Yuma County, CO Map & Demographics
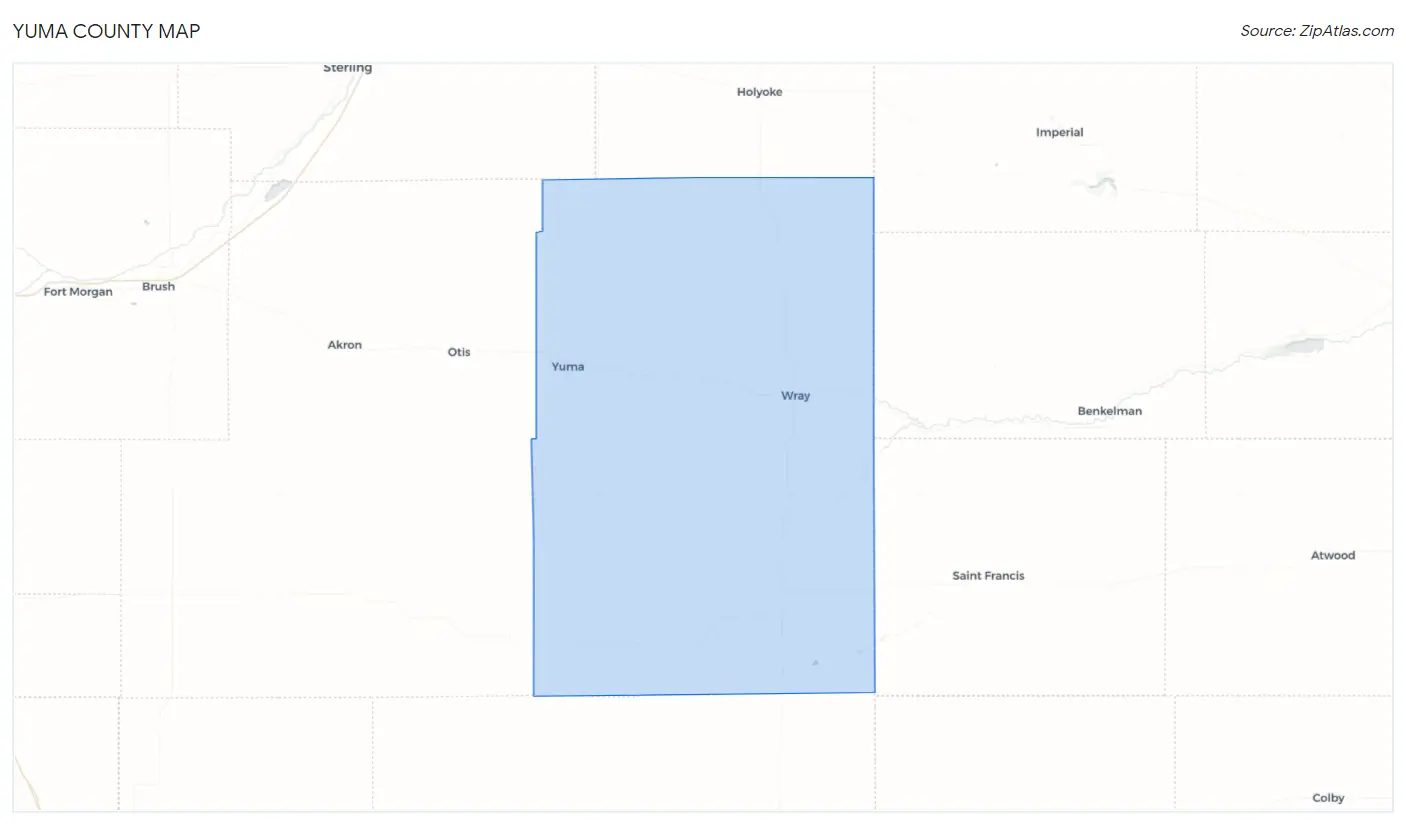
Yuma County Map
Yuma County Overview
$32,575
PER CAPITA INCOME
$71,279
AVG FAMILY INCOME
$60,118
AVG HOUSEHOLD INCOME
28.0%
WAGE / INCOME GAP [ % ]
72.0¢/ $1
WAGE / INCOME GAP [ $ ]
0.42
INEQUALITY / GINI INDEX
9,938
TOTAL POPULATION
5,049
MALE POPULATION
4,889
FEMALE POPULATION
103.27
MALES / 100 FEMALES
96.83
FEMALES / 100 MALES
39.6
MEDIAN AGE
2.9
AVG FAMILY SIZE
2.5
AVG HOUSEHOLD SIZE
5,146
LABOR FORCE [ PEOPLE ]
68.9%
PERCENT IN LABOR FORCE
5.7%
UNEMPLOYMENT RATE
Yuma County Area Codes
Income in Yuma County
Income Overview in Yuma County
Per Capita Income in Yuma County is $32,575, while median incomes of families and households are $71,279 and $60,118 respectively.
| Characteristic | Number | Measure |
| Per Capita Income | 9,938 | $32,575 |
| Median Family Income | 2,810 | $71,279 |
| Mean Family Income | 2,810 | $91,384 |
| Median Household Income | 3,953 | $60,118 |
| Mean Household Income | 3,953 | $81,329 |
| Income Deficit | 2,810 | $0 |
| Wage / Income Gap (%) | 9,938 | 28.01% |
| Wage / Income Gap ($) | 9,938 | 71.99¢ per $1 |
| Gini / Inequality Index | 9,938 | 0.42 |
Earnings by Sex in Yuma County
Average Earnings in Yuma County are $39,763, $43,358 for men and $31,214 for women, a difference of 28.0%.
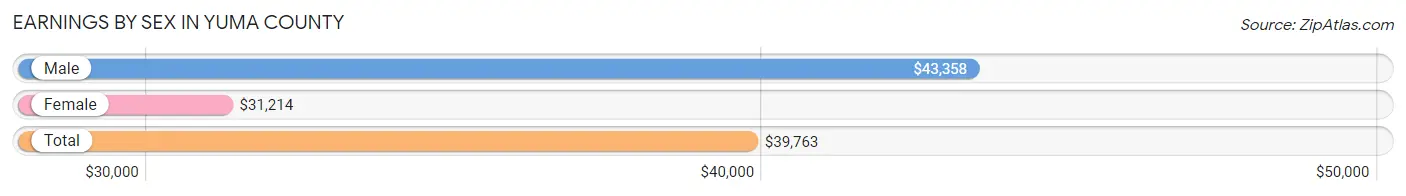
| Sex | Number | Average Earnings |
| Male | 3,008 (55.3%) | $43,358 |
| Female | 2,435 (44.7%) | $31,214 |
| Total | 5,443 (100.0%) | $39,763 |
Earnings by Sex by Income Bracket in Yuma County
The most common earnings brackets in Yuma County are $55,000 to $64,999 for men (359 | 11.9%) and $22,500 to $24,999 for women (208 | 8.5%).
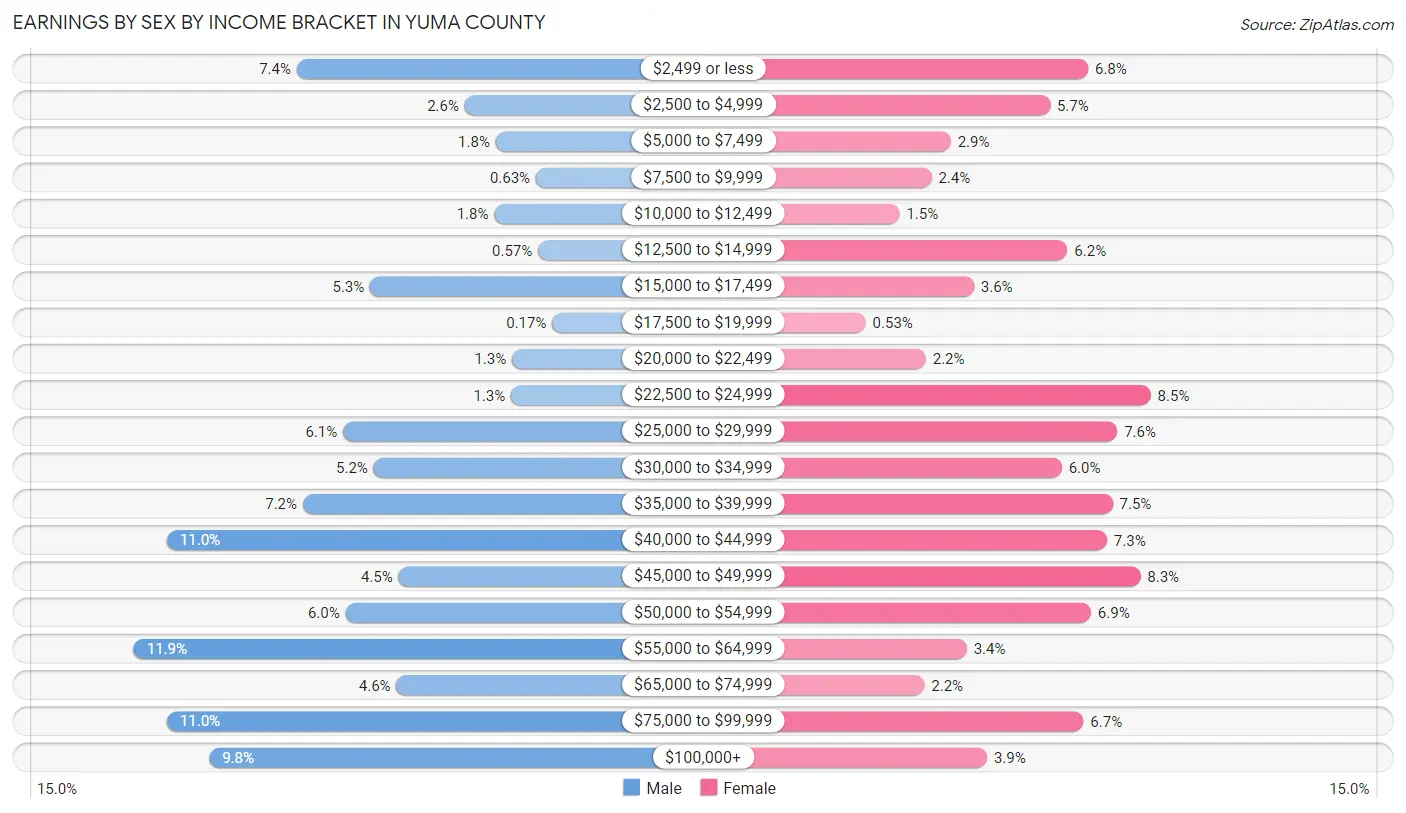
| Income | Male | Female |
| $2,499 or less | 221 (7.3%) | 165 (6.8%) |
| $2,500 to $4,999 | 79 (2.6%) | 139 (5.7%) |
| $5,000 to $7,499 | 53 (1.8%) | 71 (2.9%) |
| $7,500 to $9,999 | 19 (0.6%) | 58 (2.4%) |
| $10,000 to $12,499 | 54 (1.8%) | 36 (1.5%) |
| $12,500 to $14,999 | 17 (0.6%) | 151 (6.2%) |
| $15,000 to $17,499 | 159 (5.3%) | 87 (3.6%) |
| $17,500 to $19,999 | 5 (0.2%) | 13 (0.5%) |
| $20,000 to $22,499 | 39 (1.3%) | 54 (2.2%) |
| $22,500 to $24,999 | 40 (1.3%) | 208 (8.5%) |
| $25,000 to $29,999 | 182 (6.0%) | 185 (7.6%) |
| $30,000 to $34,999 | 156 (5.2%) | 147 (6.0%) |
| $35,000 to $39,999 | 216 (7.2%) | 182 (7.5%) |
| $40,000 to $44,999 | 331 (11.0%) | 178 (7.3%) |
| $45,000 to $49,999 | 135 (4.5%) | 201 (8.3%) |
| $50,000 to $54,999 | 180 (6.0%) | 167 (6.9%) |
| $55,000 to $64,999 | 359 (11.9%) | 82 (3.4%) |
| $65,000 to $74,999 | 137 (4.5%) | 53 (2.2%) |
| $75,000 to $99,999 | 331 (11.0%) | 162 (6.7%) |
| $100,000+ | 295 (9.8%) | 96 (3.9%) |
| Total | 3,008 (100.0%) | 2,435 (100.0%) |
Earnings by Sex by Educational Attainment in Yuma County
Average earnings in Yuma County are $48,357 for men and $36,090 for women, a difference of 25.4%. Men with an educational attainment of graduate degree enjoy the highest average annual earnings of $89,531, while those with less than high school education earn the least with $29,355. Women with an educational attainment of graduate degree earn the most with the average annual earnings of $48,900, while those with less than high school education have the smallest earnings of $22,865.
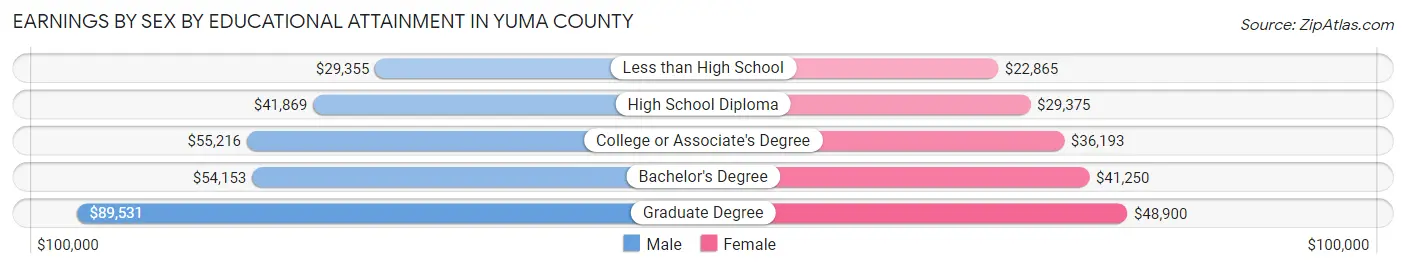
| Educational Attainment | Male Income | Female Income |
| Less than High School | $29,355 | $22,865 |
| High School Diploma | $41,869 | $29,375 |
| College or Associate's Degree | $55,216 | $36,193 |
| Bachelor's Degree | $54,153 | $41,250 |
| Graduate Degree | $89,531 | $48,900 |
| Total | $48,357 | $36,090 |
Family Income in Yuma County
Family Income Brackets in Yuma County
According to the Yuma County family income data, there are 739 families falling into the $100,000 to $149,999 income range, which is the most common income bracket and makes up 26.3% of all families. Conversely, the $10,000 to $14,999 income bracket is the least frequent group with only 67 families (2.4%) belonging to this category.
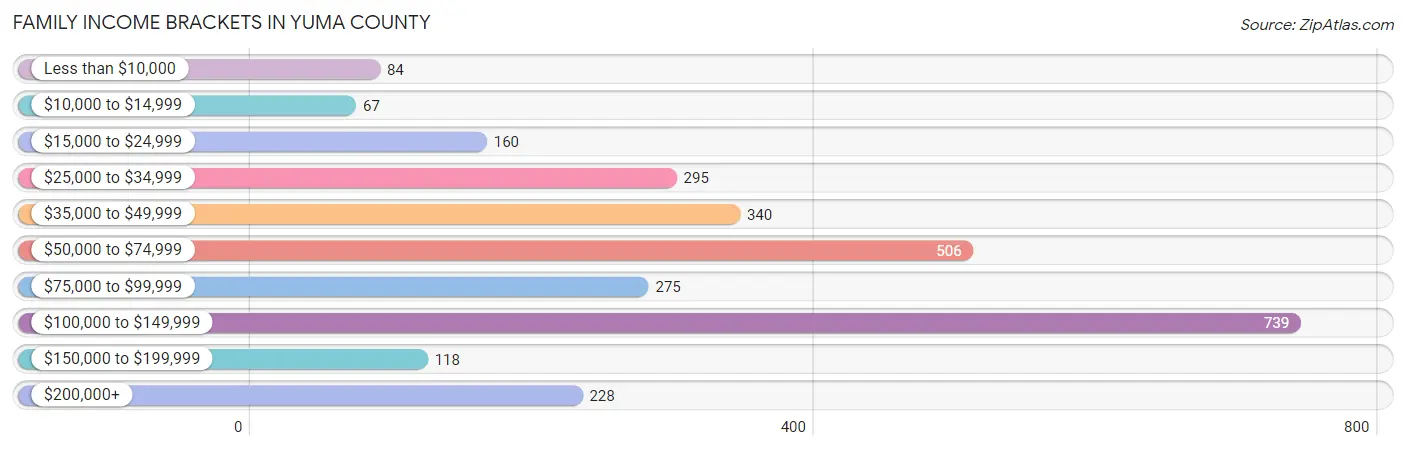
| Income Bracket | # Families | % Families |
| Less than $10,000 | 84 | 3.0% |
| $10,000 to $14,999 | 67 | 2.4% |
| $15,000 to $24,999 | 160 | 5.7% |
| $25,000 to $34,999 | 295 | 10.5% |
| $35,000 to $49,999 | 340 | 12.1% |
| $50,000 to $74,999 | 506 | 18.0% |
| $75,000 to $99,999 | 275 | 9.8% |
| $100,000 to $149,999 | 739 | 26.3% |
| $150,000 to $199,999 | 118 | 4.2% |
| $200,000+ | 228 | 8.1% |
Family Income by Famaliy Size in Yuma County
5-person families (218 | 7.8%) account for the highest median family income in Yuma County with $105,789 per family, while 2-person families (1,404 | 50.0%) have the highest median income of $36,750 per family member.
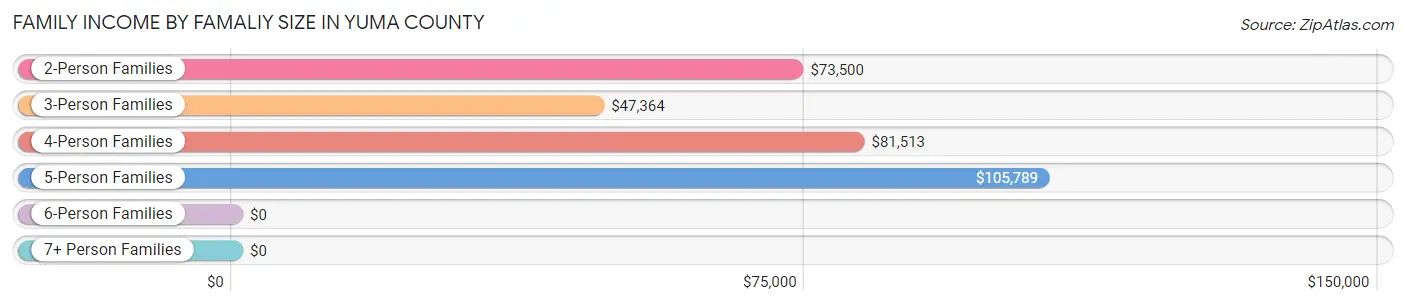
| Income Bracket | # Families | Median Income |
| 2-Person Families | 1,404 (50.0%) | $73,500 |
| 3-Person Families | 721 (25.7%) | $47,364 |
| 4-Person Families | 229 (8.2%) | $81,513 |
| 5-Person Families | 218 (7.8%) | $105,789 |
| 6-Person Families | 139 (5.0%) | $0 |
| 7+ Person Families | 99 (3.5%) | $0 |
| Total | 2,810 (100.0%) | $71,279 |
Family Income by Number of Earners in Yuma County
The median family income in Yuma County is $71,279, with families comprising 3+ earners (256) having the highest median family income of $106,000, while families with 1 earner (859) have the lowest median family income of $36,916, accounting for 9.1% and 30.6% of families, respectively.
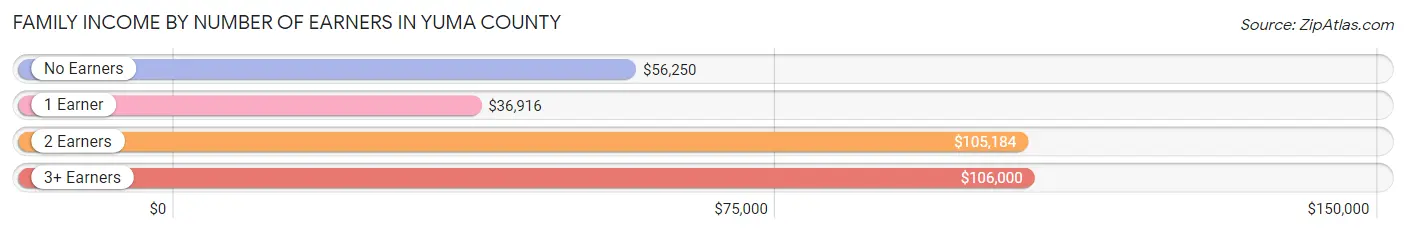
| Number of Earners | # Families | Median Income |
| No Earners | 242 (8.6%) | $56,250 |
| 1 Earner | 859 (30.6%) | $36,916 |
| 2 Earners | 1,453 (51.7%) | $105,184 |
| 3+ Earners | 256 (9.1%) | $106,000 |
| Total | 2,810 (100.0%) | $71,279 |
Household Income in Yuma County
Household Income Brackets in Yuma County
With 905 households falling in the category, the $100,000 to $149,999 income range is the most frequent in Yuma County, accounting for 22.9% of all households. In contrast, only 150 households (3.8%) fall into the $150,000 to $199,999 income bracket, making it the least populous group.
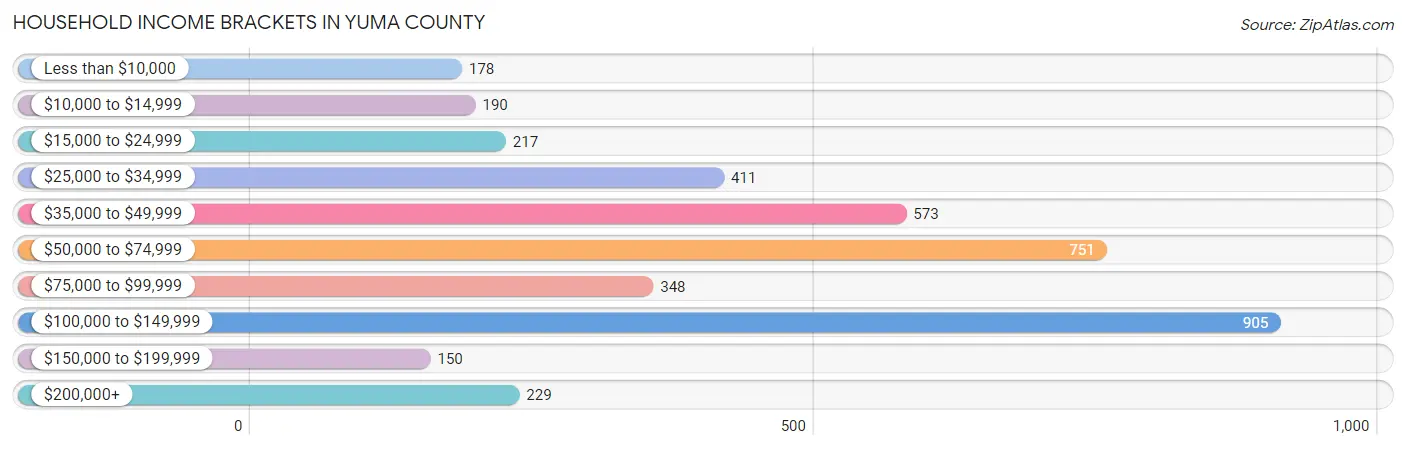
| Income Bracket | # Households | % Households |
| Less than $10,000 | 178 | 4.5% |
| $10,000 to $14,999 | 190 | 4.8% |
| $15,000 to $24,999 | 217 | 5.5% |
| $25,000 to $34,999 | 411 | 10.4% |
| $35,000 to $49,999 | 573 | 14.5% |
| $50,000 to $74,999 | 751 | 19.0% |
| $75,000 to $99,999 | 348 | 8.8% |
| $100,000 to $149,999 | 905 | 22.9% |
| $150,000 to $199,999 | 150 | 3.8% |
| $200,000+ | 229 | 5.8% |
Household Income by Householder Age in Yuma County
The median household income in Yuma County is $60,118, with the highest median household income of $72,500 found in the 45 to 64 years age bracket for the primary householder. A total of 1,542 households (39.0%) fall into this category. Meanwhile, the 15 to 24 years age bracket for the primary householder has the lowest median household income of $40,313, with 161 households (4.1%) in this group.
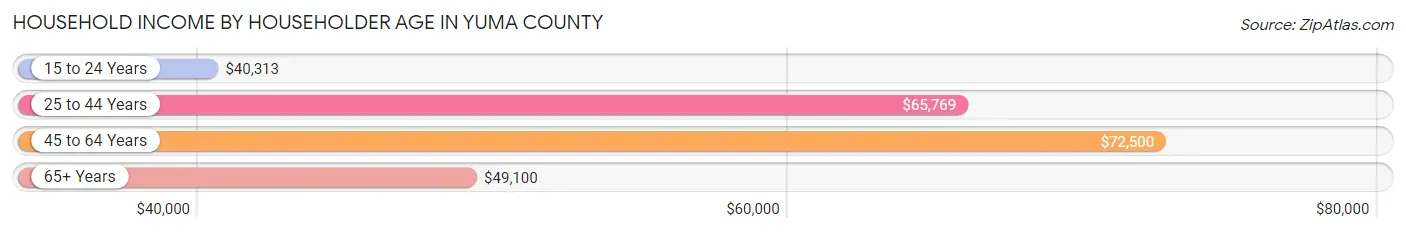
| Income Bracket | # Households | Median Income |
| 15 to 24 Years | 161 (4.1%) | $40,313 |
| 25 to 44 Years | 1,160 (29.3%) | $65,769 |
| 45 to 64 Years | 1,542 (39.0%) | $72,500 |
| 65+ Years | 1,090 (27.6%) | $49,100 |
| Total | 3,953 (100.0%) | $60,118 |
Poverty in Yuma County
Income Below Poverty by Sex and Age in Yuma County
With 14.7% poverty level for males and 13.4% for females among the residents of Yuma County, 15 year old males and 15 year old females are the most vulnerable to poverty, with 81 males (73.6%) and 22 females (27.2%) in their respective age groups living below the poverty level.
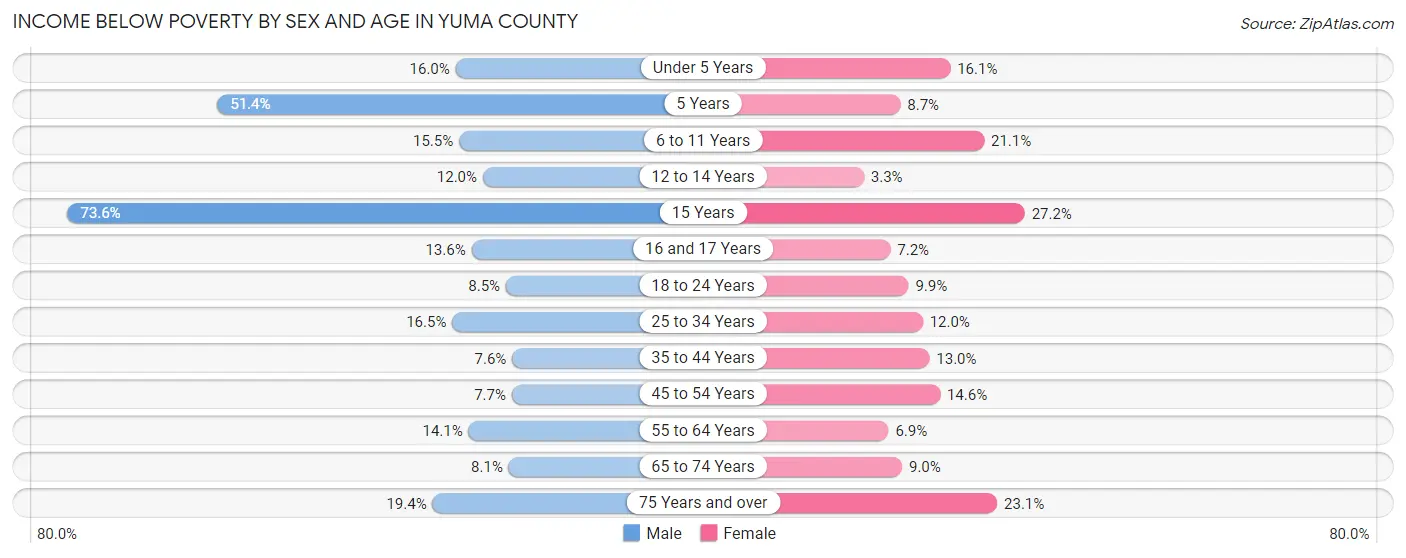
| Age Bracket | Male | Female |
| Under 5 Years | 56 (16.0%) | 43 (16.1%) |
| 5 Years | 56 (51.4%) | 2 (8.7%) |
| 6 to 11 Years | 68 (15.5%) | 124 (21.1%) |
| 12 to 14 Years | 19 (11.9%) | 7 (3.3%) |
| 15 Years | 81 (73.6%) | 22 (27.2%) |
| 16 and 17 Years | 9 (13.6%) | 8 (7.2%) |
| 18 to 24 Years | 25 (8.5%) | 31 (9.9%) |
| 25 to 34 Years | 116 (16.5%) | 67 (12.0%) |
| 35 to 44 Years | 40 (7.6%) | 72 (13.0%) |
| 45 to 54 Years | 51 (7.6%) | 85 (14.6%) |
| 55 to 64 Years | 90 (14.1%) | 41 (6.9%) |
| 65 to 74 Years | 36 (8.1%) | 47 (8.9%) |
| 75 Years and over | 61 (19.4%) | 98 (23.1%) |
| Total | 708 (14.7%) | 647 (13.4%) |
Income Above Poverty by Sex and Age in Yuma County
According to the poverty statistics in Yuma County, males aged 35 to 44 years and females aged 12 to 14 years are the age groups that are most secure financially, with 92.4% of males and 96.7% of females in these age groups living above the poverty line.
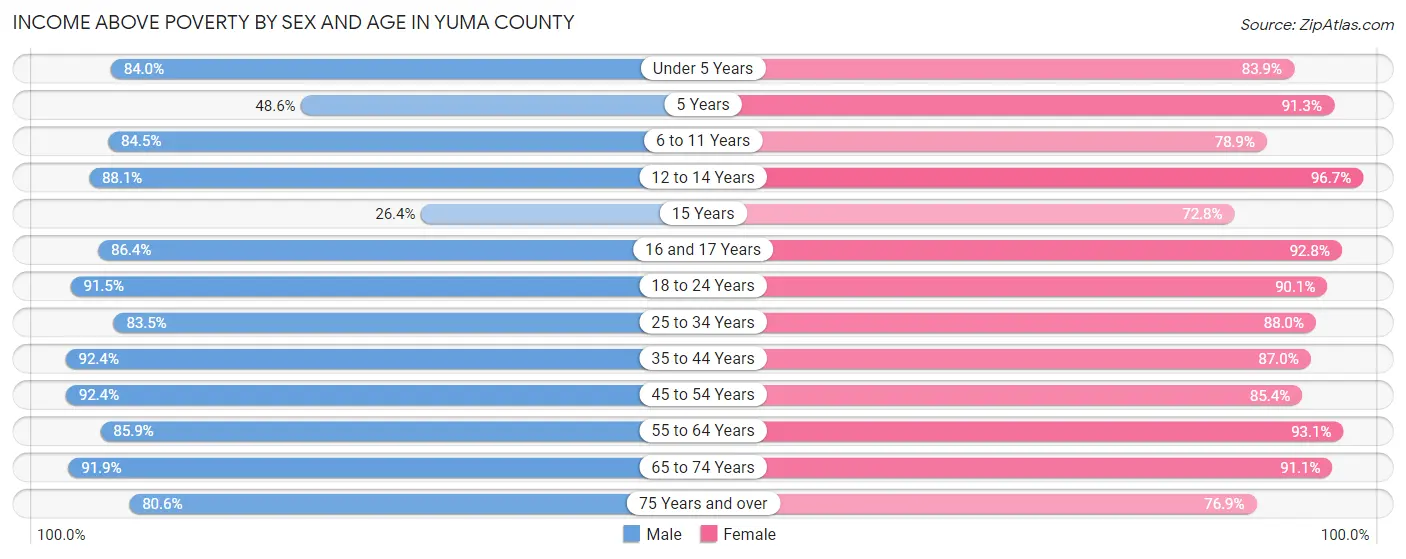
| Age Bracket | Male | Female |
| Under 5 Years | 294 (84.0%) | 224 (83.9%) |
| 5 Years | 53 (48.6%) | 21 (91.3%) |
| 6 to 11 Years | 371 (84.5%) | 463 (78.9%) |
| 12 to 14 Years | 140 (88.0%) | 207 (96.7%) |
| 15 Years | 29 (26.4%) | 59 (72.8%) |
| 16 and 17 Years | 57 (86.4%) | 103 (92.8%) |
| 18 to 24 Years | 268 (91.5%) | 282 (90.1%) |
| 25 to 34 Years | 587 (83.5%) | 491 (88.0%) |
| 35 to 44 Years | 486 (92.4%) | 482 (87.0%) |
| 45 to 54 Years | 616 (92.3%) | 498 (85.4%) |
| 55 to 64 Years | 549 (85.9%) | 551 (93.1%) |
| 65 to 74 Years | 408 (91.9%) | 478 (91.0%) |
| 75 Years and over | 253 (80.6%) | 327 (76.9%) |
| Total | 4,111 (85.3%) | 4,186 (86.6%) |
Income Below Poverty Among Married-Couple Families in Yuma County
The poverty statistics for married-couple families in Yuma County show that 10.4% or 237 of the total 2,274 families live below the poverty line. Families with 5 or more children have the highest poverty rate of 100.0%, comprising of 80 families. On the other hand, families with no children have the lowest poverty rate of 5.6%, which includes 68 families.
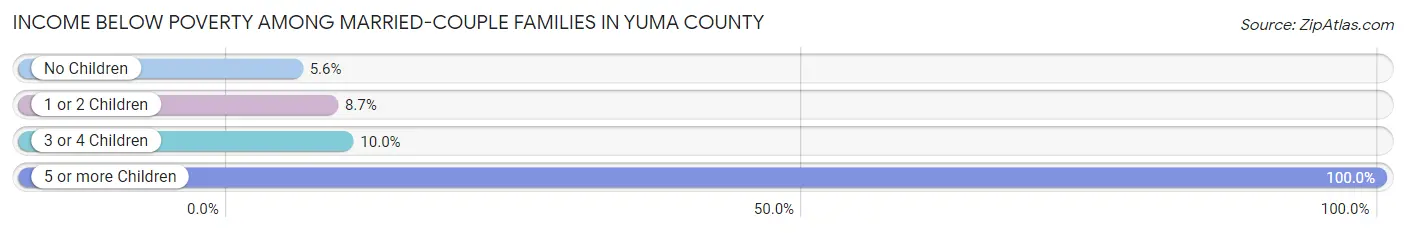
| Children | Above Poverty | Below Poverty |
| No Children | 1,140 (94.4%) | 68 (5.6%) |
| 1 or 2 Children | 682 (91.3%) | 65 (8.7%) |
| 3 or 4 Children | 215 (90.0%) | 24 (10.0%) |
| 5 or more Children | 0 (0.0%) | 80 (100.0%) |
| Total | 2,037 (89.6%) | 237 (10.4%) |
Income Below Poverty Among Single-Parent Households in Yuma County
According to the poverty data in Yuma County, 6.4% or 11 single-father households and 14.8% or 54 single-mother households are living below the poverty line. Among single-father households, those with no children have the highest poverty rate, with 6 households (25.0%) experiencing poverty. Likewise, among single-mother households, those with 3 or 4 children have the highest poverty rate, with 1 households (25.0%) falling below the poverty line.
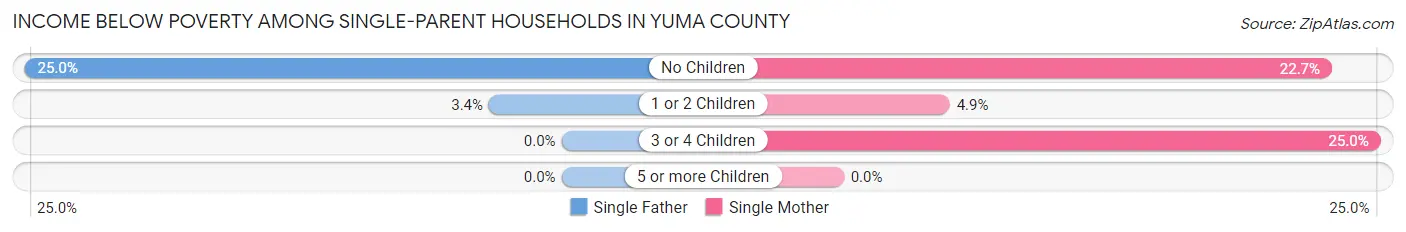
| Children | Single Father | Single Mother |
| No Children | 6 (25.0%) | 45 (22.7%) |
| 1 or 2 Children | 5 (3.4%) | 8 (4.9%) |
| 3 or 4 Children | 0 (0.0%) | 1 (25.0%) |
| 5 or more Children | 0 (0.0%) | 0 (0.0%) |
| Total | 11 (6.4%) | 54 (14.8%) |
Income Below Poverty Among Married-Couple vs Single-Parent Households in Yuma County
The poverty data for Yuma County shows that 237 of the married-couple family households (10.4%) and 65 of the single-parent households (12.1%) are living below the poverty level. Within the married-couple family households, those with 5 or more children have the highest poverty rate, with 80 households (100.0%) falling below the poverty line. Among the single-parent households, those with 3 or 4 children have the highest poverty rate, with 1 household (25.0%) living below poverty.

| Children | Married-Couple Families | Single-Parent Households |
| No Children | 68 (5.6%) | 51 (23.0%) |
| 1 or 2 Children | 65 (8.7%) | 13 (4.2%) |
| 3 or 4 Children | 24 (10.0%) | 1 (25.0%) |
| 5 or more Children | 80 (100.0%) | 0 (0.0%) |
| Total | 237 (10.4%) | 65 (12.1%) |
Race in Yuma County
The most populous races in Yuma County are White / Caucasian (8,333 | 83.9%), Hispanic or Latino (2,552 | 25.7%), and Two or more Races (1,201 | 12.1%).
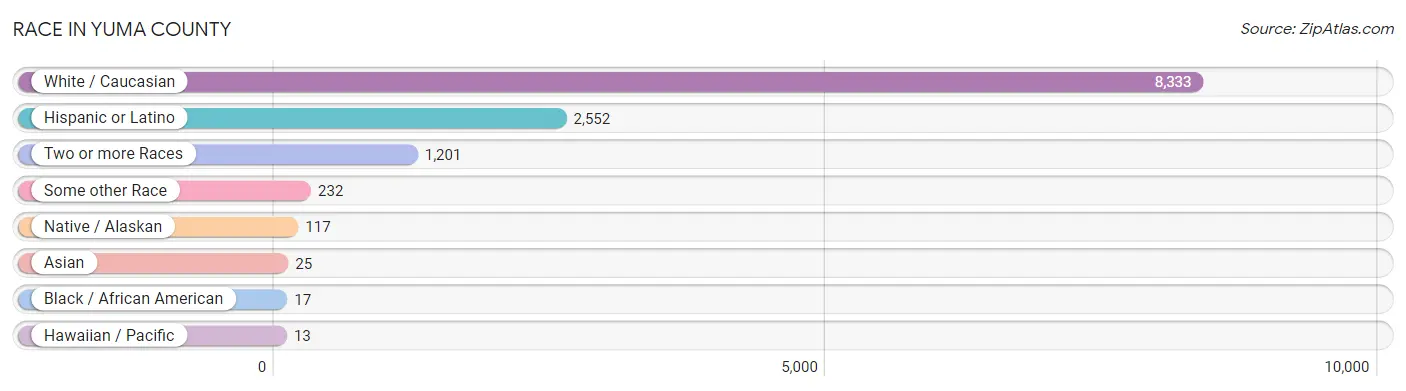
| Race | # Population | % Population |
| Asian | 25 | 0.3% |
| Black / African American | 17 | 0.2% |
| Hawaiian / Pacific | 13 | 0.1% |
| Hispanic or Latino | 2,552 | 25.7% |
| Native / Alaskan | 117 | 1.2% |
| White / Caucasian | 8,333 | 83.9% |
| Two or more Races | 1,201 | 12.1% |
| Some other Race | 232 | 2.3% |
| Total | 9,938 | 100.0% |
Ancestry in Yuma County
The most populous ancestries reported in Yuma County are German (2,530 | 25.5%), Mexican (2,365 | 23.8%), Irish (985 | 9.9%), English (982 | 9.9%), and American (506 | 5.1%), together accounting for 74.1% of all Yuma County residents.
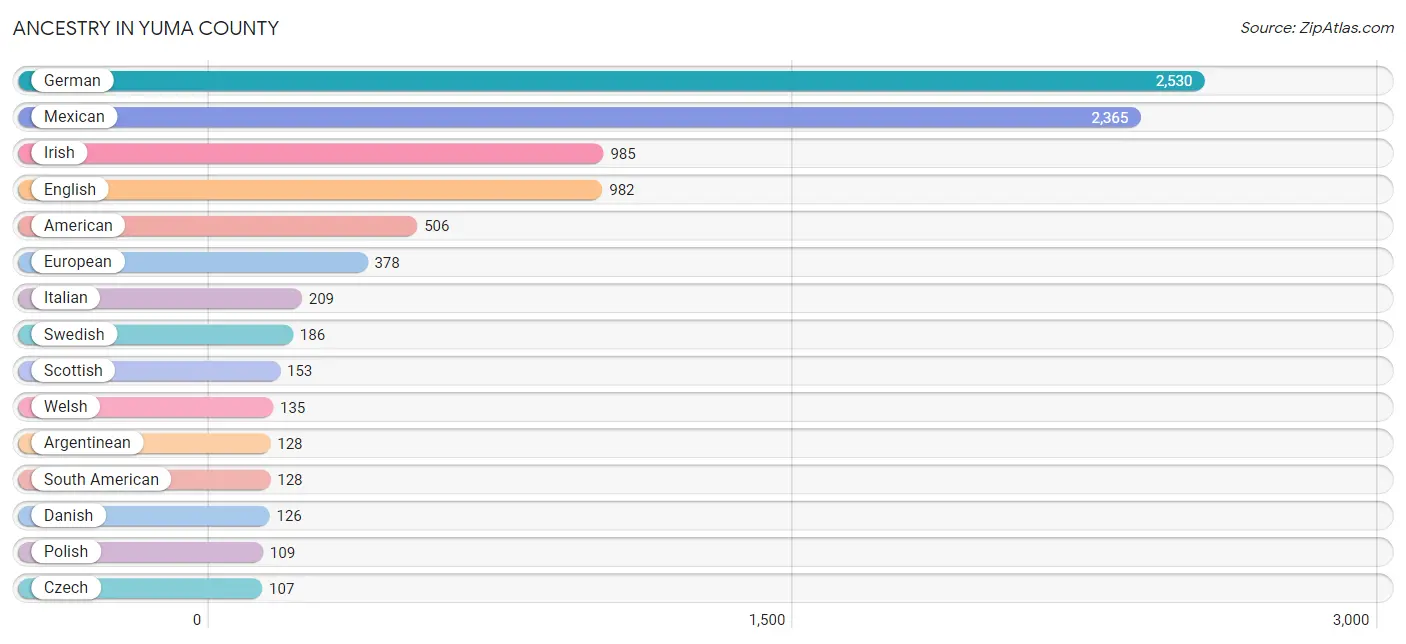
| Ancestry | # Population | % Population |
| American | 506 | 5.1% |
| Arab | 1 | 0.0% |
| Argentinean | 128 | 1.3% |
| Austrian | 14 | 0.1% |
| British | 5 | 0.1% |
| Cherokee | 1 | 0.0% |
| Chippewa | 12 | 0.1% |
| Creek | 1 | 0.0% |
| Czech | 107 | 1.1% |
| Danish | 126 | 1.3% |
| Dutch | 95 | 1.0% |
| Eastern European | 19 | 0.2% |
| English | 982 | 9.9% |
| European | 378 | 3.8% |
| French | 102 | 1.0% |
| German | 2,530 | 25.5% |
| Guamanian / Chamorro | 13 | 0.1% |
| Hungarian | 25 | 0.3% |
| Indian (Asian) | 1 | 0.0% |
| Irish | 985 | 9.9% |
| Italian | 209 | 2.1% |
| Korean | 16 | 0.2% |
| Latvian | 14 | 0.1% |
| Maltese | 6 | 0.1% |
| Mexican | 2,365 | 23.8% |
| Mexican American Indian | 13 | 0.1% |
| Moroccan | 1 | 0.0% |
| Native Hawaiian | 10 | 0.1% |
| Northern European | 9 | 0.1% |
| Norwegian | 23 | 0.2% |
| Polish | 109 | 1.1% |
| Puerto Rican | 37 | 0.4% |
| Russian | 31 | 0.3% |
| Scandinavian | 22 | 0.2% |
| Scotch-Irish | 79 | 0.8% |
| Scottish | 153 | 1.5% |
| South American | 128 | 1.3% |
| Spaniard | 2 | 0.0% |
| Spanish | 2 | 0.0% |
| Subsaharan African | 6 | 0.1% |
| Swedish | 186 | 1.9% |
| Swiss | 59 | 0.6% |
| Thai | 8 | 0.1% |
| Ugandan | 6 | 0.1% |
| Welsh | 135 | 1.4% | View All 45 Rows |
Immigrants in Yuma County
The most numerous immigrant groups reported in Yuma County came from Latin America (1,409 | 14.2%), Central America (1,281 | 12.9%), Mexico (1,281 | 12.9%), Argentina (128 | 1.3%), and South America (128 | 1.3%), together accounting for 42.5% of all Yuma County residents.
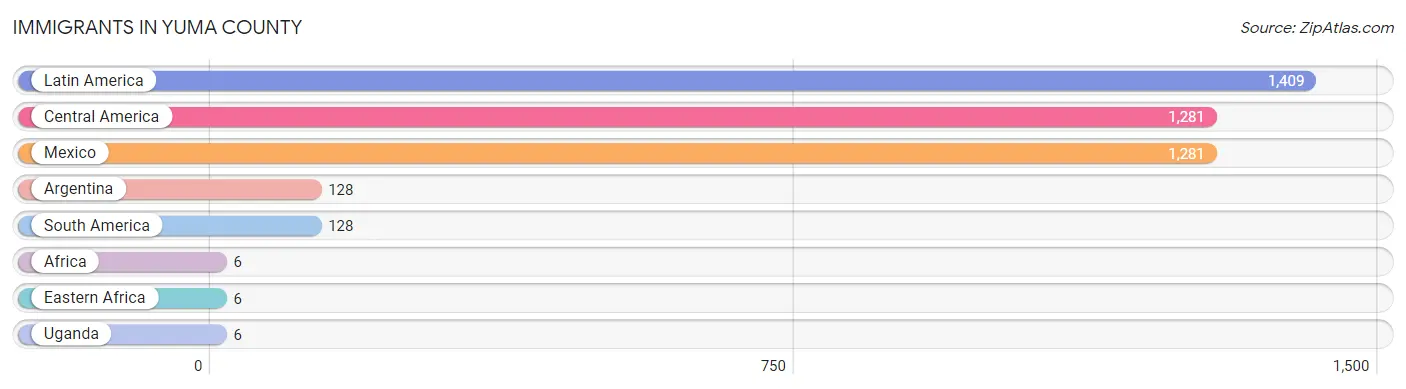
| Immigration Origin | # Population | % Population |
| Africa | 6 | 0.1% |
| Argentina | 128 | 1.3% |
| Central America | 1,281 | 12.9% |
| Eastern Africa | 6 | 0.1% |
| Latin America | 1,409 | 14.2% |
| Mexico | 1,281 | 12.9% |
| South America | 128 | 1.3% |
| Uganda | 6 | 0.1% | View All 8 Rows |
Sex and Age in Yuma County
Sex and Age in Yuma County
The most populous age groups in Yuma County are 5 to 9 Years (417 | 8.3%) for men and 5 to 9 Years (435 | 8.9%) for women.
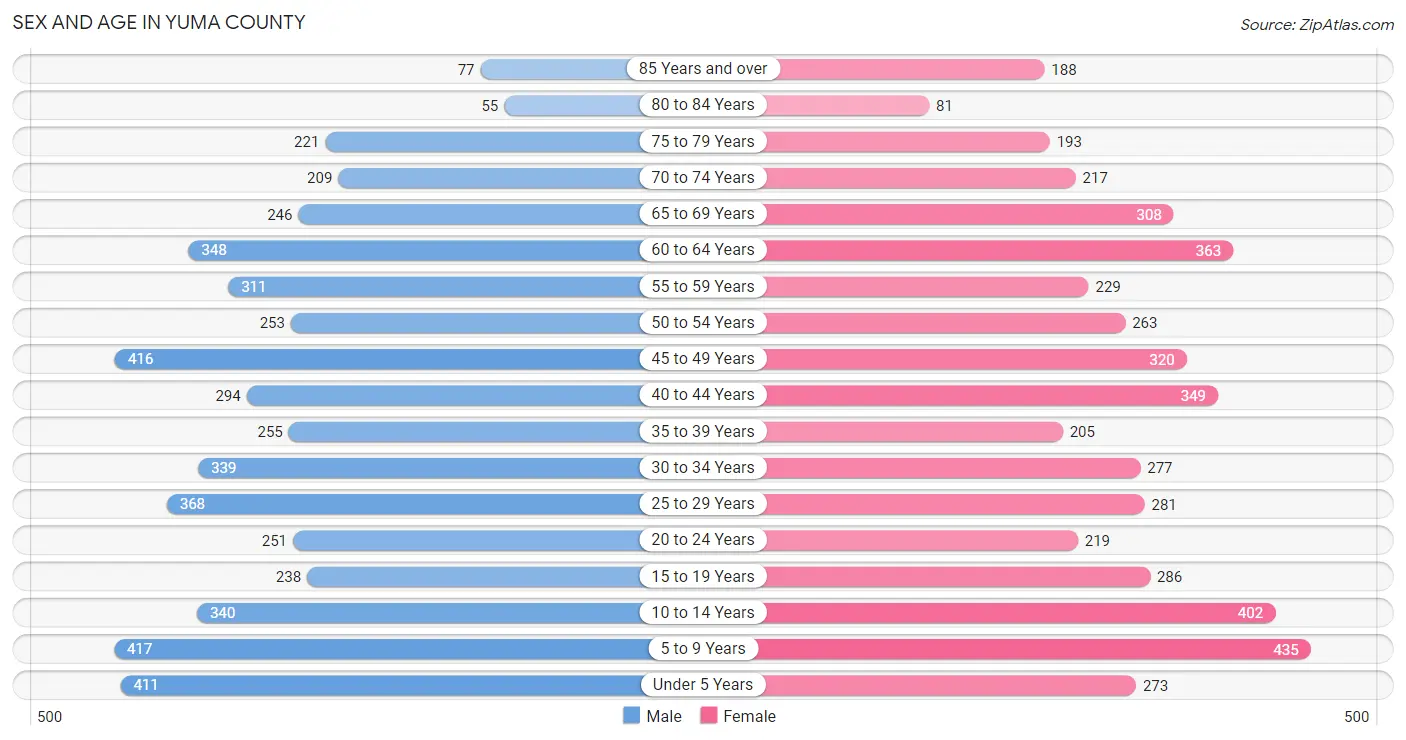
| Age Bracket | Male | Female |
| Under 5 Years | 411 (8.1%) | 273 (5.6%) |
| 5 to 9 Years | 417 (8.3%) | 435 (8.9%) |
| 10 to 14 Years | 340 (6.7%) | 402 (8.2%) |
| 15 to 19 Years | 238 (4.7%) | 286 (5.9%) |
| 20 to 24 Years | 251 (5.0%) | 219 (4.5%) |
| 25 to 29 Years | 368 (7.3%) | 281 (5.8%) |
| 30 to 34 Years | 339 (6.7%) | 277 (5.7%) |
| 35 to 39 Years | 255 (5.1%) | 205 (4.2%) |
| 40 to 44 Years | 294 (5.8%) | 349 (7.1%) |
| 45 to 49 Years | 416 (8.2%) | 320 (6.6%) |
| 50 to 54 Years | 253 (5.0%) | 263 (5.4%) |
| 55 to 59 Years | 311 (6.2%) | 229 (4.7%) |
| 60 to 64 Years | 348 (6.9%) | 363 (7.4%) |
| 65 to 69 Years | 246 (4.9%) | 308 (6.3%) |
| 70 to 74 Years | 209 (4.1%) | 217 (4.4%) |
| 75 to 79 Years | 221 (4.4%) | 193 (4.0%) |
| 80 to 84 Years | 55 (1.1%) | 81 (1.7%) |
| 85 Years and over | 77 (1.5%) | 188 (3.8%) |
| Total | 5,049 (100.0%) | 4,889 (100.0%) |
Families and Households in Yuma County
Median Family Size in Yuma County
The median family size in Yuma County is 2.86 persons per family, with married-couple families (2,274 | 80.9%) accounting for the largest median family size of 3.08 persons per family. On the other hand, single male/father families (172 | 6.1%) represent the smallest median family size with 1.87 persons per family.
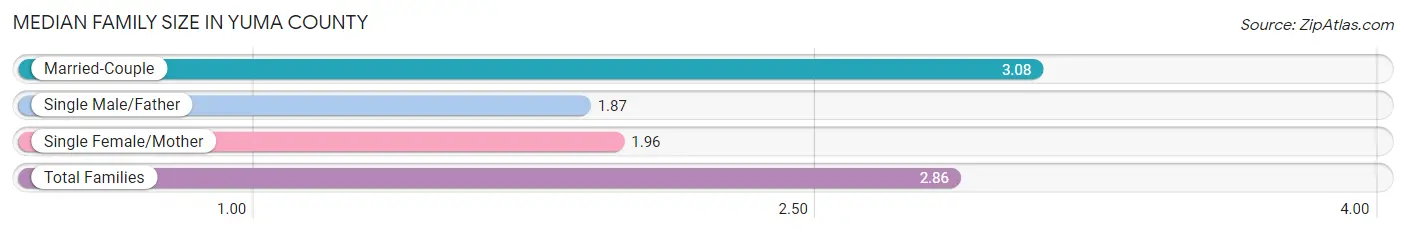
| Family Type | # Families | Family Size |
| Married-Couple | 2,274 (80.9%) | 3.08 |
| Single Male/Father | 172 (6.1%) | 1.87 |
| Single Female/Mother | 364 (13.0%) | 1.96 |
| Total Families | 2,810 (100.0%) | 2.86 |
Median Household Size in Yuma County
The median household size in Yuma County is 2.47 persons per household, with married-couple households (2,274 | 57.5%) accounting for the largest median household size of 3.11 persons per household. non-family households (1,143 | 28.9%) represent the smallest median household size with 1.18 persons per household.
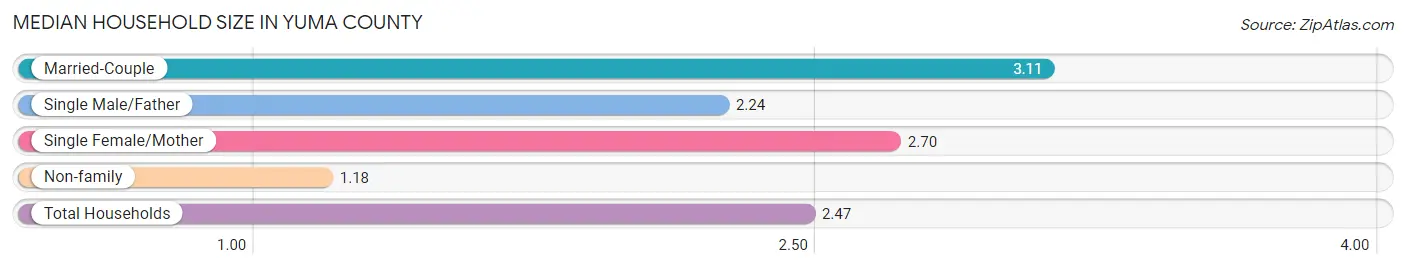
| Household Type | # Households | Household Size |
| Married-Couple | 2,274 (57.5%) | 3.11 |
| Single Male/Father | 172 (4.3%) | 2.24 |
| Single Female/Mother | 364 (9.2%) | 2.70 |
| Non-family | 1,143 (28.9%) | 1.18 |
| Total Households | 3,953 (100.0%) | 2.47 |
Household Size by Marriage Status in Yuma County
Out of a total of 3,953 households in Yuma County, 2,810 (71.1%) are family households, while 1,143 (28.9%) are nonfamily households. The most numerous type of family households are 2-person households, comprising 1,282, and the most common type of nonfamily households are 1-person households, comprising 979.
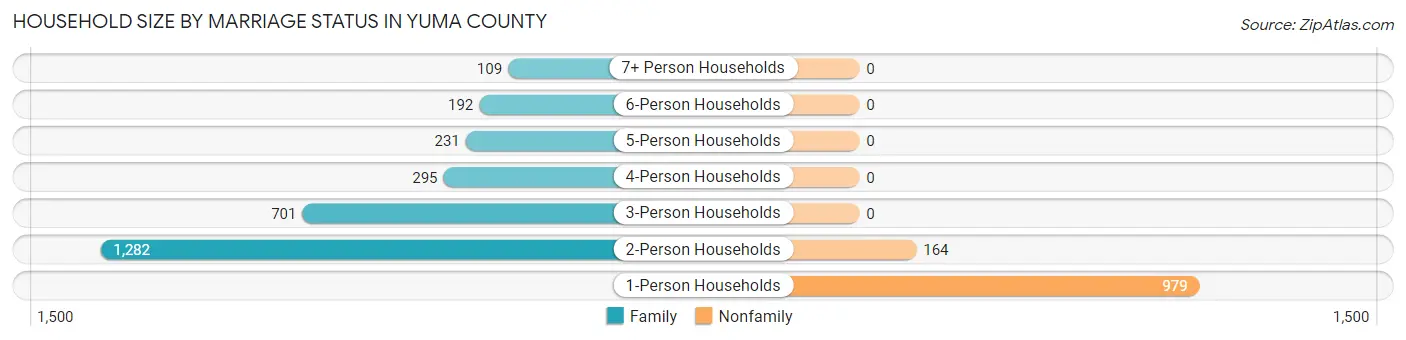
| Household Size | Family Households | Nonfamily Households |
| 1-Person Households | - | 979 (24.8%) |
| 2-Person Households | 1,282 (32.4%) | 164 (4.2%) |
| 3-Person Households | 701 (17.7%) | 0 (0.0%) |
| 4-Person Households | 295 (7.5%) | 0 (0.0%) |
| 5-Person Households | 231 (5.8%) | 0 (0.0%) |
| 6-Person Households | 192 (4.9%) | 0 (0.0%) |
| 7+ Person Households | 109 (2.8%) | 0 (0.0%) |
| Total | 2,810 (71.1%) | 1,143 (28.9%) |
Female Fertility in Yuma County
Fertility by Age in Yuma County
Average fertility rate in Yuma County is 28.0 births per 1,000 women. Women in the age bracket of 20 to 34 years have the highest fertility rate with 72.0 births per 1,000 women. Women in the age bracket of 20 to 34 years acount for 100.0% of all women with births.
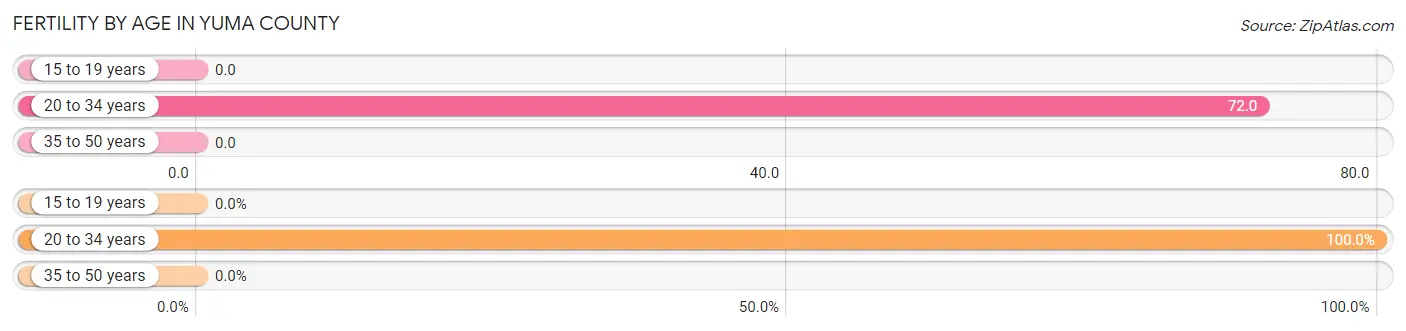
| Age Bracket | Women with Births | Births / 1,000 Women |
| 15 to 19 years | 0 (0.0%) | 0.0 |
| 20 to 34 years | 56 (100.0%) | 72.0 |
| 35 to 50 years | 0 (0.0%) | 0.0 |
| Total | 56 (100.0%) | 28.0 |
Fertility by Age by Marriage Status in Yuma County
91.1% of women with births (56) in Yuma County are married. The highest percentage of unmarried women with births falls into 20 to 34 years age bracket with 8.9% of them unmarried at the time of birth, while the lowest percentage of unmarried women with births belong to 20 to 34 years age bracket with 8.9% of them unmarried.
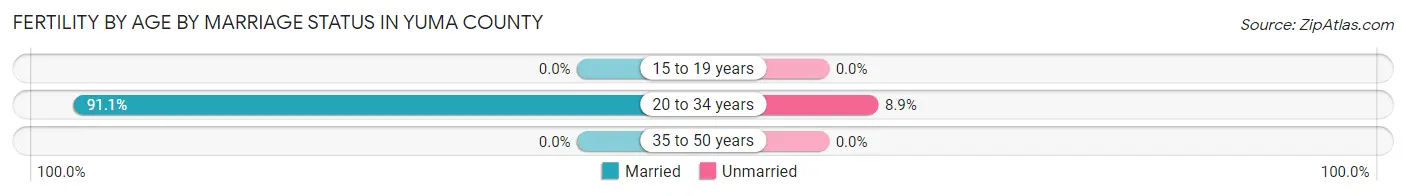
| Age Bracket | Married | Unmarried |
| 15 to 19 years | 0 (0.0%) | 0 (0.0%) |
| 20 to 34 years | 51 (91.1%) | 5 (8.9%) |
| 35 to 50 years | 0 (0.0%) | 0 (0.0%) |
| Total | 51 (91.1%) | 5 (8.9%) |
Fertility by Education in Yuma County
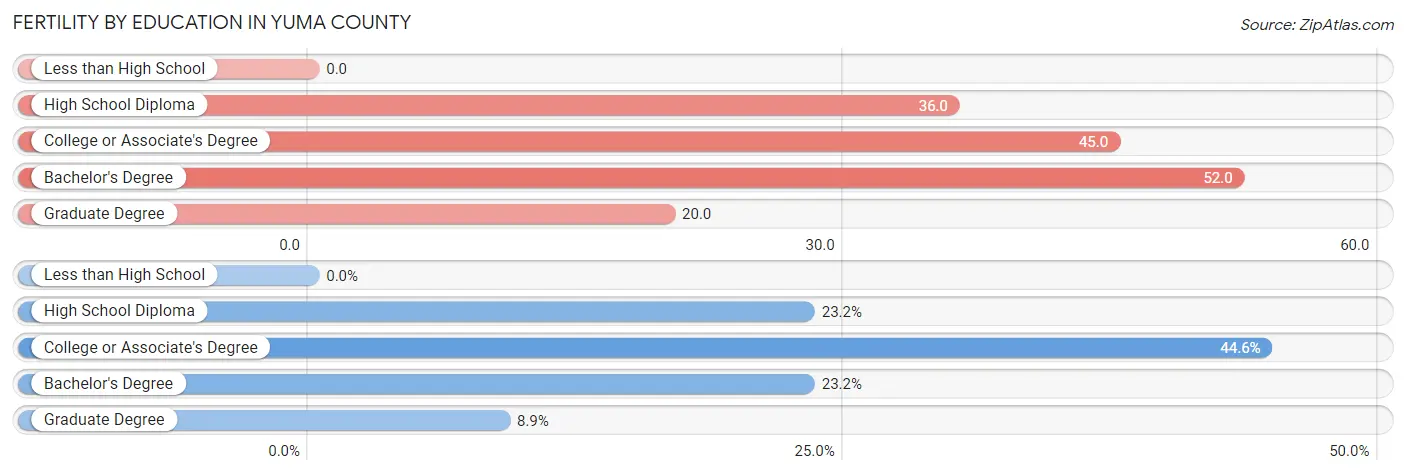
| Educational Attainment | Women with Births | Births / 1,000 Women |
| Less than High School | 0 (0.0%) | 0.0 |
| High School Diploma | 13 (23.2%) | 36.0 |
| College or Associate's Degree | 25 (44.6%) | 45.0 |
| Bachelor's Degree | 13 (23.2%) | 52.0 |
| Graduate Degree | 5 (8.9%) | 20.0 |
| Total | 56 (100.0%) | 28.0 |
Fertility by Education by Marriage Status in Yuma County
8.9% of women with births in Yuma County are unmarried. Women with the educational attainment of college or associate's degree are most likely to be married with 100.0% of them married at childbirth, while women with the educational attainment of high school diploma are least likely to be married with 38.5% of them unmarried at childbirth.
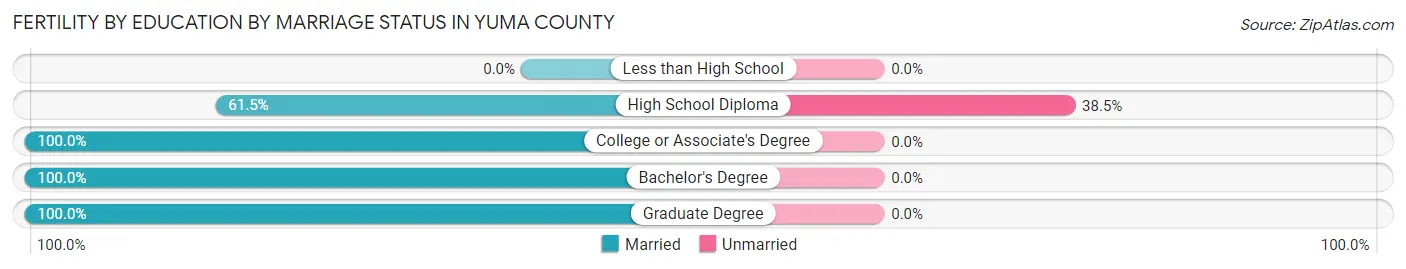
| Educational Attainment | Married | Unmarried |
| Less than High School | 0 (0.0%) | 0 (0.0%) |
| High School Diploma | 8 (61.5%) | 5 (38.5%) |
| College or Associate's Degree | 25 (100.0%) | 0 (0.0%) |
| Bachelor's Degree | 13 (100.0%) | 0 (0.0%) |
| Graduate Degree | 5 (100.0%) | 0 (0.0%) |
| Total | 51 (91.1%) | 5 (8.9%) |
Employment Characteristics in Yuma County
Employment by Class of Employer in Yuma County
Among the 4,617 employed individuals in Yuma County, private company employees (2,604 | 56.4%), local government employees (617 | 13.4%), and self-employed (not incorporated) (442 | 9.6%) make up the most common classes of employment.
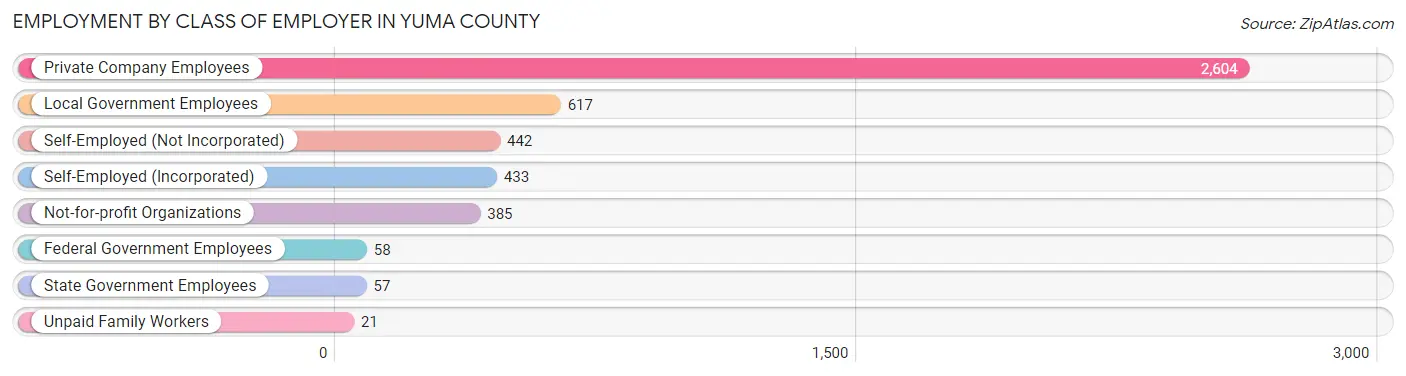
| Employer Class | # Employees | % Employees |
| Private Company Employees | 2,604 | 56.4% |
| Self-Employed (Incorporated) | 433 | 9.4% |
| Self-Employed (Not Incorporated) | 442 | 9.6% |
| Not-for-profit Organizations | 385 | 8.3% |
| Local Government Employees | 617 | 13.4% |
| State Government Employees | 57 | 1.2% |
| Federal Government Employees | 58 | 1.3% |
| Unpaid Family Workers | 21 | 0.4% |
| Total | 4,617 | 100.0% |
Employment Status by Age in Yuma County
According to the labor force statistics for Yuma County, out of the total population over 16 years of age (7,469), 68.9% or 5,146 individuals are in the labor force, with 5.7% or 293 of them unemployed. The age group with the highest labor force participation rate is 30 to 34 years, with 92.5% or 570 individuals in the labor force. Within the labor force, the 16 to 19 years age range has the highest percentage of unemployed individuals, with 16.8% or 19 of them being unemployed.
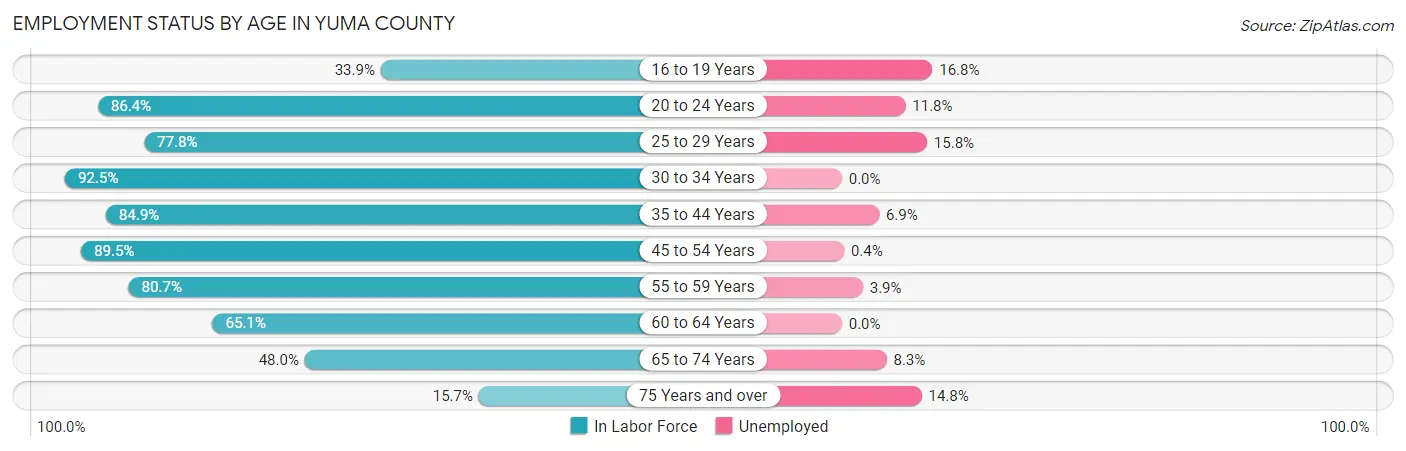
| Age Bracket | In Labor Force | Unemployed |
| 16 to 19 Years | 113 (33.9%) | 19 (16.8%) |
| 20 to 24 Years | 406 (86.4%) | 48 (11.8%) |
| 25 to 29 Years | 505 (77.8%) | 80 (15.8%) |
| 30 to 34 Years | 570 (92.5%) | 0 (0.0%) |
| 35 to 44 Years | 936 (84.9%) | 65 (6.9%) |
| 45 to 54 Years | 1,121 (89.5%) | 4 (0.4%) |
| 55 to 59 Years | 436 (80.7%) | 17 (3.9%) |
| 60 to 64 Years | 463 (65.1%) | 0 (0.0%) |
| 65 to 74 Years | 470 (48.0%) | 39 (8.3%) |
| 75 Years and over | 128 (15.7%) | 19 (14.8%) |
| Total | 5,146 (68.9%) | 293 (5.7%) |
Employment Status by Educational Attainment in Yuma County
According to labor force statistics for Yuma County, 82.8% of individuals (4,033) out of the total population between 25 and 64 years of age (4,871) are in the labor force, with 4.1% or 165 of them being unemployed. The group with the highest labor force participation rate are those with the educational attainment of high school diploma, with 86.8% or 1,045 individuals in the labor force. Within the labor force, individuals with less than high school education have the highest percentage of unemployment, with 12.9% or 80 of them being unemployed.
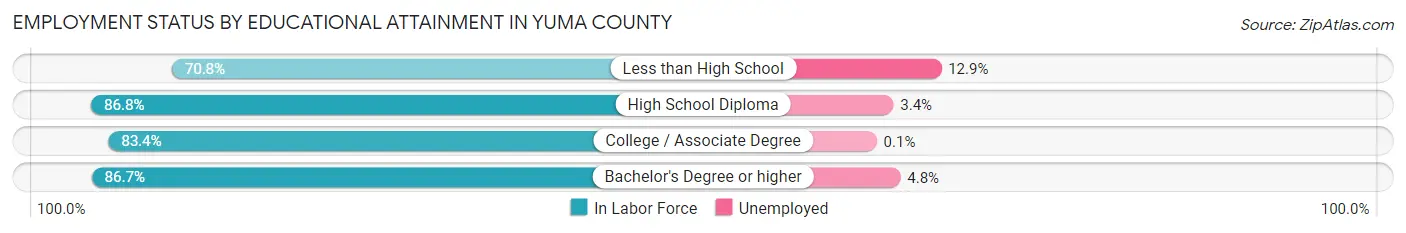
| Educational Attainment | In Labor Force | Unemployed |
| Less than High School | 618 (70.8%) | 113 (12.9%) |
| High School Diploma | 1,045 (86.8%) | 41 (3.4%) |
| College / Associate Degree | 1,369 (83.4%) | 2 (0.1%) |
| Bachelor's Degree or higher | 999 (86.7%) | 55 (4.8%) |
| Total | 4,033 (82.8%) | 200 (4.1%) |
Employment Occupations by Sex in Yuma County
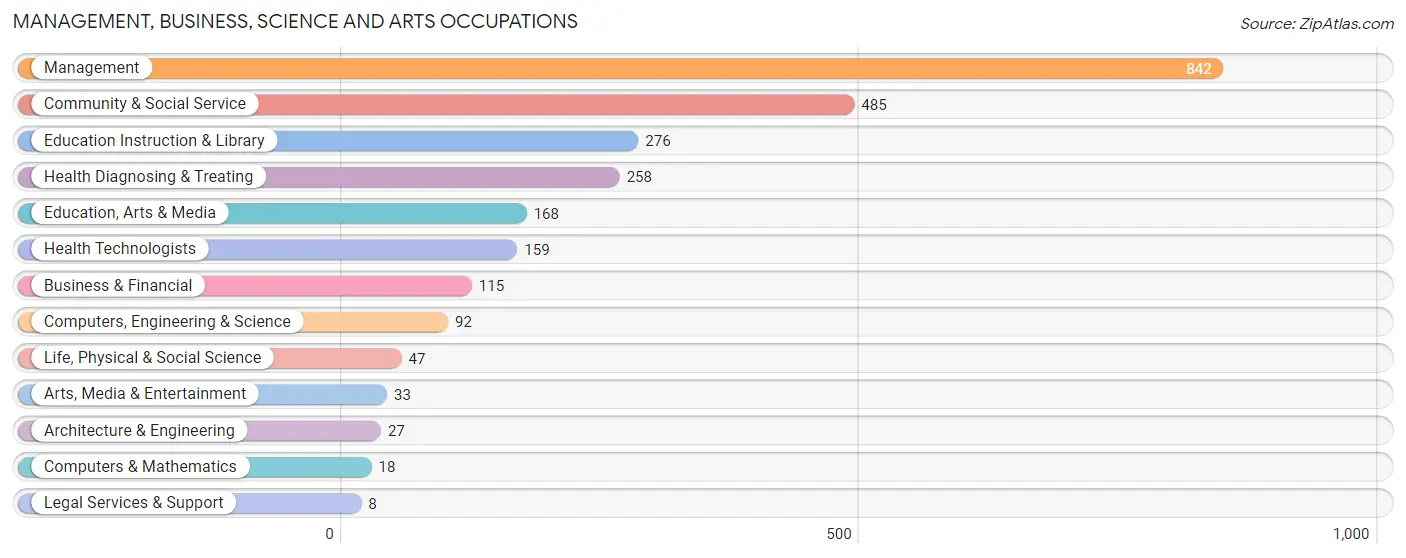
Management, Business, Science and Arts Occupations
The most common Management, Business, Science and Arts occupations in Yuma County are Management (842 | 17.3%), Community & Social Service (485 | 10.0%), Education Instruction & Library (276 | 5.7%), Health Diagnosing & Treating (258 | 5.3%), and Education, Arts & Media (168 | 3.5%).
Management, Business, Science and Arts Occupations by Sex
Within the Management, Business, Science and Arts occupations in Yuma County, the most male-oriented occupations are Architecture & Engineering (92.6%), Life, Physical & Social Science (76.6%), and Business & Financial (67.8%), while the most female-oriented occupations are Legal Services & Support (100.0%), Health Diagnosing & Treating (95.0%), and Computers & Mathematics (94.4%).
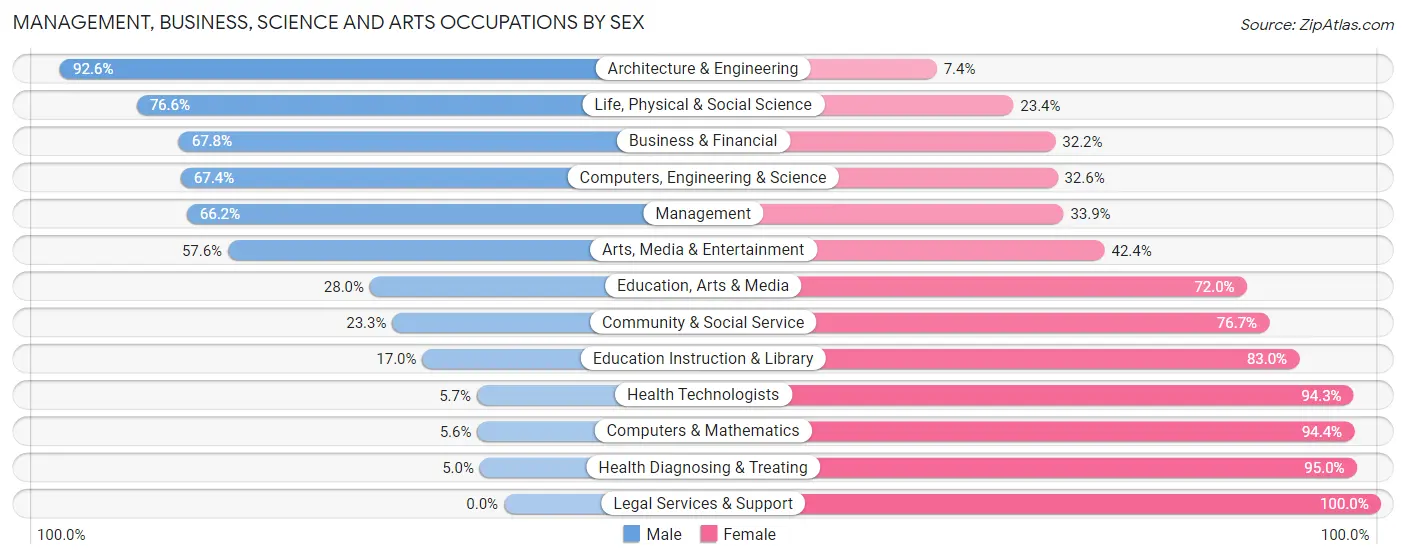
| Occupation | Male | Female |
| Management | 557 (66.1%) | 285 (33.9%) |
| Business & Financial | 78 (67.8%) | 37 (32.2%) |
| Computers, Engineering & Science | 62 (67.4%) | 30 (32.6%) |
| Computers & Mathematics | 1 (5.6%) | 17 (94.4%) |
| Architecture & Engineering | 25 (92.6%) | 2 (7.4%) |
| Life, Physical & Social Science | 36 (76.6%) | 11 (23.4%) |
| Community & Social Service | 113 (23.3%) | 372 (76.7%) |
| Education, Arts & Media | 47 (28.0%) | 121 (72.0%) |
| Legal Services & Support | 0 (0.0%) | 8 (100.0%) |
| Education Instruction & Library | 47 (17.0%) | 229 (83.0%) |
| Arts, Media & Entertainment | 19 (57.6%) | 14 (42.4%) |
| Health Diagnosing & Treating | 13 (5.0%) | 245 (95.0%) |
| Health Technologists | 9 (5.7%) | 150 (94.3%) |
| Total (Category) | 823 (45.9%) | 969 (54.1%) |
| Total (Overall) | 2,740 (56.4%) | 2,117 (43.6%) |
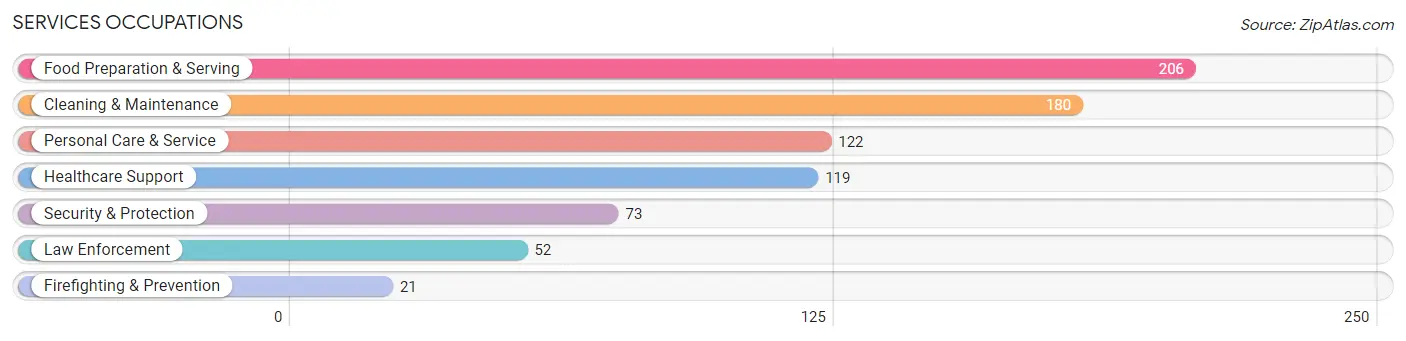
Services Occupations
The most common Services occupations in Yuma County are Food Preparation & Serving (206 | 4.2%), Cleaning & Maintenance (180 | 3.7%), Personal Care & Service (122 | 2.5%), Healthcare Support (119 | 2.5%), and Security & Protection (73 | 1.5%).
Services Occupations by Sex
Within the Services occupations in Yuma County, the most male-oriented occupations are Security & Protection (100.0%), Firefighting & Prevention (100.0%), and Law Enforcement (100.0%), while the most female-oriented occupations are Food Preparation & Serving (83.5%), Healthcare Support (53.8%), and Personal Care & Service (35.2%).
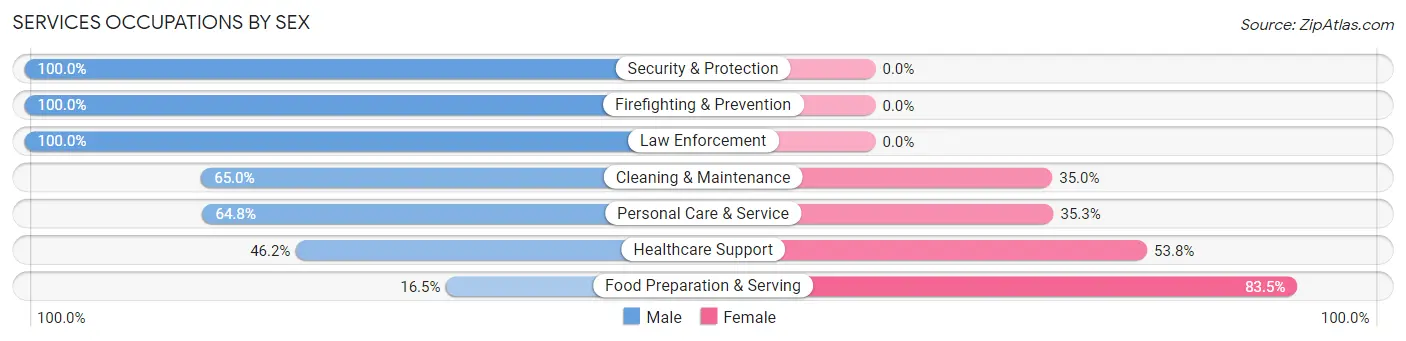
| Occupation | Male | Female |
| Healthcare Support | 55 (46.2%) | 64 (53.8%) |
| Security & Protection | 73 (100.0%) | 0 (0.0%) |
| Firefighting & Prevention | 21 (100.0%) | 0 (0.0%) |
| Law Enforcement | 52 (100.0%) | 0 (0.0%) |
| Food Preparation & Serving | 34 (16.5%) | 172 (83.5%) |
| Cleaning & Maintenance | 117 (65.0%) | 63 (35.0%) |
| Personal Care & Service | 79 (64.7%) | 43 (35.2%) |
| Total (Category) | 358 (51.1%) | 342 (48.9%) |
| Total (Overall) | 2,740 (56.4%) | 2,117 (43.6%) |
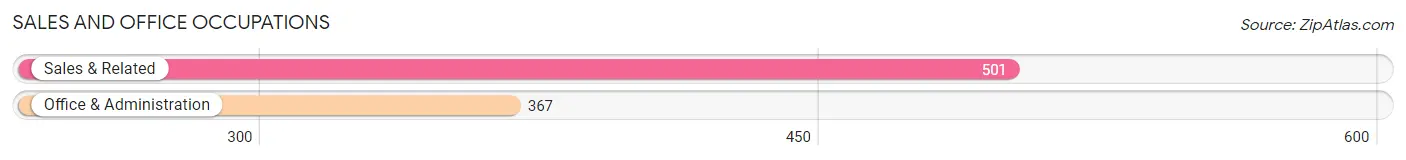
Sales and Office Occupations
The most common Sales and Office occupations in Yuma County are Sales & Related (501 | 10.3%), and Office & Administration (367 | 7.6%).
Sales and Office Occupations by Sex

| Occupation | Male | Female |
| Sales & Related | 274 (54.7%) | 227 (45.3%) |
| Office & Administration | 20 (5.4%) | 347 (94.6%) |
| Total (Category) | 294 (33.9%) | 574 (66.1%) |
| Total (Overall) | 2,740 (56.4%) | 2,117 (43.6%) |
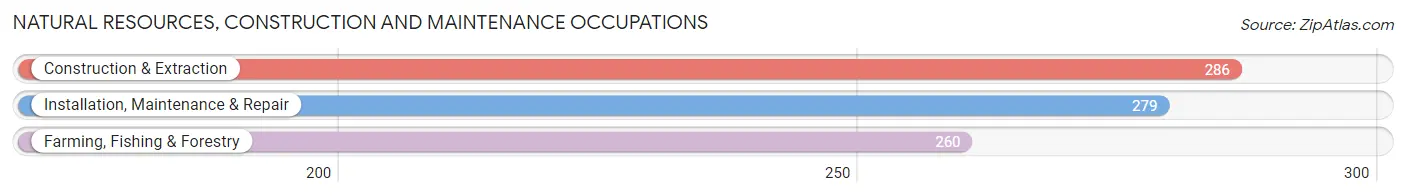
Natural Resources, Construction and Maintenance Occupations
The most common Natural Resources, Construction and Maintenance occupations in Yuma County are Construction & Extraction (286 | 5.9%), Installation, Maintenance & Repair (279 | 5.7%), and Farming, Fishing & Forestry (260 | 5.3%).
Natural Resources, Construction and Maintenance Occupations by Sex
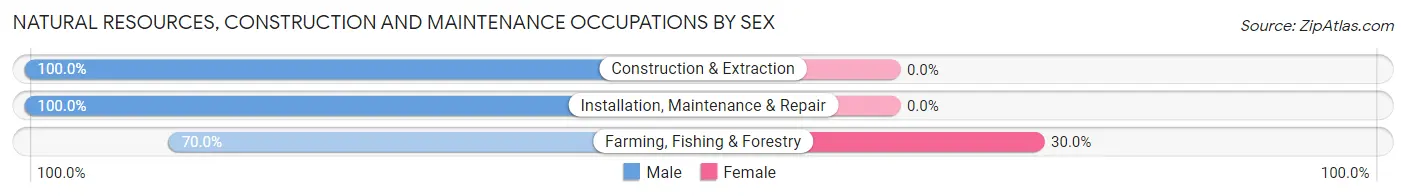
| Occupation | Male | Female |
| Farming, Fishing & Forestry | 182 (70.0%) | 78 (30.0%) |
| Construction & Extraction | 286 (100.0%) | 0 (0.0%) |
| Installation, Maintenance & Repair | 279 (100.0%) | 0 (0.0%) |
| Total (Category) | 747 (90.5%) | 78 (9.5%) |
| Total (Overall) | 2,740 (56.4%) | 2,117 (43.6%) |
Production, Transportation and Moving Occupations
The most common Production, Transportation and Moving occupations in Yuma County are Material Moving (271 | 5.6%), Transportation (237 | 4.9%), and Production (164 | 3.4%).
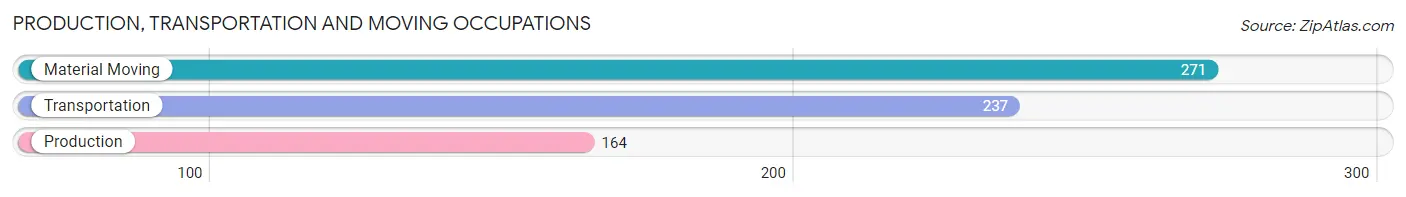
Production, Transportation and Moving Occupations by Sex

| Occupation | Male | Female |
| Production | 97 (59.2%) | 67 (40.8%) |
| Transportation | 178 (75.1%) | 59 (24.9%) |
| Material Moving | 243 (89.7%) | 28 (10.3%) |
| Total (Category) | 518 (77.1%) | 154 (22.9%) |
| Total (Overall) | 2,740 (56.4%) | 2,117 (43.6%) |
Employment Industries by Sex in Yuma County
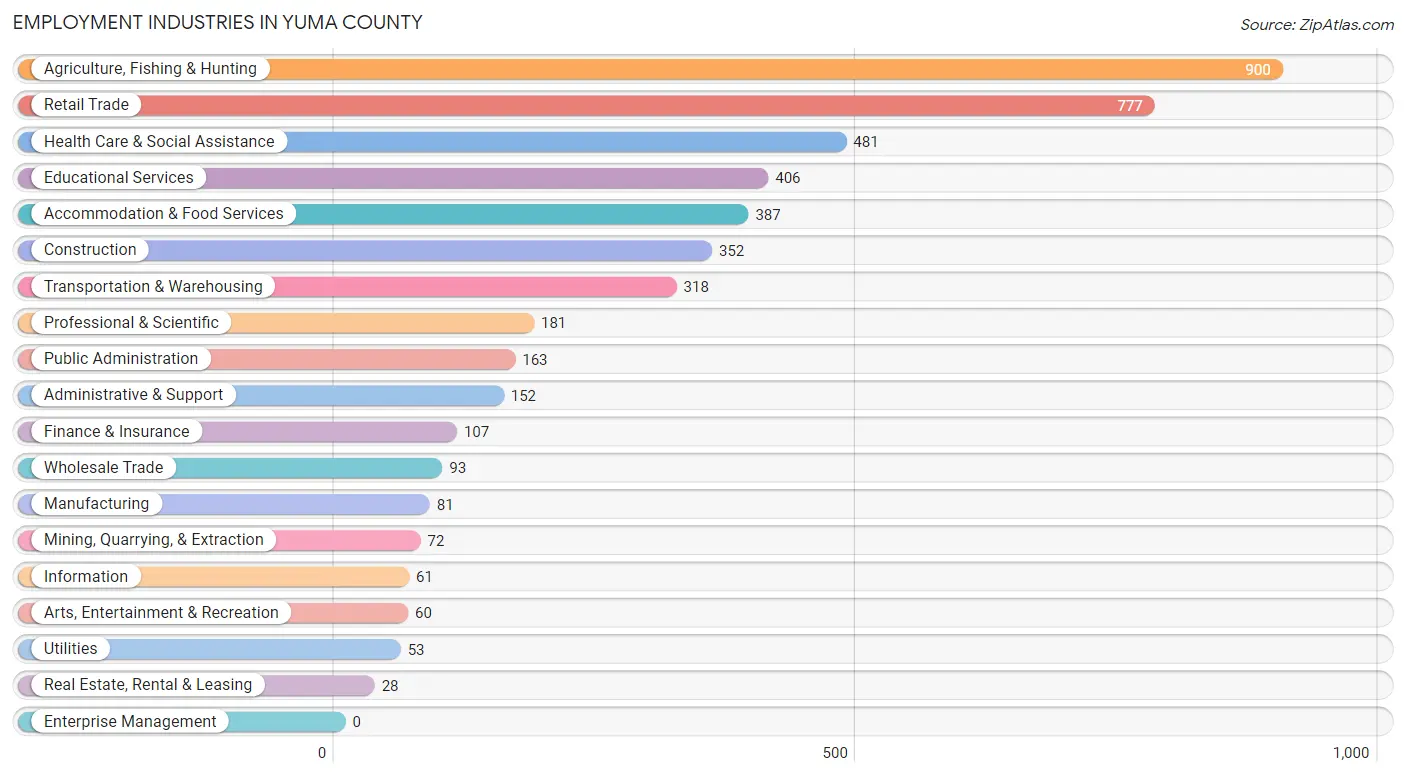
Employment Industries in Yuma County
The major employment industries in Yuma County include Agriculture, Fishing & Hunting (900 | 18.5%), Retail Trade (777 | 16.0%), Health Care & Social Assistance (481 | 9.9%), Educational Services (406 | 8.4%), and Accommodation & Food Services (387 | 8.0%).
Employment Industries by Sex in Yuma County
The Yuma County industries that see more men than women are Mining, Quarrying, & Extraction (100.0%), Utilities (100.0%), and Real Estate, Rental & Leasing (89.3%), whereas the industries that tend to have a higher number of women are Educational Services (87.7%), Health Care & Social Assistance (86.3%), and Accommodation & Food Services (79.1%).
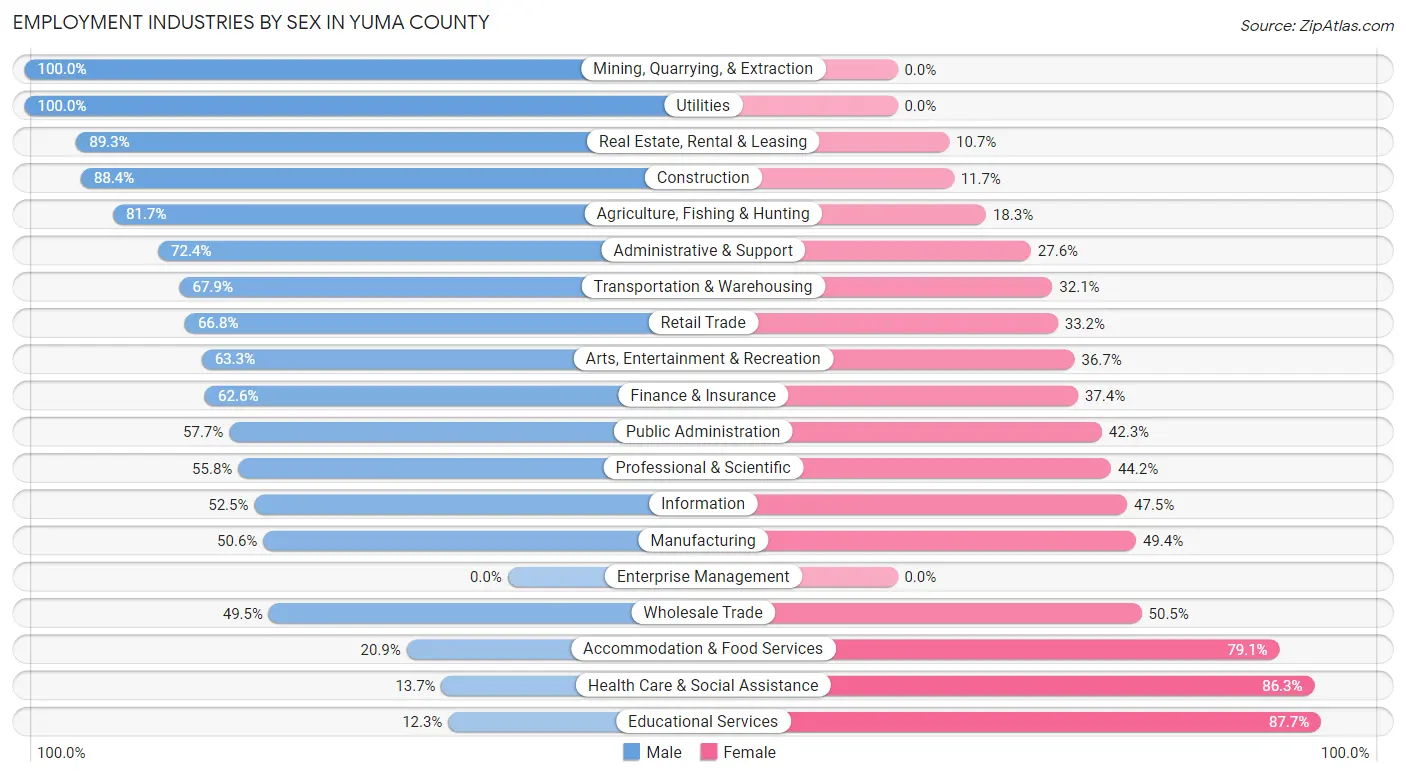
| Industry | Male | Female |
| Agriculture, Fishing & Hunting | 735 (81.7%) | 165 (18.3%) |
| Mining, Quarrying, & Extraction | 72 (100.0%) | 0 (0.0%) |
| Construction | 311 (88.3%) | 41 (11.7%) |
| Manufacturing | 41 (50.6%) | 40 (49.4%) |
| Wholesale Trade | 46 (49.5%) | 47 (50.5%) |
| Retail Trade | 519 (66.8%) | 258 (33.2%) |
| Transportation & Warehousing | 216 (67.9%) | 102 (32.1%) |
| Utilities | 53 (100.0%) | 0 (0.0%) |
| Information | 32 (52.5%) | 29 (47.5%) |
| Finance & Insurance | 67 (62.6%) | 40 (37.4%) |
| Real Estate, Rental & Leasing | 25 (89.3%) | 3 (10.7%) |
| Professional & Scientific | 101 (55.8%) | 80 (44.2%) |
| Enterprise Management | 0 (0.0%) | 0 (0.0%) |
| Administrative & Support | 110 (72.4%) | 42 (27.6%) |
| Educational Services | 50 (12.3%) | 356 (87.7%) |
| Health Care & Social Assistance | 66 (13.7%) | 415 (86.3%) |
| Arts, Entertainment & Recreation | 38 (63.3%) | 22 (36.7%) |
| Accommodation & Food Services | 81 (20.9%) | 306 (79.1%) |
| Public Administration | 94 (57.7%) | 69 (42.3%) |
| Total | 2,740 (56.4%) | 2,117 (43.6%) |
Education in Yuma County
School Enrollment in Yuma County
The most common levels of schooling among the 2,426 students in Yuma County are elementary school (626 | 25.8%), high school (583 | 24.0%), and middle school (504 | 20.8%).
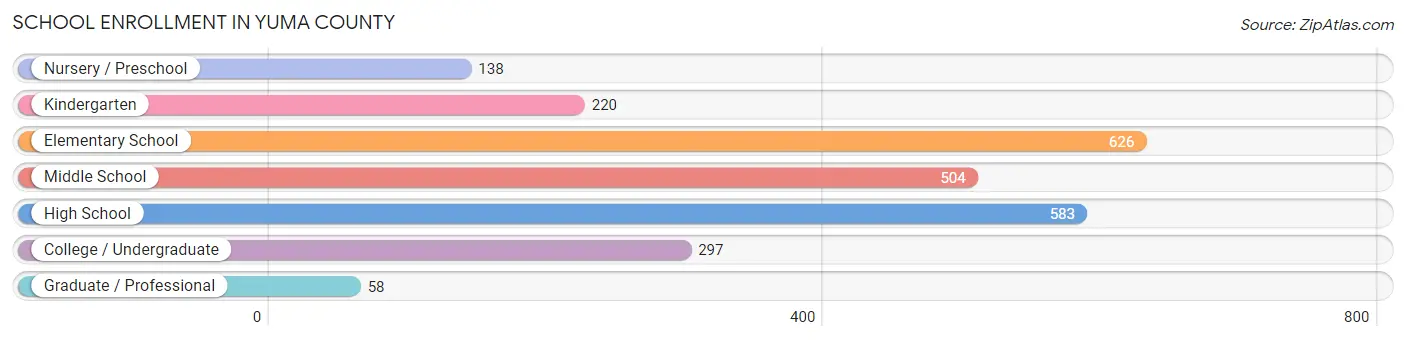
| School Level | # Students | % Students |
| Nursery / Preschool | 138 | 5.7% |
| Kindergarten | 220 | 9.1% |
| Elementary School | 626 | 25.8% |
| Middle School | 504 | 20.8% |
| High School | 583 | 24.0% |
| College / Undergraduate | 297 | 12.2% |
| Graduate / Professional | 58 | 2.4% |
| Total | 2,426 | 100.0% |
School Enrollment by Age by Funding Source in Yuma County
Out of a total of 2,426 students who are enrolled in schools in Yuma County, 206 (8.5%) attend a private institution, while the remaining 2,220 (91.5%) are enrolled in public schools. The age group of 25 to 34 year olds has the highest likelihood of being enrolled in private schools, with 80 (72.1% in the age bracket) enrolled. Conversely, the age group of 15 to 17 year olds has the lowest likelihood of being enrolled in a private school, with 368 (100.0% in the age bracket) attending a public institution.
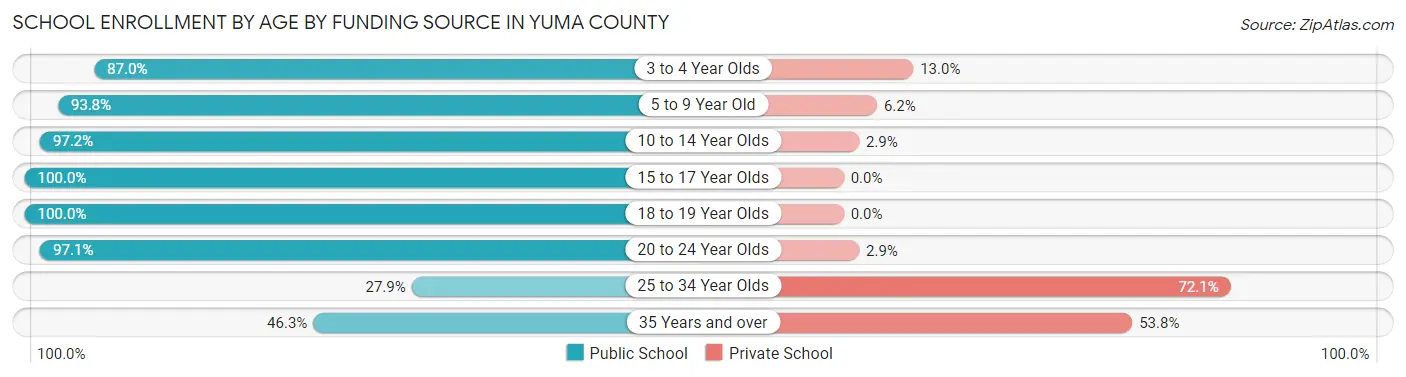
| Age Bracket | Public School | Private School |
| 3 to 4 Year Olds | 47 (87.0%) | 7 (13.0%) |
| 5 to 9 Year Old | 771 (93.8%) | 51 (6.2%) |
| 10 to 14 Year Olds | 716 (97.2%) | 21 (2.9%) |
| 15 to 17 Year Olds | 368 (100.0%) | 0 (0.0%) |
| 18 to 19 Year Olds | 115 (100.0%) | 0 (0.0%) |
| 20 to 24 Year Olds | 135 (97.1%) | 4 (2.9%) |
| 25 to 34 Year Olds | 31 (27.9%) | 80 (72.1%) |
| 35 Years and over | 37 (46.3%) | 43 (53.7%) |
| Total | 2,220 (91.5%) | 206 (8.5%) |
Educational Attainment by Field of Study in Yuma County
Education (389 | 22.5%), bio, nature & agricultural (331 | 19.1%), business (328 | 19.0%), science & technology (206 | 11.9%), and arts & humanities (114 | 6.6%) are the most common fields of study among 1,729 individuals in Yuma County who have obtained a bachelor's degree or higher.
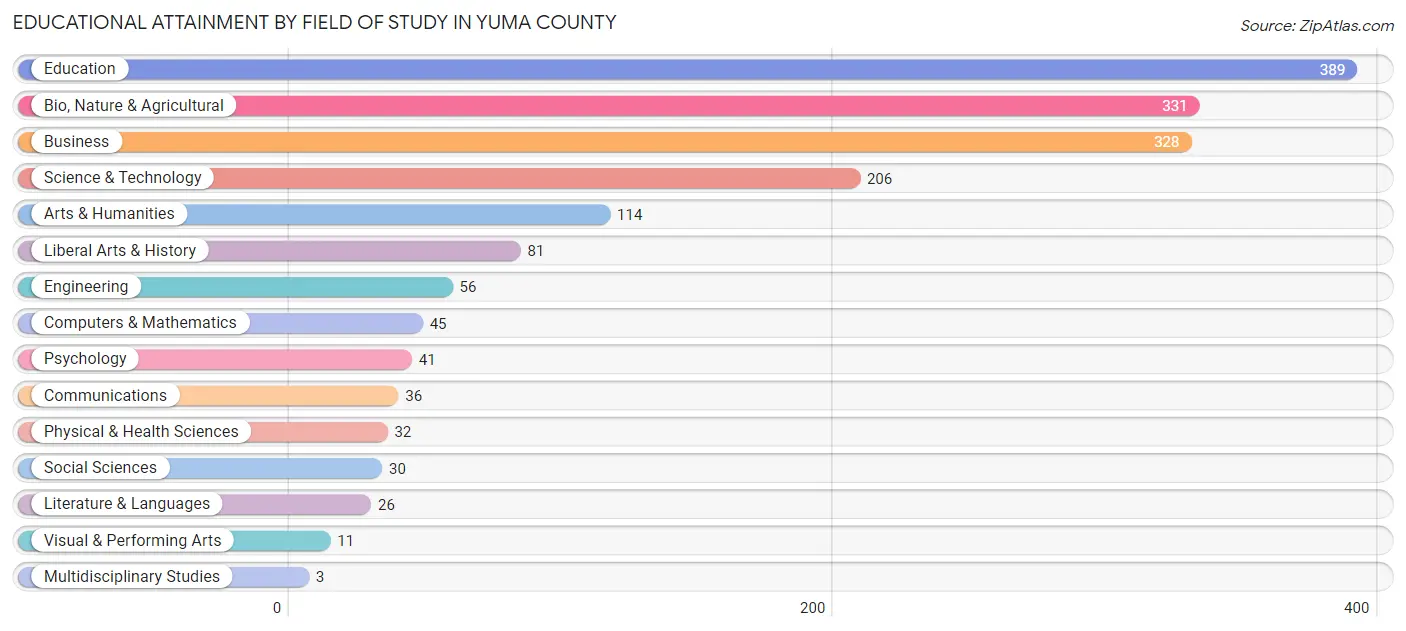
| Field of Study | # Graduates | % Graduates |
| Computers & Mathematics | 45 | 2.6% |
| Bio, Nature & Agricultural | 331 | 19.1% |
| Physical & Health Sciences | 32 | 1.8% |
| Psychology | 41 | 2.4% |
| Social Sciences | 30 | 1.7% |
| Engineering | 56 | 3.2% |
| Multidisciplinary Studies | 3 | 0.2% |
| Science & Technology | 206 | 11.9% |
| Business | 328 | 19.0% |
| Education | 389 | 22.5% |
| Literature & Languages | 26 | 1.5% |
| Liberal Arts & History | 81 | 4.7% |
| Visual & Performing Arts | 11 | 0.6% |
| Communications | 36 | 2.1% |
| Arts & Humanities | 114 | 6.6% |
| Total | 1,729 | 100.0% |
Transportation & Commute in Yuma County
Vehicle Availability by Sex in Yuma County
The most prevalent vehicle ownership categories in Yuma County are males with 2 vehicles (1,143, accounting for 43.2%) and females with 2 vehicles (848, making up 58.0%).

| Vehicles Available | Male | Female |
| No Vehicle | 12 (0.4%) | 14 (0.7%) |
| 1 Vehicle | 316 (11.9%) | 252 (12.8%) |
| 2 Vehicles | 1,143 (43.2%) | 848 (43.0%) |
| 3 Vehicles | 595 (22.5%) | 423 (21.5%) |
| 4 Vehicles | 412 (15.6%) | 273 (13.9%) |
| 5 or more Vehicles | 168 (6.4%) | 161 (8.2%) |
| Total | 2,646 (100.0%) | 1,971 (100.0%) |
Commute Time in Yuma County
The most frequently occuring commute durations in Yuma County are 5 to 9 minutes (1,556 commuters, 35.6%), less than 5 minutes (824 commuters, 18.9%), and 10 to 14 minutes (475 commuters, 10.9%).
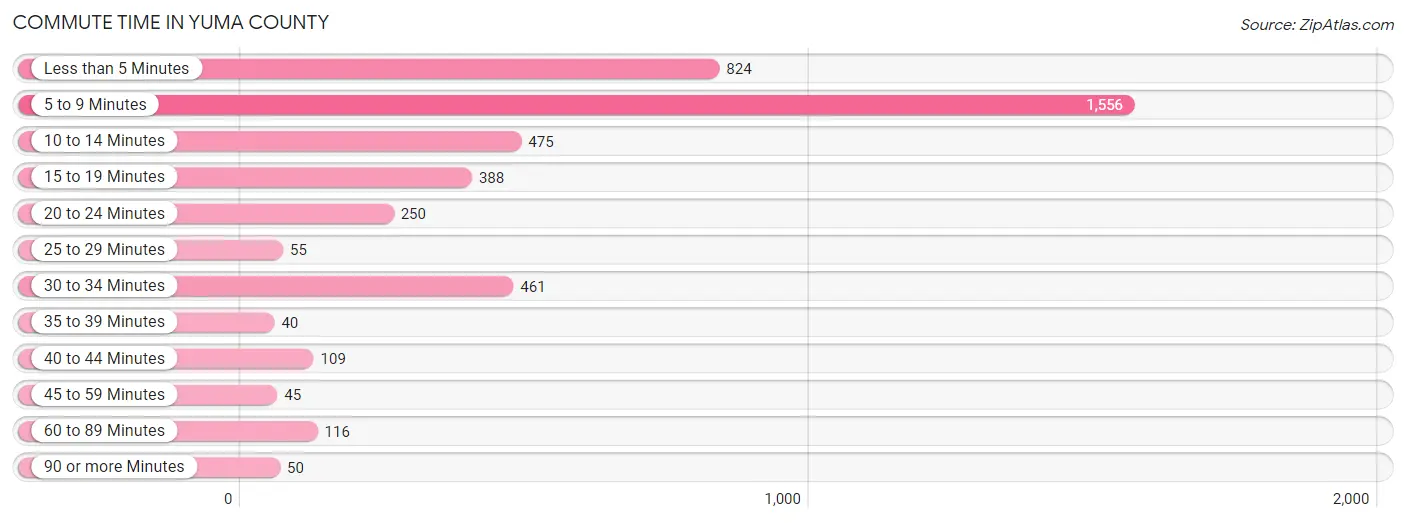
| Commute Time | # Commuters | % Commuters |
| Less than 5 Minutes | 824 | 18.9% |
| 5 to 9 Minutes | 1,556 | 35.6% |
| 10 to 14 Minutes | 475 | 10.9% |
| 15 to 19 Minutes | 388 | 8.9% |
| 20 to 24 Minutes | 250 | 5.7% |
| 25 to 29 Minutes | 55 | 1.3% |
| 30 to 34 Minutes | 461 | 10.5% |
| 35 to 39 Minutes | 40 | 0.9% |
| 40 to 44 Minutes | 109 | 2.5% |
| 45 to 59 Minutes | 45 | 1.0% |
| 60 to 89 Minutes | 116 | 2.7% |
| 90 or more Minutes | 50 | 1.1% |
Commute Time by Sex in Yuma County
The most common commute times in Yuma County are 5 to 9 minutes (820 commuters, 31.9%) for males and 5 to 9 minutes (736 commuters, 40.9%) for females.

| Commute Time | Male | Female |
| Less than 5 Minutes | 431 (16.8%) | 393 (21.8%) |
| 5 to 9 Minutes | 820 (31.9%) | 736 (40.9%) |
| 10 to 14 Minutes | 316 (12.3%) | 159 (8.8%) |
| 15 to 19 Minutes | 269 (10.5%) | 119 (6.6%) |
| 20 to 24 Minutes | 133 (5.2%) | 117 (6.5%) |
| 25 to 29 Minutes | 49 (1.9%) | 6 (0.3%) |
| 30 to 34 Minutes | 296 (11.5%) | 165 (9.2%) |
| 35 to 39 Minutes | 14 (0.5%) | 26 (1.4%) |
| 40 to 44 Minutes | 52 (2.0%) | 57 (3.2%) |
| 45 to 59 Minutes | 28 (1.1%) | 17 (0.9%) |
| 60 to 89 Minutes | 110 (4.3%) | 6 (0.3%) |
| 90 or more Minutes | 50 (1.9%) | 0 (0.0%) |
Time of Departure to Work by Sex in Yuma County
The most frequent times of departure to work in Yuma County are 7:00 AM to 7:29 AM (470, 18.3%) for males and 7:00 AM to 7:29 AM (428, 23.8%) for females.
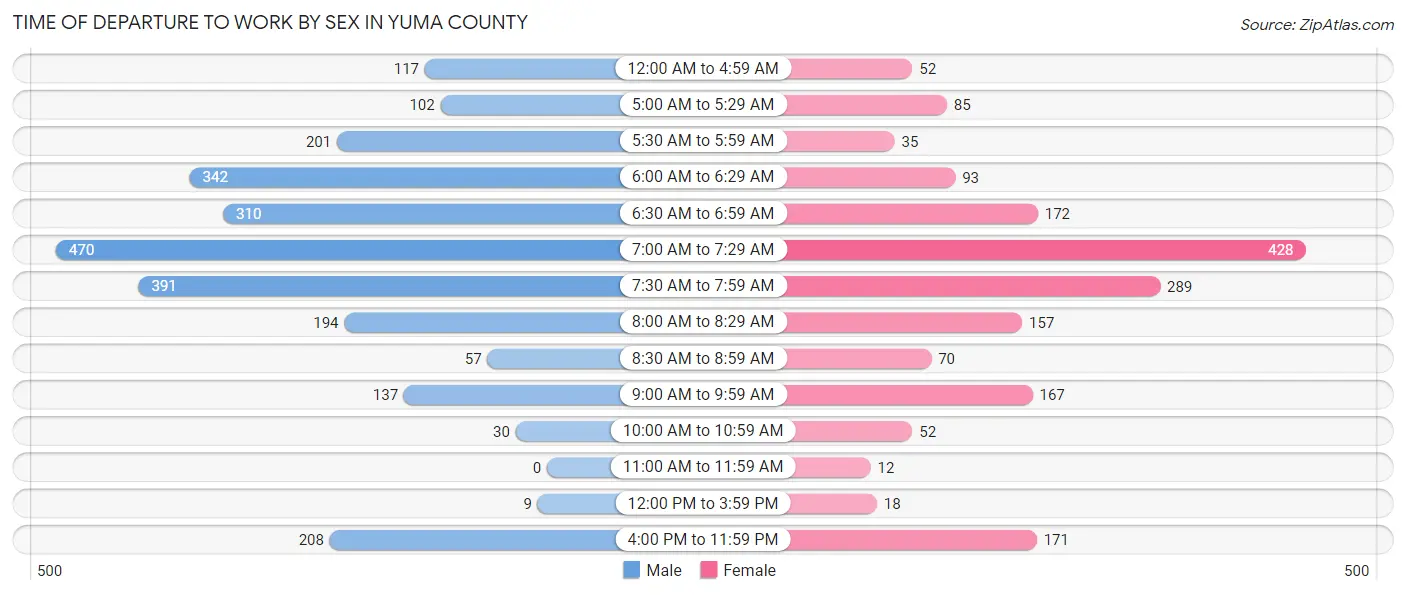
| Time of Departure | Male | Female |
| 12:00 AM to 4:59 AM | 117 (4.6%) | 52 (2.9%) |
| 5:00 AM to 5:29 AM | 102 (4.0%) | 85 (4.7%) |
| 5:30 AM to 5:59 AM | 201 (7.8%) | 35 (1.9%) |
| 6:00 AM to 6:29 AM | 342 (13.3%) | 93 (5.2%) |
| 6:30 AM to 6:59 AM | 310 (12.1%) | 172 (9.6%) |
| 7:00 AM to 7:29 AM | 470 (18.3%) | 428 (23.8%) |
| 7:30 AM to 7:59 AM | 391 (15.2%) | 289 (16.1%) |
| 8:00 AM to 8:29 AM | 194 (7.5%) | 157 (8.7%) |
| 8:30 AM to 8:59 AM | 57 (2.2%) | 70 (3.9%) |
| 9:00 AM to 9:59 AM | 137 (5.3%) | 167 (9.3%) |
| 10:00 AM to 10:59 AM | 30 (1.2%) | 52 (2.9%) |
| 11:00 AM to 11:59 AM | 0 (0.0%) | 12 (0.7%) |
| 12:00 PM to 3:59 PM | 9 (0.4%) | 18 (1.0%) |
| 4:00 PM to 11:59 PM | 208 (8.1%) | 171 (9.5%) |
| Total | 2,568 (100.0%) | 1,801 (100.0%) |
Housing Occupancy in Yuma County
Occupancy by Ownership in Yuma County
Of the total 3,953 dwellings in Yuma County, owner-occupied units account for 2,799 (70.8%), while renter-occupied units make up 1,154 (29.2%).
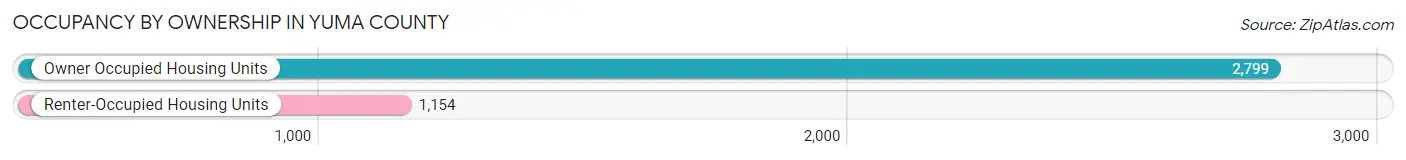
| Occupancy | # Housing Units | % Housing Units |
| Owner Occupied Housing Units | 2,799 | 70.8% |
| Renter-Occupied Housing Units | 1,154 | 29.2% |
| Total Occupied Housing Units | 3,953 | 100.0% |
Occupancy by Household Size in Yuma County
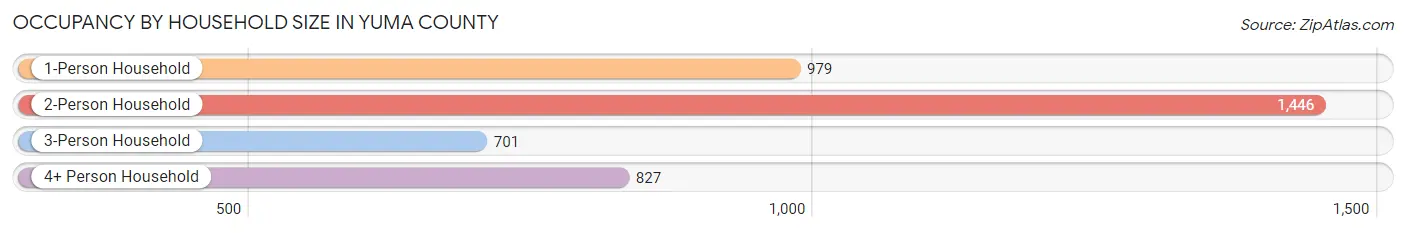
| Household Size | # Housing Units | % Housing Units |
| 1-Person Household | 979 | 24.8% |
| 2-Person Household | 1,446 | 36.6% |
| 3-Person Household | 701 | 17.7% |
| 4+ Person Household | 827 | 20.9% |
| Total Housing Units | 3,953 | 100.0% |
Occupancy by Ownership by Household Size in Yuma County
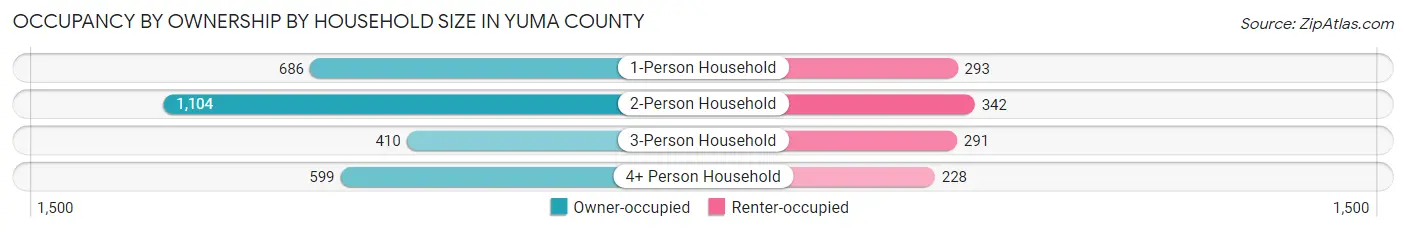
| Household Size | Owner-occupied | Renter-occupied |
| 1-Person Household | 686 (70.1%) | 293 (29.9%) |
| 2-Person Household | 1,104 (76.3%) | 342 (23.6%) |
| 3-Person Household | 410 (58.5%) | 291 (41.5%) |
| 4+ Person Household | 599 (72.4%) | 228 (27.6%) |
| Total Housing Units | 2,799 (70.8%) | 1,154 (29.2%) |
Occupancy by Educational Attainment in Yuma County
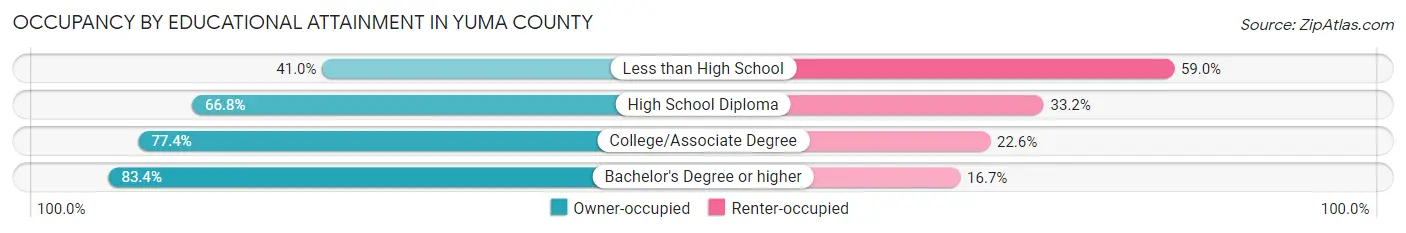
| Household Size | Owner-occupied | Renter-occupied |
| Less than High School | 240 (41.0%) | 346 (59.0%) |
| High School Diploma | 684 (66.8%) | 340 (33.2%) |
| College/Associate Degree | 1,019 (77.4%) | 297 (22.6%) |
| Bachelor's Degree or higher | 856 (83.4%) | 171 (16.7%) |
Occupancy by Age of Householder in Yuma County
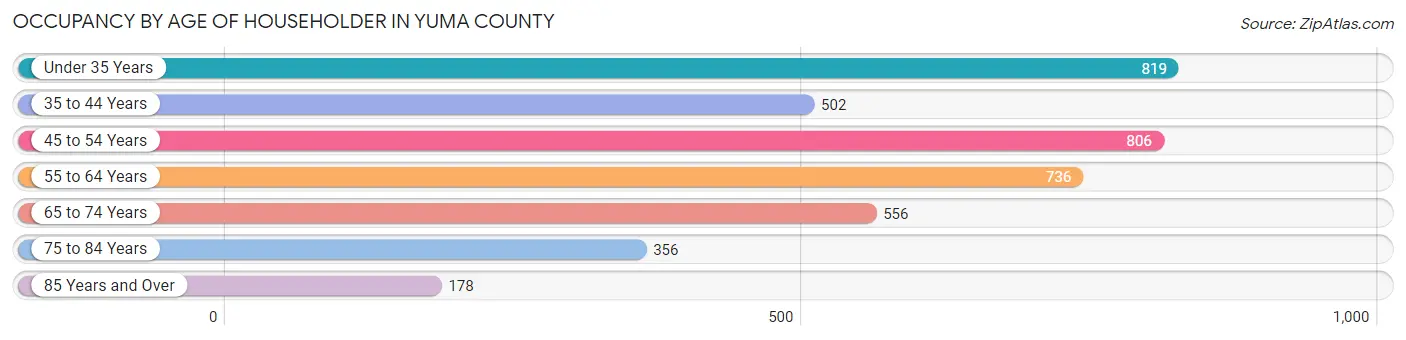
| Age Bracket | # Households | % Households |
| Under 35 Years | 819 | 20.7% |
| 35 to 44 Years | 502 | 12.7% |
| 45 to 54 Years | 806 | 20.4% |
| 55 to 64 Years | 736 | 18.6% |
| 65 to 74 Years | 556 | 14.1% |
| 75 to 84 Years | 356 | 9.0% |
| 85 Years and Over | 178 | 4.5% |
| Total | 3,953 | 100.0% |
Housing Finances in Yuma County
Median Income by Occupancy in Yuma County
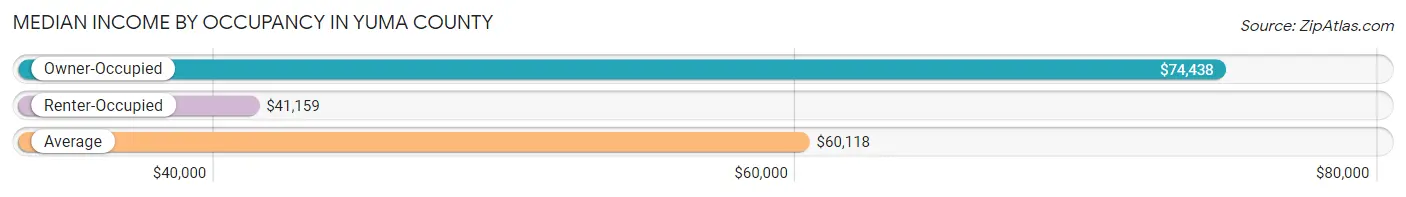
| Occupancy Type | # Households | Median Income |
| Owner-Occupied | 2,799 (70.8%) | $74,438 |
| Renter-Occupied | 1,154 (29.2%) | $41,159 |
| Average | 3,953 (100.0%) | $60,118 |
Occupancy by Householder Income Bracket in Yuma County
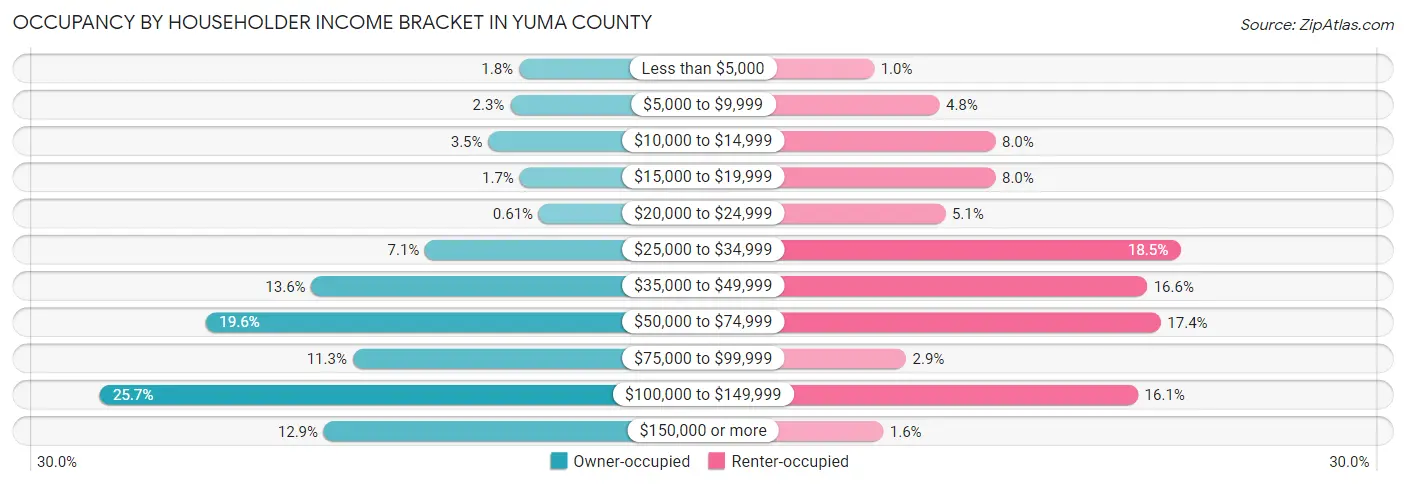
| Income Bracket | Owner-occupied | Renter-occupied |
| Less than $5,000 | 49 (1.8%) | 12 (1.0%) |
| $5,000 to $9,999 | 63 (2.2%) | 55 (4.8%) |
| $10,000 to $14,999 | 98 (3.5%) | 92 (8.0%) |
| $15,000 to $19,999 | 48 (1.7%) | 92 (8.0%) |
| $20,000 to $24,999 | 17 (0.6%) | 59 (5.1%) |
| $25,000 to $34,999 | 199 (7.1%) | 214 (18.5%) |
| $35,000 to $49,999 | 381 (13.6%) | 192 (16.6%) |
| $50,000 to $74,999 | 549 (19.6%) | 201 (17.4%) |
| $75,000 to $99,999 | 315 (11.3%) | 33 (2.9%) |
| $100,000 to $149,999 | 719 (25.7%) | 186 (16.1%) |
| $150,000 or more | 361 (12.9%) | 18 (1.6%) |
| Total | 2,799 (100.0%) | 1,154 (100.0%) |
Monthly Housing Cost Tiers in Yuma County
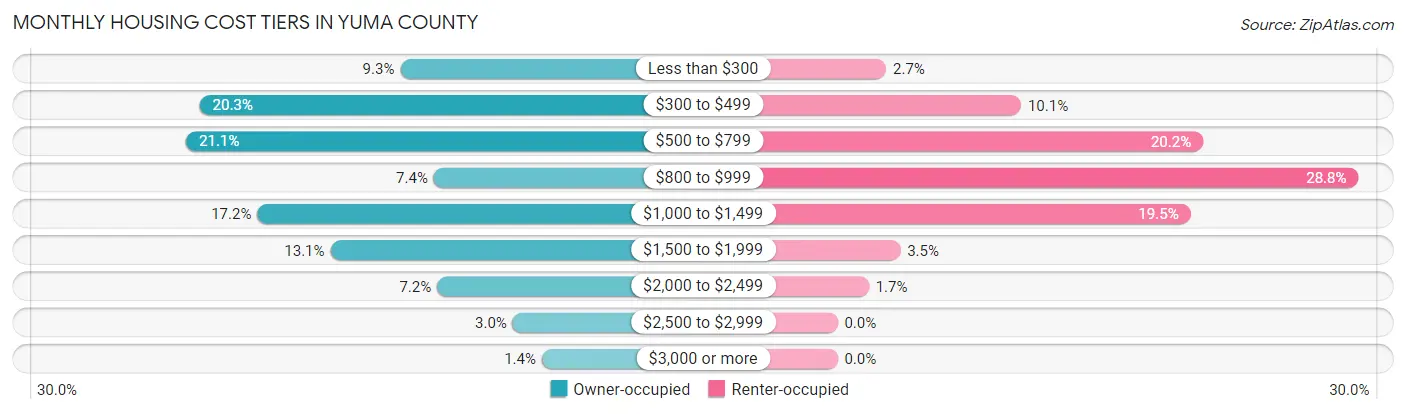
| Monthly Cost | Owner-occupied | Renter-occupied |
| Less than $300 | 259 (9.2%) | 31 (2.7%) |
| $300 to $499 | 569 (20.3%) | 117 (10.1%) |
| $500 to $799 | 590 (21.1%) | 233 (20.2%) |
| $800 to $999 | 207 (7.4%) | 332 (28.8%) |
| $1,000 to $1,499 | 480 (17.2%) | 225 (19.5%) |
| $1,500 to $1,999 | 367 (13.1%) | 40 (3.5%) |
| $2,000 to $2,499 | 202 (7.2%) | 20 (1.7%) |
| $2,500 to $2,999 | 85 (3.0%) | 0 (0.0%) |
| $3,000 or more | 40 (1.4%) | 0 (0.0%) |
| Total | 2,799 (100.0%) | 1,154 (100.0%) |
Physical Housing Characteristics in Yuma County
Housing Structures in Yuma County
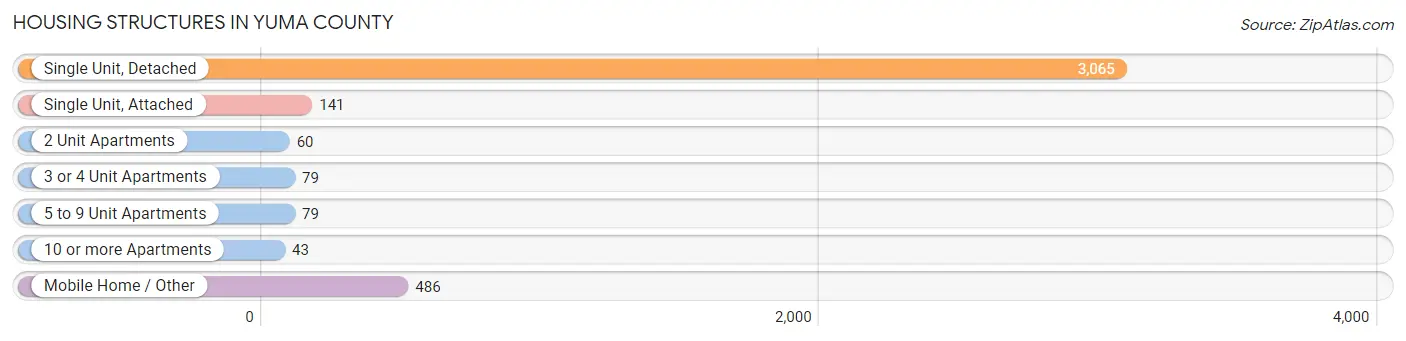
| Structure Type | # Housing Units | % Housing Units |
| Single Unit, Detached | 3,065 | 77.5% |
| Single Unit, Attached | 141 | 3.6% |
| 2 Unit Apartments | 60 | 1.5% |
| 3 or 4 Unit Apartments | 79 | 2.0% |
| 5 to 9 Unit Apartments | 79 | 2.0% |
| 10 or more Apartments | 43 | 1.1% |
| Mobile Home / Other | 486 | 12.3% |
| Total | 3,953 | 100.0% |
Housing Structures by Occupancy in Yuma County
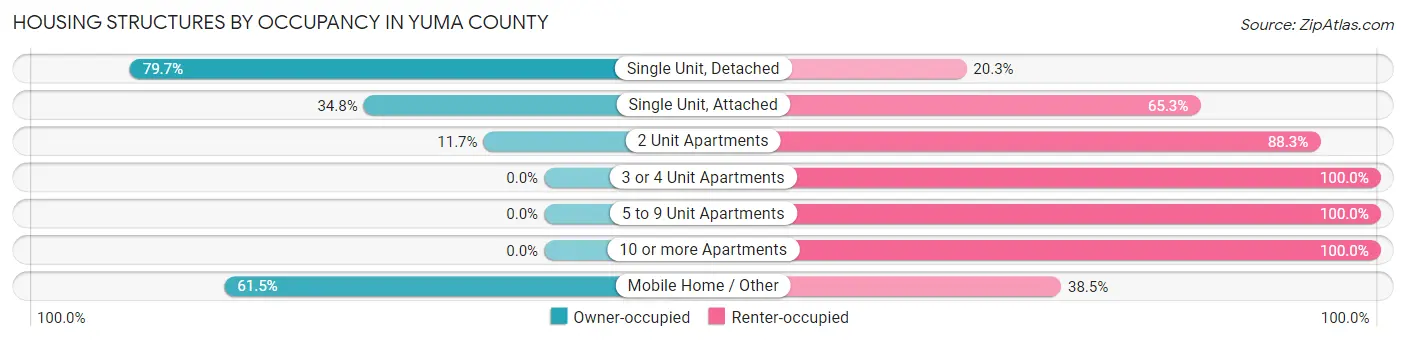
| Structure Type | Owner-occupied | Renter-occupied |
| Single Unit, Detached | 2,444 (79.7%) | 621 (20.3%) |
| Single Unit, Attached | 49 (34.7%) | 92 (65.2%) |
| 2 Unit Apartments | 7 (11.7%) | 53 (88.3%) |
| 3 or 4 Unit Apartments | 0 (0.0%) | 79 (100.0%) |
| 5 to 9 Unit Apartments | 0 (0.0%) | 79 (100.0%) |
| 10 or more Apartments | 0 (0.0%) | 43 (100.0%) |
| Mobile Home / Other | 299 (61.5%) | 187 (38.5%) |
| Total | 2,799 (70.8%) | 1,154 (29.2%) |
Housing Structures by Number of Rooms in Yuma County
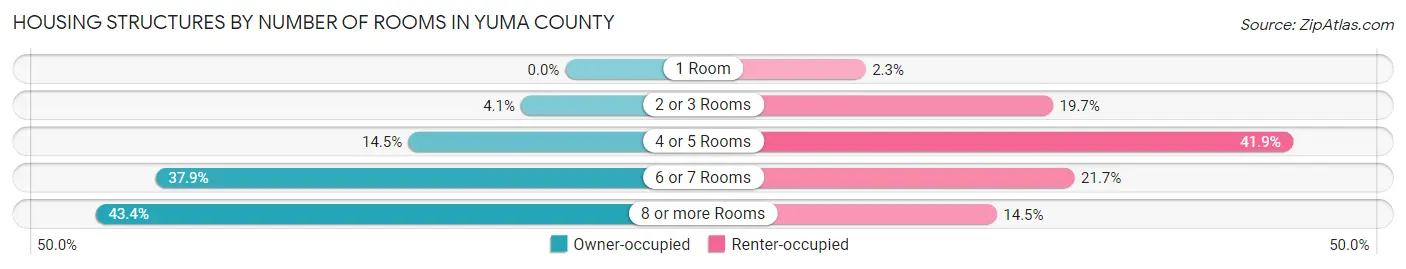
| Number of Rooms | Owner-occupied | Renter-occupied |
| 1 Room | 0 (0.0%) | 27 (2.3%) |
| 2 or 3 Rooms | 115 (4.1%) | 227 (19.7%) |
| 4 or 5 Rooms | 407 (14.5%) | 483 (41.8%) |
| 6 or 7 Rooms | 1,061 (37.9%) | 250 (21.7%) |
| 8 or more Rooms | 1,216 (43.4%) | 167 (14.5%) |
| Total | 2,799 (100.0%) | 1,154 (100.0%) |
Housing Structure by Heating Type in Yuma County
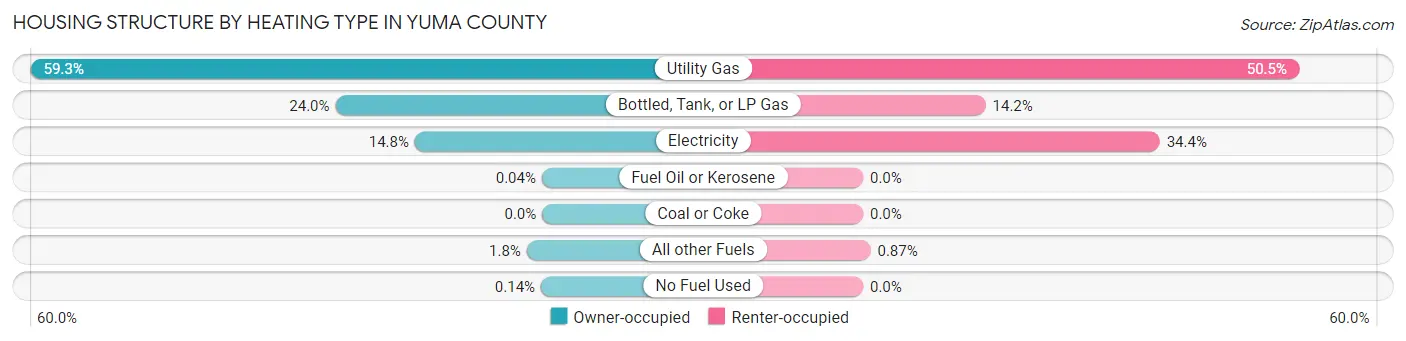
| Heating Type | Owner-occupied | Renter-occupied |
| Utility Gas | 1,660 (59.3%) | 583 (50.5%) |
| Bottled, Tank, or LP Gas | 671 (24.0%) | 164 (14.2%) |
| Electricity | 413 (14.8%) | 397 (34.4%) |
| Fuel Oil or Kerosene | 1 (0.0%) | 0 (0.0%) |
| Coal or Coke | 0 (0.0%) | 0 (0.0%) |
| All other Fuels | 50 (1.8%) | 10 (0.9%) |
| No Fuel Used | 4 (0.1%) | 0 (0.0%) |
| Total | 2,799 (100.0%) | 1,154 (100.0%) |
Household Vehicle Usage in Yuma County
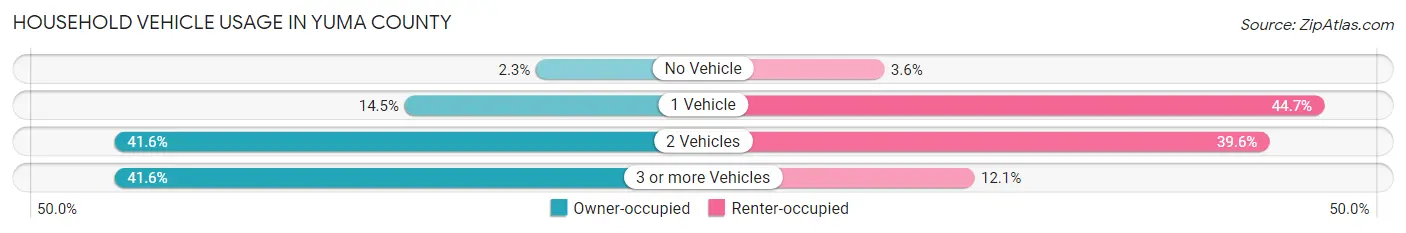
| Vehicles per Household | Owner-occupied | Renter-occupied |
| No Vehicle | 63 (2.2%) | 42 (3.6%) |
| 1 Vehicle | 406 (14.5%) | 516 (44.7%) |
| 2 Vehicles | 1,165 (41.6%) | 457 (39.6%) |
| 3 or more Vehicles | 1,165 (41.6%) | 139 (12.0%) |
| Total | 2,799 (100.0%) | 1,154 (100.0%) |
Real Estate & Mortgages in Yuma County
Real Estate and Mortgage Overview in Yuma County
| Characteristic | Without Mortgage | With Mortgage |
| Housing Units | 1,391 | 1,408 |
| Median Property Value | $171,000 | $220,900 |
| Median Household Income | $61,683 | $220 |
| Monthly Housing Costs | $463 | $40 |
| Real Estate Taxes | $791 | $21 |
Property Value by Mortgage Status in Yuma County
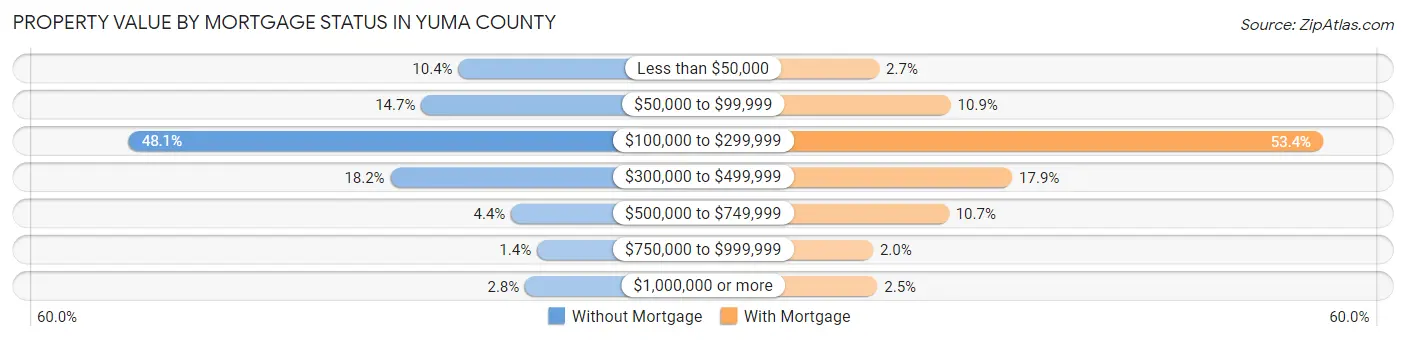
| Property Value | Without Mortgage | With Mortgage |
| Less than $50,000 | 145 (10.4%) | 38 (2.7%) |
| $50,000 to $99,999 | 204 (14.7%) | 153 (10.9%) |
| $100,000 to $299,999 | 669 (48.1%) | 752 (53.4%) |
| $300,000 to $499,999 | 253 (18.2%) | 252 (17.9%) |
| $500,000 to $749,999 | 61 (4.4%) | 150 (10.6%) |
| $750,000 to $999,999 | 20 (1.4%) | 28 (2.0%) |
| $1,000,000 or more | 39 (2.8%) | 35 (2.5%) |
| Total | 1,391 (100.0%) | 1,408 (100.0%) |
Household Income by Mortgage Status in Yuma County
| Household Income | Without Mortgage | With Mortgage |
| Less than $10,000 | 70 (5.0%) | 1 (0.1%) |
| $10,000 to $24,999 | 110 (7.9%) | 42 (3.0%) |
| $25,000 to $34,999 | 193 (13.9%) | 53 (3.8%) |
| $35,000 to $49,999 | 242 (17.4%) | 6 (0.4%) |
| $50,000 to $74,999 | 170 (12.2%) | 139 (9.9%) |
| $75,000 to $99,999 | 171 (12.3%) | 379 (26.9%) |
| $100,000 to $149,999 | 294 (21.1%) | 144 (10.2%) |
| $150,000 or more | 141 (10.1%) | 425 (30.2%) |
| Total | 1,391 (100.0%) | 1,408 (100.0%) |
Property Value to Household Income Ratio in Yuma County
| Value-to-Income Ratio | Without Mortgage | With Mortgage |
| Less than 2.0x | 522 (37.5%) | 91,500 (6,498.6%) |
| 2.0x to 2.9x | 289 (20.8%) | 502 (35.6%) |
| 3.0x to 3.9x | 114 (8.2%) | 357 (25.4%) |
| 4.0x or more | 447 (32.1%) | 124 (8.8%) |
| Total | 1,391 (100.0%) | 1,408 (100.0%) |
Real Estate Taxes by Mortgage Status in Yuma County
| Property Taxes | Without Mortgage | With Mortgage |
| Less than $800 | 673 (48.4%) | 1 (0.1%) |
| $800 to $1,499 | 365 (26.2%) | 389 (27.6%) |
| $800 to $1,499 | 293 (21.1%) | 547 (38.9%) |
| Total | 1,391 (100.0%) | 1,408 (100.0%) |
Health & Disability in Yuma County
Health Insurance Coverage by Age in Yuma County
| Age Bracket | With Coverage | Without Coverage |
| Under 6 Years | 707 (86.6%) | 109 (13.4%) |
| 6 to 18 Years | 1,621 (83.4%) | 323 (16.6%) |
| 19 to 25 Years | 469 (88.8%) | 59 (11.2%) |
| 26 to 34 Years | 1,022 (83.4%) | 203 (16.6%) |
| 35 to 44 Years | 909 (84.2%) | 171 (15.8%) |
| 45 to 54 Years | 788 (63.0%) | 462 (37.0%) |
| 55 to 64 Years | 1,055 (85.7%) | 176 (14.3%) |
| 65 to 74 Years | 969 (100.0%) | 0 (0.0%) |
| 75 Years and older | 738 (99.9%) | 1 (0.1%) |
| Total | 8,278 (84.6%) | 1,504 (15.4%) |
Health Insurance Coverage by Citizenship Status in Yuma County
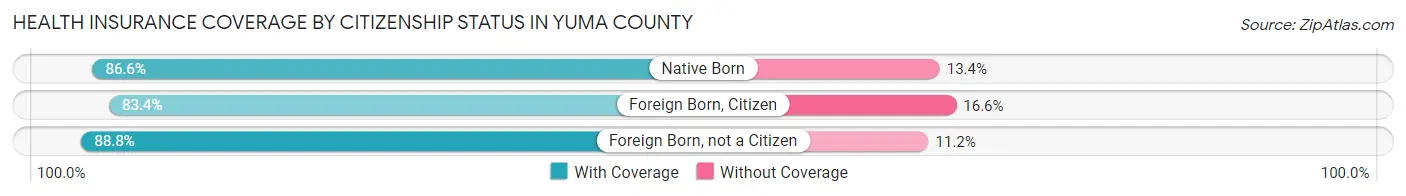
| Citizenship Status | With Coverage | Without Coverage |
| Native Born | 707 (86.6%) | 109 (13.4%) |
| Foreign Born, Citizen | 1,621 (83.4%) | 323 (16.6%) |
| Foreign Born, not a Citizen | 469 (88.8%) | 59 (11.2%) |
Health Insurance Coverage by Household Income in Yuma County
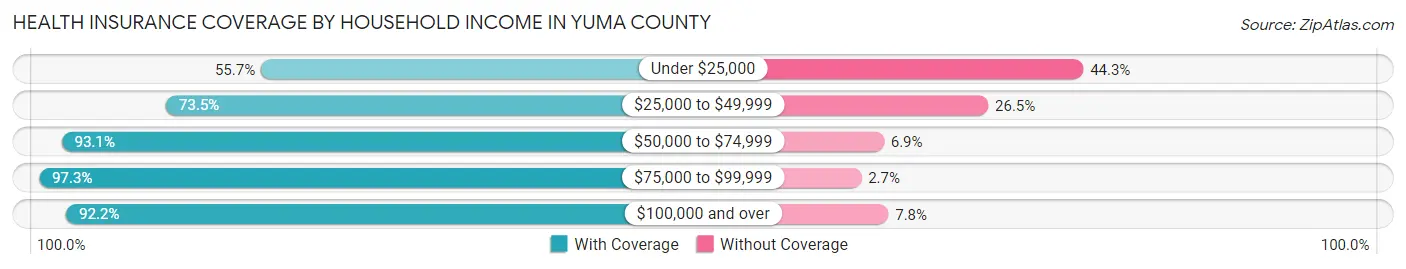
| Household Income | With Coverage | Without Coverage |
| Under $25,000 | 673 (55.7%) | 535 (44.3%) |
| $25,000 to $49,999 | 1,441 (73.5%) | 519 (26.5%) |
| $50,000 to $74,999 | 1,653 (93.1%) | 123 (6.9%) |
| $75,000 to $99,999 | 936 (97.3%) | 26 (2.7%) |
| $100,000 and over | 3,575 (92.2%) | 301 (7.8%) |
Public vs Private Health Insurance Coverage by Age in Yuma County
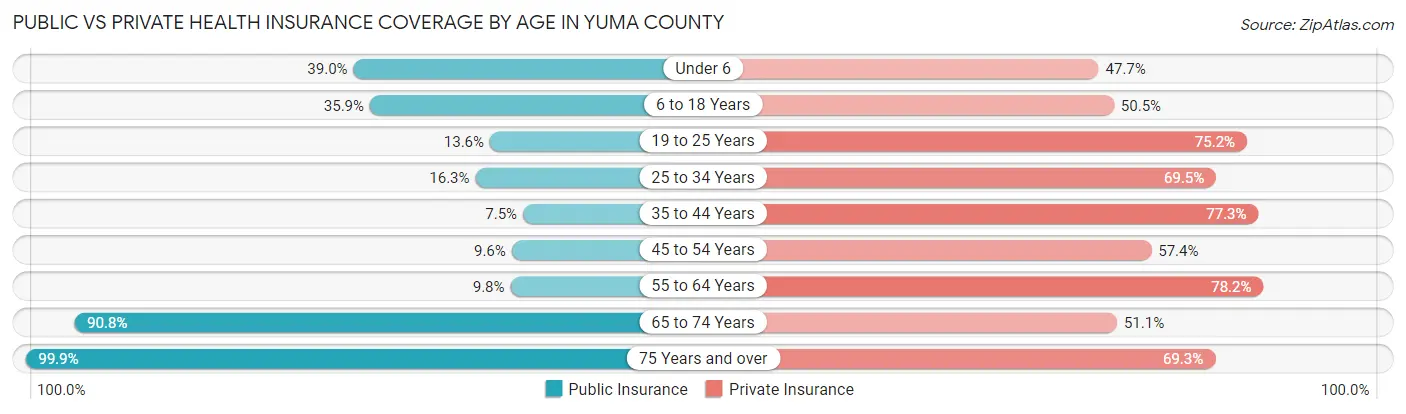
| Age Bracket | Public Insurance | Private Insurance |
| Under 6 | 318 (39.0%) | 389 (47.7%) |
| 6 to 18 Years | 698 (35.9%) | 982 (50.5%) |
| 19 to 25 Years | 72 (13.6%) | 397 (75.2%) |
| 25 to 34 Years | 200 (16.3%) | 851 (69.5%) |
| 35 to 44 Years | 81 (7.5%) | 835 (77.3%) |
| 45 to 54 Years | 120 (9.6%) | 718 (57.4%) |
| 55 to 64 Years | 121 (9.8%) | 963 (78.2%) |
| 65 to 74 Years | 880 (90.8%) | 495 (51.1%) |
| 75 Years and over | 738 (99.9%) | 512 (69.3%) |
| Total | 3,228 (33.0%) | 6,142 (62.8%) |
Disability Status by Sex by Age in Yuma County
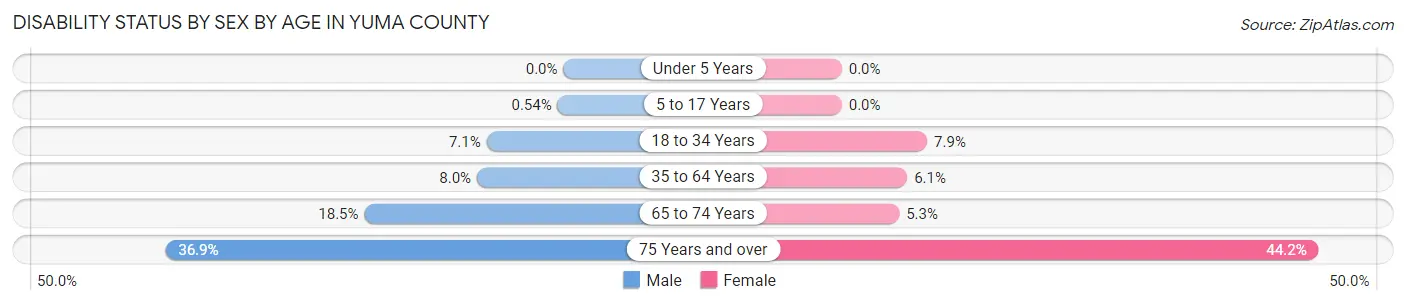
| Age Bracket | Male | Female |
| Under 5 Years | 0 (0.0%) | 0 (0.0%) |
| 5 to 17 Years | 5 (0.5%) | 0 (0.0%) |
| 18 to 34 Years | 71 (7.1%) | 69 (7.9%) |
| 35 to 64 Years | 147 (8.0%) | 105 (6.1%) |
| 65 to 74 Years | 82 (18.5%) | 28 (5.3%) |
| 75 Years and over | 116 (36.9%) | 188 (44.2%) |
Disability Class by Sex by Age in Yuma County
Disability Class: Hearing Difficulty
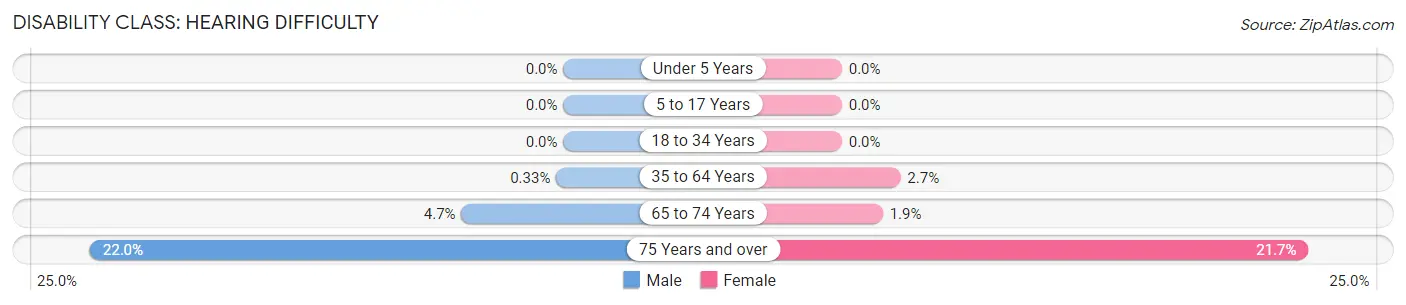
| Age Bracket | Male | Female |
| Under 5 Years | 0 (0.0%) | 0 (0.0%) |
| 5 to 17 Years | 0 (0.0%) | 0 (0.0%) |
| 18 to 34 Years | 0 (0.0%) | 0 (0.0%) |
| 35 to 64 Years | 6 (0.3%) | 47 (2.7%) |
| 65 to 74 Years | 21 (4.7%) | 10 (1.9%) |
| 75 Years and over | 69 (22.0%) | 92 (21.6%) |
Disability Class: Vision Difficulty
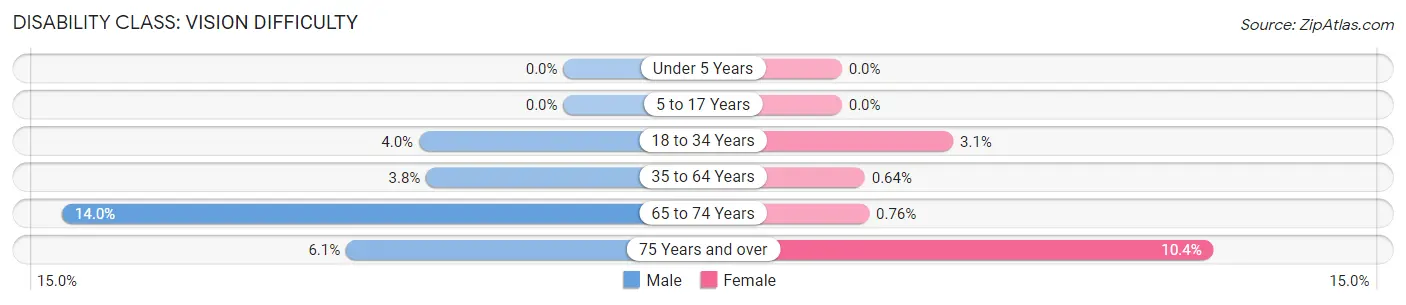
| Age Bracket | Male | Female |
| Under 5 Years | 0 (0.0%) | 0 (0.0%) |
| 5 to 17 Years | 0 (0.0%) | 0 (0.0%) |
| 18 to 34 Years | 40 (4.0%) | 27 (3.1%) |
| 35 to 64 Years | 70 (3.8%) | 11 (0.6%) |
| 65 to 74 Years | 62 (14.0%) | 4 (0.8%) |
| 75 Years and over | 19 (6.0%) | 44 (10.3%) |
Disability Class: Cognitive Difficulty
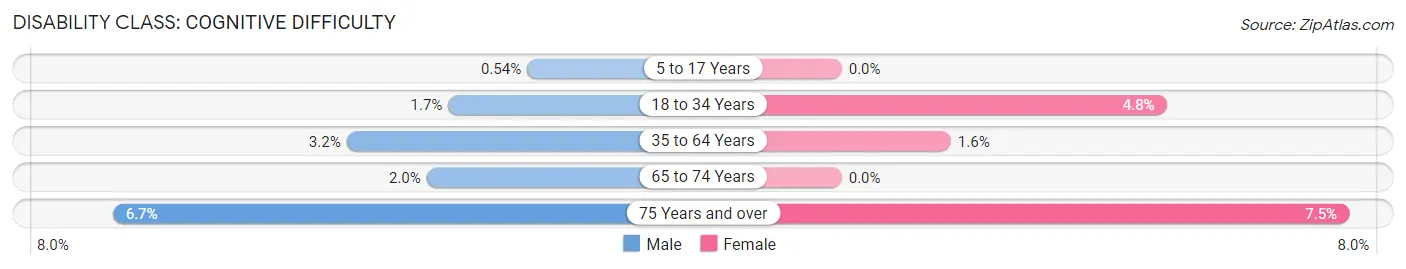
| Age Bracket | Male | Female |
| 5 to 17 Years | 5 (0.5%) | 0 (0.0%) |
| 18 to 34 Years | 17 (1.7%) | 42 (4.8%) |
| 35 to 64 Years | 59 (3.2%) | 28 (1.6%) |
| 65 to 74 Years | 9 (2.0%) | 0 (0.0%) |
| 75 Years and over | 21 (6.7%) | 32 (7.5%) |
Disability Class: Ambulatory Difficulty
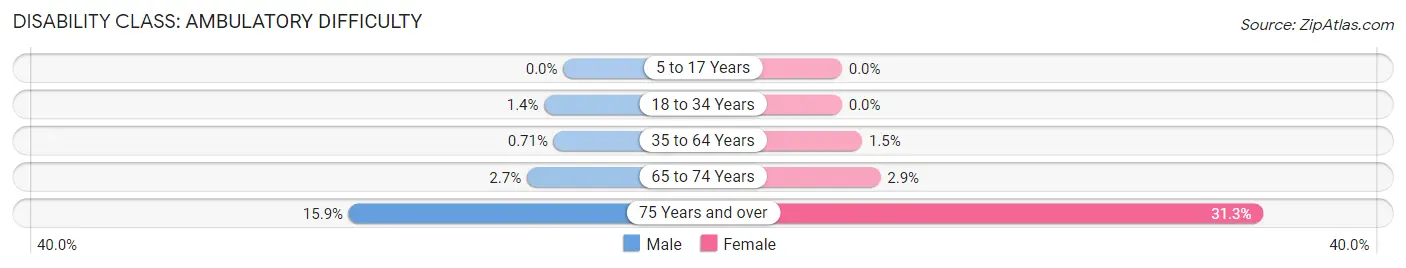
| Age Bracket | Male | Female |
| 5 to 17 Years | 0 (0.0%) | 0 (0.0%) |
| 18 to 34 Years | 14 (1.4%) | 0 (0.0%) |
| 35 to 64 Years | 13 (0.7%) | 26 (1.5%) |
| 65 to 74 Years | 12 (2.7%) | 15 (2.9%) |
| 75 Years and over | 50 (15.9%) | 133 (31.3%) |
Disability Class: Self-Care Difficulty
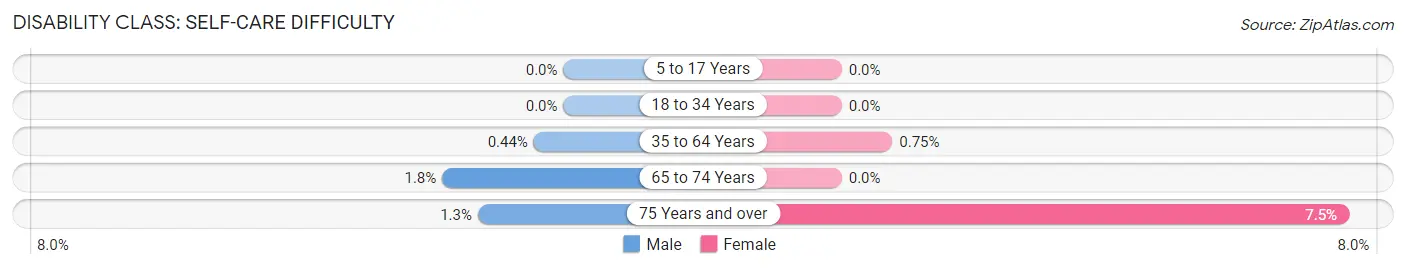
| Age Bracket | Male | Female |
| 5 to 17 Years | 0 (0.0%) | 0 (0.0%) |
| 18 to 34 Years | 0 (0.0%) | 0 (0.0%) |
| 35 to 64 Years | 8 (0.4%) | 13 (0.7%) |
| 65 to 74 Years | 8 (1.8%) | 0 (0.0%) |
| 75 Years and over | 4 (1.3%) | 32 (7.5%) |
Technology Access in Yuma County
Computing Device Access in Yuma County
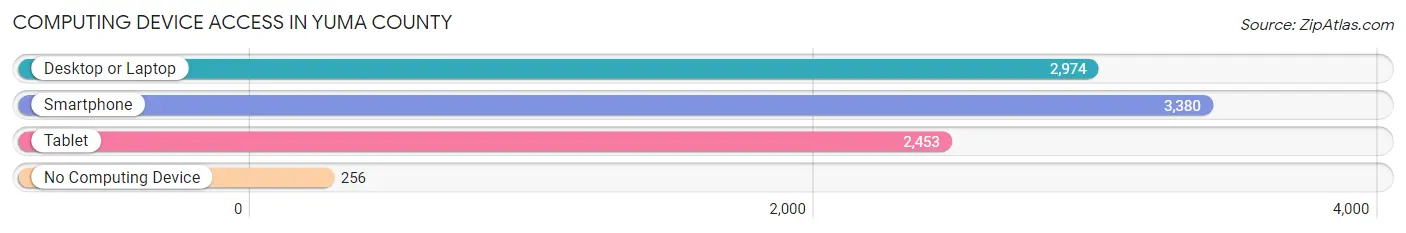
| Device Type | # Households | % Households |
| Desktop or Laptop | 2,974 | 75.2% |
| Smartphone | 3,380 | 85.5% |
| Tablet | 2,453 | 62.1% |
| No Computing Device | 256 | 6.5% |
| Total | 3,953 | 100.0% |
Internet Access in Yuma County
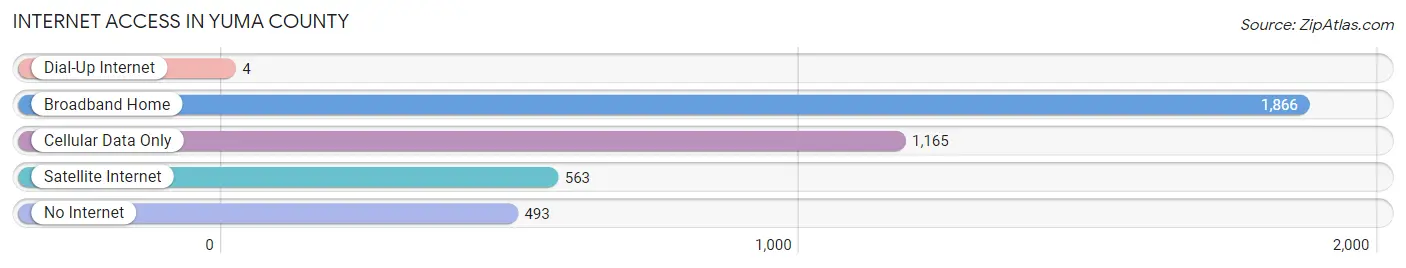
| Internet Type | # Households | % Households |
| Dial-Up Internet | 4 | 0.1% |
| Broadband Home | 1,866 | 47.2% |
| Cellular Data Only | 1,165 | 29.5% |
| Satellite Internet | 563 | 14.2% |
| No Internet | 493 | 12.5% |
| Total | 3,953 | 100.0% |
Yuma County Summary
Yuma County is located in the northeast corner of Colorado, and is bordered by Nebraska to the north, Kansas to the east, and Washington County to the south. The county seat is Wray, and the county is named after the Yuma Indians, who lived in the area until the late 19th century. Yuma County covers an area of 1,845 square miles, and has a population of 10,043 as of the 2020 census.
Geography
Yuma County is located in the High Plains region of Colorado, and is characterized by flat to rolling terrain. The county is drained by the Republican River, which flows through the county from north to south. The county is also home to several small lakes, including Lake Yuma, which is located in the northern part of the county. The county is also home to several small streams, including the Big Sandy Creek, which flows through the county from east to west.
The county is mostly agricultural, with the majority of the land being used for farming and ranching. The county is also home to several small towns, including Wray, Idalia, Eckley, and Yuma.
Climate
Yuma County has a semi-arid climate, with hot summers and cold winters. The average annual temperature is around 54 degrees Fahrenheit, with the average high temperature in the summer months reaching around 90 degrees Fahrenheit. The average low temperature in the winter months is around 20 degrees Fahrenheit. The county receives an average of 16 inches of precipitation per year, with most of the precipitation falling in the spring and summer months.
Demographics
As of the 2020 census, Yuma County had a population of 10,043. The racial makeup of the county was 94.3% White, 0.3% African American, 0.7% Native American, 0.2% Asian, 0.1% Pacific Islander, 2.7% from other races, and 1.9% from two or more races. Hispanic or Latino of any race were 8.2% of the population.
The median income for a household in the county was $41,945, and the median income for a family was $48,945. The per capita income for the county was $19,945. About 11.2% of families and 14.2% of the population were below the poverty line, including 18.2% of those under age 18 and 8.2% of those age 65 or over.
Economy
Yuma County's economy is largely based on agriculture, with the majority of the land being used for farming and ranching. The county is also home to several small businesses, including a few restaurants, convenience stores, and gas stations. The county is also home to several small manufacturing companies, including a few food processing plants.
The county is also home to several energy companies, including a few wind farms and a solar farm. The county is also home to several oil and gas wells, and is a major producer of oil and gas in the state.
Conclusion
Yuma County is a rural county located in the northeast corner of Colorado. The county is characterized by flat to rolling terrain, and is mostly agricultural, with the majority of the land being used for farming and ranching. The county has a population of 10,043, and the economy is largely based on agriculture, with several small businesses and energy companies also operating in the county.
Common Questions
What is Per Capita Income in Yuma County?
Per Capita income in Yuma County is $32,575.
What is the Median Family Income in Yuma County?
Median Family Income in Yuma County is $71,279.
What is the Median Household income in Yuma County?
Median Household Income in Yuma County is $60,118.
What is Income or Wage Gap in Yuma County?
Income or Wage Gap in Yuma County is 28.0%.
Women in Yuma County earn 72.0 cents for every dollar earned by a man.
What is Inequality or Gini Index in Yuma County?
Inequality or Gini Index in Yuma County is 0.42.
What is the Total Population of Yuma County?
Total Population of Yuma County is 9,938.
What is the Total Male Population of Yuma County?
Total Male Population of Yuma County is 5,049.
What is the Total Female Population of Yuma County?
Total Female Population of Yuma County is 4,889.
What is the Ratio of Males per 100 Females in Yuma County?
There are 103.27 Males per 100 Females in Yuma County.
What is the Ratio of Females per 100 Males in Yuma County?
There are 96.83 Females per 100 Males in Yuma County.
What is the Median Population Age in Yuma County?
Median Population Age in Yuma County is 39.6 Years.
What is the Average Family Size in Yuma County
Average Family Size in Yuma County is 2.9 People.
What is the Average Household Size in Yuma County
Average Household Size in Yuma County is 2.5 People.
How Large is the Labor Force in Yuma County?
There are 5,146 People in the Labor Forcein in Yuma County.
What is the Percentage of People in the Labor Force in Yuma County?
68.9% of People are in the Labor Force in Yuma County.
What is the Unemployment Rate in Yuma County?
Unemployment Rate in Yuma County is 5.7%.