Washington County, CO Map & Demographics
Washington County Map
Washington County Overview
$33,374
PER CAPITA INCOME
$69,648
AVG FAMILY INCOME
$59,087
AVG HOUSEHOLD INCOME
33.1%
WAGE / INCOME GAP [ % ]
66.9¢/ $1
WAGE / INCOME GAP [ $ ]
0.43
INEQUALITY / GINI INDEX
4,817
TOTAL POPULATION
2,547
MALE POPULATION
2,270
FEMALE POPULATION
112.20
MALES / 100 FEMALES
89.12
FEMALES / 100 MALES
40.2
MEDIAN AGE
2.8
AVG FAMILY SIZE
2.3
AVG HOUSEHOLD SIZE
2,367
LABOR FORCE [ PEOPLE ]
60.9%
PERCENT IN LABOR FORCE
3.5%
UNEMPLOYMENT RATE
Washington County Area Codes
Income in Washington County
Income Overview in Washington County
Per Capita Income in Washington County is $33,374, while median incomes of families and households are $69,648 and $59,087 respectively.
| Characteristic | Number | Measure |
| Per Capita Income | 4,817 | $33,374 |
| Median Family Income | 1,341 | $69,648 |
| Mean Family Income | 1,341 | $90,495 |
| Median Household Income | 2,030 | $59,087 |
| Mean Household Income | 2,030 | $76,776 |
| Income Deficit | 1,341 | $0 |
| Wage / Income Gap (%) | 4,817 | 33.07% |
| Wage / Income Gap ($) | 4,817 | 66.93¢ per $1 |
| Gini / Inequality Index | 4,817 | 0.43 |
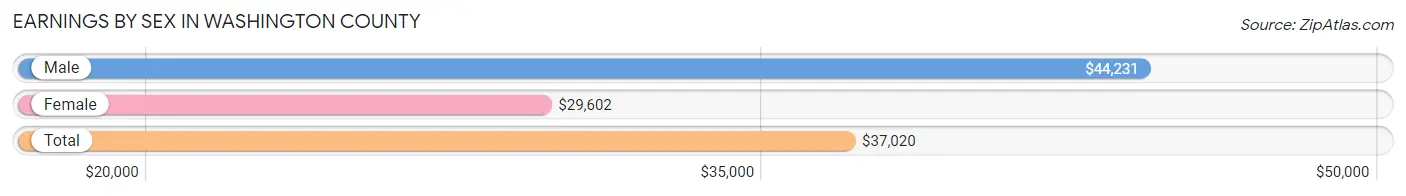
Earnings by Sex in Washington County
Average Earnings in Washington County are $37,020, $44,231 for men and $29,602 for women, a difference of 33.1%.
| Sex | Number | Average Earnings |
| Male | 1,468 (56.5%) | $44,231 |
| Female | 1,129 (43.5%) | $29,602 |
| Total | 2,597 (100.0%) | $37,020 |
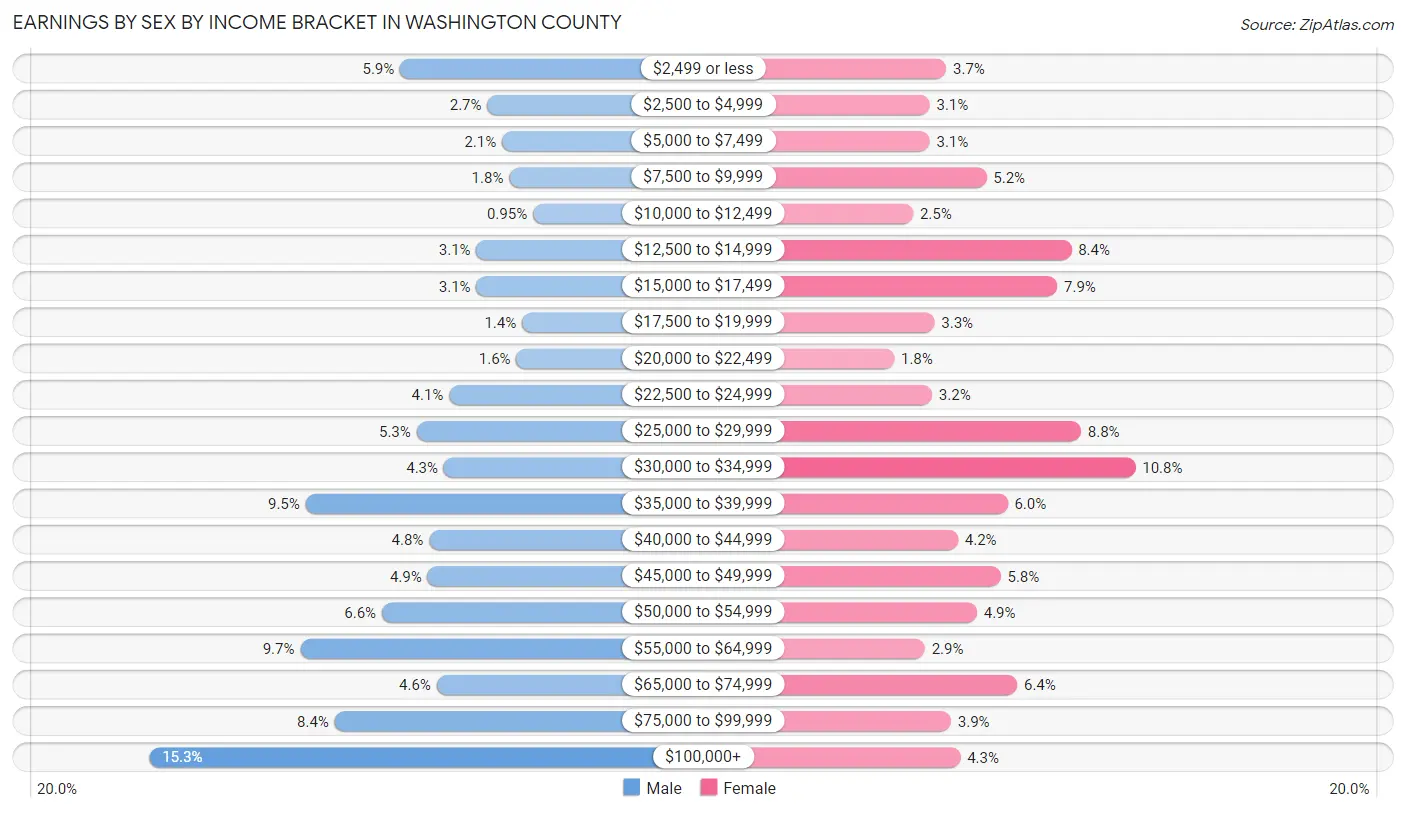
Earnings by Sex by Income Bracket in Washington County
The most common earnings brackets in Washington County are $100,000+ for men (225 | 15.3%) and $30,000 to $34,999 for women (122 | 10.8%).
| Income | Male | Female |
| $2,499 or less | 87 (5.9%) | 42 (3.7%) |
| $2,500 to $4,999 | 39 (2.7%) | 35 (3.1%) |
| $5,000 to $7,499 | 31 (2.1%) | 35 (3.1%) |
| $7,500 to $9,999 | 27 (1.8%) | 59 (5.2%) |
| $10,000 to $12,499 | 14 (0.9%) | 28 (2.5%) |
| $12,500 to $14,999 | 45 (3.1%) | 95 (8.4%) |
| $15,000 to $17,499 | 45 (3.1%) | 89 (7.9%) |
| $17,500 to $19,999 | 20 (1.4%) | 37 (3.3%) |
| $20,000 to $22,499 | 23 (1.6%) | 20 (1.8%) |
| $22,500 to $24,999 | 60 (4.1%) | 36 (3.2%) |
| $25,000 to $29,999 | 78 (5.3%) | 99 (8.8%) |
| $30,000 to $34,999 | 63 (4.3%) | 122 (10.8%) |
| $35,000 to $39,999 | 139 (9.5%) | 68 (6.0%) |
| $40,000 to $44,999 | 71 (4.8%) | 47 (4.2%) |
| $45,000 to $49,999 | 72 (4.9%) | 65 (5.8%) |
| $50,000 to $54,999 | 97 (6.6%) | 55 (4.9%) |
| $55,000 to $64,999 | 142 (9.7%) | 33 (2.9%) |
| $65,000 to $74,999 | 67 (4.6%) | 72 (6.4%) |
| $75,000 to $99,999 | 123 (8.4%) | 44 (3.9%) |
| $100,000+ | 225 (15.3%) | 48 (4.3%) |
| Total | 1,468 (100.0%) | 1,129 (100.0%) |
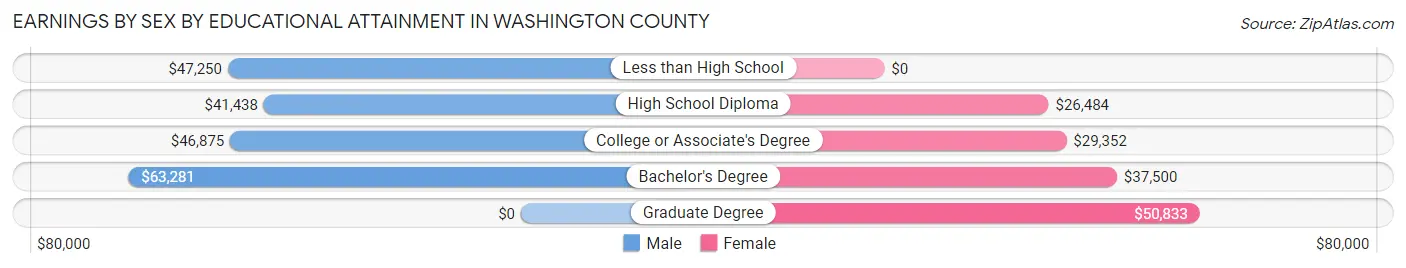
Earnings by Sex by Educational Attainment in Washington County
Average earnings in Washington County are $50,313 for men and $32,944 for women, a difference of 34.5%. Men with an educational attainment of bachelor's degree enjoy the highest average annual earnings of $63,281, while those with high school diploma education earn the least with $41,438. Women with an educational attainment of graduate degree earn the most with the average annual earnings of $50,833, while those with high school diploma education have the smallest earnings of $26,484.
| Educational Attainment | Male Income | Female Income |
| Less than High School | $47,250 | $0 |
| High School Diploma | $41,438 | $26,484 |
| College or Associate's Degree | $46,875 | $29,352 |
| Bachelor's Degree | $63,281 | $37,500 |
| Graduate Degree | - | - |
| Total | $50,313 | $32,944 |
Family Income in Washington County
Family Income Brackets in Washington County
According to the Washington County family income data, there are 319 families falling into the $50,000 to $74,999 income range, which is the most common income bracket and makes up 23.8% of all families. Conversely, the $10,000 to $14,999 income bracket is the least frequent group with only 12 families (0.9%) belonging to this category.
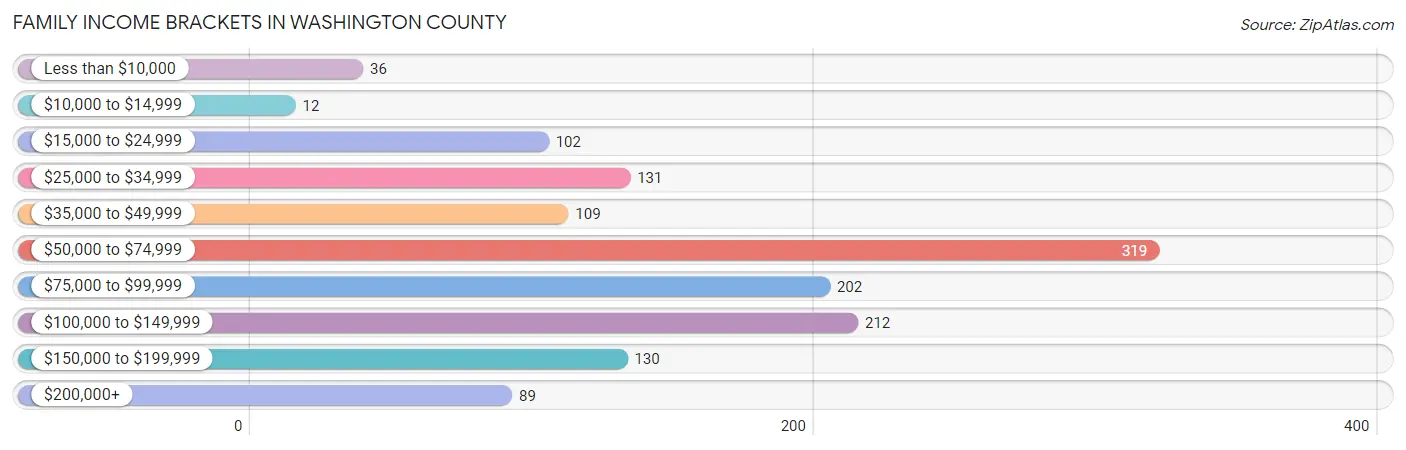
| Income Bracket | # Families | % Families |
| Less than $10,000 | 36 | 2.7% |
| $10,000 to $14,999 | 12 | 0.9% |
| $15,000 to $24,999 | 102 | 7.6% |
| $25,000 to $34,999 | 131 | 9.8% |
| $35,000 to $49,999 | 109 | 8.1% |
| $50,000 to $74,999 | 319 | 23.8% |
| $75,000 to $99,999 | 202 | 15.1% |
| $100,000 to $149,999 | 212 | 15.8% |
| $150,000 to $199,999 | 130 | 9.7% |
| $200,000+ | 89 | 6.6% |
Family Income by Famaliy Size in Washington County
6-person families (27 | 2.0%) account for the highest median family income in Washington County with $152,625 per family, while 3-person families (194 | 14.5%) have the highest median income of $38,750 per family member.
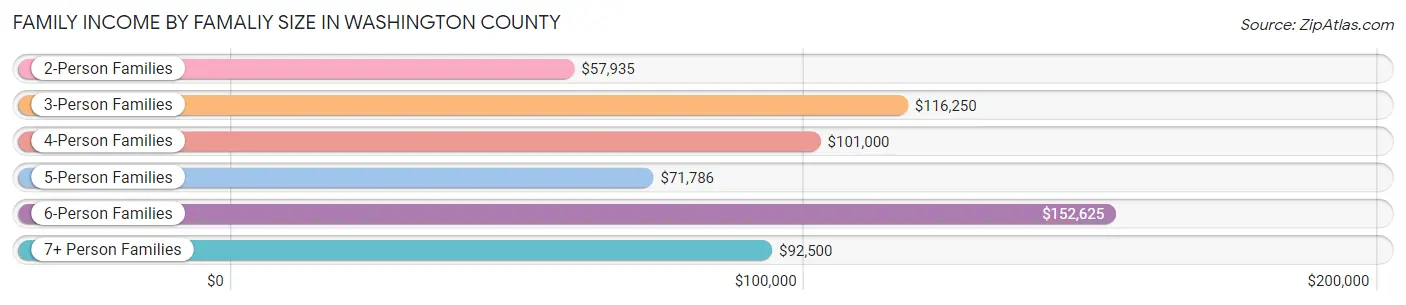
| Income Bracket | # Families | Median Income |
| 2-Person Families | 796 (59.4%) | $57,935 |
| 3-Person Families | 194 (14.5%) | $116,250 |
| 4-Person Families | 188 (14.0%) | $101,000 |
| 5-Person Families | 96 (7.2%) | $71,786 |
| 6-Person Families | 27 (2.0%) | $152,625 |
| 7+ Person Families | 40 (3.0%) | $92,500 |
| Total | 1,341 (100.0%) | $69,648 |
Family Income by Number of Earners in Washington County
The median family income in Washington County is $69,648, with families comprising 3+ earners (123) having the highest median family income of $147,188, while families with no earners (189) have the lowest median family income of $39,063, accounting for 9.2% and 14.1% of families, respectively.

| Number of Earners | # Families | Median Income |
| No Earners | 189 (14.1%) | $39,063 |
| 1 Earner | 410 (30.6%) | $58,362 |
| 2 Earners | 619 (46.2%) | $88,393 |
| 3+ Earners | 123 (9.2%) | $147,188 |
| Total | 1,341 (100.0%) | $69,648 |
Household Income in Washington County
Household Income Brackets in Washington County
With 457 households falling in the category, the $50,000 to $74,999 income range is the most frequent in Washington County, accounting for 22.5% of all households. In contrast, only 63 households (3.1%) fall into the $10,000 to $14,999 income bracket, making it the least populous group.
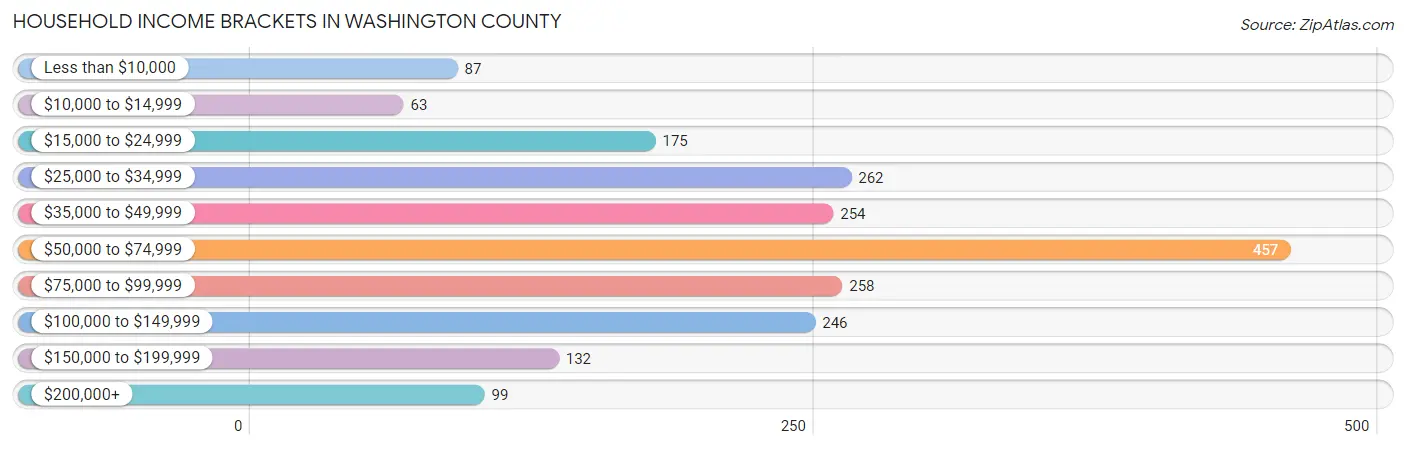
| Income Bracket | # Households | % Households |
| Less than $10,000 | 87 | 4.3% |
| $10,000 to $14,999 | 63 | 3.1% |
| $15,000 to $24,999 | 175 | 8.6% |
| $25,000 to $34,999 | 262 | 12.9% |
| $35,000 to $49,999 | 254 | 12.5% |
| $50,000 to $74,999 | 457 | 22.5% |
| $75,000 to $99,999 | 258 | 12.7% |
| $100,000 to $149,999 | 246 | 12.1% |
| $150,000 to $199,999 | 132 | 6.5% |
| $200,000+ | 99 | 4.9% |
Household Income by Householder Age in Washington County
The median household income in Washington County is $59,087, with the highest median household income of $71,094 found in the 45 to 64 years age bracket for the primary householder. A total of 675 households (33.3%) fall into this category. Meanwhile, the 15 to 24 years age bracket for the primary householder has the lowest median household income of $29,714, with 157 households (7.7%) in this group.
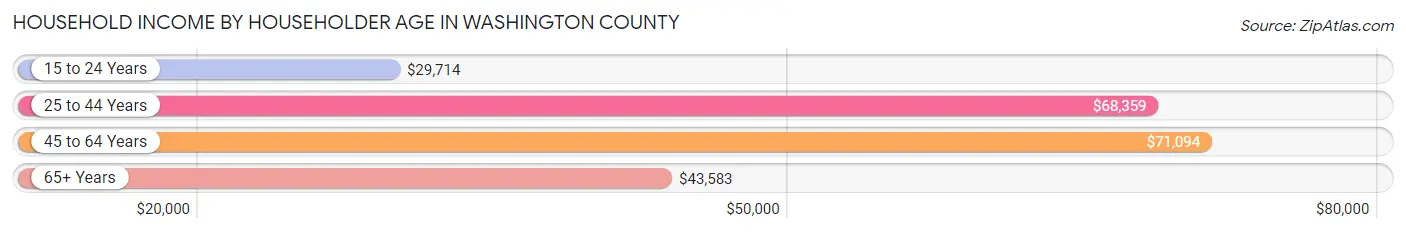
| Income Bracket | # Households | Median Income |
| 15 to 24 Years | 157 (7.7%) | $29,714 |
| 25 to 44 Years | 551 (27.1%) | $68,359 |
| 45 to 64 Years | 675 (33.3%) | $71,094 |
| 65+ Years | 647 (31.9%) | $43,583 |
| Total | 2,030 (100.0%) | $59,087 |
Poverty in Washington County
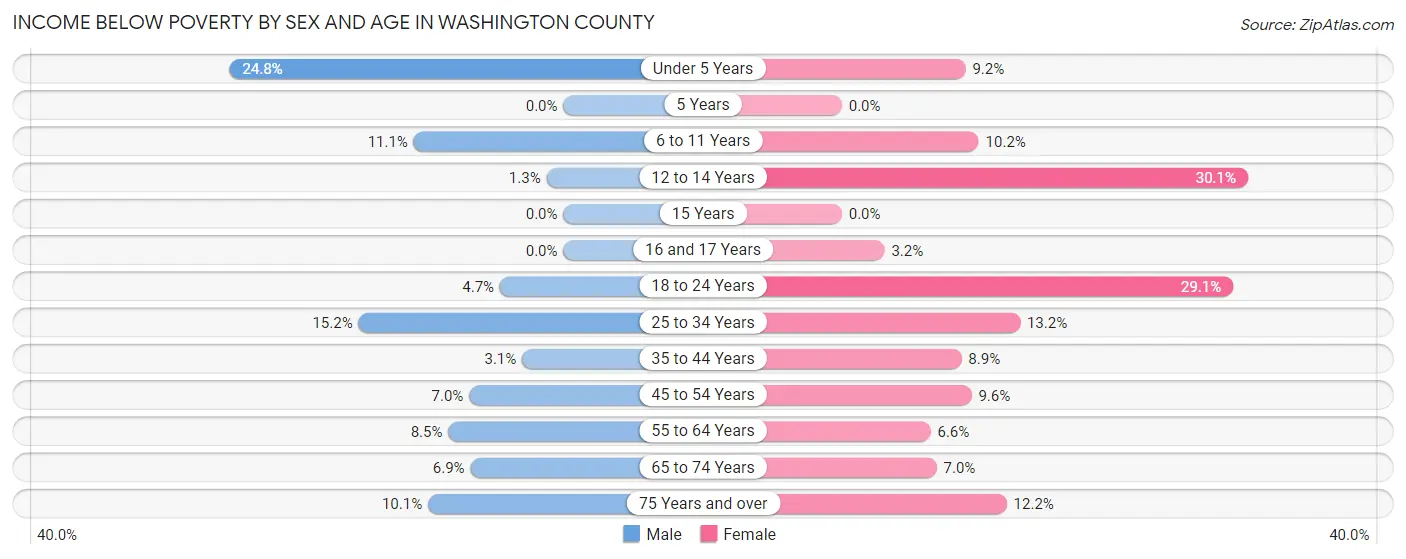
Income Below Poverty by Sex and Age in Washington County
With 8.3% poverty level for males and 11.3% for females among the residents of Washington County, under 5 year old males and 12 to 14 year old females are the most vulnerable to poverty, with 29 males (24.8%) and 22 females (30.1%) in their respective age groups living below the poverty level.
| Age Bracket | Male | Female |
| Under 5 Years | 29 (24.8%) | 9 (9.2%) |
| 5 Years | 0 (0.0%) | 0 (0.0%) |
| 6 to 11 Years | 30 (11.1%) | 19 (10.2%) |
| 12 to 14 Years | 1 (1.3%) | 22 (30.1%) |
| 15 Years | 0 (0.0%) | 0 (0.0%) |
| 16 and 17 Years | 0 (0.0%) | 2 (3.2%) |
| 18 to 24 Years | 8 (4.7%) | 52 (29.0%) |
| 25 to 34 Years | 33 (15.2%) | 34 (13.2%) |
| 35 to 44 Years | 10 (3.1%) | 23 (8.9%) |
| 45 to 54 Years | 19 (7.0%) | 21 (9.6%) |
| 55 to 64 Years | 27 (8.5%) | 23 (6.6%) |
| 65 to 74 Years | 22 (6.9%) | 19 (7.0%) |
| 75 Years and over | 19 (10.1%) | 24 (12.2%) |
| Total | 198 (8.3%) | 248 (11.3%) |
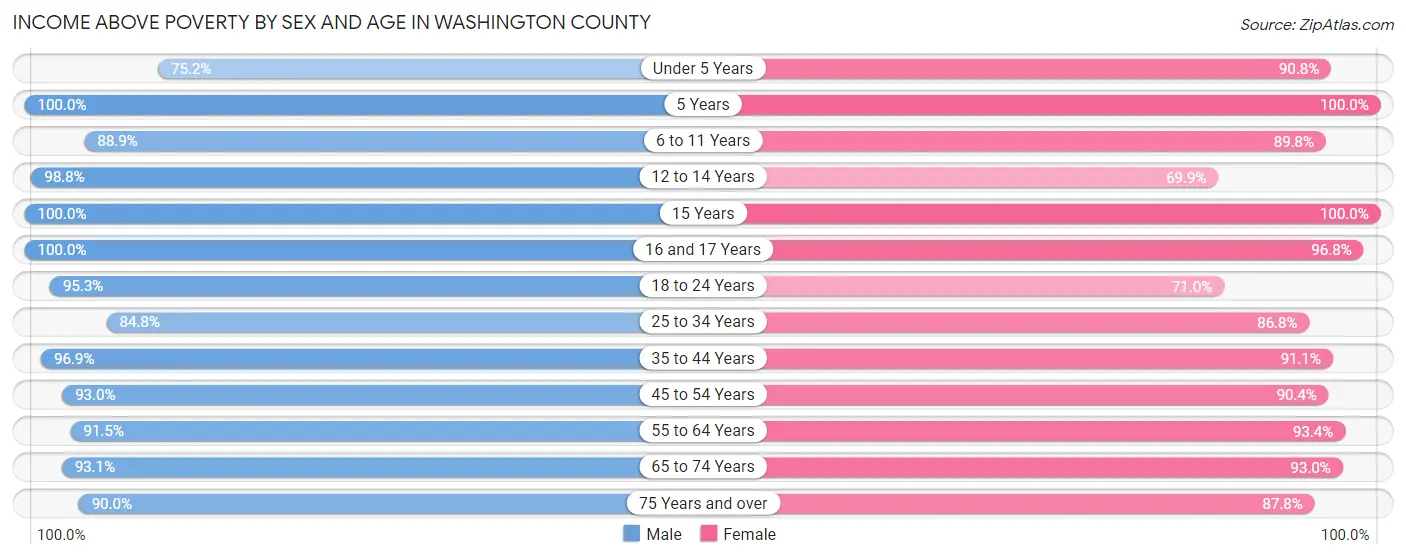
Income Above Poverty by Sex and Age in Washington County
According to the poverty statistics in Washington County, males aged 5 years and females aged 5 years are the age groups that are most secure financially, with 100.0% of males and 100.0% of females in these age groups living above the poverty line.
| Age Bracket | Male | Female |
| Under 5 Years | 88 (75.2%) | 89 (90.8%) |
| 5 Years | 17 (100.0%) | 26 (100.0%) |
| 6 to 11 Years | 240 (88.9%) | 168 (89.8%) |
| 12 to 14 Years | 79 (98.8%) | 51 (69.9%) |
| 15 Years | 30 (100.0%) | 29 (100.0%) |
| 16 and 17 Years | 72 (100.0%) | 61 (96.8%) |
| 18 to 24 Years | 162 (95.3%) | 127 (71.0%) |
| 25 to 34 Years | 184 (84.8%) | 223 (86.8%) |
| 35 to 44 Years | 317 (96.9%) | 236 (91.1%) |
| 45 to 54 Years | 253 (93.0%) | 197 (90.4%) |
| 55 to 64 Years | 289 (91.5%) | 326 (93.4%) |
| 65 to 74 Years | 297 (93.1%) | 251 (93.0%) |
| 75 Years and over | 170 (89.9%) | 172 (87.8%) |
| Total | 2,198 (91.7%) | 1,956 (88.7%) |
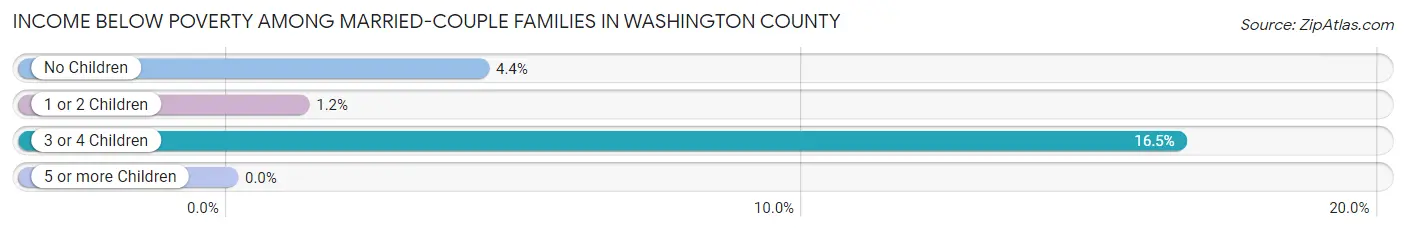
Income Below Poverty Among Married-Couple Families in Washington County
The poverty statistics for married-couple families in Washington County show that 4.8% or 52 of the total 1,080 families live below the poverty line. Families with 3 or 4 children have the highest poverty rate of 16.5%, comprising of 18 families. On the other hand, families with 5 or more children have the lowest poverty rate of 0.0%, which includes 0 families.
| Children | Above Poverty | Below Poverty |
| No Children | 678 (95.6%) | 31 (4.4%) |
| 1 or 2 Children | 238 (98.8%) | 3 (1.2%) |
| 3 or 4 Children | 91 (83.5%) | 18 (16.5%) |
| 5 or more Children | 21 (100.0%) | 0 (0.0%) |
| Total | 1,028 (95.2%) | 52 (4.8%) |
Income Below Poverty Among Single-Parent Households in Washington County
According to the poverty data in Washington County, 11.8% or 15 single-father households and 35.8% or 48 single-mother households are living below the poverty line. Among single-father households, those with 1 or 2 children have the highest poverty rate, with 13 households (21.0%) experiencing poverty. Likewise, among single-mother households, those with 3 or 4 children have the highest poverty rate, with 3 households (100.0%) falling below the poverty line.

| Children | Single Father | Single Mother |
| No Children | 2 (3.8%) | 0 (0.0%) |
| 1 or 2 Children | 13 (21.0%) | 45 (51.7%) |
| 3 or 4 Children | 0 (0.0%) | 3 (100.0%) |
| 5 or more Children | 0 (0.0%) | 0 (0.0%) |
| Total | 15 (11.8%) | 48 (35.8%) |
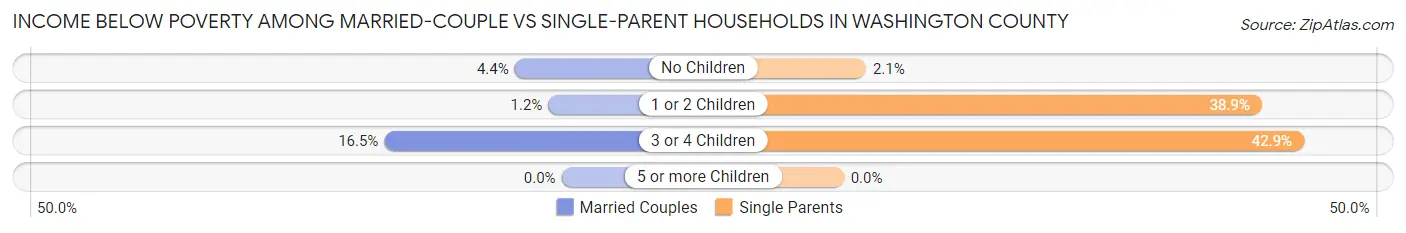
Income Below Poverty Among Married-Couple vs Single-Parent Households in Washington County
The poverty data for Washington County shows that 52 of the married-couple family households (4.8%) and 63 of the single-parent households (24.1%) are living below the poverty level. Within the married-couple family households, those with 3 or 4 children have the highest poverty rate, with 18 households (16.5%) falling below the poverty line. Among the single-parent households, those with 3 or 4 children have the highest poverty rate, with 3 household (42.9%) living below poverty.
| Children | Married-Couple Families | Single-Parent Households |
| No Children | 31 (4.4%) | 2 (2.1%) |
| 1 or 2 Children | 3 (1.2%) | 58 (38.9%) |
| 3 or 4 Children | 18 (16.5%) | 3 (42.9%) |
| 5 or more Children | 0 (0.0%) | 0 (0.0%) |
| Total | 52 (4.8%) | 63 (24.1%) |
Race in Washington County
The most populous races in Washington County are White / Caucasian (4,426 | 91.9%), Hispanic or Latino (523 | 10.9%), and Two or more Races (223 | 4.6%).

| Race | # Population | % Population |
| Asian | 18 | 0.4% |
| Black / African American | 74 | 1.5% |
| Hawaiian / Pacific | 2 | 0.0% |
| Hispanic or Latino | 523 | 10.9% |
| Native / Alaskan | 0 | 0.0% |
| White / Caucasian | 4,426 | 91.9% |
| Two or more Races | 223 | 4.6% |
| Some other Race | 74 | 1.5% |
| Total | 4,817 | 100.0% |
Ancestry in Washington County
The most populous ancestries reported in Washington County are German (1,578 | 32.8%), English (504 | 10.5%), Irish (504 | 10.5%), Mexican (481 | 10.0%), and American (203 | 4.2%), together accounting for 67.9% of all Washington County residents.

| Ancestry | # Population | % Population |
| African | 13 | 0.3% |
| American | 203 | 4.2% |
| Arab | 4 | 0.1% |
| Austrian | 2 | 0.0% |
| Basque | 28 | 0.6% |
| Belgian | 9 | 0.2% |
| Bhutanese | 8 | 0.2% |
| British | 42 | 0.9% |
| Burmese | 10 | 0.2% |
| Central American | 3 | 0.1% |
| Cherokee | 31 | 0.6% |
| Choctaw | 5 | 0.1% |
| Creek | 4 | 0.1% |
| Croatian | 7 | 0.2% |
| Cuban | 6 | 0.1% |
| Czech | 22 | 0.5% |
| Czechoslovakian | 3 | 0.1% |
| Danish | 33 | 0.7% |
| Dominican | 5 | 0.1% |
| Dutch | 105 | 2.2% |
| Eastern European | 23 | 0.5% |
| English | 504 | 10.5% |
| European | 67 | 1.4% |
| French | 85 | 1.8% |
| French Canadian | 3 | 0.1% |
| German | 1,578 | 32.8% |
| Greek | 4 | 0.1% |
| Hungarian | 11 | 0.2% |
| Irish | 504 | 10.5% |
| Italian | 114 | 2.4% |
| Korean | 9 | 0.2% |
| Maltese | 1 | 0.0% |
| Mexican | 481 | 10.0% |
| Moroccan | 4 | 0.1% |
| Native Hawaiian | 2 | 0.0% |
| Northern European | 8 | 0.2% |
| Norwegian | 91 | 1.9% |
| Panamanian | 3 | 0.1% |
| Polish | 64 | 1.3% |
| Portuguese | 9 | 0.2% |
| Russian | 88 | 1.8% |
| Scandinavian | 15 | 0.3% |
| Scotch-Irish | 90 | 1.9% |
| Scottish | 129 | 2.7% |
| Sioux | 5 | 0.1% |
| Slovak | 4 | 0.1% |
| Spaniard | 3 | 0.1% |
| Spanish | 3 | 0.1% |
| Spanish American | 10 | 0.2% |
| Sri Lankan | 1 | 0.0% |
| Subsaharan African | 13 | 0.3% |
| Swedish | 102 | 2.1% |
| Swiss | 2 | 0.0% |
| Thai | 12 | 0.3% |
| Welsh | 17 | 0.4% |
| West Indian | 4 | 0.1% | View All 56 Rows |
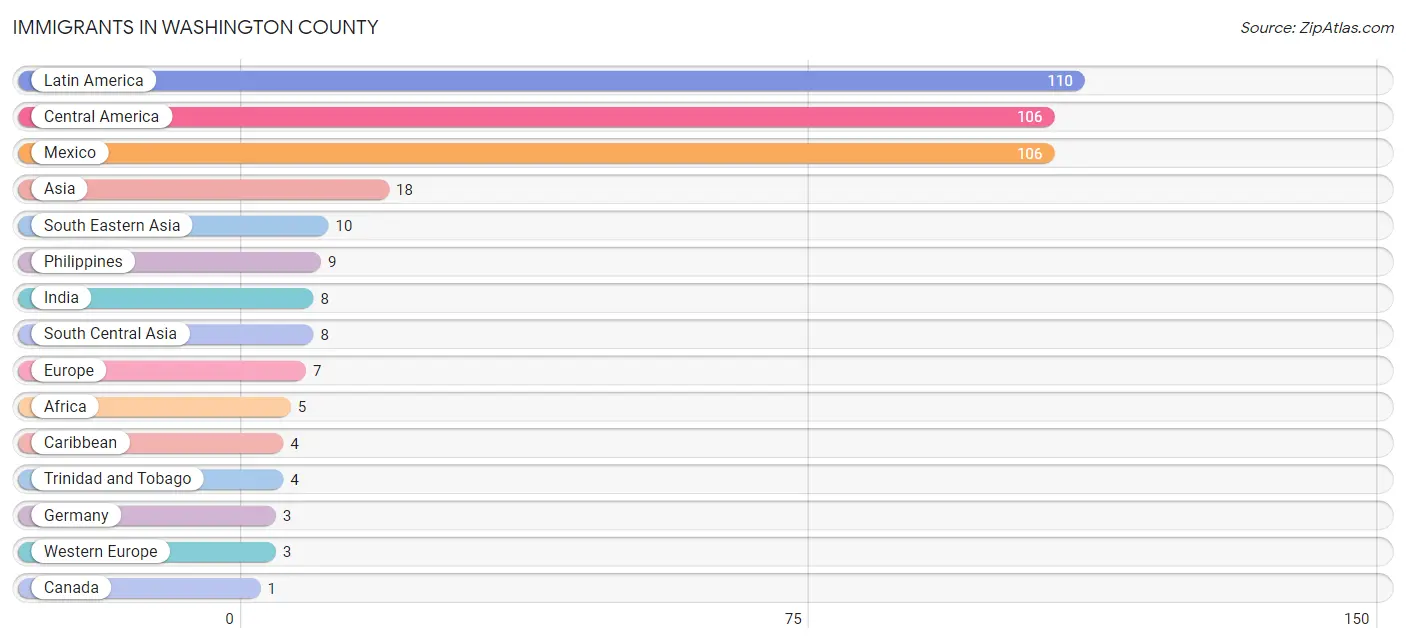
Immigrants in Washington County
The most numerous immigrant groups reported in Washington County came from Latin America (110 | 2.3%), Central America (106 | 2.2%), Mexico (106 | 2.2%), Asia (18 | 0.4%), and South Eastern Asia (10 | 0.2%), together accounting for 7.3% of all Washington County residents.
| Immigration Origin | # Population | % Population |
| Africa | 5 | 0.1% |
| Asia | 18 | 0.4% |
| Canada | 1 | 0.0% |
| Caribbean | 4 | 0.1% |
| Central America | 106 | 2.2% |
| England | 1 | 0.0% |
| Europe | 7 | 0.2% |
| Germany | 3 | 0.1% |
| India | 8 | 0.2% |
| Latin America | 110 | 2.3% |
| Mexico | 106 | 2.2% |
| Northern Europe | 1 | 0.0% |
| Philippines | 9 | 0.2% |
| South Central Asia | 8 | 0.2% |
| South Eastern Asia | 10 | 0.2% |
| Trinidad and Tobago | 4 | 0.1% |
| Vietnam | 1 | 0.0% |
| Western Europe | 3 | 0.1% | View All 18 Rows |
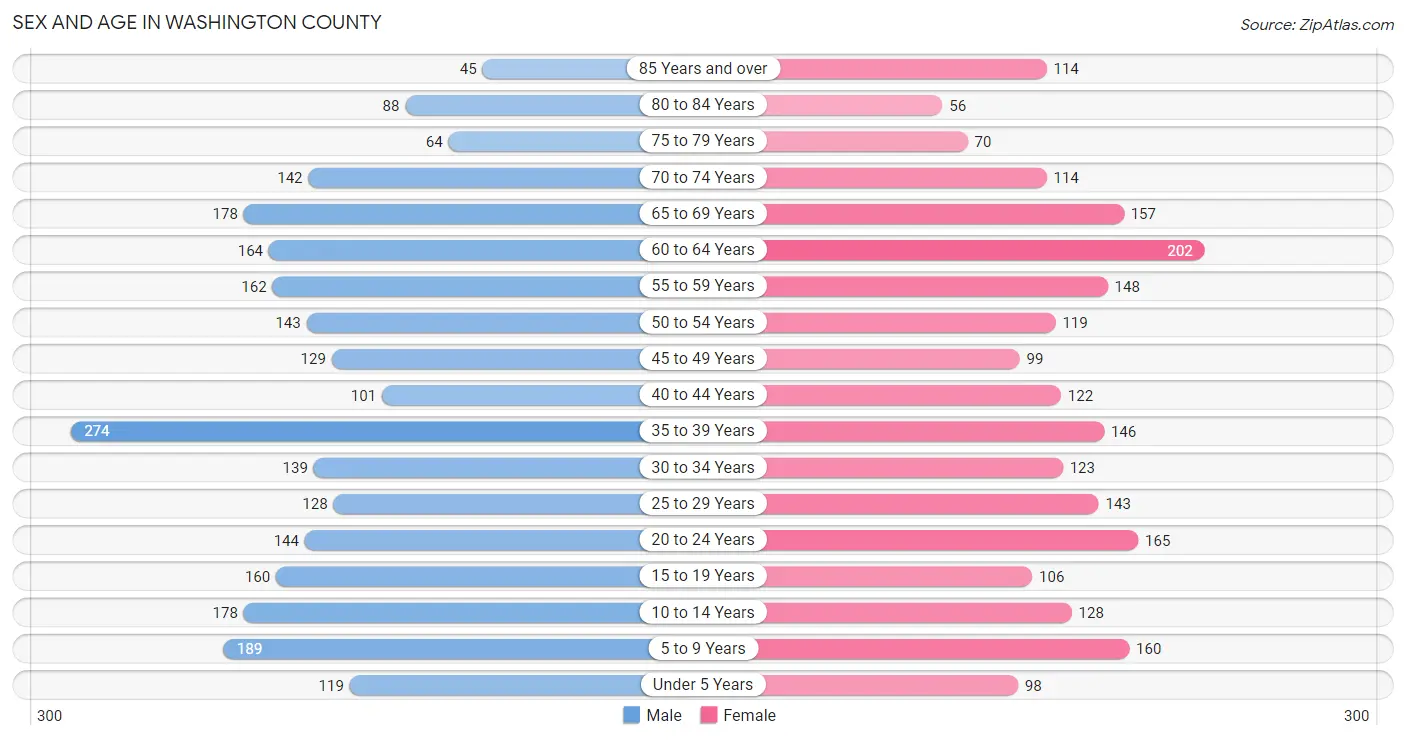
Sex and Age in Washington County
Sex and Age in Washington County
The most populous age groups in Washington County are 35 to 39 Years (274 | 10.8%) for men and 60 to 64 Years (202 | 8.9%) for women.
| Age Bracket | Male | Female |
| Under 5 Years | 119 (4.7%) | 98 (4.3%) |
| 5 to 9 Years | 189 (7.4%) | 160 (7.0%) |
| 10 to 14 Years | 178 (7.0%) | 128 (5.6%) |
| 15 to 19 Years | 160 (6.3%) | 106 (4.7%) |
| 20 to 24 Years | 144 (5.7%) | 165 (7.3%) |
| 25 to 29 Years | 128 (5.0%) | 143 (6.3%) |
| 30 to 34 Years | 139 (5.5%) | 123 (5.4%) |
| 35 to 39 Years | 274 (10.8%) | 146 (6.4%) |
| 40 to 44 Years | 101 (4.0%) | 122 (5.4%) |
| 45 to 49 Years | 129 (5.1%) | 99 (4.4%) |
| 50 to 54 Years | 143 (5.6%) | 119 (5.2%) |
| 55 to 59 Years | 162 (6.4%) | 148 (6.5%) |
| 60 to 64 Years | 164 (6.4%) | 202 (8.9%) |
| 65 to 69 Years | 178 (7.0%) | 157 (6.9%) |
| 70 to 74 Years | 142 (5.6%) | 114 (5.0%) |
| 75 to 79 Years | 64 (2.5%) | 70 (3.1%) |
| 80 to 84 Years | 88 (3.5%) | 56 (2.5%) |
| 85 Years and over | 45 (1.8%) | 114 (5.0%) |
| Total | 2,547 (100.0%) | 2,270 (100.0%) |
Families and Households in Washington County
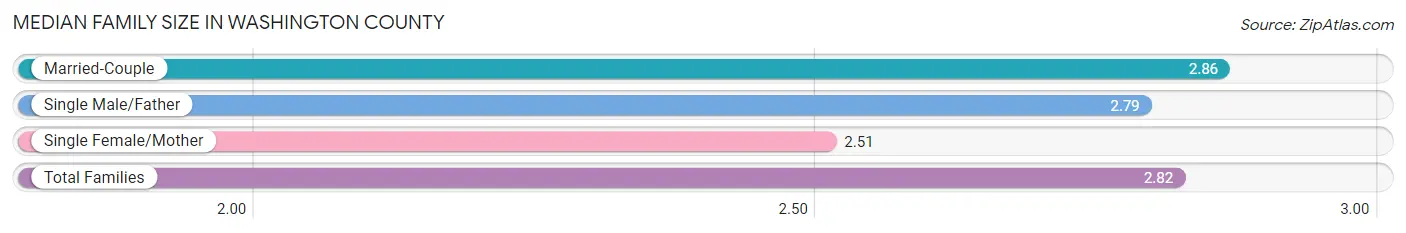
Median Family Size in Washington County
The median family size in Washington County is 2.82 persons per family, with married-couple families (1,080 | 80.5%) accounting for the largest median family size of 2.86 persons per family. On the other hand, single female/mother families (134 | 10.0%) represent the smallest median family size with 2.51 persons per family.
| Family Type | # Families | Family Size |
| Married-Couple | 1,080 (80.5%) | 2.86 |
| Single Male/Father | 127 (9.5%) | 2.79 |
| Single Female/Mother | 134 (10.0%) | 2.51 |
| Total Families | 1,341 (100.0%) | 2.82 |
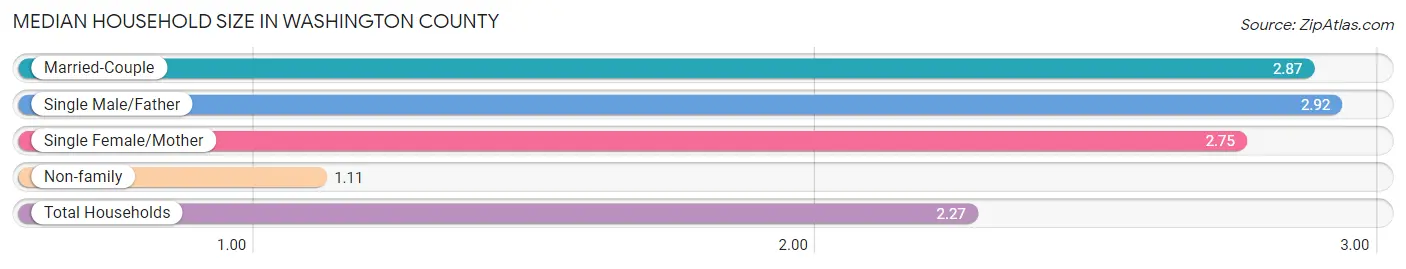
Median Household Size in Washington County
The median household size in Washington County is 2.27 persons per household, with single male/father households (127 | 6.3%) accounting for the largest median household size of 2.92 persons per household. non-family households (689 | 33.9%) represent the smallest median household size with 1.11 persons per household.
| Household Type | # Households | Household Size |
| Married-Couple | 1,080 (53.2%) | 2.87 |
| Single Male/Father | 127 (6.3%) | 2.92 |
| Single Female/Mother | 134 (6.6%) | 2.75 |
| Non-family | 689 (33.9%) | 1.11 |
| Total Households | 2,030 (100.0%) | 2.27 |
Household Size by Marriage Status in Washington County
Out of a total of 2,030 households in Washington County, 1,341 (66.1%) are family households, while 689 (33.9%) are nonfamily households. The most numerous type of family households are 2-person households, comprising 761, and the most common type of nonfamily households are 1-person households, comprising 606.

| Household Size | Family Households | Nonfamily Households |
| 1-Person Households | - | 606 (29.8%) |
| 2-Person Households | 761 (37.5%) | 78 (3.8%) |
| 3-Person Households | 203 (10.0%) | 2 (0.1%) |
| 4-Person Households | 211 (10.4%) | 3 (0.2%) |
| 5-Person Households | 97 (4.8%) | 0 (0.0%) |
| 6-Person Households | 29 (1.4%) | 0 (0.0%) |
| 7+ Person Households | 40 (2.0%) | 0 (0.0%) |
| Total | 1,341 (66.1%) | 689 (33.9%) |
Female Fertility in Washington County
Fertility by Age in Washington County
Average fertility rate in Washington County is 85.0 births per 1,000 women. Women in the age bracket of 20 to 34 years have the highest fertility rate with 181.0 births per 1,000 women. Women in the age bracket of 20 to 34 years acount for 97.5% of all women with births.
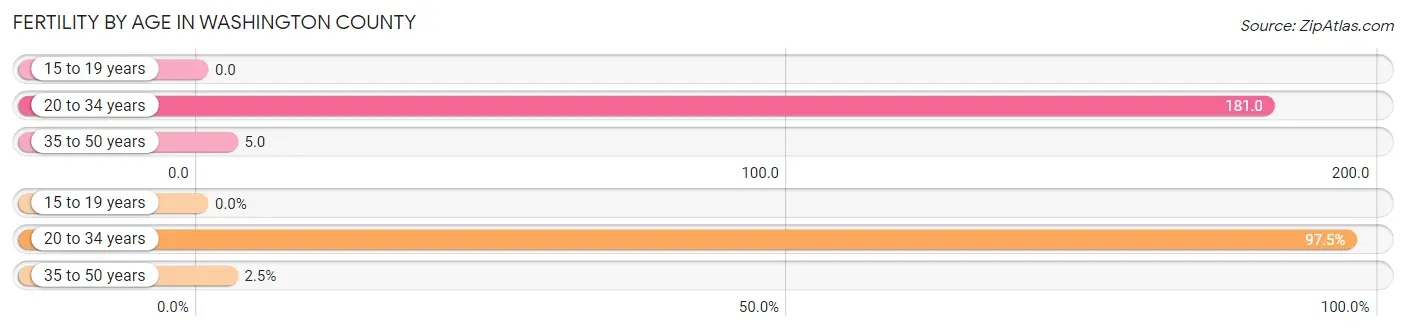
| Age Bracket | Women with Births | Births / 1,000 Women |
| 15 to 19 years | 0 (0.0%) | 0.0 |
| 20 to 34 years | 78 (97.5%) | 181.0 |
| 35 to 50 years | 2 (2.5%) | 5.0 |
| Total | 80 (100.0%) | 85.0 |
Fertility by Age by Marriage Status in Washington County
88.7% of women with births (80) in Washington County are married. The highest percentage of unmarried women with births falls into 20 to 34 years age bracket with 11.5% of them unmarried at the time of birth, while the lowest percentage of unmarried women with births belong to 35 to 50 years age bracket with 0.0% of them unmarried.
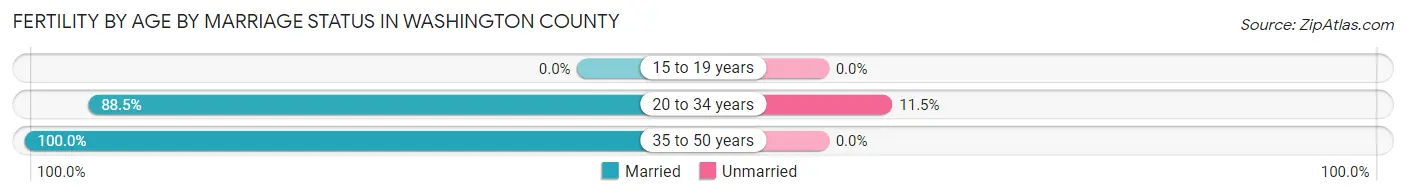
| Age Bracket | Married | Unmarried |
| 15 to 19 years | 0 (0.0%) | 0 (0.0%) |
| 20 to 34 years | 69 (88.5%) | 9 (11.5%) |
| 35 to 50 years | 2 (100.0%) | 0 (0.0%) |
| Total | 71 (88.7%) | 9 (11.3%) |
Fertility by Education in Washington County
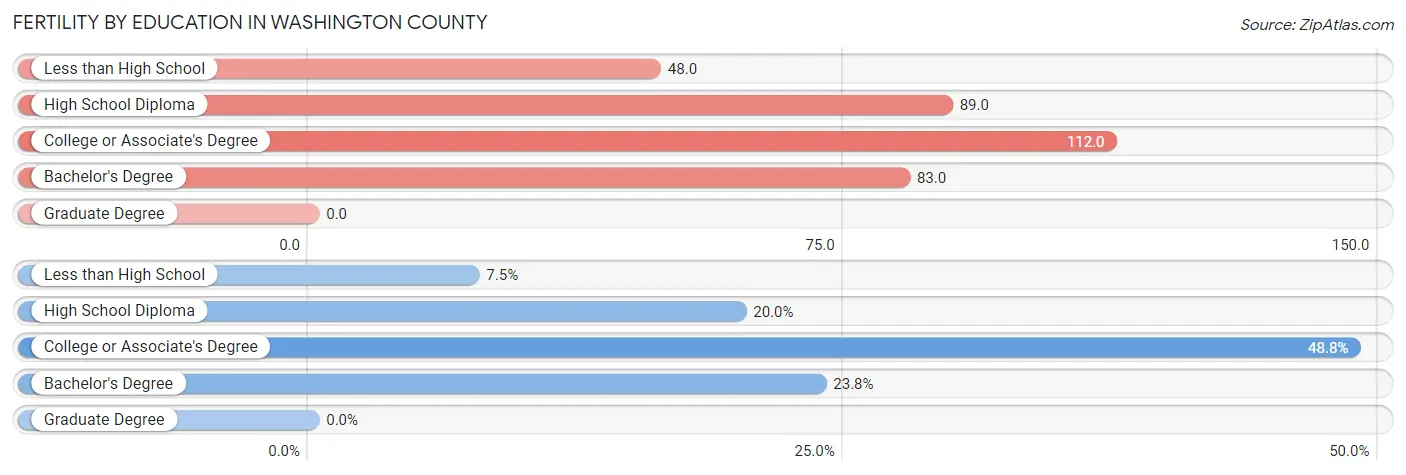
| Educational Attainment | Women with Births | Births / 1,000 Women |
| Less than High School | 6 (7.5%) | 48.0 |
| High School Diploma | 16 (20.0%) | 89.0 |
| College or Associate's Degree | 39 (48.7%) | 112.0 |
| Bachelor's Degree | 19 (23.7%) | 83.0 |
| Graduate Degree | 0 (0.0%) | 0.0 |
| Total | 80 (100.0%) | 85.0 |
Fertility by Education by Marriage Status in Washington County
11.3% of women with births in Washington County are unmarried. Women with the educational attainment of less than high school are most likely to be married with 100.0% of them married at childbirth, while women with the educational attainment of college or associate's degree are least likely to be married with 23.1% of them unmarried at childbirth.

| Educational Attainment | Married | Unmarried |
| Less than High School | 6 (100.0%) | 0 (0.0%) |
| High School Diploma | 16 (100.0%) | 0 (0.0%) |
| College or Associate's Degree | 30 (76.9%) | 9 (23.1%) |
| Bachelor's Degree | 19 (100.0%) | 0 (0.0%) |
| Graduate Degree | 0 (0.0%) | 0 (0.0%) |
| Total | 71 (88.7%) | 9 (11.3%) |
Employment Characteristics in Washington County
Employment by Class of Employer in Washington County
Among the 2,247 employed individuals in Washington County, private company employees (1,005 | 44.7%), local government employees (428 | 19.1%), and self-employed (not incorporated) (334 | 14.9%) make up the most common classes of employment.
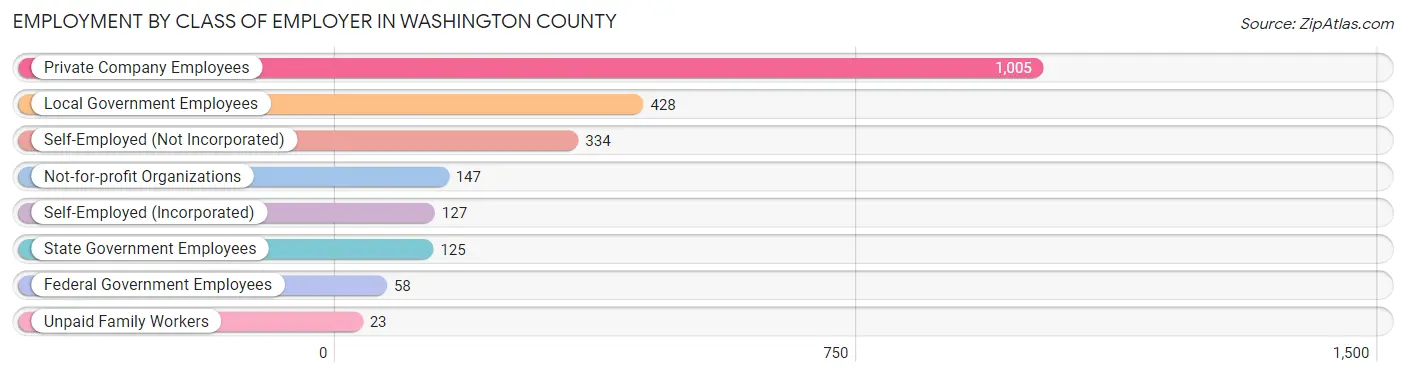
| Employer Class | # Employees | % Employees |
| Private Company Employees | 1,005 | 44.7% |
| Self-Employed (Incorporated) | 127 | 5.7% |
| Self-Employed (Not Incorporated) | 334 | 14.9% |
| Not-for-profit Organizations | 147 | 6.5% |
| Local Government Employees | 428 | 19.1% |
| State Government Employees | 125 | 5.6% |
| Federal Government Employees | 58 | 2.6% |
| Unpaid Family Workers | 23 | 1.0% |
| Total | 2,247 | 100.0% |
Employment Status by Age in Washington County
According to the labor force statistics for Washington County, out of the total population over 16 years of age (3,886), 60.9% or 2,367 individuals are in the labor force, with 3.5% or 83 of them unemployed. The age group with the highest labor force participation rate is 45 to 54 years, with 90.8% or 445 individuals in the labor force. Within the labor force, the 20 to 24 years age range has the highest percentage of unemployed individuals, with 8.9% or 22 of them being unemployed.
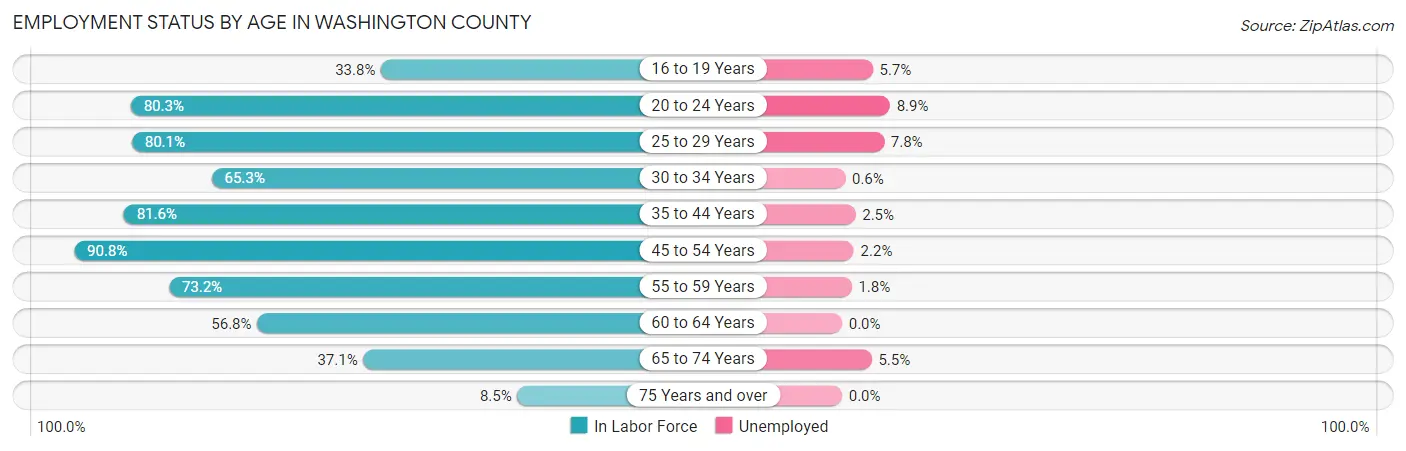
| Age Bracket | In Labor Force | Unemployed |
| 16 to 19 Years | 70 (33.8%) | 4 (5.7%) |
| 20 to 24 Years | 248 (80.3%) | 22 (8.9%) |
| 25 to 29 Years | 217 (80.1%) | 17 (7.8%) |
| 30 to 34 Years | 171 (65.3%) | 1 (0.6%) |
| 35 to 44 Years | 525 (81.6%) | 13 (2.5%) |
| 45 to 54 Years | 445 (90.8%) | 10 (2.2%) |
| 55 to 59 Years | 227 (73.2%) | 4 (1.8%) |
| 60 to 64 Years | 208 (56.8%) | 0 (0.0%) |
| 65 to 74 Years | 219 (37.1%) | 12 (5.5%) |
| 75 Years and over | 37 (8.5%) | 0 (0.0%) |
| Total | 2,367 (60.9%) | 83 (3.5%) |
Employment Status by Educational Attainment in Washington County
According to labor force statistics for Washington County, 76.6% of individuals (1,794) out of the total population between 25 and 64 years of age (2,342) are in the labor force, with 2.5% or 45 of them being unemployed. The group with the highest labor force participation rate are those with the educational attainment of bachelor's degree or higher, with 90.9% or 519 individuals in the labor force. Within the labor force, individuals with less than high school education have the highest percentage of unemployment, with 6.6% or 6 of them being unemployed.
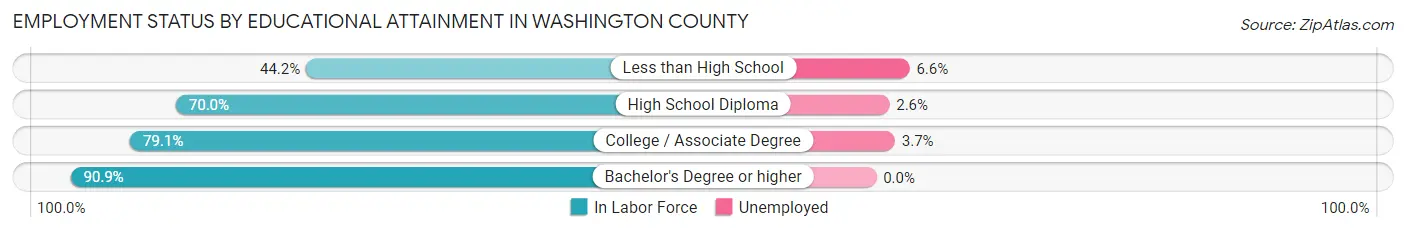
| Educational Attainment | In Labor Force | Unemployed |
| Less than High School | 91 (44.2%) | 14 (6.6%) |
| High School Diploma | 428 (70.0%) | 16 (2.6%) |
| College / Associate Degree | 755 (79.1%) | 35 (3.7%) |
| Bachelor's Degree or higher | 519 (90.9%) | 0 (0.0%) |
| Total | 1,794 (76.6%) | 59 (2.5%) |
Employment Occupations by Sex in Washington County
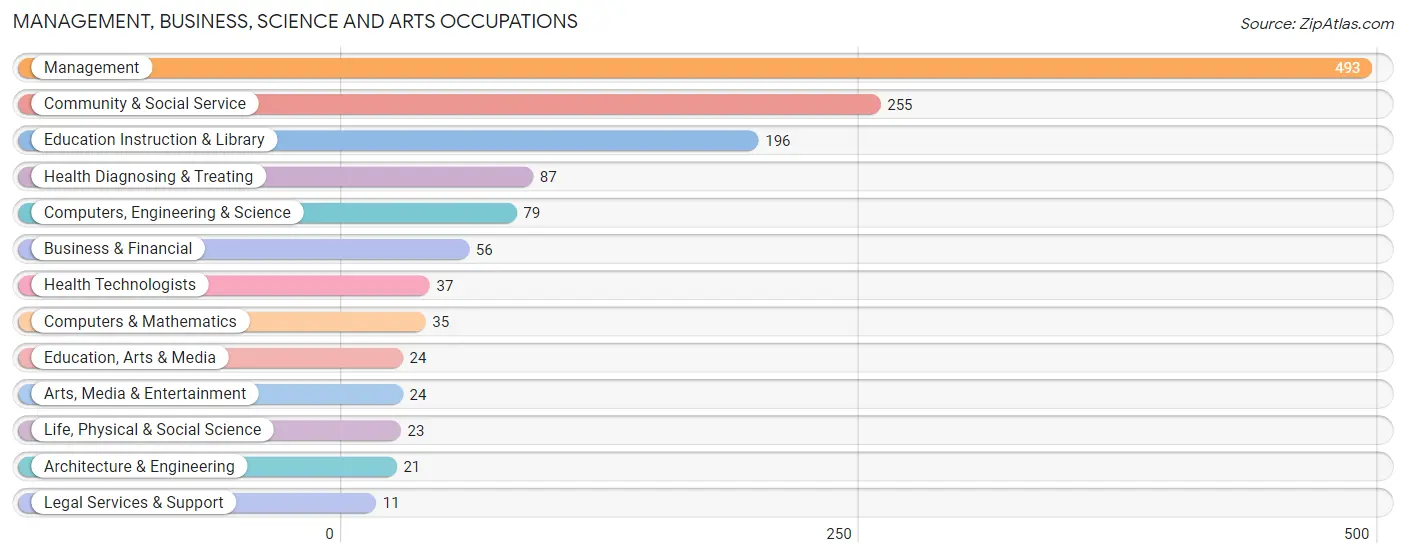
Management, Business, Science and Arts Occupations
The most common Management, Business, Science and Arts occupations in Washington County are Management (493 | 21.6%), Community & Social Service (255 | 11.2%), Education Instruction & Library (196 | 8.6%), Health Diagnosing & Treating (87 | 3.8%), and Computers, Engineering & Science (79 | 3.5%).
Management, Business, Science and Arts Occupations by Sex
Within the Management, Business, Science and Arts occupations in Washington County, the most male-oriented occupations are Computers & Mathematics (100.0%), Architecture & Engineering (95.2%), and Computers, Engineering & Science (93.7%), while the most female-oriented occupations are Health Technologists (91.9%), Health Diagnosing & Treating (89.7%), and Arts, Media & Entertainment (79.2%).
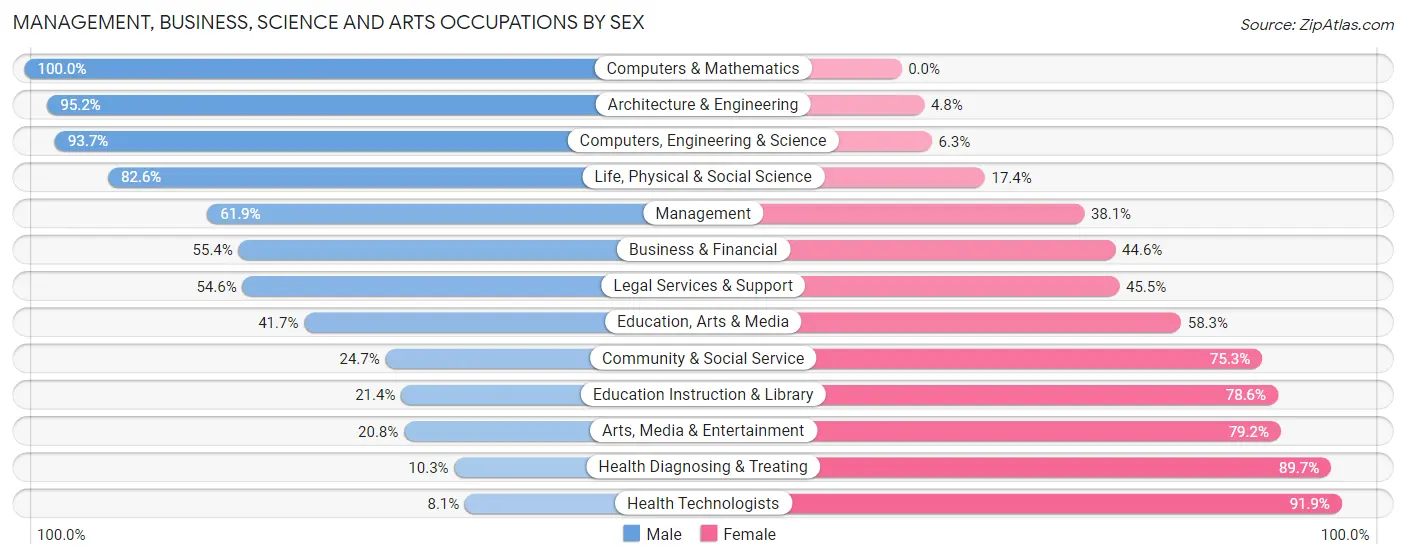
| Occupation | Male | Female |
| Management | 305 (61.9%) | 188 (38.1%) |
| Business & Financial | 31 (55.4%) | 25 (44.6%) |
| Computers, Engineering & Science | 74 (93.7%) | 5 (6.3%) |
| Computers & Mathematics | 35 (100.0%) | 0 (0.0%) |
| Architecture & Engineering | 20 (95.2%) | 1 (4.8%) |
| Life, Physical & Social Science | 19 (82.6%) | 4 (17.4%) |
| Community & Social Service | 63 (24.7%) | 192 (75.3%) |
| Education, Arts & Media | 10 (41.7%) | 14 (58.3%) |
| Legal Services & Support | 6 (54.5%) | 5 (45.5%) |
| Education Instruction & Library | 42 (21.4%) | 154 (78.6%) |
| Arts, Media & Entertainment | 5 (20.8%) | 19 (79.2%) |
| Health Diagnosing & Treating | 9 (10.3%) | 78 (89.7%) |
| Health Technologists | 3 (8.1%) | 34 (91.9%) |
| Total (Category) | 482 (49.7%) | 488 (50.3%) |
| Total (Overall) | 1,263 (55.3%) | 1,021 (44.7%) |
Services Occupations
The most common Services occupations in Washington County are Security & Protection (124 | 5.4%), Law Enforcement (112 | 4.9%), Cleaning & Maintenance (80 | 3.5%), Healthcare Support (72 | 3.2%), and Food Preparation & Serving (57 | 2.5%).

Services Occupations by Sex
Within the Services occupations in Washington County, the most male-oriented occupations are Firefighting & Prevention (75.0%), Security & Protection (70.2%), and Law Enforcement (69.6%), while the most female-oriented occupations are Healthcare Support (94.4%), Food Preparation & Serving (82.5%), and Cleaning & Maintenance (80.0%).
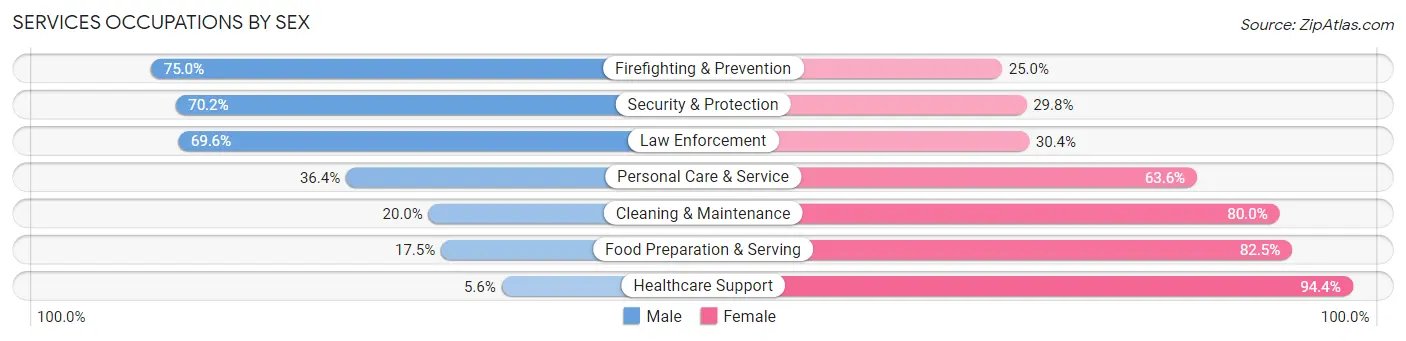
| Occupation | Male | Female |
| Healthcare Support | 4 (5.6%) | 68 (94.4%) |
| Security & Protection | 87 (70.2%) | 37 (29.8%) |
| Firefighting & Prevention | 9 (75.0%) | 3 (25.0%) |
| Law Enforcement | 78 (69.6%) | 34 (30.4%) |
| Food Preparation & Serving | 10 (17.5%) | 47 (82.5%) |
| Cleaning & Maintenance | 16 (20.0%) | 64 (80.0%) |
| Personal Care & Service | 16 (36.4%) | 28 (63.6%) |
| Total (Category) | 133 (35.3%) | 244 (64.7%) |
| Total (Overall) | 1,263 (55.3%) | 1,021 (44.7%) |
Sales and Office Occupations
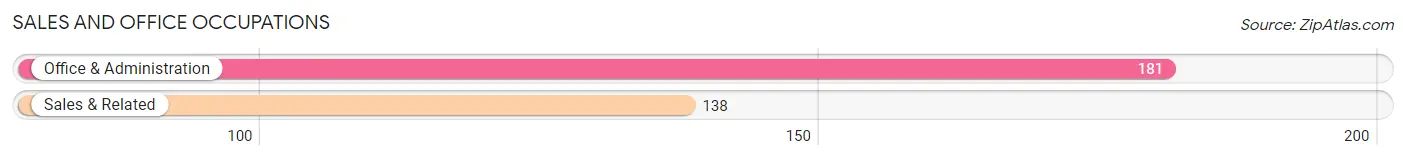
The most common Sales and Office occupations in Washington County are Office & Administration (181 | 7.9%), and Sales & Related (138 | 6.0%).
Sales and Office Occupations by Sex
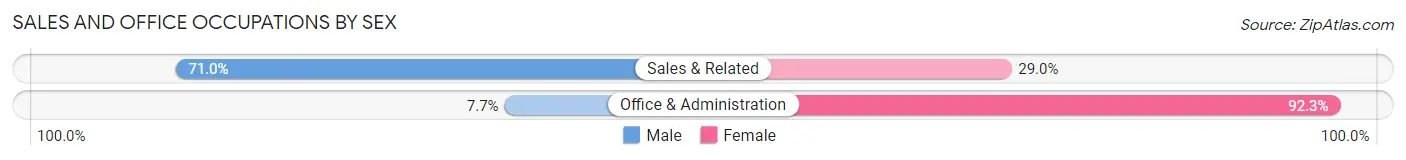
| Occupation | Male | Female |
| Sales & Related | 98 (71.0%) | 40 (29.0%) |
| Office & Administration | 14 (7.7%) | 167 (92.3%) |
| Total (Category) | 112 (35.1%) | 207 (64.9%) |
| Total (Overall) | 1,263 (55.3%) | 1,021 (44.7%) |
Natural Resources, Construction and Maintenance Occupations
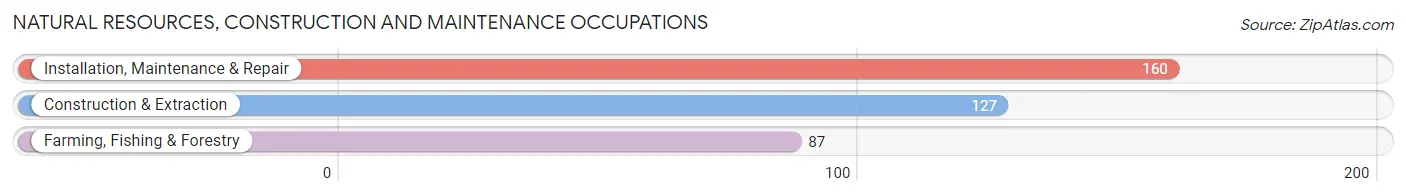
The most common Natural Resources, Construction and Maintenance occupations in Washington County are Installation, Maintenance & Repair (160 | 7.0%), Construction & Extraction (127 | 5.6%), and Farming, Fishing & Forestry (87 | 3.8%).
Natural Resources, Construction and Maintenance Occupations by Sex
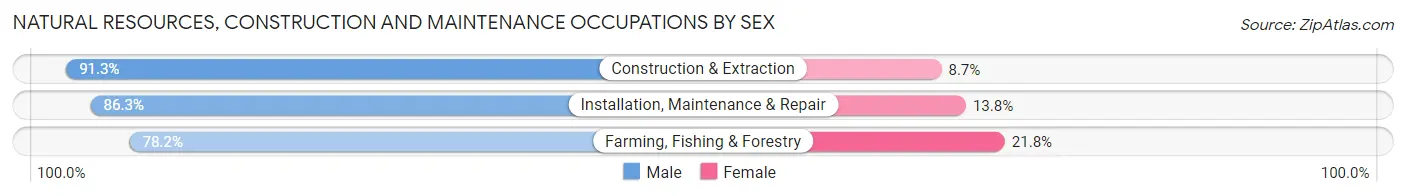
| Occupation | Male | Female |
| Farming, Fishing & Forestry | 68 (78.2%) | 19 (21.8%) |
| Construction & Extraction | 116 (91.3%) | 11 (8.7%) |
| Installation, Maintenance & Repair | 138 (86.3%) | 22 (13.8%) |
| Total (Category) | 322 (86.1%) | 52 (13.9%) |
| Total (Overall) | 1,263 (55.3%) | 1,021 (44.7%) |
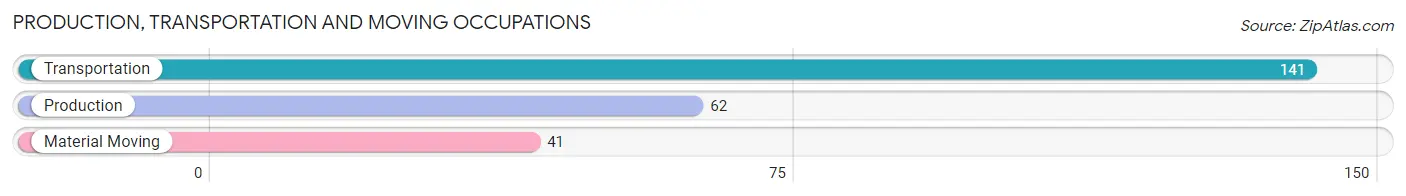
Production, Transportation and Moving Occupations
The most common Production, Transportation and Moving occupations in Washington County are Transportation (141 | 6.2%), Production (62 | 2.7%), and Material Moving (41 | 1.8%).
Production, Transportation and Moving Occupations by Sex
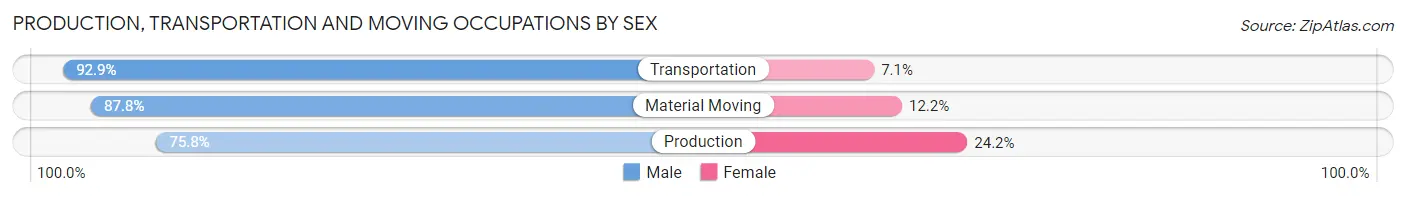
| Occupation | Male | Female |
| Production | 47 (75.8%) | 15 (24.2%) |
| Transportation | 131 (92.9%) | 10 (7.1%) |
| Material Moving | 36 (87.8%) | 5 (12.2%) |
| Total (Category) | 214 (87.7%) | 30 (12.3%) |
| Total (Overall) | 1,263 (55.3%) | 1,021 (44.7%) |
Employment Industries by Sex in Washington County
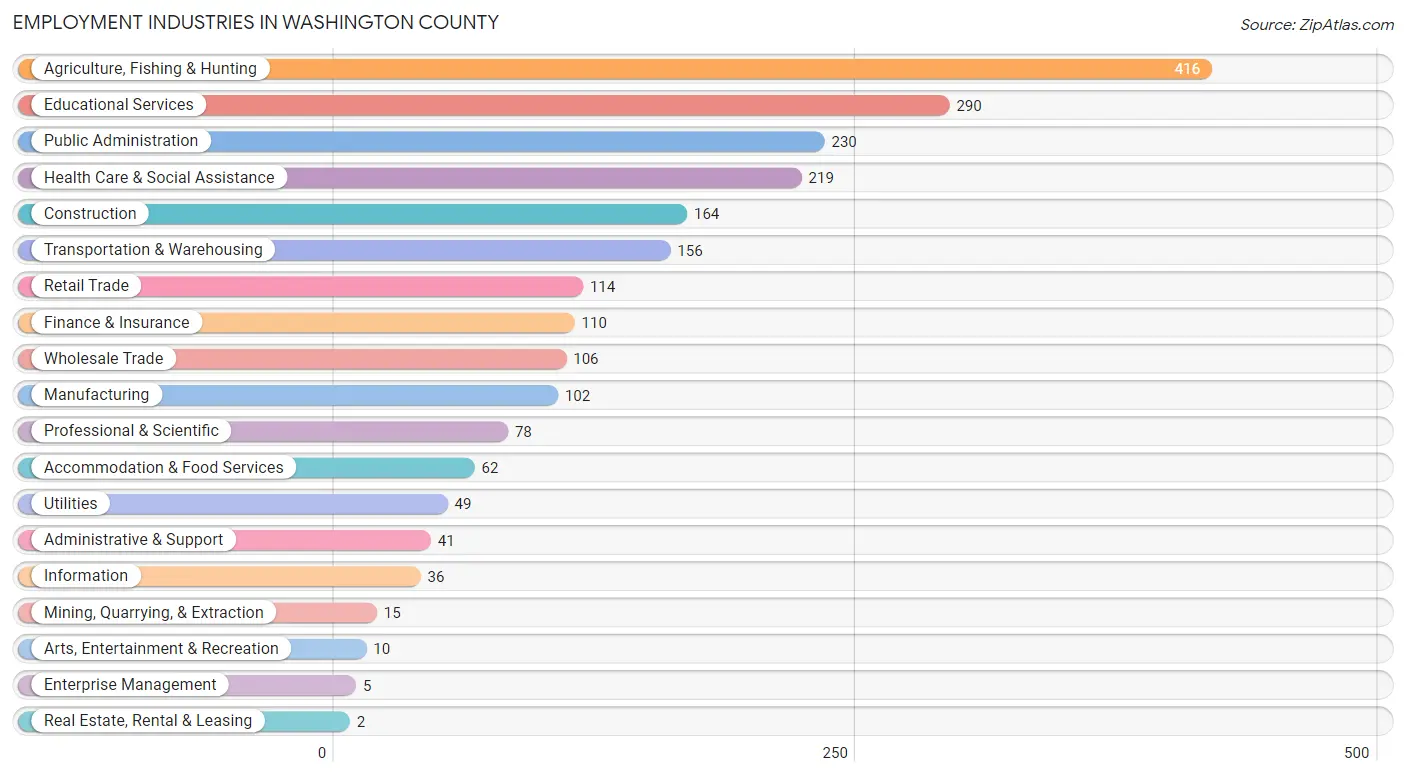
Employment Industries in Washington County
The major employment industries in Washington County include Agriculture, Fishing & Hunting (416 | 18.2%), Educational Services (290 | 12.7%), Public Administration (230 | 10.1%), Health Care & Social Assistance (219 | 9.6%), and Construction (164 | 7.2%).
Employment Industries by Sex in Washington County
The Washington County industries that see more men than women are Mining, Quarrying, & Extraction (100.0%), Utilities (89.8%), and Construction (88.4%), whereas the industries that tend to have a higher number of women are Real Estate, Rental & Leasing (100.0%), Enterprise Management (100.0%), and Health Care & Social Assistance (93.6%).
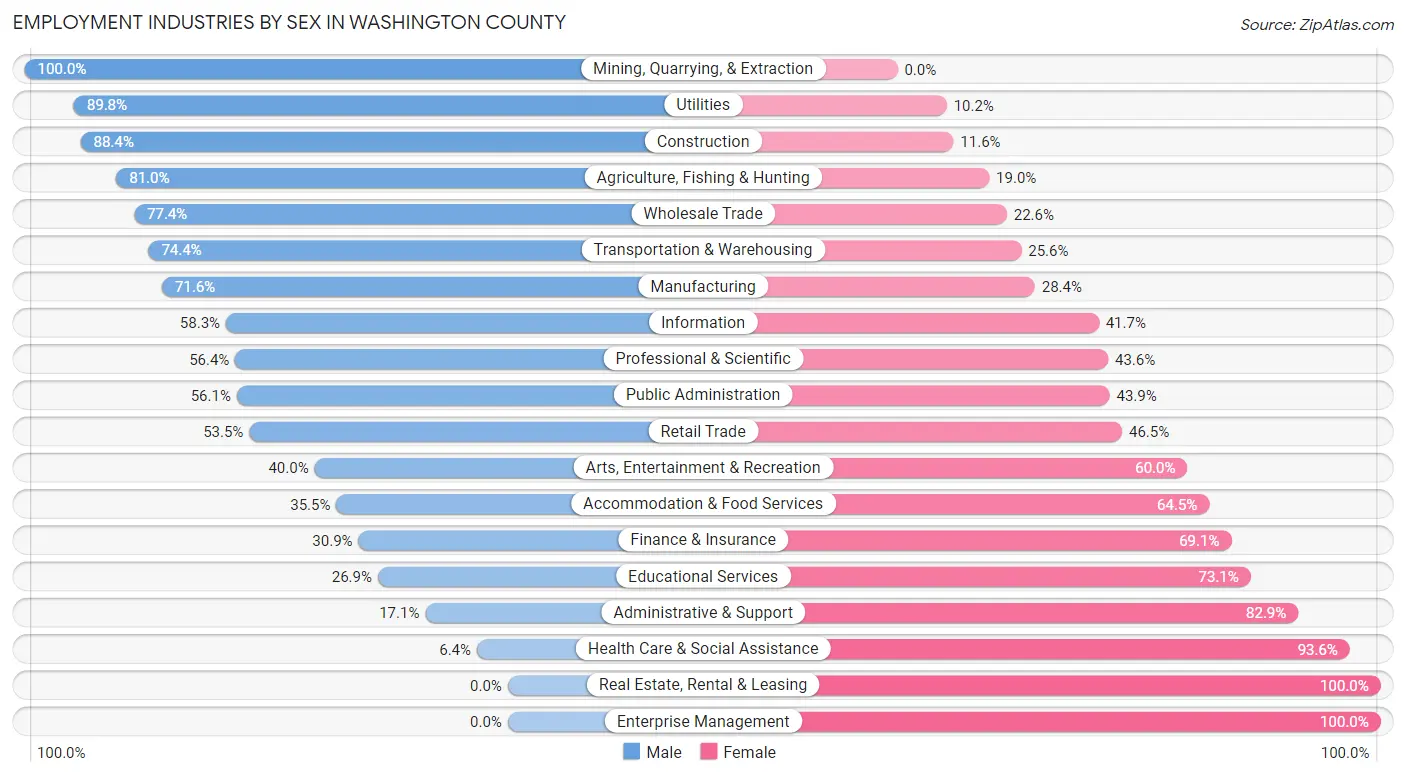
| Industry | Male | Female |
| Agriculture, Fishing & Hunting | 337 (81.0%) | 79 (19.0%) |
| Mining, Quarrying, & Extraction | 15 (100.0%) | 0 (0.0%) |
| Construction | 145 (88.4%) | 19 (11.6%) |
| Manufacturing | 73 (71.6%) | 29 (28.4%) |
| Wholesale Trade | 82 (77.4%) | 24 (22.6%) |
| Retail Trade | 61 (53.5%) | 53 (46.5%) |
| Transportation & Warehousing | 116 (74.4%) | 40 (25.6%) |
| Utilities | 44 (89.8%) | 5 (10.2%) |
| Information | 21 (58.3%) | 15 (41.7%) |
| Finance & Insurance | 34 (30.9%) | 76 (69.1%) |
| Real Estate, Rental & Leasing | 0 (0.0%) | 2 (100.0%) |
| Professional & Scientific | 44 (56.4%) | 34 (43.6%) |
| Enterprise Management | 0 (0.0%) | 5 (100.0%) |
| Administrative & Support | 7 (17.1%) | 34 (82.9%) |
| Educational Services | 78 (26.9%) | 212 (73.1%) |
| Health Care & Social Assistance | 14 (6.4%) | 205 (93.6%) |
| Arts, Entertainment & Recreation | 4 (40.0%) | 6 (60.0%) |
| Accommodation & Food Services | 22 (35.5%) | 40 (64.5%) |
| Public Administration | 129 (56.1%) | 101 (43.9%) |
| Total | 1,263 (55.3%) | 1,021 (44.7%) |
Education in Washington County
School Enrollment in Washington County
The most common levels of schooling among the 1,044 students in Washington County are elementary school (290 | 27.8%), high school (257 | 24.6%), and middle school (234 | 22.4%).
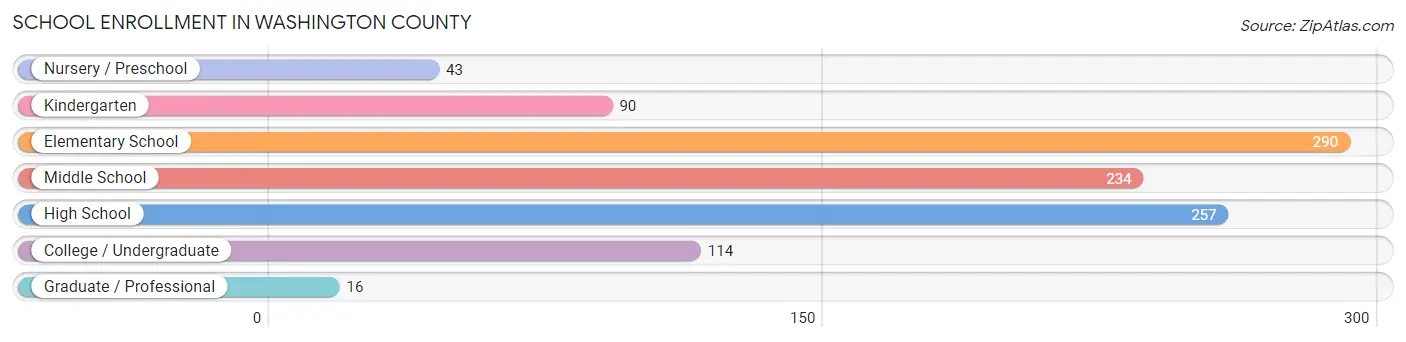
| School Level | # Students | % Students |
| Nursery / Preschool | 43 | 4.1% |
| Kindergarten | 90 | 8.6% |
| Elementary School | 290 | 27.8% |
| Middle School | 234 | 22.4% |
| High School | 257 | 24.6% |
| College / Undergraduate | 114 | 10.9% |
| Graduate / Professional | 16 | 1.5% |
| Total | 1,044 | 100.0% |
School Enrollment by Age by Funding Source in Washington County
Out of a total of 1,044 students who are enrolled in schools in Washington County, 92 (8.8%) attend a private institution, while the remaining 952 (91.2%) are enrolled in public schools. The age group of 35 years and over has the highest likelihood of being enrolled in private schools, with 14 (29.2% in the age bracket) enrolled. Conversely, the age group of 18 to 19 year olds has the lowest likelihood of being enrolled in a private school, with 55 (100.0% in the age bracket) attending a public institution.
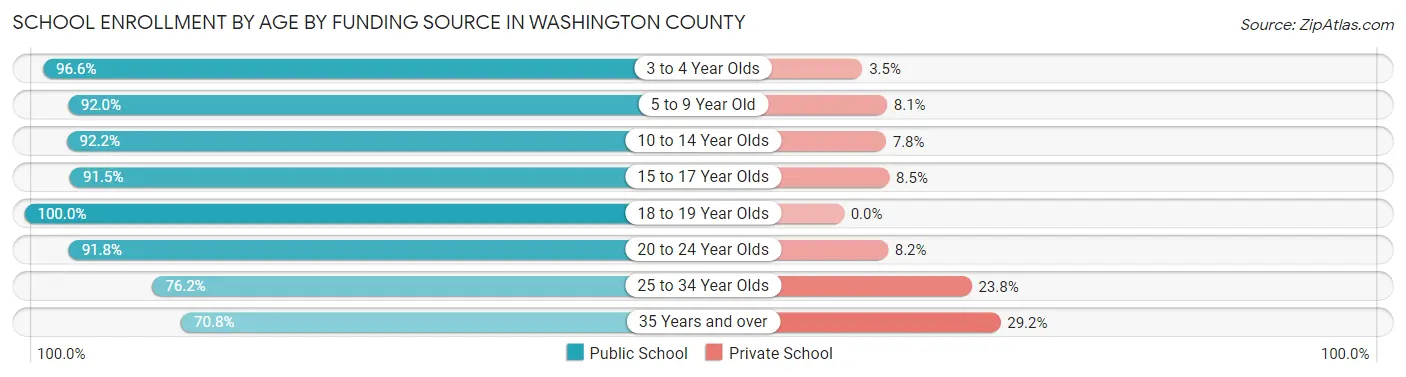
| Age Bracket | Public School | Private School |
| 3 to 4 Year Olds | 28 (96.6%) | 1 (3.5%) |
| 5 to 9 Year Old | 297 (91.9%) | 26 (8.1%) |
| 10 to 14 Year Olds | 282 (92.2%) | 24 (7.8%) |
| 15 to 17 Year Olds | 173 (91.5%) | 16 (8.5%) |
| 18 to 19 Year Olds | 55 (100.0%) | 0 (0.0%) |
| 20 to 24 Year Olds | 67 (91.8%) | 6 (8.2%) |
| 25 to 34 Year Olds | 16 (76.2%) | 5 (23.8%) |
| 35 Years and over | 34 (70.8%) | 14 (29.2%) |
| Total | 952 (91.2%) | 92 (8.8%) |
Educational Attainment by Field of Study in Washington County
Education (239 | 25.0%), bio, nature & agricultural (170 | 17.8%), business (149 | 15.6%), social sciences (71 | 7.4%), and engineering (66 | 6.9%) are the most common fields of study among 956 individuals in Washington County who have obtained a bachelor's degree or higher.
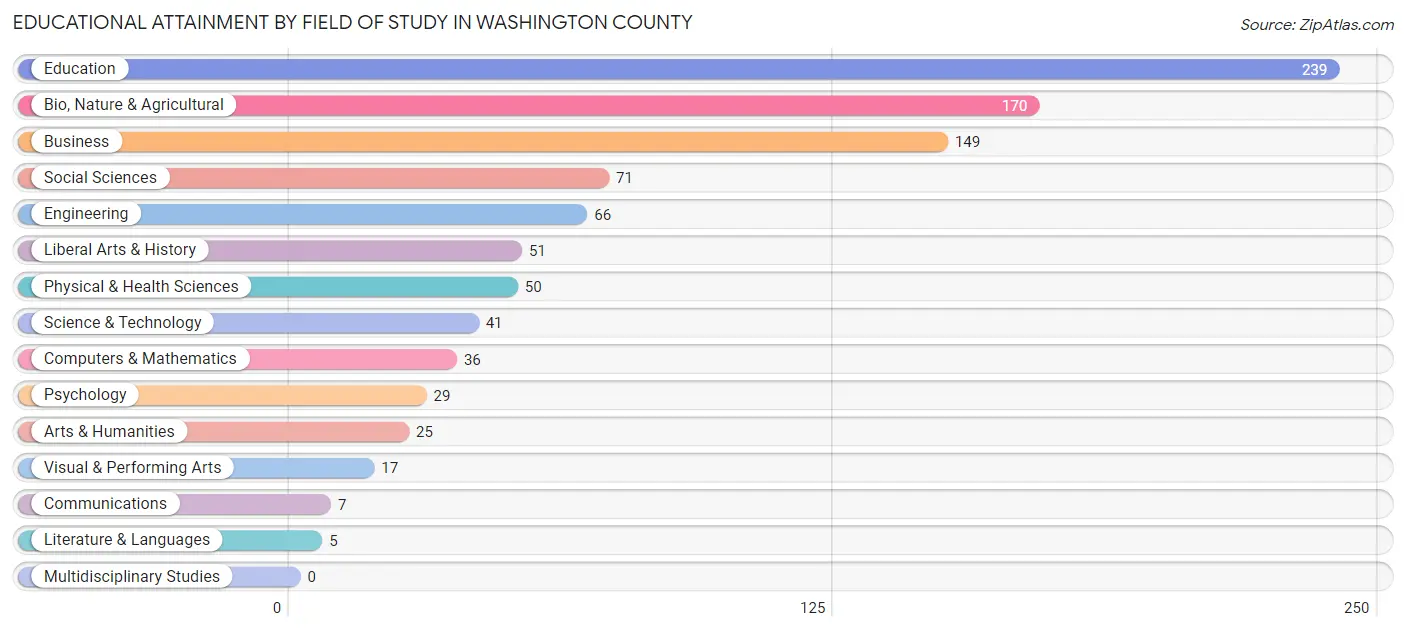
| Field of Study | # Graduates | % Graduates |
| Computers & Mathematics | 36 | 3.8% |
| Bio, Nature & Agricultural | 170 | 17.8% |
| Physical & Health Sciences | 50 | 5.2% |
| Psychology | 29 | 3.0% |
| Social Sciences | 71 | 7.4% |
| Engineering | 66 | 6.9% |
| Multidisciplinary Studies | 0 | 0.0% |
| Science & Technology | 41 | 4.3% |
| Business | 149 | 15.6% |
| Education | 239 | 25.0% |
| Literature & Languages | 5 | 0.5% |
| Liberal Arts & History | 51 | 5.3% |
| Visual & Performing Arts | 17 | 1.8% |
| Communications | 7 | 0.7% |
| Arts & Humanities | 25 | 2.6% |
| Total | 956 | 100.0% |
Transportation & Commute in Washington County
Vehicle Availability by Sex in Washington County
The most prevalent vehicle ownership categories in Washington County are males with 2 vehicles (393, accounting for 31.8%) and females with 2 vehicles (281, making up 38.9%).
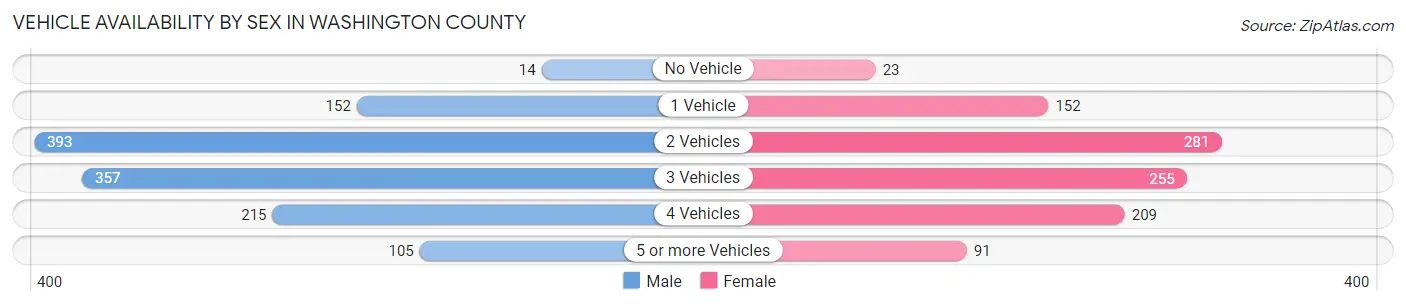
| Vehicles Available | Male | Female |
| No Vehicle | 14 (1.1%) | 23 (2.3%) |
| 1 Vehicle | 152 (12.3%) | 152 (15.0%) |
| 2 Vehicles | 393 (31.8%) | 281 (27.8%) |
| 3 Vehicles | 357 (28.9%) | 255 (25.2%) |
| 4 Vehicles | 215 (17.4%) | 209 (20.7%) |
| 5 or more Vehicles | 105 (8.5%) | 91 (9.0%) |
| Total | 1,236 (100.0%) | 1,011 (100.0%) |
Commute Time in Washington County
The most frequently occuring commute durations in Washington County are 5 to 9 minutes (474 commuters, 24.1%), less than 5 minutes (318 commuters, 16.2%), and 15 to 19 minutes (211 commuters, 10.7%).
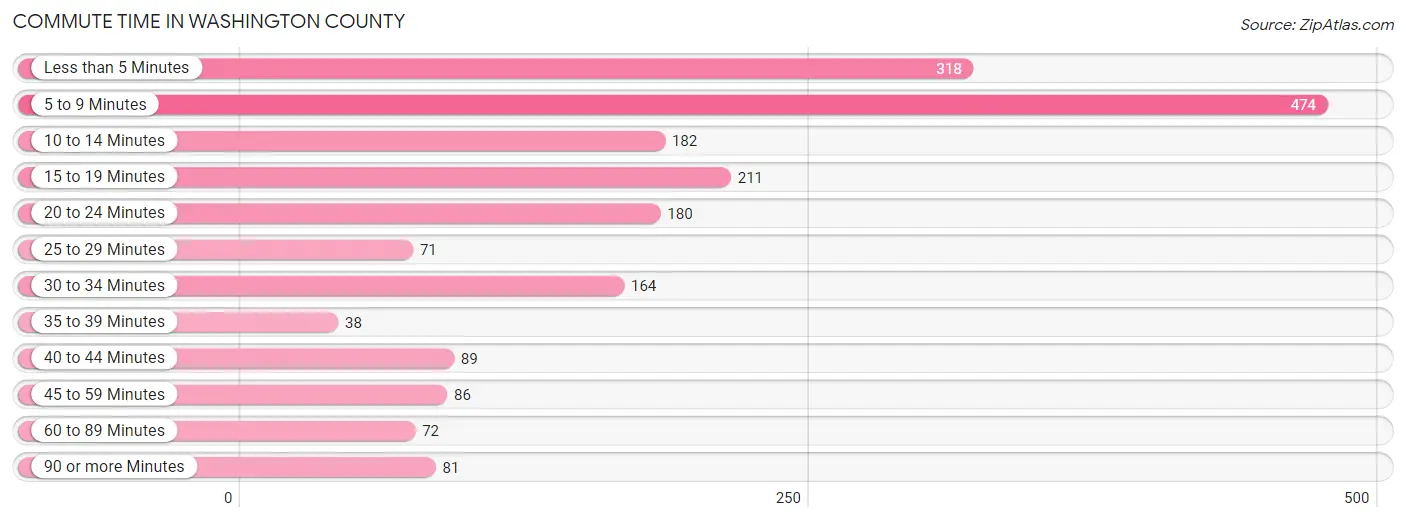
| Commute Time | # Commuters | % Commuters |
| Less than 5 Minutes | 318 | 16.2% |
| 5 to 9 Minutes | 474 | 24.1% |
| 10 to 14 Minutes | 182 | 9.3% |
| 15 to 19 Minutes | 211 | 10.7% |
| 20 to 24 Minutes | 180 | 9.2% |
| 25 to 29 Minutes | 71 | 3.6% |
| 30 to 34 Minutes | 164 | 8.3% |
| 35 to 39 Minutes | 38 | 1.9% |
| 40 to 44 Minutes | 89 | 4.5% |
| 45 to 59 Minutes | 86 | 4.4% |
| 60 to 89 Minutes | 72 | 3.7% |
| 90 or more Minutes | 81 | 4.1% |
Commute Time by Sex in Washington County
The most common commute times in Washington County are 5 to 9 minutes (239 commuters, 22.8%) for males and 5 to 9 minutes (235 commuters, 25.6%) for females.
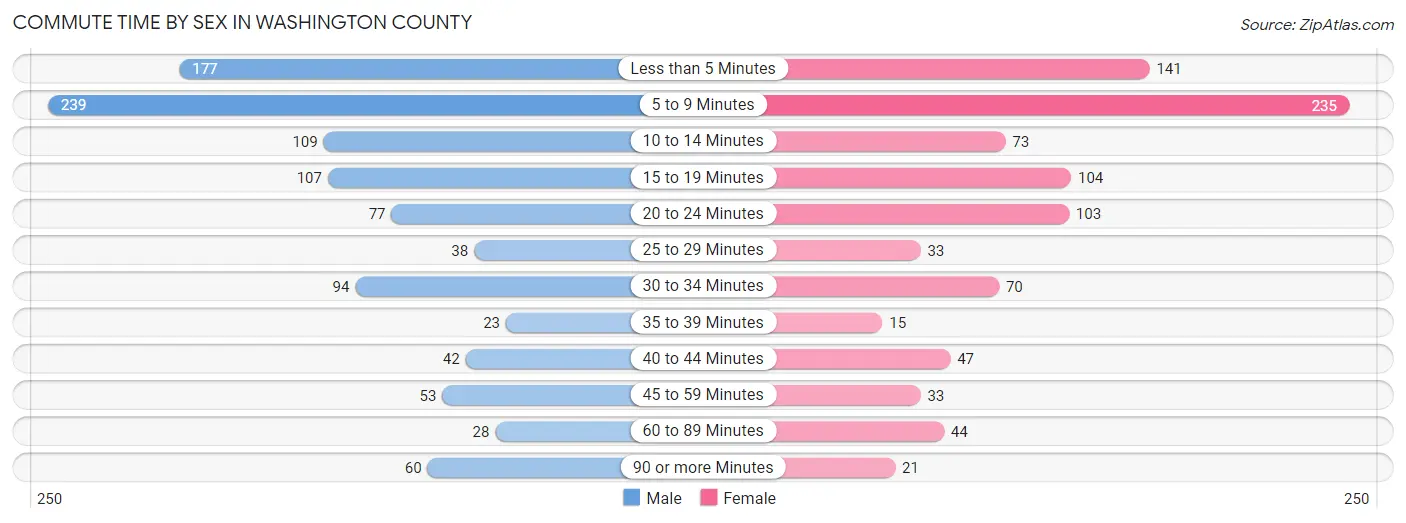
| Commute Time | Male | Female |
| Less than 5 Minutes | 177 (16.9%) | 141 (15.3%) |
| 5 to 9 Minutes | 239 (22.8%) | 235 (25.6%) |
| 10 to 14 Minutes | 109 (10.4%) | 73 (7.9%) |
| 15 to 19 Minutes | 107 (10.2%) | 104 (11.3%) |
| 20 to 24 Minutes | 77 (7.3%) | 103 (11.2%) |
| 25 to 29 Minutes | 38 (3.6%) | 33 (3.6%) |
| 30 to 34 Minutes | 94 (9.0%) | 70 (7.6%) |
| 35 to 39 Minutes | 23 (2.2%) | 15 (1.6%) |
| 40 to 44 Minutes | 42 (4.0%) | 47 (5.1%) |
| 45 to 59 Minutes | 53 (5.1%) | 33 (3.6%) |
| 60 to 89 Minutes | 28 (2.7%) | 44 (4.8%) |
| 90 or more Minutes | 60 (5.7%) | 21 (2.3%) |
Time of Departure to Work by Sex in Washington County
The most frequent times of departure to work in Washington County are 7:00 AM to 7:29 AM (237, 22.6%) for males and 7:30 AM to 7:59 AM (219, 23.8%) for females.
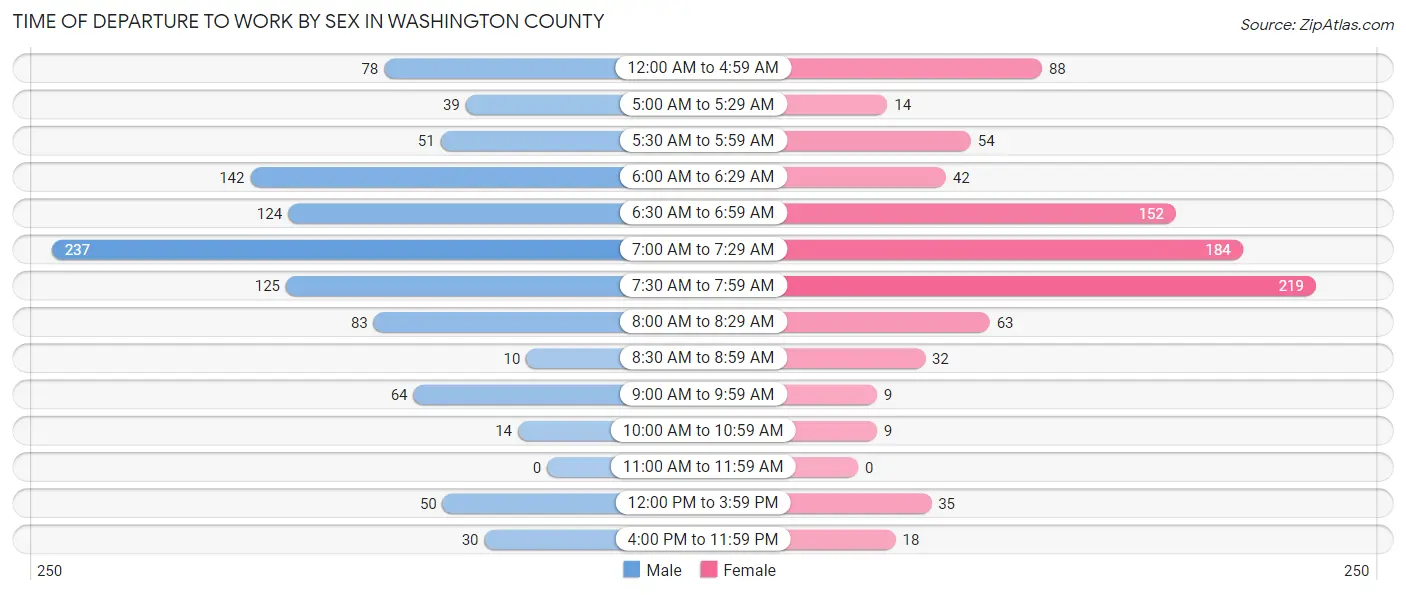
| Time of Departure | Male | Female |
| 12:00 AM to 4:59 AM | 78 (7.4%) | 88 (9.6%) |
| 5:00 AM to 5:29 AM | 39 (3.7%) | 14 (1.5%) |
| 5:30 AM to 5:59 AM | 51 (4.9%) | 54 (5.9%) |
| 6:00 AM to 6:29 AM | 142 (13.6%) | 42 (4.6%) |
| 6:30 AM to 6:59 AM | 124 (11.8%) | 152 (16.5%) |
| 7:00 AM to 7:29 AM | 237 (22.6%) | 184 (20.0%) |
| 7:30 AM to 7:59 AM | 125 (11.9%) | 219 (23.8%) |
| 8:00 AM to 8:29 AM | 83 (7.9%) | 63 (6.9%) |
| 8:30 AM to 8:59 AM | 10 (1.0%) | 32 (3.5%) |
| 9:00 AM to 9:59 AM | 64 (6.1%) | 9 (1.0%) |
| 10:00 AM to 10:59 AM | 14 (1.3%) | 9 (1.0%) |
| 11:00 AM to 11:59 AM | 0 (0.0%) | 0 (0.0%) |
| 12:00 PM to 3:59 PM | 50 (4.8%) | 35 (3.8%) |
| 4:00 PM to 11:59 PM | 30 (2.9%) | 18 (2.0%) |
| Total | 1,047 (100.0%) | 919 (100.0%) |
Housing Occupancy in Washington County
Occupancy by Ownership in Washington County
Of the total 2,030 dwellings in Washington County, owner-occupied units account for 1,426 (70.3%), while renter-occupied units make up 604 (29.7%).
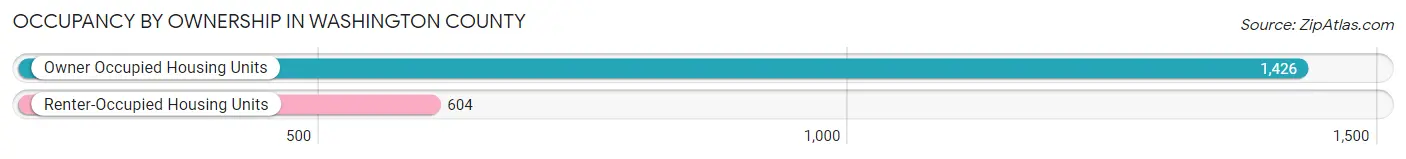
| Occupancy | # Housing Units | % Housing Units |
| Owner Occupied Housing Units | 1,426 | 70.3% |
| Renter-Occupied Housing Units | 604 | 29.7% |
| Total Occupied Housing Units | 2,030 | 100.0% |
Occupancy by Household Size in Washington County
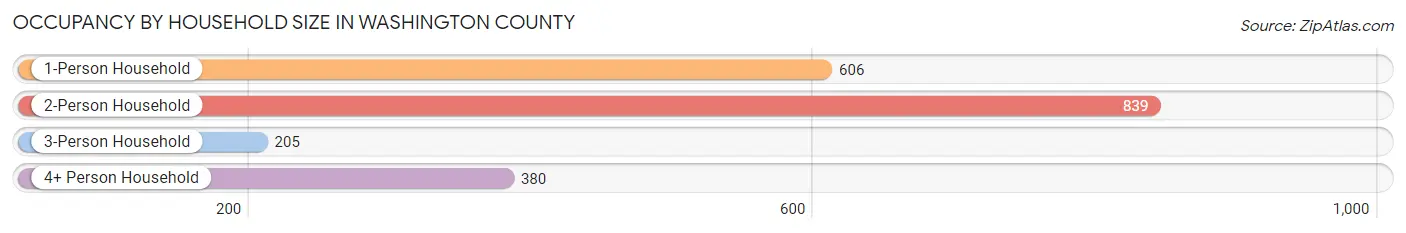
| Household Size | # Housing Units | % Housing Units |
| 1-Person Household | 606 | 29.8% |
| 2-Person Household | 839 | 41.3% |
| 3-Person Household | 205 | 10.1% |
| 4+ Person Household | 380 | 18.7% |
| Total Housing Units | 2,030 | 100.0% |
Occupancy by Ownership by Household Size in Washington County
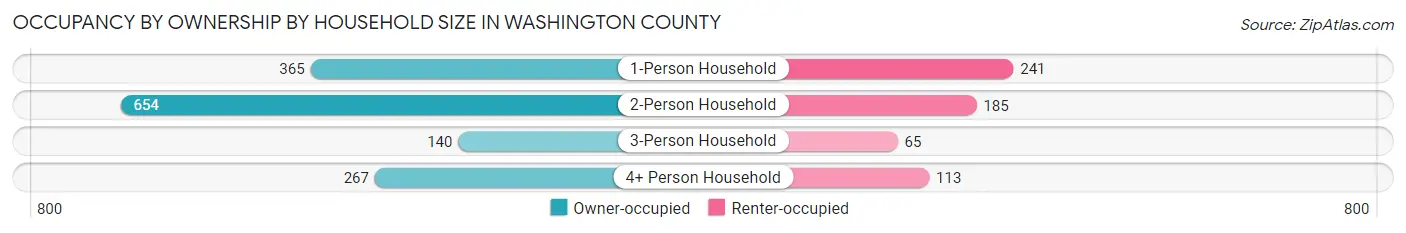
| Household Size | Owner-occupied | Renter-occupied |
| 1-Person Household | 365 (60.2%) | 241 (39.8%) |
| 2-Person Household | 654 (77.9%) | 185 (22.1%) |
| 3-Person Household | 140 (68.3%) | 65 (31.7%) |
| 4+ Person Household | 267 (70.3%) | 113 (29.7%) |
| Total Housing Units | 1,426 (70.3%) | 604 (29.7%) |
Occupancy by Educational Attainment in Washington County
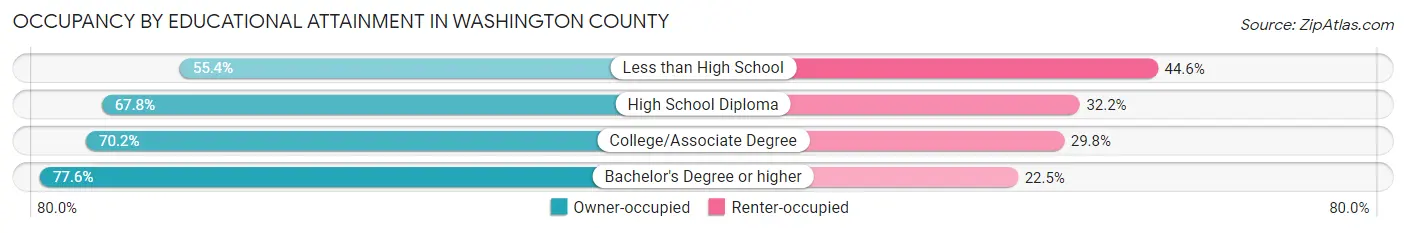
| Household Size | Owner-occupied | Renter-occupied |
| Less than High School | 98 (55.4%) | 79 (44.6%) |
| High School Diploma | 372 (67.8%) | 177 (32.2%) |
| College/Associate Degree | 531 (70.2%) | 225 (29.8%) |
| Bachelor's Degree or higher | 425 (77.5%) | 123 (22.5%) |
Occupancy by Age of Householder in Washington County
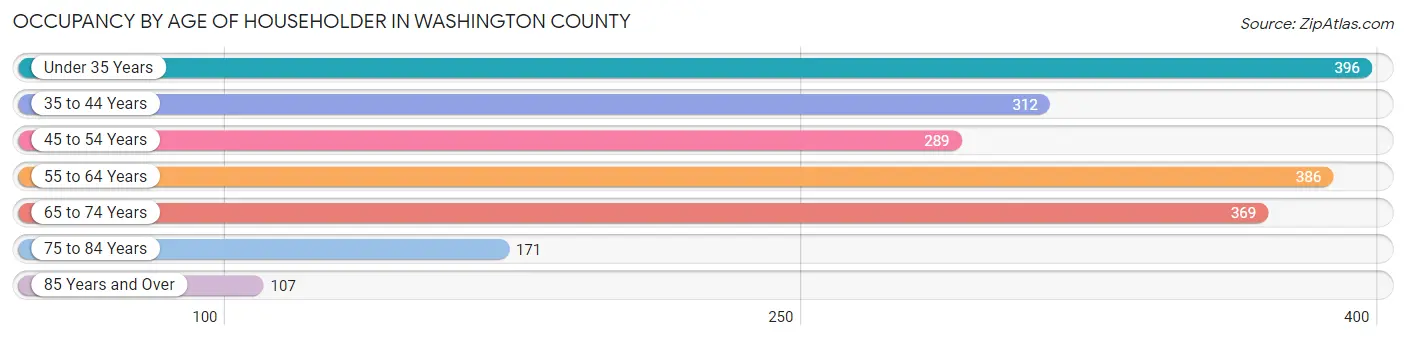
| Age Bracket | # Households | % Households |
| Under 35 Years | 396 | 19.5% |
| 35 to 44 Years | 312 | 15.4% |
| 45 to 54 Years | 289 | 14.2% |
| 55 to 64 Years | 386 | 19.0% |
| 65 to 74 Years | 369 | 18.2% |
| 75 to 84 Years | 171 | 8.4% |
| 85 Years and Over | 107 | 5.3% |
| Total | 2,030 | 100.0% |
Housing Finances in Washington County
Median Income by Occupancy in Washington County
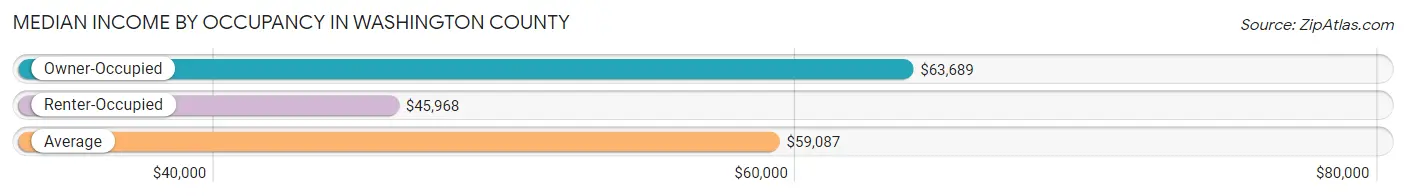
| Occupancy Type | # Households | Median Income |
| Owner-Occupied | 1,426 (70.3%) | $63,689 |
| Renter-Occupied | 604 (29.7%) | $45,968 |
| Average | 2,030 (100.0%) | $59,087 |
Occupancy by Householder Income Bracket in Washington County
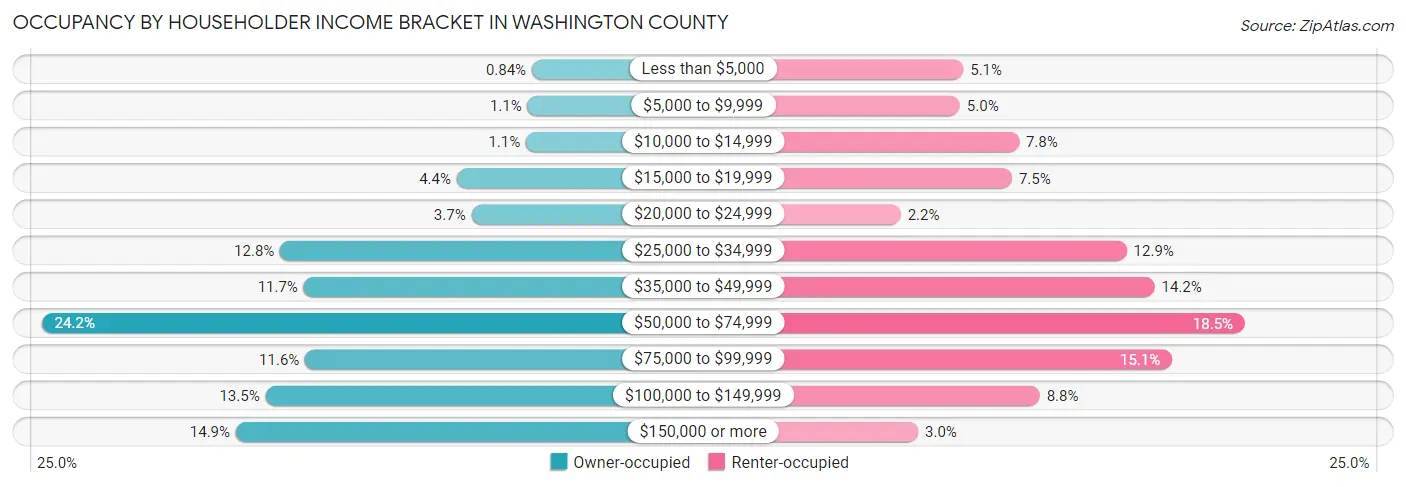
| Income Bracket | Owner-occupied | Renter-occupied |
| Less than $5,000 | 12 (0.8%) | 31 (5.1%) |
| $5,000 to $9,999 | 15 (1.1%) | 30 (5.0%) |
| $10,000 to $14,999 | 16 (1.1%) | 47 (7.8%) |
| $15,000 to $19,999 | 63 (4.4%) | 45 (7.4%) |
| $20,000 to $24,999 | 53 (3.7%) | 13 (2.1%) |
| $25,000 to $34,999 | 183 (12.8%) | 78 (12.9%) |
| $35,000 to $49,999 | 167 (11.7%) | 86 (14.2%) |
| $50,000 to $74,999 | 345 (24.2%) | 112 (18.5%) |
| $75,000 to $99,999 | 166 (11.6%) | 91 (15.1%) |
| $100,000 to $149,999 | 193 (13.5%) | 53 (8.8%) |
| $150,000 or more | 213 (14.9%) | 18 (3.0%) |
| Total | 1,426 (100.0%) | 604 (100.0%) |
Monthly Housing Cost Tiers in Washington County
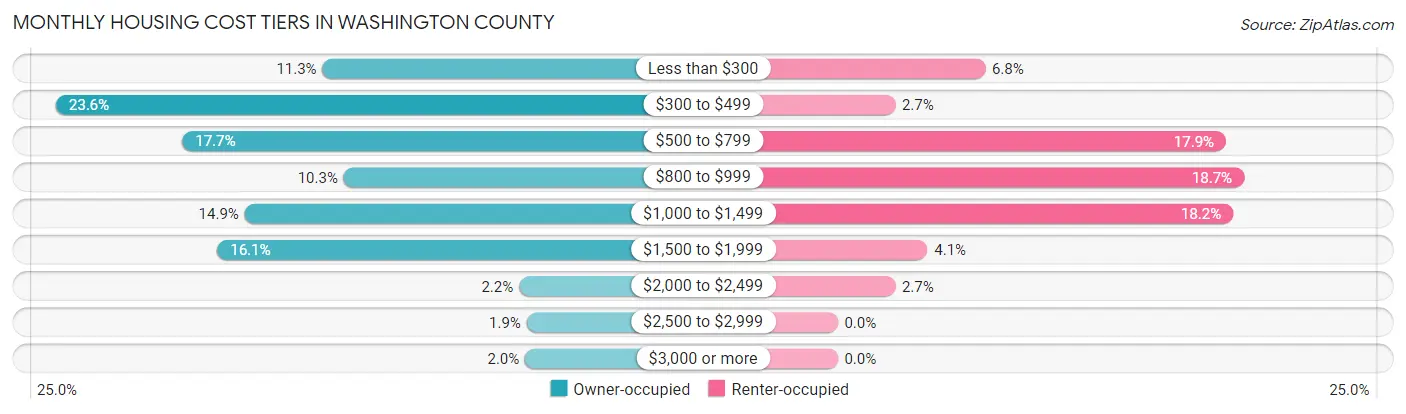
| Monthly Cost | Owner-occupied | Renter-occupied |
| Less than $300 | 161 (11.3%) | 41 (6.8%) |
| $300 to $499 | 336 (23.6%) | 16 (2.6%) |
| $500 to $799 | 253 (17.7%) | 108 (17.9%) |
| $800 to $999 | 147 (10.3%) | 113 (18.7%) |
| $1,000 to $1,499 | 212 (14.9%) | 110 (18.2%) |
| $1,500 to $1,999 | 230 (16.1%) | 25 (4.1%) |
| $2,000 to $2,499 | 32 (2.2%) | 16 (2.6%) |
| $2,500 to $2,999 | 27 (1.9%) | 0 (0.0%) |
| $3,000 or more | 28 (2.0%) | 0 (0.0%) |
| Total | 1,426 (100.0%) | 604 (100.0%) |
Physical Housing Characteristics in Washington County
Housing Structures in Washington County
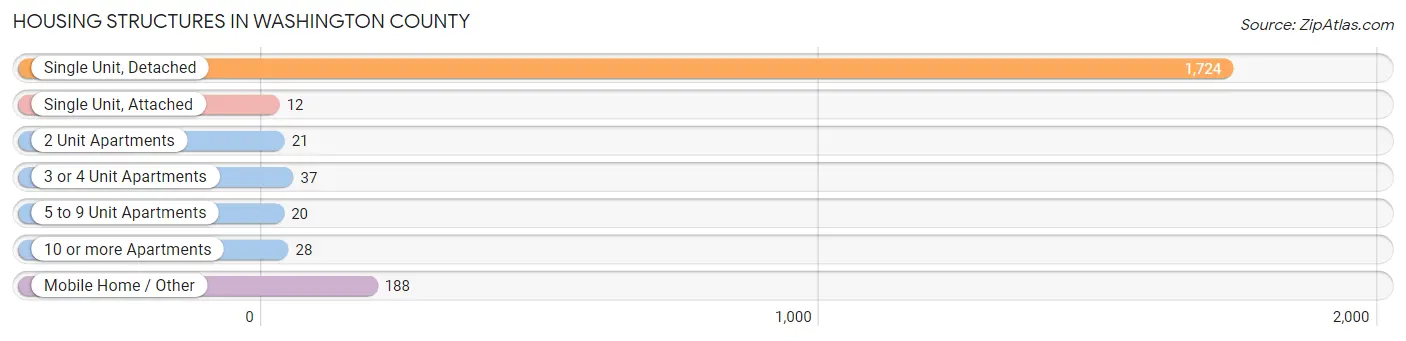
| Structure Type | # Housing Units | % Housing Units |
| Single Unit, Detached | 1,724 | 84.9% |
| Single Unit, Attached | 12 | 0.6% |
| 2 Unit Apartments | 21 | 1.0% |
| 3 or 4 Unit Apartments | 37 | 1.8% |
| 5 to 9 Unit Apartments | 20 | 1.0% |
| 10 or more Apartments | 28 | 1.4% |
| Mobile Home / Other | 188 | 9.3% |
| Total | 2,030 | 100.0% |
Housing Structures by Occupancy in Washington County
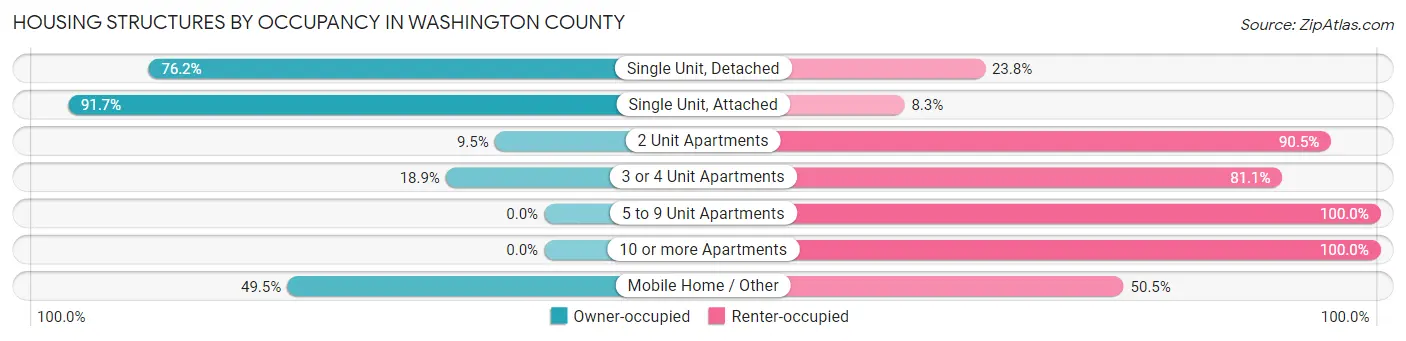
| Structure Type | Owner-occupied | Renter-occupied |
| Single Unit, Detached | 1,313 (76.2%) | 411 (23.8%) |
| Single Unit, Attached | 11 (91.7%) | 1 (8.3%) |
| 2 Unit Apartments | 2 (9.5%) | 19 (90.5%) |
| 3 or 4 Unit Apartments | 7 (18.9%) | 30 (81.1%) |
| 5 to 9 Unit Apartments | 0 (0.0%) | 20 (100.0%) |
| 10 or more Apartments | 0 (0.0%) | 28 (100.0%) |
| Mobile Home / Other | 93 (49.5%) | 95 (50.5%) |
| Total | 1,426 (70.3%) | 604 (29.7%) |
Housing Structures by Number of Rooms in Washington County
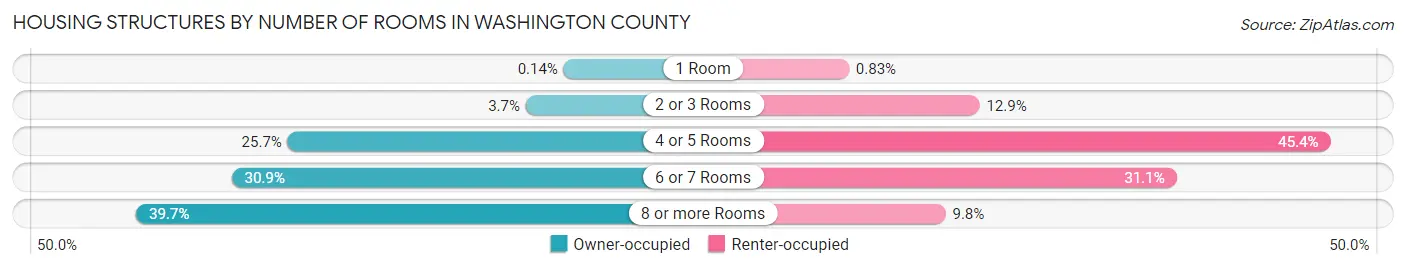
| Number of Rooms | Owner-occupied | Renter-occupied |
| 1 Room | 2 (0.1%) | 5 (0.8%) |
| 2 or 3 Rooms | 52 (3.6%) | 78 (12.9%) |
| 4 or 5 Rooms | 366 (25.7%) | 274 (45.4%) |
| 6 or 7 Rooms | 440 (30.9%) | 188 (31.1%) |
| 8 or more Rooms | 566 (39.7%) | 59 (9.8%) |
| Total | 1,426 (100.0%) | 604 (100.0%) |
Housing Structure by Heating Type in Washington County
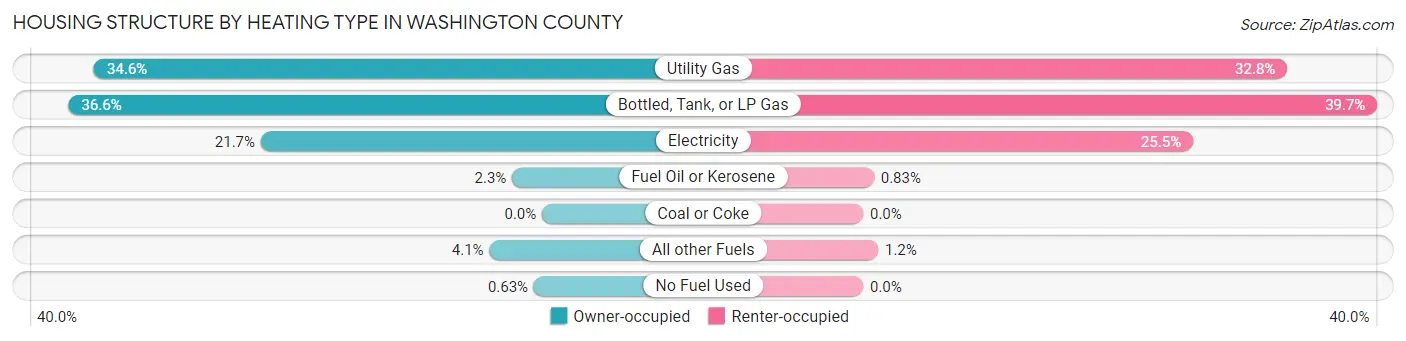
| Heating Type | Owner-occupied | Renter-occupied |
| Utility Gas | 494 (34.6%) | 198 (32.8%) |
| Bottled, Tank, or LP Gas | 522 (36.6%) | 240 (39.7%) |
| Electricity | 310 (21.7%) | 154 (25.5%) |
| Fuel Oil or Kerosene | 33 (2.3%) | 5 (0.8%) |
| Coal or Coke | 0 (0.0%) | 0 (0.0%) |
| All other Fuels | 58 (4.1%) | 7 (1.2%) |
| No Fuel Used | 9 (0.6%) | 0 (0.0%) |
| Total | 1,426 (100.0%) | 604 (100.0%) |
Household Vehicle Usage in Washington County
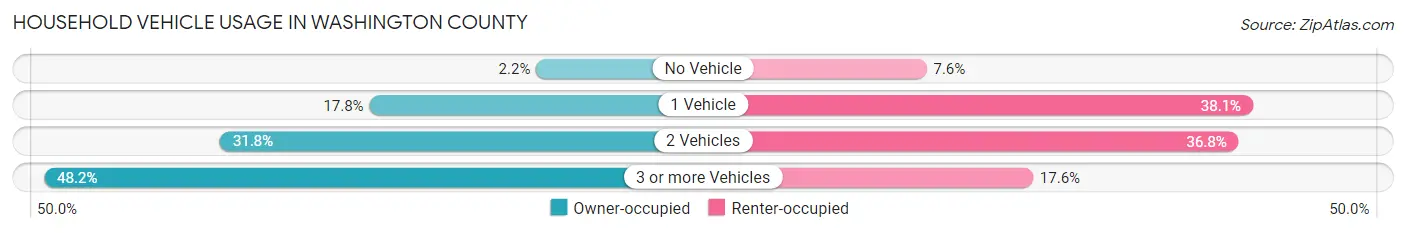
| Vehicles per Household | Owner-occupied | Renter-occupied |
| No Vehicle | 32 (2.2%) | 46 (7.6%) |
| 1 Vehicle | 254 (17.8%) | 230 (38.1%) |
| 2 Vehicles | 453 (31.8%) | 222 (36.7%) |
| 3 or more Vehicles | 687 (48.2%) | 106 (17.5%) |
| Total | 1,426 (100.0%) | 604 (100.0%) |
Real Estate & Mortgages in Washington County
Real Estate and Mortgage Overview in Washington County
| Characteristic | Without Mortgage | With Mortgage |
| Housing Units | 798 | 628 |
| Median Property Value | $169,400 | $232,200 |
| Median Household Income | $56,071 | $141 |
| Monthly Housing Costs | $458 | $28 |
| Real Estate Taxes | $832 | $10 |
Property Value by Mortgage Status in Washington County
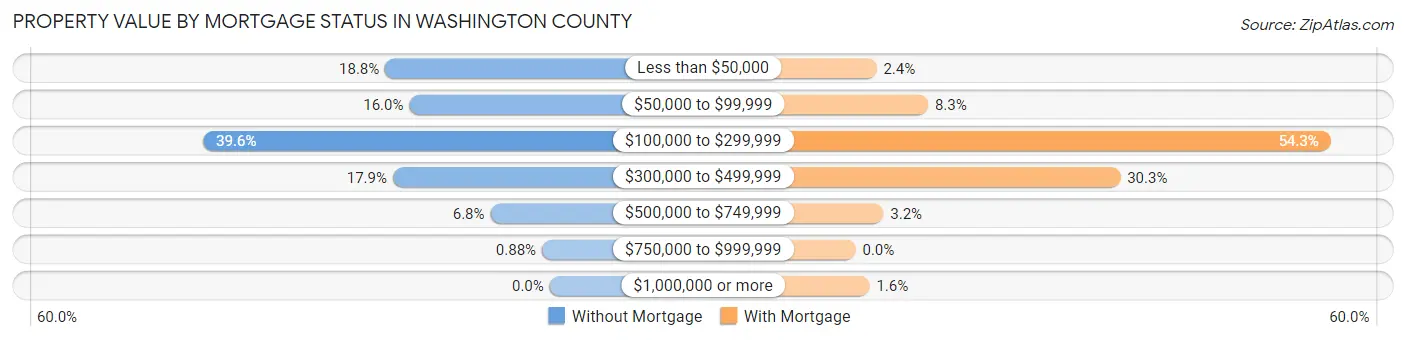
| Property Value | Without Mortgage | With Mortgage |
| Less than $50,000 | 150 (18.8%) | 15 (2.4%) |
| $50,000 to $99,999 | 128 (16.0%) | 52 (8.3%) |
| $100,000 to $299,999 | 316 (39.6%) | 341 (54.3%) |
| $300,000 to $499,999 | 143 (17.9%) | 190 (30.2%) |
| $500,000 to $749,999 | 54 (6.8%) | 20 (3.2%) |
| $750,000 to $999,999 | 7 (0.9%) | 0 (0.0%) |
| $1,000,000 or more | 0 (0.0%) | 10 (1.6%) |
| Total | 798 (100.0%) | 628 (100.0%) |
Household Income by Mortgage Status in Washington County
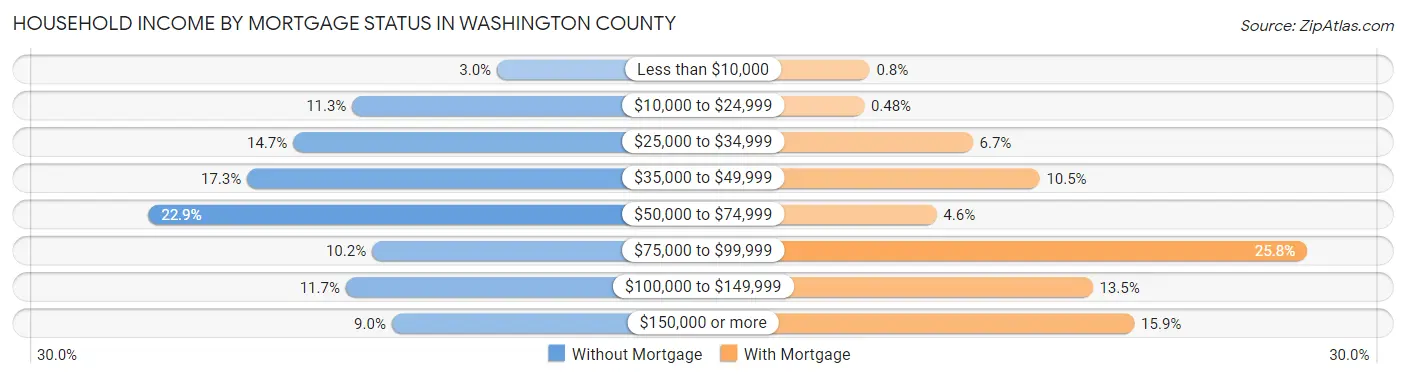
| Household Income | Without Mortgage | With Mortgage |
| Less than $10,000 | 24 (3.0%) | 5 (0.8%) |
| $10,000 to $24,999 | 90 (11.3%) | 3 (0.5%) |
| $25,000 to $34,999 | 117 (14.7%) | 42 (6.7%) |
| $35,000 to $49,999 | 138 (17.3%) | 66 (10.5%) |
| $50,000 to $74,999 | 183 (22.9%) | 29 (4.6%) |
| $75,000 to $99,999 | 81 (10.2%) | 162 (25.8%) |
| $100,000 to $149,999 | 93 (11.7%) | 85 (13.5%) |
| $150,000 or more | 72 (9.0%) | 100 (15.9%) |
| Total | 798 (100.0%) | 628 (100.0%) |
Property Value to Household Income Ratio in Washington County
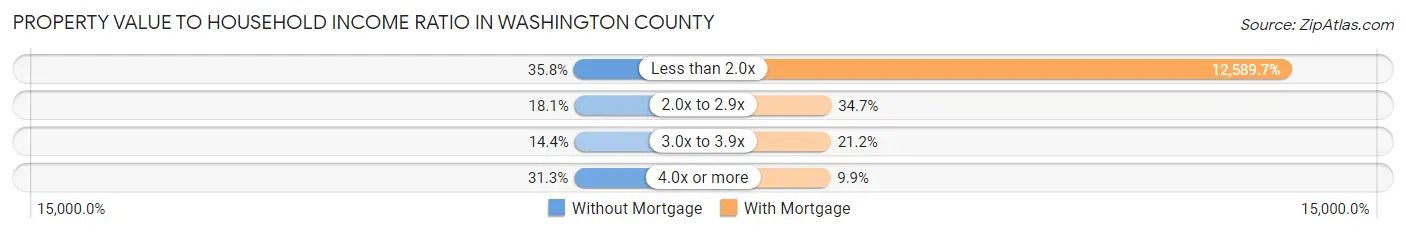
| Value-to-Income Ratio | Without Mortgage | With Mortgage |
| Less than 2.0x | 286 (35.8%) | 79,063 (12,589.7%) |
| 2.0x to 2.9x | 144 (18.0%) | 218 (34.7%) |
| 3.0x to 3.9x | 115 (14.4%) | 133 (21.2%) |
| 4.0x or more | 250 (31.3%) | 62 (9.9%) |
| Total | 798 (100.0%) | 628 (100.0%) |
Real Estate Taxes by Mortgage Status in Washington County
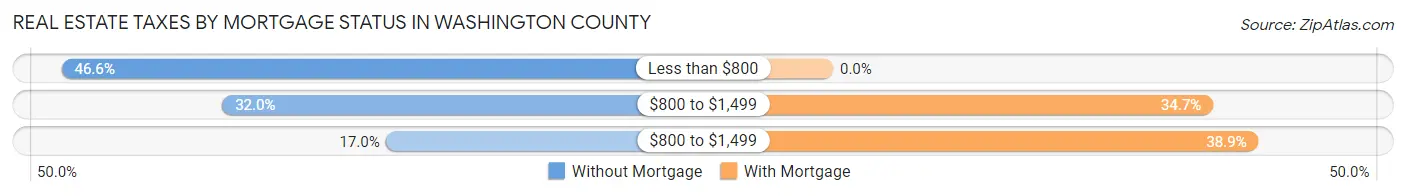
| Property Taxes | Without Mortgage | With Mortgage |
| Less than $800 | 372 (46.6%) | 0 (0.0%) |
| $800 to $1,499 | 255 (32.0%) | 218 (34.7%) |
| $800 to $1,499 | 136 (17.0%) | 244 (38.9%) |
| Total | 798 (100.0%) | 628 (100.0%) |
Health & Disability in Washington County
Health Insurance Coverage by Age in Washington County
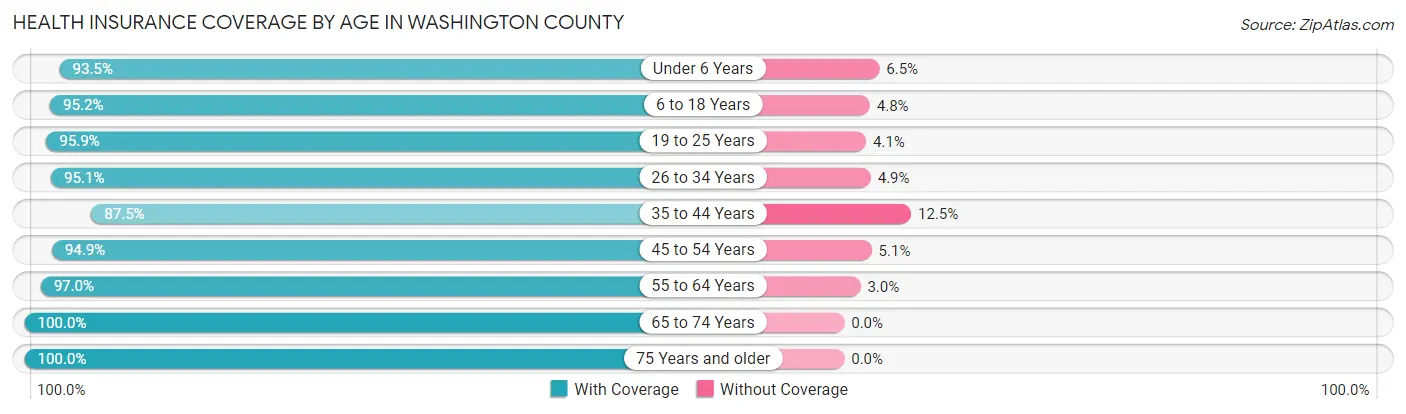
| Age Bracket | With Coverage | Without Coverage |
| Under 6 Years | 243 (93.5%) | 17 (6.5%) |
| 6 to 18 Years | 819 (95.2%) | 41 (4.8%) |
| 19 to 25 Years | 330 (95.9%) | 14 (4.1%) |
| 26 to 34 Years | 404 (95.1%) | 21 (4.9%) |
| 35 to 44 Years | 513 (87.5%) | 73 (12.5%) |
| 45 to 54 Years | 465 (94.9%) | 25 (5.1%) |
| 55 to 64 Years | 645 (97.0%) | 20 (3.0%) |
| 65 to 74 Years | 589 (100.0%) | 0 (0.0%) |
| 75 Years and older | 385 (100.0%) | 0 (0.0%) |
| Total | 4,393 (95.4%) | 211 (4.6%) |
Health Insurance Coverage by Citizenship Status in Washington County
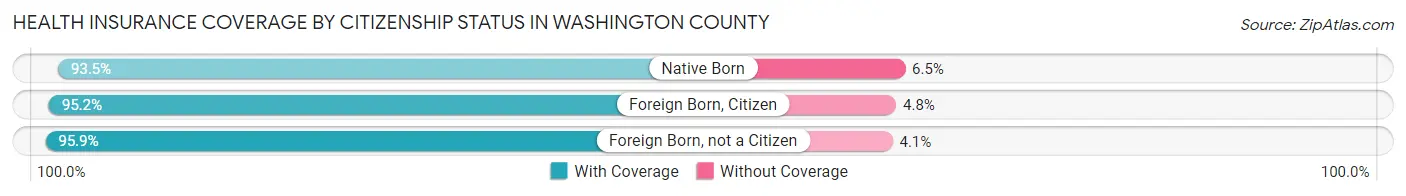
| Citizenship Status | With Coverage | Without Coverage |
| Native Born | 243 (93.5%) | 17 (6.5%) |
| Foreign Born, Citizen | 819 (95.2%) | 41 (4.8%) |
| Foreign Born, not a Citizen | 330 (95.9%) | 14 (4.1%) |
Health Insurance Coverage by Household Income in Washington County
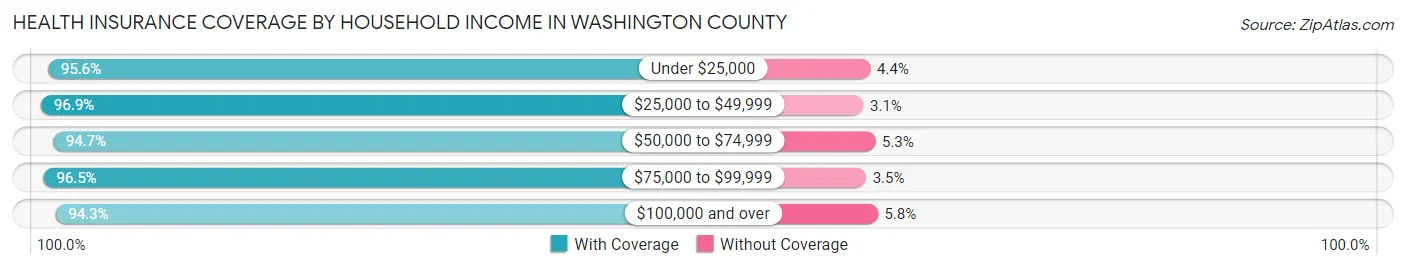
| Household Income | With Coverage | Without Coverage |
| Under $25,000 | 483 (95.6%) | 22 (4.4%) |
| $25,000 to $49,999 | 887 (96.9%) | 28 (3.1%) |
| $50,000 to $74,999 | 949 (94.7%) | 53 (5.3%) |
| $75,000 to $99,999 | 763 (96.5%) | 28 (3.5%) |
| $100,000 and over | 1,311 (94.3%) | 80 (5.8%) |
Public vs Private Health Insurance Coverage by Age in Washington County
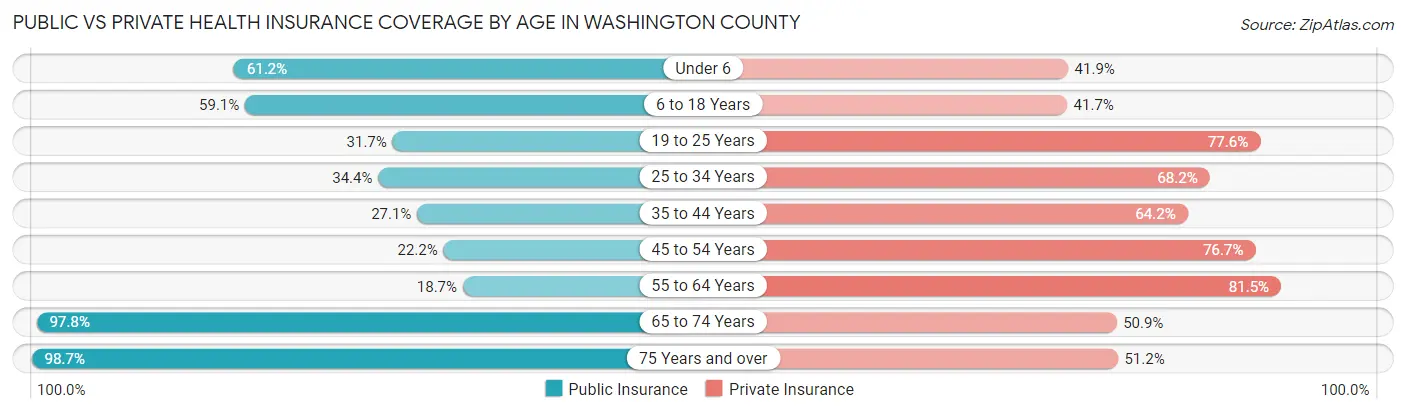
| Age Bracket | Public Insurance | Private Insurance |
| Under 6 | 159 (61.2%) | 109 (41.9%) |
| 6 to 18 Years | 508 (59.1%) | 359 (41.7%) |
| 19 to 25 Years | 109 (31.7%) | 267 (77.6%) |
| 25 to 34 Years | 146 (34.4%) | 290 (68.2%) |
| 35 to 44 Years | 159 (27.1%) | 376 (64.2%) |
| 45 to 54 Years | 109 (22.2%) | 376 (76.7%) |
| 55 to 64 Years | 124 (18.6%) | 542 (81.5%) |
| 65 to 74 Years | 576 (97.8%) | 300 (50.9%) |
| 75 Years and over | 380 (98.7%) | 197 (51.2%) |
| Total | 2,270 (49.3%) | 2,816 (61.2%) |
Disability Status by Sex by Age in Washington County
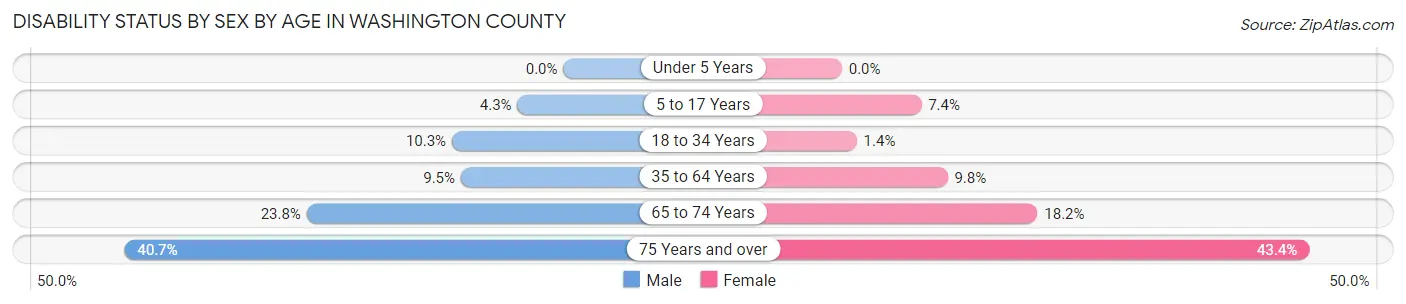
| Age Bracket | Male | Female |
| Under 5 Years | 0 (0.0%) | 0 (0.0%) |
| 5 to 17 Years | 20 (4.3%) | 28 (7.4%) |
| 18 to 34 Years | 40 (10.3%) | 6 (1.4%) |
| 35 to 64 Years | 87 (9.5%) | 81 (9.8%) |
| 65 to 74 Years | 76 (23.8%) | 49 (18.1%) |
| 75 Years and over | 77 (40.7%) | 85 (43.4%) |
Disability Class by Sex by Age in Washington County
Disability Class: Hearing Difficulty
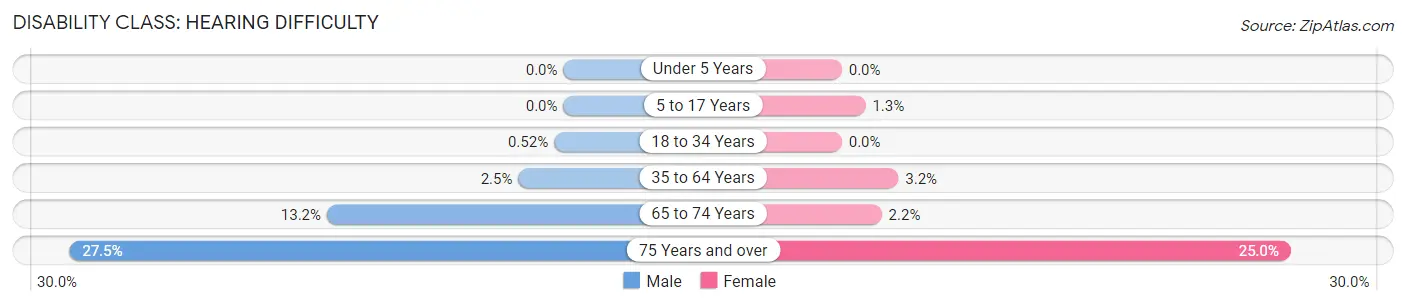
| Age Bracket | Male | Female |
| Under 5 Years | 0 (0.0%) | 0 (0.0%) |
| 5 to 17 Years | 0 (0.0%) | 5 (1.3%) |
| 18 to 34 Years | 2 (0.5%) | 0 (0.0%) |
| 35 to 64 Years | 23 (2.5%) | 26 (3.2%) |
| 65 to 74 Years | 42 (13.2%) | 6 (2.2%) |
| 75 Years and over | 52 (27.5%) | 49 (25.0%) |
Disability Class: Vision Difficulty
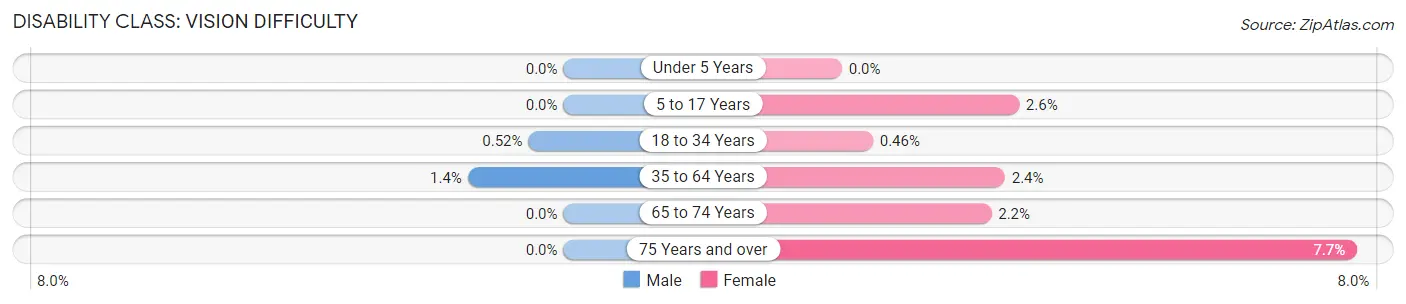
| Age Bracket | Male | Female |
| Under 5 Years | 0 (0.0%) | 0 (0.0%) |
| 5 to 17 Years | 0 (0.0%) | 10 (2.6%) |
| 18 to 34 Years | 2 (0.5%) | 2 (0.5%) |
| 35 to 64 Years | 13 (1.4%) | 20 (2.4%) |
| 65 to 74 Years | 0 (0.0%) | 6 (2.2%) |
| 75 Years and over | 0 (0.0%) | 15 (7.6%) |
Disability Class: Cognitive Difficulty
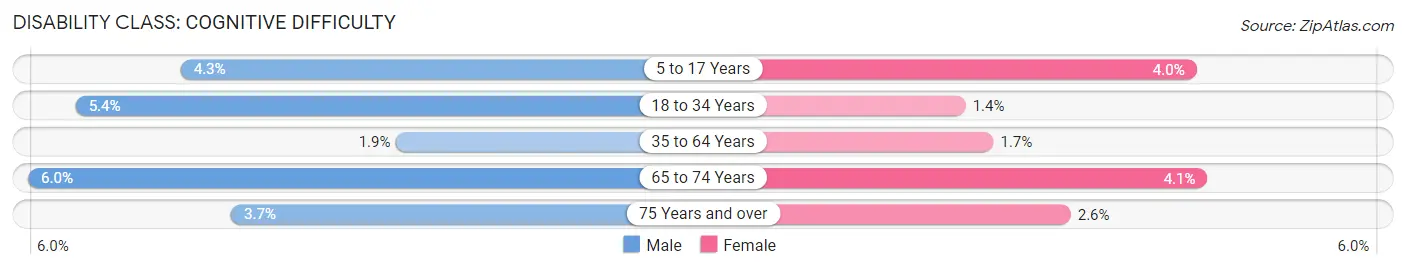
| Age Bracket | Male | Female |
| 5 to 17 Years | 20 (4.3%) | 15 (4.0%) |
| 18 to 34 Years | 21 (5.4%) | 6 (1.4%) |
| 35 to 64 Years | 17 (1.9%) | 14 (1.7%) |
| 65 to 74 Years | 19 (6.0%) | 11 (4.1%) |
| 75 Years and over | 7 (3.7%) | 5 (2.5%) |
Disability Class: Ambulatory Difficulty
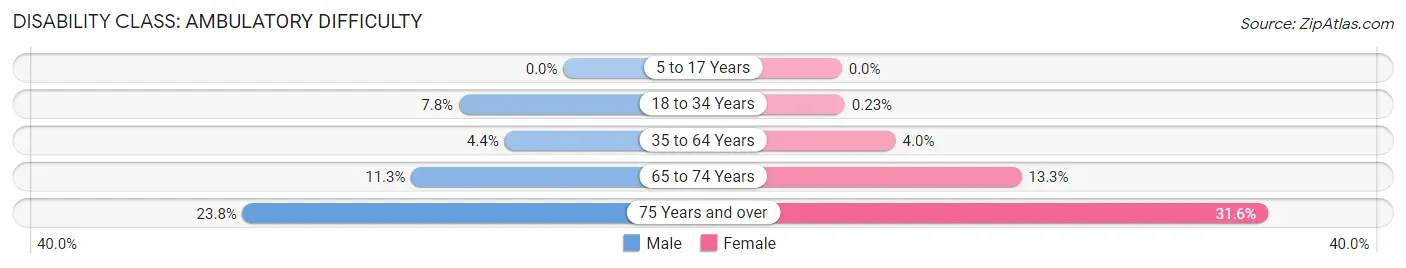
| Age Bracket | Male | Female |
| 5 to 17 Years | 0 (0.0%) | 0 (0.0%) |
| 18 to 34 Years | 30 (7.7%) | 1 (0.2%) |
| 35 to 64 Years | 40 (4.4%) | 33 (4.0%) |
| 65 to 74 Years | 36 (11.3%) | 36 (13.3%) |
| 75 Years and over | 45 (23.8%) | 62 (31.6%) |
Disability Class: Self-Care Difficulty
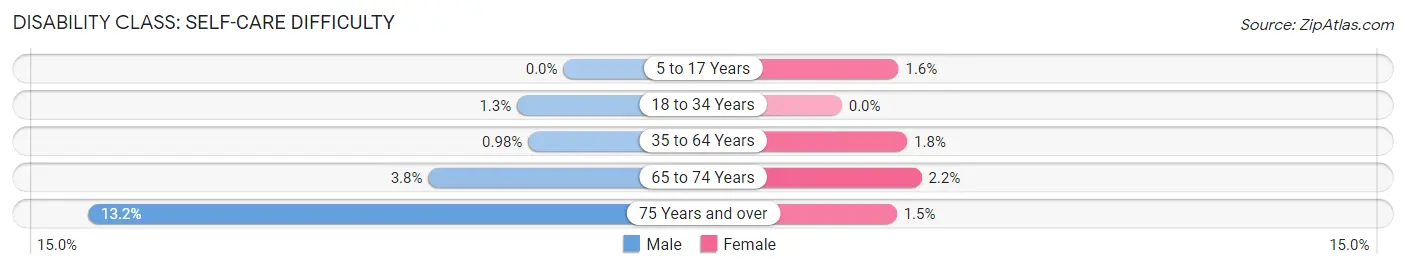
| Age Bracket | Male | Female |
| 5 to 17 Years | 0 (0.0%) | 6 (1.6%) |
| 18 to 34 Years | 5 (1.3%) | 0 (0.0%) |
| 35 to 64 Years | 9 (1.0%) | 15 (1.8%) |
| 65 to 74 Years | 12 (3.8%) | 6 (2.2%) |
| 75 Years and over | 25 (13.2%) | 3 (1.5%) |
Technology Access in Washington County
Computing Device Access in Washington County
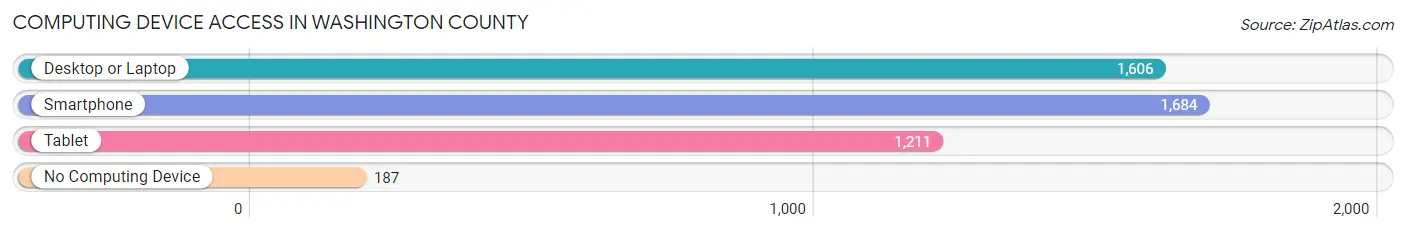
| Device Type | # Households | % Households |
| Desktop or Laptop | 1,606 | 79.1% |
| Smartphone | 1,684 | 83.0% |
| Tablet | 1,211 | 59.7% |
| No Computing Device | 187 | 9.2% |
| Total | 2,030 | 100.0% |
Internet Access in Washington County
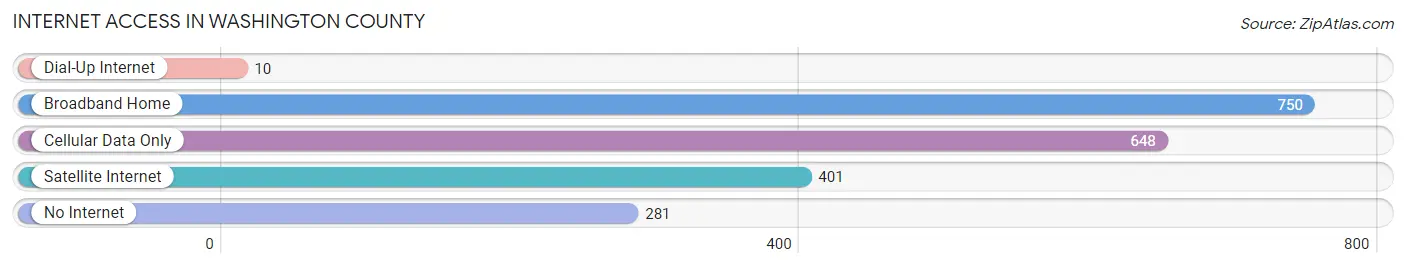
| Internet Type | # Households | % Households |
| Dial-Up Internet | 10 | 0.5% |
| Broadband Home | 750 | 36.9% |
| Cellular Data Only | 648 | 31.9% |
| Satellite Internet | 401 | 19.8% |
| No Internet | 281 | 13.8% |
| Total | 2,030 | 100.0% |
Washington County Summary
Introduction
Washington County is located in the northeastern corner of Colorado, and is the fifth least populous county in the state. It is bordered by Nebraska to the north, Wyoming to the east, and the counties of Logan, Morgan, Yuma, and Sedgwick to the south and west. The county seat is Akron, and the county is named after George Washington, the first president of the United States.
History
The area that is now Washington County was first inhabited by Native American tribes, including the Arapaho, Cheyenne, and Sioux. The first Europeans to explore the area were Spanish explorers in the late 1700s. The first permanent settlers arrived in the area in the late 1800s, and the county was officially established in 1889.
The county was initially an agricultural area, with settlers growing wheat, corn, and other crops. In the early 1900s, the county began to develop its oil and gas industry, which has since become the main economic driver in the area.
Geography
Washington County is located in the northeastern corner of Colorado, and covers an area of 1,845 square miles. The county is mostly flat, with some rolling hills in the western part of the county. The county is home to several rivers, including the South Platte River, the North Platte River, and the Republican River.
The county is home to several state parks, including the Pawnee National Grassland, the South Platte River State Wildlife Area, and the North Platte River State Wildlife Area. The county is also home to several wildlife refuges, including the Pawnee National Grassland, the South Platte River National Wildlife Refuge, and the North Platte River National Wildlife Refuge.
Economy
Washington County’s economy is largely driven by the oil and gas industry. The county is home to several oil and gas companies, including Anadarko Petroleum Corporation, Chevron Corporation, and ConocoPhillips. The county is also home to several agricultural businesses, including cattle ranches, wheat farms, and corn farms.
The county is also home to several manufacturing businesses, including a plastics factory, a furniture factory, and a metal fabrication plant. The county is also home to several retail businesses, including grocery stores, clothing stores, and restaurants.
Demographics
As of the 2010 census, the population of Washington County was 4,814. The population is largely white (93.3%), with small percentages of Hispanic (2.7%), African American (1.2%), and Native American (0.7%) residents. The median household income in the county is $45,813, and the median home value is $128,400.
Conclusion
Washington County is located in the northeastern corner of Colorado, and is the fifth least populous county in the state. The county is largely driven by the oil and gas industry, and is also home to several agricultural businesses, manufacturing businesses, and retail businesses. The population of the county is largely white, with small percentages of Hispanic, African American, and Native American residents.
Common Questions
What is Per Capita Income in Washington County?
Per Capita income in Washington County is $33,374.
What is the Median Family Income in Washington County?
Median Family Income in Washington County is $69,648.
What is the Median Household income in Washington County?
Median Household Income in Washington County is $59,087.
What is Income or Wage Gap in Washington County?
Income or Wage Gap in Washington County is 33.1%.
Women in Washington County earn 66.9 cents for every dollar earned by a man.
What is Inequality or Gini Index in Washington County?
Inequality or Gini Index in Washington County is 0.43.
What is the Total Population of Washington County?
Total Population of Washington County is 4,817.
What is the Total Male Population of Washington County?
Total Male Population of Washington County is 2,547.
What is the Total Female Population of Washington County?
Total Female Population of Washington County is 2,270.
What is the Ratio of Males per 100 Females in Washington County?
There are 112.20 Males per 100 Females in Washington County.
What is the Ratio of Females per 100 Males in Washington County?
There are 89.12 Females per 100 Males in Washington County.
What is the Median Population Age in Washington County?
Median Population Age in Washington County is 40.2 Years.
What is the Average Family Size in Washington County
Average Family Size in Washington County is 2.8 People.
What is the Average Household Size in Washington County
Average Household Size in Washington County is 2.3 People.
How Large is the Labor Force in Washington County?
There are 2,367 People in the Labor Forcein in Washington County.
What is the Percentage of People in the Labor Force in Washington County?
60.9% of People are in the Labor Force in Washington County.
What is the Unemployment Rate in Washington County?
Unemployment Rate in Washington County is 3.5%.