Sedgwick County, CO Map & Demographics
Sedgwick County Map
Sedgwick County Overview
$32,776
PER CAPITA INCOME
$72,031
AVG FAMILY INCOME
$45,855
AVG HOUSEHOLD INCOME
23.6%
WAGE / INCOME GAP [ % ]
76.4¢/ $1
WAGE / INCOME GAP [ $ ]
0.50
INEQUALITY / GINI INDEX
2,391
TOTAL POPULATION
1,208
MALE POPULATION
1,183
FEMALE POPULATION
102.11
MALES / 100 FEMALES
97.93
FEMALES / 100 MALES
44.5
MEDIAN AGE
3.1
AVG FAMILY SIZE
2.2
AVG HOUSEHOLD SIZE
1,111
LABOR FORCE [ PEOPLE ]
57.5%
PERCENT IN LABOR FORCE
3.3%
UNEMPLOYMENT RATE
Sedgwick County Area Codes
Income in Sedgwick County
Income Overview in Sedgwick County
Per Capita Income in Sedgwick County is $32,776, while median incomes of families and households are $72,031 and $45,855 respectively.
| Characteristic | Number | Measure |
| Per Capita Income | 2,391 | $32,776 |
| Median Family Income | 585 | $72,031 |
| Mean Family Income | 585 | $91,762 |
| Median Household Income | 1,049 | $45,855 |
| Mean Household Income | 1,049 | $70,610 |
| Income Deficit | 585 | $0 |
| Wage / Income Gap (%) | 2,391 | 23.61% |
| Wage / Income Gap ($) | 2,391 | 76.39¢ per $1 |
| Gini / Inequality Index | 2,391 | 0.50 |
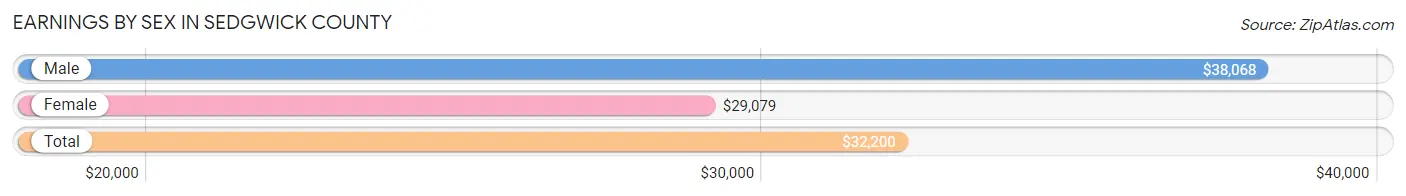
Earnings by Sex in Sedgwick County
Average Earnings in Sedgwick County are $32,200, $38,068 for men and $29,079 for women, a difference of 23.6%.
| Sex | Number | Average Earnings |
| Male | 634 (52.5%) | $38,068 |
| Female | 574 (47.5%) | $29,079 |
| Total | 1,208 (100.0%) | $32,200 |
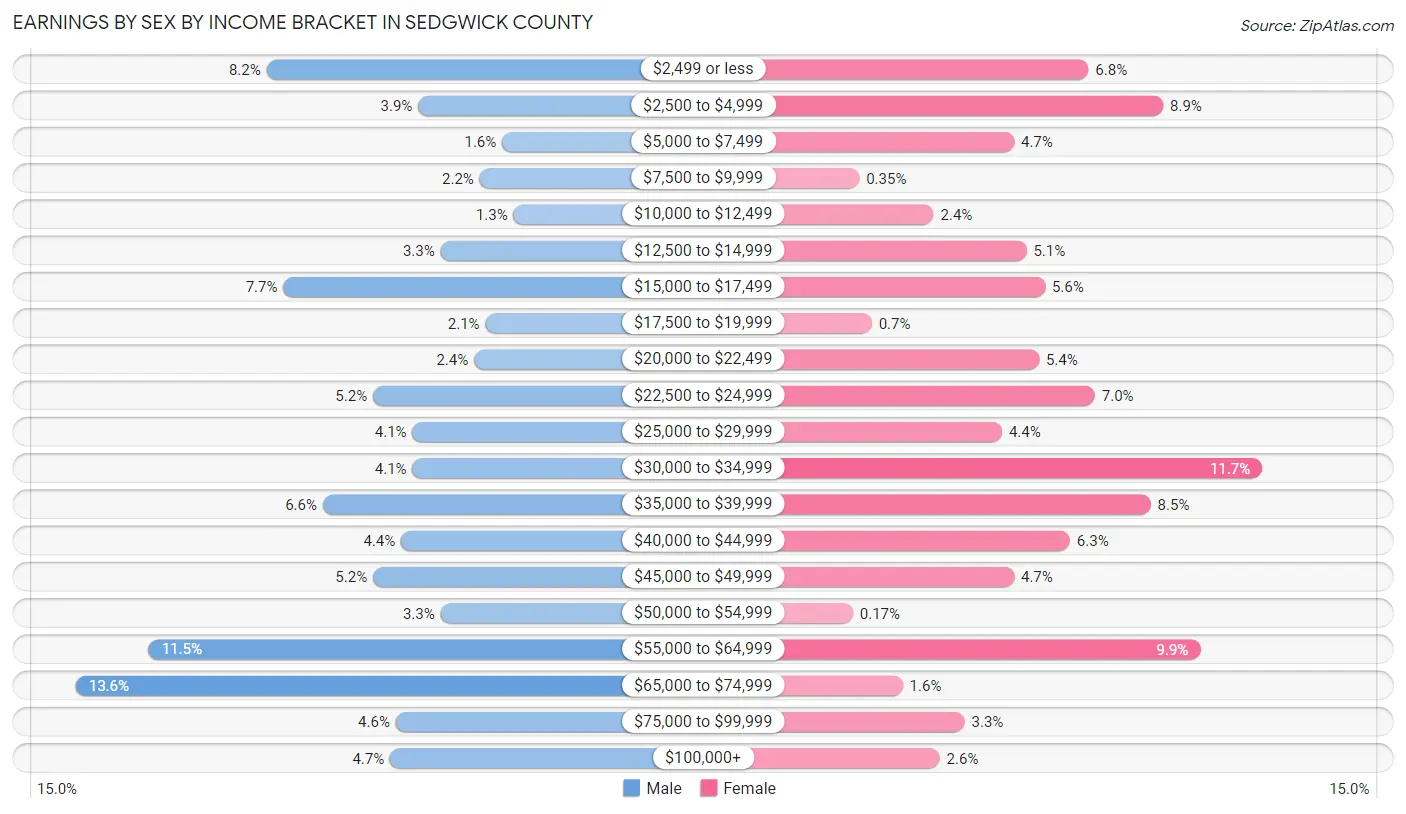
Earnings by Sex by Income Bracket in Sedgwick County
The most common earnings brackets in Sedgwick County are $65,000 to $74,999 for men (86 | 13.6%) and $30,000 to $34,999 for women (67 | 11.7%).
| Income | Male | Female |
| $2,499 or less | 52 (8.2%) | 39 (6.8%) |
| $2,500 to $4,999 | 25 (3.9%) | 51 (8.9%) |
| $5,000 to $7,499 | 10 (1.6%) | 27 (4.7%) |
| $7,500 to $9,999 | 14 (2.2%) | 2 (0.4%) |
| $10,000 to $12,499 | 8 (1.3%) | 14 (2.4%) |
| $12,500 to $14,999 | 21 (3.3%) | 29 (5.1%) |
| $15,000 to $17,499 | 49 (7.7%) | 32 (5.6%) |
| $17,500 to $19,999 | 13 (2.1%) | 4 (0.7%) |
| $20,000 to $22,499 | 15 (2.4%) | 31 (5.4%) |
| $22,500 to $24,999 | 33 (5.2%) | 40 (7.0%) |
| $25,000 to $29,999 | 26 (4.1%) | 25 (4.4%) |
| $30,000 to $34,999 | 26 (4.1%) | 67 (11.7%) |
| $35,000 to $39,999 | 42 (6.6%) | 49 (8.5%) |
| $40,000 to $44,999 | 28 (4.4%) | 36 (6.3%) |
| $45,000 to $49,999 | 33 (5.2%) | 27 (4.7%) |
| $50,000 to $54,999 | 21 (3.3%) | 1 (0.2%) |
| $55,000 to $64,999 | 73 (11.5%) | 57 (9.9%) |
| $65,000 to $74,999 | 86 (13.6%) | 9 (1.6%) |
| $75,000 to $99,999 | 29 (4.6%) | 19 (3.3%) |
| $100,000+ | 30 (4.7%) | 15 (2.6%) |
| Total | 634 (100.0%) | 574 (100.0%) |
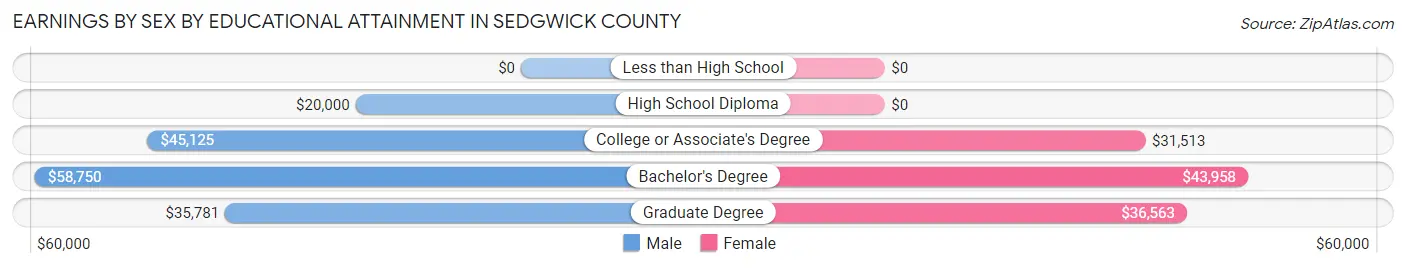
Earnings by Sex by Educational Attainment in Sedgwick County
Average earnings in Sedgwick County are $41,522 for men and $30,852 for women, a difference of 25.7%. Men with an educational attainment of bachelor's degree enjoy the highest average annual earnings of $58,750, while those with high school diploma education earn the least with $20,000. Women with an educational attainment of bachelor's degree earn the most with the average annual earnings of $43,958, while those with college or associate's degree education have the smallest earnings of $31,513.
| Educational Attainment | Male Income | Female Income |
| Less than High School | - | - |
| High School Diploma | $20,000 | $0 |
| College or Associate's Degree | $45,125 | $31,513 |
| Bachelor's Degree | $58,750 | $43,958 |
| Graduate Degree | $35,781 | $36,563 |
| Total | $41,522 | $30,852 |
Family Income in Sedgwick County
Family Income Brackets in Sedgwick County
According to the Sedgwick County family income data, there are 162 families falling into the $100,000 to $149,999 income range, which is the most common income bracket and makes up 27.7% of all families. Conversely, the $10,000 to $14,999 income bracket is the least frequent group with only 6 families (1.0%) belonging to this category.
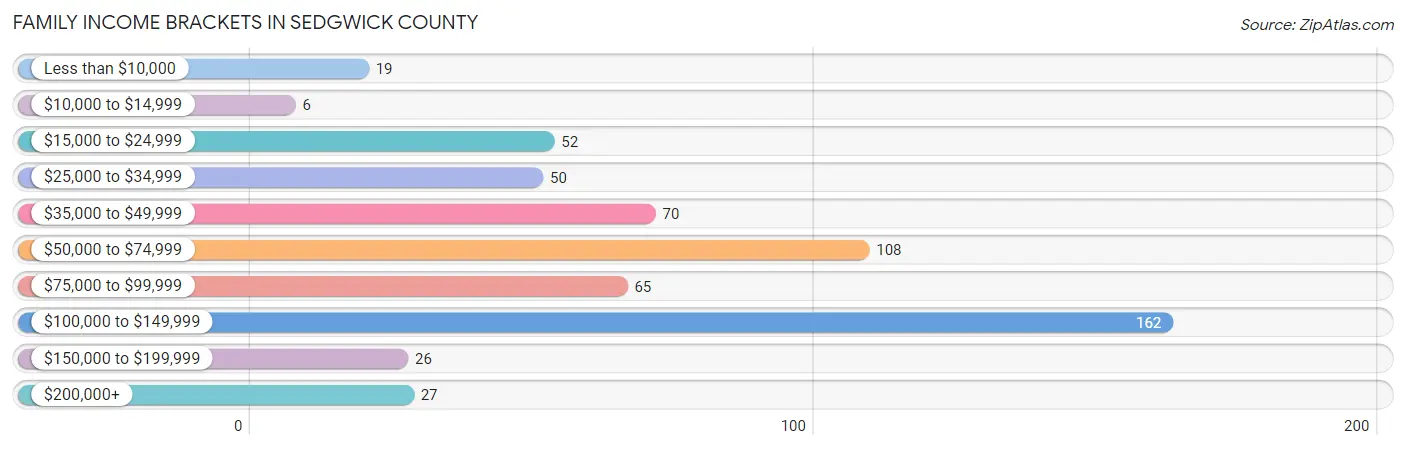
| Income Bracket | # Families | % Families |
| Less than $10,000 | 19 | 3.2% |
| $10,000 to $14,999 | 6 | 1.0% |
| $15,000 to $24,999 | 52 | 8.9% |
| $25,000 to $34,999 | 50 | 8.5% |
| $35,000 to $49,999 | 70 | 12.0% |
| $50,000 to $74,999 | 108 | 18.5% |
| $75,000 to $99,999 | 65 | 11.1% |
| $100,000 to $149,999 | 162 | 27.7% |
| $150,000 to $199,999 | 26 | 4.4% |
| $200,000+ | 27 | 4.6% |
Family Income by Famaliy Size in Sedgwick County
4-person families (105 | 17.9%) account for the highest median family income in Sedgwick County with $121,806 per family, while 2-person families (320 | 54.7%) have the highest median income of $33,552 per family member.
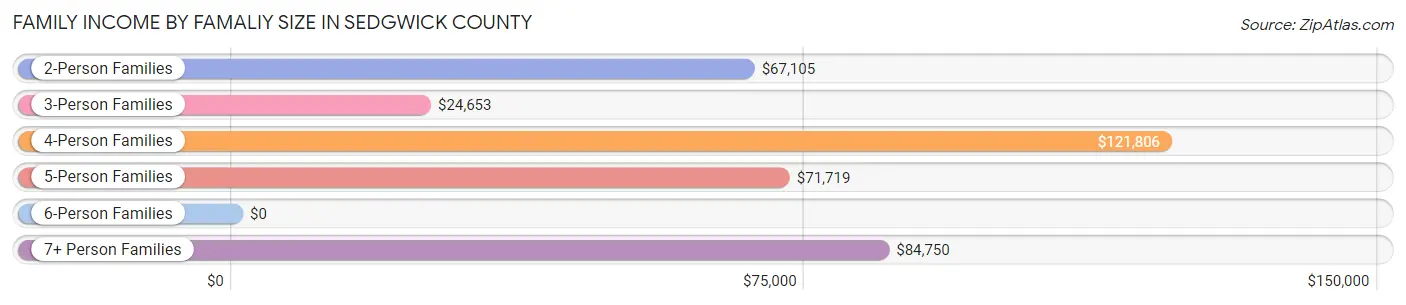
| Income Bracket | # Families | Median Income |
| 2-Person Families | 320 (54.7%) | $67,105 |
| 3-Person Families | 103 (17.6%) | $24,653 |
| 4-Person Families | 105 (17.9%) | $121,806 |
| 5-Person Families | 23 (3.9%) | $71,719 |
| 6-Person Families | 17 (2.9%) | $0 |
| 7+ Person Families | 17 (2.9%) | $84,750 |
| Total | 585 (100.0%) | $72,031 |
Family Income by Number of Earners in Sedgwick County
The median family income in Sedgwick County is $72,031, with families comprising 3+ earners (39) having the highest median family income of $122,083, while families with no earners (127) have the lowest median family income of $41,375, accounting for 6.7% and 21.7% of families, respectively.

| Number of Earners | # Families | Median Income |
| No Earners | 127 (21.7%) | $41,375 |
| 1 Earner | 170 (29.1%) | $44,167 |
| 2 Earners | 249 (42.6%) | $111,058 |
| 3+ Earners | 39 (6.7%) | $122,083 |
| Total | 585 (100.0%) | $72,031 |
Household Income in Sedgwick County
Household Income Brackets in Sedgwick County
With 174 households falling in the category, the $15,000 to $24,999 income range is the most frequent in Sedgwick County, accounting for 16.6% of all households. In contrast, only 28 households (2.7%) fall into the $150,000 to $199,999 income bracket, making it the least populous group.
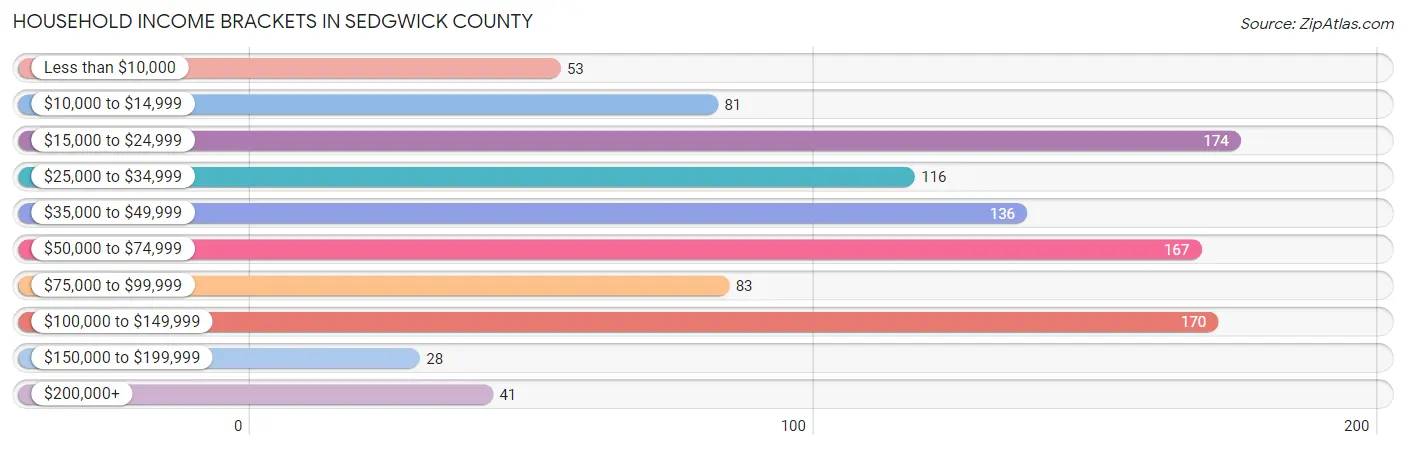
| Income Bracket | # Households | % Households |
| Less than $10,000 | 53 | 5.1% |
| $10,000 to $14,999 | 81 | 7.7% |
| $15,000 to $24,999 | 174 | 16.6% |
| $25,000 to $34,999 | 116 | 11.1% |
| $35,000 to $49,999 | 136 | 13.0% |
| $50,000 to $74,999 | 167 | 15.9% |
| $75,000 to $99,999 | 83 | 7.9% |
| $100,000 to $149,999 | 170 | 16.2% |
| $150,000 to $199,999 | 28 | 2.7% |
| $200,000+ | 41 | 3.9% |
Household Income by Householder Age in Sedgwick County
The median household income in Sedgwick County is $45,855, with the highest median household income of $65,208 found in the 25 to 44 years age bracket for the primary householder. A total of 265 households (25.3%) fall into this category. Meanwhile, the 15 to 24 years age bracket for the primary householder has the lowest median household income of $36,875, with 42 households (4.0%) in this group.
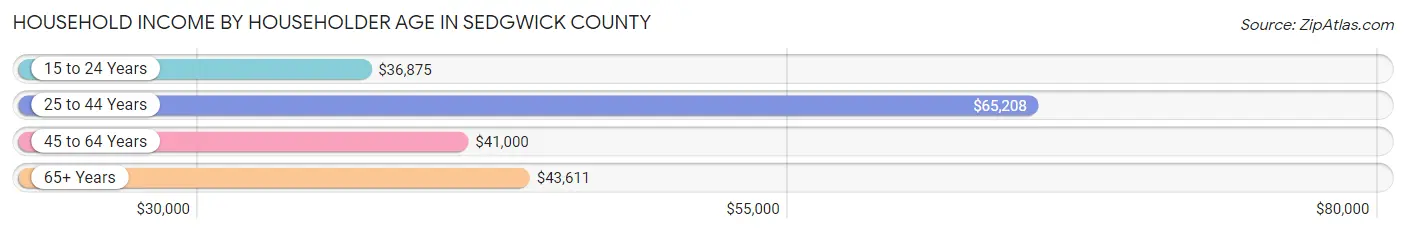
| Income Bracket | # Households | Median Income |
| 15 to 24 Years | 42 (4.0%) | $36,875 |
| 25 to 44 Years | 265 (25.3%) | $65,208 |
| 45 to 64 Years | 360 (34.3%) | $41,000 |
| 65+ Years | 382 (36.4%) | $43,611 |
| Total | 1,049 (100.0%) | $45,855 |
Poverty in Sedgwick County
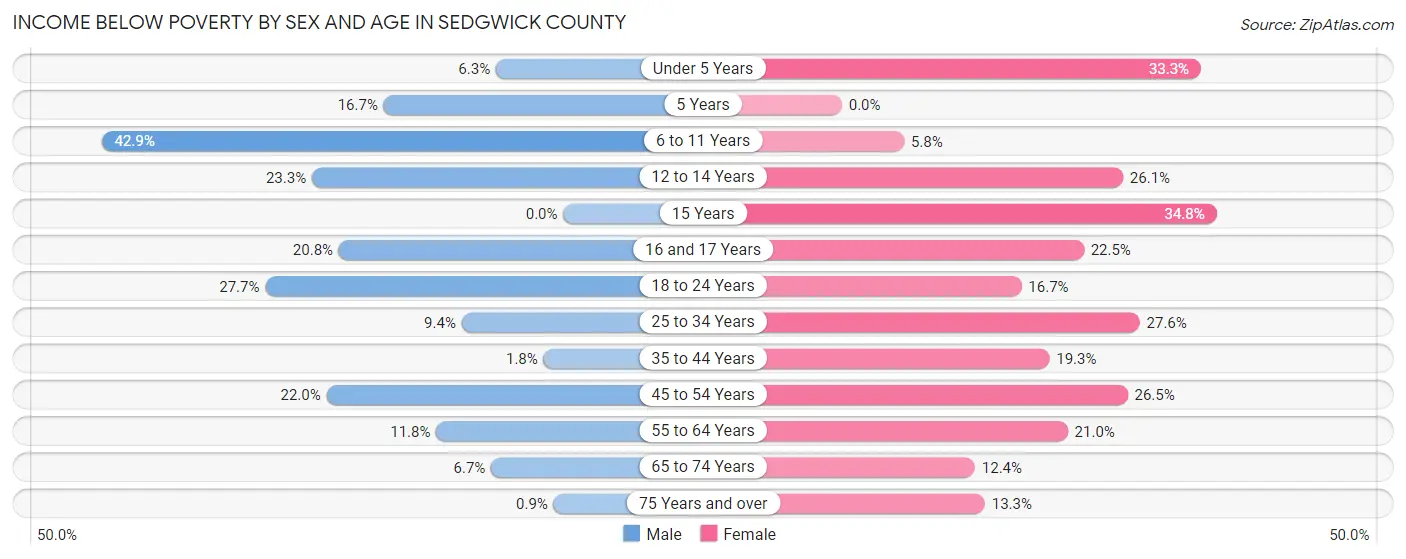
Income Below Poverty by Sex and Age in Sedgwick County
With 12.1% poverty level for males and 20.2% for females among the residents of Sedgwick County, 6 to 11 year old males and 15 year old females are the most vulnerable to poverty, with 30 males (42.9%) and 8 females (34.8%) in their respective age groups living below the poverty level.
| Age Bracket | Male | Female |
| Under 5 Years | 7 (6.2%) | 26 (33.3%) |
| 5 Years | 1 (16.7%) | 0 (0.0%) |
| 6 to 11 Years | 30 (42.9%) | 3 (5.8%) |
| 12 to 14 Years | 7 (23.3%) | 12 (26.1%) |
| 15 Years | 0 (0.0%) | 8 (34.8%) |
| 16 and 17 Years | 5 (20.8%) | 11 (22.5%) |
| 18 to 24 Years | 26 (27.7%) | 8 (16.7%) |
| 25 to 34 Years | 10 (9.4%) | 34 (27.6%) |
| 35 to 44 Years | 3 (1.8%) | 26 (19.3%) |
| 45 to 54 Years | 20 (22.0%) | 35 (26.5%) |
| 55 to 64 Years | 23 (11.8%) | 35 (21.0%) |
| 65 to 74 Years | 12 (6.7%) | 21 (12.3%) |
| 75 Years and over | 1 (0.9%) | 15 (13.3%) |
| Total | 145 (12.1%) | 234 (20.2%) |
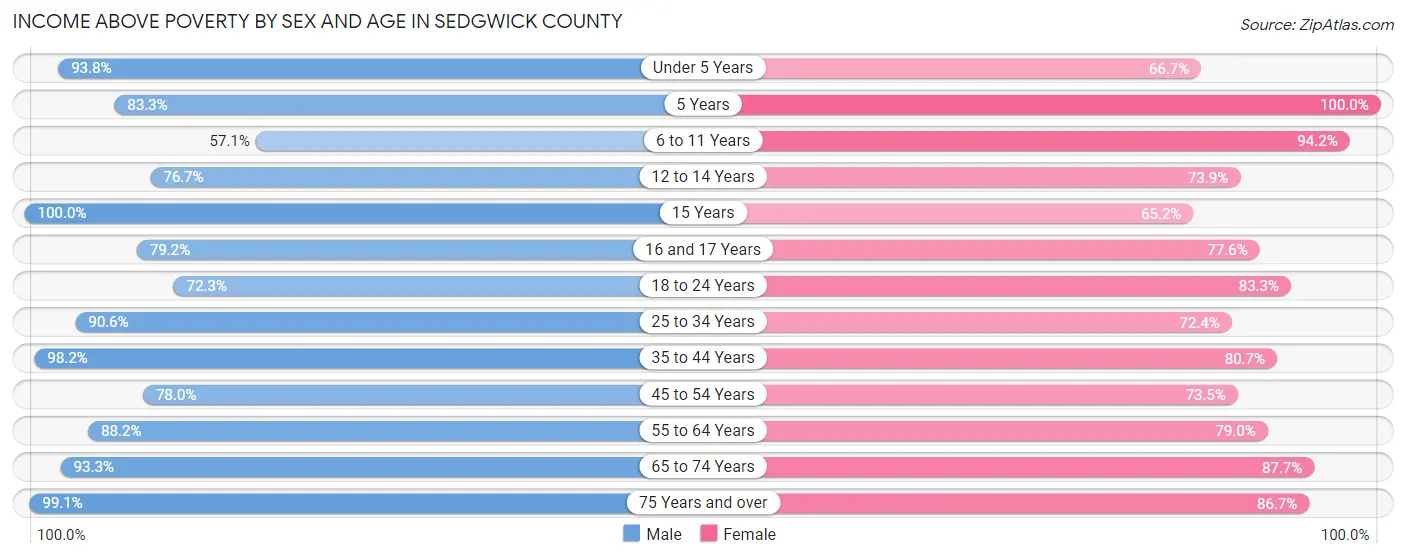
Income Above Poverty by Sex and Age in Sedgwick County
According to the poverty statistics in Sedgwick County, males aged 15 years and females aged 5 years are the age groups that are most secure financially, with 100.0% of males and 100.0% of females in these age groups living above the poverty line.
| Age Bracket | Male | Female |
| Under 5 Years | 105 (93.8%) | 52 (66.7%) |
| 5 Years | 5 (83.3%) | 23 (100.0%) |
| 6 to 11 Years | 40 (57.1%) | 49 (94.2%) |
| 12 to 14 Years | 23 (76.7%) | 34 (73.9%) |
| 15 Years | 18 (100.0%) | 15 (65.2%) |
| 16 and 17 Years | 19 (79.2%) | 38 (77.5%) |
| 18 to 24 Years | 68 (72.3%) | 40 (83.3%) |
| 25 to 34 Years | 96 (90.6%) | 89 (72.4%) |
| 35 to 44 Years | 161 (98.2%) | 109 (80.7%) |
| 45 to 54 Years | 71 (78.0%) | 97 (73.5%) |
| 55 to 64 Years | 172 (88.2%) | 132 (79.0%) |
| 65 to 74 Years | 167 (93.3%) | 149 (87.6%) |
| 75 Years and over | 110 (99.1%) | 98 (86.7%) |
| Total | 1,055 (87.9%) | 925 (79.8%) |
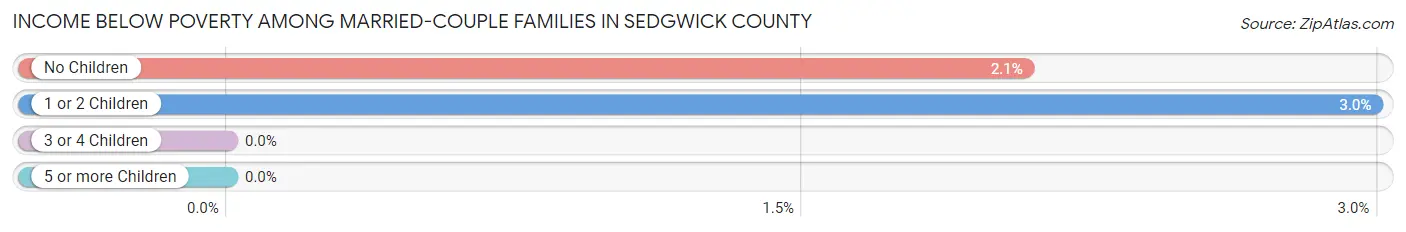
Income Below Poverty Among Married-Couple Families in Sedgwick County
The poverty statistics for married-couple families in Sedgwick County show that 2.2% or 10 of the total 459 families live below the poverty line. Families with 1 or 2 children have the highest poverty rate of 3.0%, comprising of 4 families. On the other hand, families with 3 or 4 children have the lowest poverty rate of 0.0%, which includes 0 families.
| Children | Above Poverty | Below Poverty |
| No Children | 283 (97.9%) | 6 (2.1%) |
| 1 or 2 Children | 130 (97.0%) | 4 (3.0%) |
| 3 or 4 Children | 31 (100.0%) | 0 (0.0%) |
| 5 or more Children | 5 (100.0%) | 0 (0.0%) |
| Total | 449 (97.8%) | 10 (2.2%) |
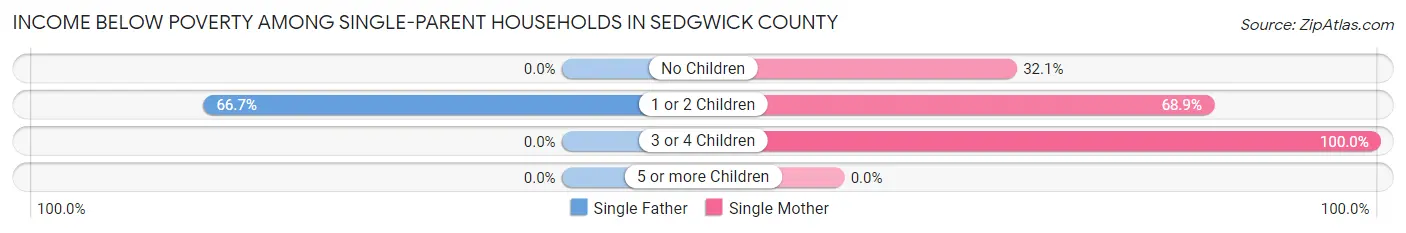
Income Below Poverty Among Single-Parent Households in Sedgwick County
According to the poverty data in Sedgwick County, 9.1% or 2 single-father households and 59.6% or 62 single-mother households are living below the poverty line. Among single-father households, those with 1 or 2 children have the highest poverty rate, with 2 households (66.7%) experiencing poverty. Likewise, among single-mother households, those with 3 or 4 children have the highest poverty rate, with 2 households (100.0%) falling below the poverty line.
| Children | Single Father | Single Mother |
| No Children | 0 (0.0%) | 9 (32.1%) |
| 1 or 2 Children | 2 (66.7%) | 51 (68.9%) |
| 3 or 4 Children | 0 (0.0%) | 2 (100.0%) |
| 5 or more Children | 0 (0.0%) | 0 (0.0%) |
| Total | 2 (9.1%) | 62 (59.6%) |
Income Below Poverty Among Married-Couple vs Single-Parent Households in Sedgwick County
The poverty data for Sedgwick County shows that 10 of the married-couple family households (2.2%) and 64 of the single-parent households (50.8%) are living below the poverty level. Within the married-couple family households, those with 1 or 2 children have the highest poverty rate, with 4 households (3.0%) falling below the poverty line. Among the single-parent households, those with 3 or 4 children have the highest poverty rate, with 2 household (100.0%) living below poverty.
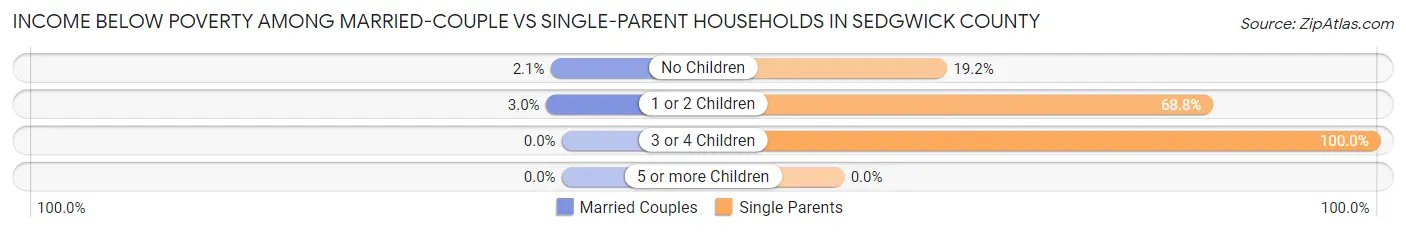
| Children | Married-Couple Families | Single-Parent Households |
| No Children | 6 (2.1%) | 9 (19.2%) |
| 1 or 2 Children | 4 (3.0%) | 53 (68.8%) |
| 3 or 4 Children | 0 (0.0%) | 2 (100.0%) |
| 5 or more Children | 0 (0.0%) | 0 (0.0%) |
| Total | 10 (2.2%) | 64 (50.8%) |
Race in Sedgwick County
The most populous races in Sedgwick County are White / Caucasian (2,067 | 86.5%), Hispanic or Latino (465 | 19.5%), and Two or more Races (186 | 7.8%).
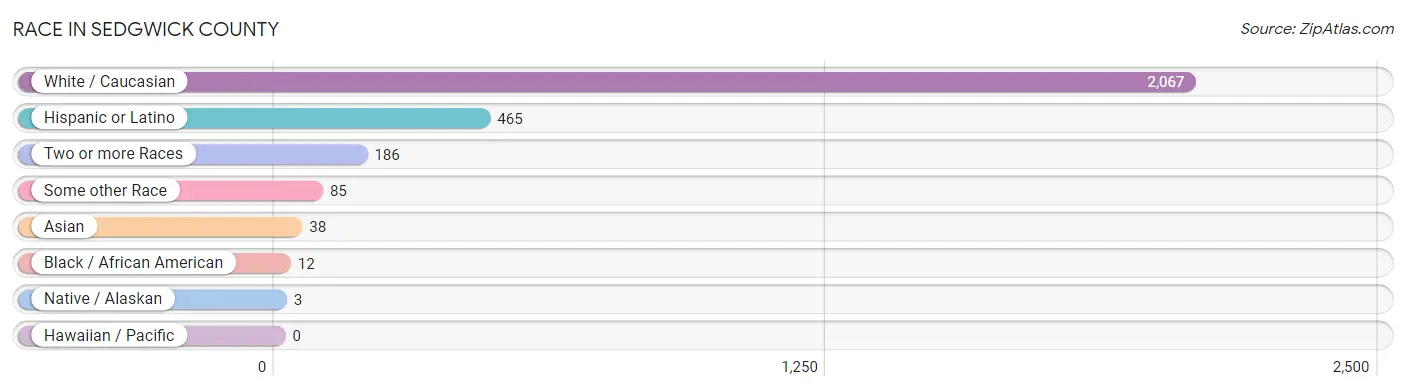
| Race | # Population | % Population |
| Asian | 38 | 1.6% |
| Black / African American | 12 | 0.5% |
| Hawaiian / Pacific | 0 | 0.0% |
| Hispanic or Latino | 465 | 19.5% |
| Native / Alaskan | 3 | 0.1% |
| White / Caucasian | 2,067 | 86.5% |
| Two or more Races | 186 | 7.8% |
| Some other Race | 85 | 3.5% |
| Total | 2,391 | 100.0% |
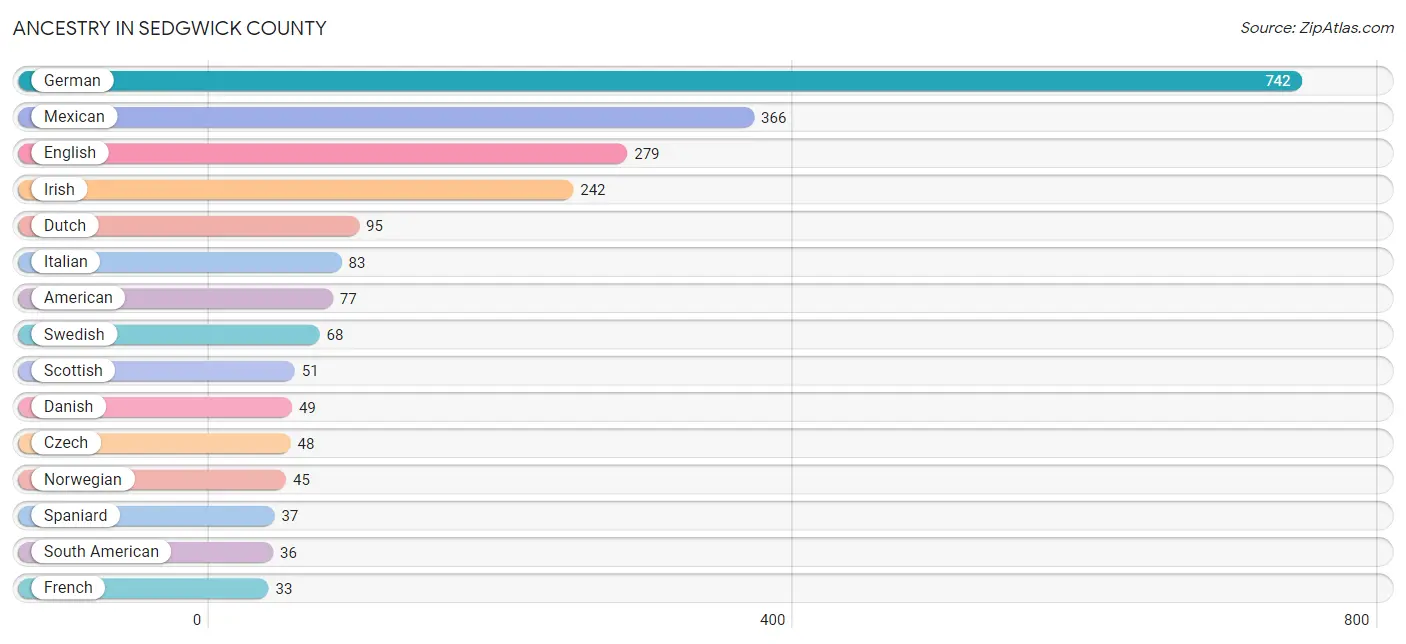
Ancestry in Sedgwick County
The most populous ancestries reported in Sedgwick County are German (742 | 31.0%), Mexican (366 | 15.3%), English (279 | 11.7%), Irish (242 | 10.1%), and Dutch (95 | 4.0%), together accounting for 72.1% of all Sedgwick County residents.
| Ancestry | # Population | % Population |
| American | 77 | 3.2% |
| Apache | 14 | 0.6% |
| Bhutanese | 28 | 1.2% |
| British | 4 | 0.2% |
| Burmese | 13 | 0.5% |
| Canadian | 4 | 0.2% |
| Central American | 1 | 0.0% |
| Cherokee | 23 | 1.0% |
| Chickasaw | 18 | 0.7% |
| Cuban | 4 | 0.2% |
| Czech | 48 | 2.0% |
| Czechoslovakian | 6 | 0.3% |
| Danish | 49 | 2.1% |
| Dutch | 95 | 4.0% |
| Eastern European | 1 | 0.0% |
| English | 279 | 11.7% |
| European | 13 | 0.5% |
| French | 33 | 1.4% |
| French Canadian | 13 | 0.5% |
| German | 742 | 31.0% |
| German Russian | 1 | 0.0% |
| Indian (Asian) | 15 | 0.6% |
| Irish | 242 | 10.1% |
| Italian | 83 | 3.5% |
| Korean | 5 | 0.2% |
| Mexican | 366 | 15.3% |
| Navajo | 14 | 0.6% |
| Nicaraguan | 1 | 0.0% |
| Norwegian | 45 | 1.9% |
| Paraguayan | 5 | 0.2% |
| Polish | 15 | 0.6% |
| Puerto Rican | 19 | 0.8% |
| Romanian | 7 | 0.3% |
| Russian | 6 | 0.3% |
| Scandinavian | 14 | 0.6% |
| Scotch-Irish | 19 | 0.8% |
| Scottish | 51 | 2.1% |
| Slavic | 2 | 0.1% |
| South American | 36 | 1.5% |
| Spaniard | 37 | 1.5% |
| Swedish | 68 | 2.8% |
| Venezuelan | 31 | 1.3% |
| Welsh | 9 | 0.4% |
| Yugoslavian | 3 | 0.1% | View All 44 Rows |
Immigrants in Sedgwick County
The most numerous immigrant groups reported in Sedgwick County came from Latin America (79 | 3.3%), Central America (49 | 2.1%), Mexico (48 | 2.0%), South America (30 | 1.3%), and Venezuela (27 | 1.1%), together accounting for 9.7% of all Sedgwick County residents.
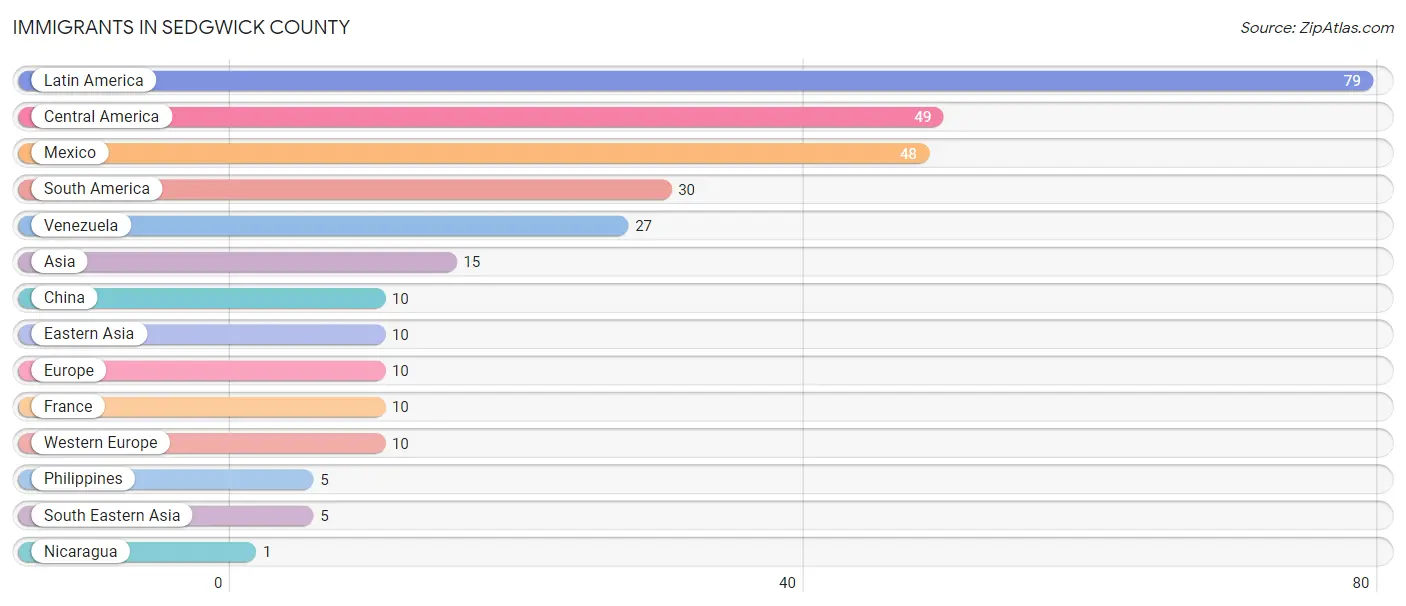
| Immigration Origin | # Population | % Population |
| Asia | 15 | 0.6% |
| Central America | 49 | 2.1% |
| China | 10 | 0.4% |
| Eastern Asia | 10 | 0.4% |
| Europe | 10 | 0.4% |
| France | 10 | 0.4% |
| Latin America | 79 | 3.3% |
| Mexico | 48 | 2.0% |
| Nicaragua | 1 | 0.0% |
| Philippines | 5 | 0.2% |
| South America | 30 | 1.3% |
| South Eastern Asia | 5 | 0.2% |
| Venezuela | 27 | 1.1% |
| Western Europe | 10 | 0.4% | View All 14 Rows |
Sex and Age in Sedgwick County
Sex and Age in Sedgwick County
The most populous age groups in Sedgwick County are Under 5 Years (112 | 9.3%) for men and 65 to 69 Years (105 | 8.9%) for women.
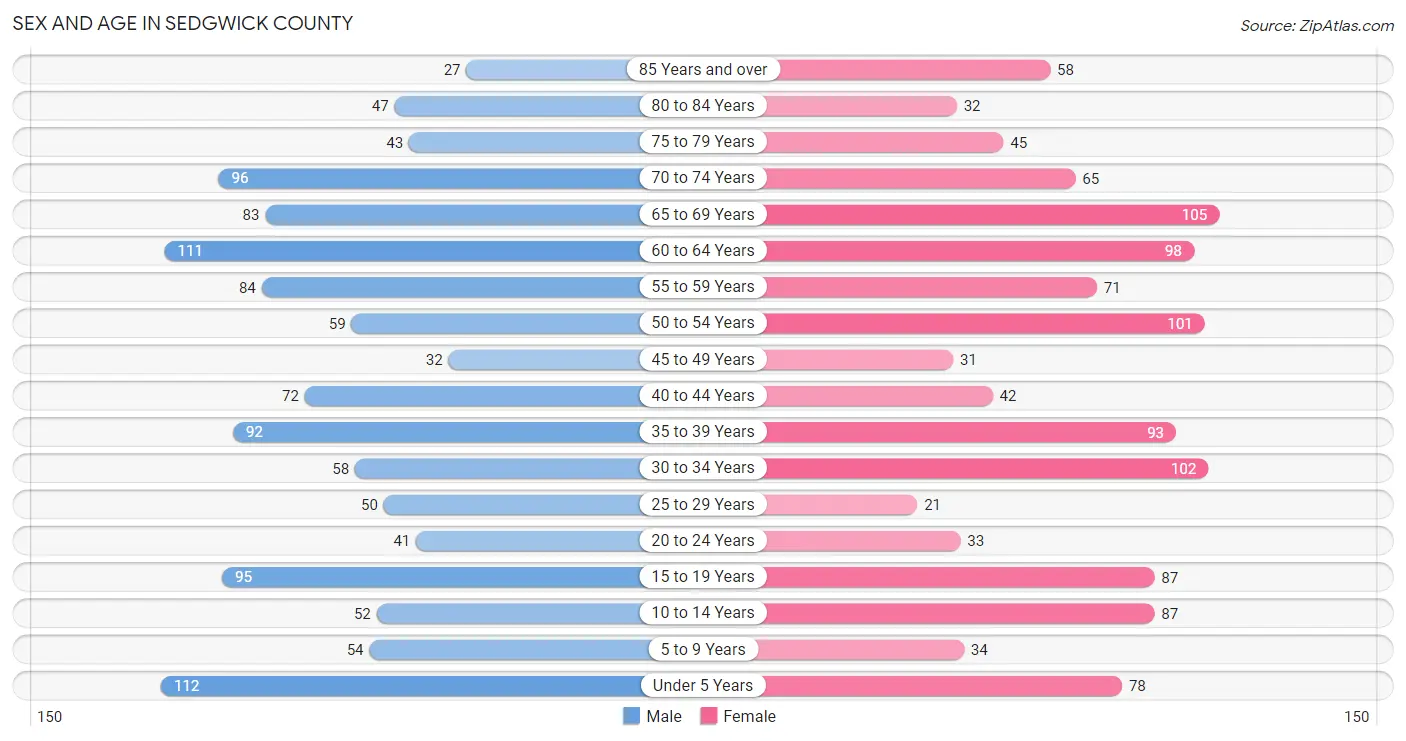
| Age Bracket | Male | Female |
| Under 5 Years | 112 (9.3%) | 78 (6.6%) |
| 5 to 9 Years | 54 (4.5%) | 34 (2.9%) |
| 10 to 14 Years | 52 (4.3%) | 87 (7.3%) |
| 15 to 19 Years | 95 (7.9%) | 87 (7.3%) |
| 20 to 24 Years | 41 (3.4%) | 33 (2.8%) |
| 25 to 29 Years | 50 (4.1%) | 21 (1.8%) |
| 30 to 34 Years | 58 (4.8%) | 102 (8.6%) |
| 35 to 39 Years | 92 (7.6%) | 93 (7.9%) |
| 40 to 44 Years | 72 (6.0%) | 42 (3.5%) |
| 45 to 49 Years | 32 (2.6%) | 31 (2.6%) |
| 50 to 54 Years | 59 (4.9%) | 101 (8.5%) |
| 55 to 59 Years | 84 (7.0%) | 71 (6.0%) |
| 60 to 64 Years | 111 (9.2%) | 98 (8.3%) |
| 65 to 69 Years | 83 (6.9%) | 105 (8.9%) |
| 70 to 74 Years | 96 (8.0%) | 65 (5.5%) |
| 75 to 79 Years | 43 (3.6%) | 45 (3.8%) |
| 80 to 84 Years | 47 (3.9%) | 32 (2.7%) |
| 85 Years and over | 27 (2.2%) | 58 (4.9%) |
| Total | 1,208 (100.0%) | 1,183 (100.0%) |
Families and Households in Sedgwick County
Median Family Size in Sedgwick County
The median family size in Sedgwick County is 3.06 persons per family, with married-couple families (459 | 78.5%) accounting for the largest median family size of 3.16 persons per family. On the other hand, single female/mother families (104 | 17.8%) represent the smallest median family size with 2.63 persons per family.
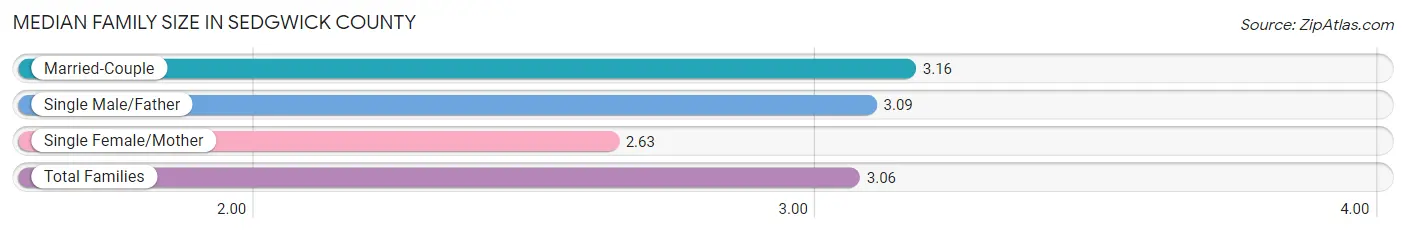
| Family Type | # Families | Family Size |
| Married-Couple | 459 (78.5%) | 3.16 |
| Single Male/Father | 22 (3.8%) | 3.09 |
| Single Female/Mother | 104 (17.8%) | 2.63 |
| Total Families | 585 (100.0%) | 3.06 |
Median Household Size in Sedgwick County
The median household size in Sedgwick County is 2.24 persons per household, with single male/father households (22 | 2.1%) accounting for the largest median household size of 3.23 persons per household. non-family households (464 | 44.2%) represent the smallest median household size with 1.16 persons per household.
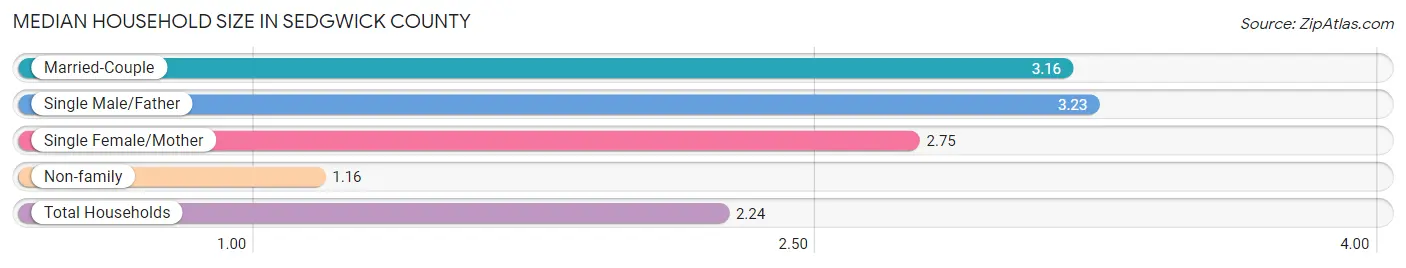
| Household Type | # Households | Household Size |
| Married-Couple | 459 (43.8%) | 3.16 |
| Single Male/Father | 22 (2.1%) | 3.23 |
| Single Female/Mother | 104 (9.9%) | 2.75 |
| Non-family | 464 (44.2%) | 1.16 |
| Total Households | 1,049 (100.0%) | 2.24 |
Household Size by Marriage Status in Sedgwick County
Out of a total of 1,049 households in Sedgwick County, 585 (55.8%) are family households, while 464 (44.2%) are nonfamily households. The most numerous type of family households are 2-person households, comprising 314, and the most common type of nonfamily households are 1-person households, comprising 420.
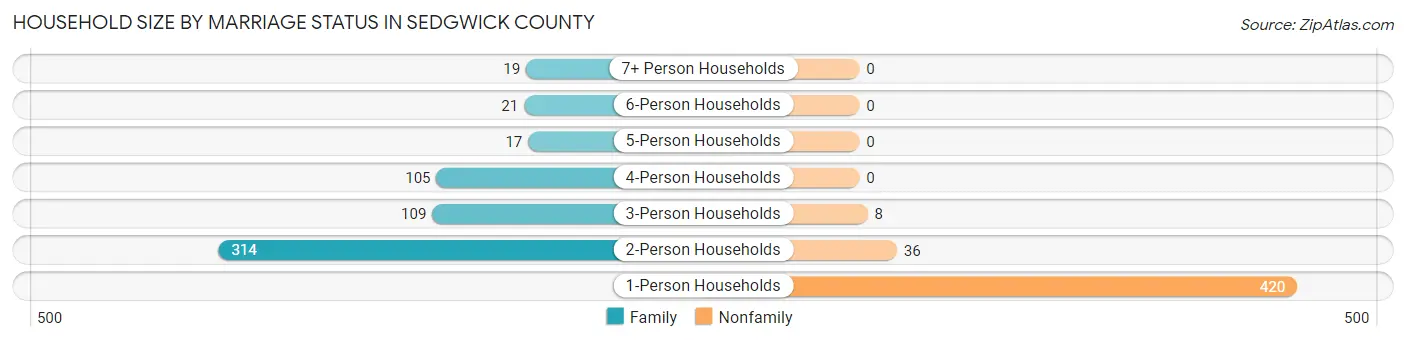
| Household Size | Family Households | Nonfamily Households |
| 1-Person Households | - | 420 (40.0%) |
| 2-Person Households | 314 (29.9%) | 36 (3.4%) |
| 3-Person Households | 109 (10.4%) | 8 (0.8%) |
| 4-Person Households | 105 (10.0%) | 0 (0.0%) |
| 5-Person Households | 17 (1.6%) | 0 (0.0%) |
| 6-Person Households | 21 (2.0%) | 0 (0.0%) |
| 7+ Person Households | 19 (1.8%) | 0 (0.0%) |
| Total | 585 (55.8%) | 464 (44.2%) |
Female Fertility in Sedgwick County
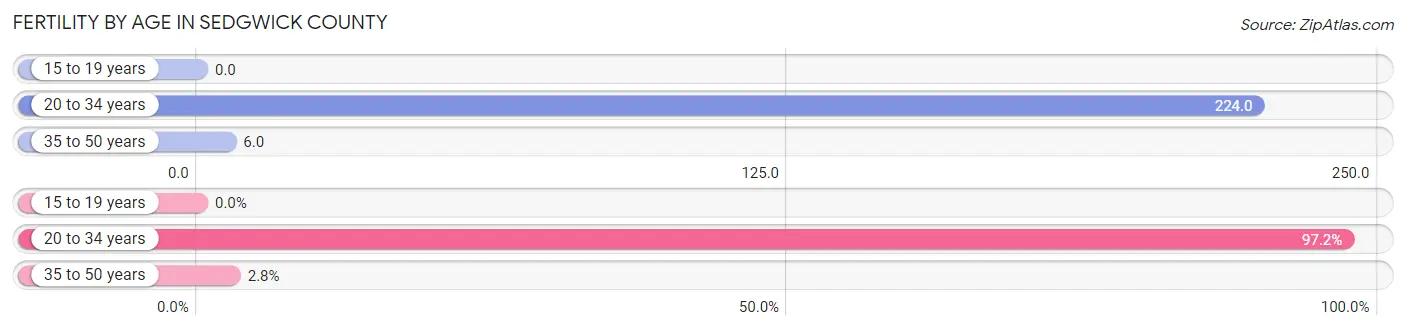
Fertility by Age in Sedgwick County
Average fertility rate in Sedgwick County is 87.0 births per 1,000 women. Women in the age bracket of 20 to 34 years have the highest fertility rate with 224.0 births per 1,000 women. Women in the age bracket of 20 to 34 years acount for 97.2% of all women with births.
| Age Bracket | Women with Births | Births / 1,000 Women |
| 15 to 19 years | 0 (0.0%) | 0.0 |
| 20 to 34 years | 35 (97.2%) | 224.0 |
| 35 to 50 years | 1 (2.8%) | 6.0 |
| Total | 36 (100.0%) | 87.0 |
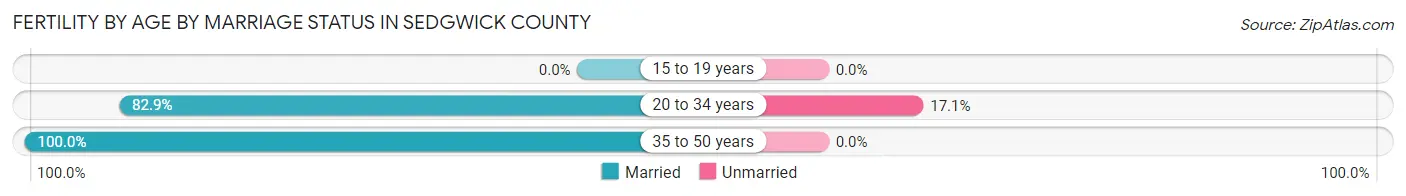
Fertility by Age by Marriage Status in Sedgwick County
83.3% of women with births (36) in Sedgwick County are married. The highest percentage of unmarried women with births falls into 20 to 34 years age bracket with 17.1% of them unmarried at the time of birth, while the lowest percentage of unmarried women with births belong to 35 to 50 years age bracket with 0.0% of them unmarried.
| Age Bracket | Married | Unmarried |
| 15 to 19 years | 0 (0.0%) | 0 (0.0%) |
| 20 to 34 years | 29 (82.9%) | 6 (17.1%) |
| 35 to 50 years | 1 (100.0%) | 0 (0.0%) |
| Total | 30 (83.3%) | 6 (16.7%) |
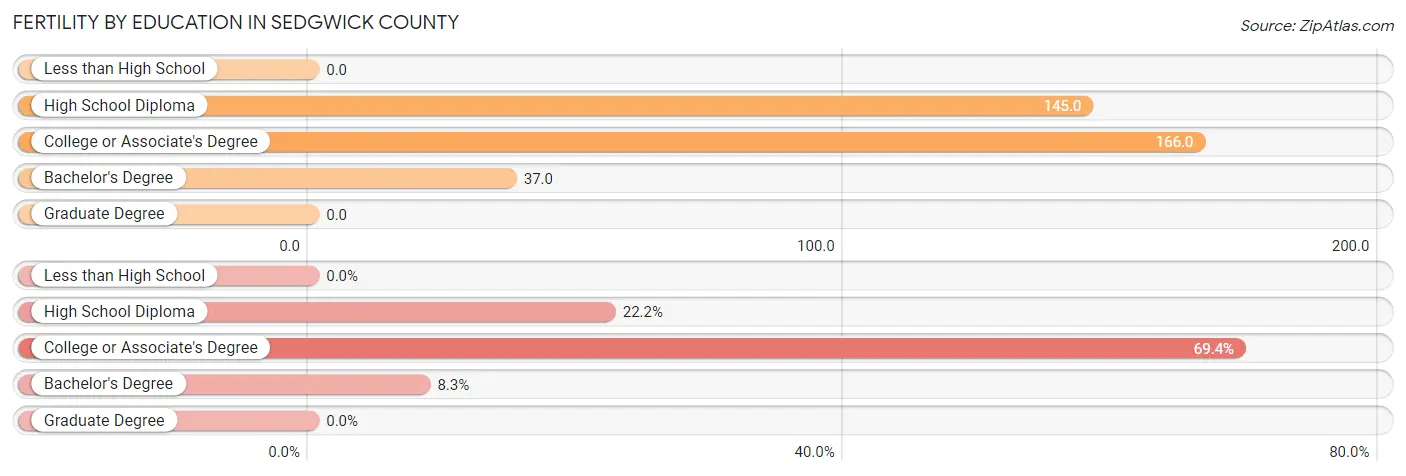
Fertility by Education in Sedgwick County
| Educational Attainment | Women with Births | Births / 1,000 Women |
| Less than High School | 0 (0.0%) | 0.0 |
| High School Diploma | 8 (22.2%) | 145.0 |
| College or Associate's Degree | 25 (69.4%) | 166.0 |
| Bachelor's Degree | 3 (8.3%) | 37.0 |
| Graduate Degree | 0 (0.0%) | 0.0 |
| Total | 36 (100.0%) | 87.0 |
Fertility by Education by Marriage Status in Sedgwick County
16.7% of women with births in Sedgwick County are unmarried. Women with the educational attainment of high school diploma are most likely to be married with 100.0% of them married at childbirth, while women with the educational attainment of bachelor's degree are least likely to be married with 100.0% of them unmarried at childbirth.

| Educational Attainment | Married | Unmarried |
| Less than High School | 0 (0.0%) | 0 (0.0%) |
| High School Diploma | 8 (100.0%) | 0 (0.0%) |
| College or Associate's Degree | 22 (88.0%) | 3 (12.0%) |
| Bachelor's Degree | 0 (0.0%) | 3 (100.0%) |
| Graduate Degree | 0 (0.0%) | 0 (0.0%) |
| Total | 30 (83.3%) | 6 (16.7%) |
Employment Characteristics in Sedgwick County
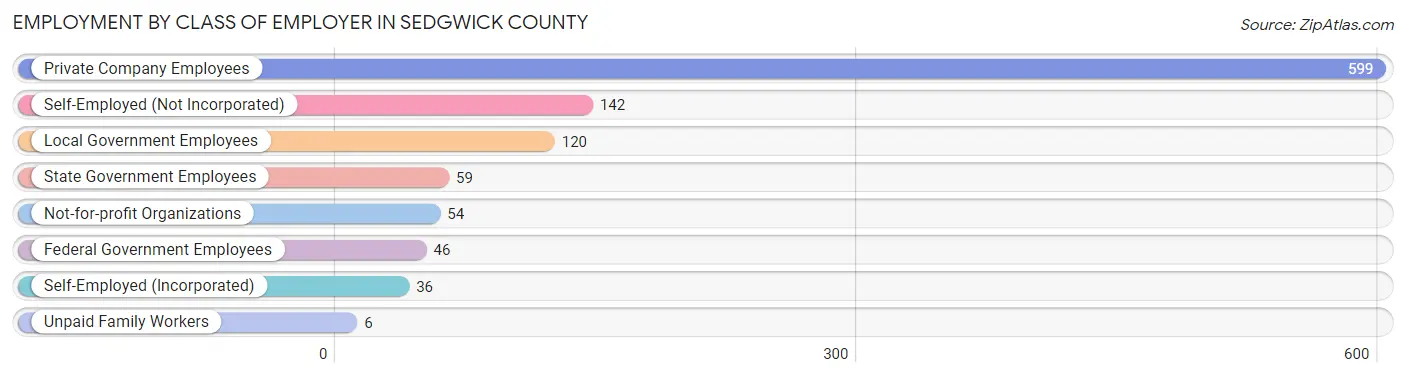
Employment by Class of Employer in Sedgwick County
Among the 1,062 employed individuals in Sedgwick County, private company employees (599 | 56.4%), self-employed (not incorporated) (142 | 13.4%), and local government employees (120 | 11.3%) make up the most common classes of employment.
| Employer Class | # Employees | % Employees |
| Private Company Employees | 599 | 56.4% |
| Self-Employed (Incorporated) | 36 | 3.4% |
| Self-Employed (Not Incorporated) | 142 | 13.4% |
| Not-for-profit Organizations | 54 | 5.1% |
| Local Government Employees | 120 | 11.3% |
| State Government Employees | 59 | 5.6% |
| Federal Government Employees | 46 | 4.3% |
| Unpaid Family Workers | 6 | 0.6% |
| Total | 1,062 | 100.0% |
Employment Status by Age in Sedgwick County
According to the labor force statistics for Sedgwick County, out of the total population over 16 years of age (1,933), 57.5% or 1,111 individuals are in the labor force, with 3.3% or 37 of them unemployed. The age group with the highest labor force participation rate is 35 to 44 years, with 92.6% or 277 individuals in the labor force. Within the labor force, the 20 to 24 years age range has the highest percentage of unemployed individuals, with 13.6% or 9 of them being unemployed.
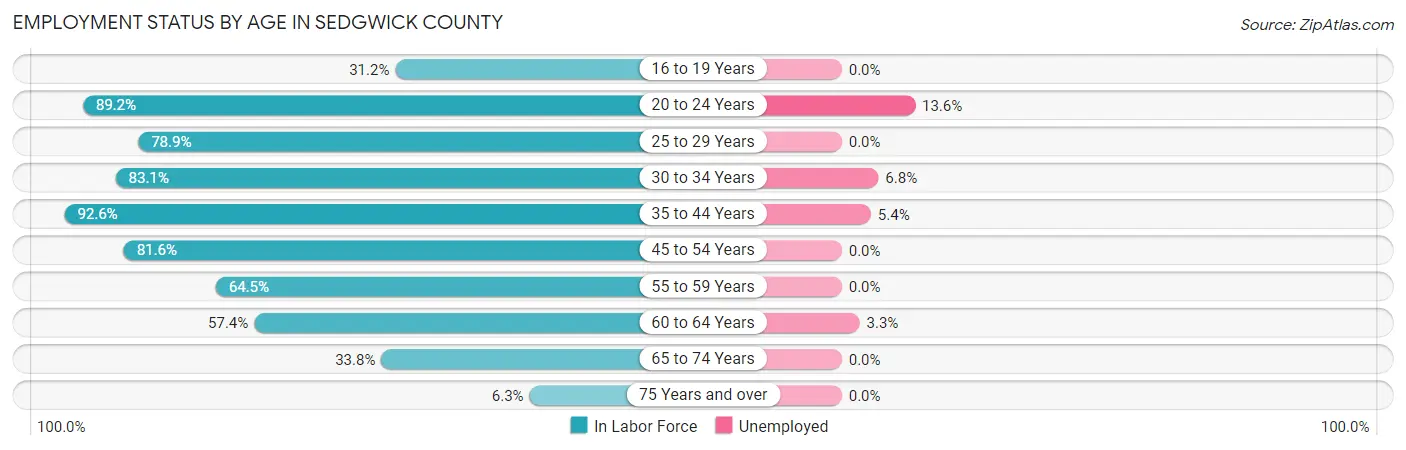
| Age Bracket | In Labor Force | Unemployed |
| 16 to 19 Years | 44 (31.2%) | 0 (0.0%) |
| 20 to 24 Years | 66 (89.2%) | 9 (13.6%) |
| 25 to 29 Years | 56 (78.9%) | 0 (0.0%) |
| 30 to 34 Years | 133 (83.1%) | 9 (6.8%) |
| 35 to 44 Years | 277 (92.6%) | 15 (5.4%) |
| 45 to 54 Years | 182 (81.6%) | 0 (0.0%) |
| 55 to 59 Years | 100 (64.5%) | 0 (0.0%) |
| 60 to 64 Years | 120 (57.4%) | 4 (3.3%) |
| 65 to 74 Years | 118 (33.8%) | 0 (0.0%) |
| 75 Years and over | 16 (6.3%) | 0 (0.0%) |
| Total | 1,111 (57.5%) | 37 (3.3%) |
Employment Status by Educational Attainment in Sedgwick County
According to labor force statistics for Sedgwick County, 77.7% of individuals (868) out of the total population between 25 and 64 years of age (1,117) are in the labor force, with 3.2% or 28 of them being unemployed. The group with the highest labor force participation rate are those with the educational attainment of college / associate degree, with 85.4% or 410 individuals in the labor force. Within the labor force, individuals with high school diploma education have the highest percentage of unemployment, with 5.4% or 8 of them being unemployed.
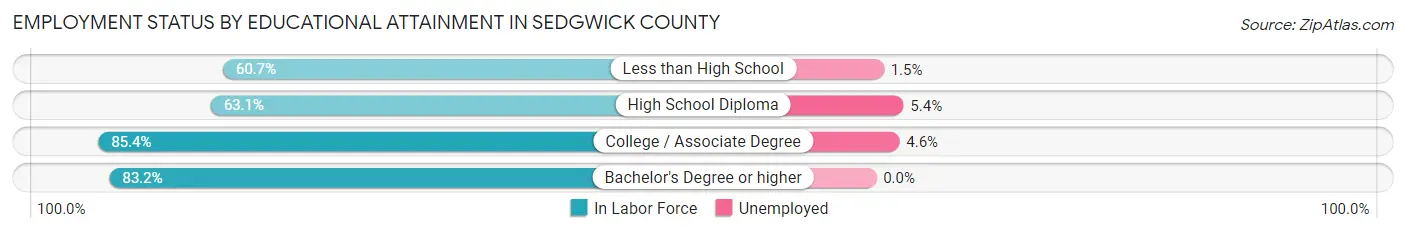
| Educational Attainment | In Labor Force | Unemployed |
| Less than High School | 68 (60.7%) | 2 (1.5%) |
| High School Diploma | 147 (63.1%) | 13 (5.4%) |
| College / Associate Degree | 410 (85.4%) | 22 (4.6%) |
| Bachelor's Degree or higher | 243 (83.2%) | 0 (0.0%) |
| Total | 868 (77.7%) | 36 (3.2%) |
Employment Occupations by Sex in Sedgwick County
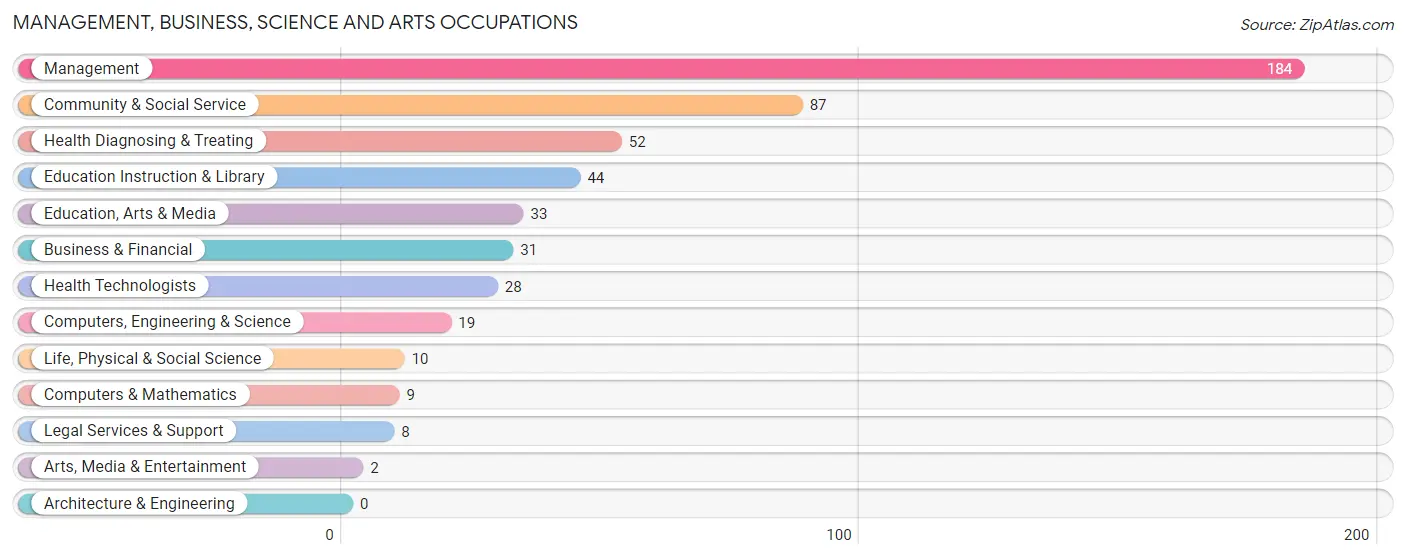
Management, Business, Science and Arts Occupations
The most common Management, Business, Science and Arts occupations in Sedgwick County are Management (184 | 17.1%), Community & Social Service (87 | 8.1%), Health Diagnosing & Treating (52 | 4.8%), Education Instruction & Library (44 | 4.1%), and Education, Arts & Media (33 | 3.1%).
Management, Business, Science and Arts Occupations by Sex
Within the Management, Business, Science and Arts occupations in Sedgwick County, the most male-oriented occupations are Life, Physical & Social Science (100.0%), Legal Services & Support (100.0%), and Arts, Media & Entertainment (100.0%), while the most female-oriented occupations are Health Technologists (100.0%), Education Instruction & Library (95.5%), and Health Diagnosing & Treating (84.6%).

| Occupation | Male | Female |
| Management | 113 (61.4%) | 71 (38.6%) |
| Business & Financial | 16 (51.6%) | 15 (48.4%) |
| Computers, Engineering & Science | 16 (84.2%) | 3 (15.8%) |
| Computers & Mathematics | 6 (66.7%) | 3 (33.3%) |
| Architecture & Engineering | 0 (0.0%) | 0 (0.0%) |
| Life, Physical & Social Science | 10 (100.0%) | 0 (0.0%) |
| Community & Social Service | 31 (35.6%) | 56 (64.4%) |
| Education, Arts & Media | 19 (57.6%) | 14 (42.4%) |
| Legal Services & Support | 8 (100.0%) | 0 (0.0%) |
| Education Instruction & Library | 2 (4.5%) | 42 (95.5%) |
| Arts, Media & Entertainment | 2 (100.0%) | 0 (0.0%) |
| Health Diagnosing & Treating | 8 (15.4%) | 44 (84.6%) |
| Health Technologists | 0 (0.0%) | 28 (100.0%) |
| Total (Category) | 184 (49.3%) | 189 (50.7%) |
| Total (Overall) | 557 (51.8%) | 518 (48.2%) |
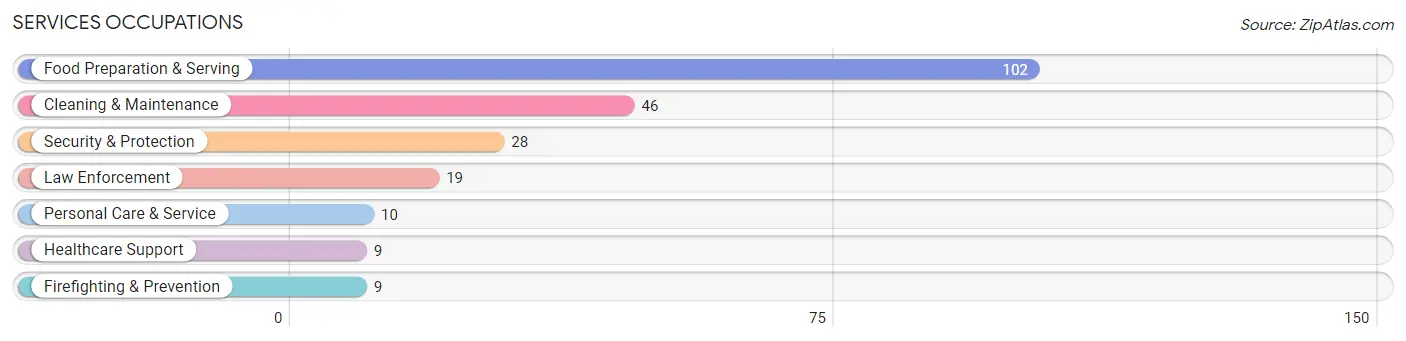
Services Occupations
The most common Services occupations in Sedgwick County are Food Preparation & Serving (102 | 9.5%), Cleaning & Maintenance (46 | 4.3%), Security & Protection (28 | 2.6%), Law Enforcement (19 | 1.8%), and Personal Care & Service (10 | 0.9%).
Services Occupations by Sex
Within the Services occupations in Sedgwick County, the most male-oriented occupations are Security & Protection (100.0%), Firefighting & Prevention (100.0%), and Law Enforcement (100.0%), while the most female-oriented occupations are Healthcare Support (100.0%), Personal Care & Service (100.0%), and Food Preparation & Serving (87.3%).
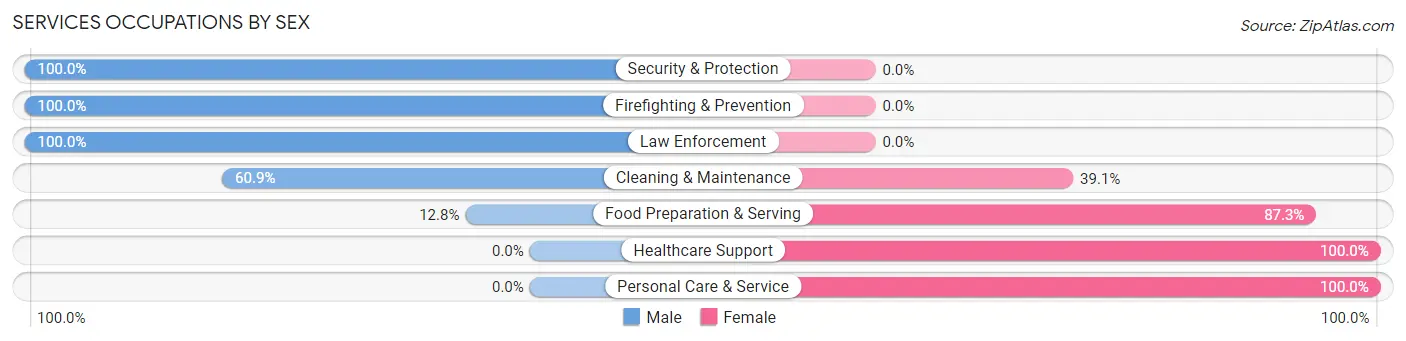
| Occupation | Male | Female |
| Healthcare Support | 0 (0.0%) | 9 (100.0%) |
| Security & Protection | 28 (100.0%) | 0 (0.0%) |
| Firefighting & Prevention | 9 (100.0%) | 0 (0.0%) |
| Law Enforcement | 19 (100.0%) | 0 (0.0%) |
| Food Preparation & Serving | 13 (12.8%) | 89 (87.3%) |
| Cleaning & Maintenance | 28 (60.9%) | 18 (39.1%) |
| Personal Care & Service | 0 (0.0%) | 10 (100.0%) |
| Total (Category) | 69 (35.4%) | 126 (64.6%) |
| Total (Overall) | 557 (51.8%) | 518 (48.2%) |
Sales and Office Occupations
The most common Sales and Office occupations in Sedgwick County are Sales & Related (114 | 10.6%), and Office & Administration (114 | 10.6%).
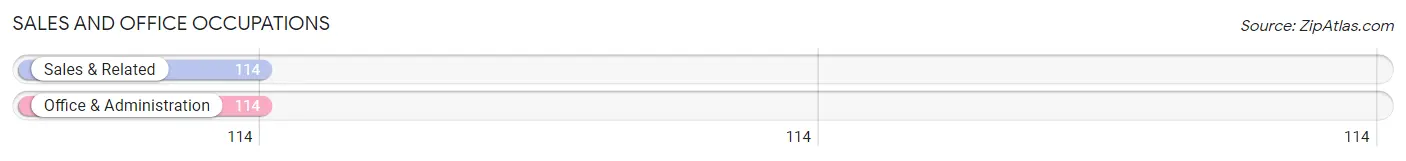
Sales and Office Occupations by Sex
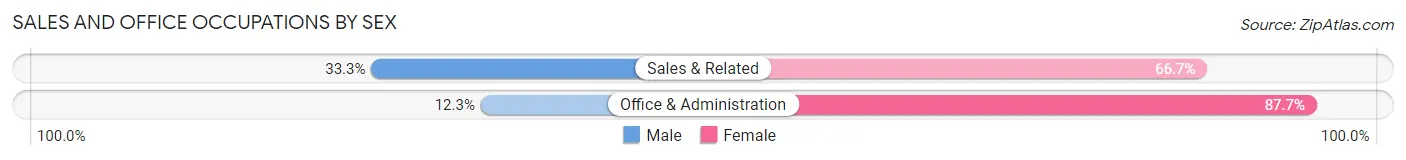
| Occupation | Male | Female |
| Sales & Related | 38 (33.3%) | 76 (66.7%) |
| Office & Administration | 14 (12.3%) | 100 (87.7%) |
| Total (Category) | 52 (22.8%) | 176 (77.2%) |
| Total (Overall) | 557 (51.8%) | 518 (48.2%) |
Natural Resources, Construction and Maintenance Occupations
The most common Natural Resources, Construction and Maintenance occupations in Sedgwick County are Construction & Extraction (105 | 9.8%), Installation, Maintenance & Repair (38 | 3.5%), and Farming, Fishing & Forestry (28 | 2.6%).
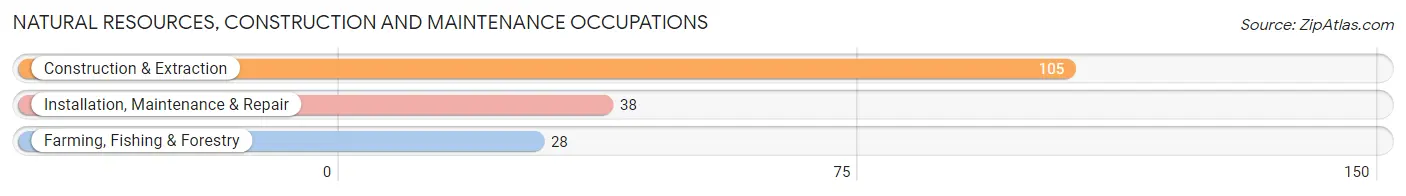
Natural Resources, Construction and Maintenance Occupations by Sex
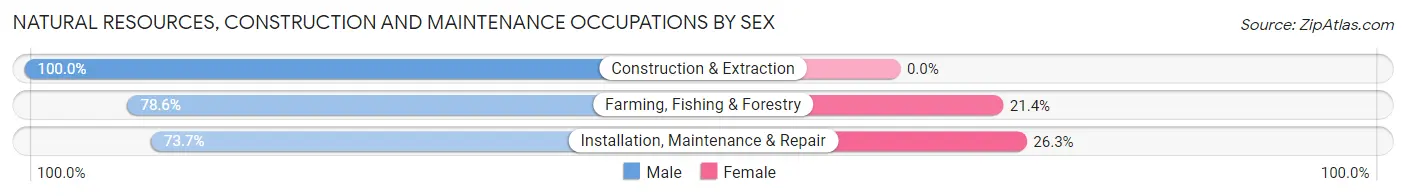
| Occupation | Male | Female |
| Farming, Fishing & Forestry | 22 (78.6%) | 6 (21.4%) |
| Construction & Extraction | 105 (100.0%) | 0 (0.0%) |
| Installation, Maintenance & Repair | 28 (73.7%) | 10 (26.3%) |
| Total (Category) | 155 (90.6%) | 16 (9.4%) |
| Total (Overall) | 557 (51.8%) | 518 (48.2%) |
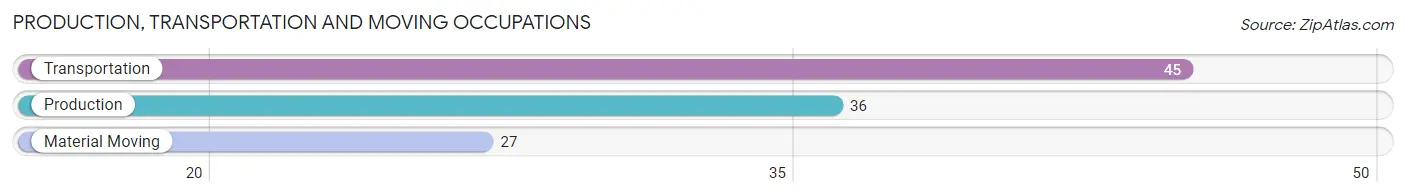
Production, Transportation and Moving Occupations
The most common Production, Transportation and Moving occupations in Sedgwick County are Transportation (45 | 4.2%), Production (36 | 3.4%), and Material Moving (27 | 2.5%).
Production, Transportation and Moving Occupations by Sex
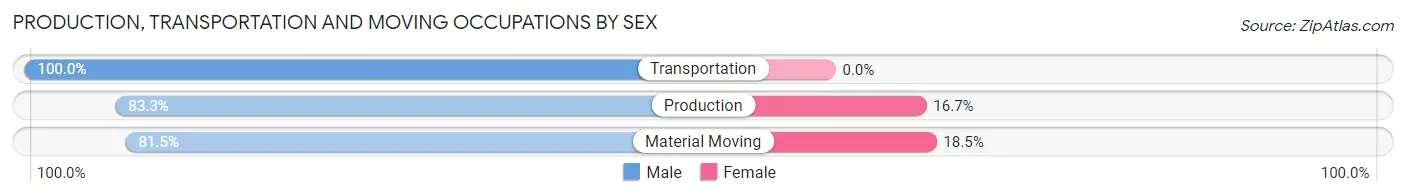
| Occupation | Male | Female |
| Production | 30 (83.3%) | 6 (16.7%) |
| Transportation | 45 (100.0%) | 0 (0.0%) |
| Material Moving | 22 (81.5%) | 5 (18.5%) |
| Total (Category) | 97 (89.8%) | 11 (10.2%) |
| Total (Overall) | 557 (51.8%) | 518 (48.2%) |
Employment Industries by Sex in Sedgwick County
Employment Industries in Sedgwick County
The major employment industries in Sedgwick County include Agriculture, Fishing & Hunting (164 | 15.3%), Retail Trade (161 | 15.0%), Construction (112 | 10.4%), Health Care & Social Assistance (101 | 9.4%), and Public Administration (87 | 8.1%).

Employment Industries by Sex in Sedgwick County
The Sedgwick County industries that see more men than women are Information (100.0%), Arts, Entertainment & Recreation (100.0%), and Construction (97.3%), whereas the industries that tend to have a higher number of women are Enterprise Management (100.0%), Accommodation & Food Services (88.3%), and Educational Services (84.9%).
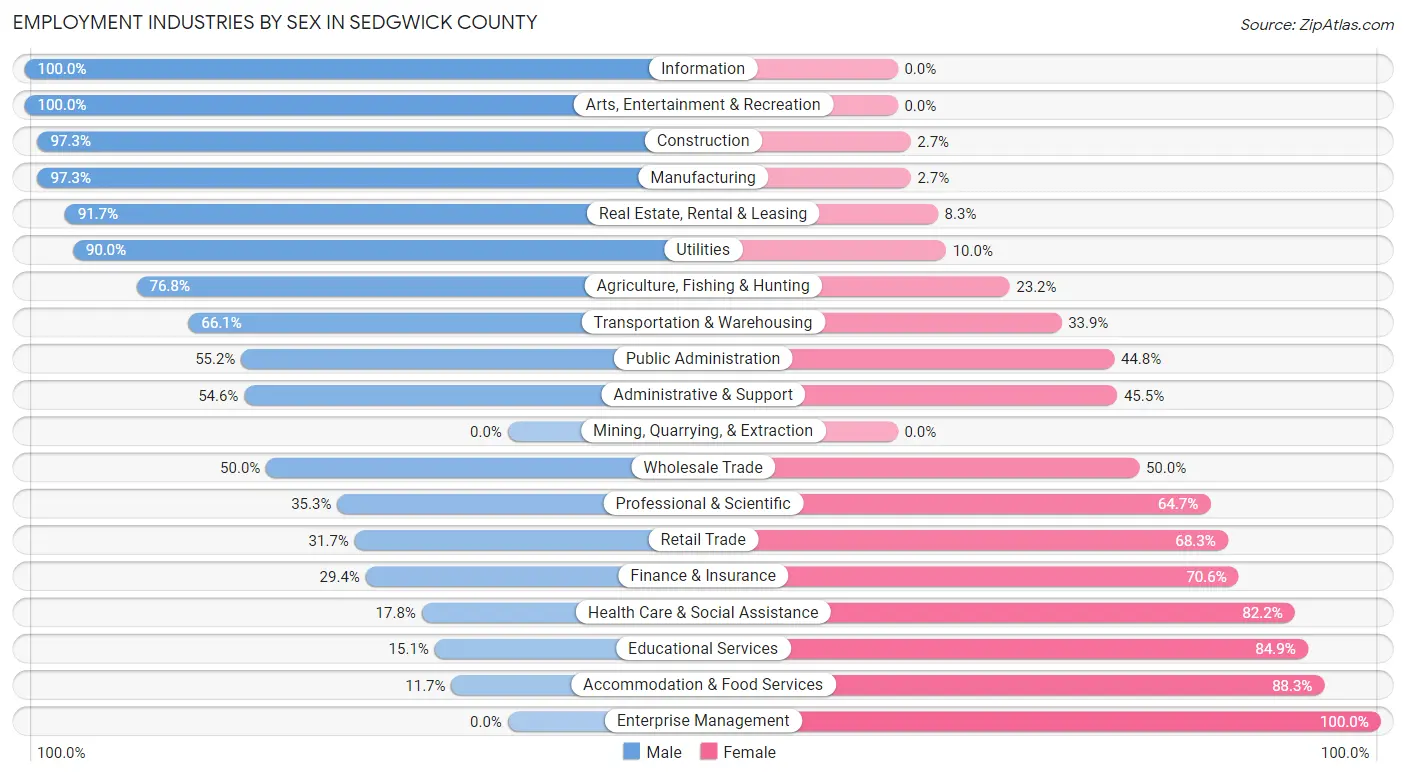
| Industry | Male | Female |
| Agriculture, Fishing & Hunting | 126 (76.8%) | 38 (23.2%) |
| Mining, Quarrying, & Extraction | 0 (0.0%) | 0 (0.0%) |
| Construction | 109 (97.3%) | 3 (2.7%) |
| Manufacturing | 36 (97.3%) | 1 (2.7%) |
| Wholesale Trade | 27 (50.0%) | 27 (50.0%) |
| Retail Trade | 51 (31.7%) | 110 (68.3%) |
| Transportation & Warehousing | 39 (66.1%) | 20 (33.9%) |
| Utilities | 9 (90.0%) | 1 (10.0%) |
| Information | 5 (100.0%) | 0 (0.0%) |
| Finance & Insurance | 5 (29.4%) | 12 (70.6%) |
| Real Estate, Rental & Leasing | 22 (91.7%) | 2 (8.3%) |
| Professional & Scientific | 6 (35.3%) | 11 (64.7%) |
| Enterprise Management | 0 (0.0%) | 1 (100.0%) |
| Administrative & Support | 18 (54.5%) | 15 (45.5%) |
| Educational Services | 13 (15.1%) | 73 (84.9%) |
| Health Care & Social Assistance | 18 (17.8%) | 83 (82.2%) |
| Arts, Entertainment & Recreation | 5 (100.0%) | 0 (0.0%) |
| Accommodation & Food Services | 7 (11.7%) | 53 (88.3%) |
| Public Administration | 48 (55.2%) | 39 (44.8%) |
| Total | 557 (51.8%) | 518 (48.2%) |
Education in Sedgwick County
School Enrollment in Sedgwick County
The most common levels of schooling among the 451 students in Sedgwick County are high school (150 | 33.3%), middle school (117 | 25.9%), and nursery / preschool (59 | 13.1%).
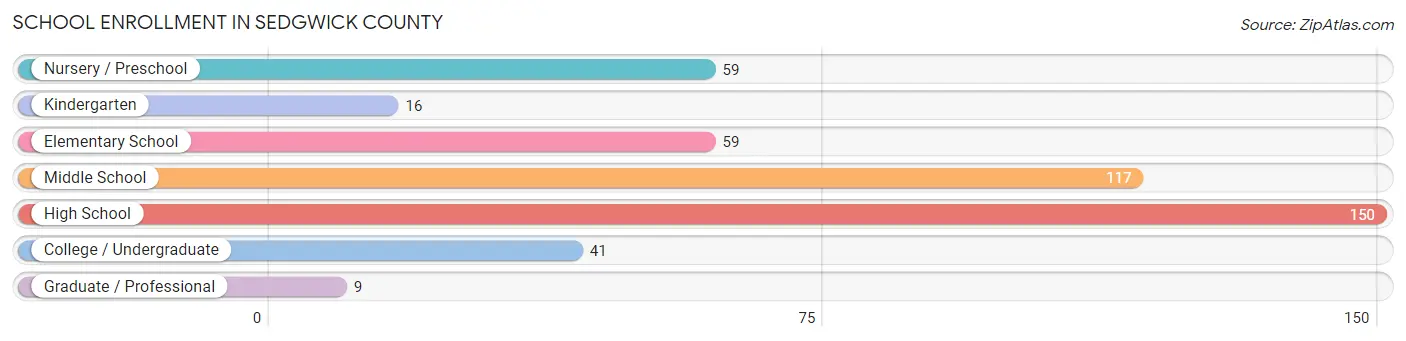
| School Level | # Students | % Students |
| Nursery / Preschool | 59 | 13.1% |
| Kindergarten | 16 | 3.5% |
| Elementary School | 59 | 13.1% |
| Middle School | 117 | 25.9% |
| High School | 150 | 33.3% |
| College / Undergraduate | 41 | 9.1% |
| Graduate / Professional | 9 | 2.0% |
| Total | 451 | 100.0% |
School Enrollment by Age by Funding Source in Sedgwick County
Out of a total of 451 students who are enrolled in schools in Sedgwick County, 5 (1.1%) attend a private institution, while the remaining 446 (98.9%) are enrolled in public schools. The age group of 35 years and over has the highest likelihood of being enrolled in private schools, with 1 (16.7% in the age bracket) enrolled. Conversely, the age group of 3 to 4 year olds has the lowest likelihood of being enrolled in a private school, with 33 (100.0% in the age bracket) attending a public institution.
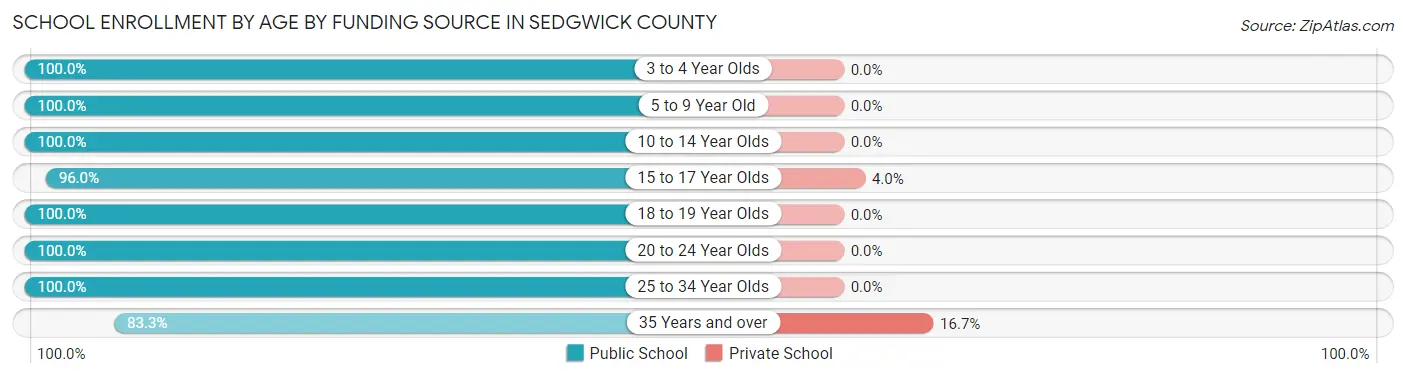
| Age Bracket | Public School | Private School |
| 3 to 4 Year Olds | 33 (100.0%) | 0 (0.0%) |
| 5 to 9 Year Old | 88 (100.0%) | 0 (0.0%) |
| 10 to 14 Year Olds | 139 (100.0%) | 0 (0.0%) |
| 15 to 17 Year Olds | 97 (96.0%) | 4 (4.0%) |
| 18 to 19 Year Olds | 56 (100.0%) | 0 (0.0%) |
| 20 to 24 Year Olds | 13 (100.0%) | 0 (0.0%) |
| 25 to 34 Year Olds | 15 (100.0%) | 0 (0.0%) |
| 35 Years and over | 5 (83.3%) | 1 (16.7%) |
| Total | 446 (98.9%) | 5 (1.1%) |
Educational Attainment by Field of Study in Sedgwick County
Education (70 | 14.4%), bio, nature & agricultural (69 | 14.2%), business (63 | 13.0%), science & technology (51 | 10.5%), and arts & humanities (46 | 9.5%) are the most common fields of study among 486 individuals in Sedgwick County who have obtained a bachelor's degree or higher.
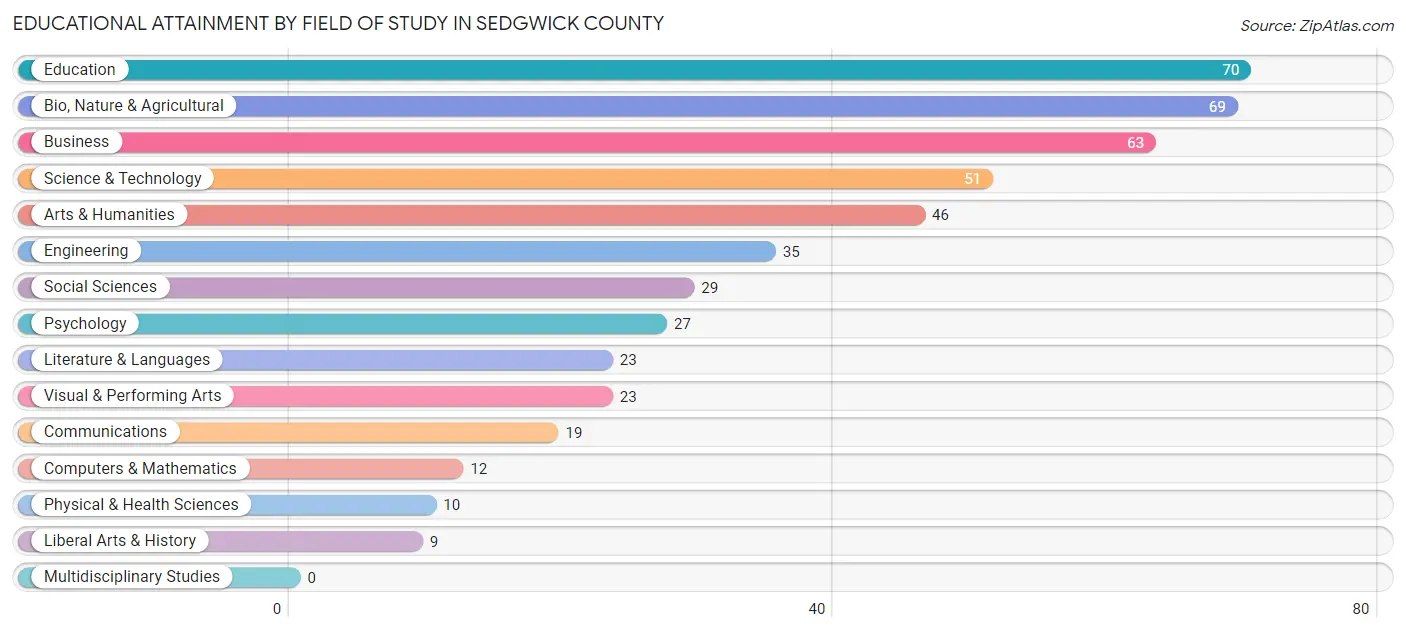
| Field of Study | # Graduates | % Graduates |
| Computers & Mathematics | 12 | 2.5% |
| Bio, Nature & Agricultural | 69 | 14.2% |
| Physical & Health Sciences | 10 | 2.1% |
| Psychology | 27 | 5.6% |
| Social Sciences | 29 | 6.0% |
| Engineering | 35 | 7.2% |
| Multidisciplinary Studies | 0 | 0.0% |
| Science & Technology | 51 | 10.5% |
| Business | 63 | 13.0% |
| Education | 70 | 14.4% |
| Literature & Languages | 23 | 4.7% |
| Liberal Arts & History | 9 | 1.8% |
| Visual & Performing Arts | 23 | 4.7% |
| Communications | 19 | 3.9% |
| Arts & Humanities | 46 | 9.5% |
| Total | 486 | 100.0% |
Transportation & Commute in Sedgwick County
Vehicle Availability by Sex in Sedgwick County
The most prevalent vehicle ownership categories in Sedgwick County are males with 2 vehicles (177, accounting for 32.1%) and females with 2 vehicles (150, making up 34.7%).
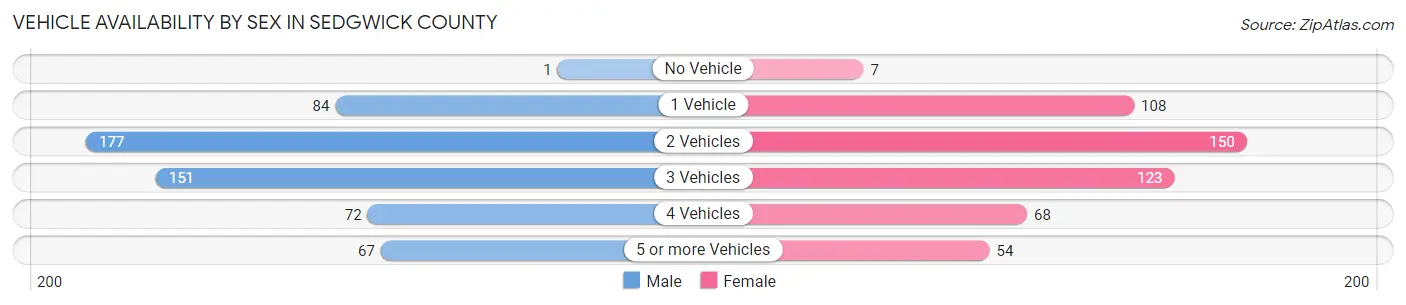
| Vehicles Available | Male | Female |
| No Vehicle | 1 (0.2%) | 7 (1.4%) |
| 1 Vehicle | 84 (15.2%) | 108 (21.2%) |
| 2 Vehicles | 177 (32.1%) | 150 (29.4%) |
| 3 Vehicles | 151 (27.4%) | 123 (24.1%) |
| 4 Vehicles | 72 (13.0%) | 68 (13.3%) |
| 5 or more Vehicles | 67 (12.1%) | 54 (10.6%) |
| Total | 552 (100.0%) | 510 (100.0%) |
Commute Time in Sedgwick County
The most frequently occuring commute durations in Sedgwick County are 5 to 9 minutes (185 commuters, 19.6%), less than 5 minutes (175 commuters, 18.5%), and 10 to 14 minutes (147 commuters, 15.6%).
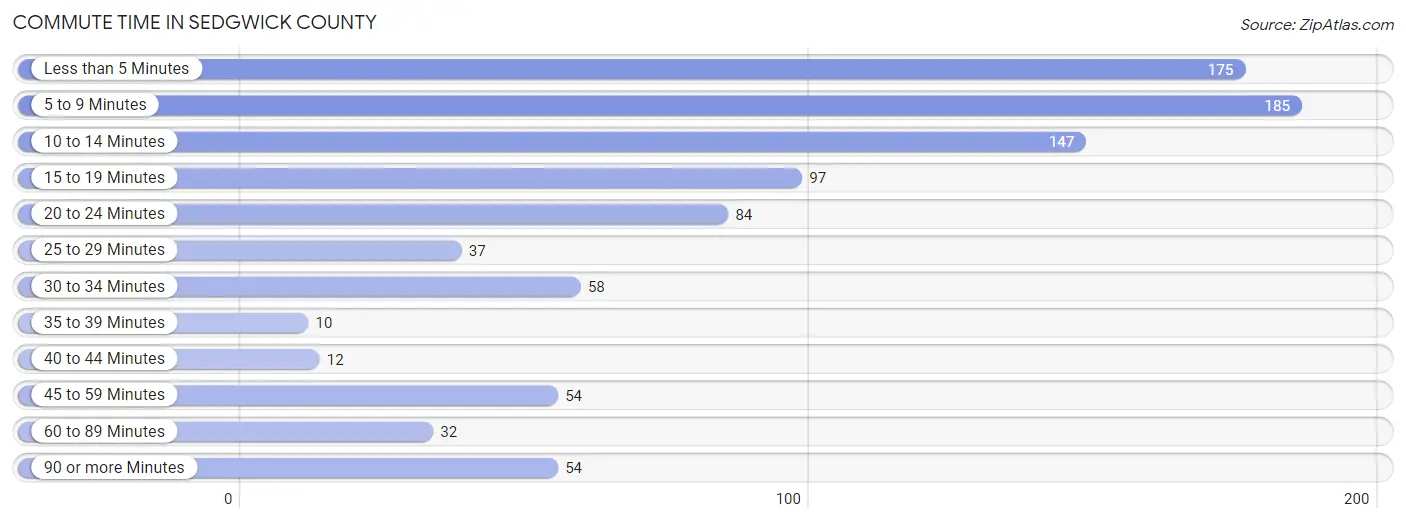
| Commute Time | # Commuters | % Commuters |
| Less than 5 Minutes | 175 | 18.5% |
| 5 to 9 Minutes | 185 | 19.6% |
| 10 to 14 Minutes | 147 | 15.6% |
| 15 to 19 Minutes | 97 | 10.3% |
| 20 to 24 Minutes | 84 | 8.9% |
| 25 to 29 Minutes | 37 | 3.9% |
| 30 to 34 Minutes | 58 | 6.1% |
| 35 to 39 Minutes | 10 | 1.1% |
| 40 to 44 Minutes | 12 | 1.3% |
| 45 to 59 Minutes | 54 | 5.7% |
| 60 to 89 Minutes | 32 | 3.4% |
| 90 or more Minutes | 54 | 5.7% |
Commute Time by Sex in Sedgwick County
The most common commute times in Sedgwick County are 5 to 9 minutes (96 commuters, 19.6%) for males and less than 5 minutes (94 commuters, 20.6%) for females.
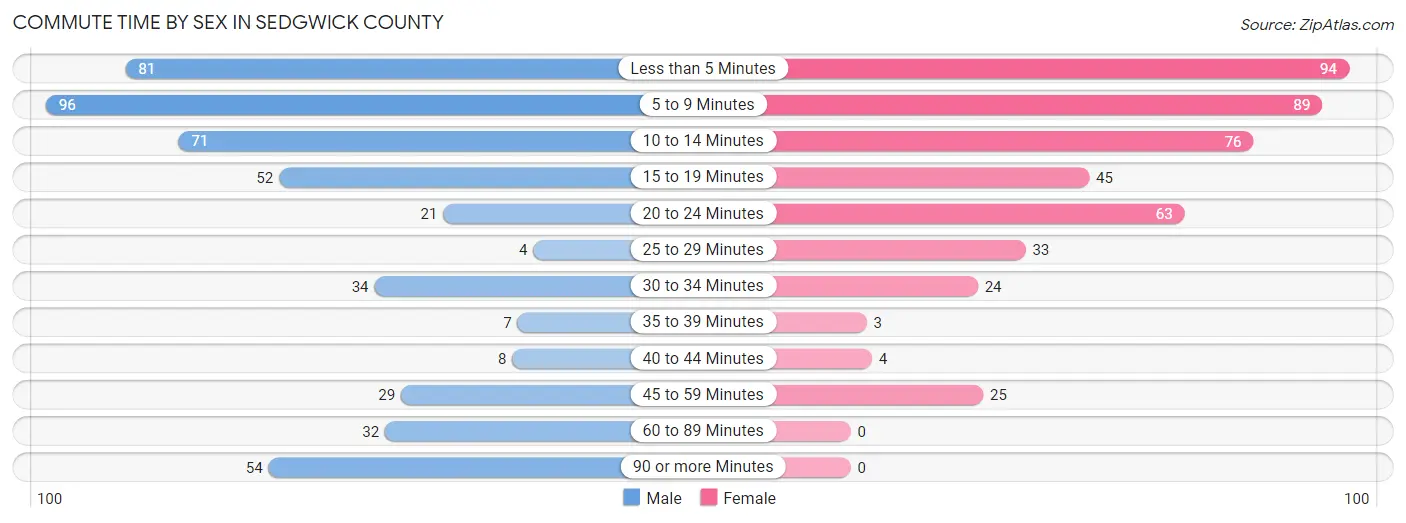
| Commute Time | Male | Female |
| Less than 5 Minutes | 81 (16.6%) | 94 (20.6%) |
| 5 to 9 Minutes | 96 (19.6%) | 89 (19.5%) |
| 10 to 14 Minutes | 71 (14.5%) | 76 (16.7%) |
| 15 to 19 Minutes | 52 (10.6%) | 45 (9.9%) |
| 20 to 24 Minutes | 21 (4.3%) | 63 (13.8%) |
| 25 to 29 Minutes | 4 (0.8%) | 33 (7.2%) |
| 30 to 34 Minutes | 34 (7.0%) | 24 (5.3%) |
| 35 to 39 Minutes | 7 (1.4%) | 3 (0.7%) |
| 40 to 44 Minutes | 8 (1.6%) | 4 (0.9%) |
| 45 to 59 Minutes | 29 (5.9%) | 25 (5.5%) |
| 60 to 89 Minutes | 32 (6.5%) | 0 (0.0%) |
| 90 or more Minutes | 54 (11.0%) | 0 (0.0%) |
Time of Departure to Work by Sex in Sedgwick County
The most frequent times of departure to work in Sedgwick County are 7:00 AM to 7:29 AM (94, 19.2%) for males and 7:30 AM to 7:59 AM (123, 27.0%) for females.
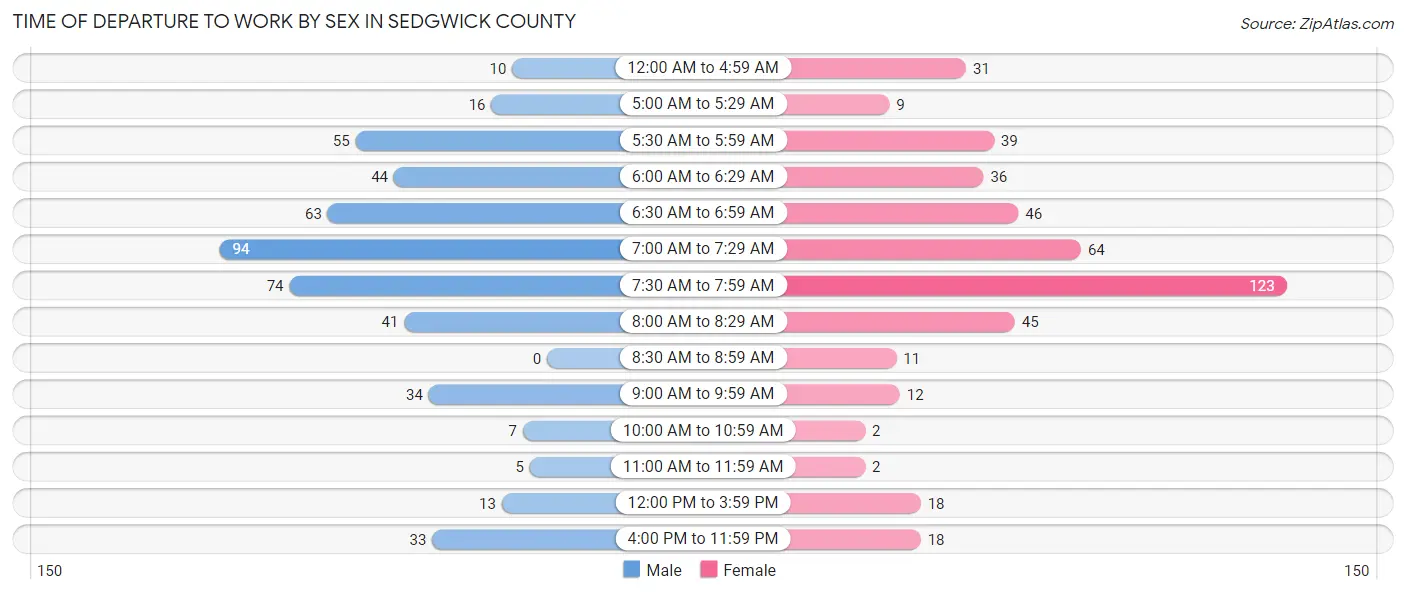
| Time of Departure | Male | Female |
| 12:00 AM to 4:59 AM | 10 (2.0%) | 31 (6.8%) |
| 5:00 AM to 5:29 AM | 16 (3.3%) | 9 (2.0%) |
| 5:30 AM to 5:59 AM | 55 (11.3%) | 39 (8.6%) |
| 6:00 AM to 6:29 AM | 44 (9.0%) | 36 (7.9%) |
| 6:30 AM to 6:59 AM | 63 (12.9%) | 46 (10.1%) |
| 7:00 AM to 7:29 AM | 94 (19.2%) | 64 (14.0%) |
| 7:30 AM to 7:59 AM | 74 (15.1%) | 123 (27.0%) |
| 8:00 AM to 8:29 AM | 41 (8.4%) | 45 (9.9%) |
| 8:30 AM to 8:59 AM | 0 (0.0%) | 11 (2.4%) |
| 9:00 AM to 9:59 AM | 34 (7.0%) | 12 (2.6%) |
| 10:00 AM to 10:59 AM | 7 (1.4%) | 2 (0.4%) |
| 11:00 AM to 11:59 AM | 5 (1.0%) | 2 (0.4%) |
| 12:00 PM to 3:59 PM | 13 (2.7%) | 18 (4.0%) |
| 4:00 PM to 11:59 PM | 33 (6.8%) | 18 (4.0%) |
| Total | 489 (100.0%) | 456 (100.0%) |
Housing Occupancy in Sedgwick County
Occupancy by Ownership in Sedgwick County
Of the total 1,049 dwellings in Sedgwick County, owner-occupied units account for 717 (68.3%), while renter-occupied units make up 332 (31.7%).
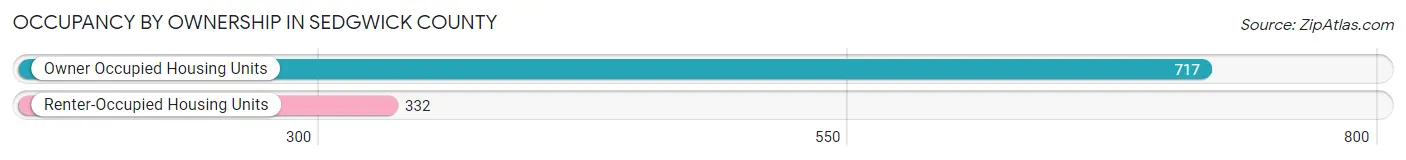
| Occupancy | # Housing Units | % Housing Units |
| Owner Occupied Housing Units | 717 | 68.3% |
| Renter-Occupied Housing Units | 332 | 31.7% |
| Total Occupied Housing Units | 1,049 | 100.0% |
Occupancy by Household Size in Sedgwick County
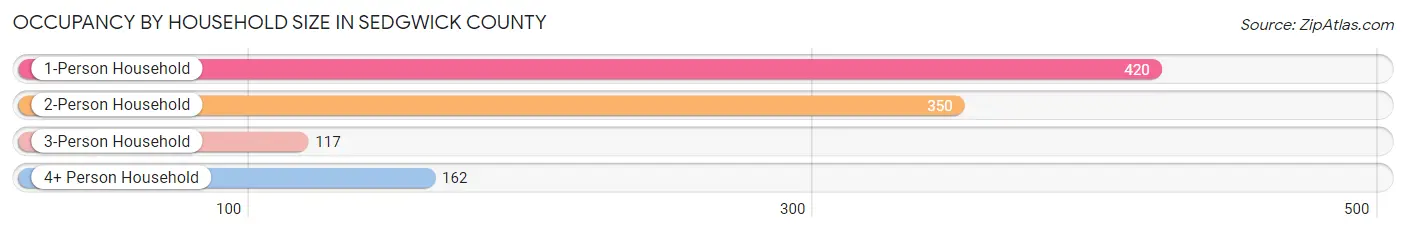
| Household Size | # Housing Units | % Housing Units |
| 1-Person Household | 420 | 40.0% |
| 2-Person Household | 350 | 33.4% |
| 3-Person Household | 117 | 11.2% |
| 4+ Person Household | 162 | 15.4% |
| Total Housing Units | 1,049 | 100.0% |
Occupancy by Ownership by Household Size in Sedgwick County
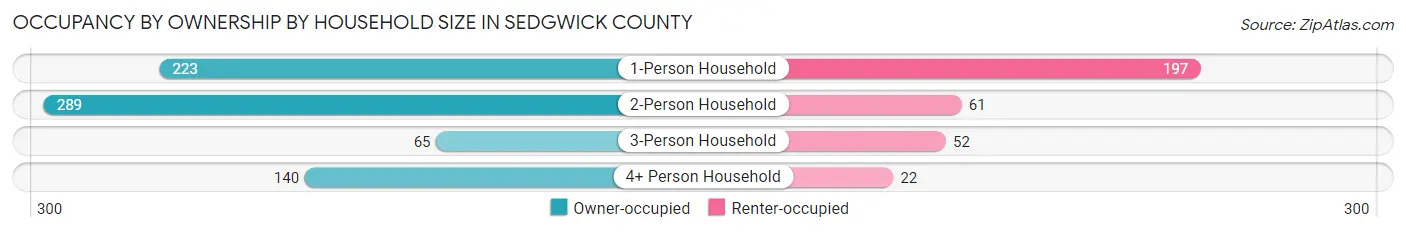
| Household Size | Owner-occupied | Renter-occupied |
| 1-Person Household | 223 (53.1%) | 197 (46.9%) |
| 2-Person Household | 289 (82.6%) | 61 (17.4%) |
| 3-Person Household | 65 (55.6%) | 52 (44.4%) |
| 4+ Person Household | 140 (86.4%) | 22 (13.6%) |
| Total Housing Units | 717 (68.3%) | 332 (31.7%) |
Occupancy by Educational Attainment in Sedgwick County
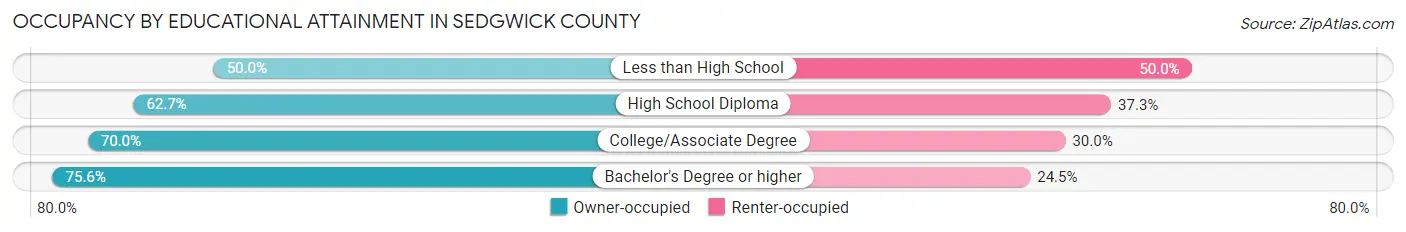
| Household Size | Owner-occupied | Renter-occupied |
| Less than High School | 38 (50.0%) | 38 (50.0%) |
| High School Diploma | 170 (62.7%) | 101 (37.3%) |
| College/Associate Degree | 268 (70.0%) | 115 (30.0%) |
| Bachelor's Degree or higher | 241 (75.5%) | 78 (24.4%) |
Occupancy by Age of Householder in Sedgwick County
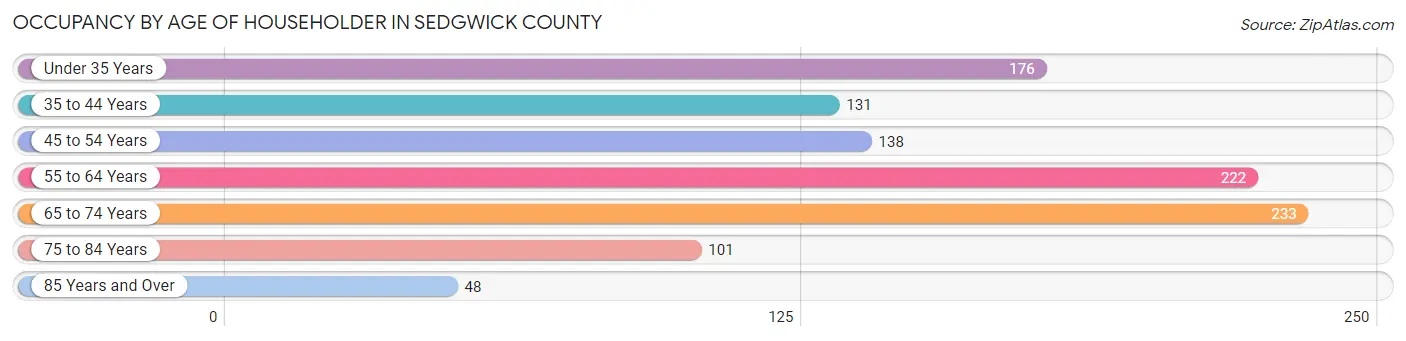
| Age Bracket | # Households | % Households |
| Under 35 Years | 176 | 16.8% |
| 35 to 44 Years | 131 | 12.5% |
| 45 to 54 Years | 138 | 13.2% |
| 55 to 64 Years | 222 | 21.2% |
| 65 to 74 Years | 233 | 22.2% |
| 75 to 84 Years | 101 | 9.6% |
| 85 Years and Over | 48 | 4.6% |
| Total | 1,049 | 100.0% |
Housing Finances in Sedgwick County
Median Income by Occupancy in Sedgwick County
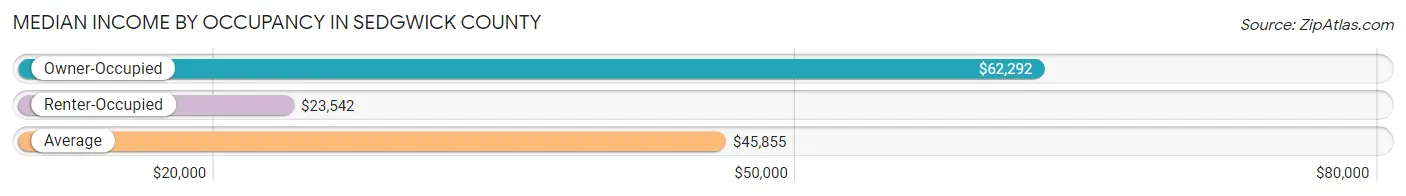
| Occupancy Type | # Households | Median Income |
| Owner-Occupied | 717 (68.3%) | $62,292 |
| Renter-Occupied | 332 (31.7%) | $23,542 |
| Average | 1,049 (100.0%) | $45,855 |
Occupancy by Householder Income Bracket in Sedgwick County
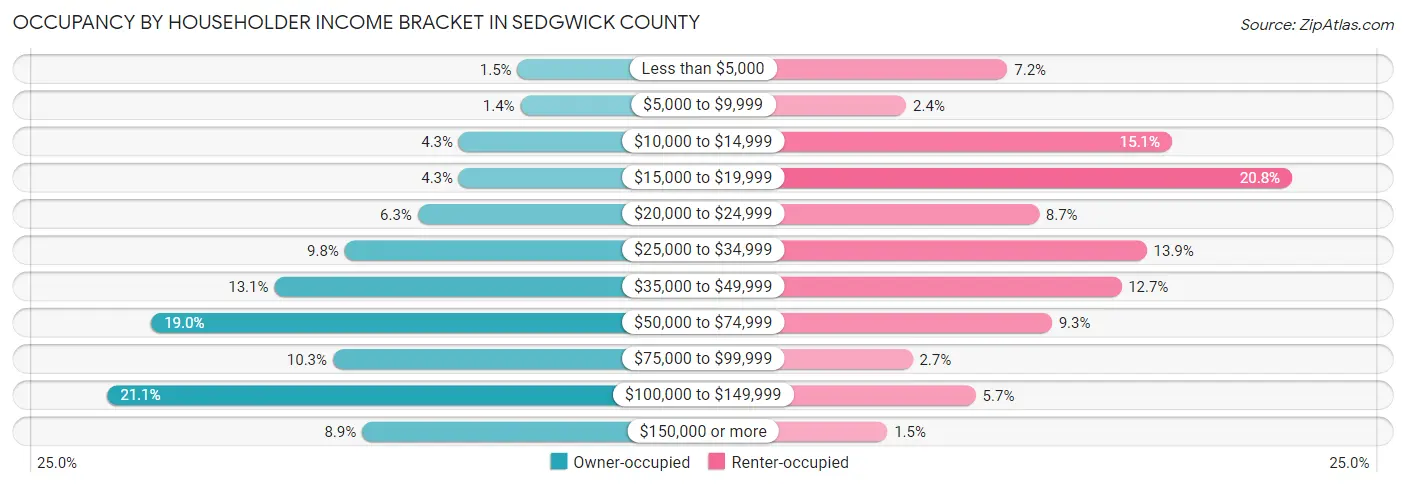
| Income Bracket | Owner-occupied | Renter-occupied |
| Less than $5,000 | 11 (1.5%) | 24 (7.2%) |
| $5,000 to $9,999 | 10 (1.4%) | 8 (2.4%) |
| $10,000 to $14,999 | 31 (4.3%) | 50 (15.1%) |
| $15,000 to $19,999 | 31 (4.3%) | 69 (20.8%) |
| $20,000 to $24,999 | 45 (6.3%) | 29 (8.7%) |
| $25,000 to $34,999 | 70 (9.8%) | 46 (13.9%) |
| $35,000 to $49,999 | 94 (13.1%) | 42 (12.7%) |
| $50,000 to $74,999 | 136 (19.0%) | 31 (9.3%) |
| $75,000 to $99,999 | 74 (10.3%) | 9 (2.7%) |
| $100,000 to $149,999 | 151 (21.1%) | 19 (5.7%) |
| $150,000 or more | 64 (8.9%) | 5 (1.5%) |
| Total | 717 (100.0%) | 332 (100.0%) |
Monthly Housing Cost Tiers in Sedgwick County
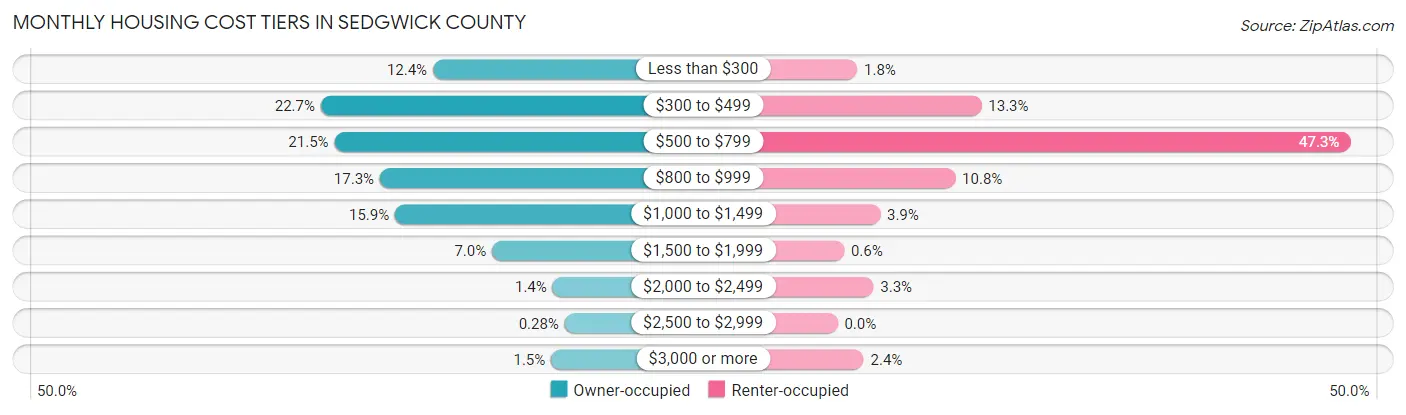
| Monthly Cost | Owner-occupied | Renter-occupied |
| Less than $300 | 89 (12.4%) | 6 (1.8%) |
| $300 to $499 | 163 (22.7%) | 44 (13.3%) |
| $500 to $799 | 154 (21.5%) | 157 (47.3%) |
| $800 to $999 | 124 (17.3%) | 36 (10.8%) |
| $1,000 to $1,499 | 114 (15.9%) | 13 (3.9%) |
| $1,500 to $1,999 | 50 (7.0%) | 2 (0.6%) |
| $2,000 to $2,499 | 10 (1.4%) | 11 (3.3%) |
| $2,500 to $2,999 | 2 (0.3%) | 0 (0.0%) |
| $3,000 or more | 11 (1.5%) | 8 (2.4%) |
| Total | 717 (100.0%) | 332 (100.0%) |
Physical Housing Characteristics in Sedgwick County
Housing Structures in Sedgwick County
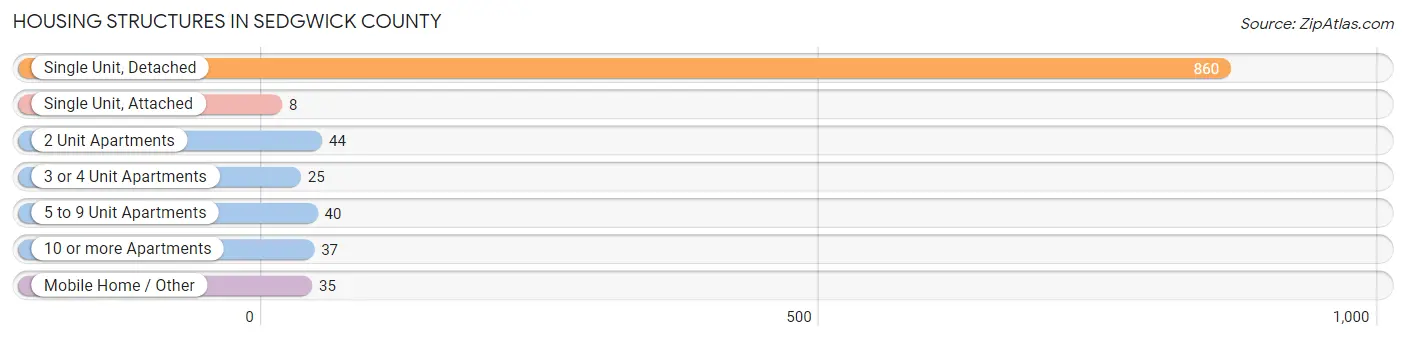
| Structure Type | # Housing Units | % Housing Units |
| Single Unit, Detached | 860 | 82.0% |
| Single Unit, Attached | 8 | 0.8% |
| 2 Unit Apartments | 44 | 4.2% |
| 3 or 4 Unit Apartments | 25 | 2.4% |
| 5 to 9 Unit Apartments | 40 | 3.8% |
| 10 or more Apartments | 37 | 3.5% |
| Mobile Home / Other | 35 | 3.3% |
| Total | 1,049 | 100.0% |
Housing Structures by Occupancy in Sedgwick County
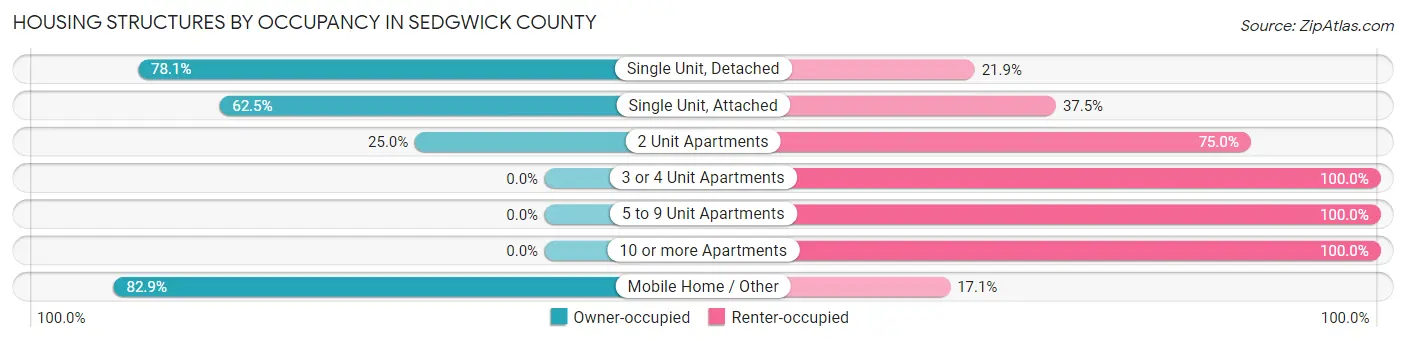
| Structure Type | Owner-occupied | Renter-occupied |
| Single Unit, Detached | 672 (78.1%) | 188 (21.9%) |
| Single Unit, Attached | 5 (62.5%) | 3 (37.5%) |
| 2 Unit Apartments | 11 (25.0%) | 33 (75.0%) |
| 3 or 4 Unit Apartments | 0 (0.0%) | 25 (100.0%) |
| 5 to 9 Unit Apartments | 0 (0.0%) | 40 (100.0%) |
| 10 or more Apartments | 0 (0.0%) | 37 (100.0%) |
| Mobile Home / Other | 29 (82.9%) | 6 (17.1%) |
| Total | 717 (68.3%) | 332 (31.7%) |
Housing Structures by Number of Rooms in Sedgwick County
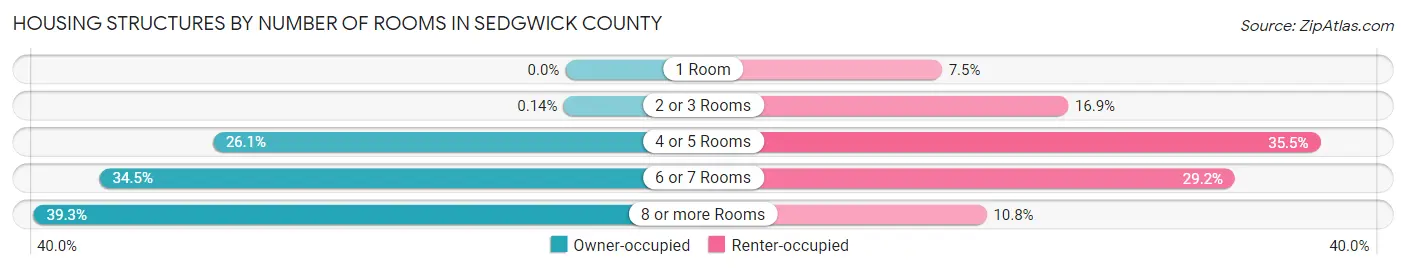
| Number of Rooms | Owner-occupied | Renter-occupied |
| 1 Room | 0 (0.0%) | 25 (7.5%) |
| 2 or 3 Rooms | 1 (0.1%) | 56 (16.9%) |
| 4 or 5 Rooms | 187 (26.1%) | 118 (35.5%) |
| 6 or 7 Rooms | 247 (34.4%) | 97 (29.2%) |
| 8 or more Rooms | 282 (39.3%) | 36 (10.8%) |
| Total | 717 (100.0%) | 332 (100.0%) |
Housing Structure by Heating Type in Sedgwick County
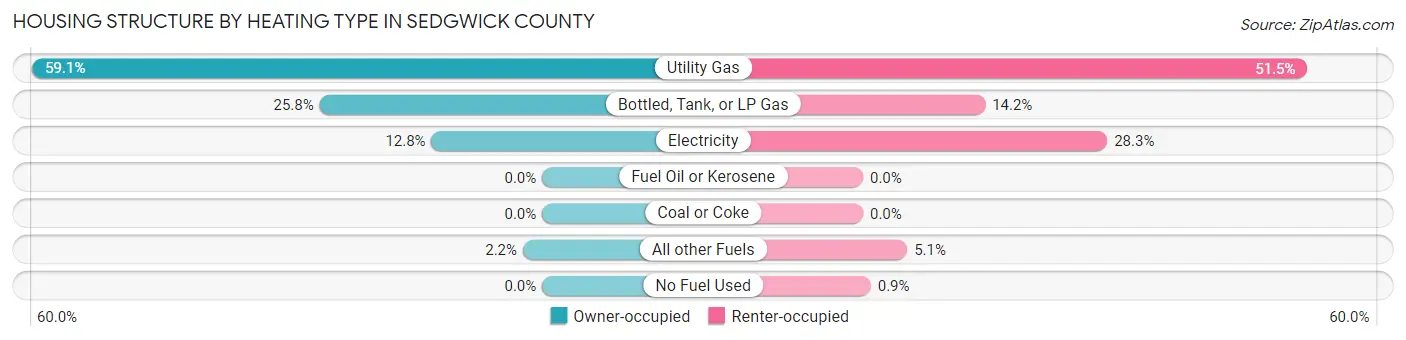
| Heating Type | Owner-occupied | Renter-occupied |
| Utility Gas | 424 (59.1%) | 171 (51.5%) |
| Bottled, Tank, or LP Gas | 185 (25.8%) | 47 (14.2%) |
| Electricity | 92 (12.8%) | 94 (28.3%) |
| Fuel Oil or Kerosene | 0 (0.0%) | 0 (0.0%) |
| Coal or Coke | 0 (0.0%) | 0 (0.0%) |
| All other Fuels | 16 (2.2%) | 17 (5.1%) |
| No Fuel Used | 0 (0.0%) | 3 (0.9%) |
| Total | 717 (100.0%) | 332 (100.0%) |
Household Vehicle Usage in Sedgwick County
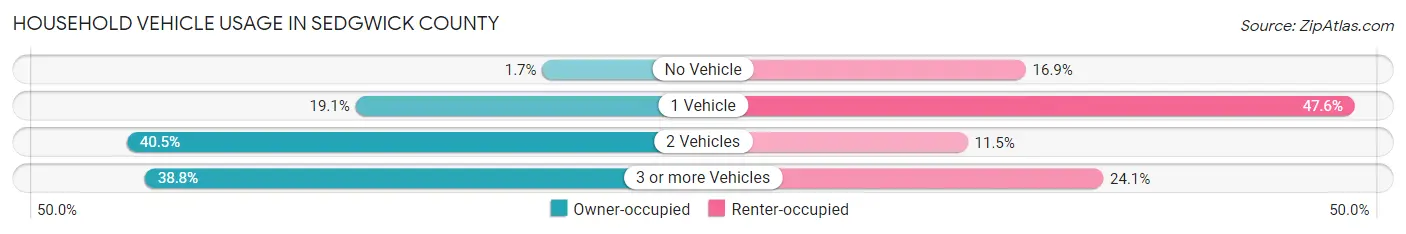
| Vehicles per Household | Owner-occupied | Renter-occupied |
| No Vehicle | 12 (1.7%) | 56 (16.9%) |
| 1 Vehicle | 137 (19.1%) | 158 (47.6%) |
| 2 Vehicles | 290 (40.5%) | 38 (11.5%) |
| 3 or more Vehicles | 278 (38.8%) | 80 (24.1%) |
| Total | 717 (100.0%) | 332 (100.0%) |
Real Estate & Mortgages in Sedgwick County
Real Estate and Mortgage Overview in Sedgwick County
| Characteristic | Without Mortgage | With Mortgage |
| Housing Units | 397 | 320 |
| Median Property Value | $119,400 | $150,000 |
| Median Household Income | $52,772 | $25 |
| Monthly Housing Costs | $442 | $10 |
| Real Estate Taxes | $532 | $3 |
Property Value by Mortgage Status in Sedgwick County
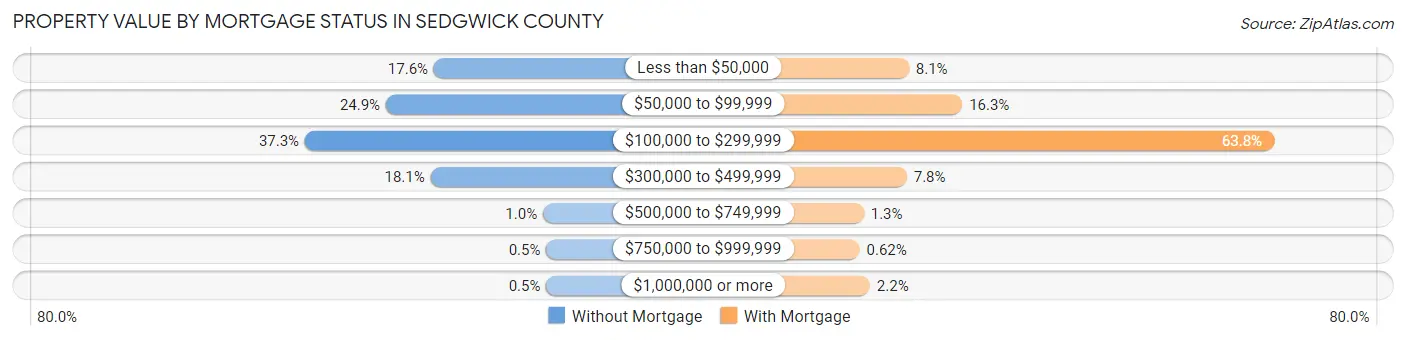
| Property Value | Without Mortgage | With Mortgage |
| Less than $50,000 | 70 (17.6%) | 26 (8.1%) |
| $50,000 to $99,999 | 99 (24.9%) | 52 (16.3%) |
| $100,000 to $299,999 | 148 (37.3%) | 204 (63.7%) |
| $300,000 to $499,999 | 72 (18.1%) | 25 (7.8%) |
| $500,000 to $749,999 | 4 (1.0%) | 4 (1.3%) |
| $750,000 to $999,999 | 2 (0.5%) | 2 (0.6%) |
| $1,000,000 or more | 2 (0.5%) | 7 (2.2%) |
| Total | 397 (100.0%) | 320 (100.0%) |
Household Income by Mortgage Status in Sedgwick County
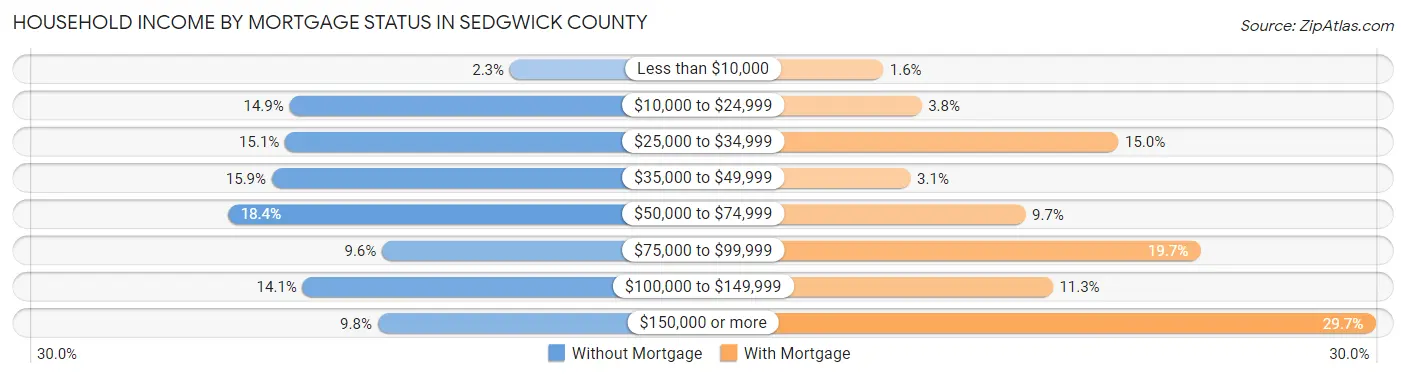
| Household Income | Without Mortgage | With Mortgage |
| Less than $10,000 | 9 (2.3%) | 5 (1.6%) |
| $10,000 to $24,999 | 59 (14.9%) | 12 (3.7%) |
| $25,000 to $34,999 | 60 (15.1%) | 48 (15.0%) |
| $35,000 to $49,999 | 63 (15.9%) | 10 (3.1%) |
| $50,000 to $74,999 | 73 (18.4%) | 31 (9.7%) |
| $75,000 to $99,999 | 38 (9.6%) | 63 (19.7%) |
| $100,000 to $149,999 | 56 (14.1%) | 36 (11.3%) |
| $150,000 or more | 39 (9.8%) | 95 (29.7%) |
| Total | 397 (100.0%) | 320 (100.0%) |
Property Value to Household Income Ratio in Sedgwick County
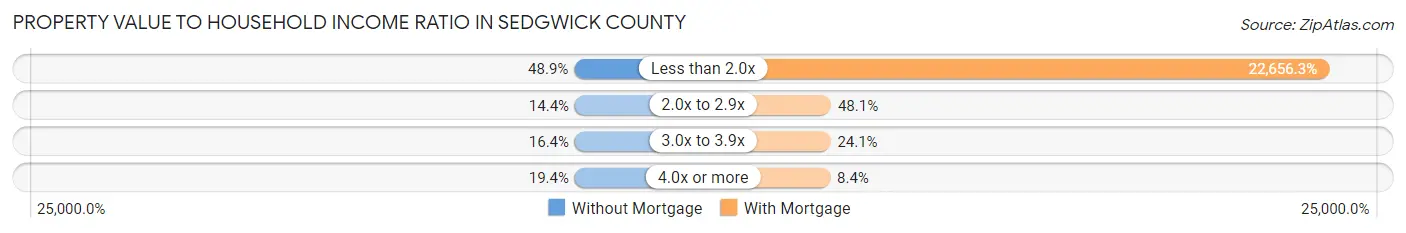
| Value-to-Income Ratio | Without Mortgage | With Mortgage |
| Less than 2.0x | 194 (48.9%) | 72,500 (22,656.2%) |
| 2.0x to 2.9x | 57 (14.4%) | 154 (48.1%) |
| 3.0x to 3.9x | 65 (16.4%) | 77 (24.1%) |
| 4.0x or more | 77 (19.4%) | 27 (8.4%) |
| Total | 397 (100.0%) | 320 (100.0%) |
Real Estate Taxes by Mortgage Status in Sedgwick County
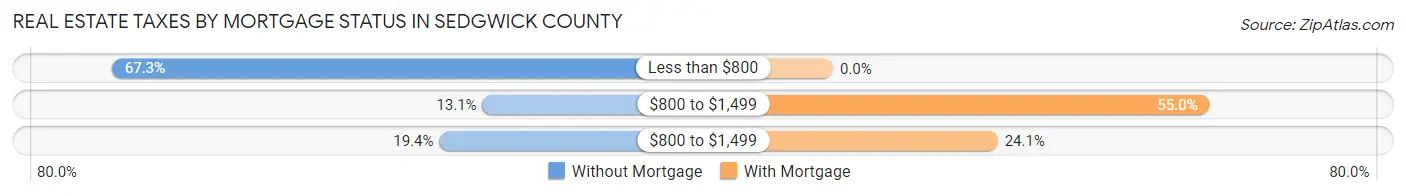
| Property Taxes | Without Mortgage | With Mortgage |
| Less than $800 | 267 (67.2%) | 0 (0.0%) |
| $800 to $1,499 | 52 (13.1%) | 176 (55.0%) |
| $800 to $1,499 | 77 (19.4%) | 77 (24.1%) |
| Total | 397 (100.0%) | 320 (100.0%) |
Health & Disability in Sedgwick County
Health Insurance Coverage by Age in Sedgwick County
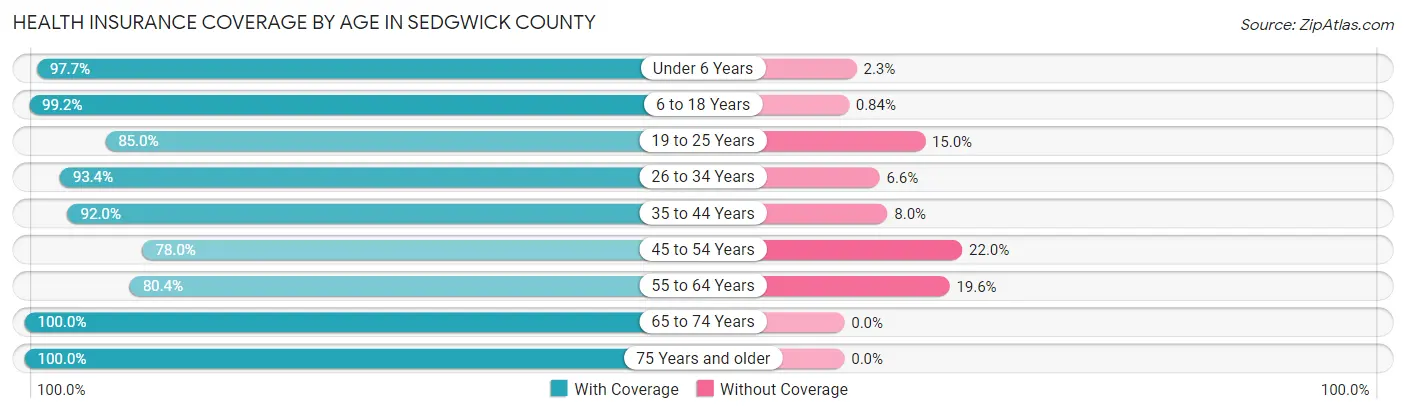
| Age Bracket | With Coverage | Without Coverage |
| Under 6 Years | 214 (97.7%) | 5 (2.3%) |
| 6 to 18 Years | 354 (99.2%) | 3 (0.8%) |
| 19 to 25 Years | 96 (85.0%) | 17 (15.0%) |
| 26 to 34 Years | 199 (93.4%) | 14 (6.6%) |
| 35 to 44 Years | 275 (92.0%) | 24 (8.0%) |
| 45 to 54 Years | 174 (78.0%) | 49 (22.0%) |
| 55 to 64 Years | 291 (80.4%) | 71 (19.6%) |
| 65 to 74 Years | 349 (100.0%) | 0 (0.0%) |
| 75 Years and older | 224 (100.0%) | 0 (0.0%) |
| Total | 2,176 (92.2%) | 183 (7.8%) |
Health Insurance Coverage by Citizenship Status in Sedgwick County
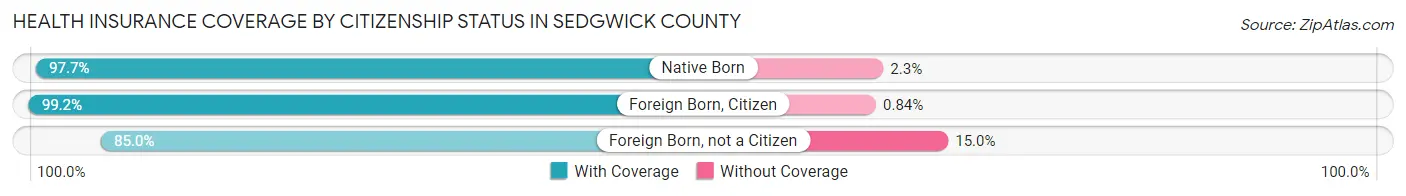
| Citizenship Status | With Coverage | Without Coverage |
| Native Born | 214 (97.7%) | 5 (2.3%) |
| Foreign Born, Citizen | 354 (99.2%) | 3 (0.8%) |
| Foreign Born, not a Citizen | 96 (85.0%) | 17 (15.0%) |
Health Insurance Coverage by Household Income in Sedgwick County

| Household Income | With Coverage | Without Coverage |
| Under $25,000 | 381 (86.2%) | 61 (13.8%) |
| $25,000 to $49,999 | 409 (95.3%) | 20 (4.7%) |
| $50,000 to $74,999 | 388 (90.4%) | 41 (9.6%) |
| $75,000 to $99,999 | 267 (95.7%) | 12 (4.3%) |
| $100,000 and over | 717 (93.6%) | 49 (6.4%) |
Public vs Private Health Insurance Coverage by Age in Sedgwick County
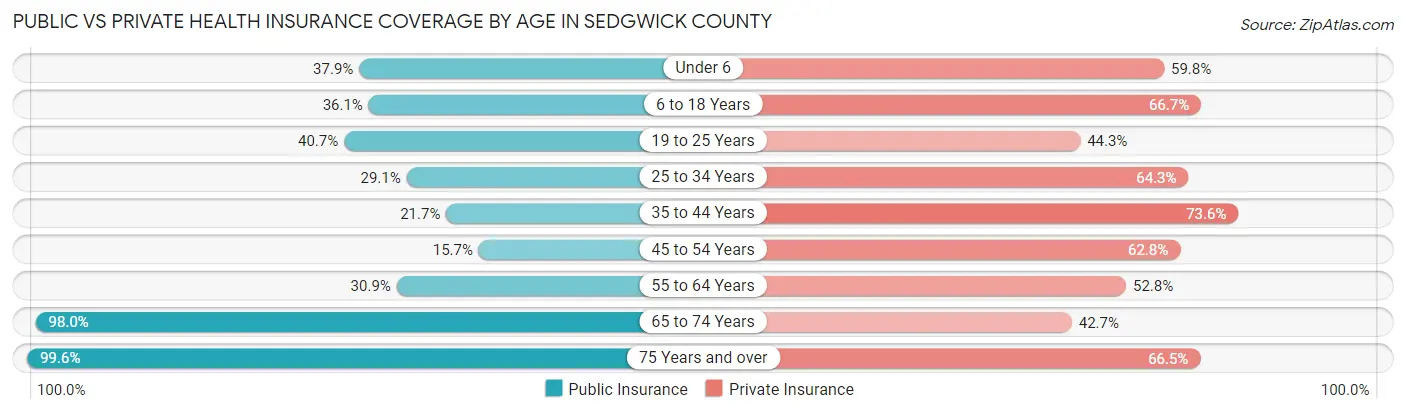
| Age Bracket | Public Insurance | Private Insurance |
| Under 6 | 83 (37.9%) | 131 (59.8%) |
| 6 to 18 Years | 129 (36.1%) | 238 (66.7%) |
| 19 to 25 Years | 46 (40.7%) | 50 (44.3%) |
| 25 to 34 Years | 62 (29.1%) | 137 (64.3%) |
| 35 to 44 Years | 65 (21.7%) | 220 (73.6%) |
| 45 to 54 Years | 35 (15.7%) | 140 (62.8%) |
| 55 to 64 Years | 112 (30.9%) | 191 (52.8%) |
| 65 to 74 Years | 342 (98.0%) | 149 (42.7%) |
| 75 Years and over | 223 (99.6%) | 149 (66.5%) |
| Total | 1,097 (46.5%) | 1,405 (59.6%) |
Disability Status by Sex by Age in Sedgwick County
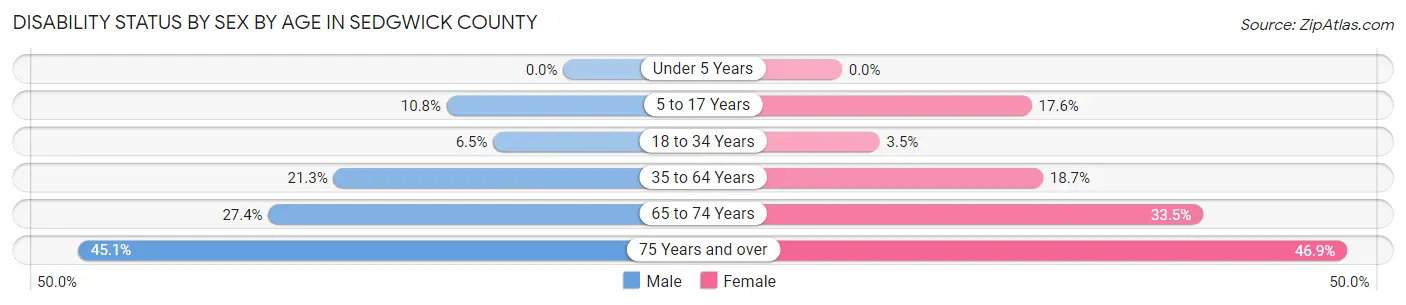
| Age Bracket | Male | Female |
| Under 5 Years | 0 (0.0%) | 0 (0.0%) |
| 5 to 17 Years | 16 (10.8%) | 34 (17.6%) |
| 18 to 34 Years | 13 (6.5%) | 6 (3.5%) |
| 35 to 64 Years | 96 (21.3%) | 81 (18.7%) |
| 65 to 74 Years | 49 (27.4%) | 57 (33.5%) |
| 75 Years and over | 50 (45.1%) | 53 (46.9%) |
Disability Class by Sex by Age in Sedgwick County
Disability Class: Hearing Difficulty
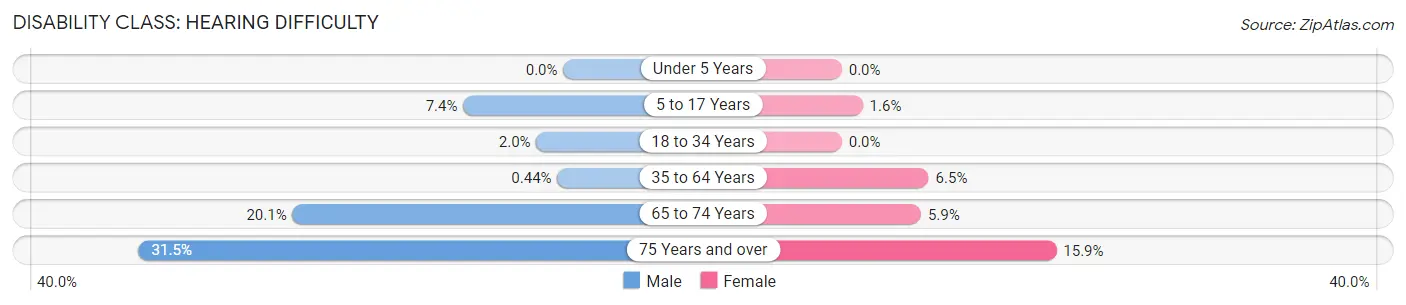
| Age Bracket | Male | Female |
| Under 5 Years | 0 (0.0%) | 0 (0.0%) |
| 5 to 17 Years | 11 (7.4%) | 3 (1.5%) |
| 18 to 34 Years | 4 (2.0%) | 0 (0.0%) |
| 35 to 64 Years | 2 (0.4%) | 28 (6.5%) |
| 65 to 74 Years | 36 (20.1%) | 10 (5.9%) |
| 75 Years and over | 35 (31.5%) | 18 (15.9%) |
Disability Class: Vision Difficulty
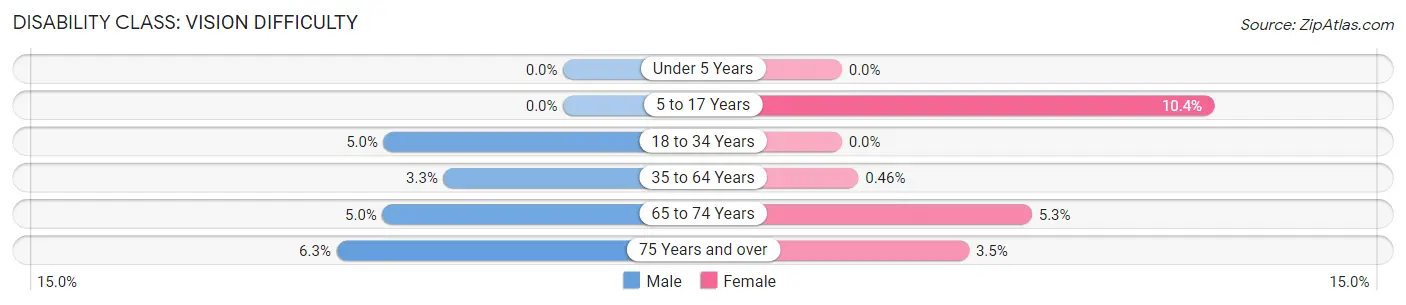
| Age Bracket | Male | Female |
| Under 5 Years | 0 (0.0%) | 0 (0.0%) |
| 5 to 17 Years | 0 (0.0%) | 20 (10.4%) |
| 18 to 34 Years | 10 (5.0%) | 0 (0.0%) |
| 35 to 64 Years | 15 (3.3%) | 2 (0.5%) |
| 65 to 74 Years | 9 (5.0%) | 9 (5.3%) |
| 75 Years and over | 7 (6.3%) | 4 (3.5%) |
Disability Class: Cognitive Difficulty
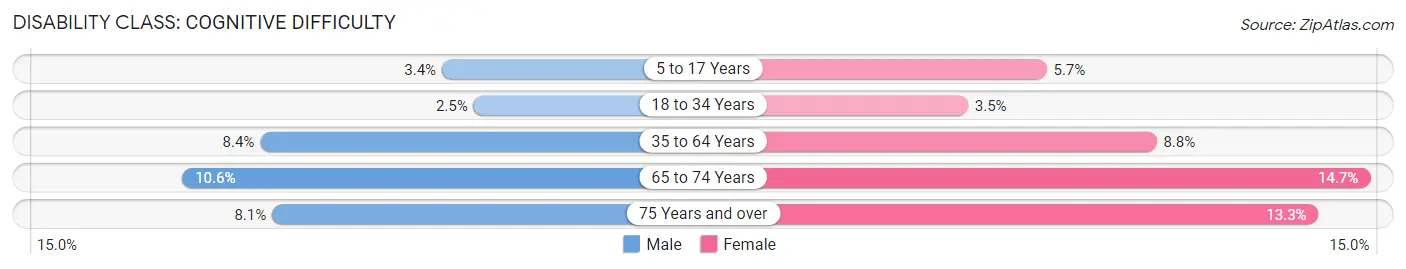
| Age Bracket | Male | Female |
| 5 to 17 Years | 5 (3.4%) | 11 (5.7%) |
| 18 to 34 Years | 5 (2.5%) | 6 (3.5%) |
| 35 to 64 Years | 38 (8.4%) | 38 (8.8%) |
| 65 to 74 Years | 19 (10.6%) | 25 (14.7%) |
| 75 Years and over | 9 (8.1%) | 15 (13.3%) |
Disability Class: Ambulatory Difficulty
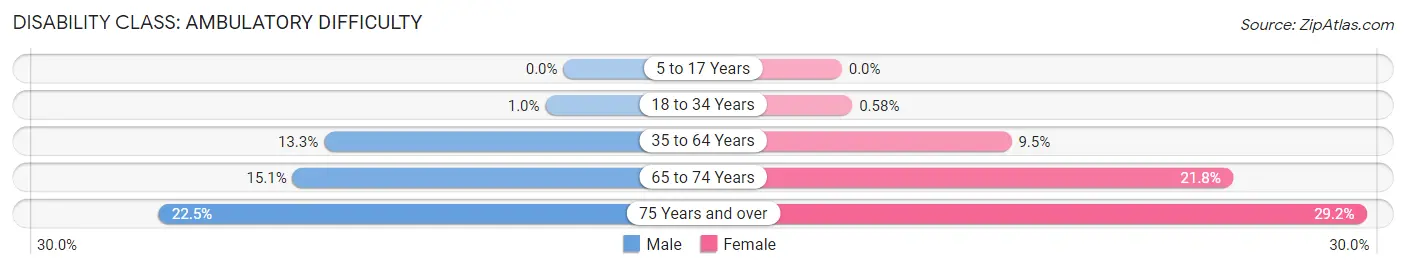
| Age Bracket | Male | Female |
| 5 to 17 Years | 0 (0.0%) | 0 (0.0%) |
| 18 to 34 Years | 2 (1.0%) | 1 (0.6%) |
| 35 to 64 Years | 60 (13.3%) | 41 (9.5%) |
| 65 to 74 Years | 27 (15.1%) | 37 (21.8%) |
| 75 Years and over | 25 (22.5%) | 33 (29.2%) |
Disability Class: Self-Care Difficulty
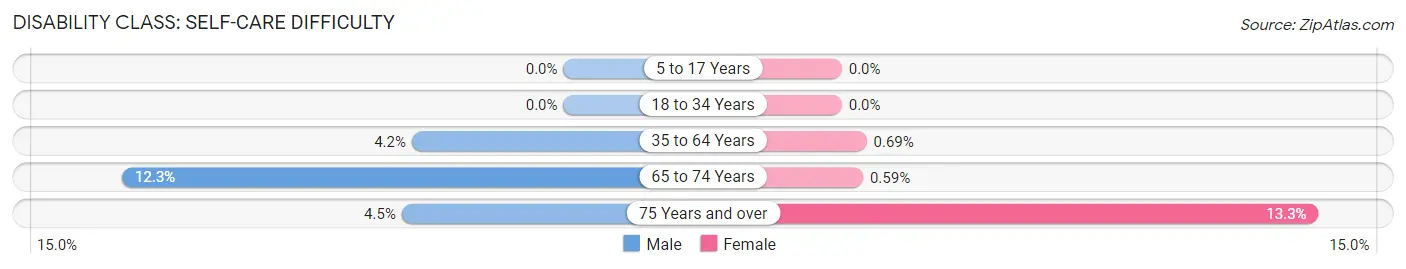
| Age Bracket | Male | Female |
| 5 to 17 Years | 0 (0.0%) | 0 (0.0%) |
| 18 to 34 Years | 0 (0.0%) | 0 (0.0%) |
| 35 to 64 Years | 19 (4.2%) | 3 (0.7%) |
| 65 to 74 Years | 22 (12.3%) | 1 (0.6%) |
| 75 Years and over | 5 (4.5%) | 15 (13.3%) |
Technology Access in Sedgwick County
Computing Device Access in Sedgwick County
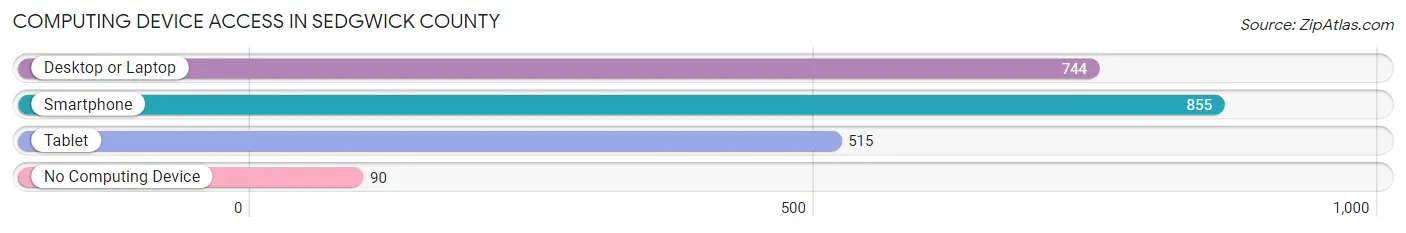
| Device Type | # Households | % Households |
| Desktop or Laptop | 744 | 70.9% |
| Smartphone | 855 | 81.5% |
| Tablet | 515 | 49.1% |
| No Computing Device | 90 | 8.6% |
| Total | 1,049 | 100.0% |
Internet Access in Sedgwick County
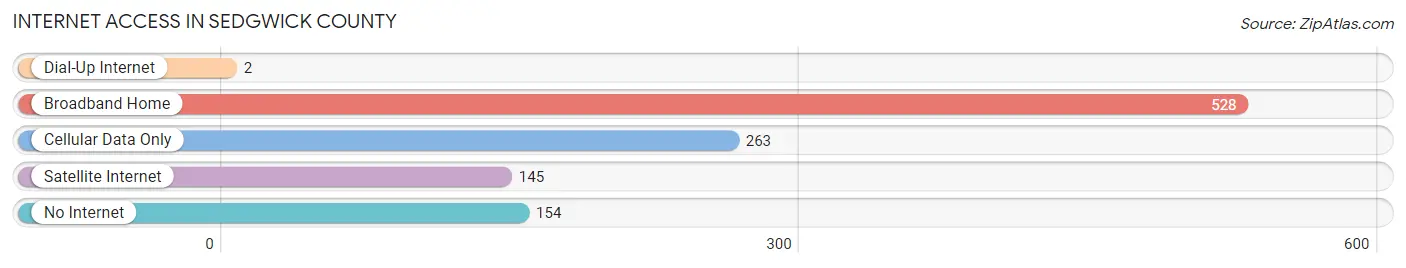
| Internet Type | # Households | % Households |
| Dial-Up Internet | 2 | 0.2% |
| Broadband Home | 528 | 50.3% |
| Cellular Data Only | 263 | 25.1% |
| Satellite Internet | 145 | 13.8% |
| No Internet | 154 | 14.7% |
| Total | 1,049 | 100.0% |
Sedgwick County Summary
Sedgwick County is located in the northeastern corner of Colorado, and is bordered by Nebraska to the north, Wyoming to the east, and the state of Colorado to the south and west. The county seat is Julesburg, and the county is named after Fort Sedgwick, which was established in 1865. The county has a total area of 1,845 square miles, and a population of 2,541 as of the 2010 census.
History
Sedgwick County was established in 1889, and was named after Fort Sedgwick, which was established in 1865. The fort was named after Major General John Sedgwick, who was killed in the Civil War. The county was originally part of Weld County, and was created to provide better access to the Union Pacific Railroad.
The county was originally populated by Native Americans, including the Arapaho, Cheyenne, and Sioux tribes. The first white settlers arrived in the area in the late 1860s, and the county was officially established in 1889.
Geography
Sedgwick County is located in the northeastern corner of Colorado, and is bordered by Nebraska to the north, Wyoming to the east, and the state of Colorado to the south and west. The county has a total area of 1,845 square miles, and is mostly flat, with some rolling hills in the western part of the county. The county is located in the High Plains region of Colorado, and is part of the Great Plains.
The county is home to several rivers, including the South Platte River, the North Platte River, and the Republican River. The county also contains several reservoirs, including the Julesburg Reservoir, the Sedgwick Reservoir, and the Ovid Reservoir.
Economy
The economy of Sedgwick County is largely based on agriculture, with the county being home to several large farms and ranches. The county is also home to several oil and gas fields, and is a major producer of oil and natural gas.
The county is also home to several manufacturing companies, including a large meat packing plant, a plastics factory, and a metal fabrication plant. The county is also home to several retail stores, including a Walmart Supercenter, a Home Depot, and several other stores.
Demographics
As of the 2010 census, the population of Sedgwick County was 2,541, with a population density of 1.4 people per square mile. The racial makeup of the county was 95.3% White, 0.4% African American, 0.2% Native American, 0.2% Asian, 0.1% Pacific Islander, 2.2% from other races, and 1.7% from two or more races. Hispanic or Latino of any race were 4.3% of the population.
The median income for a household in the county was $41,250, and the median income for a family was $48,750. The per capita income for the county was $19,945. About 11.2% of families and 14.2% of the population were below the poverty line, including 17.2% of those under age 18 and 8.2% of those age 65 or over.
Common Questions
What is Per Capita Income in Sedgwick County?
Per Capita income in Sedgwick County is $32,776.
What is the Median Family Income in Sedgwick County?
Median Family Income in Sedgwick County is $72,031.
What is the Median Household income in Sedgwick County?
Median Household Income in Sedgwick County is $45,855.
What is Income or Wage Gap in Sedgwick County?
Income or Wage Gap in Sedgwick County is 23.6%.
Women in Sedgwick County earn 76.4 cents for every dollar earned by a man.
What is Inequality or Gini Index in Sedgwick County?
Inequality or Gini Index in Sedgwick County is 0.50.
What is the Total Population of Sedgwick County?
Total Population of Sedgwick County is 2,391.
What is the Total Male Population of Sedgwick County?
Total Male Population of Sedgwick County is 1,208.
What is the Total Female Population of Sedgwick County?
Total Female Population of Sedgwick County is 1,183.
What is the Ratio of Males per 100 Females in Sedgwick County?
There are 102.11 Males per 100 Females in Sedgwick County.
What is the Ratio of Females per 100 Males in Sedgwick County?
There are 97.93 Females per 100 Males in Sedgwick County.
What is the Median Population Age in Sedgwick County?
Median Population Age in Sedgwick County is 44.5 Years.
What is the Average Family Size in Sedgwick County
Average Family Size in Sedgwick County is 3.1 People.
What is the Average Household Size in Sedgwick County
Average Household Size in Sedgwick County is 2.2 People.
How Large is the Labor Force in Sedgwick County?
There are 1,111 People in the Labor Forcein in Sedgwick County.
What is the Percentage of People in the Labor Force in Sedgwick County?
57.5% of People are in the Labor Force in Sedgwick County.
What is the Unemployment Rate in Sedgwick County?
Unemployment Rate in Sedgwick County is 3.3%.