San Miguel County, CO Map & Demographics
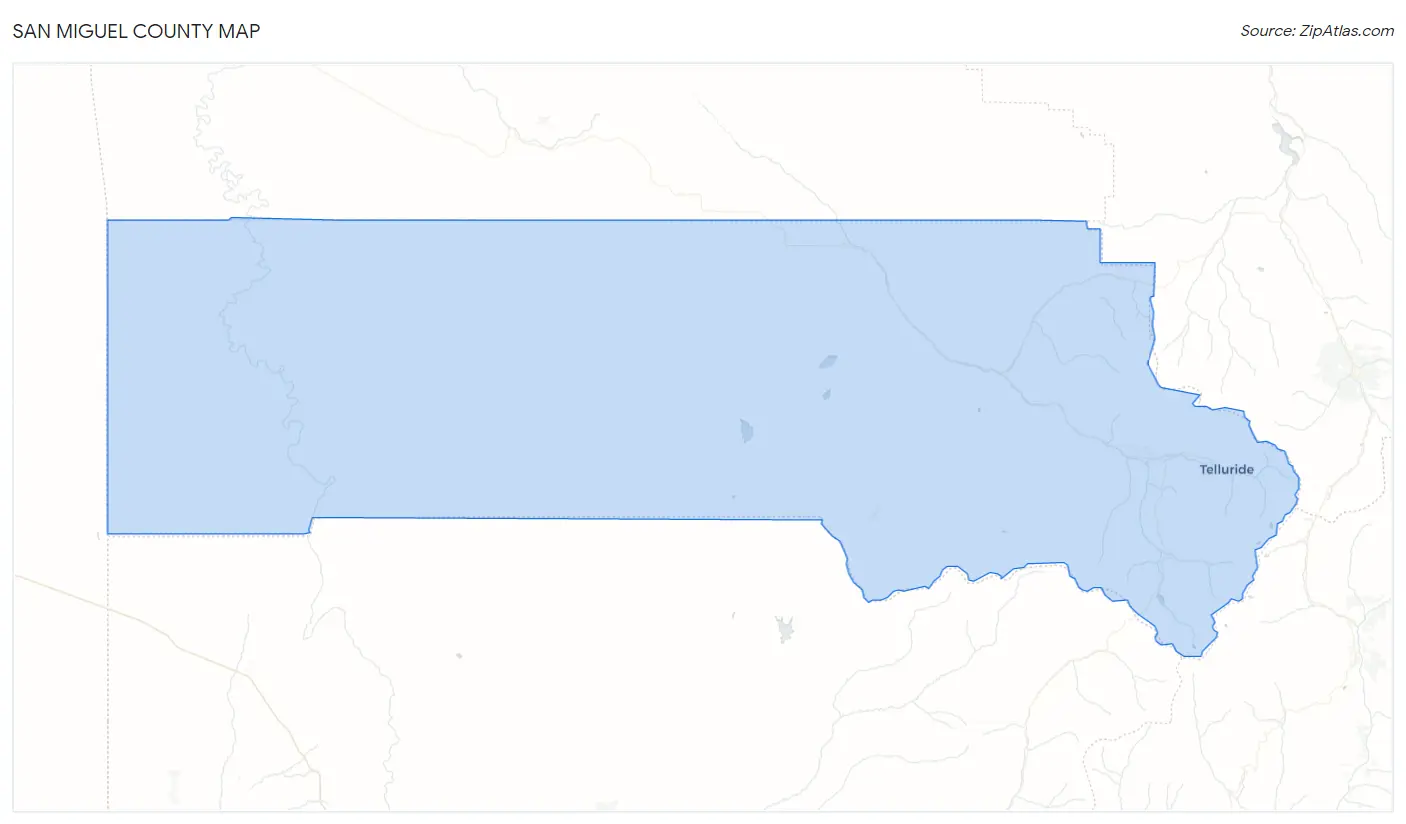
San Miguel County Map
San Miguel County Overview
$55,184
PER CAPITA INCOME
$97,472
AVG FAMILY INCOME
$72,829
AVG HOUSEHOLD INCOME
7.8%
WAGE / INCOME GAP [ % ]
92.2¢/ $1
WAGE / INCOME GAP [ $ ]
$8,587
FAMILY INCOME DEFICIT
0.52
INEQUALITY / GINI INDEX
8,082
TOTAL POPULATION
4,417
MALE POPULATION
3,665
FEMALE POPULATION
120.52
MALES / 100 FEMALES
82.97
FEMALES / 100 MALES
41.9
MEDIAN AGE
2.6
AVG FAMILY SIZE
2.1
AVG HOUSEHOLD SIZE
5,131
LABOR FORCE [ PEOPLE ]
74.2%
PERCENT IN LABOR FORCE
3.7%
UNEMPLOYMENT RATE
San Miguel County Area Codes
Income in San Miguel County
Income Overview in San Miguel County
Per Capita Income in San Miguel County is $55,184, while median incomes of families and households are $97,472 and $72,829 respectively.
| Characteristic | Number | Measure |
| Per Capita Income | 8,082 | $55,184 |
| Median Family Income | 1,969 | $97,472 |
| Mean Family Income | 1,969 | $150,410 |
| Median Household Income | 3,850 | $72,829 |
| Mean Household Income | 3,850 | $113,806 |
| Income Deficit | 1,969 | $8,587 |
| Wage / Income Gap (%) | 8,082 | 7.85% |
| Wage / Income Gap ($) | 8,082 | 92.15¢ per $1 |
| Gini / Inequality Index | 8,082 | 0.52 |
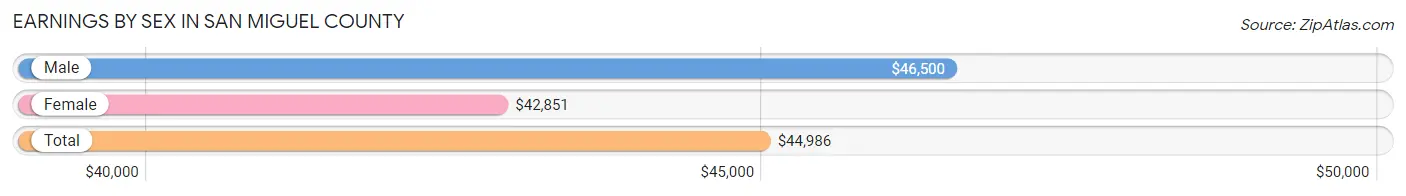
Earnings by Sex in San Miguel County
Average Earnings in San Miguel County are $44,986, $46,500 for men and $42,851 for women, a difference of 7.9%.
| Sex | Number | Average Earnings |
| Male | 3,086 (57.9%) | $46,500 |
| Female | 2,242 (42.1%) | $42,851 |
| Total | 5,328 (100.0%) | $44,986 |
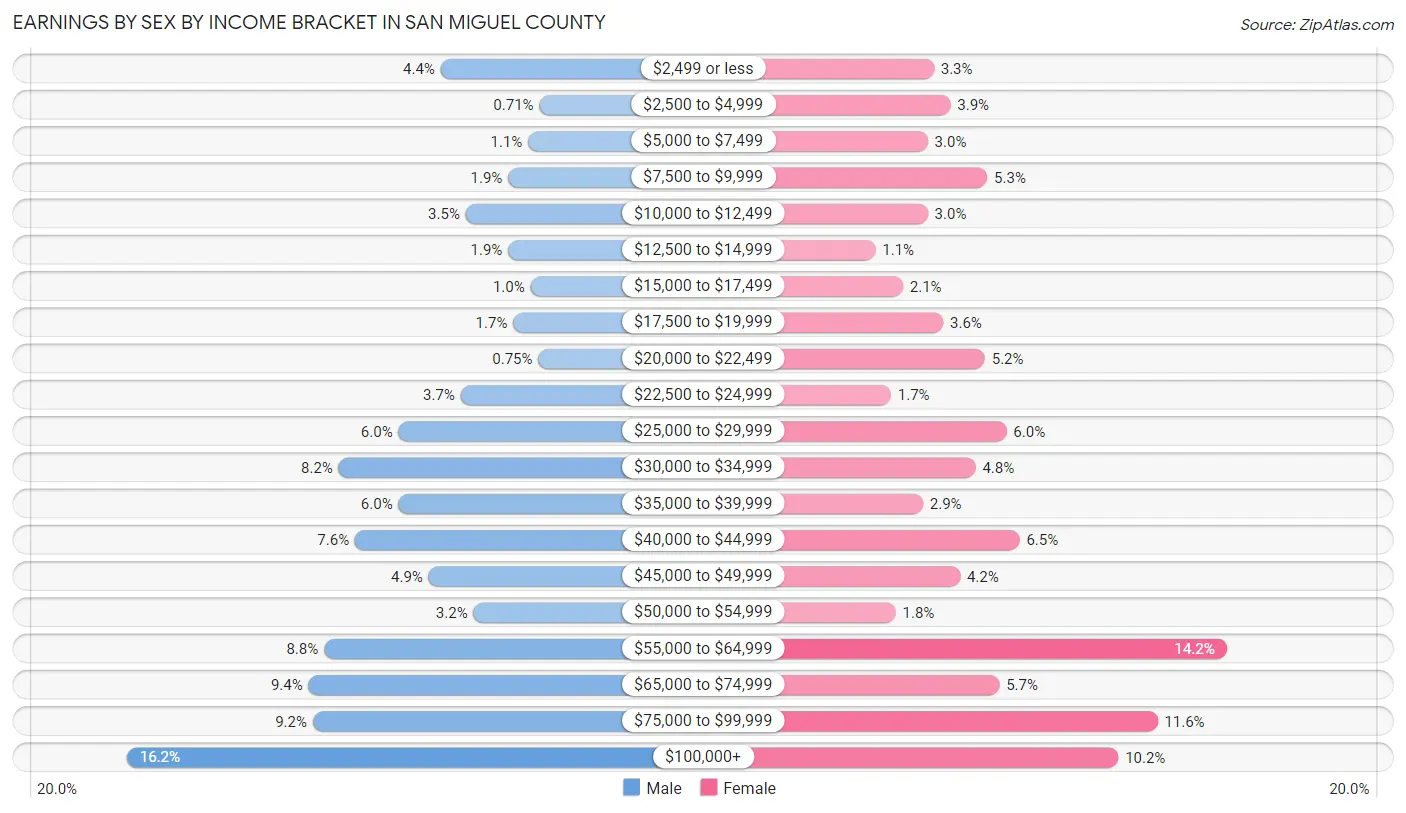
Earnings by Sex by Income Bracket in San Miguel County
The most common earnings brackets in San Miguel County are $100,000+ for men (499 | 16.2%) and $55,000 to $64,999 for women (319 | 14.2%).
| Income | Male | Female |
| $2,499 or less | 136 (4.4%) | 73 (3.3%) |
| $2,500 to $4,999 | 22 (0.7%) | 87 (3.9%) |
| $5,000 to $7,499 | 35 (1.1%) | 68 (3.0%) |
| $7,500 to $9,999 | 58 (1.9%) | 118 (5.3%) |
| $10,000 to $12,499 | 107 (3.5%) | 68 (3.0%) |
| $12,500 to $14,999 | 58 (1.9%) | 24 (1.1%) |
| $15,000 to $17,499 | 32 (1.0%) | 47 (2.1%) |
| $17,500 to $19,999 | 52 (1.7%) | 81 (3.6%) |
| $20,000 to $22,499 | 23 (0.7%) | 116 (5.2%) |
| $22,500 to $24,999 | 113 (3.7%) | 37 (1.7%) |
| $25,000 to $29,999 | 185 (6.0%) | 134 (6.0%) |
| $30,000 to $34,999 | 254 (8.2%) | 108 (4.8%) |
| $35,000 to $39,999 | 185 (6.0%) | 64 (2.9%) |
| $40,000 to $44,999 | 235 (7.6%) | 145 (6.5%) |
| $45,000 to $49,999 | 150 (4.9%) | 95 (4.2%) |
| $50,000 to $54,999 | 98 (3.2%) | 41 (1.8%) |
| $55,000 to $64,999 | 271 (8.8%) | 319 (14.2%) |
| $65,000 to $74,999 | 289 (9.4%) | 128 (5.7%) |
| $75,000 to $99,999 | 284 (9.2%) | 261 (11.6%) |
| $100,000+ | 499 (16.2%) | 228 (10.2%) |
| Total | 3,086 (100.0%) | 2,242 (100.0%) |
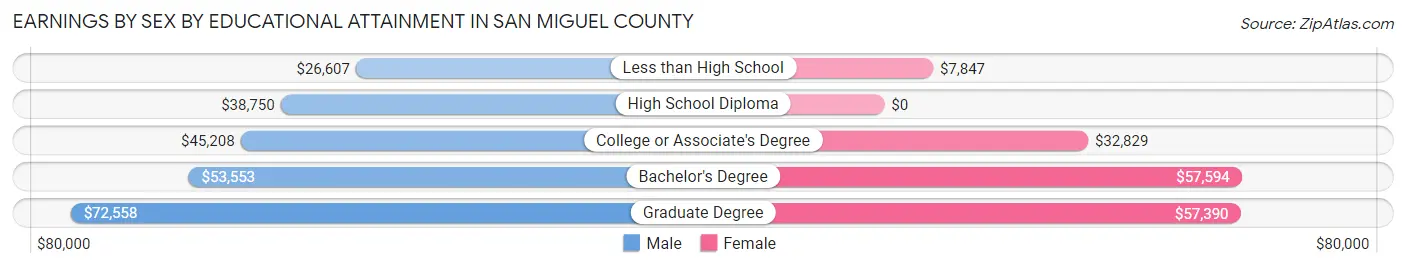
Earnings by Sex by Educational Attainment in San Miguel County
Average earnings in San Miguel County are $49,625 for men and $47,321 for women, a difference of 4.6%. Men with an educational attainment of graduate degree enjoy the highest average annual earnings of $72,558, while those with less than high school education earn the least with $26,607. Women with an educational attainment of bachelor's degree earn the most with the average annual earnings of $57,594, while those with less than high school education have the smallest earnings of $7,847.
| Educational Attainment | Male Income | Female Income |
| Less than High School | $26,607 | $7,847 |
| High School Diploma | $38,750 | $0 |
| College or Associate's Degree | $45,208 | $32,829 |
| Bachelor's Degree | $53,553 | $57,594 |
| Graduate Degree | $72,558 | $57,390 |
| Total | $49,625 | $47,321 |
Family Income in San Miguel County
Family Income Brackets in San Miguel County
According to the San Miguel County family income data, there are 368 families falling into the $200,000+ income range, which is the most common income bracket and makes up 18.7% of all families. Conversely, the $10,000 to $14,999 income bracket is the least frequent group with only 16 families (0.8%) belonging to this category.
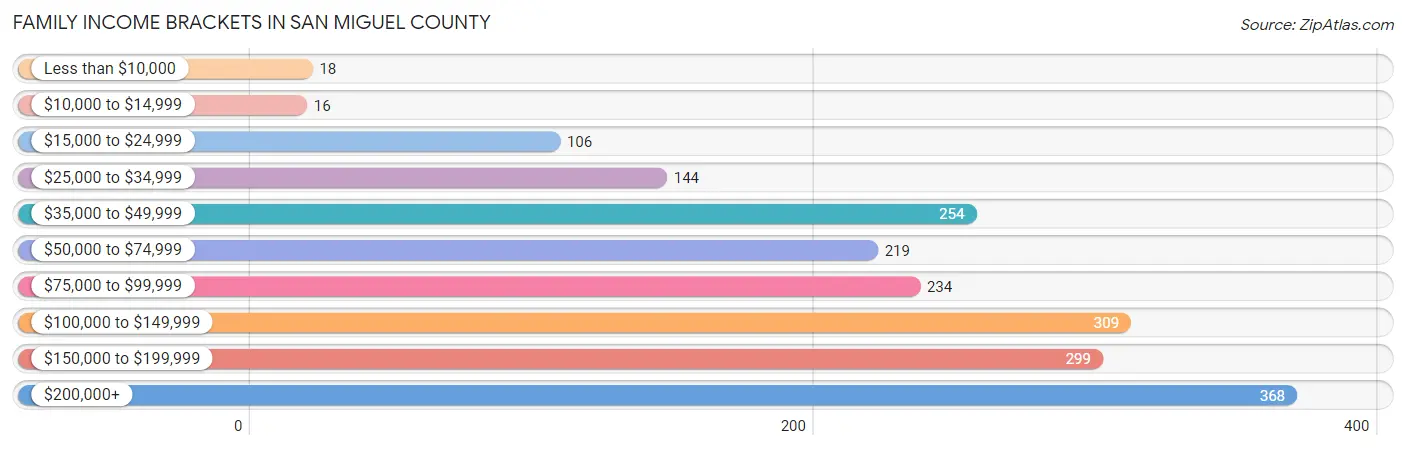
| Income Bracket | # Families | % Families |
| Less than $10,000 | 18 | 0.9% |
| $10,000 to $14,999 | 16 | 0.8% |
| $15,000 to $24,999 | 106 | 5.4% |
| $25,000 to $34,999 | 144 | 7.3% |
| $35,000 to $49,999 | 254 | 12.9% |
| $50,000 to $74,999 | 219 | 11.1% |
| $75,000 to $99,999 | 234 | 11.9% |
| $100,000 to $149,999 | 309 | 15.7% |
| $150,000 to $199,999 | 299 | 15.2% |
| $200,000+ | 368 | 18.7% |
Family Income by Famaliy Size in San Miguel County
4-person families (305 | 15.5%) account for the highest median family income in San Miguel County with $142,250 per family, while 2-person families (1,080 | 54.8%) have the highest median income of $46,706 per family member.
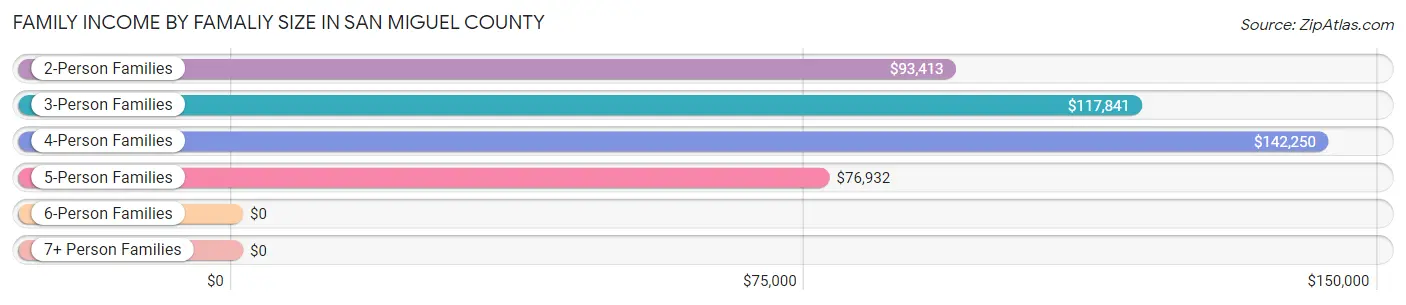
| Income Bracket | # Families | Median Income |
| 2-Person Families | 1,080 (54.8%) | $93,413 |
| 3-Person Families | 457 (23.2%) | $117,841 |
| 4-Person Families | 305 (15.5%) | $142,250 |
| 5-Person Families | 105 (5.3%) | $76,932 |
| 6-Person Families | 22 (1.1%) | $0 |
| 7+ Person Families | 0 (0.0%) | $0 |
| Total | 1,969 (100.0%) | $97,472 |
Family Income by Number of Earners in San Miguel County
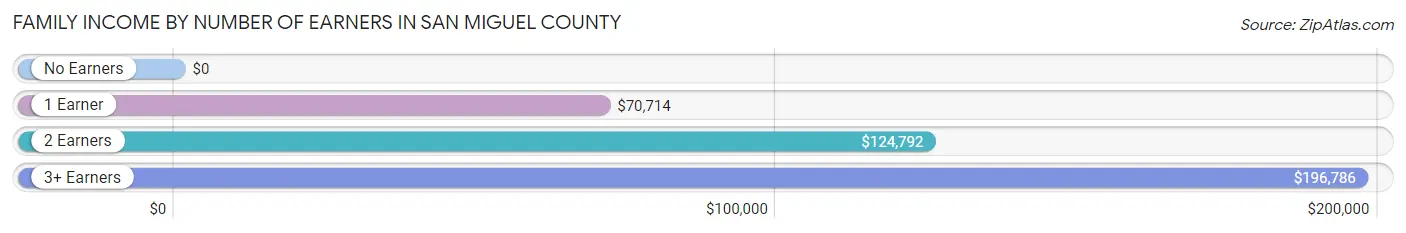
| Number of Earners | # Families | Median Income |
| No Earners | 291 (14.8%) | $0 |
| 1 Earner | 566 (28.7%) | $70,714 |
| 2 Earners | 1,062 (53.9%) | $124,792 |
| 3+ Earners | 50 (2.5%) | $196,786 |
| Total | 1,969 (100.0%) | $97,472 |
Household Income in San Miguel County
Household Income Brackets in San Miguel County
With 616 households falling in the category, the $50,000 to $74,999 income range is the most frequent in San Miguel County, accounting for 16.0% of all households. In contrast, only 104 households (2.7%) fall into the $10,000 to $14,999 income bracket, making it the least populous group.
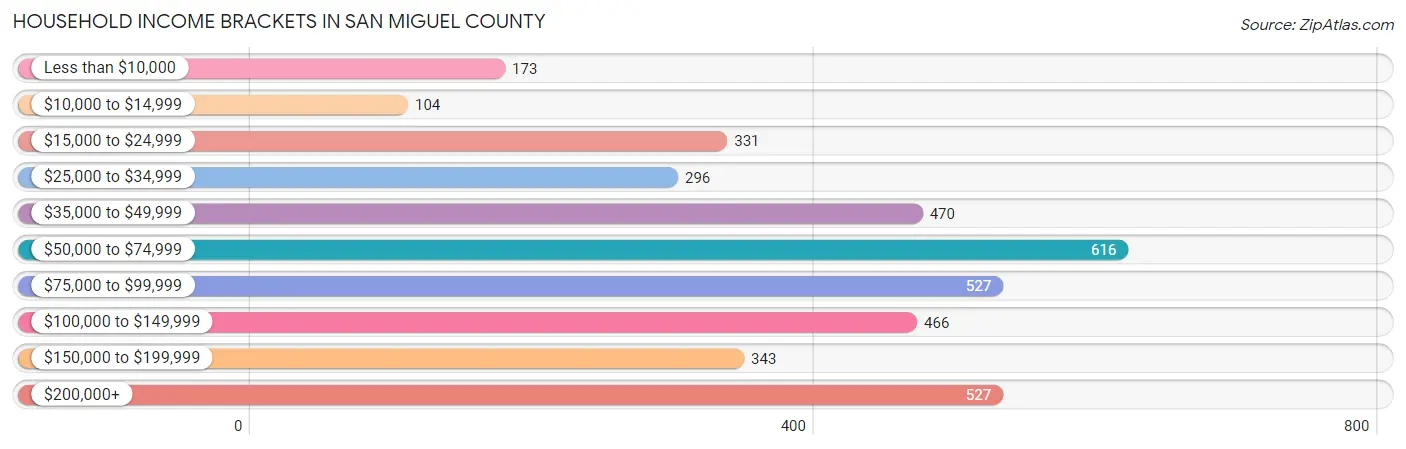
| Income Bracket | # Households | % Households |
| Less than $10,000 | 173 | 4.5% |
| $10,000 to $14,999 | 104 | 2.7% |
| $15,000 to $24,999 | 331 | 8.6% |
| $25,000 to $34,999 | 296 | 7.7% |
| $35,000 to $49,999 | 470 | 12.2% |
| $50,000 to $74,999 | 616 | 16.0% |
| $75,000 to $99,999 | 527 | 13.7% |
| $100,000 to $149,999 | 466 | 12.1% |
| $150,000 to $199,999 | 343 | 8.9% |
| $200,000+ | 527 | 13.7% |
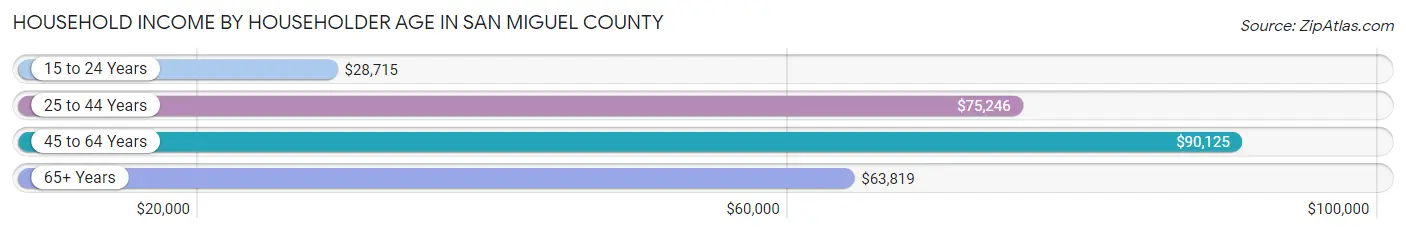
Household Income by Householder Age in San Miguel County
The median household income in San Miguel County is $72,829, with the highest median household income of $90,125 found in the 45 to 64 years age bracket for the primary householder. A total of 1,457 households (37.8%) fall into this category. Meanwhile, the 15 to 24 years age bracket for the primary householder has the lowest median household income of $28,715, with 159 households (4.1%) in this group.
| Income Bracket | # Households | Median Income |
| 15 to 24 Years | 159 (4.1%) | $28,715 |
| 25 to 44 Years | 1,364 (35.4%) | $75,246 |
| 45 to 64 Years | 1,457 (37.8%) | $90,125 |
| 65+ Years | 870 (22.6%) | $63,819 |
| Total | 3,850 (100.0%) | $72,829 |
Poverty in San Miguel County
Income Below Poverty by Sex and Age in San Miguel County
With 7.6% poverty level for males and 9.6% for females among the residents of San Miguel County, 16 and 17 year old males and 18 to 24 year old females are the most vulnerable to poverty, with 32 males (38.6%) and 57 females (21.9%) in their respective age groups living below the poverty level.
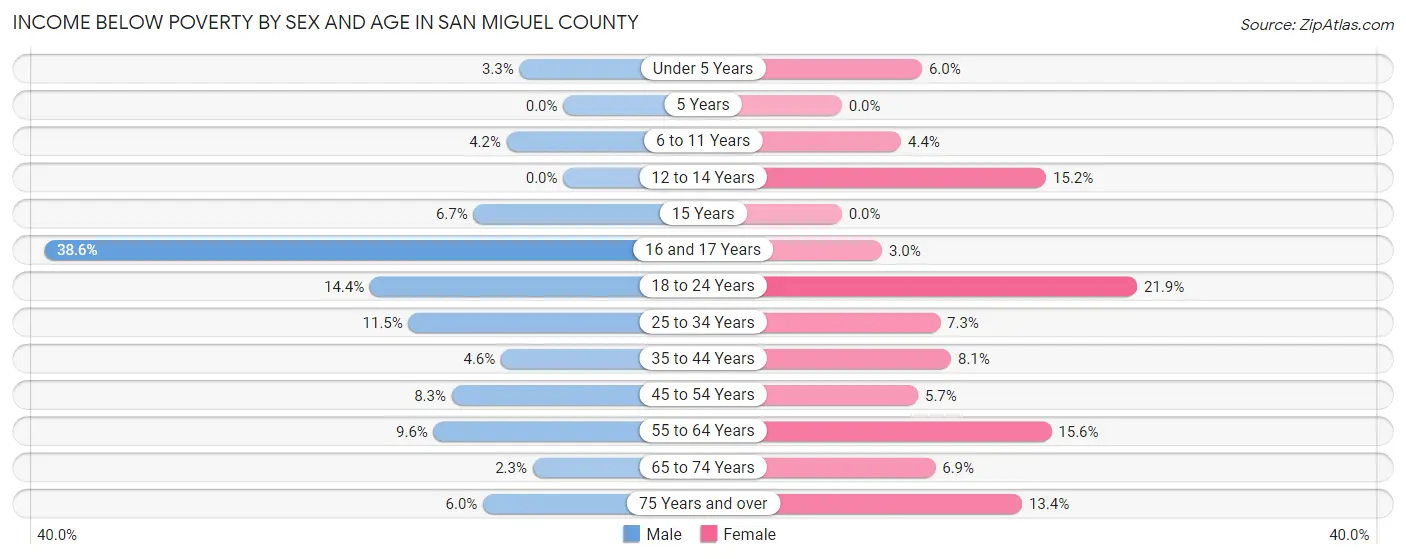
| Age Bracket | Male | Female |
| Under 5 Years | 4 (3.3%) | 5 (5.9%) |
| 5 Years | 0 (0.0%) | 0 (0.0%) |
| 6 to 11 Years | 12 (4.2%) | 7 (4.4%) |
| 12 to 14 Years | 0 (0.0%) | 22 (15.2%) |
| 15 Years | 3 (6.7%) | 0 (0.0%) |
| 16 and 17 Years | 32 (38.6%) | 2 (3.0%) |
| 18 to 24 Years | 31 (14.3%) | 57 (21.9%) |
| 25 to 34 Years | 84 (11.5%) | 46 (7.3%) |
| 35 to 44 Years | 29 (4.6%) | 48 (8.1%) |
| 45 to 54 Years | 52 (8.3%) | 32 (5.7%) |
| 55 to 64 Years | 63 (9.6%) | 80 (15.6%) |
| 65 to 74 Years | 13 (2.3%) | 30 (6.9%) |
| 75 Years and over | 11 (5.9%) | 19 (13.4%) |
| Total | 334 (7.6%) | 348 (9.6%) |
Income Above Poverty by Sex and Age in San Miguel County
According to the poverty statistics in San Miguel County, males aged 5 years and females aged 5 years are the age groups that are most secure financially, with 100.0% of males and 100.0% of females in these age groups living above the poverty line.
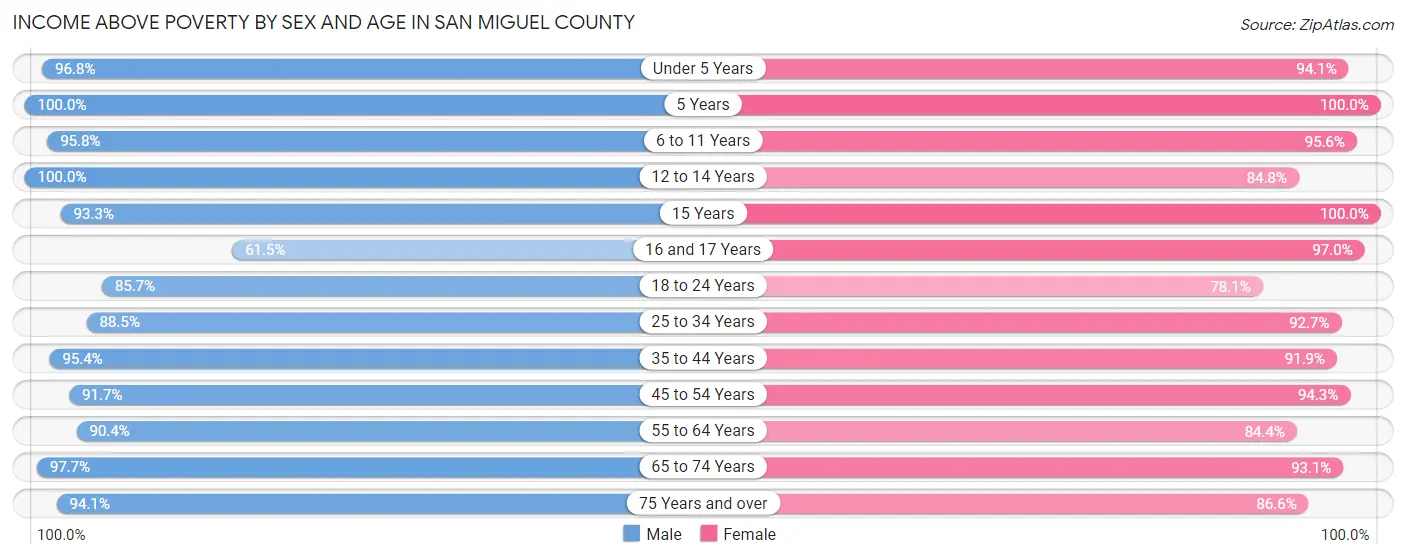
| Age Bracket | Male | Female |
| Under 5 Years | 119 (96.8%) | 79 (94.1%) |
| 5 Years | 144 (100.0%) | 19 (100.0%) |
| 6 to 11 Years | 274 (95.8%) | 152 (95.6%) |
| 12 to 14 Years | 106 (100.0%) | 123 (84.8%) |
| 15 Years | 42 (93.3%) | 34 (100.0%) |
| 16 and 17 Years | 51 (61.5%) | 65 (97.0%) |
| 18 to 24 Years | 185 (85.7%) | 203 (78.1%) |
| 25 to 34 Years | 647 (88.5%) | 584 (92.7%) |
| 35 to 44 Years | 599 (95.4%) | 544 (91.9%) |
| 45 to 54 Years | 576 (91.7%) | 533 (94.3%) |
| 55 to 64 Years | 591 (90.4%) | 434 (84.4%) |
| 65 to 74 Years | 559 (97.7%) | 402 (93.1%) |
| 75 Years and over | 174 (94.1%) | 123 (86.6%) |
| Total | 4,067 (92.4%) | 3,295 (90.4%) |
Income Below Poverty Among Married-Couple Families in San Miguel County
The poverty statistics for married-couple families in San Miguel County show that 2.6% or 40 of the total 1,559 families live below the poverty line. Families with 3 or 4 children have the highest poverty rate of 12.3%, comprising of 13 families. On the other hand, families with 1 or 2 children have the lowest poverty rate of 0.0%, which includes 0 families.
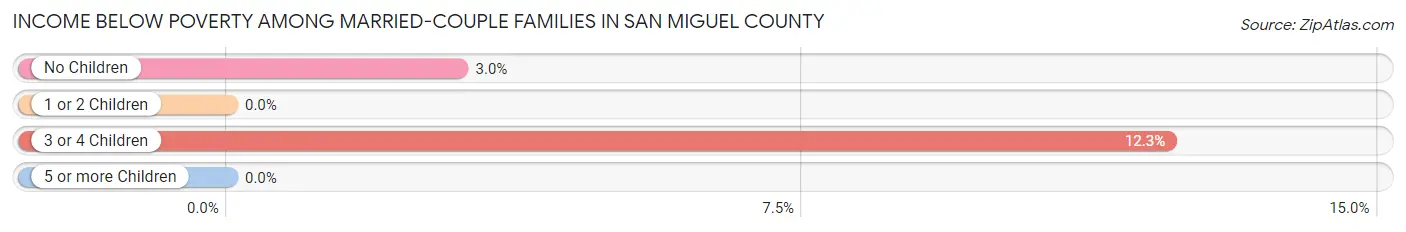
| Children | Above Poverty | Below Poverty |
| No Children | 871 (97.0%) | 27 (3.0%) |
| 1 or 2 Children | 555 (100.0%) | 0 (0.0%) |
| 3 or 4 Children | 93 (87.7%) | 13 (12.3%) |
| 5 or more Children | 0 (0.0%) | 0 (0.0%) |
| Total | 1,519 (97.4%) | 40 (2.6%) |
Income Below Poverty Among Single-Parent Households in San Miguel County
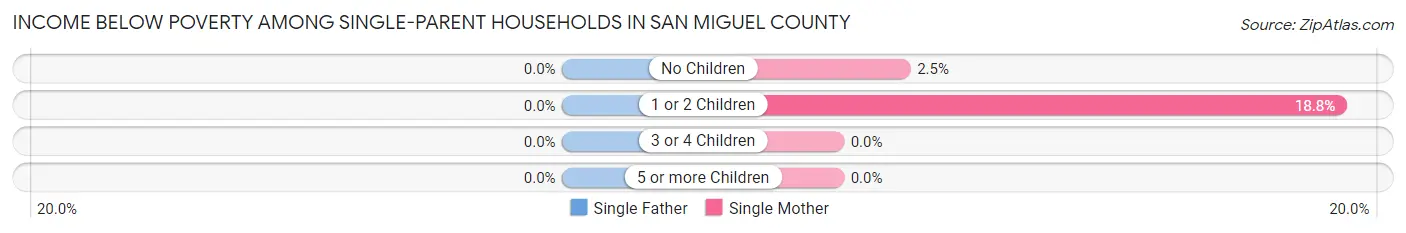
| Children | Single Father | Single Mother |
| No Children | 0 (0.0%) | 3 (2.5%) |
| 1 or 2 Children | 0 (0.0%) | 27 (18.8%) |
| 3 or 4 Children | 0 (0.0%) | 0 (0.0%) |
| 5 or more Children | 0 (0.0%) | 0 (0.0%) |
| Total | 0 (0.0%) | 30 (11.3%) |
Income Below Poverty Among Married-Couple vs Single-Parent Households in San Miguel County
The poverty data for San Miguel County shows that 40 of the married-couple family households (2.6%) and 30 of the single-parent households (7.3%) are living below the poverty level. Within the married-couple family households, those with 3 or 4 children have the highest poverty rate, with 13 households (12.3%) falling below the poverty line. Among the single-parent households, those with 1 or 2 children have the highest poverty rate, with 27 household (12.2%) living below poverty.
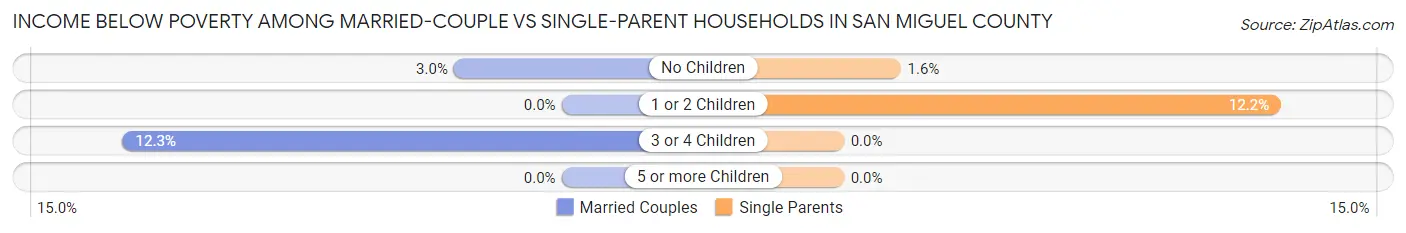
| Children | Married-Couple Families | Single-Parent Households |
| No Children | 27 (3.0%) | 3 (1.6%) |
| 1 or 2 Children | 0 (0.0%) | 27 (12.2%) |
| 3 or 4 Children | 13 (12.3%) | 0 (0.0%) |
| 5 or more Children | 0 (0.0%) | 0 (0.0%) |
| Total | 40 (2.6%) | 30 (7.3%) |
Race in San Miguel County
The most populous races in San Miguel County are White / Caucasian (7,471 | 92.4%), Hispanic or Latino (920 | 11.4%), and Two or more Races (284 | 3.5%).
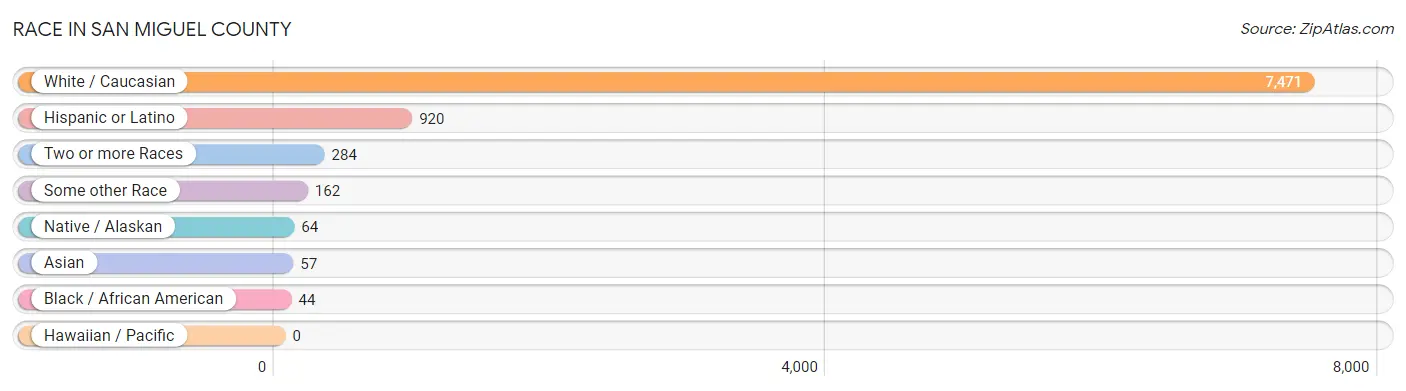
| Race | # Population | % Population |
| Asian | 57 | 0.7% |
| Black / African American | 44 | 0.5% |
| Hawaiian / Pacific | 0 | 0.0% |
| Hispanic or Latino | 920 | 11.4% |
| Native / Alaskan | 64 | 0.8% |
| White / Caucasian | 7,471 | 92.4% |
| Two or more Races | 284 | 3.5% |
| Some other Race | 162 | 2.0% |
| Total | 8,082 | 100.0% |
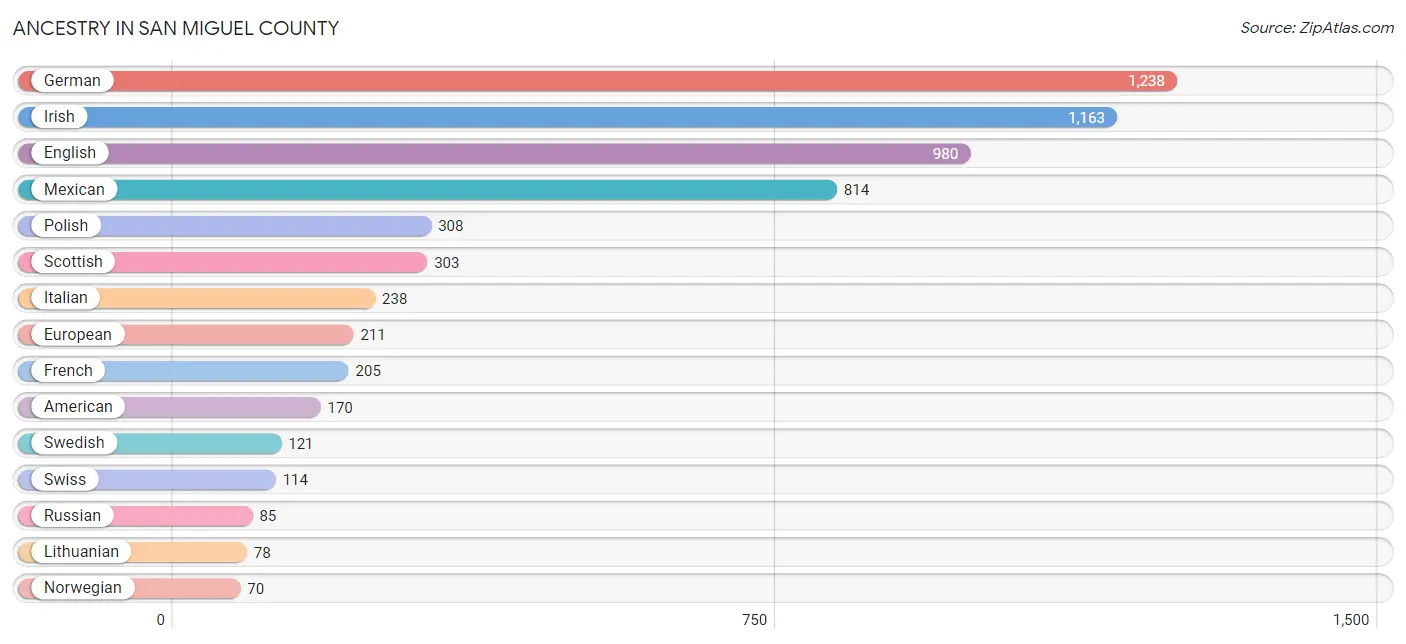
Ancestry in San Miguel County
The most populous ancestries reported in San Miguel County are German (1,238 | 15.3%), Irish (1,163 | 14.4%), English (980 | 12.1%), Mexican (814 | 10.1%), and Polish (308 | 3.8%), together accounting for 55.7% of all San Miguel County residents.
| Ancestry | # Population | % Population |
| American | 170 | 2.1% |
| Apache | 1 | 0.0% |
| Arab | 18 | 0.2% |
| Argentinean | 9 | 0.1% |
| Armenian | 5 | 0.1% |
| Australian | 24 | 0.3% |
| Austrian | 5 | 0.1% |
| Bangladeshi | 1 | 0.0% |
| Belgian | 7 | 0.1% |
| British | 39 | 0.5% |
| Canadian | 32 | 0.4% |
| Central American | 11 | 0.1% |
| Cherokee | 48 | 0.6% |
| Choctaw | 10 | 0.1% |
| Croatian | 12 | 0.2% |
| Cuban | 11 | 0.1% |
| Czech | 39 | 0.5% |
| Danish | 36 | 0.4% |
| Dutch | 34 | 0.4% |
| Eastern European | 26 | 0.3% |
| English | 980 | 12.1% |
| European | 211 | 2.6% |
| Finnish | 2 | 0.0% |
| French | 205 | 2.5% |
| French Canadian | 4 | 0.1% |
| German | 1,238 | 15.3% |
| Greek | 20 | 0.3% |
| Hungarian | 7 | 0.1% |
| Indian (Asian) | 10 | 0.1% |
| Irish | 1,163 | 14.4% |
| Italian | 238 | 2.9% |
| Korean | 58 | 0.7% |
| Lebanese | 4 | 0.1% |
| Lithuanian | 78 | 1.0% |
| Mexican | 814 | 10.1% |
| Navajo | 41 | 0.5% |
| New Zealander | 4 | 0.1% |
| Northern European | 25 | 0.3% |
| Norwegian | 70 | 0.9% |
| Pakistani | 6 | 0.1% |
| Panamanian | 11 | 0.1% |
| Polish | 308 | 3.8% |
| Portuguese | 20 | 0.3% |
| Romanian | 47 | 0.6% |
| Russian | 85 | 1.1% |
| Scandinavian | 61 | 0.7% |
| Scotch-Irish | 51 | 0.6% |
| Scottish | 303 | 3.7% |
| Slovene | 4 | 0.1% |
| South American | 9 | 0.1% |
| Spaniard | 1 | 0.0% |
| Spanish | 33 | 0.4% |
| Swedish | 121 | 1.5% |
| Swiss | 114 | 1.4% |
| Ukrainian | 7 | 0.1% |
| Welsh | 20 | 0.3% | View All 56 Rows |
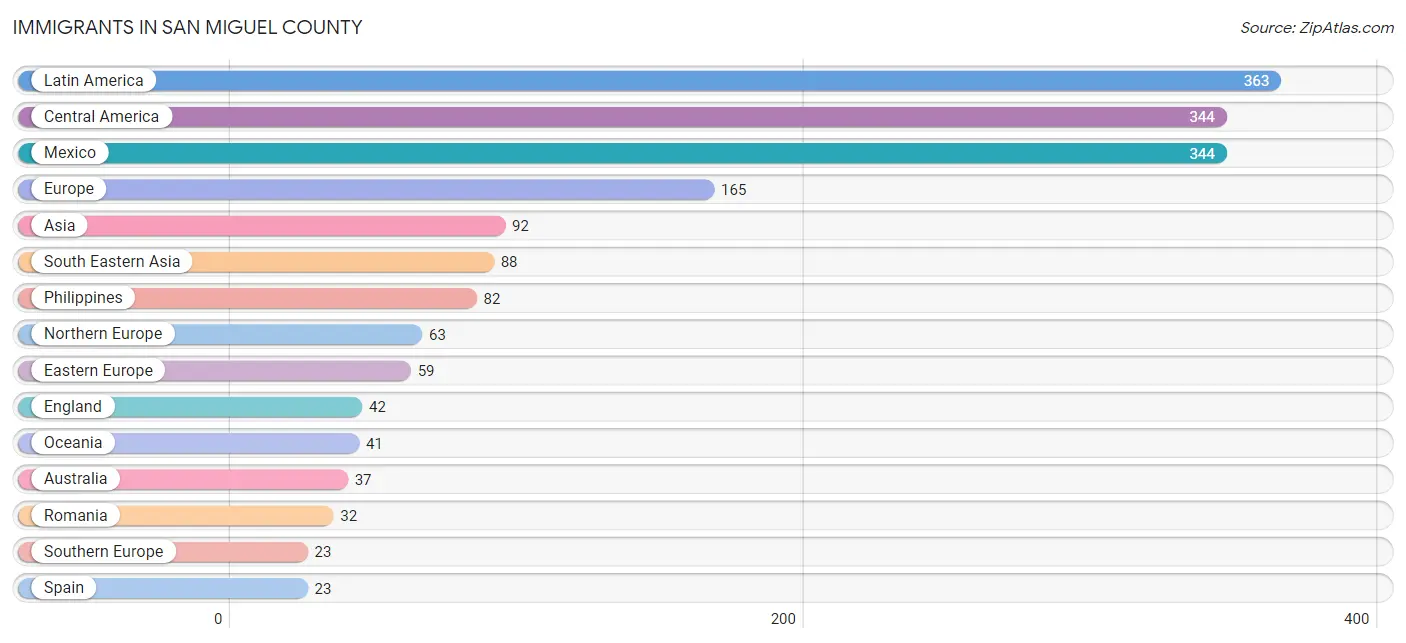
Immigrants in San Miguel County
The most numerous immigrant groups reported in San Miguel County came from Latin America (363 | 4.5%), Central America (344 | 4.3%), Mexico (344 | 4.3%), Europe (165 | 2.0%), and Asia (92 | 1.1%), together accounting for 16.2% of all San Miguel County residents.
| Immigration Origin | # Population | % Population |
| Argentina | 9 | 0.1% |
| Asia | 92 | 1.1% |
| Australia | 37 | 0.5% |
| Bolivia | 10 | 0.1% |
| Canada | 22 | 0.3% |
| Central America | 344 | 4.3% |
| China | 4 | 0.1% |
| Eastern Asia | 4 | 0.1% |
| Eastern Europe | 59 | 0.7% |
| England | 42 | 0.5% |
| Europe | 165 | 2.0% |
| France | 19 | 0.2% |
| Hong Kong | 4 | 0.1% |
| Hungary | 7 | 0.1% |
| Latin America | 363 | 4.5% |
| Mexico | 344 | 4.3% |
| Northern Europe | 63 | 0.8% |
| Oceania | 41 | 0.5% |
| Philippines | 82 | 1.0% |
| Romania | 32 | 0.4% |
| Russia | 20 | 0.3% |
| Scotland | 5 | 0.1% |
| South America | 19 | 0.2% |
| South Eastern Asia | 88 | 1.1% |
| Southern Europe | 23 | 0.3% |
| Spain | 23 | 0.3% |
| Sweden | 9 | 0.1% |
| Switzerland | 1 | 0.0% |
| Thailand | 6 | 0.1% |
| Western Europe | 20 | 0.3% | View All 30 Rows |
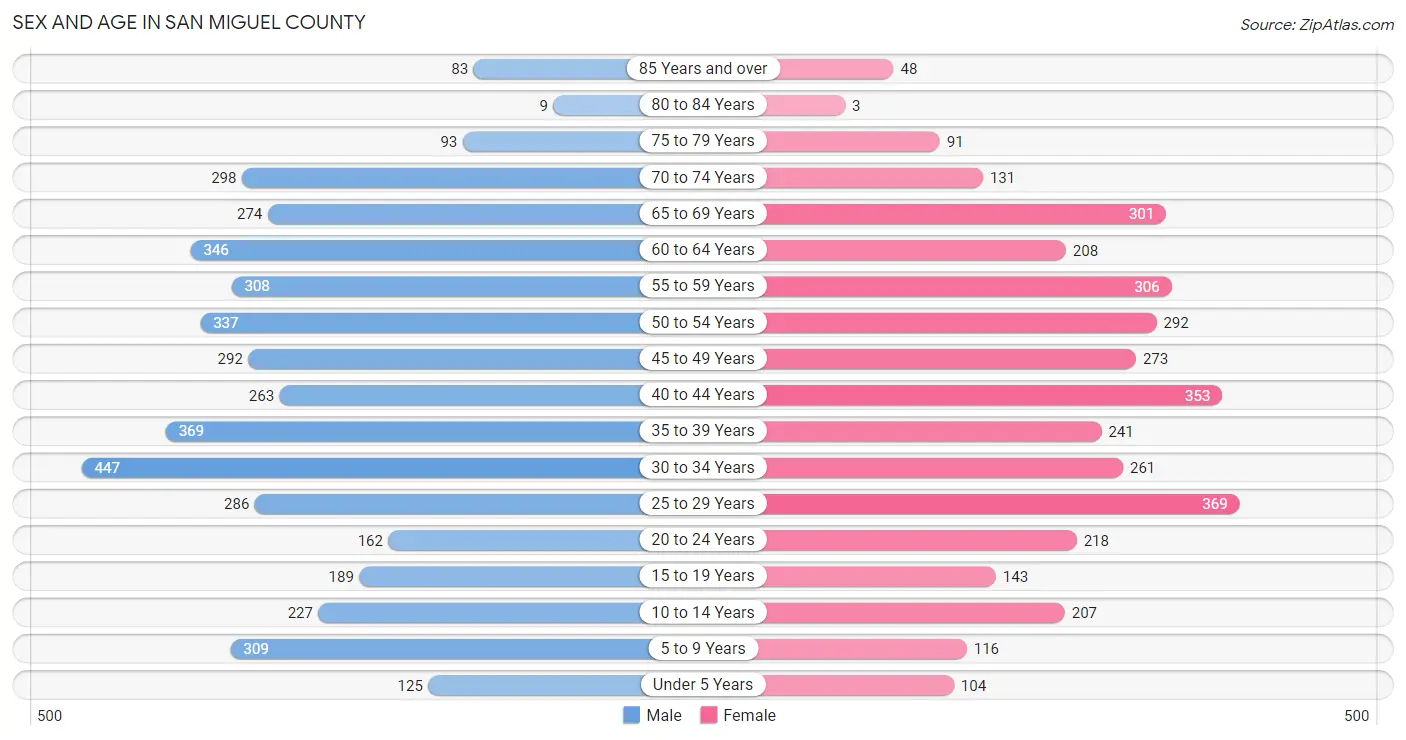
Sex and Age in San Miguel County
Sex and Age in San Miguel County
The most populous age groups in San Miguel County are 30 to 34 Years (447 | 10.1%) for men and 25 to 29 Years (369 | 10.1%) for women.
| Age Bracket | Male | Female |
| Under 5 Years | 125 (2.8%) | 104 (2.8%) |
| 5 to 9 Years | 309 (7.0%) | 116 (3.2%) |
| 10 to 14 Years | 227 (5.1%) | 207 (5.7%) |
| 15 to 19 Years | 189 (4.3%) | 143 (3.9%) |
| 20 to 24 Years | 162 (3.7%) | 218 (5.9%) |
| 25 to 29 Years | 286 (6.5%) | 369 (10.1%) |
| 30 to 34 Years | 447 (10.1%) | 261 (7.1%) |
| 35 to 39 Years | 369 (8.4%) | 241 (6.6%) |
| 40 to 44 Years | 263 (5.9%) | 353 (9.6%) |
| 45 to 49 Years | 292 (6.6%) | 273 (7.4%) |
| 50 to 54 Years | 337 (7.6%) | 292 (8.0%) |
| 55 to 59 Years | 308 (7.0%) | 306 (8.4%) |
| 60 to 64 Years | 346 (7.8%) | 208 (5.7%) |
| 65 to 69 Years | 274 (6.2%) | 301 (8.2%) |
| 70 to 74 Years | 298 (6.8%) | 131 (3.6%) |
| 75 to 79 Years | 93 (2.1%) | 91 (2.5%) |
| 80 to 84 Years | 9 (0.2%) | 3 (0.1%) |
| 85 Years and over | 83 (1.9%) | 48 (1.3%) |
| Total | 4,417 (100.0%) | 3,665 (100.0%) |
Families and Households in San Miguel County
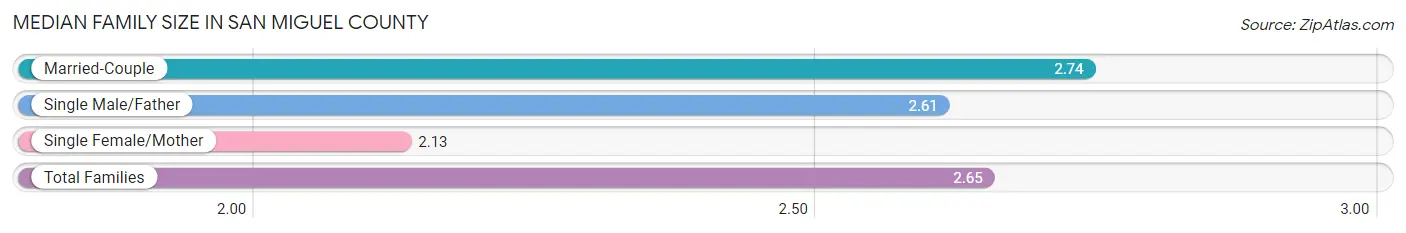
Median Family Size in San Miguel County
The median family size in San Miguel County is 2.65 persons per family, with married-couple families (1,559 | 79.2%) accounting for the largest median family size of 2.74 persons per family. On the other hand, single female/mother families (265 | 13.5%) represent the smallest median family size with 2.13 persons per family.
| Family Type | # Families | Family Size |
| Married-Couple | 1,559 (79.2%) | 2.74 |
| Single Male/Father | 145 (7.4%) | 2.61 |
| Single Female/Mother | 265 (13.5%) | 2.13 |
| Total Families | 1,969 (100.0%) | 2.65 |
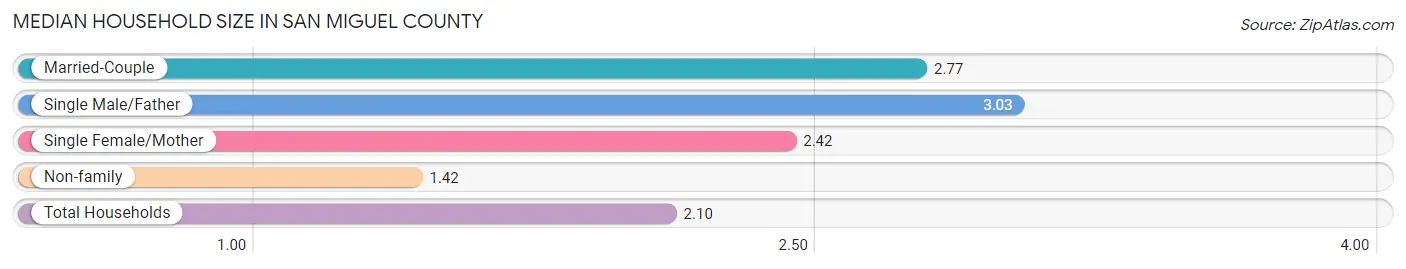
Median Household Size in San Miguel County
The median household size in San Miguel County is 2.10 persons per household, with single male/father households (145 | 3.8%) accounting for the largest median household size of 3.03 persons per household. non-family households (1,881 | 48.9%) represent the smallest median household size with 1.42 persons per household.
| Household Type | # Households | Household Size |
| Married-Couple | 1,559 (40.5%) | 2.77 |
| Single Male/Father | 145 (3.8%) | 3.03 |
| Single Female/Mother | 265 (6.9%) | 2.42 |
| Non-family | 1,881 (48.9%) | 1.42 |
| Total Households | 3,850 (100.0%) | 2.10 |
Household Size by Marriage Status in San Miguel County
Out of a total of 3,850 households in San Miguel County, 1,969 (51.1%) are family households, while 1,881 (48.9%) are nonfamily households. The most numerous type of family households are 2-person households, comprising 955, and the most common type of nonfamily households are 1-person households, comprising 1,400.
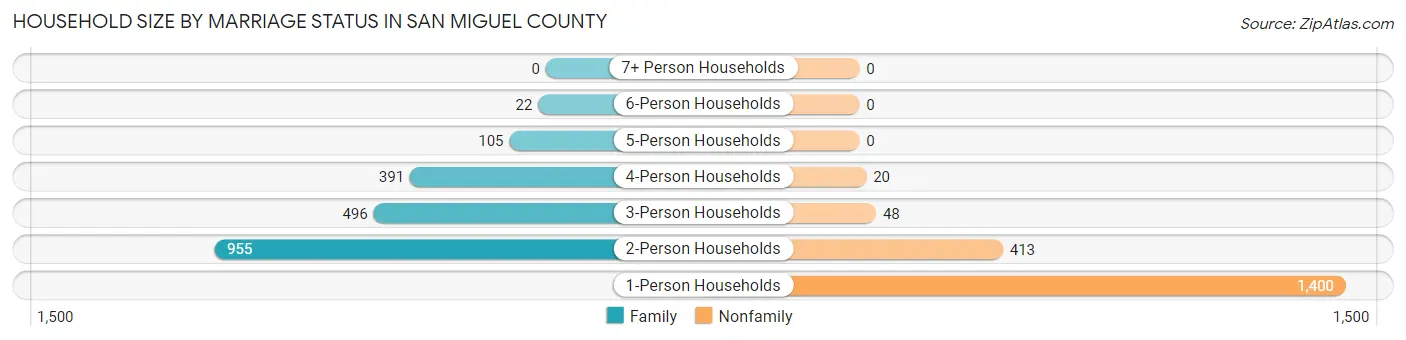
| Household Size | Family Households | Nonfamily Households |
| 1-Person Households | - | 1,400 (36.4%) |
| 2-Person Households | 955 (24.8%) | 413 (10.7%) |
| 3-Person Households | 496 (12.9%) | 48 (1.3%) |
| 4-Person Households | 391 (10.2%) | 20 (0.5%) |
| 5-Person Households | 105 (2.7%) | 0 (0.0%) |
| 6-Person Households | 22 (0.6%) | 0 (0.0%) |
| 7+ Person Households | 0 (0.0%) | 0 (0.0%) |
| Total | 1,969 (51.1%) | 1,881 (48.9%) |
Female Fertility in San Miguel County
Fertility by Age in San Miguel County
Average fertility rate in San Miguel County is 17.0 births per 1,000 women. Women in the age bracket of 20 to 34 years have the highest fertility rate with 27.0 births per 1,000 women. Women in the age bracket of 20 to 34 years acount for 69.7% of all women with births.
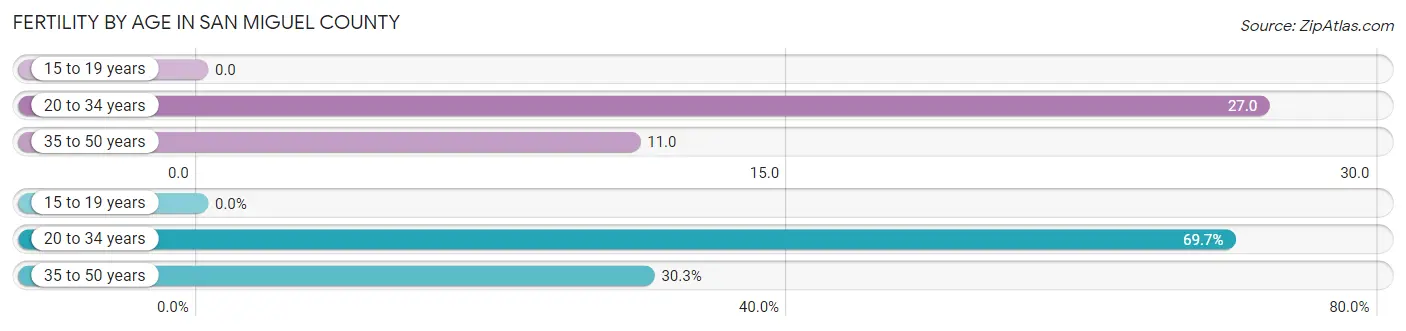
| Age Bracket | Women with Births | Births / 1,000 Women |
| 15 to 19 years | 0 (0.0%) | 0.0 |
| 20 to 34 years | 23 (69.7%) | 27.0 |
| 35 to 50 years | 10 (30.3%) | 11.0 |
| Total | 33 (100.0%) | 17.0 |
Fertility by Age by Marriage Status in San Miguel County
48.5% of women with births (33) in San Miguel County are married. The highest percentage of unmarried women with births falls into 20 to 34 years age bracket with 73.9% of them unmarried at the time of birth, while the lowest percentage of unmarried women with births belong to 35 to 50 years age bracket with 0.0% of them unmarried.
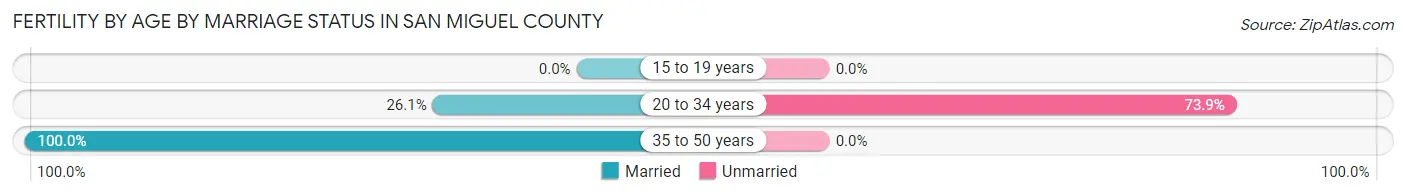
| Age Bracket | Married | Unmarried |
| 15 to 19 years | 0 (0.0%) | 0 (0.0%) |
| 20 to 34 years | 6 (26.1%) | 17 (73.9%) |
| 35 to 50 years | 10 (100.0%) | 0 (0.0%) |
| Total | 16 (48.5%) | 17 (51.5%) |
Fertility by Education in San Miguel County
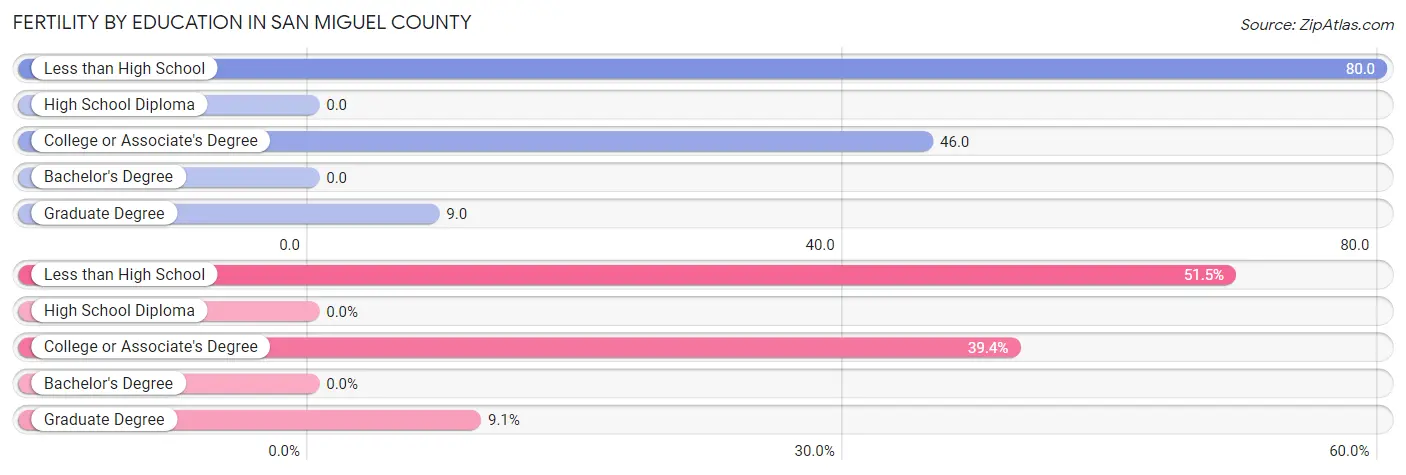
| Educational Attainment | Women with Births | Births / 1,000 Women |
| Less than High School | 17 (51.5%) | 80.0 |
| High School Diploma | 0 (0.0%) | 0.0 |
| College or Associate's Degree | 13 (39.4%) | 46.0 |
| Bachelor's Degree | 0 (0.0%) | 0.0 |
| Graduate Degree | 3 (9.1%) | 9.0 |
| Total | 33 (100.0%) | 17.0 |
Fertility by Education by Marriage Status in San Miguel County
51.5% of women with births in San Miguel County are unmarried. Women with the educational attainment of college or associate's degree are most likely to be married with 100.0% of them married at childbirth, while women with the educational attainment of less than high school are least likely to be married with 100.0% of them unmarried at childbirth.
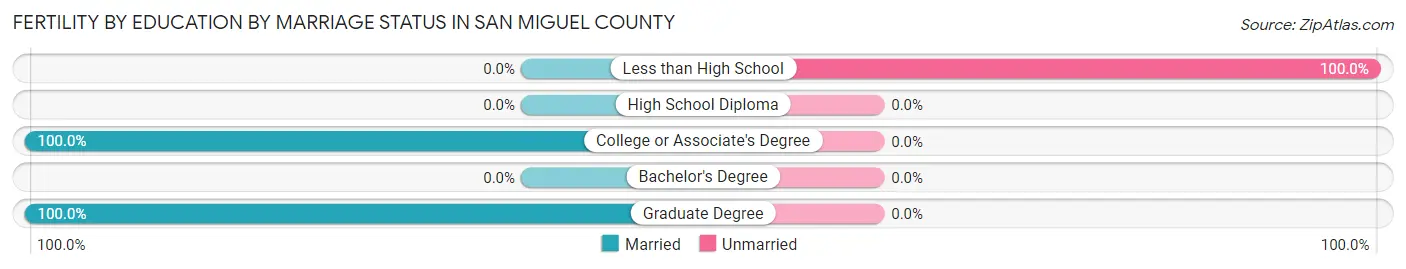
| Educational Attainment | Married | Unmarried |
| Less than High School | 0 (0.0%) | 17 (100.0%) |
| High School Diploma | 0 (0.0%) | 0 (0.0%) |
| College or Associate's Degree | 13 (100.0%) | 0 (0.0%) |
| Bachelor's Degree | 0 (0.0%) | 0 (0.0%) |
| Graduate Degree | 3 (100.0%) | 0 (0.0%) |
| Total | 16 (48.5%) | 17 (51.5%) |
Employment Characteristics in San Miguel County
Employment by Class of Employer in San Miguel County
Among the 4,897 employed individuals in San Miguel County, private company employees (2,770 | 56.6%), local government employees (635 | 13.0%), and self-employed (not incorporated) (559 | 11.4%) make up the most common classes of employment.
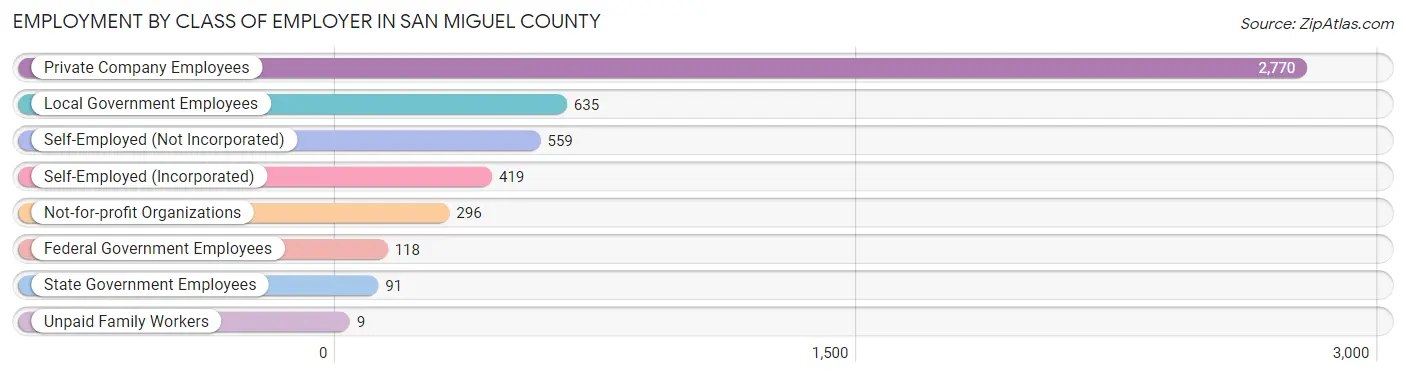
| Employer Class | # Employees | % Employees |
| Private Company Employees | 2,770 | 56.6% |
| Self-Employed (Incorporated) | 419 | 8.6% |
| Self-Employed (Not Incorporated) | 559 | 11.4% |
| Not-for-profit Organizations | 296 | 6.0% |
| Local Government Employees | 635 | 13.0% |
| State Government Employees | 91 | 1.9% |
| Federal Government Employees | 118 | 2.4% |
| Unpaid Family Workers | 9 | 0.2% |
| Total | 4,897 | 100.0% |
Employment Status by Age in San Miguel County
According to the labor force statistics for San Miguel County, out of the total population over 16 years of age (6,915), 74.2% or 5,131 individuals are in the labor force, with 3.7% or 190 of them unemployed. The age group with the highest labor force participation rate is 25 to 29 years, with 99.2% or 650 individuals in the labor force. Within the labor force, the 25 to 29 years age range has the highest percentage of unemployed individuals, with 10.9% or 71 of them being unemployed.
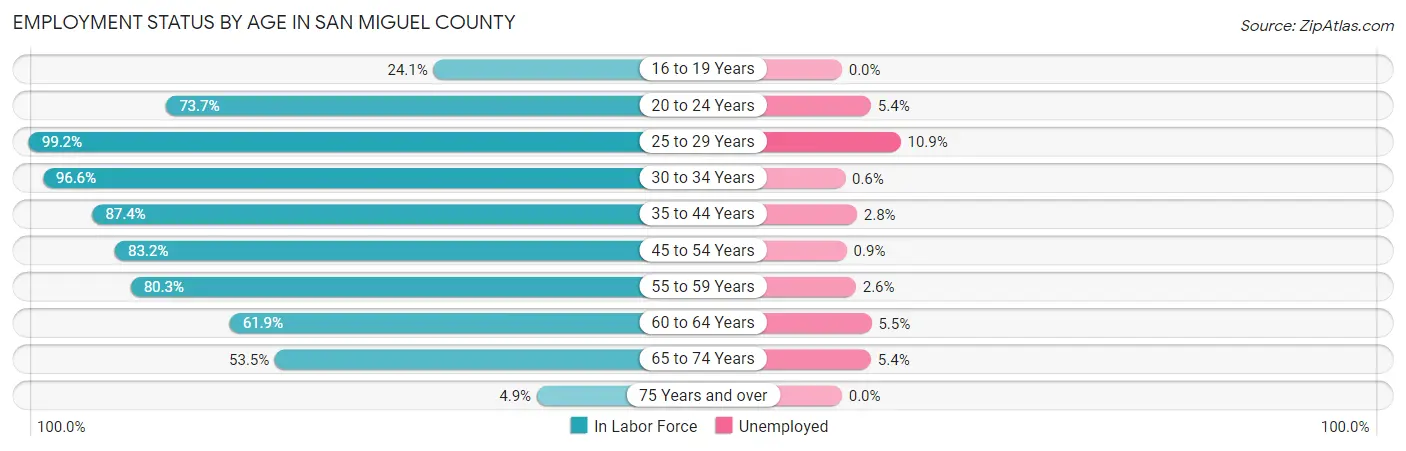
| Age Bracket | In Labor Force | Unemployed |
| 16 to 19 Years | 61 (24.1%) | 0 (0.0%) |
| 20 to 24 Years | 280 (73.7%) | 15 (5.4%) |
| 25 to 29 Years | 650 (99.2%) | 71 (10.9%) |
| 30 to 34 Years | 684 (96.6%) | 4 (0.6%) |
| 35 to 44 Years | 1,072 (87.4%) | 30 (2.8%) |
| 45 to 54 Years | 993 (83.2%) | 9 (0.9%) |
| 55 to 59 Years | 493 (80.3%) | 13 (2.6%) |
| 60 to 64 Years | 343 (61.9%) | 19 (5.5%) |
| 65 to 74 Years | 537 (53.5%) | 29 (5.4%) |
| 75 Years and over | 16 (4.9%) | 0 (0.0%) |
| Total | 5,131 (74.2%) | 190 (3.7%) |
Employment Status by Educational Attainment in San Miguel County
According to labor force statistics for San Miguel County, 85.5% of individuals (4,233) out of the total population between 25 and 64 years of age (4,951) are in the labor force, with 3.4% or 144 of them being unemployed. The group with the highest labor force participation rate are those with the educational attainment of college / associate degree, with 90.7% or 759 individuals in the labor force. Within the labor force, individuals with less than high school education have the highest percentage of unemployment, with 38.1% or 16 of them being unemployed.
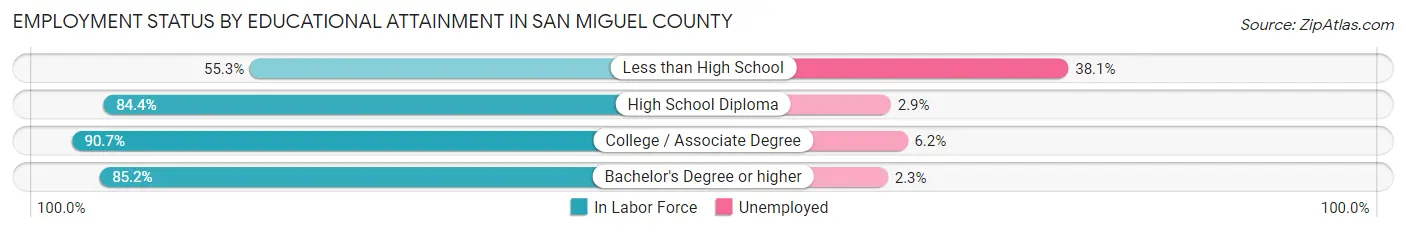
| Educational Attainment | In Labor Force | Unemployed |
| Less than High School | 42 (55.3%) | 29 (38.1%) |
| High School Diploma | 733 (84.4%) | 25 (2.9%) |
| College / Associate Degree | 759 (90.7%) | 52 (6.2%) |
| Bachelor's Degree or higher | 2,701 (85.2%) | 73 (2.3%) |
| Total | 4,233 (85.5%) | 168 (3.4%) |
Employment Occupations by Sex in San Miguel County
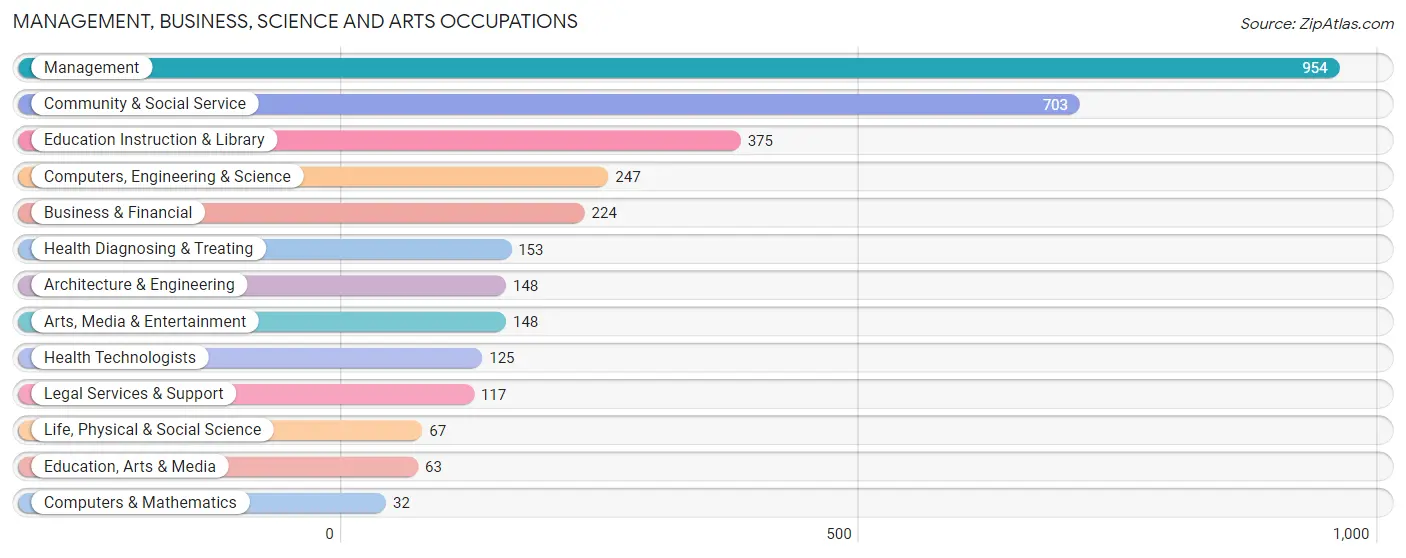
Management, Business, Science and Arts Occupations
The most common Management, Business, Science and Arts occupations in San Miguel County are Management (954 | 19.3%), Community & Social Service (703 | 14.2%), Education Instruction & Library (375 | 7.6%), Computers, Engineering & Science (247 | 5.0%), and Business & Financial (224 | 4.5%).
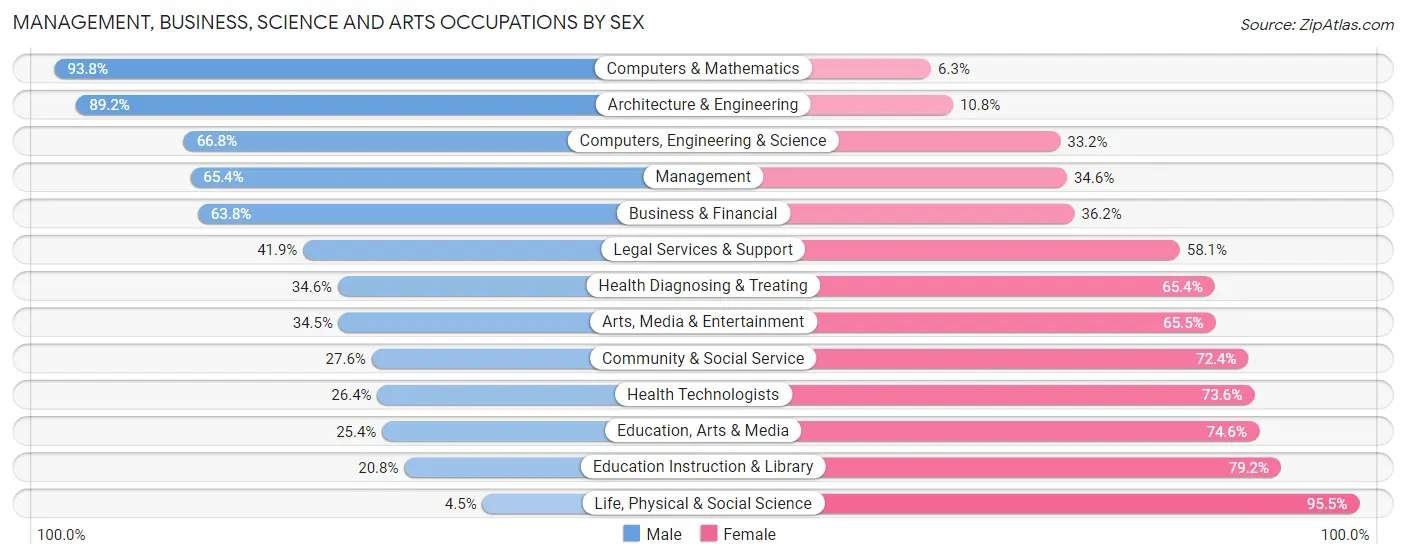
Management, Business, Science and Arts Occupations by Sex
Within the Management, Business, Science and Arts occupations in San Miguel County, the most male-oriented occupations are Computers & Mathematics (93.8%), Architecture & Engineering (89.2%), and Computers, Engineering & Science (66.8%), while the most female-oriented occupations are Life, Physical & Social Science (95.5%), Education Instruction & Library (79.2%), and Education, Arts & Media (74.6%).
| Occupation | Male | Female |
| Management | 624 (65.4%) | 330 (34.6%) |
| Business & Financial | 143 (63.8%) | 81 (36.2%) |
| Computers, Engineering & Science | 165 (66.8%) | 82 (33.2%) |
| Computers & Mathematics | 30 (93.8%) | 2 (6.2%) |
| Architecture & Engineering | 132 (89.2%) | 16 (10.8%) |
| Life, Physical & Social Science | 3 (4.5%) | 64 (95.5%) |
| Community & Social Service | 194 (27.6%) | 509 (72.4%) |
| Education, Arts & Media | 16 (25.4%) | 47 (74.6%) |
| Legal Services & Support | 49 (41.9%) | 68 (58.1%) |
| Education Instruction & Library | 78 (20.8%) | 297 (79.2%) |
| Arts, Media & Entertainment | 51 (34.5%) | 97 (65.5%) |
| Health Diagnosing & Treating | 53 (34.6%) | 100 (65.4%) |
| Health Technologists | 33 (26.4%) | 92 (73.6%) |
| Total (Category) | 1,179 (51.7%) | 1,102 (48.3%) |
| Total (Overall) | 2,906 (58.8%) | 2,033 (41.2%) |
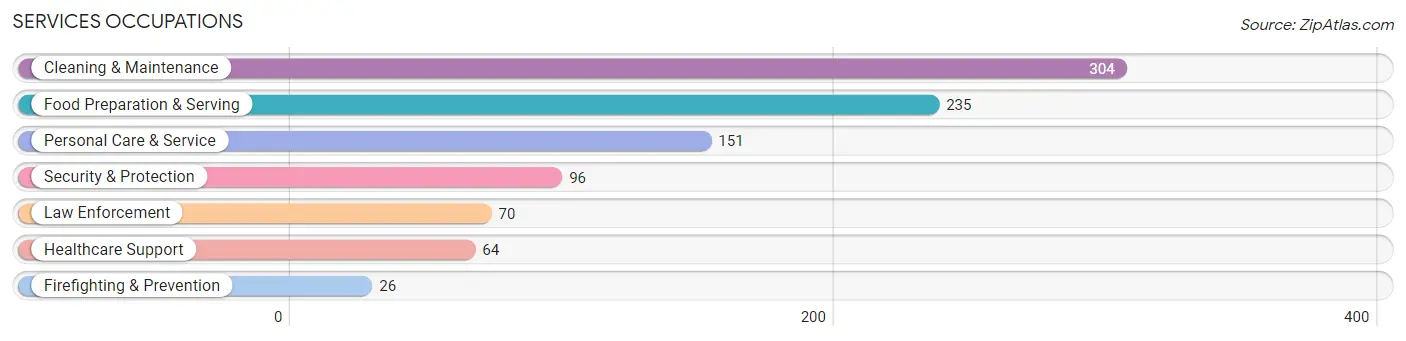
Services Occupations
The most common Services occupations in San Miguel County are Cleaning & Maintenance (304 | 6.2%), Food Preparation & Serving (235 | 4.8%), Personal Care & Service (151 | 3.1%), Security & Protection (96 | 1.9%), and Law Enforcement (70 | 1.4%).
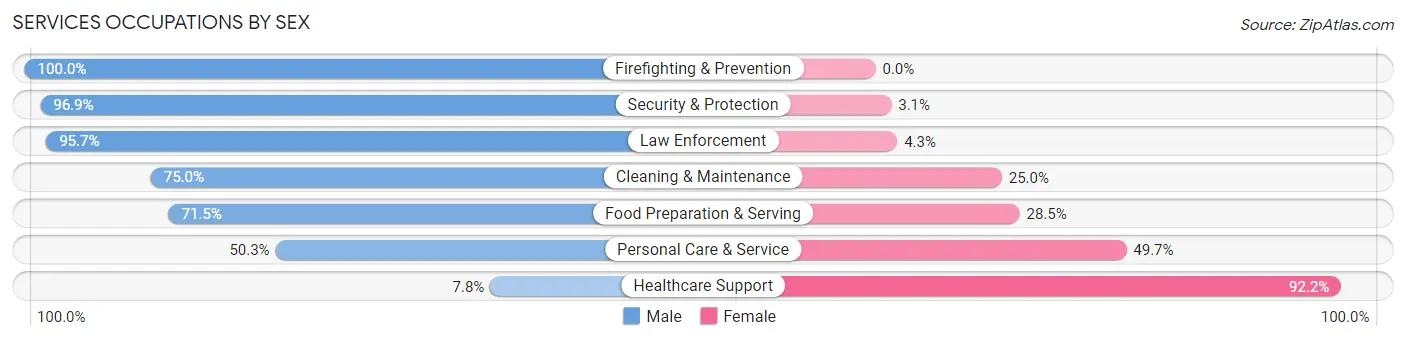
Services Occupations by Sex
Within the Services occupations in San Miguel County, the most male-oriented occupations are Firefighting & Prevention (100.0%), Security & Protection (96.9%), and Law Enforcement (95.7%), while the most female-oriented occupations are Healthcare Support (92.2%), Personal Care & Service (49.7%), and Food Preparation & Serving (28.5%).
| Occupation | Male | Female |
| Healthcare Support | 5 (7.8%) | 59 (92.2%) |
| Security & Protection | 93 (96.9%) | 3 (3.1%) |
| Firefighting & Prevention | 26 (100.0%) | 0 (0.0%) |
| Law Enforcement | 67 (95.7%) | 3 (4.3%) |
| Food Preparation & Serving | 168 (71.5%) | 67 (28.5%) |
| Cleaning & Maintenance | 228 (75.0%) | 76 (25.0%) |
| Personal Care & Service | 76 (50.3%) | 75 (49.7%) |
| Total (Category) | 570 (67.1%) | 280 (32.9%) |
| Total (Overall) | 2,906 (58.8%) | 2,033 (41.2%) |
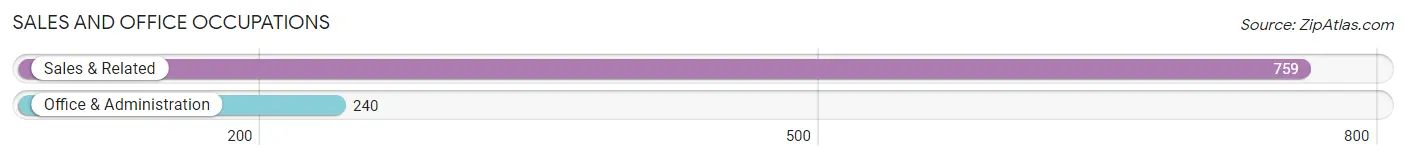
Sales and Office Occupations
The most common Sales and Office occupations in San Miguel County are Sales & Related (759 | 15.4%), and Office & Administration (240 | 4.9%).
Sales and Office Occupations by Sex
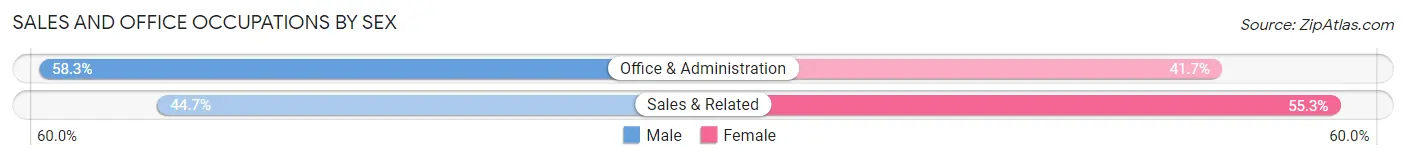
| Occupation | Male | Female |
| Sales & Related | 339 (44.7%) | 420 (55.3%) |
| Office & Administration | 140 (58.3%) | 100 (41.7%) |
| Total (Category) | 479 (47.9%) | 520 (52.0%) |
| Total (Overall) | 2,906 (58.8%) | 2,033 (41.2%) |
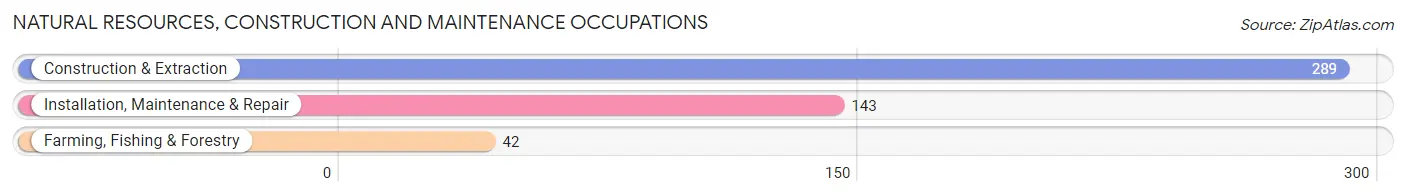
Natural Resources, Construction and Maintenance Occupations
The most common Natural Resources, Construction and Maintenance occupations in San Miguel County are Construction & Extraction (289 | 5.9%), Installation, Maintenance & Repair (143 | 2.9%), and Farming, Fishing & Forestry (42 | 0.9%).
Natural Resources, Construction and Maintenance Occupations by Sex
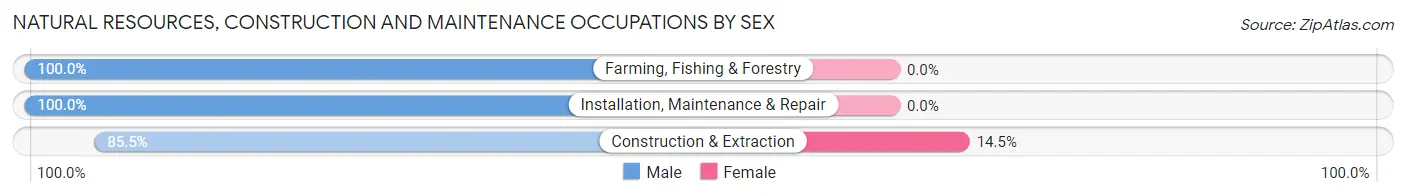
| Occupation | Male | Female |
| Farming, Fishing & Forestry | 42 (100.0%) | 0 (0.0%) |
| Construction & Extraction | 247 (85.5%) | 42 (14.5%) |
| Installation, Maintenance & Repair | 143 (100.0%) | 0 (0.0%) |
| Total (Category) | 432 (91.1%) | 42 (8.9%) |
| Total (Overall) | 2,906 (58.8%) | 2,033 (41.2%) |
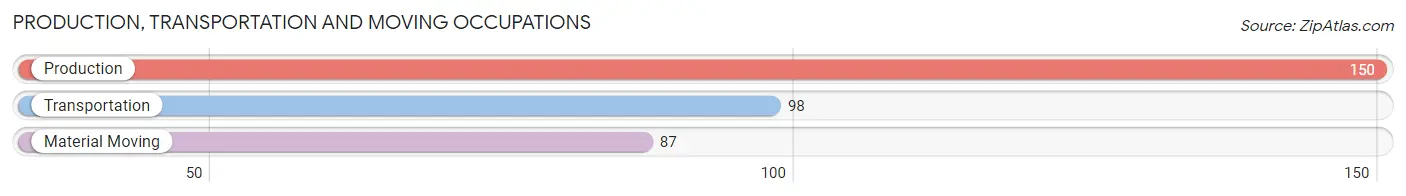
Production, Transportation and Moving Occupations
The most common Production, Transportation and Moving occupations in San Miguel County are Production (150 | 3.0%), Transportation (98 | 2.0%), and Material Moving (87 | 1.8%).
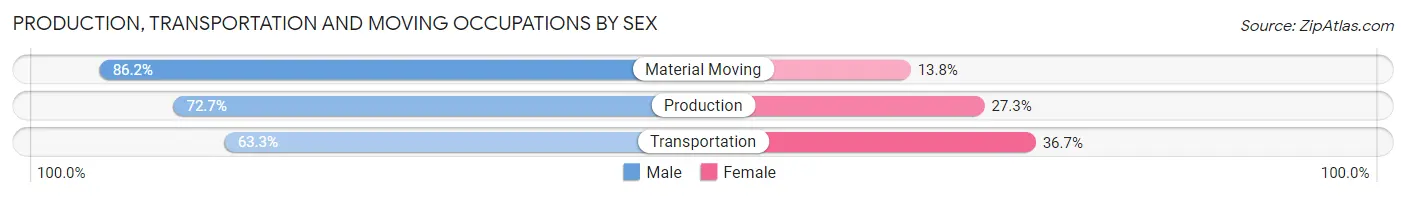
Production, Transportation and Moving Occupations by Sex
| Occupation | Male | Female |
| Production | 109 (72.7%) | 41 (27.3%) |
| Transportation | 62 (63.3%) | 36 (36.7%) |
| Material Moving | 75 (86.2%) | 12 (13.8%) |
| Total (Category) | 246 (73.4%) | 89 (26.6%) |
| Total (Overall) | 2,906 (58.8%) | 2,033 (41.2%) |
Employment Industries by Sex in San Miguel County
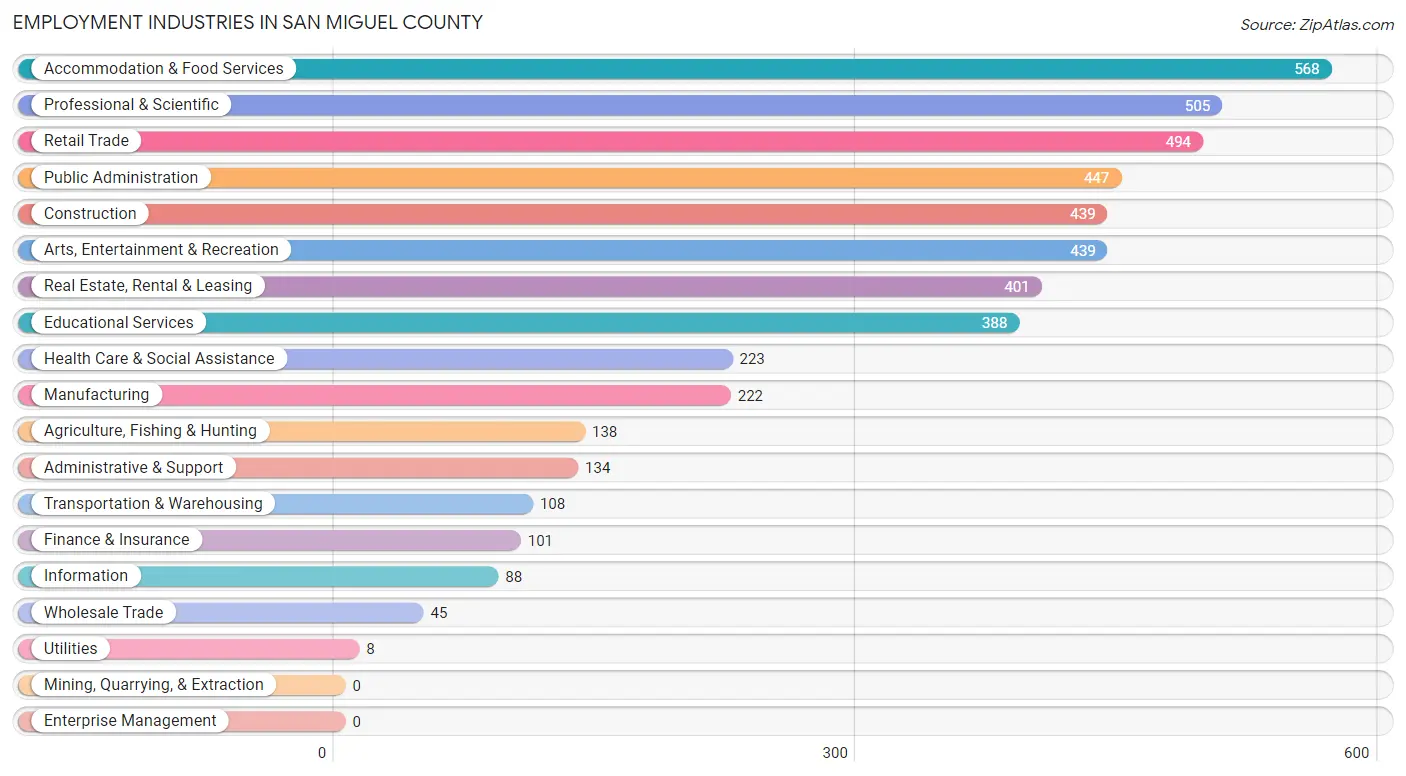
Employment Industries in San Miguel County
The major employment industries in San Miguel County include Accommodation & Food Services (568 | 11.5%), Professional & Scientific (505 | 10.2%), Retail Trade (494 | 10.0%), Public Administration (447 | 9.0%), and Construction (439 | 8.9%).
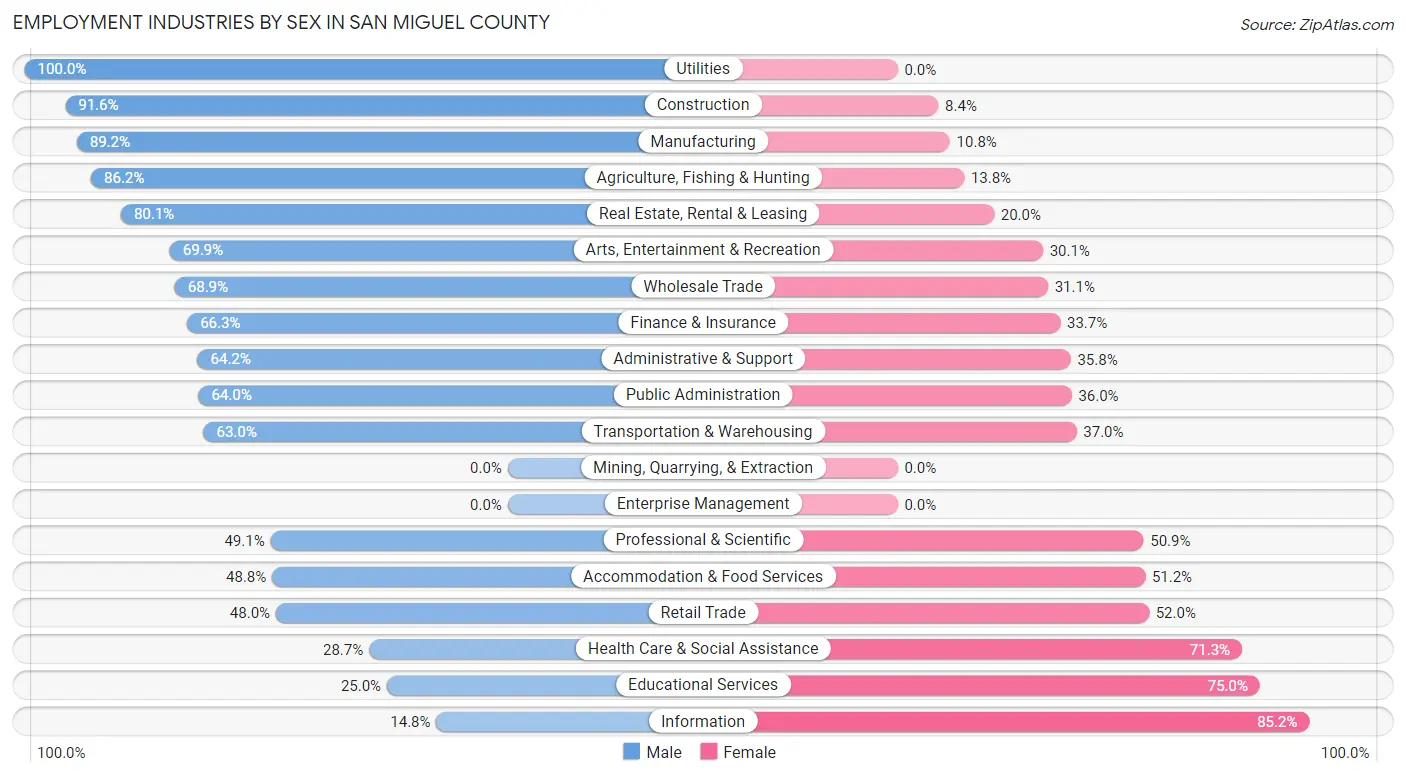
Employment Industries by Sex in San Miguel County
The San Miguel County industries that see more men than women are Utilities (100.0%), Construction (91.6%), and Manufacturing (89.2%), whereas the industries that tend to have a higher number of women are Information (85.2%), Educational Services (75.0%), and Health Care & Social Assistance (71.3%).
| Industry | Male | Female |
| Agriculture, Fishing & Hunting | 119 (86.2%) | 19 (13.8%) |
| Mining, Quarrying, & Extraction | 0 (0.0%) | 0 (0.0%) |
| Construction | 402 (91.6%) | 37 (8.4%) |
| Manufacturing | 198 (89.2%) | 24 (10.8%) |
| Wholesale Trade | 31 (68.9%) | 14 (31.1%) |
| Retail Trade | 237 (48.0%) | 257 (52.0%) |
| Transportation & Warehousing | 68 (63.0%) | 40 (37.0%) |
| Utilities | 8 (100.0%) | 0 (0.0%) |
| Information | 13 (14.8%) | 75 (85.2%) |
| Finance & Insurance | 67 (66.3%) | 34 (33.7%) |
| Real Estate, Rental & Leasing | 321 (80.0%) | 80 (20.0%) |
| Professional & Scientific | 248 (49.1%) | 257 (50.9%) |
| Enterprise Management | 0 (0.0%) | 0 (0.0%) |
| Administrative & Support | 86 (64.2%) | 48 (35.8%) |
| Educational Services | 97 (25.0%) | 291 (75.0%) |
| Health Care & Social Assistance | 64 (28.7%) | 159 (71.3%) |
| Arts, Entertainment & Recreation | 307 (69.9%) | 132 (30.1%) |
| Accommodation & Food Services | 277 (48.8%) | 291 (51.2%) |
| Public Administration | 286 (64.0%) | 161 (36.0%) |
| Total | 2,906 (58.8%) | 2,033 (41.2%) |
Education in San Miguel County
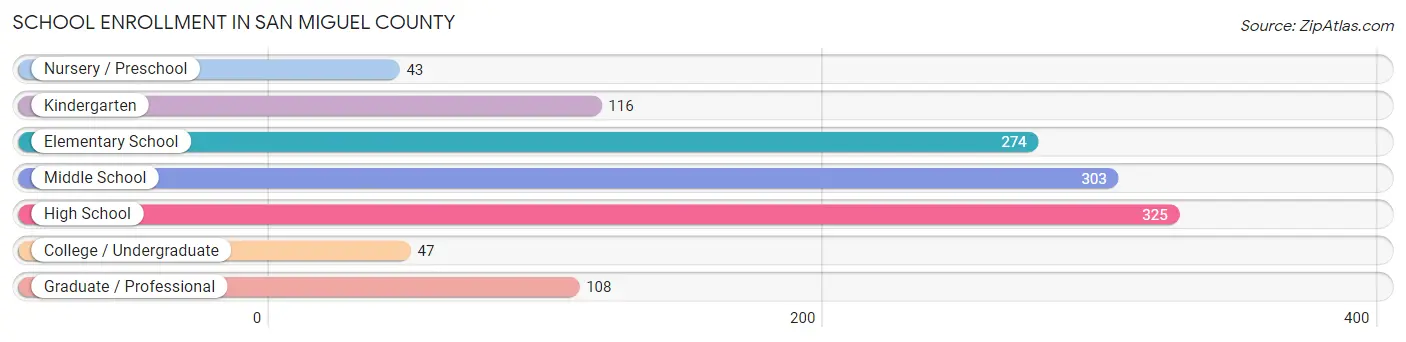
School Enrollment in San Miguel County
The most common levels of schooling among the 1,216 students in San Miguel County are high school (325 | 26.7%), middle school (303 | 24.9%), and elementary school (274 | 22.5%).
| School Level | # Students | % Students |
| Nursery / Preschool | 43 | 3.5% |
| Kindergarten | 116 | 9.5% |
| Elementary School | 274 | 22.5% |
| Middle School | 303 | 24.9% |
| High School | 325 | 26.7% |
| College / Undergraduate | 47 | 3.9% |
| Graduate / Professional | 108 | 8.9% |
| Total | 1,216 | 100.0% |
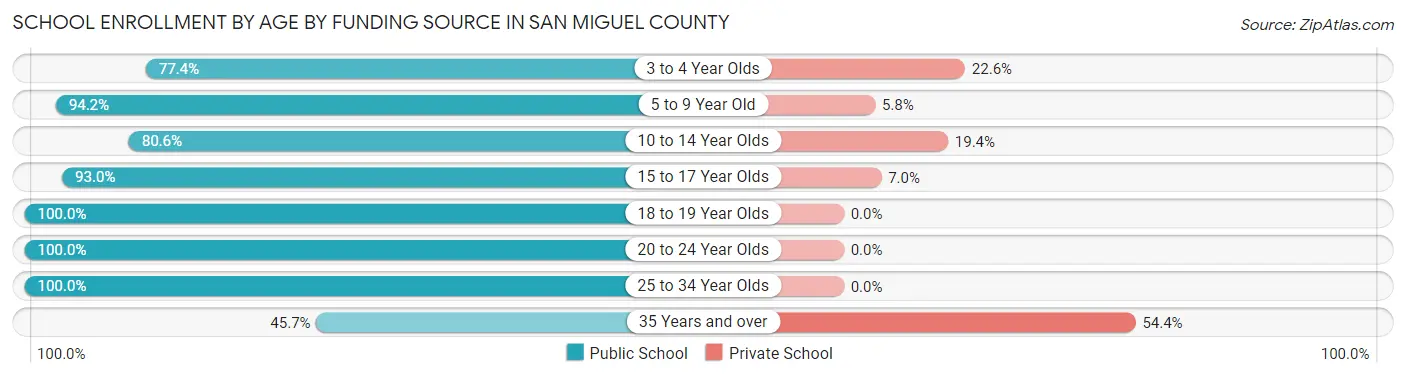
School Enrollment by Age by Funding Source in San Miguel County
Out of a total of 1,216 students who are enrolled in schools in San Miguel County, 171 (14.1%) attend a private institution, while the remaining 1,045 (85.9%) are enrolled in public schools. The age group of 35 years and over has the highest likelihood of being enrolled in private schools, with 50 (54.3% in the age bracket) enrolled. Conversely, the age group of 18 to 19 year olds has the lowest likelihood of being enrolled in a private school, with 63 (100.0% in the age bracket) attending a public institution.
| Age Bracket | Public School | Private School |
| 3 to 4 Year Olds | 24 (77.4%) | 7 (22.6%) |
| 5 to 9 Year Old | 323 (94.2%) | 20 (5.8%) |
| 10 to 14 Year Olds | 328 (80.6%) | 79 (19.4%) |
| 15 to 17 Year Olds | 213 (93.0%) | 16 (7.0%) |
| 18 to 19 Year Olds | 63 (100.0%) | 0 (0.0%) |
| 20 to 24 Year Olds | 19 (100.0%) | 0 (0.0%) |
| 25 to 34 Year Olds | 32 (100.0%) | 0 (0.0%) |
| 35 Years and over | 42 (45.7%) | 50 (54.3%) |
| Total | 1,045 (85.9%) | 171 (14.1%) |
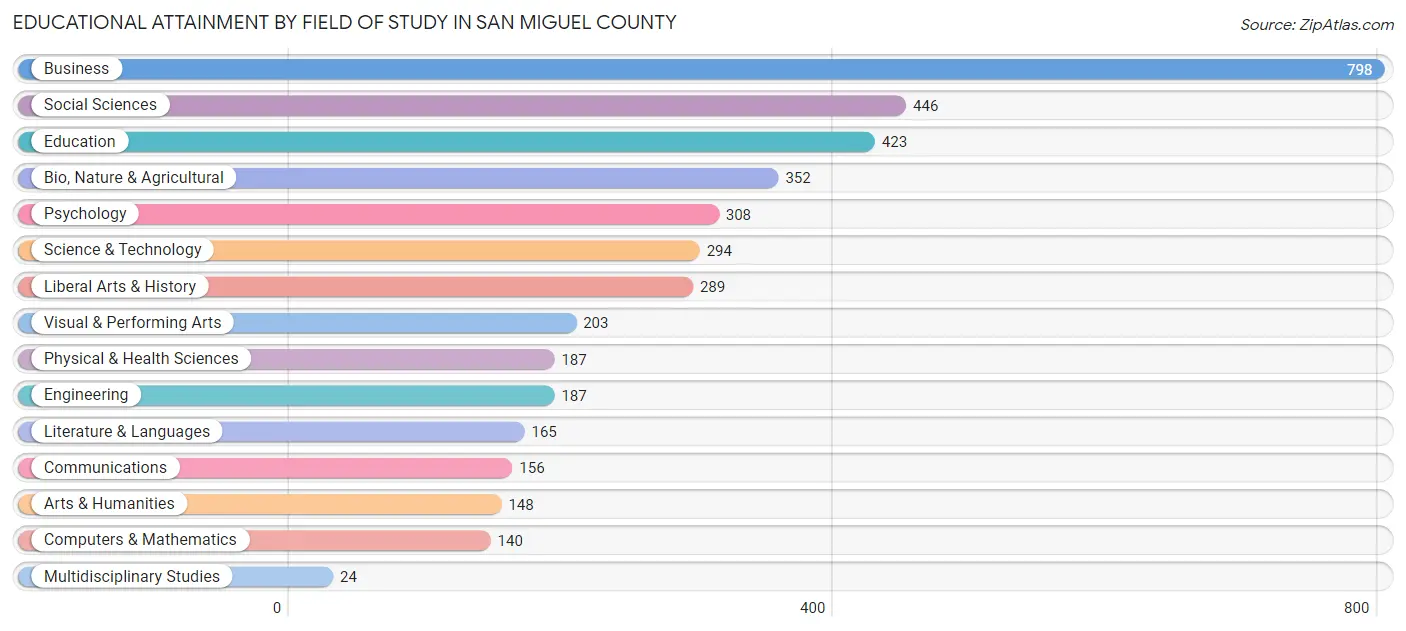
Educational Attainment by Field of Study in San Miguel County
Business (798 | 19.4%), social sciences (446 | 10.8%), education (423 | 10.3%), bio, nature & agricultural (352 | 8.5%), and psychology (308 | 7.5%) are the most common fields of study among 4,120 individuals in San Miguel County who have obtained a bachelor's degree or higher.
| Field of Study | # Graduates | % Graduates |
| Computers & Mathematics | 140 | 3.4% |
| Bio, Nature & Agricultural | 352 | 8.5% |
| Physical & Health Sciences | 187 | 4.5% |
| Psychology | 308 | 7.5% |
| Social Sciences | 446 | 10.8% |
| Engineering | 187 | 4.5% |
| Multidisciplinary Studies | 24 | 0.6% |
| Science & Technology | 294 | 7.1% |
| Business | 798 | 19.4% |
| Education | 423 | 10.3% |
| Literature & Languages | 165 | 4.0% |
| Liberal Arts & History | 289 | 7.0% |
| Visual & Performing Arts | 203 | 4.9% |
| Communications | 156 | 3.8% |
| Arts & Humanities | 148 | 3.6% |
| Total | 4,120 | 100.0% |
Transportation & Commute in San Miguel County
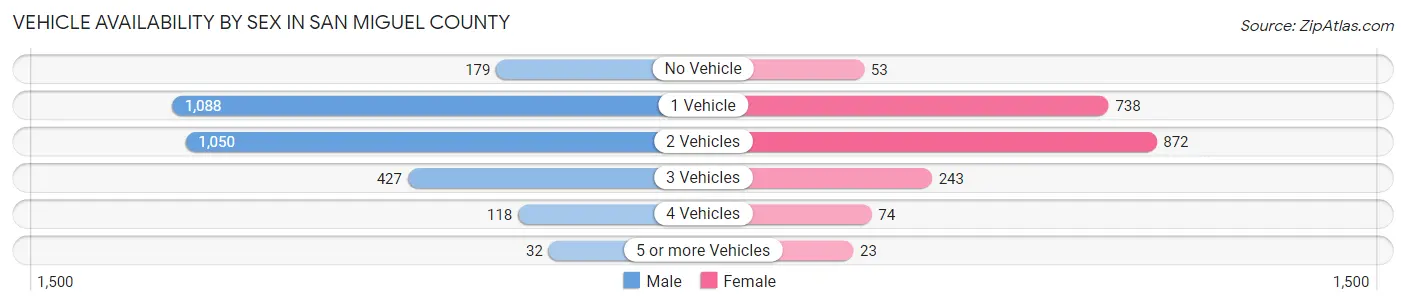
Vehicle Availability by Sex in San Miguel County
The most prevalent vehicle ownership categories in San Miguel County are males with 1 vehicle (1,088, accounting for 37.6%) and females with 1 vehicle (738, making up 54.3%).
| Vehicles Available | Male | Female |
| No Vehicle | 179 (6.2%) | 53 (2.6%) |
| 1 Vehicle | 1,088 (37.6%) | 738 (36.8%) |
| 2 Vehicles | 1,050 (36.3%) | 872 (43.5%) |
| 3 Vehicles | 427 (14.7%) | 243 (12.1%) |
| 4 Vehicles | 118 (4.1%) | 74 (3.7%) |
| 5 or more Vehicles | 32 (1.1%) | 23 (1.1%) |
| Total | 2,894 (100.0%) | 2,003 (100.0%) |
Commute Time in San Miguel County
The most frequently occuring commute durations in San Miguel County are 5 to 9 minutes (916 commuters, 22.3%), 10 to 14 minutes (892 commuters, 21.7%), and 15 to 19 minutes (867 commuters, 21.1%).
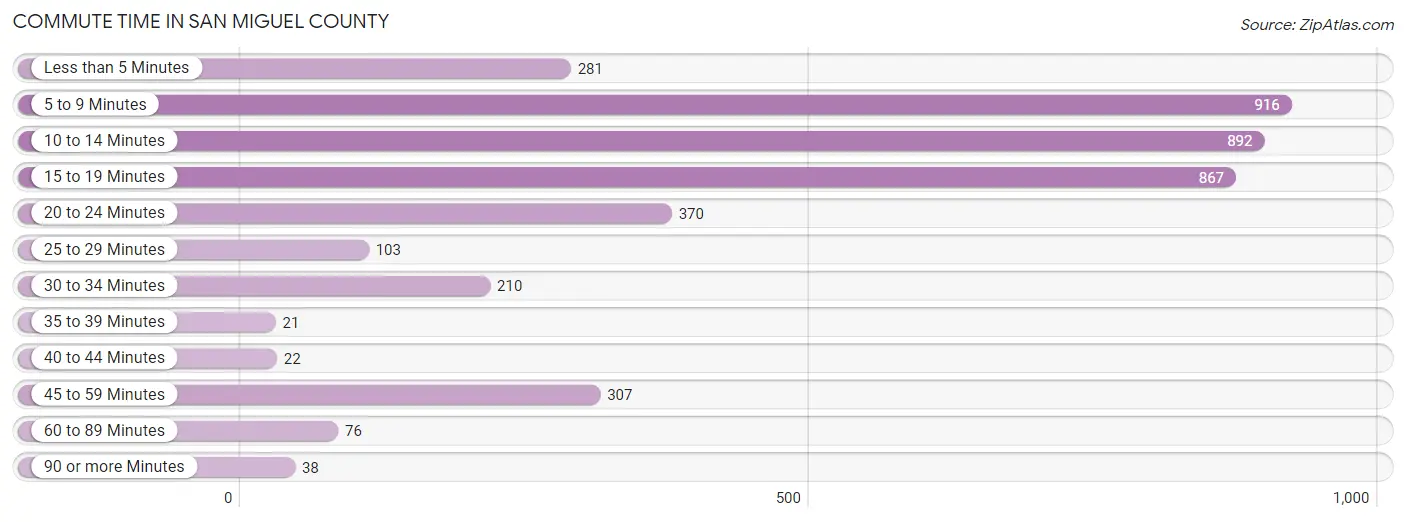
| Commute Time | # Commuters | % Commuters |
| Less than 5 Minutes | 281 | 6.9% |
| 5 to 9 Minutes | 916 | 22.3% |
| 10 to 14 Minutes | 892 | 21.7% |
| 15 to 19 Minutes | 867 | 21.1% |
| 20 to 24 Minutes | 370 | 9.0% |
| 25 to 29 Minutes | 103 | 2.5% |
| 30 to 34 Minutes | 210 | 5.1% |
| 35 to 39 Minutes | 21 | 0.5% |
| 40 to 44 Minutes | 22 | 0.5% |
| 45 to 59 Minutes | 307 | 7.5% |
| 60 to 89 Minutes | 76 | 1.8% |
| 90 or more Minutes | 38 | 0.9% |
Commute Time by Sex in San Miguel County
The most common commute times in San Miguel County are 10 to 14 minutes (549 commuters, 23.4%) for males and 5 to 9 minutes (467 commuters, 26.5%) for females.
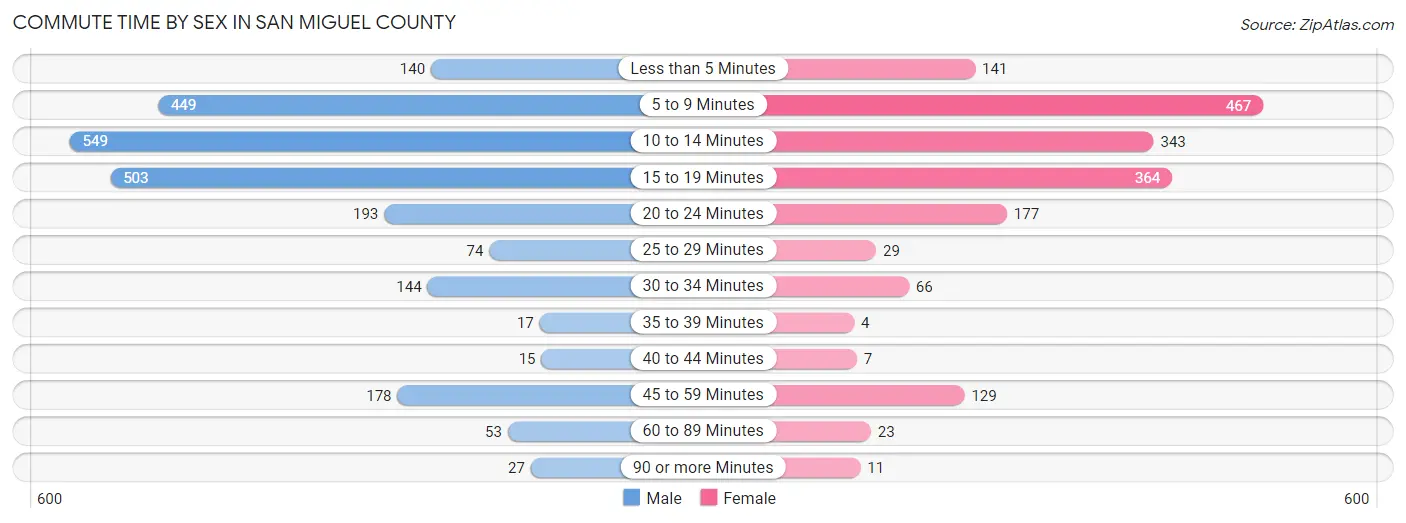
| Commute Time | Male | Female |
| Less than 5 Minutes | 140 (6.0%) | 141 (8.0%) |
| 5 to 9 Minutes | 449 (19.2%) | 467 (26.5%) |
| 10 to 14 Minutes | 549 (23.4%) | 343 (19.5%) |
| 15 to 19 Minutes | 503 (21.5%) | 364 (20.7%) |
| 20 to 24 Minutes | 193 (8.2%) | 177 (10.1%) |
| 25 to 29 Minutes | 74 (3.2%) | 29 (1.7%) |
| 30 to 34 Minutes | 144 (6.1%) | 66 (3.7%) |
| 35 to 39 Minutes | 17 (0.7%) | 4 (0.2%) |
| 40 to 44 Minutes | 15 (0.6%) | 7 (0.4%) |
| 45 to 59 Minutes | 178 (7.6%) | 129 (7.3%) |
| 60 to 89 Minutes | 53 (2.3%) | 23 (1.3%) |
| 90 or more Minutes | 27 (1.1%) | 11 (0.6%) |
Time of Departure to Work by Sex in San Miguel County
The most frequent times of departure to work in San Miguel County are 7:30 AM to 7:59 AM (436, 18.6%) for males and 7:30 AM to 7:59 AM (436, 24.8%) for females.
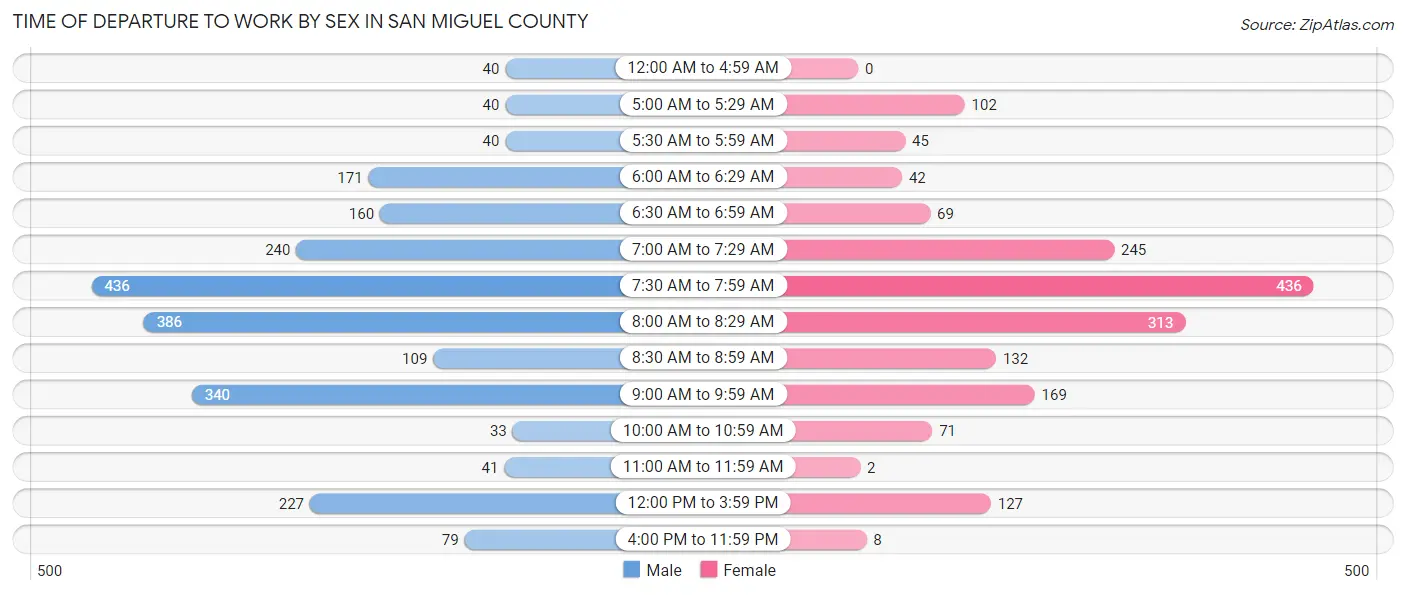
| Time of Departure | Male | Female |
| 12:00 AM to 4:59 AM | 40 (1.7%) | 0 (0.0%) |
| 5:00 AM to 5:29 AM | 40 (1.7%) | 102 (5.8%) |
| 5:30 AM to 5:59 AM | 40 (1.7%) | 45 (2.6%) |
| 6:00 AM to 6:29 AM | 171 (7.3%) | 42 (2.4%) |
| 6:30 AM to 6:59 AM | 160 (6.8%) | 69 (3.9%) |
| 7:00 AM to 7:29 AM | 240 (10.2%) | 245 (13.9%) |
| 7:30 AM to 7:59 AM | 436 (18.6%) | 436 (24.8%) |
| 8:00 AM to 8:29 AM | 386 (16.5%) | 313 (17.8%) |
| 8:30 AM to 8:59 AM | 109 (4.6%) | 132 (7.5%) |
| 9:00 AM to 9:59 AM | 340 (14.5%) | 169 (9.6%) |
| 10:00 AM to 10:59 AM | 33 (1.4%) | 71 (4.0%) |
| 11:00 AM to 11:59 AM | 41 (1.8%) | 2 (0.1%) |
| 12:00 PM to 3:59 PM | 227 (9.7%) | 127 (7.2%) |
| 4:00 PM to 11:59 PM | 79 (3.4%) | 8 (0.4%) |
| Total | 2,342 (100.0%) | 1,761 (100.0%) |
Housing Occupancy in San Miguel County
Occupancy by Ownership in San Miguel County
Of the total 3,850 dwellings in San Miguel County, owner-occupied units account for 2,351 (61.1%), while renter-occupied units make up 1,499 (38.9%).
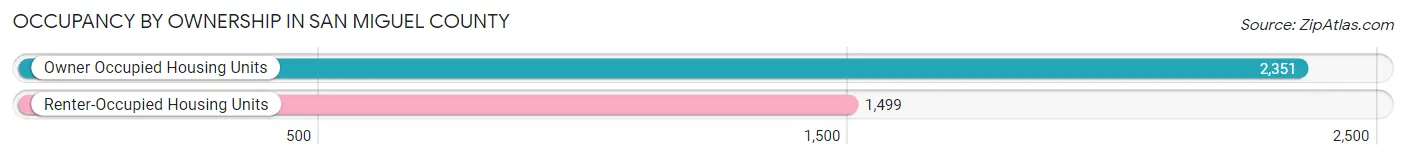
| Occupancy | # Housing Units | % Housing Units |
| Owner Occupied Housing Units | 2,351 | 61.1% |
| Renter-Occupied Housing Units | 1,499 | 38.9% |
| Total Occupied Housing Units | 3,850 | 100.0% |
Occupancy by Household Size in San Miguel County
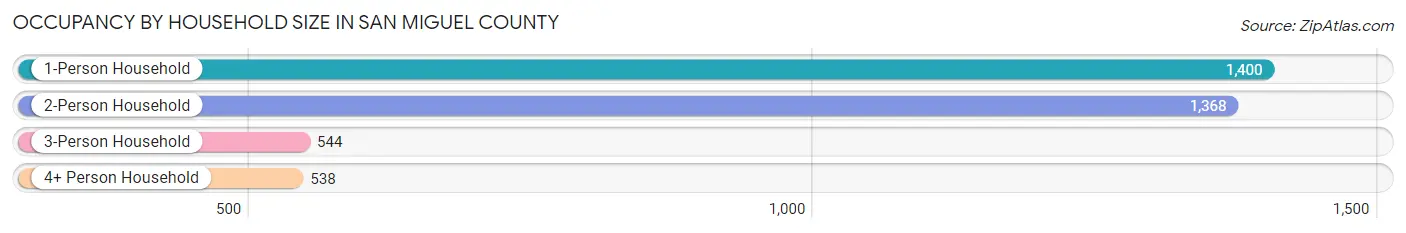
| Household Size | # Housing Units | % Housing Units |
| 1-Person Household | 1,400 | 36.4% |
| 2-Person Household | 1,368 | 35.5% |
| 3-Person Household | 544 | 14.1% |
| 4+ Person Household | 538 | 14.0% |
| Total Housing Units | 3,850 | 100.0% |
Occupancy by Ownership by Household Size in San Miguel County
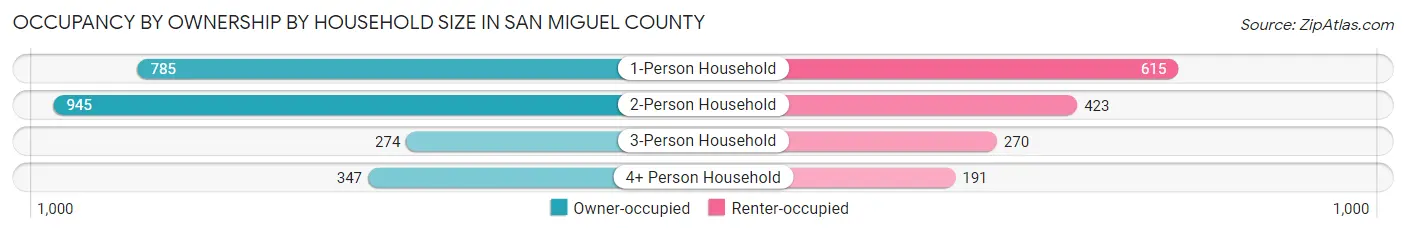
| Household Size | Owner-occupied | Renter-occupied |
| 1-Person Household | 785 (56.1%) | 615 (43.9%) |
| 2-Person Household | 945 (69.1%) | 423 (30.9%) |
| 3-Person Household | 274 (50.4%) | 270 (49.6%) |
| 4+ Person Household | 347 (64.5%) | 191 (35.5%) |
| Total Housing Units | 2,351 (61.1%) | 1,499 (38.9%) |
Occupancy by Educational Attainment in San Miguel County
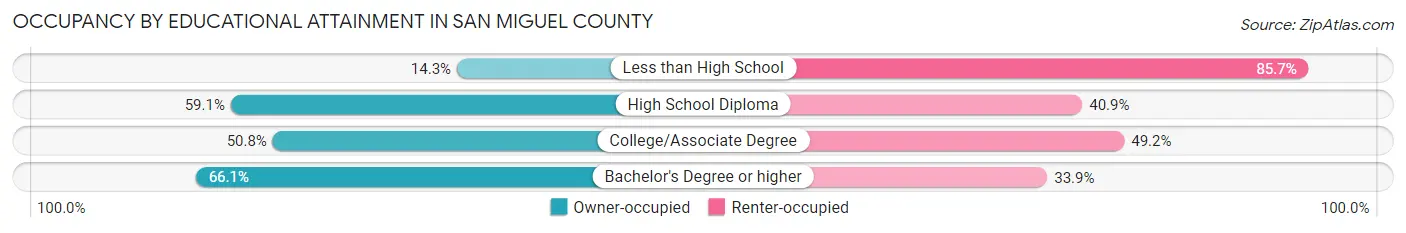
| Household Size | Owner-occupied | Renter-occupied |
| Less than High School | 11 (14.3%) | 66 (85.7%) |
| High School Diploma | 421 (59.1%) | 291 (40.9%) |
| College/Associate Degree | 344 (50.8%) | 333 (49.2%) |
| Bachelor's Degree or higher | 1,575 (66.1%) | 809 (33.9%) |
Occupancy by Age of Householder in San Miguel County
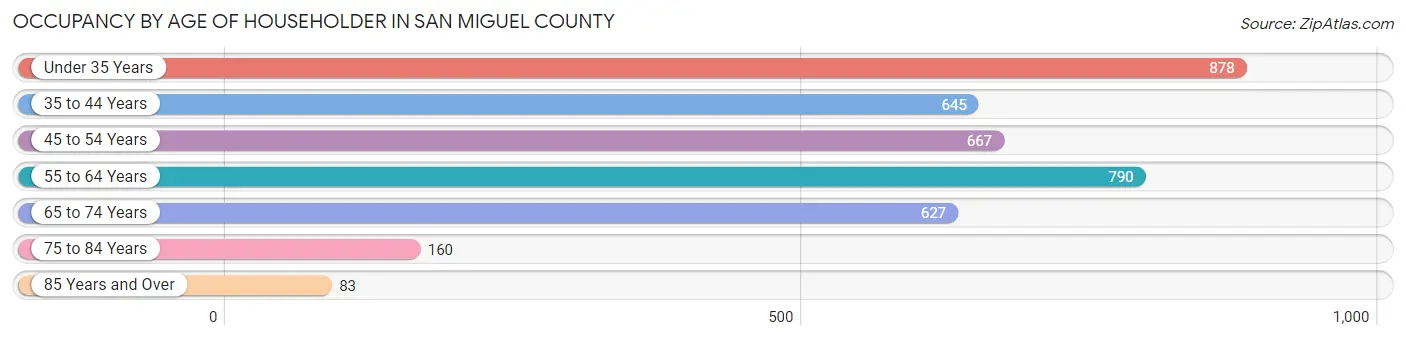
| Age Bracket | # Households | % Households |
| Under 35 Years | 878 | 22.8% |
| 35 to 44 Years | 645 | 16.8% |
| 45 to 54 Years | 667 | 17.3% |
| 55 to 64 Years | 790 | 20.5% |
| 65 to 74 Years | 627 | 16.3% |
| 75 to 84 Years | 160 | 4.2% |
| 85 Years and Over | 83 | 2.2% |
| Total | 3,850 | 100.0% |
Housing Finances in San Miguel County
Median Income by Occupancy in San Miguel County
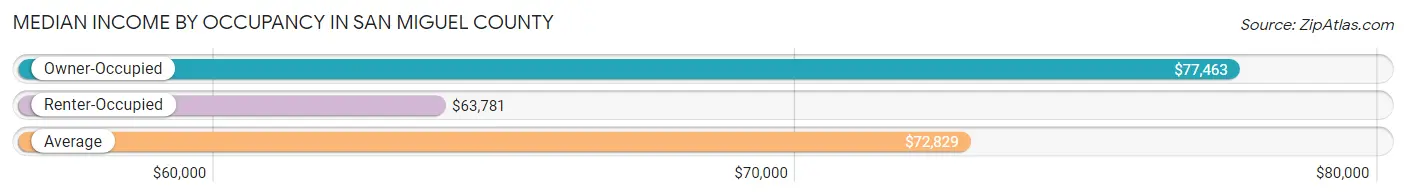
| Occupancy Type | # Households | Median Income |
| Owner-Occupied | 2,351 (61.1%) | $77,463 |
| Renter-Occupied | 1,499 (38.9%) | $63,781 |
| Average | 3,850 (100.0%) | $72,829 |
Occupancy by Householder Income Bracket in San Miguel County
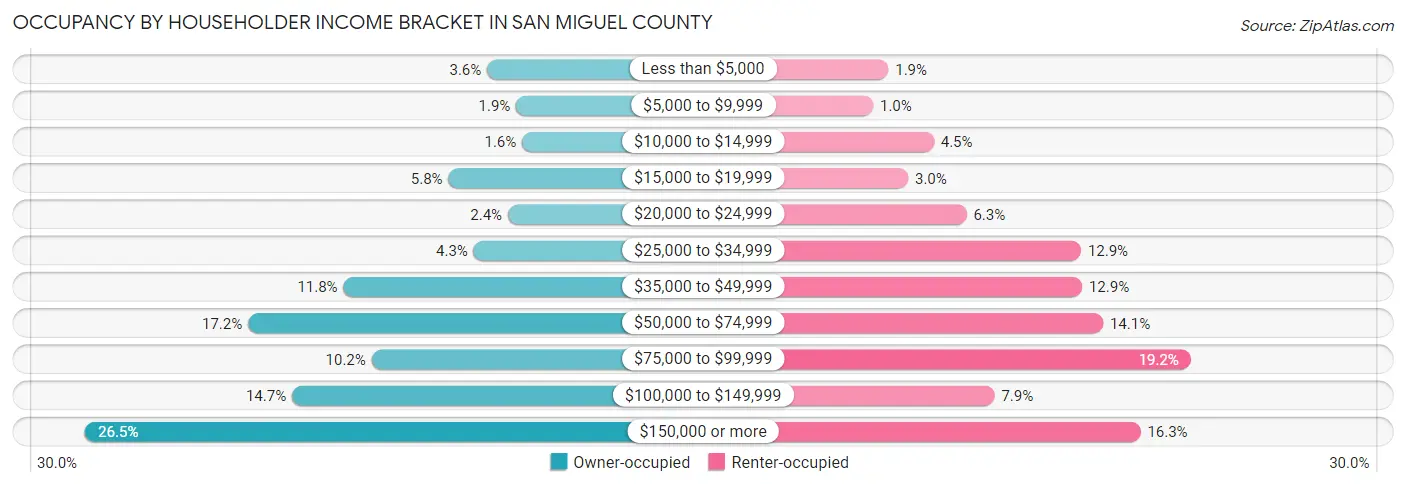
| Income Bracket | Owner-occupied | Renter-occupied |
| Less than $5,000 | 84 (3.6%) | 28 (1.9%) |
| $5,000 to $9,999 | 45 (1.9%) | 15 (1.0%) |
| $10,000 to $14,999 | 37 (1.6%) | 67 (4.5%) |
| $15,000 to $19,999 | 136 (5.8%) | 45 (3.0%) |
| $20,000 to $24,999 | 56 (2.4%) | 95 (6.3%) |
| $25,000 to $34,999 | 102 (4.3%) | 193 (12.9%) |
| $35,000 to $49,999 | 277 (11.8%) | 194 (12.9%) |
| $50,000 to $74,999 | 405 (17.2%) | 212 (14.1%) |
| $75,000 to $99,999 | 239 (10.2%) | 287 (19.2%) |
| $100,000 to $149,999 | 346 (14.7%) | 119 (7.9%) |
| $150,000 or more | 624 (26.5%) | 244 (16.3%) |
| Total | 2,351 (100.0%) | 1,499 (100.0%) |
Monthly Housing Cost Tiers in San Miguel County
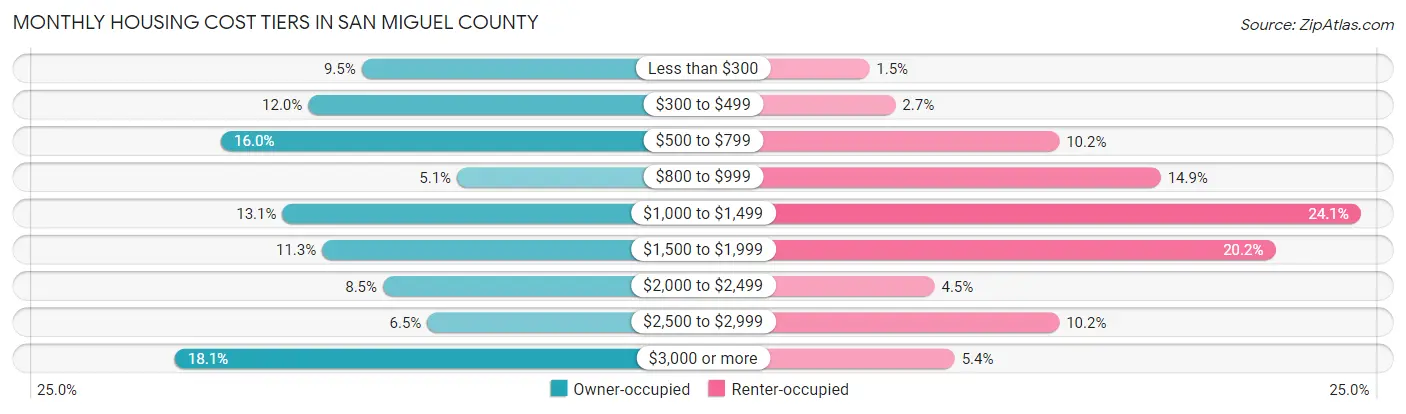
| Monthly Cost | Owner-occupied | Renter-occupied |
| Less than $300 | 223 (9.5%) | 22 (1.5%) |
| $300 to $499 | 281 (11.9%) | 40 (2.7%) |
| $500 to $799 | 375 (16.0%) | 153 (10.2%) |
| $800 to $999 | 120 (5.1%) | 223 (14.9%) |
| $1,000 to $1,499 | 309 (13.1%) | 361 (24.1%) |
| $1,500 to $1,999 | 266 (11.3%) | 302 (20.2%) |
| $2,000 to $2,499 | 200 (8.5%) | 67 (4.5%) |
| $2,500 to $2,999 | 152 (6.5%) | 153 (10.2%) |
| $3,000 or more | 425 (18.1%) | 81 (5.4%) |
| Total | 2,351 (100.0%) | 1,499 (100.0%) |
Physical Housing Characteristics in San Miguel County
Housing Structures in San Miguel County
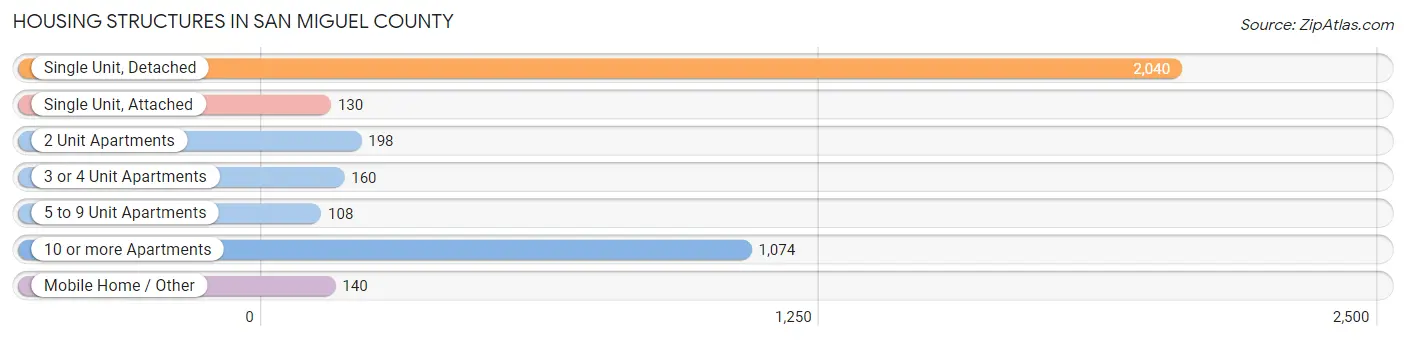
| Structure Type | # Housing Units | % Housing Units |
| Single Unit, Detached | 2,040 | 53.0% |
| Single Unit, Attached | 130 | 3.4% |
| 2 Unit Apartments | 198 | 5.1% |
| 3 or 4 Unit Apartments | 160 | 4.2% |
| 5 to 9 Unit Apartments | 108 | 2.8% |
| 10 or more Apartments | 1,074 | 27.9% |
| Mobile Home / Other | 140 | 3.6% |
| Total | 3,850 | 100.0% |
Housing Structures by Occupancy in San Miguel County
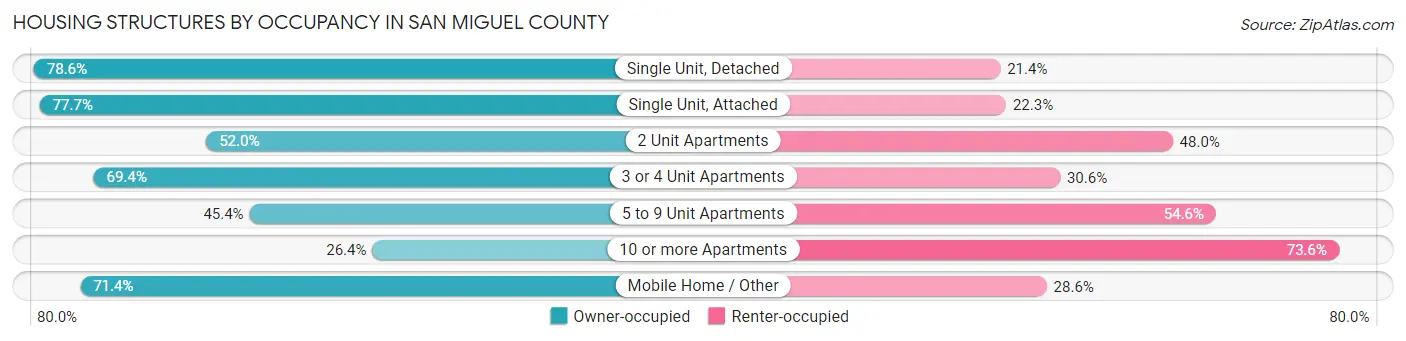
| Structure Type | Owner-occupied | Renter-occupied |
| Single Unit, Detached | 1,603 (78.6%) | 437 (21.4%) |
| Single Unit, Attached | 101 (77.7%) | 29 (22.3%) |
| 2 Unit Apartments | 103 (52.0%) | 95 (48.0%) |
| 3 or 4 Unit Apartments | 111 (69.4%) | 49 (30.6%) |
| 5 to 9 Unit Apartments | 49 (45.4%) | 59 (54.6%) |
| 10 or more Apartments | 284 (26.4%) | 790 (73.6%) |
| Mobile Home / Other | 100 (71.4%) | 40 (28.6%) |
| Total | 2,351 (61.1%) | 1,499 (38.9%) |
Housing Structures by Number of Rooms in San Miguel County
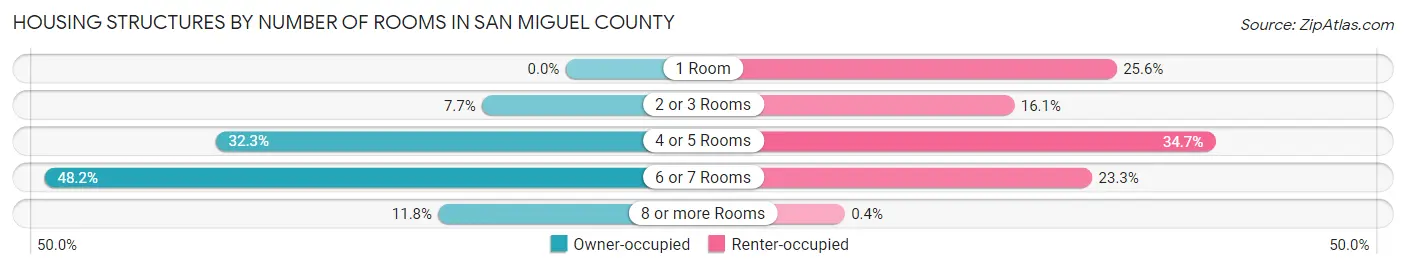
| Number of Rooms | Owner-occupied | Renter-occupied |
| 1 Room | 0 (0.0%) | 383 (25.6%) |
| 2 or 3 Rooms | 182 (7.7%) | 241 (16.1%) |
| 4 or 5 Rooms | 760 (32.3%) | 520 (34.7%) |
| 6 or 7 Rooms | 1,132 (48.1%) | 349 (23.3%) |
| 8 or more Rooms | 277 (11.8%) | 6 (0.4%) |
| Total | 2,351 (100.0%) | 1,499 (100.0%) |
Housing Structure by Heating Type in San Miguel County

| Heating Type | Owner-occupied | Renter-occupied |
| Utility Gas | 1,256 (53.4%) | 643 (42.9%) |
| Bottled, Tank, or LP Gas | 406 (17.3%) | 87 (5.8%) |
| Electricity | 461 (19.6%) | 661 (44.1%) |
| Fuel Oil or Kerosene | 7 (0.3%) | 59 (3.9%) |
| Coal or Coke | 0 (0.0%) | 0 (0.0%) |
| All other Fuels | 221 (9.4%) | 41 (2.7%) |
| No Fuel Used | 0 (0.0%) | 8 (0.5%) |
| Total | 2,351 (100.0%) | 1,499 (100.0%) |
Household Vehicle Usage in San Miguel County
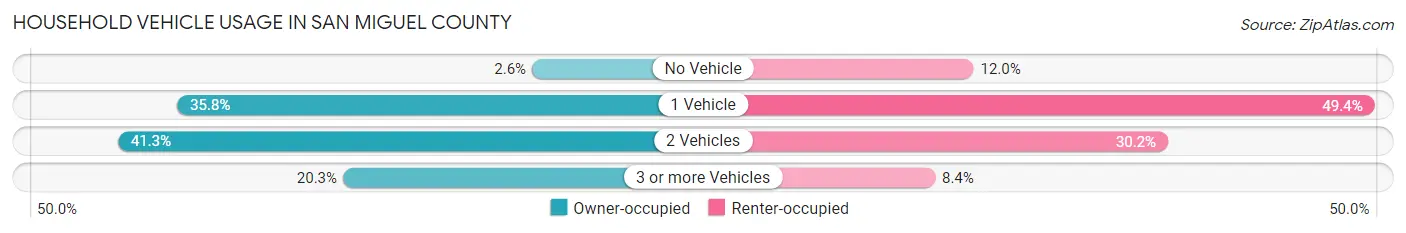
| Vehicles per Household | Owner-occupied | Renter-occupied |
| No Vehicle | 62 (2.6%) | 180 (12.0%) |
| 1 Vehicle | 841 (35.8%) | 741 (49.4%) |
| 2 Vehicles | 971 (41.3%) | 452 (30.1%) |
| 3 or more Vehicles | 477 (20.3%) | 126 (8.4%) |
| Total | 2,351 (100.0%) | 1,499 (100.0%) |
Real Estate & Mortgages in San Miguel County
Real Estate and Mortgage Overview in San Miguel County
| Characteristic | Without Mortgage | With Mortgage |
| Housing Units | 1,164 | 1,187 |
| Median Property Value | $553,600 | $564,700 |
| Median Household Income | $59,295 | $395 |
| Monthly Housing Costs | $553 | $389 |
| Real Estate Taxes | $1,418 | $5 |
Property Value by Mortgage Status in San Miguel County
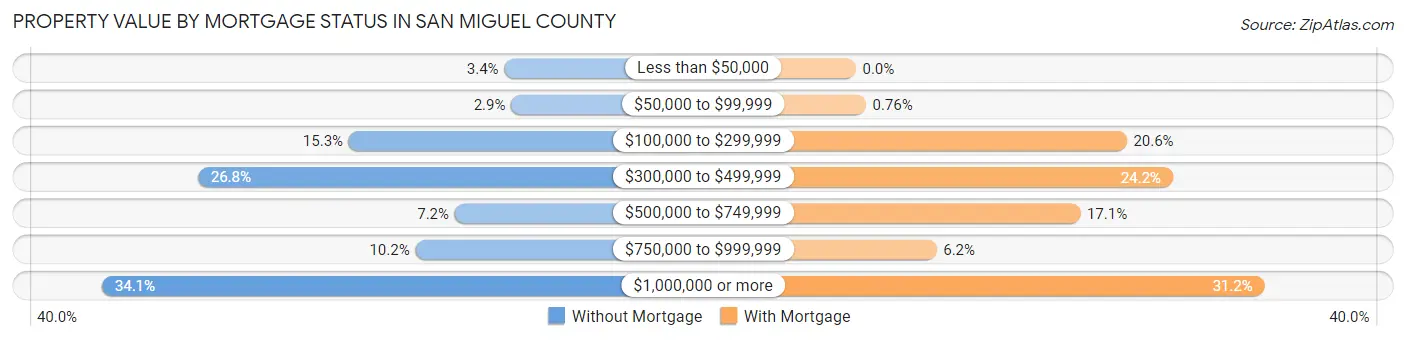
| Property Value | Without Mortgage | With Mortgage |
| Less than $50,000 | 40 (3.4%) | 0 (0.0%) |
| $50,000 to $99,999 | 34 (2.9%) | 9 (0.8%) |
| $100,000 to $299,999 | 178 (15.3%) | 245 (20.6%) |
| $300,000 to $499,999 | 312 (26.8%) | 287 (24.2%) |
| $500,000 to $749,999 | 84 (7.2%) | 203 (17.1%) |
| $750,000 to $999,999 | 119 (10.2%) | 73 (6.1%) |
| $1,000,000 or more | 397 (34.1%) | 370 (31.2%) |
| Total | 1,164 (100.0%) | 1,187 (100.0%) |
Household Income by Mortgage Status in San Miguel County
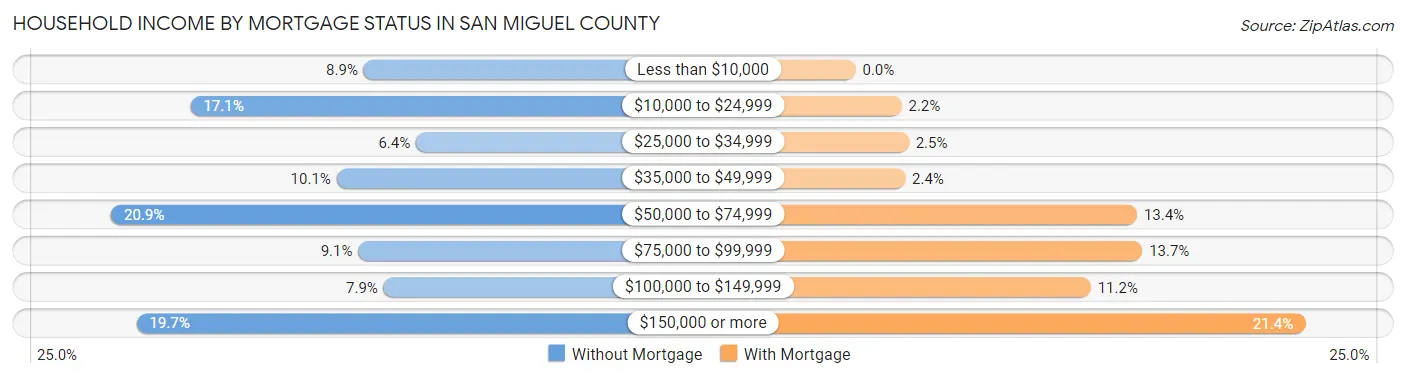
| Household Income | Without Mortgage | With Mortgage |
| Less than $10,000 | 103 (8.8%) | 0 (0.0%) |
| $10,000 to $24,999 | 199 (17.1%) | 26 (2.2%) |
| $25,000 to $34,999 | 74 (6.4%) | 30 (2.5%) |
| $35,000 to $49,999 | 118 (10.1%) | 28 (2.4%) |
| $50,000 to $74,999 | 243 (20.9%) | 159 (13.4%) |
| $75,000 to $99,999 | 106 (9.1%) | 162 (13.7%) |
| $100,000 to $149,999 | 92 (7.9%) | 133 (11.2%) |
| $150,000 or more | 229 (19.7%) | 254 (21.4%) |
| Total | 1,164 (100.0%) | 1,187 (100.0%) |
Property Value to Household Income Ratio in San Miguel County
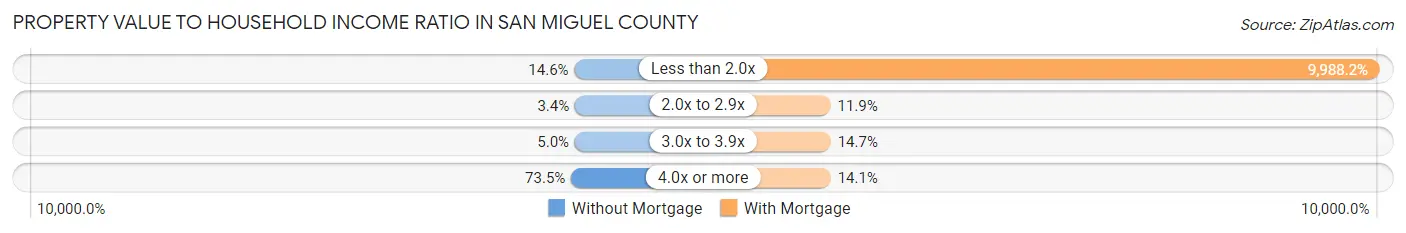
| Value-to-Income Ratio | Without Mortgage | With Mortgage |
| Less than 2.0x | 170 (14.6%) | 118,560 (9,988.2%) |
| 2.0x to 2.9x | 40 (3.4%) | 141 (11.9%) |
| 3.0x to 3.9x | 58 (5.0%) | 174 (14.7%) |
| 4.0x or more | 855 (73.5%) | 167 (14.1%) |
| Total | 1,164 (100.0%) | 1,187 (100.0%) |
Real Estate Taxes by Mortgage Status in San Miguel County
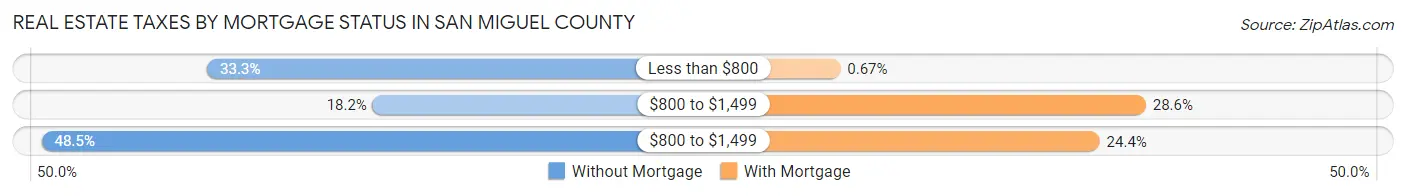
| Property Taxes | Without Mortgage | With Mortgage |
| Less than $800 | 388 (33.3%) | 8 (0.7%) |
| $800 to $1,499 | 212 (18.2%) | 339 (28.6%) |
| $800 to $1,499 | 564 (48.4%) | 289 (24.3%) |
| Total | 1,164 (100.0%) | 1,187 (100.0%) |
Health & Disability in San Miguel County
Health Insurance Coverage by Age in San Miguel County
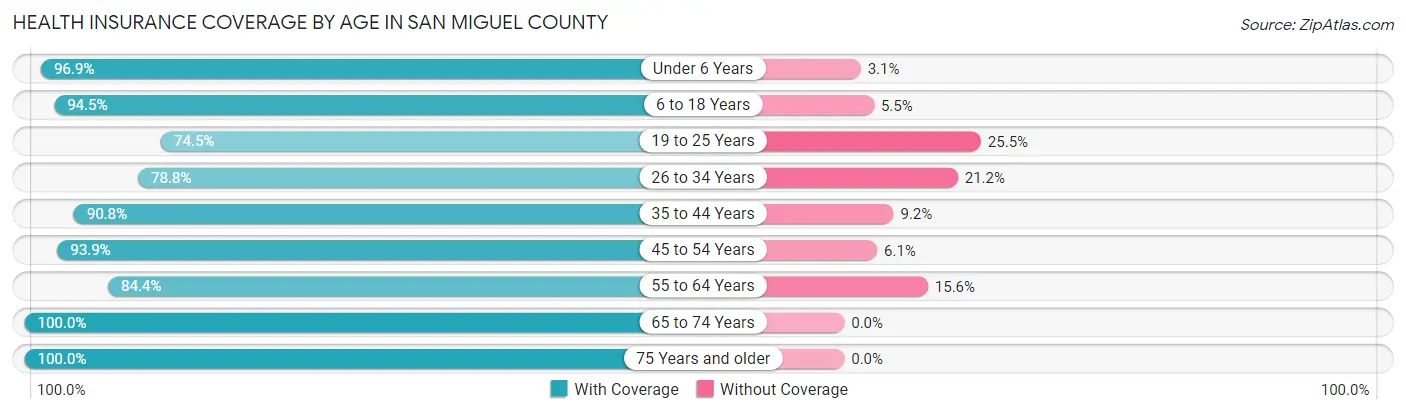
| Age Bracket | With Coverage | Without Coverage |
| Under 6 Years | 380 (96.9%) | 12 (3.1%) |
| 6 to 18 Years | 922 (94.5%) | 54 (5.5%) |
| 19 to 25 Years | 398 (74.5%) | 136 (25.5%) |
| 26 to 34 Years | 987 (78.8%) | 265 (21.2%) |
| 35 to 44 Years | 1,108 (90.8%) | 112 (9.2%) |
| 45 to 54 Years | 1,120 (93.9%) | 73 (6.1%) |
| 55 to 64 Years | 986 (84.4%) | 182 (15.6%) |
| 65 to 74 Years | 1,004 (100.0%) | 0 (0.0%) |
| 75 Years and older | 327 (100.0%) | 0 (0.0%) |
| Total | 7,232 (89.7%) | 834 (10.3%) |
Health Insurance Coverage by Citizenship Status in San Miguel County
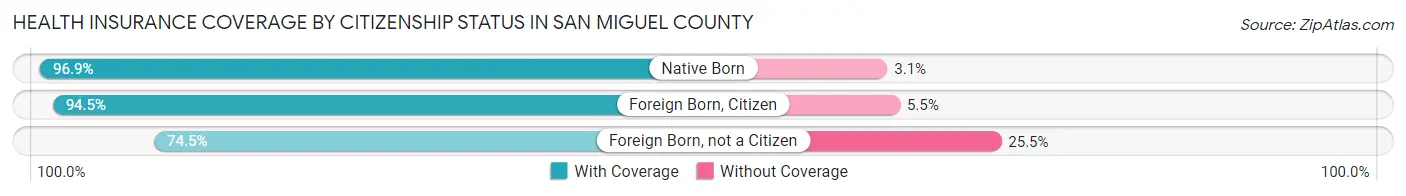
| Citizenship Status | With Coverage | Without Coverage |
| Native Born | 380 (96.9%) | 12 (3.1%) |
| Foreign Born, Citizen | 922 (94.5%) | 54 (5.5%) |
| Foreign Born, not a Citizen | 398 (74.5%) | 136 (25.5%) |
Health Insurance Coverage by Household Income in San Miguel County
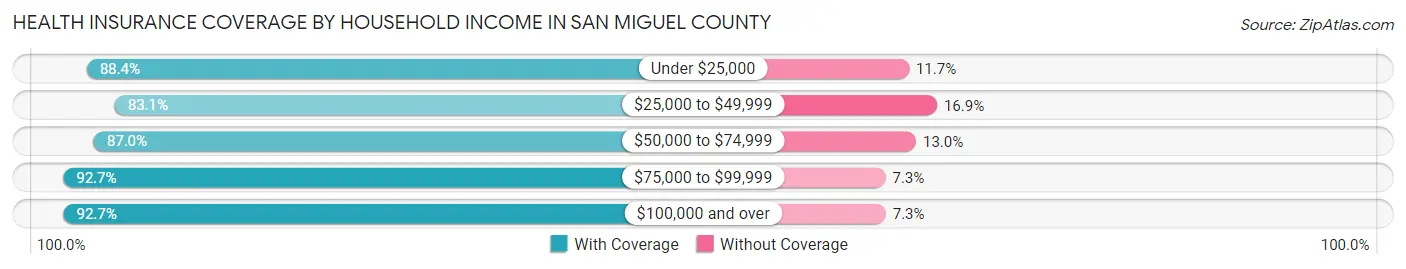
| Household Income | With Coverage | Without Coverage |
| Under $25,000 | 660 (88.3%) | 87 (11.7%) |
| $25,000 to $49,999 | 1,264 (83.1%) | 257 (16.9%) |
| $50,000 to $74,999 | 1,026 (87.0%) | 153 (13.0%) |
| $75,000 to $99,999 | 1,048 (92.7%) | 82 (7.3%) |
| $100,000 and over | 3,234 (92.7%) | 255 (7.3%) |
Public vs Private Health Insurance Coverage by Age in San Miguel County
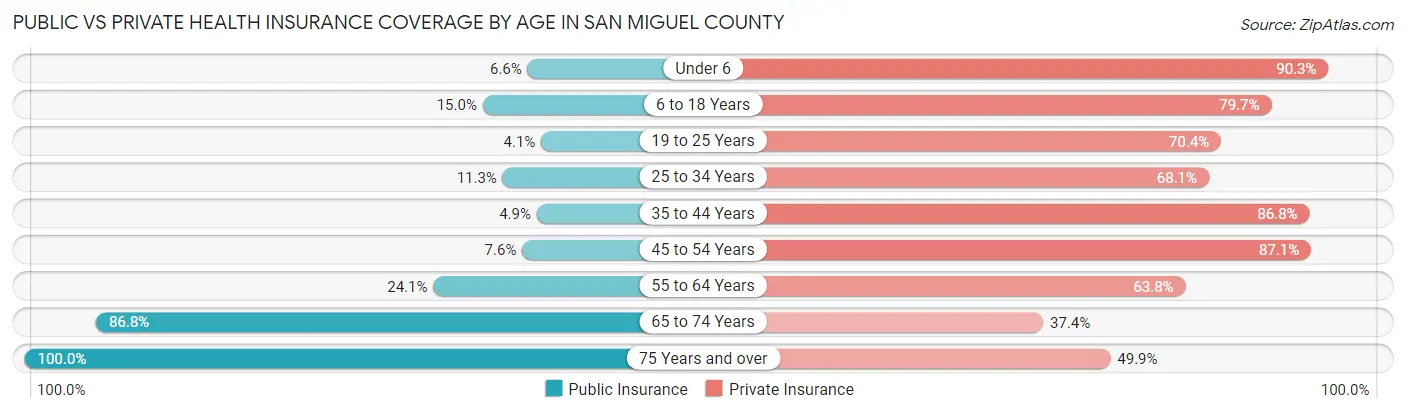
| Age Bracket | Public Insurance | Private Insurance |
| Under 6 | 26 (6.6%) | 354 (90.3%) |
| 6 to 18 Years | 146 (15.0%) | 778 (79.7%) |
| 19 to 25 Years | 22 (4.1%) | 376 (70.4%) |
| 25 to 34 Years | 141 (11.3%) | 853 (68.1%) |
| 35 to 44 Years | 60 (4.9%) | 1,059 (86.8%) |
| 45 to 54 Years | 91 (7.6%) | 1,039 (87.1%) |
| 55 to 64 Years | 282 (24.1%) | 745 (63.8%) |
| 65 to 74 Years | 871 (86.8%) | 375 (37.3%) |
| 75 Years and over | 327 (100.0%) | 163 (49.8%) |
| Total | 1,966 (24.4%) | 5,742 (71.2%) |
Disability Status by Sex by Age in San Miguel County
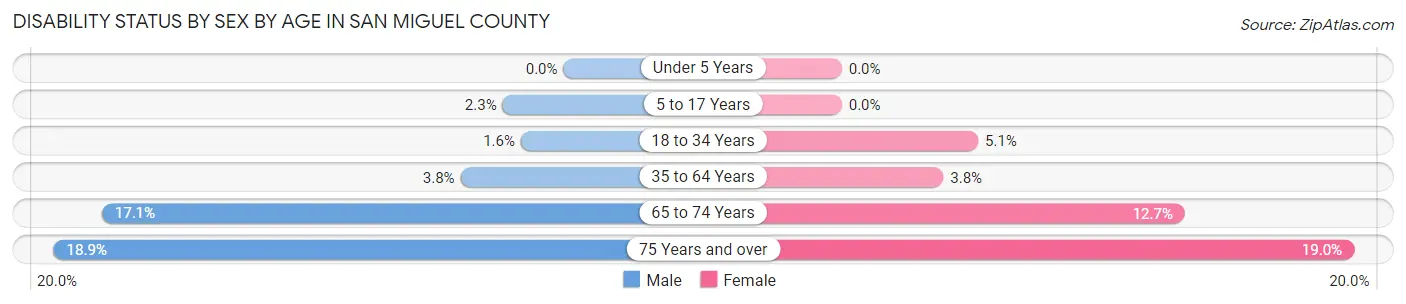
| Age Bracket | Male | Female |
| Under 5 Years | 0 (0.0%) | 0 (0.0%) |
| 5 to 17 Years | 15 (2.3%) | 0 (0.0%) |
| 18 to 34 Years | 15 (1.6%) | 45 (5.1%) |
| 35 to 64 Years | 73 (3.8%) | 63 (3.8%) |
| 65 to 74 Years | 98 (17.1%) | 55 (12.7%) |
| 75 Years and over | 35 (18.9%) | 27 (19.0%) |
Disability Class by Sex by Age in San Miguel County
Disability Class: Hearing Difficulty
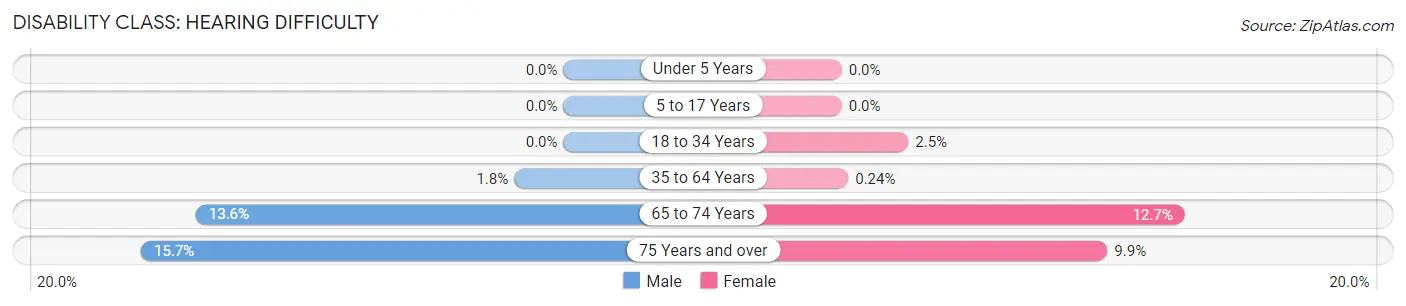
| Age Bracket | Male | Female |
| Under 5 Years | 0 (0.0%) | 0 (0.0%) |
| 5 to 17 Years | 0 (0.0%) | 0 (0.0%) |
| 18 to 34 Years | 0 (0.0%) | 22 (2.5%) |
| 35 to 64 Years | 35 (1.8%) | 4 (0.2%) |
| 65 to 74 Years | 78 (13.6%) | 55 (12.7%) |
| 75 Years and over | 29 (15.7%) | 14 (9.9%) |
Disability Class: Vision Difficulty
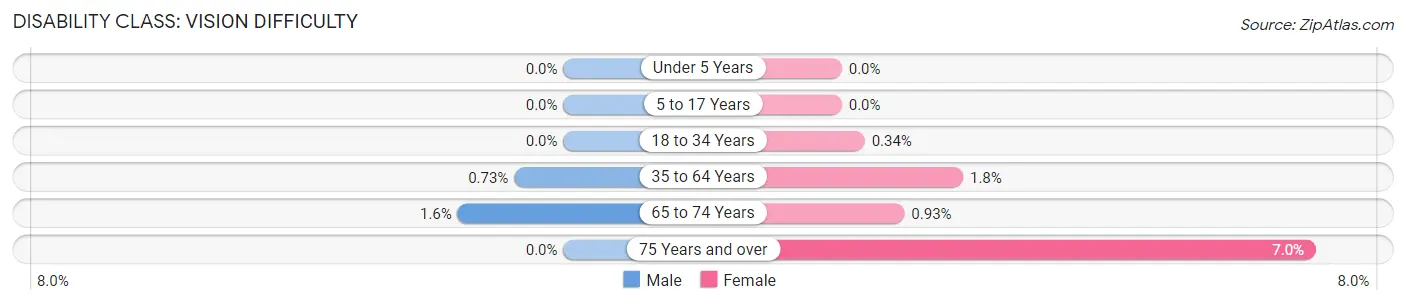
| Age Bracket | Male | Female |
| Under 5 Years | 0 (0.0%) | 0 (0.0%) |
| 5 to 17 Years | 0 (0.0%) | 0 (0.0%) |
| 18 to 34 Years | 0 (0.0%) | 3 (0.3%) |
| 35 to 64 Years | 14 (0.7%) | 30 (1.8%) |
| 65 to 74 Years | 9 (1.6%) | 4 (0.9%) |
| 75 Years and over | 0 (0.0%) | 10 (7.0%) |
Disability Class: Cognitive Difficulty
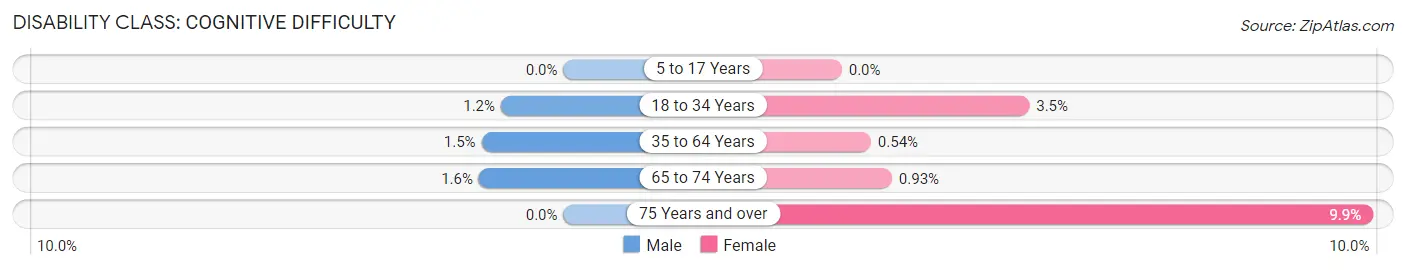
| Age Bracket | Male | Female |
| 5 to 17 Years | 0 (0.0%) | 0 (0.0%) |
| 18 to 34 Years | 11 (1.2%) | 31 (3.5%) |
| 35 to 64 Years | 29 (1.5%) | 9 (0.5%) |
| 65 to 74 Years | 9 (1.6%) | 4 (0.9%) |
| 75 Years and over | 0 (0.0%) | 14 (9.9%) |
Disability Class: Ambulatory Difficulty
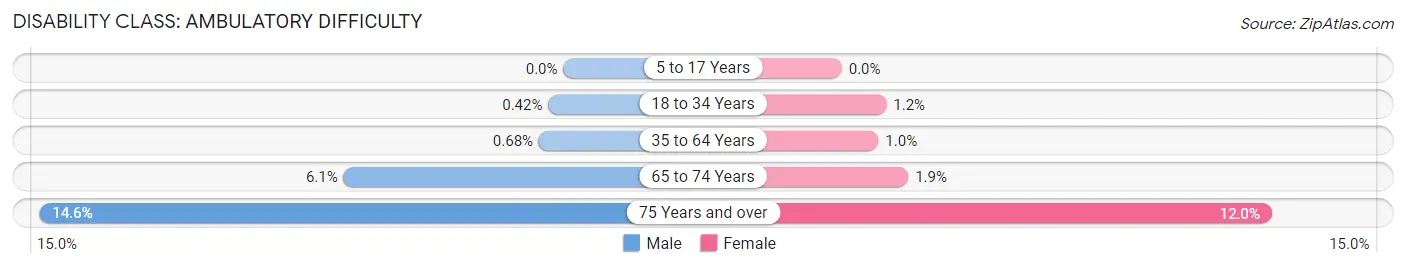
| Age Bracket | Male | Female |
| 5 to 17 Years | 0 (0.0%) | 0 (0.0%) |
| 18 to 34 Years | 4 (0.4%) | 11 (1.2%) |
| 35 to 64 Years | 13 (0.7%) | 17 (1.0%) |
| 65 to 74 Years | 35 (6.1%) | 8 (1.8%) |
| 75 Years and over | 27 (14.6%) | 17 (12.0%) |
Disability Class: Self-Care Difficulty
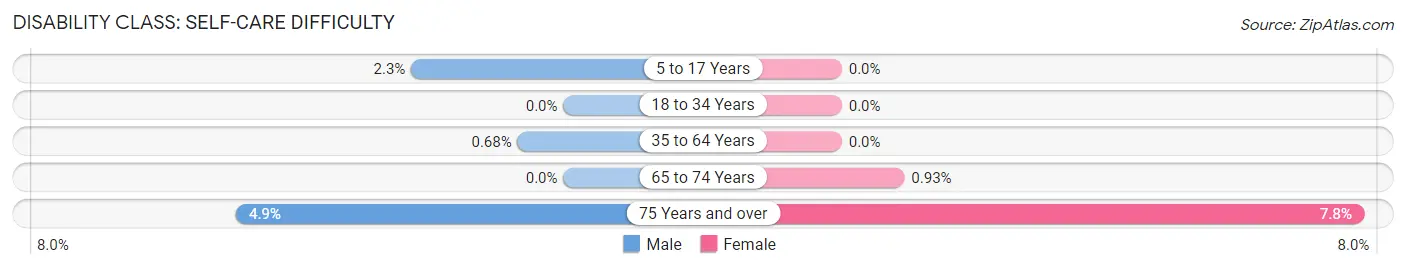
| Age Bracket | Male | Female |
| 5 to 17 Years | 15 (2.3%) | 0 (0.0%) |
| 18 to 34 Years | 0 (0.0%) | 0 (0.0%) |
| 35 to 64 Years | 13 (0.7%) | 0 (0.0%) |
| 65 to 74 Years | 0 (0.0%) | 4 (0.9%) |
| 75 Years and over | 9 (4.9%) | 11 (7.7%) |
Technology Access in San Miguel County
Computing Device Access in San Miguel County
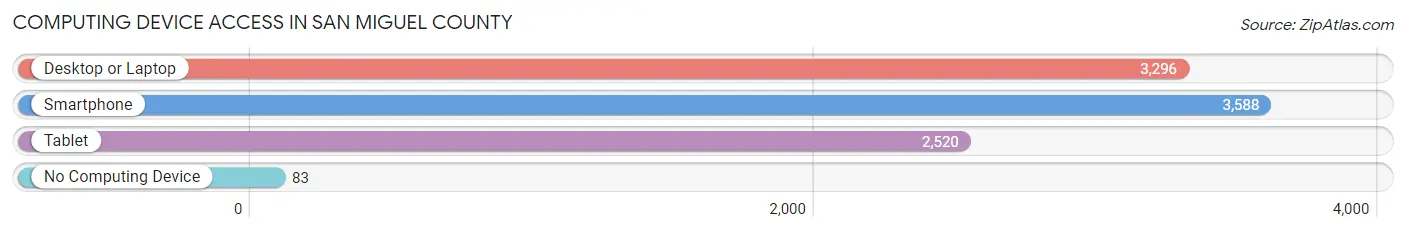
| Device Type | # Households | % Households |
| Desktop or Laptop | 3,296 | 85.6% |
| Smartphone | 3,588 | 93.2% |
| Tablet | 2,520 | 65.4% |
| No Computing Device | 83 | 2.2% |
| Total | 3,850 | 100.0% |
Internet Access in San Miguel County
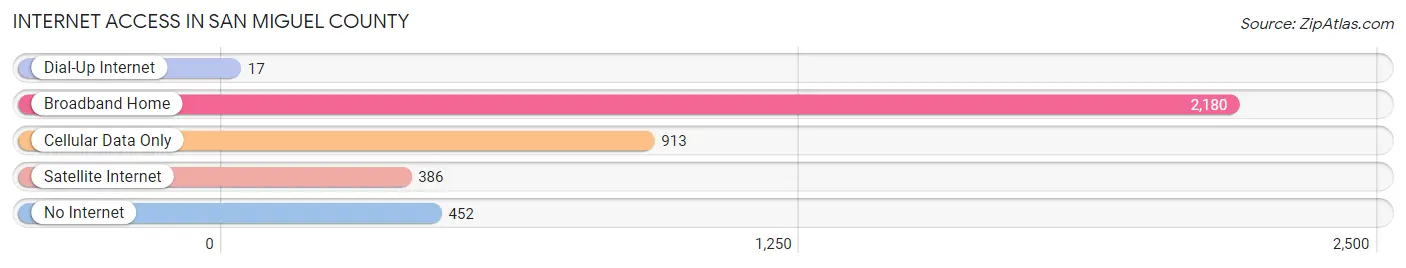
| Internet Type | # Households | % Households |
| Dial-Up Internet | 17 | 0.4% |
| Broadband Home | 2,180 | 56.6% |
| Cellular Data Only | 913 | 23.7% |
| Satellite Internet | 386 | 10.0% |
| No Internet | 452 | 11.7% |
| Total | 3,850 | 100.0% |
San Miguel County Summary
Introduction
San Miguel County is located in the southwestern corner of Colorado, and is one of the 64 counties in the state. It is bordered by Montrose County to the north, Dolores County to the east, San Juan County to the south, and Ouray County to the west. The county seat is Telluride, and the largest city is Norwood. San Miguel County covers an area of 1,289 square miles, and has a population of 8,098 as of the 2020 census.
History
San Miguel County was established in 1883, and was named after the San Miguel River, which flows through the county. The county was originally inhabited by the Ute Indians, who were later displaced by settlers in the late 19th century. The first settlers in the area were miners, who were attracted to the area by the gold and silver deposits in the San Juan Mountains. The mining industry was the main source of income for the county until the late 20th century, when tourism began to take over as the primary industry.
Geography
San Miguel County is located in the southwestern corner of Colorado, and is bordered by Montrose County to the north, Dolores County to the east, San Juan County to the south, and Ouray County to the west. The county covers an area of 1,289 square miles, and is located in the San Juan Mountains. The highest point in the county is Mount Wilson, which has an elevation of 14,246 feet. The county is home to several rivers, including the San Miguel River, the Dolores River, and the Uncompahgre River.
Economy
San Miguel County’s economy is largely based on tourism, with the county’s main attractions being the Telluride Ski Resort, the San Juan National Forest, and the Black Canyon of the Gunnison National Park. The county is also home to several small businesses, including restaurants, retail stores, and lodging. The county is also home to several mining operations, which are still active today.
Demographics
As of the 2020 census, San Miguel County had a population of 8,098. The population is spread out, with 48.3% male and 51.7% female. The median age is 44.2 years, and the median household income is $63,945. The largest racial group is White (87.2%), followed by Hispanic or Latino (7.2%), and Native American (2.2%).
Conclusion
San Miguel County is located in the southwestern corner of Colorado, and is one of the 64 counties in the state. It is bordered by Montrose County to the north, Dolores County to the east, San Juan County to the south, and Ouray County to the west. The county covers an area of 1,289 square miles, and has a population of 8,098 as of the 2020 census. The county’s economy is largely based on tourism, with the county’s main attractions being the Telluride Ski Resort, the San Juan National Forest, and the Black Canyon of the Gunnison National Park. The largest racial group is White (87.2%), followed by Hispanic or Latino (7.2%), and Native American (2.2%).
Common Questions
What is Per Capita Income in San Miguel County?
Per Capita income in San Miguel County is $55,184.
What is the Median Family Income in San Miguel County?
Median Family Income in San Miguel County is $97,472.
What is the Median Household income in San Miguel County?
Median Household Income in San Miguel County is $72,829.
What is Income or Wage Gap in San Miguel County?
Income or Wage Gap in San Miguel County is 7.8%.
Women in San Miguel County earn 92.2 cents for every dollar earned by a man.
What is Family Income Deficit in San Miguel County?
Family Income Deficit in San Miguel County is $8,587.
Families that are below poverty line in San Miguel County earn $8,587 less on average than the poverty threshold level.
What is Inequality or Gini Index in San Miguel County?
Inequality or Gini Index in San Miguel County is 0.52.
What is the Total Population of San Miguel County?
Total Population of San Miguel County is 8,082.
What is the Total Male Population of San Miguel County?
Total Male Population of San Miguel County is 4,417.
What is the Total Female Population of San Miguel County?
Total Female Population of San Miguel County is 3,665.
What is the Ratio of Males per 100 Females in San Miguel County?
There are 120.52 Males per 100 Females in San Miguel County.
What is the Ratio of Females per 100 Males in San Miguel County?
There are 82.97 Females per 100 Males in San Miguel County.
What is the Median Population Age in San Miguel County?
Median Population Age in San Miguel County is 41.9 Years.
What is the Average Family Size in San Miguel County
Average Family Size in San Miguel County is 2.6 People.
What is the Average Household Size in San Miguel County
Average Household Size in San Miguel County is 2.1 People.
How Large is the Labor Force in San Miguel County?
There are 5,131 People in the Labor Forcein in San Miguel County.
What is the Percentage of People in the Labor Force in San Miguel County?
74.2% of People are in the Labor Force in San Miguel County.
What is the Unemployment Rate in San Miguel County?
Unemployment Rate in San Miguel County is 3.7%.