San Juan County, CO Map & Demographics
San Juan County Map
San Juan County Overview
$42,678
PER CAPITA INCOME
$72,292
AVG FAMILY INCOME
$67,344
AVG HOUSEHOLD INCOME
31.6%
WAGE / INCOME GAP [ % ]
68.4¢/ $1
WAGE / INCOME GAP [ $ ]
0.47
INEQUALITY / GINI INDEX
690
TOTAL POPULATION
371
MALE POPULATION
319
FEMALE POPULATION
116.30
MALES / 100 FEMALES
85.98
FEMALES / 100 MALES
49.3
MEDIAN AGE
2.4
AVG FAMILY SIZE
2.0
AVG HOUSEHOLD SIZE
411
LABOR FORCE [ PEOPLE ]
67.0%
PERCENT IN LABOR FORCE
7.3%
UNEMPLOYMENT RATE
San Juan County Area Codes
Income in San Juan County
Income Overview in San Juan County
Per Capita Income in San Juan County is $42,678, while median incomes of families and households are $72,292 and $67,344 respectively.
| Characteristic | Number | Measure |
| Per Capita Income | 690 | $42,678 |
| Median Family Income | 205 | $72,292 |
| Mean Family Income | 205 | $98,235 |
| Median Household Income | 337 | $67,344 |
| Mean Household Income | 337 | $84,592 |
| Income Deficit | 205 | $0 |
| Wage / Income Gap (%) | 690 | 31.65% |
| Wage / Income Gap ($) | 690 | 68.35¢ per $1 |
| Gini / Inequality Index | 690 | 0.47 |
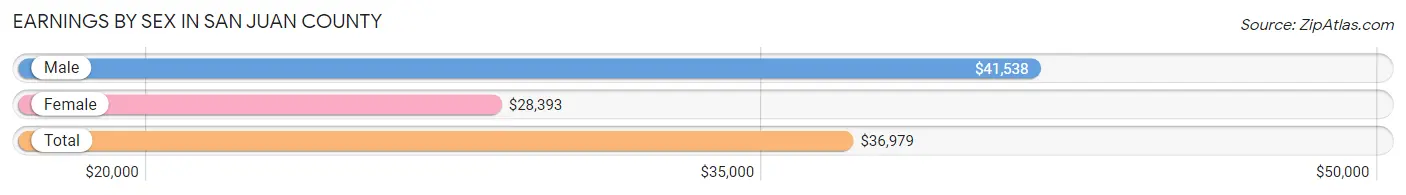
Earnings by Sex in San Juan County
Average Earnings in San Juan County are $36,979, $41,538 for men and $28,393 for women, a difference of 31.7%.
| Sex | Number | Average Earnings |
| Male | 282 (63.7%) | $41,538 |
| Female | 161 (36.3%) | $28,393 |
| Total | 443 (100.0%) | $36,979 |
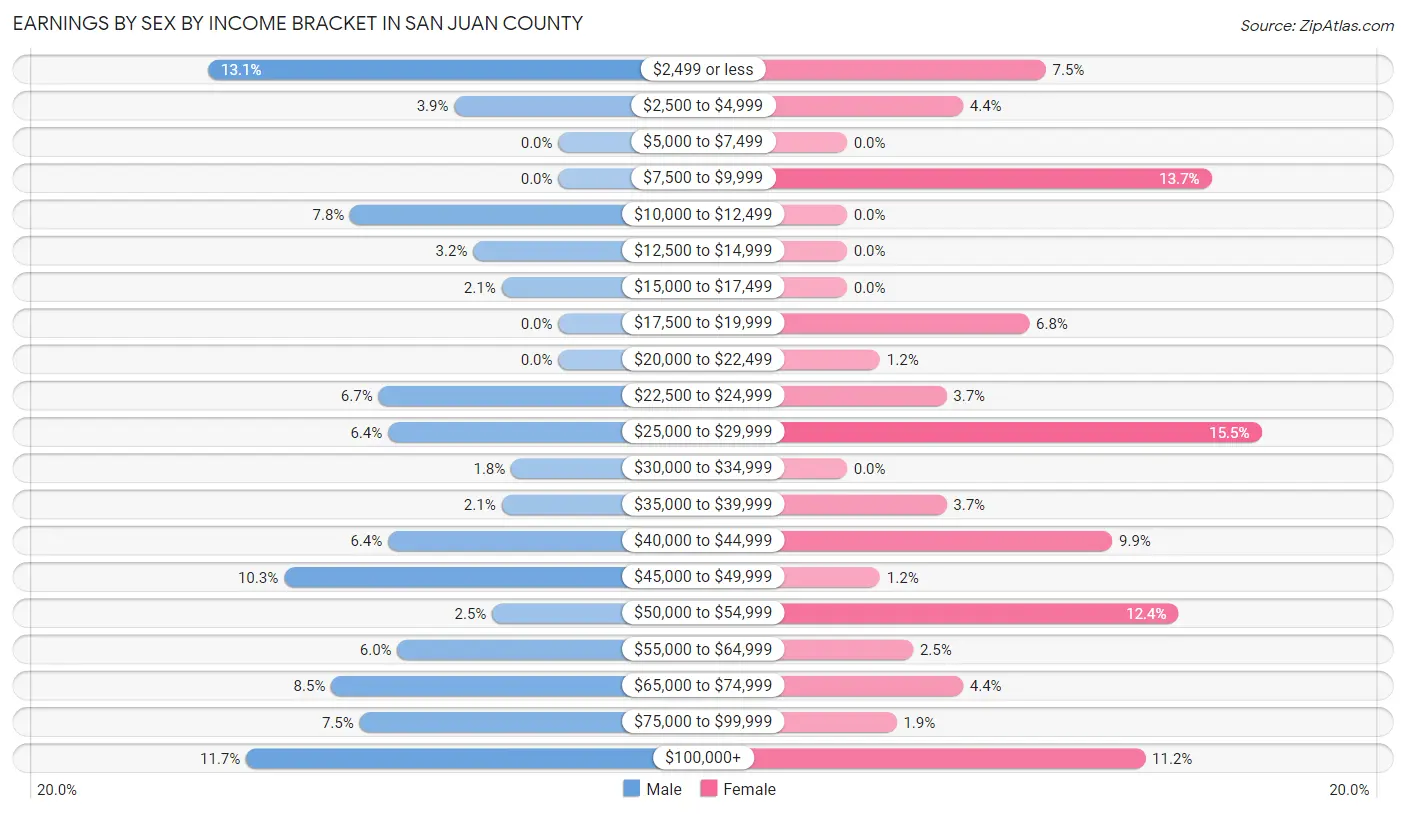
Earnings by Sex by Income Bracket in San Juan County
The most common earnings brackets in San Juan County are $2,499 or less for men (37 | 13.1%) and $25,000 to $29,999 for women (25 | 15.5%).
| Income | Male | Female |
| $2,499 or less | 37 (13.1%) | 12 (7.4%) |
| $2,500 to $4,999 | 11 (3.9%) | 7 (4.3%) |
| $5,000 to $7,499 | 0 (0.0%) | 0 (0.0%) |
| $7,500 to $9,999 | 0 (0.0%) | 22 (13.7%) |
| $10,000 to $12,499 | 22 (7.8%) | 0 (0.0%) |
| $12,500 to $14,999 | 9 (3.2%) | 0 (0.0%) |
| $15,000 to $17,499 | 6 (2.1%) | 0 (0.0%) |
| $17,500 to $19,999 | 0 (0.0%) | 11 (6.8%) |
| $20,000 to $22,499 | 0 (0.0%) | 2 (1.2%) |
| $22,500 to $24,999 | 19 (6.7%) | 6 (3.7%) |
| $25,000 to $29,999 | 18 (6.4%) | 25 (15.5%) |
| $30,000 to $34,999 | 5 (1.8%) | 0 (0.0%) |
| $35,000 to $39,999 | 6 (2.1%) | 6 (3.7%) |
| $40,000 to $44,999 | 18 (6.4%) | 16 (9.9%) |
| $45,000 to $49,999 | 29 (10.3%) | 2 (1.2%) |
| $50,000 to $54,999 | 7 (2.5%) | 20 (12.4%) |
| $55,000 to $64,999 | 17 (6.0%) | 4 (2.5%) |
| $65,000 to $74,999 | 24 (8.5%) | 7 (4.3%) |
| $75,000 to $99,999 | 21 (7.4%) | 3 (1.9%) |
| $100,000+ | 33 (11.7%) | 18 (11.2%) |
| Total | 282 (100.0%) | 161 (100.0%) |
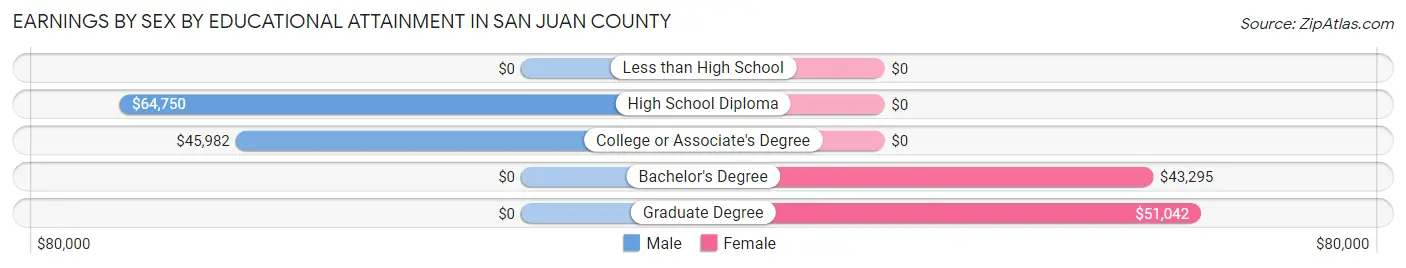
Earnings by Sex by Educational Attainment in San Juan County
Average earnings in San Juan County are $45,302 for men and $37,292 for women, a difference of 17.7%. Men with an educational attainment of high school diploma enjoy the highest average annual earnings of $64,750, while those with college or associate's degree education earn the least with $45,982. Women with an educational attainment of graduate degree earn the most with the average annual earnings of $51,042, while those with bachelor's degree education have the smallest earnings of $43,295.
| Educational Attainment | Male Income | Female Income |
| Less than High School | - | - |
| High School Diploma | $64,750 | $0 |
| College or Associate's Degree | $45,982 | $0 |
| Bachelor's Degree | - | - |
| Graduate Degree | - | - |
| Total | $45,302 | $37,292 |
Family Income in San Juan County
Family Income Brackets in San Juan County
According to the San Juan County family income data, there are 45 families falling into the $50,000 to $74,999 income range, which is the most common income bracket and makes up 22.0% of all families. Conversely, the $10,000 to $14,999 income bracket is the least frequent group with only 5 families (2.4%) belonging to this category.
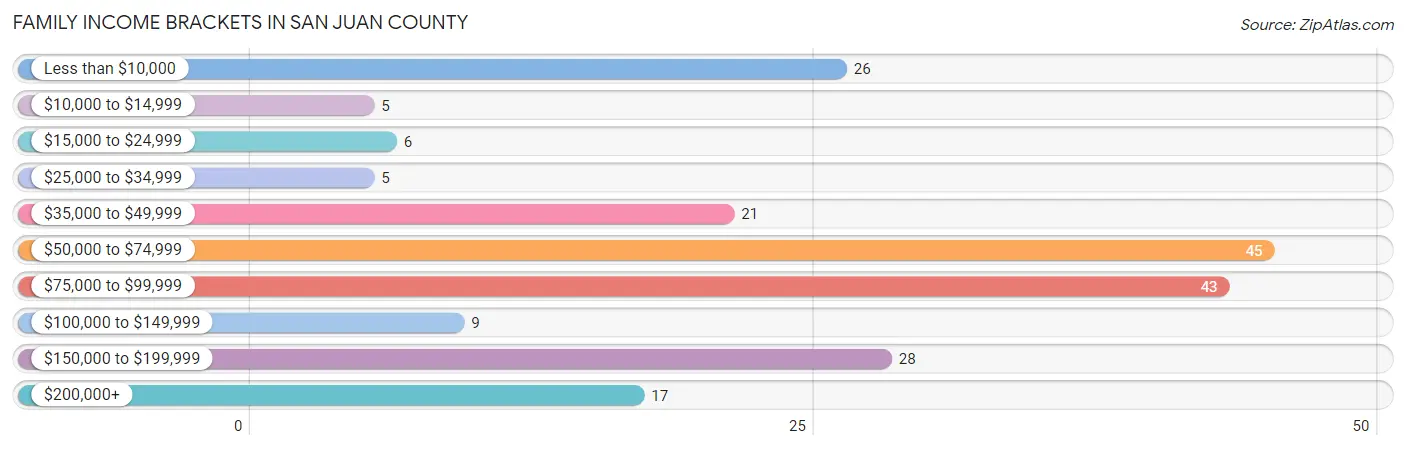
| Income Bracket | # Families | % Families |
| Less than $10,000 | 26 | 12.7% |
| $10,000 to $14,999 | 5 | 2.4% |
| $15,000 to $24,999 | 6 | 2.9% |
| $25,000 to $34,999 | 5 | 2.4% |
| $35,000 to $49,999 | 21 | 10.2% |
| $50,000 to $74,999 | 45 | 22.0% |
| $75,000 to $99,999 | 43 | 21.0% |
| $100,000 to $149,999 | 9 | 4.4% |
| $150,000 to $199,999 | 28 | 13.7% |
| $200,000+ | 17 | 8.3% |
Family Income by Famaliy Size in San Juan County
2-person families (159 | 77.6%) account for the highest median family income in San Juan County with $83,281 per family, while 2-person families (159 | 77.6%) have the highest median income of $41,640 per family member.

| Income Bracket | # Families | Median Income |
| 2-Person Families | 159 (77.6%) | $83,281 |
| 3-Person Families | 14 (6.8%) | $0 |
| 4-Person Families | 32 (15.6%) | $0 |
| 5-Person Families | 0 (0.0%) | $0 |
| 6-Person Families | 0 (0.0%) | $0 |
| 7+ Person Families | 0 (0.0%) | $0 |
| Total | 205 (100.0%) | $72,292 |
Family Income by Number of Earners in San Juan County
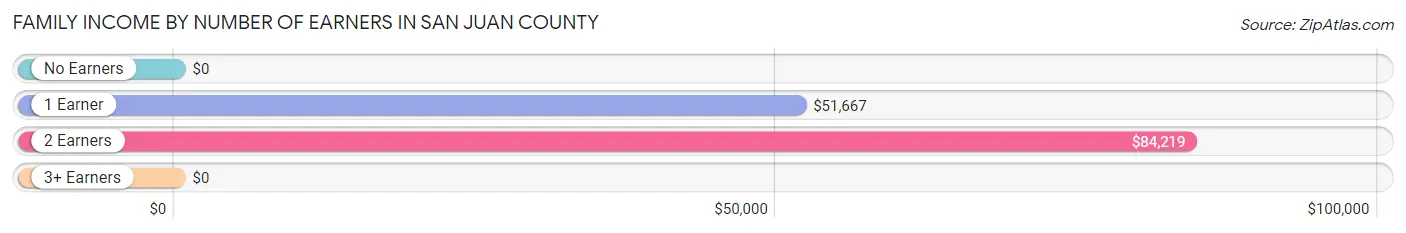
| Number of Earners | # Families | Median Income |
| No Earners | 38 (18.5%) | $0 |
| 1 Earner | 60 (29.3%) | $51,667 |
| 2 Earners | 107 (52.2%) | $84,219 |
| 3+ Earners | 0 (0.0%) | $0 |
| Total | 205 (100.0%) | $72,292 |
Household Income in San Juan County
Household Income Brackets in San Juan County
With 73 households falling in the category, the $50,000 to $74,999 income range is the most frequent in San Juan County, accounting for 21.7% of all households. In contrast, only 17 households (5.0%) fall into the $200,000+ income bracket, making it the least populous group.
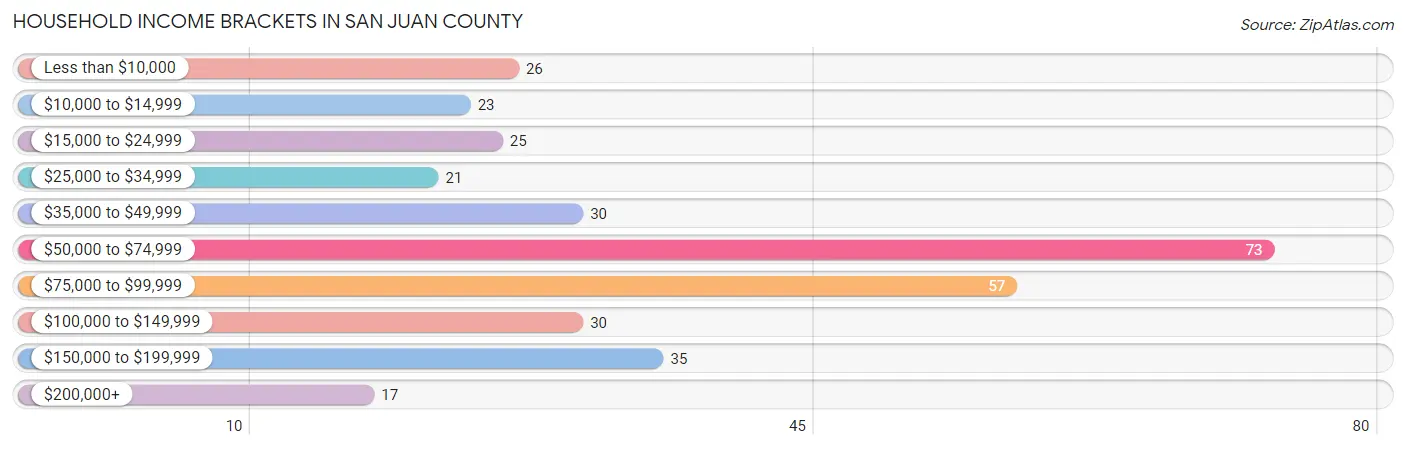
| Income Bracket | # Households | % Households |
| Less than $10,000 | 26 | 7.7% |
| $10,000 to $14,999 | 23 | 6.8% |
| $15,000 to $24,999 | 25 | 7.4% |
| $25,000 to $34,999 | 21 | 6.2% |
| $35,000 to $49,999 | 30 | 8.9% |
| $50,000 to $74,999 | 73 | 21.7% |
| $75,000 to $99,999 | 57 | 16.9% |
| $100,000 to $149,999 | 30 | 8.9% |
| $150,000 to $199,999 | 35 | 10.4% |
| $200,000+ | 17 | 5.0% |
Household Income by Householder Age in San Juan County
The median household income in San Juan County is $67,344, with the highest median household income of $72,337 found in the 45 to 64 years age bracket for the primary householder. A total of 97 households (28.8%) fall into this category. Meanwhile, the 15 to 24 years age bracket for the primary householder has the lowest median household income of $0, with 20 households (5.9%) in this group.
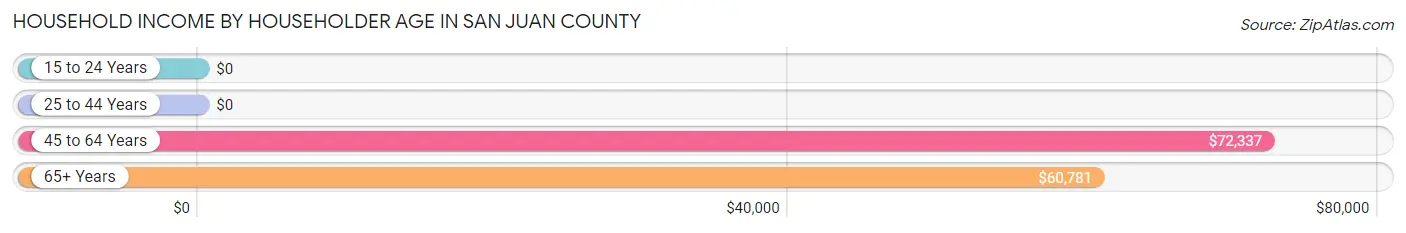
| Income Bracket | # Households | Median Income |
| 15 to 24 Years | 20 (5.9%) | $0 |
| 25 to 44 Years | 107 (31.8%) | $0 |
| 45 to 64 Years | 97 (28.8%) | $72,337 |
| 65+ Years | 113 (33.5%) | $60,781 |
| Total | 337 (100.0%) | $67,344 |
Poverty in San Juan County
Income Below Poverty by Sex and Age in San Juan County
With 18.3% poverty level for males and 20.1% for females among the residents of San Juan County, 15 year old males and 12 to 14 year old females are the most vulnerable to poverty, with 12 males (100.0%) and 18 females (100.0%) in their respective age groups living below the poverty level.
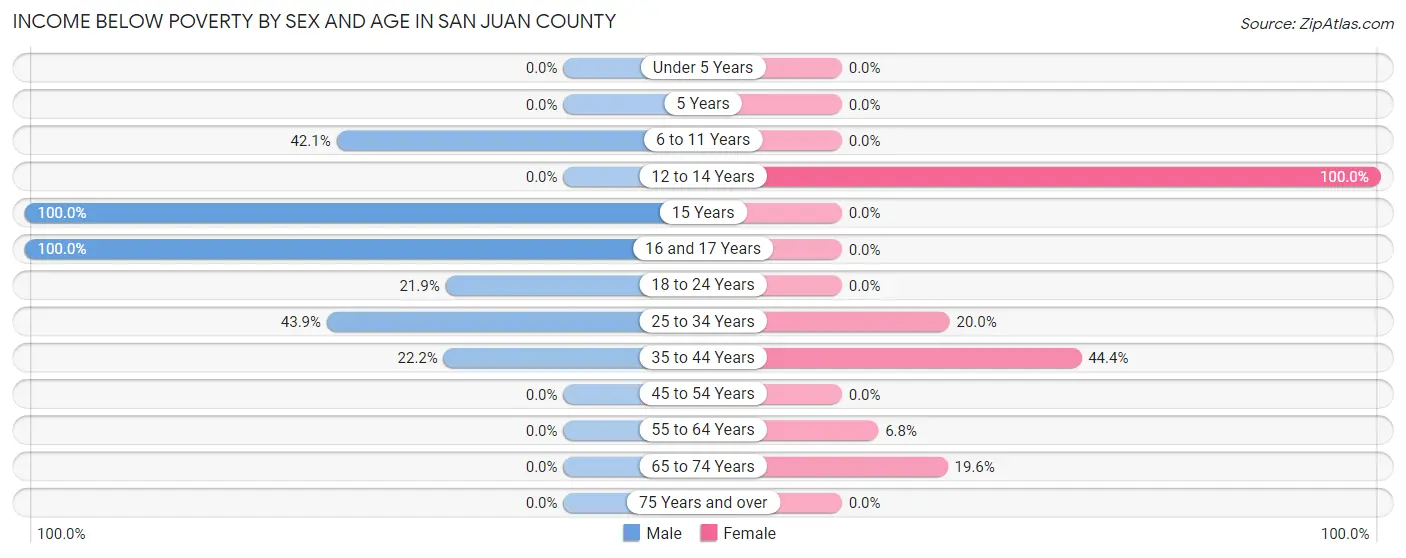
| Age Bracket | Male | Female |
| Under 5 Years | 0 (0.0%) | 0 (0.0%) |
| 5 Years | 0 (0.0%) | 0 (0.0%) |
| 6 to 11 Years | 8 (42.1%) | 0 (0.0%) |
| 12 to 14 Years | 0 (0.0%) | 18 (100.0%) |
| 15 Years | 12 (100.0%) | 0 (0.0%) |
| 16 and 17 Years | 9 (100.0%) | 0 (0.0%) |
| 18 to 24 Years | 7 (21.9%) | 0 (0.0%) |
| 25 to 34 Years | 18 (43.9%) | 6 (20.0%) |
| 35 to 44 Years | 14 (22.2%) | 24 (44.4%) |
| 45 to 54 Years | 0 (0.0%) | 0 (0.0%) |
| 55 to 64 Years | 0 (0.0%) | 5 (6.8%) |
| 65 to 74 Years | 0 (0.0%) | 11 (19.6%) |
| 75 Years and over | 0 (0.0%) | 0 (0.0%) |
| Total | 68 (18.3%) | 64 (20.1%) |
Income Above Poverty by Sex and Age in San Juan County
According to the poverty statistics in San Juan County, males aged under 5 years and females aged 6 to 11 years are the age groups that are most secure financially, with 100.0% of males and 100.0% of females in these age groups living above the poverty line.
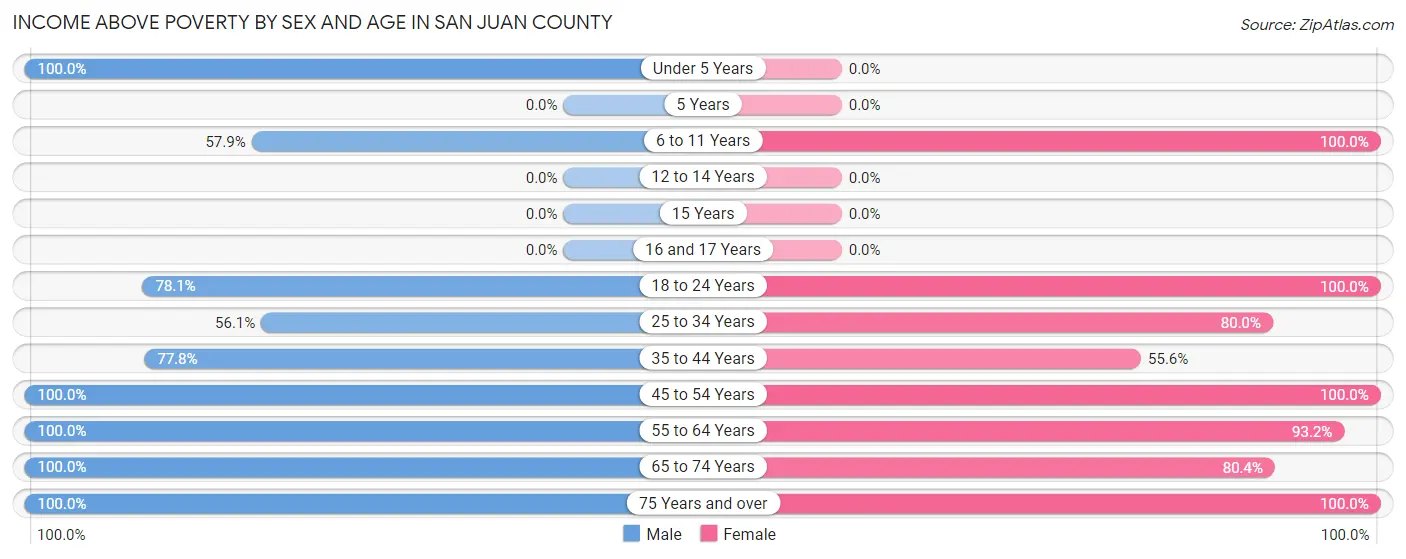
| Age Bracket | Male | Female |
| Under 5 Years | 16 (100.0%) | 0 (0.0%) |
| 5 Years | 0 (0.0%) | 0 (0.0%) |
| 6 to 11 Years | 11 (57.9%) | 12 (100.0%) |
| 12 to 14 Years | 0 (0.0%) | 0 (0.0%) |
| 15 Years | 0 (0.0%) | 0 (0.0%) |
| 16 and 17 Years | 0 (0.0%) | 0 (0.0%) |
| 18 to 24 Years | 25 (78.1%) | 20 (100.0%) |
| 25 to 34 Years | 23 (56.1%) | 24 (80.0%) |
| 35 to 44 Years | 49 (77.8%) | 30 (55.6%) |
| 45 to 54 Years | 33 (100.0%) | 28 (100.0%) |
| 55 to 64 Years | 63 (100.0%) | 69 (93.2%) |
| 65 to 74 Years | 64 (100.0%) | 45 (80.4%) |
| 75 Years and over | 19 (100.0%) | 27 (100.0%) |
| Total | 303 (81.7%) | 255 (79.9%) |
Income Below Poverty Among Married-Couple Families in San Juan County
The poverty statistics for married-couple families in San Juan County show that 7.8% or 14 of the total 180 families live below the poverty line. Families with 1 or 2 children have the highest poverty rate of 46.7%, comprising of 14 families. On the other hand, families with no children have the lowest poverty rate of 0.0%, which includes 0 families.
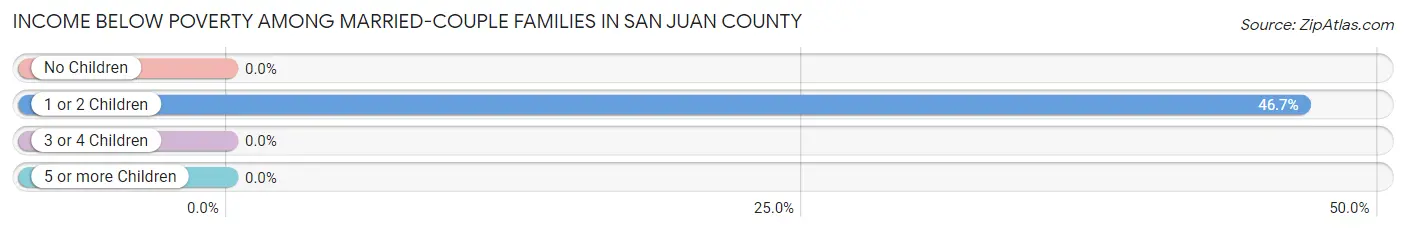
| Children | Above Poverty | Below Poverty |
| No Children | 150 (100.0%) | 0 (0.0%) |
| 1 or 2 Children | 16 (53.3%) | 14 (46.7%) |
| 3 or 4 Children | 0 (0.0%) | 0 (0.0%) |
| 5 or more Children | 0 (0.0%) | 0 (0.0%) |
| Total | 166 (92.2%) | 14 (7.8%) |
Income Below Poverty Among Single-Parent Households in San Juan County
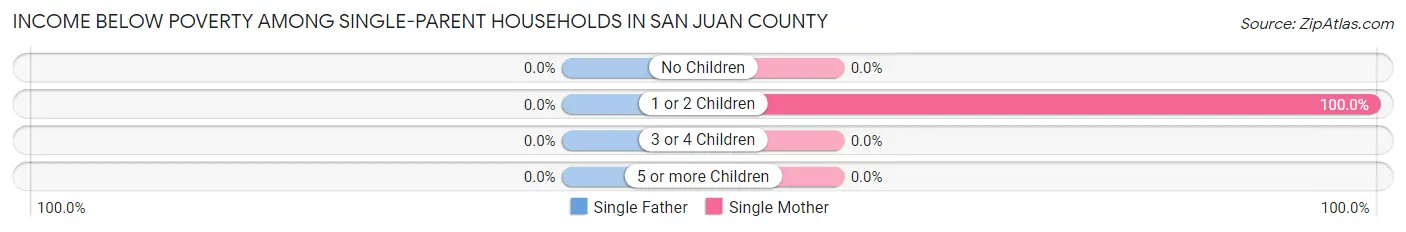
| Children | Single Father | Single Mother |
| No Children | 0 (0.0%) | 0 (0.0%) |
| 1 or 2 Children | 0 (0.0%) | 17 (100.0%) |
| 3 or 4 Children | 0 (0.0%) | 0 (0.0%) |
| 5 or more Children | 0 (0.0%) | 0 (0.0%) |
| Total | 0 (0.0%) | 17 (68.0%) |
Income Below Poverty Among Married-Couple vs Single-Parent Households in San Juan County
The poverty data for San Juan County shows that 14 of the married-couple family households (7.8%) and 17 of the single-parent households (68.0%) are living below the poverty level. Within the married-couple family households, those with 1 or 2 children have the highest poverty rate, with 14 households (46.7%) falling below the poverty line. Among the single-parent households, those with 1 or 2 children have the highest poverty rate, with 17 household (100.0%) living below poverty.

| Children | Married-Couple Families | Single-Parent Households |
| No Children | 0 (0.0%) | 0 (0.0%) |
| 1 or 2 Children | 14 (46.7%) | 17 (100.0%) |
| 3 or 4 Children | 0 (0.0%) | 0 (0.0%) |
| 5 or more Children | 0 (0.0%) | 0 (0.0%) |
| Total | 14 (7.8%) | 17 (68.0%) |
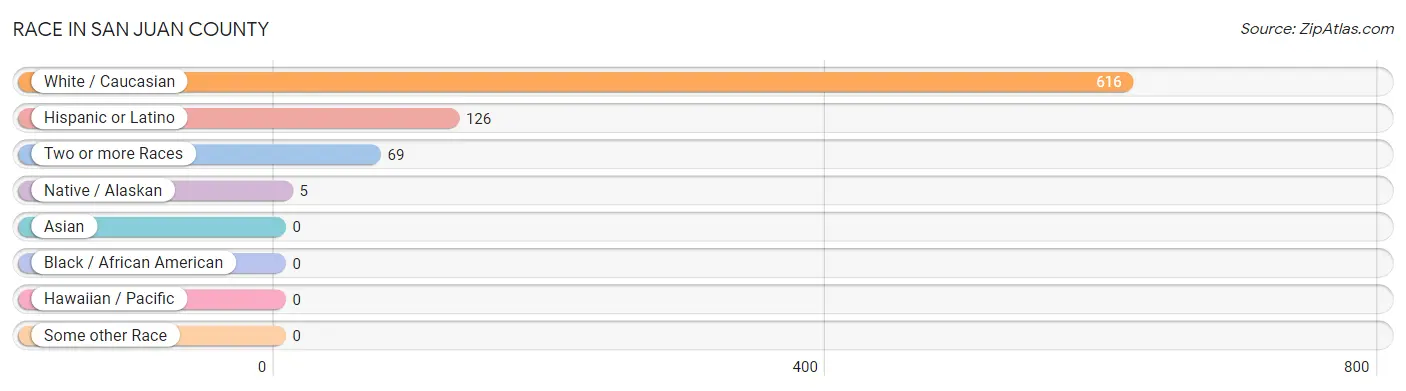
Race in San Juan County
The most populous races in San Juan County are White / Caucasian (616 | 89.3%), Hispanic or Latino (126 | 18.3%), and Two or more Races (69 | 10.0%).
| Race | # Population | % Population |
| Asian | 0 | 0.0% |
| Black / African American | 0 | 0.0% |
| Hawaiian / Pacific | 0 | 0.0% |
| Hispanic or Latino | 126 | 18.3% |
| Native / Alaskan | 5 | 0.7% |
| White / Caucasian | 616 | 89.3% |
| Two or more Races | 69 | 10.0% |
| Some other Race | 0 | 0.0% |
| Total | 690 | 100.0% |
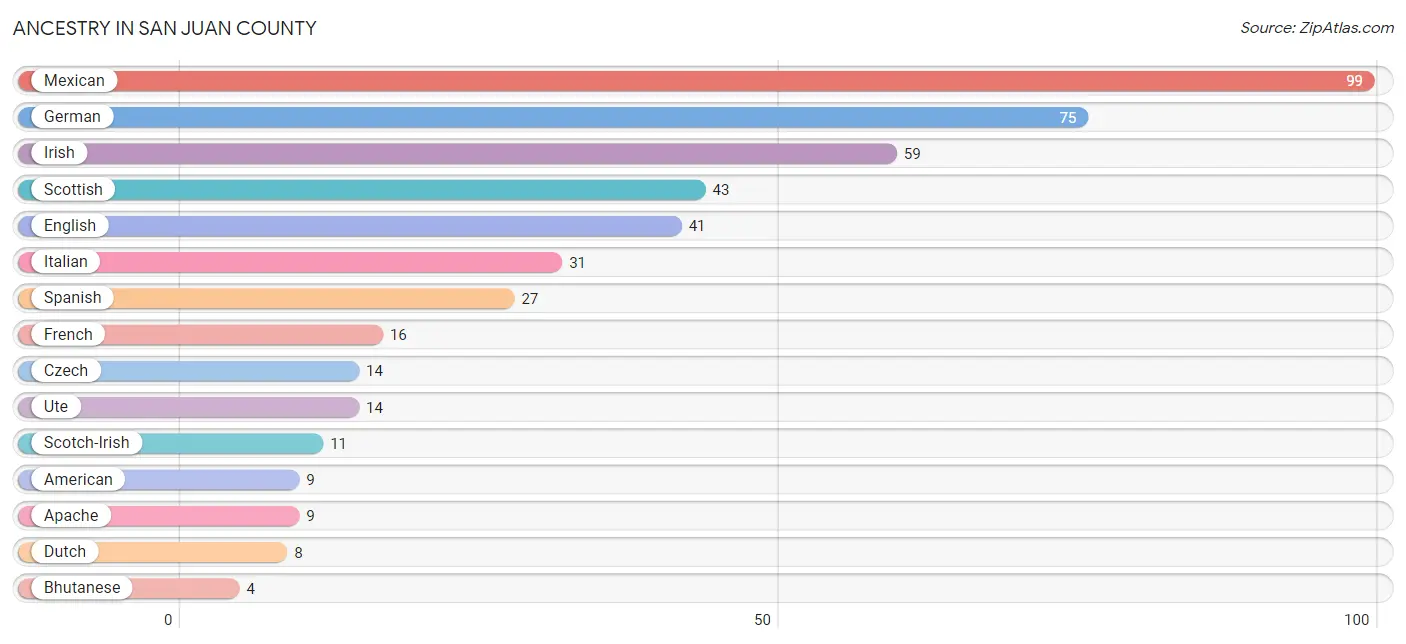
Ancestry in San Juan County
The most populous ancestries reported in San Juan County are Mexican (99 | 14.3%), German (75 | 10.9%), Irish (59 | 8.6%), Scottish (43 | 6.2%), and English (41 | 5.9%), together accounting for 45.9% of all San Juan County residents.
| Ancestry | # Population | % Population |
| American | 9 | 1.3% |
| Apache | 9 | 1.3% |
| Bhutanese | 4 | 0.6% |
| Czech | 14 | 2.0% |
| Dutch | 8 | 1.2% |
| English | 41 | 5.9% |
| European | 4 | 0.6% |
| Finnish | 3 | 0.4% |
| French | 16 | 2.3% |
| German | 75 | 10.9% |
| Hungarian | 3 | 0.4% |
| Irish | 59 | 8.6% |
| Italian | 31 | 4.5% |
| Mexican | 99 | 14.3% |
| Russian | 4 | 0.6% |
| Scandinavian | 4 | 0.6% |
| Scotch-Irish | 11 | 1.6% |
| Scottish | 43 | 6.2% |
| Spanish | 27 | 3.9% |
| Swedish | 4 | 0.6% |
| Ute | 14 | 2.0% | View All 21 Rows |
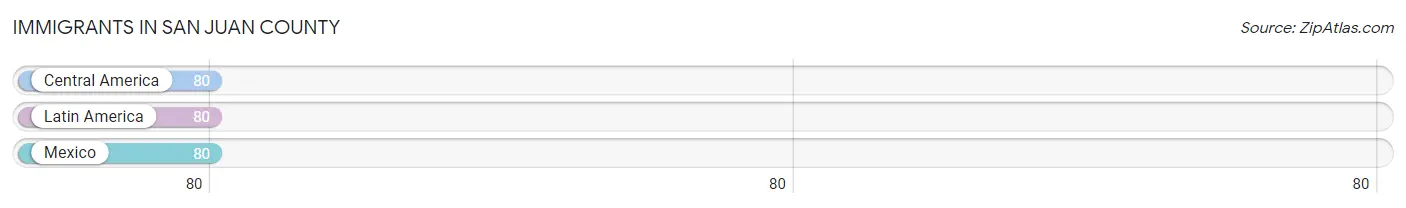
Immigrants in San Juan County
The most numerous immigrant groups reported in San Juan County came from Central America (80 | 11.6%), Latin America (80 | 11.6%), and Mexico (80 | 11.6%), together accounting for 34.8% of all San Juan County residents.
| Immigration Origin | # Population | % Population |
| Central America | 80 | 11.6% |
| Latin America | 80 | 11.6% |
| Mexico | 80 | 11.6% | View All 3 Rows |
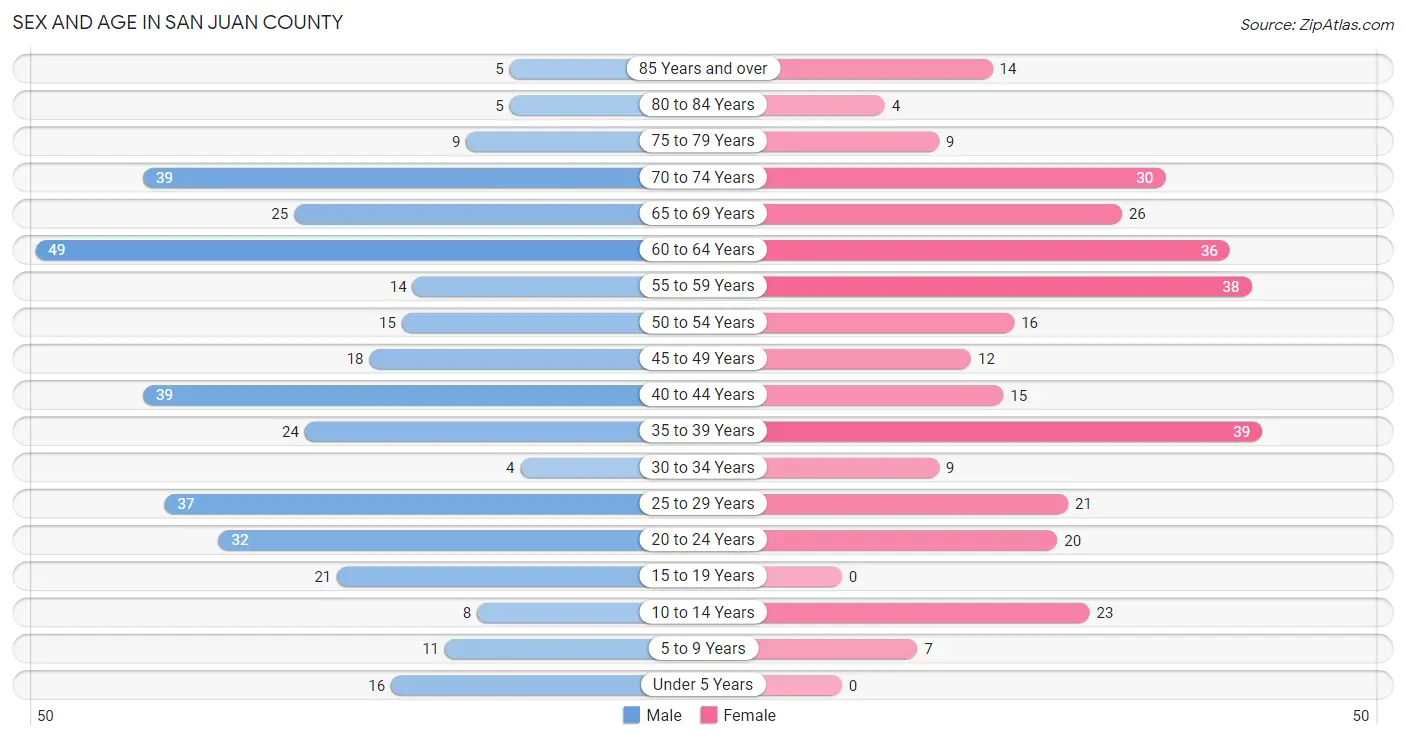
Sex and Age in San Juan County
Sex and Age in San Juan County
The most populous age groups in San Juan County are 60 to 64 Years (49 | 13.2%) for men and 35 to 39 Years (39 | 12.2%) for women.
| Age Bracket | Male | Female |
| Under 5 Years | 16 (4.3%) | 0 (0.0%) |
| 5 to 9 Years | 11 (3.0%) | 7 (2.2%) |
| 10 to 14 Years | 8 (2.2%) | 23 (7.2%) |
| 15 to 19 Years | 21 (5.7%) | 0 (0.0%) |
| 20 to 24 Years | 32 (8.6%) | 20 (6.3%) |
| 25 to 29 Years | 37 (10.0%) | 21 (6.6%) |
| 30 to 34 Years | 4 (1.1%) | 9 (2.8%) |
| 35 to 39 Years | 24 (6.5%) | 39 (12.2%) |
| 40 to 44 Years | 39 (10.5%) | 15 (4.7%) |
| 45 to 49 Years | 18 (4.9%) | 12 (3.8%) |
| 50 to 54 Years | 15 (4.0%) | 16 (5.0%) |
| 55 to 59 Years | 14 (3.8%) | 38 (11.9%) |
| 60 to 64 Years | 49 (13.2%) | 36 (11.3%) |
| 65 to 69 Years | 25 (6.7%) | 26 (8.2%) |
| 70 to 74 Years | 39 (10.5%) | 30 (9.4%) |
| 75 to 79 Years | 9 (2.4%) | 9 (2.8%) |
| 80 to 84 Years | 5 (1.3%) | 4 (1.3%) |
| 85 Years and over | 5 (1.3%) | 14 (4.4%) |
| Total | 371 (100.0%) | 319 (100.0%) |
Families and Households in San Juan County
Median Family Size in San Juan County
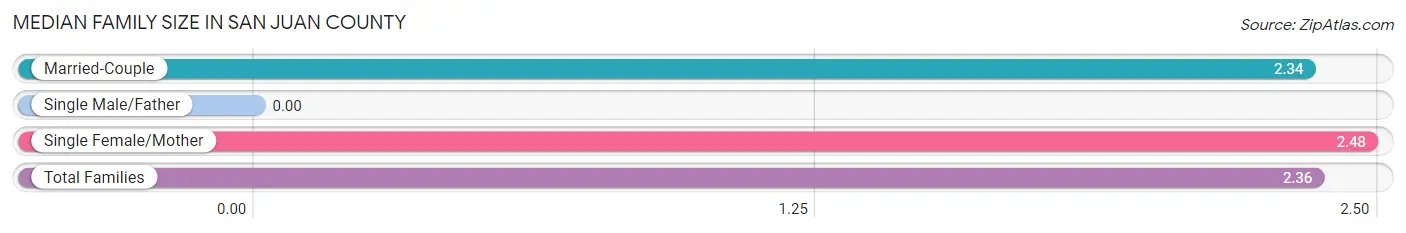
| Family Type | # Families | Family Size |
| Married-Couple | 180 (87.8%) | 2.34 |
| Single Male/Father | 0 (0.0%) | - |
| Single Female/Mother | 25 (12.2%) | 2.48 |
| Total Families | 205 (100.0%) | 2.36 |
Median Household Size in San Juan County
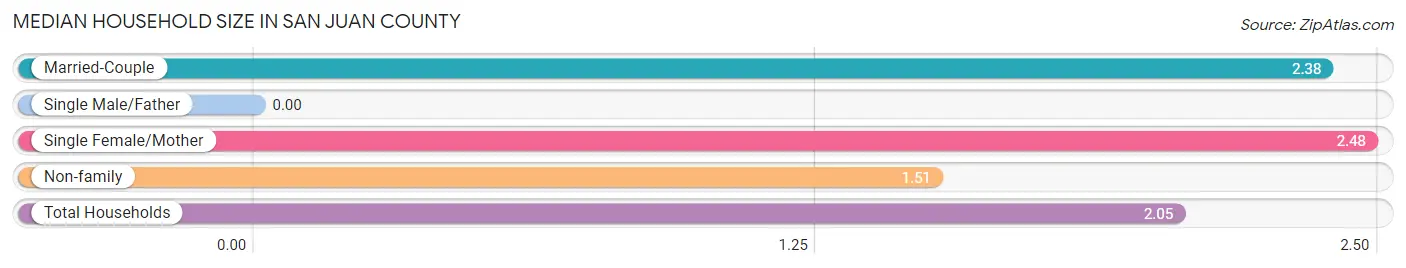
| Household Type | # Households | Household Size |
| Married-Couple | 180 (53.4%) | 2.38 |
| Single Male/Father | 0 (0.0%) | - |
| Single Female/Mother | 25 (7.4%) | 2.48 |
| Non-family | 132 (39.2%) | 1.51 |
| Total Households | 337 (100.0%) | 2.05 |
Household Size by Marriage Status in San Juan County
Out of a total of 337 households in San Juan County, 205 (60.8%) are family households, while 132 (39.2%) are nonfamily households. The most numerous type of family households are 2-person households, comprising 159, and the most common type of nonfamily households are 1-person households, comprising 83.
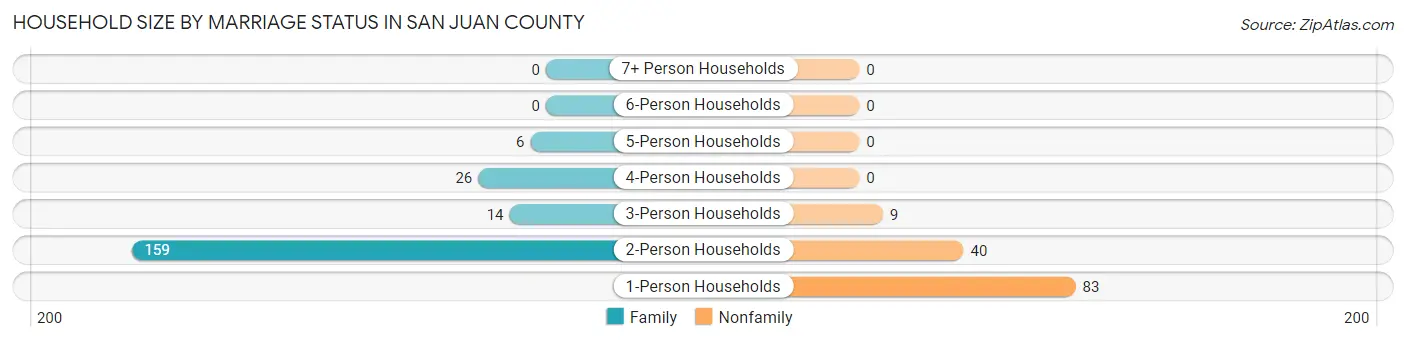
| Household Size | Family Households | Nonfamily Households |
| 1-Person Households | - | 83 (24.6%) |
| 2-Person Households | 159 (47.2%) | 40 (11.9%) |
| 3-Person Households | 14 (4.2%) | 9 (2.7%) |
| 4-Person Households | 26 (7.7%) | 0 (0.0%) |
| 5-Person Households | 6 (1.8%) | 0 (0.0%) |
| 6-Person Households | 0 (0.0%) | 0 (0.0%) |
| 7+ Person Households | 0 (0.0%) | 0 (0.0%) |
| Total | 205 (60.8%) | 132 (39.2%) |
Female Fertility in San Juan County
Fertility by Age in San Juan County
Average fertility rate in San Juan County is 26.0 births per 1,000 women. Women in the age bracket of 20 to 34 years have the highest fertility rate with 60.0 births per 1,000 women. Women in the age bracket of 20 to 34 years acount for 100.0% of all women with births.

| Age Bracket | Women with Births | Births / 1,000 Women |
| 15 to 19 years | 0 (0.0%) | 0.0 |
| 20 to 34 years | 3 (100.0%) | 60.0 |
| 35 to 50 years | 0 (0.0%) | 0.0 |
| Total | 3 (100.0%) | 26.0 |
Fertility by Age by Marriage Status in San Juan County
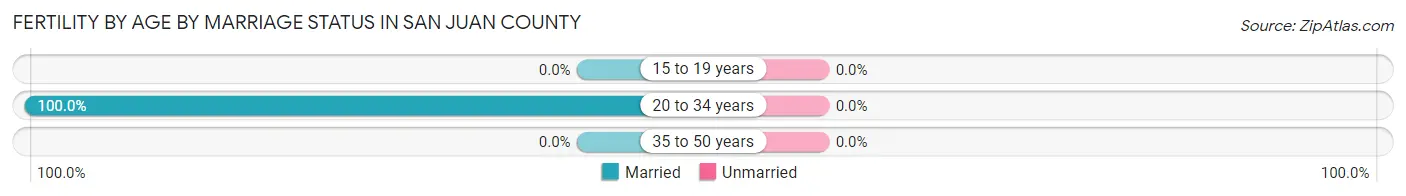
| Age Bracket | Married | Unmarried |
| 15 to 19 years | 0 (0.0%) | 0 (0.0%) |
| 20 to 34 years | 3 (100.0%) | 0 (0.0%) |
| 35 to 50 years | 0 (0.0%) | 0 (0.0%) |
| Total | 3 (100.0%) | 0 (0.0%) |
Fertility by Education in San Juan County
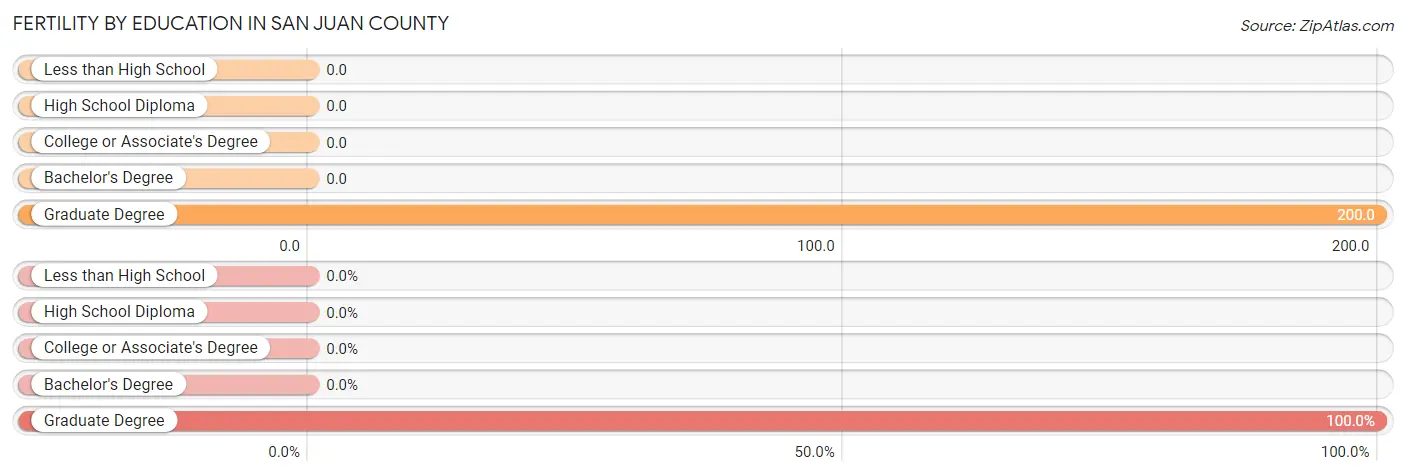
| Educational Attainment | Women with Births | Births / 1,000 Women |
| Less than High School | 0 (0.0%) | 0.0 |
| High School Diploma | 0 (0.0%) | 0.0 |
| College or Associate's Degree | 0 (0.0%) | 0.0 |
| Bachelor's Degree | 0 (0.0%) | 0.0 |
| Graduate Degree | 3 (100.0%) | 200.0 |
| Total | 3 (100.0%) | 26.0 |
Fertility by Education by Marriage Status in San Juan County
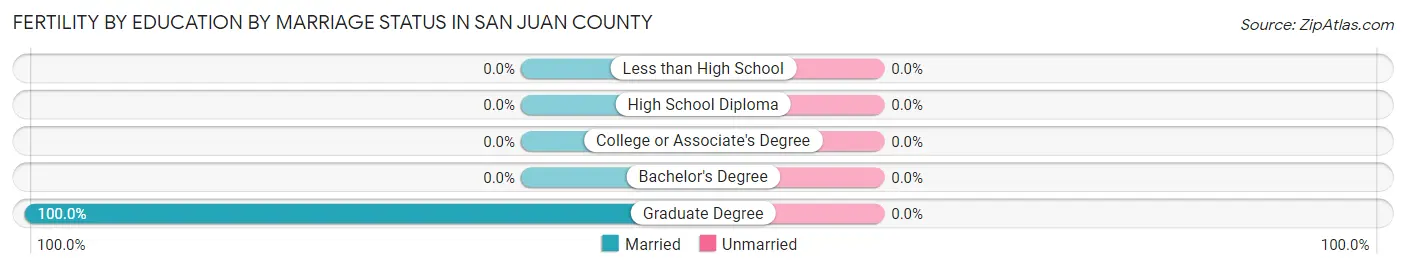
| Educational Attainment | Married | Unmarried |
| Less than High School | 0 (0.0%) | 0 (0.0%) |
| High School Diploma | 0 (0.0%) | 0 (0.0%) |
| College or Associate's Degree | 0 (0.0%) | 0 (0.0%) |
| Bachelor's Degree | 0 (0.0%) | 0 (0.0%) |
| Graduate Degree | 3 (100.0%) | 0 (0.0%) |
| Total | 3 (100.0%) | 0 (0.0%) |
Employment Characteristics in San Juan County
Employment by Class of Employer in San Juan County
Among the 372 employed individuals in San Juan County, private company employees (179 | 48.1%), self-employed (not incorporated) (80 | 21.5%), and local government employees (65 | 17.5%) make up the most common classes of employment.
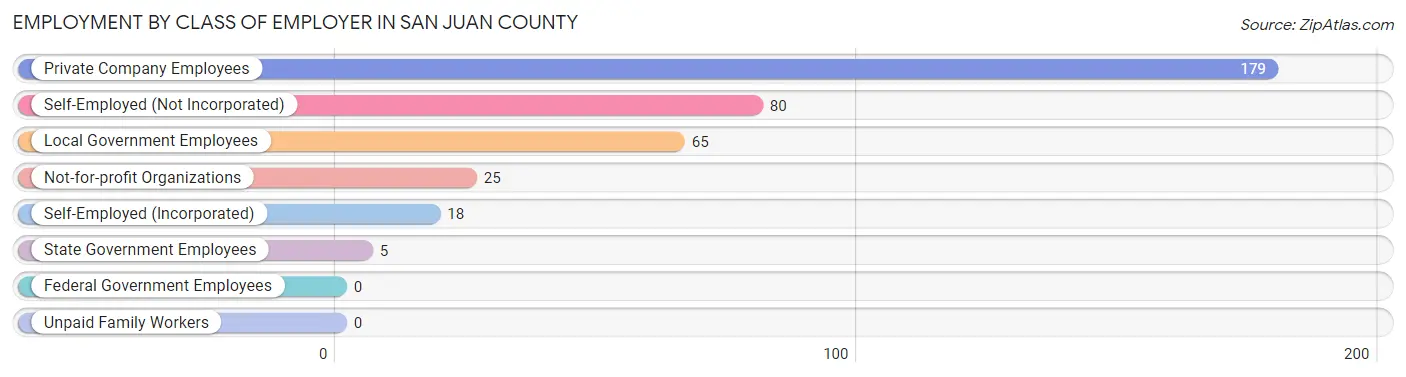
| Employer Class | # Employees | % Employees |
| Private Company Employees | 179 | 48.1% |
| Self-Employed (Incorporated) | 18 | 4.8% |
| Self-Employed (Not Incorporated) | 80 | 21.5% |
| Not-for-profit Organizations | 25 | 6.7% |
| Local Government Employees | 65 | 17.5% |
| State Government Employees | 5 | 1.3% |
| Federal Government Employees | 0 | 0.0% |
| Unpaid Family Workers | 0 | 0.0% |
| Total | 372 | 100.0% |
Employment Status by Age in San Juan County
According to the labor force statistics for San Juan County, out of the total population over 16 years of age (613), 67.0% or 411 individuals are in the labor force, with 7.3% or 30 of them unemployed. The age group with the highest labor force participation rate is 20 to 24 years, with 100.0% or 52 individuals in the labor force. Within the labor force, the 35 to 44 years age range has the highest percentage of unemployed individuals, with 20.2% or 23 of them being unemployed.
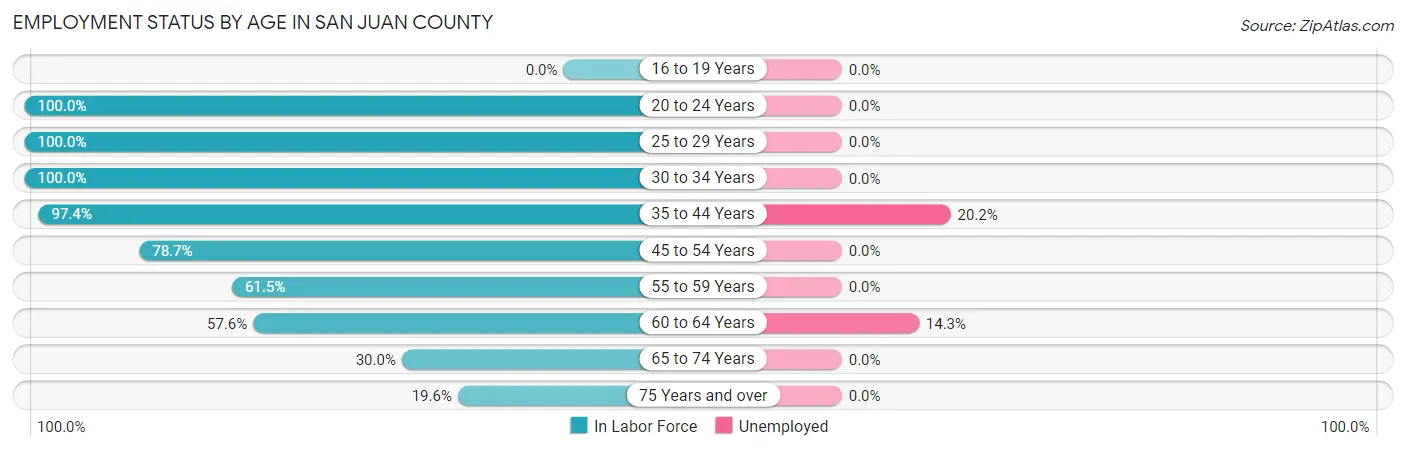
| Age Bracket | In Labor Force | Unemployed |
| 16 to 19 Years | 0 (0.0%) | 0 (0.0%) |
| 20 to 24 Years | 52 (100.0%) | 0 (0.0%) |
| 25 to 29 Years | 58 (100.0%) | 0 (0.0%) |
| 30 to 34 Years | 13 (100.0%) | 0 (0.0%) |
| 35 to 44 Years | 114 (97.4%) | 23 (20.2%) |
| 45 to 54 Years | 48 (78.7%) | 0 (0.0%) |
| 55 to 59 Years | 32 (61.5%) | 0 (0.0%) |
| 60 to 64 Years | 49 (57.6%) | 7 (14.3%) |
| 65 to 74 Years | 36 (30.0%) | 0 (0.0%) |
| 75 Years and over | 9 (19.6%) | 0 (0.0%) |
| Total | 411 (67.0%) | 30 (7.3%) |
Employment Status by Educational Attainment in San Juan County
According to labor force statistics for San Juan County, 81.3% of individuals (314) out of the total population between 25 and 64 years of age (386) are in the labor force, with 9.6% or 30 of them being unemployed. The group with the highest labor force participation rate are those with the educational attainment of less than high school, with 100.0% or 24 individuals in the labor force. Within the labor force, individuals with college / associate degree education have the highest percentage of unemployment, with 16.7% or 14 of them being unemployed.
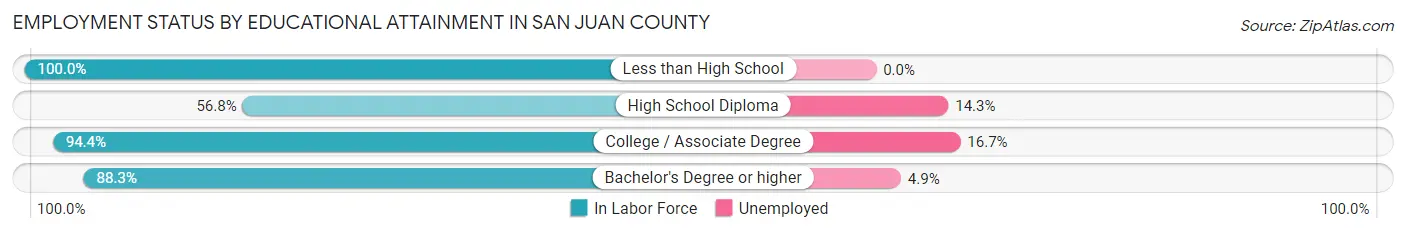
| Educational Attainment | In Labor Force | Unemployed |
| Less than High School | 24 (100.0%) | 0 (0.0%) |
| High School Diploma | 63 (56.8%) | 16 (14.3%) |
| College / Associate Degree | 84 (94.4%) | 15 (16.7%) |
| Bachelor's Degree or higher | 143 (88.3%) | 8 (4.9%) |
| Total | 314 (81.3%) | 37 (9.6%) |
Employment Occupations by Sex in San Juan County
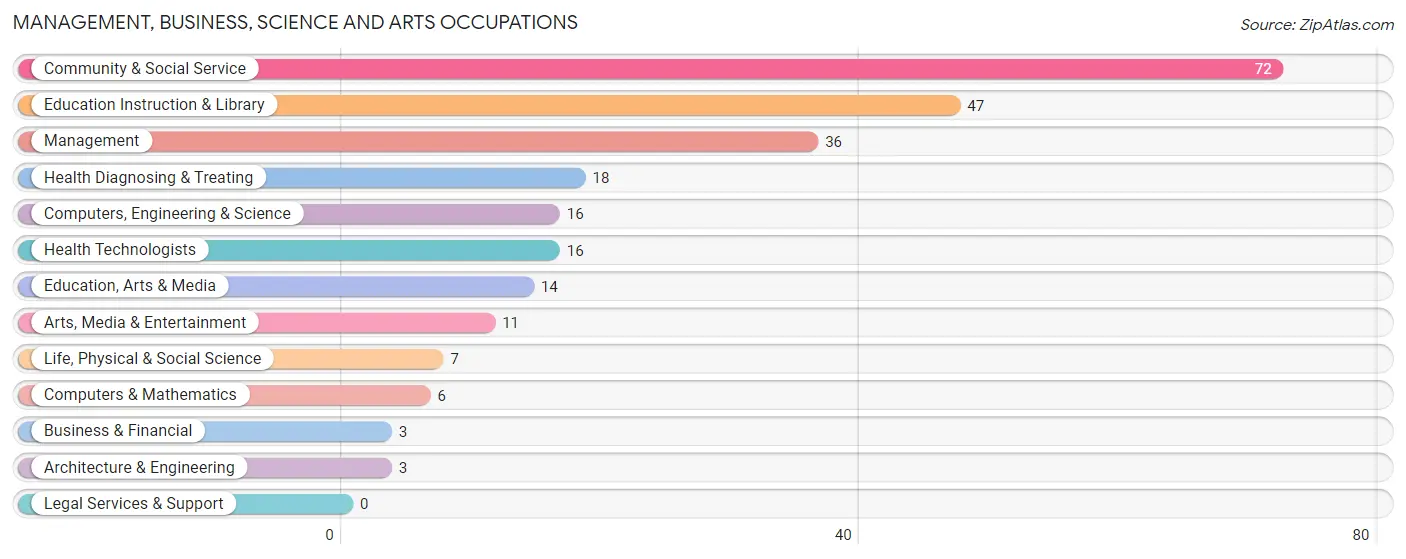
Management, Business, Science and Arts Occupations
The most common Management, Business, Science and Arts occupations in San Juan County are Community & Social Service (72 | 18.9%), Education Instruction & Library (47 | 12.3%), Management (36 | 9.5%), Health Diagnosing & Treating (18 | 4.7%), and Computers, Engineering & Science (16 | 4.2%).
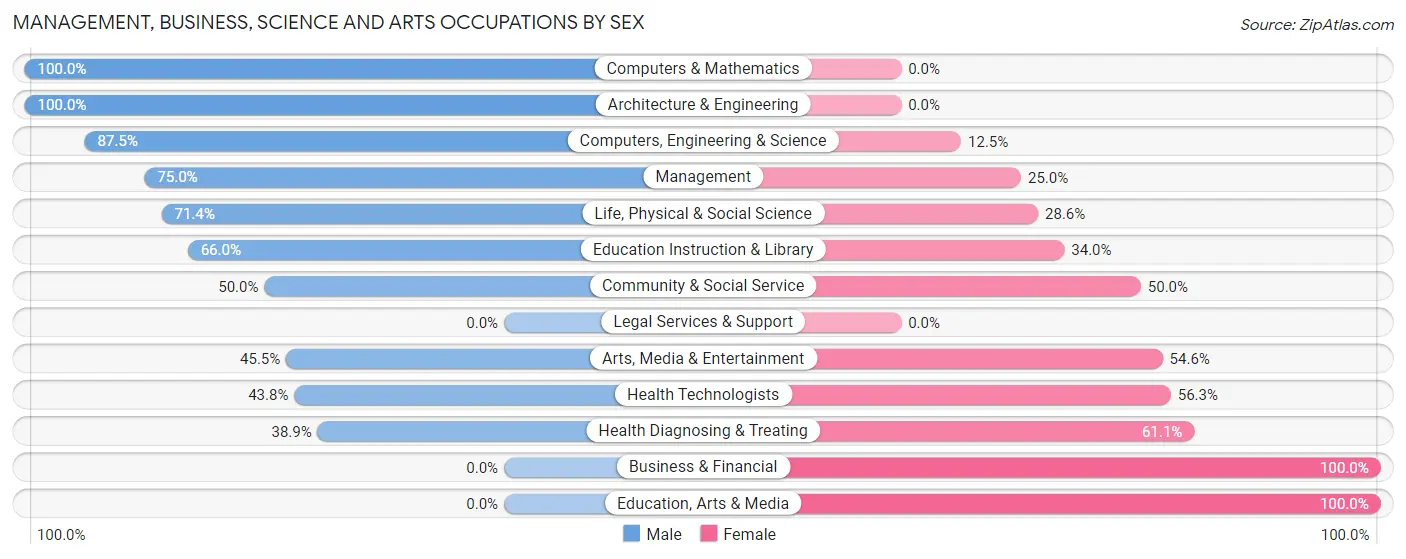
Management, Business, Science and Arts Occupations by Sex
Within the Management, Business, Science and Arts occupations in San Juan County, the most male-oriented occupations are Computers & Mathematics (100.0%), Architecture & Engineering (100.0%), and Computers, Engineering & Science (87.5%), while the most female-oriented occupations are Business & Financial (100.0%), Education, Arts & Media (100.0%), and Health Diagnosing & Treating (61.1%).
| Occupation | Male | Female |
| Management | 27 (75.0%) | 9 (25.0%) |
| Business & Financial | 0 (0.0%) | 3 (100.0%) |
| Computers, Engineering & Science | 14 (87.5%) | 2 (12.5%) |
| Computers & Mathematics | 6 (100.0%) | 0 (0.0%) |
| Architecture & Engineering | 3 (100.0%) | 0 (0.0%) |
| Life, Physical & Social Science | 5 (71.4%) | 2 (28.6%) |
| Community & Social Service | 36 (50.0%) | 36 (50.0%) |
| Education, Arts & Media | 0 (0.0%) | 14 (100.0%) |
| Legal Services & Support | 0 (0.0%) | 0 (0.0%) |
| Education Instruction & Library | 31 (66.0%) | 16 (34.0%) |
| Arts, Media & Entertainment | 5 (45.5%) | 6 (54.5%) |
| Health Diagnosing & Treating | 7 (38.9%) | 11 (61.1%) |
| Health Technologists | 7 (43.8%) | 9 (56.2%) |
| Total (Category) | 84 (57.9%) | 61 (42.1%) |
| Total (Overall) | 229 (60.1%) | 152 (39.9%) |
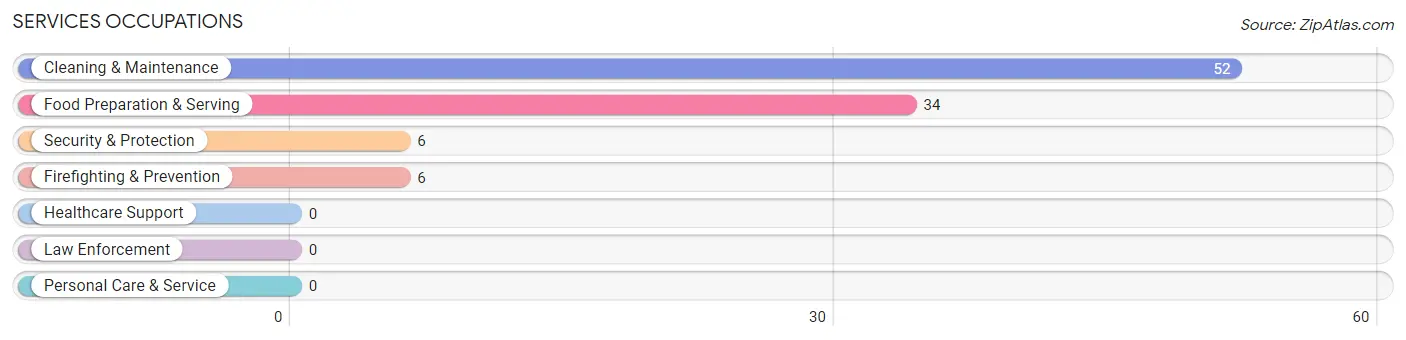
Services Occupations
The most common Services occupations in San Juan County are Cleaning & Maintenance (52 | 13.7%), Food Preparation & Serving (34 | 8.9%), Security & Protection (6 | 1.6%), and Firefighting & Prevention (6 | 1.6%).
Services Occupations by Sex
Within the Services occupations in San Juan County, the most male-oriented occupations are Security & Protection (100.0%), Firefighting & Prevention (100.0%), and Food Preparation & Serving (55.9%), while the most female-oriented occupations are Cleaning & Maintenance (46.2%), and Food Preparation & Serving (44.1%).
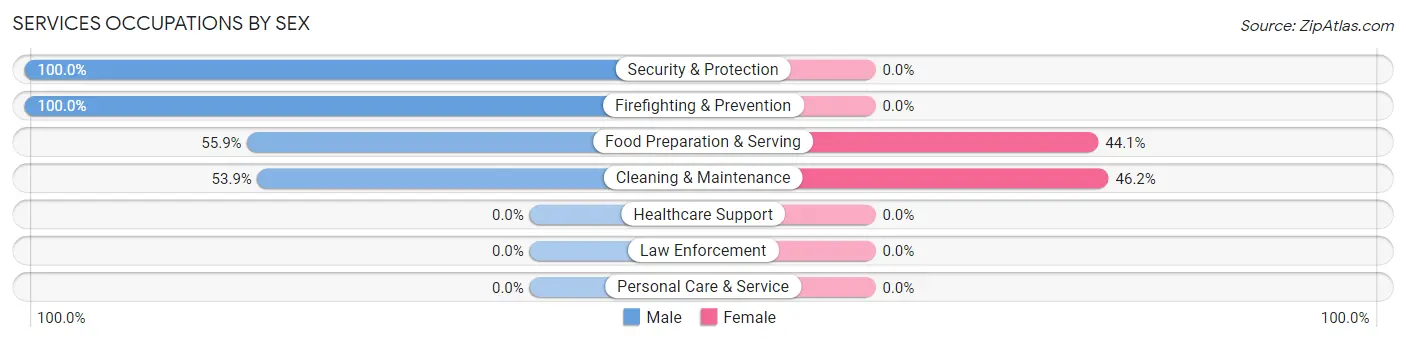
| Occupation | Male | Female |
| Healthcare Support | 0 (0.0%) | 0 (0.0%) |
| Security & Protection | 6 (100.0%) | 0 (0.0%) |
| Firefighting & Prevention | 6 (100.0%) | 0 (0.0%) |
| Law Enforcement | 0 (0.0%) | 0 (0.0%) |
| Food Preparation & Serving | 19 (55.9%) | 15 (44.1%) |
| Cleaning & Maintenance | 28 (53.8%) | 24 (46.2%) |
| Personal Care & Service | 0 (0.0%) | 0 (0.0%) |
| Total (Category) | 53 (57.6%) | 39 (42.4%) |
| Total (Overall) | 229 (60.1%) | 152 (39.9%) |
Sales and Office Occupations
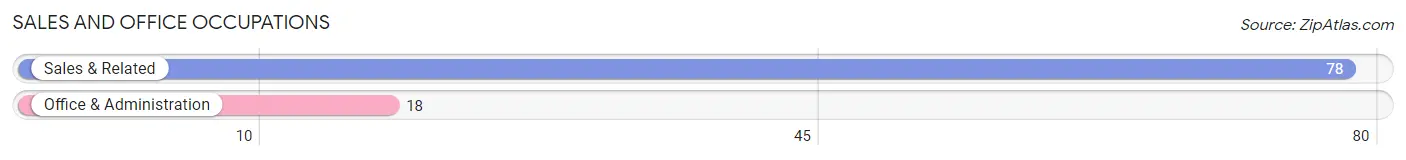
The most common Sales and Office occupations in San Juan County are Sales & Related (78 | 20.5%), and Office & Administration (18 | 4.7%).
Sales and Office Occupations by Sex
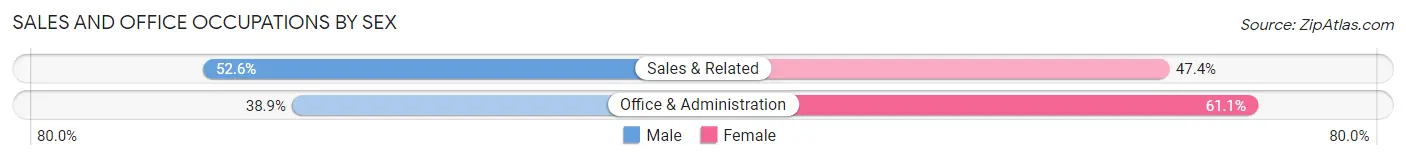
| Occupation | Male | Female |
| Sales & Related | 41 (52.6%) | 37 (47.4%) |
| Office & Administration | 7 (38.9%) | 11 (61.1%) |
| Total (Category) | 48 (50.0%) | 48 (50.0%) |
| Total (Overall) | 229 (60.1%) | 152 (39.9%) |
Natural Resources, Construction and Maintenance Occupations
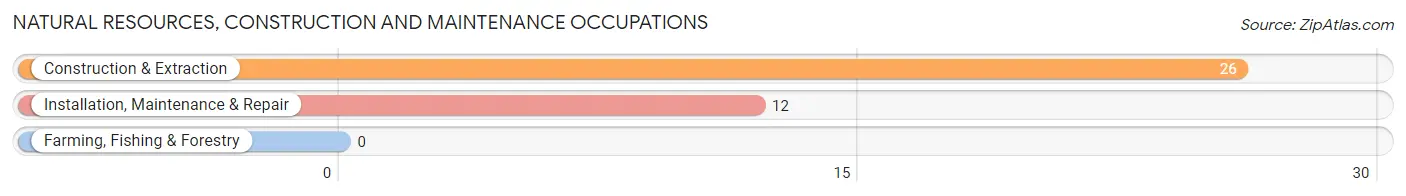
The most common Natural Resources, Construction and Maintenance occupations in San Juan County are Construction & Extraction (26 | 6.8%), and Installation, Maintenance & Repair (12 | 3.2%).
Natural Resources, Construction and Maintenance Occupations by Sex

| Occupation | Male | Female |
| Farming, Fishing & Forestry | 0 (0.0%) | 0 (0.0%) |
| Construction & Extraction | 26 (100.0%) | 0 (0.0%) |
| Installation, Maintenance & Repair | 12 (100.0%) | 0 (0.0%) |
| Total (Category) | 38 (100.0%) | 0 (0.0%) |
| Total (Overall) | 229 (60.1%) | 152 (39.9%) |
Production, Transportation and Moving Occupations
The most common Production, Transportation and Moving occupations in San Juan County are , and Production (10 | 2.6%).
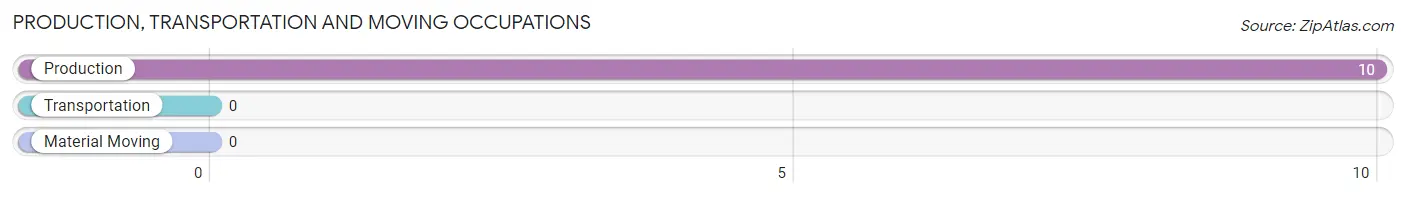
Production, Transportation and Moving Occupations by Sex

| Occupation | Male | Female |
| Production | 6 (60.0%) | 4 (40.0%) |
| Transportation | 0 (0.0%) | 0 (0.0%) |
| Material Moving | 0 (0.0%) | 0 (0.0%) |
| Total (Category) | 6 (60.0%) | 4 (40.0%) |
| Total (Overall) | 229 (60.1%) | 152 (39.9%) |
Employment Industries by Sex in San Juan County
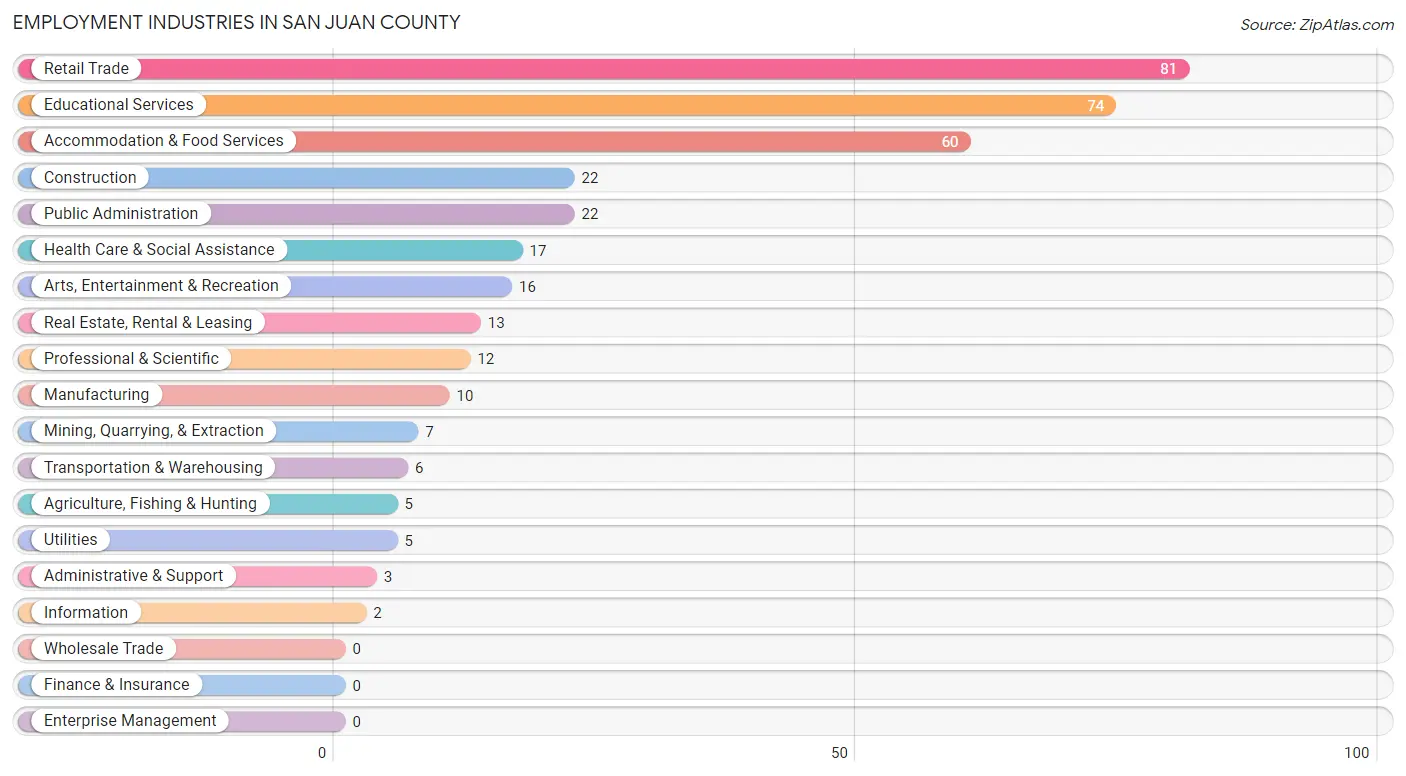
Employment Industries in San Juan County
The major employment industries in San Juan County include Retail Trade (81 | 21.3%), Educational Services (74 | 19.4%), Accommodation & Food Services (60 | 15.8%), Construction (22 | 5.8%), and Public Administration (22 | 5.8%).
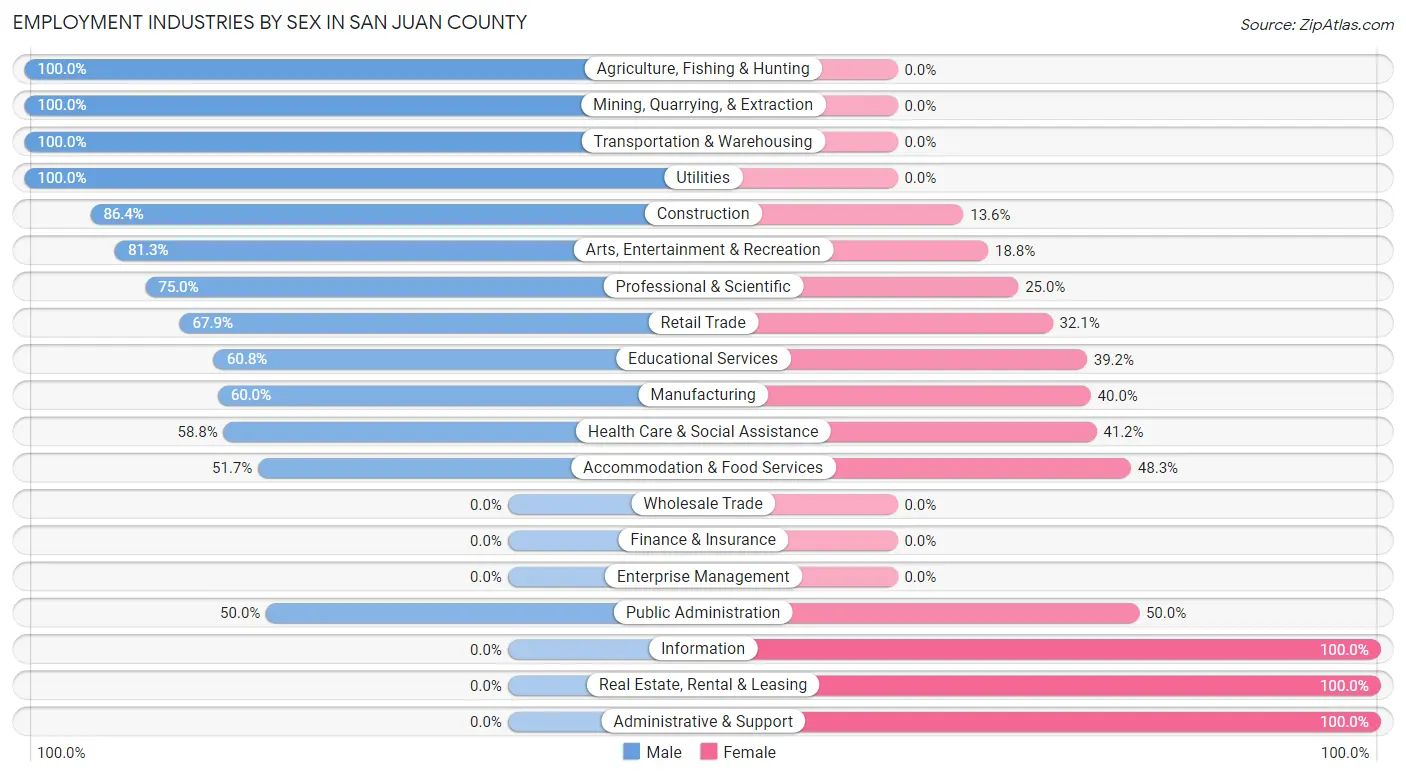
Employment Industries by Sex in San Juan County
The San Juan County industries that see more men than women are Agriculture, Fishing & Hunting (100.0%), Mining, Quarrying, & Extraction (100.0%), and Transportation & Warehousing (100.0%), whereas the industries that tend to have a higher number of women are Information (100.0%), Real Estate, Rental & Leasing (100.0%), and Administrative & Support (100.0%).
| Industry | Male | Female |
| Agriculture, Fishing & Hunting | 5 (100.0%) | 0 (0.0%) |
| Mining, Quarrying, & Extraction | 7 (100.0%) | 0 (0.0%) |
| Construction | 19 (86.4%) | 3 (13.6%) |
| Manufacturing | 6 (60.0%) | 4 (40.0%) |
| Wholesale Trade | 0 (0.0%) | 0 (0.0%) |
| Retail Trade | 55 (67.9%) | 26 (32.1%) |
| Transportation & Warehousing | 6 (100.0%) | 0 (0.0%) |
| Utilities | 5 (100.0%) | 0 (0.0%) |
| Information | 0 (0.0%) | 2 (100.0%) |
| Finance & Insurance | 0 (0.0%) | 0 (0.0%) |
| Real Estate, Rental & Leasing | 0 (0.0%) | 13 (100.0%) |
| Professional & Scientific | 9 (75.0%) | 3 (25.0%) |
| Enterprise Management | 0 (0.0%) | 0 (0.0%) |
| Administrative & Support | 0 (0.0%) | 3 (100.0%) |
| Educational Services | 45 (60.8%) | 29 (39.2%) |
| Health Care & Social Assistance | 10 (58.8%) | 7 (41.2%) |
| Arts, Entertainment & Recreation | 13 (81.2%) | 3 (18.8%) |
| Accommodation & Food Services | 31 (51.7%) | 29 (48.3%) |
| Public Administration | 11 (50.0%) | 11 (50.0%) |
| Total | 229 (60.1%) | 152 (39.9%) |
Education in San Juan County
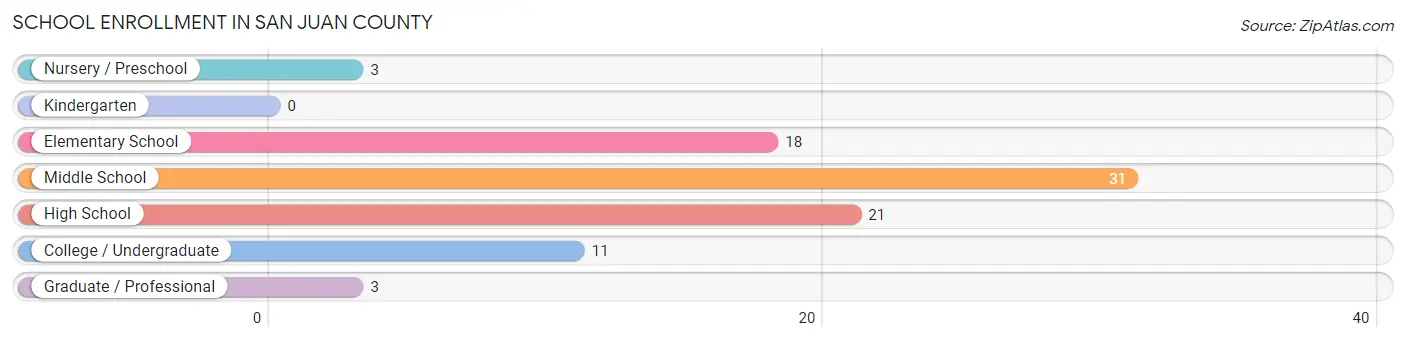
School Enrollment in San Juan County
The most common levels of schooling among the 87 students in San Juan County are middle school (31 | 35.6%), high school (21 | 24.1%), and elementary school (18 | 20.7%).
| School Level | # Students | % Students |
| Nursery / Preschool | 3 | 3.5% |
| Kindergarten | 0 | 0.0% |
| Elementary School | 18 | 20.7% |
| Middle School | 31 | 35.6% |
| High School | 21 | 24.1% |
| College / Undergraduate | 11 | 12.6% |
| Graduate / Professional | 3 | 3.5% |
| Total | 87 | 100.0% |
School Enrollment by Age by Funding Source in San Juan County
Out of a total of 87 students who are enrolled in schools in San Juan County, 3 (3.4%) attend a private institution, while the remaining 84 (96.6%) are enrolled in public schools. The age group of 35 years and over has the highest likelihood of being enrolled in private schools, with 3 (100.0% in the age bracket) enrolled. Conversely, the age group of 3 to 4 year olds has the lowest likelihood of being enrolled in a private school, with 3 (100.0% in the age bracket) attending a public institution.
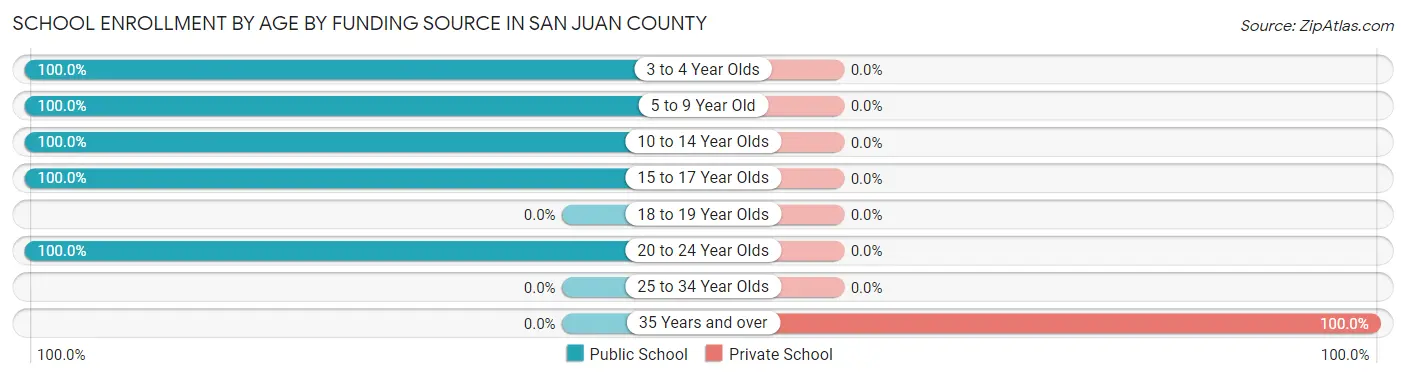
| Age Bracket | Public School | Private School |
| 3 to 4 Year Olds | 3 (100.0%) | 0 (0.0%) |
| 5 to 9 Year Old | 18 (100.0%) | 0 (0.0%) |
| 10 to 14 Year Olds | 31 (100.0%) | 0 (0.0%) |
| 15 to 17 Year Olds | 21 (100.0%) | 0 (0.0%) |
| 18 to 19 Year Olds | 0 (0.0%) | 0 (0.0%) |
| 20 to 24 Year Olds | 11 (100.0%) | 0 (0.0%) |
| 25 to 34 Year Olds | 0 (0.0%) | 0 (0.0%) |
| 35 Years and over | 0 (0.0%) | 3 (100.0%) |
| Total | 84 (96.6%) | 3 (3.4%) |
Educational Attainment by Field of Study in San Juan County
Bio, nature & agricultural (42 | 17.9%), business (39 | 16.7%), education (31 | 13.3%), engineering (28 | 12.0%), and arts & humanities (20 | 8.6%) are the most common fields of study among 234 individuals in San Juan County who have obtained a bachelor's degree or higher.
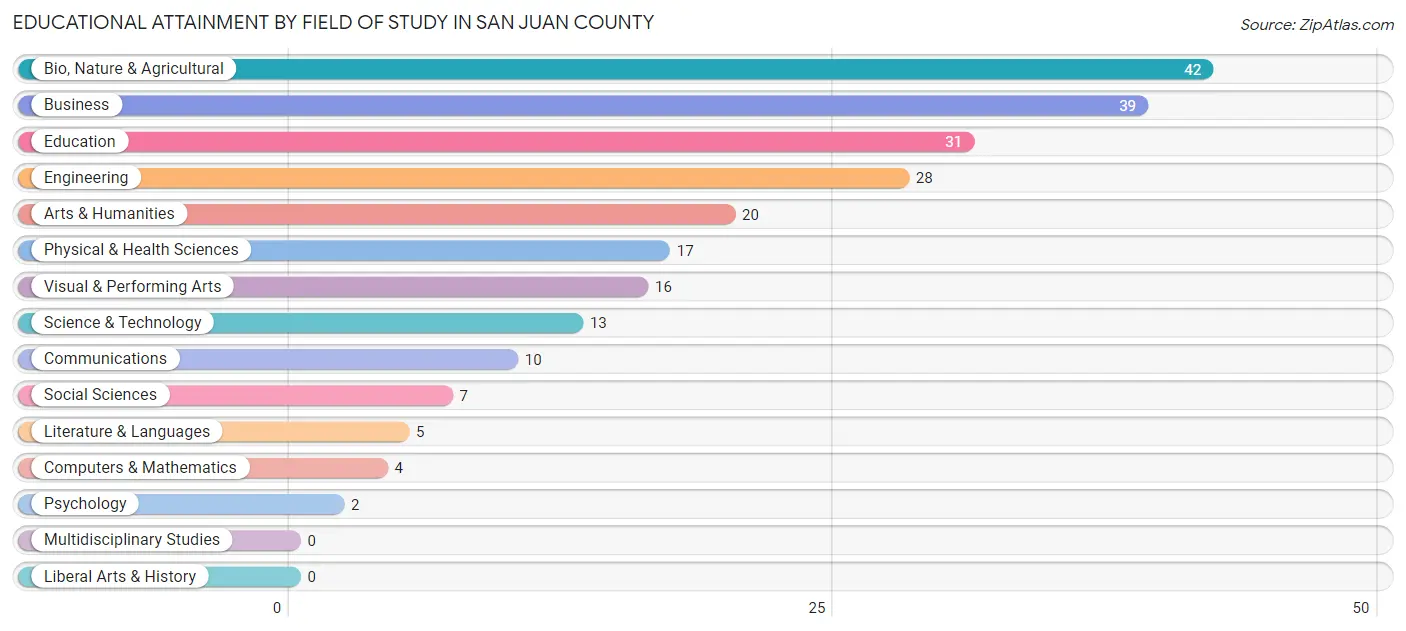
| Field of Study | # Graduates | % Graduates |
| Computers & Mathematics | 4 | 1.7% |
| Bio, Nature & Agricultural | 42 | 17.9% |
| Physical & Health Sciences | 17 | 7.3% |
| Psychology | 2 | 0.9% |
| Social Sciences | 7 | 3.0% |
| Engineering | 28 | 12.0% |
| Multidisciplinary Studies | 0 | 0.0% |
| Science & Technology | 13 | 5.6% |
| Business | 39 | 16.7% |
| Education | 31 | 13.3% |
| Literature & Languages | 5 | 2.1% |
| Liberal Arts & History | 0 | 0.0% |
| Visual & Performing Arts | 16 | 6.8% |
| Communications | 10 | 4.3% |
| Arts & Humanities | 20 | 8.6% |
| Total | 234 | 100.0% |
Transportation & Commute in San Juan County
Vehicle Availability by Sex in San Juan County
The most prevalent vehicle ownership categories in San Juan County are males with 2 vehicles (134, accounting for 60.1%) and females with 2 vehicles (78, making up 89.9%).
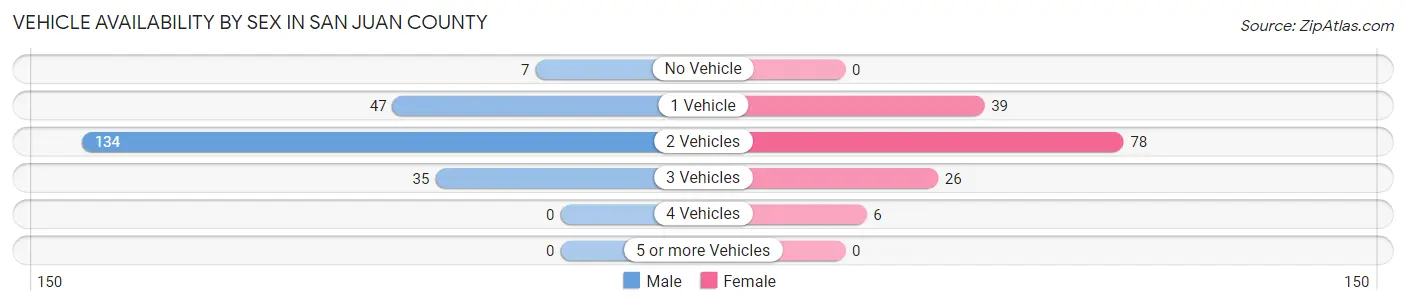
| Vehicles Available | Male | Female |
| No Vehicle | 7 (3.1%) | 0 (0.0%) |
| 1 Vehicle | 47 (21.1%) | 39 (26.2%) |
| 2 Vehicles | 134 (60.1%) | 78 (52.3%) |
| 3 Vehicles | 35 (15.7%) | 26 (17.4%) |
| 4 Vehicles | 0 (0.0%) | 6 (4.0%) |
| 5 or more Vehicles | 0 (0.0%) | 0 (0.0%) |
| Total | 223 (100.0%) | 149 (100.0%) |
Commute Time in San Juan County
The most frequently occuring commute durations in San Juan County are 5 to 9 minutes (161 commuters, 51.8%), 10 to 14 minutes (48 commuters, 15.4%), and less than 5 minutes (26 commuters, 8.4%).
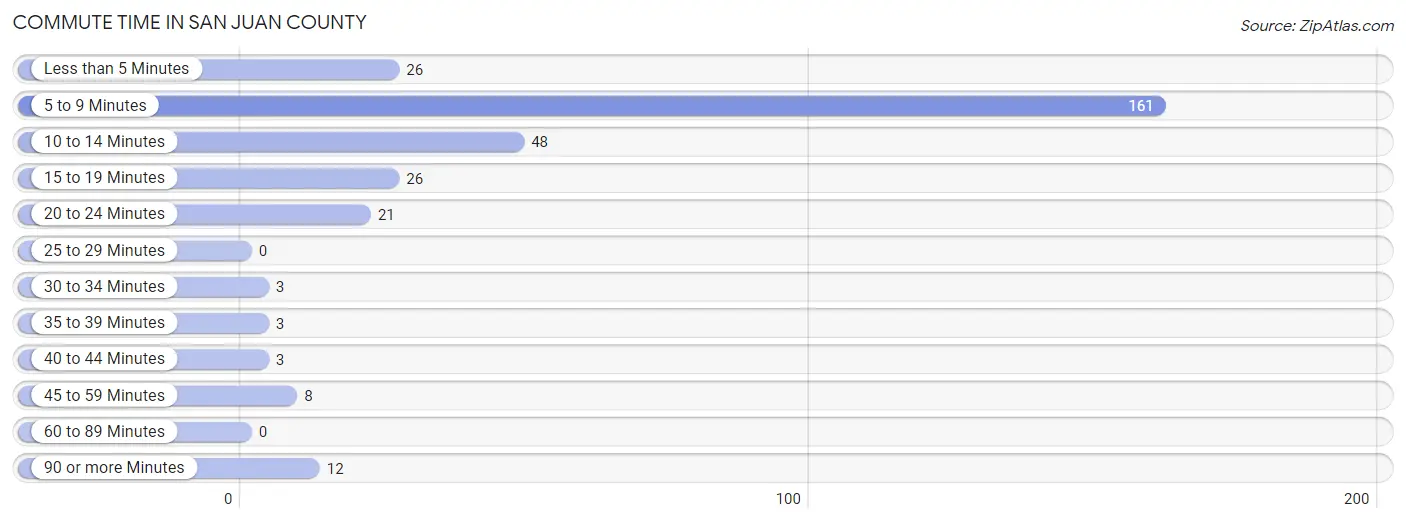
| Commute Time | # Commuters | % Commuters |
| Less than 5 Minutes | 26 | 8.4% |
| 5 to 9 Minutes | 161 | 51.8% |
| 10 to 14 Minutes | 48 | 15.4% |
| 15 to 19 Minutes | 26 | 8.4% |
| 20 to 24 Minutes | 21 | 6.8% |
| 25 to 29 Minutes | 0 | 0.0% |
| 30 to 34 Minutes | 3 | 1.0% |
| 35 to 39 Minutes | 3 | 1.0% |
| 40 to 44 Minutes | 3 | 1.0% |
| 45 to 59 Minutes | 8 | 2.6% |
| 60 to 89 Minutes | 0 | 0.0% |
| 90 or more Minutes | 12 | 3.9% |
Commute Time by Sex in San Juan County
The most common commute times in San Juan County are 5 to 9 minutes (112 commuters, 55.4%) for males and 5 to 9 minutes (49 commuters, 45.0%) for females.

| Commute Time | Male | Female |
| Less than 5 Minutes | 14 (6.9%) | 12 (11.0%) |
| 5 to 9 Minutes | 112 (55.4%) | 49 (45.0%) |
| 10 to 14 Minutes | 17 (8.4%) | 31 (28.4%) |
| 15 to 19 Minutes | 26 (12.9%) | 0 (0.0%) |
| 20 to 24 Minutes | 15 (7.4%) | 6 (5.5%) |
| 25 to 29 Minutes | 0 (0.0%) | 0 (0.0%) |
| 30 to 34 Minutes | 0 (0.0%) | 3 (2.8%) |
| 35 to 39 Minutes | 3 (1.5%) | 0 (0.0%) |
| 40 to 44 Minutes | 0 (0.0%) | 3 (2.8%) |
| 45 to 59 Minutes | 3 (1.5%) | 5 (4.6%) |
| 60 to 89 Minutes | 0 (0.0%) | 0 (0.0%) |
| 90 or more Minutes | 12 (5.9%) | 0 (0.0%) |
Time of Departure to Work by Sex in San Juan County
The most frequent times of departure to work in San Juan County are 7:00 AM to 7:29 AM (64, 31.7%) for males and 8:00 AM to 8:29 AM (56, 51.4%) for females.
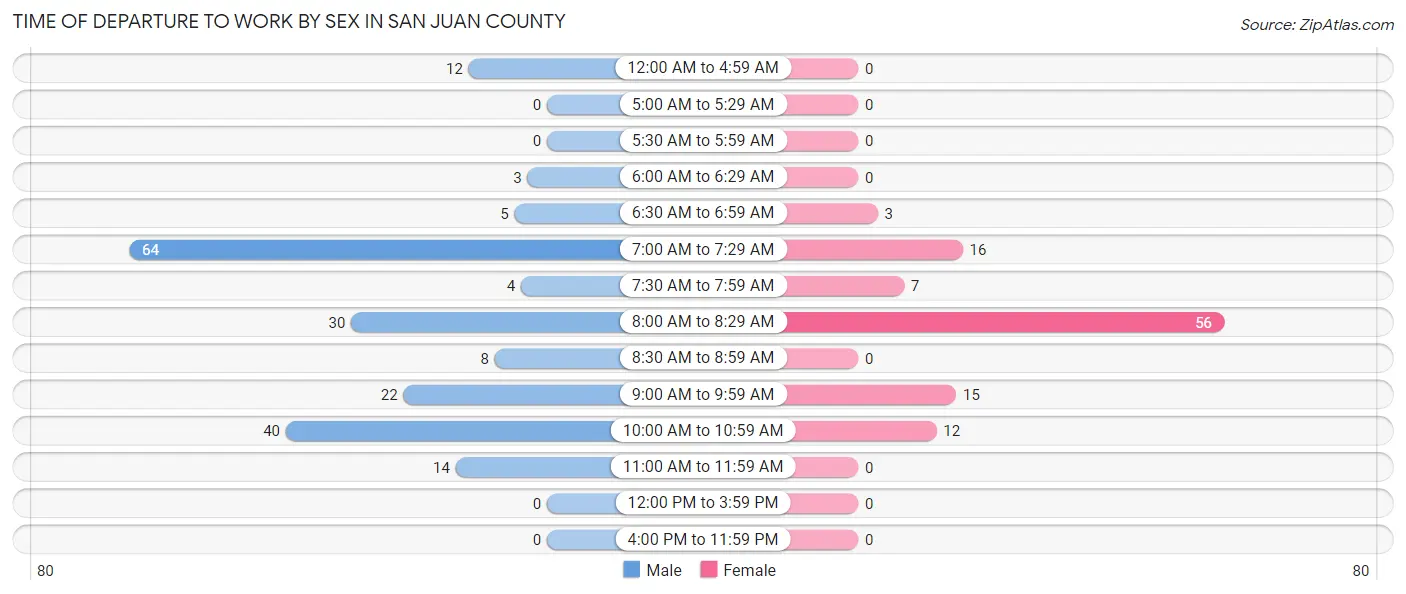
| Time of Departure | Male | Female |
| 12:00 AM to 4:59 AM | 12 (5.9%) | 0 (0.0%) |
| 5:00 AM to 5:29 AM | 0 (0.0%) | 0 (0.0%) |
| 5:30 AM to 5:59 AM | 0 (0.0%) | 0 (0.0%) |
| 6:00 AM to 6:29 AM | 3 (1.5%) | 0 (0.0%) |
| 6:30 AM to 6:59 AM | 5 (2.5%) | 3 (2.8%) |
| 7:00 AM to 7:29 AM | 64 (31.7%) | 16 (14.7%) |
| 7:30 AM to 7:59 AM | 4 (2.0%) | 7 (6.4%) |
| 8:00 AM to 8:29 AM | 30 (14.8%) | 56 (51.4%) |
| 8:30 AM to 8:59 AM | 8 (4.0%) | 0 (0.0%) |
| 9:00 AM to 9:59 AM | 22 (10.9%) | 15 (13.8%) |
| 10:00 AM to 10:59 AM | 40 (19.8%) | 12 (11.0%) |
| 11:00 AM to 11:59 AM | 14 (6.9%) | 0 (0.0%) |
| 12:00 PM to 3:59 PM | 0 (0.0%) | 0 (0.0%) |
| 4:00 PM to 11:59 PM | 0 (0.0%) | 0 (0.0%) |
| Total | 202 (100.0%) | 109 (100.0%) |
Housing Occupancy in San Juan County
Occupancy by Ownership in San Juan County
Of the total 337 dwellings in San Juan County, owner-occupied units account for 185 (54.9%), while renter-occupied units make up 152 (45.1%).
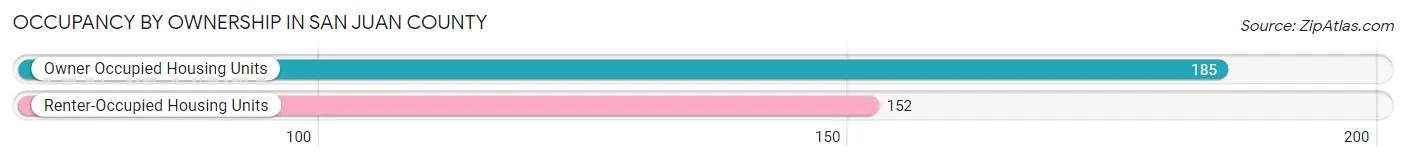
| Occupancy | # Housing Units | % Housing Units |
| Owner Occupied Housing Units | 185 | 54.9% |
| Renter-Occupied Housing Units | 152 | 45.1% |
| Total Occupied Housing Units | 337 | 100.0% |
Occupancy by Household Size in San Juan County
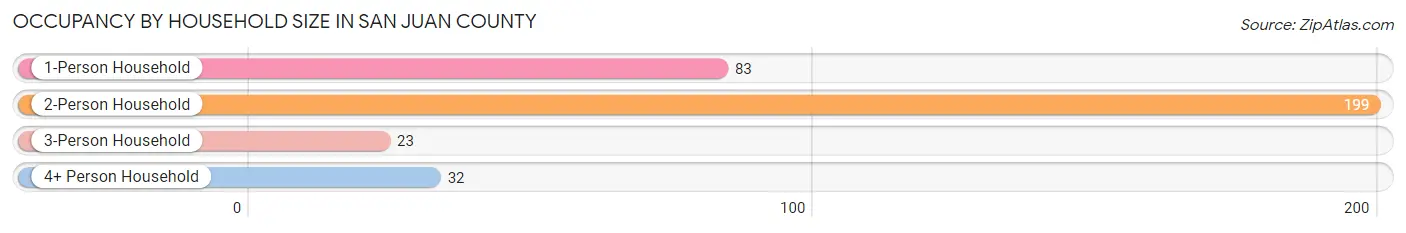
| Household Size | # Housing Units | % Housing Units |
| 1-Person Household | 83 | 24.6% |
| 2-Person Household | 199 | 59.1% |
| 3-Person Household | 23 | 6.8% |
| 4+ Person Household | 32 | 9.5% |
| Total Housing Units | 337 | 100.0% |
Occupancy by Ownership by Household Size in San Juan County
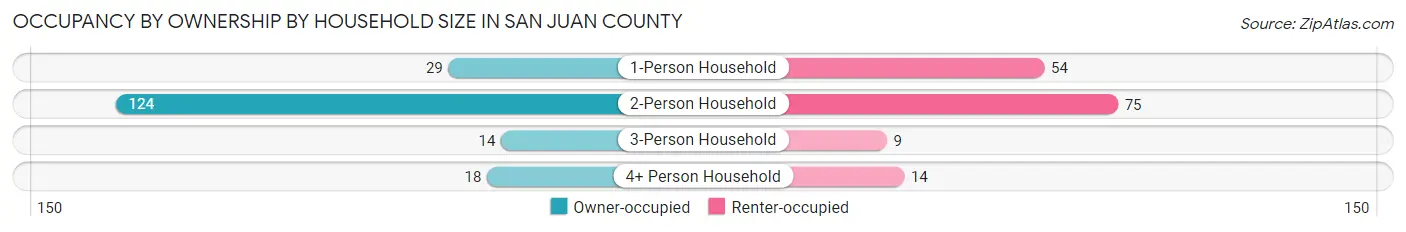
| Household Size | Owner-occupied | Renter-occupied |
| 1-Person Household | 29 (34.9%) | 54 (65.1%) |
| 2-Person Household | 124 (62.3%) | 75 (37.7%) |
| 3-Person Household | 14 (60.9%) | 9 (39.1%) |
| 4+ Person Household | 18 (56.2%) | 14 (43.8%) |
| Total Housing Units | 185 (54.9%) | 152 (45.1%) |
Occupancy by Educational Attainment in San Juan County
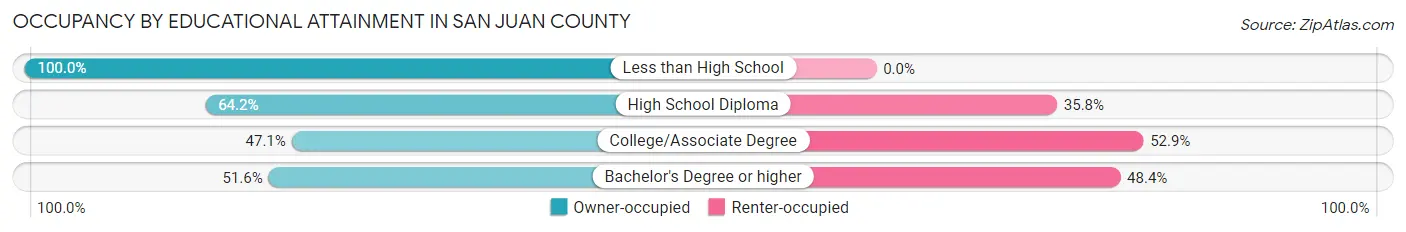
| Household Size | Owner-occupied | Renter-occupied |
| Less than High School | 15 (100.0%) | 0 (0.0%) |
| High School Diploma | 43 (64.2%) | 24 (35.8%) |
| College/Associate Degree | 48 (47.1%) | 54 (52.9%) |
| Bachelor's Degree or higher | 79 (51.6%) | 74 (48.4%) |
Occupancy by Age of Householder in San Juan County
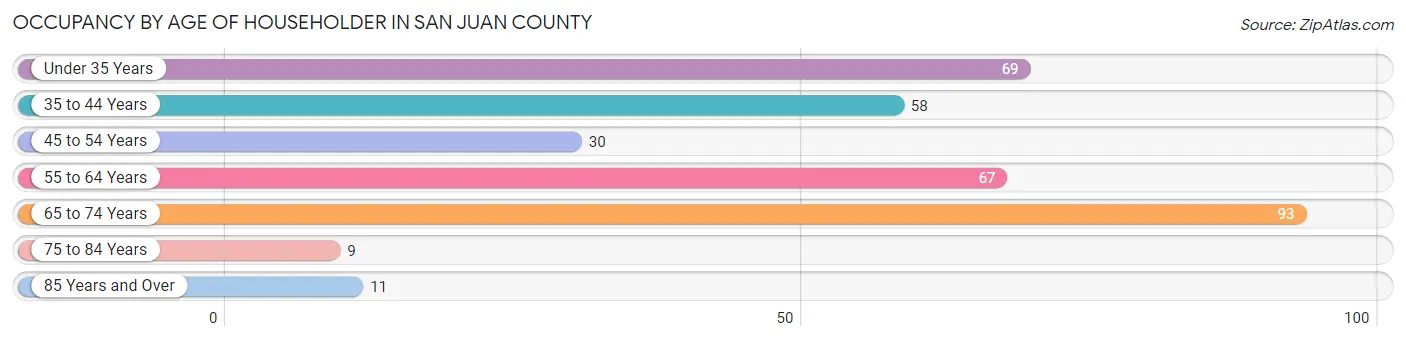
| Age Bracket | # Households | % Households |
| Under 35 Years | 69 | 20.5% |
| 35 to 44 Years | 58 | 17.2% |
| 45 to 54 Years | 30 | 8.9% |
| 55 to 64 Years | 67 | 19.9% |
| 65 to 74 Years | 93 | 27.6% |
| 75 to 84 Years | 9 | 2.7% |
| 85 Years and Over | 11 | 3.3% |
| Total | 337 | 100.0% |
Housing Finances in San Juan County
Median Income by Occupancy in San Juan County
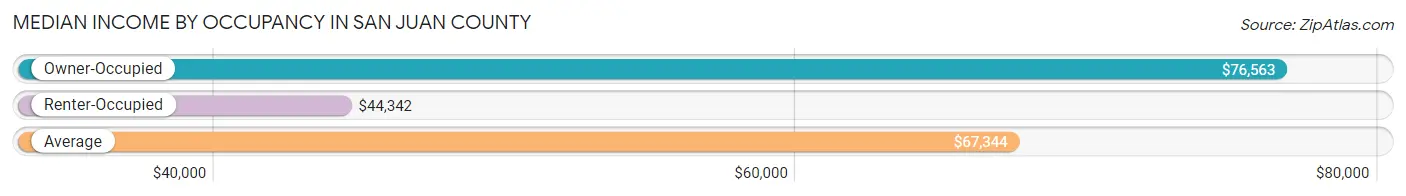
| Occupancy Type | # Households | Median Income |
| Owner-Occupied | 185 (54.9%) | $76,563 |
| Renter-Occupied | 152 (45.1%) | $44,342 |
| Average | 337 (100.0%) | $67,344 |
Occupancy by Householder Income Bracket in San Juan County
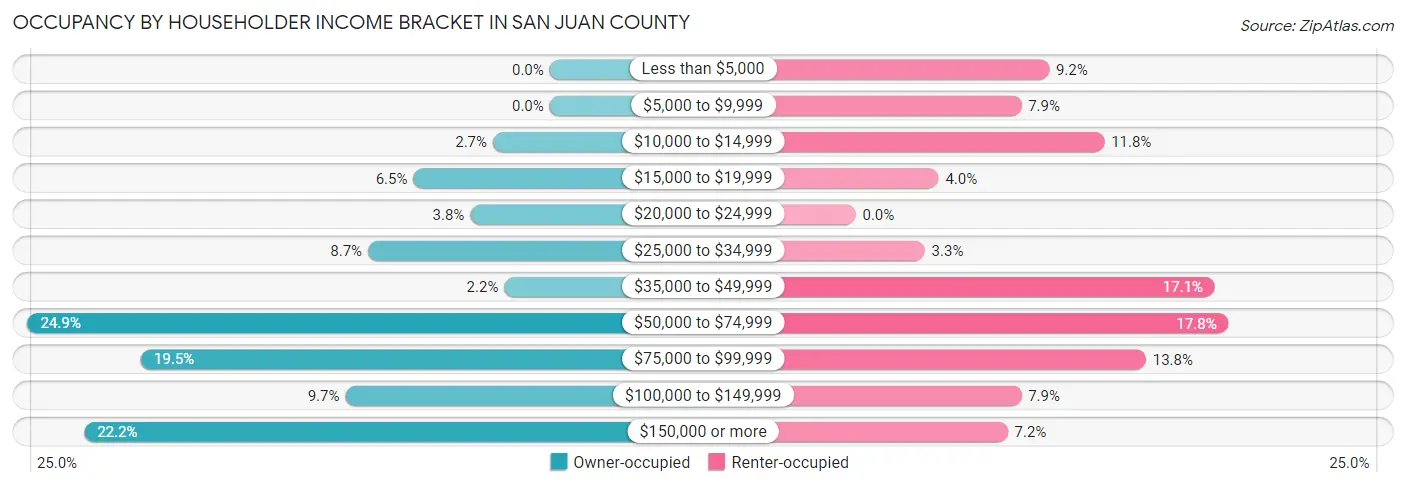
| Income Bracket | Owner-occupied | Renter-occupied |
| Less than $5,000 | 0 (0.0%) | 14 (9.2%) |
| $5,000 to $9,999 | 0 (0.0%) | 12 (7.9%) |
| $10,000 to $14,999 | 5 (2.7%) | 18 (11.8%) |
| $15,000 to $19,999 | 12 (6.5%) | 6 (4.0%) |
| $20,000 to $24,999 | 7 (3.8%) | 0 (0.0%) |
| $25,000 to $34,999 | 16 (8.6%) | 5 (3.3%) |
| $35,000 to $49,999 | 4 (2.2%) | 26 (17.1%) |
| $50,000 to $74,999 | 46 (24.9%) | 27 (17.8%) |
| $75,000 to $99,999 | 36 (19.5%) | 21 (13.8%) |
| $100,000 to $149,999 | 18 (9.7%) | 12 (7.9%) |
| $150,000 or more | 41 (22.2%) | 11 (7.2%) |
| Total | 185 (100.0%) | 152 (100.0%) |
Monthly Housing Cost Tiers in San Juan County
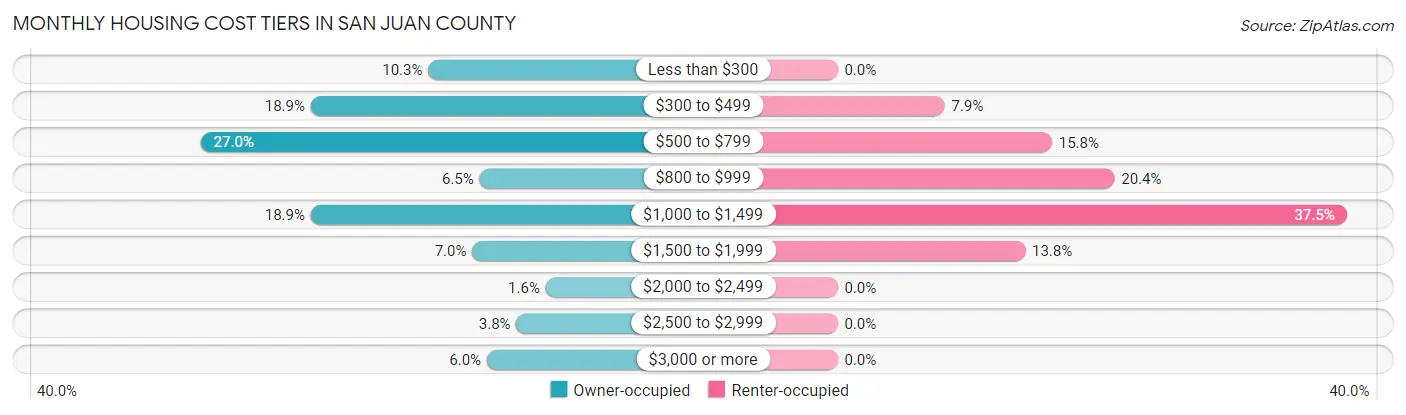
| Monthly Cost | Owner-occupied | Renter-occupied |
| Less than $300 | 19 (10.3%) | 0 (0.0%) |
| $300 to $499 | 35 (18.9%) | 12 (7.9%) |
| $500 to $799 | 50 (27.0%) | 24 (15.8%) |
| $800 to $999 | 12 (6.5%) | 31 (20.4%) |
| $1,000 to $1,499 | 35 (18.9%) | 57 (37.5%) |
| $1,500 to $1,999 | 13 (7.0%) | 21 (13.8%) |
| $2,000 to $2,499 | 3 (1.6%) | 0 (0.0%) |
| $2,500 to $2,999 | 7 (3.8%) | 0 (0.0%) |
| $3,000 or more | 11 (5.9%) | 0 (0.0%) |
| Total | 185 (100.0%) | 152 (100.0%) |
Physical Housing Characteristics in San Juan County
Housing Structures in San Juan County
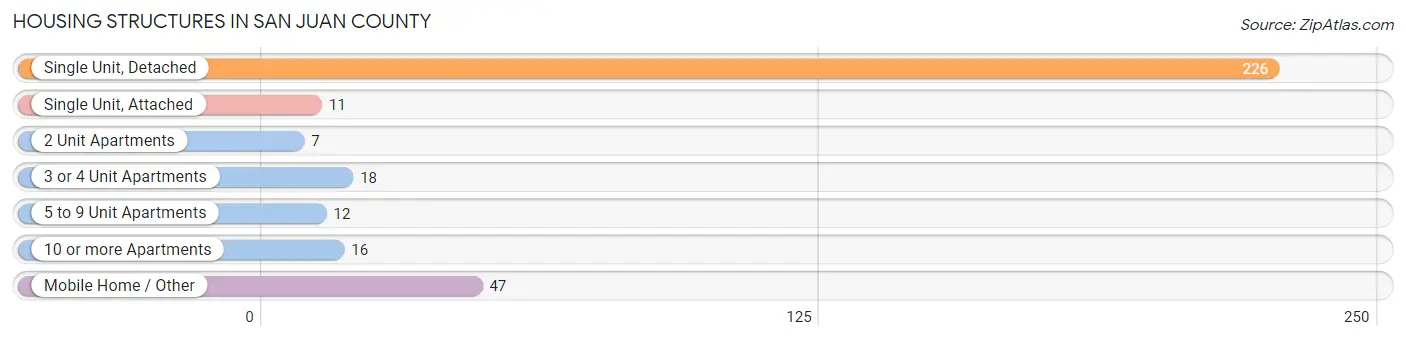
| Structure Type | # Housing Units | % Housing Units |
| Single Unit, Detached | 226 | 67.1% |
| Single Unit, Attached | 11 | 3.3% |
| 2 Unit Apartments | 7 | 2.1% |
| 3 or 4 Unit Apartments | 18 | 5.3% |
| 5 to 9 Unit Apartments | 12 | 3.6% |
| 10 or more Apartments | 16 | 4.8% |
| Mobile Home / Other | 47 | 14.0% |
| Total | 337 | 100.0% |
Housing Structures by Occupancy in San Juan County
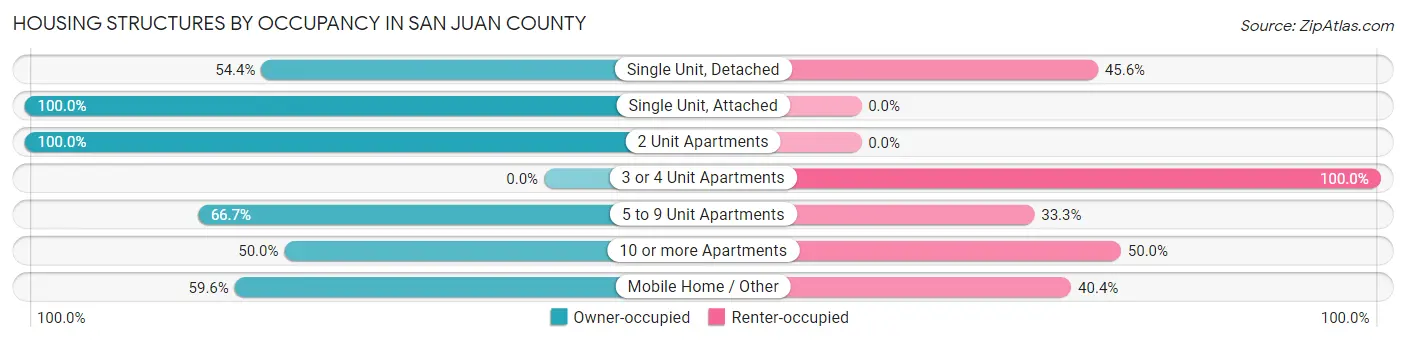
| Structure Type | Owner-occupied | Renter-occupied |
| Single Unit, Detached | 123 (54.4%) | 103 (45.6%) |
| Single Unit, Attached | 11 (100.0%) | 0 (0.0%) |
| 2 Unit Apartments | 7 (100.0%) | 0 (0.0%) |
| 3 or 4 Unit Apartments | 0 (0.0%) | 18 (100.0%) |
| 5 to 9 Unit Apartments | 8 (66.7%) | 4 (33.3%) |
| 10 or more Apartments | 8 (50.0%) | 8 (50.0%) |
| Mobile Home / Other | 28 (59.6%) | 19 (40.4%) |
| Total | 185 (54.9%) | 152 (45.1%) |
Housing Structures by Number of Rooms in San Juan County
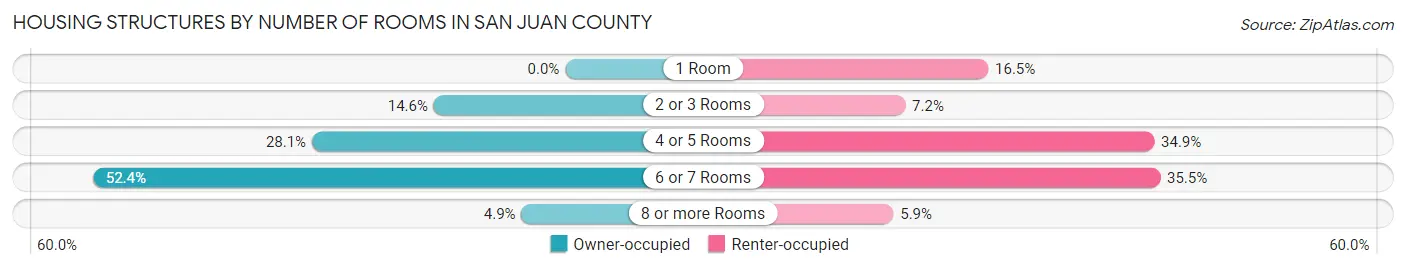
| Number of Rooms | Owner-occupied | Renter-occupied |
| 1 Room | 0 (0.0%) | 25 (16.5%) |
| 2 or 3 Rooms | 27 (14.6%) | 11 (7.2%) |
| 4 or 5 Rooms | 52 (28.1%) | 53 (34.9%) |
| 6 or 7 Rooms | 97 (52.4%) | 54 (35.5%) |
| 8 or more Rooms | 9 (4.9%) | 9 (5.9%) |
| Total | 185 (100.0%) | 152 (100.0%) |
Housing Structure by Heating Type in San Juan County
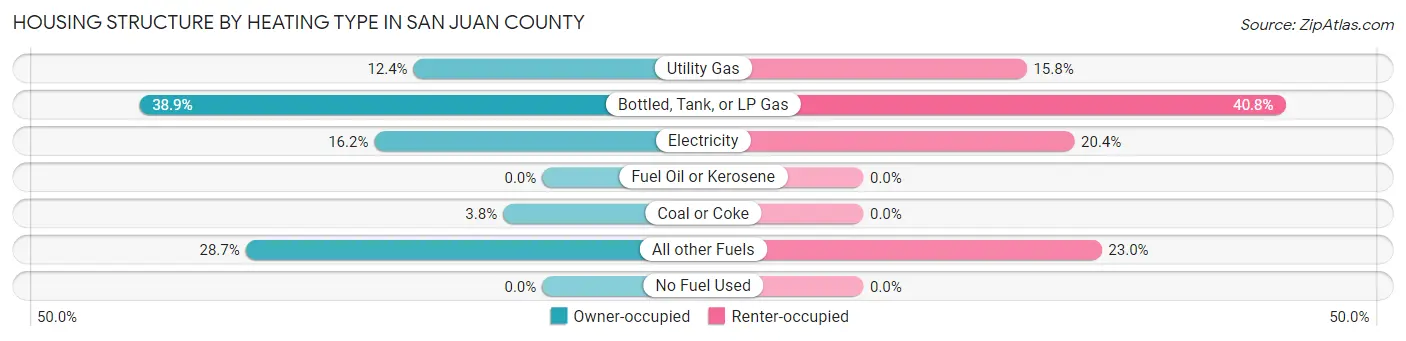
| Heating Type | Owner-occupied | Renter-occupied |
| Utility Gas | 23 (12.4%) | 24 (15.8%) |
| Bottled, Tank, or LP Gas | 72 (38.9%) | 62 (40.8%) |
| Electricity | 30 (16.2%) | 31 (20.4%) |
| Fuel Oil or Kerosene | 0 (0.0%) | 0 (0.0%) |
| Coal or Coke | 7 (3.8%) | 0 (0.0%) |
| All other Fuels | 53 (28.6%) | 35 (23.0%) |
| No Fuel Used | 0 (0.0%) | 0 (0.0%) |
| Total | 185 (100.0%) | 152 (100.0%) |
Household Vehicle Usage in San Juan County
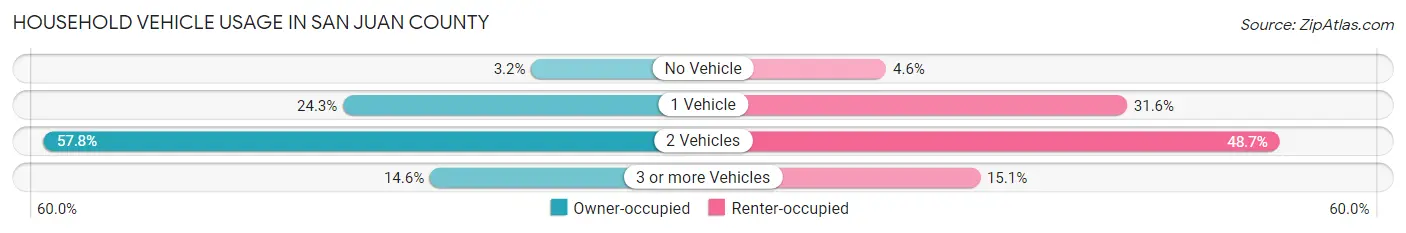
| Vehicles per Household | Owner-occupied | Renter-occupied |
| No Vehicle | 6 (3.2%) | 7 (4.6%) |
| 1 Vehicle | 45 (24.3%) | 48 (31.6%) |
| 2 Vehicles | 107 (57.8%) | 74 (48.7%) |
| 3 or more Vehicles | 27 (14.6%) | 23 (15.1%) |
| Total | 185 (100.0%) | 152 (100.0%) |
Real Estate & Mortgages in San Juan County
Real Estate and Mortgage Overview in San Juan County
| Characteristic | Without Mortgage | With Mortgage |
| Housing Units | 125 | 60 |
| Median Property Value | $383,300 | $220,000 |
| Median Household Income | $66,875 | $15 |
| Monthly Housing Costs | $534 | $11 |
| Real Estate Taxes | $767 | $0 |
Property Value by Mortgage Status in San Juan County
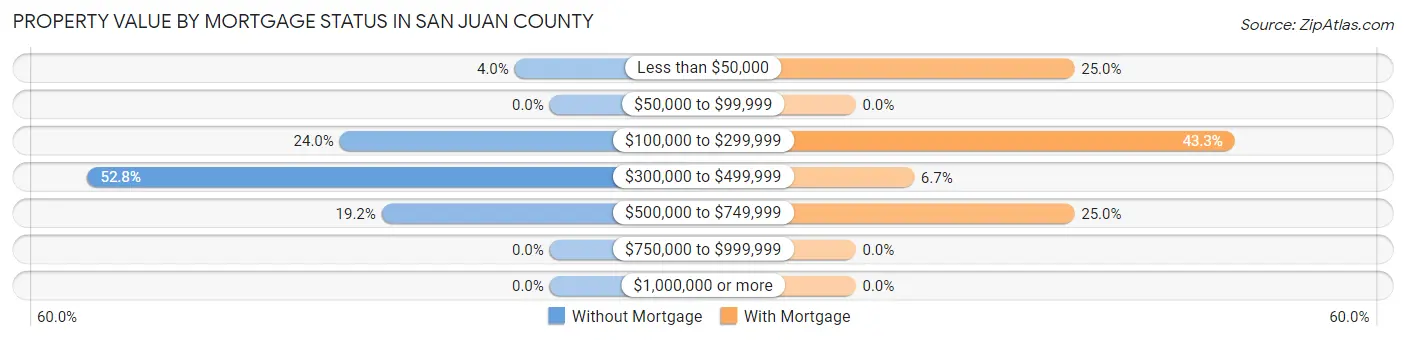
| Property Value | Without Mortgage | With Mortgage |
| Less than $50,000 | 5 (4.0%) | 15 (25.0%) |
| $50,000 to $99,999 | 0 (0.0%) | 0 (0.0%) |
| $100,000 to $299,999 | 30 (24.0%) | 26 (43.3%) |
| $300,000 to $499,999 | 66 (52.8%) | 4 (6.7%) |
| $500,000 to $749,999 | 24 (19.2%) | 15 (25.0%) |
| $750,000 to $999,999 | 0 (0.0%) | 0 (0.0%) |
| $1,000,000 or more | 0 (0.0%) | 0 (0.0%) |
| Total | 125 (100.0%) | 60 (100.0%) |
Household Income by Mortgage Status in San Juan County
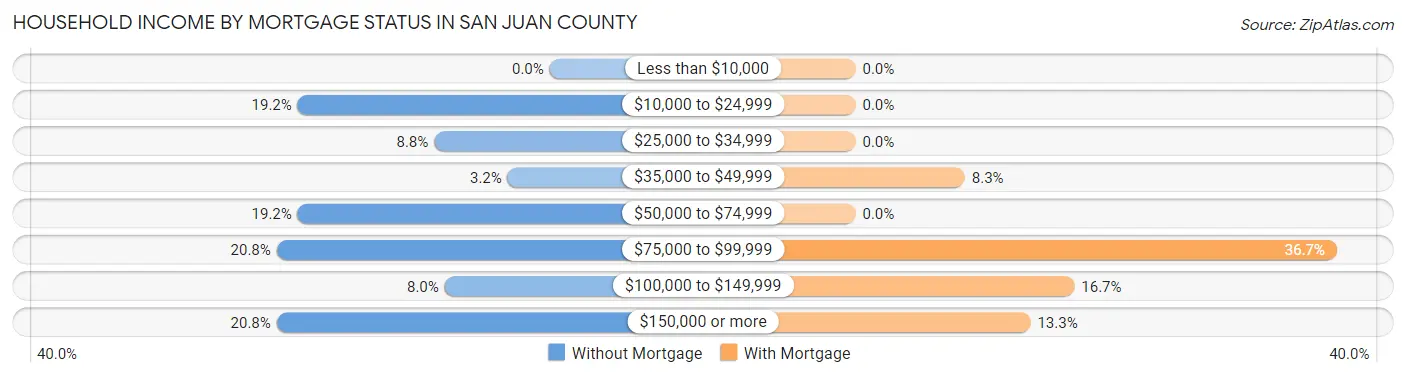
| Household Income | Without Mortgage | With Mortgage |
| Less than $10,000 | 0 (0.0%) | 0 (0.0%) |
| $10,000 to $24,999 | 24 (19.2%) | 0 (0.0%) |
| $25,000 to $34,999 | 11 (8.8%) | 0 (0.0%) |
| $35,000 to $49,999 | 4 (3.2%) | 5 (8.3%) |
| $50,000 to $74,999 | 24 (19.2%) | 0 (0.0%) |
| $75,000 to $99,999 | 26 (20.8%) | 22 (36.7%) |
| $100,000 to $149,999 | 10 (8.0%) | 10 (16.7%) |
| $150,000 or more | 26 (20.8%) | 8 (13.3%) |
| Total | 125 (100.0%) | 60 (100.0%) |
Property Value to Household Income Ratio in San Juan County
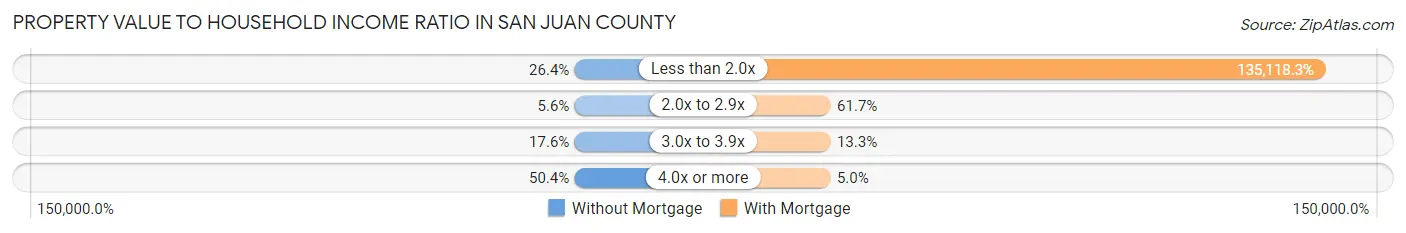
| Value-to-Income Ratio | Without Mortgage | With Mortgage |
| Less than 2.0x | 33 (26.4%) | 81,071 (135,118.3%) |
| 2.0x to 2.9x | 7 (5.6%) | 37 (61.7%) |
| 3.0x to 3.9x | 22 (17.6%) | 8 (13.3%) |
| 4.0x or more | 63 (50.4%) | 3 (5.0%) |
| Total | 125 (100.0%) | 60 (100.0%) |
Real Estate Taxes by Mortgage Status in San Juan County
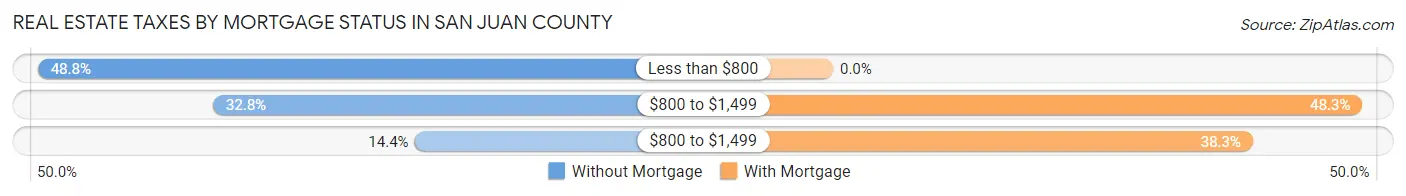
| Property Taxes | Without Mortgage | With Mortgage |
| Less than $800 | 61 (48.8%) | 0 (0.0%) |
| $800 to $1,499 | 41 (32.8%) | 29 (48.3%) |
| $800 to $1,499 | 18 (14.4%) | 23 (38.3%) |
| Total | 125 (100.0%) | 60 (100.0%) |
Health & Disability in San Juan County
Health Insurance Coverage by Age in San Juan County
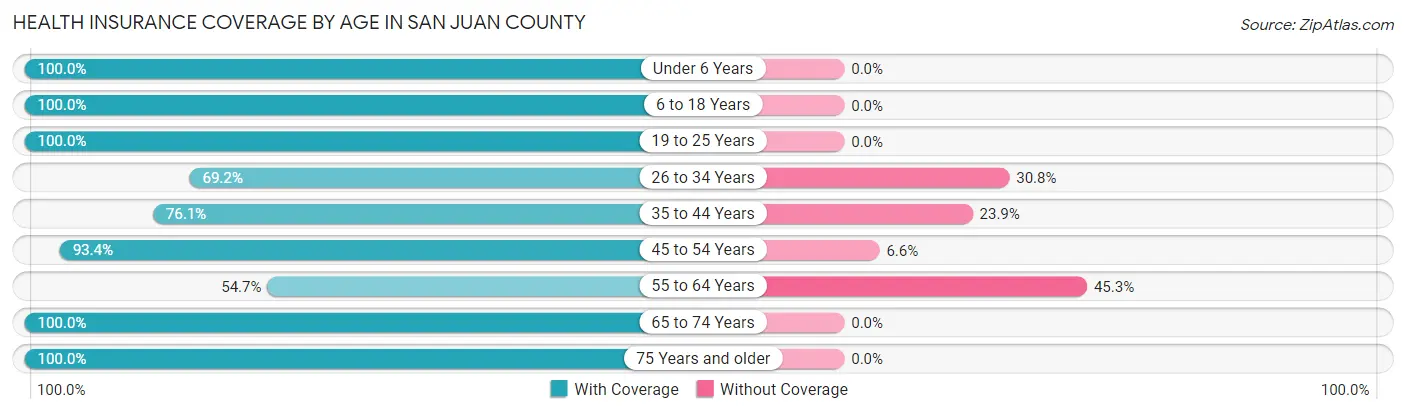
| Age Bracket | With Coverage | Without Coverage |
| Under 6 Years | 16 (100.0%) | 0 (0.0%) |
| 6 to 18 Years | 70 (100.0%) | 0 (0.0%) |
| 19 to 25 Years | 58 (100.0%) | 0 (0.0%) |
| 26 to 34 Years | 45 (69.2%) | 20 (30.8%) |
| 35 to 44 Years | 89 (76.1%) | 28 (23.9%) |
| 45 to 54 Years | 57 (93.4%) | 4 (6.6%) |
| 55 to 64 Years | 75 (54.7%) | 62 (45.3%) |
| 65 to 74 Years | 120 (100.0%) | 0 (0.0%) |
| 75 Years and older | 46 (100.0%) | 0 (0.0%) |
| Total | 576 (83.5%) | 114 (16.5%) |
Health Insurance Coverage by Citizenship Status in San Juan County
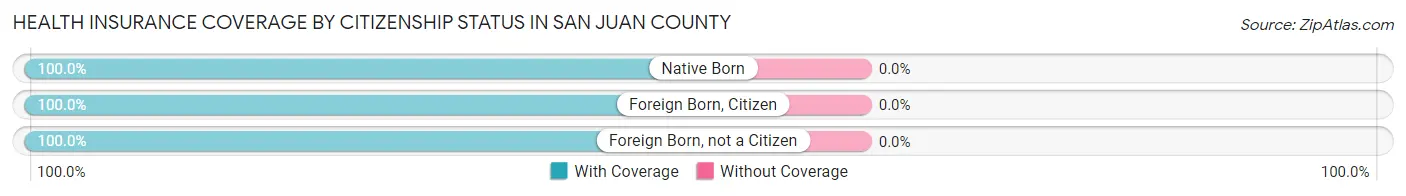
| Citizenship Status | With Coverage | Without Coverage |
| Native Born | 16 (100.0%) | 0 (0.0%) |
| Foreign Born, Citizen | 70 (100.0%) | 0 (0.0%) |
| Foreign Born, not a Citizen | 58 (100.0%) | 0 (0.0%) |
Health Insurance Coverage by Household Income in San Juan County
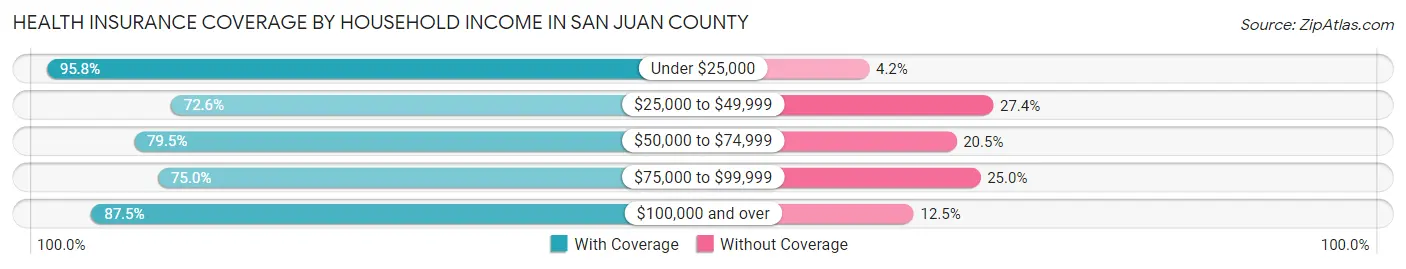
| Household Income | With Coverage | Without Coverage |
| Under $25,000 | 138 (95.8%) | 6 (4.2%) |
| $25,000 to $49,999 | 53 (72.6%) | 20 (27.4%) |
| $50,000 to $74,999 | 128 (79.5%) | 33 (20.5%) |
| $75,000 to $99,999 | 96 (75.0%) | 32 (25.0%) |
| $100,000 and over | 161 (87.5%) | 23 (12.5%) |
Public vs Private Health Insurance Coverage by Age in San Juan County
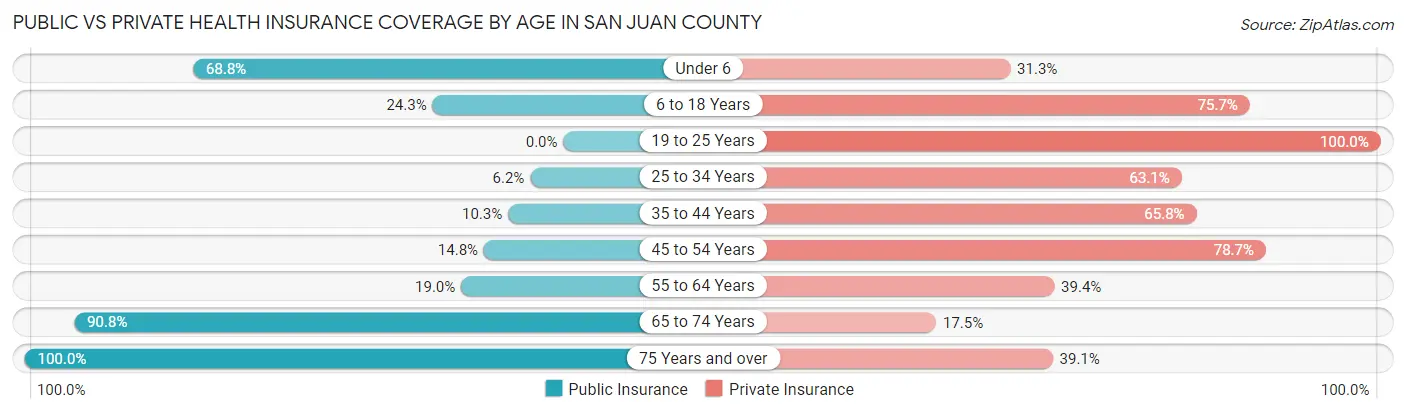
| Age Bracket | Public Insurance | Private Insurance |
| Under 6 | 11 (68.8%) | 5 (31.2%) |
| 6 to 18 Years | 17 (24.3%) | 53 (75.7%) |
| 19 to 25 Years | 0 (0.0%) | 58 (100.0%) |
| 25 to 34 Years | 4 (6.1%) | 41 (63.1%) |
| 35 to 44 Years | 12 (10.3%) | 77 (65.8%) |
| 45 to 54 Years | 9 (14.7%) | 48 (78.7%) |
| 55 to 64 Years | 26 (19.0%) | 54 (39.4%) |
| 65 to 74 Years | 109 (90.8%) | 21 (17.5%) |
| 75 Years and over | 46 (100.0%) | 18 (39.1%) |
| Total | 234 (33.9%) | 375 (54.3%) |
Disability Status by Sex by Age in San Juan County
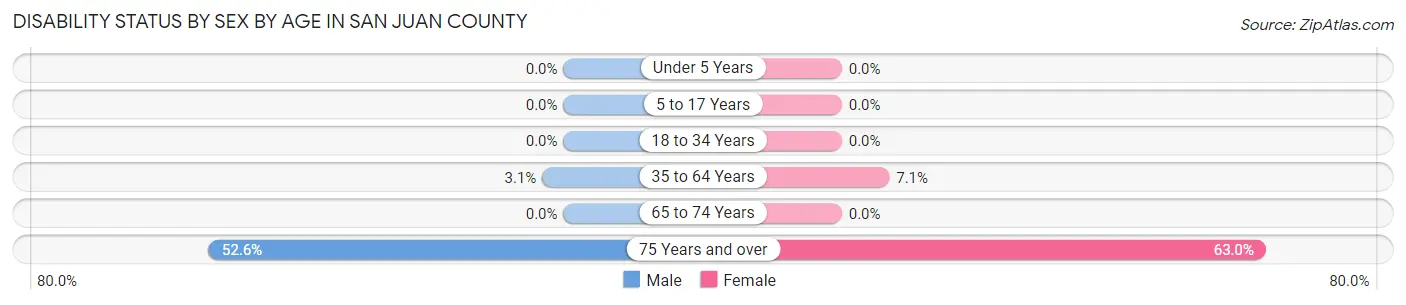
| Age Bracket | Male | Female |
| Under 5 Years | 0 (0.0%) | 0 (0.0%) |
| 5 to 17 Years | 0 (0.0%) | 0 (0.0%) |
| 18 to 34 Years | 0 (0.0%) | 0 (0.0%) |
| 35 to 64 Years | 5 (3.1%) | 11 (7.0%) |
| 65 to 74 Years | 0 (0.0%) | 0 (0.0%) |
| 75 Years and over | 10 (52.6%) | 17 (63.0%) |
Disability Class by Sex by Age in San Juan County
Disability Class: Hearing Difficulty
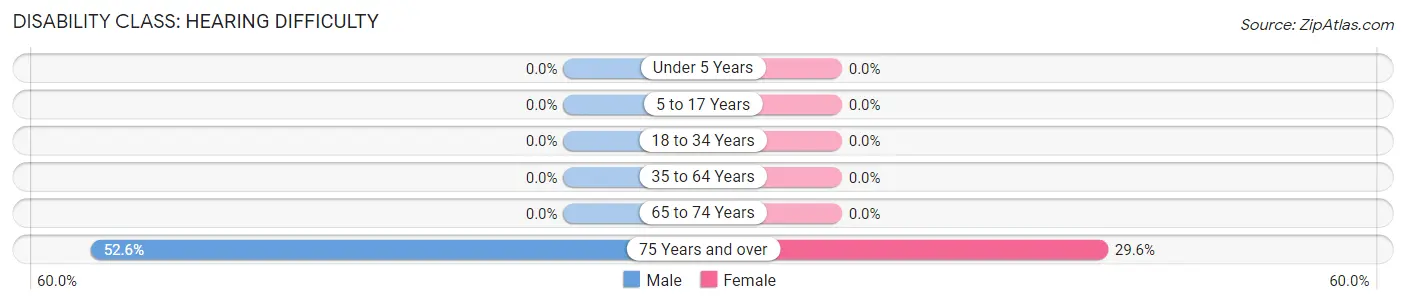
| Age Bracket | Male | Female |
| Under 5 Years | 0 (0.0%) | 0 (0.0%) |
| 5 to 17 Years | 0 (0.0%) | 0 (0.0%) |
| 18 to 34 Years | 0 (0.0%) | 0 (0.0%) |
| 35 to 64 Years | 0 (0.0%) | 0 (0.0%) |
| 65 to 74 Years | 0 (0.0%) | 0 (0.0%) |
| 75 Years and over | 10 (52.6%) | 8 (29.6%) |
Disability Class: Vision Difficulty
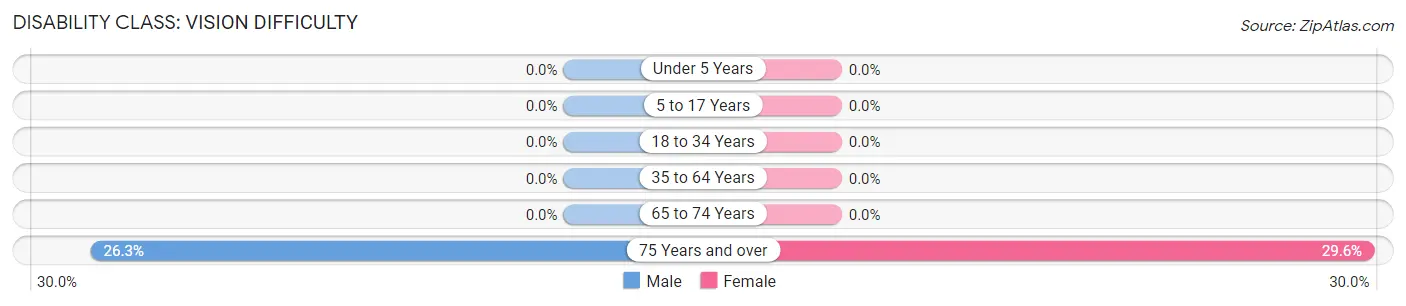
| Age Bracket | Male | Female |
| Under 5 Years | 0 (0.0%) | 0 (0.0%) |
| 5 to 17 Years | 0 (0.0%) | 0 (0.0%) |
| 18 to 34 Years | 0 (0.0%) | 0 (0.0%) |
| 35 to 64 Years | 0 (0.0%) | 0 (0.0%) |
| 65 to 74 Years | 0 (0.0%) | 0 (0.0%) |
| 75 Years and over | 5 (26.3%) | 8 (29.6%) |
Disability Class: Cognitive Difficulty
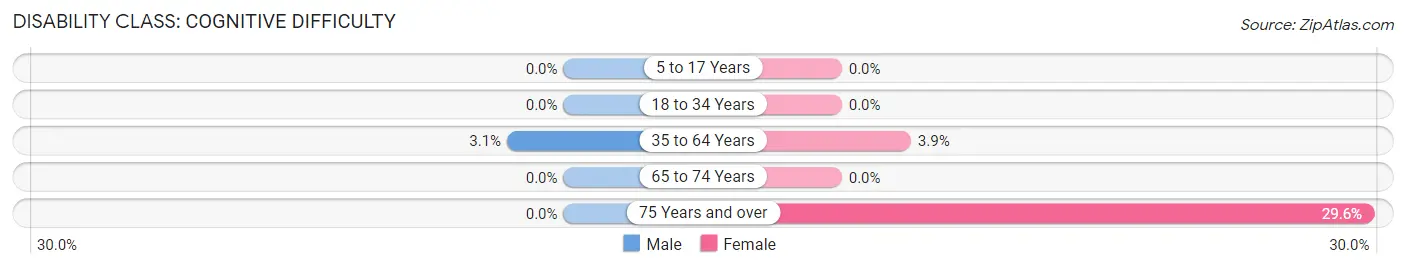
| Age Bracket | Male | Female |
| 5 to 17 Years | 0 (0.0%) | 0 (0.0%) |
| 18 to 34 Years | 0 (0.0%) | 0 (0.0%) |
| 35 to 64 Years | 5 (3.1%) | 6 (3.8%) |
| 65 to 74 Years | 0 (0.0%) | 0 (0.0%) |
| 75 Years and over | 0 (0.0%) | 8 (29.6%) |
Disability Class: Ambulatory Difficulty
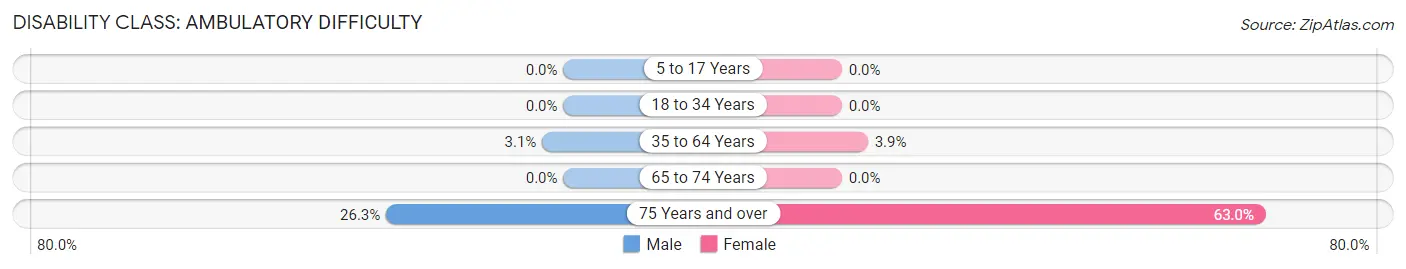
| Age Bracket | Male | Female |
| 5 to 17 Years | 0 (0.0%) | 0 (0.0%) |
| 18 to 34 Years | 0 (0.0%) | 0 (0.0%) |
| 35 to 64 Years | 5 (3.1%) | 6 (3.8%) |
| 65 to 74 Years | 0 (0.0%) | 0 (0.0%) |
| 75 Years and over | 5 (26.3%) | 17 (63.0%) |
Disability Class: Self-Care Difficulty
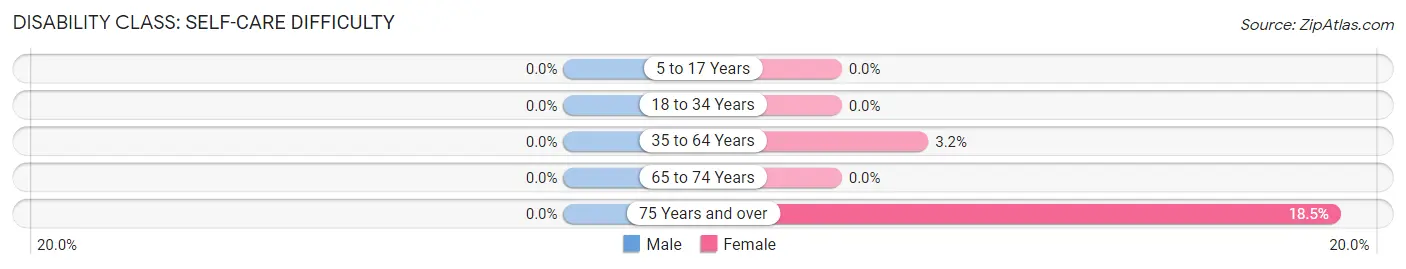
| Age Bracket | Male | Female |
| 5 to 17 Years | 0 (0.0%) | 0 (0.0%) |
| 18 to 34 Years | 0 (0.0%) | 0 (0.0%) |
| 35 to 64 Years | 0 (0.0%) | 5 (3.2%) |
| 65 to 74 Years | 0 (0.0%) | 0 (0.0%) |
| 75 Years and over | 0 (0.0%) | 5 (18.5%) |
Technology Access in San Juan County
Computing Device Access in San Juan County
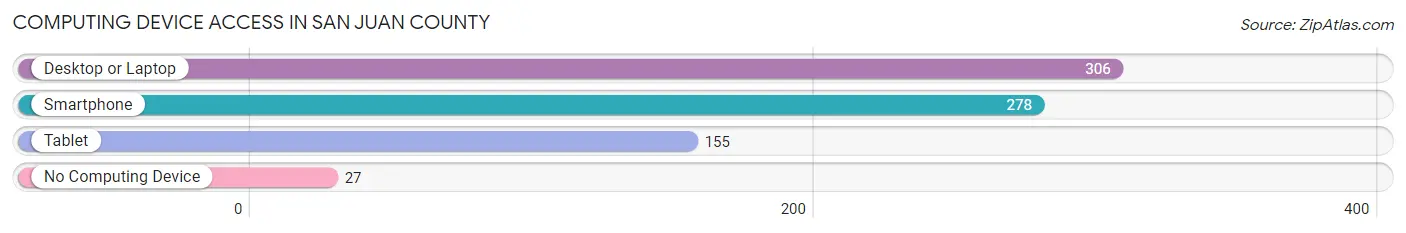
| Device Type | # Households | % Households |
| Desktop or Laptop | 306 | 90.8% |
| Smartphone | 278 | 82.5% |
| Tablet | 155 | 46.0% |
| No Computing Device | 27 | 8.0% |
| Total | 337 | 100.0% |
Internet Access in San Juan County
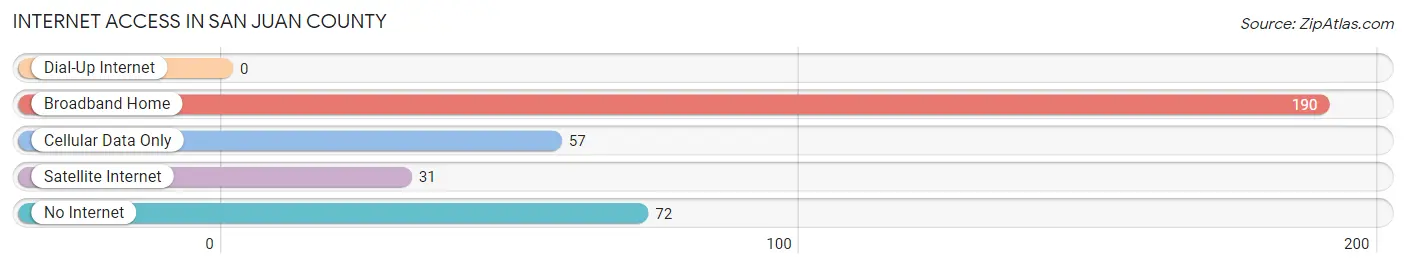
| Internet Type | # Households | % Households |
| Dial-Up Internet | 0 | 0.0% |
| Broadband Home | 190 | 56.4% |
| Cellular Data Only | 57 | 16.9% |
| Satellite Internet | 31 | 9.2% |
| No Internet | 72 | 21.4% |
| Total | 337 | 100.0% |
San Juan County Summary
San Juan County is located in the southwestern corner of Colorado, and is the fifth-largest county in the state. It is bordered by La Plata County to the north, Montezuma County to the east, and New Mexico to the south and west. The county seat is Silverton, and the largest city is Durango.
Geography
San Juan County is located in the San Juan Mountains of southwestern Colorado. The county is home to some of the highest peaks in the state, including Mount Sneffels, which is the highest peak in the county at 14,150 feet. The county is also home to the San Juan National Forest, which covers over 1.8 million acres and is the largest national forest in Colorado. The county is also home to the Weminuche Wilderness, which is the largest wilderness area in the state.
The county is home to several rivers, including the Animas River, which runs through the county from north to south. The county is also home to several lakes, including Vallecito Lake, which is the largest lake in the county.
The county has a total area of 2,945 square miles, of which 2,937 square miles is land and 8 square miles is water.
Economy
The economy of San Juan County is largely based on tourism and outdoor recreation. The county is home to several ski resorts, including Purgatory Resort, which is the largest ski resort in the county. The county is also home to several national parks and monuments, including Mesa Verde National Park and Chimney Rock National Monument.
The county is also home to several mining operations, including the Summitville Mine, which is the largest gold mine in the state. The county is also home to several oil and gas operations, including the Durango Oil Field, which is the largest oil field in the county.
Demographics
As of the 2010 census, there were 15,764 people, 6,845 households, and 4,541 families living in the county. The population density was 5.4 people per square mile. There were 8,845 housing units at an average density of 3.0 per square mile. The racial makeup of the county was 91.2% White, 0.7% Black or African American, 1.2% Native American, 0.7% Asian, 0.1% Pacific Islander, 4.2% from other races, and 2.0% from two or more races. Hispanic or Latino of any race were 11.3% of the population.
The median income for a household in the county was $41,945, and the median income for a family was $50,945. The per capita income for the county was $24,845. About 11.2% of families and 15.2% of the population were below the poverty line, including 22.2% of those under age 18 and 8.2% of those age 65 or over.
San Juan County is a rural county with a population that is largely dependent on tourism and outdoor recreation. The county is home to several ski resorts, national parks and monuments, and mining and oil and gas operations. The county has a diverse population, with a mix of White, Native American, Hispanic, and other racial and ethnic groups. The county has a median income that is slightly lower than the state average, and a poverty rate that is slightly higher than the state average.
Common Questions
What is Per Capita Income in San Juan County?
Per Capita income in San Juan County is $42,678.
What is the Median Family Income in San Juan County?
Median Family Income in San Juan County is $72,292.
What is the Median Household income in San Juan County?
Median Household Income in San Juan County is $67,344.
What is Income or Wage Gap in San Juan County?
Income or Wage Gap in San Juan County is 31.6%.
Women in San Juan County earn 68.4 cents for every dollar earned by a man.
What is Inequality or Gini Index in San Juan County?
Inequality or Gini Index in San Juan County is 0.47.
What is the Total Population of San Juan County?
Total Population of San Juan County is 690.
What is the Total Male Population of San Juan County?
Total Male Population of San Juan County is 371.
What is the Total Female Population of San Juan County?
Total Female Population of San Juan County is 319.
What is the Ratio of Males per 100 Females in San Juan County?
There are 116.30 Males per 100 Females in San Juan County.
What is the Ratio of Females per 100 Males in San Juan County?
There are 85.98 Females per 100 Males in San Juan County.
What is the Median Population Age in San Juan County?
Median Population Age in San Juan County is 49.3 Years.
What is the Average Family Size in San Juan County
Average Family Size in San Juan County is 2.4 People.
What is the Average Household Size in San Juan County
Average Household Size in San Juan County is 2.0 People.
How Large is the Labor Force in San Juan County?
There are 411 People in the Labor Forcein in San Juan County.
What is the Percentage of People in the Labor Force in San Juan County?
67.0% of People are in the Labor Force in San Juan County.
What is the Unemployment Rate in San Juan County?
Unemployment Rate in San Juan County is 7.3%.