Saguache County, CO Map & Demographics
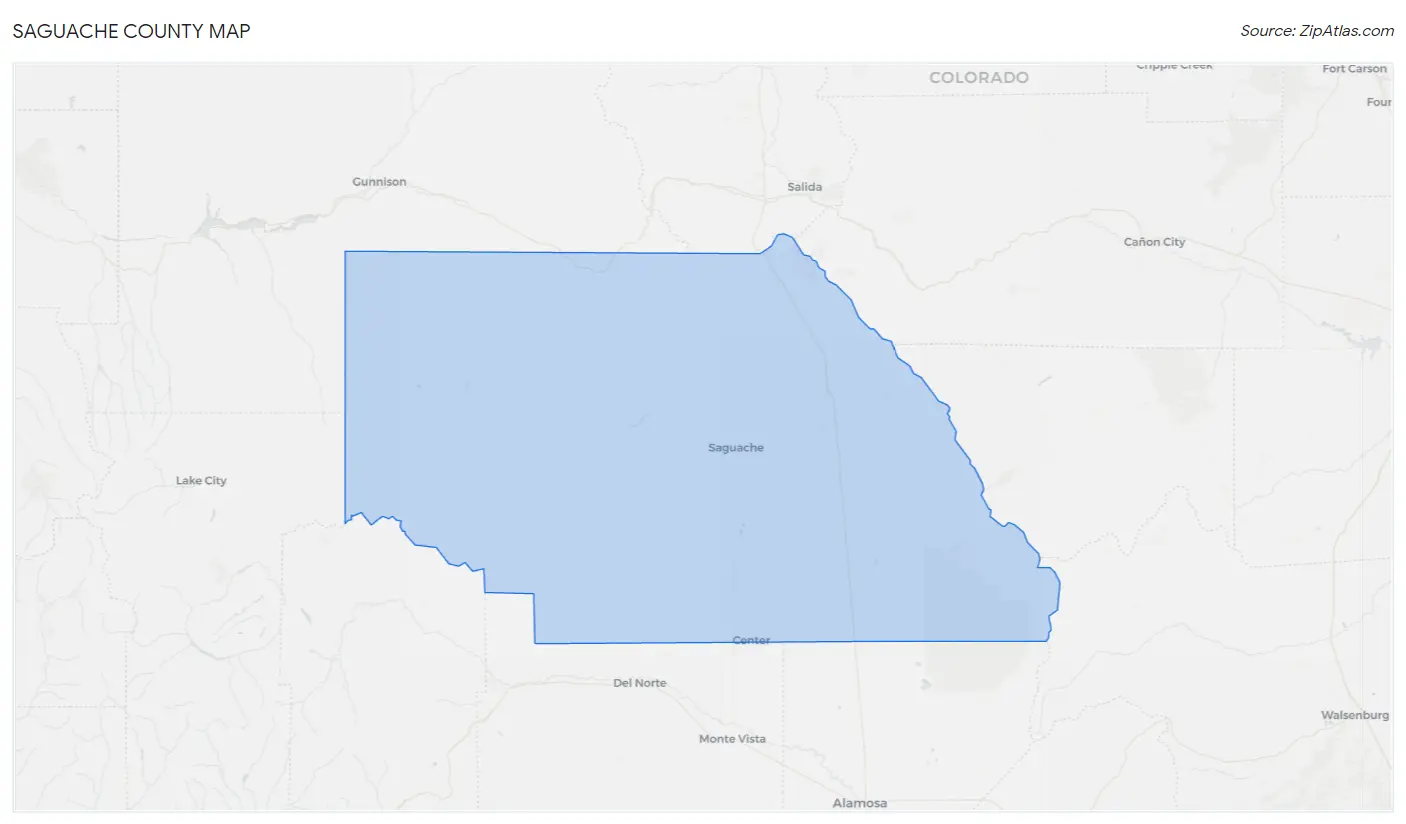
Saguache County Map
Saguache County Overview
$34,311
PER CAPITA INCOME
$58,552
AVG FAMILY INCOME
$51,946
AVG HOUSEHOLD INCOME
40.9%
WAGE / INCOME GAP [ % ]
59.1¢/ $1
WAGE / INCOME GAP [ $ ]
$7,790
FAMILY INCOME DEFICIT
0.52
INEQUALITY / GINI INDEX
6,454
TOTAL POPULATION
3,274
MALE POPULATION
3,180
FEMALE POPULATION
102.96
MALES / 100 FEMALES
97.13
FEMALES / 100 MALES
49.9
MEDIAN AGE
2.6
AVG FAMILY SIZE
2.1
AVG HOUSEHOLD SIZE
2,995
LABOR FORCE [ PEOPLE ]
55.1%
PERCENT IN LABOR FORCE
10.0%
UNEMPLOYMENT RATE
Saguache County Area Codes
Income in Saguache County
Income Overview in Saguache County
Per Capita Income in Saguache County is $34,311, while median incomes of families and households are $58,552 and $51,946 respectively.
| Characteristic | Number | Measure |
| Per Capita Income | 6,454 | $34,311 |
| Median Family Income | 1,937 | $58,552 |
| Mean Family Income | 1,937 | $84,157 |
| Median Household Income | 3,071 | $51,946 |
| Mean Household Income | 3,071 | $75,124 |
| Income Deficit | 1,937 | $7,790 |
| Wage / Income Gap (%) | 6,454 | 40.94% |
| Wage / Income Gap ($) | 6,454 | 59.06¢ per $1 |
| Gini / Inequality Index | 6,454 | 0.52 |
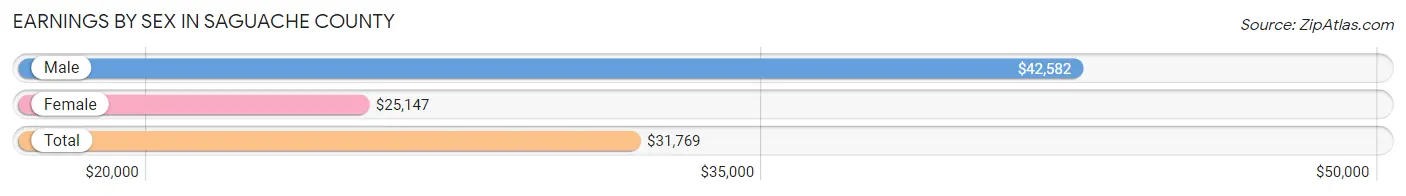
Earnings by Sex in Saguache County
Average Earnings in Saguache County are $31,769, $42,582 for men and $25,147 for women, a difference of 40.9%.
| Sex | Number | Average Earnings |
| Male | 1,664 (53.8%) | $42,582 |
| Female | 1,430 (46.2%) | $25,147 |
| Total | 3,094 (100.0%) | $31,769 |
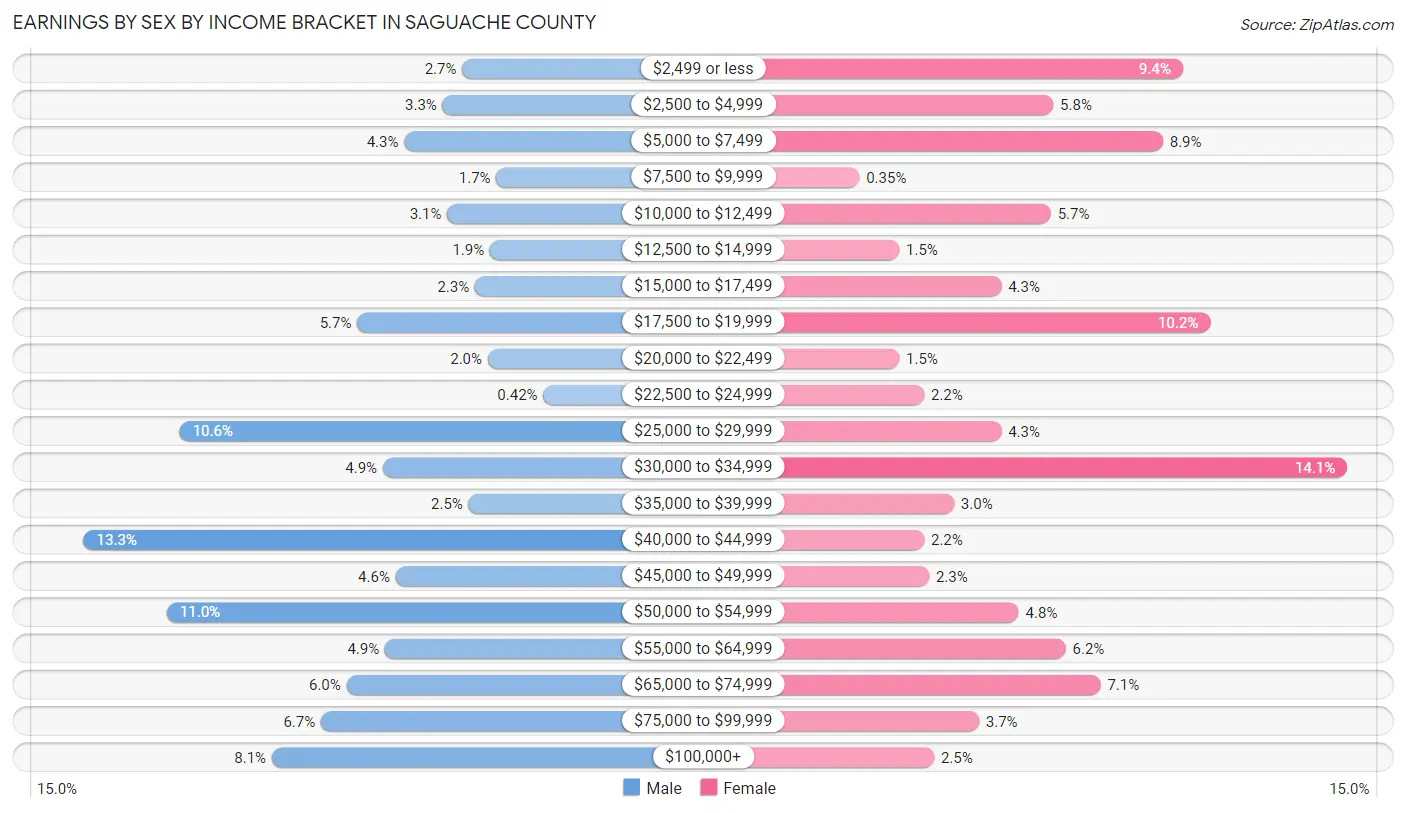
Earnings by Sex by Income Bracket in Saguache County
The most common earnings brackets in Saguache County are $40,000 to $44,999 for men (222 | 13.3%) and $30,000 to $34,999 for women (201 | 14.1%).
| Income | Male | Female |
| $2,499 or less | 45 (2.7%) | 135 (9.4%) |
| $2,500 to $4,999 | 54 (3.3%) | 83 (5.8%) |
| $5,000 to $7,499 | 72 (4.3%) | 127 (8.9%) |
| $7,500 to $9,999 | 29 (1.7%) | 5 (0.4%) |
| $10,000 to $12,499 | 52 (3.1%) | 82 (5.7%) |
| $12,500 to $14,999 | 32 (1.9%) | 21 (1.5%) |
| $15,000 to $17,499 | 39 (2.3%) | 62 (4.3%) |
| $17,500 to $19,999 | 94 (5.7%) | 146 (10.2%) |
| $20,000 to $22,499 | 33 (2.0%) | 21 (1.5%) |
| $22,500 to $24,999 | 7 (0.4%) | 31 (2.2%) |
| $25,000 to $29,999 | 177 (10.6%) | 62 (4.3%) |
| $30,000 to $34,999 | 82 (4.9%) | 201 (14.1%) |
| $35,000 to $39,999 | 42 (2.5%) | 43 (3.0%) |
| $40,000 to $44,999 | 222 (13.3%) | 31 (2.2%) |
| $45,000 to $49,999 | 76 (4.6%) | 33 (2.3%) |
| $50,000 to $54,999 | 183 (11.0%) | 69 (4.8%) |
| $55,000 to $64,999 | 81 (4.9%) | 88 (6.1%) |
| $65,000 to $74,999 | 99 (5.9%) | 102 (7.1%) |
| $75,000 to $99,999 | 111 (6.7%) | 53 (3.7%) |
| $100,000+ | 134 (8.1%) | 35 (2.5%) |
| Total | 1,664 (100.0%) | 1,430 (100.0%) |
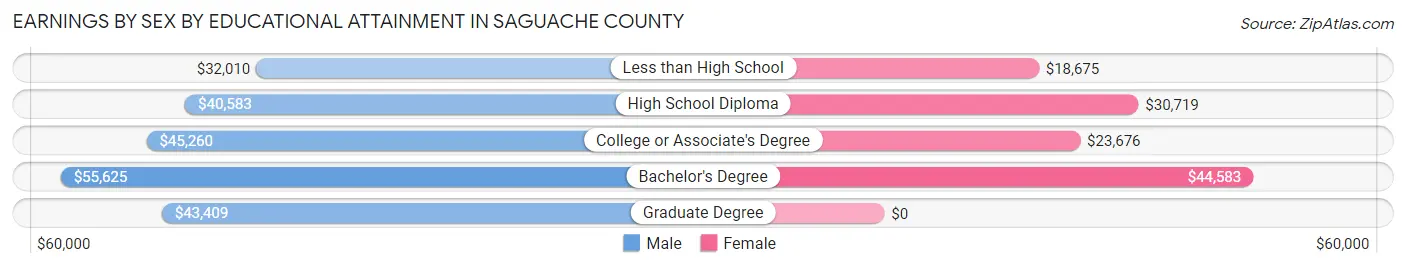
Earnings by Sex by Educational Attainment in Saguache County
Average earnings in Saguache County are $43,578 for men and $29,063 for women, a difference of 33.3%. Men with an educational attainment of bachelor's degree enjoy the highest average annual earnings of $55,625, while those with less than high school education earn the least with $32,010. Women with an educational attainment of bachelor's degree earn the most with the average annual earnings of $44,583, while those with less than high school education have the smallest earnings of $18,675.
| Educational Attainment | Male Income | Female Income |
| Less than High School | $32,010 | $18,675 |
| High School Diploma | $40,583 | $30,719 |
| College or Associate's Degree | $45,260 | $23,676 |
| Bachelor's Degree | $55,625 | $44,583 |
| Graduate Degree | $43,409 | $0 |
| Total | $43,578 | $29,063 |
Family Income in Saguache County
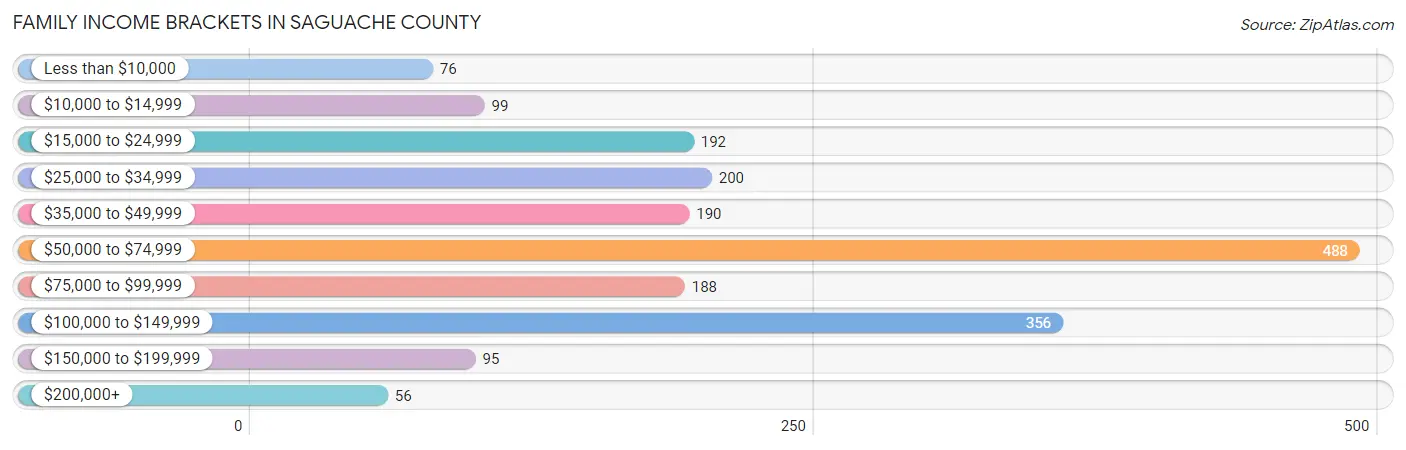
Family Income Brackets in Saguache County
According to the Saguache County family income data, there are 488 families falling into the $50,000 to $74,999 income range, which is the most common income bracket and makes up 25.2% of all families. Conversely, the $200,000+ income bracket is the least frequent group with only 56 families (2.9%) belonging to this category.
| Income Bracket | # Families | % Families |
| Less than $10,000 | 76 | 3.9% |
| $10,000 to $14,999 | 99 | 5.1% |
| $15,000 to $24,999 | 192 | 9.9% |
| $25,000 to $34,999 | 200 | 10.3% |
| $35,000 to $49,999 | 190 | 9.8% |
| $50,000 to $74,999 | 488 | 25.2% |
| $75,000 to $99,999 | 188 | 9.7% |
| $100,000 to $149,999 | 356 | 18.4% |
| $150,000 to $199,999 | 95 | 4.9% |
| $200,000+ | 56 | 2.9% |
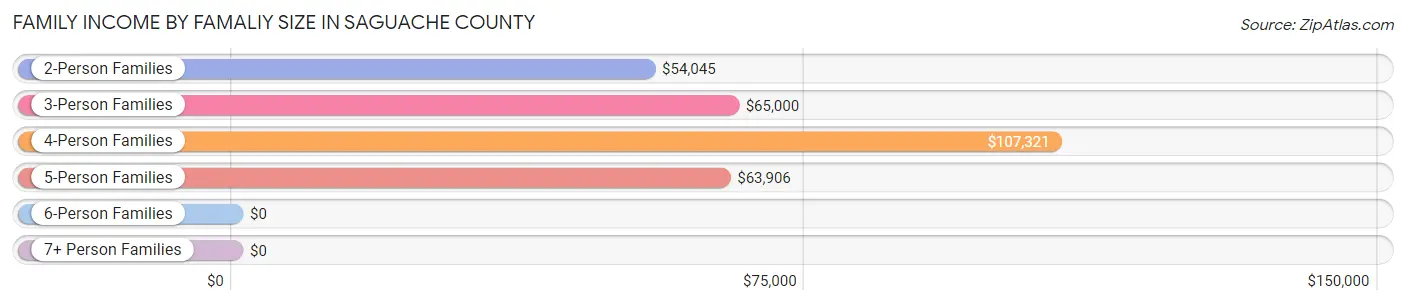
Family Income by Famaliy Size in Saguache County
4-person families (209 | 10.8%) account for the highest median family income in Saguache County with $107,321 per family, while 2-person families (1,071 | 55.3%) have the highest median income of $27,022 per family member.
| Income Bracket | # Families | Median Income |
| 2-Person Families | 1,071 (55.3%) | $54,045 |
| 3-Person Families | 508 (26.2%) | $65,000 |
| 4-Person Families | 209 (10.8%) | $107,321 |
| 5-Person Families | 101 (5.2%) | $63,906 |
| 6-Person Families | 48 (2.5%) | $0 |
| 7+ Person Families | 0 (0.0%) | $0 |
| Total | 1,937 (100.0%) | $58,552 |
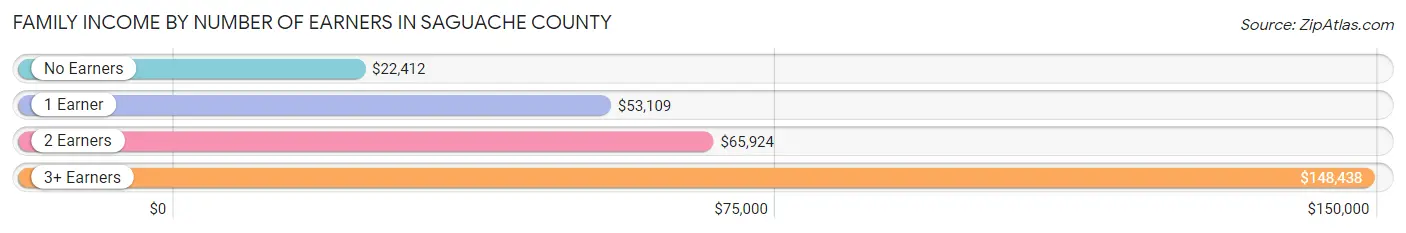
Family Income by Number of Earners in Saguache County
The median family income in Saguache County is $58,552, with families comprising 3+ earners (134) having the highest median family income of $148,438, while families with no earners (494) have the lowest median family income of $22,412, accounting for 6.9% and 25.5% of families, respectively.
| Number of Earners | # Families | Median Income |
| No Earners | 494 (25.5%) | $22,412 |
| 1 Earner | 523 (27.0%) | $53,109 |
| 2 Earners | 786 (40.6%) | $65,924 |
| 3+ Earners | 134 (6.9%) | $148,438 |
| Total | 1,937 (100.0%) | $58,552 |
Household Income in Saguache County
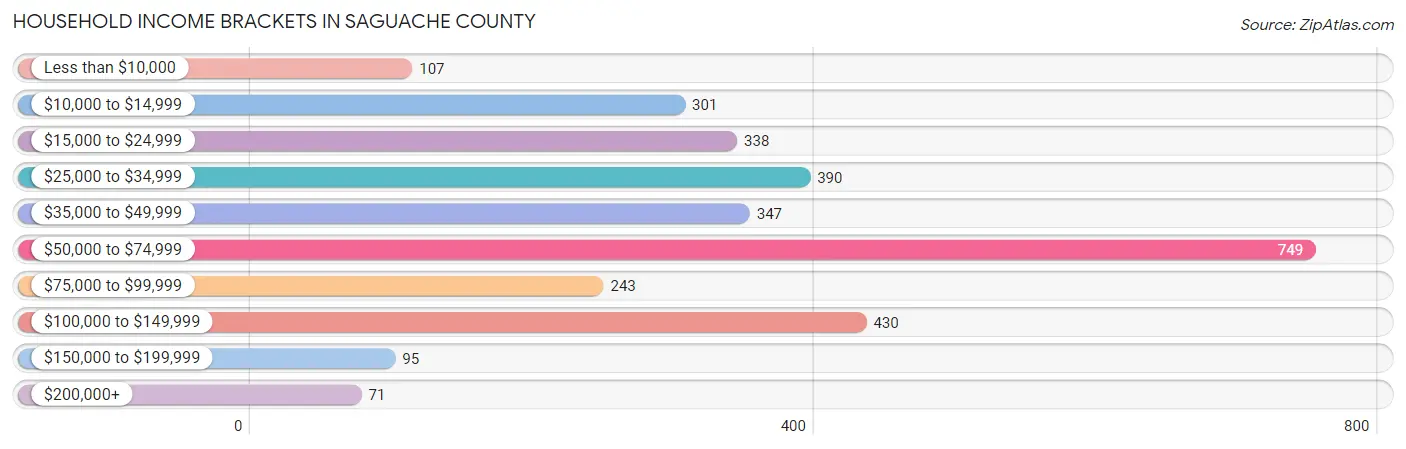
Household Income Brackets in Saguache County
With 749 households falling in the category, the $50,000 to $74,999 income range is the most frequent in Saguache County, accounting for 24.4% of all households. In contrast, only 71 households (2.3%) fall into the $200,000+ income bracket, making it the least populous group.
| Income Bracket | # Households | % Households |
| Less than $10,000 | 107 | 3.5% |
| $10,000 to $14,999 | 301 | 9.8% |
| $15,000 to $24,999 | 338 | 11.0% |
| $25,000 to $34,999 | 390 | 12.7% |
| $35,000 to $49,999 | 347 | 11.3% |
| $50,000 to $74,999 | 749 | 24.4% |
| $75,000 to $99,999 | 243 | 7.9% |
| $100,000 to $149,999 | 430 | 14.0% |
| $150,000 to $199,999 | 95 | 3.1% |
| $200,000+ | 71 | 2.3% |
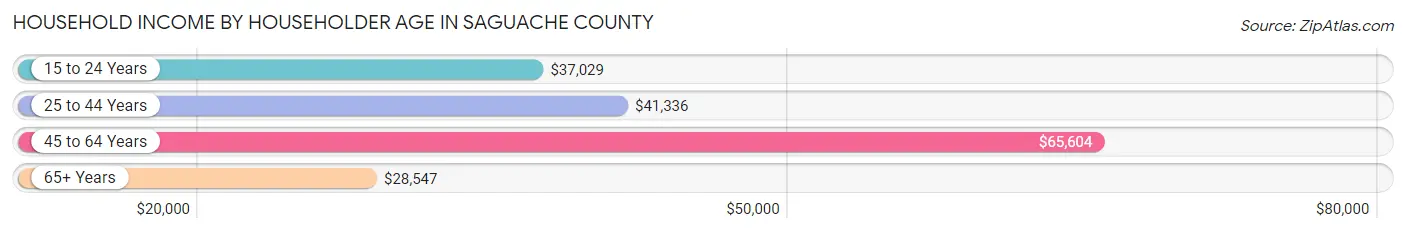
Household Income by Householder Age in Saguache County
The median household income in Saguache County is $51,946, with the highest median household income of $65,604 found in the 45 to 64 years age bracket for the primary householder. A total of 1,238 households (40.3%) fall into this category. Meanwhile, the 65+ years age bracket for the primary householder has the lowest median household income of $28,547, with 1,057 households (34.4%) in this group.
| Income Bracket | # Households | Median Income |
| 15 to 24 Years | 132 (4.3%) | $37,029 |
| 25 to 44 Years | 644 (21.0%) | $41,336 |
| 45 to 64 Years | 1,238 (40.3%) | $65,604 |
| 65+ Years | 1,057 (34.4%) | $28,547 |
| Total | 3,071 (100.0%) | $51,946 |
Poverty in Saguache County
Income Below Poverty by Sex and Age in Saguache County
With 15.8% poverty level for males and 19.3% for females among the residents of Saguache County, 15 year old males and 18 to 24 year old females are the most vulnerable to poverty, with 8 males (100.0%) and 64 females (41.0%) in their respective age groups living below the poverty level.
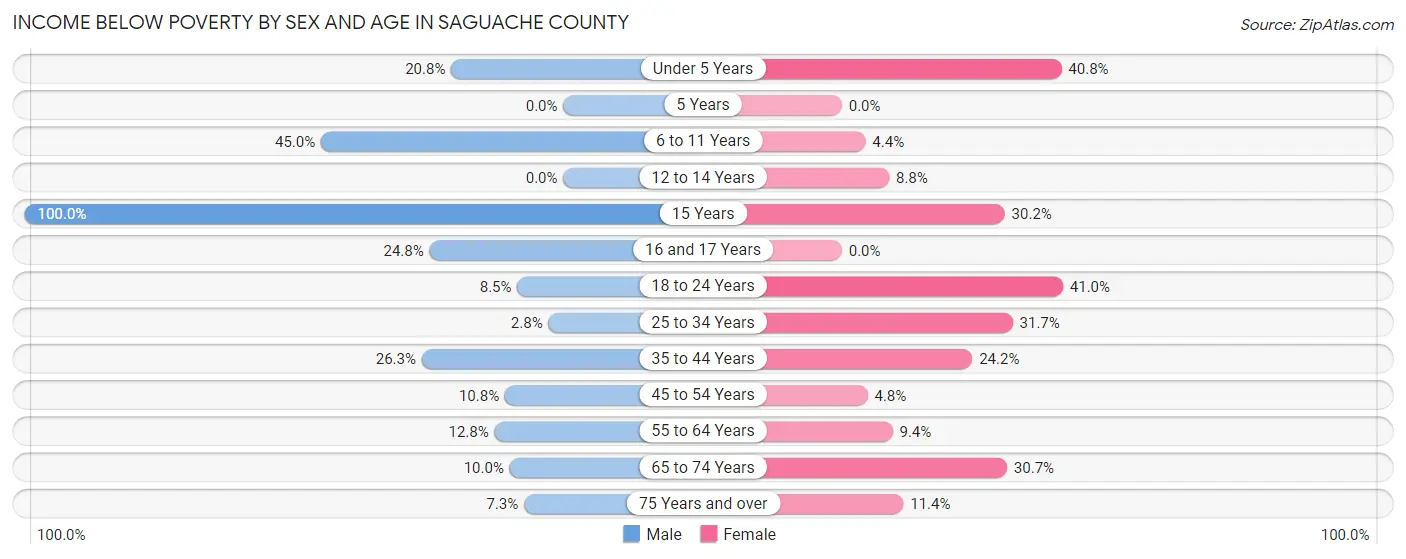
| Age Bracket | Male | Female |
| Under 5 Years | 31 (20.8%) | 64 (40.8%) |
| 5 Years | 0 (0.0%) | 0 (0.0%) |
| 6 to 11 Years | 103 (45.0%) | 7 (4.4%) |
| 12 to 14 Years | 0 (0.0%) | 10 (8.8%) |
| 15 Years | 8 (100.0%) | 13 (30.2%) |
| 16 and 17 Years | 36 (24.8%) | 0 (0.0%) |
| 18 to 24 Years | 14 (8.5%) | 64 (41.0%) |
| 25 to 34 Years | 6 (2.8%) | 110 (31.7%) |
| 35 to 44 Years | 129 (26.3%) | 69 (24.2%) |
| 45 to 54 Years | 38 (10.8%) | 17 (4.8%) |
| 55 to 64 Years | 65 (12.8%) | 62 (9.4%) |
| 65 to 74 Years | 64 (10.0%) | 171 (30.6%) |
| 75 Years and over | 17 (7.3%) | 25 (11.4%) |
| Total | 511 (15.8%) | 612 (19.3%) |
Income Above Poverty by Sex and Age in Saguache County
According to the poverty statistics in Saguache County, males aged 12 to 14 years and females aged 5 years are the age groups that are most secure financially, with 100.0% of males and 100.0% of females in these age groups living above the poverty line.
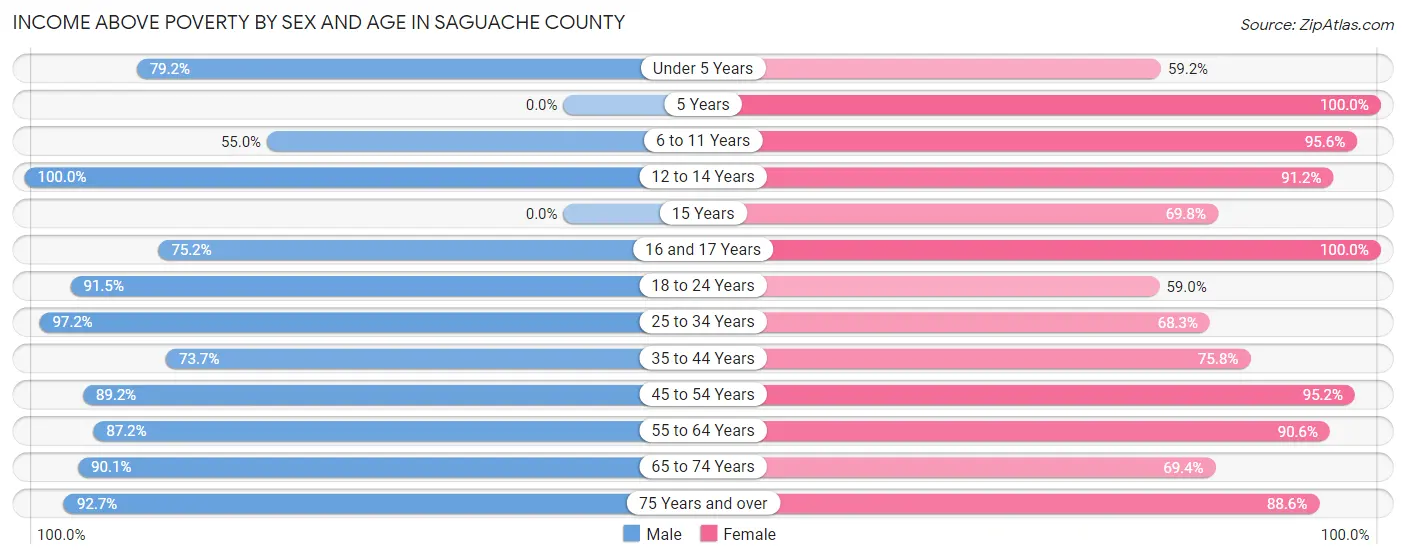
| Age Bracket | Male | Female |
| Under 5 Years | 118 (79.2%) | 93 (59.2%) |
| 5 Years | 0 (0.0%) | 56 (100.0%) |
| 6 to 11 Years | 126 (55.0%) | 153 (95.6%) |
| 12 to 14 Years | 102 (100.0%) | 104 (91.2%) |
| 15 Years | 0 (0.0%) | 30 (69.8%) |
| 16 and 17 Years | 109 (75.2%) | 69 (100.0%) |
| 18 to 24 Years | 150 (91.5%) | 92 (59.0%) |
| 25 to 34 Years | 211 (97.2%) | 237 (68.3%) |
| 35 to 44 Years | 362 (73.7%) | 216 (75.8%) |
| 45 to 54 Years | 313 (89.2%) | 339 (95.2%) |
| 55 to 64 Years | 444 (87.2%) | 596 (90.6%) |
| 65 to 74 Years | 579 (90.0%) | 387 (69.4%) |
| 75 Years and over | 216 (92.7%) | 194 (88.6%) |
| Total | 2,730 (84.2%) | 2,566 (80.7%) |
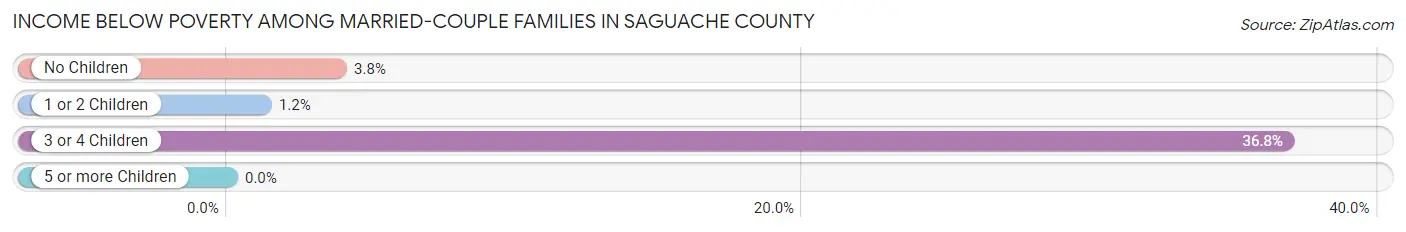
Income Below Poverty Among Married-Couple Families in Saguache County
The poverty statistics for married-couple families in Saguache County show that 5.3% or 76 of the total 1,431 families live below the poverty line. Families with 3 or 4 children have the highest poverty rate of 36.8%, comprising of 39 families. On the other hand, families with 1 or 2 children have the lowest poverty rate of 1.2%, which includes 6 families.
| Children | Above Poverty | Below Poverty |
| No Children | 785 (96.2%) | 31 (3.8%) |
| 1 or 2 Children | 503 (98.8%) | 6 (1.2%) |
| 3 or 4 Children | 67 (63.2%) | 39 (36.8%) |
| 5 or more Children | 0 (0.0%) | 0 (0.0%) |
| Total | 1,355 (94.7%) | 76 (5.3%) |
Income Below Poverty Among Single-Parent Households in Saguache County
According to the poverty data in Saguache County, 39.1% or 72 single-father households and 42.9% or 138 single-mother households are living below the poverty line. Among single-father households, those with no children have the highest poverty rate, with 53 households (53.0%) experiencing poverty. Likewise, among single-mother households, those with 1 or 2 children have the highest poverty rate, with 131 households (63.0%) falling below the poverty line.

| Children | Single Father | Single Mother |
| No Children | 53 (53.0%) | 7 (6.4%) |
| 1 or 2 Children | 19 (22.6%) | 131 (63.0%) |
| 3 or 4 Children | 0 (0.0%) | 0 (0.0%) |
| 5 or more Children | 0 (0.0%) | 0 (0.0%) |
| Total | 72 (39.1%) | 138 (42.9%) |
Income Below Poverty Among Married-Couple vs Single-Parent Households in Saguache County
The poverty data for Saguache County shows that 76 of the married-couple family households (5.3%) and 210 of the single-parent households (41.5%) are living below the poverty level. Within the married-couple family households, those with 3 or 4 children have the highest poverty rate, with 39 households (36.8%) falling below the poverty line. Among the single-parent households, those with 1 or 2 children have the highest poverty rate, with 150 household (51.4%) living below poverty.

| Children | Married-Couple Families | Single-Parent Households |
| No Children | 31 (3.8%) | 60 (28.6%) |
| 1 or 2 Children | 6 (1.2%) | 150 (51.4%) |
| 3 or 4 Children | 39 (36.8%) | 0 (0.0%) |
| 5 or more Children | 0 (0.0%) | 0 (0.0%) |
| Total | 76 (5.3%) | 210 (41.5%) |
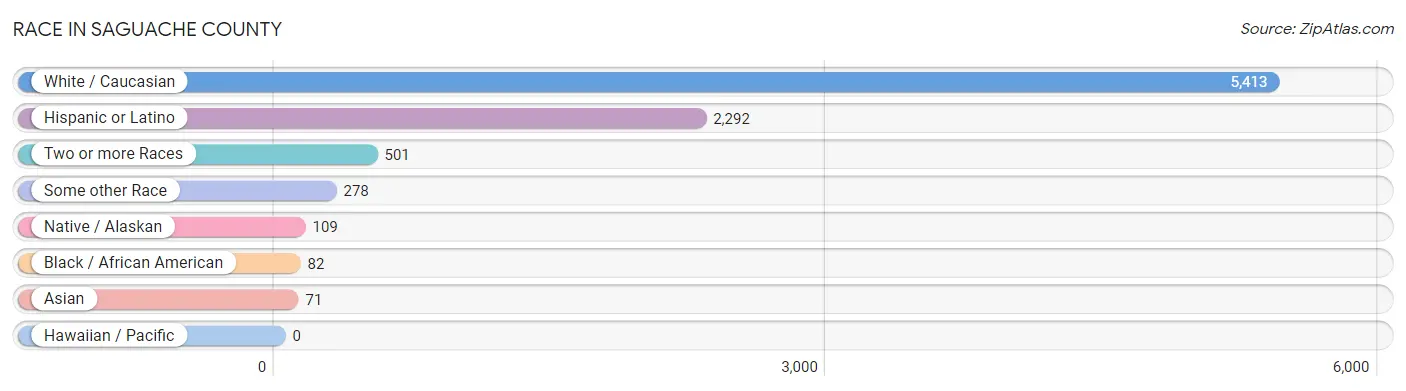
Race in Saguache County
The most populous races in Saguache County are White / Caucasian (5,413 | 83.9%), Hispanic or Latino (2,292 | 35.5%), and Two or more Races (501 | 7.8%).
| Race | # Population | % Population |
| Asian | 71 | 1.1% |
| Black / African American | 82 | 1.3% |
| Hawaiian / Pacific | 0 | 0.0% |
| Hispanic or Latino | 2,292 | 35.5% |
| Native / Alaskan | 109 | 1.7% |
| White / Caucasian | 5,413 | 83.9% |
| Two or more Races | 501 | 7.8% |
| Some other Race | 278 | 4.3% |
| Total | 6,454 | 100.0% |
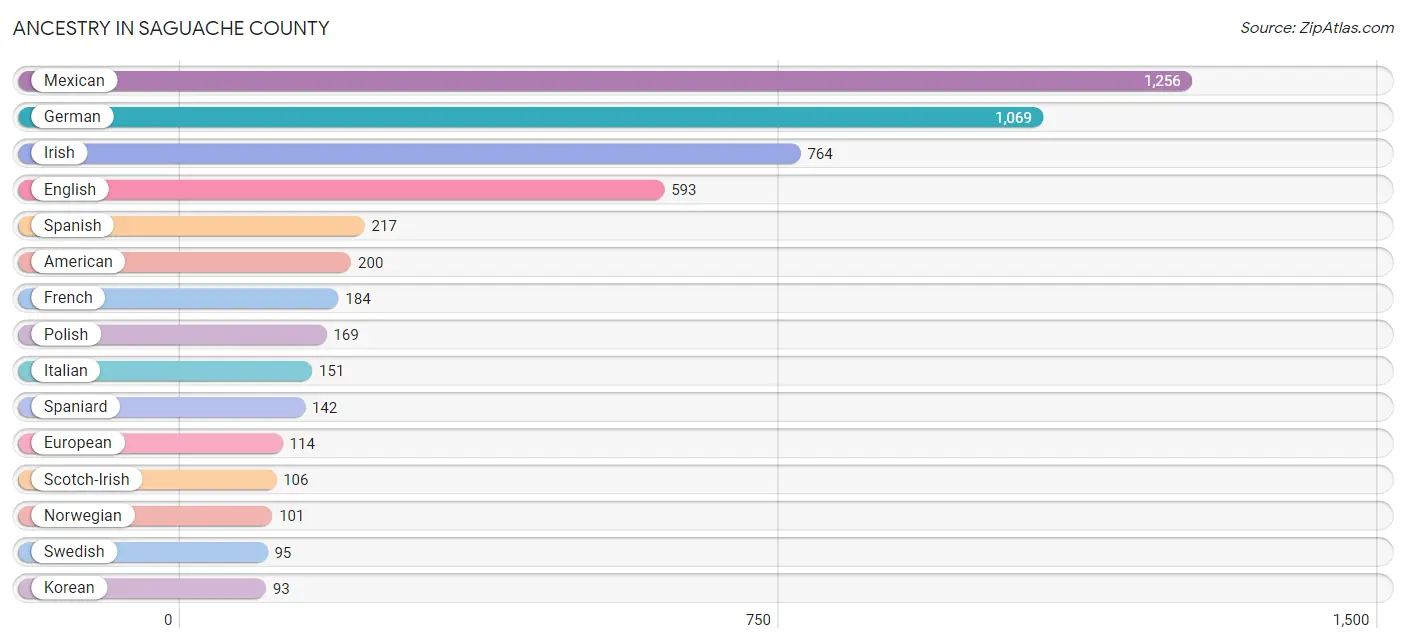
Ancestry in Saguache County
The most populous ancestries reported in Saguache County are Mexican (1,256 | 19.5%), German (1,069 | 16.6%), Irish (764 | 11.8%), English (593 | 9.2%), and Spanish (217 | 3.4%), together accounting for 60.4% of all Saguache County residents.
| Ancestry | # Population | % Population |
| American | 200 | 3.1% |
| Apache | 62 | 1.0% |
| Arab | 38 | 0.6% |
| Belgian | 34 | 0.5% |
| Blackfeet | 14 | 0.2% |
| Canadian | 21 | 0.3% |
| Central American | 26 | 0.4% |
| Cherokee | 33 | 0.5% |
| Chippewa | 2 | 0.0% |
| Cree | 6 | 0.1% |
| Danish | 63 | 1.0% |
| Dutch | 50 | 0.8% |
| English | 593 | 9.2% |
| European | 114 | 1.8% |
| Finnish | 35 | 0.5% |
| French | 184 | 2.9% |
| French Canadian | 26 | 0.4% |
| German | 1,069 | 16.6% |
| Guatemalan | 26 | 0.4% |
| Hungarian | 15 | 0.2% |
| Irish | 764 | 11.8% |
| Italian | 151 | 2.3% |
| Korean | 93 | 1.4% |
| Lebanese | 38 | 0.6% |
| Lithuanian | 1 | 0.0% |
| Mexican | 1,256 | 19.5% |
| Native Hawaiian | 26 | 0.4% |
| Navajo | 70 | 1.1% |
| Northern European | 6 | 0.1% |
| Norwegian | 101 | 1.6% |
| Osage | 8 | 0.1% |
| Pennsylvania German | 13 | 0.2% |
| Polish | 169 | 2.6% |
| Russian | 20 | 0.3% |
| Scandinavian | 30 | 0.5% |
| Scotch-Irish | 106 | 1.6% |
| Scottish | 31 | 0.5% |
| Slovak | 19 | 0.3% |
| Slovene | 7 | 0.1% |
| Spaniard | 142 | 2.2% |
| Spanish | 217 | 3.4% |
| Spanish American | 10 | 0.2% |
| Swedish | 95 | 1.5% |
| Swiss | 34 | 0.5% |
| Ukrainian | 25 | 0.4% |
| Welsh | 28 | 0.4% | View All 46 Rows |
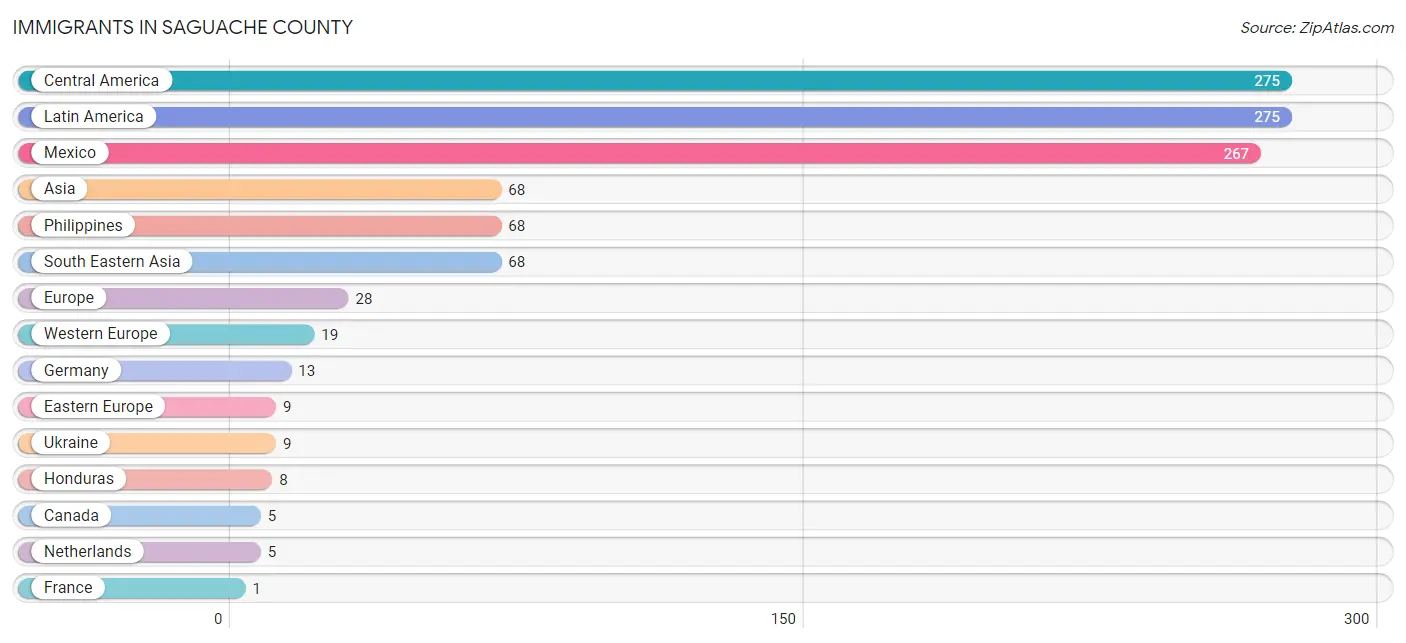
Immigrants in Saguache County
The most numerous immigrant groups reported in Saguache County came from Central America (275 | 4.3%), Latin America (275 | 4.3%), Mexico (267 | 4.1%), Asia (68 | 1.1%), and Philippines (68 | 1.1%), together accounting for 14.8% of all Saguache County residents.
| Immigration Origin | # Population | % Population |
| Asia | 68 | 1.1% |
| Canada | 5 | 0.1% |
| Central America | 275 | 4.3% |
| Eastern Europe | 9 | 0.1% |
| Europe | 28 | 0.4% |
| France | 1 | 0.0% |
| Germany | 13 | 0.2% |
| Honduras | 8 | 0.1% |
| Latin America | 275 | 4.3% |
| Mexico | 267 | 4.1% |
| Netherlands | 5 | 0.1% |
| Philippines | 68 | 1.1% |
| South Eastern Asia | 68 | 1.1% |
| Ukraine | 9 | 0.1% |
| Western Europe | 19 | 0.3% | View All 15 Rows |
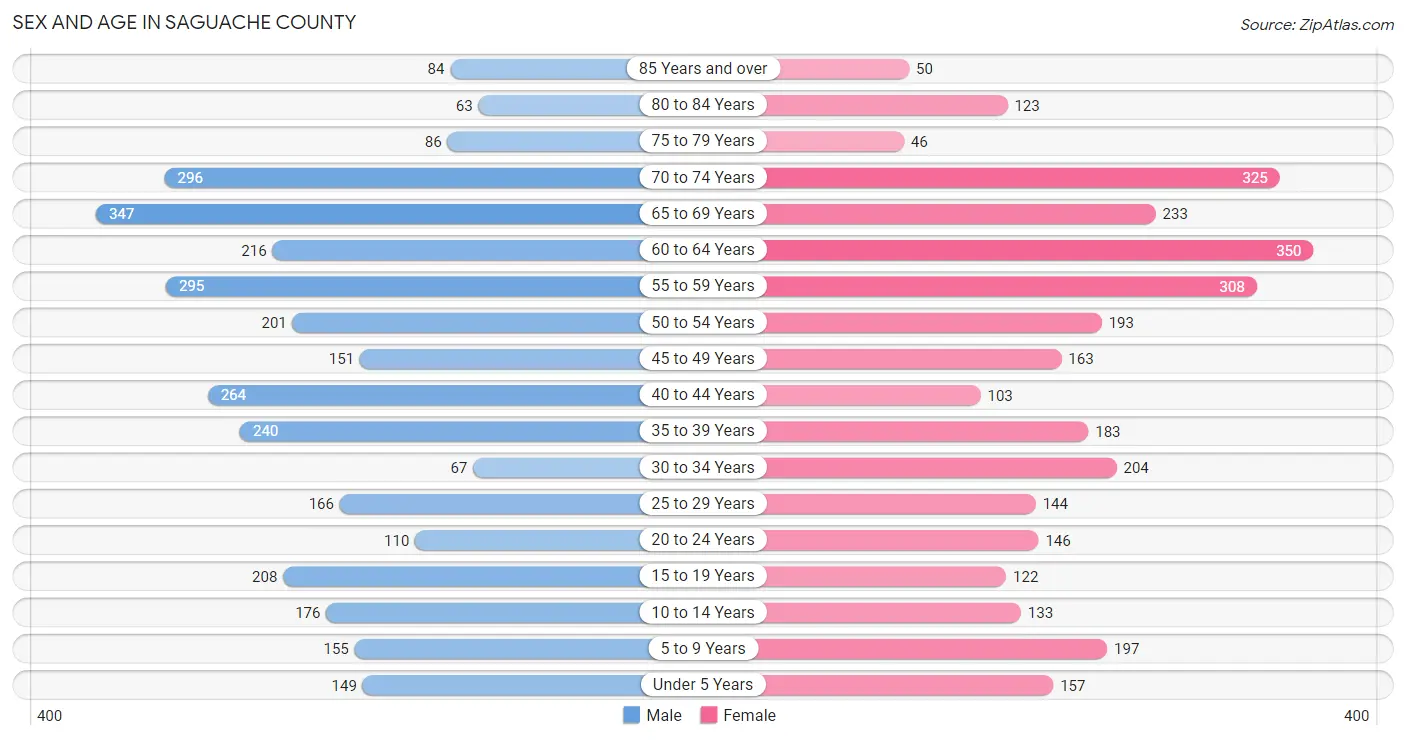
Sex and Age in Saguache County
Sex and Age in Saguache County
The most populous age groups in Saguache County are 65 to 69 Years (347 | 10.6%) for men and 60 to 64 Years (350 | 11.0%) for women.
| Age Bracket | Male | Female |
| Under 5 Years | 149 (4.5%) | 157 (4.9%) |
| 5 to 9 Years | 155 (4.7%) | 197 (6.2%) |
| 10 to 14 Years | 176 (5.4%) | 133 (4.2%) |
| 15 to 19 Years | 208 (6.4%) | 122 (3.8%) |
| 20 to 24 Years | 110 (3.4%) | 146 (4.6%) |
| 25 to 29 Years | 166 (5.1%) | 144 (4.5%) |
| 30 to 34 Years | 67 (2.1%) | 204 (6.4%) |
| 35 to 39 Years | 240 (7.3%) | 183 (5.8%) |
| 40 to 44 Years | 264 (8.1%) | 103 (3.2%) |
| 45 to 49 Years | 151 (4.6%) | 163 (5.1%) |
| 50 to 54 Years | 201 (6.1%) | 193 (6.1%) |
| 55 to 59 Years | 295 (9.0%) | 308 (9.7%) |
| 60 to 64 Years | 216 (6.6%) | 350 (11.0%) |
| 65 to 69 Years | 347 (10.6%) | 233 (7.3%) |
| 70 to 74 Years | 296 (9.0%) | 325 (10.2%) |
| 75 to 79 Years | 86 (2.6%) | 46 (1.5%) |
| 80 to 84 Years | 63 (1.9%) | 123 (3.9%) |
| 85 Years and over | 84 (2.6%) | 50 (1.6%) |
| Total | 3,274 (100.0%) | 3,180 (100.0%) |
Families and Households in Saguache County
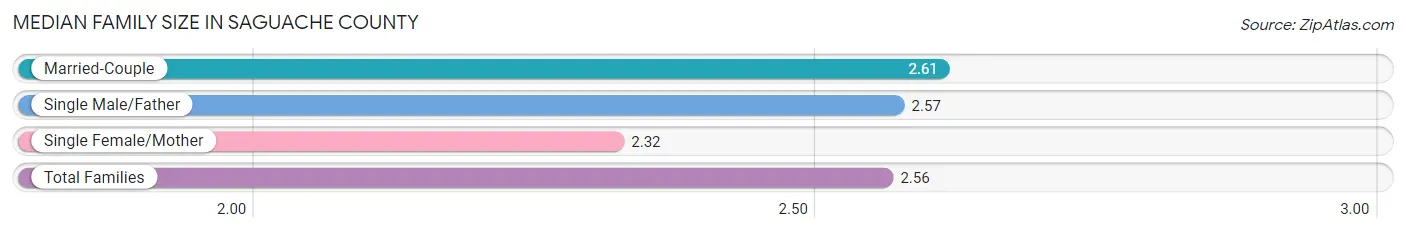
Median Family Size in Saguache County
The median family size in Saguache County is 2.56 persons per family, with married-couple families (1,431 | 73.9%) accounting for the largest median family size of 2.61 persons per family. On the other hand, single female/mother families (322 | 16.6%) represent the smallest median family size with 2.32 persons per family.
| Family Type | # Families | Family Size |
| Married-Couple | 1,431 (73.9%) | 2.61 |
| Single Male/Father | 184 (9.5%) | 2.57 |
| Single Female/Mother | 322 (16.6%) | 2.32 |
| Total Families | 1,937 (100.0%) | 2.56 |
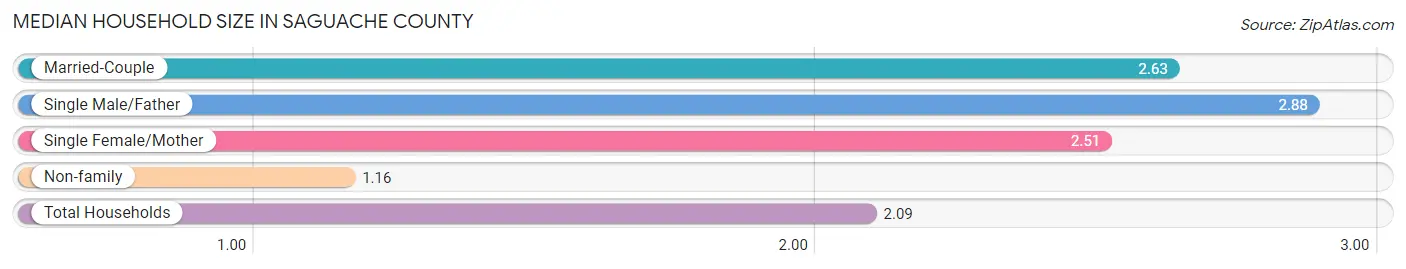
Median Household Size in Saguache County
The median household size in Saguache County is 2.09 persons per household, with single male/father households (184 | 6.0%) accounting for the largest median household size of 2.88 persons per household. non-family households (1,134 | 36.9%) represent the smallest median household size with 1.16 persons per household.
| Household Type | # Households | Household Size |
| Married-Couple | 1,431 (46.6%) | 2.63 |
| Single Male/Father | 184 (6.0%) | 2.88 |
| Single Female/Mother | 322 (10.5%) | 2.51 |
| Non-family | 1,134 (36.9%) | 1.16 |
| Total Households | 3,071 (100.0%) | 2.09 |
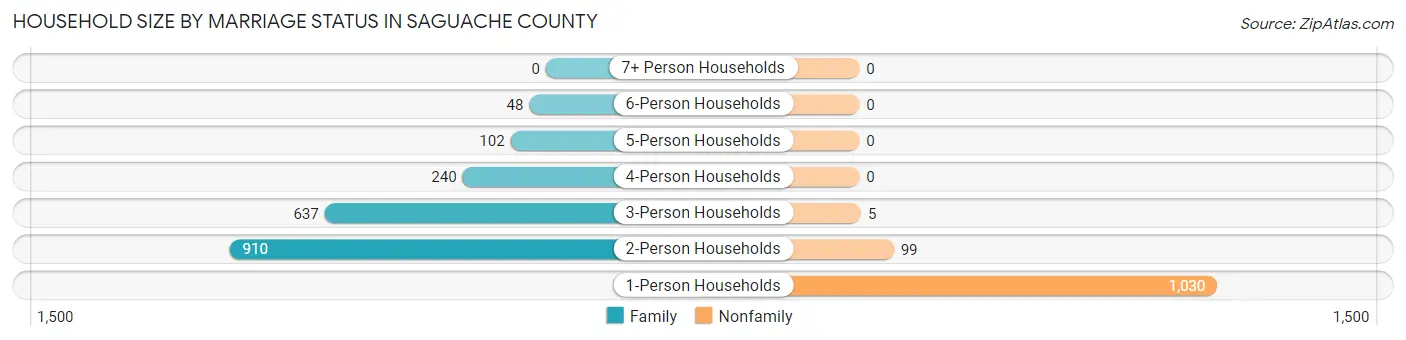
Household Size by Marriage Status in Saguache County
Out of a total of 3,071 households in Saguache County, 1,937 (63.1%) are family households, while 1,134 (36.9%) are nonfamily households. The most numerous type of family households are 2-person households, comprising 910, and the most common type of nonfamily households are 1-person households, comprising 1,030.
| Household Size | Family Households | Nonfamily Households |
| 1-Person Households | - | 1,030 (33.5%) |
| 2-Person Households | 910 (29.6%) | 99 (3.2%) |
| 3-Person Households | 637 (20.7%) | 5 (0.2%) |
| 4-Person Households | 240 (7.8%) | 0 (0.0%) |
| 5-Person Households | 102 (3.3%) | 0 (0.0%) |
| 6-Person Households | 48 (1.6%) | 0 (0.0%) |
| 7+ Person Households | 0 (0.0%) | 0 (0.0%) |
| Total | 1,937 (63.1%) | 1,134 (36.9%) |
Female Fertility in Saguache County
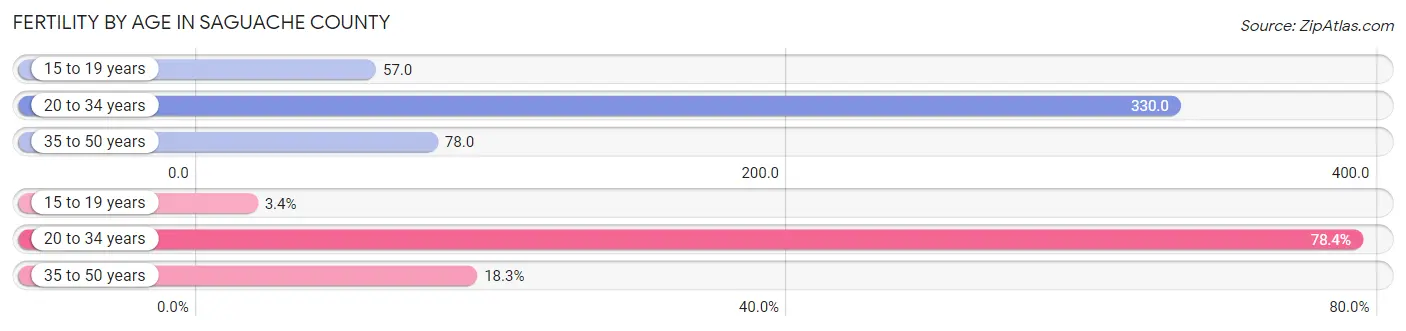
Fertility by Age in Saguache County
Average fertility rate in Saguache County is 188.0 births per 1,000 women. Women in the age bracket of 20 to 34 years have the highest fertility rate with 330.0 births per 1,000 women. Women in the age bracket of 20 to 34 years acount for 78.4% of all women with births.
| Age Bracket | Women with Births | Births / 1,000 Women |
| 15 to 19 years | 7 (3.4%) | 57.0 |
| 20 to 34 years | 163 (78.4%) | 330.0 |
| 35 to 50 years | 38 (18.3%) | 78.0 |
| Total | 208 (100.0%) | 188.0 |
Fertility by Age by Marriage Status in Saguache County
66.3% of women with births (208) in Saguache County are married. The highest percentage of unmarried women with births falls into 20 to 34 years age bracket with 42.9% of them unmarried at the time of birth, while the lowest percentage of unmarried women with births belong to 15 to 19 years age bracket with 0.0% of them unmarried.
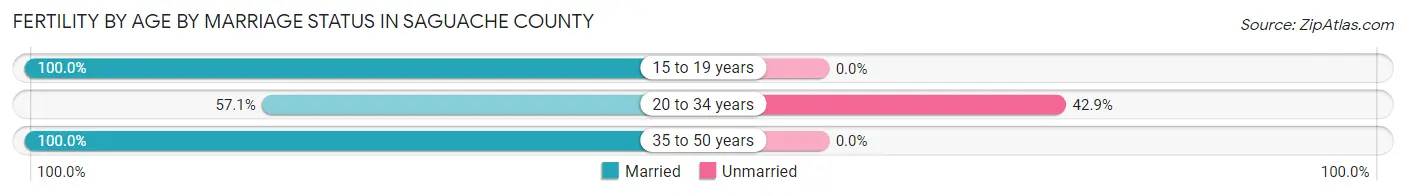
| Age Bracket | Married | Unmarried |
| 15 to 19 years | 7 (100.0%) | 0 (0.0%) |
| 20 to 34 years | 93 (57.1%) | 70 (42.9%) |
| 35 to 50 years | 38 (100.0%) | 0 (0.0%) |
| Total | 138 (66.3%) | 70 (33.7%) |
Fertility by Education in Saguache County
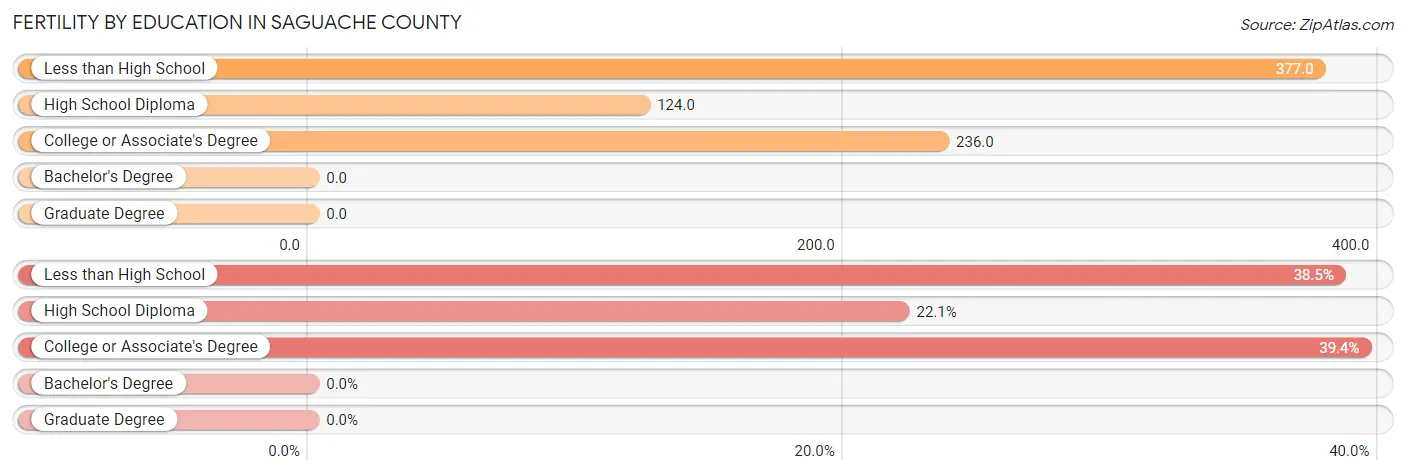
| Educational Attainment | Women with Births | Births / 1,000 Women |
| Less than High School | 80 (38.5%) | 377.0 |
| High School Diploma | 46 (22.1%) | 124.0 |
| College or Associate's Degree | 82 (39.4%) | 236.0 |
| Bachelor's Degree | 0 (0.0%) | 0.0 |
| Graduate Degree | 0 (0.0%) | 0.0 |
| Total | 208 (100.0%) | 188.0 |
Fertility by Education by Marriage Status in Saguache County
33.7% of women with births in Saguache County are unmarried. Women with the educational attainment of college or associate's degree are most likely to be married with 100.0% of them married at childbirth, while women with the educational attainment of less than high school are least likely to be married with 58.8% of them unmarried at childbirth.
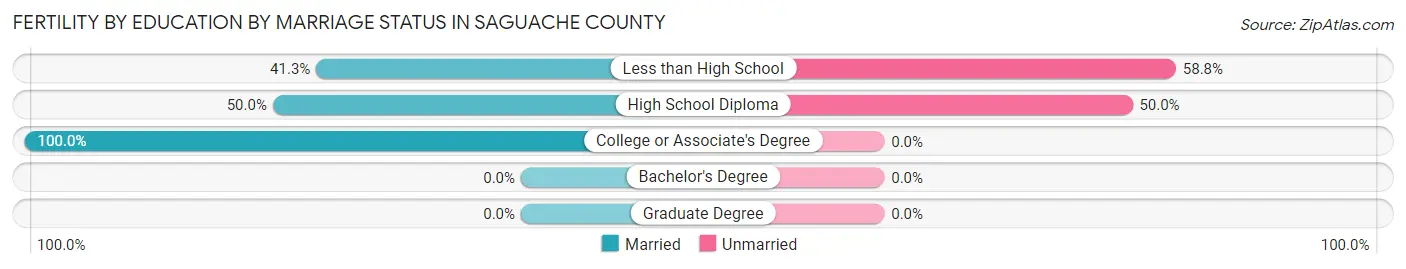
| Educational Attainment | Married | Unmarried |
| Less than High School | 33 (41.2%) | 47 (58.8%) |
| High School Diploma | 23 (50.0%) | 23 (50.0%) |
| College or Associate's Degree | 82 (100.0%) | 0 (0.0%) |
| Bachelor's Degree | 0 (0.0%) | 0 (0.0%) |
| Graduate Degree | 0 (0.0%) | 0 (0.0%) |
| Total | 138 (66.3%) | 70 (33.7%) |
Employment Characteristics in Saguache County
Employment by Class of Employer in Saguache County
Among the 2,660 employed individuals in Saguache County, private company employees (1,179 | 44.3%), local government employees (329 | 12.4%), and self-employed (not incorporated) (326 | 12.3%) make up the most common classes of employment.
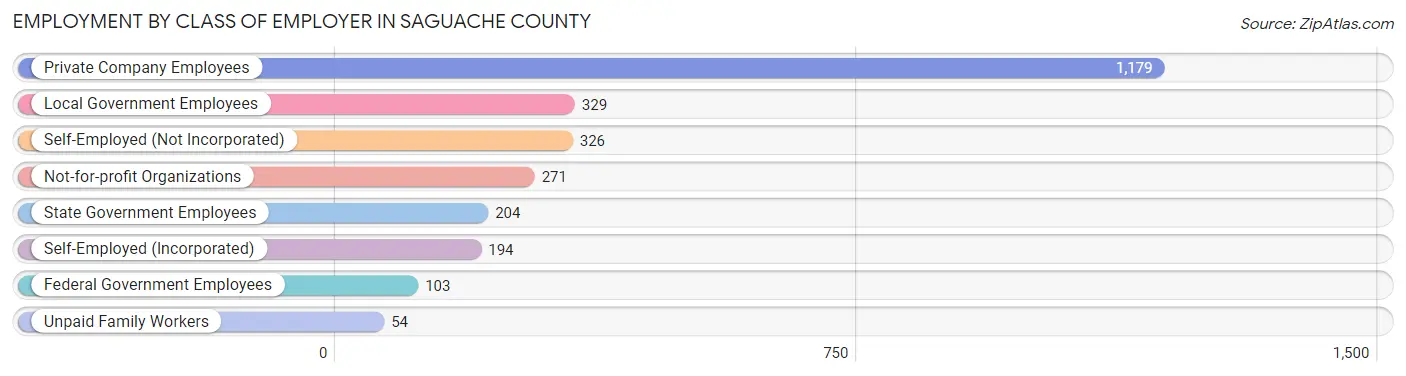
| Employer Class | # Employees | % Employees |
| Private Company Employees | 1,179 | 44.3% |
| Self-Employed (Incorporated) | 194 | 7.3% |
| Self-Employed (Not Incorporated) | 326 | 12.3% |
| Not-for-profit Organizations | 271 | 10.2% |
| Local Government Employees | 329 | 12.4% |
| State Government Employees | 204 | 7.7% |
| Federal Government Employees | 103 | 3.9% |
| Unpaid Family Workers | 54 | 2.0% |
| Total | 2,660 | 100.0% |
Employment Status by Age in Saguache County
According to the labor force statistics for Saguache County, out of the total population over 16 years of age (5,436), 55.1% or 2,995 individuals are in the labor force, with 10.0% or 300 of them unemployed. The age group with the highest labor force participation rate is 45 to 54 years, with 84.5% or 598 individuals in the labor force. Within the labor force, the 16 to 19 years age range has the highest percentage of unemployed individuals, with 36.5% or 38 of them being unemployed.
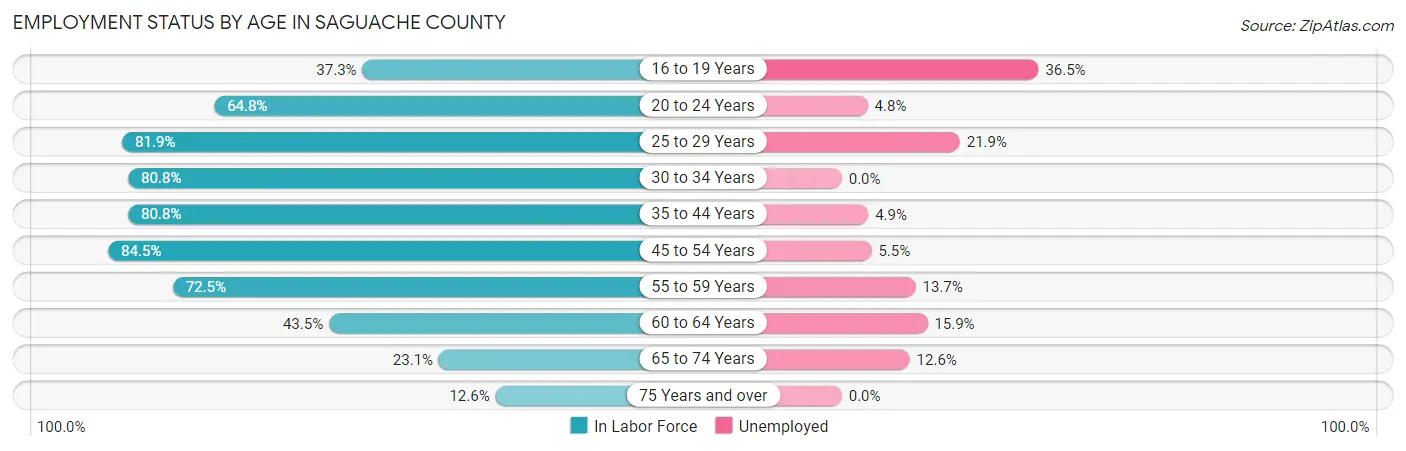
| Age Bracket | In Labor Force | Unemployed |
| 16 to 19 Years | 104 (37.3%) | 38 (36.5%) |
| 20 to 24 Years | 166 (64.8%) | 8 (4.8%) |
| 25 to 29 Years | 254 (81.9%) | 56 (21.9%) |
| 30 to 34 Years | 219 (80.8%) | 0 (0.0%) |
| 35 to 44 Years | 638 (80.8%) | 31 (4.9%) |
| 45 to 54 Years | 598 (84.5%) | 33 (5.5%) |
| 55 to 59 Years | 437 (72.5%) | 60 (13.7%) |
| 60 to 64 Years | 246 (43.5%) | 39 (15.9%) |
| 65 to 74 Years | 277 (23.1%) | 35 (12.6%) |
| 75 Years and over | 57 (12.6%) | 0 (0.0%) |
| Total | 2,995 (55.1%) | 300 (10.0%) |
Employment Status by Educational Attainment in Saguache County
According to labor force statistics for Saguache County, 73.6% of individuals (2,391) out of the total population between 25 and 64 years of age (3,248) are in the labor force, with 9.1% or 218 of them being unemployed. The group with the highest labor force participation rate are those with the educational attainment of bachelor's degree or higher, with 84.1% or 620 individuals in the labor force. Within the labor force, individuals with less than high school education have the highest percentage of unemployment, with 18.6% or 50 of them being unemployed.
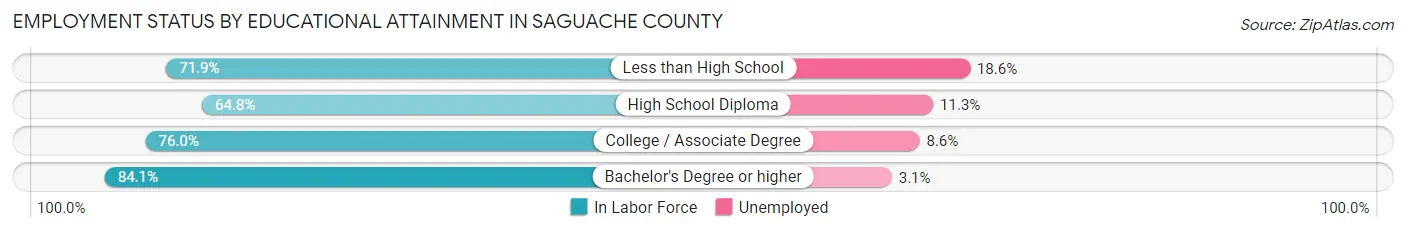
| Educational Attainment | In Labor Force | Unemployed |
| Less than High School | 269 (71.9%) | 70 (18.6%) |
| High School Diploma | 704 (64.8%) | 123 (11.3%) |
| College / Associate Degree | 799 (76.0%) | 90 (8.6%) |
| Bachelor's Degree or higher | 620 (84.1%) | 23 (3.1%) |
| Total | 2,391 (73.6%) | 296 (9.1%) |
Employment Occupations by Sex in Saguache County
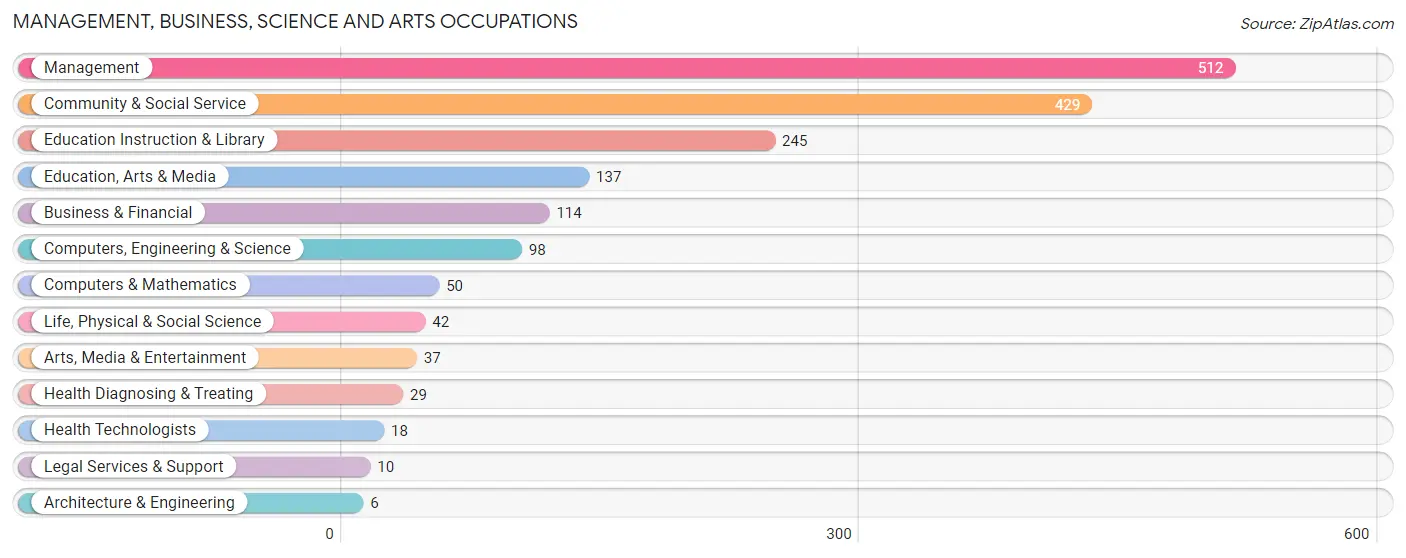
Management, Business, Science and Arts Occupations
The most common Management, Business, Science and Arts occupations in Saguache County are Management (512 | 19.0%), Community & Social Service (429 | 15.9%), Education Instruction & Library (245 | 9.1%), Education, Arts & Media (137 | 5.1%), and Business & Financial (114 | 4.2%).
Management, Business, Science and Arts Occupations by Sex
Within the Management, Business, Science and Arts occupations in Saguache County, the most male-oriented occupations are Arts, Media & Entertainment (100.0%), Business & Financial (67.5%), and Management (61.7%), while the most female-oriented occupations are Architecture & Engineering (100.0%), Legal Services & Support (100.0%), and Health Diagnosing & Treating (100.0%).
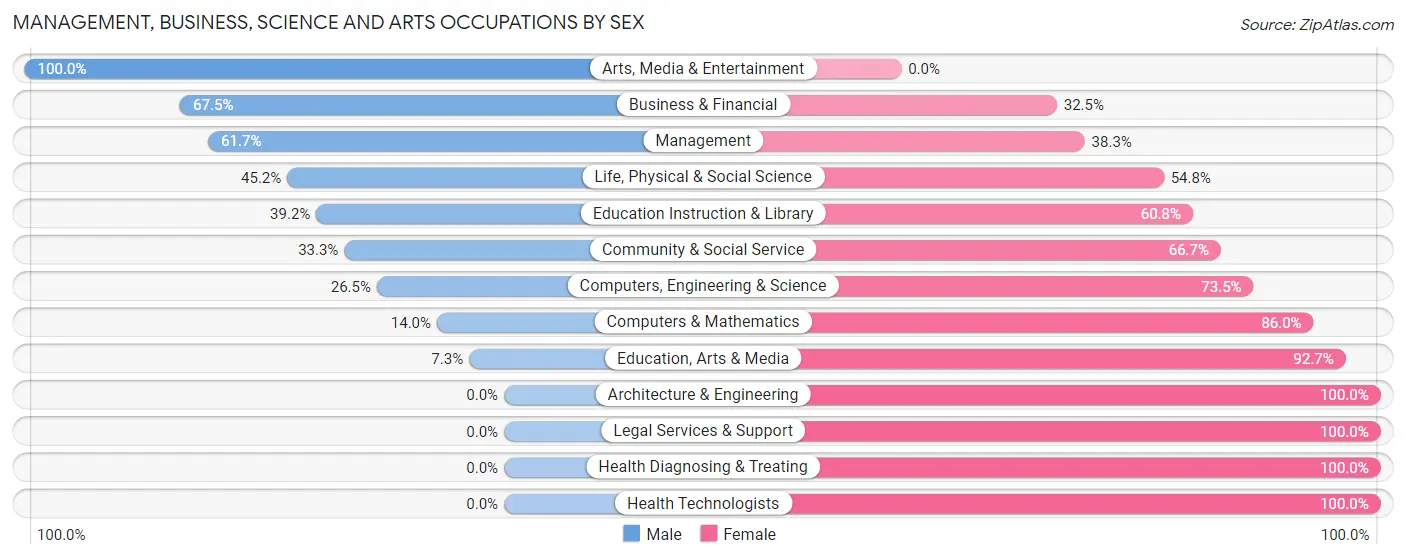
| Occupation | Male | Female |
| Management | 316 (61.7%) | 196 (38.3%) |
| Business & Financial | 77 (67.5%) | 37 (32.5%) |
| Computers, Engineering & Science | 26 (26.5%) | 72 (73.5%) |
| Computers & Mathematics | 7 (14.0%) | 43 (86.0%) |
| Architecture & Engineering | 0 (0.0%) | 6 (100.0%) |
| Life, Physical & Social Science | 19 (45.2%) | 23 (54.8%) |
| Community & Social Service | 143 (33.3%) | 286 (66.7%) |
| Education, Arts & Media | 10 (7.3%) | 127 (92.7%) |
| Legal Services & Support | 0 (0.0%) | 10 (100.0%) |
| Education Instruction & Library | 96 (39.2%) | 149 (60.8%) |
| Arts, Media & Entertainment | 37 (100.0%) | 0 (0.0%) |
| Health Diagnosing & Treating | 0 (0.0%) | 29 (100.0%) |
| Health Technologists | 0 (0.0%) | 18 (100.0%) |
| Total (Category) | 562 (47.5%) | 620 (52.4%) |
| Total (Overall) | 1,515 (56.3%) | 1,176 (43.7%) |
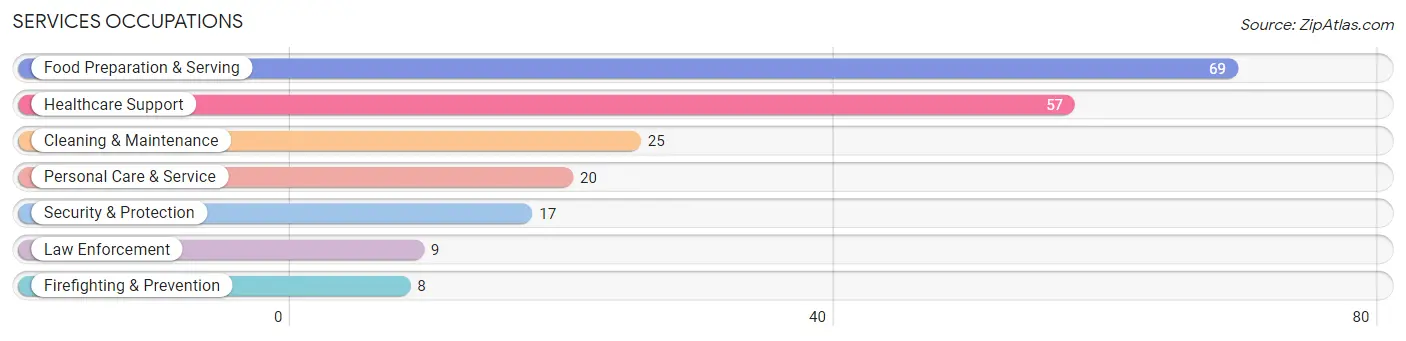
Services Occupations
The most common Services occupations in Saguache County are Food Preparation & Serving (69 | 2.6%), Healthcare Support (57 | 2.1%), Cleaning & Maintenance (25 | 0.9%), Personal Care & Service (20 | 0.7%), and Security & Protection (17 | 0.6%).
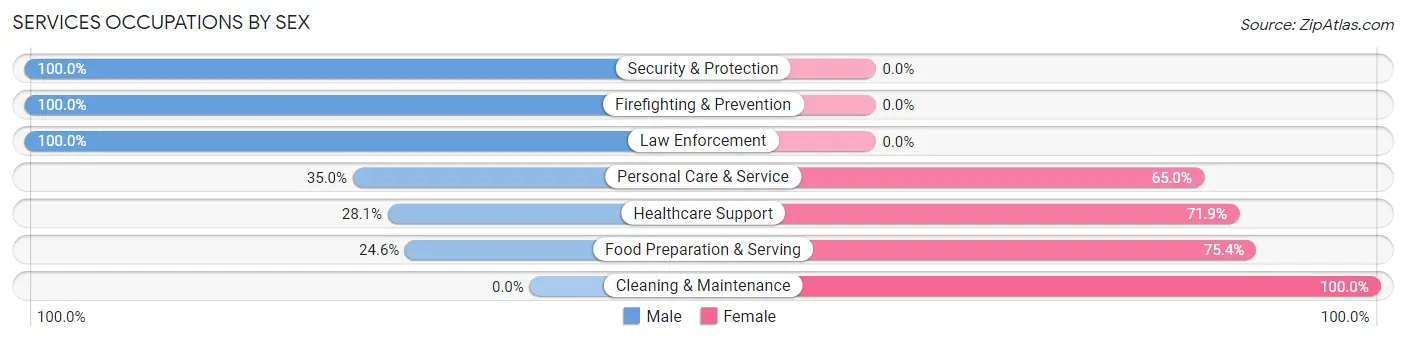
Services Occupations by Sex
Within the Services occupations in Saguache County, the most male-oriented occupations are Security & Protection (100.0%), Firefighting & Prevention (100.0%), and Law Enforcement (100.0%), while the most female-oriented occupations are Cleaning & Maintenance (100.0%), Food Preparation & Serving (75.4%), and Healthcare Support (71.9%).
| Occupation | Male | Female |
| Healthcare Support | 16 (28.1%) | 41 (71.9%) |
| Security & Protection | 17 (100.0%) | 0 (0.0%) |
| Firefighting & Prevention | 8 (100.0%) | 0 (0.0%) |
| Law Enforcement | 9 (100.0%) | 0 (0.0%) |
| Food Preparation & Serving | 17 (24.6%) | 52 (75.4%) |
| Cleaning & Maintenance | 0 (0.0%) | 25 (100.0%) |
| Personal Care & Service | 7 (35.0%) | 13 (65.0%) |
| Total (Category) | 57 (30.3%) | 131 (69.7%) |
| Total (Overall) | 1,515 (56.3%) | 1,176 (43.7%) |
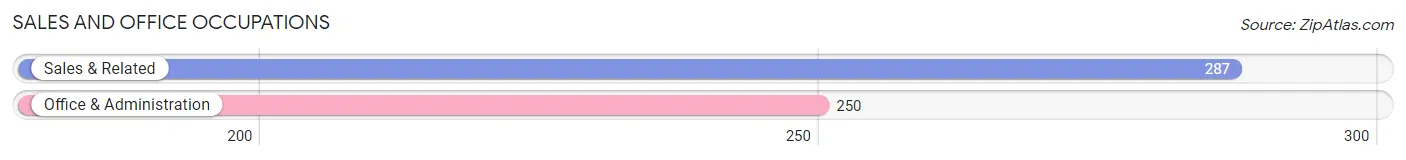
Sales and Office Occupations
The most common Sales and Office occupations in Saguache County are Sales & Related (287 | 10.7%), and Office & Administration (250 | 9.3%).
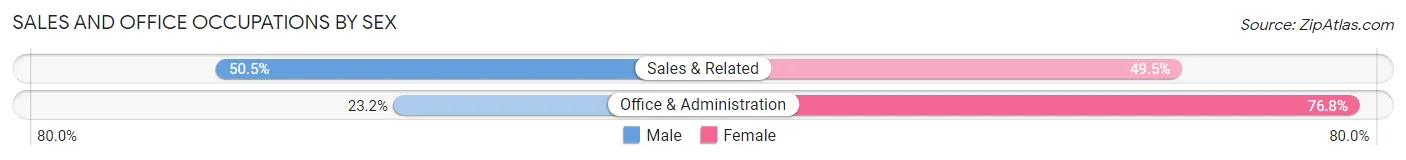
Sales and Office Occupations by Sex
| Occupation | Male | Female |
| Sales & Related | 145 (50.5%) | 142 (49.5%) |
| Office & Administration | 58 (23.2%) | 192 (76.8%) |
| Total (Category) | 203 (37.8%) | 334 (62.2%) |
| Total (Overall) | 1,515 (56.3%) | 1,176 (43.7%) |
Natural Resources, Construction and Maintenance Occupations
The most common Natural Resources, Construction and Maintenance occupations in Saguache County are Farming, Fishing & Forestry (215 | 8.0%), Construction & Extraction (205 | 7.6%), and Installation, Maintenance & Repair (115 | 4.3%).
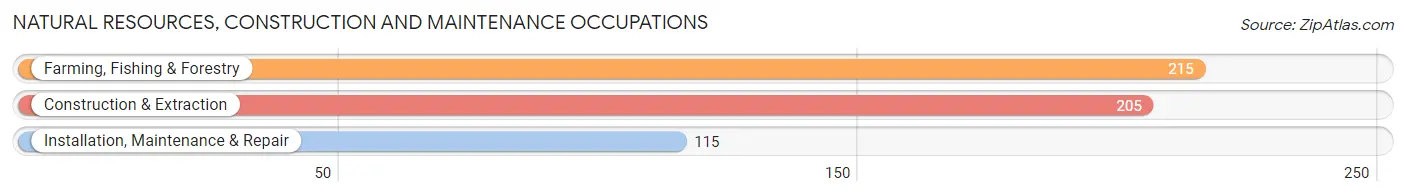
Natural Resources, Construction and Maintenance Occupations by Sex

| Occupation | Male | Female |
| Farming, Fishing & Forestry | 178 (82.8%) | 37 (17.2%) |
| Construction & Extraction | 182 (88.8%) | 23 (11.2%) |
| Installation, Maintenance & Repair | 107 (93.0%) | 8 (7.0%) |
| Total (Category) | 467 (87.3%) | 68 (12.7%) |
| Total (Overall) | 1,515 (56.3%) | 1,176 (43.7%) |
Production, Transportation and Moving Occupations
The most common Production, Transportation and Moving occupations in Saguache County are Production (138 | 5.1%), Material Moving (63 | 2.3%), and Transportation (48 | 1.8%).
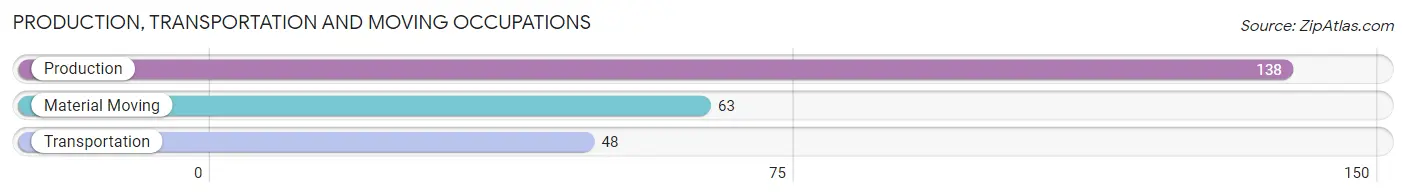
Production, Transportation and Moving Occupations by Sex
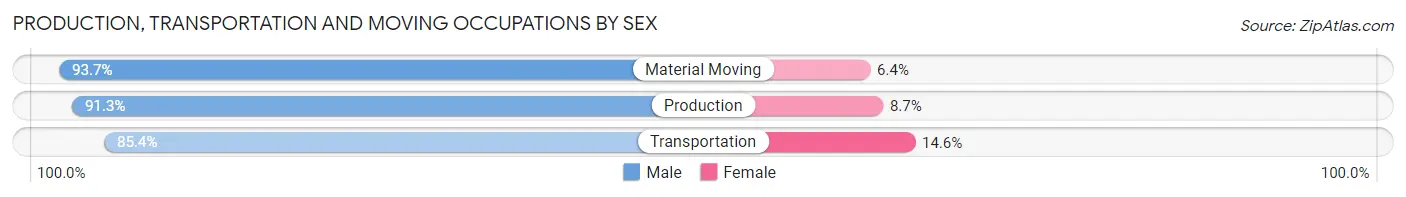
| Occupation | Male | Female |
| Production | 126 (91.3%) | 12 (8.7%) |
| Transportation | 41 (85.4%) | 7 (14.6%) |
| Material Moving | 59 (93.6%) | 4 (6.4%) |
| Total (Category) | 226 (90.8%) | 23 (9.2%) |
| Total (Overall) | 1,515 (56.3%) | 1,176 (43.7%) |
Employment Industries by Sex in Saguache County
Employment Industries in Saguache County
The major employment industries in Saguache County include Agriculture, Fishing & Hunting (502 | 18.6%), Retail Trade (332 | 12.3%), Health Care & Social Assistance (328 | 12.2%), Educational Services (273 | 10.1%), and Construction (258 | 9.6%).
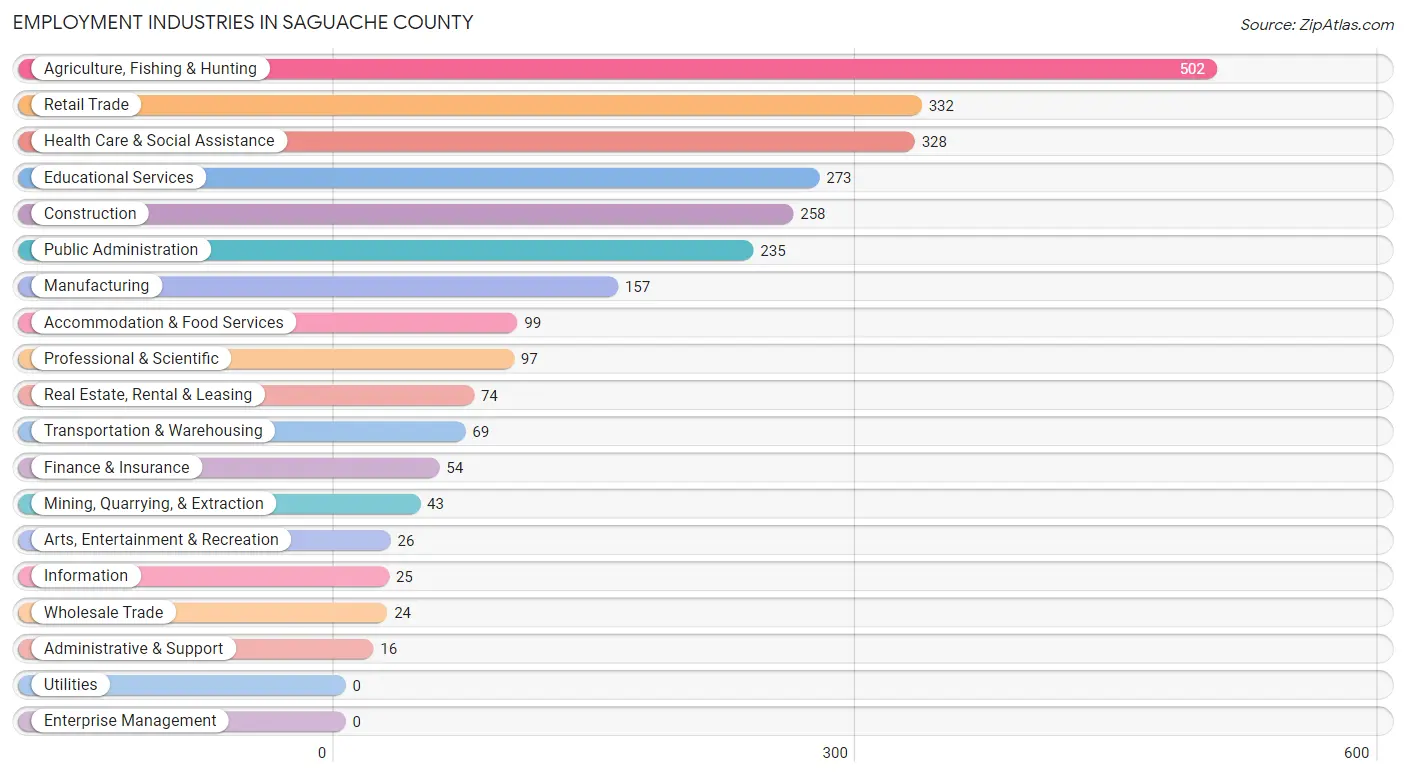
Employment Industries by Sex in Saguache County
The Saguache County industries that see more men than women are Mining, Quarrying, & Extraction (100.0%), Wholesale Trade (100.0%), and Administrative & Support (100.0%), whereas the industries that tend to have a higher number of women are Health Care & Social Assistance (90.8%), Retail Trade (62.1%), and Accommodation & Food Services (55.6%).
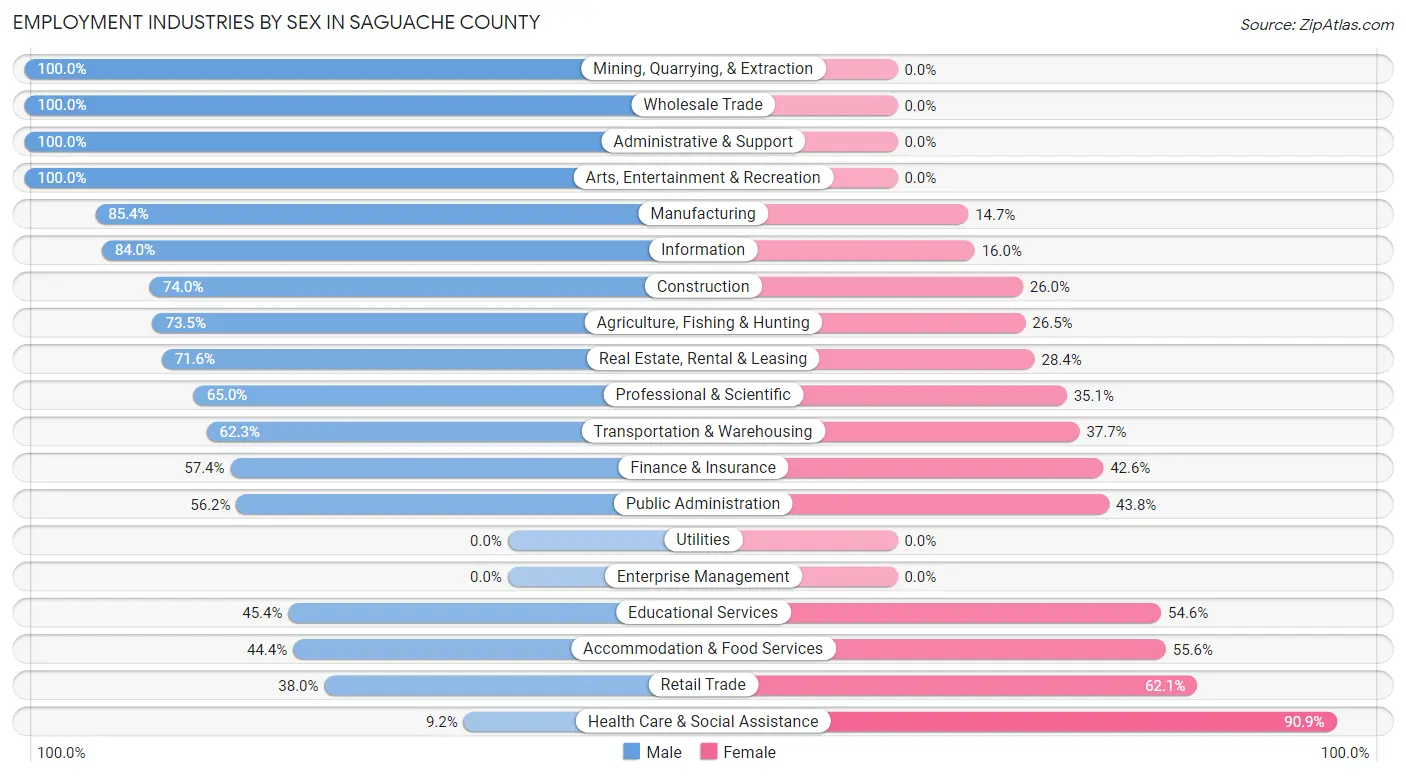
| Industry | Male | Female |
| Agriculture, Fishing & Hunting | 369 (73.5%) | 133 (26.5%) |
| Mining, Quarrying, & Extraction | 43 (100.0%) | 0 (0.0%) |
| Construction | 191 (74.0%) | 67 (26.0%) |
| Manufacturing | 134 (85.4%) | 23 (14.6%) |
| Wholesale Trade | 24 (100.0%) | 0 (0.0%) |
| Retail Trade | 126 (38.0%) | 206 (62.1%) |
| Transportation & Warehousing | 43 (62.3%) | 26 (37.7%) |
| Utilities | 0 (0.0%) | 0 (0.0%) |
| Information | 21 (84.0%) | 4 (16.0%) |
| Finance & Insurance | 31 (57.4%) | 23 (42.6%) |
| Real Estate, Rental & Leasing | 53 (71.6%) | 21 (28.4%) |
| Professional & Scientific | 63 (64.9%) | 34 (35.0%) |
| Enterprise Management | 0 (0.0%) | 0 (0.0%) |
| Administrative & Support | 16 (100.0%) | 0 (0.0%) |
| Educational Services | 124 (45.4%) | 149 (54.6%) |
| Health Care & Social Assistance | 30 (9.1%) | 298 (90.8%) |
| Arts, Entertainment & Recreation | 26 (100.0%) | 0 (0.0%) |
| Accommodation & Food Services | 44 (44.4%) | 55 (55.6%) |
| Public Administration | 132 (56.2%) | 103 (43.8%) |
| Total | 1,515 (56.3%) | 1,176 (43.7%) |
Education in Saguache County
School Enrollment in Saguache County
The most common levels of schooling among the 1,146 students in Saguache County are high school (325 | 28.4%), elementary school (289 | 25.2%), and middle school (215 | 18.8%).
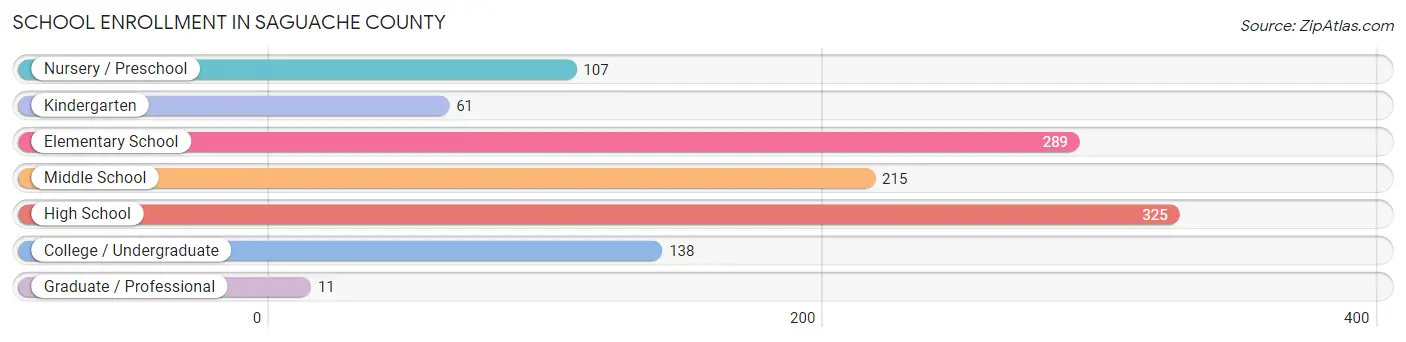
| School Level | # Students | % Students |
| Nursery / Preschool | 107 | 9.3% |
| Kindergarten | 61 | 5.3% |
| Elementary School | 289 | 25.2% |
| Middle School | 215 | 18.8% |
| High School | 325 | 28.4% |
| College / Undergraduate | 138 | 12.0% |
| Graduate / Professional | 11 | 1.0% |
| Total | 1,146 | 100.0% |
School Enrollment by Age by Funding Source in Saguache County
Out of a total of 1,146 students who are enrolled in schools in Saguache County, 199 (17.4%) attend a private institution, while the remaining 947 (82.6%) are enrolled in public schools. The age group of 20 to 24 year olds has the highest likelihood of being enrolled in private schools, with 28 (71.8% in the age bracket) enrolled. Conversely, the age group of 18 to 19 year olds has the lowest likelihood of being enrolled in a private school, with 41 (100.0% in the age bracket) attending a public institution.
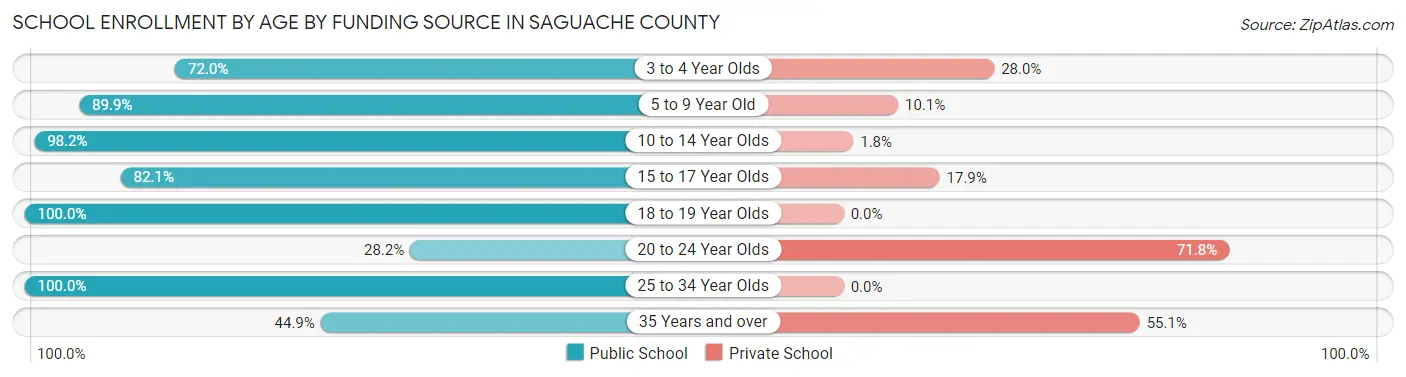
| Age Bracket | Public School | Private School |
| 3 to 4 Year Olds | 77 (72.0%) | 30 (28.0%) |
| 5 to 9 Year Old | 266 (89.9%) | 30 (10.1%) |
| 10 to 14 Year Olds | 275 (98.2%) | 5 (1.8%) |
| 15 to 17 Year Olds | 216 (82.1%) | 47 (17.9%) |
| 18 to 19 Year Olds | 41 (100.0%) | 0 (0.0%) |
| 20 to 24 Year Olds | 11 (28.2%) | 28 (71.8%) |
| 25 to 34 Year Olds | 13 (100.0%) | 0 (0.0%) |
| 35 Years and over | 48 (44.9%) | 59 (55.1%) |
| Total | 947 (82.6%) | 199 (17.4%) |
Educational Attainment by Field of Study in Saguache County
Arts & humanities (211 | 15.1%), education (194 | 13.9%), business (193 | 13.9%), psychology (148 | 10.6%), and science & technology (137 | 9.8%) are the most common fields of study among 1,393 individuals in Saguache County who have obtained a bachelor's degree or higher.
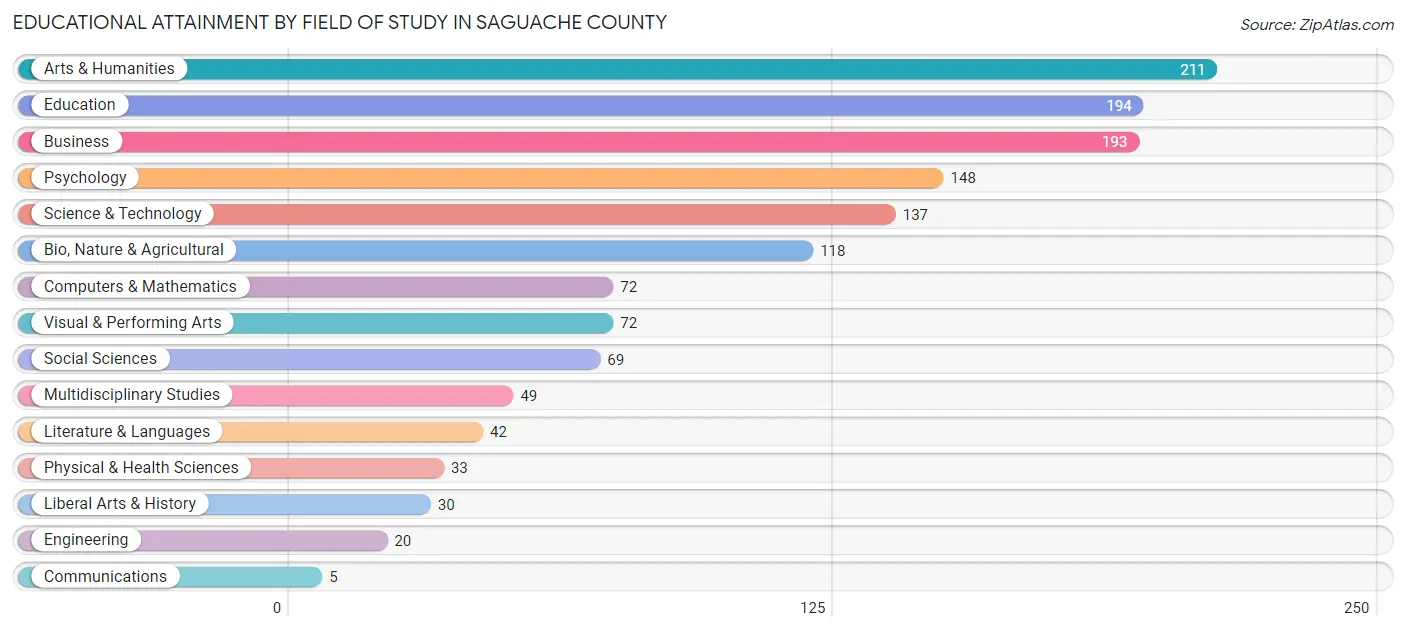
| Field of Study | # Graduates | % Graduates |
| Computers & Mathematics | 72 | 5.2% |
| Bio, Nature & Agricultural | 118 | 8.5% |
| Physical & Health Sciences | 33 | 2.4% |
| Psychology | 148 | 10.6% |
| Social Sciences | 69 | 5.0% |
| Engineering | 20 | 1.4% |
| Multidisciplinary Studies | 49 | 3.5% |
| Science & Technology | 137 | 9.8% |
| Business | 193 | 13.9% |
| Education | 194 | 13.9% |
| Literature & Languages | 42 | 3.0% |
| Liberal Arts & History | 30 | 2.1% |
| Visual & Performing Arts | 72 | 5.2% |
| Communications | 5 | 0.4% |
| Arts & Humanities | 211 | 15.1% |
| Total | 1,393 | 100.0% |
Transportation & Commute in Saguache County
Vehicle Availability by Sex in Saguache County
The most prevalent vehicle ownership categories in Saguache County are males with 2 vehicles (622, accounting for 41.4%) and females with 2 vehicles (463, making up 53.8%).
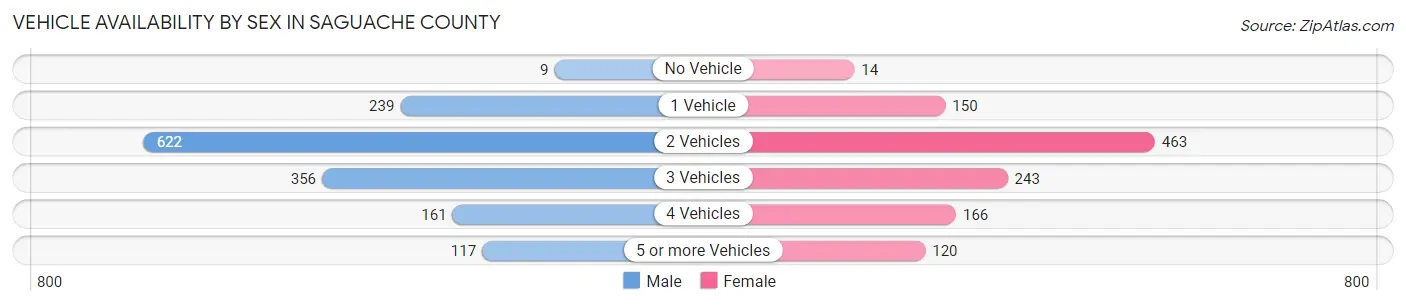
| Vehicles Available | Male | Female |
| No Vehicle | 9 (0.6%) | 14 (1.2%) |
| 1 Vehicle | 239 (15.9%) | 150 (13.0%) |
| 2 Vehicles | 622 (41.4%) | 463 (40.1%) |
| 3 Vehicles | 356 (23.7%) | 243 (21.0%) |
| 4 Vehicles | 161 (10.7%) | 166 (14.4%) |
| 5 or more Vehicles | 117 (7.8%) | 120 (10.4%) |
| Total | 1,504 (100.0%) | 1,156 (100.0%) |
Commute Time in Saguache County
The most frequently occuring commute durations in Saguache County are less than 5 minutes (445 commuters, 20.2%), 15 to 19 minutes (328 commuters, 14.9%), and 5 to 9 minutes (324 commuters, 14.7%).
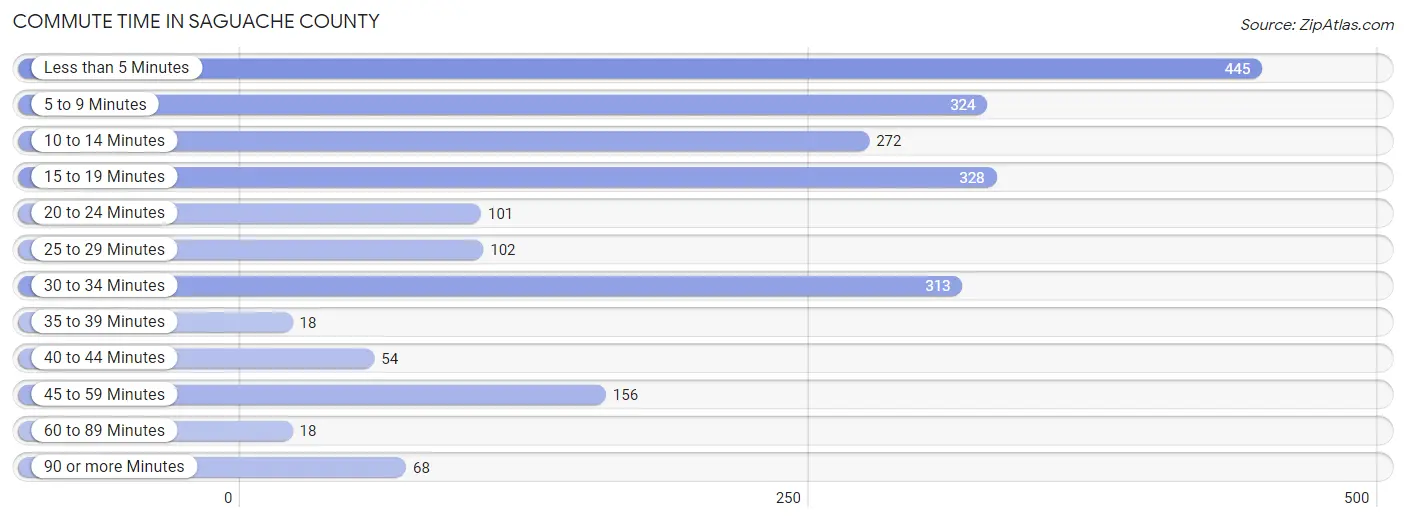
| Commute Time | # Commuters | % Commuters |
| Less than 5 Minutes | 445 | 20.2% |
| 5 to 9 Minutes | 324 | 14.7% |
| 10 to 14 Minutes | 272 | 12.4% |
| 15 to 19 Minutes | 328 | 14.9% |
| 20 to 24 Minutes | 101 | 4.6% |
| 25 to 29 Minutes | 102 | 4.6% |
| 30 to 34 Minutes | 313 | 14.2% |
| 35 to 39 Minutes | 18 | 0.8% |
| 40 to 44 Minutes | 54 | 2.5% |
| 45 to 59 Minutes | 156 | 7.1% |
| 60 to 89 Minutes | 18 | 0.8% |
| 90 or more Minutes | 68 | 3.1% |
Commute Time by Sex in Saguache County
The most common commute times in Saguache County are less than 5 minutes (234 commuters, 18.7%) for males and less than 5 minutes (211 commuters, 22.3%) for females.
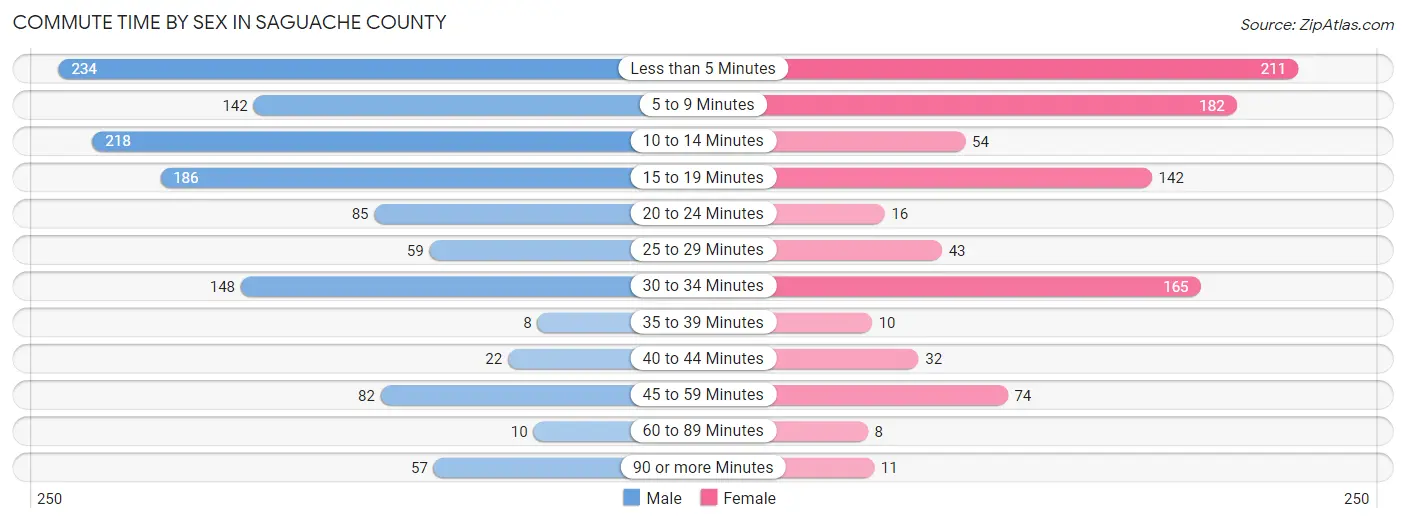
| Commute Time | Male | Female |
| Less than 5 Minutes | 234 (18.7%) | 211 (22.3%) |
| 5 to 9 Minutes | 142 (11.4%) | 182 (19.2%) |
| 10 to 14 Minutes | 218 (17.4%) | 54 (5.7%) |
| 15 to 19 Minutes | 186 (14.9%) | 142 (15.0%) |
| 20 to 24 Minutes | 85 (6.8%) | 16 (1.7%) |
| 25 to 29 Minutes | 59 (4.7%) | 43 (4.5%) |
| 30 to 34 Minutes | 148 (11.8%) | 165 (17.4%) |
| 35 to 39 Minutes | 8 (0.6%) | 10 (1.1%) |
| 40 to 44 Minutes | 22 (1.8%) | 32 (3.4%) |
| 45 to 59 Minutes | 82 (6.6%) | 74 (7.8%) |
| 60 to 89 Minutes | 10 (0.8%) | 8 (0.8%) |
| 90 or more Minutes | 57 (4.6%) | 11 (1.2%) |
Time of Departure to Work by Sex in Saguache County
The most frequent times of departure to work in Saguache County are 7:00 AM to 7:29 AM (386, 30.9%) for males and 7:00 AM to 7:29 AM (342, 36.1%) for females.
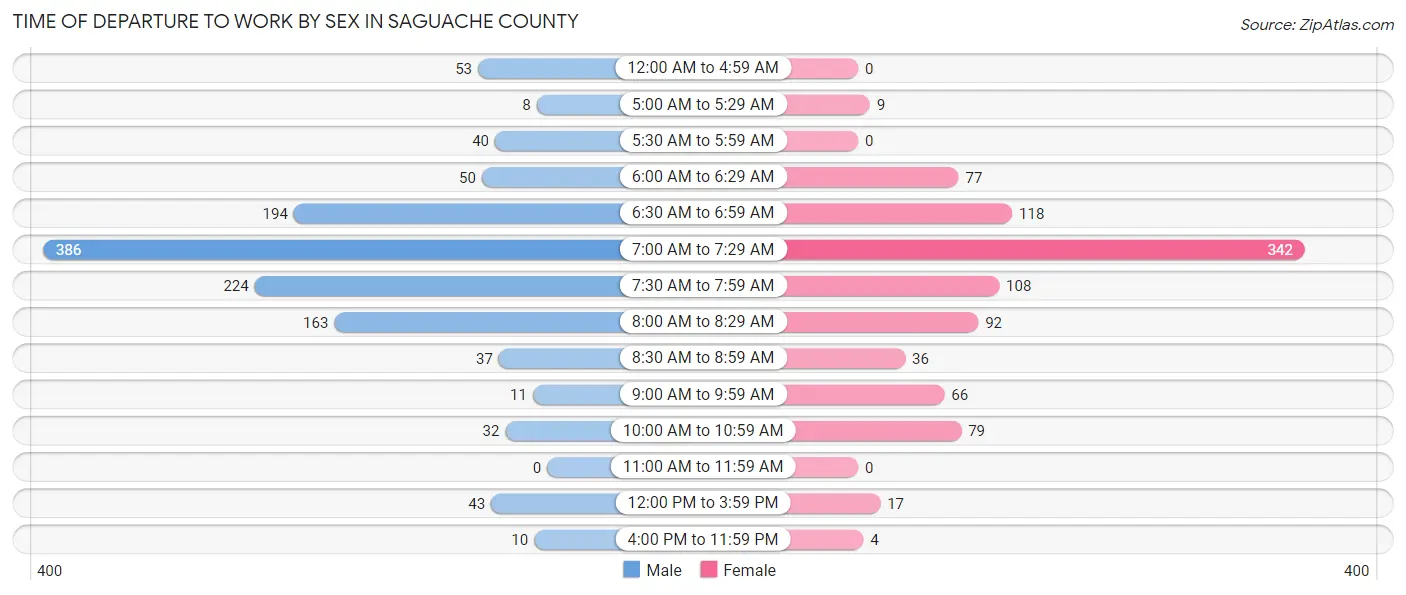
| Time of Departure | Male | Female |
| 12:00 AM to 4:59 AM | 53 (4.2%) | 0 (0.0%) |
| 5:00 AM to 5:29 AM | 8 (0.6%) | 9 (0.9%) |
| 5:30 AM to 5:59 AM | 40 (3.2%) | 0 (0.0%) |
| 6:00 AM to 6:29 AM | 50 (4.0%) | 77 (8.1%) |
| 6:30 AM to 6:59 AM | 194 (15.5%) | 118 (12.4%) |
| 7:00 AM to 7:29 AM | 386 (30.9%) | 342 (36.1%) |
| 7:30 AM to 7:59 AM | 224 (17.9%) | 108 (11.4%) |
| 8:00 AM to 8:29 AM | 163 (13.0%) | 92 (9.7%) |
| 8:30 AM to 8:59 AM | 37 (3.0%) | 36 (3.8%) |
| 9:00 AM to 9:59 AM | 11 (0.9%) | 66 (7.0%) |
| 10:00 AM to 10:59 AM | 32 (2.6%) | 79 (8.3%) |
| 11:00 AM to 11:59 AM | 0 (0.0%) | 0 (0.0%) |
| 12:00 PM to 3:59 PM | 43 (3.4%) | 17 (1.8%) |
| 4:00 PM to 11:59 PM | 10 (0.8%) | 4 (0.4%) |
| Total | 1,251 (100.0%) | 948 (100.0%) |
Housing Occupancy in Saguache County
Occupancy by Ownership in Saguache County
Of the total 3,071 dwellings in Saguache County, owner-occupied units account for 2,235 (72.8%), while renter-occupied units make up 836 (27.2%).
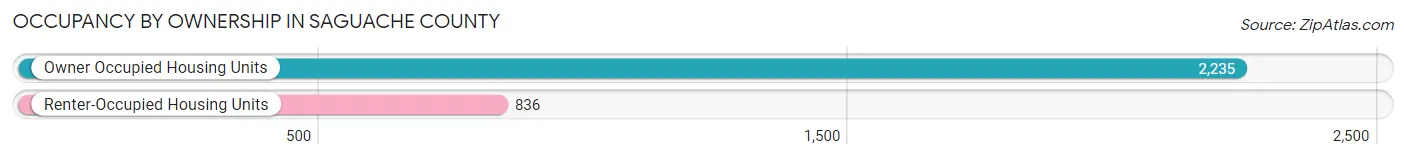
| Occupancy | # Housing Units | % Housing Units |
| Owner Occupied Housing Units | 2,235 | 72.8% |
| Renter-Occupied Housing Units | 836 | 27.2% |
| Total Occupied Housing Units | 3,071 | 100.0% |
Occupancy by Household Size in Saguache County
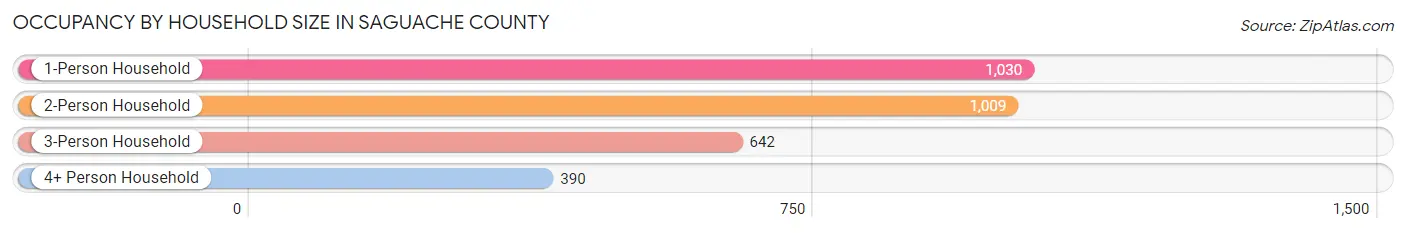
| Household Size | # Housing Units | % Housing Units |
| 1-Person Household | 1,030 | 33.5% |
| 2-Person Household | 1,009 | 32.9% |
| 3-Person Household | 642 | 20.9% |
| 4+ Person Household | 390 | 12.7% |
| Total Housing Units | 3,071 | 100.0% |
Occupancy by Ownership by Household Size in Saguache County
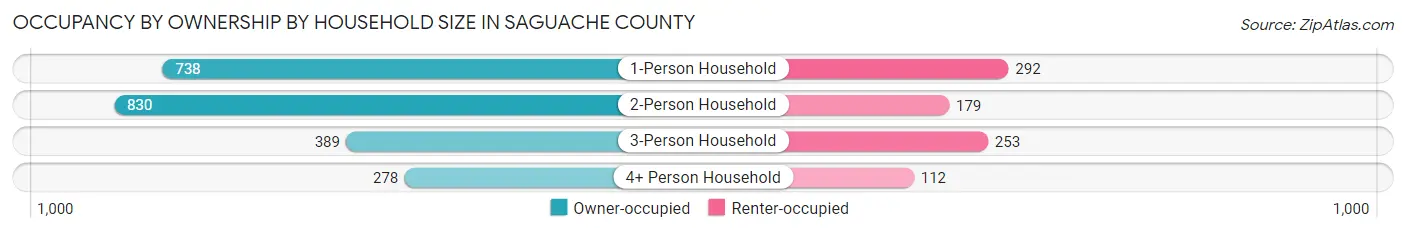
| Household Size | Owner-occupied | Renter-occupied |
| 1-Person Household | 738 (71.7%) | 292 (28.3%) |
| 2-Person Household | 830 (82.3%) | 179 (17.7%) |
| 3-Person Household | 389 (60.6%) | 253 (39.4%) |
| 4+ Person Household | 278 (71.3%) | 112 (28.7%) |
| Total Housing Units | 2,235 (72.8%) | 836 (27.2%) |
Occupancy by Educational Attainment in Saguache County
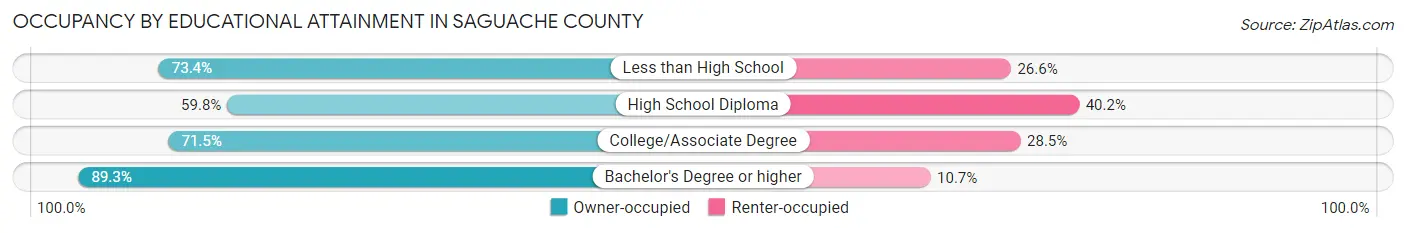
| Household Size | Owner-occupied | Renter-occupied |
| Less than High School | 281 (73.4%) | 102 (26.6%) |
| High School Diploma | 526 (59.8%) | 353 (40.2%) |
| College/Associate Degree | 751 (71.5%) | 300 (28.5%) |
| Bachelor's Degree or higher | 677 (89.3%) | 81 (10.7%) |
Occupancy by Age of Householder in Saguache County
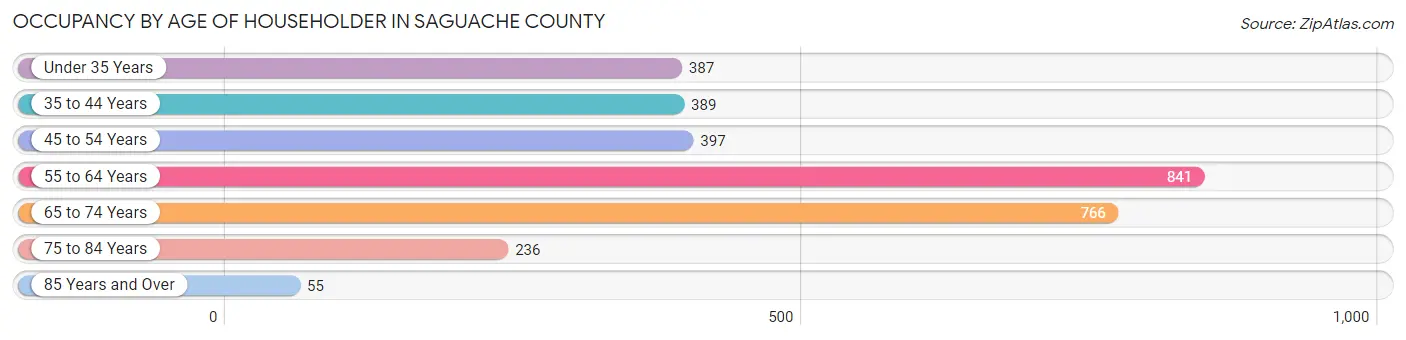
| Age Bracket | # Households | % Households |
| Under 35 Years | 387 | 12.6% |
| 35 to 44 Years | 389 | 12.7% |
| 45 to 54 Years | 397 | 12.9% |
| 55 to 64 Years | 841 | 27.4% |
| 65 to 74 Years | 766 | 24.9% |
| 75 to 84 Years | 236 | 7.7% |
| 85 Years and Over | 55 | 1.8% |
| Total | 3,071 | 100.0% |
Housing Finances in Saguache County
Median Income by Occupancy in Saguache County
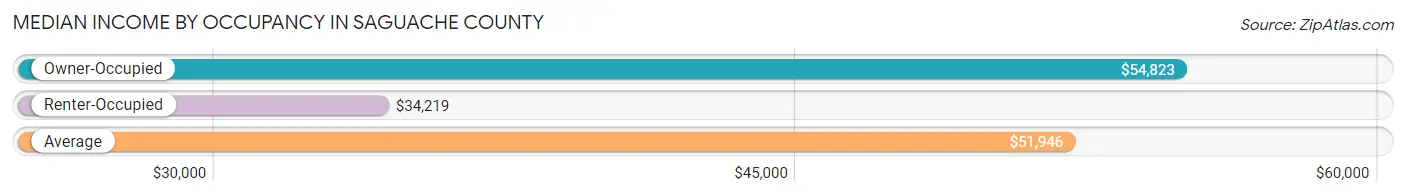
| Occupancy Type | # Households | Median Income |
| Owner-Occupied | 2,235 (72.8%) | $54,823 |
| Renter-Occupied | 836 (27.2%) | $34,219 |
| Average | 3,071 (100.0%) | $51,946 |
Occupancy by Householder Income Bracket in Saguache County
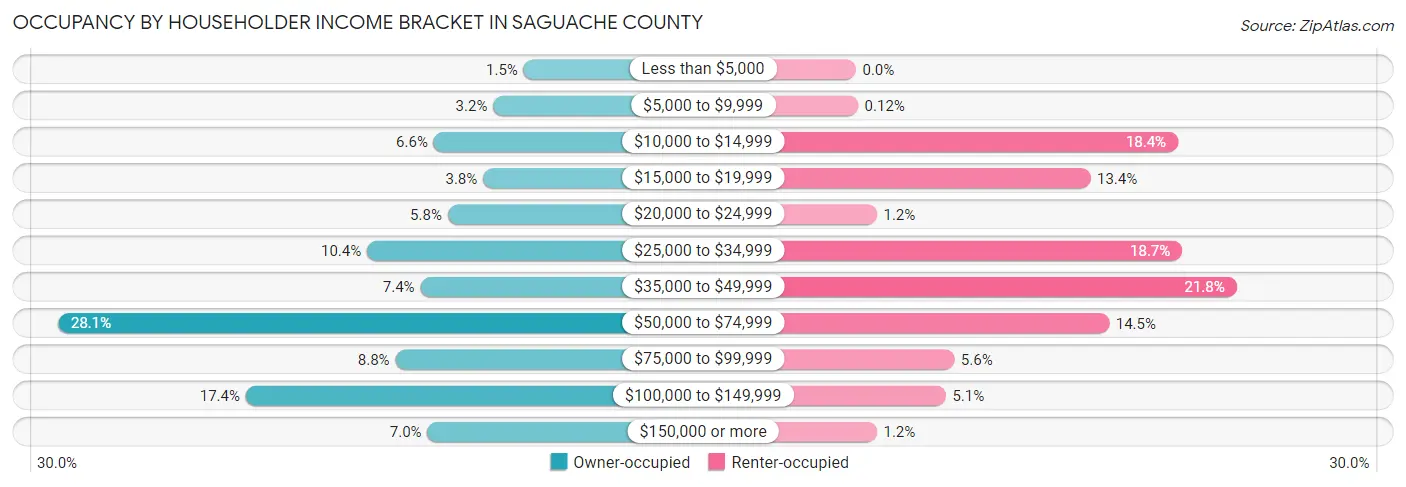
| Income Bracket | Owner-occupied | Renter-occupied |
| Less than $5,000 | 33 (1.5%) | 0 (0.0%) |
| $5,000 to $9,999 | 72 (3.2%) | 1 (0.1%) |
| $10,000 to $14,999 | 148 (6.6%) | 154 (18.4%) |
| $15,000 to $19,999 | 85 (3.8%) | 112 (13.4%) |
| $20,000 to $24,999 | 130 (5.8%) | 10 (1.2%) |
| $25,000 to $34,999 | 233 (10.4%) | 156 (18.7%) |
| $35,000 to $49,999 | 165 (7.4%) | 182 (21.8%) |
| $50,000 to $74,999 | 628 (28.1%) | 121 (14.5%) |
| $75,000 to $99,999 | 197 (8.8%) | 47 (5.6%) |
| $100,000 to $149,999 | 388 (17.4%) | 43 (5.1%) |
| $150,000 or more | 156 (7.0%) | 10 (1.2%) |
| Total | 2,235 (100.0%) | 836 (100.0%) |
Monthly Housing Cost Tiers in Saguache County
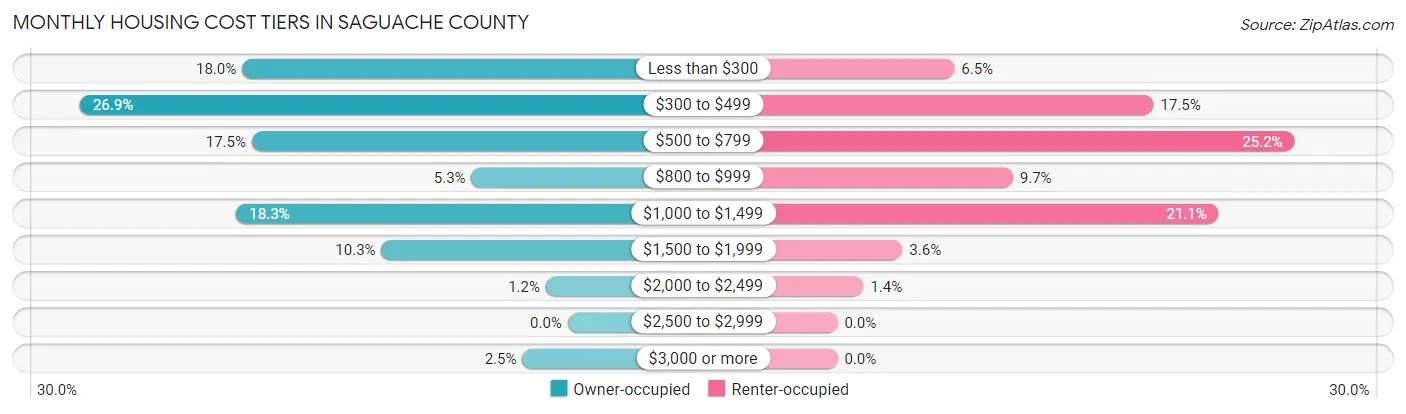
| Monthly Cost | Owner-occupied | Renter-occupied |
| Less than $300 | 402 (18.0%) | 54 (6.5%) |
| $300 to $499 | 602 (26.9%) | 146 (17.5%) |
| $500 to $799 | 390 (17.4%) | 211 (25.2%) |
| $800 to $999 | 119 (5.3%) | 81 (9.7%) |
| $1,000 to $1,499 | 409 (18.3%) | 176 (21.0%) |
| $1,500 to $1,999 | 230 (10.3%) | 30 (3.6%) |
| $2,000 to $2,499 | 27 (1.2%) | 12 (1.4%) |
| $2,500 to $2,999 | 0 (0.0%) | 0 (0.0%) |
| $3,000 or more | 56 (2.5%) | 0 (0.0%) |
| Total | 2,235 (100.0%) | 836 (100.0%) |
Physical Housing Characteristics in Saguache County
Housing Structures in Saguache County
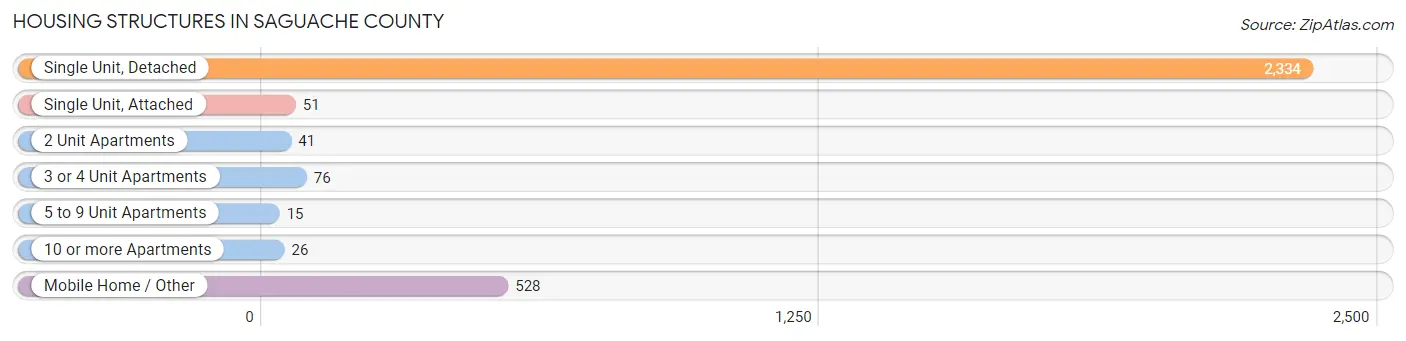
| Structure Type | # Housing Units | % Housing Units |
| Single Unit, Detached | 2,334 | 76.0% |
| Single Unit, Attached | 51 | 1.7% |
| 2 Unit Apartments | 41 | 1.3% |
| 3 or 4 Unit Apartments | 76 | 2.5% |
| 5 to 9 Unit Apartments | 15 | 0.5% |
| 10 or more Apartments | 26 | 0.9% |
| Mobile Home / Other | 528 | 17.2% |
| Total | 3,071 | 100.0% |
Housing Structures by Occupancy in Saguache County
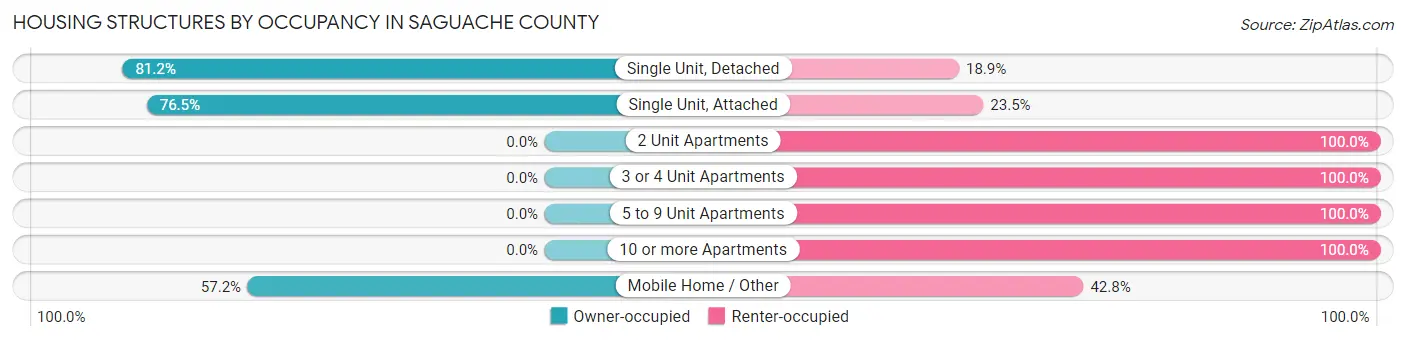
| Structure Type | Owner-occupied | Renter-occupied |
| Single Unit, Detached | 1,894 (81.1%) | 440 (18.9%) |
| Single Unit, Attached | 39 (76.5%) | 12 (23.5%) |
| 2 Unit Apartments | 0 (0.0%) | 41 (100.0%) |
| 3 or 4 Unit Apartments | 0 (0.0%) | 76 (100.0%) |
| 5 to 9 Unit Apartments | 0 (0.0%) | 15 (100.0%) |
| 10 or more Apartments | 0 (0.0%) | 26 (100.0%) |
| Mobile Home / Other | 302 (57.2%) | 226 (42.8%) |
| Total | 2,235 (72.8%) | 836 (27.2%) |
Housing Structures by Number of Rooms in Saguache County
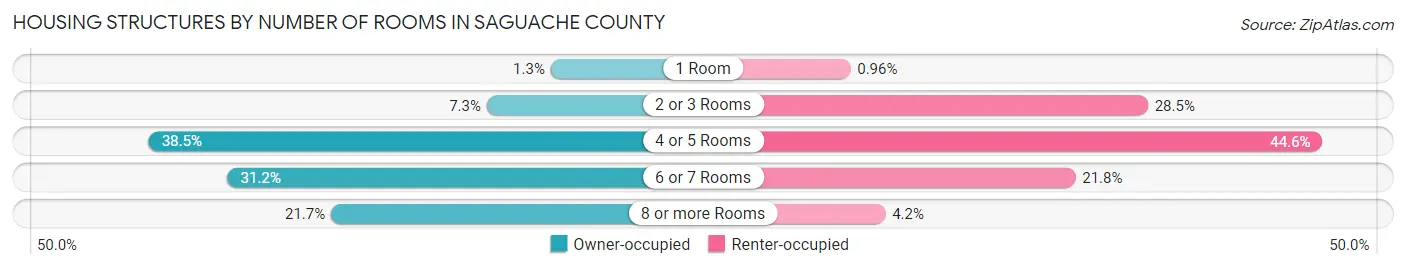
| Number of Rooms | Owner-occupied | Renter-occupied |
| 1 Room | 30 (1.3%) | 8 (1.0%) |
| 2 or 3 Rooms | 162 (7.2%) | 238 (28.5%) |
| 4 or 5 Rooms | 861 (38.5%) | 373 (44.6%) |
| 6 or 7 Rooms | 698 (31.2%) | 182 (21.8%) |
| 8 or more Rooms | 484 (21.7%) | 35 (4.2%) |
| Total | 2,235 (100.0%) | 836 (100.0%) |
Housing Structure by Heating Type in Saguache County
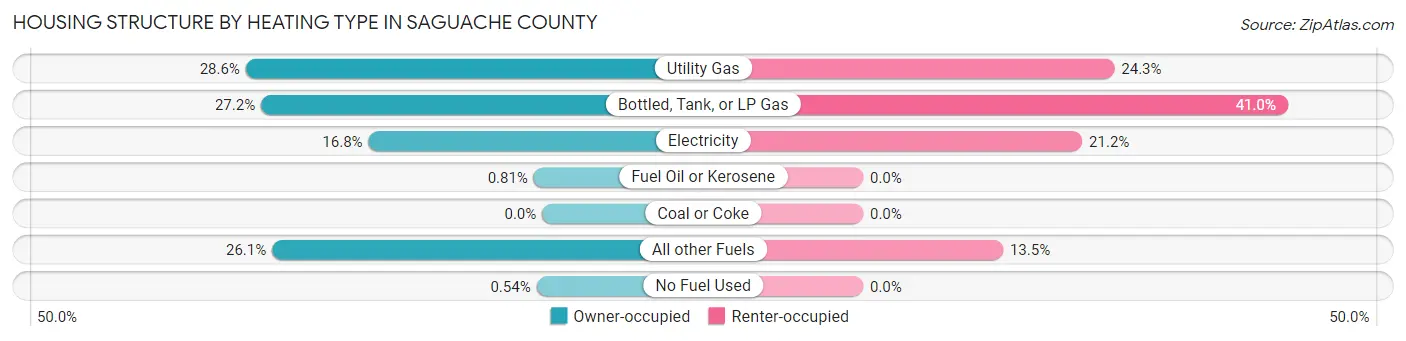
| Heating Type | Owner-occupied | Renter-occupied |
| Utility Gas | 640 (28.6%) | 203 (24.3%) |
| Bottled, Tank, or LP Gas | 607 (27.2%) | 343 (41.0%) |
| Electricity | 375 (16.8%) | 177 (21.2%) |
| Fuel Oil or Kerosene | 18 (0.8%) | 0 (0.0%) |
| Coal or Coke | 0 (0.0%) | 0 (0.0%) |
| All other Fuels | 583 (26.1%) | 113 (13.5%) |
| No Fuel Used | 12 (0.5%) | 0 (0.0%) |
| Total | 2,235 (100.0%) | 836 (100.0%) |
Household Vehicle Usage in Saguache County
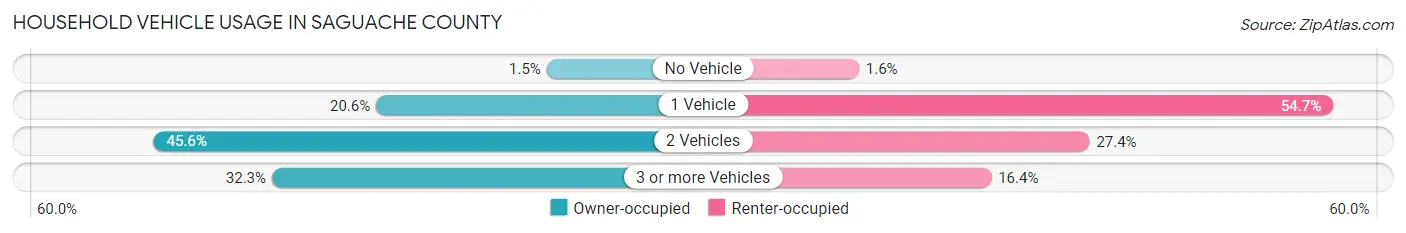
| Vehicles per Household | Owner-occupied | Renter-occupied |
| No Vehicle | 34 (1.5%) | 13 (1.6%) |
| 1 Vehicle | 461 (20.6%) | 457 (54.7%) |
| 2 Vehicles | 1,018 (45.6%) | 229 (27.4%) |
| 3 or more Vehicles | 722 (32.3%) | 137 (16.4%) |
| Total | 2,235 (100.0%) | 836 (100.0%) |
Real Estate & Mortgages in Saguache County
Real Estate and Mortgage Overview in Saguache County
| Characteristic | Without Mortgage | With Mortgage |
| Housing Units | 1,304 | 931 |
| Median Property Value | $144,600 | $179,700 |
| Median Household Income | $54,357 | $87 |
| Monthly Housing Costs | $370 | $56 |
| Real Estate Taxes | $677 | $7 |
Property Value by Mortgage Status in Saguache County
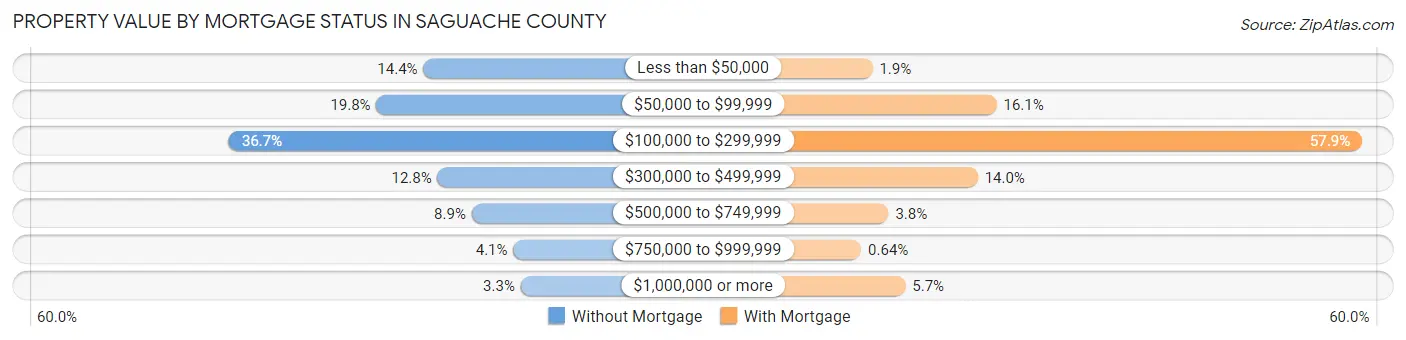
| Property Value | Without Mortgage | With Mortgage |
| Less than $50,000 | 188 (14.4%) | 18 (1.9%) |
| $50,000 to $99,999 | 258 (19.8%) | 150 (16.1%) |
| $100,000 to $299,999 | 478 (36.7%) | 539 (57.9%) |
| $300,000 to $499,999 | 167 (12.8%) | 130 (14.0%) |
| $500,000 to $749,999 | 116 (8.9%) | 35 (3.8%) |
| $750,000 to $999,999 | 54 (4.1%) | 6 (0.6%) |
| $1,000,000 or more | 43 (3.3%) | 53 (5.7%) |
| Total | 1,304 (100.0%) | 931 (100.0%) |
Household Income by Mortgage Status in Saguache County
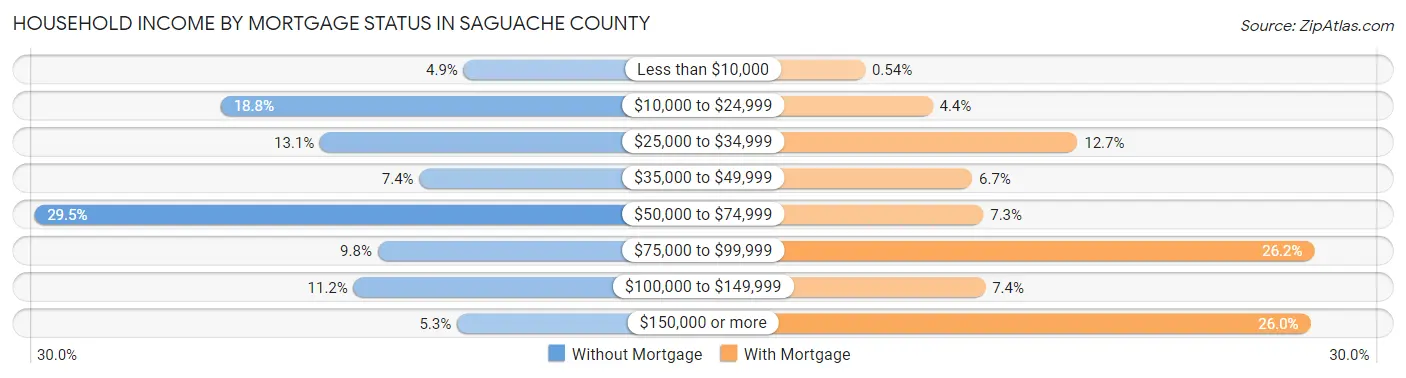
| Household Income | Without Mortgage | With Mortgage |
| Less than $10,000 | 64 (4.9%) | 5 (0.5%) |
| $10,000 to $24,999 | 245 (18.8%) | 41 (4.4%) |
| $25,000 to $34,999 | 171 (13.1%) | 118 (12.7%) |
| $35,000 to $49,999 | 97 (7.4%) | 62 (6.7%) |
| $50,000 to $74,999 | 384 (29.4%) | 68 (7.3%) |
| $75,000 to $99,999 | 128 (9.8%) | 244 (26.2%) |
| $100,000 to $149,999 | 146 (11.2%) | 69 (7.4%) |
| $150,000 or more | 69 (5.3%) | 242 (26.0%) |
| Total | 1,304 (100.0%) | 931 (100.0%) |
Property Value to Household Income Ratio in Saguache County
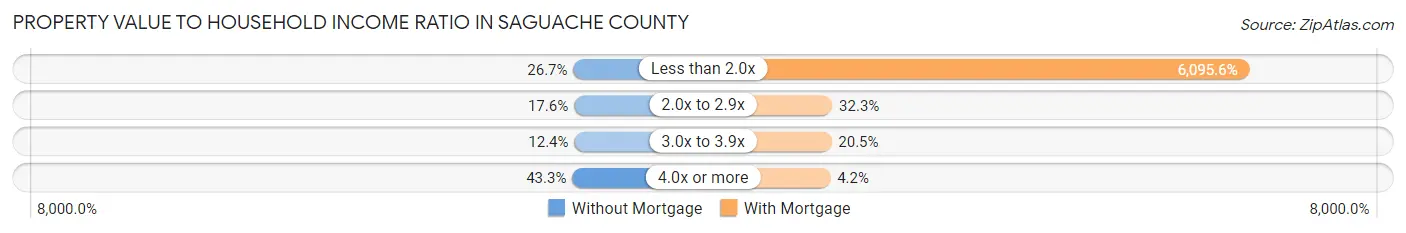
| Value-to-Income Ratio | Without Mortgage | With Mortgage |
| Less than 2.0x | 348 (26.7%) | 56,750 (6,095.6%) |
| 2.0x to 2.9x | 230 (17.6%) | 301 (32.3%) |
| 3.0x to 3.9x | 162 (12.4%) | 191 (20.5%) |
| 4.0x or more | 564 (43.2%) | 39 (4.2%) |
| Total | 1,304 (100.0%) | 931 (100.0%) |
Real Estate Taxes by Mortgage Status in Saguache County
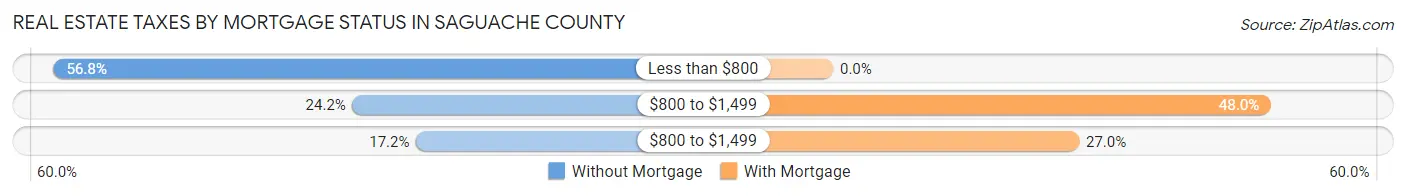
| Property Taxes | Without Mortgage | With Mortgage |
| Less than $800 | 741 (56.8%) | 0 (0.0%) |
| $800 to $1,499 | 315 (24.2%) | 447 (48.0%) |
| $800 to $1,499 | 224 (17.2%) | 251 (27.0%) |
| Total | 1,304 (100.0%) | 931 (100.0%) |
Health & Disability in Saguache County
Health Insurance Coverage by Age in Saguache County
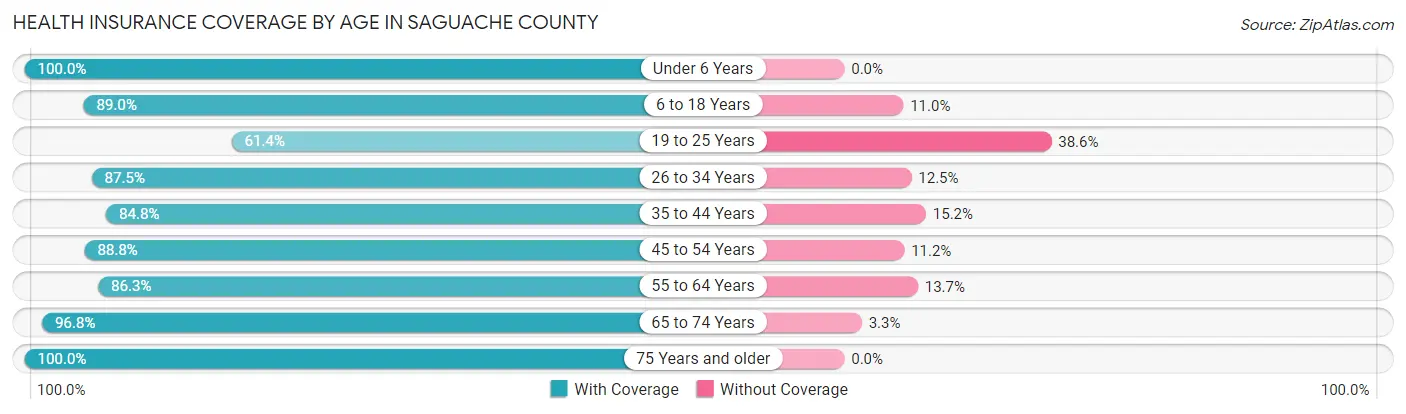
| Age Bracket | With Coverage | Without Coverage |
| Under 6 Years | 362 (100.0%) | 0 (0.0%) |
| 6 to 18 Years | 802 (89.0%) | 99 (11.0%) |
| 19 to 25 Years | 264 (61.4%) | 166 (38.6%) |
| 26 to 34 Years | 364 (87.5%) | 52 (12.5%) |
| 35 to 44 Years | 658 (84.8%) | 118 (15.2%) |
| 45 to 54 Years | 628 (88.8%) | 79 (11.2%) |
| 55 to 64 Years | 1,007 (86.3%) | 160 (13.7%) |
| 65 to 74 Years | 1,162 (96.8%) | 39 (3.3%) |
| 75 Years and older | 452 (100.0%) | 0 (0.0%) |
| Total | 5,699 (88.9%) | 713 (11.1%) |
Health Insurance Coverage by Citizenship Status in Saguache County
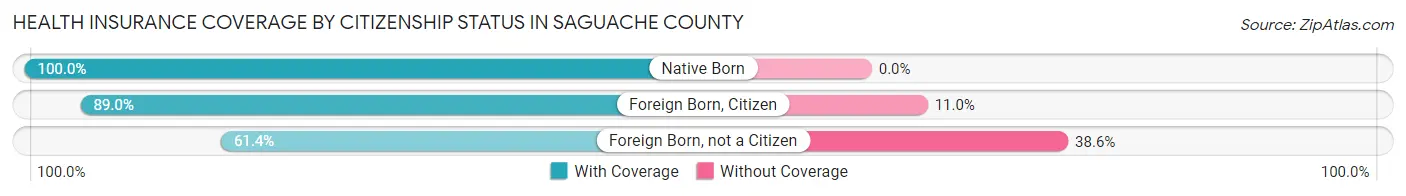
| Citizenship Status | With Coverage | Without Coverage |
| Native Born | 362 (100.0%) | 0 (0.0%) |
| Foreign Born, Citizen | 802 (89.0%) | 99 (11.0%) |
| Foreign Born, not a Citizen | 264 (61.4%) | 166 (38.6%) |
Health Insurance Coverage by Household Income in Saguache County
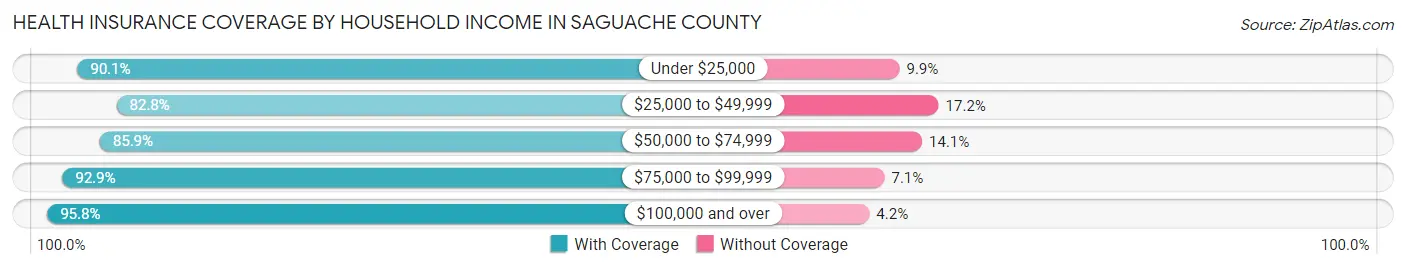
| Household Income | With Coverage | Without Coverage |
| Under $25,000 | 1,049 (90.1%) | 115 (9.9%) |
| $25,000 to $49,999 | 1,357 (82.8%) | 282 (17.2%) |
| $50,000 to $74,999 | 1,291 (85.9%) | 212 (14.1%) |
| $75,000 to $99,999 | 486 (92.9%) | 37 (7.1%) |
| $100,000 and over | 1,515 (95.8%) | 67 (4.2%) |
Public vs Private Health Insurance Coverage by Age in Saguache County
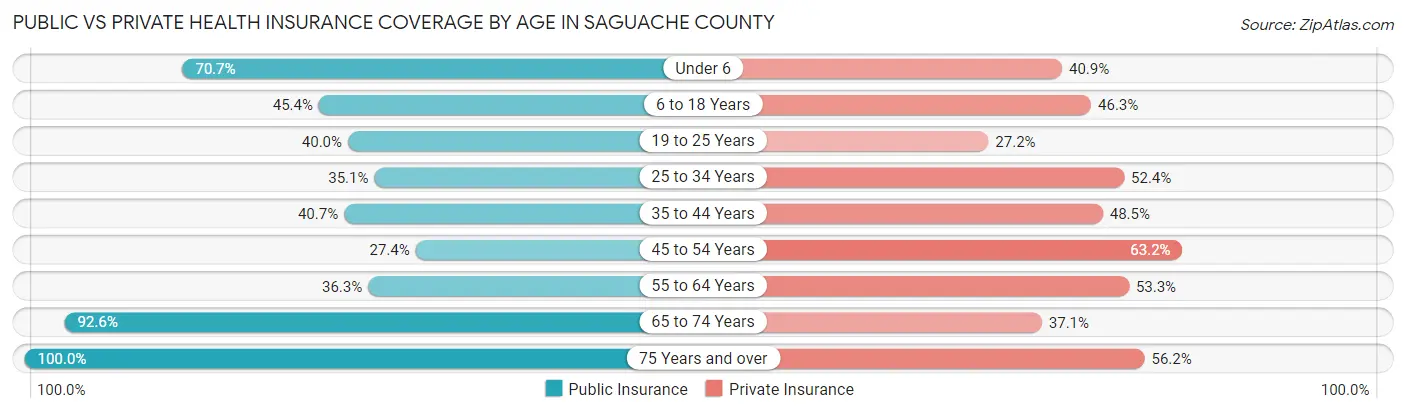
| Age Bracket | Public Insurance | Private Insurance |
| Under 6 | 256 (70.7%) | 148 (40.9%) |
| 6 to 18 Years | 409 (45.4%) | 417 (46.3%) |
| 19 to 25 Years | 172 (40.0%) | 117 (27.2%) |
| 25 to 34 Years | 146 (35.1%) | 218 (52.4%) |
| 35 to 44 Years | 316 (40.7%) | 376 (48.4%) |
| 45 to 54 Years | 194 (27.4%) | 447 (63.2%) |
| 55 to 64 Years | 423 (36.2%) | 622 (53.3%) |
| 65 to 74 Years | 1,112 (92.6%) | 446 (37.1%) |
| 75 Years and over | 452 (100.0%) | 254 (56.2%) |
| Total | 3,480 (54.3%) | 3,045 (47.5%) |
Disability Status by Sex by Age in Saguache County
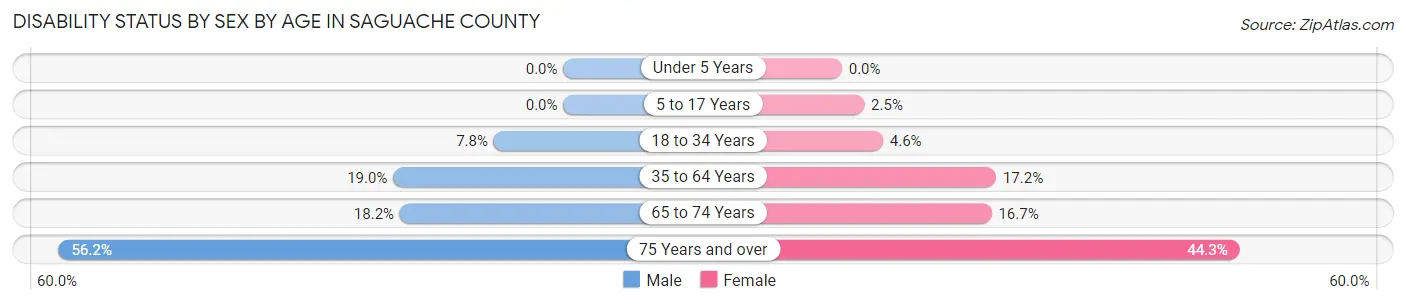
| Age Bracket | Male | Female |
| Under 5 Years | 0 (0.0%) | 0 (0.0%) |
| 5 to 17 Years | 0 (0.0%) | 11 (2.5%) |
| 18 to 34 Years | 29 (7.7%) | 23 (4.6%) |
| 35 to 64 Years | 256 (19.0%) | 223 (17.2%) |
| 65 to 74 Years | 117 (18.2%) | 93 (16.7%) |
| 75 Years and over | 131 (56.2%) | 97 (44.3%) |
Disability Class by Sex by Age in Saguache County
Disability Class: Hearing Difficulty
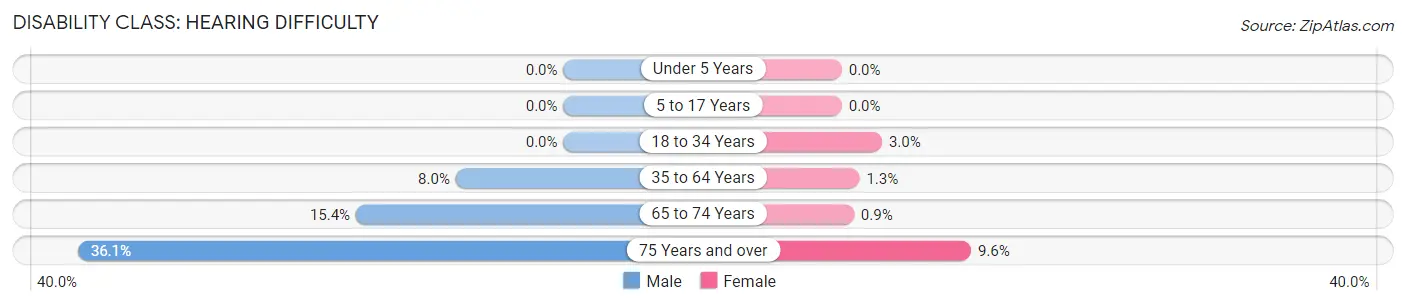
| Age Bracket | Male | Female |
| Under 5 Years | 0 (0.0%) | 0 (0.0%) |
| 5 to 17 Years | 0 (0.0%) | 0 (0.0%) |
| 18 to 34 Years | 0 (0.0%) | 15 (3.0%) |
| 35 to 64 Years | 108 (8.0%) | 17 (1.3%) |
| 65 to 74 Years | 99 (15.4%) | 5 (0.9%) |
| 75 Years and over | 84 (36.0%) | 21 (9.6%) |
Disability Class: Vision Difficulty
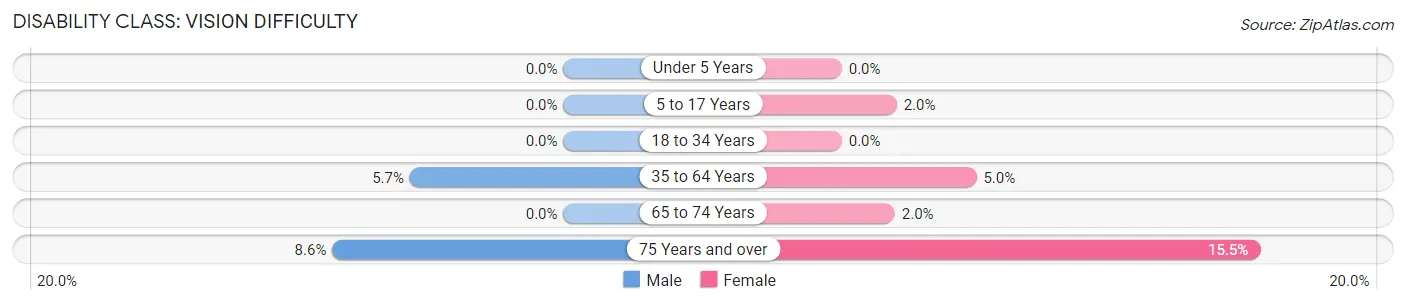
| Age Bracket | Male | Female |
| Under 5 Years | 0 (0.0%) | 0 (0.0%) |
| 5 to 17 Years | 0 (0.0%) | 9 (2.0%) |
| 18 to 34 Years | 0 (0.0%) | 0 (0.0%) |
| 35 to 64 Years | 77 (5.7%) | 65 (5.0%) |
| 65 to 74 Years | 0 (0.0%) | 11 (2.0%) |
| 75 Years and over | 20 (8.6%) | 34 (15.5%) |
Disability Class: Cognitive Difficulty
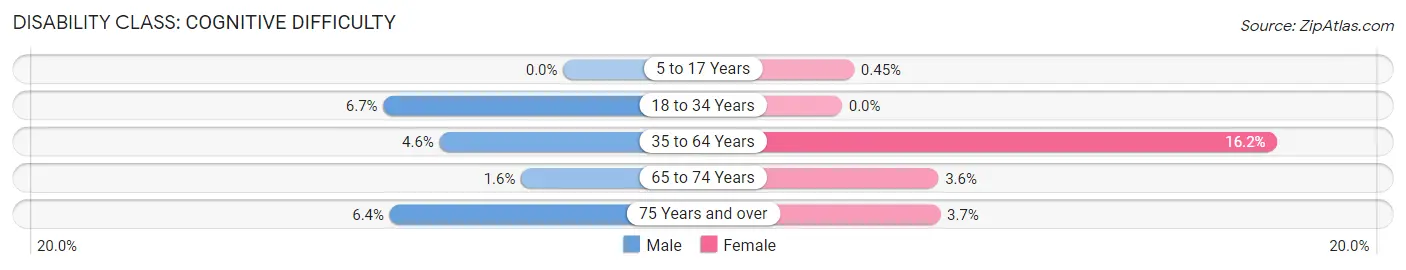
| Age Bracket | Male | Female |
| 5 to 17 Years | 0 (0.0%) | 2 (0.4%) |
| 18 to 34 Years | 25 (6.7%) | 0 (0.0%) |
| 35 to 64 Years | 62 (4.6%) | 210 (16.2%) |
| 65 to 74 Years | 10 (1.6%) | 20 (3.6%) |
| 75 Years and over | 15 (6.4%) | 8 (3.6%) |
Disability Class: Ambulatory Difficulty
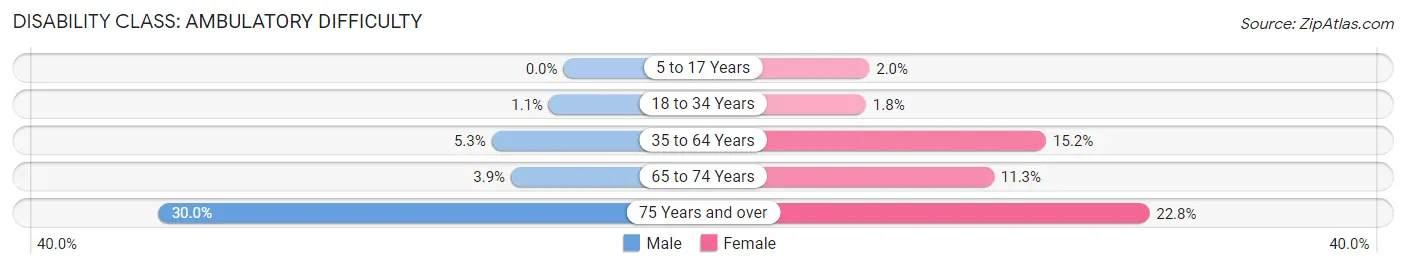
| Age Bracket | Male | Female |
| 5 to 17 Years | 0 (0.0%) | 9 (2.0%) |
| 18 to 34 Years | 4 (1.1%) | 9 (1.8%) |
| 35 to 64 Years | 72 (5.3%) | 197 (15.2%) |
| 65 to 74 Years | 25 (3.9%) | 63 (11.3%) |
| 75 Years and over | 70 (30.0%) | 50 (22.8%) |
Disability Class: Self-Care Difficulty
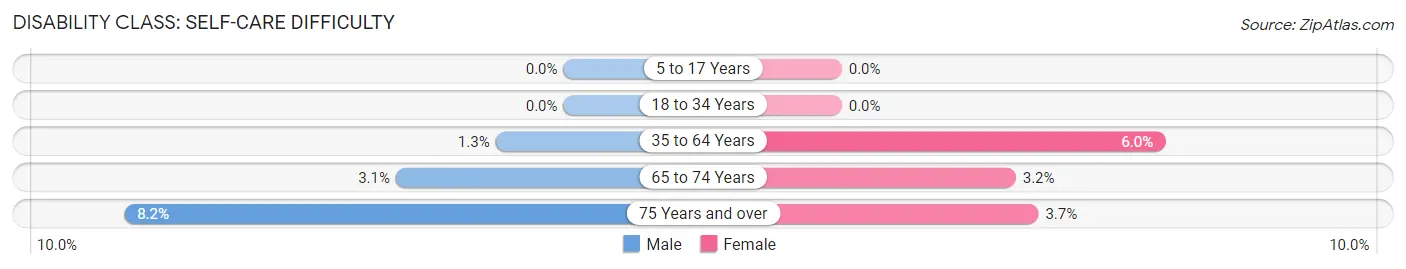
| Age Bracket | Male | Female |
| 5 to 17 Years | 0 (0.0%) | 0 (0.0%) |
| 18 to 34 Years | 0 (0.0%) | 0 (0.0%) |
| 35 to 64 Years | 17 (1.3%) | 78 (6.0%) |
| 65 to 74 Years | 20 (3.1%) | 18 (3.2%) |
| 75 Years and over | 19 (8.2%) | 8 (3.6%) |
Technology Access in Saguache County
Computing Device Access in Saguache County
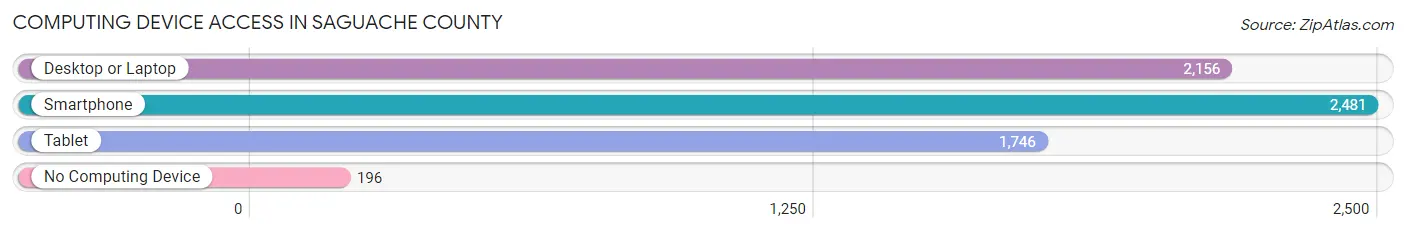
| Device Type | # Households | % Households |
| Desktop or Laptop | 2,156 | 70.2% |
| Smartphone | 2,481 | 80.8% |
| Tablet | 1,746 | 56.9% |
| No Computing Device | 196 | 6.4% |
| Total | 3,071 | 100.0% |
Internet Access in Saguache County
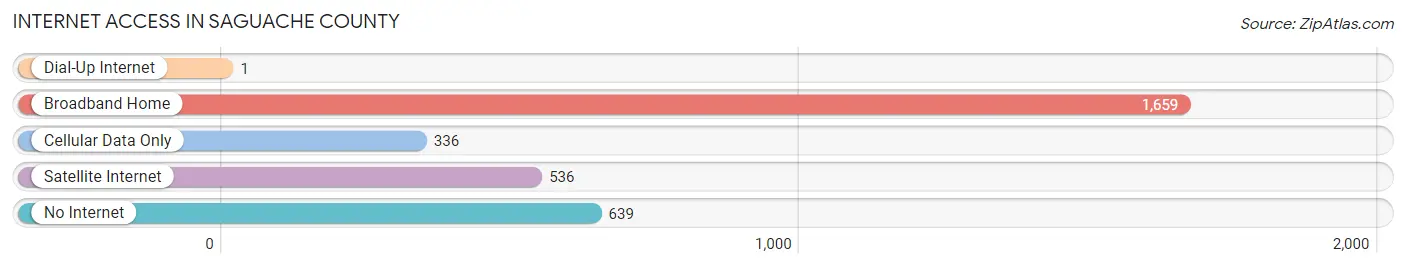
| Internet Type | # Households | % Households |
| Dial-Up Internet | 1 | 0.0% |
| Broadband Home | 1,659 | 54.0% |
| Cellular Data Only | 336 | 10.9% |
| Satellite Internet | 536 | 17.4% |
| No Internet | 639 | 20.8% |
| Total | 3,071 | 100.0% |
Saguache County Summary
Saguache County is located in the San Luis Valley of south-central Colorado. It is bordered by Rio Grande County to the north, Alamosa County to the east, Costilla County to the south, and Conejos County to the west. The county seat is Saguache, and the county has a total area of 2,941 square miles, making it the fourth largest county in Colorado.
History
The area that is now Saguache County was originally inhabited by the Ute and Apache tribes. The first Europeans to explore the area were Spanish explorers in the late 1700s. The county was officially established in 1866 and was named after the Ute word for “blue earth”.
The county was initially populated by miners and ranchers, and the first permanent settlement was established in 1867. The county was largely agricultural until the early 1900s, when the railroad arrived and the area began to develop. The county experienced a population boom in the 1920s, when the Great Depression hit and many people moved to the area in search of work.
Geography
Saguache County is located in the San Luis Valley, which is a large intermontane basin in south-central Colorado. The county is bordered by Rio Grande County to the north, Alamosa County to the east, Costilla County to the south, and Conejos County to the west. The county has a total area of 2,941 square miles, making it the fourth largest county in Colorado.
The county is mostly mountainous, with the Sangre de Cristo Mountains to the east and the San Juan Mountains to the west. The highest point in the county is Mount Ouray, which has an elevation of 13,971 feet. The county also contains several rivers, including the Rio Grande, the San Luis, and the Saguache.
Economy
The economy of Saguache County is largely based on agriculture and tourism. The county is home to several large farms, which produce a variety of crops, including potatoes, alfalfa, and hay. The county is also home to several tourist attractions, including the Great Sand Dunes National Park and the San Luis Valley National Wildlife Refuge.
The county also has a growing manufacturing sector, which includes several companies that produce food products, furniture, and other goods. The county is also home to several energy companies, which produce oil and natural gas.
Demographics
As of the 2010 census, the population of Saguache County was 6,108. The population is largely white (90.2%), with small Hispanic (7.2%) and Native American (1.2%) populations. The median household income is $37,917, and the median age is 41.
The county is largely rural, with only two incorporated towns: Saguache and Center. The county is served by two school districts, the Saguache County School District and the Center Consolidated School District. The county is also home to several higher education institutions, including Adams State University and the University of Colorado at Colorado Springs.
Common Questions
What is Per Capita Income in Saguache County?
Per Capita income in Saguache County is $34,311.
What is the Median Family Income in Saguache County?
Median Family Income in Saguache County is $58,552.
What is the Median Household income in Saguache County?
Median Household Income in Saguache County is $51,946.
What is Income or Wage Gap in Saguache County?
Income or Wage Gap in Saguache County is 40.9%.
Women in Saguache County earn 59.1 cents for every dollar earned by a man.
What is Family Income Deficit in Saguache County?
Family Income Deficit in Saguache County is $7,790.
Families that are below poverty line in Saguache County earn $7,790 less on average than the poverty threshold level.
What is Inequality or Gini Index in Saguache County?
Inequality or Gini Index in Saguache County is 0.52.
What is the Total Population of Saguache County?
Total Population of Saguache County is 6,454.
What is the Total Male Population of Saguache County?
Total Male Population of Saguache County is 3,274.
What is the Total Female Population of Saguache County?
Total Female Population of Saguache County is 3,180.
What is the Ratio of Males per 100 Females in Saguache County?
There are 102.96 Males per 100 Females in Saguache County.
What is the Ratio of Females per 100 Males in Saguache County?
There are 97.13 Females per 100 Males in Saguache County.
What is the Median Population Age in Saguache County?
Median Population Age in Saguache County is 49.9 Years.
What is the Average Family Size in Saguache County
Average Family Size in Saguache County is 2.6 People.
What is the Average Household Size in Saguache County
Average Household Size in Saguache County is 2.1 People.
How Large is the Labor Force in Saguache County?
There are 2,995 People in the Labor Forcein in Saguache County.
What is the Percentage of People in the Labor Force in Saguache County?
55.1% of People are in the Labor Force in Saguache County.
What is the Unemployment Rate in Saguache County?
Unemployment Rate in Saguache County is 10.0%.