Rio Grande County, CO Map & Demographics
Rio Grande County Map

Rio Grande County Overview
$34,328
PER CAPITA INCOME
$81,904
AVG FAMILY INCOME
$57,591
AVG HOUSEHOLD INCOME
6.2%
WAGE / INCOME GAP [ % ]
93.8¢/ $1
WAGE / INCOME GAP [ $ ]
$8,975
FAMILY INCOME DEFICIT
0.43
INEQUALITY / GINI INDEX
11,442
TOTAL POPULATION
5,913
MALE POPULATION
5,529
FEMALE POPULATION
106.95
MALES / 100 FEMALES
93.51
FEMALES / 100 MALES
41.3
MEDIAN AGE
2.9
AVG FAMILY SIZE
2.4
AVG HOUSEHOLD SIZE
5,654
LABOR FORCE [ PEOPLE ]
60.8%
PERCENT IN LABOR FORCE
6.0%
UNEMPLOYMENT RATE
Rio Grande County Area Codes
Income in Rio Grande County
Income Overview in Rio Grande County
Per Capita Income in Rio Grande County is $34,328, while median incomes of families and households are $81,904 and $57,591 respectively.
| Characteristic | Number | Measure |
| Per Capita Income | 11,442 | $34,328 |
| Median Family Income | 3,115 | $81,904 |
| Mean Family Income | 3,115 | $92,297 |
| Median Household Income | 4,657 | $57,591 |
| Mean Household Income | 4,657 | $78,305 |
| Income Deficit | 3,115 | $8,975 |
| Wage / Income Gap (%) | 11,442 | 6.24% |
| Wage / Income Gap ($) | 11,442 | 93.76¢ per $1 |
| Gini / Inequality Index | 11,442 | 0.43 |
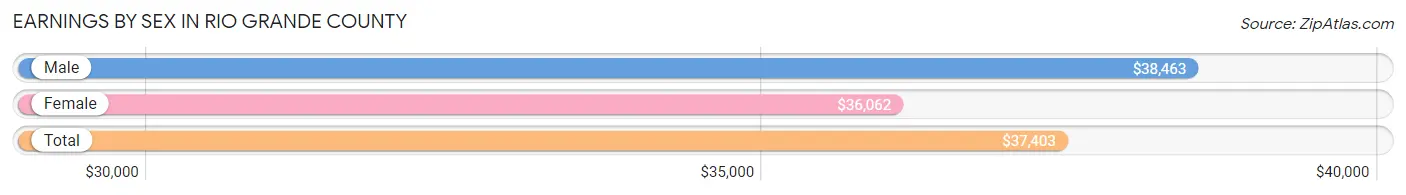
Earnings by Sex in Rio Grande County
Average Earnings in Rio Grande County are $37,403, $38,463 for men and $36,062 for women, a difference of 6.2%.
| Sex | Number | Average Earnings |
| Male | 3,485 (56.4%) | $38,463 |
| Female | 2,698 (43.6%) | $36,062 |
| Total | 6,183 (100.0%) | $37,403 |
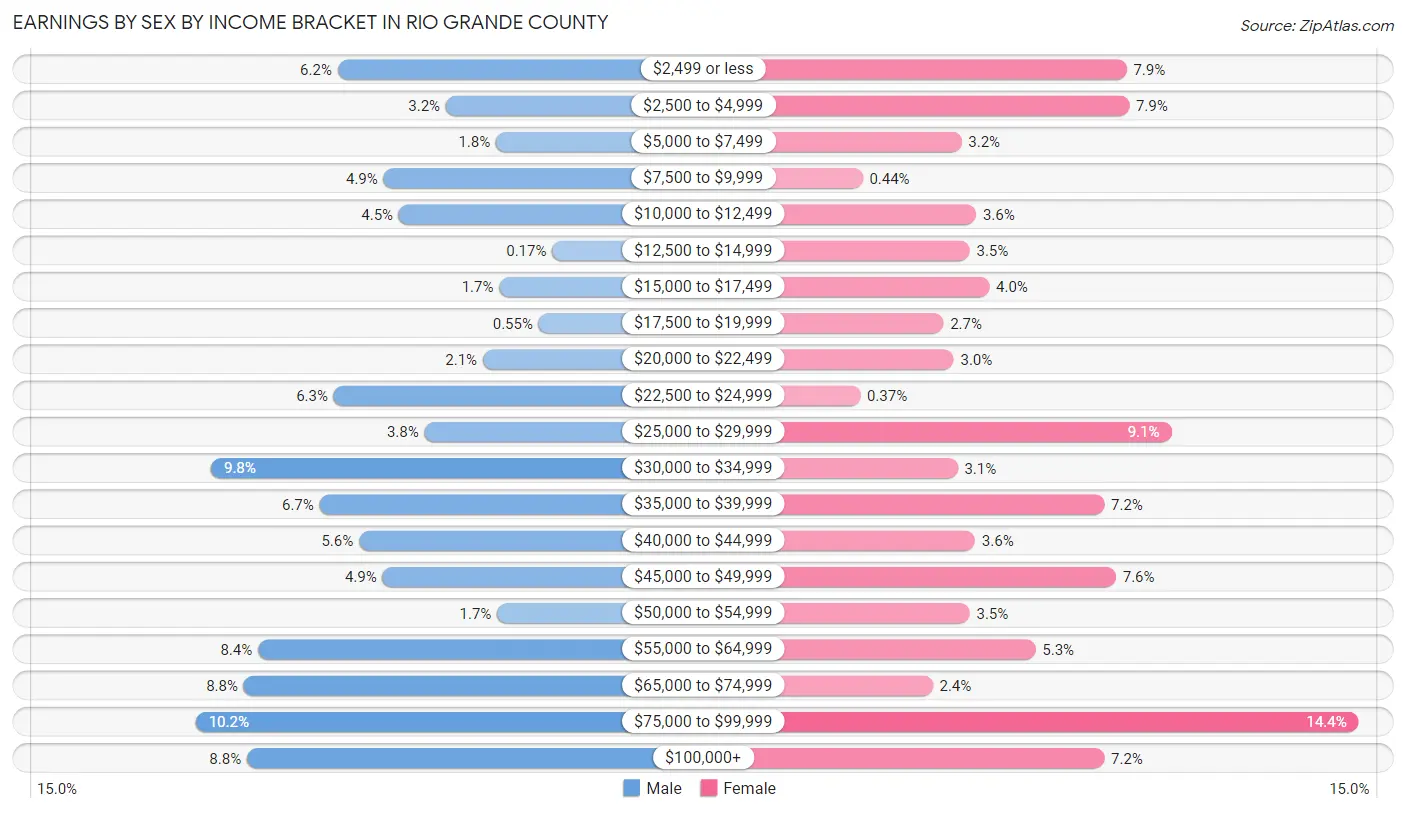
Earnings by Sex by Income Bracket in Rio Grande County
The most common earnings brackets in Rio Grande County are $75,000 to $99,999 for men (355 | 10.2%) and $75,000 to $99,999 for women (388 | 14.4%).
| Income | Male | Female |
| $2,499 or less | 216 (6.2%) | 212 (7.9%) |
| $2,500 to $4,999 | 110 (3.2%) | 214 (7.9%) |
| $5,000 to $7,499 | 61 (1.8%) | 87 (3.2%) |
| $7,500 to $9,999 | 171 (4.9%) | 12 (0.4%) |
| $10,000 to $12,499 | 156 (4.5%) | 98 (3.6%) |
| $12,500 to $14,999 | 6 (0.2%) | 93 (3.5%) |
| $15,000 to $17,499 | 58 (1.7%) | 108 (4.0%) |
| $17,500 to $19,999 | 19 (0.5%) | 73 (2.7%) |
| $20,000 to $22,499 | 74 (2.1%) | 81 (3.0%) |
| $22,500 to $24,999 | 220 (6.3%) | 10 (0.4%) |
| $25,000 to $29,999 | 131 (3.8%) | 246 (9.1%) |
| $30,000 to $34,999 | 340 (9.8%) | 84 (3.1%) |
| $35,000 to $39,999 | 234 (6.7%) | 195 (7.2%) |
| $40,000 to $44,999 | 195 (5.6%) | 97 (3.6%) |
| $45,000 to $49,999 | 172 (4.9%) | 204 (7.6%) |
| $50,000 to $54,999 | 60 (1.7%) | 93 (3.5%) |
| $55,000 to $64,999 | 294 (8.4%) | 143 (5.3%) |
| $65,000 to $74,999 | 308 (8.8%) | 65 (2.4%) |
| $75,000 to $99,999 | 355 (10.2%) | 388 (14.4%) |
| $100,000+ | 305 (8.7%) | 195 (7.2%) |
| Total | 3,485 (100.0%) | 2,698 (100.0%) |
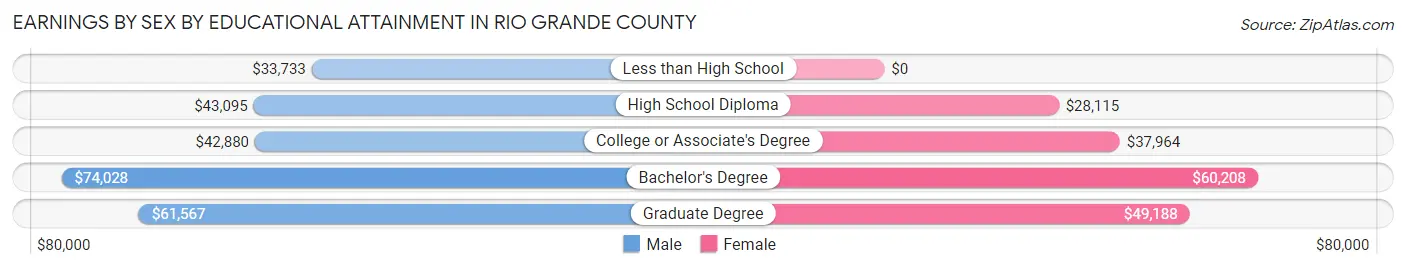
Earnings by Sex by Educational Attainment in Rio Grande County
Average earnings in Rio Grande County are $45,664 for men and $43,380 for women, a difference of 5.0%. Men with an educational attainment of bachelor's degree enjoy the highest average annual earnings of $74,028, while those with less than high school education earn the least with $33,733. Women with an educational attainment of bachelor's degree earn the most with the average annual earnings of $60,208, while those with high school diploma education have the smallest earnings of $28,115.
| Educational Attainment | Male Income | Female Income |
| Less than High School | $33,733 | $0 |
| High School Diploma | $43,095 | $28,115 |
| College or Associate's Degree | $42,880 | $37,964 |
| Bachelor's Degree | $74,028 | $60,208 |
| Graduate Degree | $61,567 | $49,188 |
| Total | $45,664 | $43,380 |
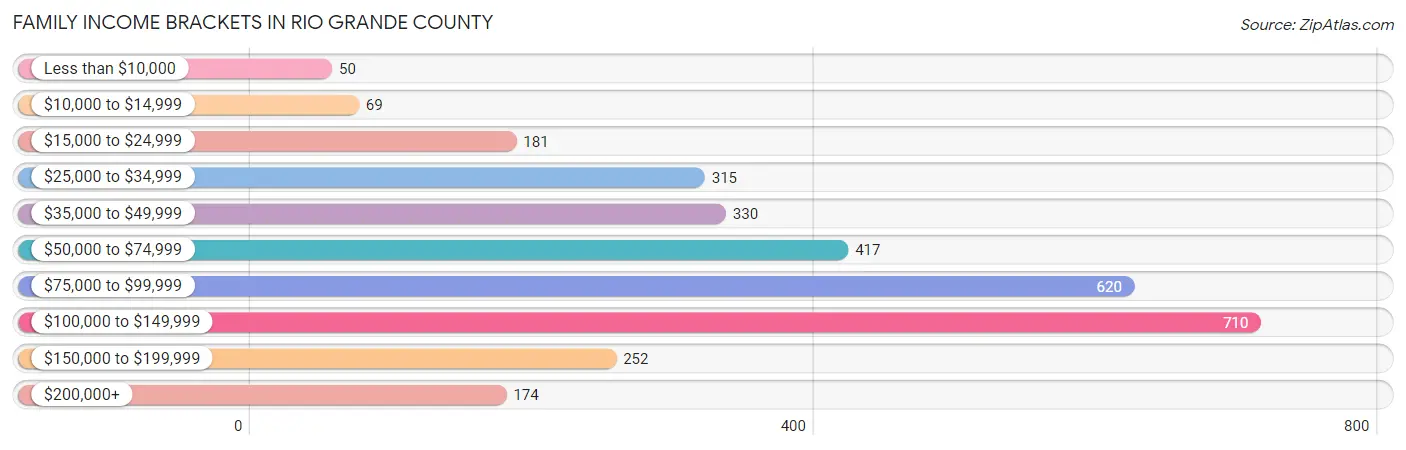
Family Income in Rio Grande County
Family Income Brackets in Rio Grande County
According to the Rio Grande County family income data, there are 710 families falling into the $100,000 to $149,999 income range, which is the most common income bracket and makes up 22.8% of all families. Conversely, the less than $10,000 income bracket is the least frequent group with only 50 families (1.6%) belonging to this category.
| Income Bracket | # Families | % Families |
| Less than $10,000 | 50 | 1.6% |
| $10,000 to $14,999 | 69 | 2.2% |
| $15,000 to $24,999 | 181 | 5.8% |
| $25,000 to $34,999 | 315 | 10.1% |
| $35,000 to $49,999 | 330 | 10.6% |
| $50,000 to $74,999 | 417 | 13.4% |
| $75,000 to $99,999 | 620 | 19.9% |
| $100,000 to $149,999 | 710 | 22.8% |
| $150,000 to $199,999 | 252 | 8.1% |
| $200,000+ | 174 | 5.6% |
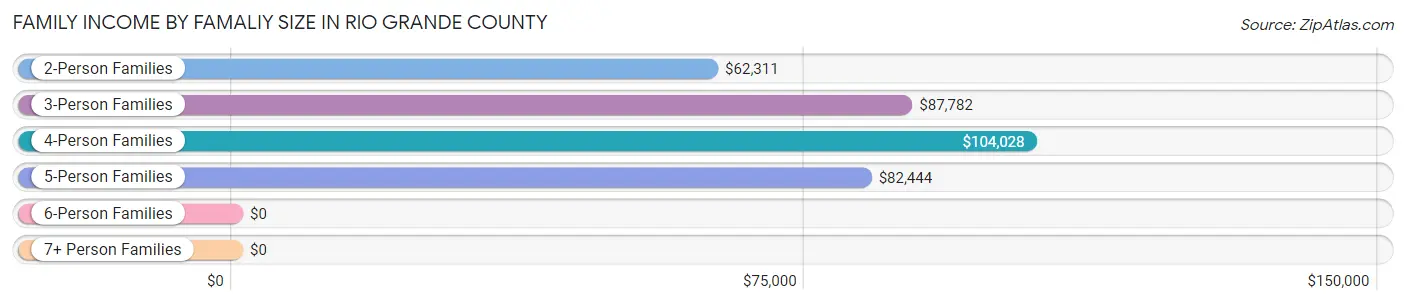
Family Income by Famaliy Size in Rio Grande County
4-person families (407 | 13.1%) account for the highest median family income in Rio Grande County with $104,028 per family, while 2-person families (1,663 | 53.4%) have the highest median income of $31,156 per family member.
| Income Bracket | # Families | Median Income |
| 2-Person Families | 1,663 (53.4%) | $62,311 |
| 3-Person Families | 811 (26.0%) | $87,782 |
| 4-Person Families | 407 (13.1%) | $104,028 |
| 5-Person Families | 185 (5.9%) | $82,444 |
| 6-Person Families | 49 (1.6%) | $0 |
| 7+ Person Families | 0 (0.0%) | $0 |
| Total | 3,115 (100.0%) | $81,904 |
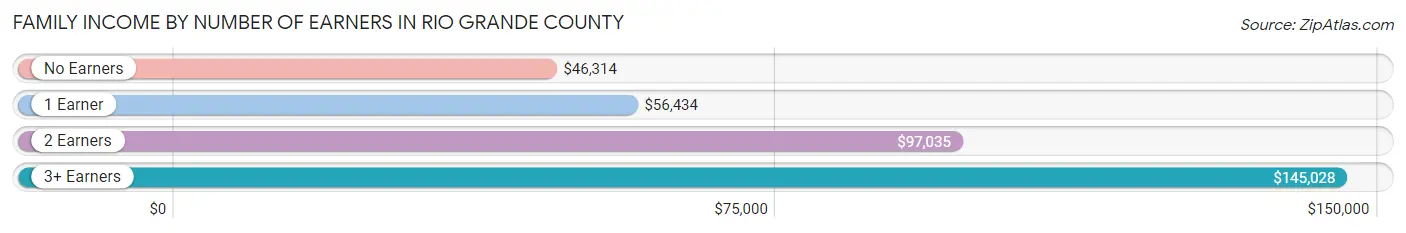
Family Income by Number of Earners in Rio Grande County
The median family income in Rio Grande County is $81,904, with families comprising 3+ earners (261) having the highest median family income of $145,028, while families with no earners (589) have the lowest median family income of $46,314, accounting for 8.4% and 18.9% of families, respectively.
| Number of Earners | # Families | Median Income |
| No Earners | 589 (18.9%) | $46,314 |
| 1 Earner | 905 (29.0%) | $56,434 |
| 2 Earners | 1,360 (43.7%) | $97,035 |
| 3+ Earners | 261 (8.4%) | $145,028 |
| Total | 3,115 (100.0%) | $81,904 |
Household Income in Rio Grande County
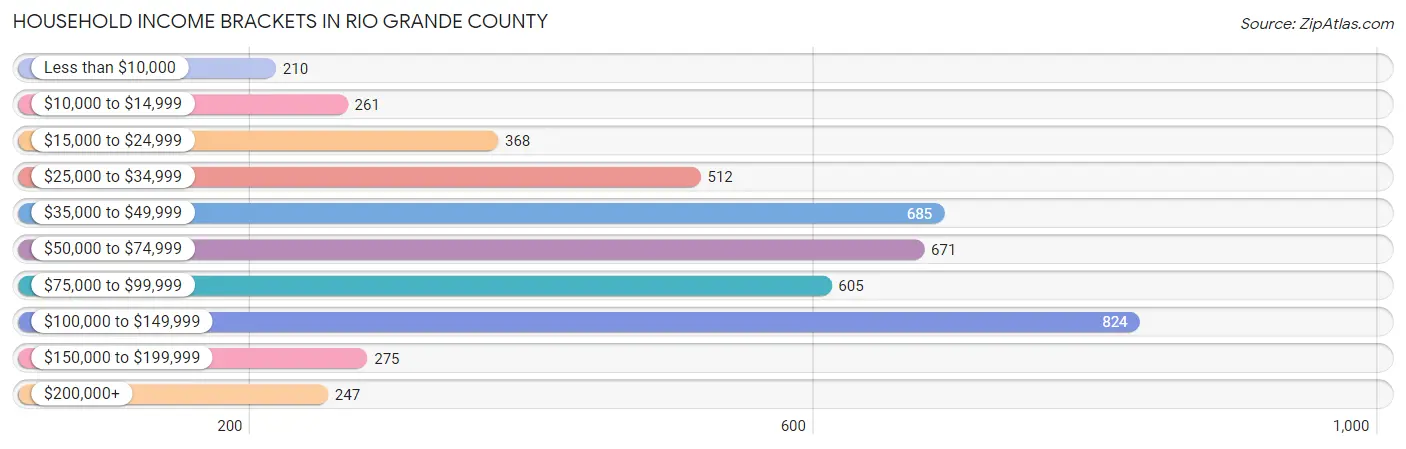
Household Income Brackets in Rio Grande County
With 824 households falling in the category, the $100,000 to $149,999 income range is the most frequent in Rio Grande County, accounting for 17.7% of all households. In contrast, only 210 households (4.5%) fall into the less than $10,000 income bracket, making it the least populous group.
| Income Bracket | # Households | % Households |
| Less than $10,000 | 210 | 4.5% |
| $10,000 to $14,999 | 261 | 5.6% |
| $15,000 to $24,999 | 368 | 7.9% |
| $25,000 to $34,999 | 512 | 11.0% |
| $35,000 to $49,999 | 685 | 14.7% |
| $50,000 to $74,999 | 671 | 14.4% |
| $75,000 to $99,999 | 605 | 13.0% |
| $100,000 to $149,999 | 824 | 17.7% |
| $150,000 to $199,999 | 275 | 5.9% |
| $200,000+ | 247 | 5.3% |
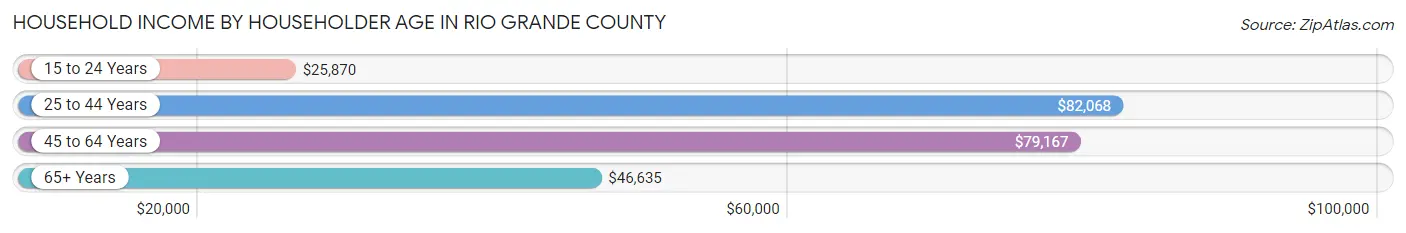
Household Income by Householder Age in Rio Grande County
The median household income in Rio Grande County is $57,591, with the highest median household income of $82,068 found in the 25 to 44 years age bracket for the primary householder. A total of 1,236 households (26.5%) fall into this category. Meanwhile, the 15 to 24 years age bracket for the primary householder has the lowest median household income of $25,870, with 282 households (6.1%) in this group.
| Income Bracket | # Households | Median Income |
| 15 to 24 Years | 282 (6.1%) | $25,870 |
| 25 to 44 Years | 1,236 (26.5%) | $82,068 |
| 45 to 64 Years | 1,678 (36.0%) | $79,167 |
| 65+ Years | 1,461 (31.4%) | $46,635 |
| Total | 4,657 (100.0%) | $57,591 |
Poverty in Rio Grande County
Income Below Poverty by Sex and Age in Rio Grande County
With 8.8% poverty level for males and 11.8% for females among the residents of Rio Grande County, under 5 year old males and 5 year old females are the most vulnerable to poverty, with 59 males (24.5%) and 38 females (53.5%) in their respective age groups living below the poverty level.
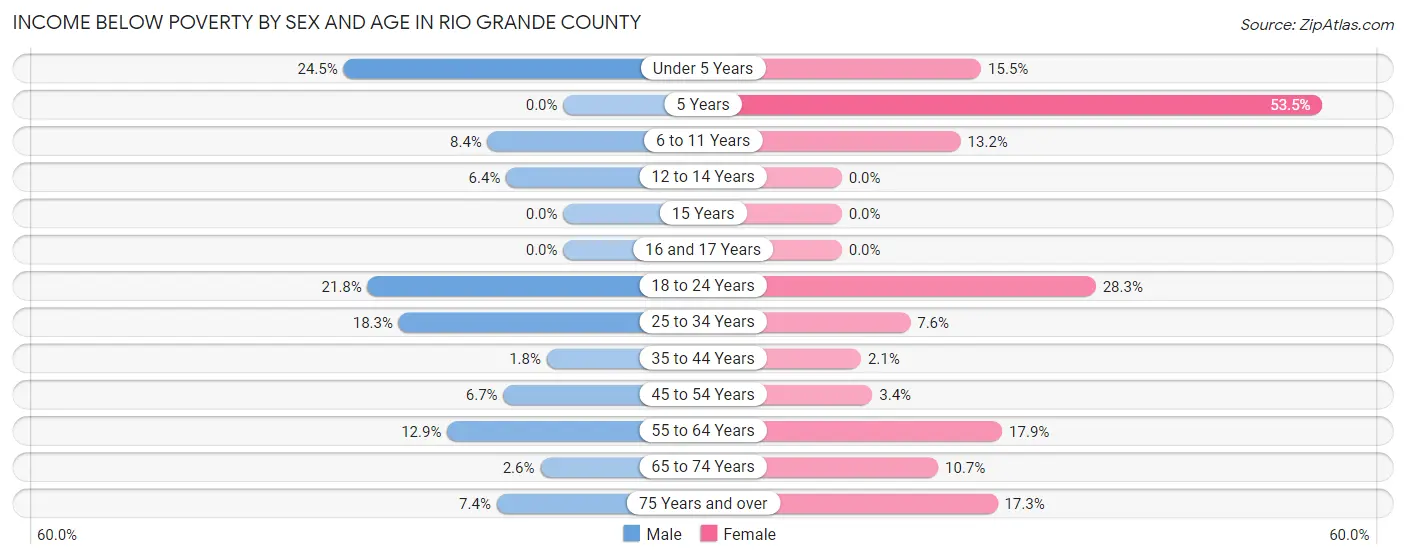
| Age Bracket | Male | Female |
| Under 5 Years | 59 (24.5%) | 54 (15.5%) |
| 5 Years | 0 (0.0%) | 38 (53.5%) |
| 6 to 11 Years | 30 (8.4%) | 47 (13.2%) |
| 12 to 14 Years | 26 (6.4%) | 0 (0.0%) |
| 15 Years | 0 (0.0%) | 0 (0.0%) |
| 16 and 17 Years | 0 (0.0%) | 0 (0.0%) |
| 18 to 24 Years | 109 (21.8%) | 123 (28.3%) |
| 25 to 34 Years | 81 (18.3%) | 38 (7.6%) |
| 35 to 44 Years | 20 (1.8%) | 20 (2.1%) |
| 45 to 54 Years | 39 (6.7%) | 18 (3.4%) |
| 55 to 64 Years | 101 (12.9%) | 142 (17.9%) |
| 65 to 74 Years | 18 (2.6%) | 78 (10.7%) |
| 75 Years and over | 29 (7.4%) | 81 (17.3%) |
| Total | 512 (8.8%) | 639 (11.8%) |
Income Above Poverty by Sex and Age in Rio Grande County
According to the poverty statistics in Rio Grande County, males aged 5 years and females aged 12 to 14 years are the age groups that are most secure financially, with 100.0% of males and 100.0% of females in these age groups living above the poverty line.
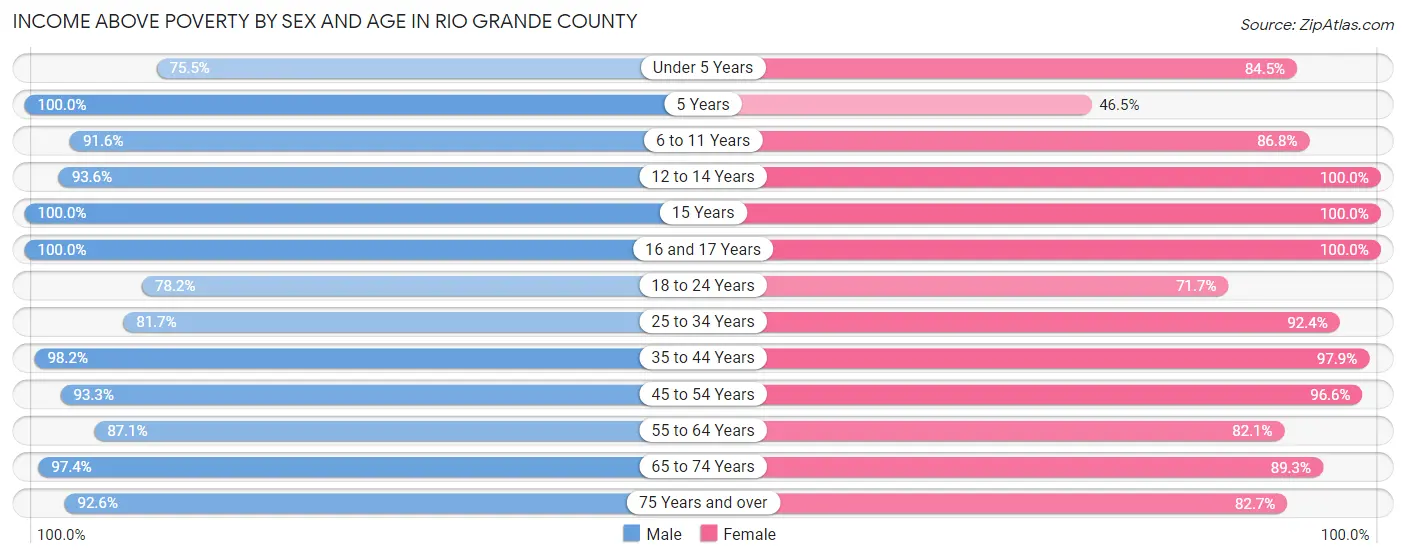
| Age Bracket | Male | Female |
| Under 5 Years | 182 (75.5%) | 294 (84.5%) |
| 5 Years | 23 (100.0%) | 33 (46.5%) |
| 6 to 11 Years | 326 (91.6%) | 308 (86.8%) |
| 12 to 14 Years | 383 (93.6%) | 165 (100.0%) |
| 15 Years | 107 (100.0%) | 9 (100.0%) |
| 16 and 17 Years | 177 (100.0%) | 87 (100.0%) |
| 18 to 24 Years | 391 (78.2%) | 312 (71.7%) |
| 25 to 34 Years | 361 (81.7%) | 460 (92.4%) |
| 35 to 44 Years | 1,065 (98.2%) | 916 (97.9%) |
| 45 to 54 Years | 546 (93.3%) | 512 (96.6%) |
| 55 to 64 Years | 680 (87.1%) | 653 (82.1%) |
| 65 to 74 Years | 683 (97.4%) | 649 (89.3%) |
| 75 Years and over | 362 (92.6%) | 386 (82.7%) |
| Total | 5,286 (91.2%) | 4,784 (88.2%) |
Income Below Poverty Among Married-Couple Families in Rio Grande County
The poverty statistics for married-couple families in Rio Grande County show that 2.2% or 50 of the total 2,275 families live below the poverty line. Families with 3 or 4 children have the highest poverty rate of 7.9%, comprising of 14 families. On the other hand, families with 1 or 2 children have the lowest poverty rate of 0.0%, which includes 0 families.
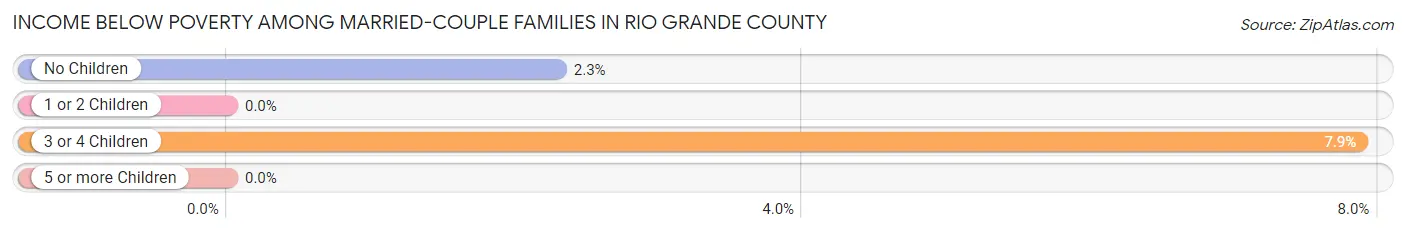
| Children | Above Poverty | Below Poverty |
| No Children | 1,535 (97.7%) | 36 (2.3%) |
| 1 or 2 Children | 526 (100.0%) | 0 (0.0%) |
| 3 or 4 Children | 164 (92.1%) | 14 (7.9%) |
| 5 or more Children | 0 (0.0%) | 0 (0.0%) |
| Total | 2,225 (97.8%) | 50 (2.2%) |
Income Below Poverty Among Single-Parent Households in Rio Grande County
According to the poverty data in Rio Grande County, 6.3% or 14 single-father households and 14.9% or 92 single-mother households are living below the poverty line. Among single-father households, those with no children have the highest poverty rate, with 8 households (7.4%) experiencing poverty. Likewise, among single-mother households, those with 3 or 4 children have the highest poverty rate, with 24 households (100.0%) falling below the poverty line.
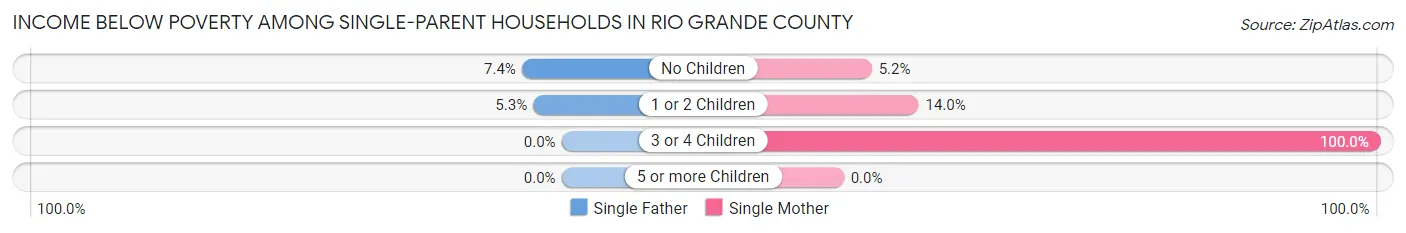
| Children | Single Father | Single Mother |
| No Children | 8 (7.4%) | 9 (5.2%) |
| 1 or 2 Children | 6 (5.3%) | 59 (14.0%) |
| 3 or 4 Children | 0 (0.0%) | 24 (100.0%) |
| 5 or more Children | 0 (0.0%) | 0 (0.0%) |
| Total | 14 (6.3%) | 92 (14.9%) |
Income Below Poverty Among Married-Couple vs Single-Parent Households in Rio Grande County
The poverty data for Rio Grande County shows that 50 of the married-couple family households (2.2%) and 106 of the single-parent households (12.6%) are living below the poverty level. Within the married-couple family households, those with 3 or 4 children have the highest poverty rate, with 14 households (7.9%) falling below the poverty line. Among the single-parent households, those with 3 or 4 children have the highest poverty rate, with 24 household (100.0%) living below poverty.
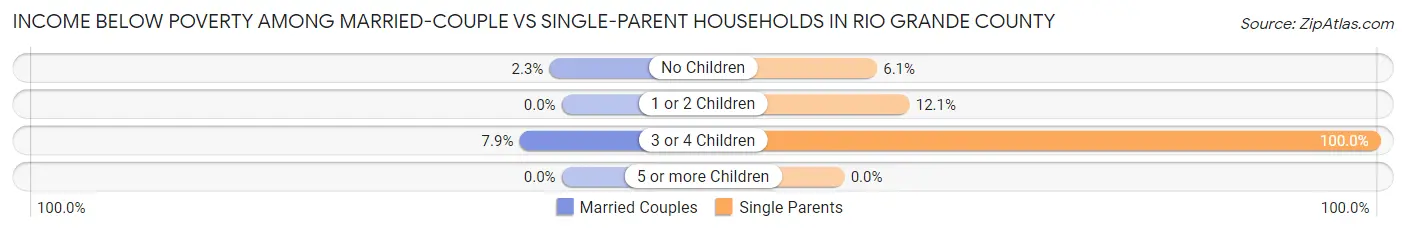
| Children | Married-Couple Families | Single-Parent Households |
| No Children | 36 (2.3%) | 17 (6.1%) |
| 1 or 2 Children | 0 (0.0%) | 65 (12.1%) |
| 3 or 4 Children | 14 (7.9%) | 24 (100.0%) |
| 5 or more Children | 0 (0.0%) | 0 (0.0%) |
| Total | 50 (2.2%) | 106 (12.6%) |
Race in Rio Grande County
The most populous races in Rio Grande County are White / Caucasian (8,757 | 76.5%), Hispanic or Latino (5,086 | 44.5%), and Two or more Races (1,676 | 14.6%).
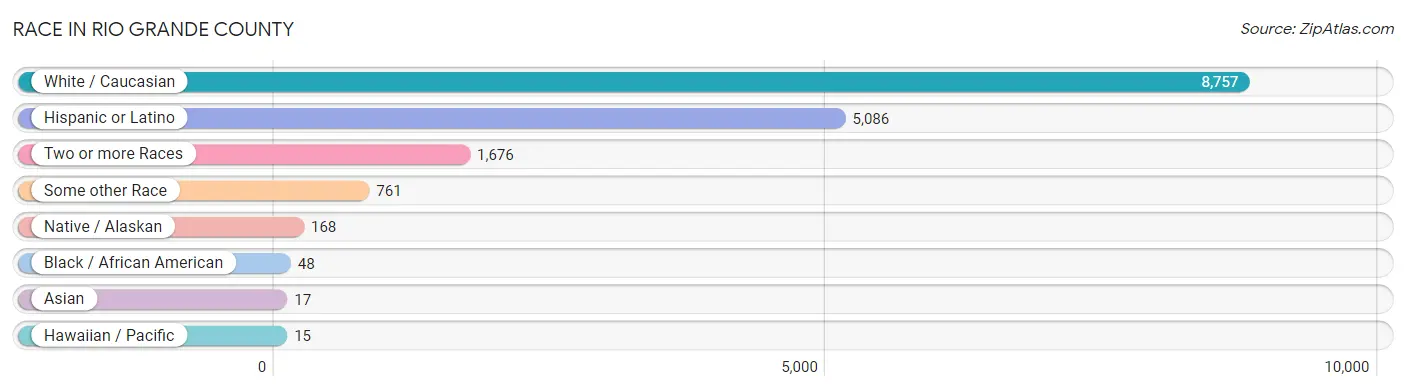
| Race | # Population | % Population |
| Asian | 17 | 0.2% |
| Black / African American | 48 | 0.4% |
| Hawaiian / Pacific | 15 | 0.1% |
| Hispanic or Latino | 5,086 | 44.5% |
| Native / Alaskan | 168 | 1.5% |
| White / Caucasian | 8,757 | 76.5% |
| Two or more Races | 1,676 | 14.6% |
| Some other Race | 761 | 6.7% |
| Total | 11,442 | 100.0% |
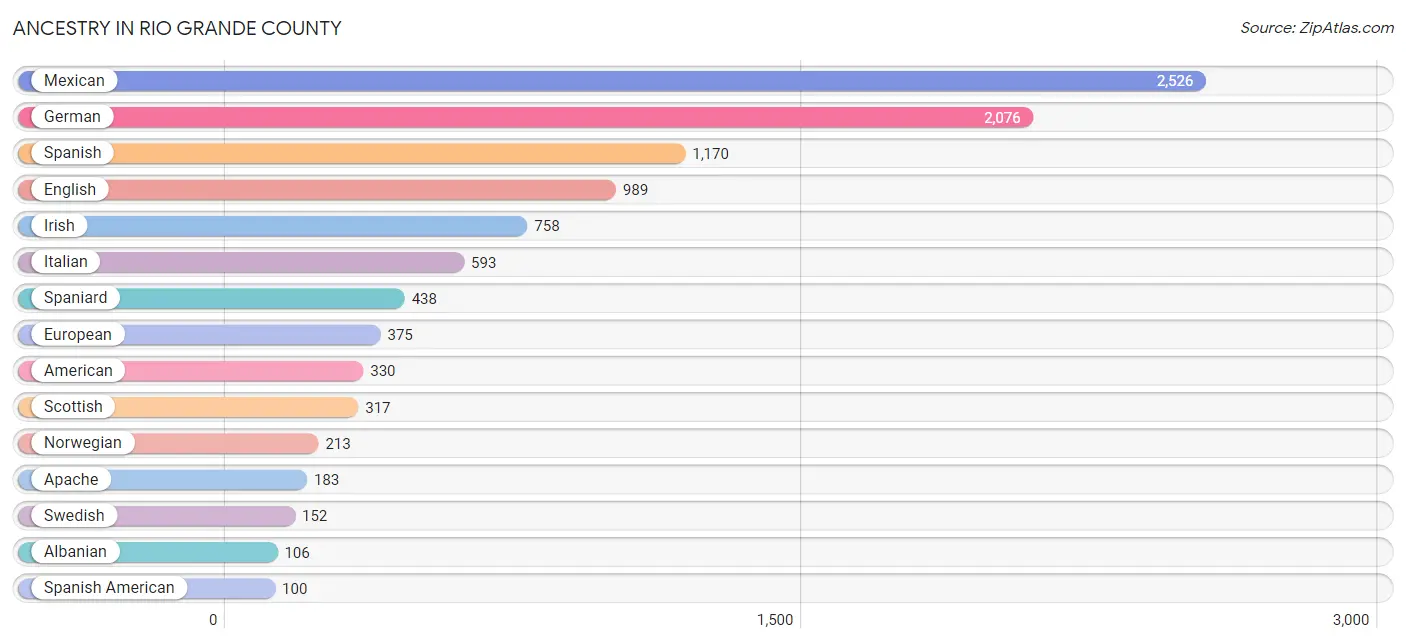
Ancestry in Rio Grande County
The most populous ancestries reported in Rio Grande County are Mexican (2,526 | 22.1%), German (2,076 | 18.1%), Spanish (1,170 | 10.2%), English (989 | 8.6%), and Irish (758 | 6.6%), together accounting for 65.7% of all Rio Grande County residents.
| Ancestry | # Population | % Population |
| Albanian | 106 | 0.9% |
| American | 330 | 2.9% |
| Apache | 183 | 1.6% |
| Austrian | 19 | 0.2% |
| Belgian | 1 | 0.0% |
| Bhutanese | 12 | 0.1% |
| Blackfeet | 46 | 0.4% |
| British | 18 | 0.2% |
| Burmese | 8 | 0.1% |
| Canadian | 19 | 0.2% |
| Cherokee | 36 | 0.3% |
| Choctaw | 32 | 0.3% |
| Comanche | 5 | 0.0% |
| Creek | 2 | 0.0% |
| Cuban | 6 | 0.1% |
| Czech | 52 | 0.4% |
| Czechoslovakian | 7 | 0.1% |
| Danish | 48 | 0.4% |
| Dutch | 92 | 0.8% |
| Eastern European | 9 | 0.1% |
| English | 989 | 8.6% |
| European | 375 | 3.3% |
| French | 97 | 0.9% |
| French Canadian | 1 | 0.0% |
| German | 2,076 | 18.1% |
| Greek | 6 | 0.1% |
| Hungarian | 10 | 0.1% |
| Irish | 758 | 6.6% |
| Italian | 593 | 5.2% |
| Mexican | 2,526 | 22.1% |
| Native Hawaiian | 15 | 0.1% |
| Navajo | 41 | 0.4% |
| Northern European | 52 | 0.4% |
| Norwegian | 213 | 1.9% |
| Pennsylvania German | 7 | 0.1% |
| Polish | 76 | 0.7% |
| Portuguese | 13 | 0.1% |
| Potawatomi | 21 | 0.2% |
| Puerto Rican | 38 | 0.3% |
| Romanian | 6 | 0.1% |
| Russian | 71 | 0.6% |
| Scandinavian | 44 | 0.4% |
| Scotch-Irish | 67 | 0.6% |
| Scottish | 317 | 2.8% |
| Sioux | 17 | 0.2% |
| Slovak | 7 | 0.1% |
| South American | 61 | 0.5% |
| Spaniard | 438 | 3.8% |
| Spanish | 1,170 | 10.2% |
| Spanish American | 100 | 0.9% |
| Spanish American Indian | 32 | 0.3% |
| Swedish | 152 | 1.3% |
| Swiss | 39 | 0.3% |
| Turkish | 67 | 0.6% |
| Ukrainian | 3 | 0.0% |
| Uruguayan | 61 | 0.5% |
| Ute | 94 | 0.8% |
| Welsh | 78 | 0.7% | View All 58 Rows |
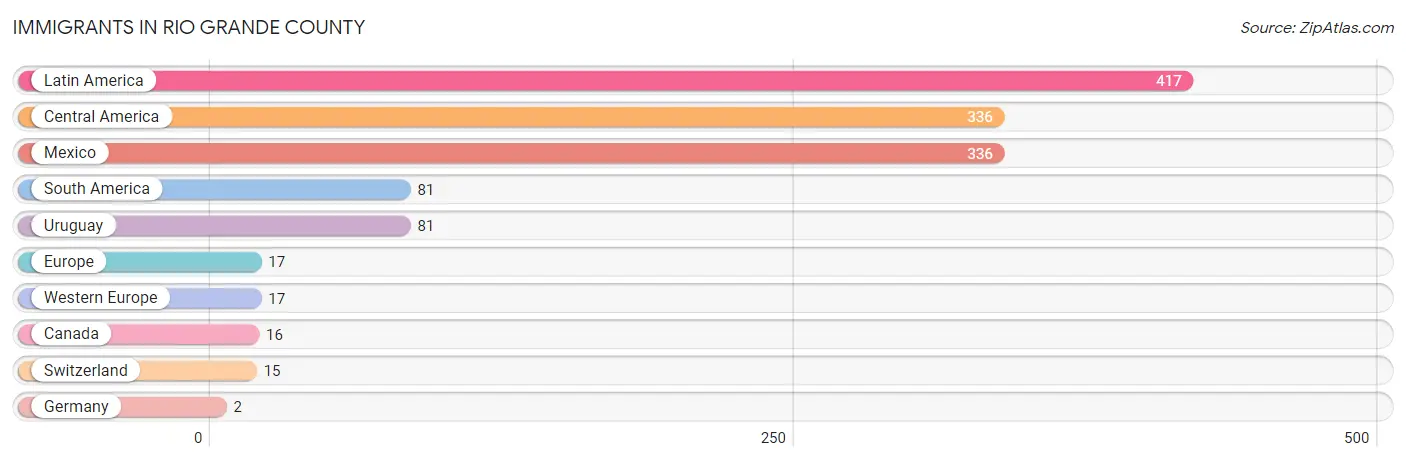
Immigrants in Rio Grande County
The most numerous immigrant groups reported in Rio Grande County came from Latin America (417 | 3.6%), Central America (336 | 2.9%), Mexico (336 | 2.9%), South America (81 | 0.7%), and Uruguay (81 | 0.7%), together accounting for 10.9% of all Rio Grande County residents.
| Immigration Origin | # Population | % Population |
| Canada | 16 | 0.1% |
| Central America | 336 | 2.9% |
| Europe | 17 | 0.2% |
| Germany | 2 | 0.0% |
| Latin America | 417 | 3.6% |
| Mexico | 336 | 2.9% |
| South America | 81 | 0.7% |
| Switzerland | 15 | 0.1% |
| Uruguay | 81 | 0.7% |
| Western Europe | 17 | 0.2% | View All 10 Rows |
Sex and Age in Rio Grande County
Sex and Age in Rio Grande County
The most populous age groups in Rio Grande County are 10 to 14 Years (639 | 10.8%) for men and 35 to 39 Years (657 | 11.9%) for women.
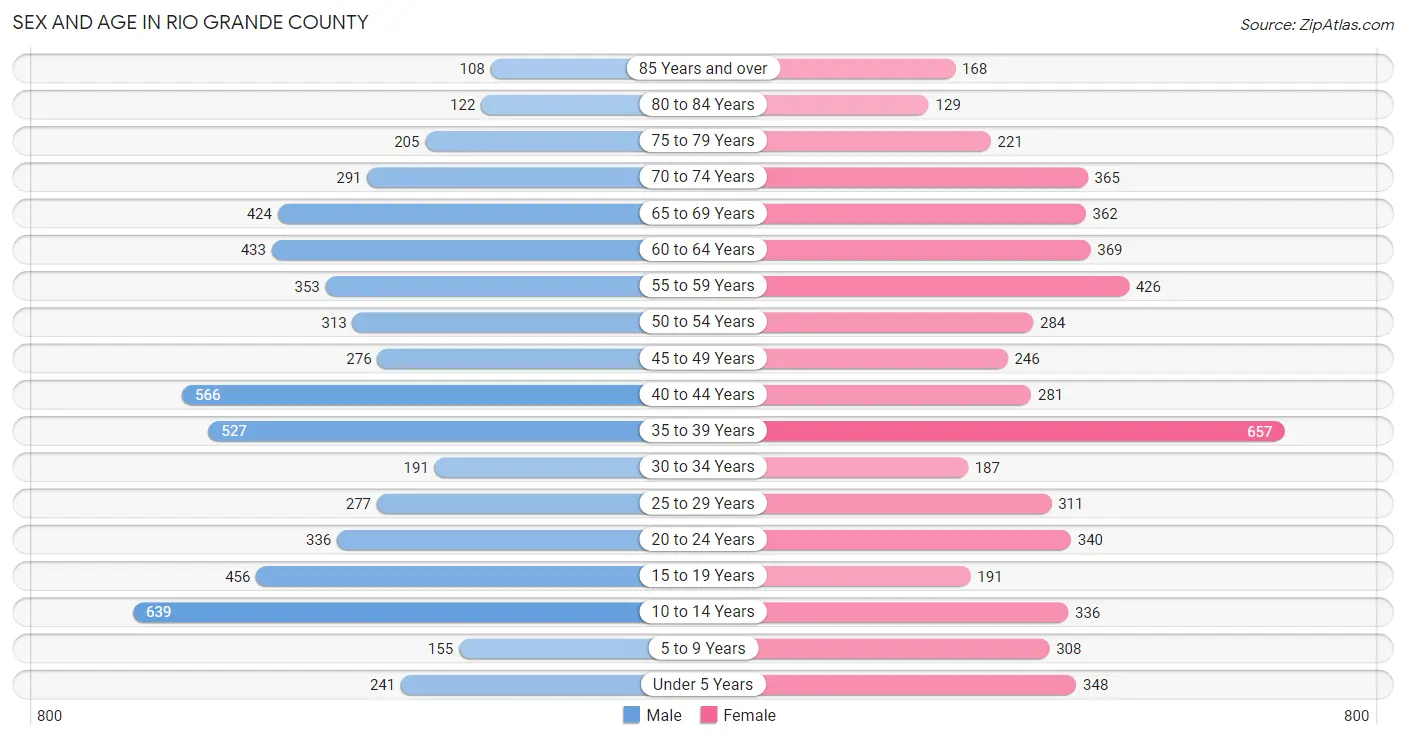
| Age Bracket | Male | Female |
| Under 5 Years | 241 (4.1%) | 348 (6.3%) |
| 5 to 9 Years | 155 (2.6%) | 308 (5.6%) |
| 10 to 14 Years | 639 (10.8%) | 336 (6.1%) |
| 15 to 19 Years | 456 (7.7%) | 191 (3.5%) |
| 20 to 24 Years | 336 (5.7%) | 340 (6.1%) |
| 25 to 29 Years | 277 (4.7%) | 311 (5.6%) |
| 30 to 34 Years | 191 (3.2%) | 187 (3.4%) |
| 35 to 39 Years | 527 (8.9%) | 657 (11.9%) |
| 40 to 44 Years | 566 (9.6%) | 281 (5.1%) |
| 45 to 49 Years | 276 (4.7%) | 246 (4.4%) |
| 50 to 54 Years | 313 (5.3%) | 284 (5.1%) |
| 55 to 59 Years | 353 (6.0%) | 426 (7.7%) |
| 60 to 64 Years | 433 (7.3%) | 369 (6.7%) |
| 65 to 69 Years | 424 (7.2%) | 362 (6.6%) |
| 70 to 74 Years | 291 (4.9%) | 365 (6.6%) |
| 75 to 79 Years | 205 (3.5%) | 221 (4.0%) |
| 80 to 84 Years | 122 (2.1%) | 129 (2.3%) |
| 85 Years and over | 108 (1.8%) | 168 (3.0%) |
| Total | 5,913 (100.0%) | 5,529 (100.0%) |
Families and Households in Rio Grande County
Median Family Size in Rio Grande County
The median family size in Rio Grande County is 2.91 persons per family, with single female/mother families (619 | 19.9%) accounting for the largest median family size of 3.28 persons per family. On the other hand, single male/father families (221 | 7.1%) represent the smallest median family size with 2.28 persons per family.
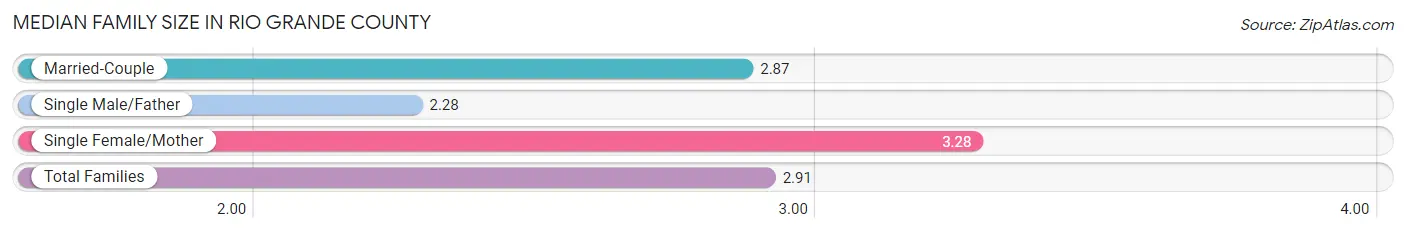
| Family Type | # Families | Family Size |
| Married-Couple | 2,275 (73.0%) | 2.87 |
| Single Male/Father | 221 (7.1%) | 2.28 |
| Single Female/Mother | 619 (19.9%) | 3.28 |
| Total Families | 3,115 (100.0%) | 2.91 |
Median Household Size in Rio Grande County
The median household size in Rio Grande County is 2.41 persons per household, with single female/mother households (619 | 13.3%) accounting for the largest median household size of 3.76 persons per household. non-family households (1,542 | 33.1%) represent the smallest median household size with 1.13 persons per household.
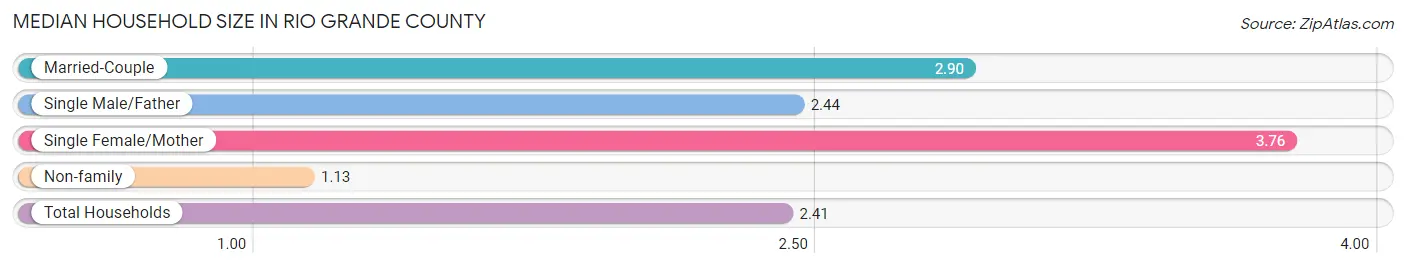
| Household Type | # Households | Household Size |
| Married-Couple | 2,275 (48.8%) | 2.90 |
| Single Male/Father | 221 (4.8%) | 2.44 |
| Single Female/Mother | 619 (13.3%) | 3.76 |
| Non-family | 1,542 (33.1%) | 1.13 |
| Total Households | 4,657 (100.0%) | 2.41 |
Household Size by Marriage Status in Rio Grande County
Out of a total of 4,657 households in Rio Grande County, 3,115 (66.9%) are family households, while 1,542 (33.1%) are nonfamily households. The most numerous type of family households are 2-person households, comprising 1,531, and the most common type of nonfamily households are 1-person households, comprising 1,294.
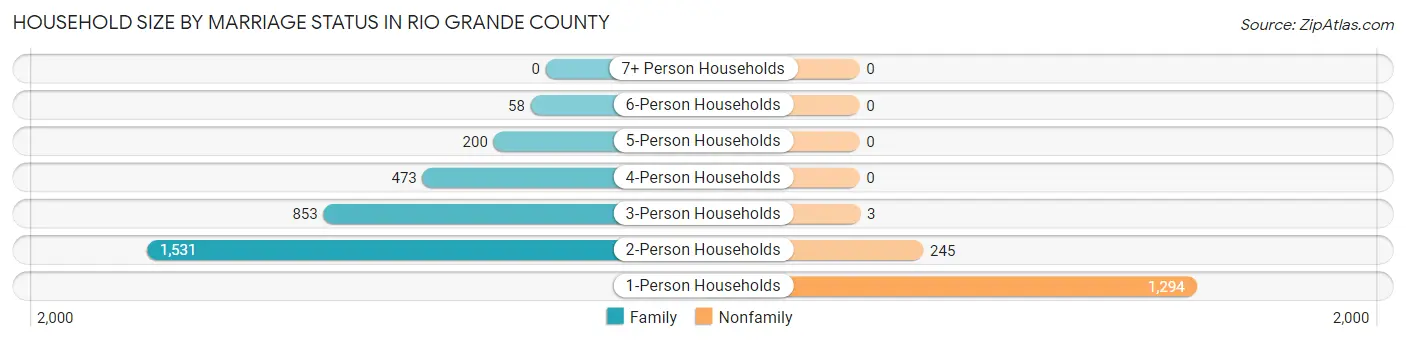
| Household Size | Family Households | Nonfamily Households |
| 1-Person Households | - | 1,294 (27.8%) |
| 2-Person Households | 1,531 (32.9%) | 245 (5.3%) |
| 3-Person Households | 853 (18.3%) | 3 (0.1%) |
| 4-Person Households | 473 (10.2%) | 0 (0.0%) |
| 5-Person Households | 200 (4.3%) | 0 (0.0%) |
| 6-Person Households | 58 (1.3%) | 0 (0.0%) |
| 7+ Person Households | 0 (0.0%) | 0 (0.0%) |
| Total | 3,115 (66.9%) | 1,542 (33.1%) |
Female Fertility in Rio Grande County
Fertility by Age in Rio Grande County
Average fertility rate in Rio Grande County is 48.0 births per 1,000 women. Women in the age bracket of 20 to 34 years have the highest fertility rate with 126.0 births per 1,000 women. Women in the age bracket of 20 to 34 years acount for 96.4% of all women with births.
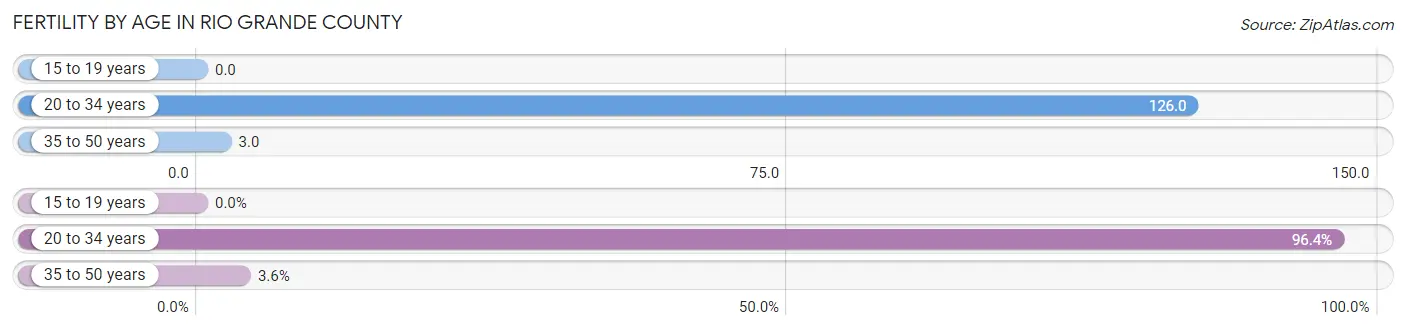
| Age Bracket | Women with Births | Births / 1,000 Women |
| 15 to 19 years | 0 (0.0%) | 0.0 |
| 20 to 34 years | 106 (96.4%) | 126.0 |
| 35 to 50 years | 4 (3.6%) | 3.0 |
| Total | 110 (100.0%) | 48.0 |
Fertility by Age by Marriage Status in Rio Grande County
57.3% of women with births (110) in Rio Grande County are married. The highest percentage of unmarried women with births falls into 20 to 34 years age bracket with 44.3% of them unmarried at the time of birth, while the lowest percentage of unmarried women with births belong to 35 to 50 years age bracket with 0.0% of them unmarried.

| Age Bracket | Married | Unmarried |
| 15 to 19 years | 0 (0.0%) | 0 (0.0%) |
| 20 to 34 years | 59 (55.7%) | 47 (44.3%) |
| 35 to 50 years | 4 (100.0%) | 0 (0.0%) |
| Total | 63 (57.3%) | 47 (42.7%) |
Fertility by Education in Rio Grande County
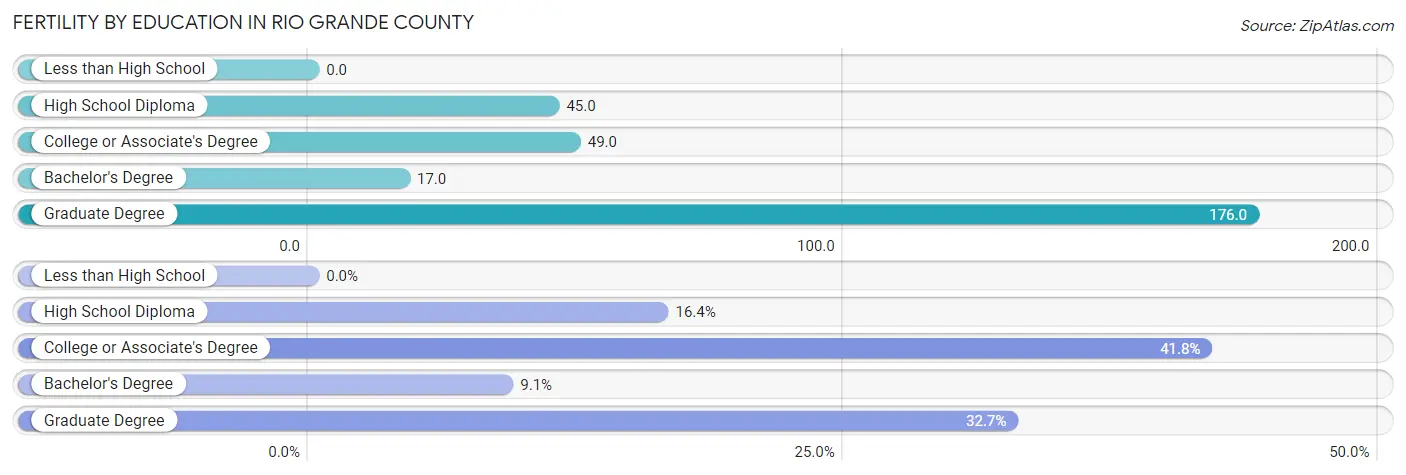
| Educational Attainment | Women with Births | Births / 1,000 Women |
| Less than High School | 0 (0.0%) | 0.0 |
| High School Diploma | 18 (16.4%) | 45.0 |
| College or Associate's Degree | 46 (41.8%) | 49.0 |
| Bachelor's Degree | 10 (9.1%) | 17.0 |
| Graduate Degree | 36 (32.7%) | 176.0 |
| Total | 110 (100.0%) | 48.0 |
Fertility by Education by Marriage Status in Rio Grande County
42.7% of women with births in Rio Grande County are unmarried. Women with the educational attainment of bachelor's degree are most likely to be married with 100.0% of them married at childbirth, while women with the educational attainment of college or associate's degree are least likely to be married with 67.4% of them unmarried at childbirth.
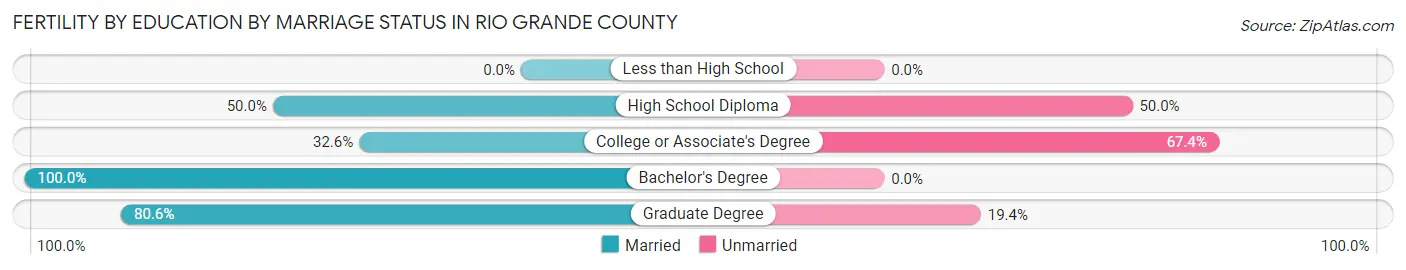
| Educational Attainment | Married | Unmarried |
| Less than High School | 0 (0.0%) | 0 (0.0%) |
| High School Diploma | 9 (50.0%) | 9 (50.0%) |
| College or Associate's Degree | 15 (32.6%) | 31 (67.4%) |
| Bachelor's Degree | 10 (100.0%) | 0 (0.0%) |
| Graduate Degree | 29 (80.6%) | 7 (19.4%) |
| Total | 63 (57.3%) | 47 (42.7%) |
Employment Characteristics in Rio Grande County
Employment by Class of Employer in Rio Grande County
Among the 4,989 employed individuals in Rio Grande County, private company employees (2,637 | 52.9%), local government employees (621 | 12.4%), and not-for-profit organizations (466 | 9.3%) make up the most common classes of employment.
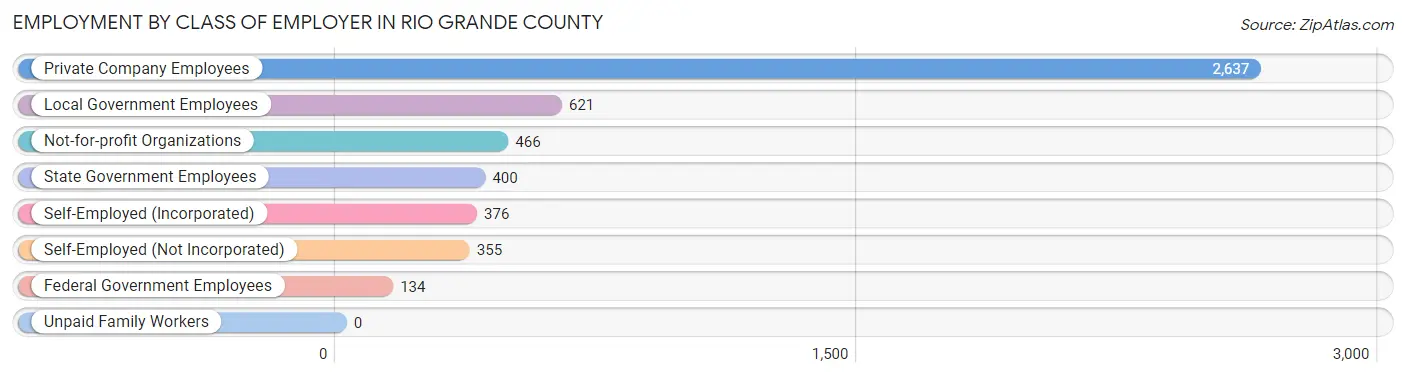
| Employer Class | # Employees | % Employees |
| Private Company Employees | 2,637 | 52.9% |
| Self-Employed (Incorporated) | 376 | 7.5% |
| Self-Employed (Not Incorporated) | 355 | 7.1% |
| Not-for-profit Organizations | 466 | 9.3% |
| Local Government Employees | 621 | 12.4% |
| State Government Employees | 400 | 8.0% |
| Federal Government Employees | 134 | 2.7% |
| Unpaid Family Workers | 0 | 0.0% |
| Total | 4,989 | 100.0% |
Employment Status by Age in Rio Grande County
According to the labor force statistics for Rio Grande County, out of the total population over 16 years of age (9,299), 60.8% or 5,654 individuals are in the labor force, with 6.0% or 339 of them unemployed. The age group with the highest labor force participation rate is 20 to 24 years, with 91.1% or 616 individuals in the labor force. Within the labor force, the 16 to 19 years age range has the highest percentage of unemployed individuals, with 27.3% or 66 of them being unemployed.

| Age Bracket | In Labor Force | Unemployed |
| 16 to 19 Years | 242 (45.6%) | 66 (27.3%) |
| 20 to 24 Years | 616 (91.1%) | 48 (7.8%) |
| 25 to 29 Years | 430 (73.1%) | 19 (4.4%) |
| 30 to 34 Years | 323 (85.4%) | 7 (2.2%) |
| 35 to 44 Years | 1,739 (85.6%) | 150 (8.6%) |
| 45 to 54 Years | 890 (79.5%) | 33 (3.7%) |
| 55 to 59 Years | 485 (62.3%) | 0 (0.0%) |
| 60 to 64 Years | 397 (49.5%) | 3 (0.8%) |
| 65 to 74 Years | 483 (33.5%) | 15 (3.1%) |
| 75 Years and over | 50 (5.2%) | 0 (0.0%) |
| Total | 5,654 (60.8%) | 339 (6.0%) |
Employment Status by Educational Attainment in Rio Grande County
According to labor force statistics for Rio Grande County, 74.8% of individuals (4,261) out of the total population between 25 and 64 years of age (5,697) are in the labor force, with 5.0% or 213 of them being unemployed. The group with the highest labor force participation rate are those with the educational attainment of bachelor's degree or higher, with 85.6% or 1,572 individuals in the labor force. Within the labor force, individuals with college / associate degree education have the highest percentage of unemployment, with 7.7% or 88 of them being unemployed.
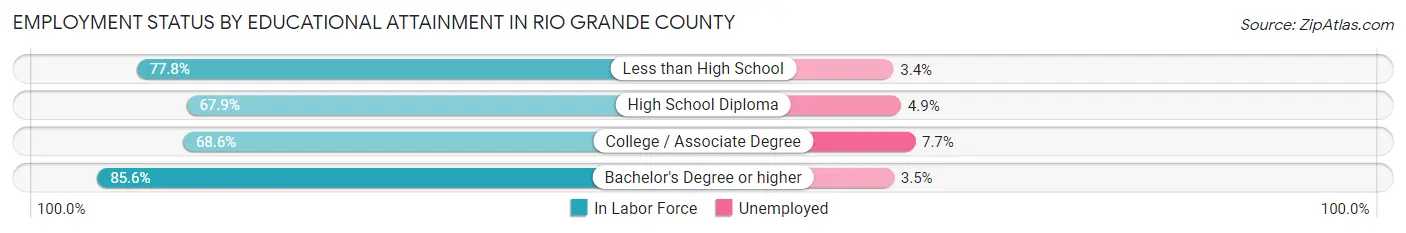
| Educational Attainment | In Labor Force | Unemployed |
| Less than High School | 465 (77.8%) | 20 (3.4%) |
| High School Diploma | 1,089 (67.9%) | 79 (4.9%) |
| College / Associate Degree | 1,137 (68.6%) | 128 (7.7%) |
| Bachelor's Degree or higher | 1,572 (85.6%) | 64 (3.5%) |
| Total | 4,261 (74.8%) | 285 (5.0%) |
Employment Occupations by Sex in Rio Grande County
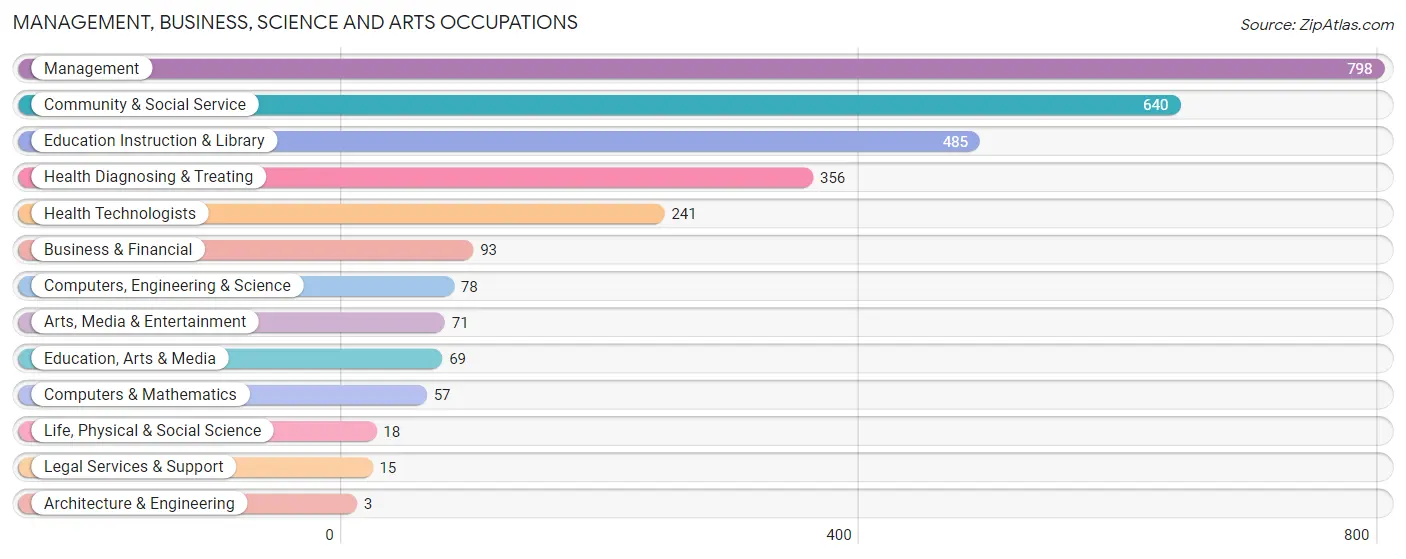
Management, Business, Science and Arts Occupations
The most common Management, Business, Science and Arts occupations in Rio Grande County are Management (798 | 15.0%), Community & Social Service (640 | 12.1%), Education Instruction & Library (485 | 9.1%), Health Diagnosing & Treating (356 | 6.7%), and Health Technologists (241 | 4.5%).
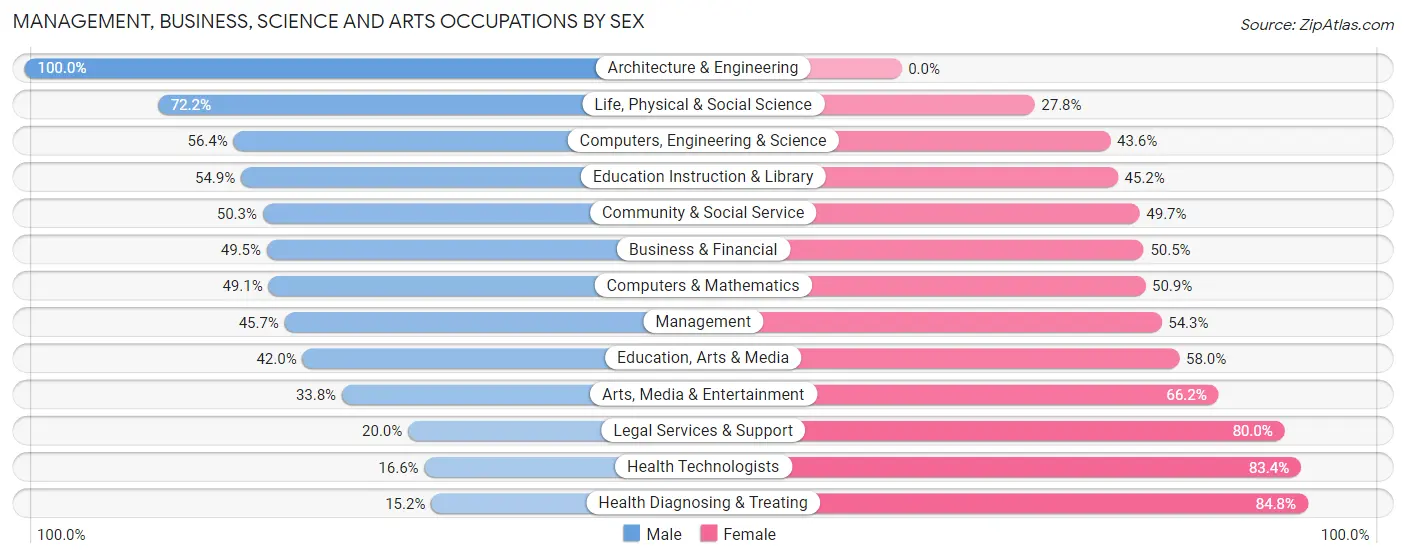
Management, Business, Science and Arts Occupations by Sex
Within the Management, Business, Science and Arts occupations in Rio Grande County, the most male-oriented occupations are Architecture & Engineering (100.0%), Life, Physical & Social Science (72.2%), and Computers, Engineering & Science (56.4%), while the most female-oriented occupations are Health Diagnosing & Treating (84.8%), Health Technologists (83.4%), and Legal Services & Support (80.0%).
| Occupation | Male | Female |
| Management | 365 (45.7%) | 433 (54.3%) |
| Business & Financial | 46 (49.5%) | 47 (50.5%) |
| Computers, Engineering & Science | 44 (56.4%) | 34 (43.6%) |
| Computers & Mathematics | 28 (49.1%) | 29 (50.9%) |
| Architecture & Engineering | 3 (100.0%) | 0 (0.0%) |
| Life, Physical & Social Science | 13 (72.2%) | 5 (27.8%) |
| Community & Social Service | 322 (50.3%) | 318 (49.7%) |
| Education, Arts & Media | 29 (42.0%) | 40 (58.0%) |
| Legal Services & Support | 3 (20.0%) | 12 (80.0%) |
| Education Instruction & Library | 266 (54.8%) | 219 (45.2%) |
| Arts, Media & Entertainment | 24 (33.8%) | 47 (66.2%) |
| Health Diagnosing & Treating | 54 (15.2%) | 302 (84.8%) |
| Health Technologists | 40 (16.6%) | 201 (83.4%) |
| Total (Category) | 831 (42.3%) | 1,134 (57.7%) |
| Total (Overall) | 2,959 (55.8%) | 2,342 (44.2%) |
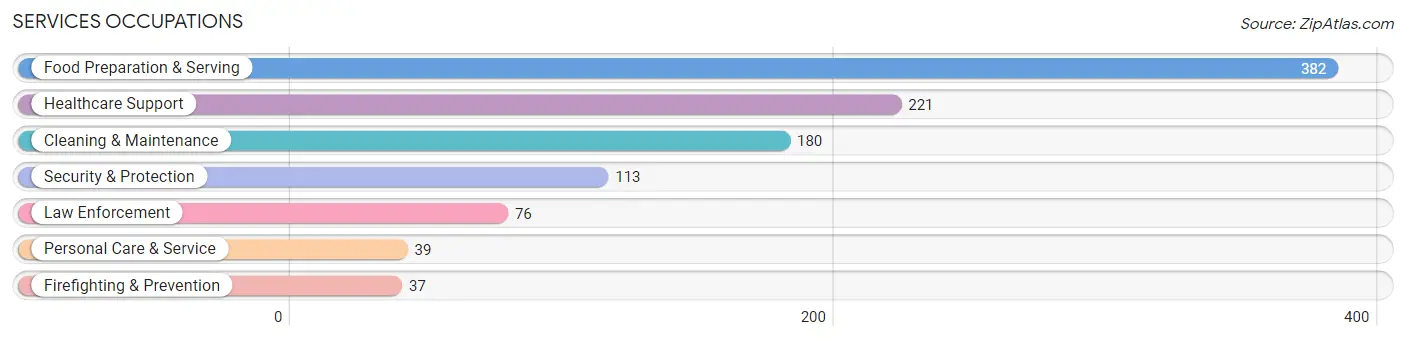
Services Occupations
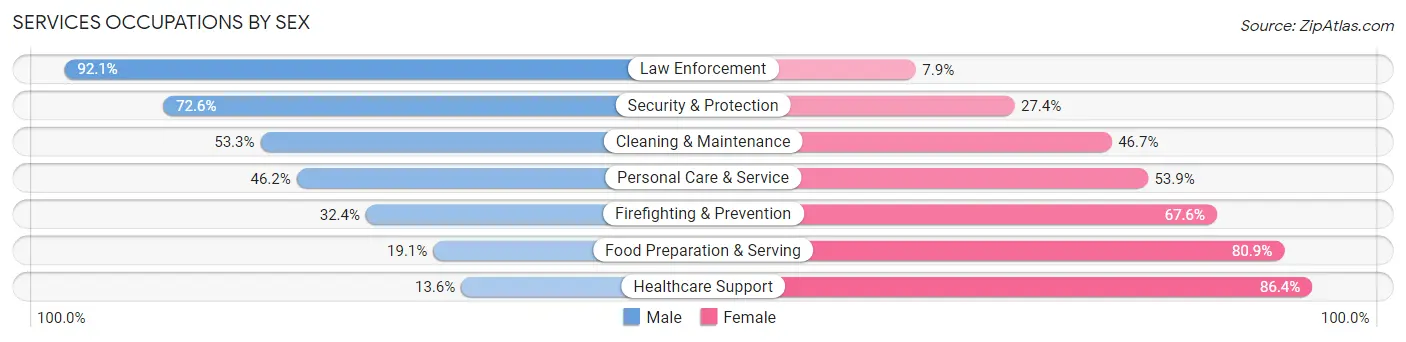
The most common Services occupations in Rio Grande County are Food Preparation & Serving (382 | 7.2%), Healthcare Support (221 | 4.2%), Cleaning & Maintenance (180 | 3.4%), Security & Protection (113 | 2.1%), and Law Enforcement (76 | 1.4%).
Services Occupations by Sex
Within the Services occupations in Rio Grande County, the most male-oriented occupations are Law Enforcement (92.1%), Security & Protection (72.6%), and Cleaning & Maintenance (53.3%), while the most female-oriented occupations are Healthcare Support (86.4%), Food Preparation & Serving (80.9%), and Firefighting & Prevention (67.6%).
| Occupation | Male | Female |
| Healthcare Support | 30 (13.6%) | 191 (86.4%) |
| Security & Protection | 82 (72.6%) | 31 (27.4%) |
| Firefighting & Prevention | 12 (32.4%) | 25 (67.6%) |
| Law Enforcement | 70 (92.1%) | 6 (7.9%) |
| Food Preparation & Serving | 73 (19.1%) | 309 (80.9%) |
| Cleaning & Maintenance | 96 (53.3%) | 84 (46.7%) |
| Personal Care & Service | 18 (46.2%) | 21 (53.8%) |
| Total (Category) | 299 (32.0%) | 636 (68.0%) |
| Total (Overall) | 2,959 (55.8%) | 2,342 (44.2%) |
Sales and Office Occupations
The most common Sales and Office occupations in Rio Grande County are Office & Administration (550 | 10.4%), and Sales & Related (427 | 8.1%).

Sales and Office Occupations by Sex

| Occupation | Male | Female |
| Sales & Related | 324 (75.9%) | 103 (24.1%) |
| Office & Administration | 183 (33.3%) | 367 (66.7%) |
| Total (Category) | 507 (51.9%) | 470 (48.1%) |
| Total (Overall) | 2,959 (55.8%) | 2,342 (44.2%) |
Natural Resources, Construction and Maintenance Occupations
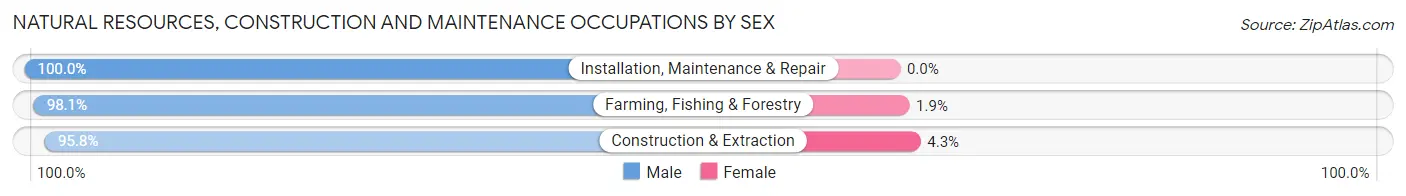
The most common Natural Resources, Construction and Maintenance occupations in Rio Grande County are Installation, Maintenance & Repair (441 | 8.3%), Construction & Extraction (259 | 4.9%), and Farming, Fishing & Forestry (156 | 2.9%).

Natural Resources, Construction and Maintenance Occupations by Sex
| Occupation | Male | Female |
| Farming, Fishing & Forestry | 153 (98.1%) | 3 (1.9%) |
| Construction & Extraction | 248 (95.8%) | 11 (4.3%) |
| Installation, Maintenance & Repair | 441 (100.0%) | 0 (0.0%) |
| Total (Category) | 842 (98.4%) | 14 (1.6%) |
| Total (Overall) | 2,959 (55.8%) | 2,342 (44.2%) |
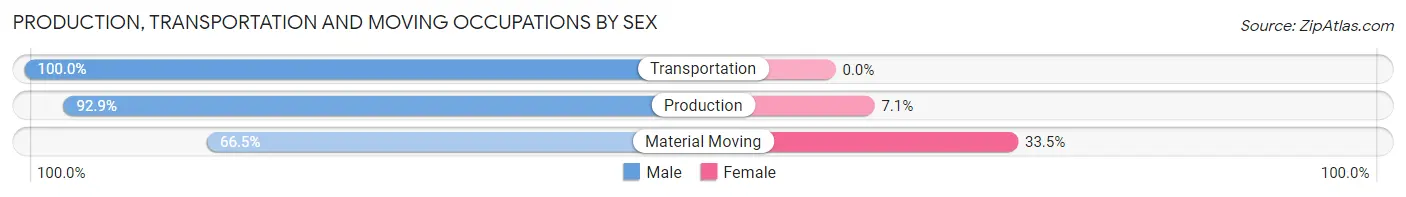
Production, Transportation and Moving Occupations
The most common Production, Transportation and Moving occupations in Rio Grande County are Production (224 | 4.2%), Material Moving (215 | 4.1%), and Transportation (129 | 2.4%).

Production, Transportation and Moving Occupations by Sex
| Occupation | Male | Female |
| Production | 208 (92.9%) | 16 (7.1%) |
| Transportation | 129 (100.0%) | 0 (0.0%) |
| Material Moving | 143 (66.5%) | 72 (33.5%) |
| Total (Category) | 480 (84.5%) | 88 (15.5%) |
| Total (Overall) | 2,959 (55.8%) | 2,342 (44.2%) |
Employment Industries by Sex in Rio Grande County
Employment Industries in Rio Grande County
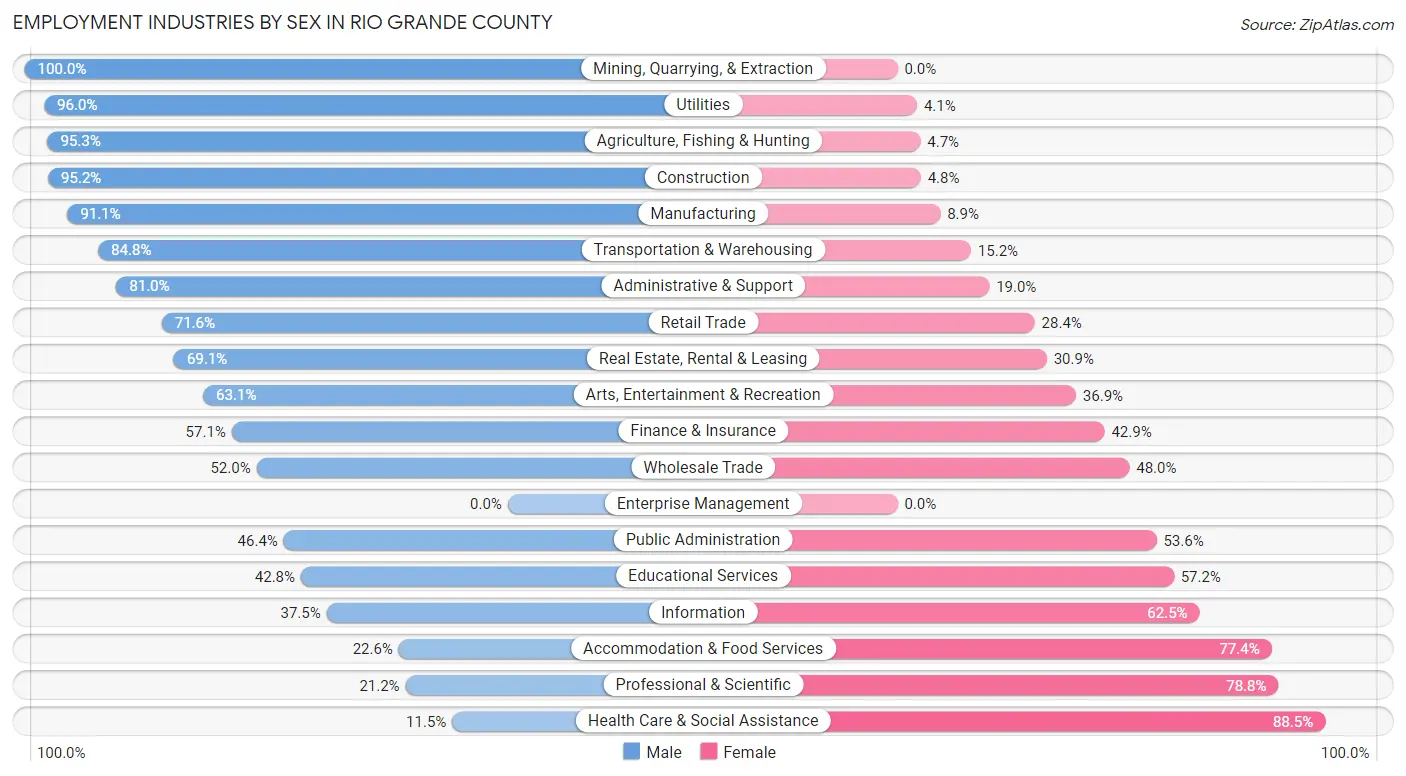
The major employment industries in Rio Grande County include Educational Services (717 | 13.5%), Health Care & Social Assistance (652 | 12.3%), Retail Trade (528 | 10.0%), Accommodation & Food Services (443 | 8.4%), and Agriculture, Fishing & Hunting (401 | 7.6%).
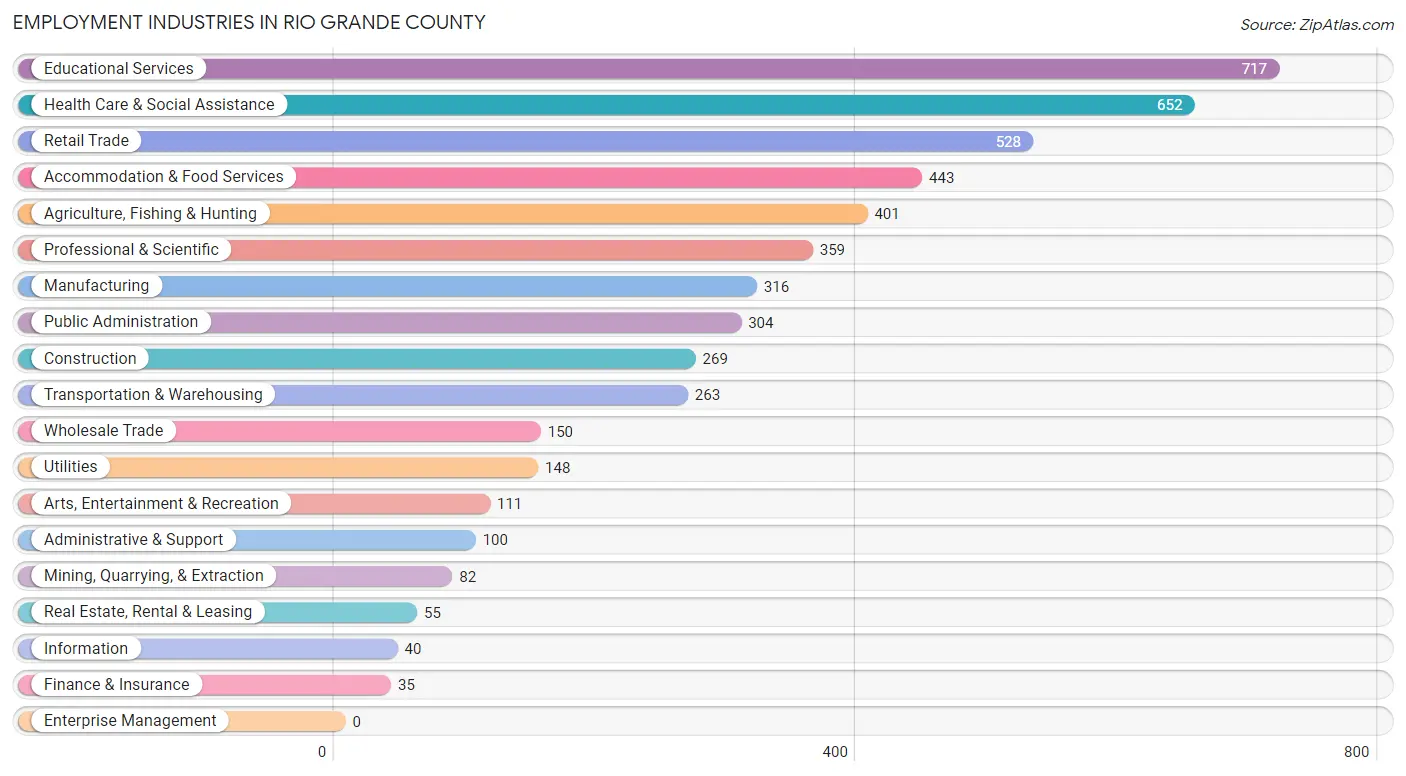
Employment Industries by Sex in Rio Grande County
The Rio Grande County industries that see more men than women are Mining, Quarrying, & Extraction (100.0%), Utilities (96.0%), and Agriculture, Fishing & Hunting (95.3%), whereas the industries that tend to have a higher number of women are Health Care & Social Assistance (88.5%), Professional & Scientific (78.8%), and Accommodation & Food Services (77.4%).
| Industry | Male | Female |
| Agriculture, Fishing & Hunting | 382 (95.3%) | 19 (4.7%) |
| Mining, Quarrying, & Extraction | 82 (100.0%) | 0 (0.0%) |
| Construction | 256 (95.2%) | 13 (4.8%) |
| Manufacturing | 288 (91.1%) | 28 (8.9%) |
| Wholesale Trade | 78 (52.0%) | 72 (48.0%) |
| Retail Trade | 378 (71.6%) | 150 (28.4%) |
| Transportation & Warehousing | 223 (84.8%) | 40 (15.2%) |
| Utilities | 142 (96.0%) | 6 (4.1%) |
| Information | 15 (37.5%) | 25 (62.5%) |
| Finance & Insurance | 20 (57.1%) | 15 (42.9%) |
| Real Estate, Rental & Leasing | 38 (69.1%) | 17 (30.9%) |
| Professional & Scientific | 76 (21.2%) | 283 (78.8%) |
| Enterprise Management | 0 (0.0%) | 0 (0.0%) |
| Administrative & Support | 81 (81.0%) | 19 (19.0%) |
| Educational Services | 307 (42.8%) | 410 (57.2%) |
| Health Care & Social Assistance | 75 (11.5%) | 577 (88.5%) |
| Arts, Entertainment & Recreation | 70 (63.1%) | 41 (36.9%) |
| Accommodation & Food Services | 100 (22.6%) | 343 (77.4%) |
| Public Administration | 141 (46.4%) | 163 (53.6%) |
| Total | 2,959 (55.8%) | 2,342 (44.2%) |
Education in Rio Grande County
School Enrollment in Rio Grande County
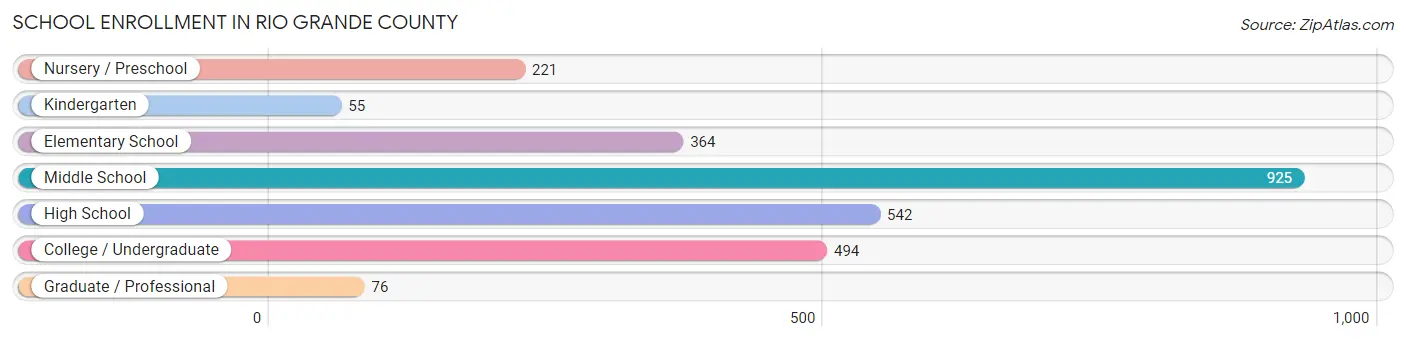
The most common levels of schooling among the 2,677 students in Rio Grande County are middle school (925 | 34.5%), high school (542 | 20.3%), and college / undergraduate (494 | 18.4%).
| School Level | # Students | % Students |
| Nursery / Preschool | 221 | 8.3% |
| Kindergarten | 55 | 2.1% |
| Elementary School | 364 | 13.6% |
| Middle School | 925 | 34.5% |
| High School | 542 | 20.3% |
| College / Undergraduate | 494 | 18.4% |
| Graduate / Professional | 76 | 2.8% |
| Total | 2,677 | 100.0% |
School Enrollment by Age by Funding Source in Rio Grande County
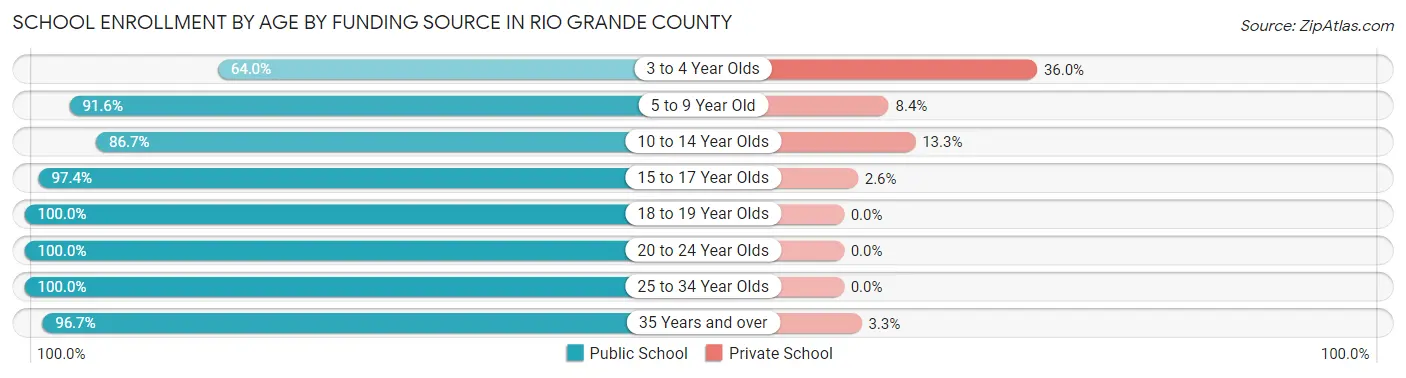
Out of a total of 2,677 students who are enrolled in schools in Rio Grande County, 236 (8.8%) attend a private institution, while the remaining 2,441 (91.2%) are enrolled in public schools. The age group of 3 to 4 year olds has the highest likelihood of being enrolled in private schools, with 54 (36.0% in the age bracket) enrolled. Conversely, the age group of 18 to 19 year olds has the lowest likelihood of being enrolled in a private school, with 248 (100.0% in the age bracket) attending a public institution.
| Age Bracket | Public School | Private School |
| 3 to 4 Year Olds | 96 (64.0%) | 54 (36.0%) |
| 5 to 9 Year Old | 416 (91.6%) | 38 (8.4%) |
| 10 to 14 Year Olds | 845 (86.7%) | 130 (13.3%) |
| 15 to 17 Year Olds | 370 (97.4%) | 10 (2.6%) |
| 18 to 19 Year Olds | 248 (100.0%) | 0 (0.0%) |
| 20 to 24 Year Olds | 205 (100.0%) | 0 (0.0%) |
| 25 to 34 Year Olds | 144 (100.0%) | 0 (0.0%) |
| 35 Years and over | 117 (96.7%) | 4 (3.3%) |
| Total | 2,441 (91.2%) | 236 (8.8%) |
Educational Attainment by Field of Study in Rio Grande County
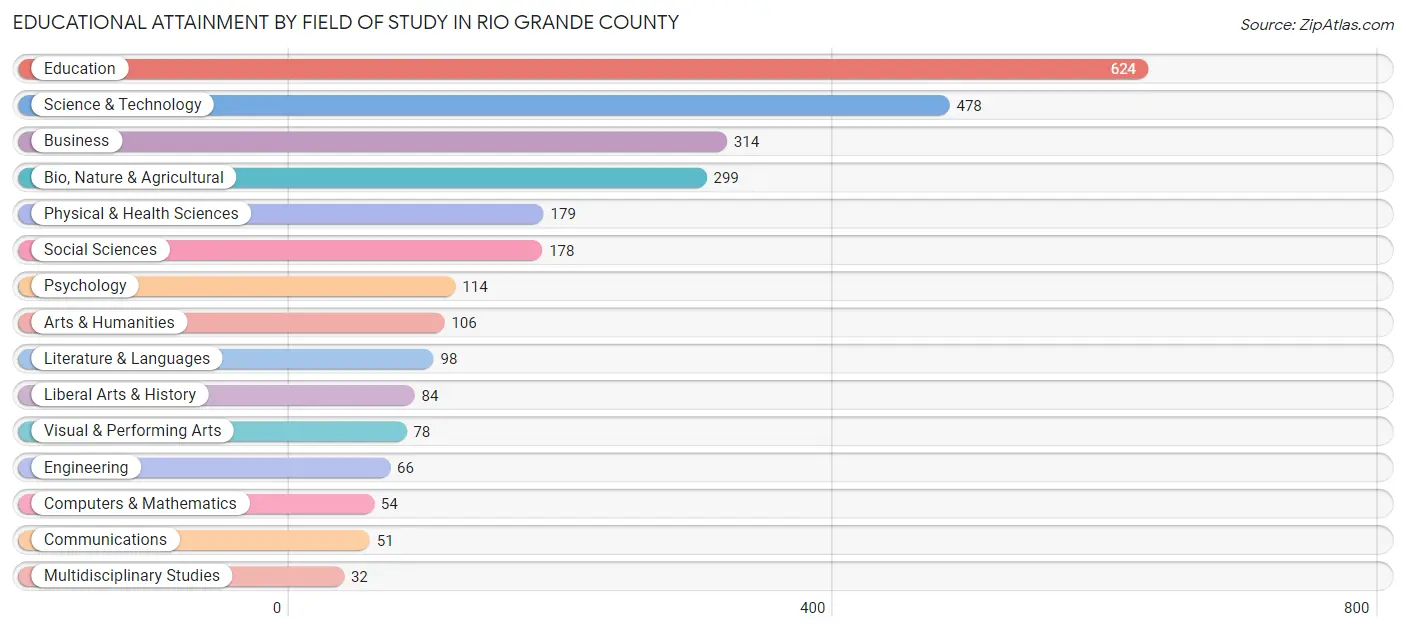
Education (624 | 22.7%), science & technology (478 | 17.3%), business (314 | 11.4%), bio, nature & agricultural (299 | 10.8%), and physical & health sciences (179 | 6.5%) are the most common fields of study among 2,755 individuals in Rio Grande County who have obtained a bachelor's degree or higher.
| Field of Study | # Graduates | % Graduates |
| Computers & Mathematics | 54 | 2.0% |
| Bio, Nature & Agricultural | 299 | 10.8% |
| Physical & Health Sciences | 179 | 6.5% |
| Psychology | 114 | 4.1% |
| Social Sciences | 178 | 6.5% |
| Engineering | 66 | 2.4% |
| Multidisciplinary Studies | 32 | 1.2% |
| Science & Technology | 478 | 17.3% |
| Business | 314 | 11.4% |
| Education | 624 | 22.7% |
| Literature & Languages | 98 | 3.6% |
| Liberal Arts & History | 84 | 3.0% |
| Visual & Performing Arts | 78 | 2.8% |
| Communications | 51 | 1.8% |
| Arts & Humanities | 106 | 3.8% |
| Total | 2,755 | 100.0% |
Transportation & Commute in Rio Grande County
Vehicle Availability by Sex in Rio Grande County
The most prevalent vehicle ownership categories in Rio Grande County are males with 2 vehicles (1,013, accounting for 34.9%) and females with 2 vehicles (449, making up 49.5%).
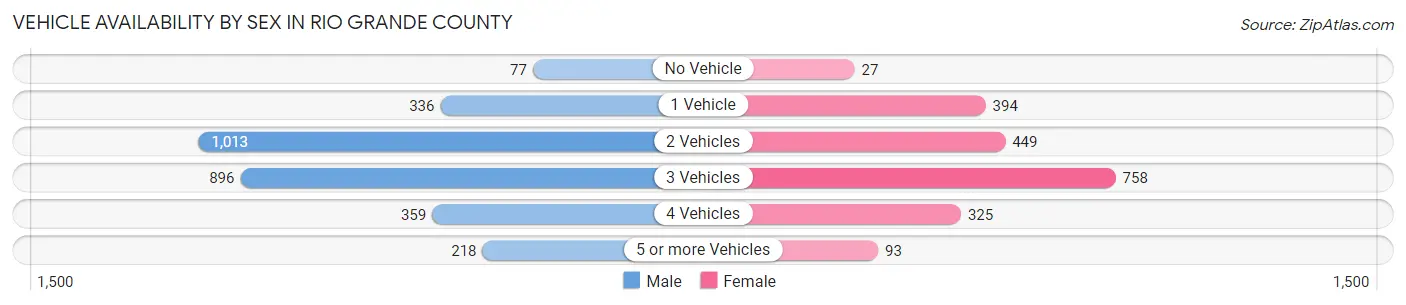
| Vehicles Available | Male | Female |
| No Vehicle | 77 (2.7%) | 27 (1.3%) |
| 1 Vehicle | 336 (11.6%) | 394 (19.3%) |
| 2 Vehicles | 1,013 (34.9%) | 449 (22.0%) |
| 3 Vehicles | 896 (30.9%) | 758 (37.0%) |
| 4 Vehicles | 359 (12.4%) | 325 (15.9%) |
| 5 or more Vehicles | 218 (7.5%) | 93 (4.5%) |
| Total | 2,899 (100.0%) | 2,046 (100.0%) |
Commute Time in Rio Grande County
The most frequently occuring commute durations in Rio Grande County are 10 to 14 minutes (807 commuters, 17.4%), 5 to 9 minutes (725 commuters, 15.6%), and less than 5 minutes (704 commuters, 15.2%).
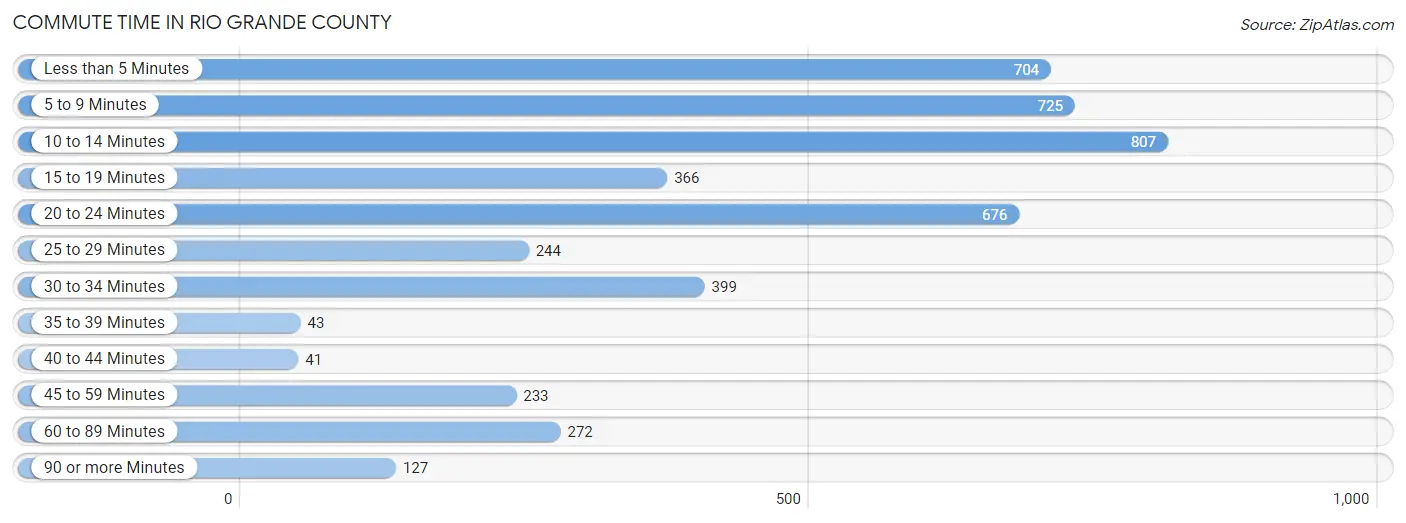
| Commute Time | # Commuters | % Commuters |
| Less than 5 Minutes | 704 | 15.2% |
| 5 to 9 Minutes | 725 | 15.6% |
| 10 to 14 Minutes | 807 | 17.4% |
| 15 to 19 Minutes | 366 | 7.9% |
| 20 to 24 Minutes | 676 | 14.6% |
| 25 to 29 Minutes | 244 | 5.3% |
| 30 to 34 Minutes | 399 | 8.6% |
| 35 to 39 Minutes | 43 | 0.9% |
| 40 to 44 Minutes | 41 | 0.9% |
| 45 to 59 Minutes | 233 | 5.0% |
| 60 to 89 Minutes | 272 | 5.9% |
| 90 or more Minutes | 127 | 2.7% |
Commute Time by Sex in Rio Grande County
The most common commute times in Rio Grande County are 10 to 14 minutes (474 commuters, 17.0%) for males and 20 to 24 minutes (369 commuters, 19.9%) for females.
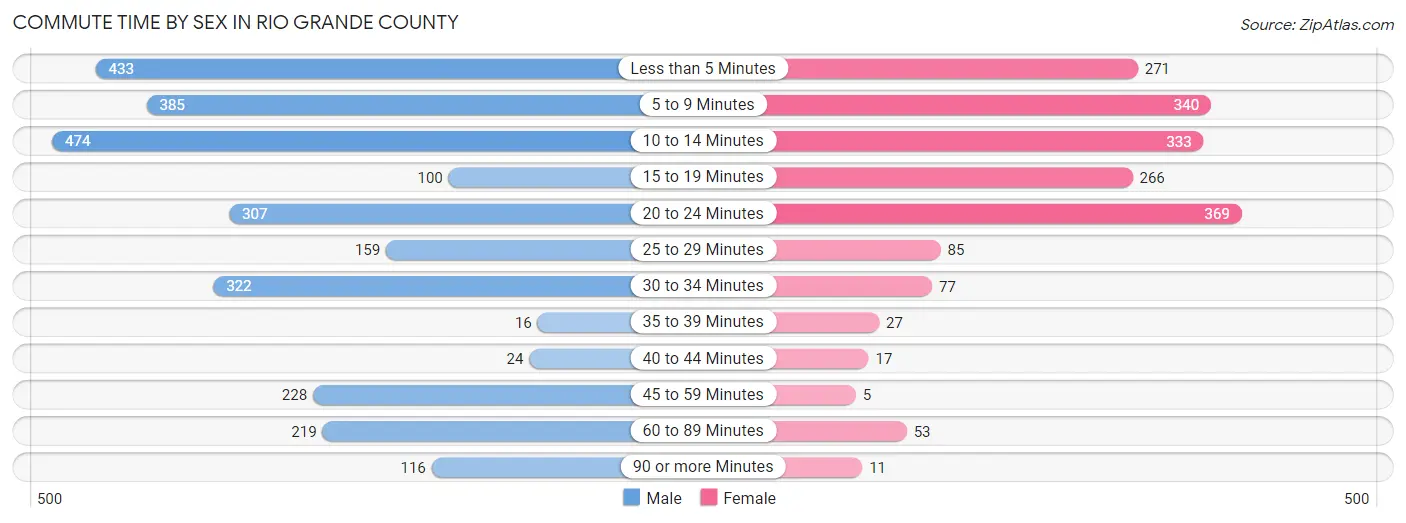
| Commute Time | Male | Female |
| Less than 5 Minutes | 433 (15.6%) | 271 (14.6%) |
| 5 to 9 Minutes | 385 (13.8%) | 340 (18.3%) |
| 10 to 14 Minutes | 474 (17.0%) | 333 (18.0%) |
| 15 to 19 Minutes | 100 (3.6%) | 266 (14.3%) |
| 20 to 24 Minutes | 307 (11.0%) | 369 (19.9%) |
| 25 to 29 Minutes | 159 (5.7%) | 85 (4.6%) |
| 30 to 34 Minutes | 322 (11.6%) | 77 (4.2%) |
| 35 to 39 Minutes | 16 (0.6%) | 27 (1.5%) |
| 40 to 44 Minutes | 24 (0.9%) | 17 (0.9%) |
| 45 to 59 Minutes | 228 (8.2%) | 5 (0.3%) |
| 60 to 89 Minutes | 219 (7.9%) | 53 (2.9%) |
| 90 or more Minutes | 116 (4.2%) | 11 (0.6%) |
Time of Departure to Work by Sex in Rio Grande County
The most frequent times of departure to work in Rio Grande County are 7:00 AM to 7:29 AM (836, 30.0%) for males and 7:30 AM to 7:59 AM (397, 21.4%) for females.
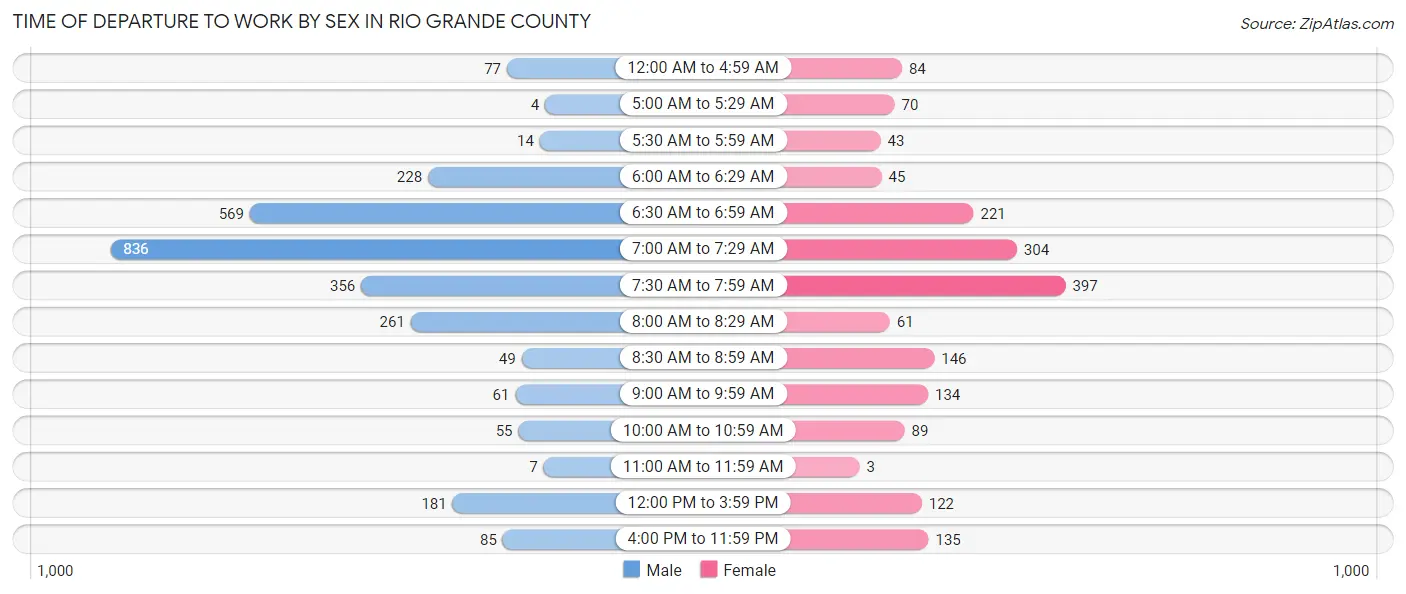
| Time of Departure | Male | Female |
| 12:00 AM to 4:59 AM | 77 (2.8%) | 84 (4.5%) |
| 5:00 AM to 5:29 AM | 4 (0.1%) | 70 (3.8%) |
| 5:30 AM to 5:59 AM | 14 (0.5%) | 43 (2.3%) |
| 6:00 AM to 6:29 AM | 228 (8.2%) | 45 (2.4%) |
| 6:30 AM to 6:59 AM | 569 (20.4%) | 221 (11.9%) |
| 7:00 AM to 7:29 AM | 836 (30.0%) | 304 (16.4%) |
| 7:30 AM to 7:59 AM | 356 (12.8%) | 397 (21.4%) |
| 8:00 AM to 8:29 AM | 261 (9.4%) | 61 (3.3%) |
| 8:30 AM to 8:59 AM | 49 (1.8%) | 146 (7.9%) |
| 9:00 AM to 9:59 AM | 61 (2.2%) | 134 (7.2%) |
| 10:00 AM to 10:59 AM | 55 (2.0%) | 89 (4.8%) |
| 11:00 AM to 11:59 AM | 7 (0.3%) | 3 (0.2%) |
| 12:00 PM to 3:59 PM | 181 (6.5%) | 122 (6.6%) |
| 4:00 PM to 11:59 PM | 85 (3.0%) | 135 (7.3%) |
| Total | 2,783 (100.0%) | 1,854 (100.0%) |
Housing Occupancy in Rio Grande County
Occupancy by Ownership in Rio Grande County
Of the total 4,657 dwellings in Rio Grande County, owner-occupied units account for 3,376 (72.5%), while renter-occupied units make up 1,281 (27.5%).
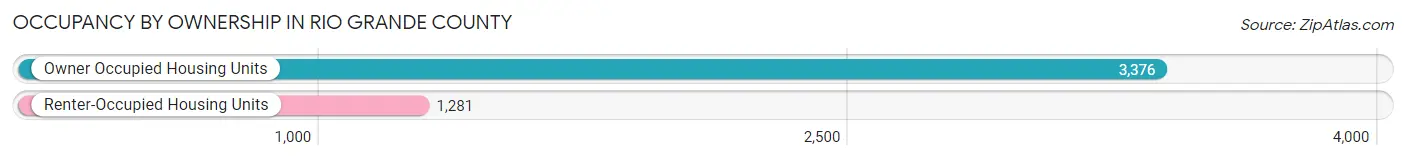
| Occupancy | # Housing Units | % Housing Units |
| Owner Occupied Housing Units | 3,376 | 72.5% |
| Renter-Occupied Housing Units | 1,281 | 27.5% |
| Total Occupied Housing Units | 4,657 | 100.0% |
Occupancy by Household Size in Rio Grande County

| Household Size | # Housing Units | % Housing Units |
| 1-Person Household | 1,294 | 27.8% |
| 2-Person Household | 1,776 | 38.1% |
| 3-Person Household | 856 | 18.4% |
| 4+ Person Household | 731 | 15.7% |
| Total Housing Units | 4,657 | 100.0% |
Occupancy by Ownership by Household Size in Rio Grande County

| Household Size | Owner-occupied | Renter-occupied |
| 1-Person Household | 737 (57.0%) | 557 (43.0%) |
| 2-Person Household | 1,376 (77.5%) | 400 (22.5%) |
| 3-Person Household | 682 (79.7%) | 174 (20.3%) |
| 4+ Person Household | 581 (79.5%) | 150 (20.5%) |
| Total Housing Units | 3,376 (72.5%) | 1,281 (27.5%) |
Occupancy by Educational Attainment in Rio Grande County
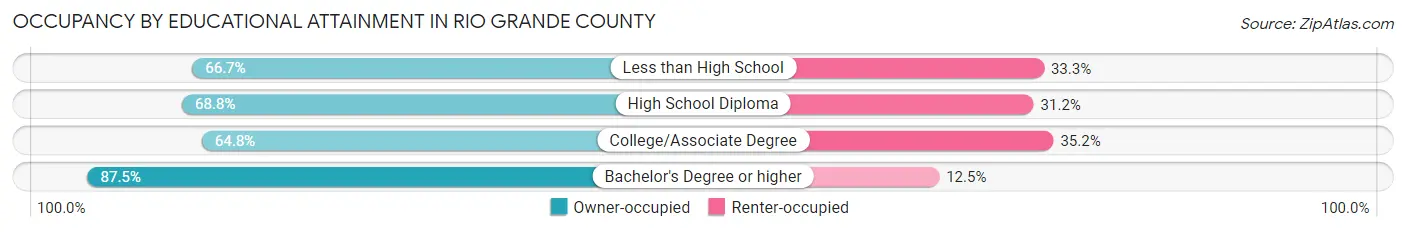
| Household Size | Owner-occupied | Renter-occupied |
| Less than High School | 329 (66.7%) | 164 (33.3%) |
| High School Diploma | 868 (68.8%) | 394 (31.2%) |
| College/Associate Degree | 1,031 (64.8%) | 559 (35.2%) |
| Bachelor's Degree or higher | 1,148 (87.5%) | 164 (12.5%) |
Occupancy by Age of Householder in Rio Grande County

| Age Bracket | # Households | % Households |
| Under 35 Years | 571 | 12.3% |
| 35 to 44 Years | 947 | 20.3% |
| 45 to 54 Years | 627 | 13.5% |
| 55 to 64 Years | 1,051 | 22.6% |
| 65 to 74 Years | 970 | 20.8% |
| 75 to 84 Years | 349 | 7.5% |
| 85 Years and Over | 142 | 3.0% |
| Total | 4,657 | 100.0% |
Housing Finances in Rio Grande County
Median Income by Occupancy in Rio Grande County
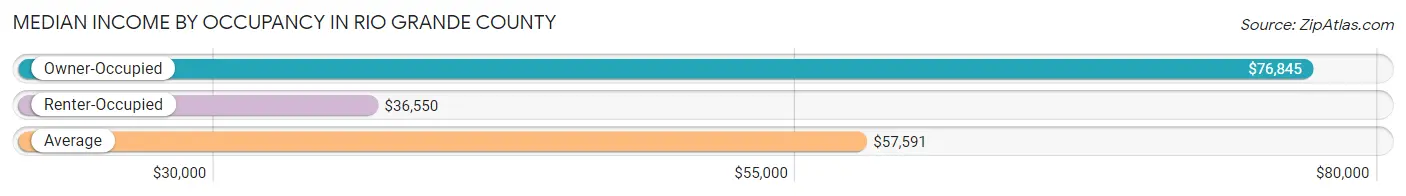
| Occupancy Type | # Households | Median Income |
| Owner-Occupied | 3,376 (72.5%) | $76,845 |
| Renter-Occupied | 1,281 (27.5%) | $36,550 |
| Average | 4,657 (100.0%) | $57,591 |
Occupancy by Householder Income Bracket in Rio Grande County
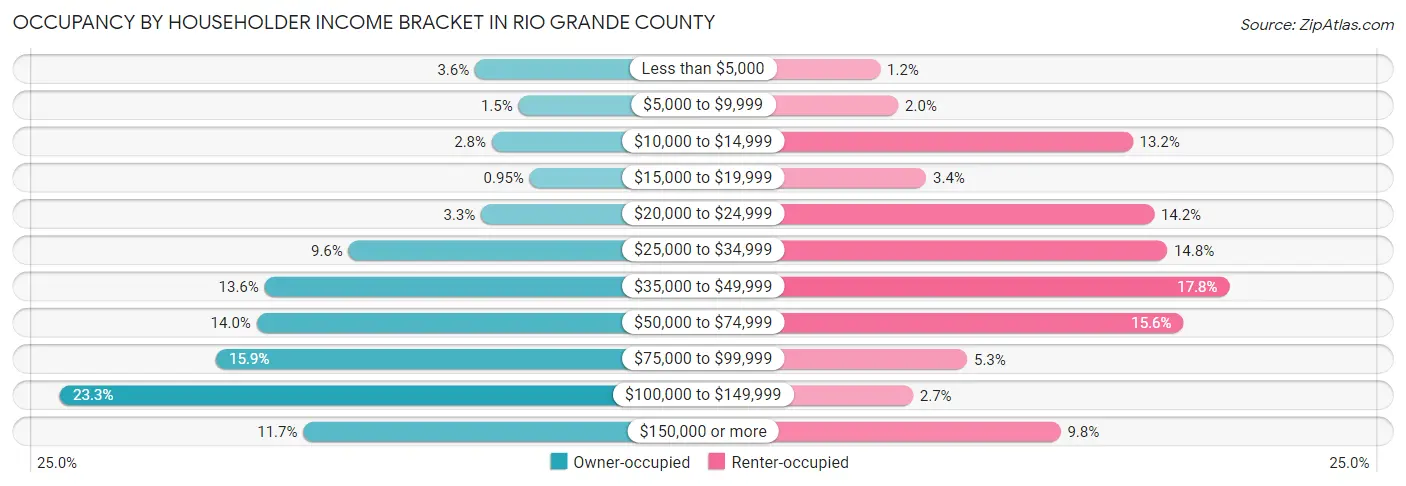
| Income Bracket | Owner-occupied | Renter-occupied |
| Less than $5,000 | 120 (3.5%) | 15 (1.2%) |
| $5,000 to $9,999 | 50 (1.5%) | 26 (2.0%) |
| $10,000 to $14,999 | 93 (2.8%) | 169 (13.2%) |
| $15,000 to $19,999 | 32 (0.9%) | 43 (3.4%) |
| $20,000 to $24,999 | 110 (3.3%) | 182 (14.2%) |
| $25,000 to $34,999 | 323 (9.6%) | 190 (14.8%) |
| $35,000 to $49,999 | 458 (13.6%) | 228 (17.8%) |
| $50,000 to $74,999 | 471 (14.0%) | 200 (15.6%) |
| $75,000 to $99,999 | 536 (15.9%) | 68 (5.3%) |
| $100,000 to $149,999 | 787 (23.3%) | 35 (2.7%) |
| $150,000 or more | 396 (11.7%) | 125 (9.8%) |
| Total | 3,376 (100.0%) | 1,281 (100.0%) |
Monthly Housing Cost Tiers in Rio Grande County
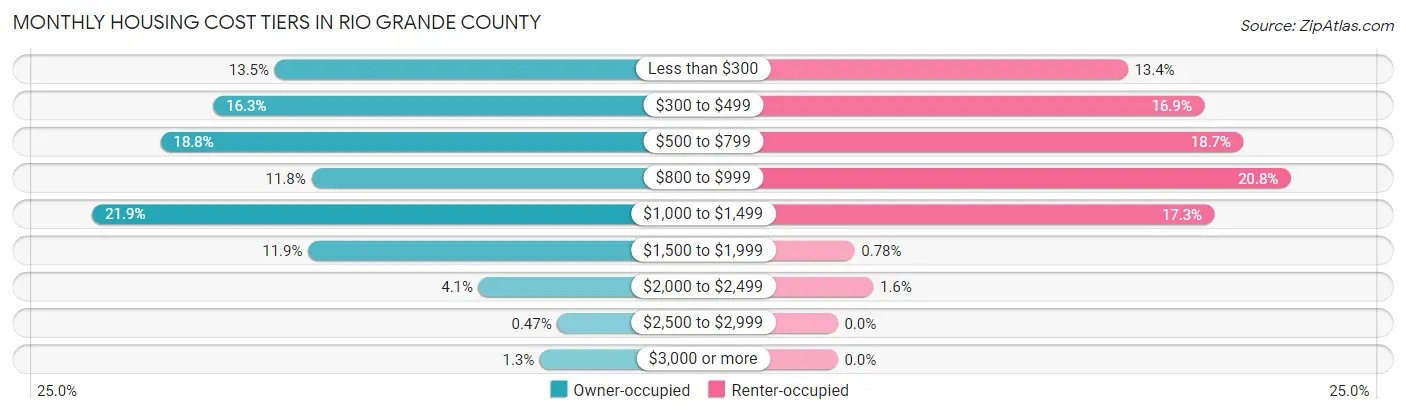
| Monthly Cost | Owner-occupied | Renter-occupied |
| Less than $300 | 455 (13.5%) | 171 (13.4%) |
| $300 to $499 | 551 (16.3%) | 216 (16.9%) |
| $500 to $799 | 633 (18.8%) | 239 (18.7%) |
| $800 to $999 | 398 (11.8%) | 267 (20.8%) |
| $1,000 to $1,499 | 739 (21.9%) | 222 (17.3%) |
| $1,500 to $1,999 | 403 (11.9%) | 10 (0.8%) |
| $2,000 to $2,499 | 138 (4.1%) | 21 (1.6%) |
| $2,500 to $2,999 | 16 (0.5%) | 0 (0.0%) |
| $3,000 or more | 43 (1.3%) | 0 (0.0%) |
| Total | 3,376 (100.0%) | 1,281 (100.0%) |
Physical Housing Characteristics in Rio Grande County
Housing Structures in Rio Grande County

| Structure Type | # Housing Units | % Housing Units |
| Single Unit, Detached | 3,330 | 71.5% |
| Single Unit, Attached | 47 | 1.0% |
| 2 Unit Apartments | 224 | 4.8% |
| 3 or 4 Unit Apartments | 33 | 0.7% |
| 5 to 9 Unit Apartments | 180 | 3.9% |
| 10 or more Apartments | 154 | 3.3% |
| Mobile Home / Other | 689 | 14.8% |
| Total | 4,657 | 100.0% |
Housing Structures by Occupancy in Rio Grande County
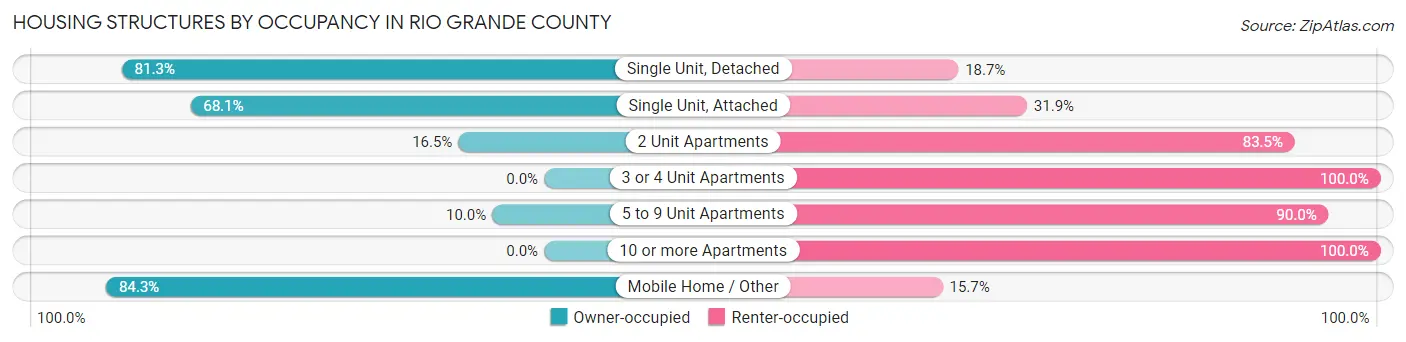
| Structure Type | Owner-occupied | Renter-occupied |
| Single Unit, Detached | 2,708 (81.3%) | 622 (18.7%) |
| Single Unit, Attached | 32 (68.1%) | 15 (31.9%) |
| 2 Unit Apartments | 37 (16.5%) | 187 (83.5%) |
| 3 or 4 Unit Apartments | 0 (0.0%) | 33 (100.0%) |
| 5 to 9 Unit Apartments | 18 (10.0%) | 162 (90.0%) |
| 10 or more Apartments | 0 (0.0%) | 154 (100.0%) |
| Mobile Home / Other | 581 (84.3%) | 108 (15.7%) |
| Total | 3,376 (72.5%) | 1,281 (27.5%) |
Housing Structures by Number of Rooms in Rio Grande County
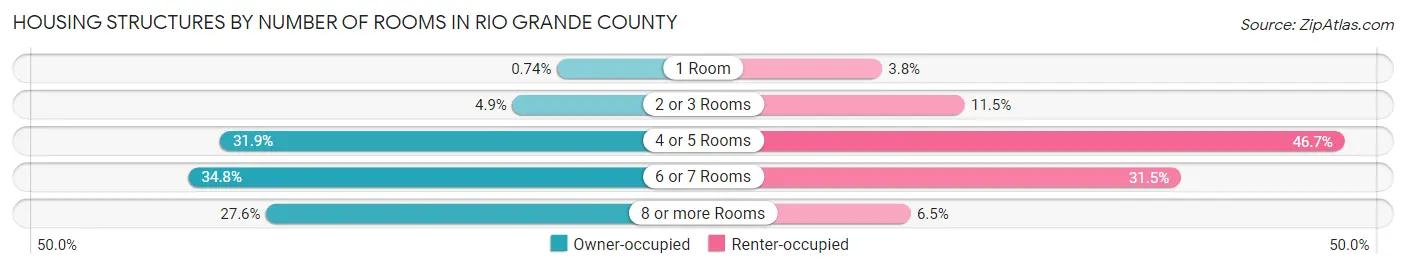
| Number of Rooms | Owner-occupied | Renter-occupied |
| 1 Room | 25 (0.7%) | 49 (3.8%) |
| 2 or 3 Rooms | 164 (4.9%) | 147 (11.5%) |
| 4 or 5 Rooms | 1,078 (31.9%) | 598 (46.7%) |
| 6 or 7 Rooms | 1,176 (34.8%) | 404 (31.5%) |
| 8 or more Rooms | 933 (27.6%) | 83 (6.5%) |
| Total | 3,376 (100.0%) | 1,281 (100.0%) |
Housing Structure by Heating Type in Rio Grande County
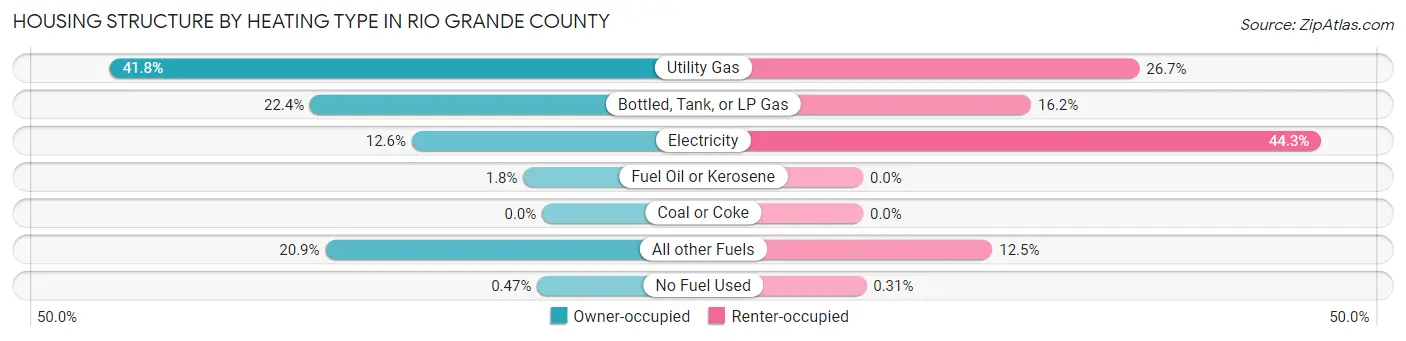
| Heating Type | Owner-occupied | Renter-occupied |
| Utility Gas | 1,410 (41.8%) | 342 (26.7%) |
| Bottled, Tank, or LP Gas | 757 (22.4%) | 208 (16.2%) |
| Electricity | 425 (12.6%) | 567 (44.3%) |
| Fuel Oil or Kerosene | 61 (1.8%) | 0 (0.0%) |
| Coal or Coke | 0 (0.0%) | 0 (0.0%) |
| All other Fuels | 707 (20.9%) | 160 (12.5%) |
| No Fuel Used | 16 (0.5%) | 4 (0.3%) |
| Total | 3,376 (100.0%) | 1,281 (100.0%) |
Household Vehicle Usage in Rio Grande County
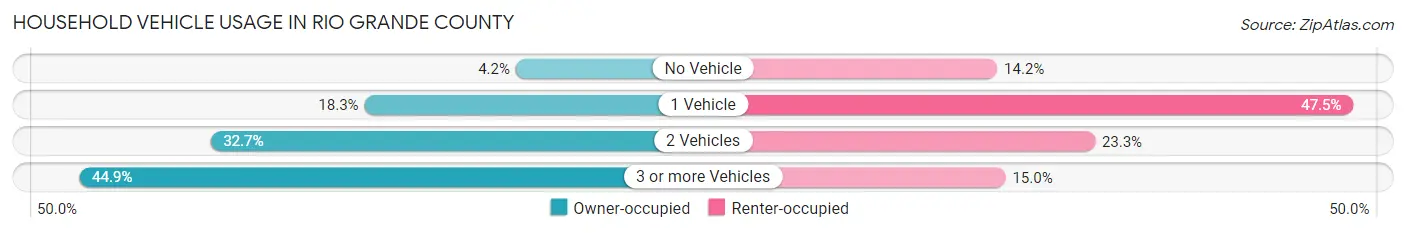
| Vehicles per Household | Owner-occupied | Renter-occupied |
| No Vehicle | 140 (4.2%) | 182 (14.2%) |
| 1 Vehicle | 617 (18.3%) | 608 (47.5%) |
| 2 Vehicles | 1,103 (32.7%) | 299 (23.3%) |
| 3 or more Vehicles | 1,516 (44.9%) | 192 (15.0%) |
| Total | 3,376 (100.0%) | 1,281 (100.0%) |
Real Estate & Mortgages in Rio Grande County
Real Estate and Mortgage Overview in Rio Grande County
| Characteristic | Without Mortgage | With Mortgage |
| Housing Units | 1,559 | 1,817 |
| Median Property Value | $160,700 | $213,400 |
| Median Household Income | $49,571 | $188 |
| Monthly Housing Costs | $402 | $43 |
| Real Estate Taxes | $586 | $26 |
Property Value by Mortgage Status in Rio Grande County
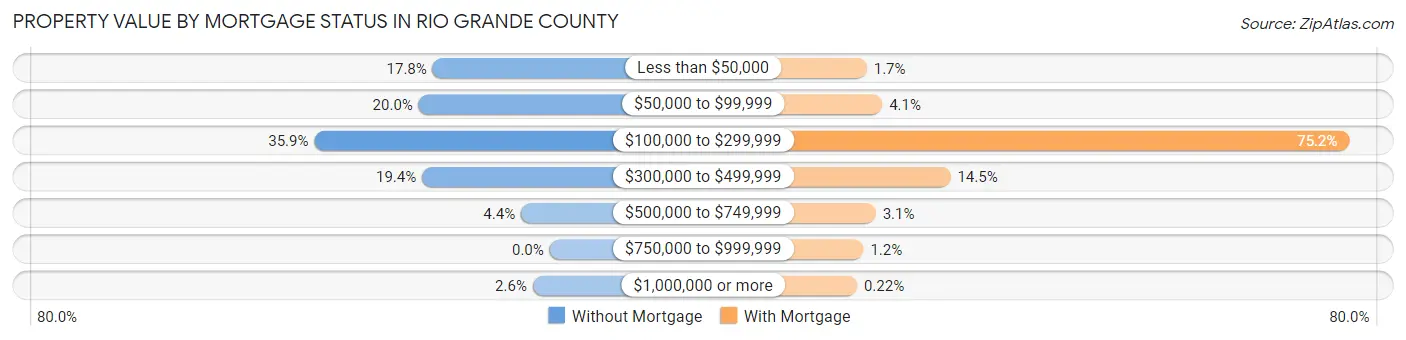
| Property Value | Without Mortgage | With Mortgage |
| Less than $50,000 | 278 (17.8%) | 31 (1.7%) |
| $50,000 to $99,999 | 311 (20.0%) | 74 (4.1%) |
| $100,000 to $299,999 | 559 (35.9%) | 1,367 (75.2%) |
| $300,000 to $499,999 | 303 (19.4%) | 263 (14.5%) |
| $500,000 to $749,999 | 68 (4.4%) | 56 (3.1%) |
| $750,000 to $999,999 | 0 (0.0%) | 22 (1.2%) |
| $1,000,000 or more | 40 (2.6%) | 4 (0.2%) |
| Total | 1,559 (100.0%) | 1,817 (100.0%) |
Household Income by Mortgage Status in Rio Grande County
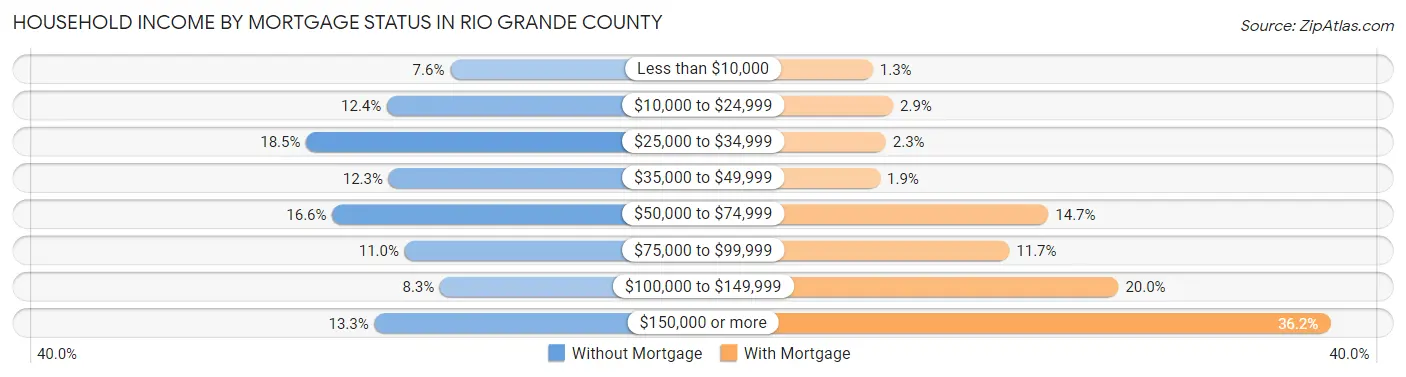
| Household Income | Without Mortgage | With Mortgage |
| Less than $10,000 | 118 (7.6%) | 24 (1.3%) |
| $10,000 to $24,999 | 193 (12.4%) | 52 (2.9%) |
| $25,000 to $34,999 | 289 (18.5%) | 42 (2.3%) |
| $35,000 to $49,999 | 191 (12.2%) | 34 (1.9%) |
| $50,000 to $74,999 | 258 (16.6%) | 267 (14.7%) |
| $75,000 to $99,999 | 172 (11.0%) | 213 (11.7%) |
| $100,000 to $149,999 | 130 (8.3%) | 364 (20.0%) |
| $150,000 or more | 208 (13.3%) | 657 (36.2%) |
| Total | 1,559 (100.0%) | 1,817 (100.0%) |
Property Value to Household Income Ratio in Rio Grande County

| Value-to-Income Ratio | Without Mortgage | With Mortgage |
| Less than 2.0x | 548 (35.1%) | 94,989 (5,227.8%) |
| 2.0x to 2.9x | 265 (17.0%) | 731 (40.2%) |
| 3.0x to 3.9x | 90 (5.8%) | 458 (25.2%) |
| 4.0x or more | 656 (42.1%) | 188 (10.3%) |
| Total | 1,559 (100.0%) | 1,817 (100.0%) |
Real Estate Taxes by Mortgage Status in Rio Grande County
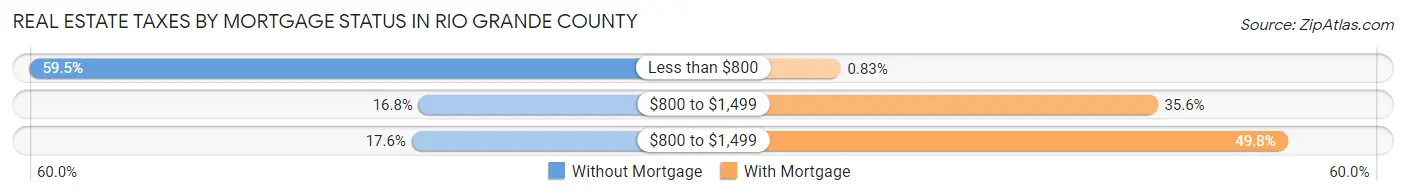
| Property Taxes | Without Mortgage | With Mortgage |
| Less than $800 | 927 (59.5%) | 15 (0.8%) |
| $800 to $1,499 | 262 (16.8%) | 646 (35.5%) |
| $800 to $1,499 | 274 (17.6%) | 905 (49.8%) |
| Total | 1,559 (100.0%) | 1,817 (100.0%) |
Health & Disability in Rio Grande County
Health Insurance Coverage by Age in Rio Grande County
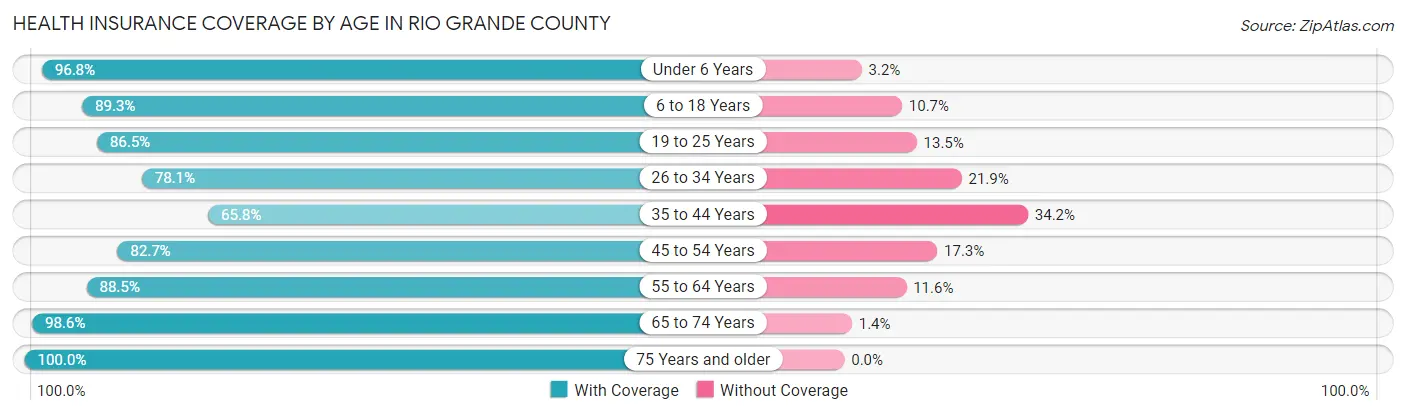
| Age Bracket | With Coverage | Without Coverage |
| Under 6 Years | 661 (96.8%) | 22 (3.2%) |
| 6 to 18 Years | 1,756 (89.3%) | 211 (10.7%) |
| 19 to 25 Years | 750 (86.5%) | 117 (13.5%) |
| 26 to 34 Years | 597 (78.1%) | 167 (21.9%) |
| 35 to 44 Years | 1,320 (65.8%) | 687 (34.2%) |
| 45 to 54 Years | 922 (82.7%) | 193 (17.3%) |
| 55 to 64 Years | 1,394 (88.4%) | 182 (11.6%) |
| 65 to 74 Years | 1,408 (98.6%) | 20 (1.4%) |
| 75 Years and older | 858 (100.0%) | 0 (0.0%) |
| Total | 9,666 (85.8%) | 1,599 (14.2%) |
Health Insurance Coverage by Citizenship Status in Rio Grande County
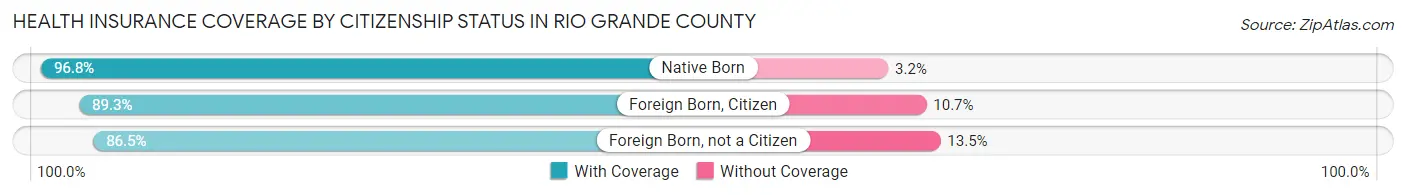
| Citizenship Status | With Coverage | Without Coverage |
| Native Born | 661 (96.8%) | 22 (3.2%) |
| Foreign Born, Citizen | 1,756 (89.3%) | 211 (10.7%) |
| Foreign Born, not a Citizen | 750 (86.5%) | 117 (13.5%) |
Health Insurance Coverage by Household Income in Rio Grande County
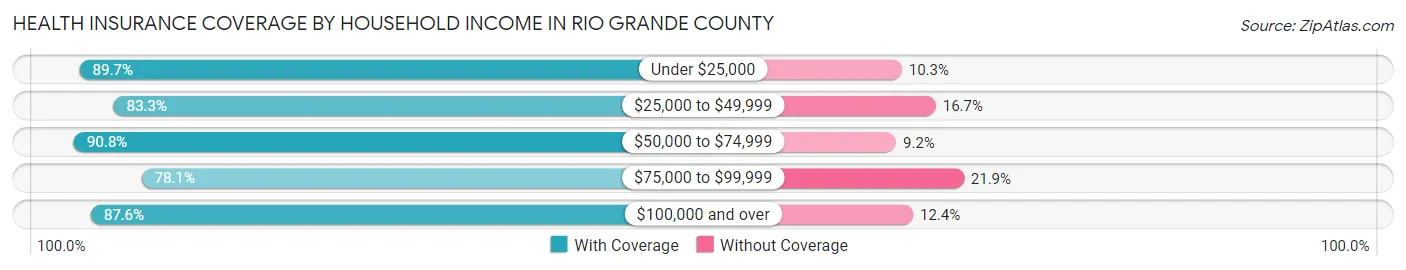
| Household Income | With Coverage | Without Coverage |
| Under $25,000 | 1,313 (89.7%) | 151 (10.3%) |
| $25,000 to $49,999 | 1,835 (83.3%) | 367 (16.7%) |
| $50,000 to $74,999 | 1,326 (90.8%) | 135 (9.2%) |
| $75,000 to $99,999 | 1,438 (78.1%) | 404 (21.9%) |
| $100,000 and over | 3,706 (87.6%) | 525 (12.4%) |
Public vs Private Health Insurance Coverage by Age in Rio Grande County
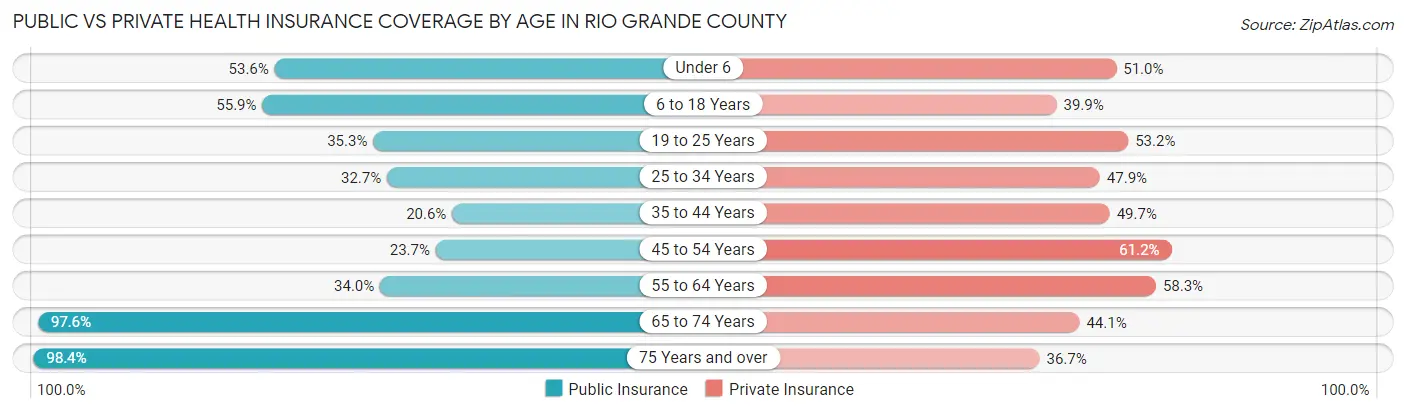
| Age Bracket | Public Insurance | Private Insurance |
| Under 6 | 366 (53.6%) | 348 (50.9%) |
| 6 to 18 Years | 1,099 (55.9%) | 784 (39.9%) |
| 19 to 25 Years | 306 (35.3%) | 461 (53.2%) |
| 25 to 34 Years | 250 (32.7%) | 366 (47.9%) |
| 35 to 44 Years | 414 (20.6%) | 998 (49.7%) |
| 45 to 54 Years | 264 (23.7%) | 682 (61.2%) |
| 55 to 64 Years | 536 (34.0%) | 919 (58.3%) |
| 65 to 74 Years | 1,393 (97.6%) | 630 (44.1%) |
| 75 Years and over | 844 (98.4%) | 315 (36.7%) |
| Total | 5,472 (48.6%) | 5,503 (48.8%) |
Disability Status by Sex by Age in Rio Grande County
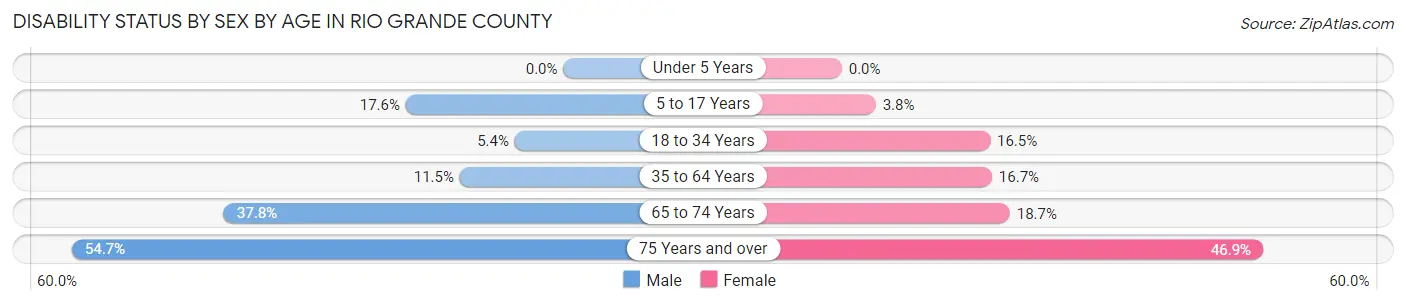
| Age Bracket | Male | Female |
| Under 5 Years | 0 (0.0%) | 0 (0.0%) |
| 5 to 17 Years | 189 (17.5%) | 28 (3.8%) |
| 18 to 34 Years | 51 (5.4%) | 154 (16.5%) |
| 35 to 64 Years | 281 (11.5%) | 378 (16.7%) |
| 65 to 74 Years | 265 (37.8%) | 136 (18.7%) |
| 75 Years and over | 214 (54.7%) | 219 (46.9%) |
Disability Class by Sex by Age in Rio Grande County
Disability Class: Hearing Difficulty
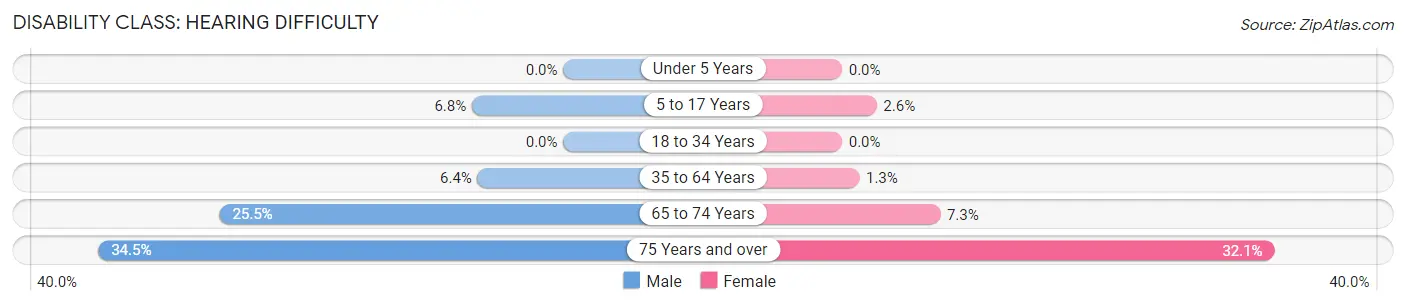
| Age Bracket | Male | Female |
| Under 5 Years | 0 (0.0%) | 0 (0.0%) |
| 5 to 17 Years | 73 (6.8%) | 19 (2.6%) |
| 18 to 34 Years | 0 (0.0%) | 0 (0.0%) |
| 35 to 64 Years | 155 (6.4%) | 29 (1.3%) |
| 65 to 74 Years | 179 (25.5%) | 53 (7.3%) |
| 75 Years and over | 135 (34.5%) | 150 (32.1%) |
Disability Class: Vision Difficulty
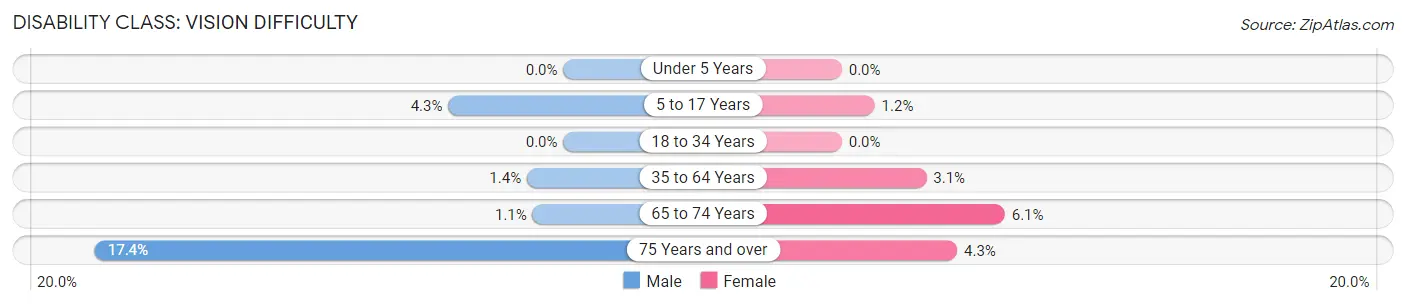
| Age Bracket | Male | Female |
| Under 5 Years | 0 (0.0%) | 0 (0.0%) |
| 5 to 17 Years | 46 (4.3%) | 9 (1.2%) |
| 18 to 34 Years | 0 (0.0%) | 0 (0.0%) |
| 35 to 64 Years | 33 (1.3%) | 71 (3.1%) |
| 65 to 74 Years | 8 (1.1%) | 44 (6.0%) |
| 75 Years and over | 68 (17.4%) | 20 (4.3%) |
Disability Class: Cognitive Difficulty

| Age Bracket | Male | Female |
| 5 to 17 Years | 162 (15.0%) | 28 (3.8%) |
| 18 to 34 Years | 0 (0.0%) | 118 (12.7%) |
| 35 to 64 Years | 50 (2.1%) | 101 (4.5%) |
| 65 to 74 Years | 7 (1.0%) | 21 (2.9%) |
| 75 Years and over | 67 (17.1%) | 28 (6.0%) |
Disability Class: Ambulatory Difficulty
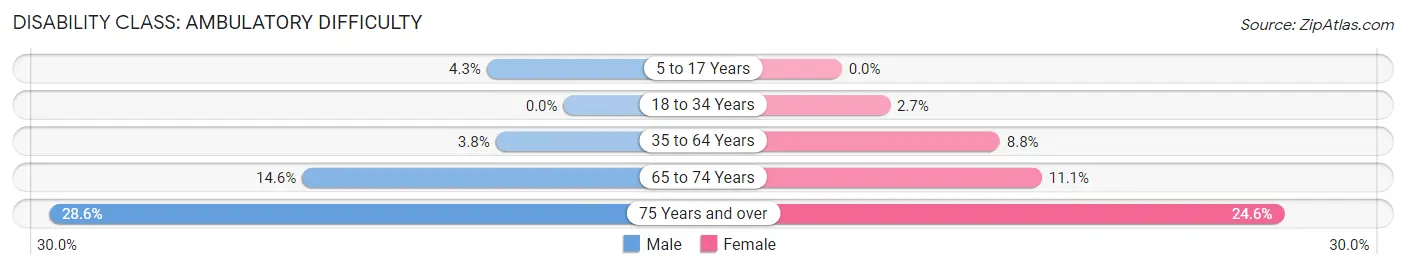
| Age Bracket | Male | Female |
| 5 to 17 Years | 46 (4.3%) | 0 (0.0%) |
| 18 to 34 Years | 0 (0.0%) | 25 (2.7%) |
| 35 to 64 Years | 92 (3.8%) | 199 (8.8%) |
| 65 to 74 Years | 102 (14.5%) | 81 (11.1%) |
| 75 Years and over | 112 (28.6%) | 115 (24.6%) |
Disability Class: Self-Care Difficulty
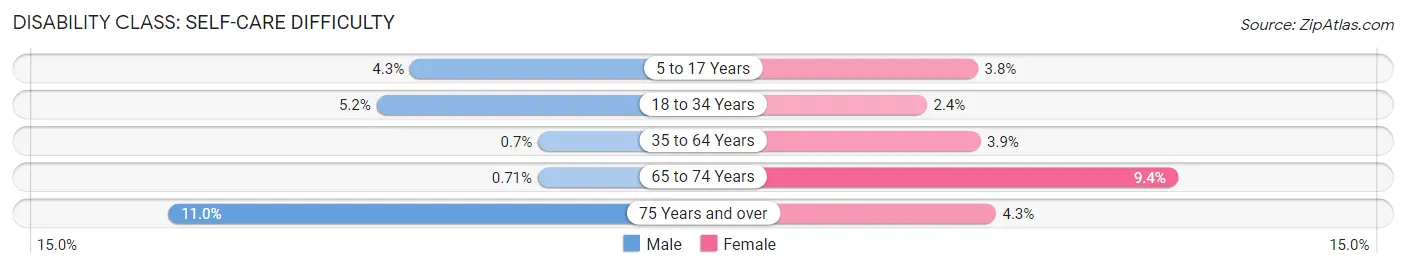
| Age Bracket | Male | Female |
| 5 to 17 Years | 46 (4.3%) | 28 (3.8%) |
| 18 to 34 Years | 49 (5.2%) | 22 (2.4%) |
| 35 to 64 Years | 17 (0.7%) | 87 (3.8%) |
| 65 to 74 Years | 5 (0.7%) | 68 (9.3%) |
| 75 Years and over | 43 (11.0%) | 20 (4.3%) |
Technology Access in Rio Grande County
Computing Device Access in Rio Grande County
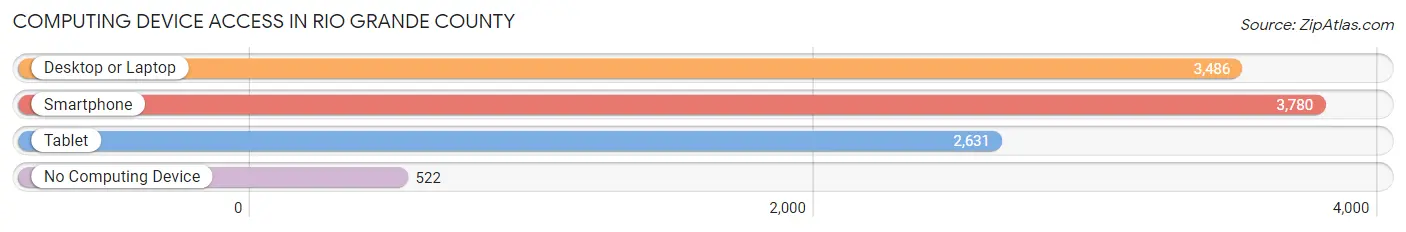
| Device Type | # Households | % Households |
| Desktop or Laptop | 3,486 | 74.9% |
| Smartphone | 3,780 | 81.2% |
| Tablet | 2,631 | 56.5% |
| No Computing Device | 522 | 11.2% |
| Total | 4,657 | 100.0% |
Internet Access in Rio Grande County
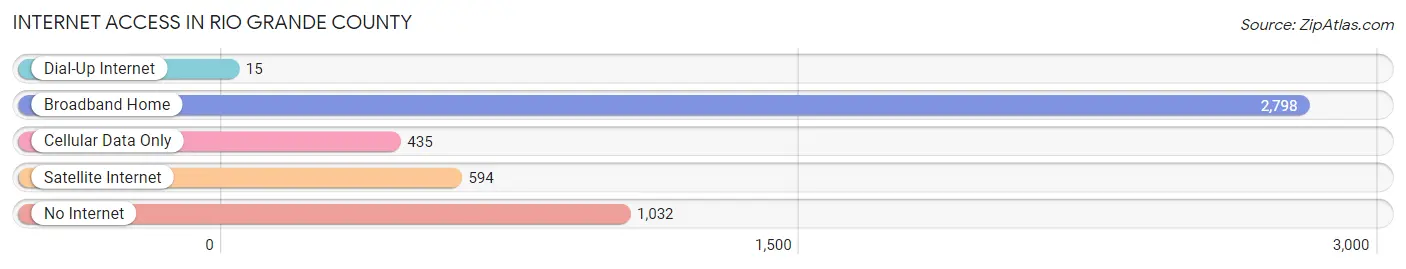
| Internet Type | # Households | % Households |
| Dial-Up Internet | 15 | 0.3% |
| Broadband Home | 2,798 | 60.1% |
| Cellular Data Only | 435 | 9.3% |
| Satellite Internet | 594 | 12.8% |
| No Internet | 1,032 | 22.2% |
| Total | 4,657 | 100.0% |
Rio Grande County Summary
Rio Grande County is located in the San Luis Valley of south-central Colorado. It is bordered by Alamosa County to the north, Conejos County to the east, Costilla County to the south, and Mineral County to the west. The county seat is Del Norte. The county was established in 1874 and is named for the Rio Grande, which flows through the county.
Geography
Rio Grande County covers an area of 1,845 square miles. The county is located in the San Luis Valley, which is a large intermontane basin in the Rocky Mountains. The valley is surrounded by the Sangre de Cristo Mountains to the east and the San Juan Mountains to the west. The Rio Grande River flows through the county from north to south. The county is mostly flat, with elevations ranging from 7,000 to 8,000 feet above sea level.
The county is home to several natural features, including the Rio Grande National Forest, the San Luis State Wildlife Area, and the Rio Grande Reservoir. The county also contains several small towns, including Del Norte, Monte Vista, and South Fork.
Demographics
As of the 2010 census, the population of Rio Grande County was 11,982. The population density was 6.5 people per square mile. The racial makeup of the county was 81.3% White, 0.7% African American, 1.2% Native American, 0.5% Asian, 0.1% Pacific Islander, 13.7% from other races, and 2.5% from two or more races. Hispanic or Latino of any race were 43.2% of the population.
The median income for a household in the county was $35,945, and the median income for a family was $41,945. The per capita income for the county was $17,845. About 16.2% of families and 20.2% of the population were below the poverty line, including 28.2% of those under age 18 and 10.2% of those age 65 or over.
Economy
The economy of Rio Grande County is largely based on agriculture. The county is home to several large farms, which produce a variety of crops, including potatoes, alfalfa, and wheat. The county is also home to several small businesses, including restaurants, retail stores, and service providers.
The county is also home to several tourist attractions, including the Rio Grande Scenic Railroad, the Rio Grande Nature Center, and the Rio Grande Golf Course. The county is also home to several ski resorts, including Wolf Creek Ski Area and Ski Rio.
Conclusion
Rio Grande County is a rural county located in the San Luis Valley of south-central Colorado. The county is home to several natural features, including the Rio Grande National Forest, the San Luis State Wildlife Area, and the Rio Grande Reservoir. The population of the county is 11,982, and the median income for a household is $35,945. The economy of the county is largely based on agriculture, with several large farms producing a variety of crops. The county is also home to several tourist attractions, including the Rio Grande Scenic Railroad, the Rio Grande Nature Center, and the Rio Grande Golf Course.
Common Questions
What is Per Capita Income in Rio Grande County?
Per Capita income in Rio Grande County is $34,328.
What is the Median Family Income in Rio Grande County?
Median Family Income in Rio Grande County is $81,904.
What is the Median Household income in Rio Grande County?
Median Household Income in Rio Grande County is $57,591.
What is Income or Wage Gap in Rio Grande County?
Income or Wage Gap in Rio Grande County is 6.2%.
Women in Rio Grande County earn 93.8 cents for every dollar earned by a man.
What is Family Income Deficit in Rio Grande County?
Family Income Deficit in Rio Grande County is $8,975.
Families that are below poverty line in Rio Grande County earn $8,975 less on average than the poverty threshold level.
What is Inequality or Gini Index in Rio Grande County?
Inequality or Gini Index in Rio Grande County is 0.43.
What is the Total Population of Rio Grande County?
Total Population of Rio Grande County is 11,442.
What is the Total Male Population of Rio Grande County?
Total Male Population of Rio Grande County is 5,913.
What is the Total Female Population of Rio Grande County?
Total Female Population of Rio Grande County is 5,529.
What is the Ratio of Males per 100 Females in Rio Grande County?
There are 106.95 Males per 100 Females in Rio Grande County.
What is the Ratio of Females per 100 Males in Rio Grande County?
There are 93.51 Females per 100 Males in Rio Grande County.
What is the Median Population Age in Rio Grande County?
Median Population Age in Rio Grande County is 41.3 Years.
What is the Average Family Size in Rio Grande County
Average Family Size in Rio Grande County is 2.9 People.
What is the Average Household Size in Rio Grande County
Average Household Size in Rio Grande County is 2.4 People.
How Large is the Labor Force in Rio Grande County?
There are 5,654 People in the Labor Forcein in Rio Grande County.
What is the Percentage of People in the Labor Force in Rio Grande County?
60.8% of People are in the Labor Force in Rio Grande County.
What is the Unemployment Rate in Rio Grande County?
Unemployment Rate in Rio Grande County is 6.0%.