Rio Blanco County, CO Map & Demographics
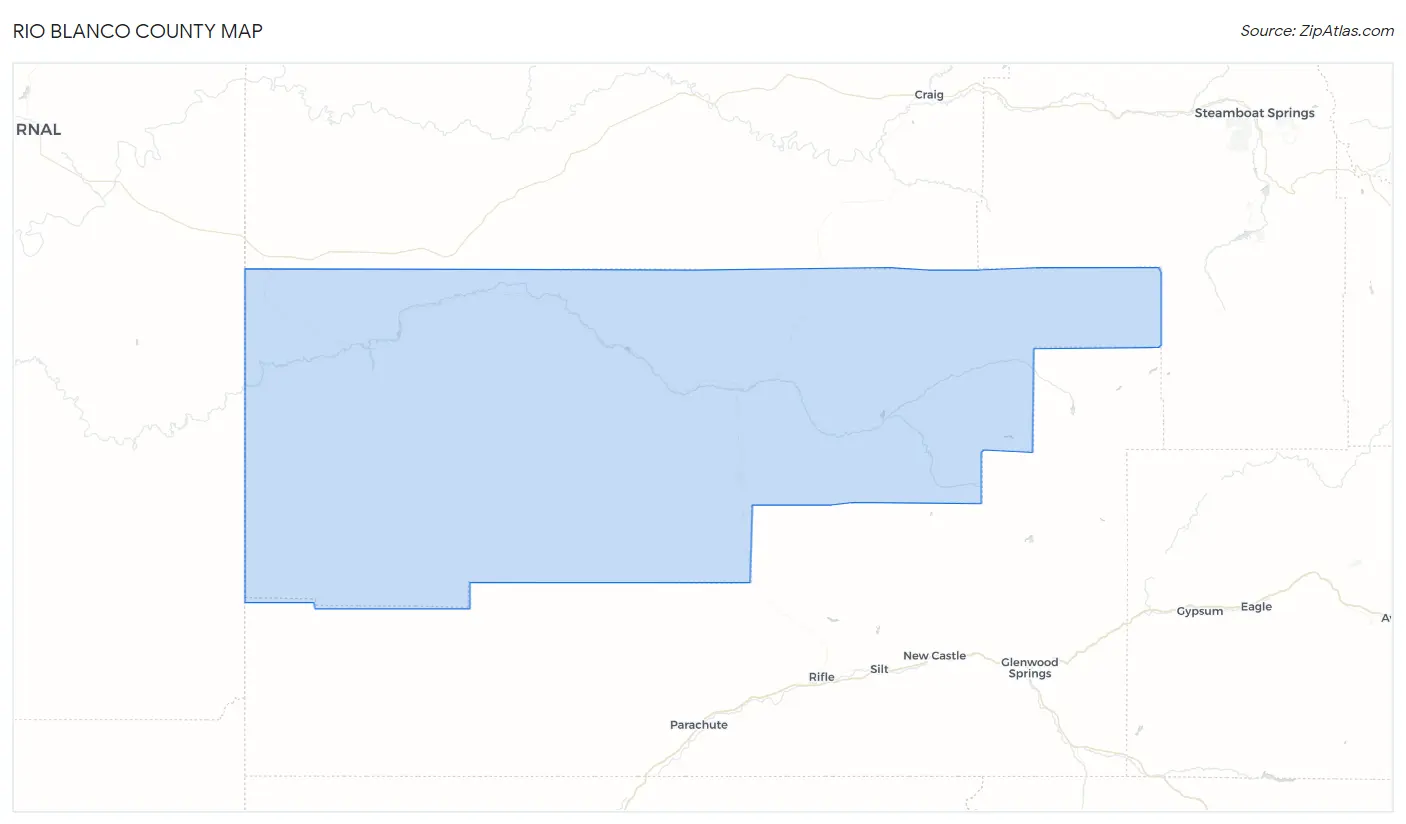
Rio Blanco County Map
Rio Blanco County Overview
$30,140
PER CAPITA INCOME
$84,716
AVG FAMILY INCOME
$69,882
AVG HOUSEHOLD INCOME
46.2%
WAGE / INCOME GAP [ % ]
53.8¢/ $1
WAGE / INCOME GAP [ $ ]
$12,195
FAMILY INCOME DEFICIT
0.36
INEQUALITY / GINI INDEX
6,511
TOTAL POPULATION
3,450
MALE POPULATION
3,061
FEMALE POPULATION
112.71
MALES / 100 FEMALES
88.72
FEMALES / 100 MALES
39.2
MEDIAN AGE
3.0
AVG FAMILY SIZE
2.5
AVG HOUSEHOLD SIZE
3,090
LABOR FORCE [ PEOPLE ]
60.1%
PERCENT IN LABOR FORCE
6.1%
UNEMPLOYMENT RATE
Rio Blanco County Area Codes
Income in Rio Blanco County
Income Overview in Rio Blanco County
Per Capita Income in Rio Blanco County is $30,140, while median incomes of families and households are $84,716 and $69,882 respectively.
| Characteristic | Number | Measure |
| Per Capita Income | 6,511 | $30,140 |
| Median Family Income | 1,679 | $84,716 |
| Mean Family Income | 1,679 | $88,159 |
| Median Household Income | 2,513 | $69,882 |
| Mean Household Income | 2,513 | $76,757 |
| Income Deficit | 1,679 | $12,195 |
| Wage / Income Gap (%) | 6,511 | 46.16% |
| Wage / Income Gap ($) | 6,511 | 53.84¢ per $1 |
| Gini / Inequality Index | 6,511 | 0.36 |
Earnings by Sex in Rio Blanco County
Average Earnings in Rio Blanco County are $34,048, $45,969 for men and $24,750 for women, a difference of 46.2%.
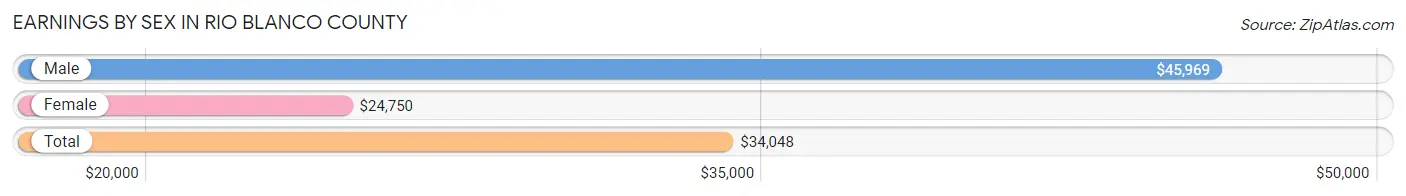
| Sex | Number | Average Earnings |
| Male | 1,907 (56.7%) | $45,969 |
| Female | 1,455 (43.3%) | $24,750 |
| Total | 3,362 (100.0%) | $34,048 |
Earnings by Sex by Income Bracket in Rio Blanco County
The most common earnings brackets in Rio Blanco County are $100,000+ for men (330 | 17.3%) and $2,499 or less for women (148 | 10.2%).
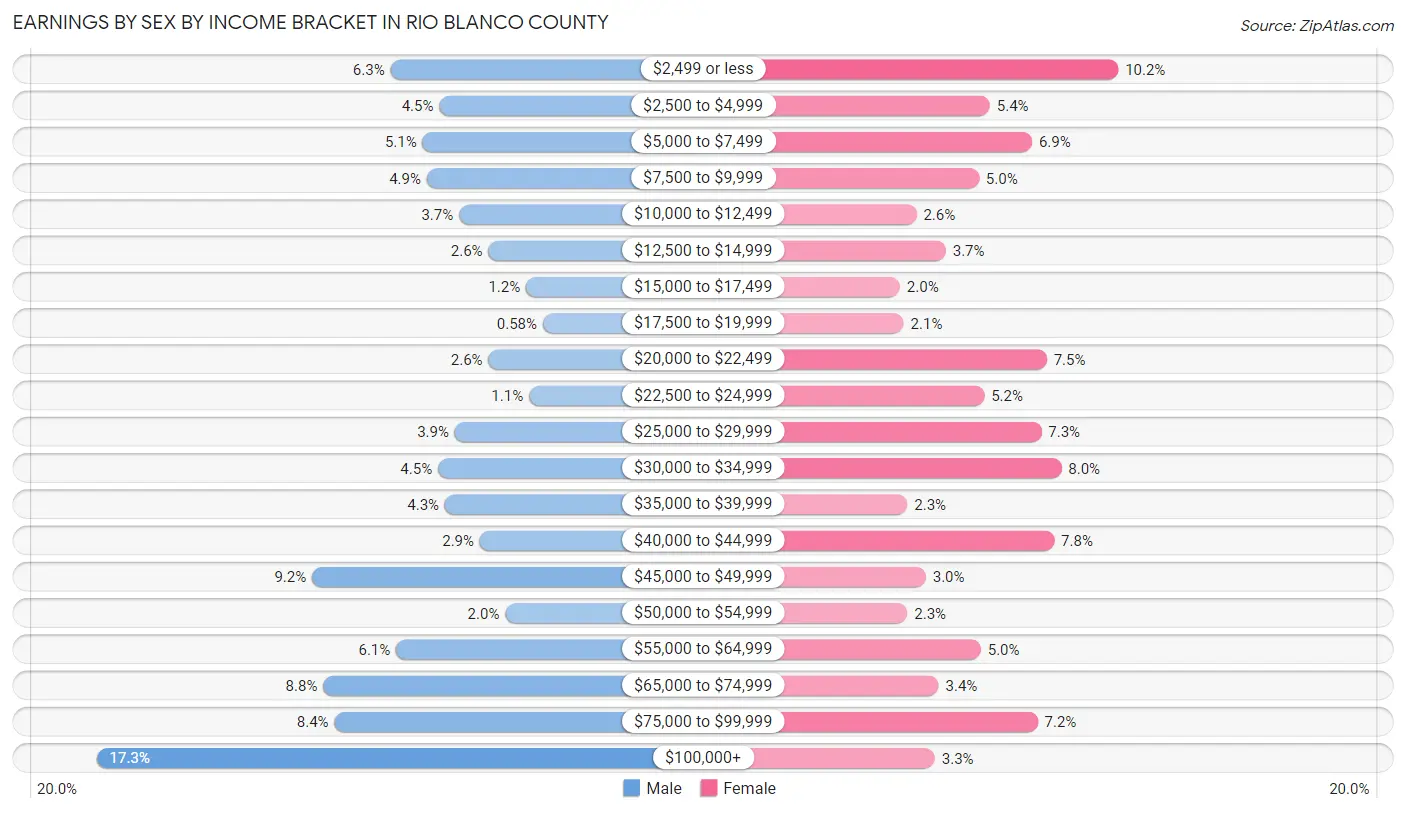
| Income | Male | Female |
| $2,499 or less | 120 (6.3%) | 148 (10.2%) |
| $2,500 to $4,999 | 85 (4.5%) | 78 (5.4%) |
| $5,000 to $7,499 | 97 (5.1%) | 101 (6.9%) |
| $7,500 to $9,999 | 94 (4.9%) | 72 (5.0%) |
| $10,000 to $12,499 | 71 (3.7%) | 38 (2.6%) |
| $12,500 to $14,999 | 50 (2.6%) | 54 (3.7%) |
| $15,000 to $17,499 | 23 (1.2%) | 29 (2.0%) |
| $17,500 to $19,999 | 11 (0.6%) | 31 (2.1%) |
| $20,000 to $22,499 | 50 (2.6%) | 109 (7.5%) |
| $22,500 to $24,999 | 21 (1.1%) | 75 (5.1%) |
| $25,000 to $29,999 | 74 (3.9%) | 106 (7.3%) |
| $30,000 to $34,999 | 86 (4.5%) | 117 (8.0%) |
| $35,000 to $39,999 | 81 (4.3%) | 33 (2.3%) |
| $40,000 to $44,999 | 56 (2.9%) | 113 (7.8%) |
| $45,000 to $49,999 | 176 (9.2%) | 43 (3.0%) |
| $50,000 to $54,999 | 38 (2.0%) | 33 (2.3%) |
| $55,000 to $64,999 | 116 (6.1%) | 73 (5.0%) |
| $65,000 to $74,999 | 168 (8.8%) | 50 (3.4%) |
| $75,000 to $99,999 | 160 (8.4%) | 104 (7.1%) |
| $100,000+ | 330 (17.3%) | 48 (3.3%) |
| Total | 1,907 (100.0%) | 1,455 (100.0%) |
Earnings by Sex by Educational Attainment in Rio Blanco County
Average earnings in Rio Blanco County are $49,124 for men and $30,329 for women, a difference of 38.3%. Men with an educational attainment of high school diploma enjoy the highest average annual earnings of $72,637, while those with college or associate's degree education earn the least with $46,350. Women with an educational attainment of graduate degree earn the most with the average annual earnings of $57,917, while those with less than high school education have the smallest earnings of $3,462.
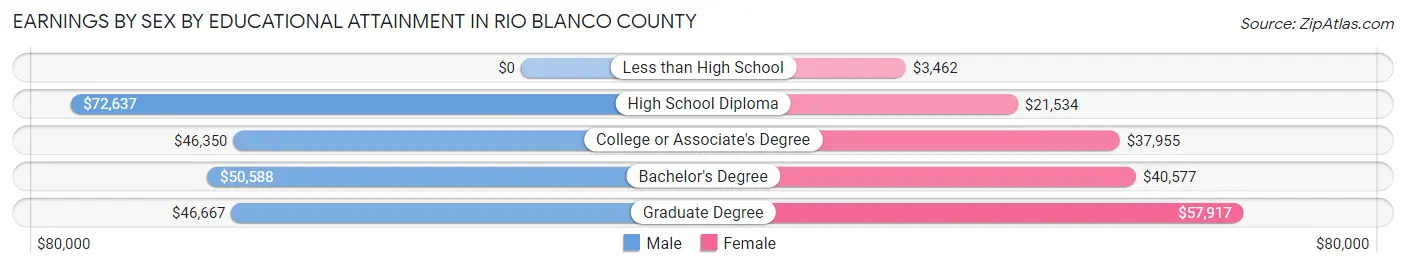
| Educational Attainment | Male Income | Female Income |
| Less than High School | - | - |
| High School Diploma | $72,637 | $21,534 |
| College or Associate's Degree | $46,350 | $37,955 |
| Bachelor's Degree | $50,588 | $40,577 |
| Graduate Degree | $46,667 | $57,917 |
| Total | $49,124 | $30,329 |
Family Income in Rio Blanco County
Family Income Brackets in Rio Blanco County
According to the Rio Blanco County family income data, there are 467 families falling into the $100,000 to $149,999 income range, which is the most common income bracket and makes up 27.8% of all families. Conversely, the $15,000 to $24,999 income bracket is the least frequent group with only 30 families (1.8%) belonging to this category.
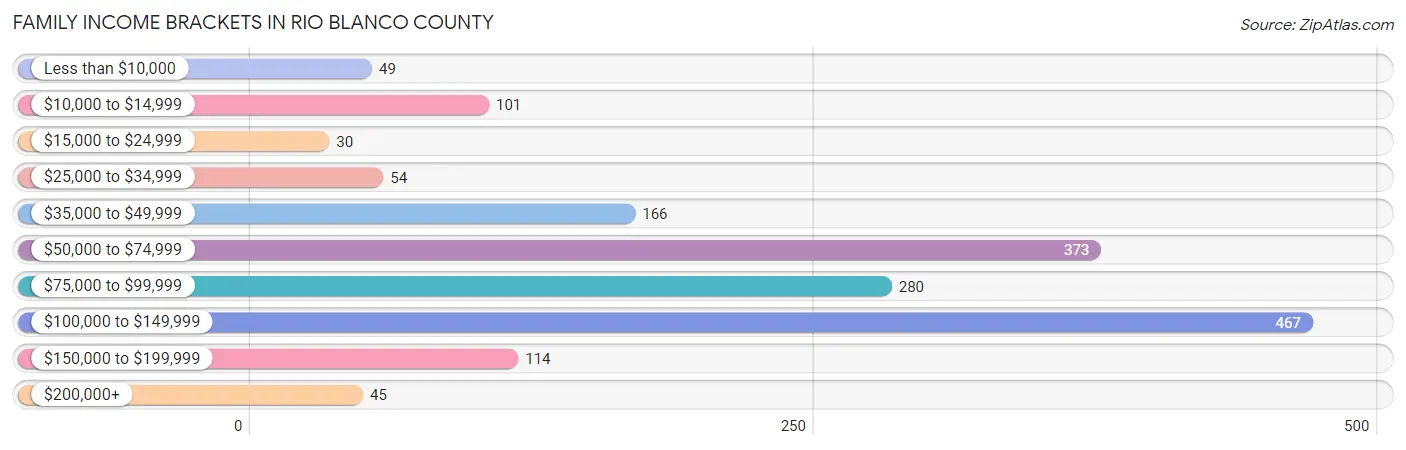
| Income Bracket | # Families | % Families |
| Less than $10,000 | 49 | 2.9% |
| $10,000 to $14,999 | 101 | 6.0% |
| $15,000 to $24,999 | 30 | 1.8% |
| $25,000 to $34,999 | 54 | 3.2% |
| $35,000 to $49,999 | 166 | 9.9% |
| $50,000 to $74,999 | 373 | 22.2% |
| $75,000 to $99,999 | 280 | 16.7% |
| $100,000 to $149,999 | 467 | 27.8% |
| $150,000 to $199,999 | 114 | 6.8% |
| $200,000+ | 45 | 2.7% |
Family Income by Famaliy Size in Rio Blanco County
6-person families (16 | 0.9%) account for the highest median family income in Rio Blanco County with $126,875 per family, while 2-person families (832 | 49.5%) have the highest median income of $44,526 per family member.
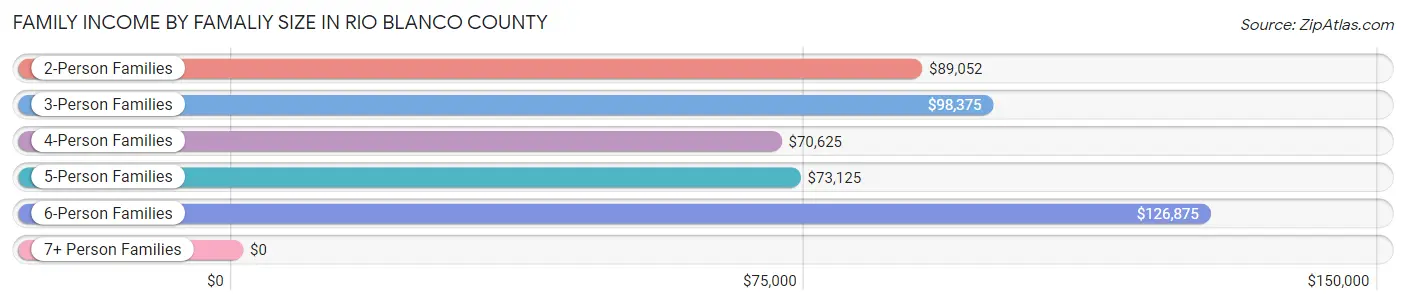
| Income Bracket | # Families | Median Income |
| 2-Person Families | 832 (49.5%) | $89,052 |
| 3-Person Families | 296 (17.6%) | $98,375 |
| 4-Person Families | 382 (22.8%) | $70,625 |
| 5-Person Families | 153 (9.1%) | $73,125 |
| 6-Person Families | 16 (0.9%) | $126,875 |
| 7+ Person Families | 0 (0.0%) | $0 |
| Total | 1,679 (100.0%) | $84,716 |
Family Income by Number of Earners in Rio Blanco County
The median family income in Rio Blanco County is $84,716, with families comprising 3+ earners (74) having the highest median family income of $112,000, while families with no earners (207) have the lowest median family income of $50,625, accounting for 4.4% and 12.3% of families, respectively.

| Number of Earners | # Families | Median Income |
| No Earners | 207 (12.3%) | $50,625 |
| 1 Earner | 679 (40.4%) | $62,991 |
| 2 Earners | 719 (42.8%) | $99,978 |
| 3+ Earners | 74 (4.4%) | $112,000 |
| Total | 1,679 (100.0%) | $84,716 |
Household Income in Rio Blanco County
Household Income Brackets in Rio Blanco County
With 596 households falling in the category, the $50,000 to $74,999 income range is the most frequent in Rio Blanco County, accounting for 23.7% of all households. In contrast, only 45 households (1.8%) fall into the $200,000+ income bracket, making it the least populous group.
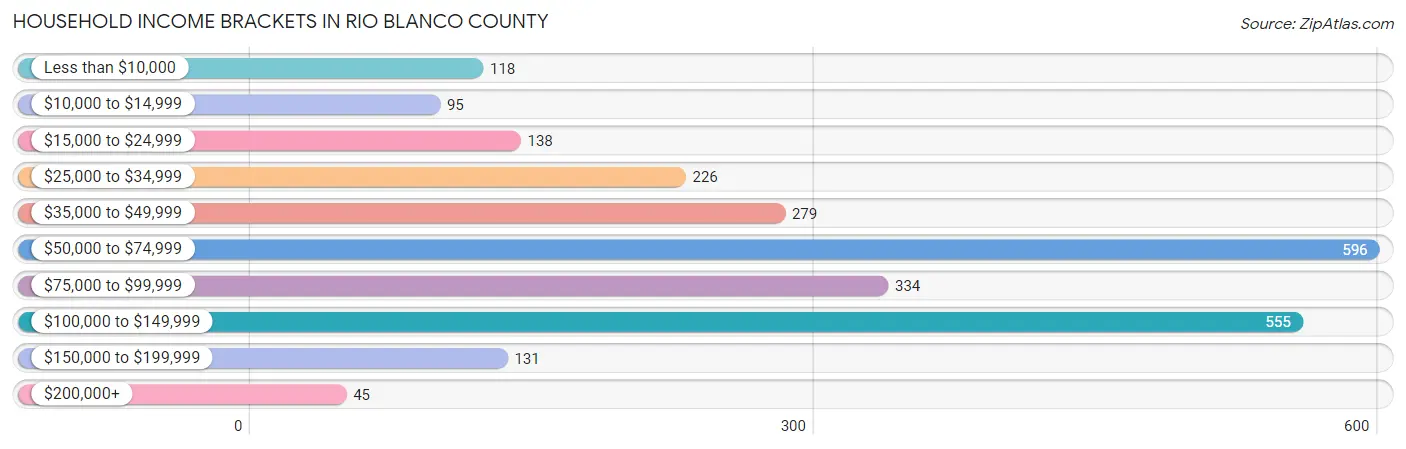
| Income Bracket | # Households | % Households |
| Less than $10,000 | 118 | 4.7% |
| $10,000 to $14,999 | 95 | 3.8% |
| $15,000 to $24,999 | 138 | 5.5% |
| $25,000 to $34,999 | 226 | 9.0% |
| $35,000 to $49,999 | 279 | 11.1% |
| $50,000 to $74,999 | 596 | 23.7% |
| $75,000 to $99,999 | 334 | 13.3% |
| $100,000 to $149,999 | 555 | 22.1% |
| $150,000 to $199,999 | 131 | 5.2% |
| $200,000+ | 45 | 1.8% |
Household Income by Householder Age in Rio Blanco County
The median household income in Rio Blanco County is $69,882, with the highest median household income of $85,250 found in the 45 to 64 years age bracket for the primary householder. A total of 917 households (36.5%) fall into this category. Meanwhile, the 15 to 24 years age bracket for the primary householder has the lowest median household income of $34,063, with 139 households (5.5%) in this group.
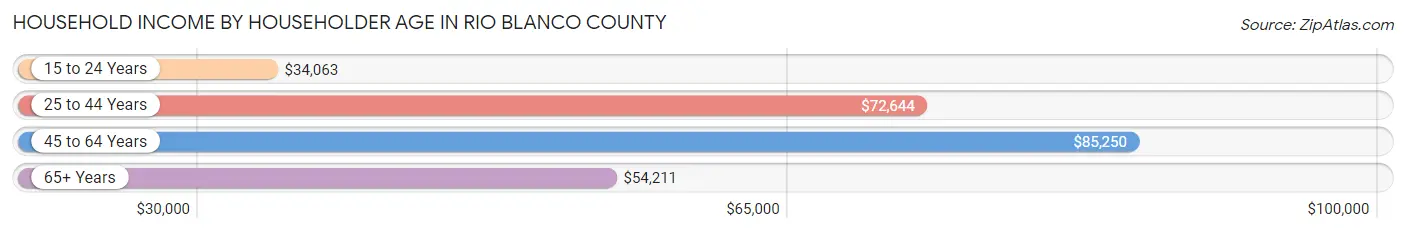
| Income Bracket | # Households | Median Income |
| 15 to 24 Years | 139 (5.5%) | $34,063 |
| 25 to 44 Years | 799 (31.8%) | $72,644 |
| 45 to 64 Years | 917 (36.5%) | $85,250 |
| 65+ Years | 658 (26.2%) | $54,211 |
| Total | 2,513 (100.0%) | $69,882 |
Poverty in Rio Blanco County
Income Below Poverty by Sex and Age in Rio Blanco County
With 13.0% poverty level for males and 12.9% for females among the residents of Rio Blanco County, 6 to 11 year old males and 18 to 24 year old females are the most vulnerable to poverty, with 157 males (66.2%) and 46 females (21.3%) in their respective age groups living below the poverty level.
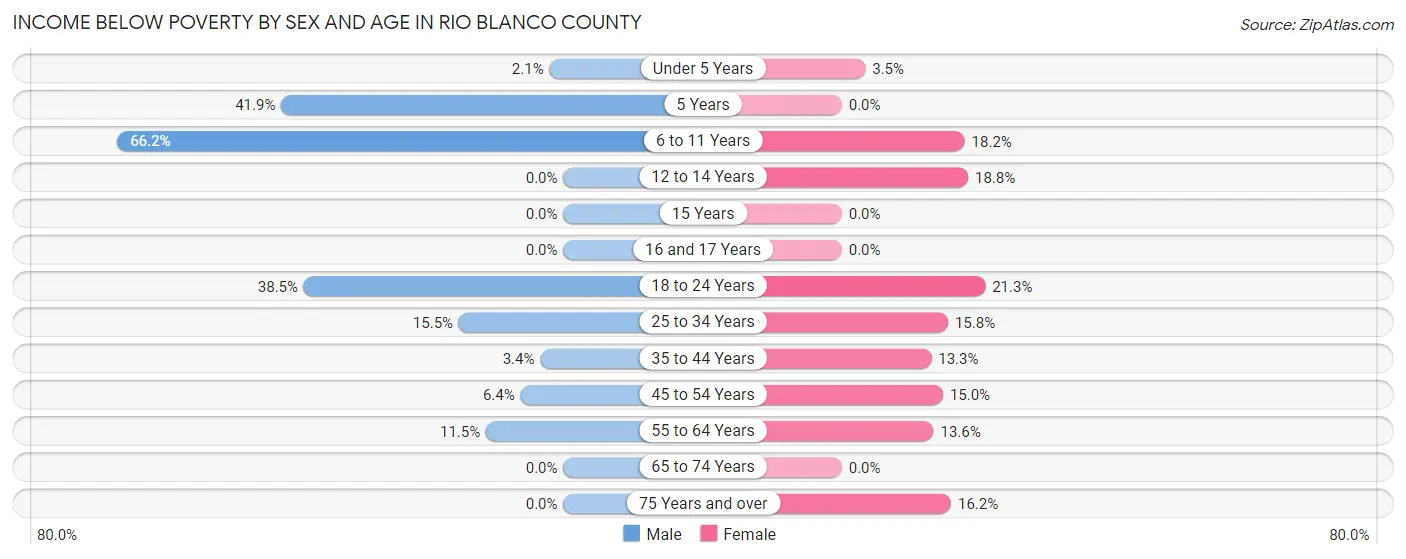
| Age Bracket | Male | Female |
| Under 5 Years | 5 (2.1%) | 6 (3.5%) |
| 5 Years | 31 (41.9%) | 0 (0.0%) |
| 6 to 11 Years | 157 (66.2%) | 54 (18.2%) |
| 12 to 14 Years | 0 (0.0%) | 18 (18.8%) |
| 15 Years | 0 (0.0%) | 0 (0.0%) |
| 16 and 17 Years | 0 (0.0%) | 0 (0.0%) |
| 18 to 24 Years | 84 (38.5%) | 46 (21.3%) |
| 25 to 34 Years | 56 (15.5%) | 47 (15.8%) |
| 35 to 44 Years | 19 (3.4%) | 57 (13.3%) |
| 45 to 54 Years | 15 (6.4%) | 50 (15.0%) |
| 55 to 64 Years | 59 (11.5%) | 70 (13.6%) |
| 65 to 74 Years | 0 (0.0%) | 0 (0.0%) |
| 75 Years and over | 0 (0.0%) | 25 (16.2%) |
| Total | 426 (13.0%) | 373 (12.9%) |
Income Above Poverty by Sex and Age in Rio Blanco County
According to the poverty statistics in Rio Blanco County, males aged 12 to 14 years and females aged 5 years are the age groups that are most secure financially, with 100.0% of males and 100.0% of females in these age groups living above the poverty line.
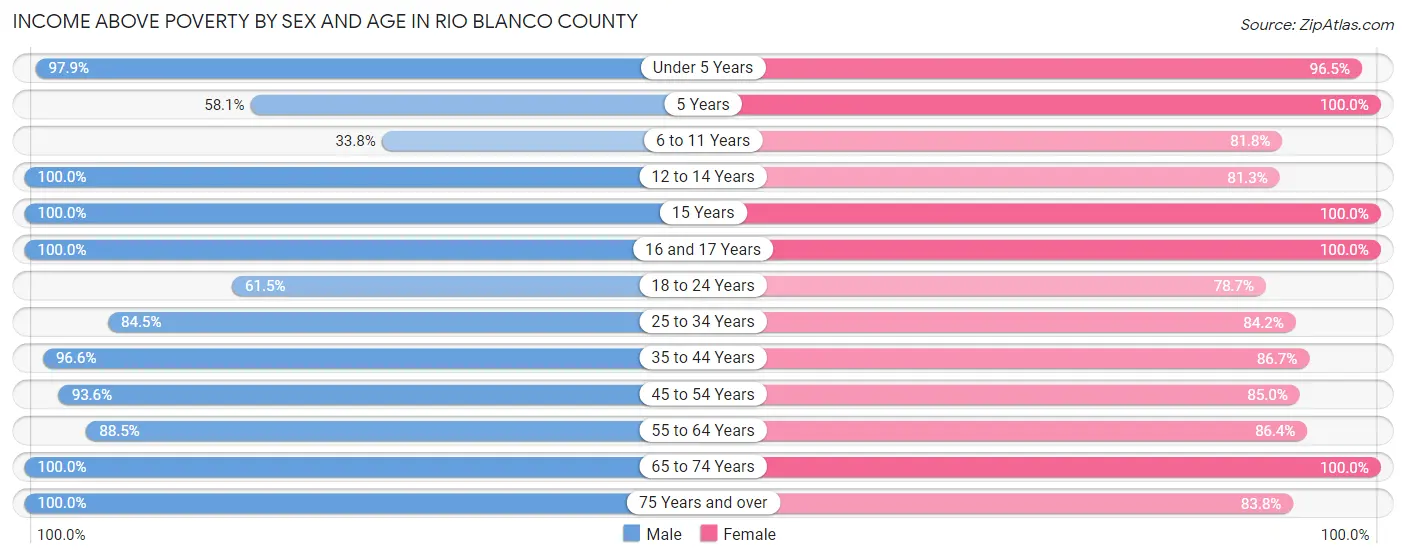
| Age Bracket | Male | Female |
| Under 5 Years | 238 (97.9%) | 166 (96.5%) |
| 5 Years | 43 (58.1%) | 34 (100.0%) |
| 6 to 11 Years | 80 (33.8%) | 242 (81.8%) |
| 12 to 14 Years | 178 (100.0%) | 78 (81.2%) |
| 15 Years | 25 (100.0%) | 3 (100.0%) |
| 16 and 17 Years | 142 (100.0%) | 54 (100.0%) |
| 18 to 24 Years | 134 (61.5%) | 170 (78.7%) |
| 25 to 34 Years | 305 (84.5%) | 251 (84.2%) |
| 35 to 44 Years | 536 (96.6%) | 372 (86.7%) |
| 45 to 54 Years | 221 (93.6%) | 283 (85.0%) |
| 55 to 64 Years | 455 (88.5%) | 444 (86.4%) |
| 65 to 74 Years | 321 (100.0%) | 299 (100.0%) |
| 75 Years and over | 173 (100.0%) | 129 (83.8%) |
| Total | 2,851 (87.0%) | 2,525 (87.1%) |
Income Below Poverty Among Married-Couple Families in Rio Blanco County
The poverty statistics for married-couple families in Rio Blanco County show that 5.5% or 75 of the total 1,364 families live below the poverty line. Families with 1 or 2 children have the highest poverty rate of 12.4%, comprising of 63 families. On the other hand, families with 3 or 4 children have the lowest poverty rate of 0.0%, which includes 0 families.
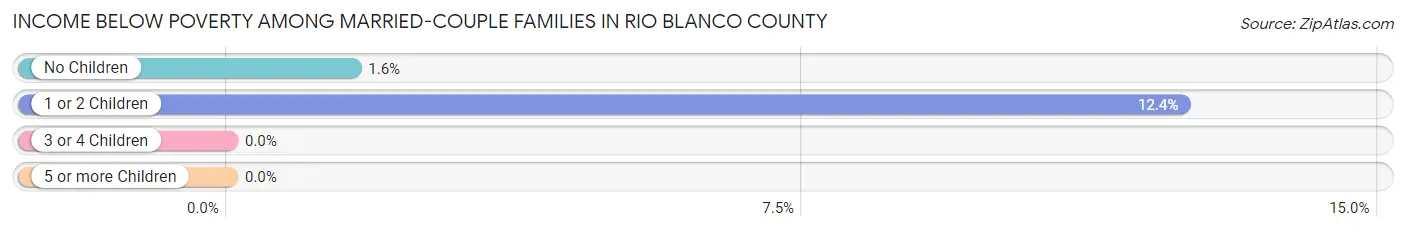
| Children | Above Poverty | Below Poverty |
| No Children | 734 (98.4%) | 12 (1.6%) |
| 1 or 2 Children | 444 (87.6%) | 63 (12.4%) |
| 3 or 4 Children | 111 (100.0%) | 0 (0.0%) |
| 5 or more Children | 0 (0.0%) | 0 (0.0%) |
| Total | 1,289 (94.5%) | 75 (5.5%) |
Income Below Poverty Among Single-Parent Households in Rio Blanco County
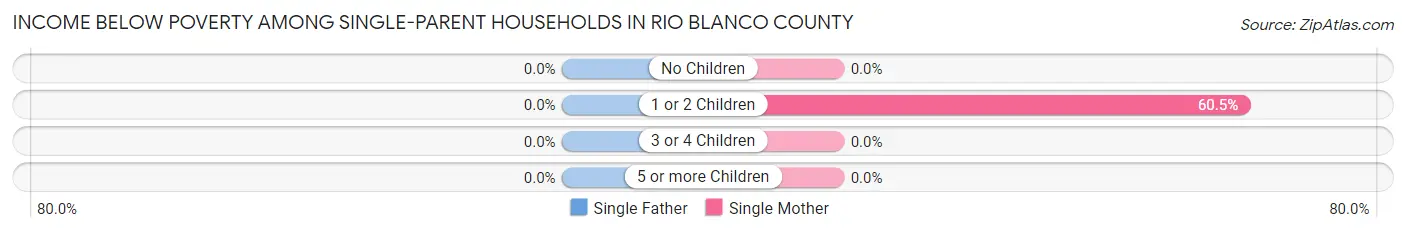
| Children | Single Father | Single Mother |
| No Children | 0 (0.0%) | 0 (0.0%) |
| 1 or 2 Children | 0 (0.0%) | 89 (60.5%) |
| 3 or 4 Children | 0 (0.0%) | 0 (0.0%) |
| 5 or more Children | 0 (0.0%) | 0 (0.0%) |
| Total | 0 (0.0%) | 89 (41.6%) |
Income Below Poverty Among Married-Couple vs Single-Parent Households in Rio Blanco County
The poverty data for Rio Blanco County shows that 75 of the married-couple family households (5.5%) and 89 of the single-parent households (28.2%) are living below the poverty level. Within the married-couple family households, those with 1 or 2 children have the highest poverty rate, with 63 households (12.4%) falling below the poverty line. Among the single-parent households, those with 1 or 2 children have the highest poverty rate, with 89 household (45.6%) living below poverty.
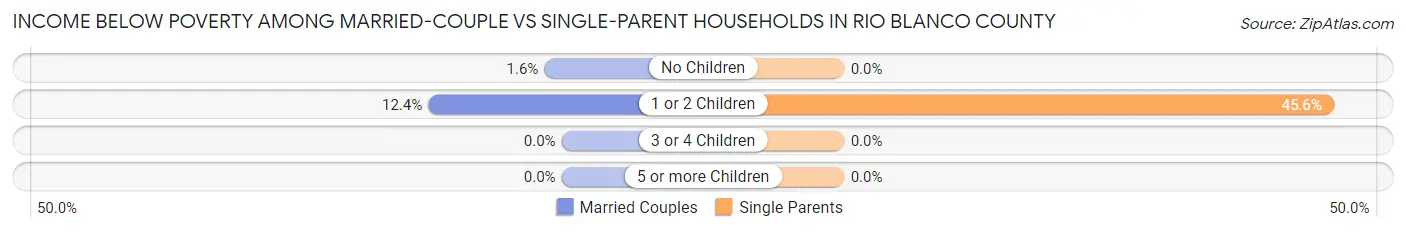
| Children | Married-Couple Families | Single-Parent Households |
| No Children | 12 (1.6%) | 0 (0.0%) |
| 1 or 2 Children | 63 (12.4%) | 89 (45.6%) |
| 3 or 4 Children | 0 (0.0%) | 0 (0.0%) |
| 5 or more Children | 0 (0.0%) | 0 (0.0%) |
| Total | 75 (5.5%) | 89 (28.2%) |
Race in Rio Blanco County
The most populous races in Rio Blanco County are White / Caucasian (5,583 | 85.8%), Hispanic or Latino (721 | 11.1%), and Two or more Races (720 | 11.1%).

| Race | # Population | % Population |
| Asian | 4 | 0.1% |
| Black / African American | 19 | 0.3% |
| Hawaiian / Pacific | 0 | 0.0% |
| Hispanic or Latino | 721 | 11.1% |
| Native / Alaskan | 71 | 1.1% |
| White / Caucasian | 5,583 | 85.8% |
| Two or more Races | 720 | 11.1% |
| Some other Race | 114 | 1.8% |
| Total | 6,511 | 100.0% |
Ancestry in Rio Blanco County
The most populous ancestries reported in Rio Blanco County are German (1,737 | 26.7%), English (1,126 | 17.3%), Irish (576 | 8.8%), Mexican (395 | 6.1%), and American (337 | 5.2%), together accounting for 64.1% of all Rio Blanco County residents.

| Ancestry | # Population | % Population |
| American | 337 | 5.2% |
| Arab | 11 | 0.2% |
| Armenian | 7 | 0.1% |
| Austrian | 20 | 0.3% |
| Bhutanese | 10 | 0.2% |
| Blackfeet | 1 | 0.0% |
| Burmese | 6 | 0.1% |
| Canadian | 20 | 0.3% |
| Cherokee | 162 | 2.5% |
| Chippewa | 16 | 0.3% |
| Choctaw | 20 | 0.3% |
| Colombian | 61 | 0.9% |
| Czech | 89 | 1.4% |
| Czechoslovakian | 11 | 0.2% |
| Danish | 36 | 0.5% |
| Dutch | 111 | 1.7% |
| Eastern European | 24 | 0.4% |
| Ecuadorian | 32 | 0.5% |
| English | 1,126 | 17.3% |
| European | 173 | 2.7% |
| Finnish | 9 | 0.1% |
| French | 260 | 4.0% |
| French Canadian | 65 | 1.0% |
| German | 1,737 | 26.7% |
| Greek | 33 | 0.5% |
| Irish | 576 | 8.8% |
| Italian | 115 | 1.8% |
| Kiowa | 4 | 0.1% |
| Latvian | 1 | 0.0% |
| Lebanese | 11 | 0.2% |
| Mexican | 395 | 6.1% |
| Northern European | 22 | 0.3% |
| Norwegian | 158 | 2.4% |
| Paiute | 5 | 0.1% |
| Peruvian | 5 | 0.1% |
| Polish | 130 | 2.0% |
| Pueblo | 8 | 0.1% |
| Puerto Rican | 13 | 0.2% |
| Russian | 56 | 0.9% |
| Scandinavian | 97 | 1.5% |
| Scotch-Irish | 85 | 1.3% |
| Scottish | 208 | 3.2% |
| Seminole | 6 | 0.1% |
| Sioux | 5 | 0.1% |
| Slavic | 23 | 0.4% |
| South American | 99 | 1.5% |
| Spaniard | 73 | 1.1% |
| Spanish | 7 | 0.1% |
| Spanish American | 7 | 0.1% |
| Spanish American Indian | 10 | 0.2% |
| Swedish | 77 | 1.2% |
| Swiss | 34 | 0.5% |
| Taiwanese | 40 | 0.6% |
| Thai | 4 | 0.1% |
| Ukrainian | 80 | 1.2% |
| Ute | 30 | 0.5% |
| Venezuelan | 1 | 0.0% |
| Welsh | 60 | 0.9% |
| Yugoslavian | 11 | 0.2% | View All 59 Rows |
Immigrants in Rio Blanco County
The most numerous immigrant groups reported in Rio Blanco County came from Latin America (148 | 2.3%), Central America (98 | 1.5%), Mexico (98 | 1.5%), Europe (96 | 1.5%), and Colombia (50 | 0.8%), together accounting for 7.5% of all Rio Blanco County residents.

| Immigration Origin | # Population | % Population |
| Canada | 1 | 0.0% |
| Central America | 98 | 1.5% |
| Colombia | 50 | 0.8% |
| Eastern Europe | 36 | 0.5% |
| Europe | 96 | 1.5% |
| Germany | 31 | 0.5% |
| Latin America | 148 | 2.3% |
| Mexico | 98 | 1.5% |
| Northern Europe | 29 | 0.4% |
| Russia | 2 | 0.0% |
| Scotland | 29 | 0.4% |
| South America | 50 | 0.8% |
| Ukraine | 34 | 0.5% |
| Western Europe | 31 | 0.5% | View All 14 Rows |
Sex and Age in Rio Blanco County
Sex and Age in Rio Blanco County
The most populous age groups in Rio Blanco County are 35 to 39 Years (326 | 9.5%) for men and 55 to 59 Years (291 | 9.5%) for women.
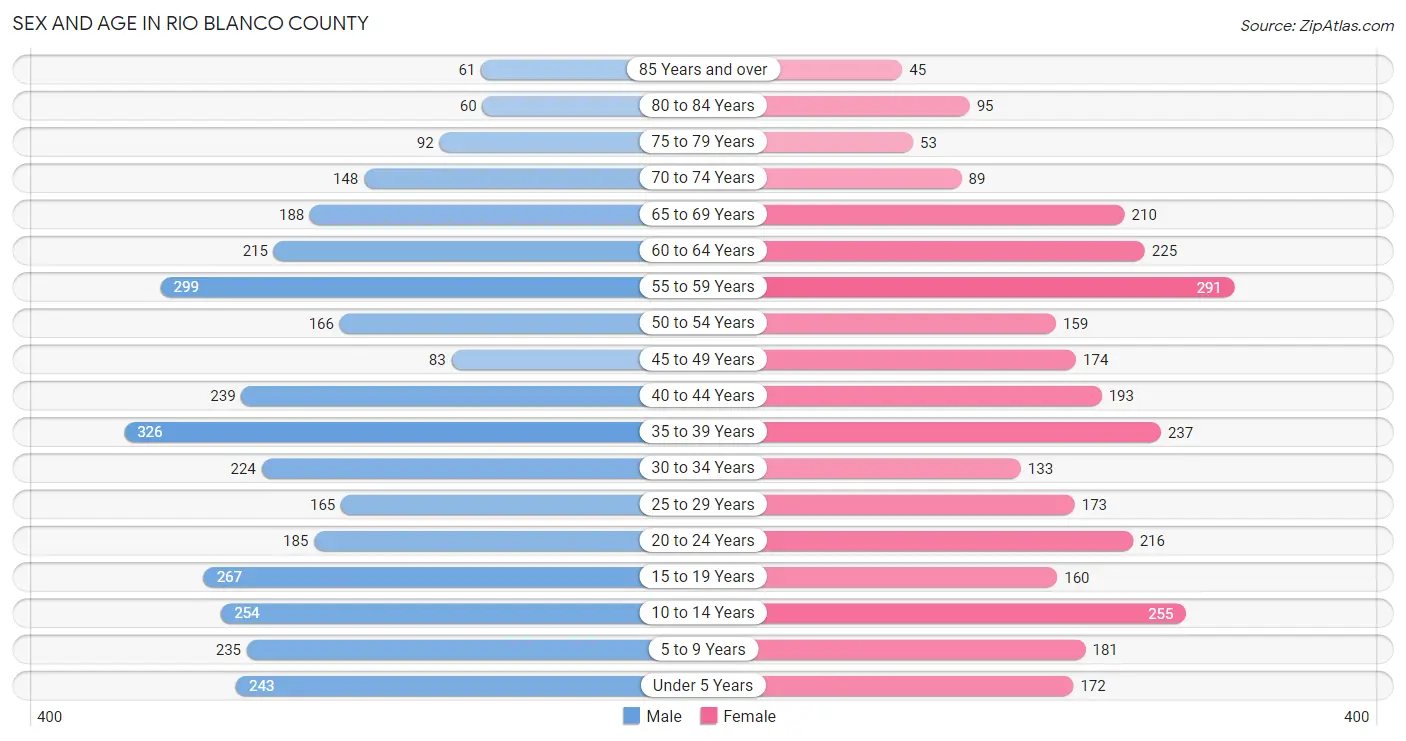
| Age Bracket | Male | Female |
| Under 5 Years | 243 (7.0%) | 172 (5.6%) |
| 5 to 9 Years | 235 (6.8%) | 181 (5.9%) |
| 10 to 14 Years | 254 (7.4%) | 255 (8.3%) |
| 15 to 19 Years | 267 (7.7%) | 160 (5.2%) |
| 20 to 24 Years | 185 (5.4%) | 216 (7.1%) |
| 25 to 29 Years | 165 (4.8%) | 173 (5.7%) |
| 30 to 34 Years | 224 (6.5%) | 133 (4.3%) |
| 35 to 39 Years | 326 (9.5%) | 237 (7.7%) |
| 40 to 44 Years | 239 (6.9%) | 193 (6.3%) |
| 45 to 49 Years | 83 (2.4%) | 174 (5.7%) |
| 50 to 54 Years | 166 (4.8%) | 159 (5.2%) |
| 55 to 59 Years | 299 (8.7%) | 291 (9.5%) |
| 60 to 64 Years | 215 (6.2%) | 225 (7.3%) |
| 65 to 69 Years | 188 (5.4%) | 210 (6.9%) |
| 70 to 74 Years | 148 (4.3%) | 89 (2.9%) |
| 75 to 79 Years | 92 (2.7%) | 53 (1.7%) |
| 80 to 84 Years | 60 (1.7%) | 95 (3.1%) |
| 85 Years and over | 61 (1.8%) | 45 (1.5%) |
| Total | 3,450 (100.0%) | 3,061 (100.0%) |
Families and Households in Rio Blanco County
Median Family Size in Rio Blanco County
The median family size in Rio Blanco County is 3.03 persons per family, with married-couple families (1,364 | 81.2%) accounting for the largest median family size of 3.12 persons per family. On the other hand, single male/father families (101 | 6.0%) represent the smallest median family size with 2.45 persons per family.
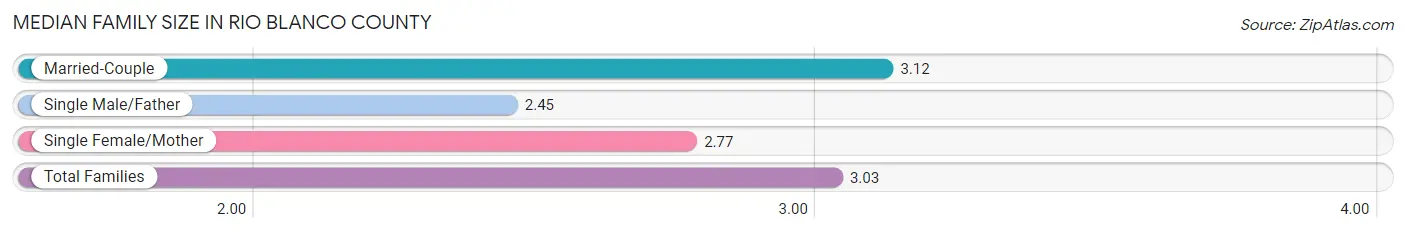
| Family Type | # Families | Family Size |
| Married-Couple | 1,364 (81.2%) | 3.12 |
| Single Male/Father | 101 (6.0%) | 2.45 |
| Single Female/Mother | 214 (12.8%) | 2.77 |
| Total Families | 1,679 (100.0%) | 3.03 |
Median Household Size in Rio Blanco County
The median household size in Rio Blanco County is 2.45 persons per household, with married-couple households (1,364 | 54.3%) accounting for the largest median household size of 3.13 persons per household. non-family households (834 | 33.2%) represent the smallest median household size with 1.19 persons per household.
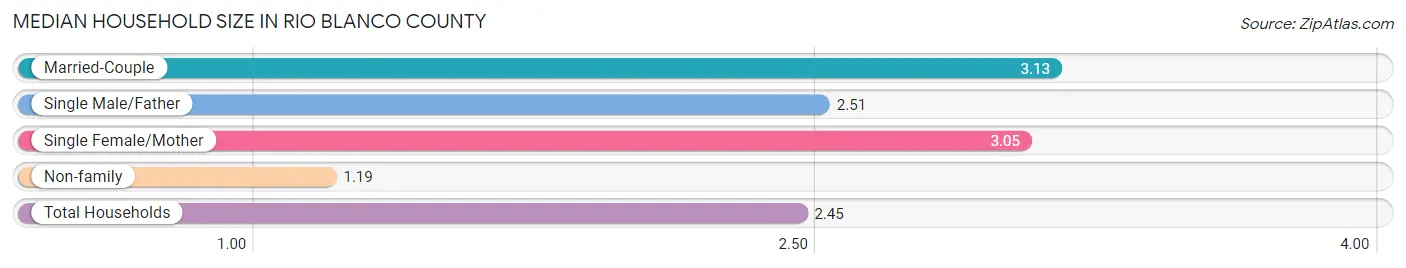
| Household Type | # Households | Household Size |
| Married-Couple | 1,364 (54.3%) | 3.13 |
| Single Male/Father | 101 (4.0%) | 2.51 |
| Single Female/Mother | 214 (8.5%) | 3.05 |
| Non-family | 834 (33.2%) | 1.19 |
| Total Households | 2,513 (100.0%) | 2.45 |
Household Size by Marriage Status in Rio Blanco County
Out of a total of 2,513 households in Rio Blanco County, 1,679 (66.8%) are family households, while 834 (33.2%) are nonfamily households. The most numerous type of family households are 2-person households, comprising 802, and the most common type of nonfamily households are 1-person households, comprising 718.

| Household Size | Family Households | Nonfamily Households |
| 1-Person Households | - | 718 (28.6%) |
| 2-Person Households | 802 (31.9%) | 83 (3.3%) |
| 3-Person Households | 286 (11.4%) | 10 (0.4%) |
| 4-Person Households | 422 (16.8%) | 23 (0.9%) |
| 5-Person Households | 142 (5.7%) | 0 (0.0%) |
| 6-Person Households | 27 (1.1%) | 0 (0.0%) |
| 7+ Person Households | 0 (0.0%) | 0 (0.0%) |
| Total | 1,679 (66.8%) | 834 (33.2%) |
Female Fertility in Rio Blanco County
Fertility by Age in Rio Blanco County
Average fertility rate in Rio Blanco County is 108.0 births per 1,000 women. Women in the age bracket of 20 to 34 years have the highest fertility rate with 218.0 births per 1,000 women. Women in the age bracket of 20 to 34 years acount for 79.7% of all women with births.
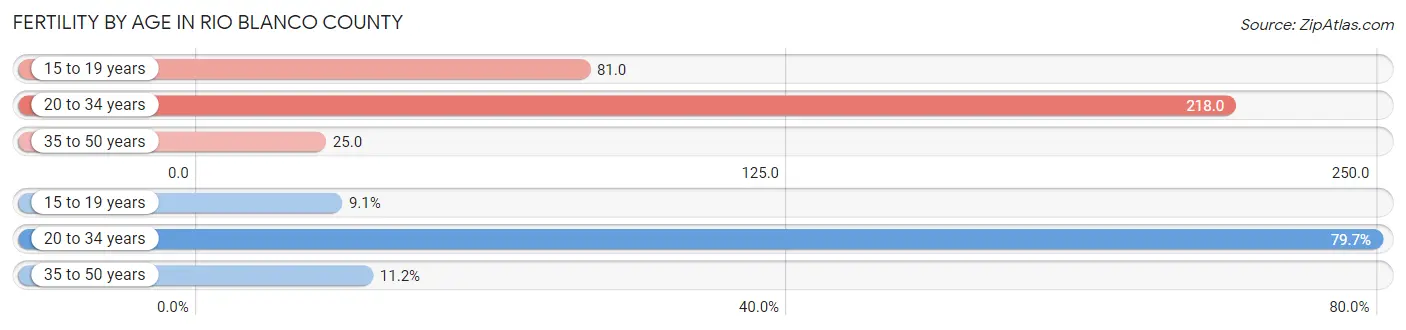
| Age Bracket | Women with Births | Births / 1,000 Women |
| 15 to 19 years | 13 (9.1%) | 81.0 |
| 20 to 34 years | 114 (79.7%) | 218.0 |
| 35 to 50 years | 16 (11.2%) | 25.0 |
| Total | 143 (100.0%) | 108.0 |
Fertility by Age by Marriage Status in Rio Blanco County
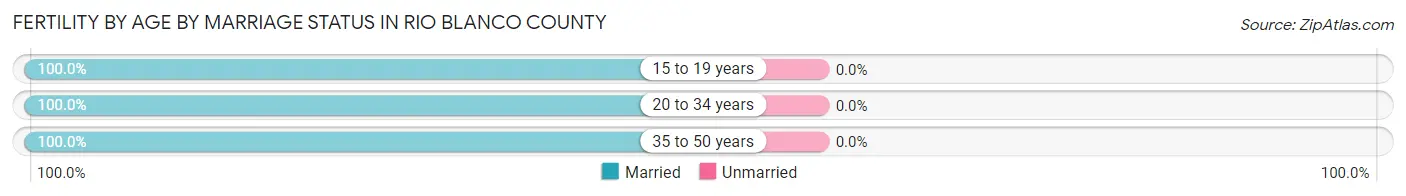
| Age Bracket | Married | Unmarried |
| 15 to 19 years | 13 (100.0%) | 0 (0.0%) |
| 20 to 34 years | 114 (100.0%) | 0 (0.0%) |
| 35 to 50 years | 16 (100.0%) | 0 (0.0%) |
| Total | 143 (100.0%) | 0 (0.0%) |
Fertility by Education in Rio Blanco County
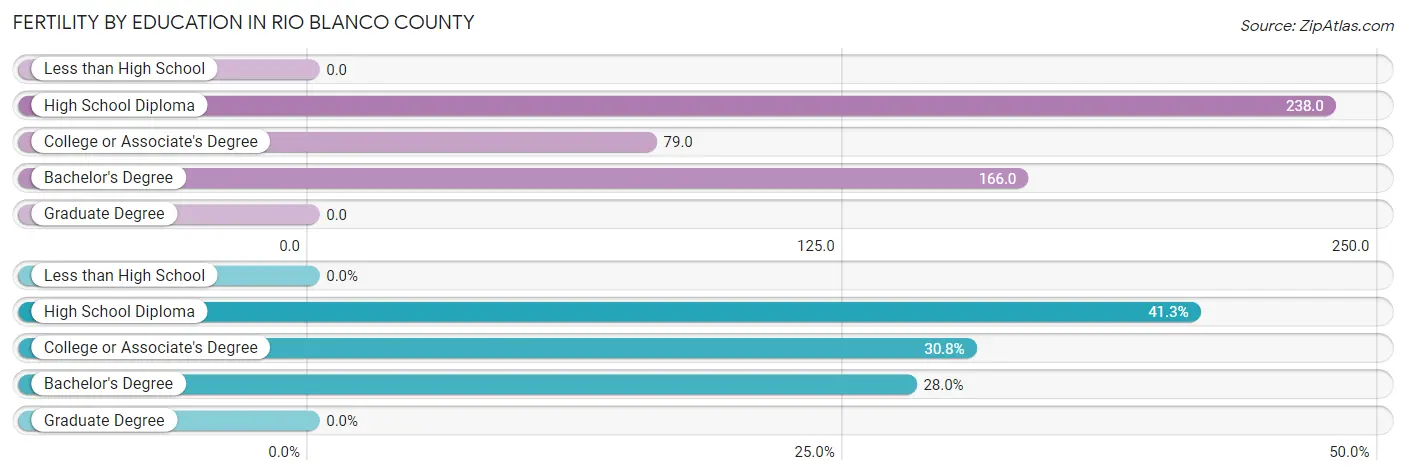
| Educational Attainment | Women with Births | Births / 1,000 Women |
| Less than High School | 0 (0.0%) | 0.0 |
| High School Diploma | 59 (41.3%) | 238.0 |
| College or Associate's Degree | 44 (30.8%) | 79.0 |
| Bachelor's Degree | 40 (28.0%) | 166.0 |
| Graduate Degree | 0 (0.0%) | 0.0 |
| Total | 143 (100.0%) | 108.0 |
Fertility by Education by Marriage Status in Rio Blanco County
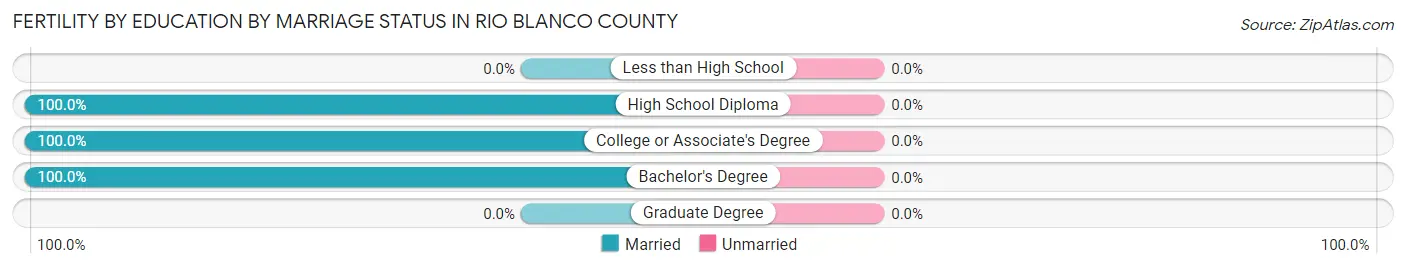
| Educational Attainment | Married | Unmarried |
| Less than High School | 0 (0.0%) | 0 (0.0%) |
| High School Diploma | 59 (100.0%) | 0 (0.0%) |
| College or Associate's Degree | 44 (100.0%) | 0 (0.0%) |
| Bachelor's Degree | 40 (100.0%) | 0 (0.0%) |
| Graduate Degree | 0 (0.0%) | 0 (0.0%) |
| Total | 143 (100.0%) | 0 (0.0%) |
Employment Characteristics in Rio Blanco County
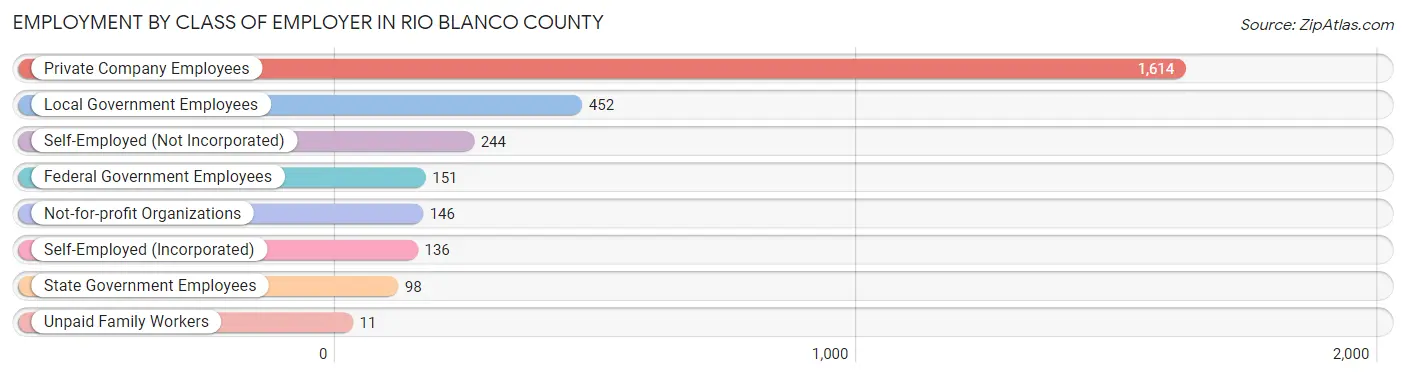
Employment by Class of Employer in Rio Blanco County
Among the 2,852 employed individuals in Rio Blanco County, private company employees (1,614 | 56.6%), local government employees (452 | 15.9%), and self-employed (not incorporated) (244 | 8.6%) make up the most common classes of employment.
| Employer Class | # Employees | % Employees |
| Private Company Employees | 1,614 | 56.6% |
| Self-Employed (Incorporated) | 136 | 4.8% |
| Self-Employed (Not Incorporated) | 244 | 8.6% |
| Not-for-profit Organizations | 146 | 5.1% |
| Local Government Employees | 452 | 15.9% |
| State Government Employees | 98 | 3.4% |
| Federal Government Employees | 151 | 5.3% |
| Unpaid Family Workers | 11 | 0.4% |
| Total | 2,852 | 100.0% |
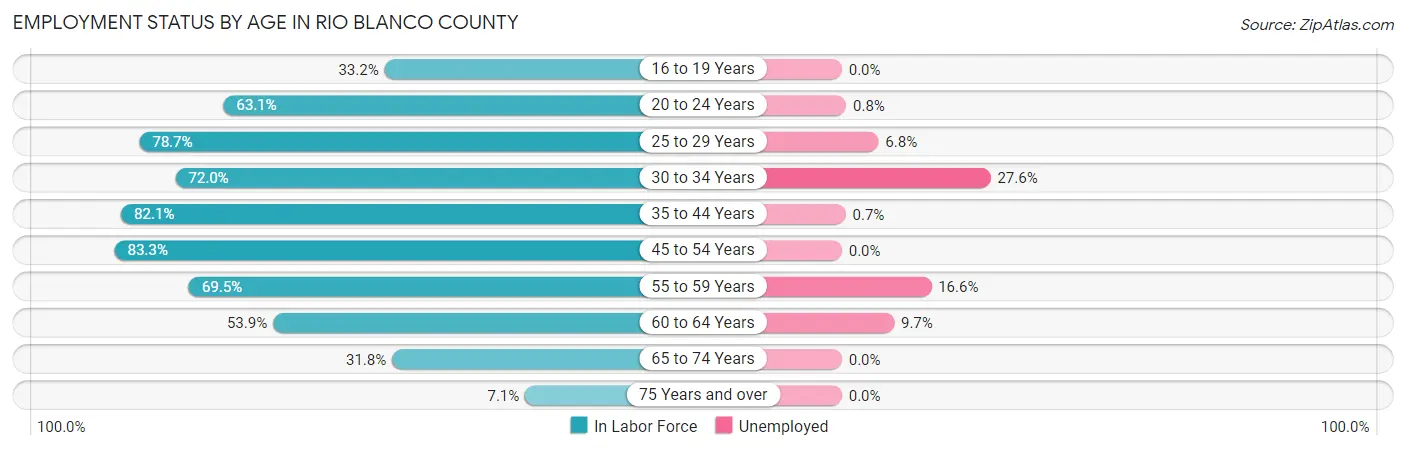
Employment Status by Age in Rio Blanco County
According to the labor force statistics for Rio Blanco County, out of the total population over 16 years of age (5,142), 60.1% or 3,090 individuals are in the labor force, with 6.1% or 188 of them unemployed. The age group with the highest labor force participation rate is 45 to 54 years, with 83.3% or 485 individuals in the labor force. Within the labor force, the 30 to 34 years age range has the highest percentage of unemployed individuals, with 27.6% or 71 of them being unemployed.
| Age Bracket | In Labor Force | Unemployed |
| 16 to 19 Years | 132 (33.2%) | 0 (0.0%) |
| 20 to 24 Years | 253 (63.1%) | 2 (0.8%) |
| 25 to 29 Years | 266 (78.7%) | 18 (6.8%) |
| 30 to 34 Years | 257 (72.0%) | 71 (27.6%) |
| 35 to 44 Years | 817 (82.1%) | 6 (0.7%) |
| 45 to 54 Years | 485 (83.3%) | 0 (0.0%) |
| 55 to 59 Years | 410 (69.5%) | 68 (16.6%) |
| 60 to 64 Years | 237 (53.9%) | 23 (9.7%) |
| 65 to 74 Years | 202 (31.8%) | 0 (0.0%) |
| 75 Years and over | 29 (7.1%) | 0 (0.0%) |
| Total | 3,090 (60.1%) | 188 (6.1%) |
Employment Status by Educational Attainment in Rio Blanco County
According to labor force statistics for Rio Blanco County, 74.9% of individuals (2,473) out of the total population between 25 and 64 years of age (3,302) are in the labor force, with 7.5% or 185 of them being unemployed. The group with the highest labor force participation rate are those with the educational attainment of bachelor's degree or higher, with 83.6% or 653 individuals in the labor force. Within the labor force, individuals with less than high school education have the highest percentage of unemployment, with 30.3% or 46 of them being unemployed.

| Educational Attainment | In Labor Force | Unemployed |
| Less than High School | 152 (58.2%) | 79 (30.3%) |
| High School Diploma | 798 (69.9%) | 9 (0.8%) |
| College / Associate Degree | 869 (77.7%) | 119 (10.6%) |
| Bachelor's Degree or higher | 653 (83.6%) | 50 (6.4%) |
| Total | 2,473 (74.9%) | 248 (7.5%) |
Employment Occupations by Sex in Rio Blanco County
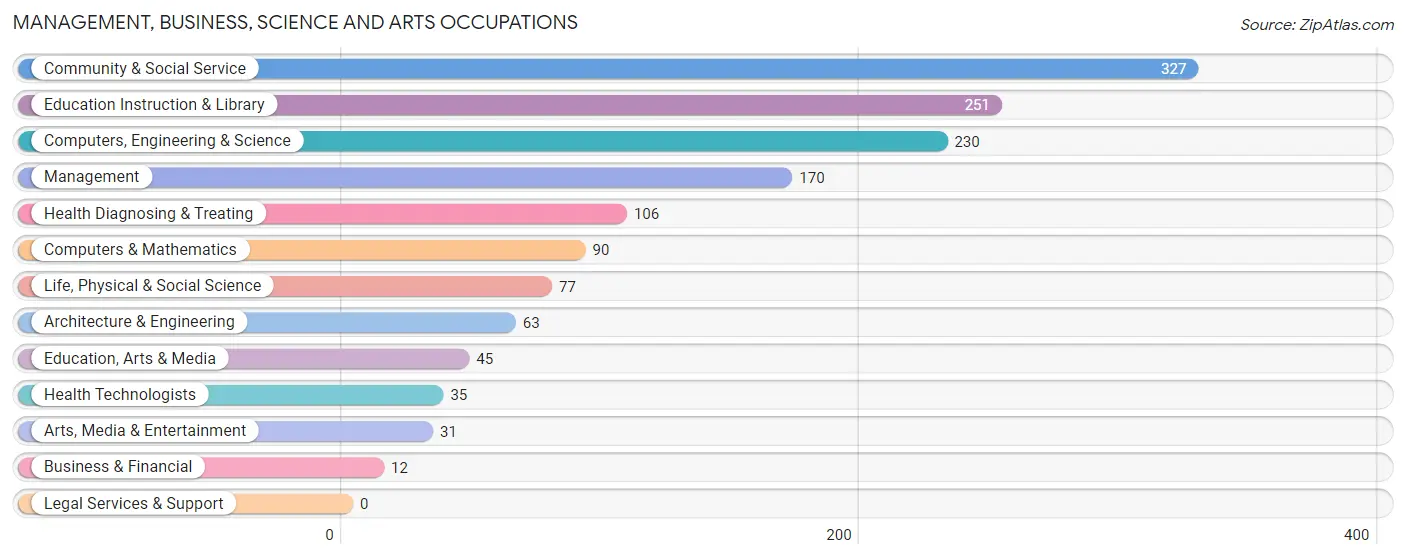
Management, Business, Science and Arts Occupations
The most common Management, Business, Science and Arts occupations in Rio Blanco County are Community & Social Service (327 | 11.3%), Education Instruction & Library (251 | 8.7%), Computers, Engineering & Science (230 | 7.9%), Management (170 | 5.9%), and Health Diagnosing & Treating (106 | 3.7%).
Management, Business, Science and Arts Occupations by Sex
Within the Management, Business, Science and Arts occupations in Rio Blanco County, the most male-oriented occupations are Architecture & Engineering (84.1%), Computers, Engineering & Science (67.8%), and Education, Arts & Media (66.7%), while the most female-oriented occupations are Health Diagnosing & Treating (95.3%), Health Technologists (85.7%), and Education Instruction & Library (72.5%).
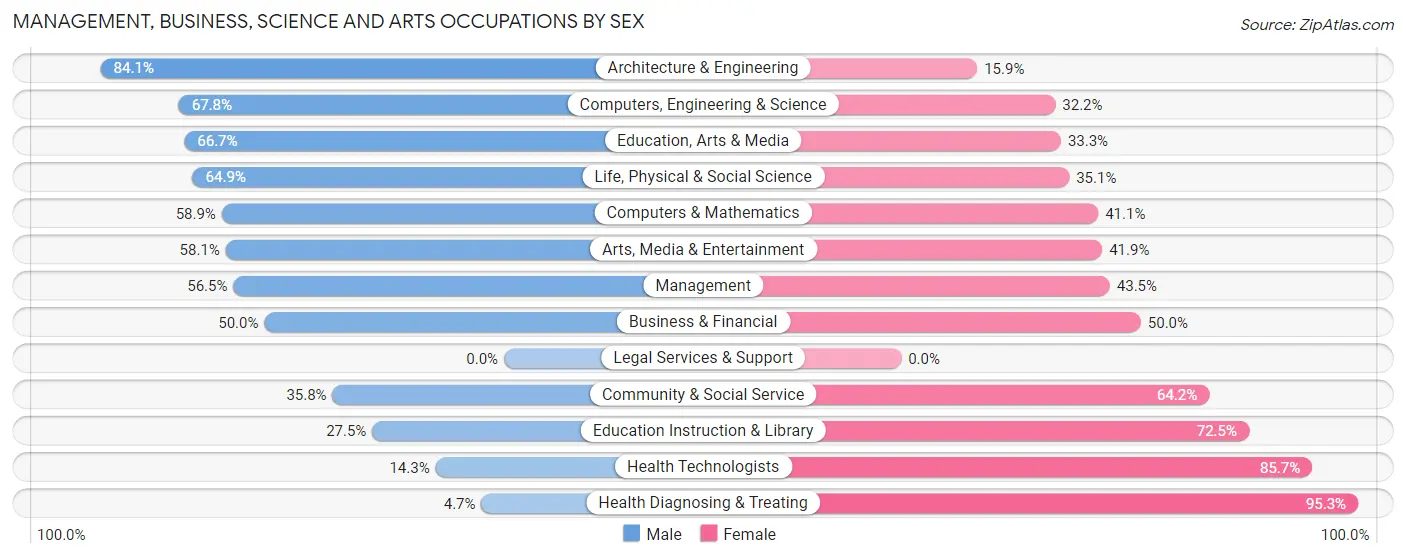
| Occupation | Male | Female |
| Management | 96 (56.5%) | 74 (43.5%) |
| Business & Financial | 6 (50.0%) | 6 (50.0%) |
| Computers, Engineering & Science | 156 (67.8%) | 74 (32.2%) |
| Computers & Mathematics | 53 (58.9%) | 37 (41.1%) |
| Architecture & Engineering | 53 (84.1%) | 10 (15.9%) |
| Life, Physical & Social Science | 50 (64.9%) | 27 (35.1%) |
| Community & Social Service | 117 (35.8%) | 210 (64.2%) |
| Education, Arts & Media | 30 (66.7%) | 15 (33.3%) |
| Legal Services & Support | 0 (0.0%) | 0 (0.0%) |
| Education Instruction & Library | 69 (27.5%) | 182 (72.5%) |
| Arts, Media & Entertainment | 18 (58.1%) | 13 (41.9%) |
| Health Diagnosing & Treating | 5 (4.7%) | 101 (95.3%) |
| Health Technologists | 5 (14.3%) | 30 (85.7%) |
| Total (Category) | 380 (45.0%) | 465 (55.0%) |
| Total (Overall) | 1,596 (55.0%) | 1,304 (45.0%) |
Services Occupations
The most common Services occupations in Rio Blanco County are Cleaning & Maintenance (197 | 6.8%), Personal Care & Service (151 | 5.2%), Security & Protection (117 | 4.0%), Healthcare Support (102 | 3.5%), and Law Enforcement (87 | 3.0%).

Services Occupations by Sex
Within the Services occupations in Rio Blanco County, the most male-oriented occupations are Food Preparation & Serving (75.8%), Law Enforcement (64.4%), and Cleaning & Maintenance (60.9%), while the most female-oriented occupations are Healthcare Support (100.0%), Personal Care & Service (79.5%), and Firefighting & Prevention (60.0%).
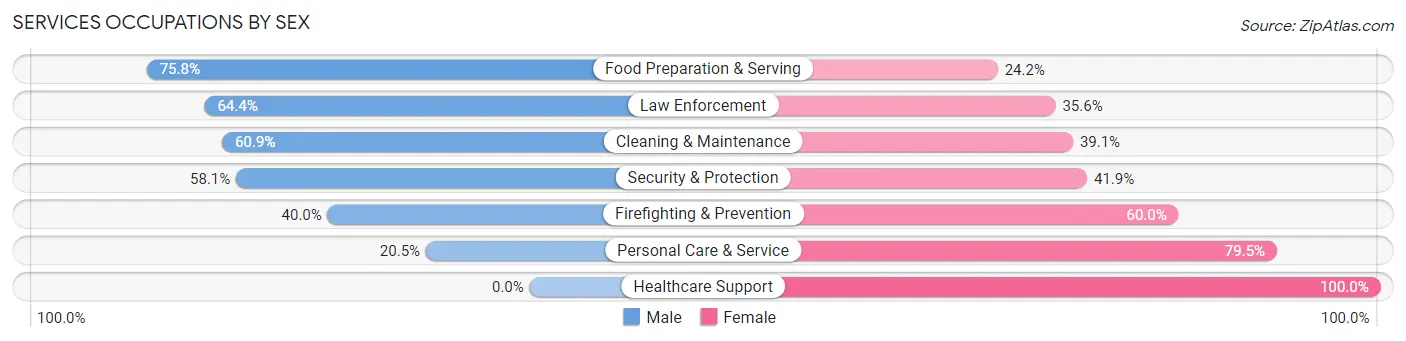
| Occupation | Male | Female |
| Healthcare Support | 0 (0.0%) | 102 (100.0%) |
| Security & Protection | 68 (58.1%) | 49 (41.9%) |
| Firefighting & Prevention | 12 (40.0%) | 18 (60.0%) |
| Law Enforcement | 56 (64.4%) | 31 (35.6%) |
| Food Preparation & Serving | 47 (75.8%) | 15 (24.2%) |
| Cleaning & Maintenance | 120 (60.9%) | 77 (39.1%) |
| Personal Care & Service | 31 (20.5%) | 120 (79.5%) |
| Total (Category) | 266 (42.3%) | 363 (57.7%) |
| Total (Overall) | 1,596 (55.0%) | 1,304 (45.0%) |
Sales and Office Occupations
The most common Sales and Office occupations in Rio Blanco County are Sales & Related (325 | 11.2%), and Office & Administration (273 | 9.4%).

Sales and Office Occupations by Sex

| Occupation | Male | Female |
| Sales & Related | 158 (48.6%) | 167 (51.4%) |
| Office & Administration | 53 (19.4%) | 220 (80.6%) |
| Total (Category) | 211 (35.3%) | 387 (64.7%) |
| Total (Overall) | 1,596 (55.0%) | 1,304 (45.0%) |
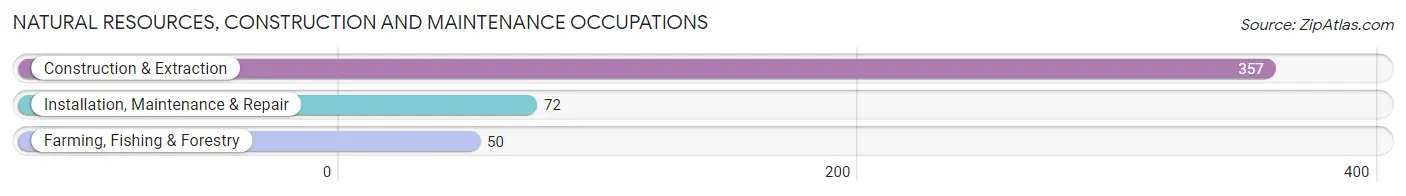
Natural Resources, Construction and Maintenance Occupations
The most common Natural Resources, Construction and Maintenance occupations in Rio Blanco County are Construction & Extraction (357 | 12.3%), Installation, Maintenance & Repair (72 | 2.5%), and Farming, Fishing & Forestry (50 | 1.7%).
Natural Resources, Construction and Maintenance Occupations by Sex
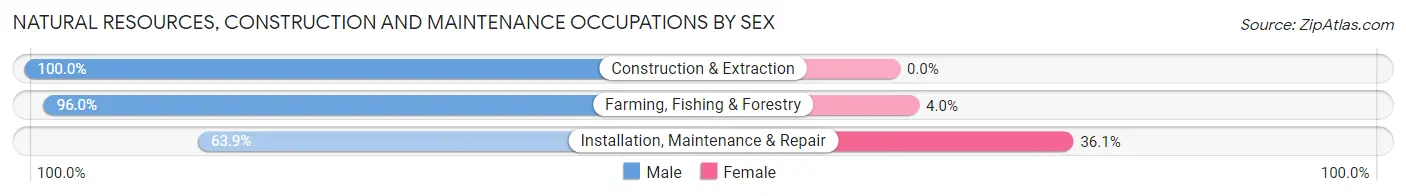
| Occupation | Male | Female |
| Farming, Fishing & Forestry | 48 (96.0%) | 2 (4.0%) |
| Construction & Extraction | 357 (100.0%) | 0 (0.0%) |
| Installation, Maintenance & Repair | 46 (63.9%) | 26 (36.1%) |
| Total (Category) | 451 (94.2%) | 28 (5.9%) |
| Total (Overall) | 1,596 (55.0%) | 1,304 (45.0%) |
Production, Transportation and Moving Occupations
The most common Production, Transportation and Moving occupations in Rio Blanco County are Production (190 | 6.6%), Transportation (123 | 4.2%), and Material Moving (36 | 1.2%).
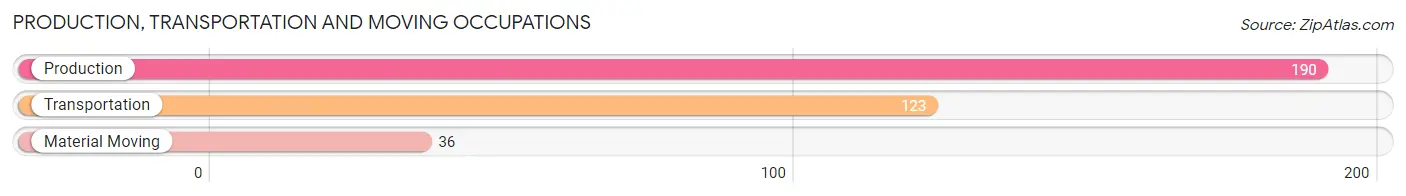
Production, Transportation and Moving Occupations by Sex
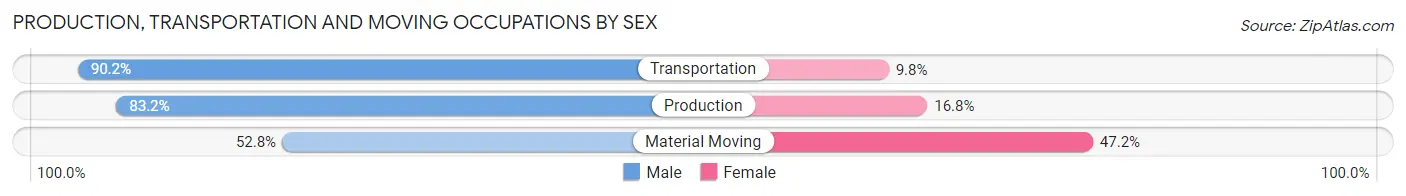
| Occupation | Male | Female |
| Production | 158 (83.2%) | 32 (16.8%) |
| Transportation | 111 (90.2%) | 12 (9.8%) |
| Material Moving | 19 (52.8%) | 17 (47.2%) |
| Total (Category) | 288 (82.5%) | 61 (17.5%) |
| Total (Overall) | 1,596 (55.0%) | 1,304 (45.0%) |
Employment Industries by Sex in Rio Blanco County
Employment Industries in Rio Blanco County
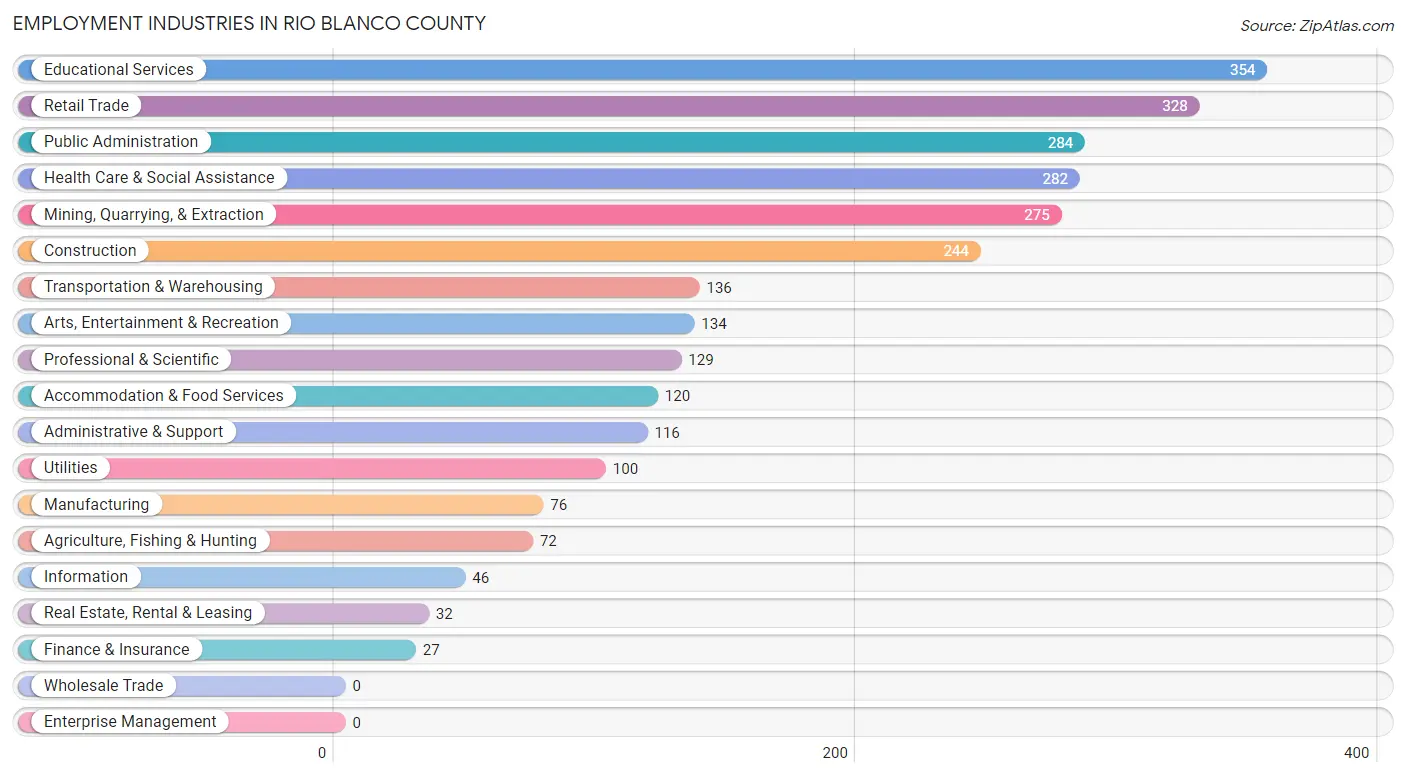
The major employment industries in Rio Blanco County include Educational Services (354 | 12.2%), Retail Trade (328 | 11.3%), Public Administration (284 | 9.8%), Health Care & Social Assistance (282 | 9.7%), and Mining, Quarrying, & Extraction (275 | 9.5%).
Employment Industries by Sex in Rio Blanco County
The Rio Blanco County industries that see more men than women are Real Estate, Rental & Leasing (100.0%), Manufacturing (93.4%), and Construction (92.2%), whereas the industries that tend to have a higher number of women are Finance & Insurance (100.0%), Health Care & Social Assistance (89.0%), and Information (67.4%).
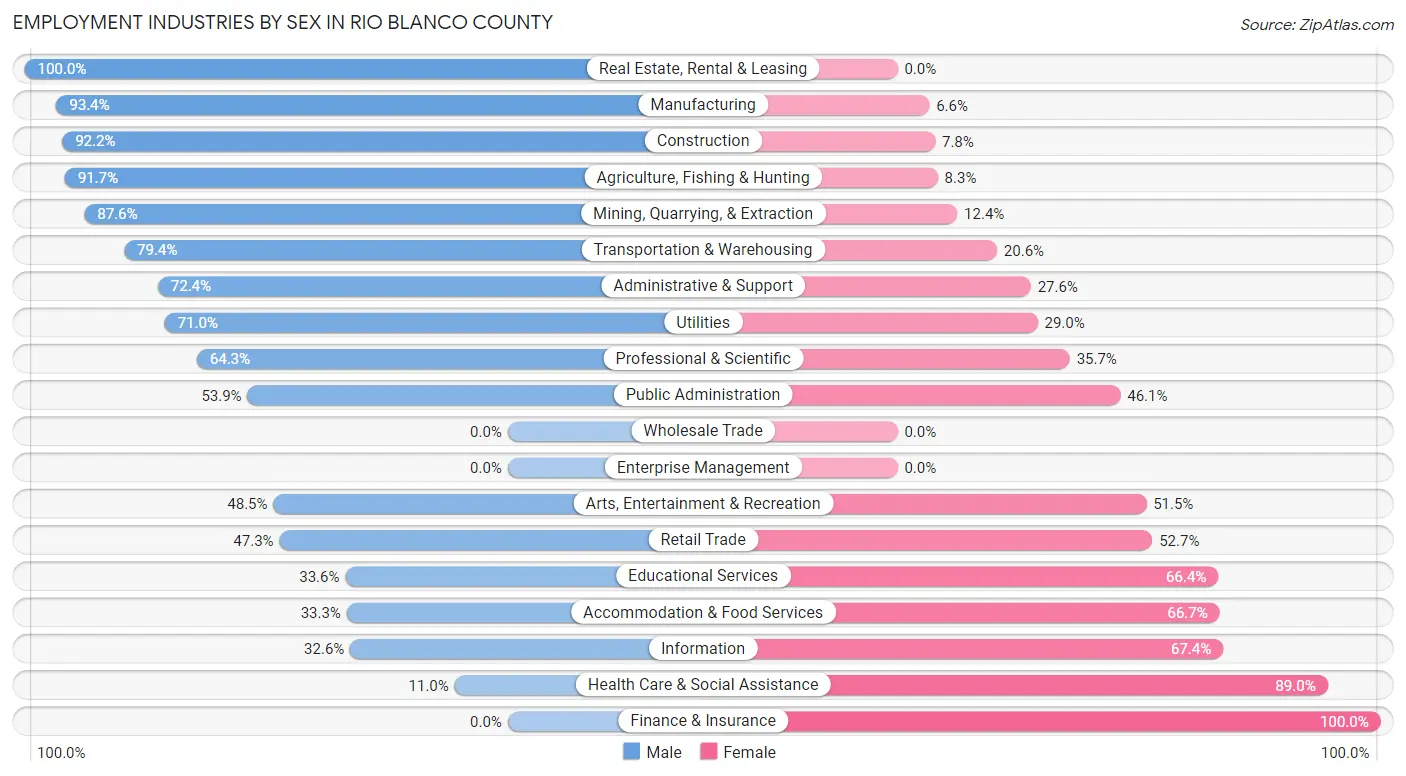
| Industry | Male | Female |
| Agriculture, Fishing & Hunting | 66 (91.7%) | 6 (8.3%) |
| Mining, Quarrying, & Extraction | 241 (87.6%) | 34 (12.4%) |
| Construction | 225 (92.2%) | 19 (7.8%) |
| Manufacturing | 71 (93.4%) | 5 (6.6%) |
| Wholesale Trade | 0 (0.0%) | 0 (0.0%) |
| Retail Trade | 155 (47.3%) | 173 (52.7%) |
| Transportation & Warehousing | 108 (79.4%) | 28 (20.6%) |
| Utilities | 71 (71.0%) | 29 (29.0%) |
| Information | 15 (32.6%) | 31 (67.4%) |
| Finance & Insurance | 0 (0.0%) | 27 (100.0%) |
| Real Estate, Rental & Leasing | 32 (100.0%) | 0 (0.0%) |
| Professional & Scientific | 83 (64.3%) | 46 (35.7%) |
| Enterprise Management | 0 (0.0%) | 0 (0.0%) |
| Administrative & Support | 84 (72.4%) | 32 (27.6%) |
| Educational Services | 119 (33.6%) | 235 (66.4%) |
| Health Care & Social Assistance | 31 (11.0%) | 251 (89.0%) |
| Arts, Entertainment & Recreation | 65 (48.5%) | 69 (51.5%) |
| Accommodation & Food Services | 40 (33.3%) | 80 (66.7%) |
| Public Administration | 153 (53.9%) | 131 (46.1%) |
| Total | 1,596 (55.0%) | 1,304 (45.0%) |
Education in Rio Blanco County
School Enrollment in Rio Blanco County
The most common levels of schooling among the 1,579 students in Rio Blanco County are middle school (433 | 27.4%), college / undergraduate (330 | 20.9%), and elementary school (328 | 20.8%).
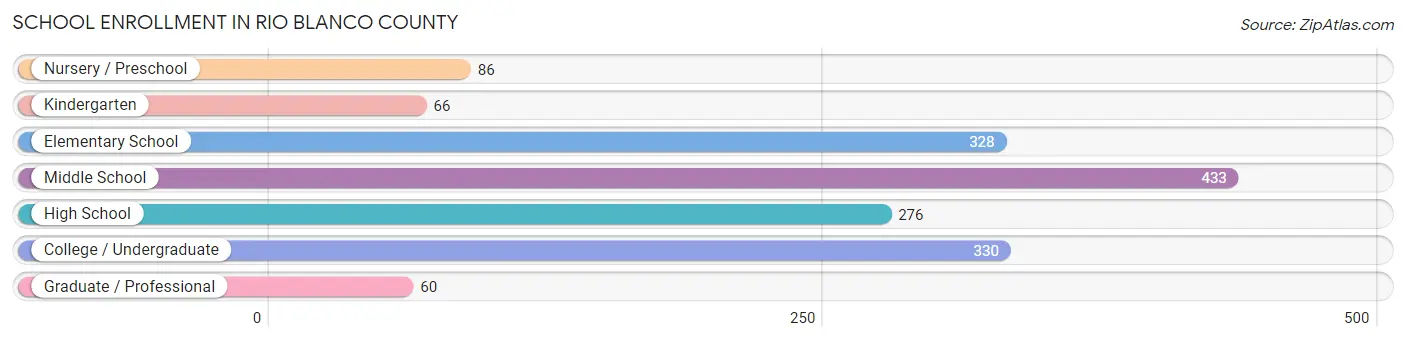
| School Level | # Students | % Students |
| Nursery / Preschool | 86 | 5.4% |
| Kindergarten | 66 | 4.2% |
| Elementary School | 328 | 20.8% |
| Middle School | 433 | 27.4% |
| High School | 276 | 17.5% |
| College / Undergraduate | 330 | 20.9% |
| Graduate / Professional | 60 | 3.8% |
| Total | 1,579 | 100.0% |
School Enrollment by Age by Funding Source in Rio Blanco County
Out of a total of 1,579 students who are enrolled in schools in Rio Blanco County, 191 (12.1%) attend a private institution, while the remaining 1,388 (87.9%) are enrolled in public schools. The age group of 35 years and over has the highest likelihood of being enrolled in private schools, with 20 (35.1% in the age bracket) enrolled. Conversely, the age group of 3 to 4 year olds has the lowest likelihood of being enrolled in a private school, with 18 (100.0% in the age bracket) attending a public institution.
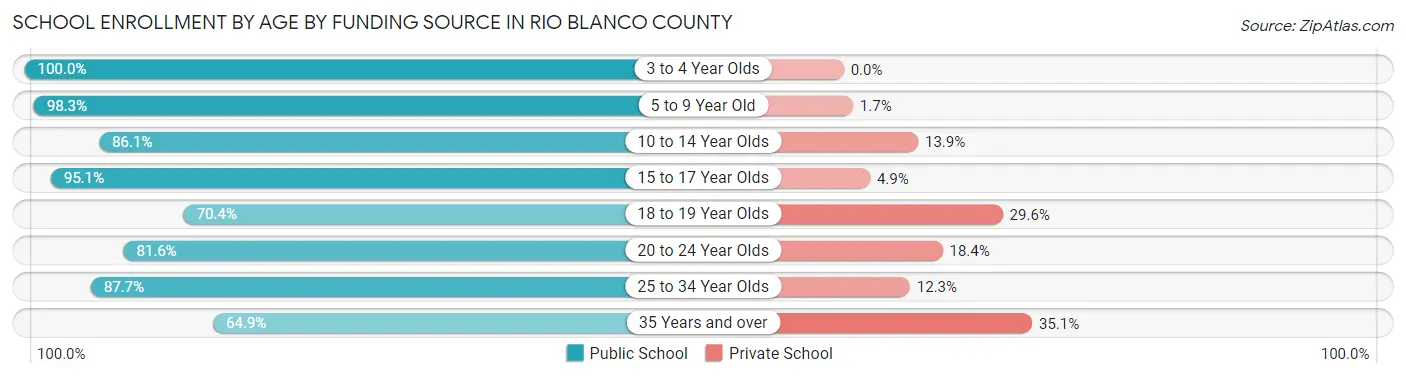
| Age Bracket | Public School | Private School |
| 3 to 4 Year Olds | 18 (100.0%) | 0 (0.0%) |
| 5 to 9 Year Old | 401 (98.3%) | 7 (1.7%) |
| 10 to 14 Year Olds | 435 (86.1%) | 70 (13.9%) |
| 15 to 17 Year Olds | 214 (95.1%) | 11 (4.9%) |
| 18 to 19 Year Olds | 126 (70.4%) | 53 (29.6%) |
| 20 to 24 Year Olds | 93 (81.6%) | 21 (18.4%) |
| 25 to 34 Year Olds | 64 (87.7%) | 9 (12.3%) |
| 35 Years and over | 37 (64.9%) | 20 (35.1%) |
| Total | 1,388 (87.9%) | 191 (12.1%) |
Educational Attainment by Field of Study in Rio Blanco County
Education (237 | 21.6%), arts & humanities (191 | 17.4%), bio, nature & agricultural (102 | 9.3%), liberal arts & history (102 | 9.3%), and social sciences (97 | 8.8%) are the most common fields of study among 1,096 individuals in Rio Blanco County who have obtained a bachelor's degree or higher.
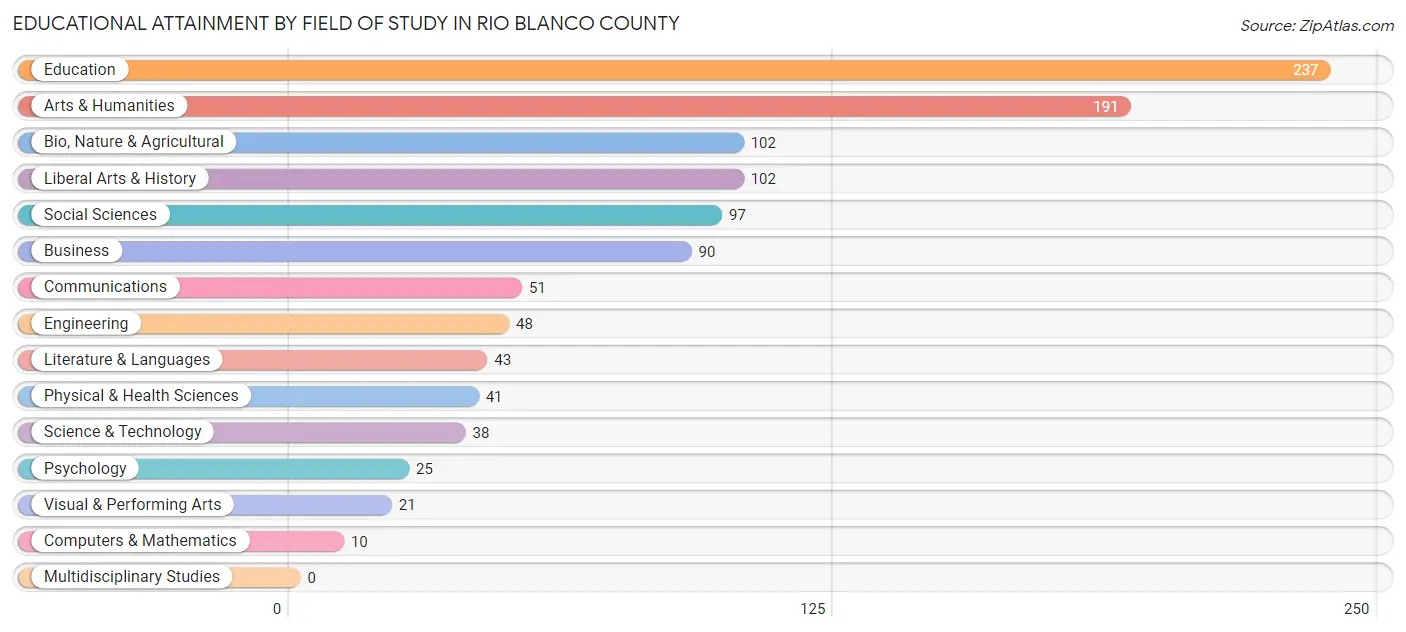
| Field of Study | # Graduates | % Graduates |
| Computers & Mathematics | 10 | 0.9% |
| Bio, Nature & Agricultural | 102 | 9.3% |
| Physical & Health Sciences | 41 | 3.7% |
| Psychology | 25 | 2.3% |
| Social Sciences | 97 | 8.8% |
| Engineering | 48 | 4.4% |
| Multidisciplinary Studies | 0 | 0.0% |
| Science & Technology | 38 | 3.5% |
| Business | 90 | 8.2% |
| Education | 237 | 21.6% |
| Literature & Languages | 43 | 3.9% |
| Liberal Arts & History | 102 | 9.3% |
| Visual & Performing Arts | 21 | 1.9% |
| Communications | 51 | 4.6% |
| Arts & Humanities | 191 | 17.4% |
| Total | 1,096 | 100.0% |
Transportation & Commute in Rio Blanco County
Vehicle Availability by Sex in Rio Blanco County
The most prevalent vehicle ownership categories in Rio Blanco County are males with 2 vehicles (616, accounting for 39.1%) and females with 2 vehicles (338, making up 51.1%).
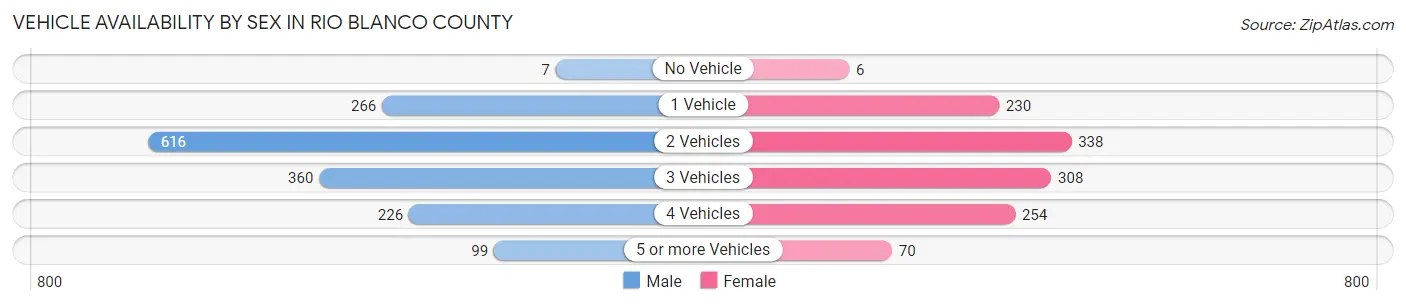
| Vehicles Available | Male | Female |
| No Vehicle | 7 (0.4%) | 6 (0.5%) |
| 1 Vehicle | 266 (16.9%) | 230 (19.1%) |
| 2 Vehicles | 616 (39.1%) | 338 (28.0%) |
| 3 Vehicles | 360 (22.9%) | 308 (25.5%) |
| 4 Vehicles | 226 (14.4%) | 254 (21.1%) |
| 5 or more Vehicles | 99 (6.3%) | 70 (5.8%) |
| Total | 1,574 (100.0%) | 1,206 (100.0%) |
Commute Time in Rio Blanco County
The most frequently occuring commute durations in Rio Blanco County are 5 to 9 minutes (1,047 commuters, 40.0%), less than 5 minutes (569 commuters, 21.8%), and 15 to 19 minutes (218 commuters, 8.3%).
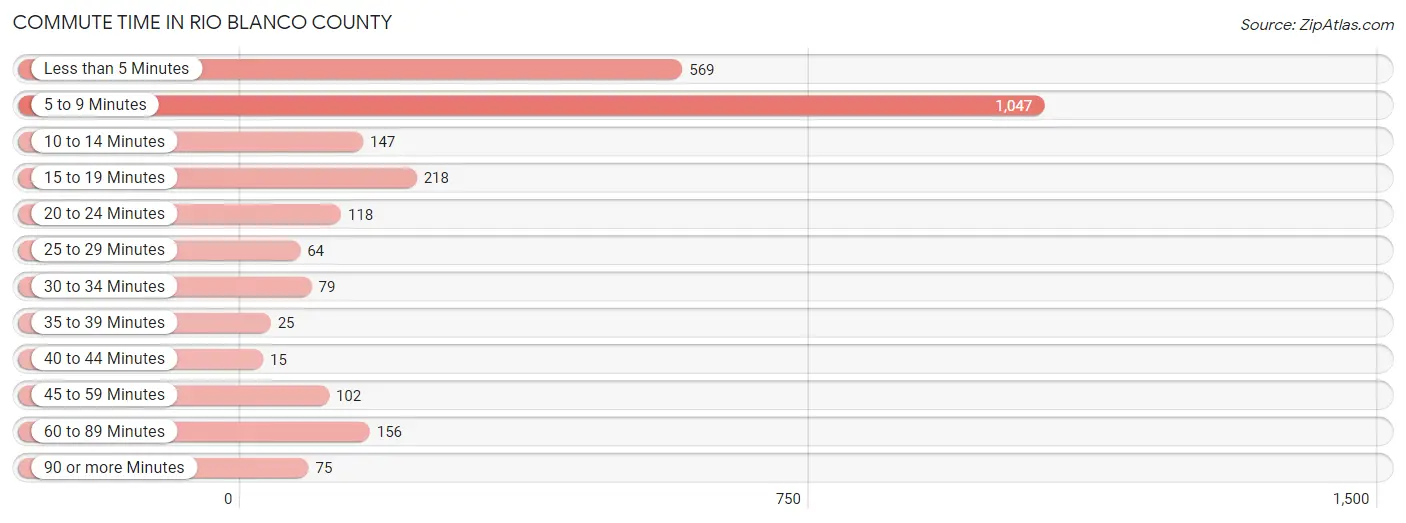
| Commute Time | # Commuters | % Commuters |
| Less than 5 Minutes | 569 | 21.8% |
| 5 to 9 Minutes | 1,047 | 40.0% |
| 10 to 14 Minutes | 147 | 5.6% |
| 15 to 19 Minutes | 218 | 8.3% |
| 20 to 24 Minutes | 118 | 4.5% |
| 25 to 29 Minutes | 64 | 2.5% |
| 30 to 34 Minutes | 79 | 3.0% |
| 35 to 39 Minutes | 25 | 1.0% |
| 40 to 44 Minutes | 15 | 0.6% |
| 45 to 59 Minutes | 102 | 3.9% |
| 60 to 89 Minutes | 156 | 6.0% |
| 90 or more Minutes | 75 | 2.9% |
Commute Time by Sex in Rio Blanco County
The most common commute times in Rio Blanco County are 5 to 9 minutes (484 commuters, 32.9%) for males and 5 to 9 minutes (563 commuters, 49.2%) for females.
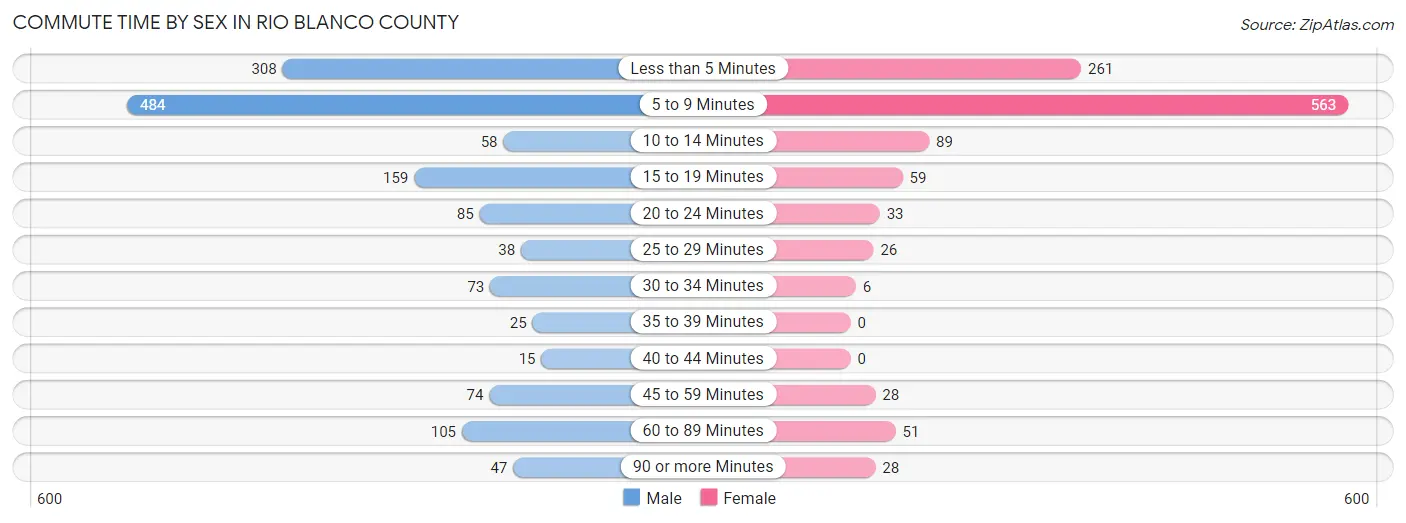
| Commute Time | Male | Female |
| Less than 5 Minutes | 308 (20.9%) | 261 (22.8%) |
| 5 to 9 Minutes | 484 (32.9%) | 563 (49.2%) |
| 10 to 14 Minutes | 58 (3.9%) | 89 (7.8%) |
| 15 to 19 Minutes | 159 (10.8%) | 59 (5.2%) |
| 20 to 24 Minutes | 85 (5.8%) | 33 (2.9%) |
| 25 to 29 Minutes | 38 (2.6%) | 26 (2.3%) |
| 30 to 34 Minutes | 73 (5.0%) | 6 (0.5%) |
| 35 to 39 Minutes | 25 (1.7%) | 0 (0.0%) |
| 40 to 44 Minutes | 15 (1.0%) | 0 (0.0%) |
| 45 to 59 Minutes | 74 (5.0%) | 28 (2.5%) |
| 60 to 89 Minutes | 105 (7.1%) | 51 (4.5%) |
| 90 or more Minutes | 47 (3.2%) | 28 (2.5%) |
Time of Departure to Work by Sex in Rio Blanco County
The most frequent times of departure to work in Rio Blanco County are 7:00 AM to 7:29 AM (239, 16.3%) for males and 7:00 AM to 7:29 AM (225, 19.7%) for females.
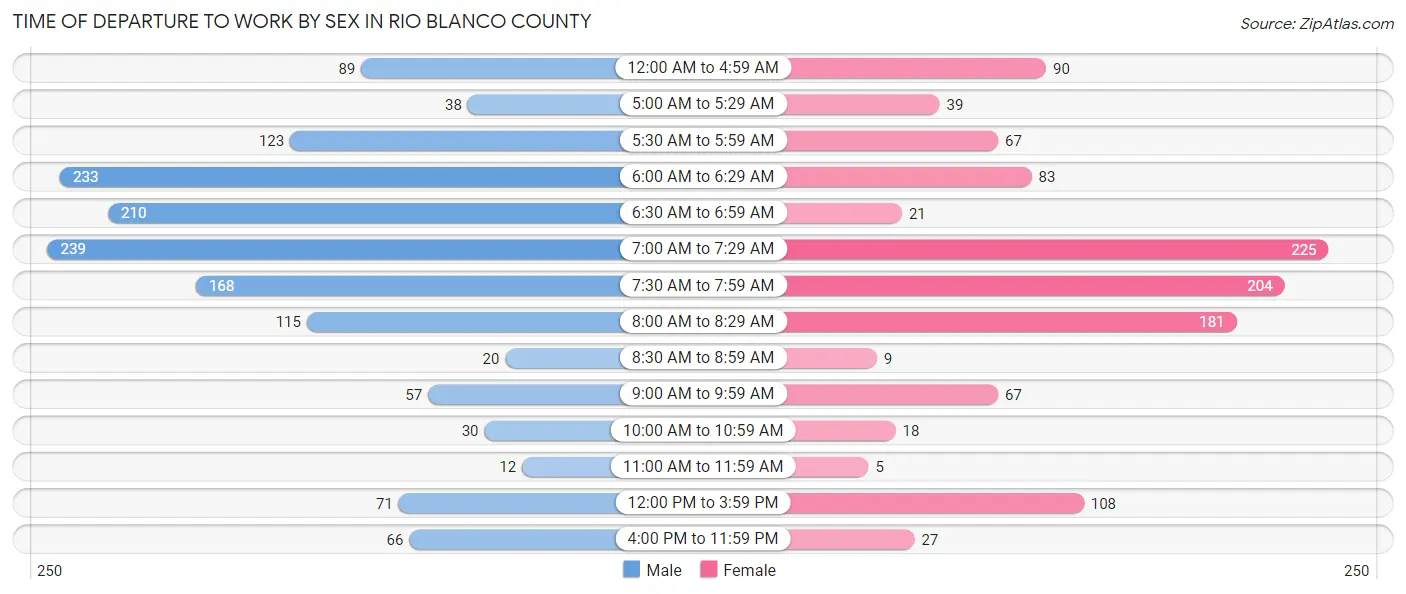
| Time of Departure | Male | Female |
| 12:00 AM to 4:59 AM | 89 (6.0%) | 90 (7.9%) |
| 5:00 AM to 5:29 AM | 38 (2.6%) | 39 (3.4%) |
| 5:30 AM to 5:59 AM | 123 (8.4%) | 67 (5.9%) |
| 6:00 AM to 6:29 AM | 233 (15.8%) | 83 (7.3%) |
| 6:30 AM to 6:59 AM | 210 (14.3%) | 21 (1.8%) |
| 7:00 AM to 7:29 AM | 239 (16.3%) | 225 (19.7%) |
| 7:30 AM to 7:59 AM | 168 (11.4%) | 204 (17.8%) |
| 8:00 AM to 8:29 AM | 115 (7.8%) | 181 (15.8%) |
| 8:30 AM to 8:59 AM | 20 (1.4%) | 9 (0.8%) |
| 9:00 AM to 9:59 AM | 57 (3.9%) | 67 (5.9%) |
| 10:00 AM to 10:59 AM | 30 (2.0%) | 18 (1.6%) |
| 11:00 AM to 11:59 AM | 12 (0.8%) | 5 (0.4%) |
| 12:00 PM to 3:59 PM | 71 (4.8%) | 108 (9.4%) |
| 4:00 PM to 11:59 PM | 66 (4.5%) | 27 (2.4%) |
| Total | 1,471 (100.0%) | 1,144 (100.0%) |
Housing Occupancy in Rio Blanco County
Occupancy by Ownership in Rio Blanco County
Of the total 2,513 dwellings in Rio Blanco County, owner-occupied units account for 1,976 (78.6%), while renter-occupied units make up 537 (21.4%).
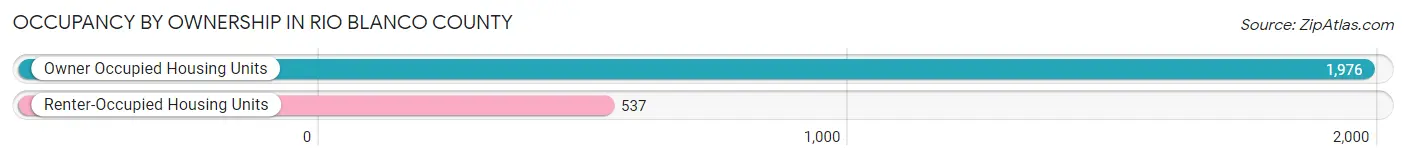
| Occupancy | # Housing Units | % Housing Units |
| Owner Occupied Housing Units | 1,976 | 78.6% |
| Renter-Occupied Housing Units | 537 | 21.4% |
| Total Occupied Housing Units | 2,513 | 100.0% |
Occupancy by Household Size in Rio Blanco County

| Household Size | # Housing Units | % Housing Units |
| 1-Person Household | 718 | 28.6% |
| 2-Person Household | 885 | 35.2% |
| 3-Person Household | 296 | 11.8% |
| 4+ Person Household | 614 | 24.4% |
| Total Housing Units | 2,513 | 100.0% |
Occupancy by Ownership by Household Size in Rio Blanco County
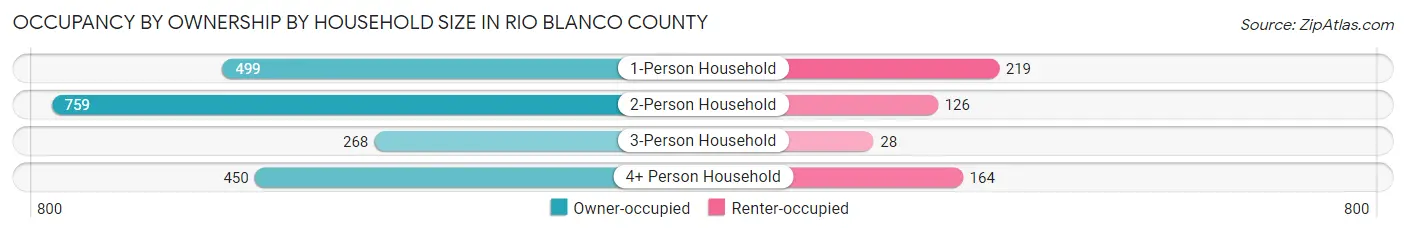
| Household Size | Owner-occupied | Renter-occupied |
| 1-Person Household | 499 (69.5%) | 219 (30.5%) |
| 2-Person Household | 759 (85.8%) | 126 (14.2%) |
| 3-Person Household | 268 (90.5%) | 28 (9.5%) |
| 4+ Person Household | 450 (73.3%) | 164 (26.7%) |
| Total Housing Units | 1,976 (78.6%) | 537 (21.4%) |
Occupancy by Educational Attainment in Rio Blanco County
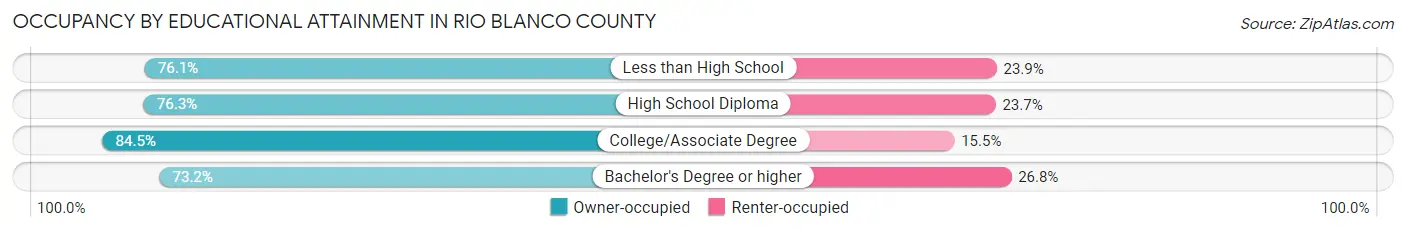
| Household Size | Owner-occupied | Renter-occupied |
| Less than High School | 67 (76.1%) | 21 (23.9%) |
| High School Diploma | 584 (76.3%) | 181 (23.7%) |
| College/Associate Degree | 819 (84.5%) | 150 (15.5%) |
| Bachelor's Degree or higher | 506 (73.2%) | 185 (26.8%) |
Occupancy by Age of Householder in Rio Blanco County
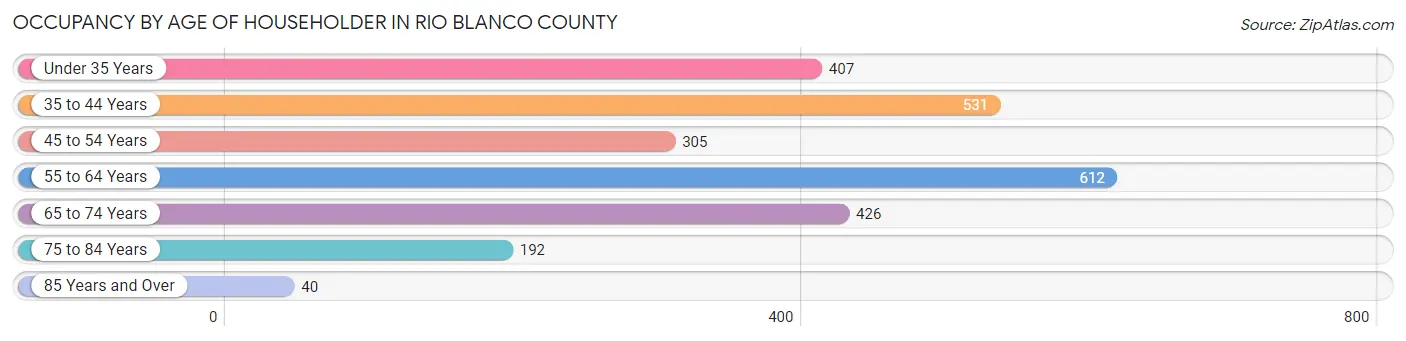
| Age Bracket | # Households | % Households |
| Under 35 Years | 407 | 16.2% |
| 35 to 44 Years | 531 | 21.1% |
| 45 to 54 Years | 305 | 12.1% |
| 55 to 64 Years | 612 | 24.3% |
| 65 to 74 Years | 426 | 17.0% |
| 75 to 84 Years | 192 | 7.6% |
| 85 Years and Over | 40 | 1.6% |
| Total | 2,513 | 100.0% |
Housing Finances in Rio Blanco County
Median Income by Occupancy in Rio Blanco County

| Occupancy Type | # Households | Median Income |
| Owner-Occupied | 1,976 (78.6%) | $74,233 |
| Renter-Occupied | 537 (21.4%) | $44,708 |
| Average | 2,513 (100.0%) | $69,882 |
Occupancy by Householder Income Bracket in Rio Blanco County

| Income Bracket | Owner-occupied | Renter-occupied |
| Less than $5,000 | 17 (0.9%) | 0 (0.0%) |
| $5,000 to $9,999 | 9 (0.5%) | 91 (17.0%) |
| $10,000 to $14,999 | 96 (4.9%) | 0 (0.0%) |
| $15,000 to $19,999 | 25 (1.3%) | 49 (9.1%) |
| $20,000 to $24,999 | 54 (2.7%) | 9 (1.7%) |
| $25,000 to $34,999 | 151 (7.6%) | 74 (13.8%) |
| $35,000 to $49,999 | 200 (10.1%) | 78 (14.5%) |
| $50,000 to $74,999 | 459 (23.2%) | 137 (25.5%) |
| $75,000 to $99,999 | 300 (15.2%) | 33 (6.1%) |
| $100,000 to $149,999 | 510 (25.8%) | 45 (8.4%) |
| $150,000 or more | 155 (7.8%) | 21 (3.9%) |
| Total | 1,976 (100.0%) | 537 (100.0%) |
Monthly Housing Cost Tiers in Rio Blanco County
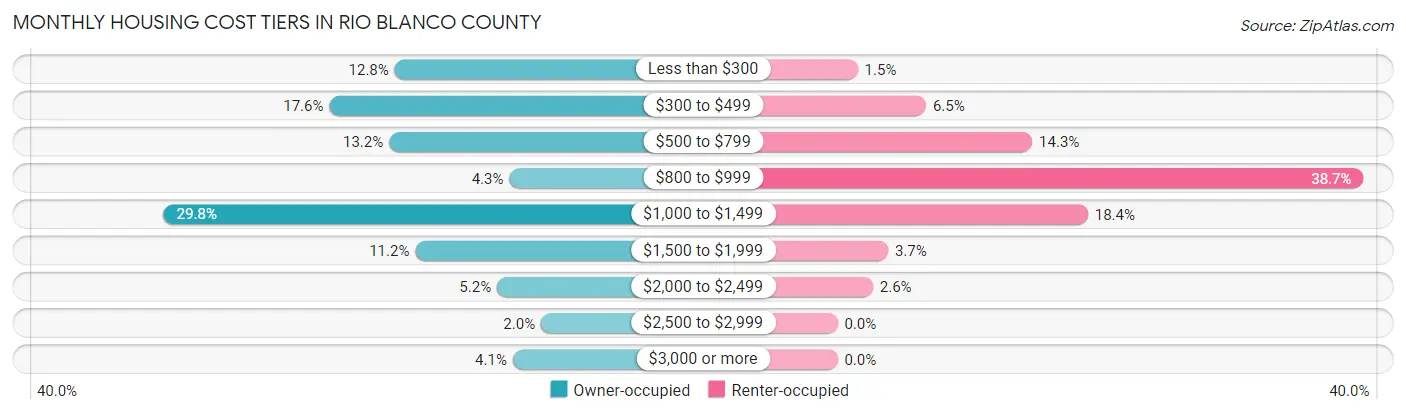
| Monthly Cost | Owner-occupied | Renter-occupied |
| Less than $300 | 252 (12.8%) | 8 (1.5%) |
| $300 to $499 | 347 (17.6%) | 35 (6.5%) |
| $500 to $799 | 260 (13.2%) | 77 (14.3%) |
| $800 to $999 | 85 (4.3%) | 208 (38.7%) |
| $1,000 to $1,499 | 588 (29.8%) | 99 (18.4%) |
| $1,500 to $1,999 | 222 (11.2%) | 20 (3.7%) |
| $2,000 to $2,499 | 103 (5.2%) | 14 (2.6%) |
| $2,500 to $2,999 | 39 (2.0%) | 0 (0.0%) |
| $3,000 or more | 80 (4.1%) | 0 (0.0%) |
| Total | 1,976 (100.0%) | 537 (100.0%) |
Physical Housing Characteristics in Rio Blanco County
Housing Structures in Rio Blanco County
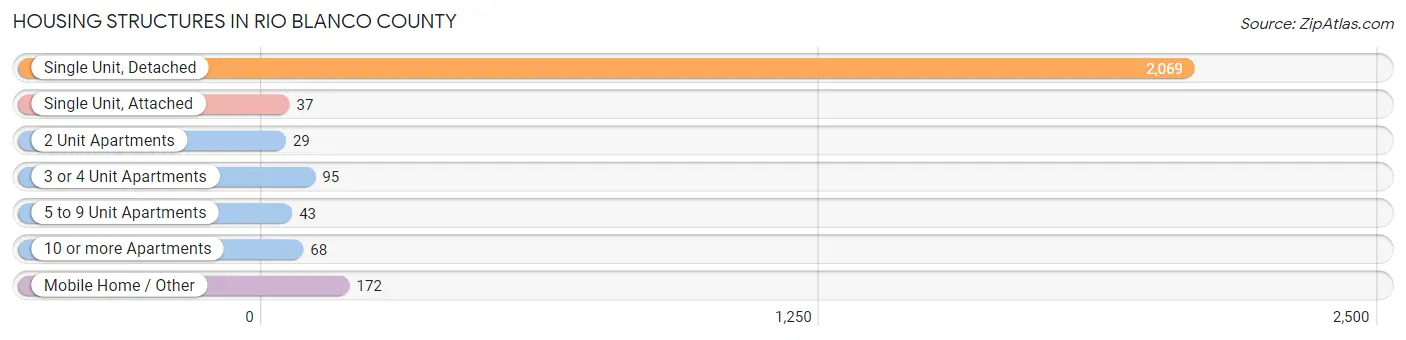
| Structure Type | # Housing Units | % Housing Units |
| Single Unit, Detached | 2,069 | 82.3% |
| Single Unit, Attached | 37 | 1.5% |
| 2 Unit Apartments | 29 | 1.1% |
| 3 or 4 Unit Apartments | 95 | 3.8% |
| 5 to 9 Unit Apartments | 43 | 1.7% |
| 10 or more Apartments | 68 | 2.7% |
| Mobile Home / Other | 172 | 6.8% |
| Total | 2,513 | 100.0% |
Housing Structures by Occupancy in Rio Blanco County
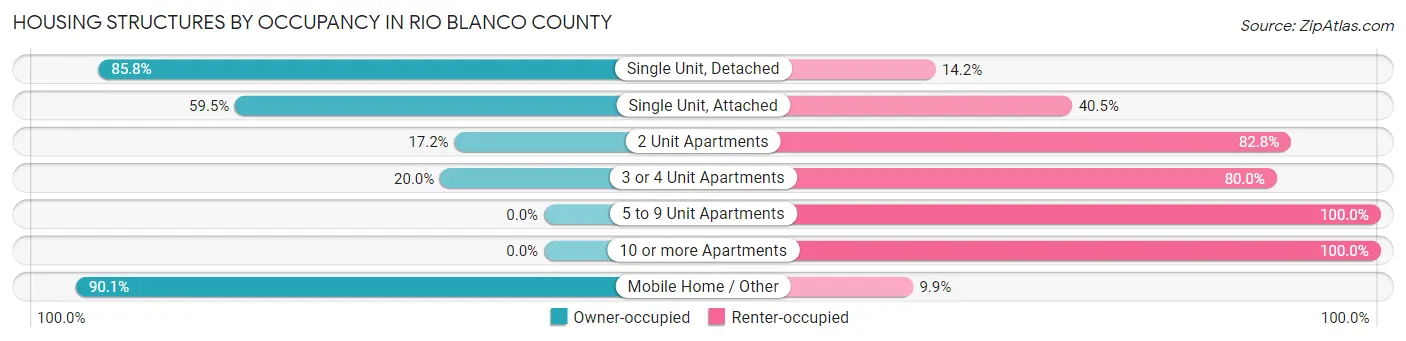
| Structure Type | Owner-occupied | Renter-occupied |
| Single Unit, Detached | 1,775 (85.8%) | 294 (14.2%) |
| Single Unit, Attached | 22 (59.5%) | 15 (40.5%) |
| 2 Unit Apartments | 5 (17.2%) | 24 (82.8%) |
| 3 or 4 Unit Apartments | 19 (20.0%) | 76 (80.0%) |
| 5 to 9 Unit Apartments | 0 (0.0%) | 43 (100.0%) |
| 10 or more Apartments | 0 (0.0%) | 68 (100.0%) |
| Mobile Home / Other | 155 (90.1%) | 17 (9.9%) |
| Total | 1,976 (78.6%) | 537 (21.4%) |
Housing Structures by Number of Rooms in Rio Blanco County
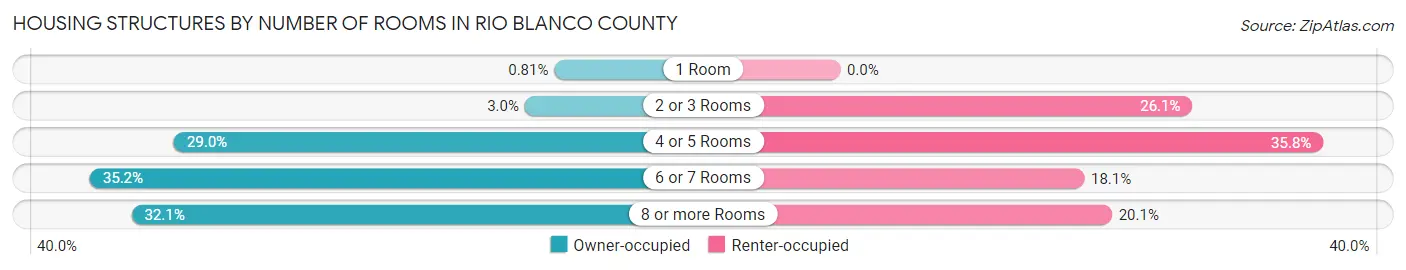
| Number of Rooms | Owner-occupied | Renter-occupied |
| 1 Room | 16 (0.8%) | 0 (0.0%) |
| 2 or 3 Rooms | 59 (3.0%) | 140 (26.1%) |
| 4 or 5 Rooms | 572 (28.9%) | 192 (35.7%) |
| 6 or 7 Rooms | 695 (35.2%) | 97 (18.1%) |
| 8 or more Rooms | 634 (32.1%) | 108 (20.1%) |
| Total | 1,976 (100.0%) | 537 (100.0%) |
Housing Structure by Heating Type in Rio Blanco County
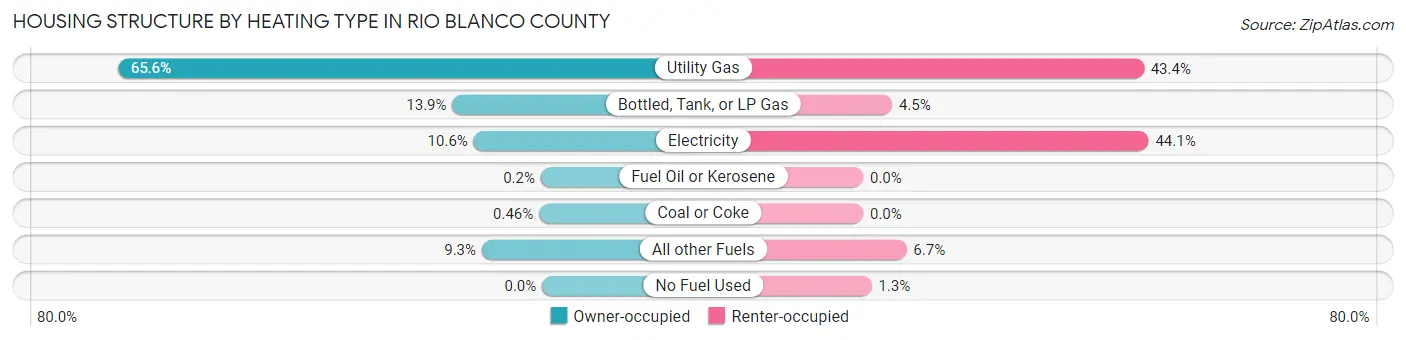
| Heating Type | Owner-occupied | Renter-occupied |
| Utility Gas | 1,296 (65.6%) | 233 (43.4%) |
| Bottled, Tank, or LP Gas | 274 (13.9%) | 24 (4.5%) |
| Electricity | 209 (10.6%) | 237 (44.1%) |
| Fuel Oil or Kerosene | 4 (0.2%) | 0 (0.0%) |
| Coal or Coke | 9 (0.5%) | 0 (0.0%) |
| All other Fuels | 184 (9.3%) | 36 (6.7%) |
| No Fuel Used | 0 (0.0%) | 7 (1.3%) |
| Total | 1,976 (100.0%) | 537 (100.0%) |
Household Vehicle Usage in Rio Blanco County
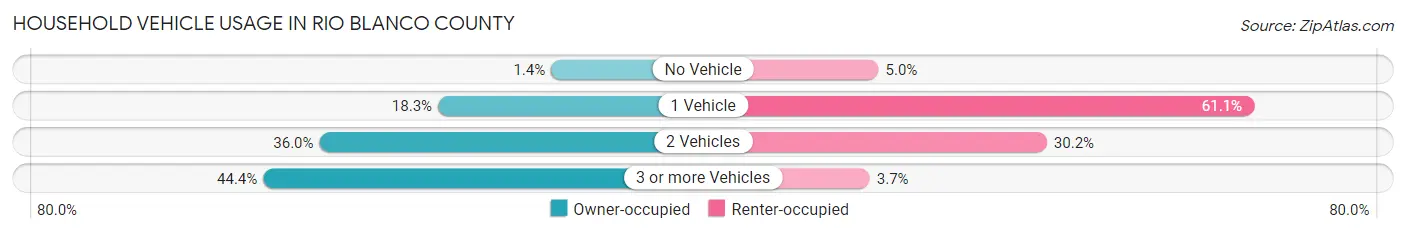
| Vehicles per Household | Owner-occupied | Renter-occupied |
| No Vehicle | 27 (1.4%) | 27 (5.0%) |
| 1 Vehicle | 361 (18.3%) | 328 (61.1%) |
| 2 Vehicles | 711 (36.0%) | 162 (30.2%) |
| 3 or more Vehicles | 877 (44.4%) | 20 (3.7%) |
| Total | 1,976 (100.0%) | 537 (100.0%) |
Real Estate & Mortgages in Rio Blanco County
Real Estate and Mortgage Overview in Rio Blanco County
| Characteristic | Without Mortgage | With Mortgage |
| Housing Units | 790 | 1,186 |
| Median Property Value | $196,900 | $254,300 |
| Median Household Income | $62,500 | $115 |
| Monthly Housing Costs | $377 | $80 |
| Real Estate Taxes | $677 | $6 |
Property Value by Mortgage Status in Rio Blanco County
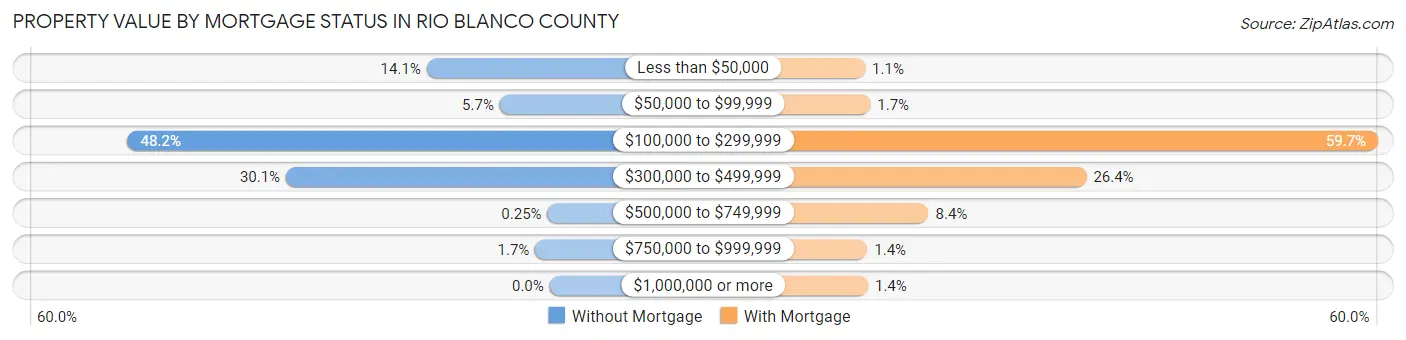
| Property Value | Without Mortgage | With Mortgage |
| Less than $50,000 | 111 (14.1%) | 13 (1.1%) |
| $50,000 to $99,999 | 45 (5.7%) | 20 (1.7%) |
| $100,000 to $299,999 | 381 (48.2%) | 708 (59.7%) |
| $300,000 to $499,999 | 238 (30.1%) | 313 (26.4%) |
| $500,000 to $749,999 | 2 (0.3%) | 99 (8.4%) |
| $750,000 to $999,999 | 13 (1.7%) | 16 (1.3%) |
| $1,000,000 or more | 0 (0.0%) | 17 (1.4%) |
| Total | 790 (100.0%) | 1,186 (100.0%) |
Household Income by Mortgage Status in Rio Blanco County
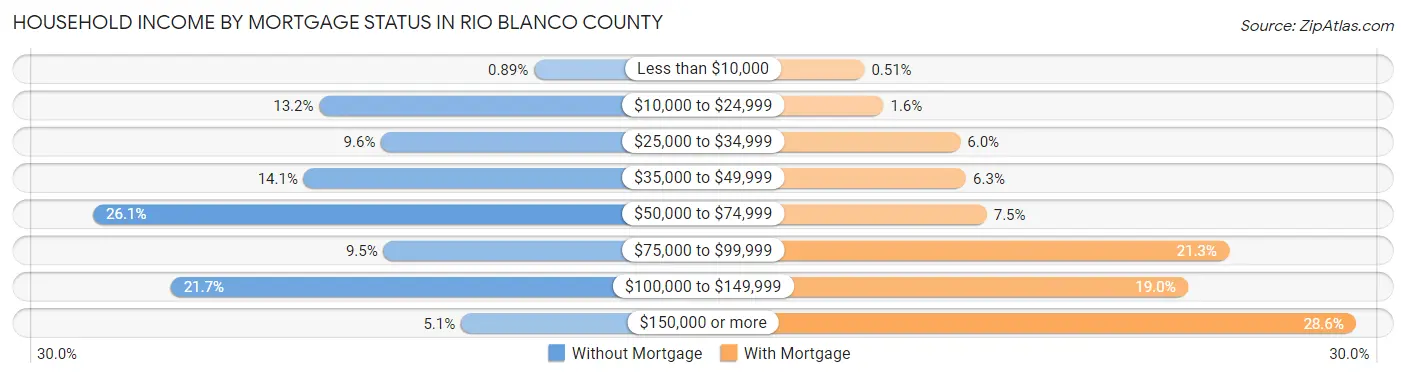
| Household Income | Without Mortgage | With Mortgage |
| Less than $10,000 | 7 (0.9%) | 6 (0.5%) |
| $10,000 to $24,999 | 104 (13.2%) | 19 (1.6%) |
| $25,000 to $34,999 | 76 (9.6%) | 71 (6.0%) |
| $35,000 to $49,999 | 111 (14.1%) | 75 (6.3%) |
| $50,000 to $74,999 | 206 (26.1%) | 89 (7.5%) |
| $75,000 to $99,999 | 75 (9.5%) | 253 (21.3%) |
| $100,000 to $149,999 | 171 (21.6%) | 225 (19.0%) |
| $150,000 or more | 40 (5.1%) | 339 (28.6%) |
| Total | 790 (100.0%) | 1,186 (100.0%) |
Property Value to Household Income Ratio in Rio Blanco County

| Value-to-Income Ratio | Without Mortgage | With Mortgage |
| Less than 2.0x | 218 (27.6%) | 88,611 (7,471.4%) |
| 2.0x to 2.9x | 137 (17.3%) | 369 (31.1%) |
| 3.0x to 3.9x | 144 (18.2%) | 227 (19.1%) |
| 4.0x or more | 291 (36.8%) | 124 (10.5%) |
| Total | 790 (100.0%) | 1,186 (100.0%) |
Real Estate Taxes by Mortgage Status in Rio Blanco County
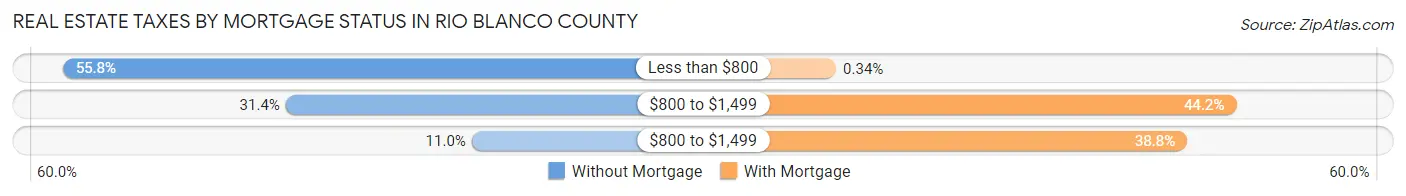
| Property Taxes | Without Mortgage | With Mortgage |
| Less than $800 | 441 (55.8%) | 4 (0.3%) |
| $800 to $1,499 | 248 (31.4%) | 524 (44.2%) |
| $800 to $1,499 | 87 (11.0%) | 460 (38.8%) |
| Total | 790 (100.0%) | 1,186 (100.0%) |
Health & Disability in Rio Blanco County
Health Insurance Coverage by Age in Rio Blanco County
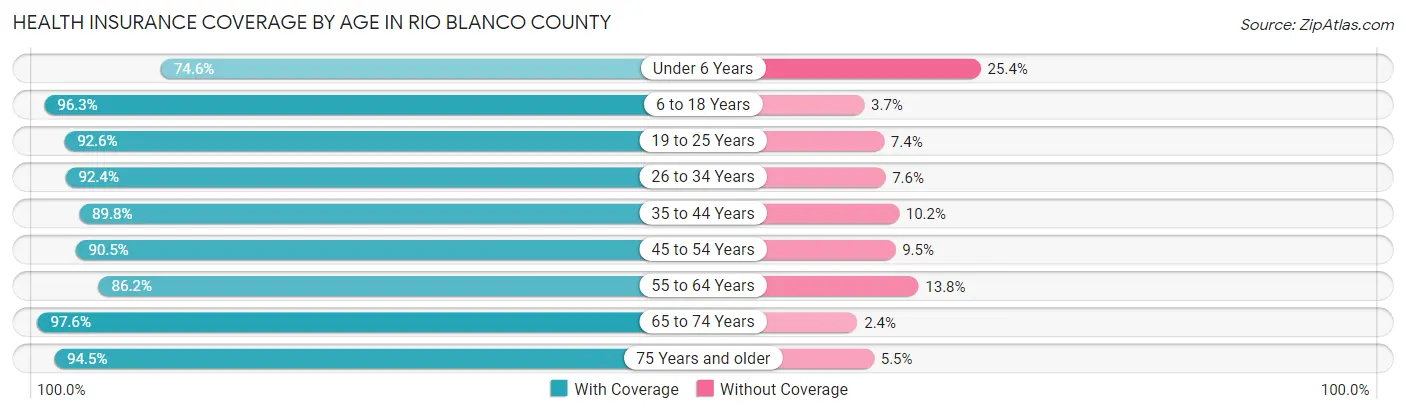
| Age Bracket | With Coverage | Without Coverage |
| Under 6 Years | 393 (74.6%) | 134 (25.4%) |
| 6 to 18 Years | 1,070 (96.3%) | 41 (3.7%) |
| 19 to 25 Years | 526 (92.6%) | 42 (7.4%) |
| 26 to 34 Years | 593 (92.4%) | 49 (7.6%) |
| 35 to 44 Years | 884 (89.8%) | 100 (10.2%) |
| 45 to 54 Years | 515 (90.5%) | 54 (9.5%) |
| 55 to 64 Years | 886 (86.2%) | 142 (13.8%) |
| 65 to 74 Years | 605 (97.6%) | 15 (2.4%) |
| 75 Years and older | 309 (94.5%) | 18 (5.5%) |
| Total | 5,781 (90.7%) | 595 (9.3%) |
Health Insurance Coverage by Citizenship Status in Rio Blanco County
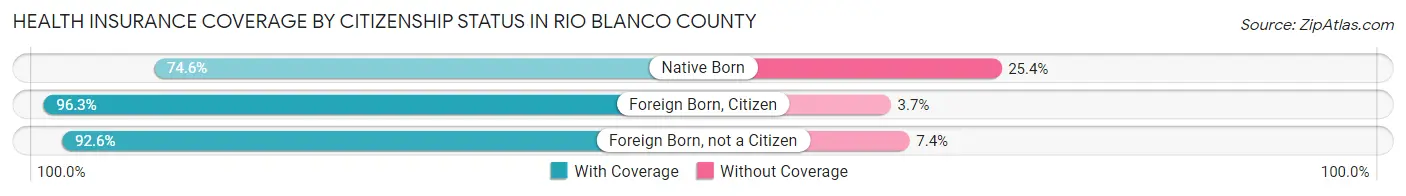
| Citizenship Status | With Coverage | Without Coverage |
| Native Born | 393 (74.6%) | 134 (25.4%) |
| Foreign Born, Citizen | 1,070 (96.3%) | 41 (3.7%) |
| Foreign Born, not a Citizen | 526 (92.6%) | 42 (7.4%) |
Health Insurance Coverage by Household Income in Rio Blanco County

| Household Income | With Coverage | Without Coverage |
| Under $25,000 | 666 (85.6%) | 112 (14.4%) |
| $25,000 to $49,999 | 944 (91.4%) | 89 (8.6%) |
| $50,000 to $74,999 | 1,383 (95.0%) | 73 (5.0%) |
| $75,000 to $99,999 | 759 (94.1%) | 48 (5.9%) |
| $100,000 and over | 1,821 (87.0%) | 272 (13.0%) |
Public vs Private Health Insurance Coverage by Age in Rio Blanco County
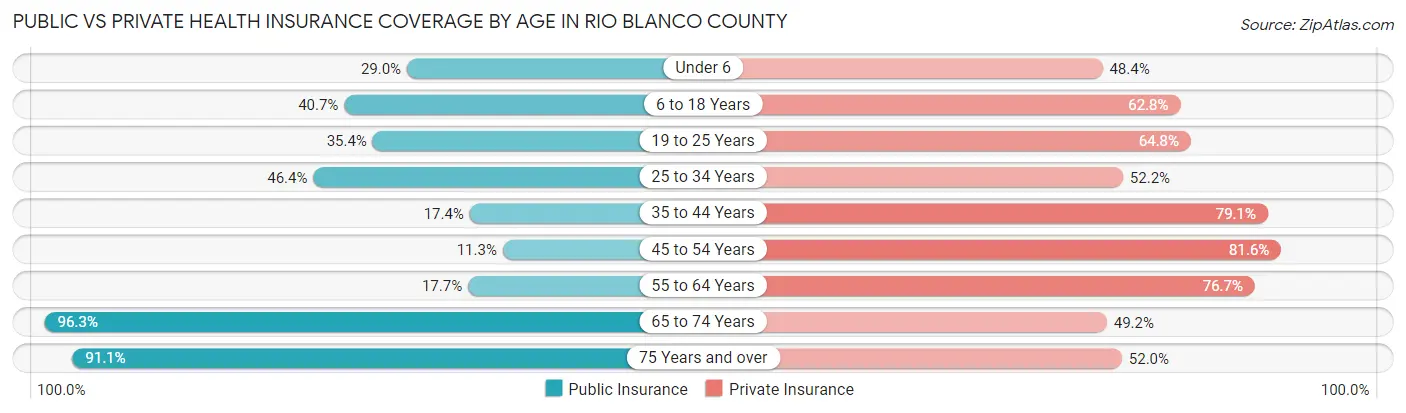
| Age Bracket | Public Insurance | Private Insurance |
| Under 6 | 153 (29.0%) | 255 (48.4%) |
| 6 to 18 Years | 452 (40.7%) | 698 (62.8%) |
| 19 to 25 Years | 201 (35.4%) | 368 (64.8%) |
| 25 to 34 Years | 298 (46.4%) | 335 (52.2%) |
| 35 to 44 Years | 171 (17.4%) | 778 (79.1%) |
| 45 to 54 Years | 64 (11.3%) | 464 (81.6%) |
| 55 to 64 Years | 182 (17.7%) | 788 (76.6%) |
| 65 to 74 Years | 597 (96.3%) | 305 (49.2%) |
| 75 Years and over | 298 (91.1%) | 170 (52.0%) |
| Total | 2,416 (37.9%) | 4,161 (65.3%) |
Disability Status by Sex by Age in Rio Blanco County
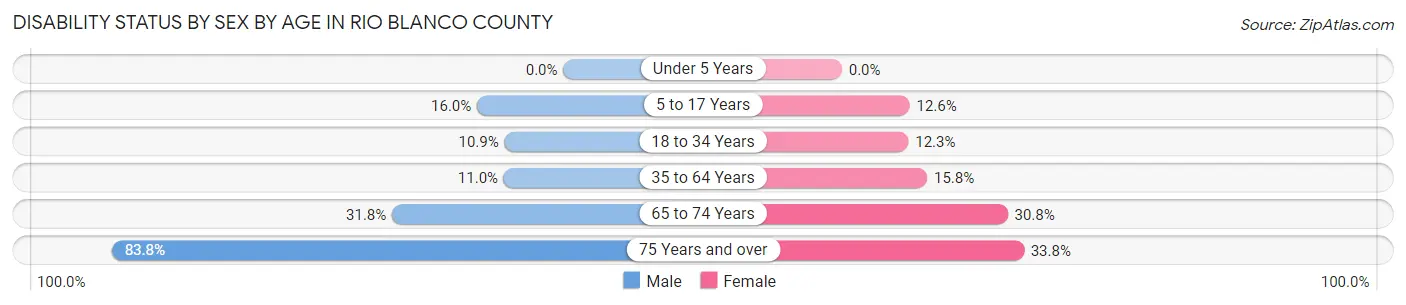
| Age Bracket | Male | Female |
| Under 5 Years | 0 (0.0%) | 0 (0.0%) |
| 5 to 17 Years | 105 (16.0%) | 62 (12.6%) |
| 18 to 34 Years | 72 (10.9%) | 77 (12.3%) |
| 35 to 64 Years | 144 (11.0%) | 202 (15.8%) |
| 65 to 74 Years | 102 (31.8%) | 92 (30.8%) |
| 75 Years and over | 145 (83.8%) | 52 (33.8%) |
Disability Class by Sex by Age in Rio Blanco County
Disability Class: Hearing Difficulty

| Age Bracket | Male | Female |
| Under 5 Years | 0 (0.0%) | 0 (0.0%) |
| 5 to 17 Years | 0 (0.0%) | 22 (4.5%) |
| 18 to 34 Years | 19 (2.9%) | 0 (0.0%) |
| 35 to 64 Years | 57 (4.4%) | 46 (3.6%) |
| 65 to 74 Years | 87 (27.1%) | 62 (20.7%) |
| 75 Years and over | 63 (36.4%) | 34 (22.1%) |
Disability Class: Vision Difficulty
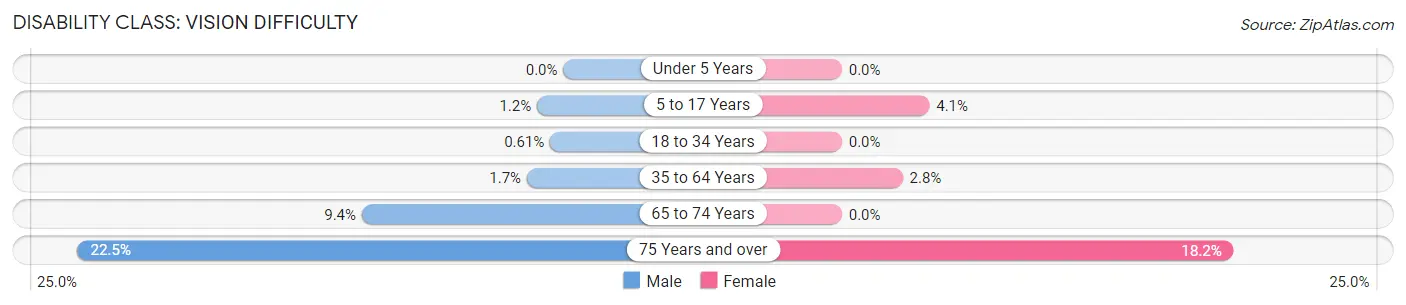
| Age Bracket | Male | Female |
| Under 5 Years | 0 (0.0%) | 0 (0.0%) |
| 5 to 17 Years | 8 (1.2%) | 20 (4.1%) |
| 18 to 34 Years | 4 (0.6%) | 0 (0.0%) |
| 35 to 64 Years | 22 (1.7%) | 36 (2.8%) |
| 65 to 74 Years | 30 (9.3%) | 0 (0.0%) |
| 75 Years and over | 39 (22.5%) | 28 (18.2%) |
Disability Class: Cognitive Difficulty
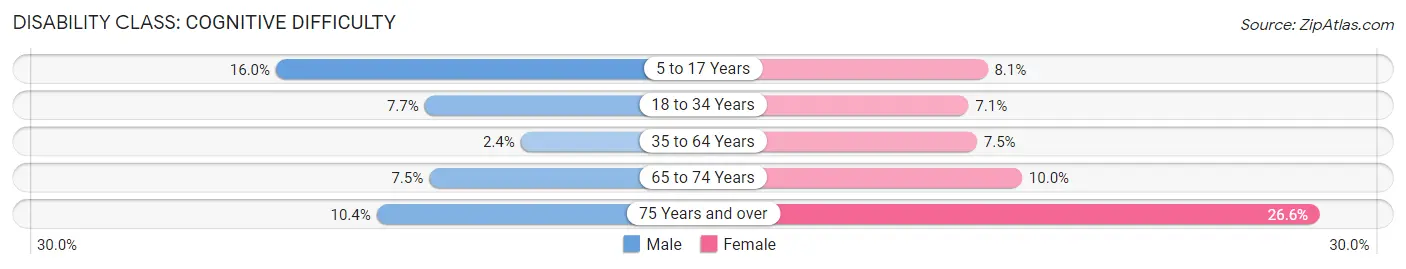
| Age Bracket | Male | Female |
| 5 to 17 Years | 105 (16.0%) | 40 (8.1%) |
| 18 to 34 Years | 51 (7.7%) | 44 (7.0%) |
| 35 to 64 Years | 31 (2.4%) | 96 (7.5%) |
| 65 to 74 Years | 24 (7.5%) | 30 (10.0%) |
| 75 Years and over | 18 (10.4%) | 41 (26.6%) |
Disability Class: Ambulatory Difficulty
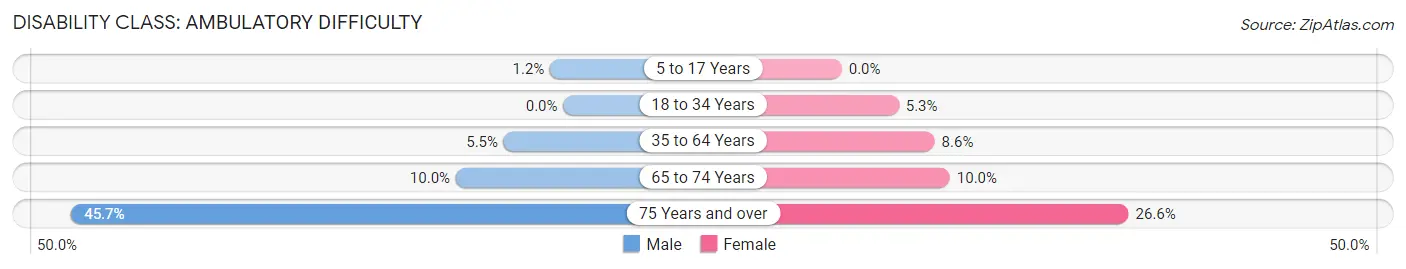
| Age Bracket | Male | Female |
| 5 to 17 Years | 8 (1.2%) | 0 (0.0%) |
| 18 to 34 Years | 0 (0.0%) | 33 (5.3%) |
| 35 to 64 Years | 72 (5.5%) | 110 (8.6%) |
| 65 to 74 Years | 32 (10.0%) | 30 (10.0%) |
| 75 Years and over | 79 (45.7%) | 41 (26.6%) |
Disability Class: Self-Care Difficulty
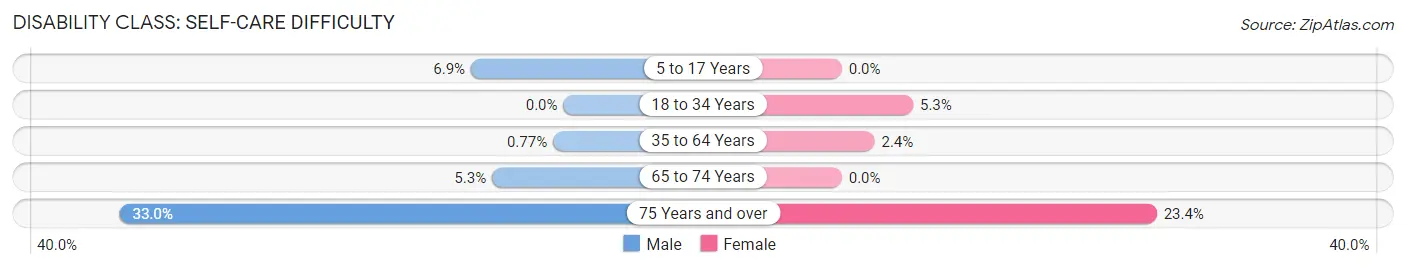
| Age Bracket | Male | Female |
| 5 to 17 Years | 45 (6.9%) | 0 (0.0%) |
| 18 to 34 Years | 0 (0.0%) | 33 (5.3%) |
| 35 to 64 Years | 10 (0.8%) | 31 (2.4%) |
| 65 to 74 Years | 17 (5.3%) | 0 (0.0%) |
| 75 Years and over | 57 (33.0%) | 36 (23.4%) |
Technology Access in Rio Blanco County
Computing Device Access in Rio Blanco County
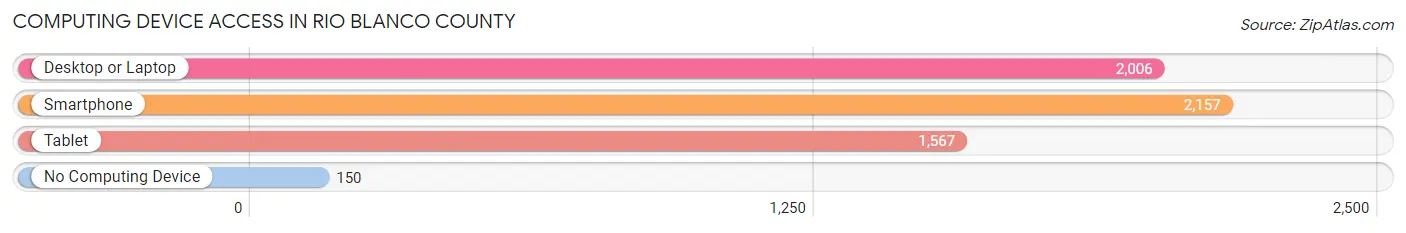
| Device Type | # Households | % Households |
| Desktop or Laptop | 2,006 | 79.8% |
| Smartphone | 2,157 | 85.8% |
| Tablet | 1,567 | 62.4% |
| No Computing Device | 150 | 6.0% |
| Total | 2,513 | 100.0% |
Internet Access in Rio Blanco County
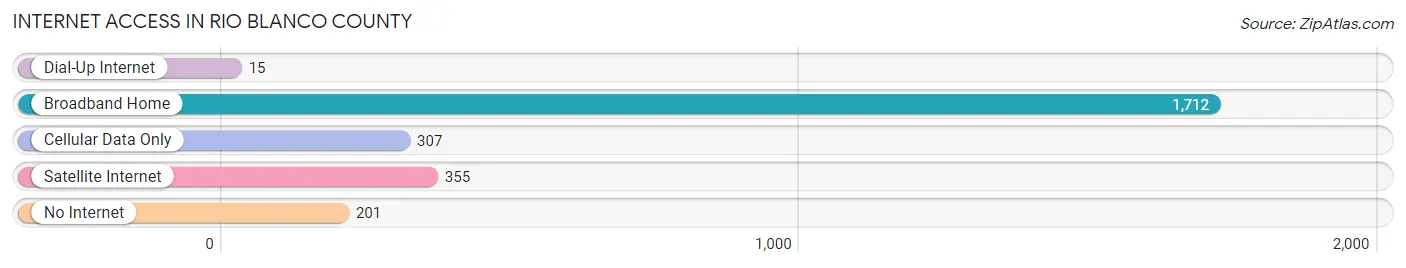
| Internet Type | # Households | % Households |
| Dial-Up Internet | 15 | 0.6% |
| Broadband Home | 1,712 | 68.1% |
| Cellular Data Only | 307 | 12.2% |
| Satellite Internet | 355 | 14.1% |
| No Internet | 201 | 8.0% |
| Total | 2,513 | 100.0% |
Rio Blanco County Summary
Rio Blanco County is located in the northwestern corner of Colorado, and is bordered by Moffat County to the north, Garfield County to the east, Mesa County to the south, and Utah to the west. The county seat is Meeker, and the county is named after the Rio Blanco, a tributary of the White River. The county has a total area of 2,541 square miles, of which 2,539 square miles is land and 2.2 square miles is water.
Rio Blanco County has a rich history, beginning with the Ute Indians who were the first inhabitants of the area. The Utes were nomadic hunters and gatherers who lived in the area for centuries before the arrival of white settlers. The first white settlers arrived in the area in the late 1800s, and the county was officially established in 1889. The county was named after the Rio Blanco, a tributary of the White River.
The economy of Rio Blanco County is largely based on agriculture and energy production. The county is home to several large ranches, and the agricultural industry is the largest employer in the county. The county is also home to several oil and gas fields, and energy production is a major contributor to the local economy. The county is also home to several recreational areas, including the White River National Forest and the Flat Tops Wilderness Area.
The population of Rio Blanco County was 6,822 in the 2010 census, a decrease of 4.3% from the 2000 census. The population is spread out across the county, with the largest population centers being Meeker, Rangely, and Dinosaur. The median household income in the county is $45,845, and the median age is 39.7 years. The population is predominantly white, with a small Hispanic population.
Rio Blanco County is a rural county with a small population and a strong agricultural and energy-based economy. The county is home to several recreational areas, and the population is spread out across the county. The county has a rich history, and the population is predominantly white with a small Hispanic population. The county is a great place to live and work, and offers a variety of opportunities for those looking to make a home in the area.
Common Questions
What is Per Capita Income in Rio Blanco County?
Per Capita income in Rio Blanco County is $30,140.
What is the Median Family Income in Rio Blanco County?
Median Family Income in Rio Blanco County is $84,716.
What is the Median Household income in Rio Blanco County?
Median Household Income in Rio Blanco County is $69,882.
What is Income or Wage Gap in Rio Blanco County?
Income or Wage Gap in Rio Blanco County is 46.2%.
Women in Rio Blanco County earn 53.8 cents for every dollar earned by a man.
What is Family Income Deficit in Rio Blanco County?
Family Income Deficit in Rio Blanco County is $12,195.
Families that are below poverty line in Rio Blanco County earn $12,195 less on average than the poverty threshold level.
What is Inequality or Gini Index in Rio Blanco County?
Inequality or Gini Index in Rio Blanco County is 0.36.
What is the Total Population of Rio Blanco County?
Total Population of Rio Blanco County is 6,511.
What is the Total Male Population of Rio Blanco County?
Total Male Population of Rio Blanco County is 3,450.
What is the Total Female Population of Rio Blanco County?
Total Female Population of Rio Blanco County is 3,061.
What is the Ratio of Males per 100 Females in Rio Blanco County?
There are 112.71 Males per 100 Females in Rio Blanco County.
What is the Ratio of Females per 100 Males in Rio Blanco County?
There are 88.72 Females per 100 Males in Rio Blanco County.
What is the Median Population Age in Rio Blanco County?
Median Population Age in Rio Blanco County is 39.2 Years.
What is the Average Family Size in Rio Blanco County
Average Family Size in Rio Blanco County is 3.0 People.
What is the Average Household Size in Rio Blanco County
Average Household Size in Rio Blanco County is 2.5 People.
How Large is the Labor Force in Rio Blanco County?
There are 3,090 People in the Labor Forcein in Rio Blanco County.
What is the Percentage of People in the Labor Force in Rio Blanco County?
60.1% of People are in the Labor Force in Rio Blanco County.
What is the Unemployment Rate in Rio Blanco County?
Unemployment Rate in Rio Blanco County is 6.1%.