Prowers County, CO Map & Demographics
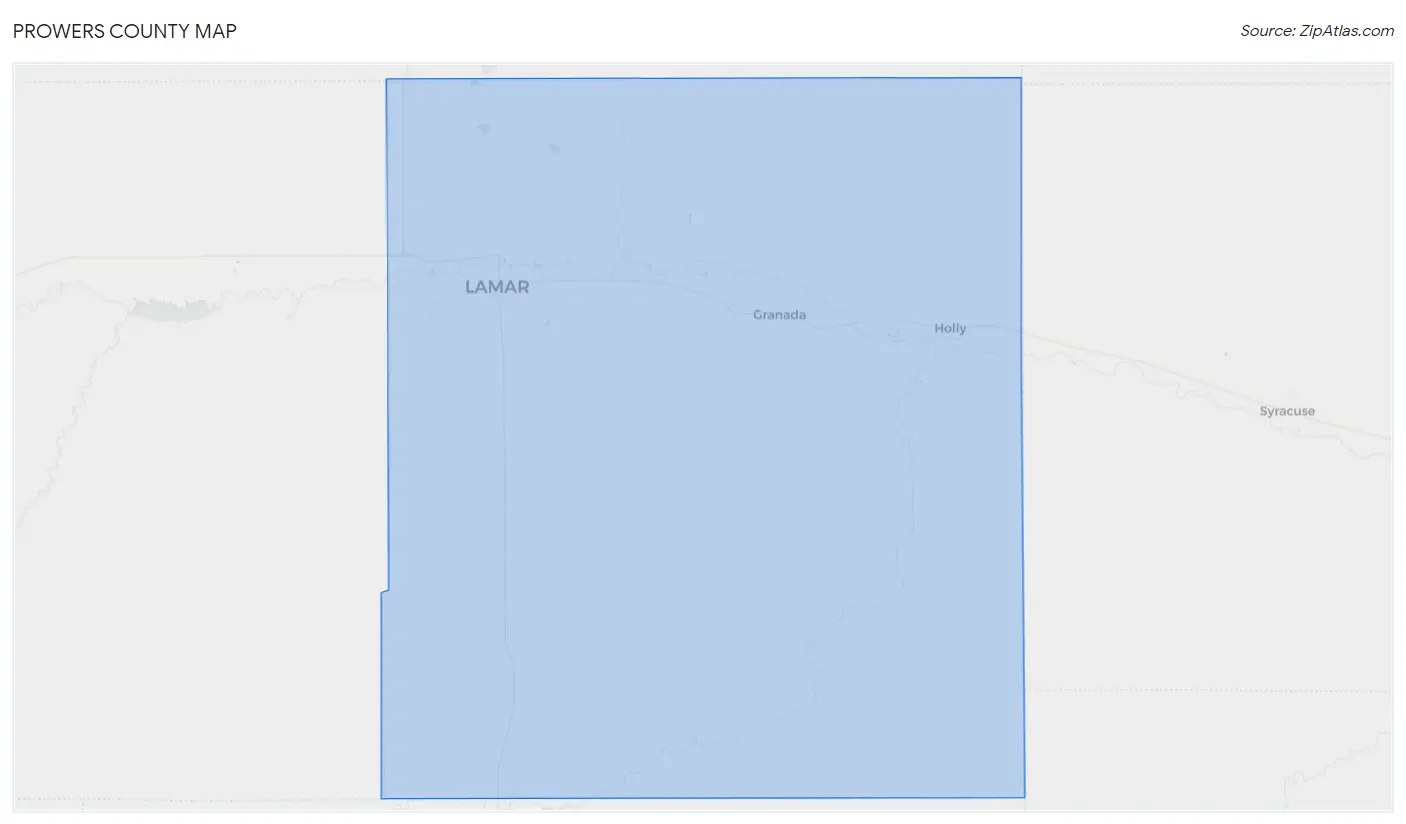
Prowers County Map
Prowers County Overview
$29,026
PER CAPITA INCOME
$61,755
AVG FAMILY INCOME
$49,422
AVG HOUSEHOLD INCOME
9.8%
WAGE / INCOME GAP [ % ]
90.2¢/ $1
WAGE / INCOME GAP [ $ ]
0.50
INEQUALITY / GINI INDEX
11,968
TOTAL POPULATION
6,079
MALE POPULATION
5,889
FEMALE POPULATION
103.23
MALES / 100 FEMALES
96.87
FEMALES / 100 MALES
37.8
MEDIAN AGE
3.2
AVG FAMILY SIZE
2.6
AVG HOUSEHOLD SIZE
5,627
LABOR FORCE [ PEOPLE ]
61.2%
PERCENT IN LABOR FORCE
4.4%
UNEMPLOYMENT RATE
Prowers County Area Codes
Income in Prowers County
Income Overview in Prowers County
Per Capita Income in Prowers County is $29,026, while median incomes of families and households are $61,755 and $49,422 respectively.
| Characteristic | Number | Measure |
| Per Capita Income | 11,968 | $29,026 |
| Median Family Income | 2,997 | $61,755 |
| Mean Family Income | 2,997 | $92,983 |
| Median Household Income | 4,507 | $49,422 |
| Mean Household Income | 4,507 | $76,069 |
| Income Deficit | 2,997 | $0 |
| Wage / Income Gap (%) | 11,968 | 9.82% |
| Wage / Income Gap ($) | 11,968 | 90.18¢ per $1 |
| Gini / Inequality Index | 11,968 | 0.50 |
Earnings by Sex in Prowers County
Average Earnings in Prowers County are $33,191, $34,382 for men and $31,005 for women, a difference of 9.8%.
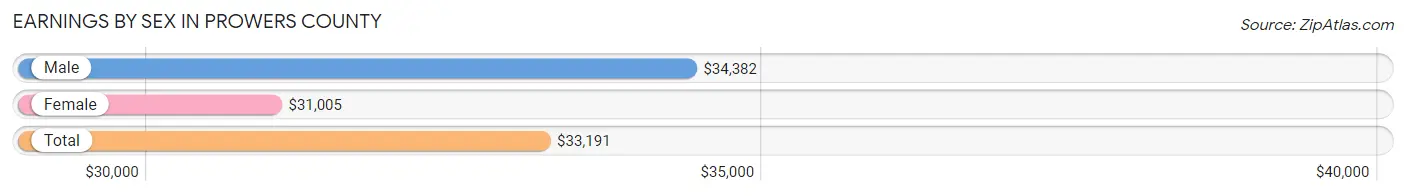
| Sex | Number | Average Earnings |
| Male | 3,179 (54.3%) | $34,382 |
| Female | 2,676 (45.7%) | $31,005 |
| Total | 5,855 (100.0%) | $33,191 |
Earnings by Sex by Income Bracket in Prowers County
The most common earnings brackets in Prowers County are $30,000 to $34,999 for men (366 | 11.5%) and $30,000 to $34,999 for women (270 | 10.1%).
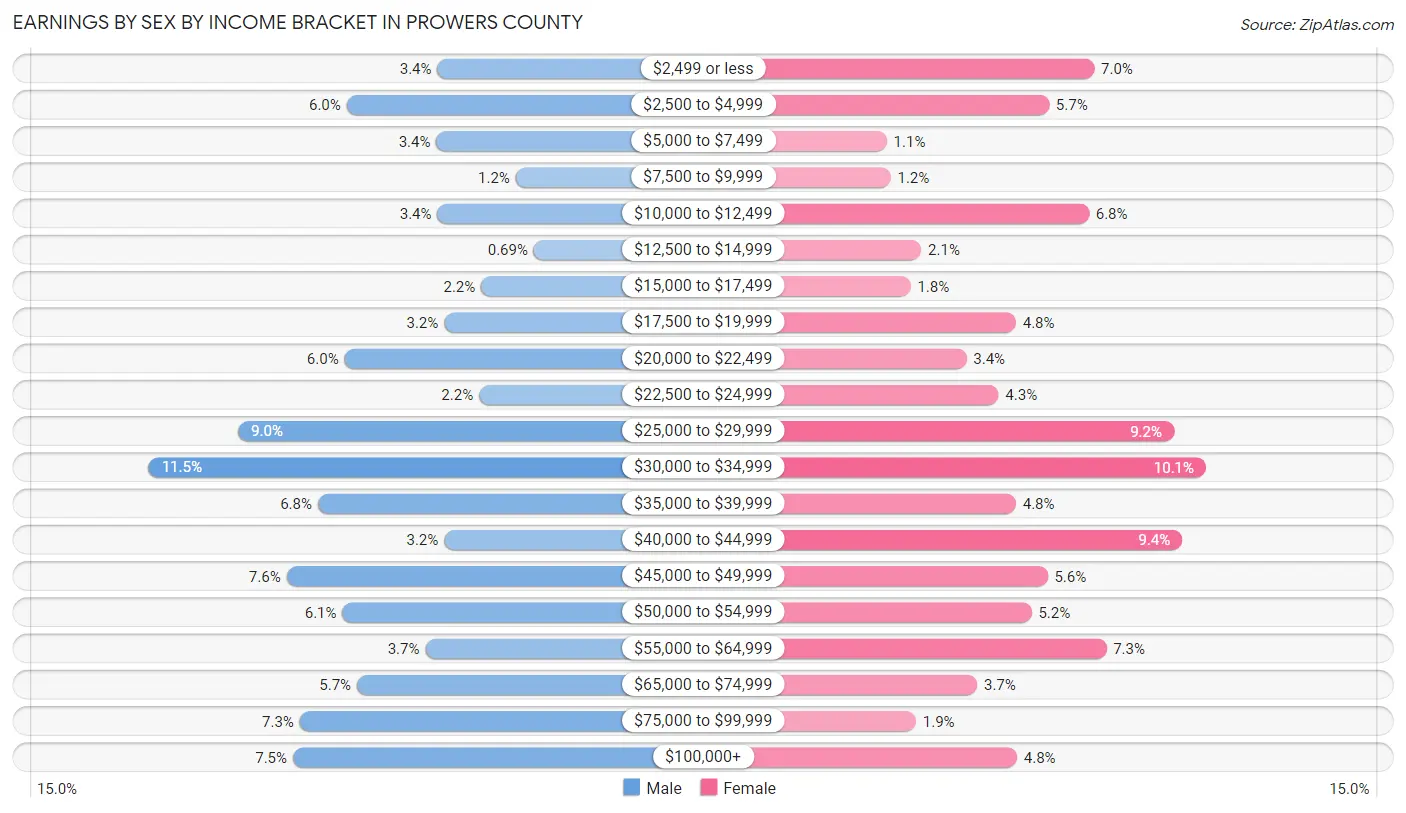
| Income | Male | Female |
| $2,499 or less | 108 (3.4%) | 186 (7.0%) |
| $2,500 to $4,999 | 189 (5.9%) | 152 (5.7%) |
| $5,000 to $7,499 | 109 (3.4%) | 30 (1.1%) |
| $7,500 to $9,999 | 38 (1.2%) | 33 (1.2%) |
| $10,000 to $12,499 | 108 (3.4%) | 182 (6.8%) |
| $12,500 to $14,999 | 22 (0.7%) | 56 (2.1%) |
| $15,000 to $17,499 | 69 (2.2%) | 48 (1.8%) |
| $17,500 to $19,999 | 102 (3.2%) | 127 (4.8%) |
| $20,000 to $22,499 | 191 (6.0%) | 90 (3.4%) |
| $22,500 to $24,999 | 71 (2.2%) | 114 (4.3%) |
| $25,000 to $29,999 | 286 (9.0%) | 246 (9.2%) |
| $30,000 to $34,999 | 366 (11.5%) | 270 (10.1%) |
| $35,000 to $39,999 | 215 (6.8%) | 127 (4.8%) |
| $40,000 to $44,999 | 102 (3.2%) | 252 (9.4%) |
| $45,000 to $49,999 | 243 (7.6%) | 151 (5.6%) |
| $50,000 to $54,999 | 193 (6.1%) | 139 (5.2%) |
| $55,000 to $64,999 | 119 (3.7%) | 195 (7.3%) |
| $65,000 to $74,999 | 180 (5.7%) | 98 (3.7%) |
| $75,000 to $99,999 | 231 (7.3%) | 52 (1.9%) |
| $100,000+ | 237 (7.5%) | 128 (4.8%) |
| Total | 3,179 (100.0%) | 2,676 (100.0%) |
Earnings by Sex by Educational Attainment in Prowers County
Average earnings in Prowers County are $41,786 for men and $37,461 for women, a difference of 10.3%. Men with an educational attainment of graduate degree enjoy the highest average annual earnings of $72,417, while those with high school diploma education earn the least with $36,682. Women with an educational attainment of bachelor's degree earn the most with the average annual earnings of $46,759, while those with high school diploma education have the smallest earnings of $26,436.
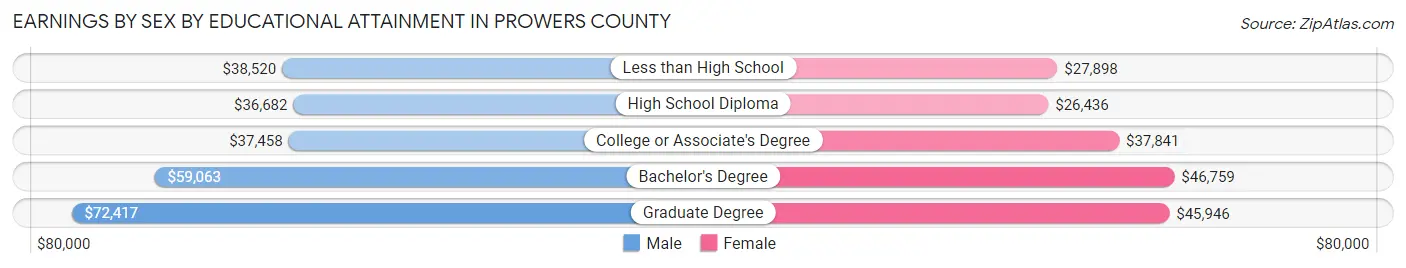
| Educational Attainment | Male Income | Female Income |
| Less than High School | $38,520 | $27,898 |
| High School Diploma | $36,682 | $26,436 |
| College or Associate's Degree | $37,458 | $37,841 |
| Bachelor's Degree | $59,063 | $46,759 |
| Graduate Degree | $72,417 | $45,946 |
| Total | $41,786 | $37,461 |
Family Income in Prowers County
Family Income Brackets in Prowers County
According to the Prowers County family income data, there are 683 families falling into the $35,000 to $49,999 income range, which is the most common income bracket and makes up 22.8% of all families. Conversely, the $10,000 to $14,999 income bracket is the least frequent group with only 60 families (2.0%) belonging to this category.
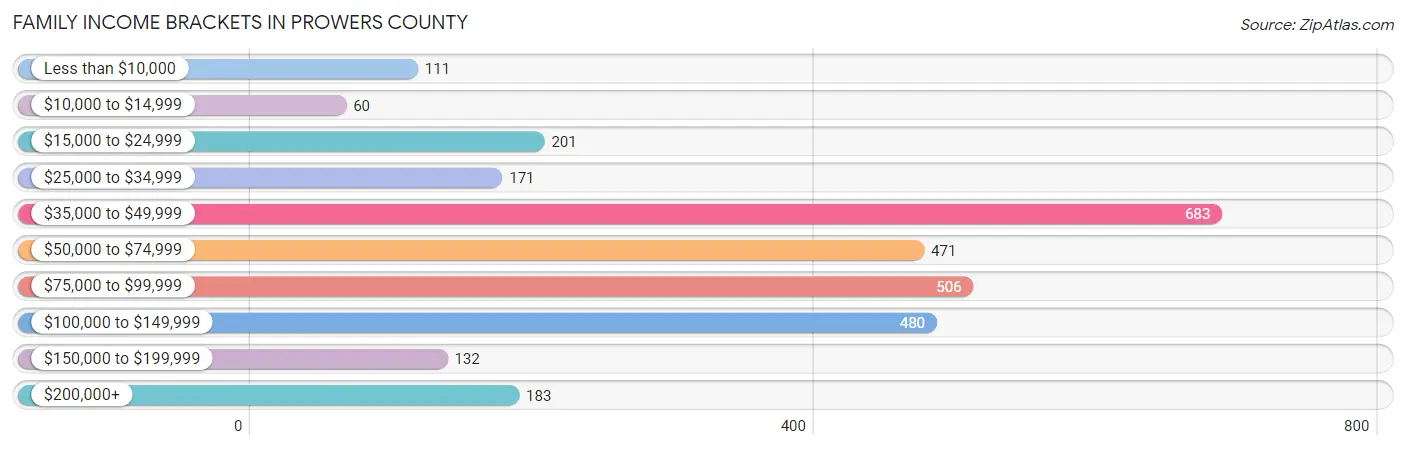
| Income Bracket | # Families | % Families |
| Less than $10,000 | 111 | 3.7% |
| $10,000 to $14,999 | 60 | 2.0% |
| $15,000 to $24,999 | 201 | 6.7% |
| $25,000 to $34,999 | 171 | 5.7% |
| $35,000 to $49,999 | 683 | 22.8% |
| $50,000 to $74,999 | 471 | 15.7% |
| $75,000 to $99,999 | 506 | 16.9% |
| $100,000 to $149,999 | 480 | 16.0% |
| $150,000 to $199,999 | 132 | 4.4% |
| $200,000+ | 183 | 6.1% |
Family Income by Famaliy Size in Prowers County
4-person families (529 | 17.6%) account for the highest median family income in Prowers County with $90,966 per family, while 2-person families (1,270 | 42.4%) have the highest median income of $31,896 per family member.
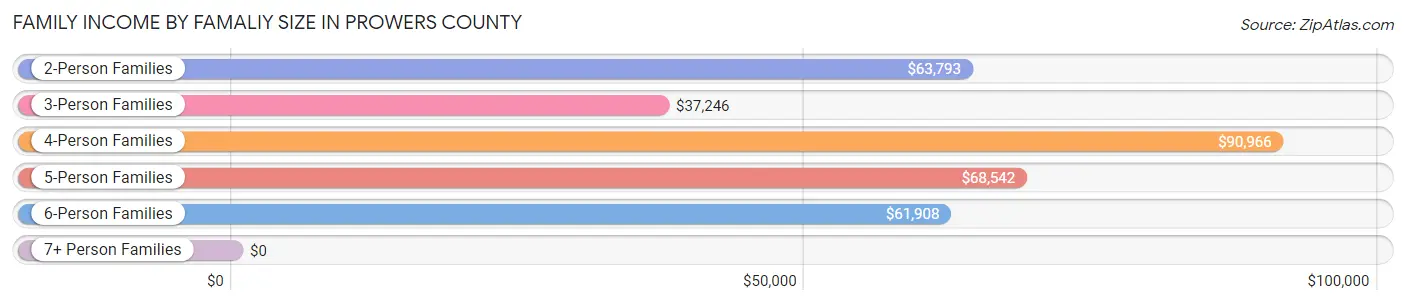
| Income Bracket | # Families | Median Income |
| 2-Person Families | 1,270 (42.4%) | $63,793 |
| 3-Person Families | 610 (20.3%) | $37,246 |
| 4-Person Families | 529 (17.6%) | $90,966 |
| 5-Person Families | 387 (12.9%) | $68,542 |
| 6-Person Families | 100 (3.3%) | $61,908 |
| 7+ Person Families | 101 (3.4%) | $0 |
| Total | 2,997 (100.0%) | $61,755 |
Family Income by Number of Earners in Prowers County
The median family income in Prowers County is $61,755, with families comprising 3+ earners (294) having the highest median family income of $110,500, while families with no earners (372) have the lowest median family income of $27,500, accounting for 9.8% and 12.4% of families, respectively.
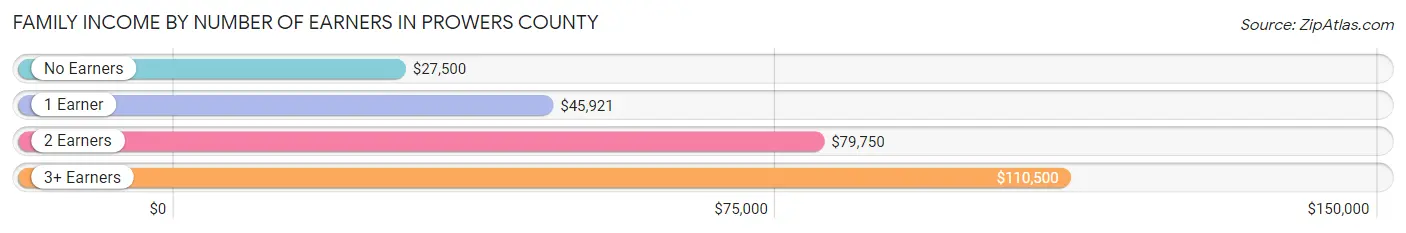
| Number of Earners | # Families | Median Income |
| No Earners | 372 (12.4%) | $27,500 |
| 1 Earner | 922 (30.8%) | $45,921 |
| 2 Earners | 1,409 (47.0%) | $79,750 |
| 3+ Earners | 294 (9.8%) | $110,500 |
| Total | 2,997 (100.0%) | $61,755 |
Household Income in Prowers County
Household Income Brackets in Prowers County
With 897 households falling in the category, the $35,000 to $49,999 income range is the most frequent in Prowers County, accounting for 19.9% of all households. In contrast, only 153 households (3.4%) fall into the $150,000 to $199,999 income bracket, making it the least populous group.
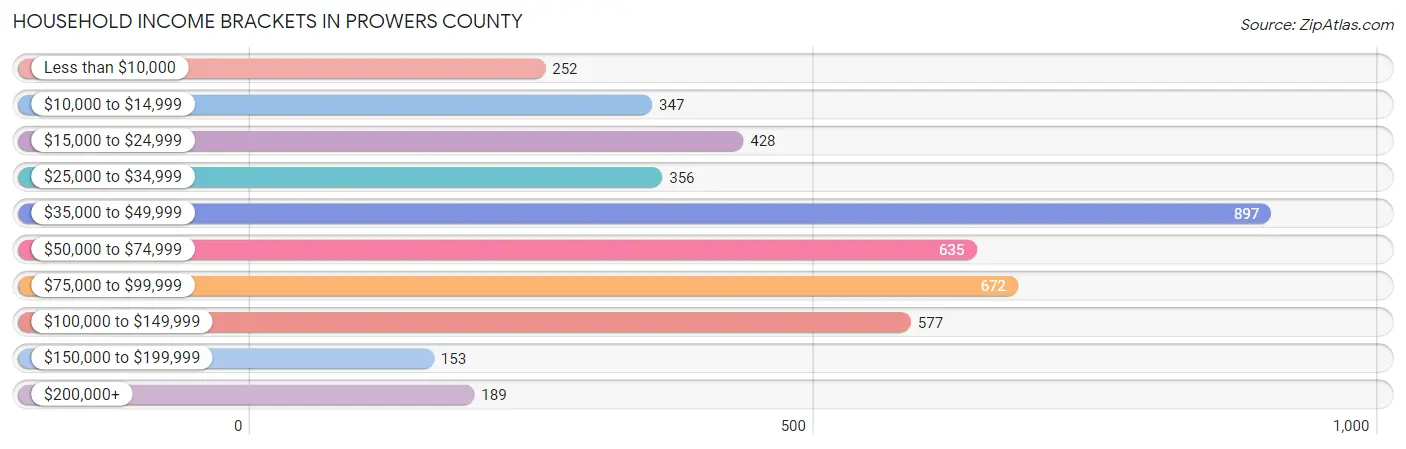
| Income Bracket | # Households | % Households |
| Less than $10,000 | 252 | 5.6% |
| $10,000 to $14,999 | 347 | 7.7% |
| $15,000 to $24,999 | 428 | 9.5% |
| $25,000 to $34,999 | 356 | 7.9% |
| $35,000 to $49,999 | 897 | 19.9% |
| $50,000 to $74,999 | 635 | 14.1% |
| $75,000 to $99,999 | 672 | 14.9% |
| $100,000 to $149,999 | 577 | 12.8% |
| $150,000 to $199,999 | 153 | 3.4% |
| $200,000+ | 189 | 4.2% |
Household Income by Householder Age in Prowers County
The median household income in Prowers County is $49,422, with the highest median household income of $74,107 found in the 45 to 64 years age bracket for the primary householder. A total of 1,571 households (34.9%) fall into this category. Meanwhile, the 65+ years age bracket for the primary householder has the lowest median household income of $35,852, with 1,500 households (33.3%) in this group.
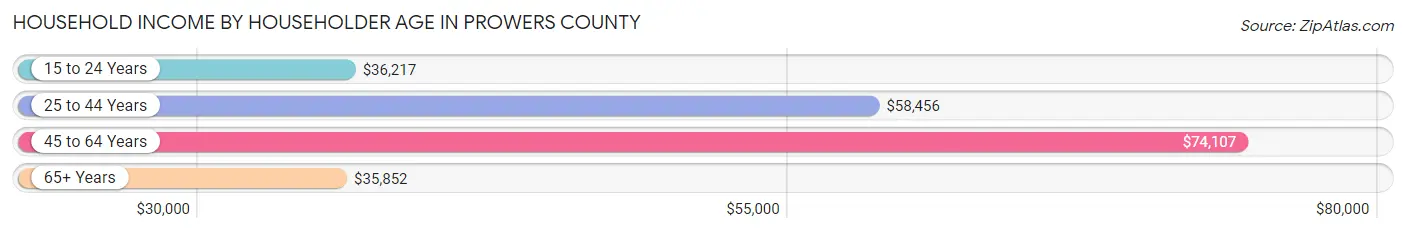
| Income Bracket | # Households | Median Income |
| 15 to 24 Years | 381 (8.5%) | $36,217 |
| 25 to 44 Years | 1,055 (23.4%) | $58,456 |
| 45 to 64 Years | 1,571 (34.9%) | $74,107 |
| 65+ Years | 1,500 (33.3%) | $35,852 |
| Total | 4,507 (100.0%) | $49,422 |
Poverty in Prowers County
Income Below Poverty by Sex and Age in Prowers County
With 17.2% poverty level for males and 18.0% for females among the residents of Prowers County, 65 to 74 year old males and 25 to 34 year old females are the most vulnerable to poverty, with 209 males (31.8%) and 207 females (35.7%) in their respective age groups living below the poverty level.
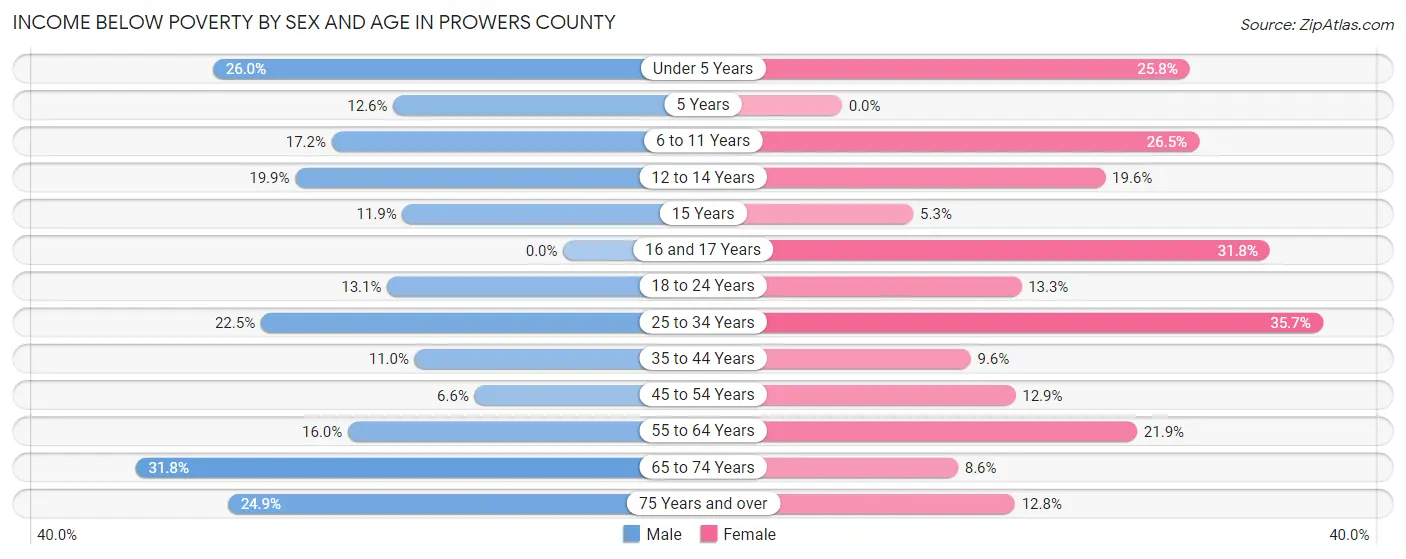
| Age Bracket | Male | Female |
| Under 5 Years | 102 (26.0%) | 102 (25.8%) |
| 5 Years | 26 (12.6%) | 0 (0.0%) |
| 6 to 11 Years | 87 (17.2%) | 149 (26.5%) |
| 12 to 14 Years | 39 (19.9%) | 35 (19.6%) |
| 15 Years | 8 (11.9%) | 7 (5.3%) |
| 16 and 17 Years | 0 (0.0%) | 34 (31.8%) |
| 18 to 24 Years | 74 (13.1%) | 75 (13.3%) |
| 25 to 34 Years | 141 (22.5%) | 207 (35.7%) |
| 35 to 44 Years | 73 (11.0%) | 67 (9.6%) |
| 45 to 54 Years | 43 (6.6%) | 77 (12.9%) |
| 55 to 64 Years | 121 (16.0%) | 165 (21.9%) |
| 65 to 74 Years | 209 (31.8%) | 58 (8.6%) |
| 75 Years and over | 82 (24.9%) | 56 (12.8%) |
| Total | 1,005 (17.2%) | 1,032 (18.0%) |
Income Above Poverty by Sex and Age in Prowers County
According to the poverty statistics in Prowers County, males aged 16 and 17 years and females aged 5 years are the age groups that are most secure financially, with 100.0% of males and 100.0% of females in these age groups living above the poverty line.
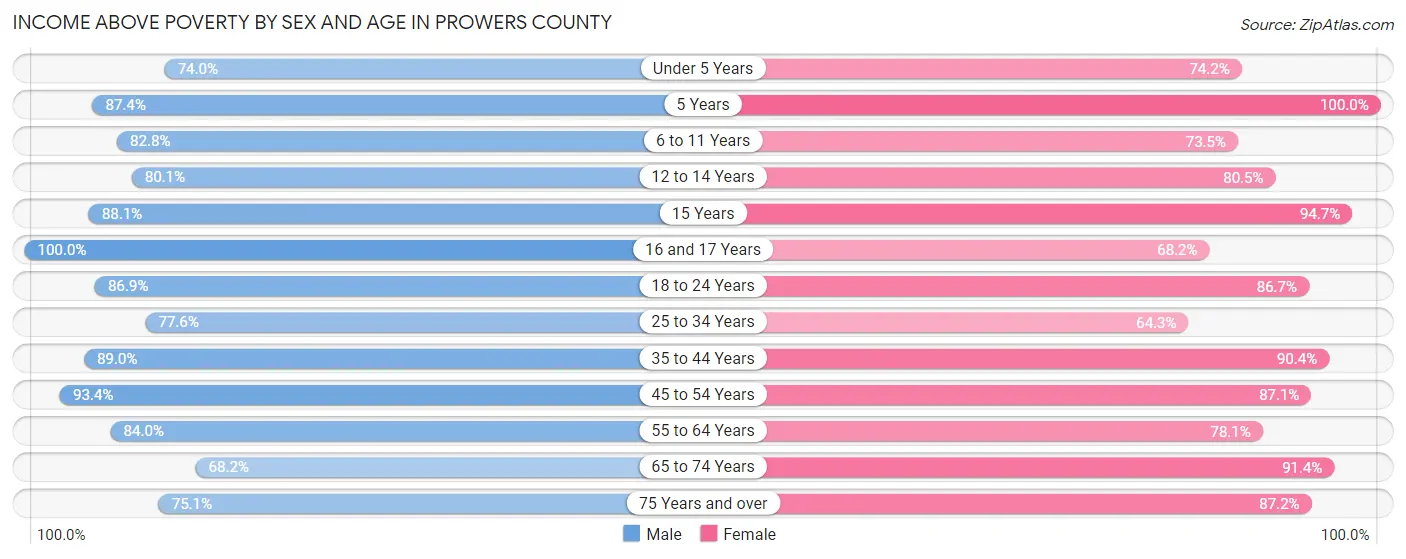
| Age Bracket | Male | Female |
| Under 5 Years | 290 (74.0%) | 293 (74.2%) |
| 5 Years | 180 (87.4%) | 60 (100.0%) |
| 6 to 11 Years | 419 (82.8%) | 413 (73.5%) |
| 12 to 14 Years | 157 (80.1%) | 144 (80.4%) |
| 15 Years | 59 (88.1%) | 125 (94.7%) |
| 16 and 17 Years | 227 (100.0%) | 73 (68.2%) |
| 18 to 24 Years | 492 (86.9%) | 488 (86.7%) |
| 25 to 34 Years | 487 (77.5%) | 373 (64.3%) |
| 35 to 44 Years | 589 (89.0%) | 634 (90.4%) |
| 45 to 54 Years | 610 (93.4%) | 521 (87.1%) |
| 55 to 64 Years | 636 (84.0%) | 588 (78.1%) |
| 65 to 74 Years | 449 (68.2%) | 616 (91.4%) |
| 75 Years and over | 247 (75.1%) | 380 (87.2%) |
| Total | 4,842 (82.8%) | 4,708 (82.0%) |
Income Below Poverty Among Married-Couple Families in Prowers County
The poverty statistics for married-couple families in Prowers County show that 7.6% or 177 of the total 2,339 families live below the poverty line. Families with 5 or more children have the highest poverty rate of 100.0%, comprising of 6 families. On the other hand, families with 1 or 2 children have the lowest poverty rate of 4.8%, which includes 37 families.
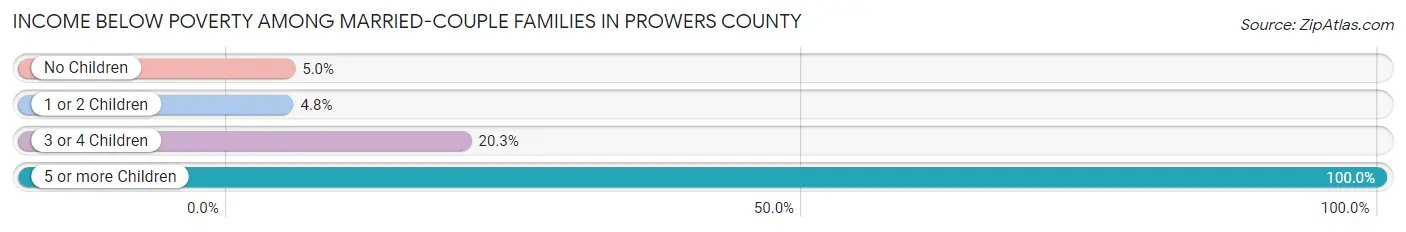
| Children | Above Poverty | Below Poverty |
| No Children | 1,144 (95.0%) | 60 (5.0%) |
| 1 or 2 Children | 728 (95.2%) | 37 (4.8%) |
| 3 or 4 Children | 290 (79.7%) | 74 (20.3%) |
| 5 or more Children | 0 (0.0%) | 6 (100.0%) |
| Total | 2,162 (92.4%) | 177 (7.6%) |
Income Below Poverty Among Single-Parent Households in Prowers County
According to the poverty data in Prowers County, 1.8% or 3 single-father households and 34.2% or 168 single-mother households are living below the poverty line. Among single-father households, those with 3 or 4 children have the highest poverty rate, with 3 households (10.0%) experiencing poverty. Likewise, among single-mother households, those with 3 or 4 children have the highest poverty rate, with 59 households (56.2%) falling below the poverty line.
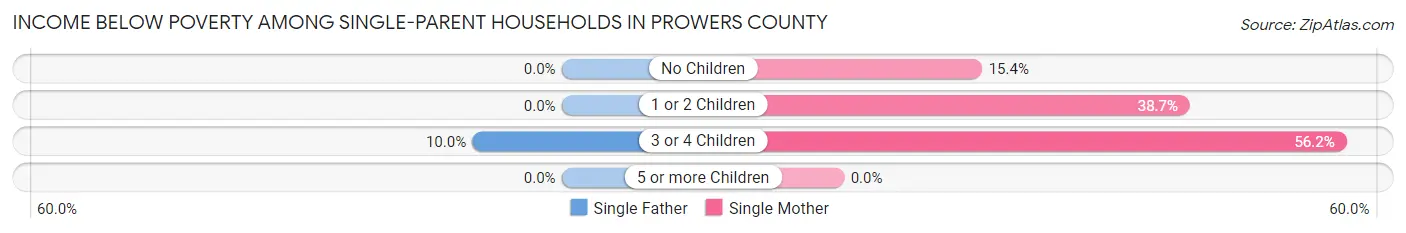
| Children | Single Father | Single Mother |
| No Children | 0 (0.0%) | 27 (15.4%) |
| 1 or 2 Children | 0 (0.0%) | 82 (38.7%) |
| 3 or 4 Children | 3 (10.0%) | 59 (56.2%) |
| 5 or more Children | 0 (0.0%) | 0 (0.0%) |
| Total | 3 (1.8%) | 168 (34.2%) |
Income Below Poverty Among Married-Couple vs Single-Parent Households in Prowers County
The poverty data for Prowers County shows that 177 of the married-couple family households (7.6%) and 171 of the single-parent households (26.0%) are living below the poverty level. Within the married-couple family households, those with 5 or more children have the highest poverty rate, with 6 households (100.0%) falling below the poverty line. Among the single-parent households, those with 3 or 4 children have the highest poverty rate, with 62 household (45.9%) living below poverty.
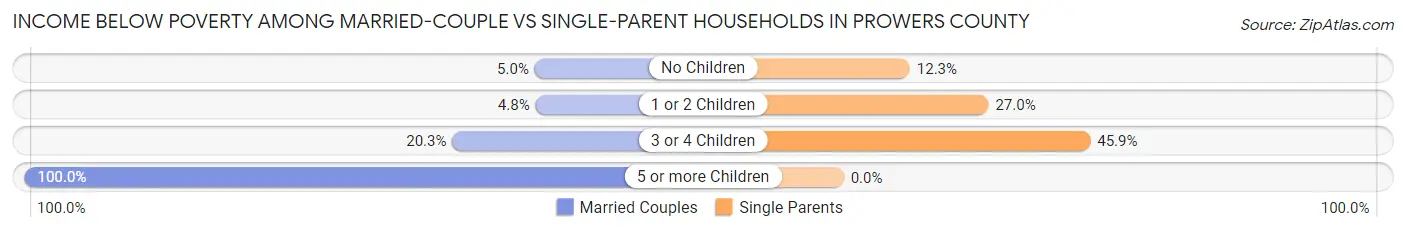
| Children | Married-Couple Families | Single-Parent Households |
| No Children | 60 (5.0%) | 27 (12.3%) |
| 1 or 2 Children | 37 (4.8%) | 82 (27.0%) |
| 3 or 4 Children | 74 (20.3%) | 62 (45.9%) |
| 5 or more Children | 6 (100.0%) | 0 (0.0%) |
| Total | 177 (7.6%) | 171 (26.0%) |
Race in Prowers County
The most populous races in Prowers County are White / Caucasian (9,037 | 75.5%), Hispanic or Latino (4,725 | 39.5%), and Two or more Races (1,289 | 10.8%).
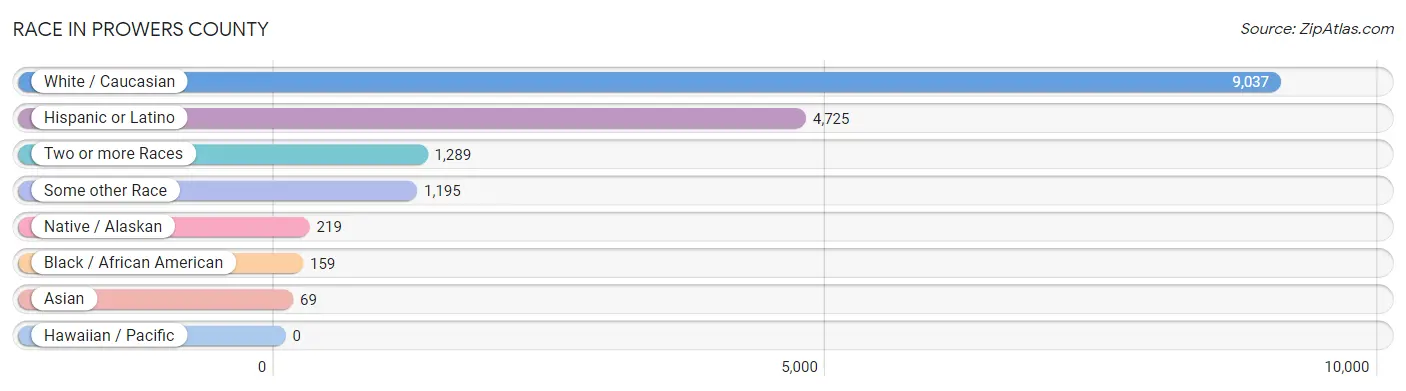
| Race | # Population | % Population |
| Asian | 69 | 0.6% |
| Black / African American | 159 | 1.3% |
| Hawaiian / Pacific | 0 | 0.0% |
| Hispanic or Latino | 4,725 | 39.5% |
| Native / Alaskan | 219 | 1.8% |
| White / Caucasian | 9,037 | 75.5% |
| Two or more Races | 1,289 | 10.8% |
| Some other Race | 1,195 | 10.0% |
| Total | 11,968 | 100.0% |
Ancestry in Prowers County
The most populous ancestries reported in Prowers County are Mexican (3,915 | 32.7%), German (1,681 | 14.1%), English (1,341 | 11.2%), American (1,003 | 8.4%), and Irish (552 | 4.6%), together accounting for 71.0% of all Prowers County residents.
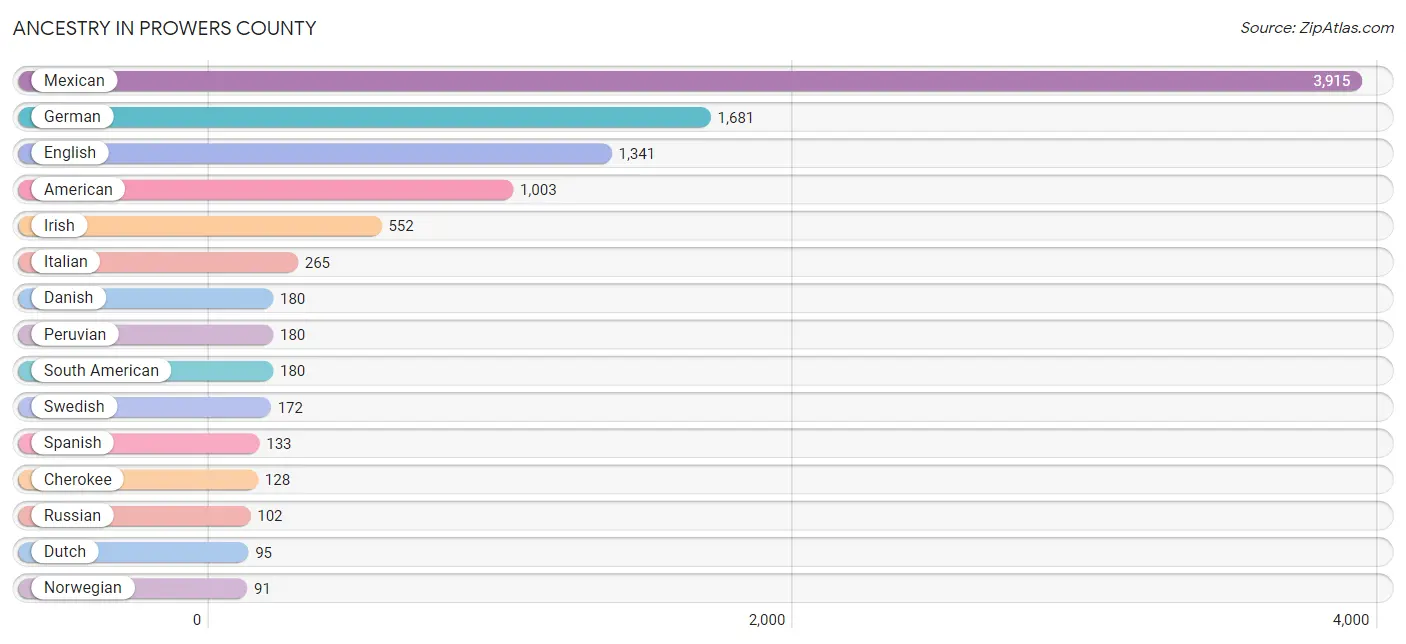
| Ancestry | # Population | % Population |
| Alaskan Athabascan | 26 | 0.2% |
| American | 1,003 | 8.4% |
| Apache | 51 | 0.4% |
| Blackfeet | 7 | 0.1% |
| British | 10 | 0.1% |
| Burmese | 18 | 0.2% |
| Canadian | 90 | 0.7% |
| Cherokee | 128 | 1.1% |
| Chippewa | 19 | 0.2% |
| Czech | 27 | 0.2% |
| Danish | 180 | 1.5% |
| Dutch | 95 | 0.8% |
| Eastern European | 56 | 0.5% |
| English | 1,341 | 11.2% |
| European | 72 | 0.6% |
| French | 54 | 0.4% |
| French Canadian | 18 | 0.2% |
| German | 1,681 | 14.1% |
| Greek | 2 | 0.0% |
| Hungarian | 12 | 0.1% |
| Indian (Asian) | 10 | 0.1% |
| Irish | 552 | 4.6% |
| Italian | 265 | 2.2% |
| Korean | 41 | 0.3% |
| Mexican | 3,915 | 32.7% |
| Mexican American Indian | 25 | 0.2% |
| Navajo | 44 | 0.4% |
| Northern European | 15 | 0.1% |
| Norwegian | 91 | 0.8% |
| Peruvian | 180 | 1.5% |
| Polish | 49 | 0.4% |
| Potawatomi | 3 | 0.0% |
| Russian | 102 | 0.9% |
| Scandinavian | 3 | 0.0% |
| Scotch-Irish | 46 | 0.4% |
| Scottish | 74 | 0.6% |
| Sioux | 41 | 0.3% |
| South American | 180 | 1.5% |
| South American Indian | 18 | 0.2% |
| Spaniard | 61 | 0.5% |
| Spanish | 133 | 1.1% |
| Swedish | 172 | 1.4% |
| Thai | 10 | 0.1% |
| Ukrainian | 1 | 0.0% |
| Welsh | 31 | 0.3% | View All 45 Rows |
Immigrants in Prowers County
The most numerous immigrant groups reported in Prowers County came from Latin America (1,016 | 8.5%), Central America (913 | 7.6%), Mexico (885 | 7.4%), Peru (103 | 0.9%), and South America (103 | 0.9%), together accounting for 25.2% of all Prowers County residents.
| Immigration Origin | # Population | % Population |
| Africa | 7 | 0.1% |
| Asia | 25 | 0.2% |
| Canada | 5 | 0.0% |
| Central America | 913 | 7.6% |
| Eastern Asia | 18 | 0.2% |
| Eastern Europe | 1 | 0.0% |
| England | 13 | 0.1% |
| Europe | 25 | 0.2% |
| Guatemala | 8 | 0.1% |
| Honduras | 20 | 0.2% |
| India | 1 | 0.0% |
| Korea | 18 | 0.2% |
| Latin America | 1,016 | 8.5% |
| Mexico | 885 | 7.4% |
| Netherlands | 11 | 0.1% |
| Northern Europe | 13 | 0.1% |
| Peru | 103 | 0.9% |
| Philippines | 6 | 0.1% |
| Poland | 1 | 0.0% |
| South America | 103 | 0.9% |
| South Central Asia | 1 | 0.0% |
| South Eastern Asia | 6 | 0.1% |
| Western Africa | 7 | 0.1% |
| Western Europe | 11 | 0.1% | View All 24 Rows |
Sex and Age in Prowers County
Sex and Age in Prowers County
The most populous age groups in Prowers County are 15 to 19 Years (606 | 10.0%) for men and 5 to 9 Years (542 | 9.2%) for women.
| Age Bracket | Male | Female |
| Under 5 Years | 392 (6.5%) | 400 (6.8%) |
| 5 to 9 Years | 519 (8.5%) | 542 (9.2%) |
| 10 to 14 Years | 394 (6.5%) | 327 (5.6%) |
| 15 to 19 Years | 606 (10.0%) | 402 (6.8%) |
| 20 to 24 Years | 404 (6.7%) | 439 (7.4%) |
| 25 to 29 Years | 306 (5.0%) | 271 (4.6%) |
| 30 to 34 Years | 322 (5.3%) | 309 (5.2%) |
| 35 to 39 Years | 315 (5.2%) | 293 (5.0%) |
| 40 to 44 Years | 368 (6.0%) | 408 (6.9%) |
| 45 to 49 Years | 338 (5.6%) | 265 (4.5%) |
| 50 to 54 Years | 321 (5.3%) | 333 (5.7%) |
| 55 to 59 Years | 436 (7.2%) | 292 (5.0%) |
| 60 to 64 Years | 341 (5.6%) | 469 (8.0%) |
| 65 to 69 Years | 455 (7.5%) | 486 (8.3%) |
| 70 to 74 Years | 225 (3.7%) | 195 (3.3%) |
| 75 to 79 Years | 135 (2.2%) | 87 (1.5%) |
| 80 to 84 Years | 99 (1.6%) | 169 (2.9%) |
| 85 Years and over | 103 (1.7%) | 202 (3.4%) |
| Total | 6,079 (100.0%) | 5,889 (100.0%) |
Families and Households in Prowers County
Median Family Size in Prowers County
The median family size in Prowers County is 3.21 persons per family, with single female/mother families (492 | 16.4%) accounting for the largest median family size of 3.33 persons per family. On the other hand, single male/father families (166 | 5.5%) represent the smallest median family size with 2.40 persons per family.
| Family Type | # Families | Family Size |
| Married-Couple | 2,339 (78.0%) | 3.24 |
| Single Male/Father | 166 (5.5%) | 2.40 |
| Single Female/Mother | 492 (16.4%) | 3.33 |
| Total Families | 2,997 (100.0%) | 3.21 |
Median Household Size in Prowers County
The median household size in Prowers County is 2.57 persons per household, with single female/mother households (492 | 10.9%) accounting for the largest median household size of 3.8 persons per household. non-family households (1,510 | 33.5%) represent the smallest median household size with 1.12 persons per household.
| Household Type | # Households | Household Size |
| Married-Couple | 2,339 (51.9%) | 3.24 |
| Single Male/Father | 166 (3.7%) | 2.71 |
| Single Female/Mother | 492 (10.9%) | 3.80 |
| Non-family | 1,510 (33.5%) | 1.12 |
| Total Households | 4,507 (100.0%) | 2.57 |
Household Size by Marriage Status in Prowers County
Out of a total of 4,507 households in Prowers County, 2,997 (66.5%) are family households, while 1,510 (33.5%) are nonfamily households. The most numerous type of family households are 2-person households, comprising 1,238, and the most common type of nonfamily households are 1-person households, comprising 1,352.
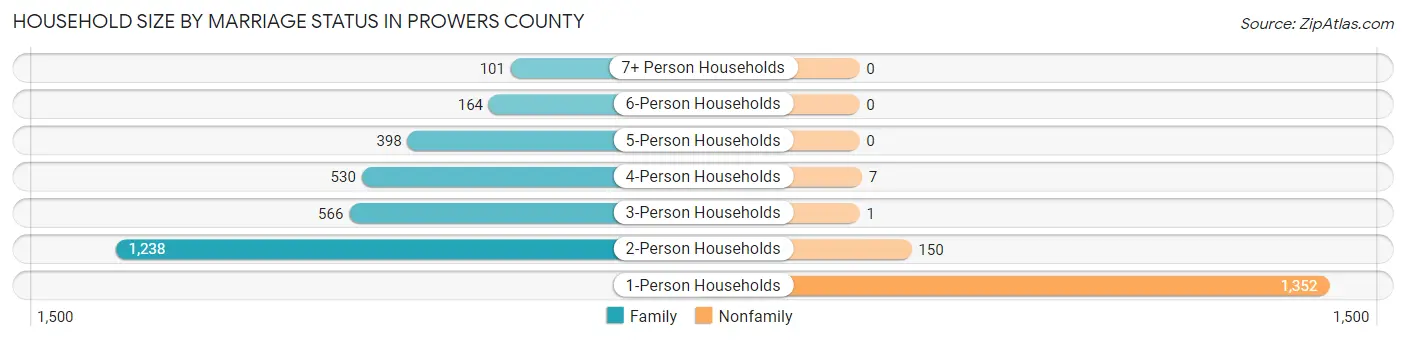
| Household Size | Family Households | Nonfamily Households |
| 1-Person Households | - | 1,352 (30.0%) |
| 2-Person Households | 1,238 (27.5%) | 150 (3.3%) |
| 3-Person Households | 566 (12.6%) | 1 (0.0%) |
| 4-Person Households | 530 (11.8%) | 7 (0.2%) |
| 5-Person Households | 398 (8.8%) | 0 (0.0%) |
| 6-Person Households | 164 (3.6%) | 0 (0.0%) |
| 7+ Person Households | 101 (2.2%) | 0 (0.0%) |
| Total | 2,997 (66.5%) | 1,510 (33.5%) |
Female Fertility in Prowers County
Fertility by Age in Prowers County
Average fertility rate in Prowers County is 89.0 births per 1,000 women. Women in the age bracket of 20 to 34 years have the highest fertility rate with 197.0 births per 1,000 women. Women in the age bracket of 20 to 34 years acount for 93.5% of all women with births.
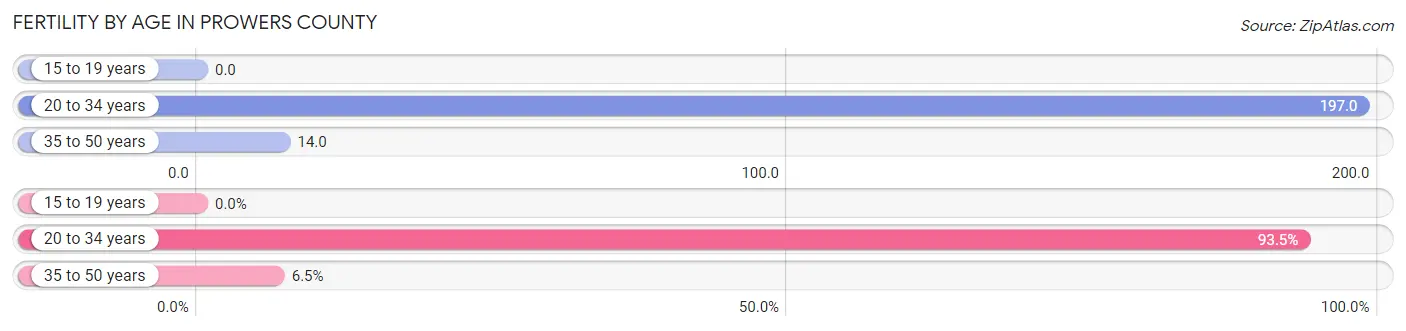
| Age Bracket | Women with Births | Births / 1,000 Women |
| 15 to 19 years | 0 (0.0%) | 0.0 |
| 20 to 34 years | 201 (93.5%) | 197.0 |
| 35 to 50 years | 14 (6.5%) | 14.0 |
| Total | 215 (100.0%) | 89.0 |
Fertility by Age by Marriage Status in Prowers County
82.8% of women with births (215) in Prowers County are married. The highest percentage of unmarried women with births falls into 20 to 34 years age bracket with 18.4% of them unmarried at the time of birth, while the lowest percentage of unmarried women with births belong to 35 to 50 years age bracket with 0.0% of them unmarried.
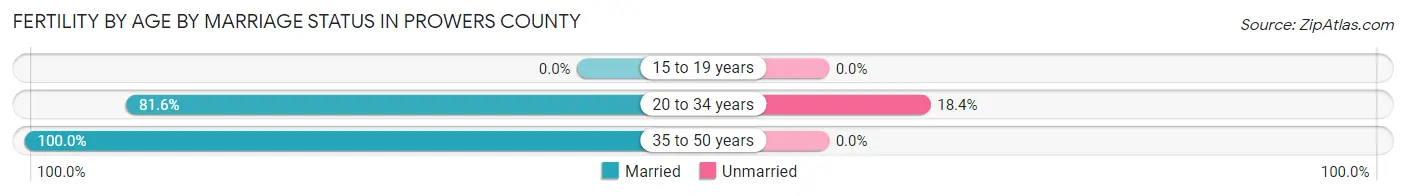
| Age Bracket | Married | Unmarried |
| 15 to 19 years | 0 (0.0%) | 0 (0.0%) |
| 20 to 34 years | 164 (81.6%) | 37 (18.4%) |
| 35 to 50 years | 14 (100.0%) | 0 (0.0%) |
| Total | 178 (82.8%) | 37 (17.2%) |
Fertility by Education in Prowers County
Average fertility rate in Prowers County is 89.0 births per 1,000 women. Women with the education attainment of graduate degree have the highest fertility rate of 149.0 births per 1,000 women, while women with the education attainment of bachelor's degree have the lowest fertility at 25.0 births per 1,000 women. Women with the education attainment of college or associate's degree represent 44.2% of all women with births.
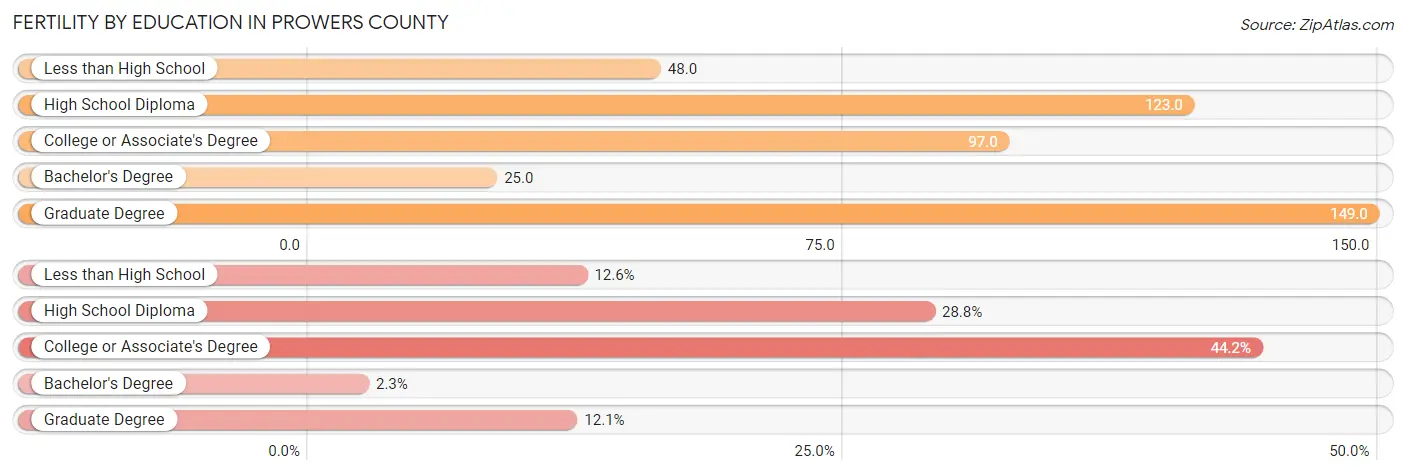
| Educational Attainment | Women with Births | Births / 1,000 Women |
| Less than High School | 27 (12.6%) | 48.0 |
| High School Diploma | 62 (28.8%) | 123.0 |
| College or Associate's Degree | 95 (44.2%) | 97.0 |
| Bachelor's Degree | 5 (2.3%) | 25.0 |
| Graduate Degree | 26 (12.1%) | 149.0 |
| Total | 215 (100.0%) | 89.0 |
Fertility by Education by Marriage Status in Prowers County
17.2% of women with births in Prowers County are unmarried. Women with the educational attainment of bachelor's degree are most likely to be married with 100.0% of them married at childbirth, while women with the educational attainment of less than high school are least likely to be married with 100.0% of them unmarried at childbirth.
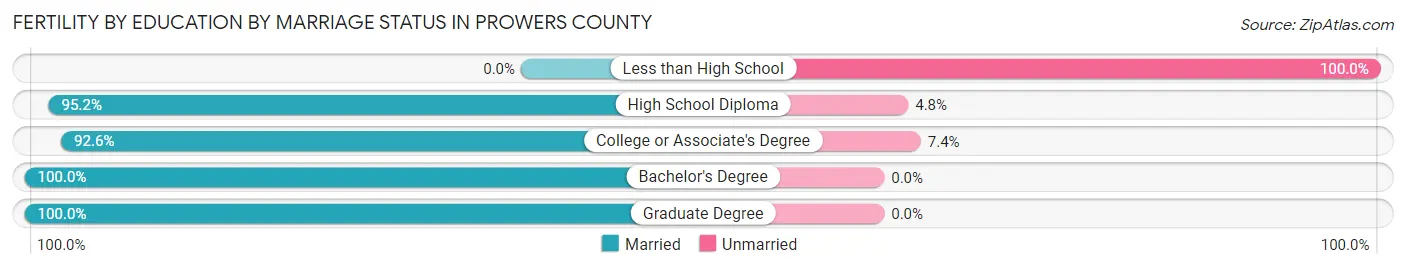
| Educational Attainment | Married | Unmarried |
| Less than High School | 0 (0.0%) | 27 (100.0%) |
| High School Diploma | 59 (95.2%) | 3 (4.8%) |
| College or Associate's Degree | 88 (92.6%) | 7 (7.4%) |
| Bachelor's Degree | 5 (100.0%) | 0 (0.0%) |
| Graduate Degree | 26 (100.0%) | 0 (0.0%) |
| Total | 178 (82.8%) | 37 (17.2%) |
Employment Characteristics in Prowers County
Employment by Class of Employer in Prowers County
Among the 5,353 employed individuals in Prowers County, private company employees (3,081 | 57.6%), local government employees (755 | 14.1%), and self-employed (not incorporated) (503 | 9.4%) make up the most common classes of employment.
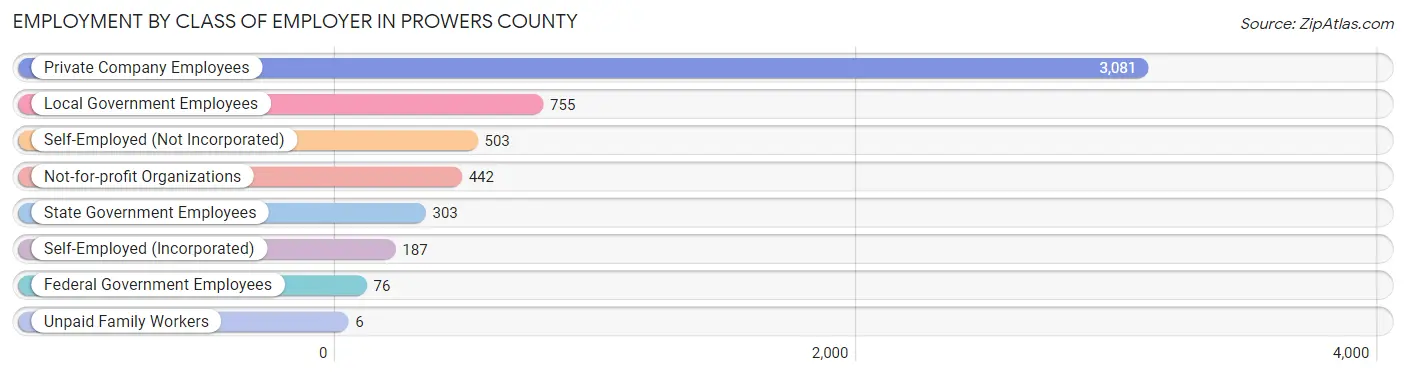
| Employer Class | # Employees | % Employees |
| Private Company Employees | 3,081 | 57.6% |
| Self-Employed (Incorporated) | 187 | 3.5% |
| Self-Employed (Not Incorporated) | 503 | 9.4% |
| Not-for-profit Organizations | 442 | 8.3% |
| Local Government Employees | 755 | 14.1% |
| State Government Employees | 303 | 5.7% |
| Federal Government Employees | 76 | 1.4% |
| Unpaid Family Workers | 6 | 0.1% |
| Total | 5,353 | 100.0% |
Employment Status by Age in Prowers County
According to the labor force statistics for Prowers County, out of the total population over 16 years of age (9,195), 61.2% or 5,627 individuals are in the labor force, with 4.4% or 248 of them unemployed. The age group with the highest labor force participation rate is 20 to 24 years, with 86.1% or 726 individuals in the labor force. Within the labor force, the 16 to 19 years age range has the highest percentage of unemployed individuals, with 13.1% or 56 of them being unemployed.
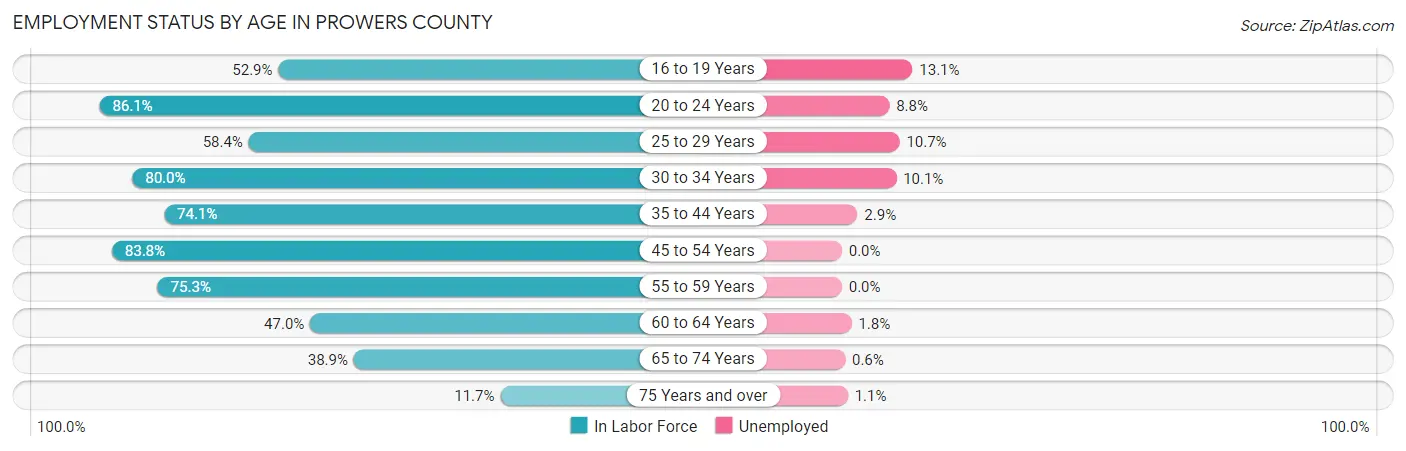
| Age Bracket | In Labor Force | Unemployed |
| 16 to 19 Years | 428 (52.9%) | 56 (13.1%) |
| 20 to 24 Years | 726 (86.1%) | 64 (8.8%) |
| 25 to 29 Years | 337 (58.4%) | 36 (10.7%) |
| 30 to 34 Years | 505 (80.0%) | 51 (10.1%) |
| 35 to 44 Years | 1,026 (74.1%) | 30 (2.9%) |
| 45 to 54 Years | 1,053 (83.8%) | 0 (0.0%) |
| 55 to 59 Years | 548 (75.3%) | 0 (0.0%) |
| 60 to 64 Years | 381 (47.0%) | 7 (1.8%) |
| 65 to 74 Years | 529 (38.9%) | 3 (0.6%) |
| 75 Years and over | 93 (11.7%) | 1 (1.1%) |
| Total | 5,627 (61.2%) | 248 (4.4%) |
Employment Status by Educational Attainment in Prowers County
According to labor force statistics for Prowers County, 71.5% of individuals (3,852) out of the total population between 25 and 64 years of age (5,387) are in the labor force, with 3.2% or 123 of them being unemployed. The group with the highest labor force participation rate are those with the educational attainment of bachelor's degree or higher, with 85.2% or 907 individuals in the labor force. Within the labor force, individuals with less than high school education have the highest percentage of unemployment, with 6.7% or 27 of them being unemployed.
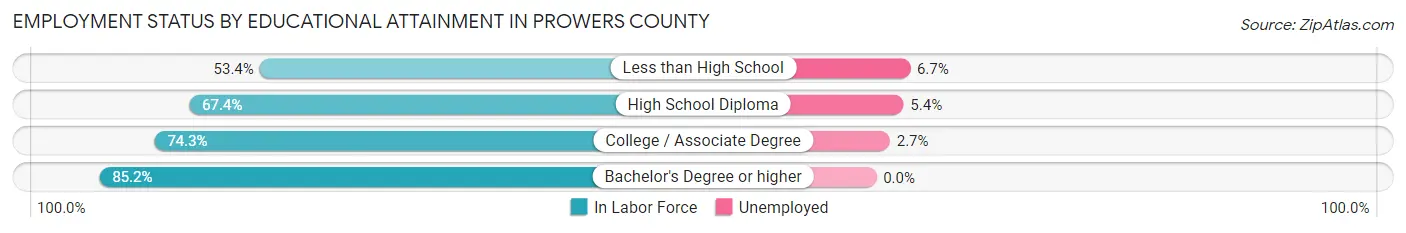
| Educational Attainment | In Labor Force | Unemployed |
| Less than High School | 405 (53.4%) | 51 (6.7%) |
| High School Diploma | 1,076 (67.4%) | 86 (5.4%) |
| College / Associate Degree | 1,463 (74.3%) | 53 (2.7%) |
| Bachelor's Degree or higher | 907 (85.2%) | 0 (0.0%) |
| Total | 3,852 (71.5%) | 172 (3.2%) |
Employment Occupations by Sex in Prowers County
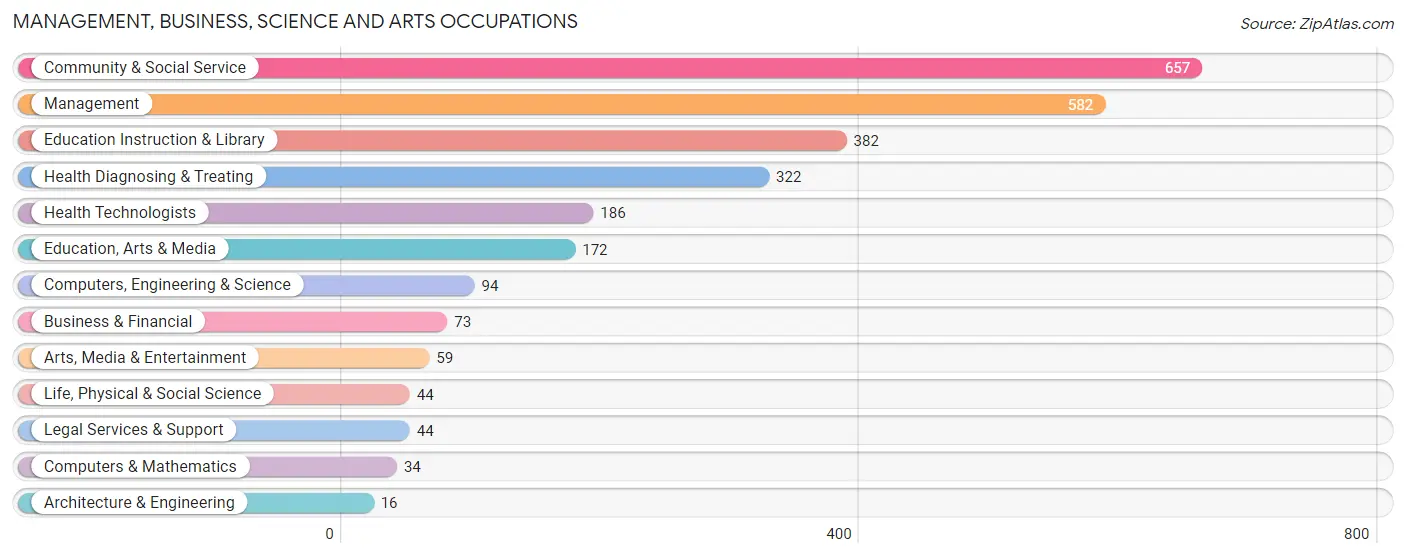
Management, Business, Science and Arts Occupations
The most common Management, Business, Science and Arts occupations in Prowers County are Community & Social Service (657 | 12.2%), Management (582 | 10.8%), Education Instruction & Library (382 | 7.1%), Health Diagnosing & Treating (322 | 6.0%), and Health Technologists (186 | 3.5%).
Management, Business, Science and Arts Occupations by Sex
Within the Management, Business, Science and Arts occupations in Prowers County, the most male-oriented occupations are Computers & Mathematics (100.0%), Arts, Media & Entertainment (86.4%), and Architecture & Engineering (75.0%), while the most female-oriented occupations are Legal Services & Support (100.0%), Life, Physical & Social Science (90.9%), and Education, Arts & Media (84.9%).

| Occupation | Male | Female |
| Management | 385 (66.1%) | 197 (33.9%) |
| Business & Financial | 39 (53.4%) | 34 (46.6%) |
| Computers, Engineering & Science | 50 (53.2%) | 44 (46.8%) |
| Computers & Mathematics | 34 (100.0%) | 0 (0.0%) |
| Architecture & Engineering | 12 (75.0%) | 4 (25.0%) |
| Life, Physical & Social Science | 4 (9.1%) | 40 (90.9%) |
| Community & Social Service | 153 (23.3%) | 504 (76.7%) |
| Education, Arts & Media | 26 (15.1%) | 146 (84.9%) |
| Legal Services & Support | 0 (0.0%) | 44 (100.0%) |
| Education Instruction & Library | 76 (19.9%) | 306 (80.1%) |
| Arts, Media & Entertainment | 51 (86.4%) | 8 (13.6%) |
| Health Diagnosing & Treating | 62 (19.3%) | 260 (80.7%) |
| Health Technologists | 50 (26.9%) | 136 (73.1%) |
| Total (Category) | 689 (39.9%) | 1,039 (60.1%) |
| Total (Overall) | 2,989 (55.6%) | 2,390 (44.4%) |
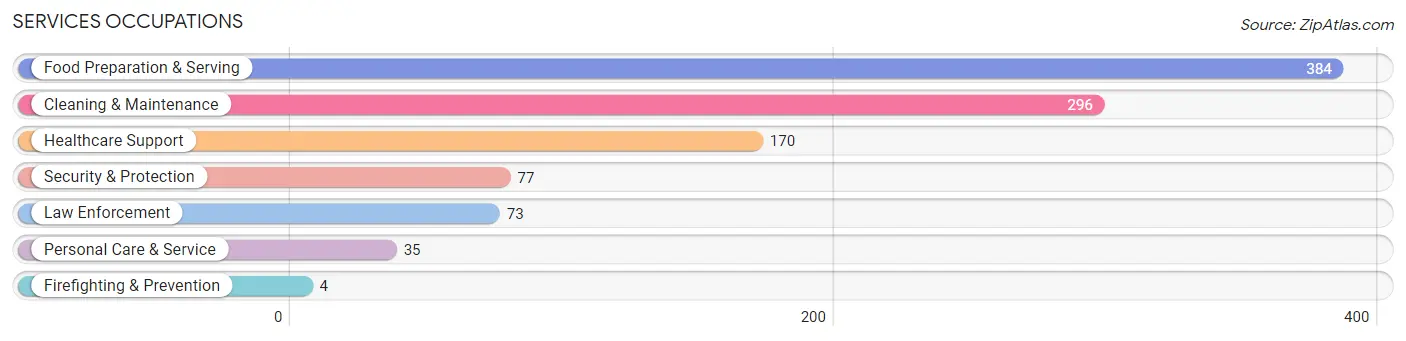
Services Occupations
The most common Services occupations in Prowers County are Food Preparation & Serving (384 | 7.1%), Cleaning & Maintenance (296 | 5.5%), Healthcare Support (170 | 3.2%), Security & Protection (77 | 1.4%), and Law Enforcement (73 | 1.4%).
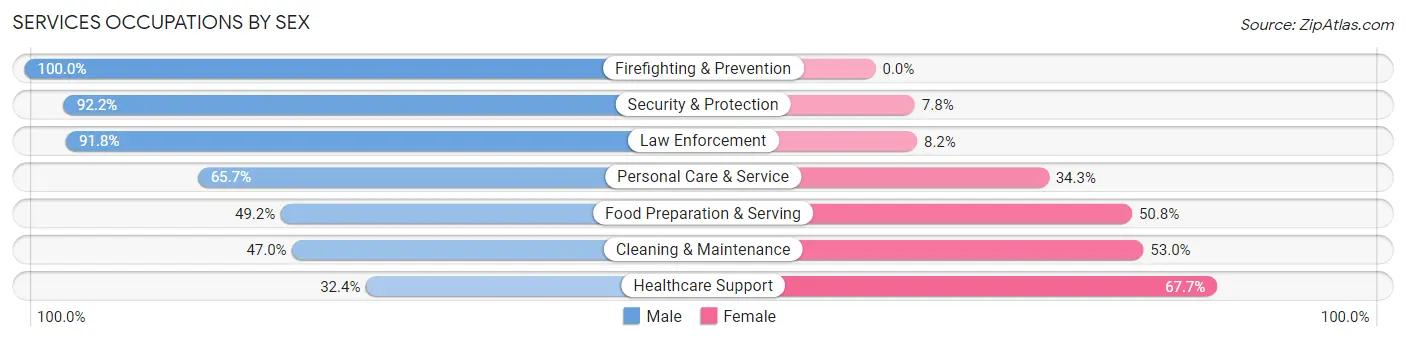
Services Occupations by Sex
Within the Services occupations in Prowers County, the most male-oriented occupations are Firefighting & Prevention (100.0%), Security & Protection (92.2%), and Law Enforcement (91.8%), while the most female-oriented occupations are Healthcare Support (67.6%), Cleaning & Maintenance (53.0%), and Food Preparation & Serving (50.8%).
| Occupation | Male | Female |
| Healthcare Support | 55 (32.4%) | 115 (67.6%) |
| Security & Protection | 71 (92.2%) | 6 (7.8%) |
| Firefighting & Prevention | 4 (100.0%) | 0 (0.0%) |
| Law Enforcement | 67 (91.8%) | 6 (8.2%) |
| Food Preparation & Serving | 189 (49.2%) | 195 (50.8%) |
| Cleaning & Maintenance | 139 (47.0%) | 157 (53.0%) |
| Personal Care & Service | 23 (65.7%) | 12 (34.3%) |
| Total (Category) | 477 (49.6%) | 485 (50.4%) |
| Total (Overall) | 2,989 (55.6%) | 2,390 (44.4%) |
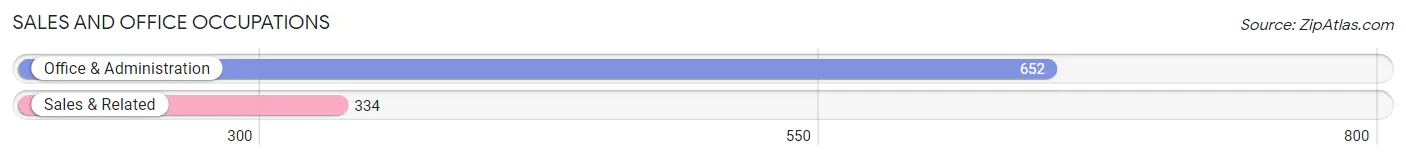
Sales and Office Occupations
The most common Sales and Office occupations in Prowers County are Office & Administration (652 | 12.1%), and Sales & Related (334 | 6.2%).
Sales and Office Occupations by Sex
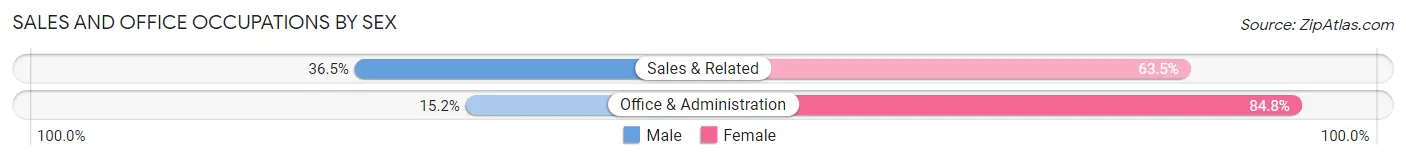
| Occupation | Male | Female |
| Sales & Related | 122 (36.5%) | 212 (63.5%) |
| Office & Administration | 99 (15.2%) | 553 (84.8%) |
| Total (Category) | 221 (22.4%) | 765 (77.6%) |
| Total (Overall) | 2,989 (55.6%) | 2,390 (44.4%) |
Natural Resources, Construction and Maintenance Occupations
The most common Natural Resources, Construction and Maintenance occupations in Prowers County are Construction & Extraction (378 | 7.0%), Farming, Fishing & Forestry (357 | 6.6%), and Installation, Maintenance & Repair (90 | 1.7%).
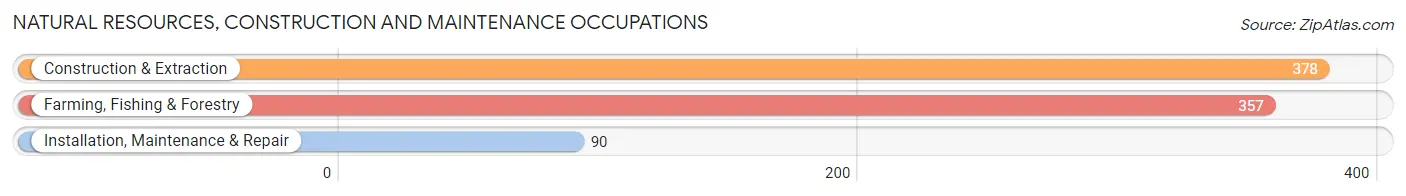
Natural Resources, Construction and Maintenance Occupations by Sex
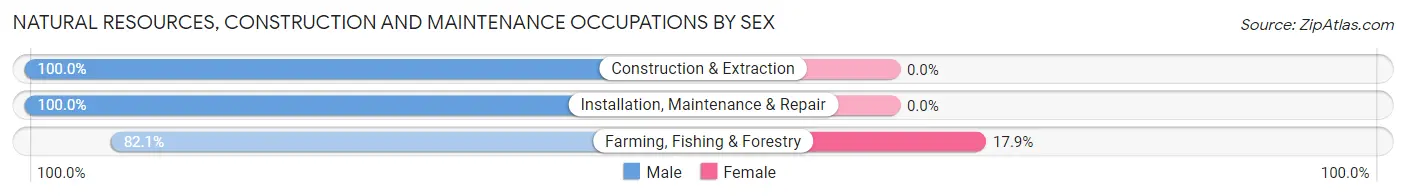
| Occupation | Male | Female |
| Farming, Fishing & Forestry | 293 (82.1%) | 64 (17.9%) |
| Construction & Extraction | 378 (100.0%) | 0 (0.0%) |
| Installation, Maintenance & Repair | 90 (100.0%) | 0 (0.0%) |
| Total (Category) | 761 (92.2%) | 64 (7.8%) |
| Total (Overall) | 2,989 (55.6%) | 2,390 (44.4%) |
Production, Transportation and Moving Occupations
The most common Production, Transportation and Moving occupations in Prowers County are Production (332 | 6.2%), Transportation (293 | 5.4%), and Material Moving (253 | 4.7%).
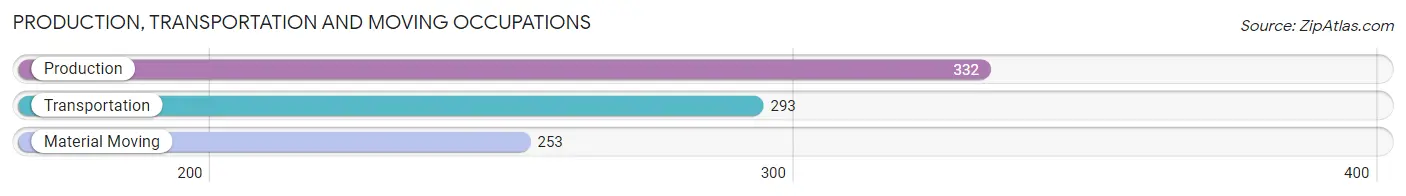
Production, Transportation and Moving Occupations by Sex

| Occupation | Male | Female |
| Production | 312 (94.0%) | 20 (6.0%) |
| Transportation | 293 (100.0%) | 0 (0.0%) |
| Material Moving | 236 (93.3%) | 17 (6.7%) |
| Total (Category) | 841 (95.8%) | 37 (4.2%) |
| Total (Overall) | 2,989 (55.6%) | 2,390 (44.4%) |
Employment Industries by Sex in Prowers County
Employment Industries in Prowers County
The major employment industries in Prowers County include Health Care & Social Assistance (816 | 15.2%), Agriculture, Fishing & Hunting (685 | 12.7%), Educational Services (589 | 11.0%), Retail Trade (563 | 10.5%), and Construction (450 | 8.4%).

Employment Industries by Sex in Prowers County
The Prowers County industries that see more men than women are Mining, Quarrying, & Extraction (100.0%), Transportation & Warehousing (96.5%), and Wholesale Trade (90.9%), whereas the industries that tend to have a higher number of women are Real Estate, Rental & Leasing (92.3%), Health Care & Social Assistance (90.1%), and Arts, Entertainment & Recreation (80.0%).
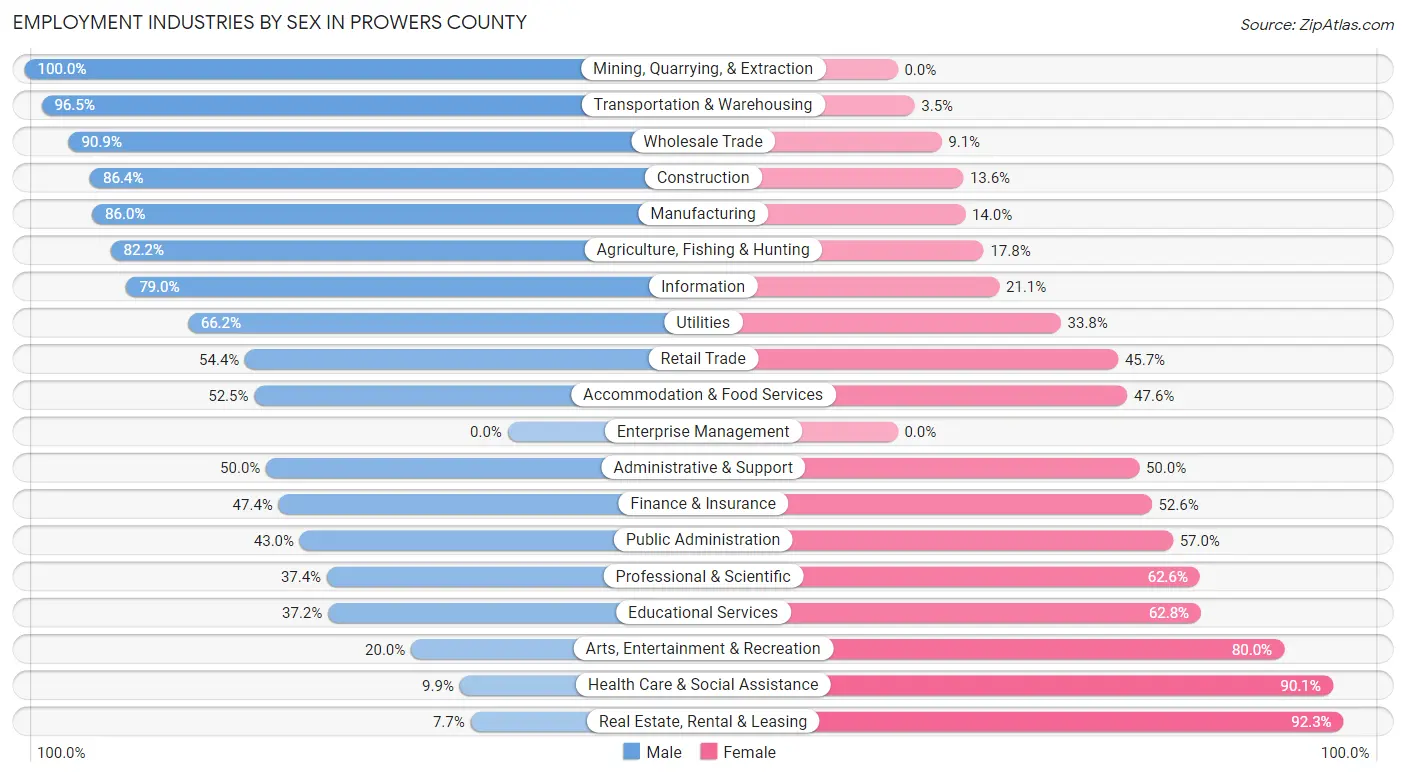
| Industry | Male | Female |
| Agriculture, Fishing & Hunting | 563 (82.2%) | 122 (17.8%) |
| Mining, Quarrying, & Extraction | 70 (100.0%) | 0 (0.0%) |
| Construction | 389 (86.4%) | 61 (13.6%) |
| Manufacturing | 203 (86.0%) | 33 (14.0%) |
| Wholesale Trade | 70 (90.9%) | 7 (9.1%) |
| Retail Trade | 306 (54.3%) | 257 (45.7%) |
| Transportation & Warehousing | 276 (96.5%) | 10 (3.5%) |
| Utilities | 49 (66.2%) | 25 (33.8%) |
| Information | 30 (78.9%) | 8 (21.0%) |
| Finance & Insurance | 55 (47.4%) | 61 (52.6%) |
| Real Estate, Rental & Leasing | 1 (7.7%) | 12 (92.3%) |
| Professional & Scientific | 61 (37.4%) | 102 (62.6%) |
| Enterprise Management | 0 (0.0%) | 0 (0.0%) |
| Administrative & Support | 92 (50.0%) | 92 (50.0%) |
| Educational Services | 219 (37.2%) | 370 (62.8%) |
| Health Care & Social Assistance | 81 (9.9%) | 735 (90.1%) |
| Arts, Entertainment & Recreation | 6 (20.0%) | 24 (80.0%) |
| Accommodation & Food Services | 214 (52.4%) | 194 (47.5%) |
| Public Administration | 151 (43.0%) | 200 (57.0%) |
| Total | 2,989 (55.6%) | 2,390 (44.4%) |
Education in Prowers County
School Enrollment in Prowers County
The most common levels of schooling among the 2,894 students in Prowers County are elementary school (652 | 22.5%), high school (640 | 22.1%), and middle school (511 | 17.7%).
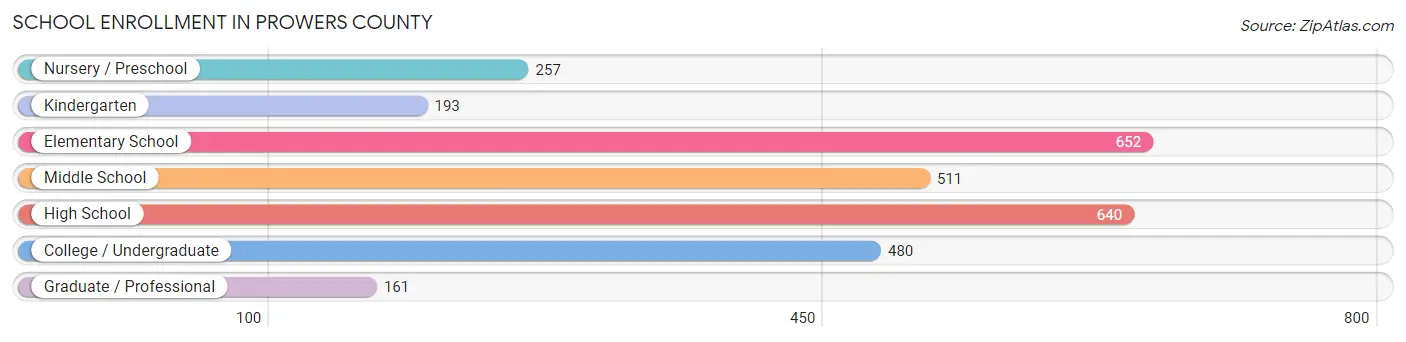
| School Level | # Students | % Students |
| Nursery / Preschool | 257 | 8.9% |
| Kindergarten | 193 | 6.7% |
| Elementary School | 652 | 22.5% |
| Middle School | 511 | 17.7% |
| High School | 640 | 22.1% |
| College / Undergraduate | 480 | 16.6% |
| Graduate / Professional | 161 | 5.6% |
| Total | 2,894 | 100.0% |
School Enrollment by Age by Funding Source in Prowers County
Out of a total of 2,894 students who are enrolled in schools in Prowers County, 182 (6.3%) attend a private institution, while the remaining 2,712 (93.7%) are enrolled in public schools. The age group of 25 to 34 year olds has the highest likelihood of being enrolled in private schools, with 21 (29.2% in the age bracket) enrolled. Conversely, the age group of 5 to 9 year old has the lowest likelihood of being enrolled in a private school, with 848 (98.8% in the age bracket) attending a public institution.
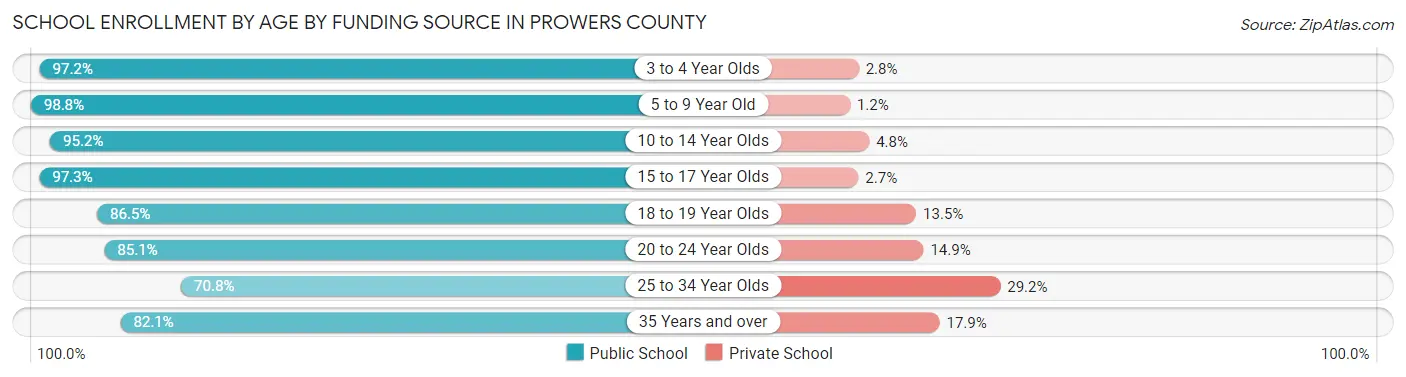
| Age Bracket | Public School | Private School |
| 3 to 4 Year Olds | 104 (97.2%) | 3 (2.8%) |
| 5 to 9 Year Old | 848 (98.8%) | 10 (1.2%) |
| 10 to 14 Year Olds | 640 (95.2%) | 32 (4.8%) |
| 15 to 17 Year Olds | 497 (97.3%) | 14 (2.7%) |
| 18 to 19 Year Olds | 269 (86.5%) | 42 (13.5%) |
| 20 to 24 Year Olds | 166 (85.1%) | 29 (14.9%) |
| 25 to 34 Year Olds | 51 (70.8%) | 21 (29.2%) |
| 35 Years and over | 138 (82.1%) | 30 (17.9%) |
| Total | 2,712 (93.7%) | 182 (6.3%) |
Educational Attainment by Field of Study in Prowers County
Education (319 | 21.3%), liberal arts & history (216 | 14.5%), science & technology (191 | 12.8%), business (176 | 11.8%), and social sciences (141 | 9.4%) are the most common fields of study among 1,494 individuals in Prowers County who have obtained a bachelor's degree or higher.
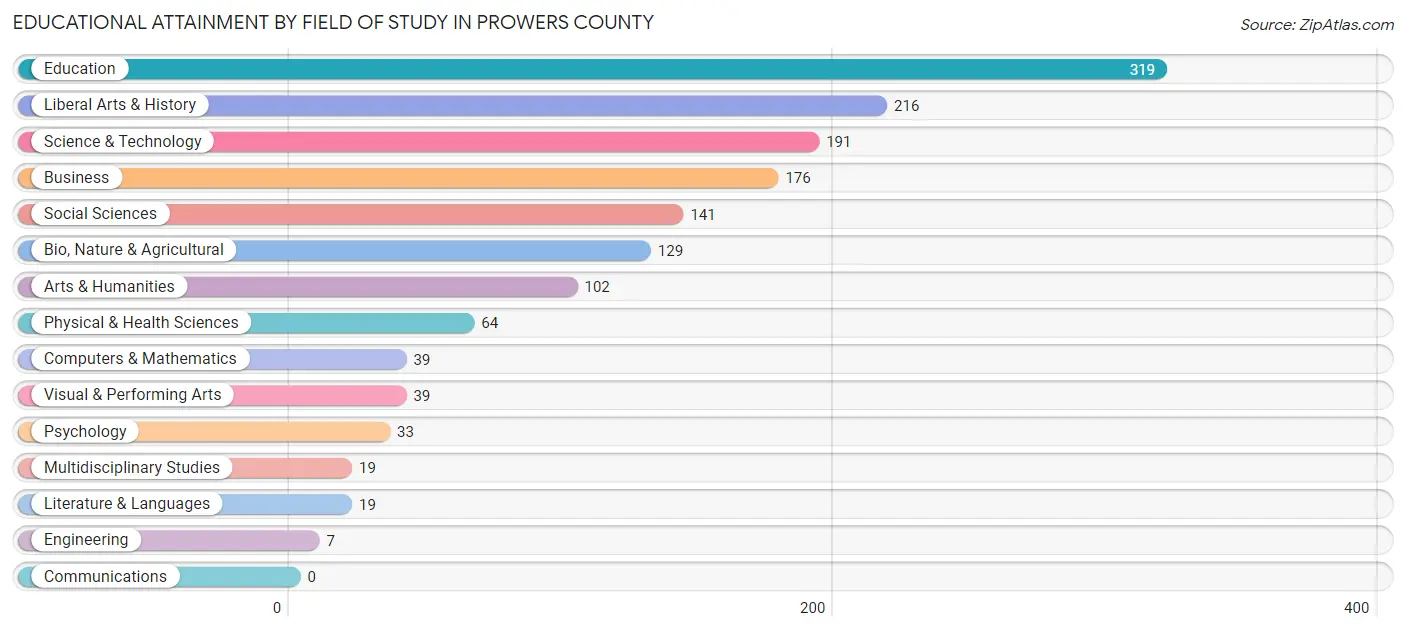
| Field of Study | # Graduates | % Graduates |
| Computers & Mathematics | 39 | 2.6% |
| Bio, Nature & Agricultural | 129 | 8.6% |
| Physical & Health Sciences | 64 | 4.3% |
| Psychology | 33 | 2.2% |
| Social Sciences | 141 | 9.4% |
| Engineering | 7 | 0.5% |
| Multidisciplinary Studies | 19 | 1.3% |
| Science & Technology | 191 | 12.8% |
| Business | 176 | 11.8% |
| Education | 319 | 21.3% |
| Literature & Languages | 19 | 1.3% |
| Liberal Arts & History | 216 | 14.5% |
| Visual & Performing Arts | 39 | 2.6% |
| Communications | 0 | 0.0% |
| Arts & Humanities | 102 | 6.8% |
| Total | 1,494 | 100.0% |
Transportation & Commute in Prowers County
Vehicle Availability by Sex in Prowers County
The most prevalent vehicle ownership categories in Prowers County are males with 2 vehicles (1,235, accounting for 42.3%) and females with 2 vehicles (933, making up 52.7%).
| Vehicles Available | Male | Female |
| No Vehicle | 30 (1.0%) | 10 (0.4%) |
| 1 Vehicle | 536 (18.3%) | 582 (24.8%) |
| 2 Vehicles | 1,235 (42.3%) | 933 (39.8%) |
| 3 Vehicles | 527 (18.0%) | 411 (17.5%) |
| 4 Vehicles | 320 (11.0%) | 220 (9.4%) |
| 5 or more Vehicles | 274 (9.4%) | 187 (8.0%) |
| Total | 2,922 (100.0%) | 2,343 (100.0%) |
Commute Time in Prowers County
The most frequently occuring commute durations in Prowers County are 5 to 9 minutes (2,124 commuters, 42.2%), less than 5 minutes (766 commuters, 15.2%), and 10 to 14 minutes (731 commuters, 14.5%).
| Commute Time | # Commuters | % Commuters |
| Less than 5 Minutes | 766 | 15.2% |
| 5 to 9 Minutes | 2,124 | 42.2% |
| 10 to 14 Minutes | 731 | 14.5% |
| 15 to 19 Minutes | 499 | 9.9% |
| 20 to 24 Minutes | 215 | 4.3% |
| 25 to 29 Minutes | 69 | 1.4% |
| 30 to 34 Minutes | 130 | 2.6% |
| 35 to 39 Minutes | 27 | 0.5% |
| 40 to 44 Minutes | 84 | 1.7% |
| 45 to 59 Minutes | 208 | 4.1% |
| 60 to 89 Minutes | 87 | 1.7% |
| 90 or more Minutes | 94 | 1.9% |
Commute Time by Sex in Prowers County
The most common commute times in Prowers County are 5 to 9 minutes (1,071 commuters, 38.8%) for males and 5 to 9 minutes (1,053 commuters, 46.3%) for females.
| Commute Time | Male | Female |
| Less than 5 Minutes | 465 (16.9%) | 301 (13.2%) |
| 5 to 9 Minutes | 1,071 (38.8%) | 1,053 (46.3%) |
| 10 to 14 Minutes | 416 (15.1%) | 315 (13.9%) |
| 15 to 19 Minutes | 242 (8.8%) | 257 (11.3%) |
| 20 to 24 Minutes | 126 (4.6%) | 89 (3.9%) |
| 25 to 29 Minutes | 56 (2.0%) | 13 (0.6%) |
| 30 to 34 Minutes | 100 (3.6%) | 30 (1.3%) |
| 35 to 39 Minutes | 6 (0.2%) | 21 (0.9%) |
| 40 to 44 Minutes | 44 (1.6%) | 40 (1.8%) |
| 45 to 59 Minutes | 98 (3.5%) | 110 (4.8%) |
| 60 to 89 Minutes | 63 (2.3%) | 24 (1.1%) |
| 90 or more Minutes | 73 (2.6%) | 21 (0.9%) |
Time of Departure to Work by Sex in Prowers County
The most frequent times of departure to work in Prowers County are 7:00 AM to 7:29 AM (477, 17.3%) for males and 7:30 AM to 7:59 AM (512, 22.5%) for females.

| Time of Departure | Male | Female |
| 12:00 AM to 4:59 AM | 217 (7.9%) | 19 (0.8%) |
| 5:00 AM to 5:29 AM | 198 (7.2%) | 28 (1.2%) |
| 5:30 AM to 5:59 AM | 160 (5.8%) | 41 (1.8%) |
| 6:00 AM to 6:29 AM | 268 (9.7%) | 140 (6.2%) |
| 6:30 AM to 6:59 AM | 286 (10.4%) | 94 (4.1%) |
| 7:00 AM to 7:29 AM | 477 (17.3%) | 458 (20.1%) |
| 7:30 AM to 7:59 AM | 305 (11.1%) | 512 (22.5%) |
| 8:00 AM to 8:29 AM | 203 (7.4%) | 486 (21.4%) |
| 8:30 AM to 8:59 AM | 18 (0.6%) | 107 (4.7%) |
| 9:00 AM to 9:59 AM | 214 (7.7%) | 76 (3.3%) |
| 10:00 AM to 10:59 AM | 112 (4.1%) | 120 (5.3%) |
| 11:00 AM to 11:59 AM | 83 (3.0%) | 42 (1.8%) |
| 12:00 PM to 3:59 PM | 47 (1.7%) | 61 (2.7%) |
| 4:00 PM to 11:59 PM | 172 (6.2%) | 90 (4.0%) |
| Total | 2,760 (100.0%) | 2,274 (100.0%) |
Housing Occupancy in Prowers County
Occupancy by Ownership in Prowers County
Of the total 4,507 dwellings in Prowers County, owner-occupied units account for 3,200 (71.0%), while renter-occupied units make up 1,307 (29.0%).
| Occupancy | # Housing Units | % Housing Units |
| Owner Occupied Housing Units | 3,200 | 71.0% |
| Renter-Occupied Housing Units | 1,307 | 29.0% |
| Total Occupied Housing Units | 4,507 | 100.0% |
Occupancy by Household Size in Prowers County

| Household Size | # Housing Units | % Housing Units |
| 1-Person Household | 1,352 | 30.0% |
| 2-Person Household | 1,388 | 30.8% |
| 3-Person Household | 567 | 12.6% |
| 4+ Person Household | 1,200 | 26.6% |
| Total Housing Units | 4,507 | 100.0% |
Occupancy by Ownership by Household Size in Prowers County
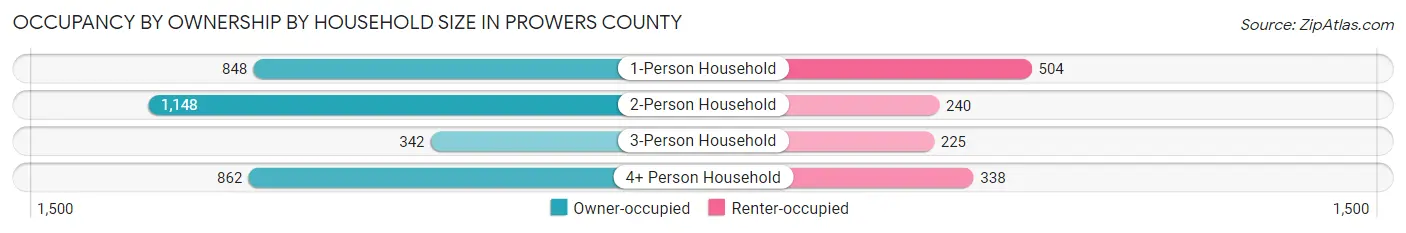
| Household Size | Owner-occupied | Renter-occupied |
| 1-Person Household | 848 (62.7%) | 504 (37.3%) |
| 2-Person Household | 1,148 (82.7%) | 240 (17.3%) |
| 3-Person Household | 342 (60.3%) | 225 (39.7%) |
| 4+ Person Household | 862 (71.8%) | 338 (28.2%) |
| Total Housing Units | 3,200 (71.0%) | 1,307 (29.0%) |
Occupancy by Educational Attainment in Prowers County
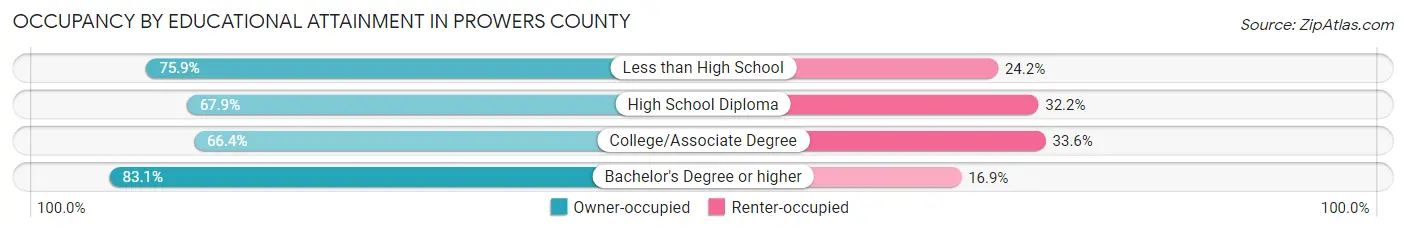
| Household Size | Owner-occupied | Renter-occupied |
| Less than High School | 355 (75.8%) | 113 (24.1%) |
| High School Diploma | 933 (67.8%) | 442 (32.2%) |
| College/Associate Degree | 1,202 (66.4%) | 608 (33.6%) |
| Bachelor's Degree or higher | 710 (83.1%) | 144 (16.9%) |
Occupancy by Age of Householder in Prowers County
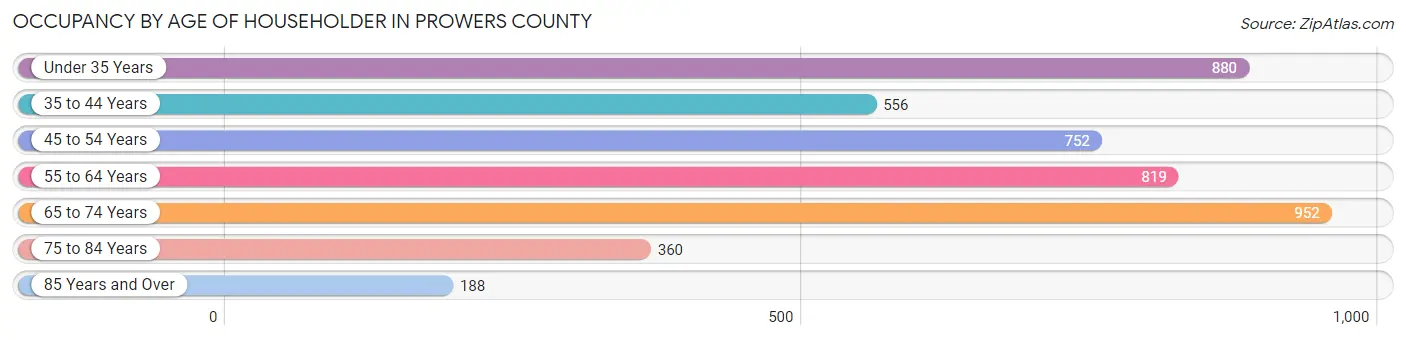
| Age Bracket | # Households | % Households |
| Under 35 Years | 880 | 19.5% |
| 35 to 44 Years | 556 | 12.3% |
| 45 to 54 Years | 752 | 16.7% |
| 55 to 64 Years | 819 | 18.2% |
| 65 to 74 Years | 952 | 21.1% |
| 75 to 84 Years | 360 | 8.0% |
| 85 Years and Over | 188 | 4.2% |
| Total | 4,507 | 100.0% |
Housing Finances in Prowers County
Median Income by Occupancy in Prowers County
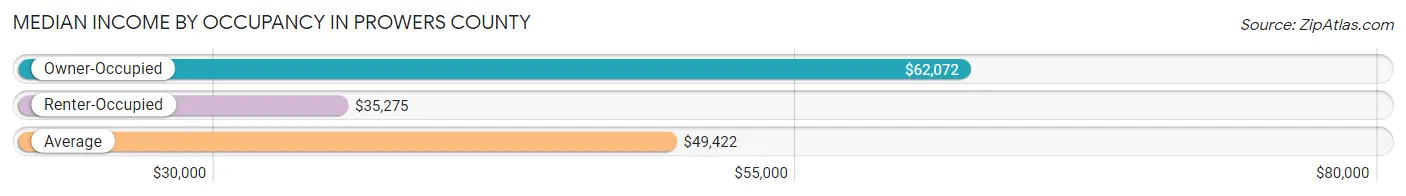
| Occupancy Type | # Households | Median Income |
| Owner-Occupied | 3,200 (71.0%) | $62,072 |
| Renter-Occupied | 1,307 (29.0%) | $35,275 |
| Average | 4,507 (100.0%) | $49,422 |
Occupancy by Householder Income Bracket in Prowers County
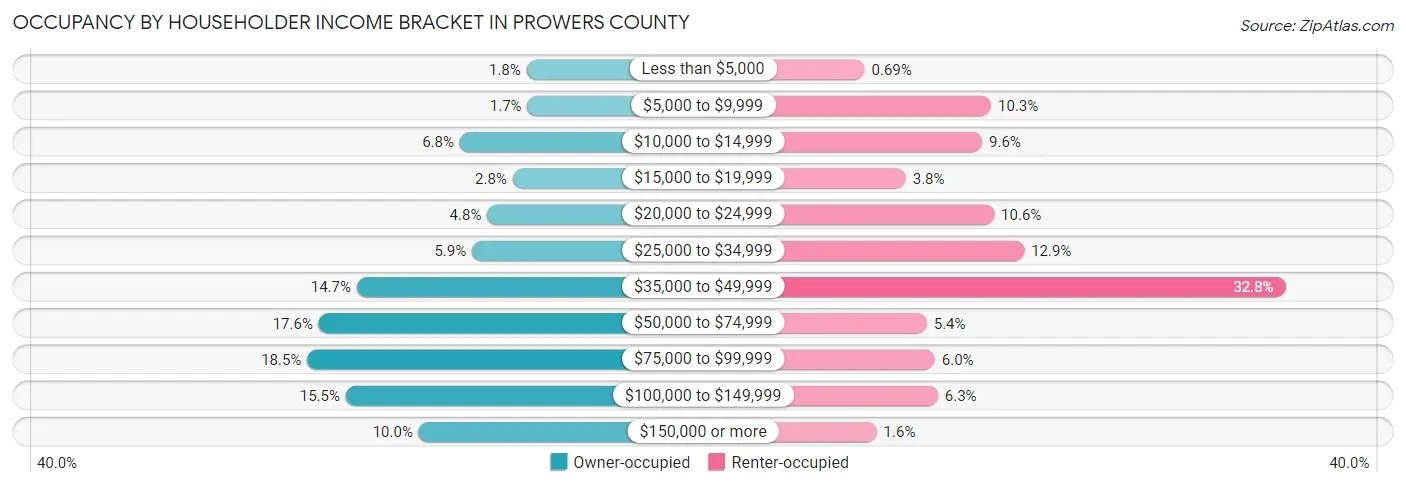
| Income Bracket | Owner-occupied | Renter-occupied |
| Less than $5,000 | 56 (1.8%) | 9 (0.7%) |
| $5,000 to $9,999 | 54 (1.7%) | 135 (10.3%) |
| $10,000 to $14,999 | 219 (6.8%) | 126 (9.6%) |
| $15,000 to $19,999 | 90 (2.8%) | 50 (3.8%) |
| $20,000 to $24,999 | 152 (4.8%) | 138 (10.6%) |
| $25,000 to $34,999 | 189 (5.9%) | 168 (12.9%) |
| $35,000 to $49,999 | 470 (14.7%) | 428 (32.8%) |
| $50,000 to $74,999 | 563 (17.6%) | 71 (5.4%) |
| $75,000 to $99,999 | 591 (18.5%) | 79 (6.0%) |
| $100,000 to $149,999 | 497 (15.5%) | 82 (6.3%) |
| $150,000 or more | 319 (10.0%) | 21 (1.6%) |
| Total | 3,200 (100.0%) | 1,307 (100.0%) |
Monthly Housing Cost Tiers in Prowers County
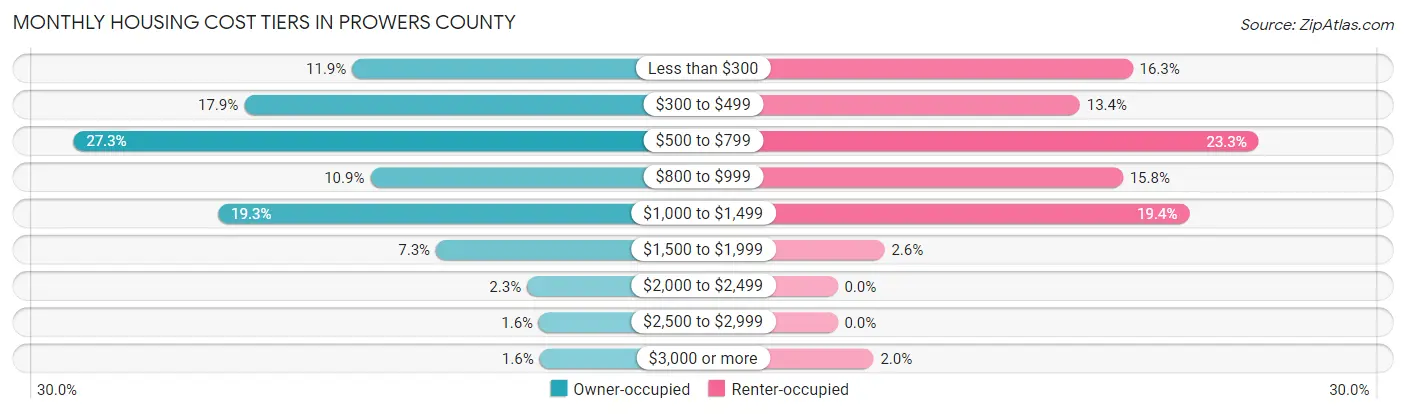
| Monthly Cost | Owner-occupied | Renter-occupied |
| Less than $300 | 381 (11.9%) | 213 (16.3%) |
| $300 to $499 | 572 (17.9%) | 175 (13.4%) |
| $500 to $799 | 874 (27.3%) | 304 (23.3%) |
| $800 to $999 | 349 (10.9%) | 206 (15.8%) |
| $1,000 to $1,499 | 618 (19.3%) | 254 (19.4%) |
| $1,500 to $1,999 | 233 (7.3%) | 34 (2.6%) |
| $2,000 to $2,499 | 72 (2.2%) | 0 (0.0%) |
| $2,500 to $2,999 | 51 (1.6%) | 0 (0.0%) |
| $3,000 or more | 50 (1.6%) | 26 (2.0%) |
| Total | 3,200 (100.0%) | 1,307 (100.0%) |
Physical Housing Characteristics in Prowers County
Housing Structures in Prowers County
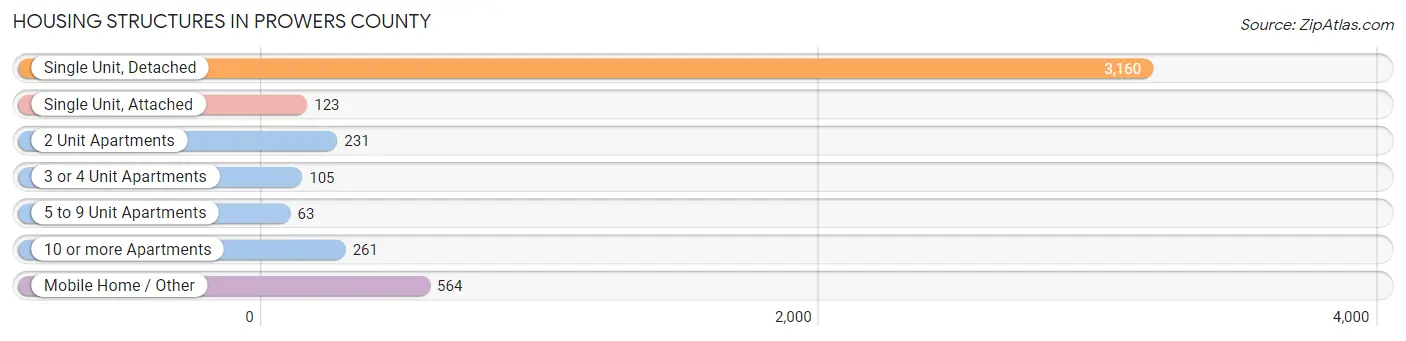
| Structure Type | # Housing Units | % Housing Units |
| Single Unit, Detached | 3,160 | 70.1% |
| Single Unit, Attached | 123 | 2.7% |
| 2 Unit Apartments | 231 | 5.1% |
| 3 or 4 Unit Apartments | 105 | 2.3% |
| 5 to 9 Unit Apartments | 63 | 1.4% |
| 10 or more Apartments | 261 | 5.8% |
| Mobile Home / Other | 564 | 12.5% |
| Total | 4,507 | 100.0% |
Housing Structures by Occupancy in Prowers County
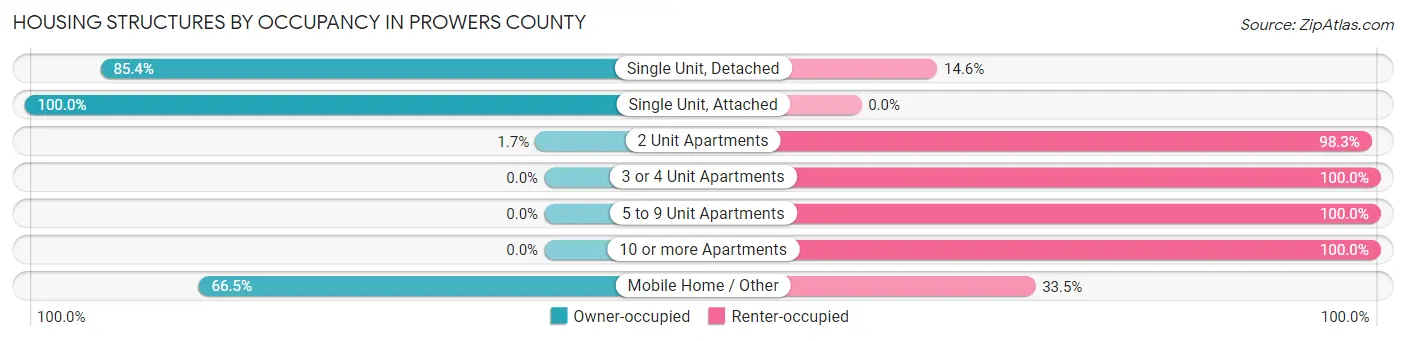
| Structure Type | Owner-occupied | Renter-occupied |
| Single Unit, Detached | 2,698 (85.4%) | 462 (14.6%) |
| Single Unit, Attached | 123 (100.0%) | 0 (0.0%) |
| 2 Unit Apartments | 4 (1.7%) | 227 (98.3%) |
| 3 or 4 Unit Apartments | 0 (0.0%) | 105 (100.0%) |
| 5 to 9 Unit Apartments | 0 (0.0%) | 63 (100.0%) |
| 10 or more Apartments | 0 (0.0%) | 261 (100.0%) |
| Mobile Home / Other | 375 (66.5%) | 189 (33.5%) |
| Total | 3,200 (71.0%) | 1,307 (29.0%) |
Housing Structures by Number of Rooms in Prowers County
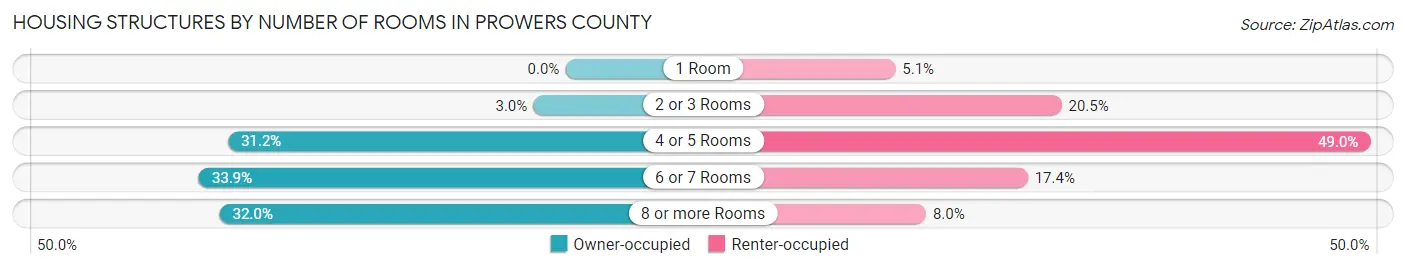
| Number of Rooms | Owner-occupied | Renter-occupied |
| 1 Room | 0 (0.0%) | 67 (5.1%) |
| 2 or 3 Rooms | 95 (3.0%) | 268 (20.5%) |
| 4 or 5 Rooms | 998 (31.2%) | 641 (49.0%) |
| 6 or 7 Rooms | 1,084 (33.9%) | 227 (17.4%) |
| 8 or more Rooms | 1,023 (32.0%) | 104 (8.0%) |
| Total | 3,200 (100.0%) | 1,307 (100.0%) |
Housing Structure by Heating Type in Prowers County
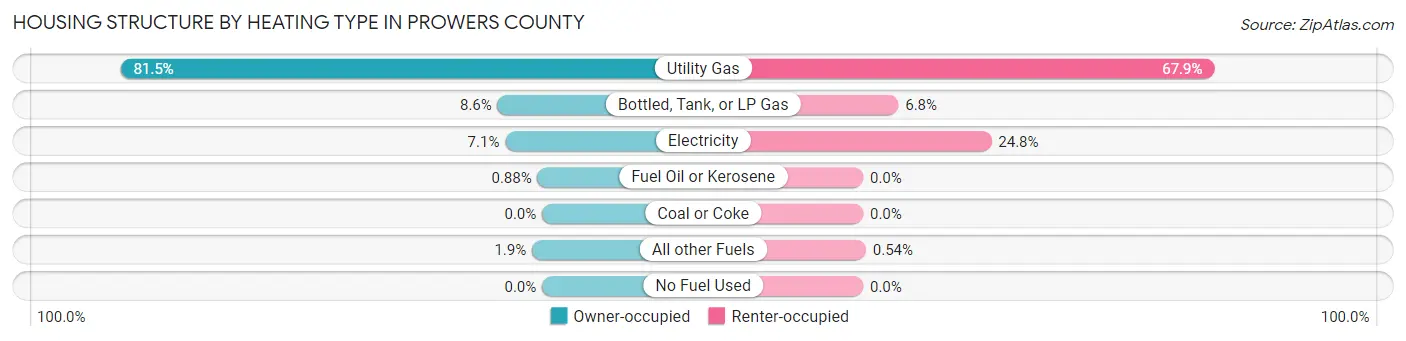
| Heating Type | Owner-occupied | Renter-occupied |
| Utility Gas | 2,607 (81.5%) | 887 (67.9%) |
| Bottled, Tank, or LP Gas | 275 (8.6%) | 89 (6.8%) |
| Electricity | 228 (7.1%) | 324 (24.8%) |
| Fuel Oil or Kerosene | 28 (0.9%) | 0 (0.0%) |
| Coal or Coke | 0 (0.0%) | 0 (0.0%) |
| All other Fuels | 62 (1.9%) | 7 (0.5%) |
| No Fuel Used | 0 (0.0%) | 0 (0.0%) |
| Total | 3,200 (100.0%) | 1,307 (100.0%) |
Household Vehicle Usage in Prowers County
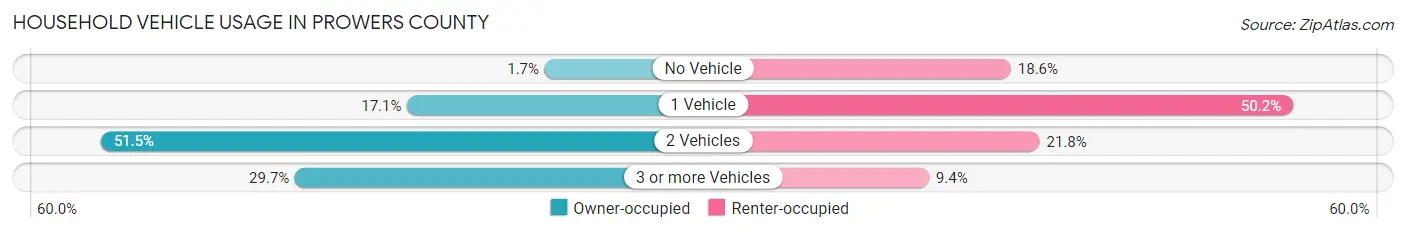
| Vehicles per Household | Owner-occupied | Renter-occupied |
| No Vehicle | 55 (1.7%) | 243 (18.6%) |
| 1 Vehicle | 548 (17.1%) | 656 (50.2%) |
| 2 Vehicles | 1,647 (51.5%) | 285 (21.8%) |
| 3 or more Vehicles | 950 (29.7%) | 123 (9.4%) |
| Total | 3,200 (100.0%) | 1,307 (100.0%) |
Real Estate & Mortgages in Prowers County
Real Estate and Mortgage Overview in Prowers County
| Characteristic | Without Mortgage | With Mortgage |
| Housing Units | 1,680 | 1,520 |
| Median Property Value | $90,400 | $166,300 |
| Median Household Income | $51,096 | $179 |
| Monthly Housing Costs | $459 | $49 |
| Real Estate Taxes | $331 | $62 |
Property Value by Mortgage Status in Prowers County
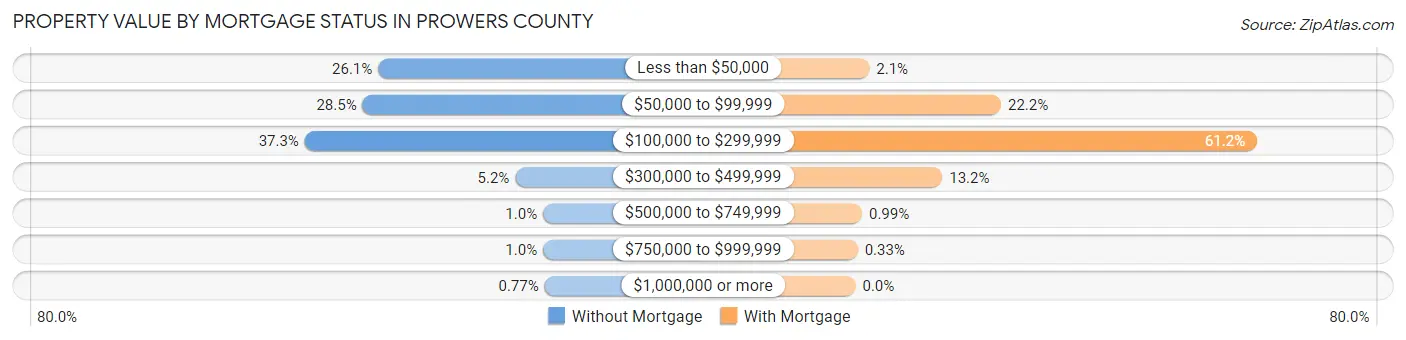
| Property Value | Without Mortgage | With Mortgage |
| Less than $50,000 | 439 (26.1%) | 32 (2.1%) |
| $50,000 to $99,999 | 479 (28.5%) | 337 (22.2%) |
| $100,000 to $299,999 | 627 (37.3%) | 930 (61.2%) |
| $300,000 to $499,999 | 88 (5.2%) | 201 (13.2%) |
| $500,000 to $749,999 | 17 (1.0%) | 15 (1.0%) |
| $750,000 to $999,999 | 17 (1.0%) | 5 (0.3%) |
| $1,000,000 or more | 13 (0.8%) | 0 (0.0%) |
| Total | 1,680 (100.0%) | 1,520 (100.0%) |
Household Income by Mortgage Status in Prowers County
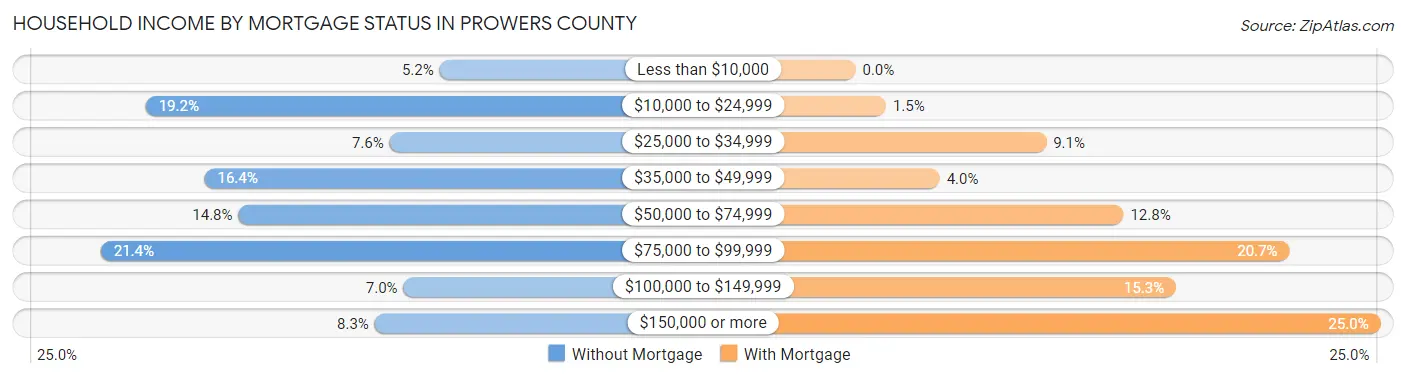
| Household Income | Without Mortgage | With Mortgage |
| Less than $10,000 | 88 (5.2%) | 0 (0.0%) |
| $10,000 to $24,999 | 323 (19.2%) | 22 (1.5%) |
| $25,000 to $34,999 | 128 (7.6%) | 138 (9.1%) |
| $35,000 to $49,999 | 276 (16.4%) | 61 (4.0%) |
| $50,000 to $74,999 | 249 (14.8%) | 194 (12.8%) |
| $75,000 to $99,999 | 359 (21.4%) | 314 (20.7%) |
| $100,000 to $149,999 | 117 (7.0%) | 232 (15.3%) |
| $150,000 or more | 140 (8.3%) | 380 (25.0%) |
| Total | 1,680 (100.0%) | 1,520 (100.0%) |
Property Value to Household Income Ratio in Prowers County
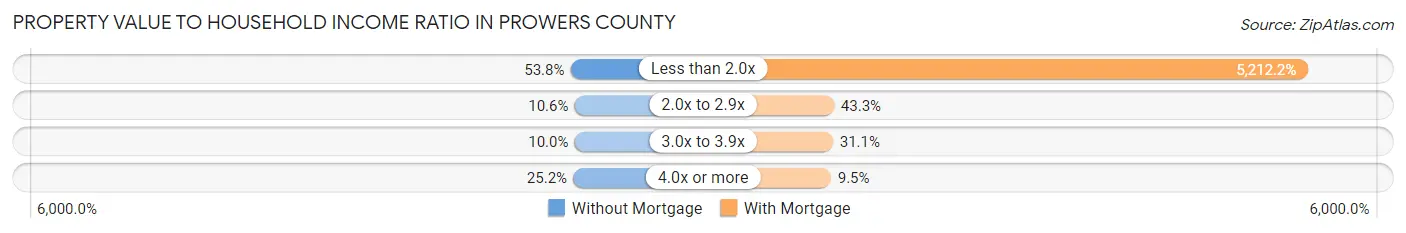
| Value-to-Income Ratio | Without Mortgage | With Mortgage |
| Less than 2.0x | 904 (53.8%) | 79,226 (5,212.2%) |
| 2.0x to 2.9x | 178 (10.6%) | 658 (43.3%) |
| 3.0x to 3.9x | 168 (10.0%) | 473 (31.1%) |
| 4.0x or more | 424 (25.2%) | 145 (9.5%) |
| Total | 1,680 (100.0%) | 1,520 (100.0%) |
Real Estate Taxes by Mortgage Status in Prowers County
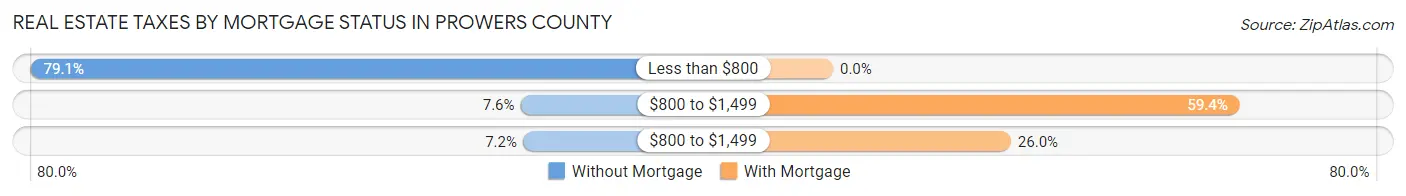
| Property Taxes | Without Mortgage | With Mortgage |
| Less than $800 | 1,329 (79.1%) | 0 (0.0%) |
| $800 to $1,499 | 127 (7.6%) | 903 (59.4%) |
| $800 to $1,499 | 121 (7.2%) | 395 (26.0%) |
| Total | 1,680 (100.0%) | 1,520 (100.0%) |
Health & Disability in Prowers County
Health Insurance Coverage by Age in Prowers County
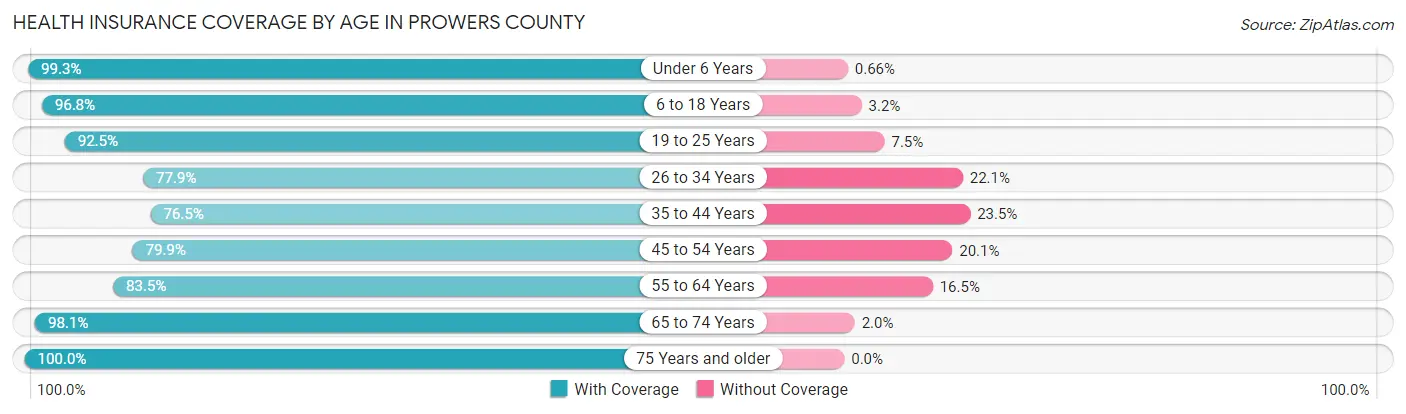
| Age Bracket | With Coverage | Without Coverage |
| Under 6 Years | 1,051 (99.3%) | 7 (0.7%) |
| 6 to 18 Years | 2,304 (96.8%) | 77 (3.2%) |
| 19 to 25 Years | 1,047 (92.5%) | 85 (7.5%) |
| 26 to 34 Years | 811 (77.9%) | 230 (22.1%) |
| 35 to 44 Years | 1,043 (76.5%) | 320 (23.5%) |
| 45 to 54 Years | 999 (79.9%) | 252 (20.1%) |
| 55 to 64 Years | 1,261 (83.5%) | 249 (16.5%) |
| 65 to 74 Years | 1,306 (98.1%) | 26 (1.9%) |
| 75 Years and older | 765 (100.0%) | 0 (0.0%) |
| Total | 10,587 (89.5%) | 1,246 (10.5%) |
Health Insurance Coverage by Citizenship Status in Prowers County
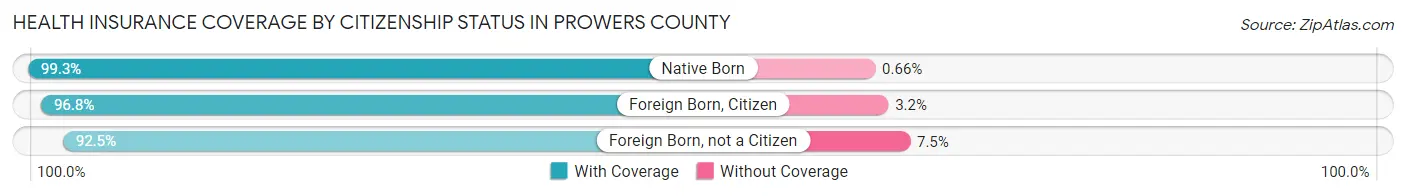
| Citizenship Status | With Coverage | Without Coverage |
| Native Born | 1,051 (99.3%) | 7 (0.7%) |
| Foreign Born, Citizen | 2,304 (96.8%) | 77 (3.2%) |
| Foreign Born, not a Citizen | 1,047 (92.5%) | 85 (7.5%) |
Health Insurance Coverage by Household Income in Prowers County
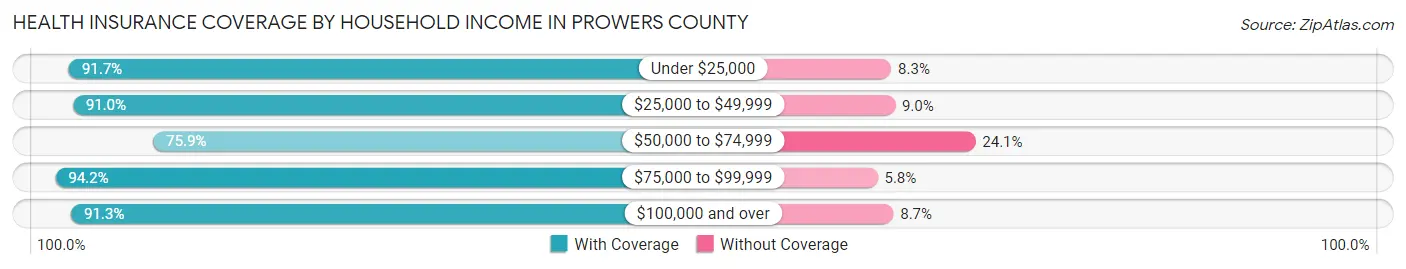
| Household Income | With Coverage | Without Coverage |
| Under $25,000 | 1,610 (91.7%) | 146 (8.3%) |
| $25,000 to $49,999 | 2,599 (91.0%) | 258 (9.0%) |
| $50,000 to $74,999 | 1,383 (75.9%) | 439 (24.1%) |
| $75,000 to $99,999 | 1,800 (94.2%) | 110 (5.8%) |
| $100,000 and over | 2,966 (91.3%) | 283 (8.7%) |
Public vs Private Health Insurance Coverage by Age in Prowers County
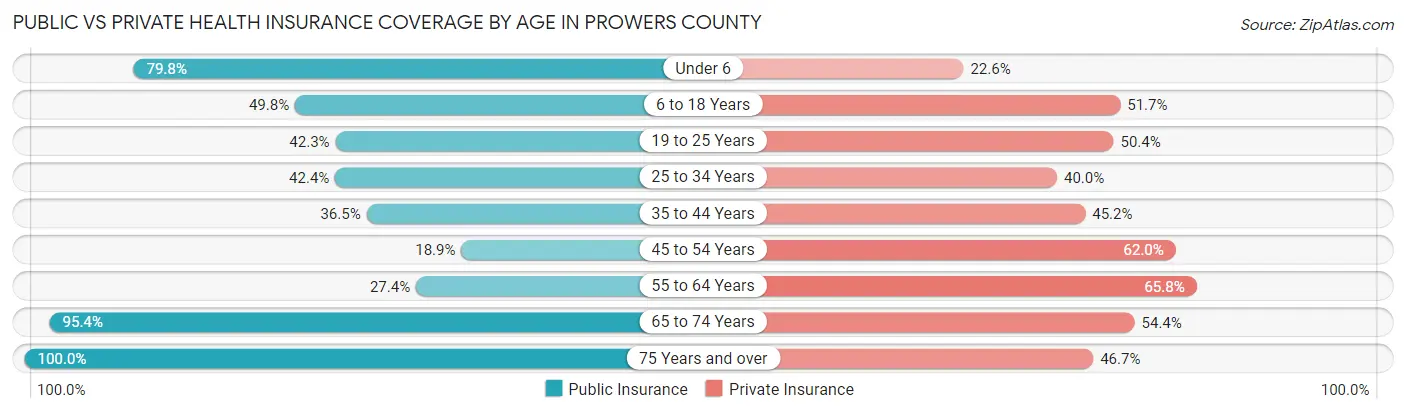
| Age Bracket | Public Insurance | Private Insurance |
| Under 6 | 844 (79.8%) | 239 (22.6%) |
| 6 to 18 Years | 1,186 (49.8%) | 1,231 (51.7%) |
| 19 to 25 Years | 479 (42.3%) | 571 (50.4%) |
| 25 to 34 Years | 441 (42.4%) | 416 (40.0%) |
| 35 to 44 Years | 498 (36.5%) | 616 (45.2%) |
| 45 to 54 Years | 237 (18.9%) | 775 (62.0%) |
| 55 to 64 Years | 413 (27.4%) | 994 (65.8%) |
| 65 to 74 Years | 1,270 (95.4%) | 724 (54.3%) |
| 75 Years and over | 765 (100.0%) | 357 (46.7%) |
| Total | 6,133 (51.8%) | 5,923 (50.0%) |
Disability Status by Sex by Age in Prowers County
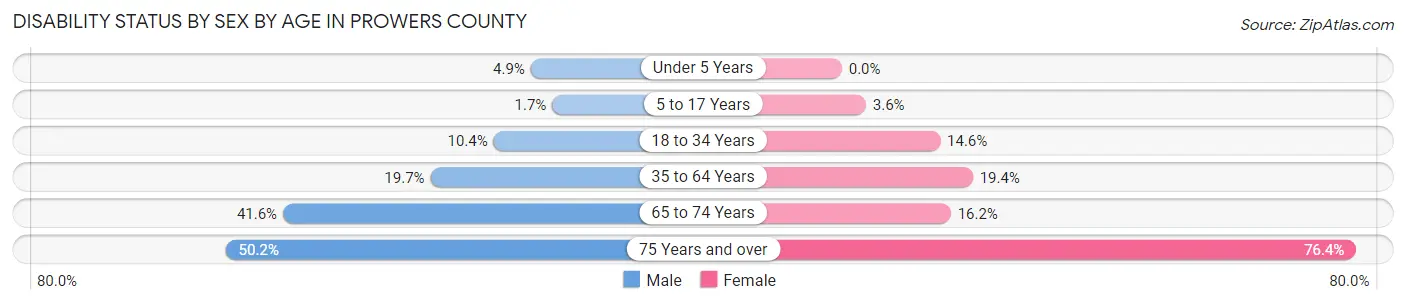
| Age Bracket | Male | Female |
| Under 5 Years | 19 (4.9%) | 0 (0.0%) |
| 5 to 17 Years | 20 (1.7%) | 40 (3.6%) |
| 18 to 34 Years | 137 (10.4%) | 171 (14.6%) |
| 35 to 64 Years | 409 (19.7%) | 399 (19.4%) |
| 65 to 74 Years | 274 (41.6%) | 109 (16.2%) |
| 75 Years and over | 165 (50.1%) | 333 (76.4%) |
Disability Class by Sex by Age in Prowers County
Disability Class: Hearing Difficulty
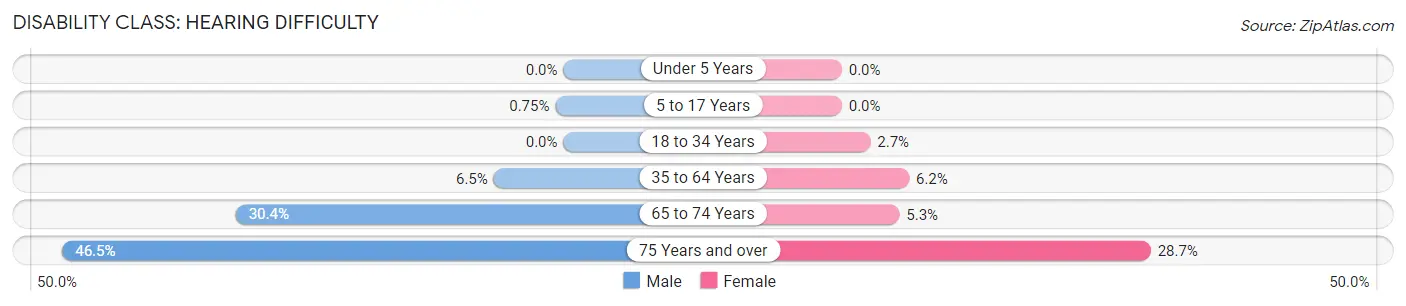
| Age Bracket | Male | Female |
| Under 5 Years | 0 (0.0%) | 0 (0.0%) |
| 5 to 17 Years | 9 (0.7%) | 0 (0.0%) |
| 18 to 34 Years | 0 (0.0%) | 31 (2.6%) |
| 35 to 64 Years | 134 (6.5%) | 128 (6.2%) |
| 65 to 74 Years | 200 (30.4%) | 36 (5.3%) |
| 75 Years and over | 153 (46.5%) | 125 (28.7%) |
Disability Class: Vision Difficulty
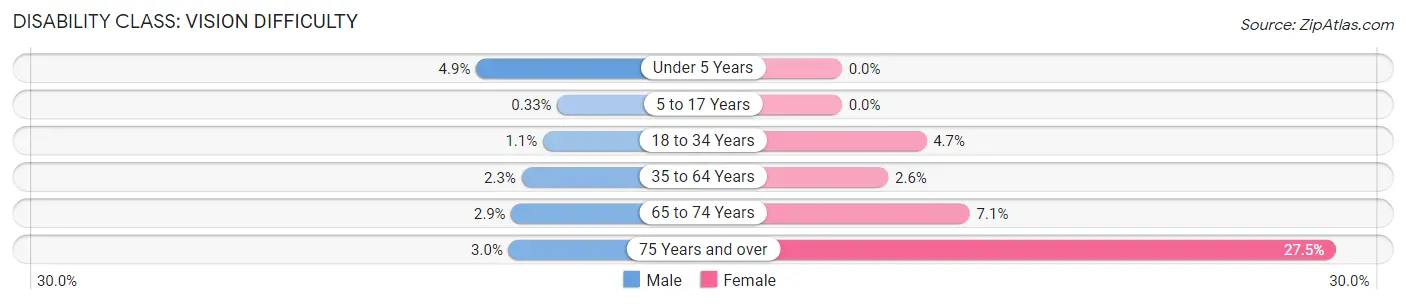
| Age Bracket | Male | Female |
| Under 5 Years | 19 (4.9%) | 0 (0.0%) |
| 5 to 17 Years | 4 (0.3%) | 0 (0.0%) |
| 18 to 34 Years | 15 (1.1%) | 55 (4.7%) |
| 35 to 64 Years | 48 (2.3%) | 53 (2.6%) |
| 65 to 74 Years | 19 (2.9%) | 48 (7.1%) |
| 75 Years and over | 10 (3.0%) | 120 (27.5%) |
Disability Class: Cognitive Difficulty
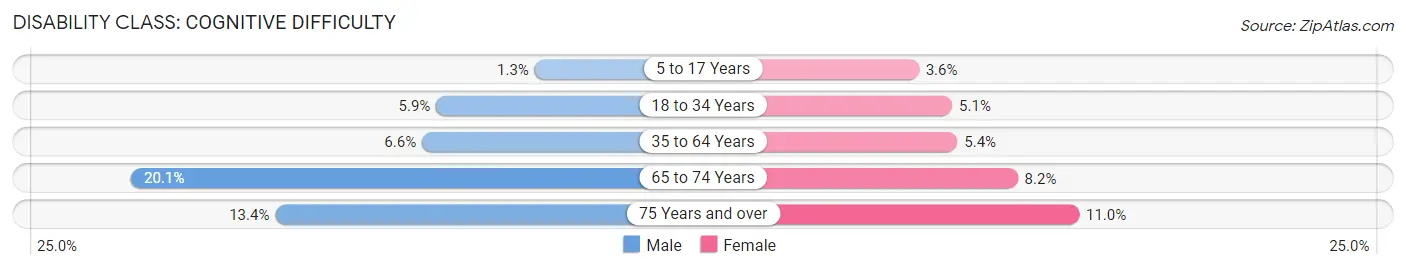
| Age Bracket | Male | Female |
| 5 to 17 Years | 16 (1.3%) | 40 (3.6%) |
| 18 to 34 Years | 78 (5.9%) | 60 (5.1%) |
| 35 to 64 Years | 136 (6.6%) | 110 (5.4%) |
| 65 to 74 Years | 132 (20.1%) | 55 (8.2%) |
| 75 Years and over | 44 (13.4%) | 48 (11.0%) |
Disability Class: Ambulatory Difficulty
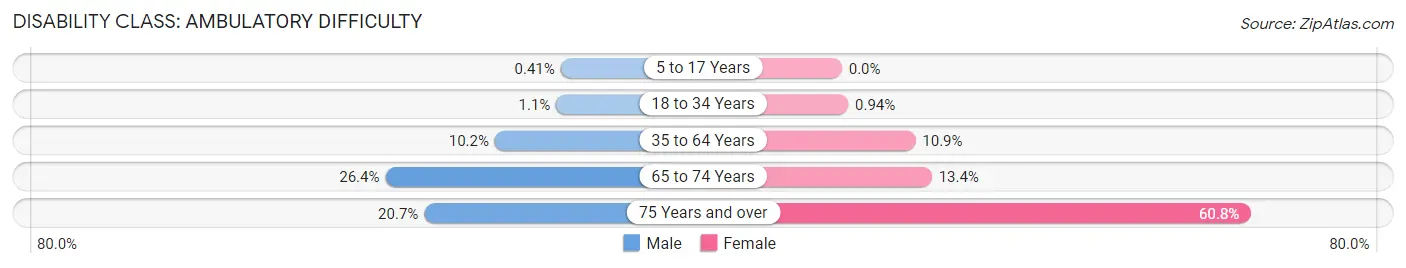
| Age Bracket | Male | Female |
| 5 to 17 Years | 5 (0.4%) | 0 (0.0%) |
| 18 to 34 Years | 14 (1.1%) | 11 (0.9%) |
| 35 to 64 Years | 211 (10.2%) | 224 (10.9%) |
| 65 to 74 Years | 174 (26.4%) | 90 (13.4%) |
| 75 Years and over | 68 (20.7%) | 265 (60.8%) |
Disability Class: Self-Care Difficulty
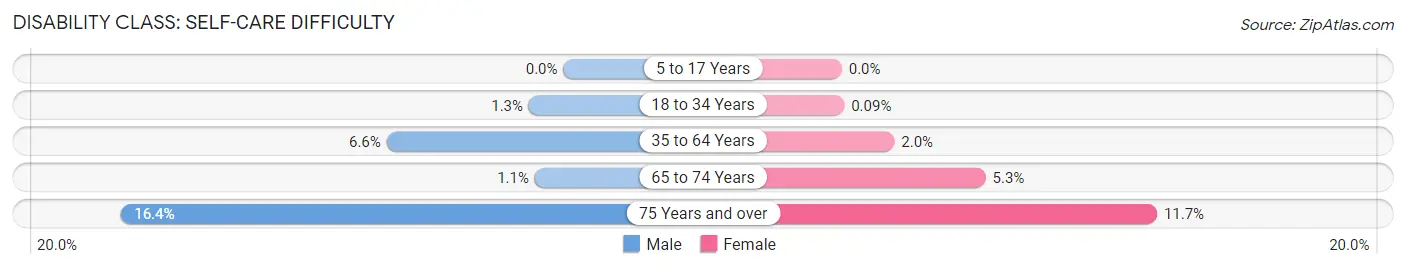
| Age Bracket | Male | Female |
| 5 to 17 Years | 0 (0.0%) | 0 (0.0%) |
| 18 to 34 Years | 17 (1.3%) | 1 (0.1%) |
| 35 to 64 Years | 136 (6.6%) | 40 (1.9%) |
| 65 to 74 Years | 7 (1.1%) | 36 (5.3%) |
| 75 Years and over | 54 (16.4%) | 51 (11.7%) |
Technology Access in Prowers County
Computing Device Access in Prowers County
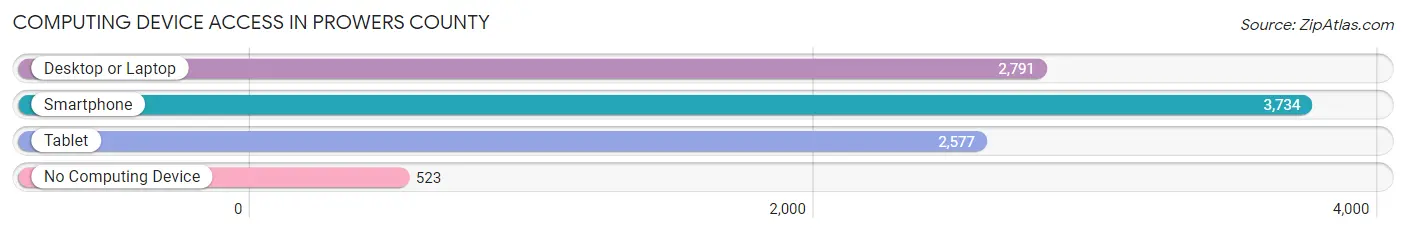
| Device Type | # Households | % Households |
| Desktop or Laptop | 2,791 | 61.9% |
| Smartphone | 3,734 | 82.9% |
| Tablet | 2,577 | 57.2% |
| No Computing Device | 523 | 11.6% |
| Total | 4,507 | 100.0% |
Internet Access in Prowers County
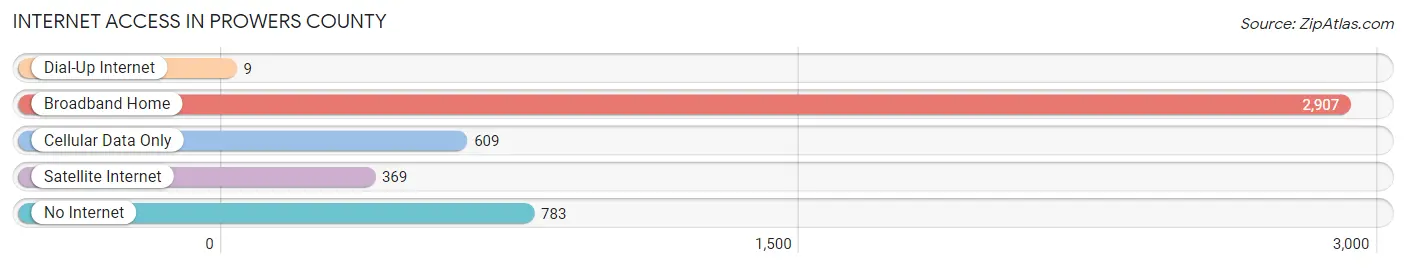
| Internet Type | # Households | % Households |
| Dial-Up Internet | 9 | 0.2% |
| Broadband Home | 2,907 | 64.5% |
| Cellular Data Only | 609 | 13.5% |
| Satellite Internet | 369 | 8.2% |
| No Internet | 783 | 17.4% |
| Total | 4,507 | 100.0% |
Prowers County Summary
Prowers County is located in the southeastern corner of Colorado, and is bordered by Kansas to the east, Baca County to the north, Bent County to the west, and Oklahoma to the south. The county seat is Lamar, and the county has a total area of 1,643 square miles. As of the 2010 census, the population was 12,551.
History
Prowers County was established in 1889 from part of Bent County. It was named for John W. Prowers, a prominent rancher and businessman in the area. The county was originally populated by Native American tribes, including the Cheyenne, Arapaho, and Kiowa.
In the late 19th century, the area was settled by ranchers and farmers, and the county was organized in 1889. The county seat was established in Lamar, and the county was officially incorporated in 1890.
Geography
Prowers County is located in the southeastern corner of Colorado, and is bordered by Kansas to the east, Baca County to the north, Bent County to the west, and Oklahoma to the south. The county has a total area of 1,643 square miles, and is mostly flat, with some rolling hills in the western part of the county. The Arkansas River runs through the county, and there are several small lakes and reservoirs in the area.
The county is mostly rural, with the majority of the population living in the county seat of Lamar. Other towns in the county include Granada, Holly, and Wiley.
Economy
The economy of Prowers County is largely based on agriculture, with wheat, corn, and sorghum being the main crops. Cattle ranching is also an important part of the economy, and there are several large feedlots in the area.
The county is also home to several manufacturing companies, including a large meatpacking plant in Lamar. The county is also home to several oil and gas companies, and there are several wind farms in the area.
Demographics
As of the 2010 census, the population of Prowers County was 12,551. The population is mostly white (87.3%), with small percentages of Hispanic (7.3%), African American (1.2%), and Native American (1.1%) populations.
The median household income in the county is $41,945, and the median home value is $97,400. The unemployment rate is 4.2%, and the poverty rate is 13.3%.
Conclusion
Prowers County is located in the southeastern corner of Colorado, and is bordered by Kansas to the east, Baca County to the north, Bent County to the west, and Oklahoma to the south. The county has a total area of 1,643 square miles, and is mostly rural, with the majority of the population living in the county seat of Lamar. The economy of Prowers County is largely based on agriculture, with wheat, corn, and sorghum being the main crops. Cattle ranching is also an important part of the economy, and there are several large feedlots in the area. As of the 2010 census, the population of Prowers County was 12,551, and the median household income is $41,945.
Common Questions
What is Per Capita Income in Prowers County?
Per Capita income in Prowers County is $29,026.
What is the Median Family Income in Prowers County?
Median Family Income in Prowers County is $61,755.
What is the Median Household income in Prowers County?
Median Household Income in Prowers County is $49,422.
What is Income or Wage Gap in Prowers County?
Income or Wage Gap in Prowers County is 9.8%.
Women in Prowers County earn 90.2 cents for every dollar earned by a man.
What is Inequality or Gini Index in Prowers County?
Inequality or Gini Index in Prowers County is 0.50.
What is the Total Population of Prowers County?
Total Population of Prowers County is 11,968.
What is the Total Male Population of Prowers County?
Total Male Population of Prowers County is 6,079.
What is the Total Female Population of Prowers County?
Total Female Population of Prowers County is 5,889.
What is the Ratio of Males per 100 Females in Prowers County?
There are 103.23 Males per 100 Females in Prowers County.
What is the Ratio of Females per 100 Males in Prowers County?
There are 96.87 Females per 100 Males in Prowers County.
What is the Median Population Age in Prowers County?
Median Population Age in Prowers County is 37.8 Years.
What is the Average Family Size in Prowers County
Average Family Size in Prowers County is 3.2 People.
What is the Average Household Size in Prowers County
Average Household Size in Prowers County is 2.6 People.
How Large is the Labor Force in Prowers County?
There are 5,627 People in the Labor Forcein in Prowers County.
What is the Percentage of People in the Labor Force in Prowers County?
61.2% of People are in the Labor Force in Prowers County.
What is the Unemployment Rate in Prowers County?
Unemployment Rate in Prowers County is 4.4%.