Phillips County, CO Map & Demographics
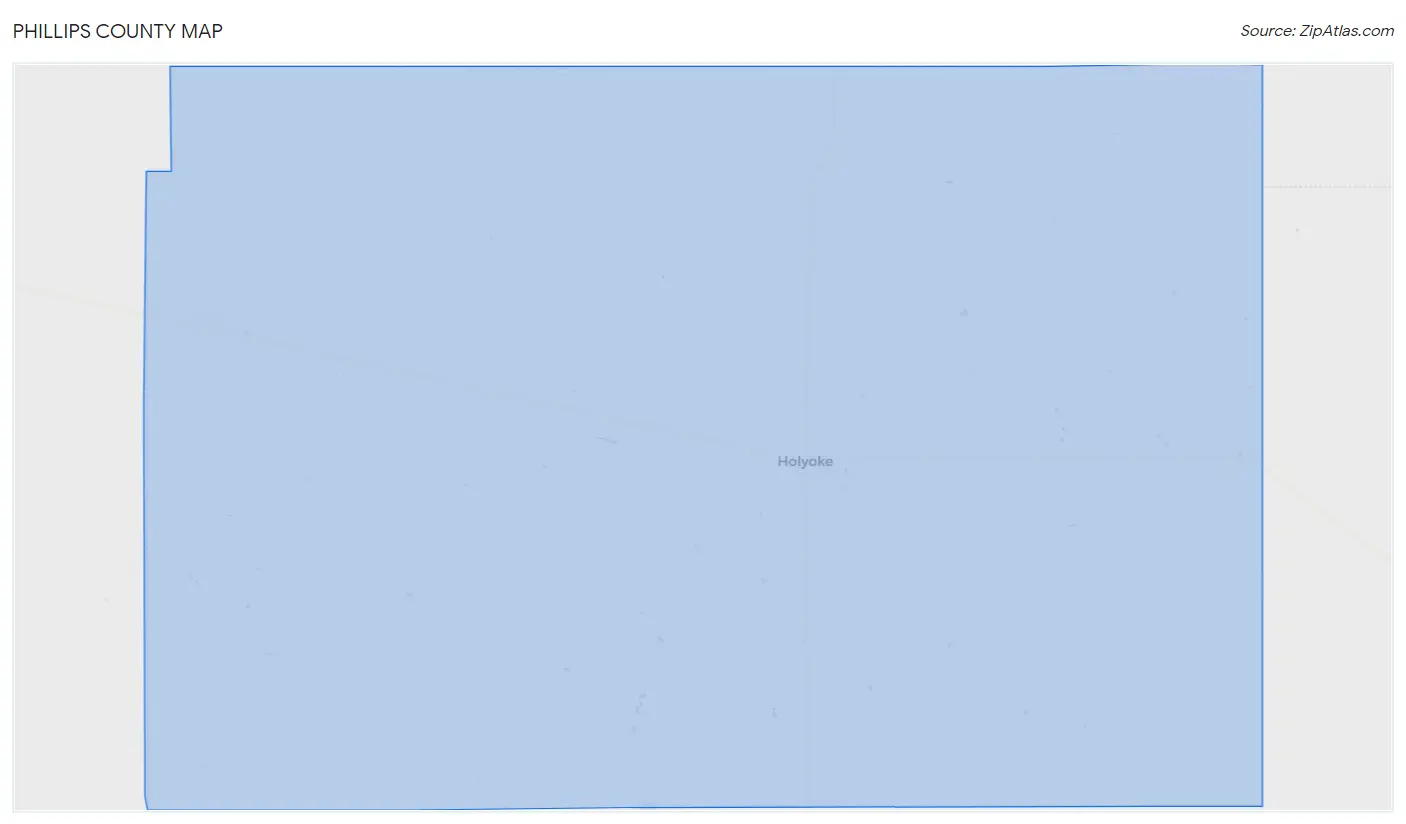
Phillips County Map
Phillips County Overview
$37,996
PER CAPITA INCOME
$69,659
AVG FAMILY INCOME
$58,474
AVG HOUSEHOLD INCOME
35.5%
WAGE / INCOME GAP [ % ]
64.5¢/ $1
WAGE / INCOME GAP [ $ ]
$6,810
FAMILY INCOME DEFICIT
0.51
INEQUALITY / GINI INDEX
4,493
TOTAL POPULATION
2,203
MALE POPULATION
2,290
FEMALE POPULATION
96.20
MALES / 100 FEMALES
103.95
FEMALES / 100 MALES
40.6
MEDIAN AGE
3.2
AVG FAMILY SIZE
2.5
AVG HOUSEHOLD SIZE
2,104
LABOR FORCE [ PEOPLE ]
61.6%
PERCENT IN LABOR FORCE
1.4%
UNEMPLOYMENT RATE
Phillips County Area Codes
Income in Phillips County
Income Overview in Phillips County
Per Capita Income in Phillips County is $37,996, while median incomes of families and households are $69,659 and $58,474 respectively.
| Characteristic | Number | Measure |
| Per Capita Income | 4,493 | $37,996 |
| Median Family Income | 1,179 | $69,659 |
| Mean Family Income | 1,179 | $113,923 |
| Median Household Income | 1,760 | $58,474 |
| Mean Household Income | 1,760 | $93,678 |
| Income Deficit | 1,179 | $6,810 |
| Wage / Income Gap (%) | 4,493 | 35.45% |
| Wage / Income Gap ($) | 4,493 | 64.55¢ per $1 |
| Gini / Inequality Index | 4,493 | 0.51 |
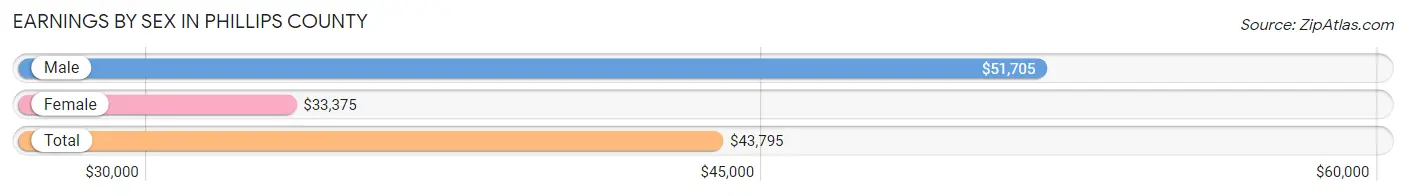
Earnings by Sex in Phillips County
Average Earnings in Phillips County are $43,795, $51,705 for men and $33,375 for women, a difference of 35.4%.
| Sex | Number | Average Earnings |
| Male | 1,310 (56.9%) | $51,705 |
| Female | 994 (43.1%) | $33,375 |
| Total | 2,304 (100.0%) | $43,795 |
Earnings by Sex by Income Bracket in Phillips County
The most common earnings brackets in Phillips County are $55,000 to $64,999 for men (220 | 16.8%) and $10,000 to $12,499 for women (105 | 10.6%).
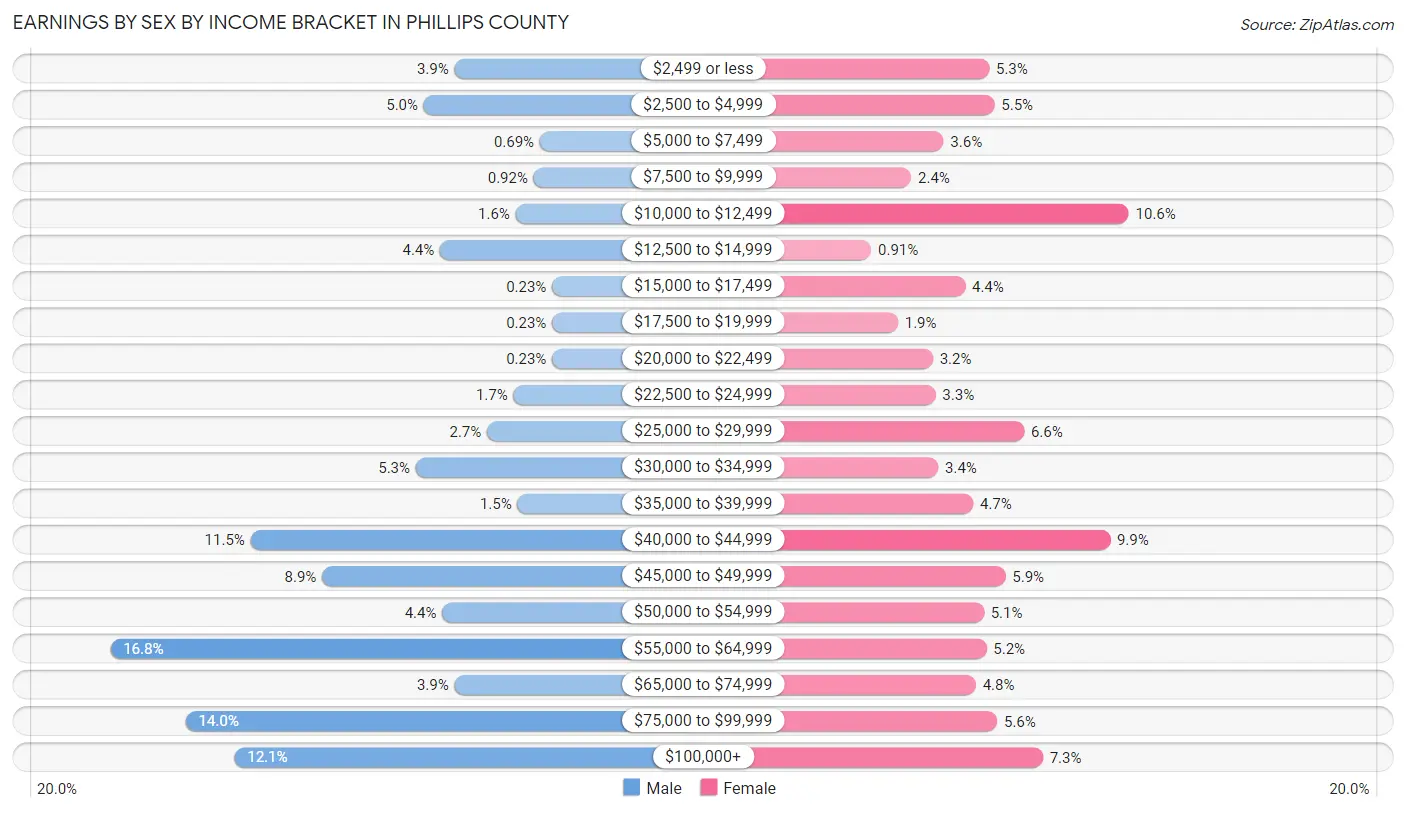
| Income | Male | Female |
| $2,499 or less | 51 (3.9%) | 53 (5.3%) |
| $2,500 to $4,999 | 66 (5.0%) | 55 (5.5%) |
| $5,000 to $7,499 | 9 (0.7%) | 36 (3.6%) |
| $7,500 to $9,999 | 12 (0.9%) | 24 (2.4%) |
| $10,000 to $12,499 | 21 (1.6%) | 105 (10.6%) |
| $12,500 to $14,999 | 58 (4.4%) | 9 (0.9%) |
| $15,000 to $17,499 | 3 (0.2%) | 44 (4.4%) |
| $17,500 to $19,999 | 3 (0.2%) | 19 (1.9%) |
| $20,000 to $22,499 | 3 (0.2%) | 32 (3.2%) |
| $22,500 to $24,999 | 22 (1.7%) | 33 (3.3%) |
| $25,000 to $29,999 | 35 (2.7%) | 66 (6.6%) |
| $30,000 to $34,999 | 70 (5.3%) | 34 (3.4%) |
| $35,000 to $39,999 | 20 (1.5%) | 47 (4.7%) |
| $40,000 to $44,999 | 151 (11.5%) | 98 (9.9%) |
| $45,000 to $49,999 | 116 (8.8%) | 59 (5.9%) |
| $50,000 to $54,999 | 57 (4.3%) | 51 (5.1%) |
| $55,000 to $64,999 | 220 (16.8%) | 52 (5.2%) |
| $65,000 to $74,999 | 51 (3.9%) | 48 (4.8%) |
| $75,000 to $99,999 | 183 (14.0%) | 56 (5.6%) |
| $100,000+ | 159 (12.1%) | 73 (7.3%) |
| Total | 1,310 (100.0%) | 994 (100.0%) |
Earnings by Sex by Educational Attainment in Phillips County
Average earnings in Phillips County are $52,443 for men and $40,158 for women, a difference of 23.4%. Men with an educational attainment of bachelor's degree enjoy the highest average annual earnings of $82,679, while those with less than high school education earn the least with $41,071. Women with an educational attainment of graduate degree earn the most with the average annual earnings of $99,375, while those with college or associate's degree education have the smallest earnings of $24,911.
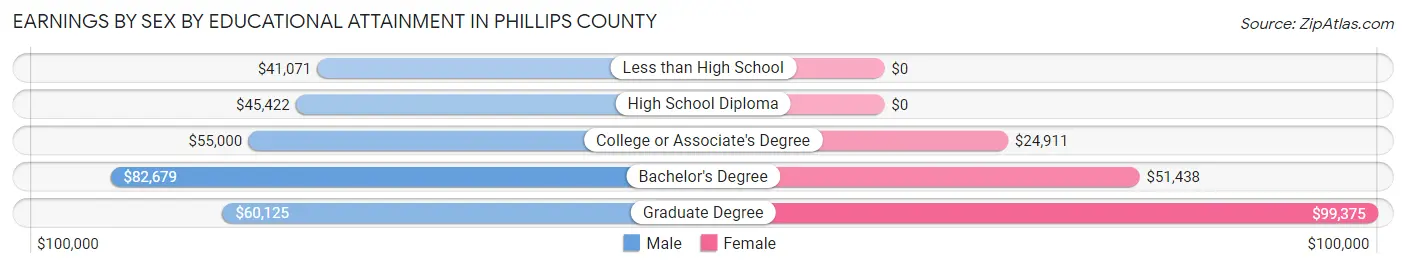
| Educational Attainment | Male Income | Female Income |
| Less than High School | $41,071 | $0 |
| High School Diploma | $45,422 | $0 |
| College or Associate's Degree | $55,000 | $24,911 |
| Bachelor's Degree | $82,679 | $51,438 |
| Graduate Degree | $60,125 | $99,375 |
| Total | $52,443 | $40,158 |
Family Income in Phillips County
Family Income Brackets in Phillips County
According to the Phillips County family income data, there are 241 families falling into the $50,000 to $74,999 income range, which is the most common income bracket and makes up 20.4% of all families. Conversely, the less than $10,000 income bracket is the least frequent group with only 11 families (0.9%) belonging to this category.

| Income Bracket | # Families | % Families |
| Less than $10,000 | 11 | 0.9% |
| $10,000 to $14,999 | 55 | 4.7% |
| $15,000 to $24,999 | 73 | 6.2% |
| $25,000 to $34,999 | 87 | 7.4% |
| $35,000 to $49,999 | 137 | 11.6% |
| $50,000 to $74,999 | 241 | 20.4% |
| $75,000 to $99,999 | 180 | 15.3% |
| $100,000 to $149,999 | 206 | 17.5% |
| $150,000 to $199,999 | 79 | 6.7% |
| $200,000+ | 110 | 9.3% |
Family Income by Famaliy Size in Phillips County
5-person families (183 | 15.5%) account for the highest median family income in Phillips County with $127,802 per family, while 3-person families (135 | 11.5%) have the highest median income of $32,096 per family member.

| Income Bracket | # Families | Median Income |
| 2-Person Families | 585 (49.6%) | $60,848 |
| 3-Person Families | 135 (11.5%) | $96,287 |
| 4-Person Families | 192 (16.3%) | $0 |
| 5-Person Families | 183 (15.5%) | $127,802 |
| 6-Person Families | 83 (7.0%) | $0 |
| 7+ Person Families | 1 (0.1%) | $0 |
| Total | 1,179 (100.0%) | $69,659 |
Family Income by Number of Earners in Phillips County
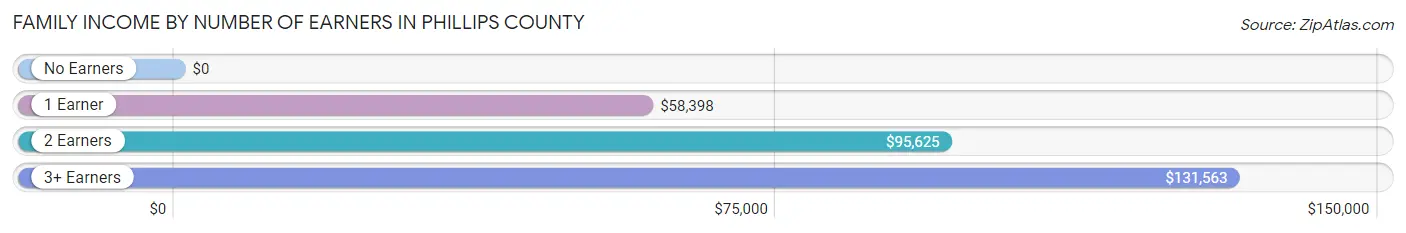
| Number of Earners | # Families | Median Income |
| No Earners | 146 (12.4%) | $0 |
| 1 Earner | 389 (33.0%) | $58,398 |
| 2 Earners | 555 (47.1%) | $95,625 |
| 3+ Earners | 89 (7.5%) | $131,563 |
| Total | 1,179 (100.0%) | $69,659 |
Household Income in Phillips County
Household Income Brackets in Phillips County
With 347 households falling in the category, the $50,000 to $74,999 income range is the most frequent in Phillips County, accounting for 19.7% of all households. In contrast, only 42 households (2.4%) fall into the less than $10,000 income bracket, making it the least populous group.

| Income Bracket | # Households | % Households |
| Less than $10,000 | 42 | 2.4% |
| $10,000 to $14,999 | 139 | 7.9% |
| $15,000 to $24,999 | 127 | 7.2% |
| $25,000 to $34,999 | 137 | 7.8% |
| $35,000 to $49,999 | 282 | 16.0% |
| $50,000 to $74,999 | 347 | 19.7% |
| $75,000 to $99,999 | 225 | 12.8% |
| $100,000 to $149,999 | 234 | 13.3% |
| $150,000 to $199,999 | 109 | 6.2% |
| $200,000+ | 116 | 6.6% |
Household Income by Householder Age in Phillips County
The median household income in Phillips County is $58,474, with the highest median household income of $80,197 found in the 25 to 44 years age bracket for the primary householder. A total of 545 households (31.0%) fall into this category. Meanwhile, the 65+ years age bracket for the primary householder has the lowest median household income of $36,711, with 522 households (29.7%) in this group.
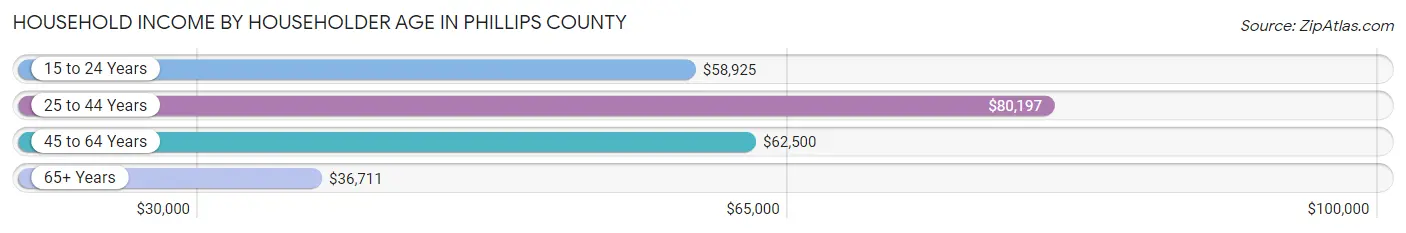
| Income Bracket | # Households | Median Income |
| 15 to 24 Years | 113 (6.4%) | $58,925 |
| 25 to 44 Years | 545 (31.0%) | $80,197 |
| 45 to 64 Years | 580 (33.0%) | $62,500 |
| 65+ Years | 522 (29.7%) | $36,711 |
| Total | 1,760 (100.0%) | $58,474 |
Poverty in Phillips County
Income Below Poverty by Sex and Age in Phillips County
With 10.7% poverty level for males and 17.0% for females among the residents of Phillips County, 5 year old males and 75 year old and over females are the most vulnerable to poverty, with 16 males (24.2%) and 84 females (36.5%) in their respective age groups living below the poverty level.
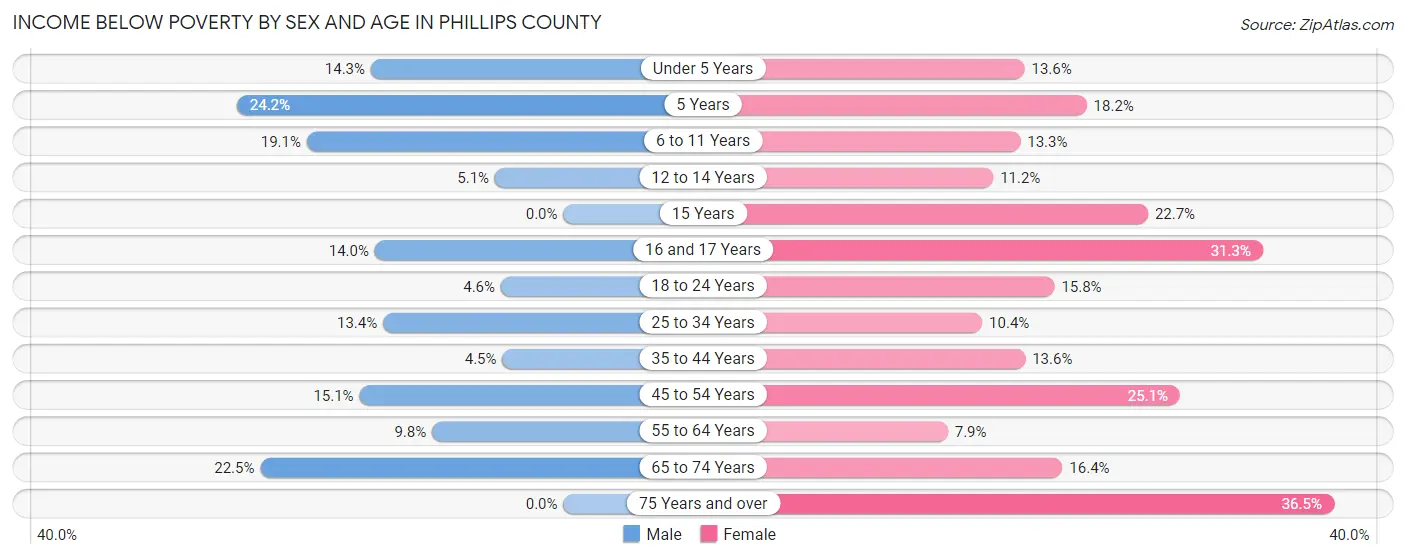
| Age Bracket | Male | Female |
| Under 5 Years | 8 (14.3%) | 38 (13.6%) |
| 5 Years | 16 (24.2%) | 2 (18.2%) |
| 6 to 11 Years | 32 (19.1%) | 31 (13.3%) |
| 12 to 14 Years | 6 (5.1%) | 10 (11.2%) |
| 15 Years | 0 (0.0%) | 5 (22.7%) |
| 16 and 17 Years | 7 (14.0%) | 5 (31.2%) |
| 18 to 24 Years | 9 (4.6%) | 30 (15.8%) |
| 25 to 34 Years | 34 (13.4%) | 15 (10.4%) |
| 35 to 44 Years | 15 (4.5%) | 44 (13.6%) |
| 45 to 54 Years | 43 (15.1%) | 66 (25.1%) |
| 55 to 64 Years | 27 (9.8%) | 20 (7.9%) |
| 65 to 74 Years | 36 (22.5%) | 29 (16.4%) |
| 75 Years and over | 0 (0.0%) | 84 (36.5%) |
| Total | 233 (10.7%) | 379 (17.0%) |
Income Above Poverty by Sex and Age in Phillips County
According to the poverty statistics in Phillips County, males aged 15 years and females aged 55 to 64 years are the age groups that are most secure financially, with 100.0% of males and 92.1% of females in these age groups living above the poverty line.
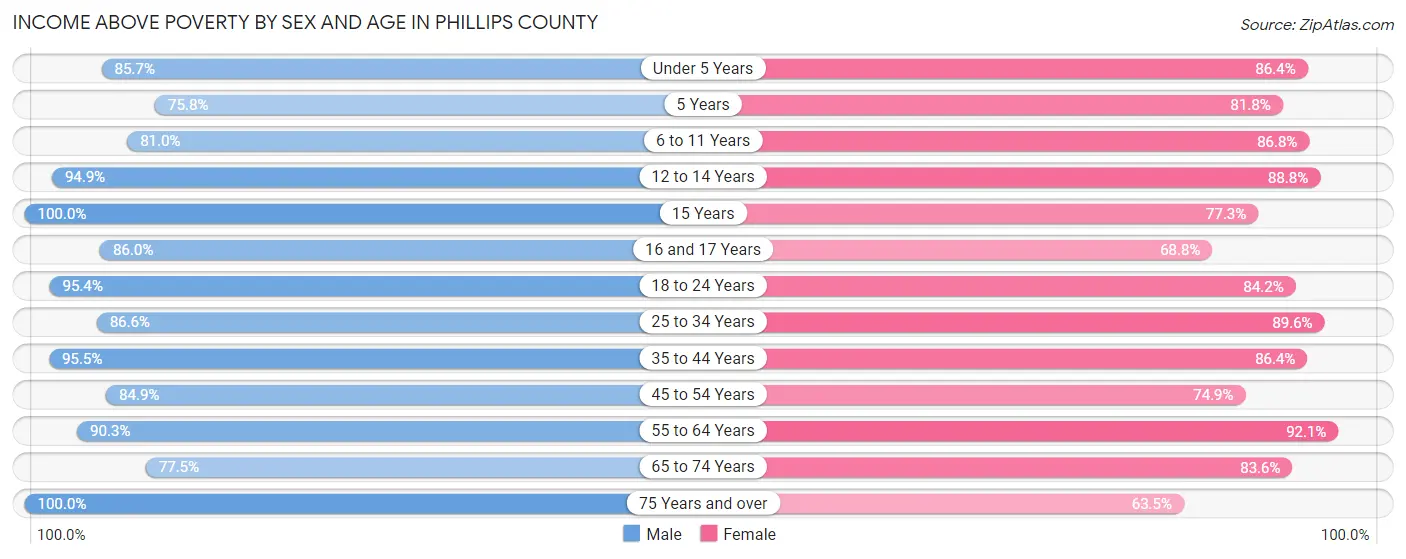
| Age Bracket | Male | Female |
| Under 5 Years | 48 (85.7%) | 242 (86.4%) |
| 5 Years | 50 (75.8%) | 9 (81.8%) |
| 6 to 11 Years | 136 (80.9%) | 203 (86.8%) |
| 12 to 14 Years | 112 (94.9%) | 79 (88.8%) |
| 15 Years | 33 (100.0%) | 17 (77.3%) |
| 16 and 17 Years | 43 (86.0%) | 11 (68.8%) |
| 18 to 24 Years | 185 (95.4%) | 160 (84.2%) |
| 25 to 34 Years | 220 (86.6%) | 129 (89.6%) |
| 35 to 44 Years | 316 (95.5%) | 279 (86.4%) |
| 45 to 54 Years | 241 (84.9%) | 197 (74.9%) |
| 55 to 64 Years | 250 (90.2%) | 234 (92.1%) |
| 65 to 74 Years | 124 (77.5%) | 148 (83.6%) |
| 75 Years and over | 186 (100.0%) | 146 (63.5%) |
| Total | 1,944 (89.3%) | 1,854 (83.0%) |
Income Below Poverty Among Married-Couple Families in Phillips County
The poverty statistics for married-couple families in Phillips County show that 7.2% or 71 of the total 987 families live below the poverty line. Families with 5 or more children have the highest poverty rate of 100.0%, comprising of 1 families. On the other hand, families with no children have the lowest poverty rate of 3.2%, which includes 17 families.
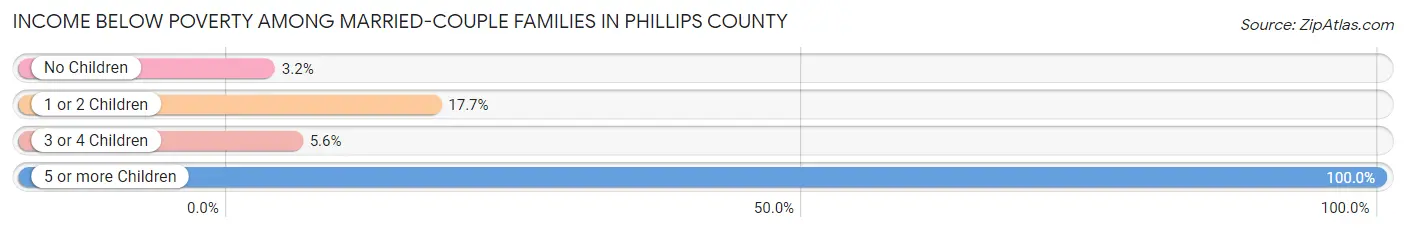
| Children | Above Poverty | Below Poverty |
| No Children | 512 (96.8%) | 17 (3.2%) |
| 1 or 2 Children | 186 (82.3%) | 40 (17.7%) |
| 3 or 4 Children | 218 (94.4%) | 13 (5.6%) |
| 5 or more Children | 0 (0.0%) | 1 (100.0%) |
| Total | 916 (92.8%) | 71 (7.2%) |
Income Below Poverty Among Single-Parent Households in Phillips County
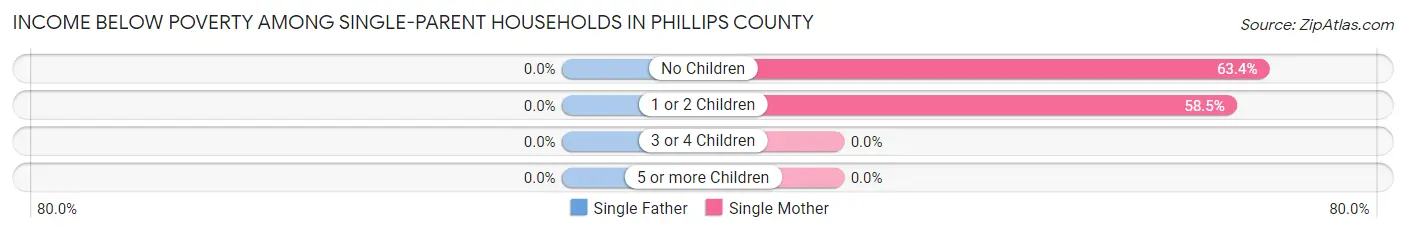
| Children | Single Father | Single Mother |
| No Children | 0 (0.0%) | 52 (63.4%) |
| 1 or 2 Children | 0 (0.0%) | 24 (58.5%) |
| 3 or 4 Children | 0 (0.0%) | 0 (0.0%) |
| 5 or more Children | 0 (0.0%) | 0 (0.0%) |
| Total | 0 (0.0%) | 76 (61.8%) |
Income Below Poverty Among Married-Couple vs Single-Parent Households in Phillips County
The poverty data for Phillips County shows that 71 of the married-couple family households (7.2%) and 76 of the single-parent households (39.6%) are living below the poverty level. Within the married-couple family households, those with 5 or more children have the highest poverty rate, with 1 households (100.0%) falling below the poverty line. Among the single-parent households, those with 1 or 2 children have the highest poverty rate, with 24 household (57.1%) living below poverty.
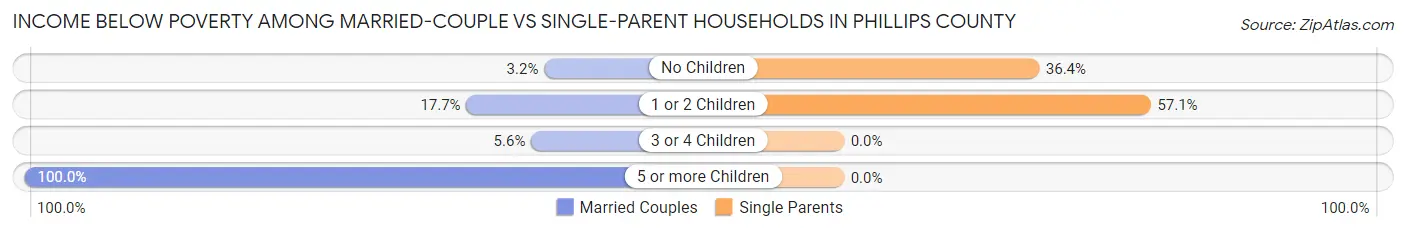
| Children | Married-Couple Families | Single-Parent Households |
| No Children | 17 (3.2%) | 52 (36.4%) |
| 1 or 2 Children | 40 (17.7%) | 24 (57.1%) |
| 3 or 4 Children | 13 (5.6%) | 0 (0.0%) |
| 5 or more Children | 1 (100.0%) | 0 (0.0%) |
| Total | 71 (7.2%) | 76 (39.6%) |
Race in Phillips County
The most populous races in Phillips County are White / Caucasian (3,795 | 84.5%), Hispanic or Latino (1,268 | 28.2%), and Two or more Races (467 | 10.4%).
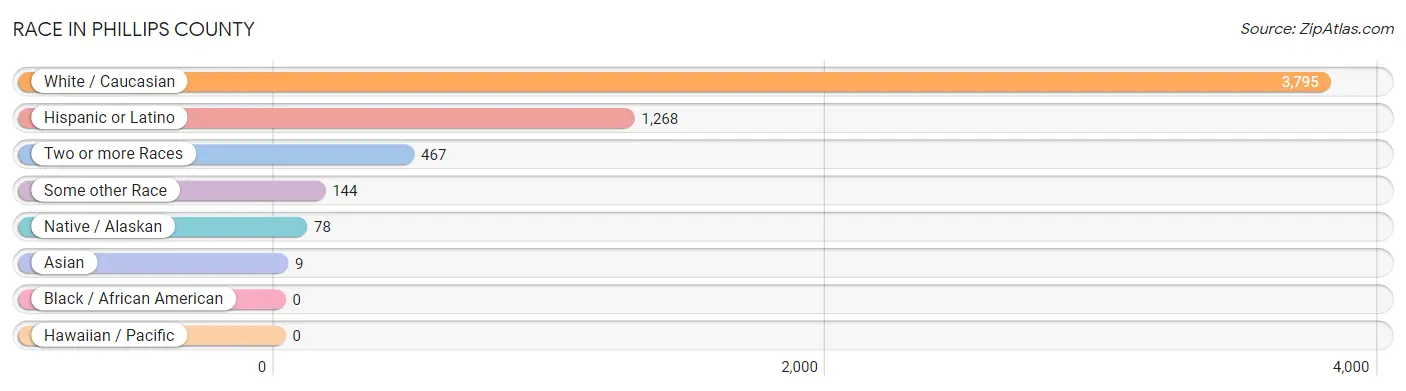
| Race | # Population | % Population |
| Asian | 9 | 0.2% |
| Black / African American | 0 | 0.0% |
| Hawaiian / Pacific | 0 | 0.0% |
| Hispanic or Latino | 1,268 | 28.2% |
| Native / Alaskan | 78 | 1.7% |
| White / Caucasian | 3,795 | 84.5% |
| Two or more Races | 467 | 10.4% |
| Some other Race | 144 | 3.2% |
| Total | 4,493 | 100.0% |
Ancestry in Phillips County
The most populous ancestries reported in Phillips County are German (1,250 | 27.8%), Mexican (1,067 | 23.7%), Irish (330 | 7.3%), English (240 | 5.3%), and Central American (165 | 3.7%), together accounting for 67.9% of all Phillips County residents.
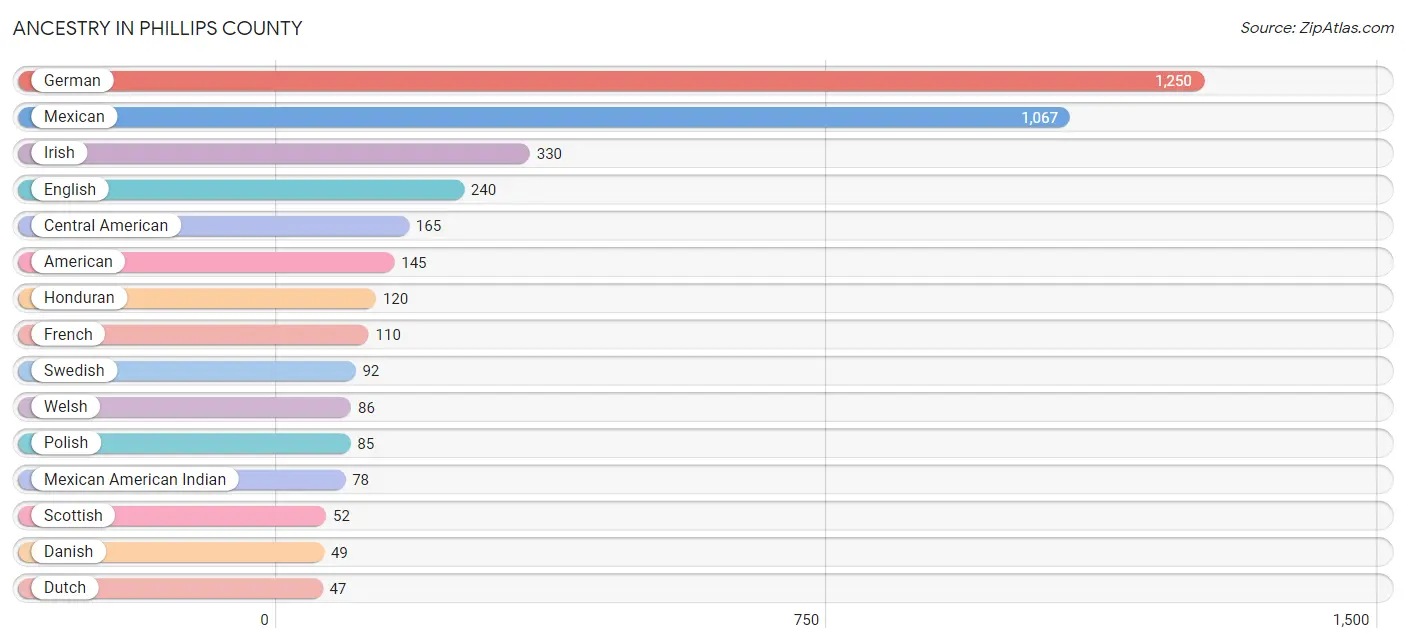
| Ancestry | # Population | % Population |
| American | 145 | 3.2% |
| Belgian | 13 | 0.3% |
| British | 6 | 0.1% |
| Burmese | 8 | 0.2% |
| Central American | 165 | 3.7% |
| Croatian | 4 | 0.1% |
| Czech | 2 | 0.0% |
| Danish | 49 | 1.1% |
| Dutch | 47 | 1.1% |
| English | 240 | 5.3% |
| European | 37 | 0.8% |
| French | 110 | 2.5% |
| French Canadian | 6 | 0.1% |
| German | 1,250 | 27.8% |
| Guatemalan | 45 | 1.0% |
| Honduran | 120 | 2.7% |
| Hungarian | 10 | 0.2% |
| Irish | 330 | 7.3% |
| Italian | 42 | 0.9% |
| Korean | 5 | 0.1% |
| Mexican | 1,067 | 23.7% |
| Mexican American Indian | 78 | 1.7% |
| Native Hawaiian | 7 | 0.2% |
| Nigerian | 4 | 0.1% |
| Norwegian | 38 | 0.9% |
| Osage | 3 | 0.1% |
| Pennsylvania German | 6 | 0.1% |
| Polish | 85 | 1.9% |
| Russian | 24 | 0.5% |
| Scandinavian | 18 | 0.4% |
| Scotch-Irish | 18 | 0.4% |
| Scottish | 52 | 1.2% |
| Shoshone | 6 | 0.1% |
| Spaniard | 18 | 0.4% |
| Spanish | 16 | 0.4% |
| Subsaharan African | 4 | 0.1% |
| Swedish | 92 | 2.1% |
| Welsh | 86 | 1.9% | View All 38 Rows |
Immigrants in Phillips County
The most numerous immigrant groups reported in Phillips County came from Central America (569 | 12.7%), Latin America (569 | 12.7%), Mexico (454 | 10.1%), Honduras (115 | 2.6%), and Europe (36 | 0.8%), together accounting for 38.8% of all Phillips County residents.
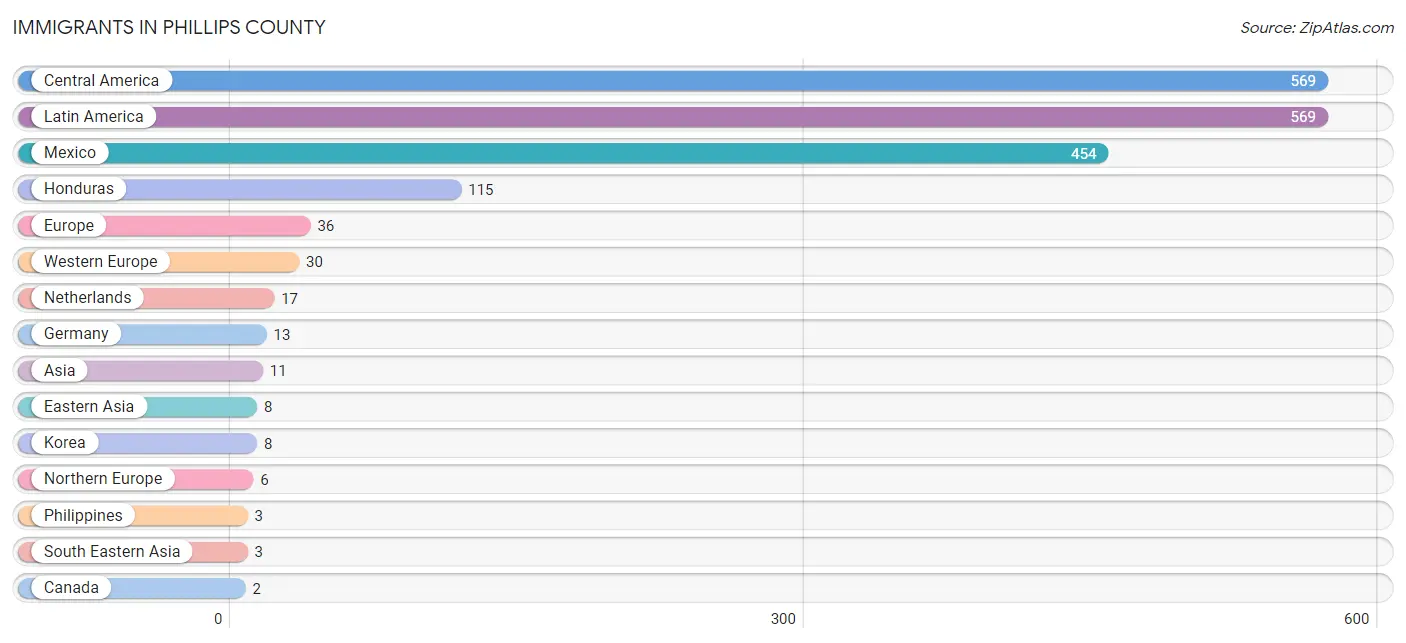
| Immigration Origin | # Population | % Population |
| Asia | 11 | 0.2% |
| Canada | 2 | 0.0% |
| Central America | 569 | 12.7% |
| Eastern Asia | 8 | 0.2% |
| Europe | 36 | 0.8% |
| Germany | 13 | 0.3% |
| Honduras | 115 | 2.6% |
| Korea | 8 | 0.2% |
| Latin America | 569 | 12.7% |
| Mexico | 454 | 10.1% |
| Netherlands | 17 | 0.4% |
| Northern Europe | 6 | 0.1% |
| Philippines | 3 | 0.1% |
| South Eastern Asia | 3 | 0.1% |
| Western Europe | 30 | 0.7% | View All 15 Rows |
Sex and Age in Phillips County
Sex and Age in Phillips County
The most populous age groups in Phillips County are 40 to 44 Years (240 | 10.9%) for men and Under 5 Years (280 | 12.2%) for women.
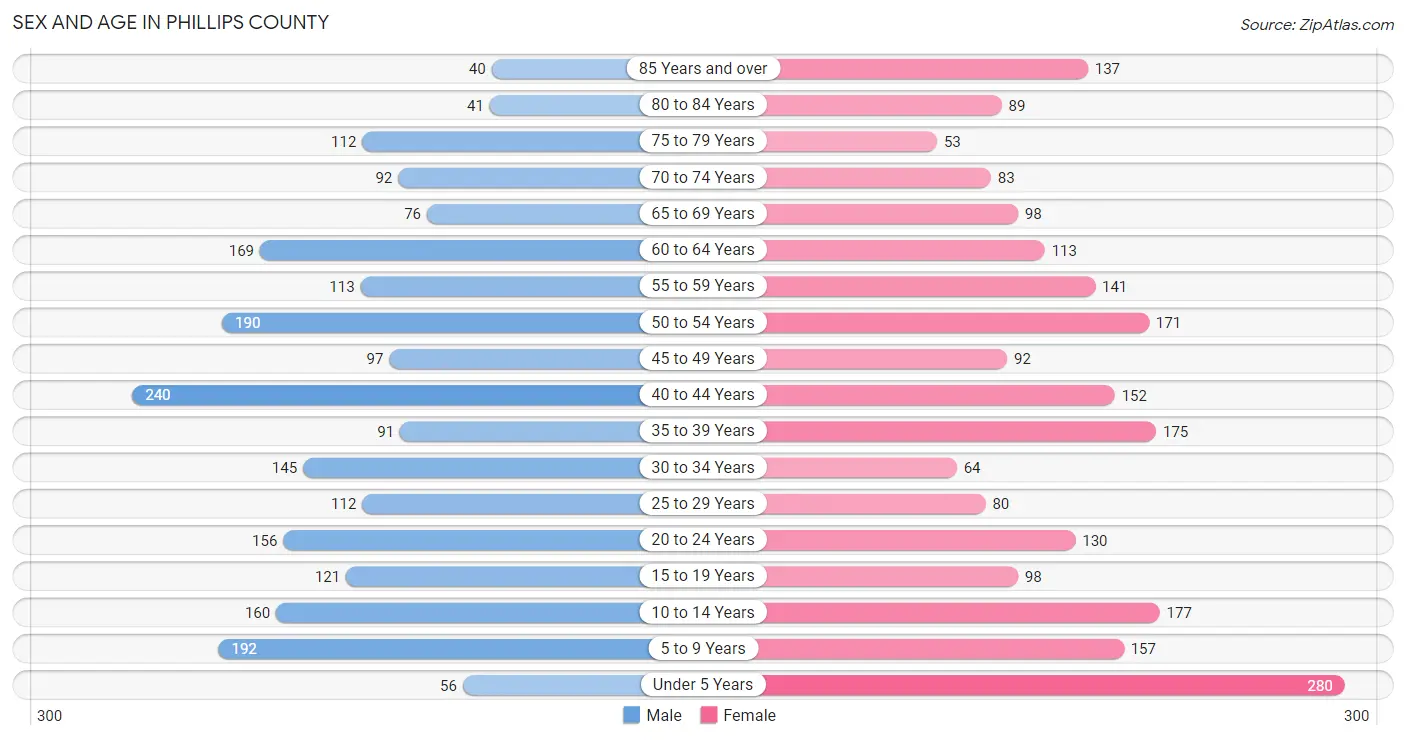
| Age Bracket | Male | Female |
| Under 5 Years | 56 (2.5%) | 280 (12.2%) |
| 5 to 9 Years | 192 (8.7%) | 157 (6.9%) |
| 10 to 14 Years | 160 (7.3%) | 177 (7.7%) |
| 15 to 19 Years | 121 (5.5%) | 98 (4.3%) |
| 20 to 24 Years | 156 (7.1%) | 130 (5.7%) |
| 25 to 29 Years | 112 (5.1%) | 80 (3.5%) |
| 30 to 34 Years | 145 (6.6%) | 64 (2.8%) |
| 35 to 39 Years | 91 (4.1%) | 175 (7.6%) |
| 40 to 44 Years | 240 (10.9%) | 152 (6.6%) |
| 45 to 49 Years | 97 (4.4%) | 92 (4.0%) |
| 50 to 54 Years | 190 (8.6%) | 171 (7.5%) |
| 55 to 59 Years | 113 (5.1%) | 141 (6.2%) |
| 60 to 64 Years | 169 (7.7%) | 113 (4.9%) |
| 65 to 69 Years | 76 (3.5%) | 98 (4.3%) |
| 70 to 74 Years | 92 (4.2%) | 83 (3.6%) |
| 75 to 79 Years | 112 (5.1%) | 53 (2.3%) |
| 80 to 84 Years | 41 (1.9%) | 89 (3.9%) |
| 85 Years and over | 40 (1.8%) | 137 (6.0%) |
| Total | 2,203 (100.0%) | 2,290 (100.0%) |
Families and Households in Phillips County
Median Family Size in Phillips County
The median family size in Phillips County is 3.16 persons per family, with married-couple families (987 | 83.7%) accounting for the largest median family size of 3.26 persons per family. On the other hand, single female/mother families (123 | 10.4%) represent the smallest median family size with 2.57 persons per family.
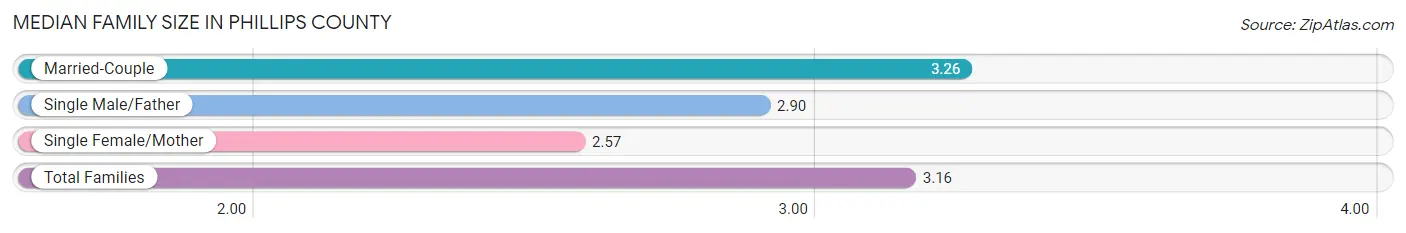
| Family Type | # Families | Family Size |
| Married-Couple | 987 (83.7%) | 3.26 |
| Single Male/Father | 69 (5.9%) | 2.90 |
| Single Female/Mother | 123 (10.4%) | 2.57 |
| Total Families | 1,179 (100.0%) | 3.16 |
Median Household Size in Phillips County
The median household size in Phillips County is 2.51 persons per household, with married-couple households (987 | 56.1%) accounting for the largest median household size of 3.28 persons per household. non-family households (581 | 33.0%) represent the smallest median household size with 1.11 persons per household.
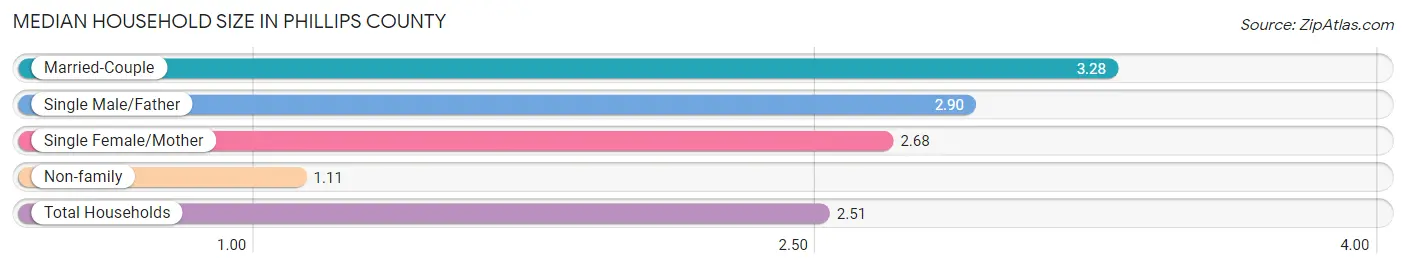
| Household Type | # Households | Household Size |
| Married-Couple | 987 (56.1%) | 3.28 |
| Single Male/Father | 69 (3.9%) | 2.90 |
| Single Female/Mother | 123 (7.0%) | 2.68 |
| Non-family | 581 (33.0%) | 1.11 |
| Total Households | 1,760 (100.0%) | 2.51 |
Household Size by Marriage Status in Phillips County
Out of a total of 1,760 households in Phillips County, 1,179 (67.0%) are family households, while 581 (33.0%) are nonfamily households. The most numerous type of family households are 2-person households, comprising 580, and the most common type of nonfamily households are 1-person households, comprising 529.
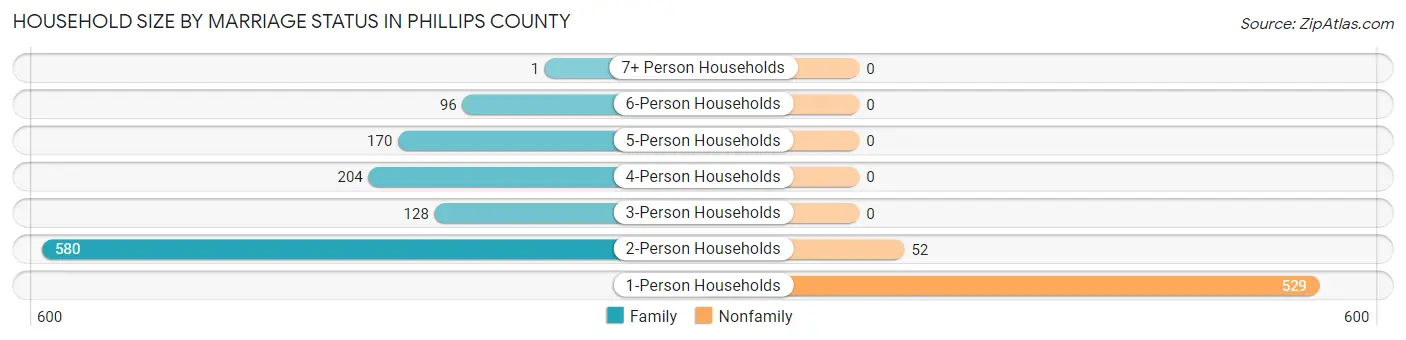
| Household Size | Family Households | Nonfamily Households |
| 1-Person Households | - | 529 (30.1%) |
| 2-Person Households | 580 (33.0%) | 52 (2.9%) |
| 3-Person Households | 128 (7.3%) | 0 (0.0%) |
| 4-Person Households | 204 (11.6%) | 0 (0.0%) |
| 5-Person Households | 170 (9.7%) | 0 (0.0%) |
| 6-Person Households | 96 (5.4%) | 0 (0.0%) |
| 7+ Person Households | 1 (0.1%) | 0 (0.0%) |
| Total | 1,179 (67.0%) | 581 (33.0%) |
Female Fertility in Phillips County
Fertility by Age in Phillips County
Average fertility rate in Phillips County is 100.0 births per 1,000 women. Women in the age bracket of 15 to 19 years have the highest fertility rate with 163.0 births per 1,000 women. Women in the age bracket of 35 to 50 years acount for 61.5% of all women with births.

| Age Bracket | Women with Births | Births / 1,000 Women |
| 15 to 19 years | 16 (19.3%) | 163.0 |
| 20 to 34 years | 16 (19.3%) | 58.0 |
| 35 to 50 years | 51 (61.5%) | 111.0 |
| Total | 83 (100.0%) | 100.0 |
Fertility by Age by Marriage Status in Phillips County
92.8% of women with births (83) in Phillips County are married. The highest percentage of unmarried women with births falls into 20 to 34 years age bracket with 37.5% of them unmarried at the time of birth, while the lowest percentage of unmarried women with births belong to 15 to 19 years age bracket with 0.0% of them unmarried.
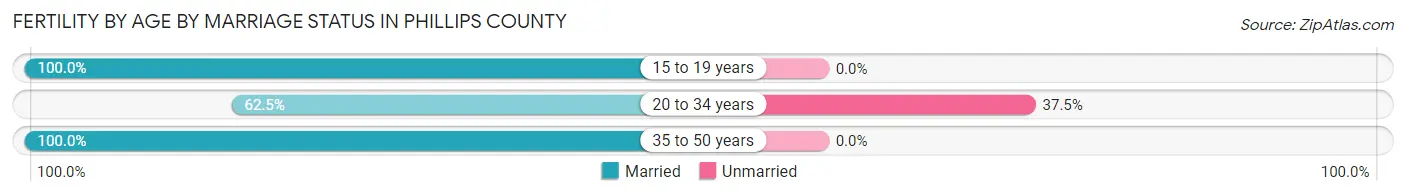
| Age Bracket | Married | Unmarried |
| 15 to 19 years | 16 (100.0%) | 0 (0.0%) |
| 20 to 34 years | 10 (62.5%) | 6 (37.5%) |
| 35 to 50 years | 51 (100.0%) | 0 (0.0%) |
| Total | 77 (92.8%) | 6 (7.2%) |
Fertility by Education in Phillips County
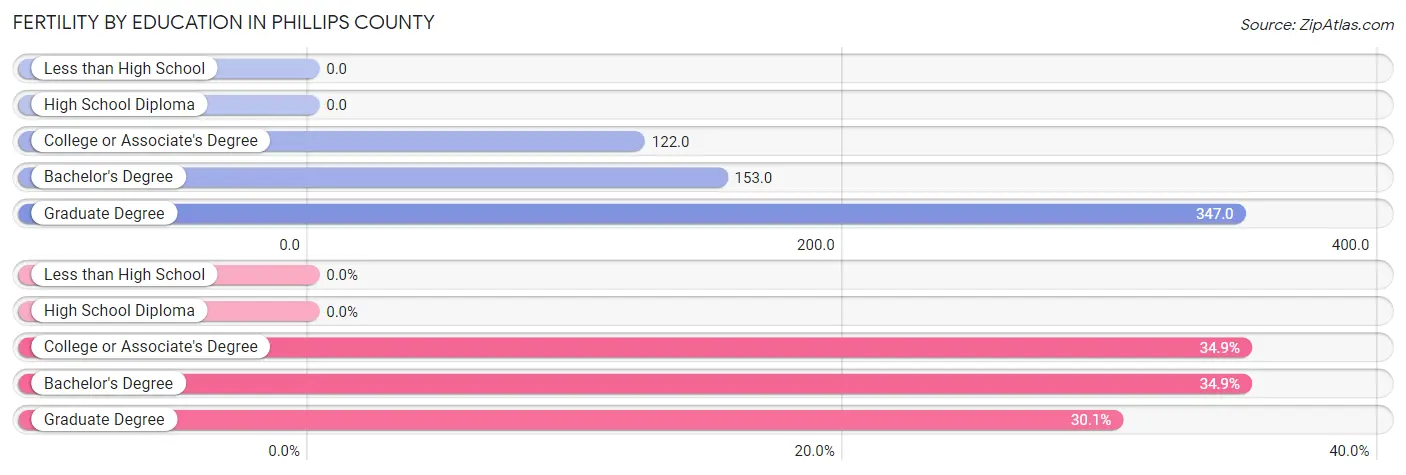
| Educational Attainment | Women with Births | Births / 1,000 Women |
| Less than High School | 0 (0.0%) | 0.0 |
| High School Diploma | 0 (0.0%) | 0.0 |
| College or Associate's Degree | 29 (34.9%) | 122.0 |
| Bachelor's Degree | 29 (34.9%) | 153.0 |
| Graduate Degree | 25 (30.1%) | 347.0 |
| Total | 83 (100.0%) | 100.0 |
Fertility by Education by Marriage Status in Phillips County
7.2% of women with births in Phillips County are unmarried. Women with the educational attainment of bachelor's degree are most likely to be married with 100.0% of them married at childbirth, while women with the educational attainment of college or associate's degree are least likely to be married with 20.7% of them unmarried at childbirth.
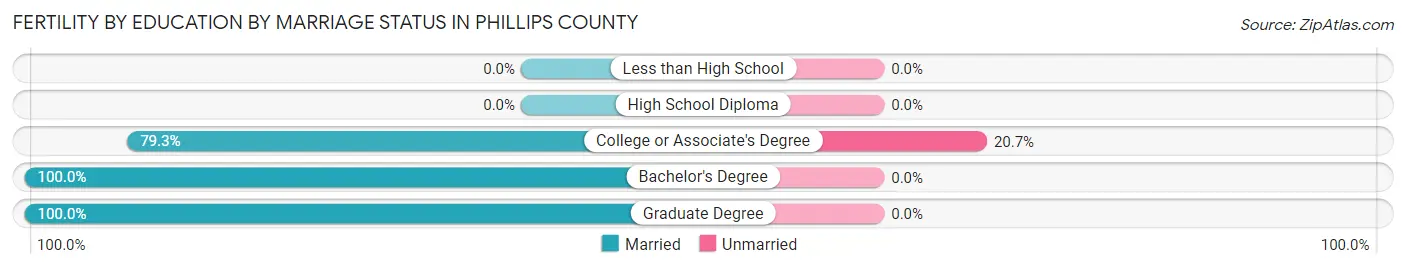
| Educational Attainment | Married | Unmarried |
| Less than High School | 0 (0.0%) | 0 (0.0%) |
| High School Diploma | 0 (0.0%) | 0 (0.0%) |
| College or Associate's Degree | 23 (79.3%) | 6 (20.7%) |
| Bachelor's Degree | 29 (100.0%) | 0 (0.0%) |
| Graduate Degree | 25 (100.0%) | 0 (0.0%) |
| Total | 77 (92.8%) | 6 (7.2%) |
Employment Characteristics in Phillips County
Employment by Class of Employer in Phillips County
Among the 2,055 employed individuals in Phillips County, private company employees (1,171 | 57.0%), self-employed (not incorporated) (356 | 17.3%), and local government employees (209 | 10.2%) make up the most common classes of employment.
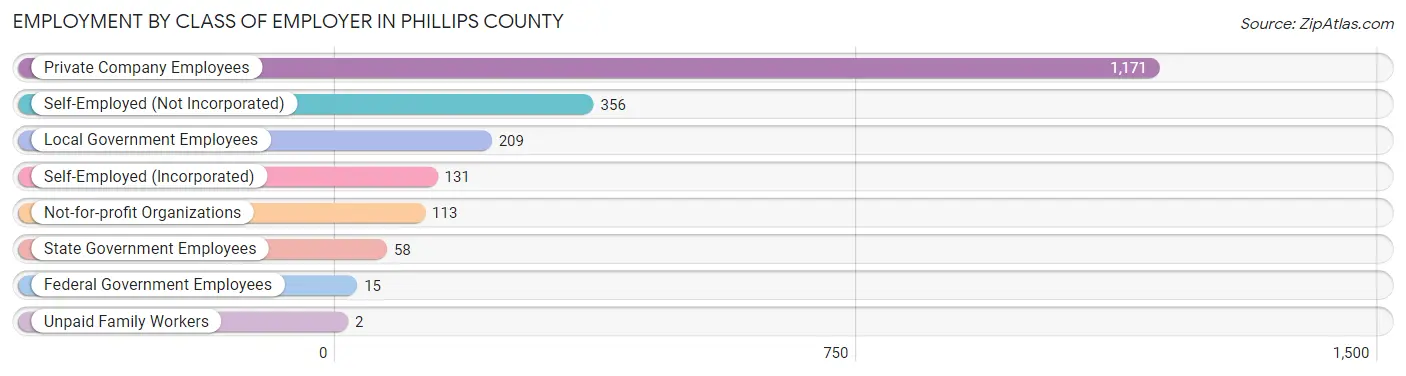
| Employer Class | # Employees | % Employees |
| Private Company Employees | 1,171 | 57.0% |
| Self-Employed (Incorporated) | 131 | 6.4% |
| Self-Employed (Not Incorporated) | 356 | 17.3% |
| Not-for-profit Organizations | 113 | 5.5% |
| Local Government Employees | 209 | 10.2% |
| State Government Employees | 58 | 2.8% |
| Federal Government Employees | 15 | 0.7% |
| Unpaid Family Workers | 2 | 0.1% |
| Total | 2,055 | 100.0% |
Employment Status by Age in Phillips County
According to the labor force statistics for Phillips County, out of the total population over 16 years of age (3,416), 61.6% or 2,104 individuals are in the labor force, with 1.4% or 29 of them unemployed. The age group with the highest labor force participation rate is 25 to 29 years, with 100.0% or 192 individuals in the labor force. Within the labor force, the 16 to 19 years age range has the highest percentage of unemployed individuals, with 17.1% or 6 of them being unemployed.
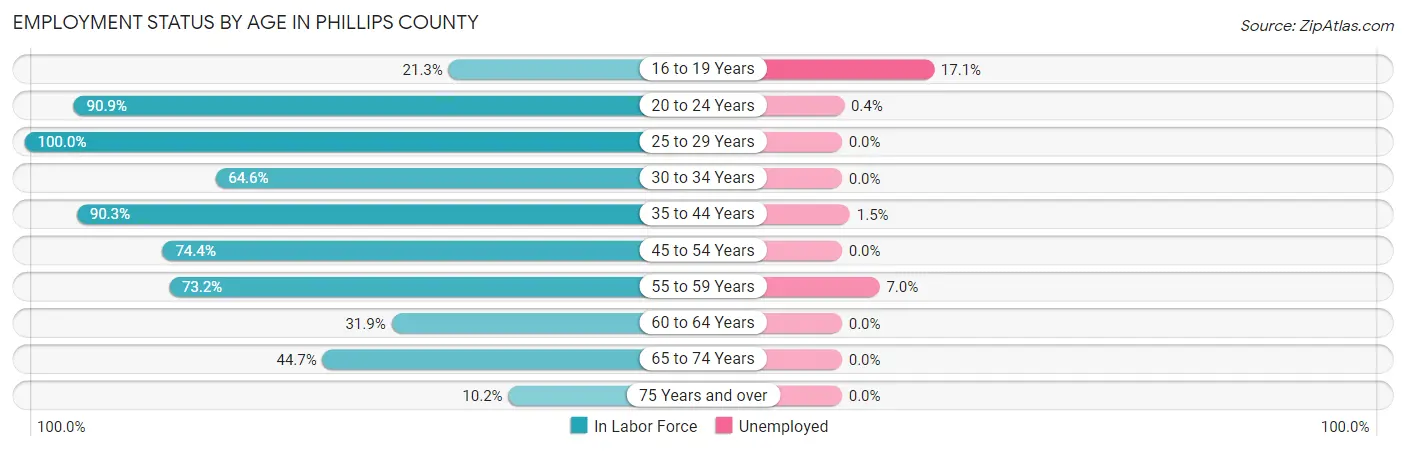
| Age Bracket | In Labor Force | Unemployed |
| 16 to 19 Years | 35 (21.3%) | 6 (17.1%) |
| 20 to 24 Years | 260 (90.9%) | 1 (0.4%) |
| 25 to 29 Years | 192 (100.0%) | 0 (0.0%) |
| 30 to 34 Years | 135 (64.6%) | 0 (0.0%) |
| 35 to 44 Years | 594 (90.3%) | 9 (1.5%) |
| 45 to 54 Years | 409 (74.4%) | 0 (0.0%) |
| 55 to 59 Years | 186 (73.2%) | 13 (7.0%) |
| 60 to 64 Years | 90 (31.9%) | 0 (0.0%) |
| 65 to 74 Years | 156 (44.7%) | 0 (0.0%) |
| 75 Years and over | 48 (10.2%) | 0 (0.0%) |
| Total | 2,104 (61.6%) | 29 (1.4%) |
Employment Status by Educational Attainment in Phillips County
According to labor force statistics for Phillips County, 74.9% of individuals (1,607) out of the total population between 25 and 64 years of age (2,145) are in the labor force, with 1.4% or 22 of them being unemployed. The group with the highest labor force participation rate are those with the educational attainment of bachelor's degree or higher, with 85.6% or 524 individuals in the labor force. Within the labor force, individuals with college / associate degree education have the highest percentage of unemployment, with 4.3% or 22 of them being unemployed.
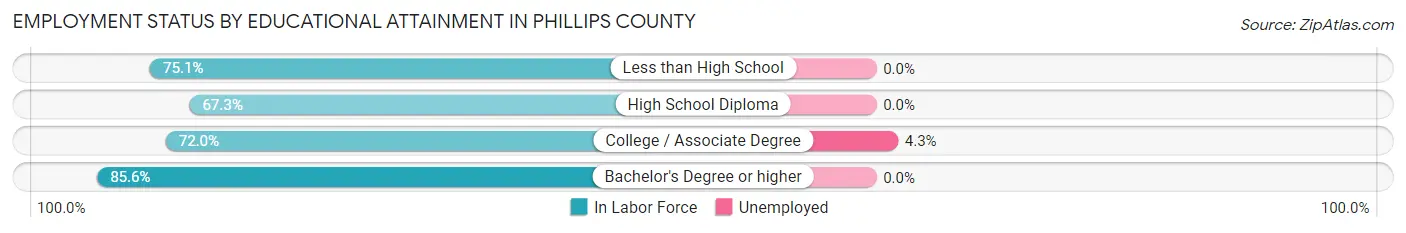
| Educational Attainment | In Labor Force | Unemployed |
| Less than High School | 163 (75.1%) | 0 (0.0%) |
| High School Diploma | 409 (67.3%) | 0 (0.0%) |
| College / Associate Degree | 510 (72.0%) | 30 (4.3%) |
| Bachelor's Degree or higher | 524 (85.6%) | 0 (0.0%) |
| Total | 1,607 (74.9%) | 30 (1.4%) |
Employment Occupations by Sex in Phillips County
Management, Business, Science and Arts Occupations
The most common Management, Business, Science and Arts occupations in Phillips County are Management (494 | 23.8%), Community & Social Service (181 | 8.7%), Health Diagnosing & Treating (110 | 5.3%), Business & Financial (107 | 5.1%), and Education Instruction & Library (105 | 5.1%).
Management, Business, Science and Arts Occupations by Sex
Within the Management, Business, Science and Arts occupations in Phillips County, the most male-oriented occupations are Computers & Mathematics (100.0%), Architecture & Engineering (100.0%), and Computers, Engineering & Science (84.6%), while the most female-oriented occupations are Arts, Media & Entertainment (100.0%), Health Diagnosing & Treating (85.5%), and Education Instruction & Library (84.8%).
| Occupation | Male | Female |
| Management | 370 (74.9%) | 124 (25.1%) |
| Business & Financial | 69 (64.5%) | 38 (35.5%) |
| Computers, Engineering & Science | 22 (84.6%) | 4 (15.4%) |
| Computers & Mathematics | 11 (100.0%) | 0 (0.0%) |
| Architecture & Engineering | 3 (100.0%) | 0 (0.0%) |
| Life, Physical & Social Science | 8 (66.7%) | 4 (33.3%) |
| Community & Social Service | 29 (16.0%) | 152 (84.0%) |
| Education, Arts & Media | 7 (20.6%) | 27 (79.4%) |
| Legal Services & Support | 6 (16.7%) | 30 (83.3%) |
| Education Instruction & Library | 16 (15.2%) | 89 (84.8%) |
| Arts, Media & Entertainment | 0 (0.0%) | 6 (100.0%) |
| Health Diagnosing & Treating | 16 (14.5%) | 94 (85.5%) |
| Health Technologists | 16 (21.9%) | 57 (78.1%) |
| Total (Category) | 506 (55.1%) | 412 (44.9%) |
| Total (Overall) | 1,157 (55.7%) | 919 (44.3%) |
Services Occupations
The most common Services occupations in Phillips County are Food Preparation & Serving (72 | 3.5%), Healthcare Support (70 | 3.4%), Cleaning & Maintenance (65 | 3.1%), Personal Care & Service (50 | 2.4%), and Security & Protection (23 | 1.1%).
Services Occupations by Sex
Within the Services occupations in Phillips County, the most male-oriented occupations are Firefighting & Prevention (100.0%), Security & Protection (82.6%), and Law Enforcement (78.9%), while the most female-oriented occupations are Healthcare Support (100.0%), Personal Care & Service (92.0%), and Food Preparation & Serving (66.7%).
| Occupation | Male | Female |
| Healthcare Support | 0 (0.0%) | 70 (100.0%) |
| Security & Protection | 19 (82.6%) | 4 (17.4%) |
| Firefighting & Prevention | 4 (100.0%) | 0 (0.0%) |
| Law Enforcement | 15 (78.9%) | 4 (21.0%) |
| Food Preparation & Serving | 24 (33.3%) | 48 (66.7%) |
| Cleaning & Maintenance | 33 (50.8%) | 32 (49.2%) |
| Personal Care & Service | 4 (8.0%) | 46 (92.0%) |
| Total (Category) | 80 (28.6%) | 200 (71.4%) |
| Total (Overall) | 1,157 (55.7%) | 919 (44.3%) |
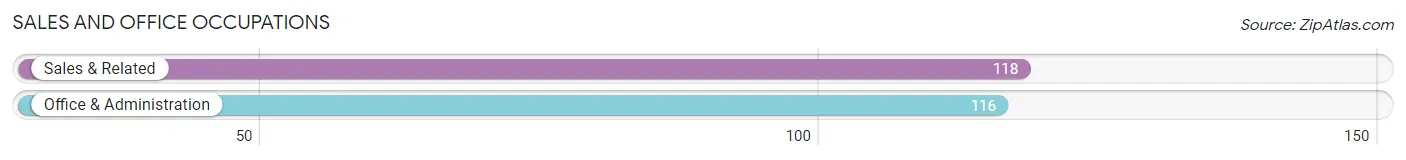
Sales and Office Occupations
The most common Sales and Office occupations in Phillips County are Sales & Related (118 | 5.7%), and Office & Administration (116 | 5.6%).
Sales and Office Occupations by Sex
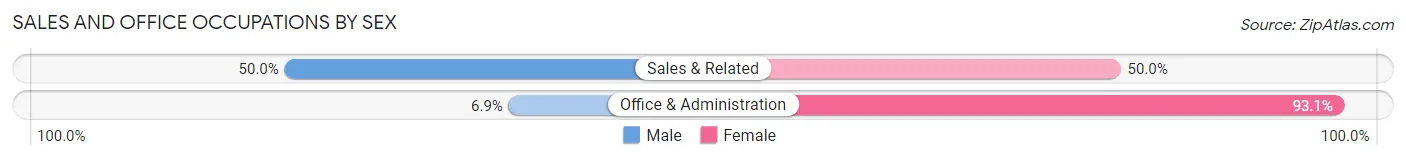
| Occupation | Male | Female |
| Sales & Related | 59 (50.0%) | 59 (50.0%) |
| Office & Administration | 8 (6.9%) | 108 (93.1%) |
| Total (Category) | 67 (28.6%) | 167 (71.4%) |
| Total (Overall) | 1,157 (55.7%) | 919 (44.3%) |
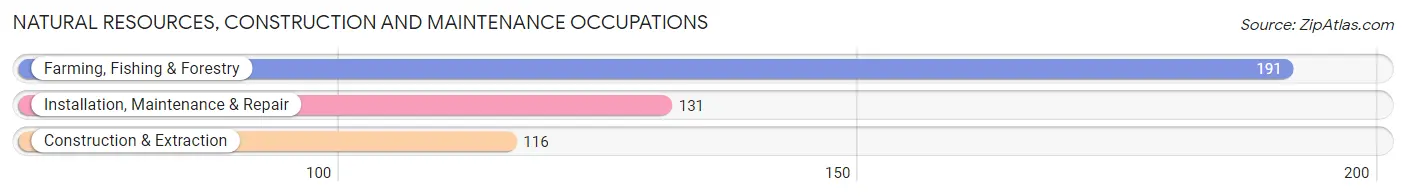
Natural Resources, Construction and Maintenance Occupations
The most common Natural Resources, Construction and Maintenance occupations in Phillips County are Farming, Fishing & Forestry (191 | 9.2%), Installation, Maintenance & Repair (131 | 6.3%), and Construction & Extraction (116 | 5.6%).
Natural Resources, Construction and Maintenance Occupations by Sex
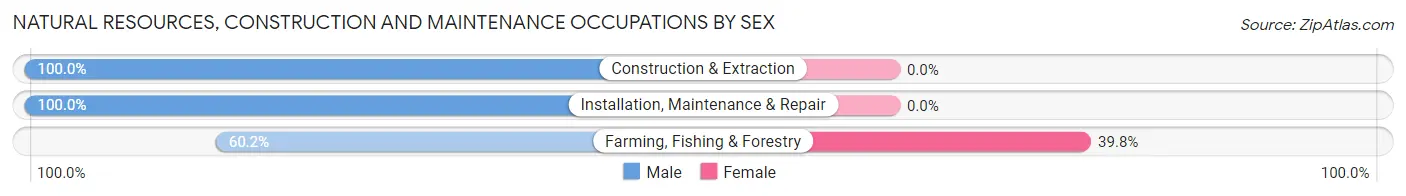
| Occupation | Male | Female |
| Farming, Fishing & Forestry | 115 (60.2%) | 76 (39.8%) |
| Construction & Extraction | 116 (100.0%) | 0 (0.0%) |
| Installation, Maintenance & Repair | 131 (100.0%) | 0 (0.0%) |
| Total (Category) | 362 (82.7%) | 76 (17.3%) |
| Total (Overall) | 1,157 (55.7%) | 919 (44.3%) |
Production, Transportation and Moving Occupations
The most common Production, Transportation and Moving occupations in Phillips County are Material Moving (108 | 5.2%), Transportation (57 | 2.8%), and Production (41 | 2.0%).
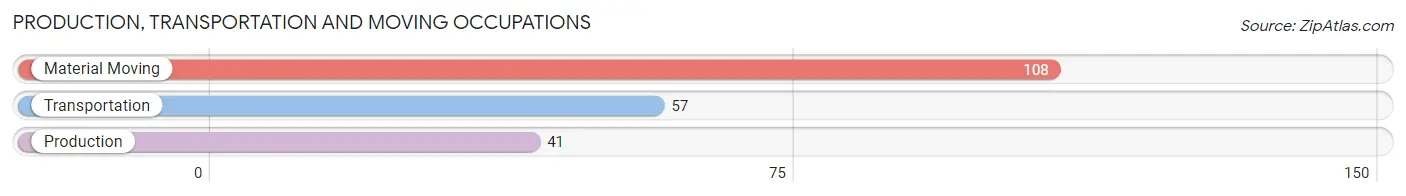
Production, Transportation and Moving Occupations by Sex
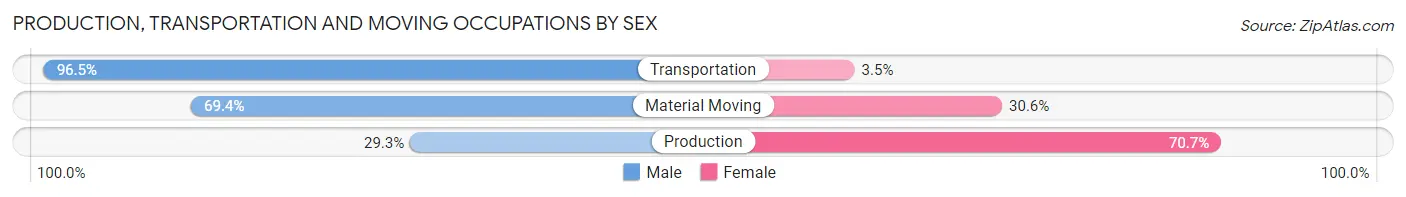
| Occupation | Male | Female |
| Production | 12 (29.3%) | 29 (70.7%) |
| Transportation | 55 (96.5%) | 2 (3.5%) |
| Material Moving | 75 (69.4%) | 33 (30.6%) |
| Total (Category) | 142 (68.9%) | 64 (31.1%) |
| Total (Overall) | 1,157 (55.7%) | 919 (44.3%) |
Employment Industries by Sex in Phillips County
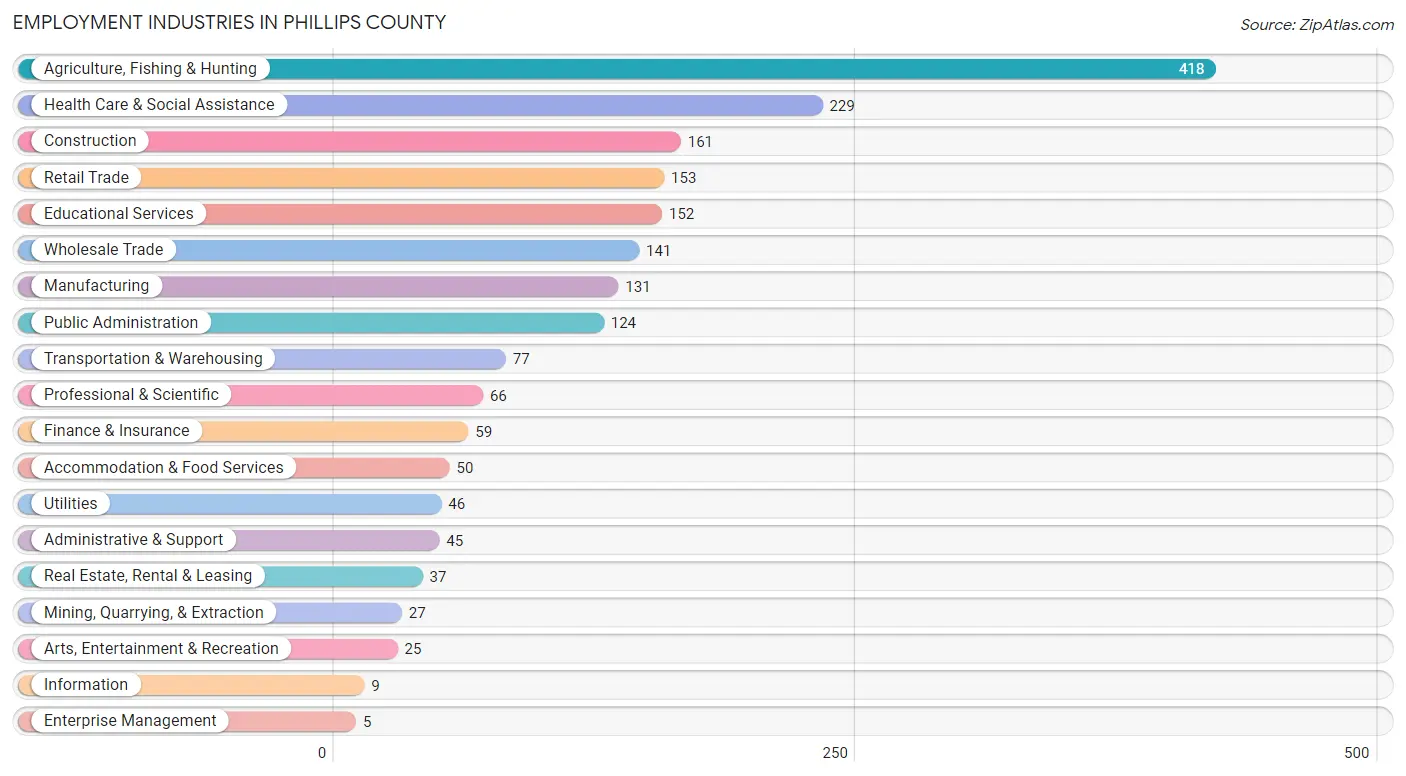
Employment Industries in Phillips County
The major employment industries in Phillips County include Agriculture, Fishing & Hunting (418 | 20.1%), Health Care & Social Assistance (229 | 11.0%), Construction (161 | 7.8%), Retail Trade (153 | 7.4%), and Educational Services (152 | 7.3%).
Employment Industries by Sex in Phillips County
The Phillips County industries that see more men than women are Construction (100.0%), Agriculture, Fishing & Hunting (87.6%), and Transportation & Warehousing (80.5%), whereas the industries that tend to have a higher number of women are Information (100.0%), Enterprise Management (100.0%), and Health Care & Social Assistance (93.0%).
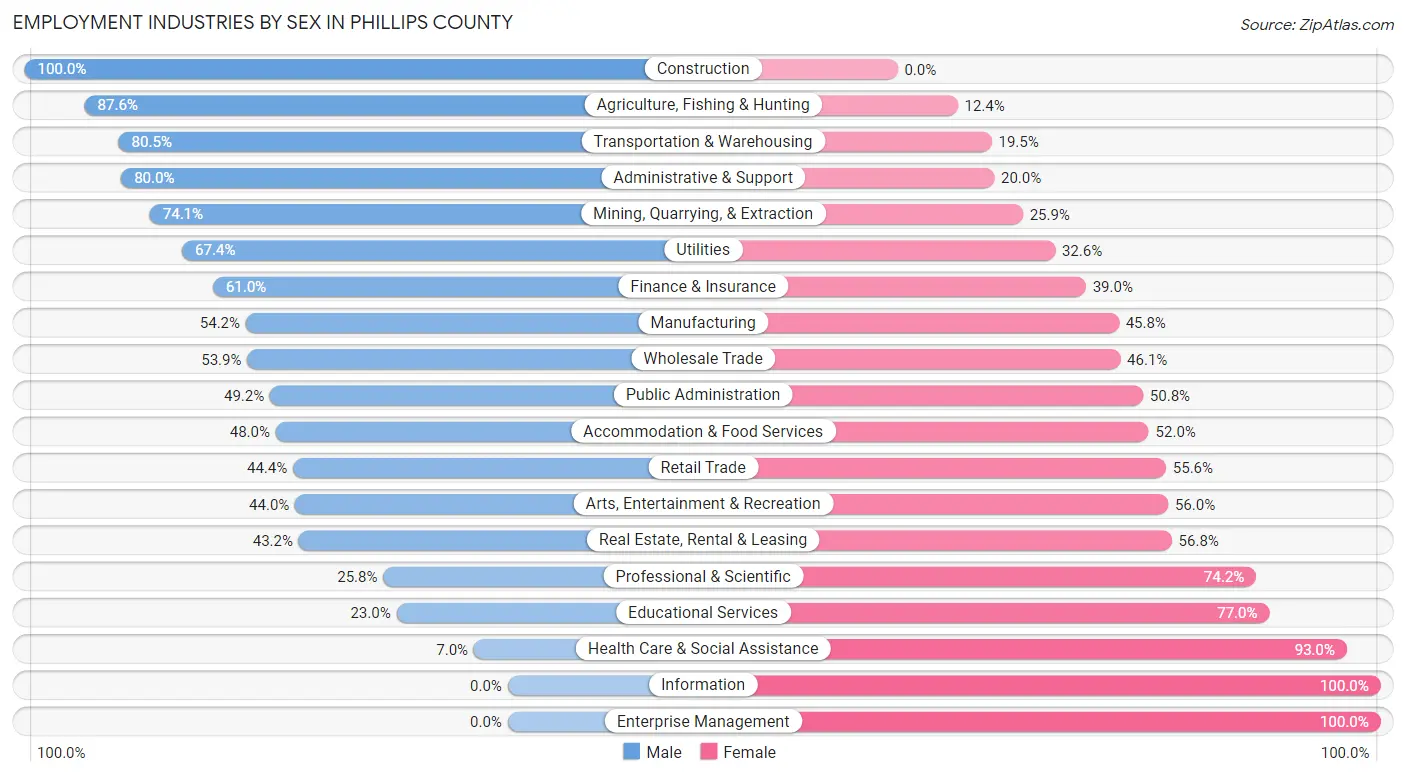
| Industry | Male | Female |
| Agriculture, Fishing & Hunting | 366 (87.6%) | 52 (12.4%) |
| Mining, Quarrying, & Extraction | 20 (74.1%) | 7 (25.9%) |
| Construction | 161 (100.0%) | 0 (0.0%) |
| Manufacturing | 71 (54.2%) | 60 (45.8%) |
| Wholesale Trade | 76 (53.9%) | 65 (46.1%) |
| Retail Trade | 68 (44.4%) | 85 (55.6%) |
| Transportation & Warehousing | 62 (80.5%) | 15 (19.5%) |
| Utilities | 31 (67.4%) | 15 (32.6%) |
| Information | 0 (0.0%) | 9 (100.0%) |
| Finance & Insurance | 36 (61.0%) | 23 (39.0%) |
| Real Estate, Rental & Leasing | 16 (43.2%) | 21 (56.8%) |
| Professional & Scientific | 17 (25.8%) | 49 (74.2%) |
| Enterprise Management | 0 (0.0%) | 5 (100.0%) |
| Administrative & Support | 36 (80.0%) | 9 (20.0%) |
| Educational Services | 35 (23.0%) | 117 (77.0%) |
| Health Care & Social Assistance | 16 (7.0%) | 213 (93.0%) |
| Arts, Entertainment & Recreation | 11 (44.0%) | 14 (56.0%) |
| Accommodation & Food Services | 24 (48.0%) | 26 (52.0%) |
| Public Administration | 61 (49.2%) | 63 (50.8%) |
| Total | 1,157 (55.7%) | 919 (44.3%) |
Education in Phillips County
School Enrollment in Phillips County
The most common levels of schooling among the 1,185 students in Phillips County are middle school (282 | 23.8%), high school (282 | 23.8%), and elementary school (280 | 23.6%).
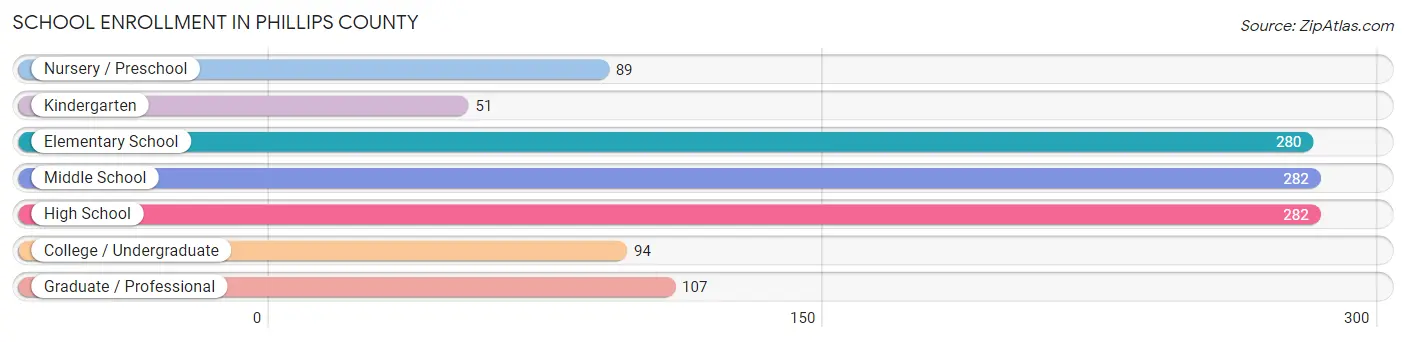
| School Level | # Students | % Students |
| Nursery / Preschool | 89 | 7.5% |
| Kindergarten | 51 | 4.3% |
| Elementary School | 280 | 23.6% |
| Middle School | 282 | 23.8% |
| High School | 282 | 23.8% |
| College / Undergraduate | 94 | 7.9% |
| Graduate / Professional | 107 | 9.0% |
| Total | 1,185 | 100.0% |
School Enrollment by Age by Funding Source in Phillips County
Out of a total of 1,185 students who are enrolled in schools in Phillips County, 39 (3.3%) attend a private institution, while the remaining 1,146 (96.7%) are enrolled in public schools. The age group of 20 to 24 year olds has the highest likelihood of being enrolled in private schools, with 12 (14.3% in the age bracket) enrolled. Conversely, the age group of 3 to 4 year olds has the lowest likelihood of being enrolled in a private school, with 53 (100.0% in the age bracket) attending a public institution.
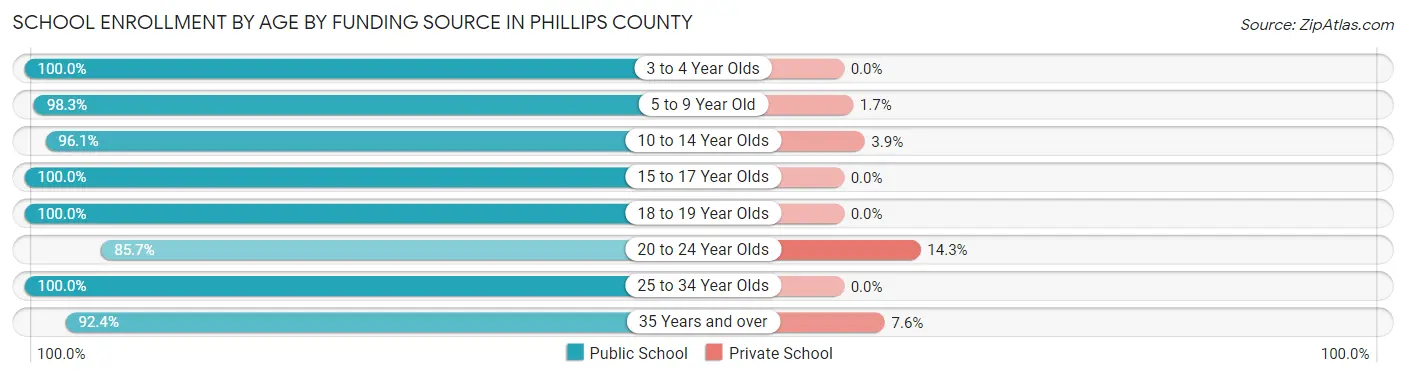
| Age Bracket | Public School | Private School |
| 3 to 4 Year Olds | 53 (100.0%) | 0 (0.0%) |
| 5 to 9 Year Old | 343 (98.3%) | 6 (1.7%) |
| 10 to 14 Year Olds | 324 (96.1%) | 13 (3.9%) |
| 15 to 17 Year Olds | 121 (100.0%) | 0 (0.0%) |
| 18 to 19 Year Olds | 82 (100.0%) | 0 (0.0%) |
| 20 to 24 Year Olds | 72 (85.7%) | 12 (14.3%) |
| 25 to 34 Year Olds | 54 (100.0%) | 0 (0.0%) |
| 35 Years and over | 97 (92.4%) | 8 (7.6%) |
| Total | 1,146 (96.7%) | 39 (3.3%) |
Educational Attainment by Field of Study in Phillips County
Business (199 | 24.2%), education (135 | 16.4%), bio, nature & agricultural (122 | 14.8%), communications (68 | 8.3%), and engineering (58 | 7.0%) are the most common fields of study among 823 individuals in Phillips County who have obtained a bachelor's degree or higher.
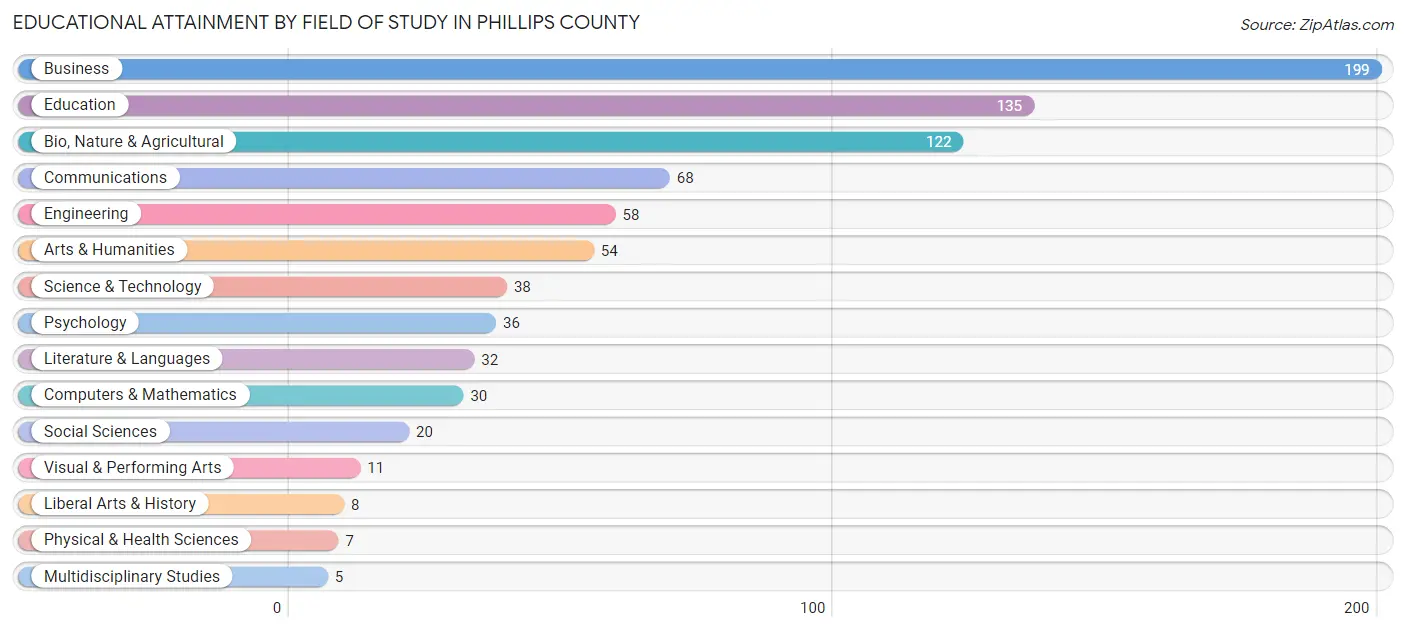
| Field of Study | # Graduates | % Graduates |
| Computers & Mathematics | 30 | 3.6% |
| Bio, Nature & Agricultural | 122 | 14.8% |
| Physical & Health Sciences | 7 | 0.9% |
| Psychology | 36 | 4.4% |
| Social Sciences | 20 | 2.4% |
| Engineering | 58 | 7.0% |
| Multidisciplinary Studies | 5 | 0.6% |
| Science & Technology | 38 | 4.6% |
| Business | 199 | 24.2% |
| Education | 135 | 16.4% |
| Literature & Languages | 32 | 3.9% |
| Liberal Arts & History | 8 | 1.0% |
| Visual & Performing Arts | 11 | 1.3% |
| Communications | 68 | 8.3% |
| Arts & Humanities | 54 | 6.6% |
| Total | 823 | 100.0% |
Transportation & Commute in Phillips County
Vehicle Availability by Sex in Phillips County
The most prevalent vehicle ownership categories in Phillips County are males with 2 vehicles (494, accounting for 43.3%) and females with 2 vehicles (368, making up 54.1%).
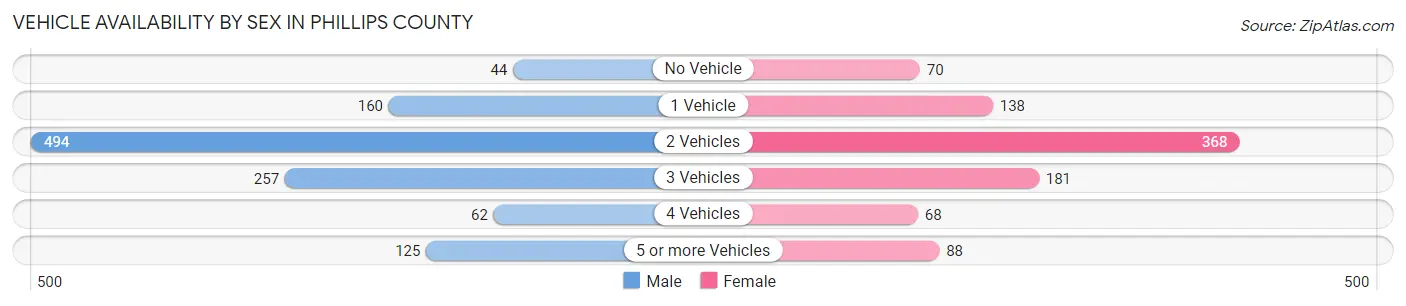
| Vehicles Available | Male | Female |
| No Vehicle | 44 (3.8%) | 70 (7.7%) |
| 1 Vehicle | 160 (14.0%) | 138 (15.1%) |
| 2 Vehicles | 494 (43.3%) | 368 (40.3%) |
| 3 Vehicles | 257 (22.5%) | 181 (19.8%) |
| 4 Vehicles | 62 (5.4%) | 68 (7.4%) |
| 5 or more Vehicles | 125 (11.0%) | 88 (9.6%) |
| Total | 1,142 (100.0%) | 913 (100.0%) |
Commute Time in Phillips County
The most frequently occuring commute durations in Phillips County are 5 to 9 minutes (553 commuters, 29.5%), less than 5 minutes (284 commuters, 15.1%), and 15 to 19 minutes (174 commuters, 9.3%).
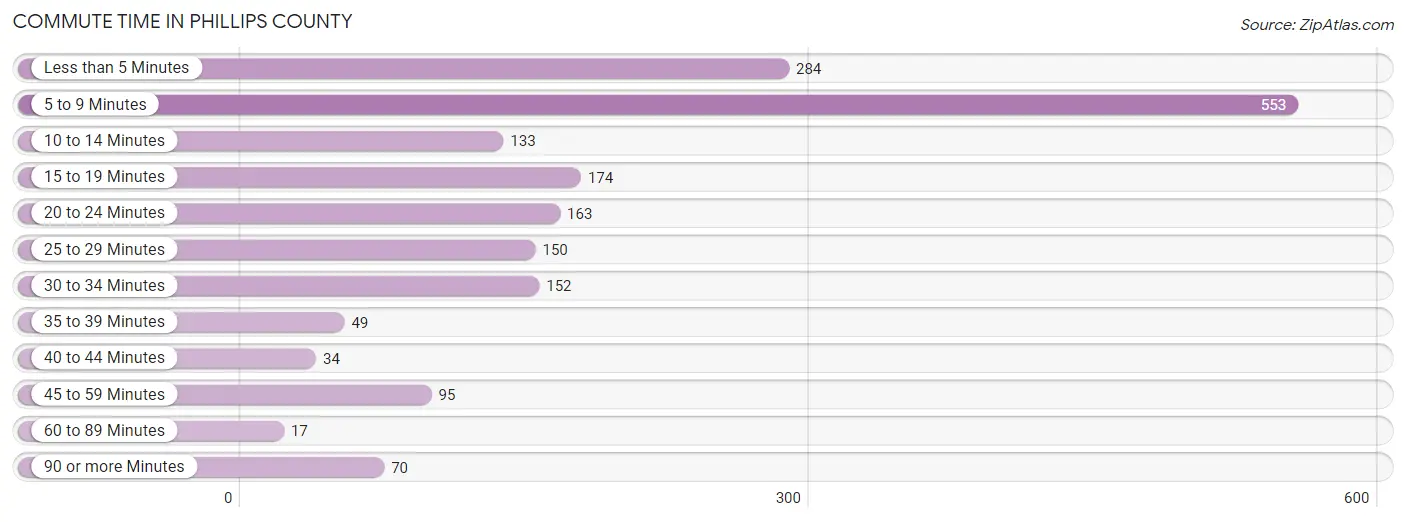
| Commute Time | # Commuters | % Commuters |
| Less than 5 Minutes | 284 | 15.1% |
| 5 to 9 Minutes | 553 | 29.5% |
| 10 to 14 Minutes | 133 | 7.1% |
| 15 to 19 Minutes | 174 | 9.3% |
| 20 to 24 Minutes | 163 | 8.7% |
| 25 to 29 Minutes | 150 | 8.0% |
| 30 to 34 Minutes | 152 | 8.1% |
| 35 to 39 Minutes | 49 | 2.6% |
| 40 to 44 Minutes | 34 | 1.8% |
| 45 to 59 Minutes | 95 | 5.1% |
| 60 to 89 Minutes | 17 | 0.9% |
| 90 or more Minutes | 70 | 3.7% |
Commute Time by Sex in Phillips County
The most common commute times in Phillips County are 5 to 9 minutes (298 commuters, 29.8%) for males and 5 to 9 minutes (255 commuters, 29.2%) for females.
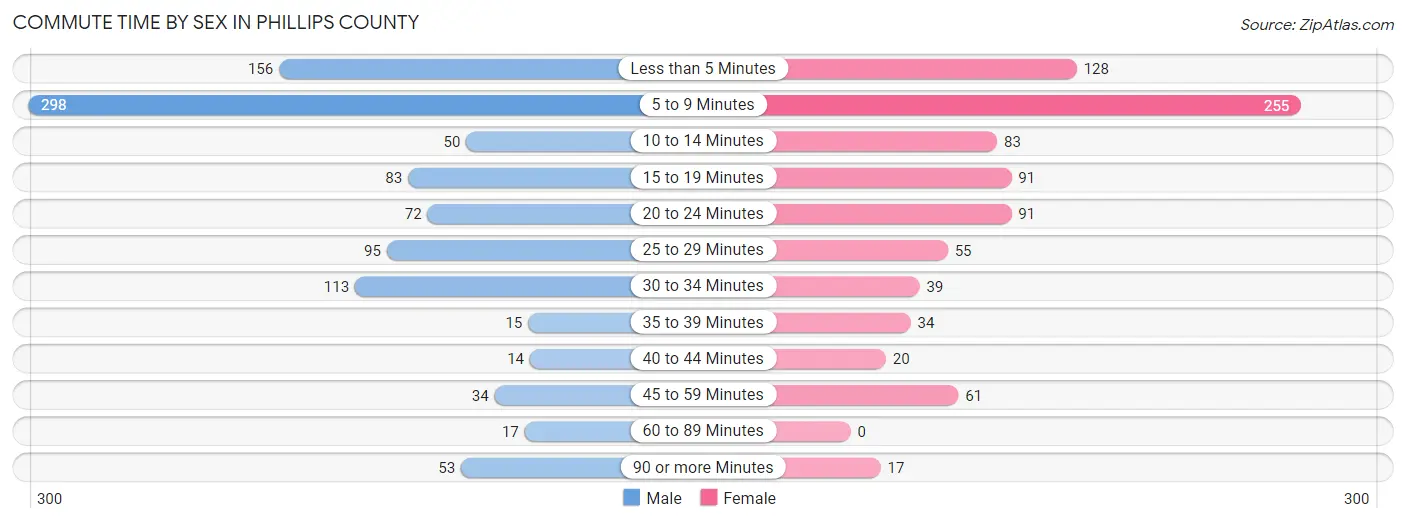
| Commute Time | Male | Female |
| Less than 5 Minutes | 156 (15.6%) | 128 (14.6%) |
| 5 to 9 Minutes | 298 (29.8%) | 255 (29.2%) |
| 10 to 14 Minutes | 50 (5.0%) | 83 (9.5%) |
| 15 to 19 Minutes | 83 (8.3%) | 91 (10.4%) |
| 20 to 24 Minutes | 72 (7.2%) | 91 (10.4%) |
| 25 to 29 Minutes | 95 (9.5%) | 55 (6.3%) |
| 30 to 34 Minutes | 113 (11.3%) | 39 (4.5%) |
| 35 to 39 Minutes | 15 (1.5%) | 34 (3.9%) |
| 40 to 44 Minutes | 14 (1.4%) | 20 (2.3%) |
| 45 to 59 Minutes | 34 (3.4%) | 61 (7.0%) |
| 60 to 89 Minutes | 17 (1.7%) | 0 (0.0%) |
| 90 or more Minutes | 53 (5.3%) | 17 (1.9%) |
Time of Departure to Work by Sex in Phillips County
The most frequent times of departure to work in Phillips County are 7:30 AM to 7:59 AM (191, 19.1%) for males and 7:30 AM to 7:59 AM (243, 27.8%) for females.
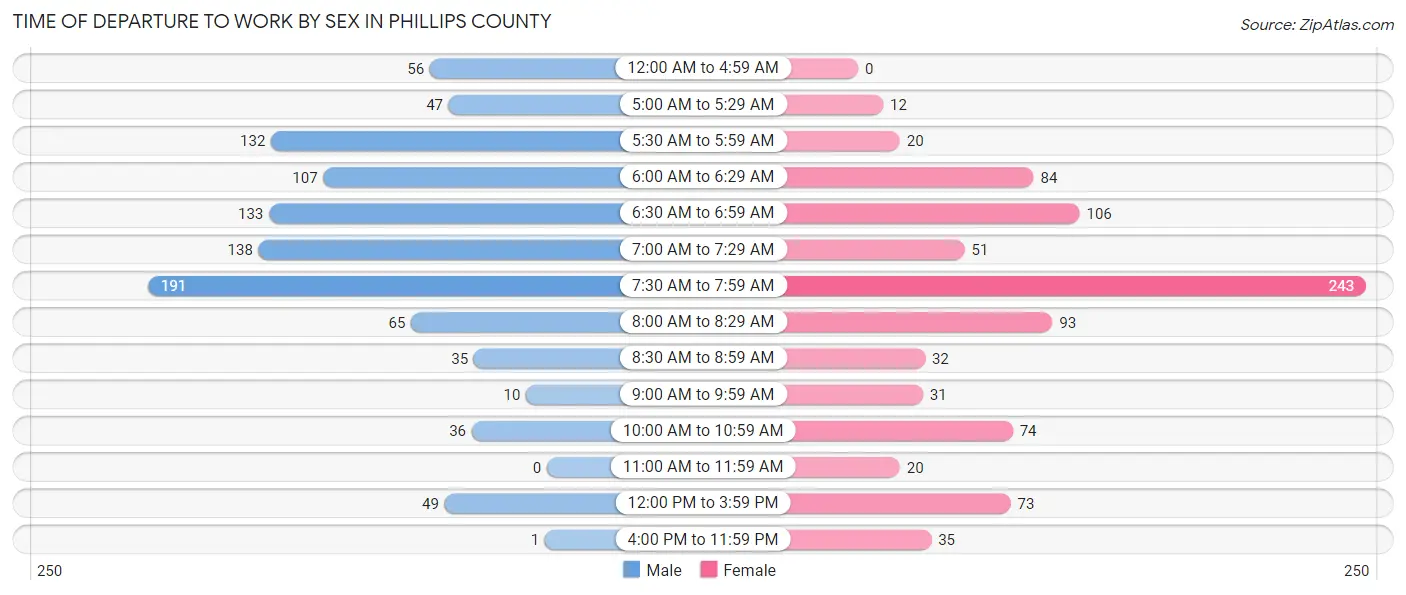
| Time of Departure | Male | Female |
| 12:00 AM to 4:59 AM | 56 (5.6%) | 0 (0.0%) |
| 5:00 AM to 5:29 AM | 47 (4.7%) | 12 (1.4%) |
| 5:30 AM to 5:59 AM | 132 (13.2%) | 20 (2.3%) |
| 6:00 AM to 6:29 AM | 107 (10.7%) | 84 (9.6%) |
| 6:30 AM to 6:59 AM | 133 (13.3%) | 106 (12.1%) |
| 7:00 AM to 7:29 AM | 138 (13.8%) | 51 (5.8%) |
| 7:30 AM to 7:59 AM | 191 (19.1%) | 243 (27.8%) |
| 8:00 AM to 8:29 AM | 65 (6.5%) | 93 (10.6%) |
| 8:30 AM to 8:59 AM | 35 (3.5%) | 32 (3.7%) |
| 9:00 AM to 9:59 AM | 10 (1.0%) | 31 (3.5%) |
| 10:00 AM to 10:59 AM | 36 (3.6%) | 74 (8.5%) |
| 11:00 AM to 11:59 AM | 0 (0.0%) | 20 (2.3%) |
| 12:00 PM to 3:59 PM | 49 (4.9%) | 73 (8.4%) |
| 4:00 PM to 11:59 PM | 1 (0.1%) | 35 (4.0%) |
| Total | 1,000 (100.0%) | 874 (100.0%) |
Housing Occupancy in Phillips County
Occupancy by Ownership in Phillips County
Of the total 1,760 dwellings in Phillips County, owner-occupied units account for 1,319 (74.9%), while renter-occupied units make up 441 (25.1%).
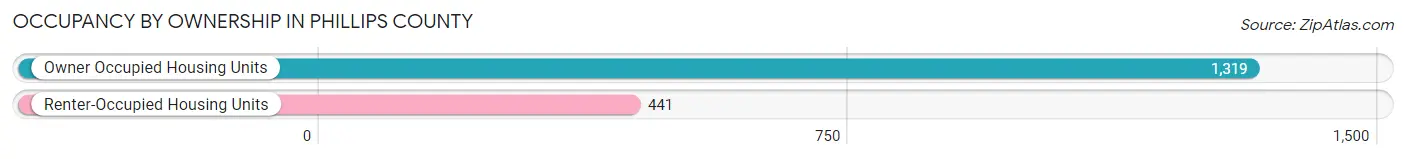
| Occupancy | # Housing Units | % Housing Units |
| Owner Occupied Housing Units | 1,319 | 74.9% |
| Renter-Occupied Housing Units | 441 | 25.1% |
| Total Occupied Housing Units | 1,760 | 100.0% |
Occupancy by Household Size in Phillips County
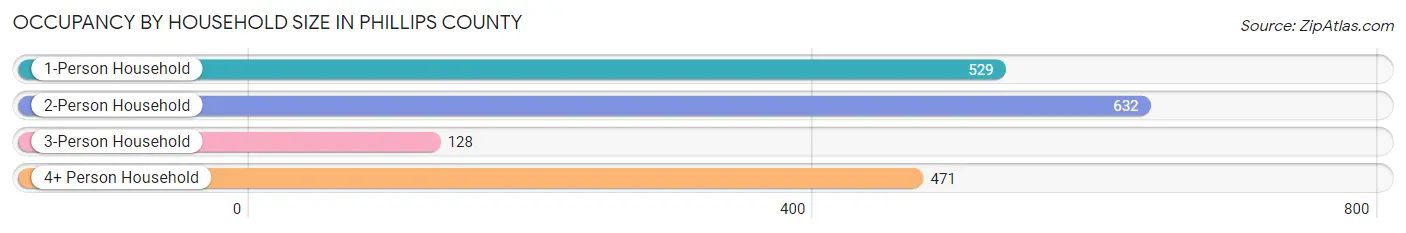
| Household Size | # Housing Units | % Housing Units |
| 1-Person Household | 529 | 30.1% |
| 2-Person Household | 632 | 35.9% |
| 3-Person Household | 128 | 7.3% |
| 4+ Person Household | 471 | 26.8% |
| Total Housing Units | 1,760 | 100.0% |
Occupancy by Ownership by Household Size in Phillips County
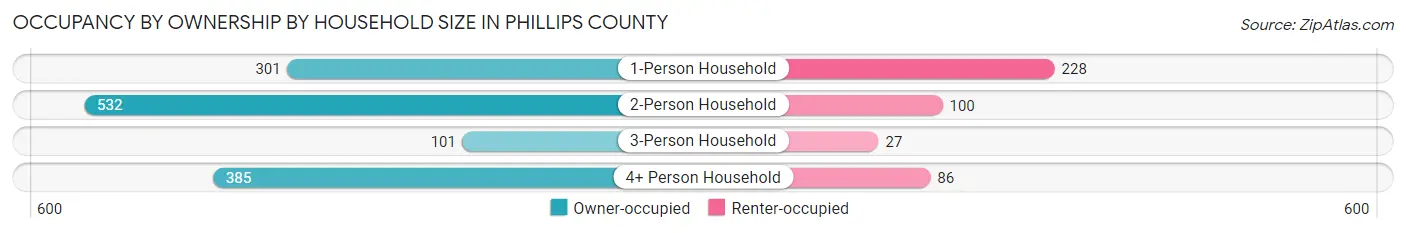
| Household Size | Owner-occupied | Renter-occupied |
| 1-Person Household | 301 (56.9%) | 228 (43.1%) |
| 2-Person Household | 532 (84.2%) | 100 (15.8%) |
| 3-Person Household | 101 (78.9%) | 27 (21.1%) |
| 4+ Person Household | 385 (81.7%) | 86 (18.3%) |
| Total Housing Units | 1,319 (74.9%) | 441 (25.1%) |
Occupancy by Educational Attainment in Phillips County
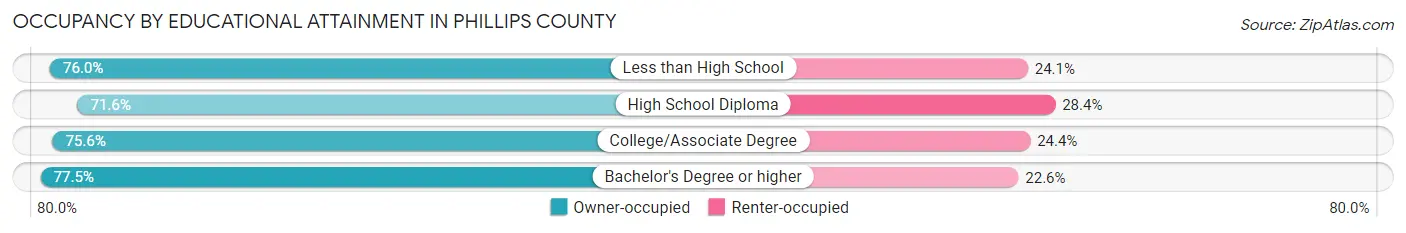
| Household Size | Owner-occupied | Renter-occupied |
| Less than High School | 120 (75.9%) | 38 (24.0%) |
| High School Diploma | 368 (71.6%) | 146 (28.4%) |
| College/Associate Degree | 467 (75.6%) | 151 (24.4%) |
| Bachelor's Degree or higher | 364 (77.4%) | 106 (22.6%) |
Occupancy by Age of Householder in Phillips County
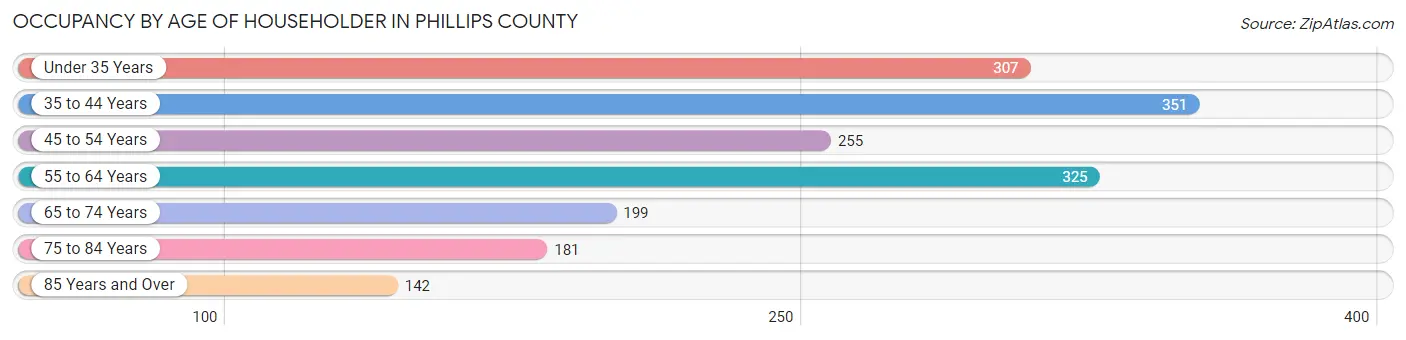
| Age Bracket | # Households | % Households |
| Under 35 Years | 307 | 17.4% |
| 35 to 44 Years | 351 | 19.9% |
| 45 to 54 Years | 255 | 14.5% |
| 55 to 64 Years | 325 | 18.5% |
| 65 to 74 Years | 199 | 11.3% |
| 75 to 84 Years | 181 | 10.3% |
| 85 Years and Over | 142 | 8.1% |
| Total | 1,760 | 100.0% |
Housing Finances in Phillips County
Median Income by Occupancy in Phillips County
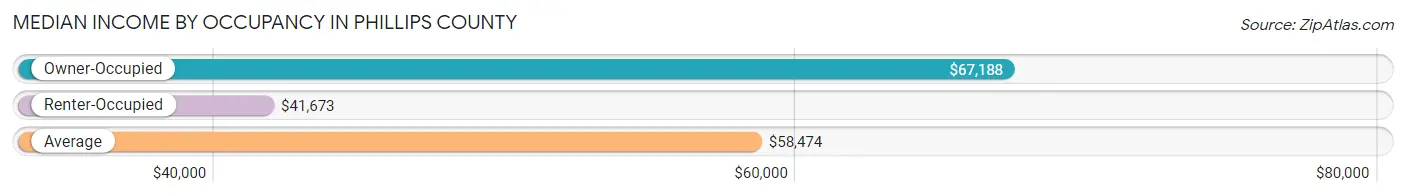
| Occupancy Type | # Households | Median Income |
| Owner-Occupied | 1,319 (74.9%) | $67,188 |
| Renter-Occupied | 441 (25.1%) | $41,673 |
| Average | 1,760 (100.0%) | $58,474 |
Occupancy by Householder Income Bracket in Phillips County
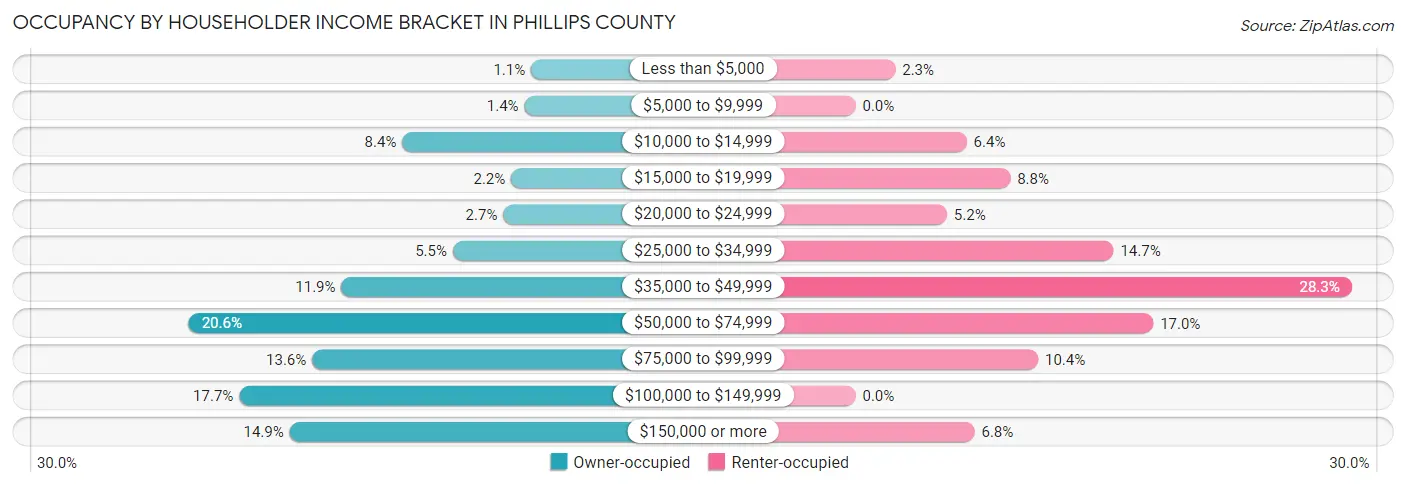
| Income Bracket | Owner-occupied | Renter-occupied |
| Less than $5,000 | 14 (1.1%) | 10 (2.3%) |
| $5,000 to $9,999 | 19 (1.4%) | 0 (0.0%) |
| $10,000 to $14,999 | 111 (8.4%) | 28 (6.4%) |
| $15,000 to $19,999 | 29 (2.2%) | 39 (8.8%) |
| $20,000 to $24,999 | 35 (2.6%) | 23 (5.2%) |
| $25,000 to $34,999 | 73 (5.5%) | 65 (14.7%) |
| $35,000 to $49,999 | 157 (11.9%) | 125 (28.3%) |
| $50,000 to $74,999 | 272 (20.6%) | 75 (17.0%) |
| $75,000 to $99,999 | 179 (13.6%) | 46 (10.4%) |
| $100,000 to $149,999 | 234 (17.7%) | 0 (0.0%) |
| $150,000 or more | 196 (14.9%) | 30 (6.8%) |
| Total | 1,319 (100.0%) | 441 (100.0%) |
Monthly Housing Cost Tiers in Phillips County
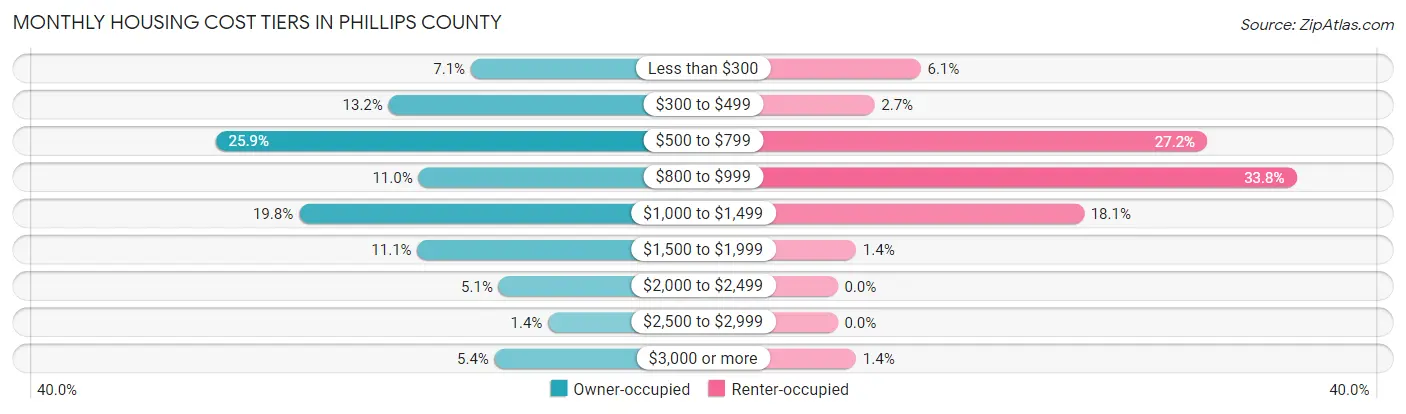
| Monthly Cost | Owner-occupied | Renter-occupied |
| Less than $300 | 94 (7.1%) | 27 (6.1%) |
| $300 to $499 | 174 (13.2%) | 12 (2.7%) |
| $500 to $799 | 342 (25.9%) | 120 (27.2%) |
| $800 to $999 | 145 (11.0%) | 149 (33.8%) |
| $1,000 to $1,499 | 261 (19.8%) | 80 (18.1%) |
| $1,500 to $1,999 | 146 (11.1%) | 6 (1.4%) |
| $2,000 to $2,499 | 67 (5.1%) | 0 (0.0%) |
| $2,500 to $2,999 | 19 (1.4%) | 0 (0.0%) |
| $3,000 or more | 71 (5.4%) | 6 (1.4%) |
| Total | 1,319 (100.0%) | 441 (100.0%) |
Physical Housing Characteristics in Phillips County
Housing Structures in Phillips County
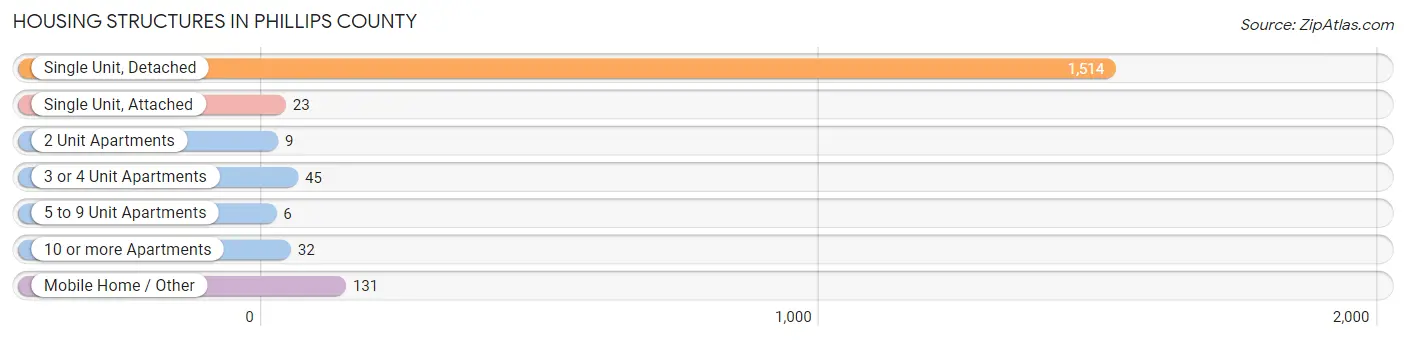
| Structure Type | # Housing Units | % Housing Units |
| Single Unit, Detached | 1,514 | 86.0% |
| Single Unit, Attached | 23 | 1.3% |
| 2 Unit Apartments | 9 | 0.5% |
| 3 or 4 Unit Apartments | 45 | 2.6% |
| 5 to 9 Unit Apartments | 6 | 0.3% |
| 10 or more Apartments | 32 | 1.8% |
| Mobile Home / Other | 131 | 7.4% |
| Total | 1,760 | 100.0% |
Housing Structures by Occupancy in Phillips County

| Structure Type | Owner-occupied | Renter-occupied |
| Single Unit, Detached | 1,248 (82.4%) | 266 (17.6%) |
| Single Unit, Attached | 19 (82.6%) | 4 (17.4%) |
| 2 Unit Apartments | 0 (0.0%) | 9 (100.0%) |
| 3 or 4 Unit Apartments | 0 (0.0%) | 45 (100.0%) |
| 5 to 9 Unit Apartments | 0 (0.0%) | 6 (100.0%) |
| 10 or more Apartments | 0 (0.0%) | 32 (100.0%) |
| Mobile Home / Other | 52 (39.7%) | 79 (60.3%) |
| Total | 1,319 (74.9%) | 441 (25.1%) |
Housing Structures by Number of Rooms in Phillips County
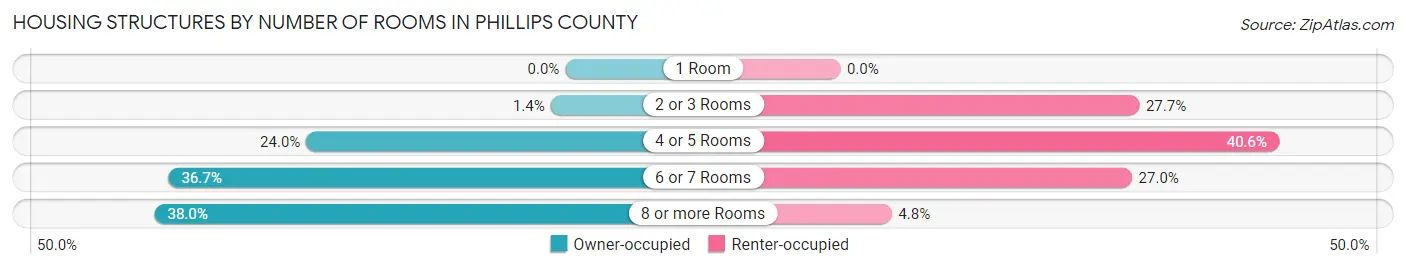
| Number of Rooms | Owner-occupied | Renter-occupied |
| 1 Room | 0 (0.0%) | 0 (0.0%) |
| 2 or 3 Rooms | 18 (1.4%) | 122 (27.7%) |
| 4 or 5 Rooms | 316 (24.0%) | 179 (40.6%) |
| 6 or 7 Rooms | 484 (36.7%) | 119 (27.0%) |
| 8 or more Rooms | 501 (38.0%) | 21 (4.8%) |
| Total | 1,319 (100.0%) | 441 (100.0%) |
Housing Structure by Heating Type in Phillips County
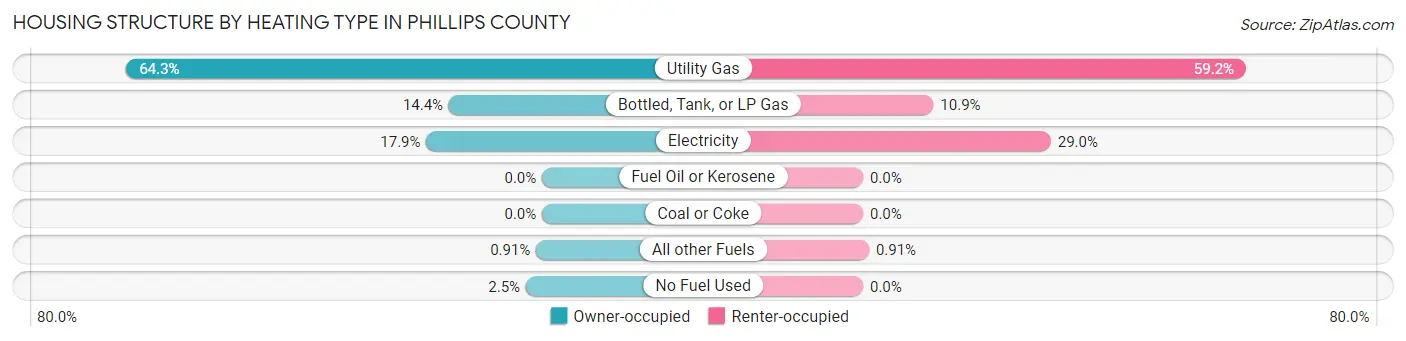
| Heating Type | Owner-occupied | Renter-occupied |
| Utility Gas | 848 (64.3%) | 261 (59.2%) |
| Bottled, Tank, or LP Gas | 190 (14.4%) | 48 (10.9%) |
| Electricity | 236 (17.9%) | 128 (29.0%) |
| Fuel Oil or Kerosene | 0 (0.0%) | 0 (0.0%) |
| Coal or Coke | 0 (0.0%) | 0 (0.0%) |
| All other Fuels | 12 (0.9%) | 4 (0.9%) |
| No Fuel Used | 33 (2.5%) | 0 (0.0%) |
| Total | 1,319 (100.0%) | 441 (100.0%) |
Household Vehicle Usage in Phillips County
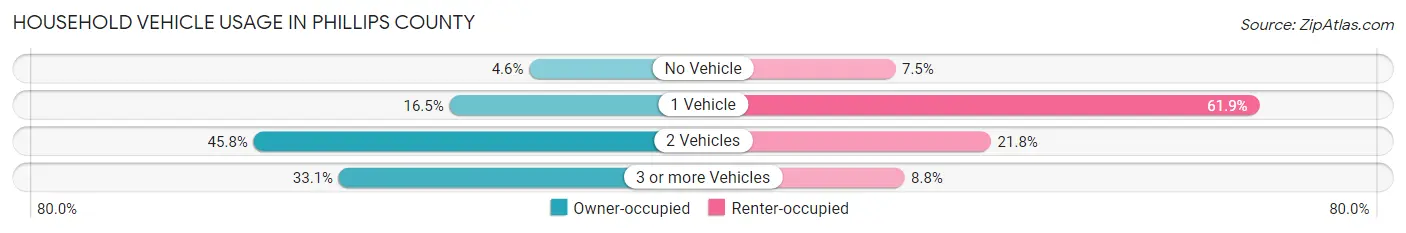
| Vehicles per Household | Owner-occupied | Renter-occupied |
| No Vehicle | 61 (4.6%) | 33 (7.5%) |
| 1 Vehicle | 218 (16.5%) | 273 (61.9%) |
| 2 Vehicles | 604 (45.8%) | 96 (21.8%) |
| 3 or more Vehicles | 436 (33.1%) | 39 (8.8%) |
| Total | 1,319 (100.0%) | 441 (100.0%) |
Real Estate & Mortgages in Phillips County
Real Estate and Mortgage Overview in Phillips County
| Characteristic | Without Mortgage | With Mortgage |
| Housing Units | 613 | 706 |
| Median Property Value | $254,300 | $260,100 |
| Median Household Income | $65,750 | $80 |
| Monthly Housing Costs | $529 | $71 |
| Real Estate Taxes | $1,172 | $13 |
Property Value by Mortgage Status in Phillips County
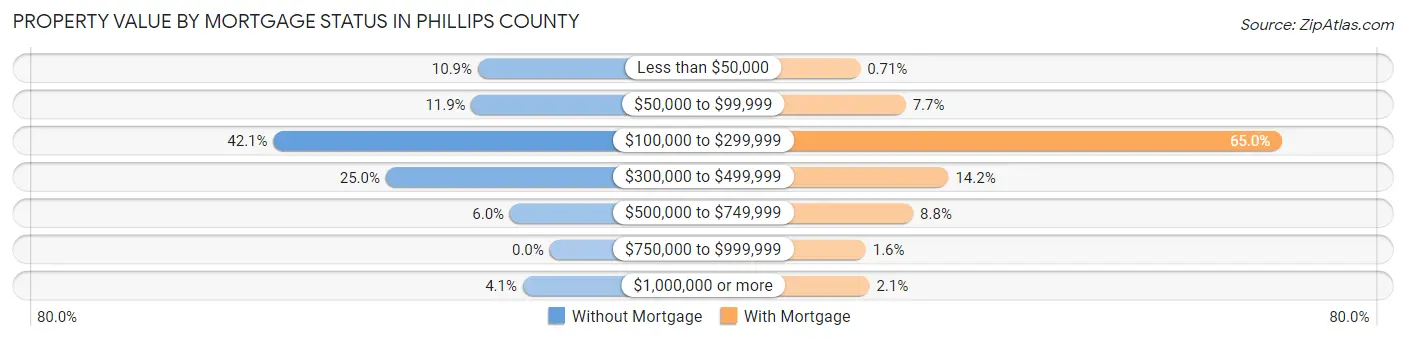
| Property Value | Without Mortgage | With Mortgage |
| Less than $50,000 | 67 (10.9%) | 5 (0.7%) |
| $50,000 to $99,999 | 73 (11.9%) | 54 (7.6%) |
| $100,000 to $299,999 | 258 (42.1%) | 459 (65.0%) |
| $300,000 to $499,999 | 153 (25.0%) | 100 (14.2%) |
| $500,000 to $749,999 | 37 (6.0%) | 62 (8.8%) |
| $750,000 to $999,999 | 0 (0.0%) | 11 (1.6%) |
| $1,000,000 or more | 25 (4.1%) | 15 (2.1%) |
| Total | 613 (100.0%) | 706 (100.0%) |
Household Income by Mortgage Status in Phillips County
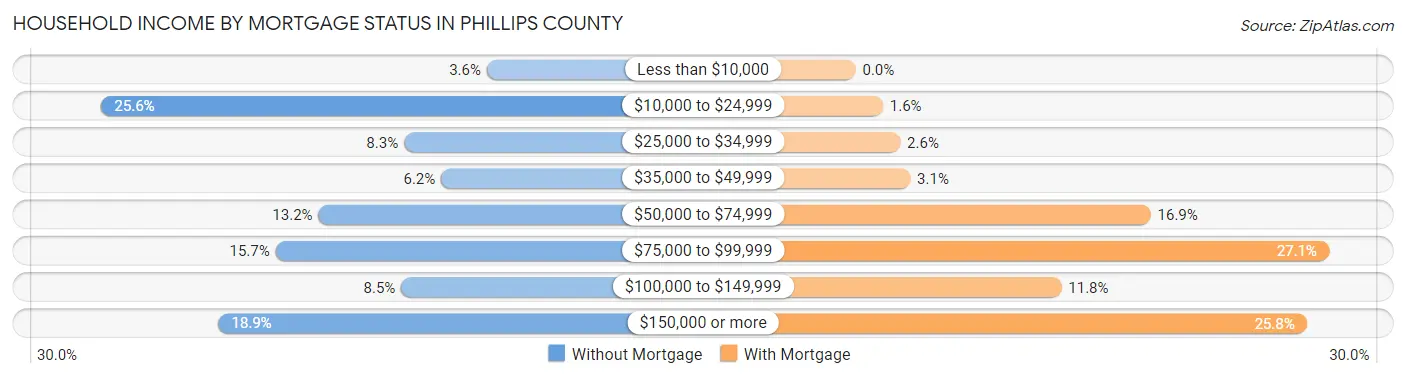
| Household Income | Without Mortgage | With Mortgage |
| Less than $10,000 | 22 (3.6%) | 0 (0.0%) |
| $10,000 to $24,999 | 157 (25.6%) | 11 (1.6%) |
| $25,000 to $34,999 | 51 (8.3%) | 18 (2.5%) |
| $35,000 to $49,999 | 38 (6.2%) | 22 (3.1%) |
| $50,000 to $74,999 | 81 (13.2%) | 119 (16.9%) |
| $75,000 to $99,999 | 96 (15.7%) | 191 (27.1%) |
| $100,000 to $149,999 | 52 (8.5%) | 83 (11.8%) |
| $150,000 or more | 116 (18.9%) | 182 (25.8%) |
| Total | 613 (100.0%) | 706 (100.0%) |
Property Value to Household Income Ratio in Phillips County
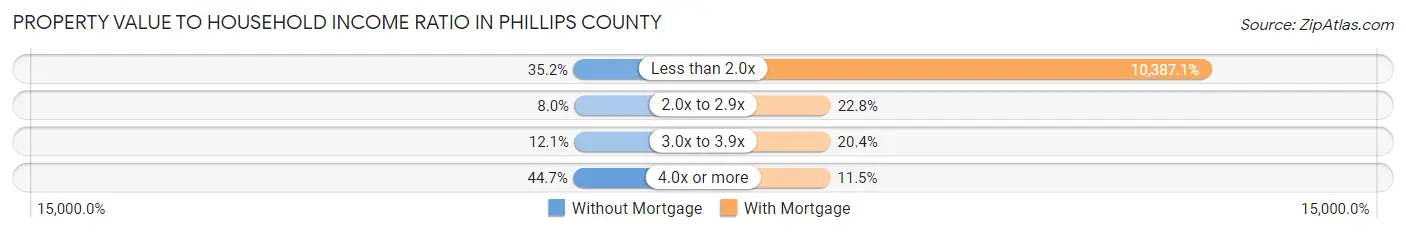
| Value-to-Income Ratio | Without Mortgage | With Mortgage |
| Less than 2.0x | 216 (35.2%) | 73,333 (10,387.1%) |
| 2.0x to 2.9x | 49 (8.0%) | 161 (22.8%) |
| 3.0x to 3.9x | 74 (12.1%) | 144 (20.4%) |
| 4.0x or more | 274 (44.7%) | 81 (11.5%) |
| Total | 613 (100.0%) | 706 (100.0%) |
Real Estate Taxes by Mortgage Status in Phillips County

| Property Taxes | Without Mortgage | With Mortgage |
| Less than $800 | 216 (35.2%) | 4 (0.6%) |
| $800 to $1,499 | 135 (22.0%) | 164 (23.2%) |
| $800 to $1,499 | 221 (36.0%) | 272 (38.5%) |
| Total | 613 (100.0%) | 706 (100.0%) |
Health & Disability in Phillips County
Health Insurance Coverage by Age in Phillips County
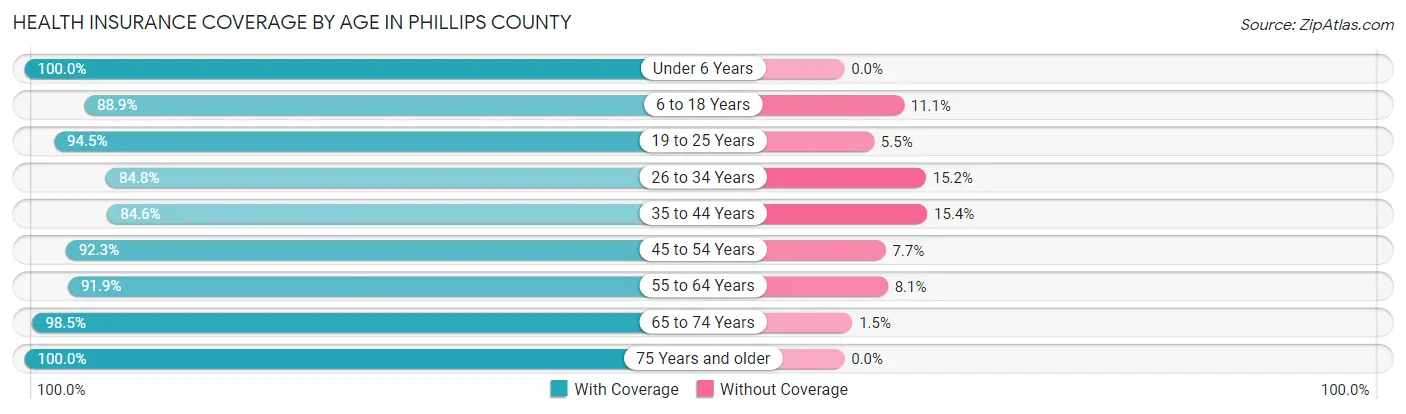
| Age Bracket | With Coverage | Without Coverage |
| Under 6 Years | 413 (100.0%) | 0 (0.0%) |
| 6 to 18 Years | 705 (88.9%) | 88 (11.1%) |
| 19 to 25 Years | 325 (94.5%) | 19 (5.5%) |
| 26 to 34 Years | 318 (84.8%) | 57 (15.2%) |
| 35 to 44 Years | 553 (84.6%) | 101 (15.4%) |
| 45 to 54 Years | 505 (92.3%) | 42 (7.7%) |
| 55 to 64 Years | 488 (91.9%) | 43 (8.1%) |
| 65 to 74 Years | 332 (98.5%) | 5 (1.5%) |
| 75 Years and older | 416 (100.0%) | 0 (0.0%) |
| Total | 4,055 (91.9%) | 355 (8.1%) |
Health Insurance Coverage by Citizenship Status in Phillips County
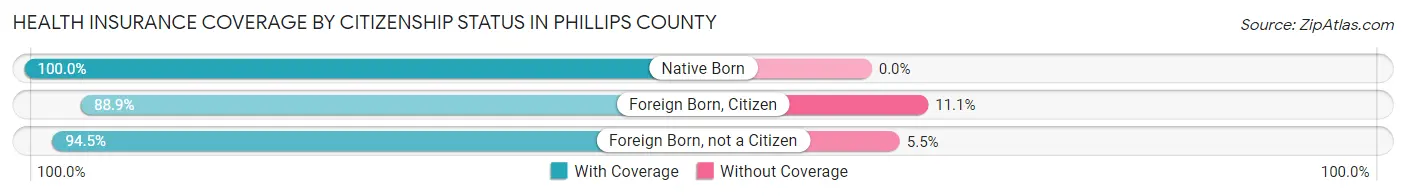
| Citizenship Status | With Coverage | Without Coverage |
| Native Born | 413 (100.0%) | 0 (0.0%) |
| Foreign Born, Citizen | 705 (88.9%) | 88 (11.1%) |
| Foreign Born, not a Citizen | 325 (94.5%) | 19 (5.5%) |
Health Insurance Coverage by Household Income in Phillips County
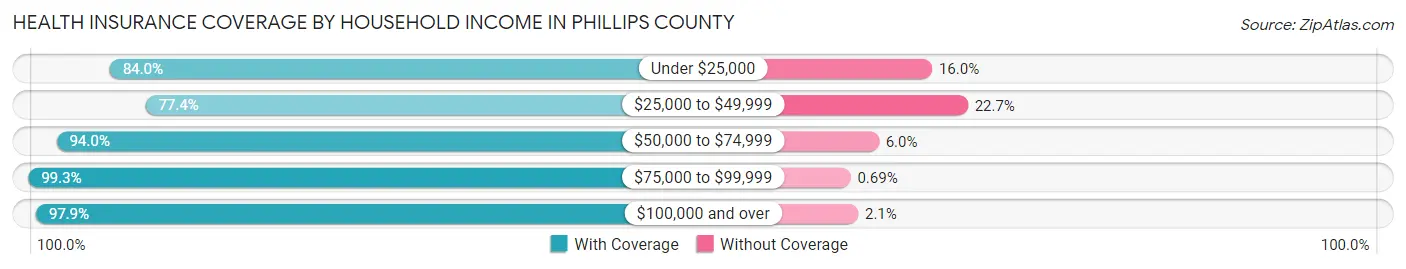
| Household Income | With Coverage | Without Coverage |
| Under $25,000 | 537 (84.0%) | 102 (16.0%) |
| $25,000 to $49,999 | 567 (77.3%) | 166 (22.7%) |
| $50,000 to $74,999 | 755 (94.0%) | 48 (6.0%) |
| $75,000 to $99,999 | 575 (99.3%) | 4 (0.7%) |
| $100,000 and over | 1,621 (97.9%) | 35 (2.1%) |
Public vs Private Health Insurance Coverage by Age in Phillips County
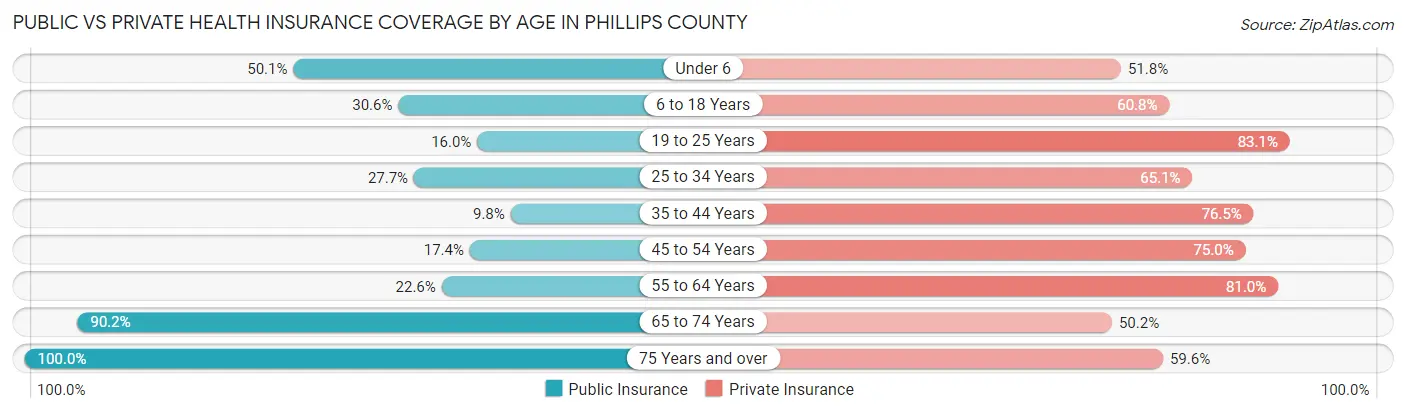
| Age Bracket | Public Insurance | Private Insurance |
| Under 6 | 207 (50.1%) | 214 (51.8%) |
| 6 to 18 Years | 243 (30.6%) | 482 (60.8%) |
| 19 to 25 Years | 55 (16.0%) | 286 (83.1%) |
| 25 to 34 Years | 104 (27.7%) | 244 (65.1%) |
| 35 to 44 Years | 64 (9.8%) | 500 (76.4%) |
| 45 to 54 Years | 95 (17.4%) | 410 (75.0%) |
| 55 to 64 Years | 120 (22.6%) | 430 (81.0%) |
| 65 to 74 Years | 304 (90.2%) | 169 (50.1%) |
| 75 Years and over | 416 (100.0%) | 248 (59.6%) |
| Total | 1,608 (36.5%) | 2,983 (67.6%) |
Disability Status by Sex by Age in Phillips County
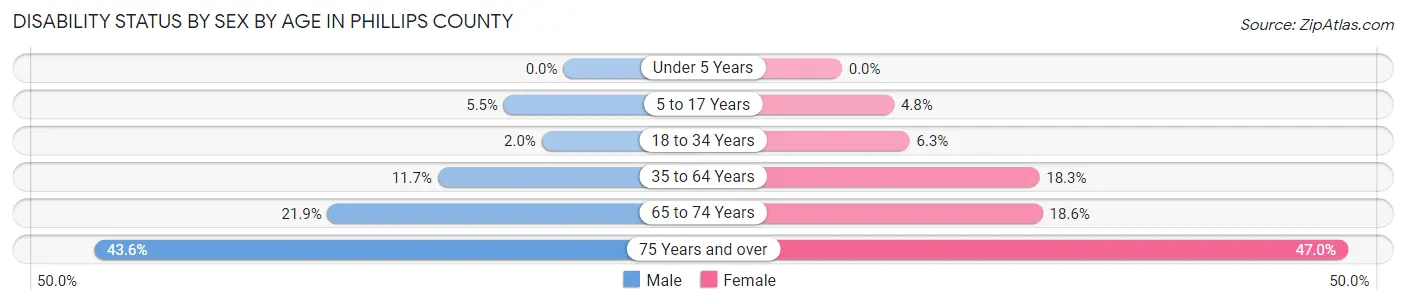
| Age Bracket | Male | Female |
| Under 5 Years | 0 (0.0%) | 0 (0.0%) |
| 5 to 17 Years | 24 (5.5%) | 18 (4.8%) |
| 18 to 34 Years | 9 (2.0%) | 21 (6.3%) |
| 35 to 64 Years | 104 (11.7%) | 154 (18.3%) |
| 65 to 74 Years | 35 (21.9%) | 33 (18.6%) |
| 75 Years and over | 81 (43.5%) | 108 (47.0%) |
Disability Class by Sex by Age in Phillips County
Disability Class: Hearing Difficulty
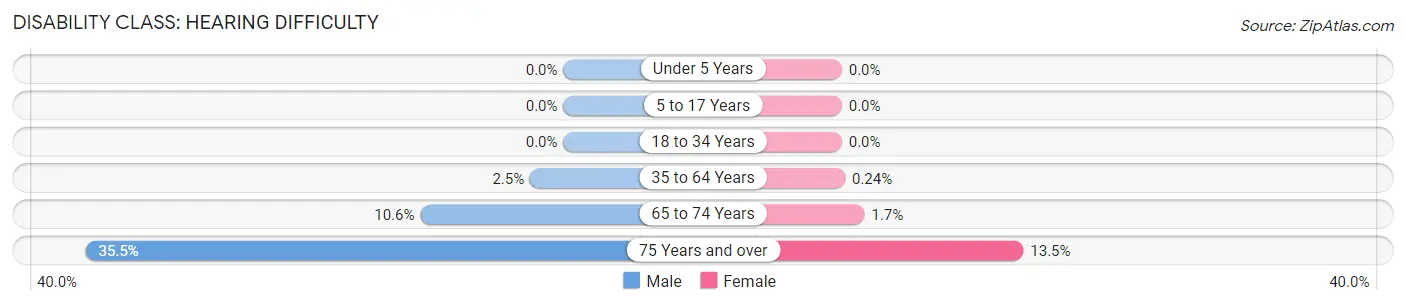
| Age Bracket | Male | Female |
| Under 5 Years | 0 (0.0%) | 0 (0.0%) |
| 5 to 17 Years | 0 (0.0%) | 0 (0.0%) |
| 18 to 34 Years | 0 (0.0%) | 0 (0.0%) |
| 35 to 64 Years | 22 (2.5%) | 2 (0.2%) |
| 65 to 74 Years | 17 (10.6%) | 3 (1.7%) |
| 75 Years and over | 66 (35.5%) | 31 (13.5%) |
Disability Class: Vision Difficulty
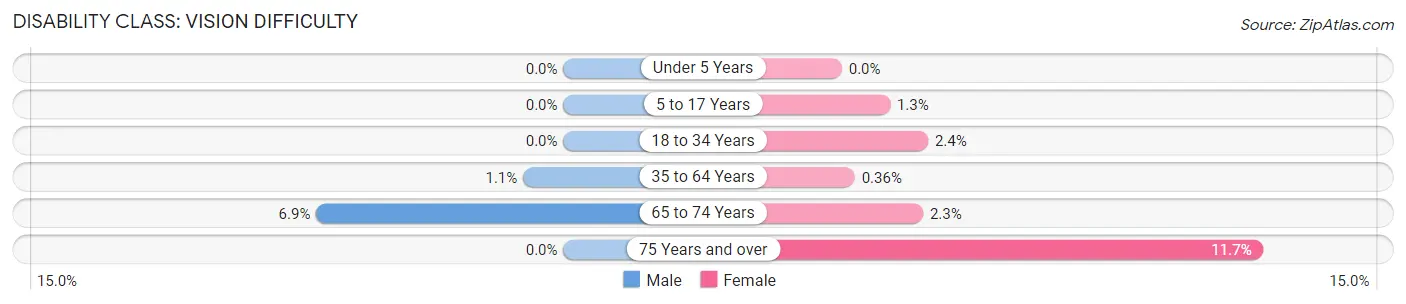
| Age Bracket | Male | Female |
| Under 5 Years | 0 (0.0%) | 0 (0.0%) |
| 5 to 17 Years | 0 (0.0%) | 5 (1.3%) |
| 18 to 34 Years | 0 (0.0%) | 8 (2.4%) |
| 35 to 64 Years | 10 (1.1%) | 3 (0.4%) |
| 65 to 74 Years | 11 (6.9%) | 4 (2.3%) |
| 75 Years and over | 0 (0.0%) | 27 (11.7%) |
Disability Class: Cognitive Difficulty
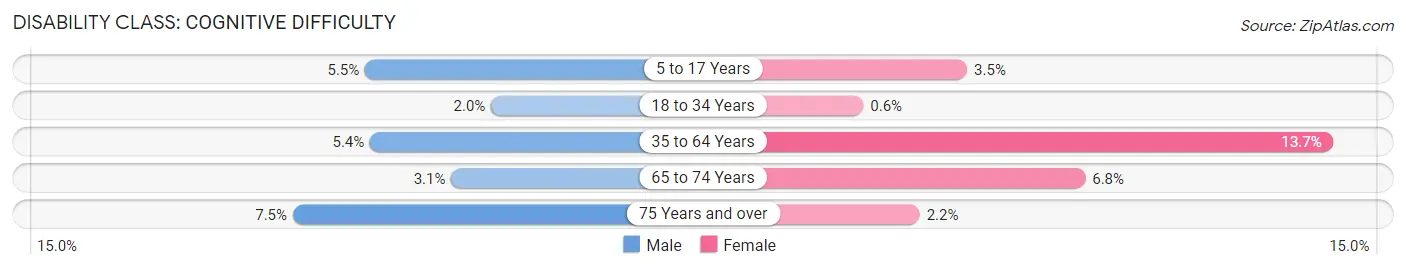
| Age Bracket | Male | Female |
| 5 to 17 Years | 24 (5.5%) | 13 (3.5%) |
| 18 to 34 Years | 9 (2.0%) | 2 (0.6%) |
| 35 to 64 Years | 48 (5.4%) | 115 (13.7%) |
| 65 to 74 Years | 5 (3.1%) | 12 (6.8%) |
| 75 Years and over | 14 (7.5%) | 5 (2.2%) |
Disability Class: Ambulatory Difficulty
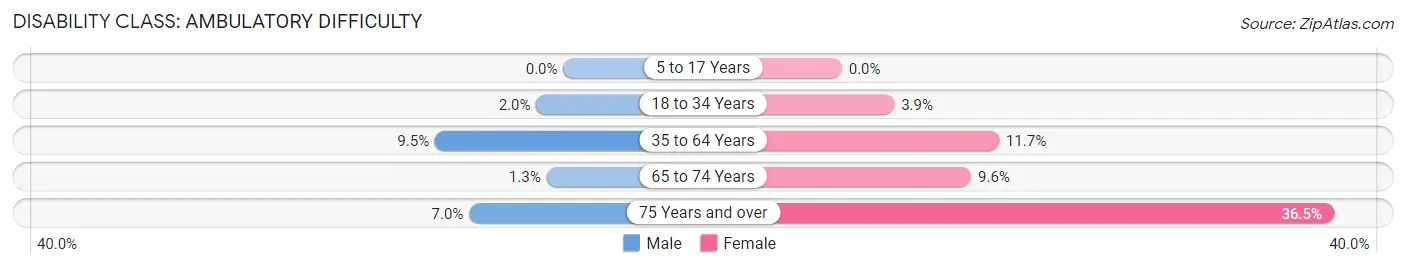
| Age Bracket | Male | Female |
| 5 to 17 Years | 0 (0.0%) | 0 (0.0%) |
| 18 to 34 Years | 9 (2.0%) | 13 (3.9%) |
| 35 to 64 Years | 85 (9.5%) | 98 (11.7%) |
| 65 to 74 Years | 2 (1.3%) | 17 (9.6%) |
| 75 Years and over | 13 (7.0%) | 84 (36.5%) |
Disability Class: Self-Care Difficulty
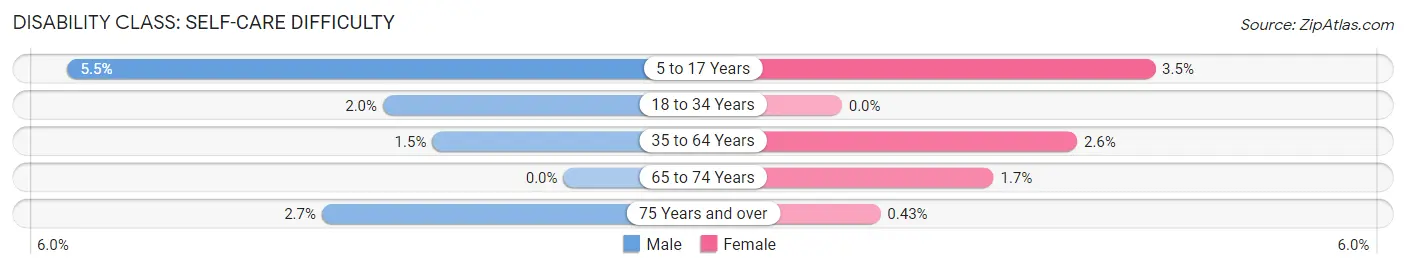
| Age Bracket | Male | Female |
| 5 to 17 Years | 24 (5.5%) | 13 (3.5%) |
| 18 to 34 Years | 9 (2.0%) | 0 (0.0%) |
| 35 to 64 Years | 13 (1.5%) | 22 (2.6%) |
| 65 to 74 Years | 0 (0.0%) | 3 (1.7%) |
| 75 Years and over | 5 (2.7%) | 1 (0.4%) |
Technology Access in Phillips County
Computing Device Access in Phillips County
| Device Type | # Households | % Households |
| Desktop or Laptop | 1,327 | 75.4% |
| Smartphone | 1,382 | 78.5% |
| Tablet | 998 | 56.7% |
| No Computing Device | 173 | 9.8% |
| Total | 1,760 | 100.0% |
Internet Access in Phillips County
| Internet Type | # Households | % Households |
| Dial-Up Internet | 63 | 3.6% |
| Broadband Home | 1,038 | 59.0% |
| Cellular Data Only | 191 | 10.8% |
| Satellite Internet | 194 | 11.0% |
| No Internet | 377 | 21.4% |
| Total | 1,760 | 100.0% |
Phillips County Summary
Phillips County is located in the northeast corner of Colorado, and is bordered by Nebraska to the north and Kansas to the east. The county seat is Holyoke, and the county is named after a prominent early settler, William Phillips. Phillips County covers an area of 1,521 square miles, and has a population of 5,543 as of the 2010 census.
History
Phillips County was established in 1889, and was named after William Phillips, a prominent early settler. The county was originally part of Cheyenne County, and was created when Cheyenne County was divided into two parts. The first settlers in the area were ranchers, who were attracted to the area by the abundance of grass and water. The first town in the county was Holyoke, which was founded in 1887.
The county experienced rapid growth in the early 20th century, as the Great Western Sugar Company built a sugar beet processing plant in Holyoke in 1906. This led to an influx of immigrants from Europe, and the population of the county grew rapidly. The sugar beet industry was the main source of employment in the county until the 1950s, when the industry began to decline.
Geography
Phillips County is located in the northeast corner of Colorado, and is bordered by Nebraska to the north and Kansas to the east. The county covers an area of 1,521 square miles, and is mostly flat, with some rolling hills in the western part of the county. The county is drained by the South Platte River, which flows through the county from north to south.
The county is mostly agricultural, with the majority of the land being used for farming and ranching. The main crops grown in the county are corn, wheat, and sugar beets. The county also has some oil and gas production, as well as some wind energy production.
Economy
The economy of Phillips County is largely based on agriculture, with the majority of the land being used for farming and ranching. The main crops grown in the county are corn, wheat, and sugar beets. The county also has some oil and gas production, as well as some wind energy production.
The county is also home to several manufacturing companies, including a sugar beet processing plant, a feed mill, and a dairy processing plant. The county also has a number of small businesses, including restaurants, retail stores, and service providers.
Demographics
As of the 2010 census, Phillips County had a population of 5,543. The racial makeup of the county was 95.3% White, 0.3% African American, 0.7% Native American, 0.2% Asian, 0.1% Pacific Islander, 2.2% from other races, and 1.3% from two or more races. Hispanic or Latino of any race were 5.3% of the population.
The median income for a household in the county was $37,917, and the median income for a family was $45,938. The per capita income for the county was $18,945. About 11.2% of families and 14.2% of the population were below the poverty line, including 17.2% of those under age 18 and 10.2% of those age 65 or over.
Common Questions
What is Per Capita Income in Phillips County?
Per Capita income in Phillips County is $37,996.
What is the Median Family Income in Phillips County?
Median Family Income in Phillips County is $69,659.
What is the Median Household income in Phillips County?
Median Household Income in Phillips County is $58,474.
What is Income or Wage Gap in Phillips County?
Income or Wage Gap in Phillips County is 35.5%.
Women in Phillips County earn 64.5 cents for every dollar earned by a man.
What is Family Income Deficit in Phillips County?
Family Income Deficit in Phillips County is $6,810.
Families that are below poverty line in Phillips County earn $6,810 less on average than the poverty threshold level.
What is Inequality or Gini Index in Phillips County?
Inequality or Gini Index in Phillips County is 0.51.
What is the Total Population of Phillips County?
Total Population of Phillips County is 4,493.
What is the Total Male Population of Phillips County?
Total Male Population of Phillips County is 2,203.
What is the Total Female Population of Phillips County?
Total Female Population of Phillips County is 2,290.
What is the Ratio of Males per 100 Females in Phillips County?
There are 96.20 Males per 100 Females in Phillips County.
What is the Ratio of Females per 100 Males in Phillips County?
There are 103.95 Females per 100 Males in Phillips County.
What is the Median Population Age in Phillips County?
Median Population Age in Phillips County is 40.6 Years.
What is the Average Family Size in Phillips County
Average Family Size in Phillips County is 3.2 People.
What is the Average Household Size in Phillips County
Average Household Size in Phillips County is 2.5 People.
How Large is the Labor Force in Phillips County?
There are 2,104 People in the Labor Forcein in Phillips County.
What is the Percentage of People in the Labor Force in Phillips County?
61.6% of People are in the Labor Force in Phillips County.
What is the Unemployment Rate in Phillips County?
Unemployment Rate in Phillips County is 1.4%.