Ouray County, CO Map & Demographics
Ouray County Map
Ouray County Overview
$47,768
PER CAPITA INCOME
$89,070
AVG FAMILY INCOME
$78,750
AVG HOUSEHOLD INCOME
27.3%
WAGE / INCOME GAP [ % ]
72.7¢/ $1
WAGE / INCOME GAP [ $ ]
0.44
INEQUALITY / GINI INDEX
4,936
TOTAL POPULATION
2,558
MALE POPULATION
2,378
FEMALE POPULATION
107.57
MALES / 100 FEMALES
92.96
FEMALES / 100 MALES
56.8
MEDIAN AGE
2.5
AVG FAMILY SIZE
2.0
AVG HOUSEHOLD SIZE
2,286
LABOR FORCE [ PEOPLE ]
51.9%
PERCENT IN LABOR FORCE
4.2%
UNEMPLOYMENT RATE
Ouray County Area Codes
Income in Ouray County
Income Overview in Ouray County
Per Capita Income in Ouray County is $47,768, while median incomes of families and households are $89,070 and $78,750 respectively.
| Characteristic | Number | Measure |
| Per Capita Income | 4,936 | $47,768 |
| Median Family Income | 1,464 | $89,070 |
| Mean Family Income | 1,464 | $117,162 |
| Median Household Income | 2,435 | $78,750 |
| Mean Household Income | 2,435 | $97,473 |
| Income Deficit | 1,464 | $0 |
| Wage / Income Gap (%) | 4,936 | 27.31% |
| Wage / Income Gap ($) | 4,936 | 72.69¢ per $1 |
| Gini / Inequality Index | 4,936 | 0.44 |
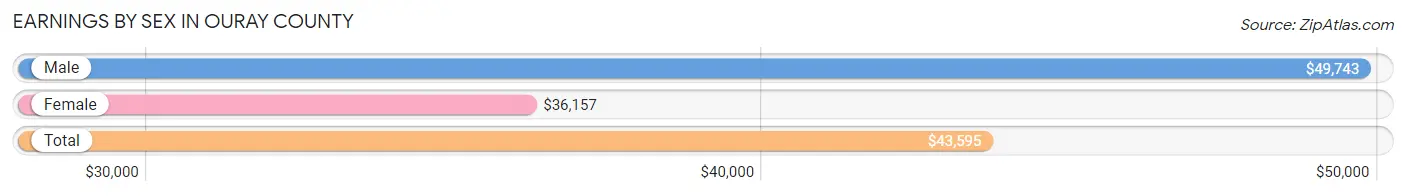
Earnings by Sex in Ouray County
Average Earnings in Ouray County are $43,595, $49,743 for men and $36,157 for women, a difference of 27.3%.
| Sex | Number | Average Earnings |
| Male | 1,369 (53.4%) | $49,743 |
| Female | 1,193 (46.6%) | $36,157 |
| Total | 2,562 (100.0%) | $43,595 |
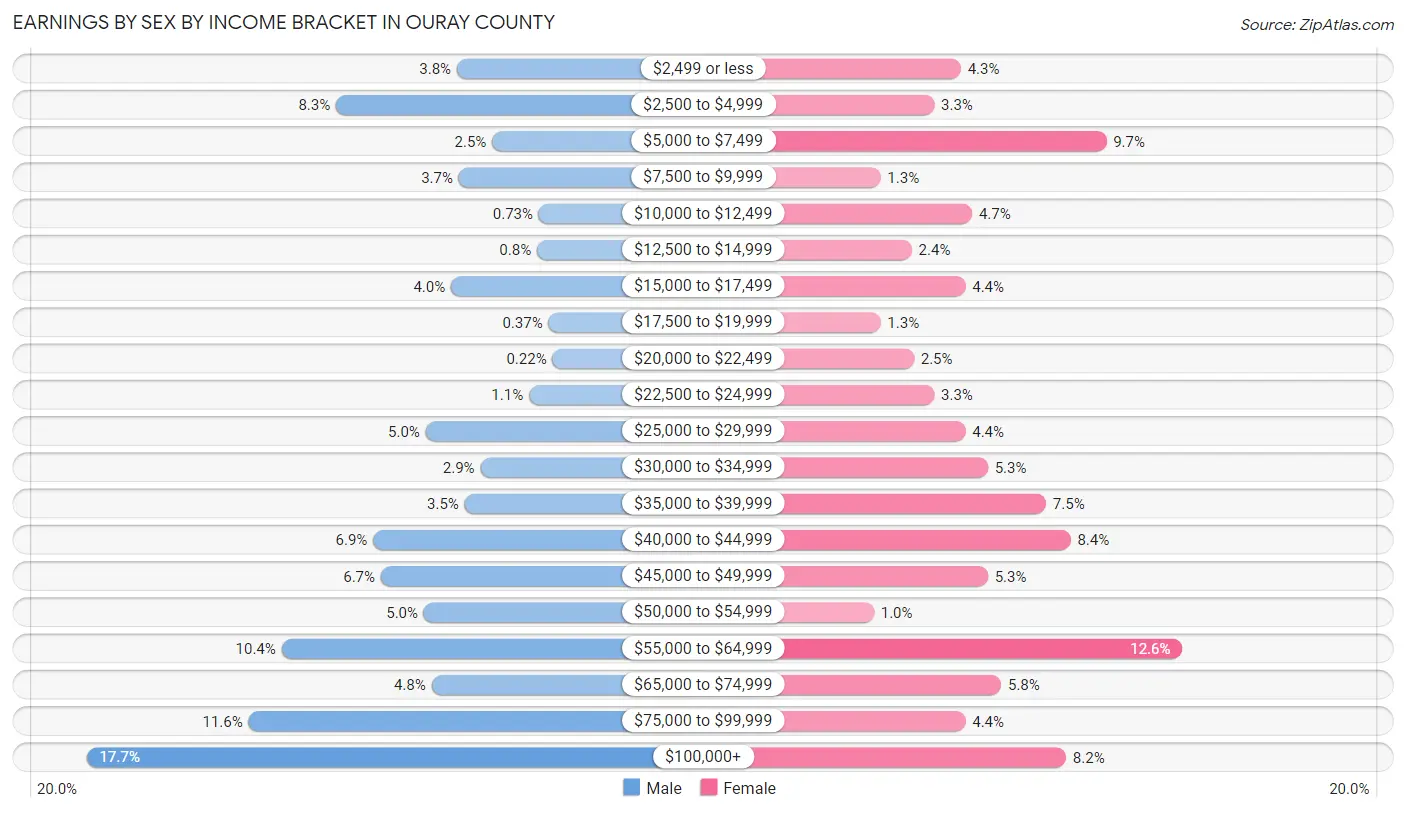
Earnings by Sex by Income Bracket in Ouray County
The most common earnings brackets in Ouray County are $100,000+ for men (242 | 17.7%) and $55,000 to $64,999 for women (150 | 12.6%).
| Income | Male | Female |
| $2,499 or less | 52 (3.8%) | 51 (4.3%) |
| $2,500 to $4,999 | 114 (8.3%) | 39 (3.3%) |
| $5,000 to $7,499 | 34 (2.5%) | 116 (9.7%) |
| $7,500 to $9,999 | 51 (3.7%) | 15 (1.3%) |
| $10,000 to $12,499 | 10 (0.7%) | 56 (4.7%) |
| $12,500 to $14,999 | 11 (0.8%) | 29 (2.4%) |
| $15,000 to $17,499 | 55 (4.0%) | 53 (4.4%) |
| $17,500 to $19,999 | 5 (0.4%) | 15 (1.3%) |
| $20,000 to $22,499 | 3 (0.2%) | 30 (2.5%) |
| $22,500 to $24,999 | 15 (1.1%) | 39 (3.3%) |
| $25,000 to $29,999 | 68 (5.0%) | 53 (4.4%) |
| $30,000 to $34,999 | 40 (2.9%) | 63 (5.3%) |
| $35,000 to $39,999 | 48 (3.5%) | 89 (7.5%) |
| $40,000 to $44,999 | 95 (6.9%) | 100 (8.4%) |
| $45,000 to $49,999 | 91 (6.7%) | 63 (5.3%) |
| $50,000 to $54,999 | 69 (5.0%) | 12 (1.0%) |
| $55,000 to $64,999 | 142 (10.4%) | 150 (12.6%) |
| $65,000 to $74,999 | 65 (4.8%) | 69 (5.8%) |
| $75,000 to $99,999 | 159 (11.6%) | 53 (4.4%) |
| $100,000+ | 242 (17.7%) | 98 (8.2%) |
| Total | 1,369 (100.0%) | 1,193 (100.0%) |
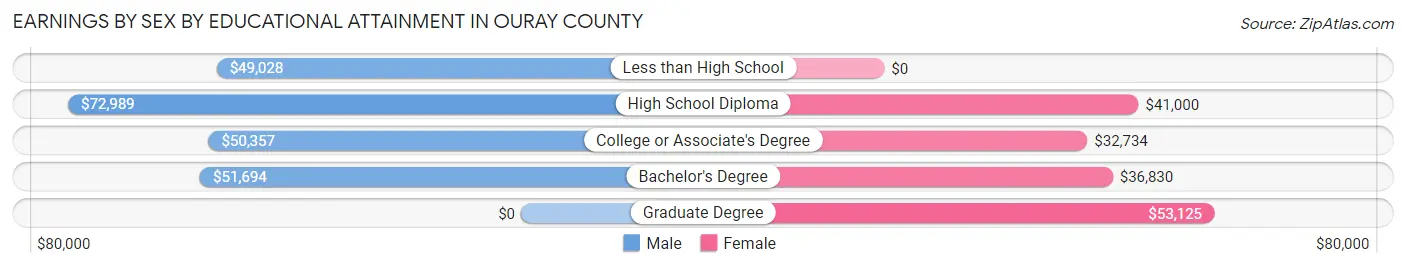
Earnings by Sex by Educational Attainment in Ouray County
Average earnings in Ouray County are $51,763 for men and $36,929 for women, a difference of 28.7%. Men with an educational attainment of high school diploma enjoy the highest average annual earnings of $72,989, while those with less than high school education earn the least with $49,028. Women with an educational attainment of graduate degree earn the most with the average annual earnings of $53,125, while those with college or associate's degree education have the smallest earnings of $32,734.
| Educational Attainment | Male Income | Female Income |
| Less than High School | $49,028 | $0 |
| High School Diploma | $72,989 | $41,000 |
| College or Associate's Degree | $50,357 | $32,734 |
| Bachelor's Degree | $51,694 | $36,830 |
| Graduate Degree | - | - |
| Total | $51,763 | $36,929 |
Family Income in Ouray County
Family Income Brackets in Ouray County
According to the Ouray County family income data, there are 318 families falling into the $100,000 to $149,999 income range, which is the most common income bracket and makes up 21.7% of all families.
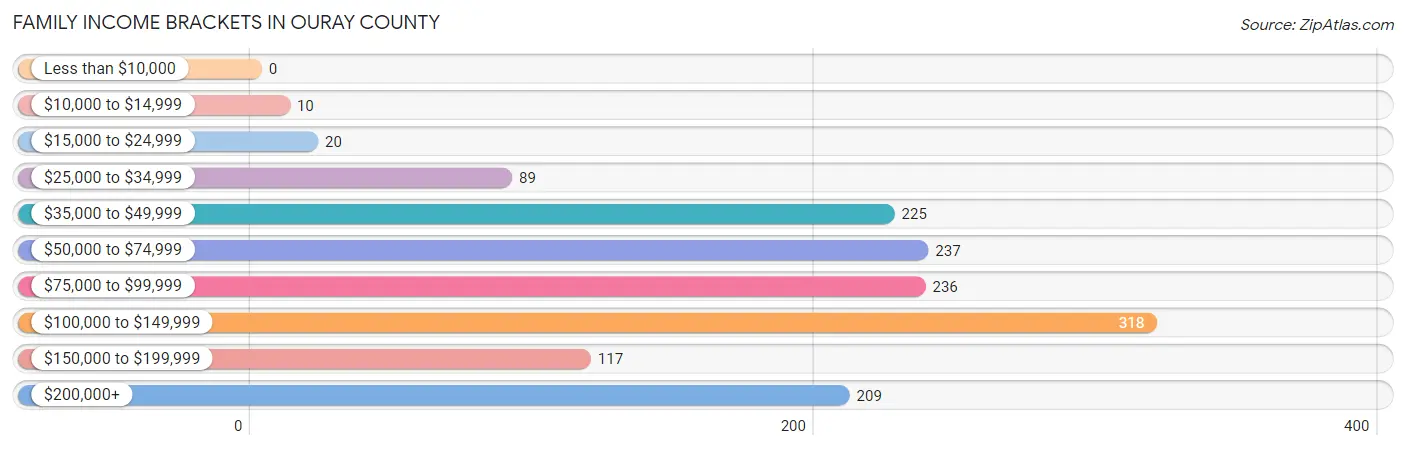
| Income Bracket | # Families | % Families |
| Less than $10,000 | 0 | 0.0% |
| $10,000 to $14,999 | 10 | 0.7% |
| $15,000 to $24,999 | 20 | 1.4% |
| $25,000 to $34,999 | 89 | 6.1% |
| $35,000 to $49,999 | 225 | 15.4% |
| $50,000 to $74,999 | 237 | 16.2% |
| $75,000 to $99,999 | 236 | 16.1% |
| $100,000 to $149,999 | 318 | 21.7% |
| $150,000 to $199,999 | 117 | 8.0% |
| $200,000+ | 209 | 14.3% |
Family Income by Famaliy Size in Ouray County
6-person families (31 | 2.1%) account for the highest median family income in Ouray County with $250,001 per family, while 6-person families (31 | 2.1%) have the highest median income of $41,667 per family member.
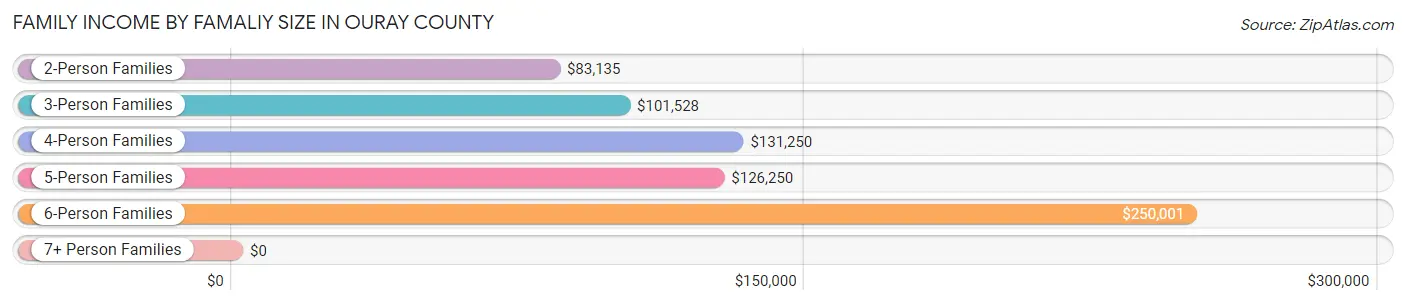
| Income Bracket | # Families | Median Income |
| 2-Person Families | 1,096 (74.9%) | $83,135 |
| 3-Person Families | 143 (9.8%) | $101,528 |
| 4-Person Families | 118 (8.1%) | $131,250 |
| 5-Person Families | 68 (4.6%) | $126,250 |
| 6-Person Families | 31 (2.1%) | $250,001 |
| 7+ Person Families | 8 (0.5%) | $0 |
| Total | 1,464 (100.0%) | $89,070 |
Family Income by Number of Earners in Ouray County
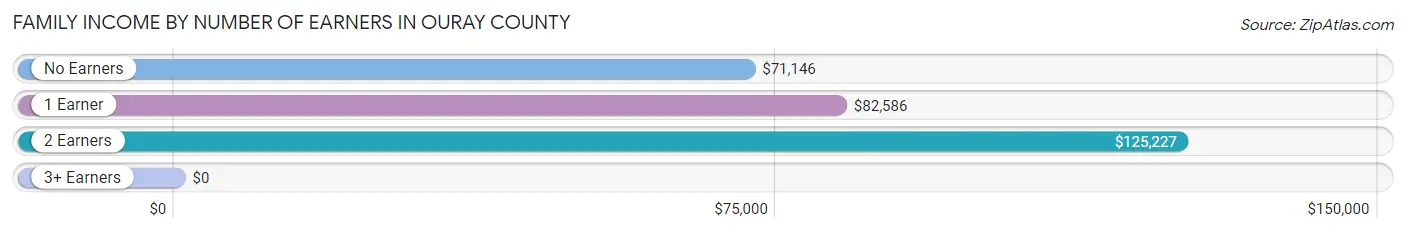
| Number of Earners | # Families | Median Income |
| No Earners | 483 (33.0%) | $71,146 |
| 1 Earner | 430 (29.4%) | $82,586 |
| 2 Earners | 474 (32.4%) | $125,227 |
| 3+ Earners | 77 (5.3%) | $0 |
| Total | 1,464 (100.0%) | $89,070 |
Household Income in Ouray County
Household Income Brackets in Ouray County
With 455 households falling in the category, the $100,000 to $149,999 income range is the most frequent in Ouray County, accounting for 18.7% of all households. In contrast, only 46 households (1.9%) fall into the $10,000 to $14,999 income bracket, making it the least populous group.
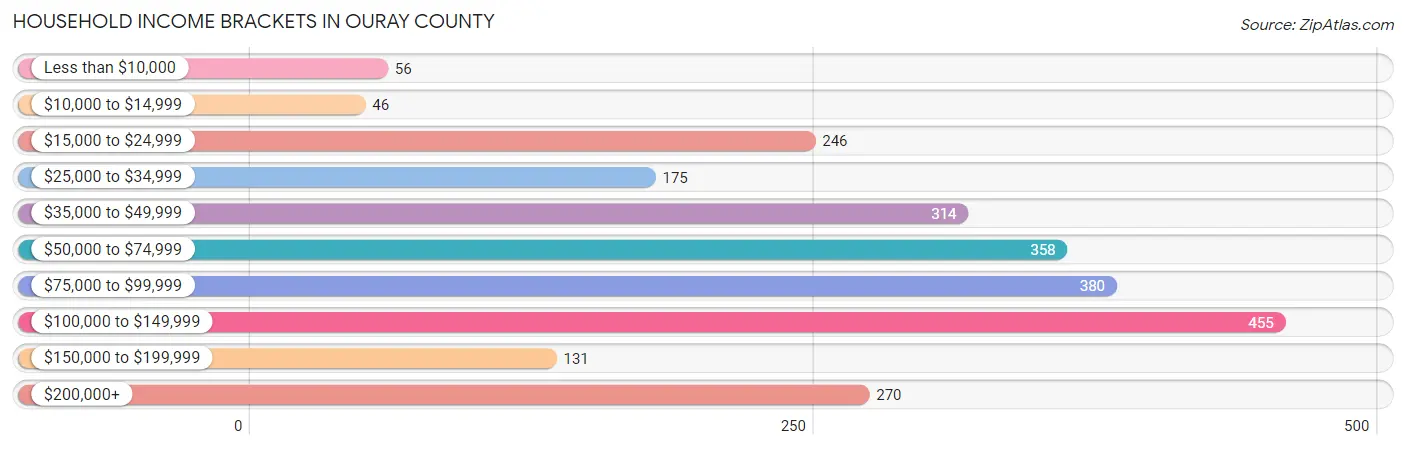
| Income Bracket | # Households | % Households |
| Less than $10,000 | 56 | 2.3% |
| $10,000 to $14,999 | 46 | 1.9% |
| $15,000 to $24,999 | 246 | 10.1% |
| $25,000 to $34,999 | 175 | 7.2% |
| $35,000 to $49,999 | 314 | 12.9% |
| $50,000 to $74,999 | 358 | 14.7% |
| $75,000 to $99,999 | 380 | 15.6% |
| $100,000 to $149,999 | 455 | 18.7% |
| $150,000 to $199,999 | 131 | 5.4% |
| $200,000+ | 270 | 11.1% |
Household Income by Householder Age in Ouray County
The median household income in Ouray County is $78,750, with the highest median household income of $84,524 found in the 45 to 64 years age bracket for the primary householder. A total of 818 households (33.6%) fall into this category. Meanwhile, the 15 to 24 years age bracket for the primary householder has the lowest median household income of $0, with 43 households (1.8%) in this group.
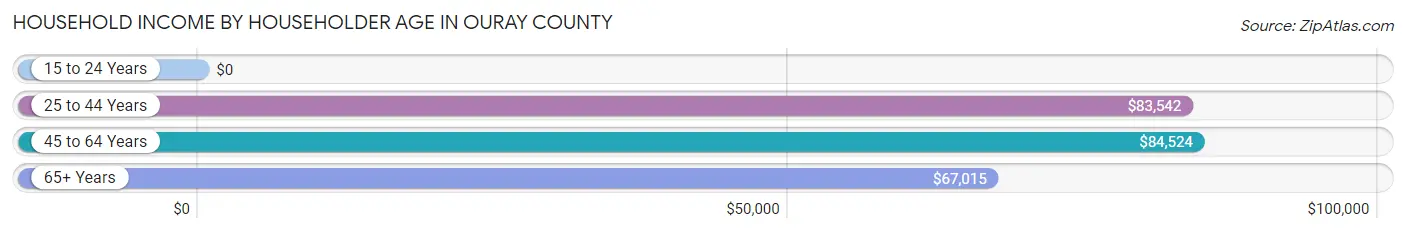
| Income Bracket | # Households | Median Income |
| 15 to 24 Years | 43 (1.8%) | $0 |
| 25 to 44 Years | 447 (18.4%) | $83,542 |
| 45 to 64 Years | 818 (33.6%) | $84,524 |
| 65+ Years | 1,127 (46.3%) | $67,015 |
| Total | 2,435 (100.0%) | $78,750 |
Poverty in Ouray County
Income Below Poverty by Sex and Age in Ouray County
With 2.7% poverty level for males and 7.1% for females among the residents of Ouray County, 55 to 64 year old males and under 5 year old females are the most vulnerable to poverty, with 39 males (11.5%) and 8 females (22.9%) in their respective age groups living below the poverty level.
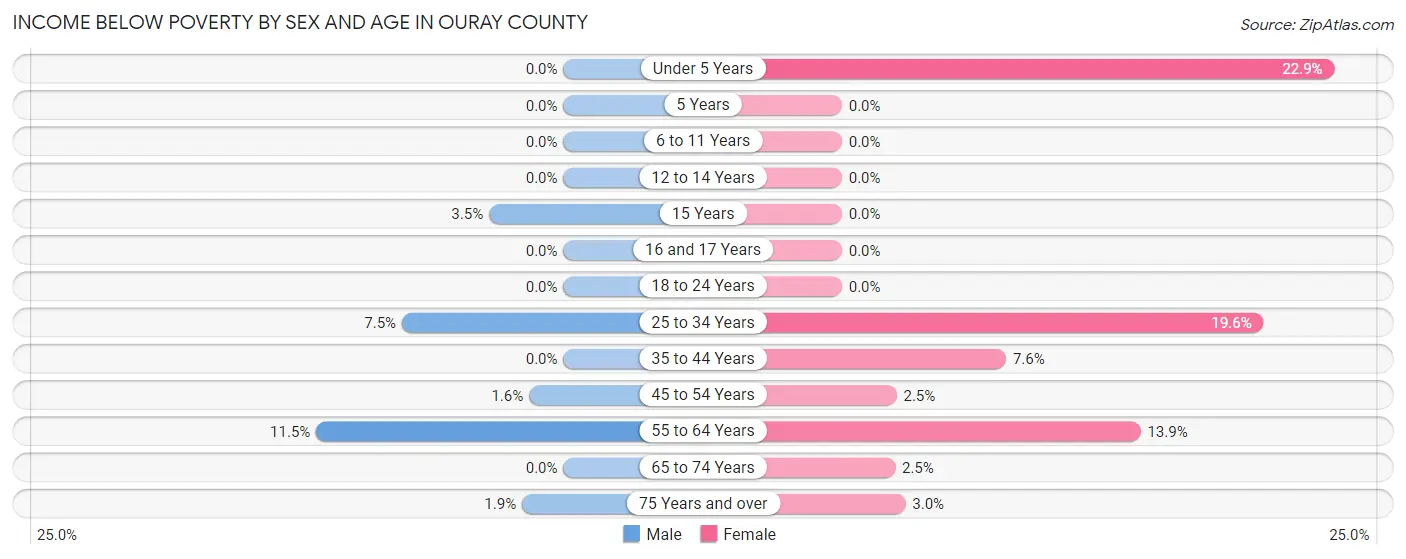
| Age Bracket | Male | Female |
| Under 5 Years | 0 (0.0%) | 8 (22.9%) |
| 5 Years | 0 (0.0%) | 0 (0.0%) |
| 6 to 11 Years | 0 (0.0%) | 0 (0.0%) |
| 12 to 14 Years | 0 (0.0%) | 0 (0.0%) |
| 15 Years | 2 (3.5%) | 0 (0.0%) |
| 16 and 17 Years | 0 (0.0%) | 0 (0.0%) |
| 18 to 24 Years | 0 (0.0%) | 0 (0.0%) |
| 25 to 34 Years | 17 (7.5%) | 55 (19.6%) |
| 35 to 44 Years | 0 (0.0%) | 17 (7.6%) |
| 45 to 54 Years | 5 (1.6%) | 8 (2.5%) |
| 55 to 64 Years | 39 (11.5%) | 61 (13.9%) |
| 65 to 74 Years | 0 (0.0%) | 14 (2.5%) |
| 75 Years and over | 6 (1.9%) | 7 (2.9%) |
| Total | 69 (2.7%) | 170 (7.1%) |
Income Above Poverty by Sex and Age in Ouray County
According to the poverty statistics in Ouray County, males aged under 5 years and females aged 5 years are the age groups that are most secure financially, with 100.0% of males and 100.0% of females in these age groups living above the poverty line.
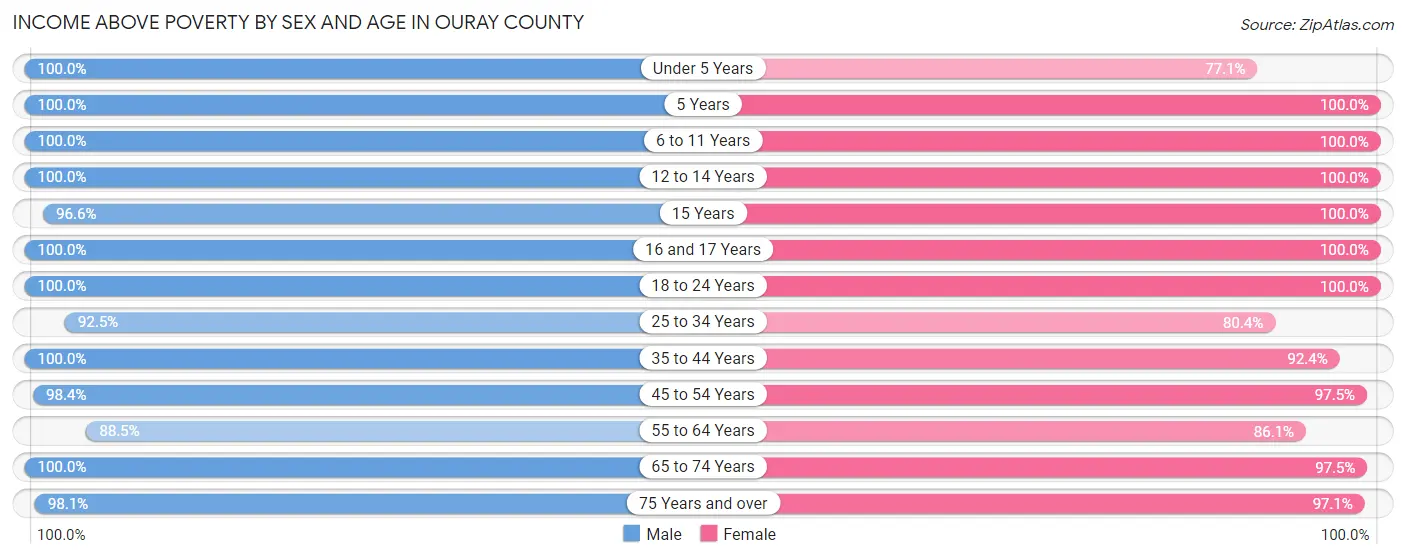
| Age Bracket | Male | Female |
| Under 5 Years | 110 (100.0%) | 27 (77.1%) |
| 5 Years | 18 (100.0%) | 18 (100.0%) |
| 6 to 11 Years | 64 (100.0%) | 117 (100.0%) |
| 12 to 14 Years | 52 (100.0%) | 29 (100.0%) |
| 15 Years | 56 (96.6%) | 25 (100.0%) |
| 16 and 17 Years | 56 (100.0%) | 43 (100.0%) |
| 18 to 24 Years | 83 (100.0%) | 48 (100.0%) |
| 25 to 34 Years | 210 (92.5%) | 226 (80.4%) |
| 35 to 44 Years | 255 (100.0%) | 206 (92.4%) |
| 45 to 54 Years | 309 (98.4%) | 307 (97.5%) |
| 55 to 64 Years | 301 (88.5%) | 379 (86.1%) |
| 65 to 74 Years | 663 (100.0%) | 553 (97.5%) |
| 75 Years and over | 307 (98.1%) | 230 (97.1%) |
| Total | 2,484 (97.3%) | 2,208 (92.8%) |
Income Below Poverty Among Married-Couple Families in Ouray County
The poverty statistics for married-couple families in Ouray County show that 0.6% or 8 of the total 1,302 families live below the poverty line. Families with no children have the highest poverty rate of 0.8%, comprising of 8 families. On the other hand, families with 1 or 2 children have the lowest poverty rate of 0.0%, which includes 0 families.
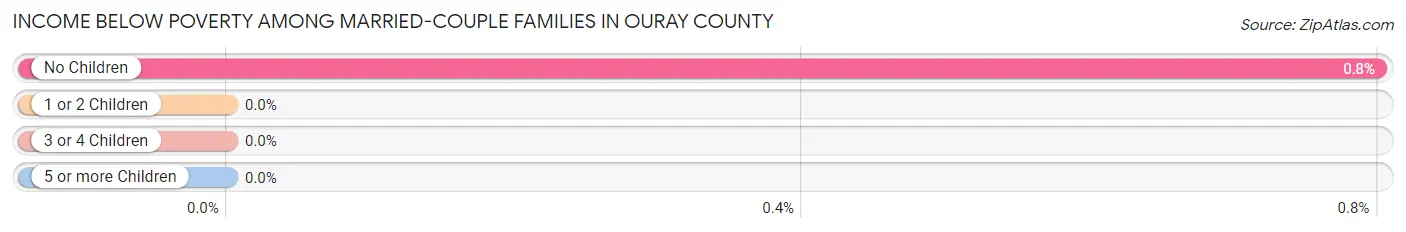
| Children | Above Poverty | Below Poverty |
| No Children | 994 (99.2%) | 8 (0.8%) |
| 1 or 2 Children | 235 (100.0%) | 0 (0.0%) |
| 3 or 4 Children | 65 (100.0%) | 0 (0.0%) |
| 5 or more Children | 0 (0.0%) | 0 (0.0%) |
| Total | 1,294 (99.4%) | 8 (0.6%) |
Income Below Poverty Among Single-Parent Households in Ouray County
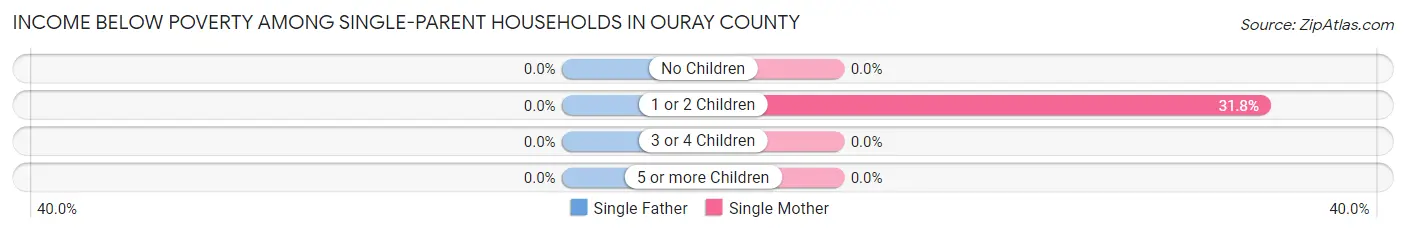
| Children | Single Father | Single Mother |
| No Children | 0 (0.0%) | 0 (0.0%) |
| 1 or 2 Children | 0 (0.0%) | 7 (31.8%) |
| 3 or 4 Children | 0 (0.0%) | 0 (0.0%) |
| 5 or more Children | 0 (0.0%) | 0 (0.0%) |
| Total | 0 (0.0%) | 7 (7.6%) |
Income Below Poverty Among Married-Couple vs Single-Parent Households in Ouray County
The poverty data for Ouray County shows that 8 of the married-couple family households (0.6%) and 7 of the single-parent households (4.3%) are living below the poverty level. Within the married-couple family households, those with no children have the highest poverty rate, with 8 households (0.8%) falling below the poverty line. Among the single-parent households, those with 1 or 2 children have the highest poverty rate, with 7 household (15.6%) living below poverty.
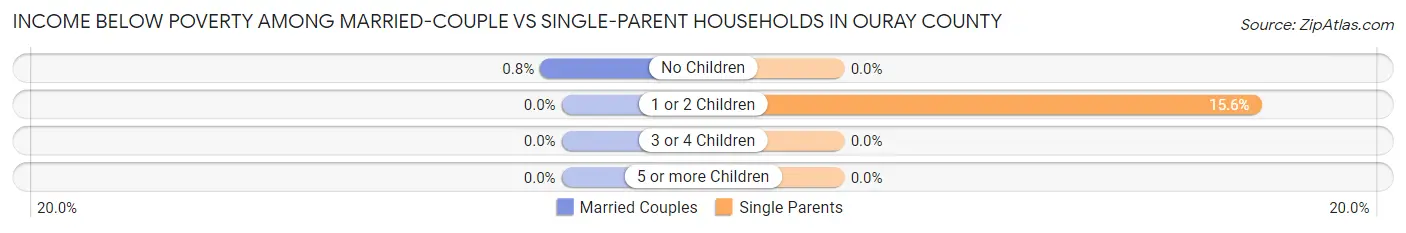
| Children | Married-Couple Families | Single-Parent Households |
| No Children | 8 (0.8%) | 0 (0.0%) |
| 1 or 2 Children | 0 (0.0%) | 7 (15.6%) |
| 3 or 4 Children | 0 (0.0%) | 0 (0.0%) |
| 5 or more Children | 0 (0.0%) | 0 (0.0%) |
| Total | 8 (0.6%) | 7 (4.3%) |
Race in Ouray County
The most populous races in Ouray County are White / Caucasian (4,522 | 91.6%), Two or more Races (245 | 5.0%), and Hispanic or Latino (206 | 4.2%).
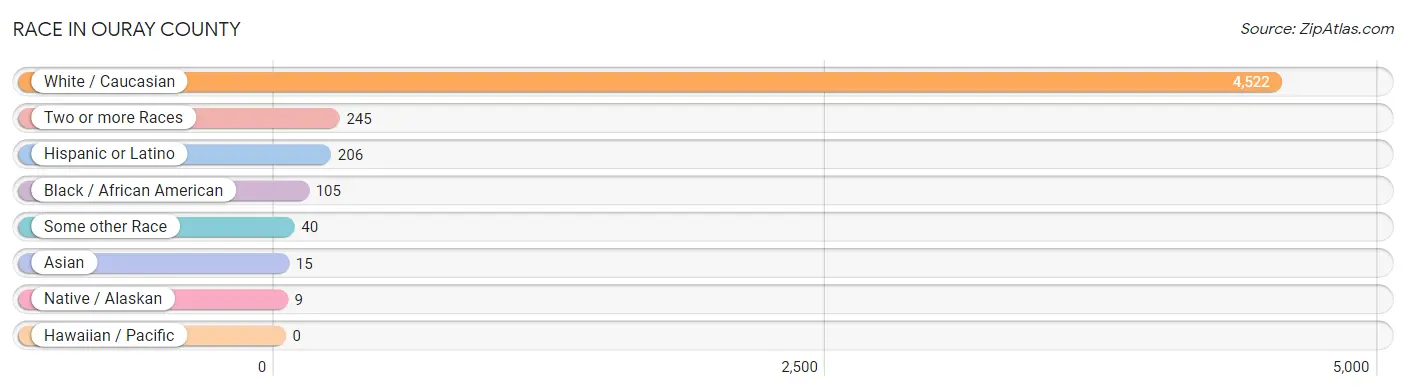
| Race | # Population | % Population |
| Asian | 15 | 0.3% |
| Black / African American | 105 | 2.1% |
| Hawaiian / Pacific | 0 | 0.0% |
| Hispanic or Latino | 206 | 4.2% |
| Native / Alaskan | 9 | 0.2% |
| White / Caucasian | 4,522 | 91.6% |
| Two or more Races | 245 | 5.0% |
| Some other Race | 40 | 0.8% |
| Total | 4,936 | 100.0% |
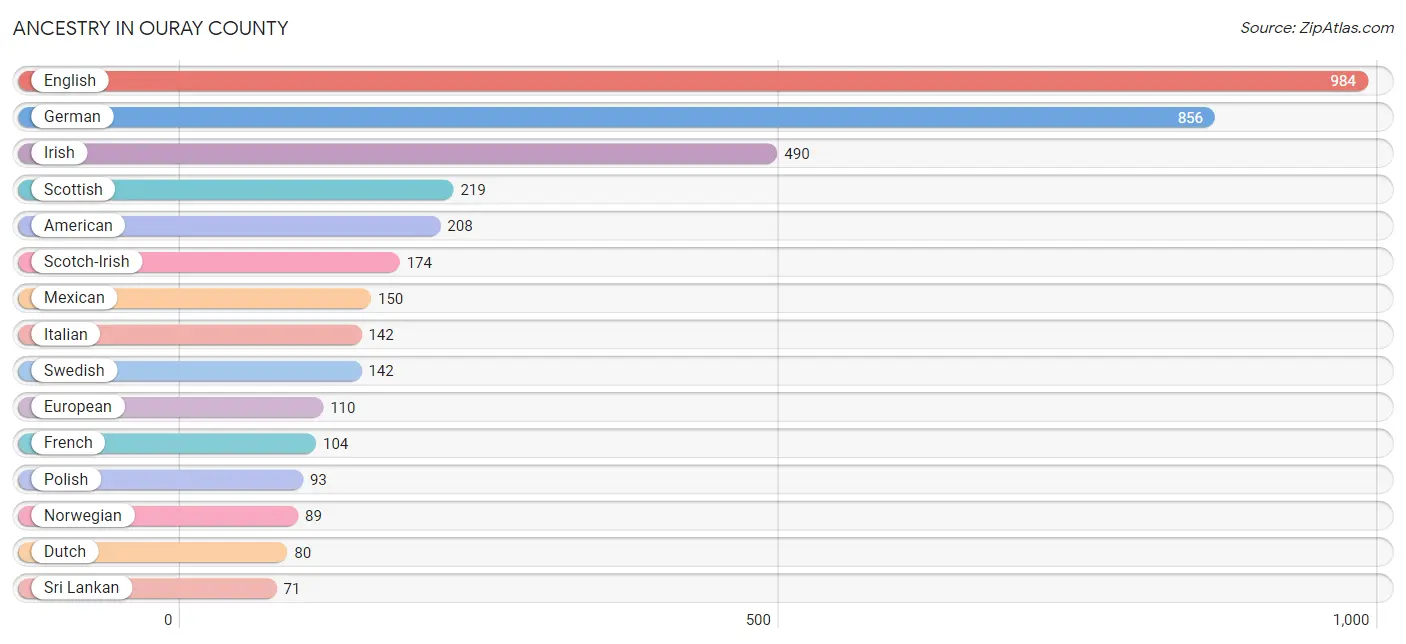
Ancestry in Ouray County
The most populous ancestries reported in Ouray County are English (984 | 19.9%), German (856 | 17.3%), Irish (490 | 9.9%), Scottish (219 | 4.4%), and American (208 | 4.2%), together accounting for 55.9% of all Ouray County residents.
| Ancestry | # Population | % Population |
| American | 208 | 4.2% |
| Arab | 10 | 0.2% |
| Argentinean | 8 | 0.2% |
| Australian | 2 | 0.0% |
| Austrian | 44 | 0.9% |
| Belgian | 10 | 0.2% |
| British | 33 | 0.7% |
| Burmese | 3 | 0.1% |
| Canadian | 6 | 0.1% |
| Celtic | 7 | 0.1% |
| Choctaw | 9 | 0.2% |
| Croatian | 11 | 0.2% |
| Czech | 34 | 0.7% |
| Danish | 32 | 0.6% |
| Dutch | 80 | 1.6% |
| Eastern European | 10 | 0.2% |
| English | 984 | 19.9% |
| European | 110 | 2.2% |
| Finnish | 15 | 0.3% |
| French | 104 | 2.1% |
| French Canadian | 38 | 0.8% |
| German | 856 | 17.3% |
| Greek | 5 | 0.1% |
| Hungarian | 5 | 0.1% |
| Indian (Asian) | 10 | 0.2% |
| Irish | 490 | 9.9% |
| Israeli | 6 | 0.1% |
| Italian | 142 | 2.9% |
| Laotian | 10 | 0.2% |
| Lebanese | 10 | 0.2% |
| Lithuanian | 2 | 0.0% |
| Mexican | 150 | 3.0% |
| Native Hawaiian | 8 | 0.2% |
| Northern European | 50 | 1.0% |
| Norwegian | 89 | 1.8% |
| Polish | 93 | 1.9% |
| Romanian | 35 | 0.7% |
| Russian | 47 | 0.9% |
| Scandinavian | 16 | 0.3% |
| Scotch-Irish | 174 | 3.5% |
| Scottish | 219 | 4.4% |
| Slavic | 5 | 0.1% |
| Slovene | 22 | 0.4% |
| South American | 8 | 0.2% |
| Spanish | 44 | 0.9% |
| Sri Lankan | 71 | 1.4% |
| Swedish | 142 | 2.9% |
| Swiss | 41 | 0.8% |
| Syrian | 7 | 0.1% |
| Ukrainian | 21 | 0.4% |
| Welsh | 52 | 1.1% | View All 51 Rows |
Immigrants in Ouray County
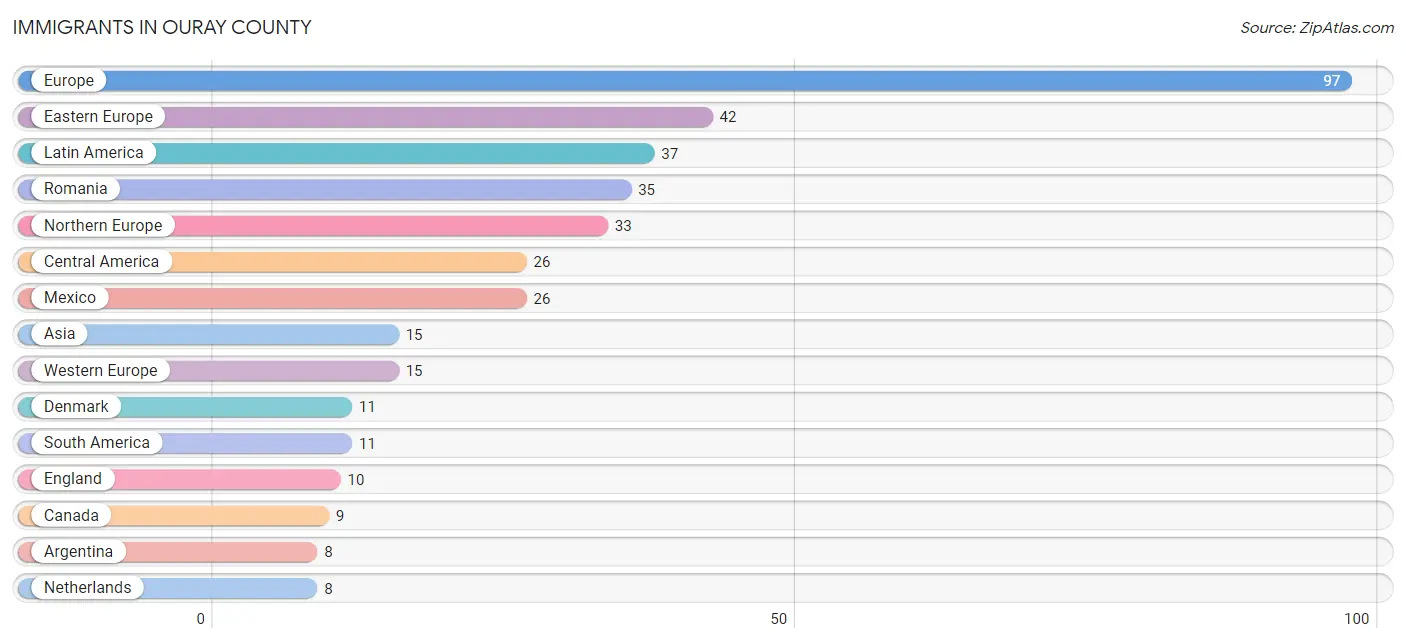
The most numerous immigrant groups reported in Ouray County came from Europe (97 | 2.0%), Eastern Europe (42 | 0.9%), Latin America (37 | 0.7%), Romania (35 | 0.7%), and Northern Europe (33 | 0.7%), together accounting for 4.9% of all Ouray County residents.
| Immigration Origin | # Population | % Population |
| Argentina | 8 | 0.2% |
| Asia | 15 | 0.3% |
| Brazil | 3 | 0.1% |
| Canada | 9 | 0.2% |
| Central America | 26 | 0.5% |
| Denmark | 11 | 0.2% |
| Eastern Asia | 3 | 0.1% |
| Eastern Europe | 42 | 0.9% |
| England | 10 | 0.2% |
| Europe | 97 | 2.0% |
| Indonesia | 6 | 0.1% |
| Israel | 6 | 0.1% |
| Italy | 7 | 0.1% |
| Korea | 3 | 0.1% |
| Latin America | 37 | 0.7% |
| Mexico | 26 | 0.5% |
| Netherlands | 8 | 0.2% |
| Northern Europe | 33 | 0.7% |
| Poland | 7 | 0.1% |
| Romania | 35 | 0.7% |
| Scotland | 7 | 0.1% |
| South America | 11 | 0.2% |
| South Eastern Asia | 6 | 0.1% |
| Southern Europe | 7 | 0.1% |
| Switzerland | 7 | 0.1% |
| Western Asia | 6 | 0.1% |
| Western Europe | 15 | 0.3% | View All 27 Rows |
Sex and Age in Ouray County
Sex and Age in Ouray County
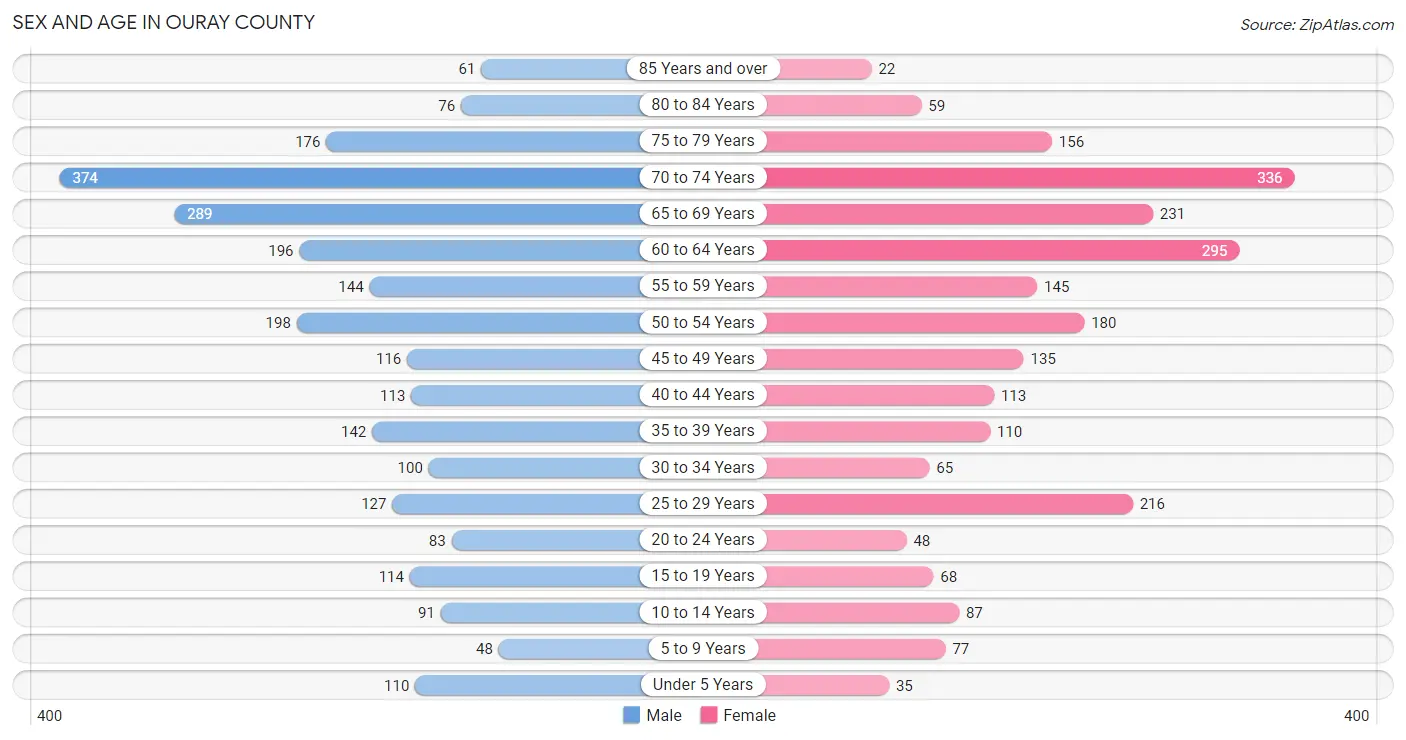
The most populous age groups in Ouray County are 70 to 74 Years (374 | 14.6%) for men and 70 to 74 Years (336 | 14.1%) for women.
| Age Bracket | Male | Female |
| Under 5 Years | 110 (4.3%) | 35 (1.5%) |
| 5 to 9 Years | 48 (1.9%) | 77 (3.2%) |
| 10 to 14 Years | 91 (3.6%) | 87 (3.7%) |
| 15 to 19 Years | 114 (4.5%) | 68 (2.9%) |
| 20 to 24 Years | 83 (3.2%) | 48 (2.0%) |
| 25 to 29 Years | 127 (5.0%) | 216 (9.1%) |
| 30 to 34 Years | 100 (3.9%) | 65 (2.7%) |
| 35 to 39 Years | 142 (5.6%) | 110 (4.6%) |
| 40 to 44 Years | 113 (4.4%) | 113 (4.8%) |
| 45 to 49 Years | 116 (4.5%) | 135 (5.7%) |
| 50 to 54 Years | 198 (7.7%) | 180 (7.6%) |
| 55 to 59 Years | 144 (5.6%) | 145 (6.1%) |
| 60 to 64 Years | 196 (7.7%) | 295 (12.4%) |
| 65 to 69 Years | 289 (11.3%) | 231 (9.7%) |
| 70 to 74 Years | 374 (14.6%) | 336 (14.1%) |
| 75 to 79 Years | 176 (6.9%) | 156 (6.6%) |
| 80 to 84 Years | 76 (3.0%) | 59 (2.5%) |
| 85 Years and over | 61 (2.4%) | 22 (0.9%) |
| Total | 2,558 (100.0%) | 2,378 (100.0%) |
Families and Households in Ouray County
Median Family Size in Ouray County
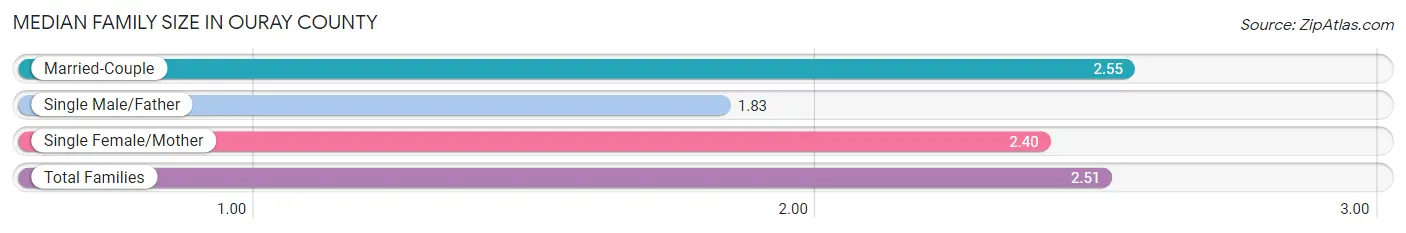
The median family size in Ouray County is 2.51 persons per family, with married-couple families (1,302 | 88.9%) accounting for the largest median family size of 2.55 persons per family. On the other hand, single male/father families (70 | 4.8%) represent the smallest median family size with 1.83 persons per family.
| Family Type | # Families | Family Size |
| Married-Couple | 1,302 (88.9%) | 2.55 |
| Single Male/Father | 70 (4.8%) | 1.83 |
| Single Female/Mother | 92 (6.3%) | 2.40 |
| Total Families | 1,464 (100.0%) | 2.51 |
Median Household Size in Ouray County
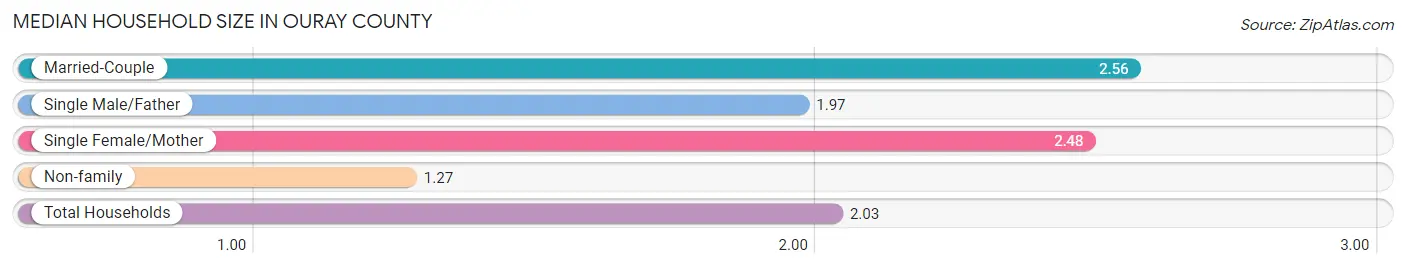
The median household size in Ouray County is 2.03 persons per household, with married-couple households (1,302 | 53.5%) accounting for the largest median household size of 2.56 persons per household. non-family households (971 | 39.9%) represent the smallest median household size with 1.27 persons per household.
| Household Type | # Households | Household Size |
| Married-Couple | 1,302 (53.5%) | 2.56 |
| Single Male/Father | 70 (2.9%) | 1.97 |
| Single Female/Mother | 92 (3.8%) | 2.48 |
| Non-family | 971 (39.9%) | 1.27 |
| Total Households | 2,435 (100.0%) | 2.03 |
Household Size by Marriage Status in Ouray County
Out of a total of 2,435 households in Ouray County, 1,464 (60.1%) are family households, while 971 (39.9%) are nonfamily households. The most numerous type of family households are 2-person households, comprising 1,085, and the most common type of nonfamily households are 1-person households, comprising 714.
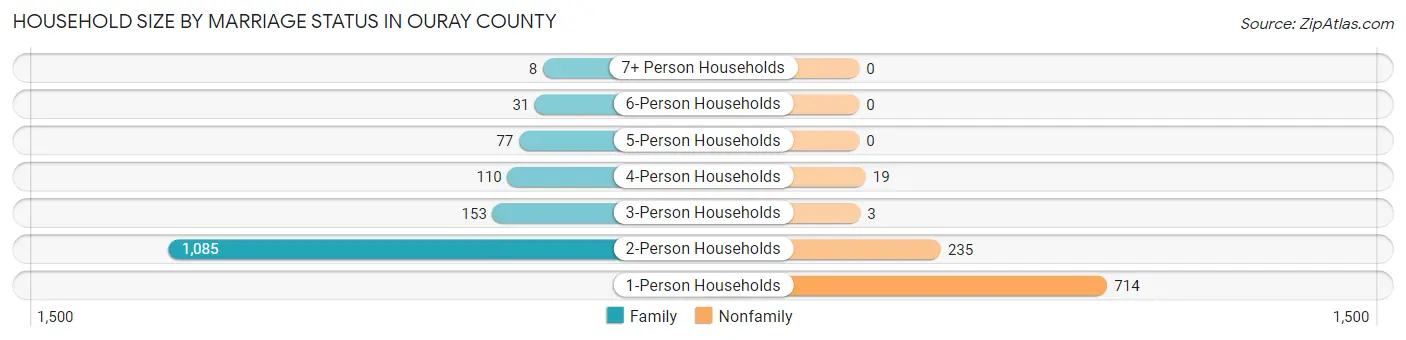
| Household Size | Family Households | Nonfamily Households |
| 1-Person Households | - | 714 (29.3%) |
| 2-Person Households | 1,085 (44.6%) | 235 (9.7%) |
| 3-Person Households | 153 (6.3%) | 3 (0.1%) |
| 4-Person Households | 110 (4.5%) | 19 (0.8%) |
| 5-Person Households | 77 (3.2%) | 0 (0.0%) |
| 6-Person Households | 31 (1.3%) | 0 (0.0%) |
| 7+ Person Households | 8 (0.3%) | 0 (0.0%) |
| Total | 1,464 (60.1%) | 971 (39.9%) |
Female Fertility in Ouray County
Fertility by Age in Ouray County
Average fertility rate in Ouray County is 22.0 births per 1,000 women. Women in the age bracket of 20 to 34 years have the highest fertility rate with 27.0 births per 1,000 women. Women in the age bracket of 20 to 34 years acount for 52.9% of all women with births.
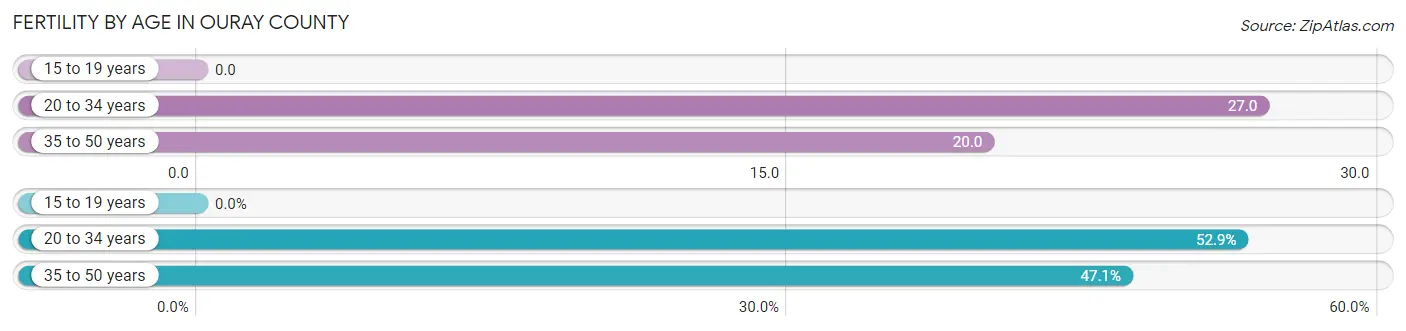
| Age Bracket | Women with Births | Births / 1,000 Women |
| 15 to 19 years | 0 (0.0%) | 0.0 |
| 20 to 34 years | 9 (52.9%) | 27.0 |
| 35 to 50 years | 8 (47.1%) | 20.0 |
| Total | 17 (100.0%) | 22.0 |
Fertility by Age by Marriage Status in Ouray County

| Age Bracket | Married | Unmarried |
| 15 to 19 years | 0 (0.0%) | 0 (0.0%) |
| 20 to 34 years | 9 (100.0%) | 0 (0.0%) |
| 35 to 50 years | 8 (100.0%) | 0 (0.0%) |
| Total | 17 (100.0%) | 0 (0.0%) |
Fertility by Education in Ouray County
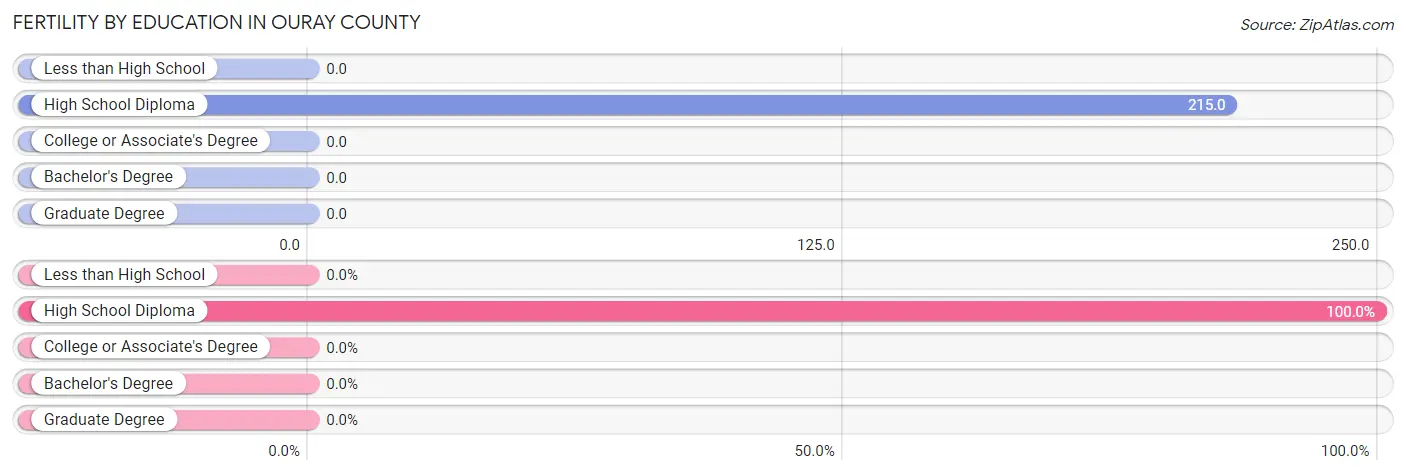
| Educational Attainment | Women with Births | Births / 1,000 Women |
| Less than High School | 0 (0.0%) | 0.0 |
| High School Diploma | 17 (100.0%) | 215.0 |
| College or Associate's Degree | 0 (0.0%) | 0.0 |
| Bachelor's Degree | 0 (0.0%) | 0.0 |
| Graduate Degree | 0 (0.0%) | 0.0 |
| Total | 17 (100.0%) | 22.0 |
Fertility by Education by Marriage Status in Ouray County
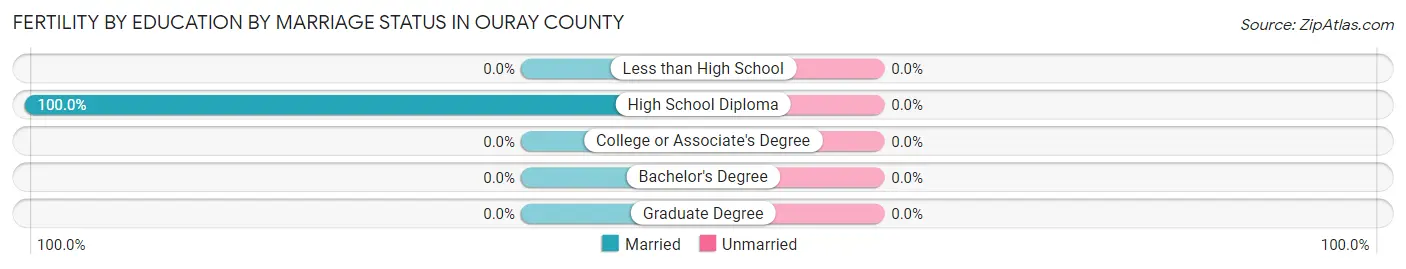
| Educational Attainment | Married | Unmarried |
| Less than High School | 0 (0.0%) | 0 (0.0%) |
| High School Diploma | 17 (100.0%) | 0 (0.0%) |
| College or Associate's Degree | 0 (0.0%) | 0 (0.0%) |
| Bachelor's Degree | 0 (0.0%) | 0 (0.0%) |
| Graduate Degree | 0 (0.0%) | 0 (0.0%) |
| Total | 17 (100.0%) | 0 (0.0%) |
Employment Characteristics in Ouray County
Employment by Class of Employer in Ouray County
Among the 2,167 employed individuals in Ouray County, private company employees (1,117 | 51.5%), self-employed (incorporated) (305 | 14.1%), and self-employed (not incorporated) (254 | 11.7%) make up the most common classes of employment.
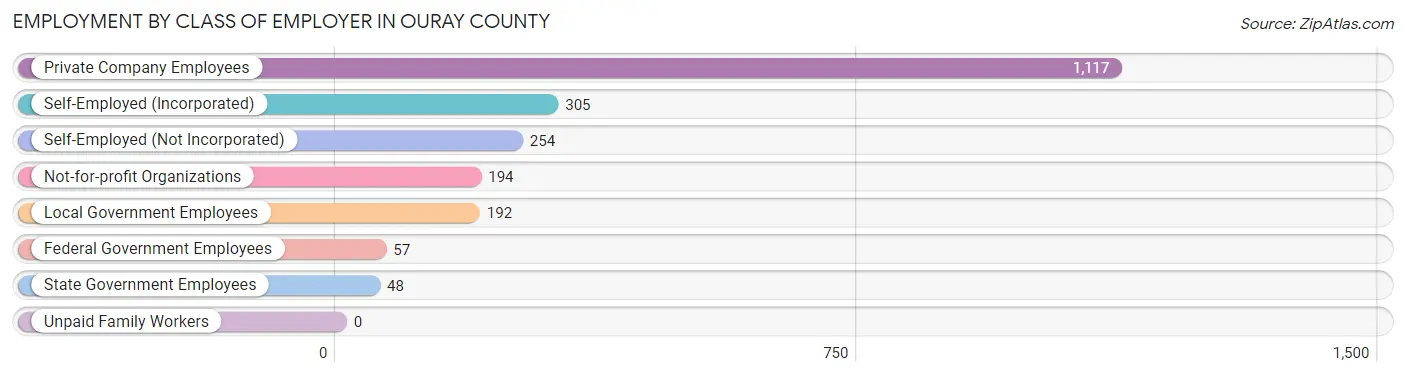
| Employer Class | # Employees | % Employees |
| Private Company Employees | 1,117 | 51.5% |
| Self-Employed (Incorporated) | 305 | 14.1% |
| Self-Employed (Not Incorporated) | 254 | 11.7% |
| Not-for-profit Organizations | 194 | 8.9% |
| Local Government Employees | 192 | 8.9% |
| State Government Employees | 48 | 2.2% |
| Federal Government Employees | 57 | 2.6% |
| Unpaid Family Workers | 0 | 0.0% |
| Total | 2,167 | 100.0% |
Employment Status by Age in Ouray County
According to the labor force statistics for Ouray County, out of the total population over 16 years of age (4,405), 51.9% or 2,286 individuals are in the labor force, with 4.2% or 96 of them unemployed. The age group with the highest labor force participation rate is 30 to 34 years, with 97.6% or 161 individuals in the labor force. Within the labor force, the 20 to 24 years age range has the highest percentage of unemployed individuals, with 21.2% or 18 of them being unemployed.
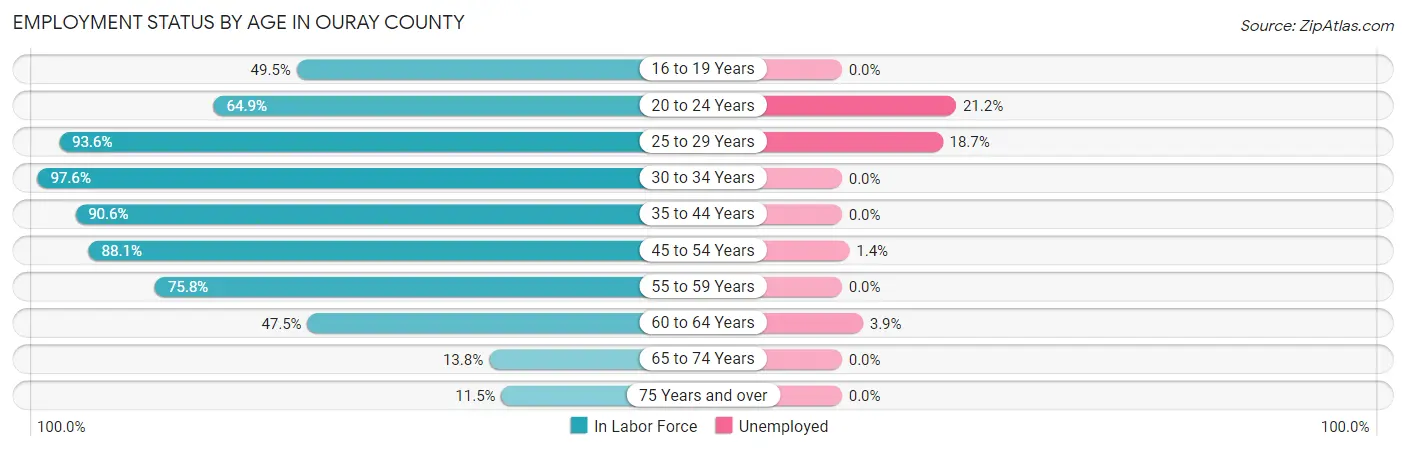
| Age Bracket | In Labor Force | Unemployed |
| 16 to 19 Years | 49 (49.5%) | 0 (0.0%) |
| 20 to 24 Years | 85 (64.9%) | 18 (21.2%) |
| 25 to 29 Years | 321 (93.6%) | 60 (18.7%) |
| 30 to 34 Years | 161 (97.6%) | 0 (0.0%) |
| 35 to 44 Years | 433 (90.6%) | 0 (0.0%) |
| 45 to 54 Years | 554 (88.1%) | 8 (1.4%) |
| 55 to 59 Years | 219 (75.8%) | 0 (0.0%) |
| 60 to 64 Years | 233 (47.5%) | 9 (3.9%) |
| 65 to 74 Years | 170 (13.8%) | 0 (0.0%) |
| 75 Years and over | 63 (11.5%) | 0 (0.0%) |
| Total | 2,286 (51.9%) | 96 (4.2%) |
Employment Status by Educational Attainment in Ouray County
According to labor force statistics for Ouray County, 80.2% of individuals (1,921) out of the total population between 25 and 64 years of age (2,395) are in the labor force, with 4.0% or 77 of them being unemployed. The group with the highest labor force participation rate are those with the educational attainment of college / associate degree, with 87.8% or 767 individuals in the labor force. Within the labor force, individuals with bachelor's degree or higher education have the highest percentage of unemployment, with 7.8% or 68 of them being unemployed.
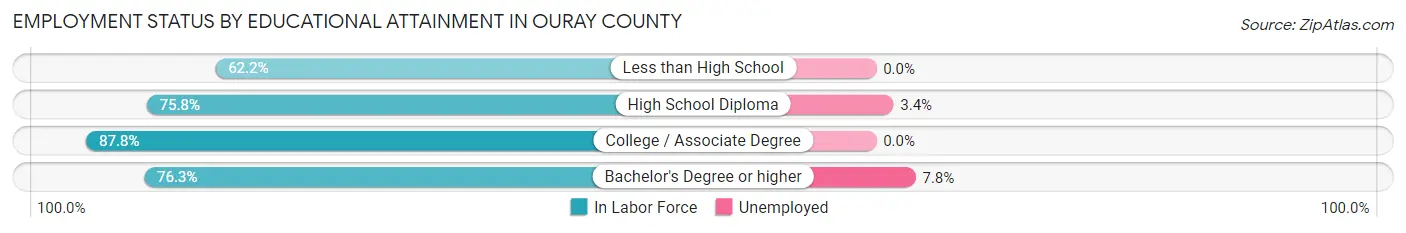
| Educational Attainment | In Labor Force | Unemployed |
| Less than High School | 23 (62.2%) | 0 (0.0%) |
| High School Diploma | 263 (75.8%) | 12 (3.4%) |
| College / Associate Degree | 767 (87.8%) | 0 (0.0%) |
| Bachelor's Degree or higher | 868 (76.3%) | 89 (7.8%) |
| Total | 1,921 (80.2%) | 96 (4.0%) |
Employment Occupations by Sex in Ouray County
Management, Business, Science and Arts Occupations
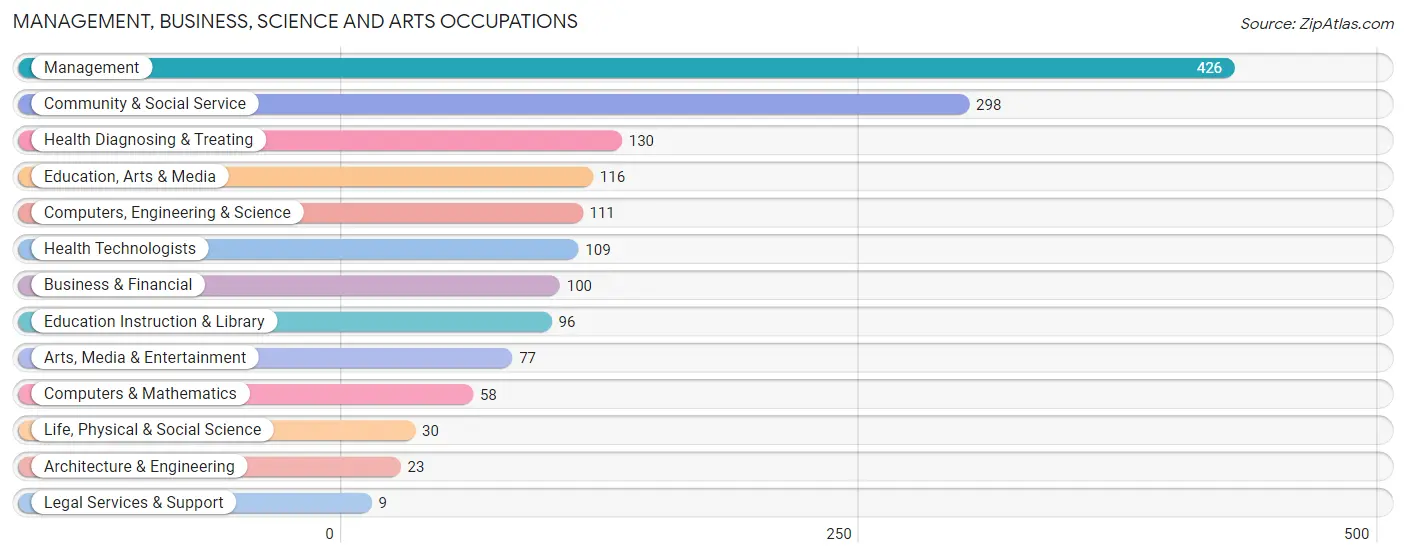
The most common Management, Business, Science and Arts occupations in Ouray County are Management (426 | 19.4%), Community & Social Service (298 | 13.6%), Health Diagnosing & Treating (130 | 5.9%), Education, Arts & Media (116 | 5.3%), and Computers, Engineering & Science (111 | 5.1%).
Management, Business, Science and Arts Occupations by Sex
Within the Management, Business, Science and Arts occupations in Ouray County, the most male-oriented occupations are Architecture & Engineering (78.3%), Arts, Media & Entertainment (70.1%), and Life, Physical & Social Science (63.3%), while the most female-oriented occupations are Health Diagnosing & Treating (70.8%), Education Instruction & Library (66.7%), and Health Technologists (65.1%).
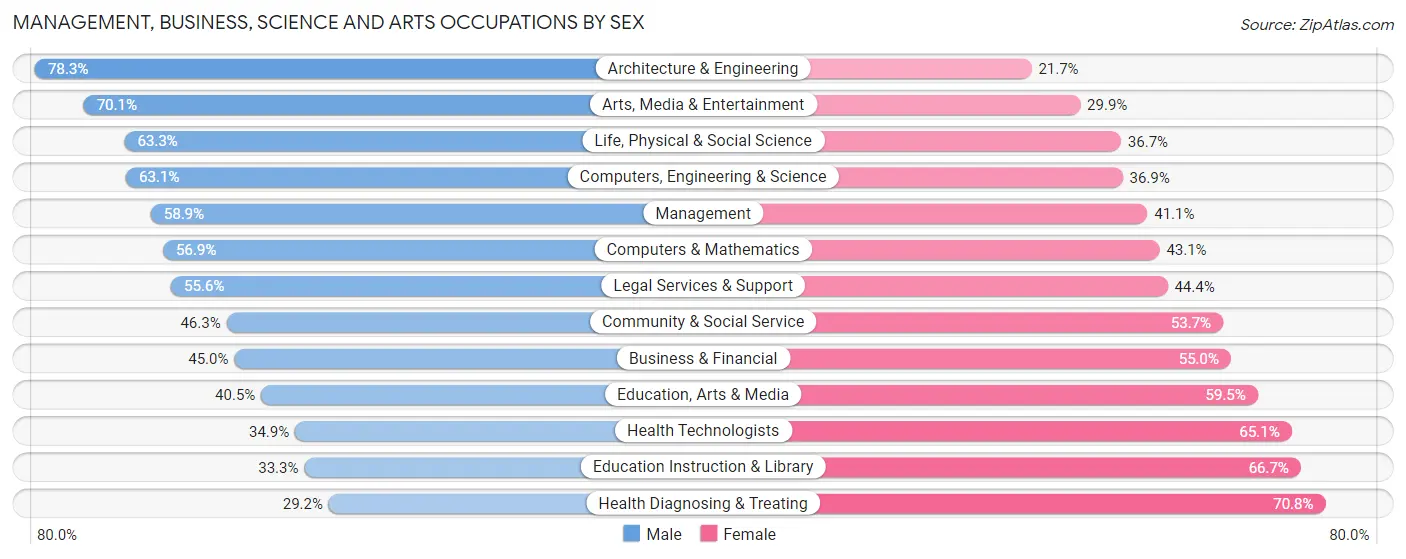
| Occupation | Male | Female |
| Management | 251 (58.9%) | 175 (41.1%) |
| Business & Financial | 45 (45.0%) | 55 (55.0%) |
| Computers, Engineering & Science | 70 (63.1%) | 41 (36.9%) |
| Computers & Mathematics | 33 (56.9%) | 25 (43.1%) |
| Architecture & Engineering | 18 (78.3%) | 5 (21.7%) |
| Life, Physical & Social Science | 19 (63.3%) | 11 (36.7%) |
| Community & Social Service | 138 (46.3%) | 160 (53.7%) |
| Education, Arts & Media | 47 (40.5%) | 69 (59.5%) |
| Legal Services & Support | 5 (55.6%) | 4 (44.4%) |
| Education Instruction & Library | 32 (33.3%) | 64 (66.7%) |
| Arts, Media & Entertainment | 54 (70.1%) | 23 (29.9%) |
| Health Diagnosing & Treating | 38 (29.2%) | 92 (70.8%) |
| Health Technologists | 38 (34.9%) | 71 (65.1%) |
| Total (Category) | 542 (50.9%) | 523 (49.1%) |
| Total (Overall) | 1,228 (56.0%) | 965 (44.0%) |
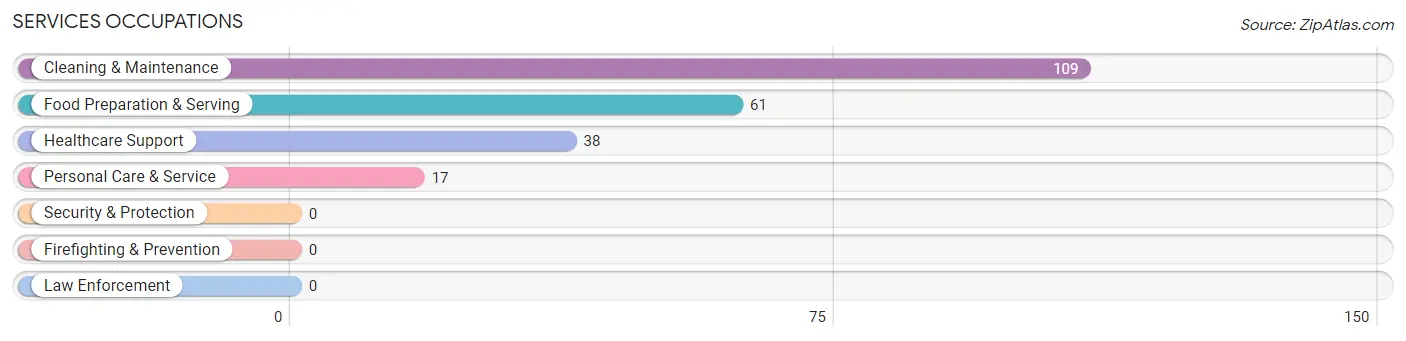
Services Occupations
The most common Services occupations in Ouray County are Cleaning & Maintenance (109 | 5.0%), Food Preparation & Serving (61 | 2.8%), Healthcare Support (38 | 1.7%), and Personal Care & Service (17 | 0.8%).
Services Occupations by Sex
Within the Services occupations in Ouray County, the most male-oriented occupations are Food Preparation & Serving (60.7%), Personal Care & Service (52.9%), and Cleaning & Maintenance (50.5%), while the most female-oriented occupations are Healthcare Support (81.6%), Cleaning & Maintenance (49.5%), and Personal Care & Service (47.1%).
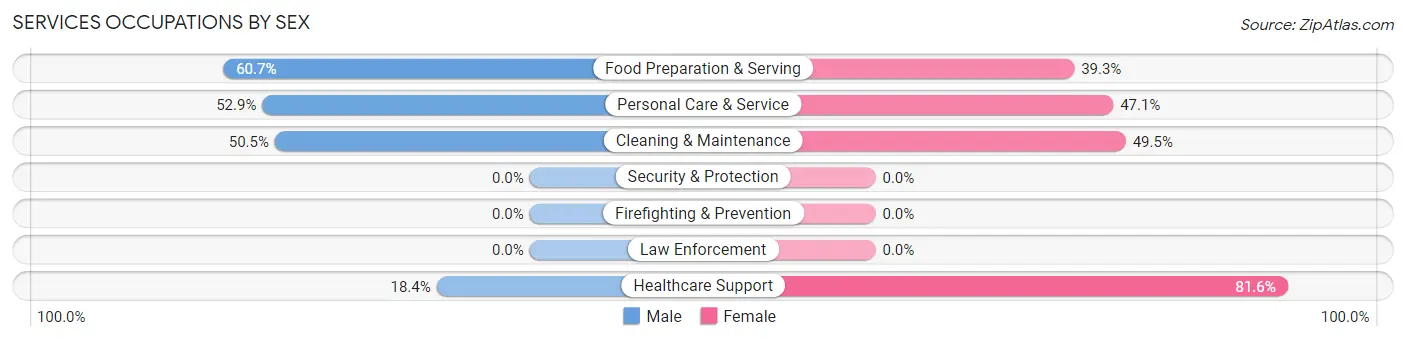
| Occupation | Male | Female |
| Healthcare Support | 7 (18.4%) | 31 (81.6%) |
| Security & Protection | 0 (0.0%) | 0 (0.0%) |
| Firefighting & Prevention | 0 (0.0%) | 0 (0.0%) |
| Law Enforcement | 0 (0.0%) | 0 (0.0%) |
| Food Preparation & Serving | 37 (60.7%) | 24 (39.3%) |
| Cleaning & Maintenance | 55 (50.5%) | 54 (49.5%) |
| Personal Care & Service | 9 (52.9%) | 8 (47.1%) |
| Total (Category) | 108 (48.0%) | 117 (52.0%) |
| Total (Overall) | 1,228 (56.0%) | 965 (44.0%) |
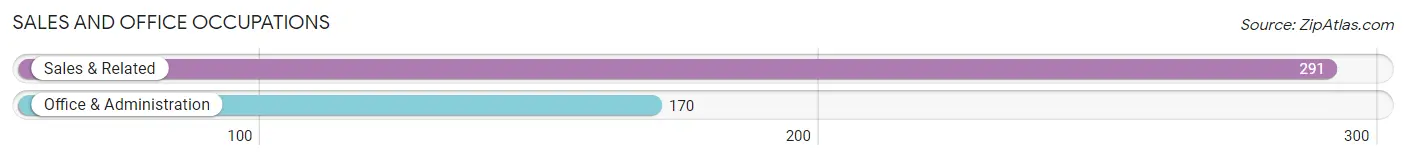
Sales and Office Occupations
The most common Sales and Office occupations in Ouray County are Sales & Related (291 | 13.3%), and Office & Administration (170 | 7.7%).
Sales and Office Occupations by Sex
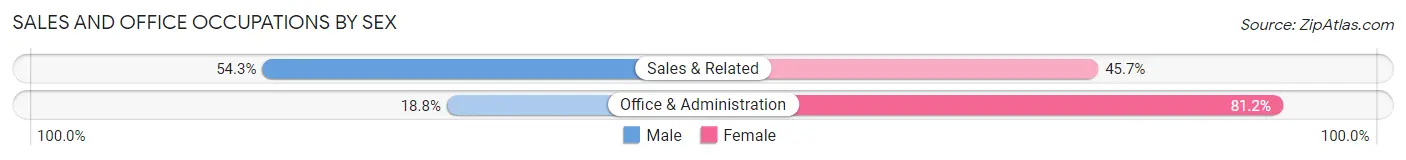
| Occupation | Male | Female |
| Sales & Related | 158 (54.3%) | 133 (45.7%) |
| Office & Administration | 32 (18.8%) | 138 (81.2%) |
| Total (Category) | 190 (41.2%) | 271 (58.8%) |
| Total (Overall) | 1,228 (56.0%) | 965 (44.0%) |
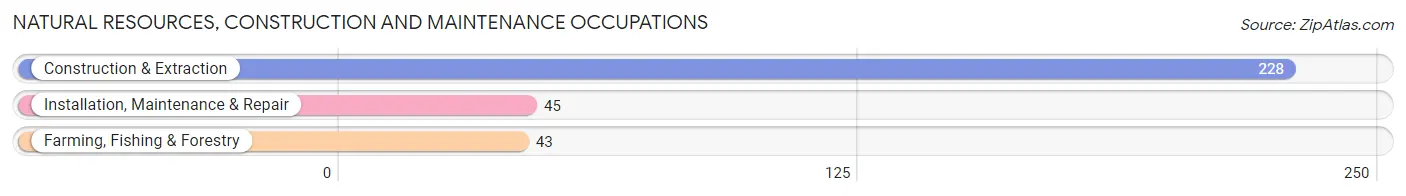
Natural Resources, Construction and Maintenance Occupations
The most common Natural Resources, Construction and Maintenance occupations in Ouray County are Construction & Extraction (228 | 10.4%), Installation, Maintenance & Repair (45 | 2.1%), and Farming, Fishing & Forestry (43 | 2.0%).
Natural Resources, Construction and Maintenance Occupations by Sex
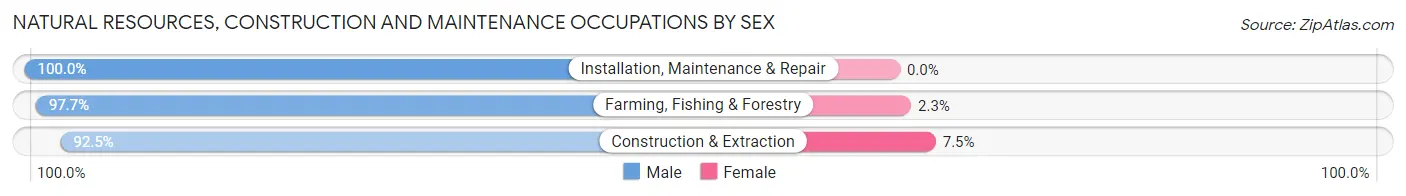
| Occupation | Male | Female |
| Farming, Fishing & Forestry | 42 (97.7%) | 1 (2.3%) |
| Construction & Extraction | 211 (92.5%) | 17 (7.5%) |
| Installation, Maintenance & Repair | 45 (100.0%) | 0 (0.0%) |
| Total (Category) | 298 (94.3%) | 18 (5.7%) |
| Total (Overall) | 1,228 (56.0%) | 965 (44.0%) |
Production, Transportation and Moving Occupations
The most common Production, Transportation and Moving occupations in Ouray County are Transportation (63 | 2.9%), Material Moving (37 | 1.7%), and Production (26 | 1.2%).
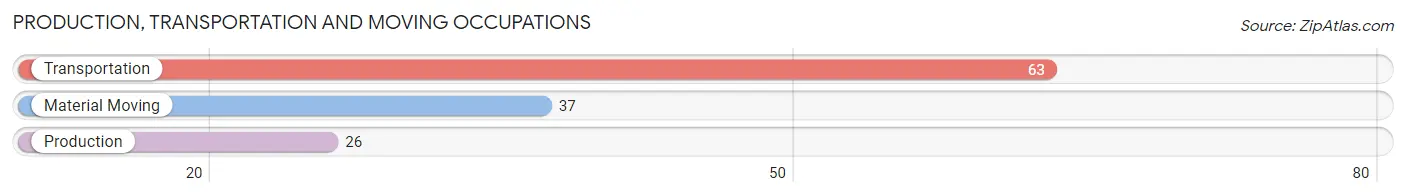
Production, Transportation and Moving Occupations by Sex
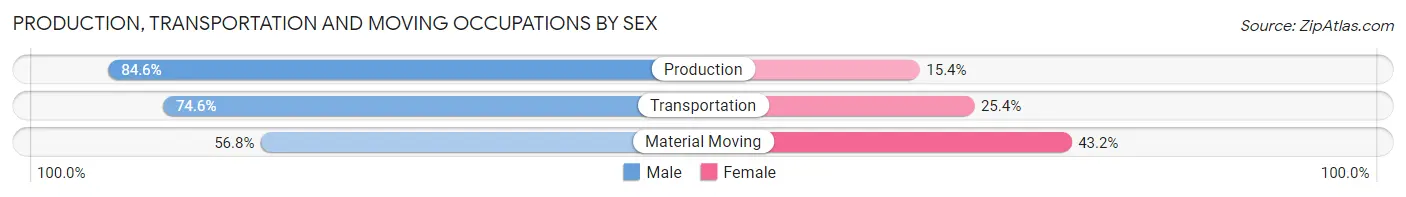
| Occupation | Male | Female |
| Production | 22 (84.6%) | 4 (15.4%) |
| Transportation | 47 (74.6%) | 16 (25.4%) |
| Material Moving | 21 (56.8%) | 16 (43.2%) |
| Total (Category) | 90 (71.4%) | 36 (28.6%) |
| Total (Overall) | 1,228 (56.0%) | 965 (44.0%) |
Employment Industries by Sex in Ouray County
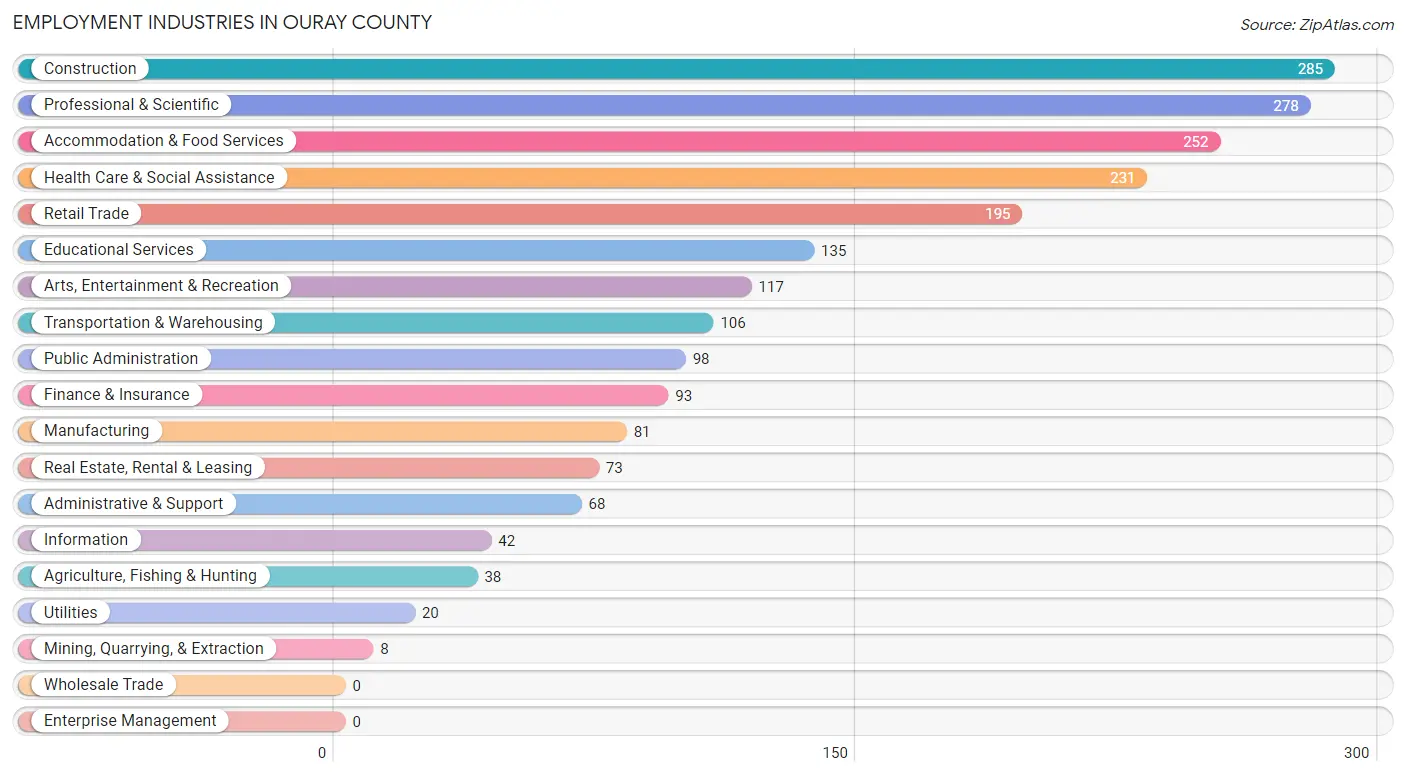
Employment Industries in Ouray County
The major employment industries in Ouray County include Construction (285 | 13.0%), Professional & Scientific (278 | 12.7%), Accommodation & Food Services (252 | 11.5%), Health Care & Social Assistance (231 | 10.5%), and Retail Trade (195 | 8.9%).
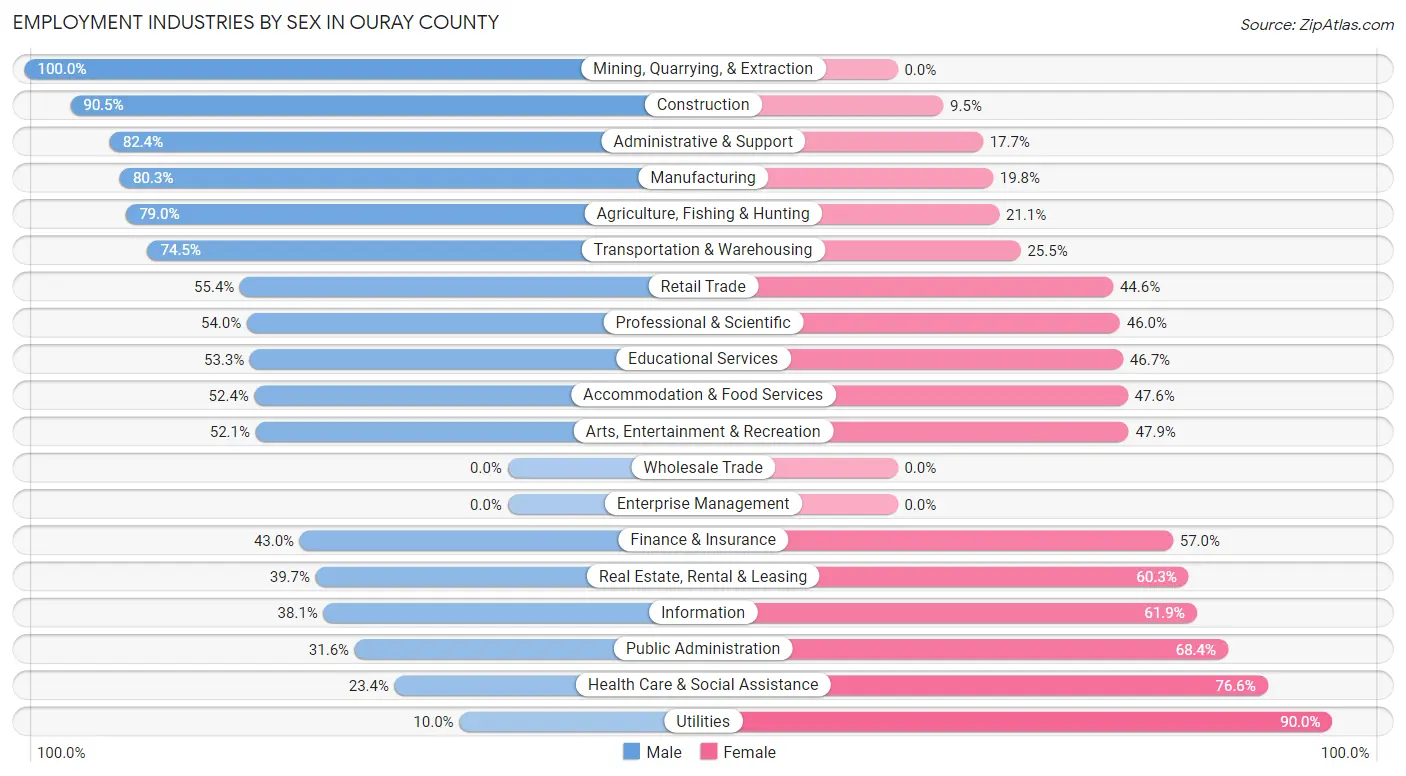
Employment Industries by Sex in Ouray County
The Ouray County industries that see more men than women are Mining, Quarrying, & Extraction (100.0%), Construction (90.5%), and Administrative & Support (82.4%), whereas the industries that tend to have a higher number of women are Utilities (90.0%), Health Care & Social Assistance (76.6%), and Public Administration (68.4%).
| Industry | Male | Female |
| Agriculture, Fishing & Hunting | 30 (78.9%) | 8 (21.0%) |
| Mining, Quarrying, & Extraction | 8 (100.0%) | 0 (0.0%) |
| Construction | 258 (90.5%) | 27 (9.5%) |
| Manufacturing | 65 (80.2%) | 16 (19.8%) |
| Wholesale Trade | 0 (0.0%) | 0 (0.0%) |
| Retail Trade | 108 (55.4%) | 87 (44.6%) |
| Transportation & Warehousing | 79 (74.5%) | 27 (25.5%) |
| Utilities | 2 (10.0%) | 18 (90.0%) |
| Information | 16 (38.1%) | 26 (61.9%) |
| Finance & Insurance | 40 (43.0%) | 53 (57.0%) |
| Real Estate, Rental & Leasing | 29 (39.7%) | 44 (60.3%) |
| Professional & Scientific | 150 (54.0%) | 128 (46.0%) |
| Enterprise Management | 0 (0.0%) | 0 (0.0%) |
| Administrative & Support | 56 (82.4%) | 12 (17.6%) |
| Educational Services | 72 (53.3%) | 63 (46.7%) |
| Health Care & Social Assistance | 54 (23.4%) | 177 (76.6%) |
| Arts, Entertainment & Recreation | 61 (52.1%) | 56 (47.9%) |
| Accommodation & Food Services | 132 (52.4%) | 120 (47.6%) |
| Public Administration | 31 (31.6%) | 67 (68.4%) |
| Total | 1,228 (56.0%) | 965 (44.0%) |
Education in Ouray County
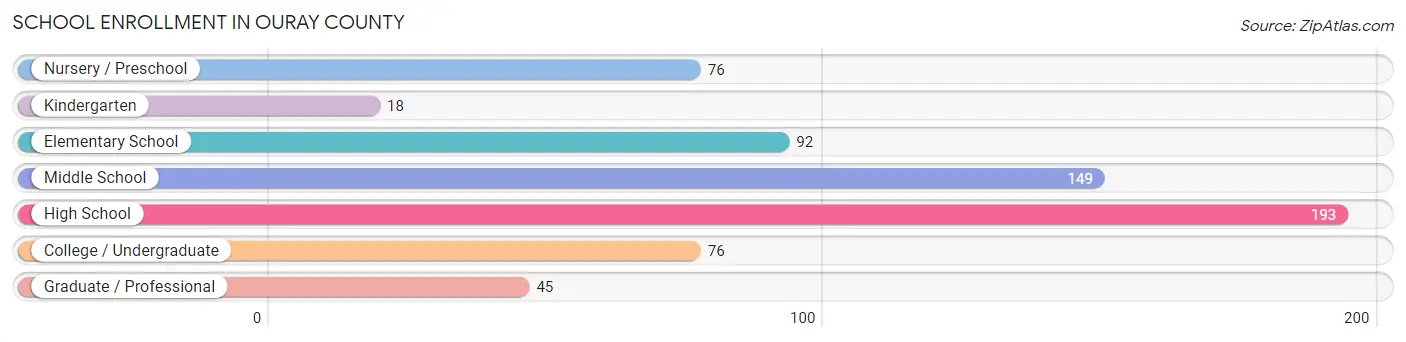
School Enrollment in Ouray County
The most common levels of schooling among the 649 students in Ouray County are high school (193 | 29.7%), middle school (149 | 23.0%), and elementary school (92 | 14.2%).
| School Level | # Students | % Students |
| Nursery / Preschool | 76 | 11.7% |
| Kindergarten | 18 | 2.8% |
| Elementary School | 92 | 14.2% |
| Middle School | 149 | 23.0% |
| High School | 193 | 29.7% |
| College / Undergraduate | 76 | 11.7% |
| Graduate / Professional | 45 | 6.9% |
| Total | 649 | 100.0% |
School Enrollment by Age by Funding Source in Ouray County
Out of a total of 649 students who are enrolled in schools in Ouray County, 65 (10.0%) attend a private institution, while the remaining 584 (90.0%) are enrolled in public schools. The age group of 35 years and over has the highest likelihood of being enrolled in private schools, with 10 (43.5% in the age bracket) enrolled. Conversely, the age group of 15 to 17 year olds has the lowest likelihood of being enrolled in a private school, with 180 (98.9% in the age bracket) attending a public institution.
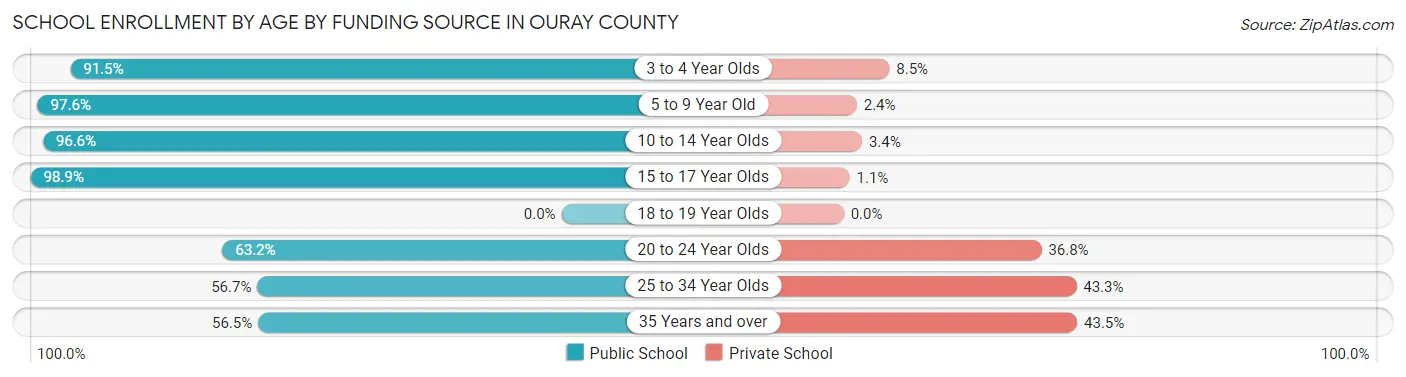
| Age Bracket | Public School | Private School |
| 3 to 4 Year Olds | 43 (91.5%) | 4 (8.5%) |
| 5 to 9 Year Old | 120 (97.6%) | 3 (2.4%) |
| 10 to 14 Year Olds | 170 (96.6%) | 6 (3.4%) |
| 15 to 17 Year Olds | 180 (98.9%) | 2 (1.1%) |
| 18 to 19 Year Olds | 0 (0.0%) | 0 (0.0%) |
| 20 to 24 Year Olds | 24 (63.2%) | 14 (36.8%) |
| 25 to 34 Year Olds | 34 (56.7%) | 26 (43.3%) |
| 35 Years and over | 13 (56.5%) | 10 (43.5%) |
| Total | 584 (90.0%) | 65 (10.0%) |
Educational Attainment by Field of Study in Ouray County
Business (334 | 14.5%), science & technology (276 | 12.0%), education (239 | 10.4%), bio, nature & agricultural (185 | 8.0%), and arts & humanities (171 | 7.4%) are the most common fields of study among 2,307 individuals in Ouray County who have obtained a bachelor's degree or higher.
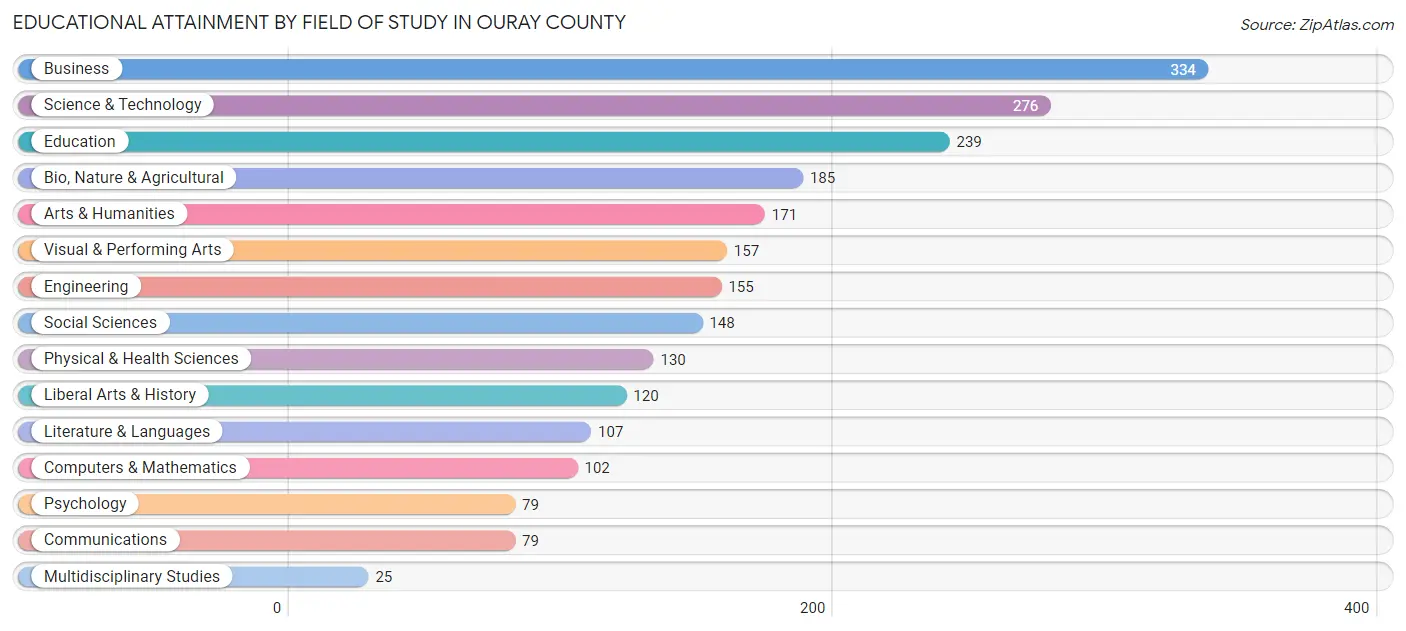
| Field of Study | # Graduates | % Graduates |
| Computers & Mathematics | 102 | 4.4% |
| Bio, Nature & Agricultural | 185 | 8.0% |
| Physical & Health Sciences | 130 | 5.6% |
| Psychology | 79 | 3.4% |
| Social Sciences | 148 | 6.4% |
| Engineering | 155 | 6.7% |
| Multidisciplinary Studies | 25 | 1.1% |
| Science & Technology | 276 | 12.0% |
| Business | 334 | 14.5% |
| Education | 239 | 10.4% |
| Literature & Languages | 107 | 4.6% |
| Liberal Arts & History | 120 | 5.2% |
| Visual & Performing Arts | 157 | 6.8% |
| Communications | 79 | 3.4% |
| Arts & Humanities | 171 | 7.4% |
| Total | 2,307 | 100.0% |
Transportation & Commute in Ouray County
Vehicle Availability by Sex in Ouray County
The most prevalent vehicle ownership categories in Ouray County are males with 2 vehicles (549, accounting for 45.2%) and females with 2 vehicles (338, making up 57.6%).
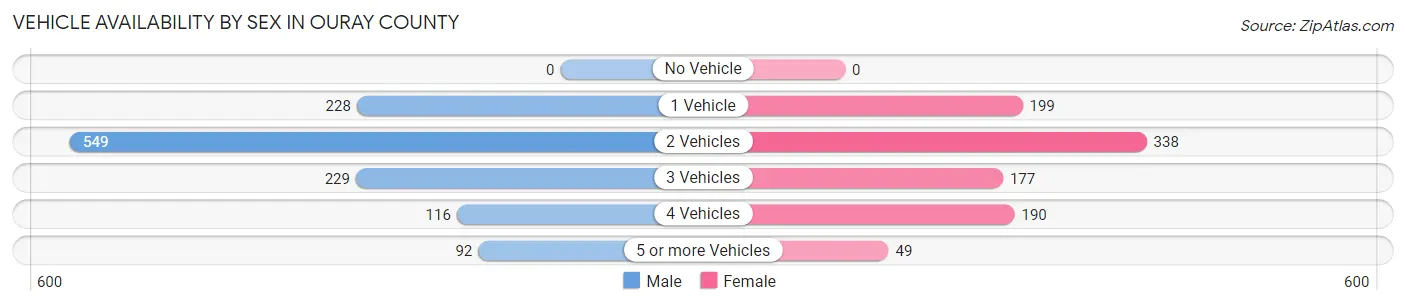
| Vehicles Available | Male | Female |
| No Vehicle | 0 (0.0%) | 0 (0.0%) |
| 1 Vehicle | 228 (18.8%) | 199 (20.9%) |
| 2 Vehicles | 549 (45.2%) | 338 (35.5%) |
| 3 Vehicles | 229 (18.9%) | 177 (18.6%) |
| 4 Vehicles | 116 (9.6%) | 190 (19.9%) |
| 5 or more Vehicles | 92 (7.6%) | 49 (5.1%) |
| Total | 1,214 (100.0%) | 953 (100.0%) |
Commute Time in Ouray County
The most frequently occuring commute durations in Ouray County are 5 to 9 minutes (419 commuters, 22.9%), 10 to 14 minutes (259 commuters, 14.1%), and 45 to 59 minutes (248 commuters, 13.5%).
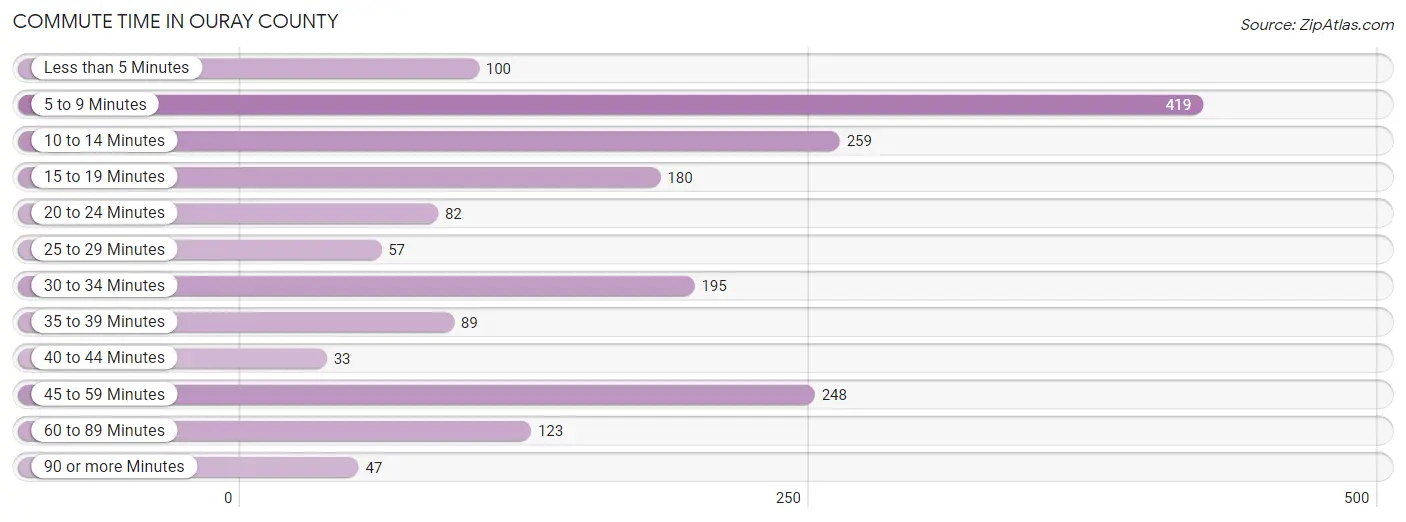
| Commute Time | # Commuters | % Commuters |
| Less than 5 Minutes | 100 | 5.5% |
| 5 to 9 Minutes | 419 | 22.9% |
| 10 to 14 Minutes | 259 | 14.1% |
| 15 to 19 Minutes | 180 | 9.8% |
| 20 to 24 Minutes | 82 | 4.5% |
| 25 to 29 Minutes | 57 | 3.1% |
| 30 to 34 Minutes | 195 | 10.6% |
| 35 to 39 Minutes | 89 | 4.9% |
| 40 to 44 Minutes | 33 | 1.8% |
| 45 to 59 Minutes | 248 | 13.5% |
| 60 to 89 Minutes | 123 | 6.7% |
| 90 or more Minutes | 47 | 2.6% |
Commute Time by Sex in Ouray County
The most common commute times in Ouray County are 5 to 9 minutes (254 commuters, 24.6%) for males and 5 to 9 minutes (165 commuters, 20.6%) for females.
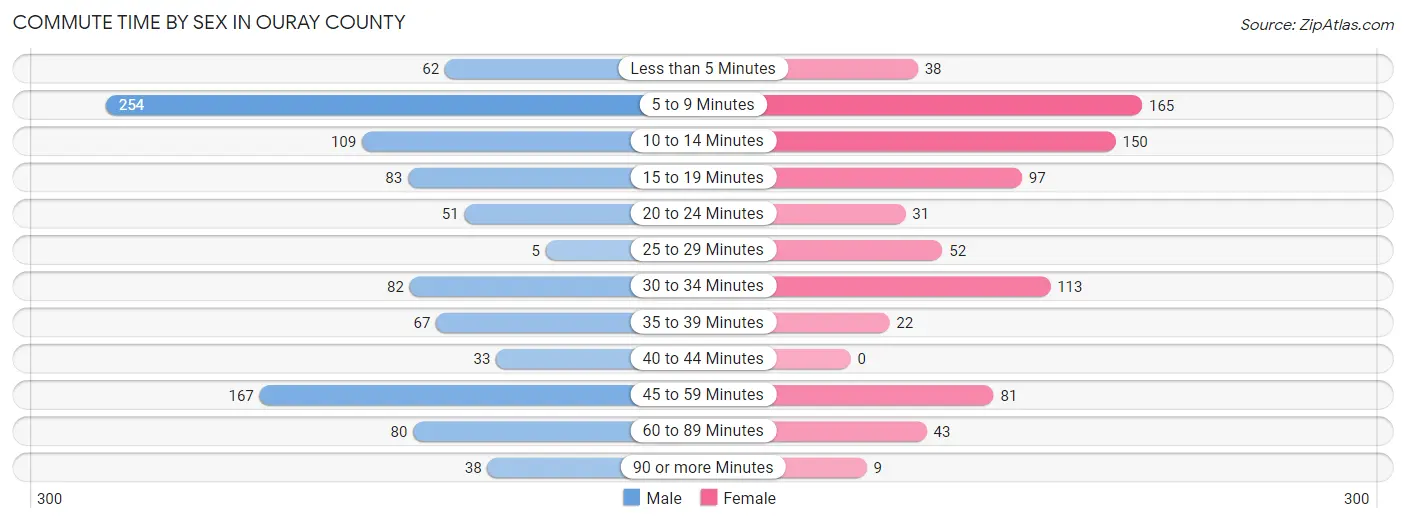
| Commute Time | Male | Female |
| Less than 5 Minutes | 62 (6.0%) | 38 (4.7%) |
| 5 to 9 Minutes | 254 (24.6%) | 165 (20.6%) |
| 10 to 14 Minutes | 109 (10.6%) | 150 (18.7%) |
| 15 to 19 Minutes | 83 (8.1%) | 97 (12.1%) |
| 20 to 24 Minutes | 51 (5.0%) | 31 (3.9%) |
| 25 to 29 Minutes | 5 (0.5%) | 52 (6.5%) |
| 30 to 34 Minutes | 82 (8.0%) | 113 (14.1%) |
| 35 to 39 Minutes | 67 (6.5%) | 22 (2.8%) |
| 40 to 44 Minutes | 33 (3.2%) | 0 (0.0%) |
| 45 to 59 Minutes | 167 (16.2%) | 81 (10.1%) |
| 60 to 89 Minutes | 80 (7.8%) | 43 (5.4%) |
| 90 or more Minutes | 38 (3.7%) | 9 (1.1%) |
Time of Departure to Work by Sex in Ouray County
The most frequent times of departure to work in Ouray County are 7:00 AM to 7:29 AM (269, 26.1%) for males and 7:30 AM to 7:59 AM (229, 28.6%) for females.
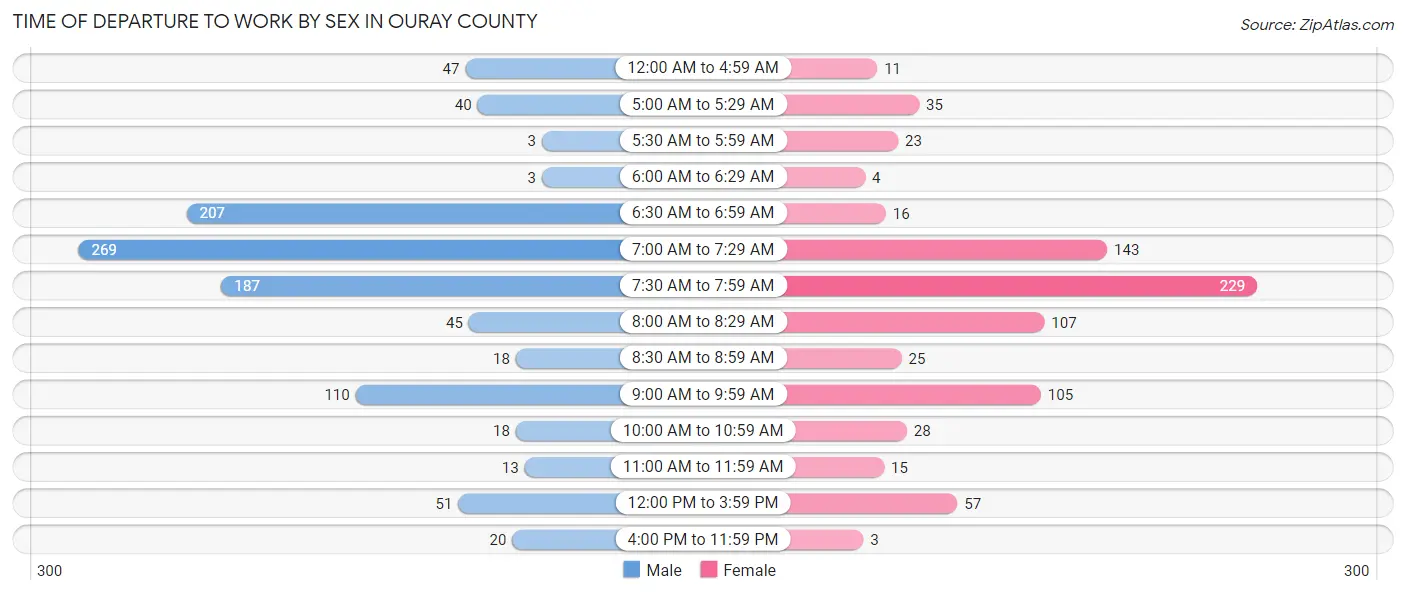
| Time of Departure | Male | Female |
| 12:00 AM to 4:59 AM | 47 (4.6%) | 11 (1.4%) |
| 5:00 AM to 5:29 AM | 40 (3.9%) | 35 (4.4%) |
| 5:30 AM to 5:59 AM | 3 (0.3%) | 23 (2.9%) |
| 6:00 AM to 6:29 AM | 3 (0.3%) | 4 (0.5%) |
| 6:30 AM to 6:59 AM | 207 (20.1%) | 16 (2.0%) |
| 7:00 AM to 7:29 AM | 269 (26.1%) | 143 (17.8%) |
| 7:30 AM to 7:59 AM | 187 (18.1%) | 229 (28.6%) |
| 8:00 AM to 8:29 AM | 45 (4.4%) | 107 (13.4%) |
| 8:30 AM to 8:59 AM | 18 (1.8%) | 25 (3.1%) |
| 9:00 AM to 9:59 AM | 110 (10.7%) | 105 (13.1%) |
| 10:00 AM to 10:59 AM | 18 (1.8%) | 28 (3.5%) |
| 11:00 AM to 11:59 AM | 13 (1.3%) | 15 (1.9%) |
| 12:00 PM to 3:59 PM | 51 (5.0%) | 57 (7.1%) |
| 4:00 PM to 11:59 PM | 20 (1.9%) | 3 (0.4%) |
| Total | 1,031 (100.0%) | 801 (100.0%) |
Housing Occupancy in Ouray County
Occupancy by Ownership in Ouray County
Of the total 2,435 dwellings in Ouray County, owner-occupied units account for 1,864 (76.5%), while renter-occupied units make up 571 (23.4%).

| Occupancy | # Housing Units | % Housing Units |
| Owner Occupied Housing Units | 1,864 | 76.5% |
| Renter-Occupied Housing Units | 571 | 23.4% |
| Total Occupied Housing Units | 2,435 | 100.0% |
Occupancy by Household Size in Ouray County
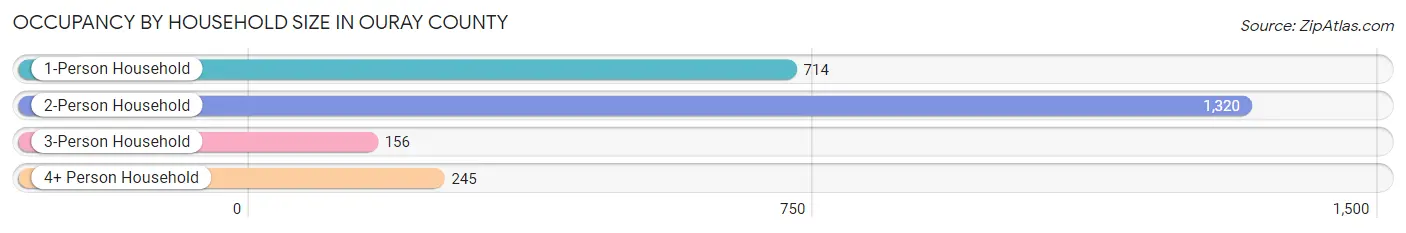
| Household Size | # Housing Units | % Housing Units |
| 1-Person Household | 714 | 29.3% |
| 2-Person Household | 1,320 | 54.2% |
| 3-Person Household | 156 | 6.4% |
| 4+ Person Household | 245 | 10.1% |
| Total Housing Units | 2,435 | 100.0% |
Occupancy by Ownership by Household Size in Ouray County

| Household Size | Owner-occupied | Renter-occupied |
| 1-Person Household | 527 (73.8%) | 187 (26.2%) |
| 2-Person Household | 1,057 (80.1%) | 263 (19.9%) |
| 3-Person Household | 108 (69.2%) | 48 (30.8%) |
| 4+ Person Household | 172 (70.2%) | 73 (29.8%) |
| Total Housing Units | 1,864 (76.5%) | 571 (23.4%) |
Occupancy by Educational Attainment in Ouray County
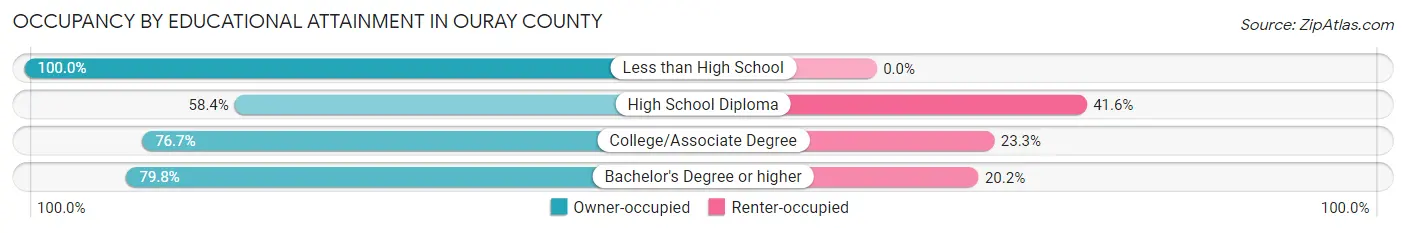
| Household Size | Owner-occupied | Renter-occupied |
| Less than High School | 58 (100.0%) | 0 (0.0%) |
| High School Diploma | 171 (58.4%) | 122 (41.6%) |
| College/Associate Degree | 690 (76.7%) | 210 (23.3%) |
| Bachelor's Degree or higher | 945 (79.8%) | 239 (20.2%) |
Occupancy by Age of Householder in Ouray County

| Age Bracket | # Households | % Households |
| Under 35 Years | 260 | 10.7% |
| 35 to 44 Years | 230 | 9.5% |
| 45 to 54 Years | 380 | 15.6% |
| 55 to 64 Years | 438 | 18.0% |
| 65 to 74 Years | 794 | 32.6% |
| 75 to 84 Years | 267 | 11.0% |
| 85 Years and Over | 66 | 2.7% |
| Total | 2,435 | 100.0% |
Housing Finances in Ouray County
Median Income by Occupancy in Ouray County
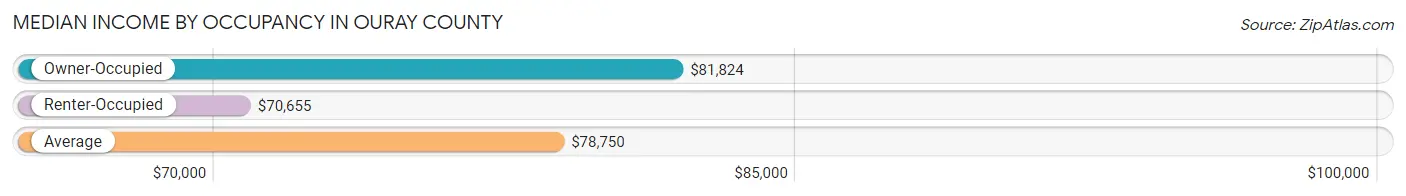
| Occupancy Type | # Households | Median Income |
| Owner-Occupied | 1,864 (76.5%) | $81,824 |
| Renter-Occupied | 571 (23.4%) | $70,655 |
| Average | 2,435 (100.0%) | $78,750 |
Occupancy by Householder Income Bracket in Ouray County
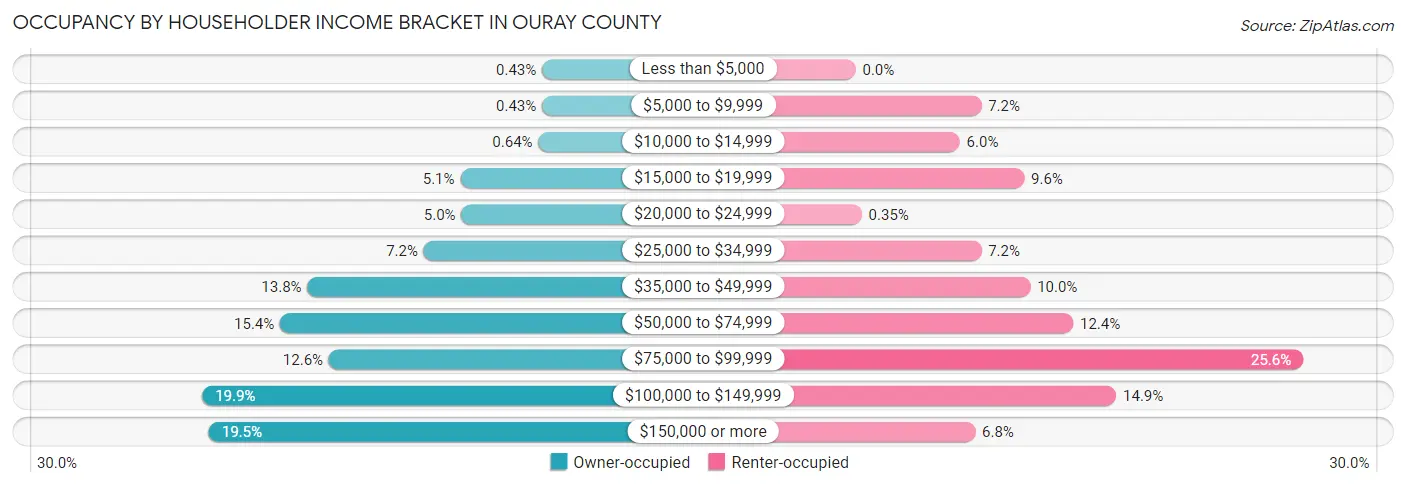
| Income Bracket | Owner-occupied | Renter-occupied |
| Less than $5,000 | 8 (0.4%) | 0 (0.0%) |
| $5,000 to $9,999 | 8 (0.4%) | 41 (7.2%) |
| $10,000 to $14,999 | 12 (0.6%) | 34 (5.9%) |
| $15,000 to $19,999 | 95 (5.1%) | 55 (9.6%) |
| $20,000 to $24,999 | 94 (5.0%) | 2 (0.4%) |
| $25,000 to $34,999 | 134 (7.2%) | 41 (7.2%) |
| $35,000 to $49,999 | 258 (13.8%) | 57 (10.0%) |
| $50,000 to $74,999 | 287 (15.4%) | 71 (12.4%) |
| $75,000 to $99,999 | 235 (12.6%) | 146 (25.6%) |
| $100,000 to $149,999 | 370 (19.9%) | 85 (14.9%) |
| $150,000 or more | 363 (19.5%) | 39 (6.8%) |
| Total | 1,864 (100.0%) | 571 (100.0%) |
Monthly Housing Cost Tiers in Ouray County
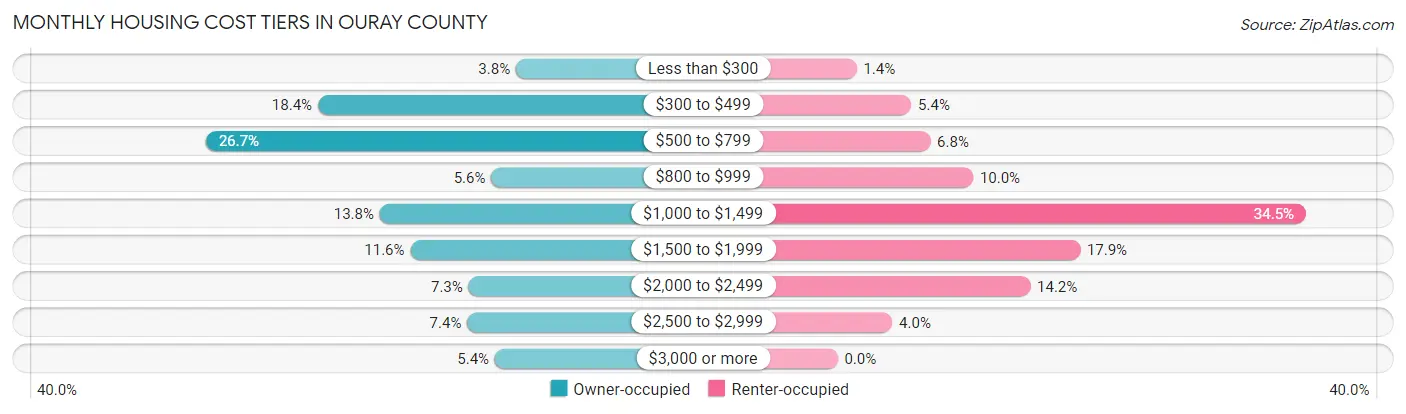
| Monthly Cost | Owner-occupied | Renter-occupied |
| Less than $300 | 71 (3.8%) | 8 (1.4%) |
| $300 to $499 | 343 (18.4%) | 31 (5.4%) |
| $500 to $799 | 497 (26.7%) | 39 (6.8%) |
| $800 to $999 | 105 (5.6%) | 57 (10.0%) |
| $1,000 to $1,499 | 258 (13.8%) | 197 (34.5%) |
| $1,500 to $1,999 | 216 (11.6%) | 102 (17.9%) |
| $2,000 to $2,499 | 136 (7.3%) | 81 (14.2%) |
| $2,500 to $2,999 | 138 (7.4%) | 23 (4.0%) |
| $3,000 or more | 100 (5.4%) | 0 (0.0%) |
| Total | 1,864 (100.0%) | 571 (100.0%) |
Physical Housing Characteristics in Ouray County
Housing Structures in Ouray County
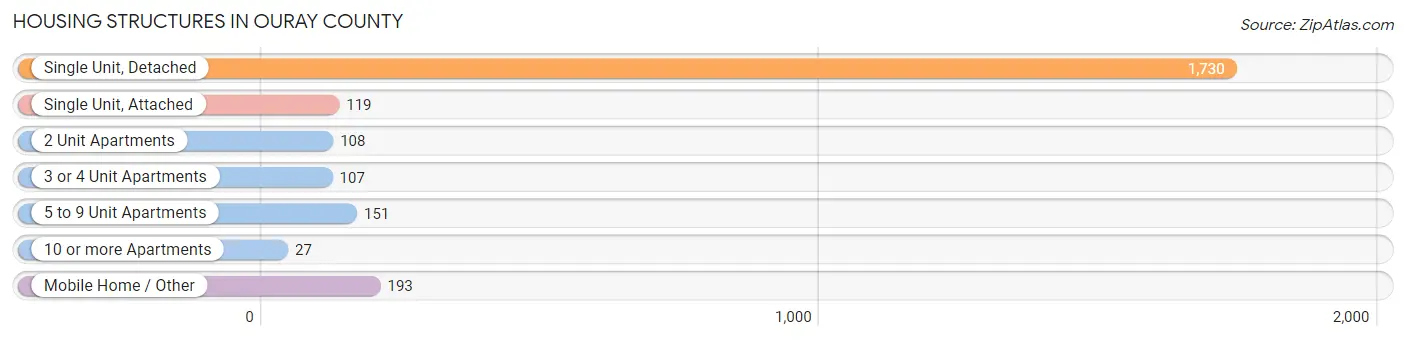
| Structure Type | # Housing Units | % Housing Units |
| Single Unit, Detached | 1,730 | 71.1% |
| Single Unit, Attached | 119 | 4.9% |
| 2 Unit Apartments | 108 | 4.4% |
| 3 or 4 Unit Apartments | 107 | 4.4% |
| 5 to 9 Unit Apartments | 151 | 6.2% |
| 10 or more Apartments | 27 | 1.1% |
| Mobile Home / Other | 193 | 7.9% |
| Total | 2,435 | 100.0% |
Housing Structures by Occupancy in Ouray County
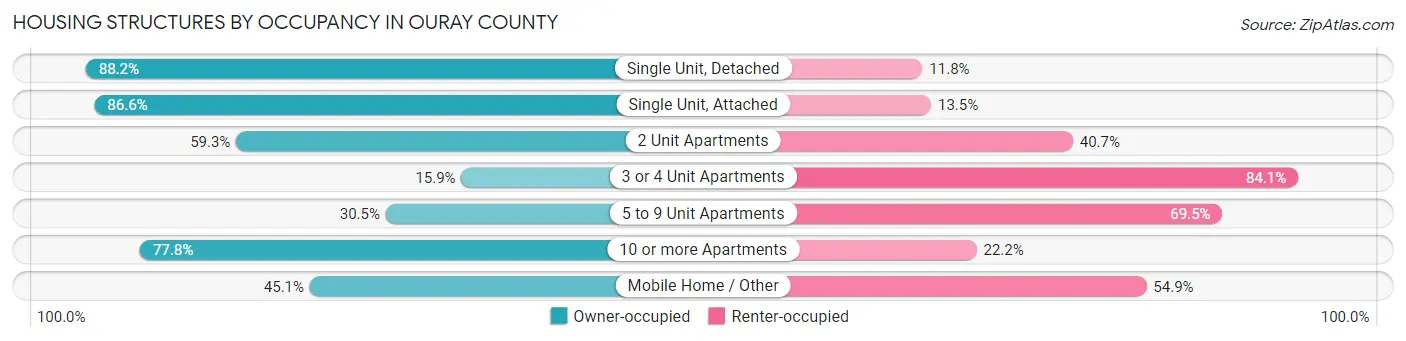
| Structure Type | Owner-occupied | Renter-occupied |
| Single Unit, Detached | 1,526 (88.2%) | 204 (11.8%) |
| Single Unit, Attached | 103 (86.6%) | 16 (13.5%) |
| 2 Unit Apartments | 64 (59.3%) | 44 (40.7%) |
| 3 or 4 Unit Apartments | 17 (15.9%) | 90 (84.1%) |
| 5 to 9 Unit Apartments | 46 (30.5%) | 105 (69.5%) |
| 10 or more Apartments | 21 (77.8%) | 6 (22.2%) |
| Mobile Home / Other | 87 (45.1%) | 106 (54.9%) |
| Total | 1,864 (76.5%) | 571 (23.4%) |
Housing Structures by Number of Rooms in Ouray County
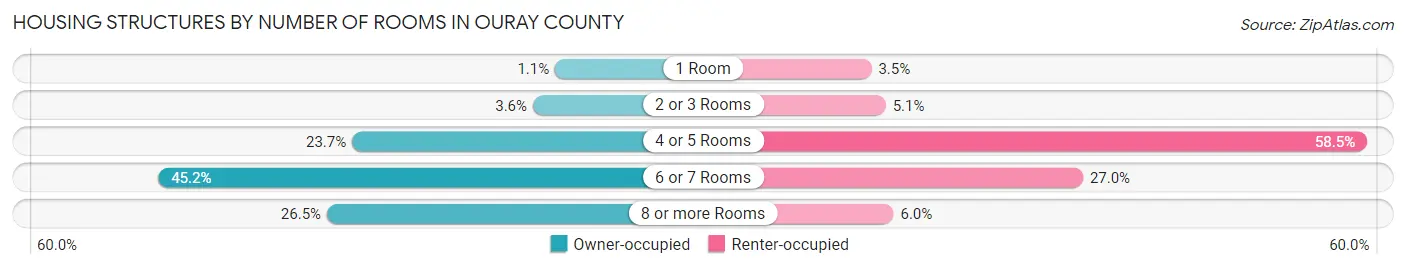
| Number of Rooms | Owner-occupied | Renter-occupied |
| 1 Room | 21 (1.1%) | 20 (3.5%) |
| 2 or 3 Rooms | 67 (3.6%) | 29 (5.1%) |
| 4 or 5 Rooms | 441 (23.7%) | 334 (58.5%) |
| 6 or 7 Rooms | 842 (45.2%) | 154 (27.0%) |
| 8 or more Rooms | 493 (26.5%) | 34 (5.9%) |
| Total | 1,864 (100.0%) | 571 (100.0%) |
Housing Structure by Heating Type in Ouray County
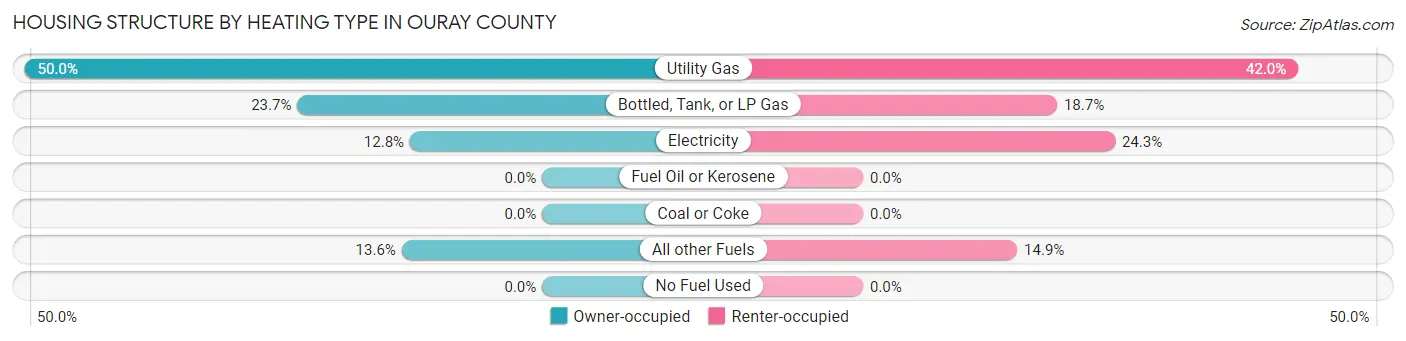
| Heating Type | Owner-occupied | Renter-occupied |
| Utility Gas | 932 (50.0%) | 240 (42.0%) |
| Bottled, Tank, or LP Gas | 441 (23.7%) | 107 (18.7%) |
| Electricity | 238 (12.8%) | 139 (24.3%) |
| Fuel Oil or Kerosene | 0 (0.0%) | 0 (0.0%) |
| Coal or Coke | 0 (0.0%) | 0 (0.0%) |
| All other Fuels | 253 (13.6%) | 85 (14.9%) |
| No Fuel Used | 0 (0.0%) | 0 (0.0%) |
| Total | 1,864 (100.0%) | 571 (100.0%) |
Household Vehicle Usage in Ouray County
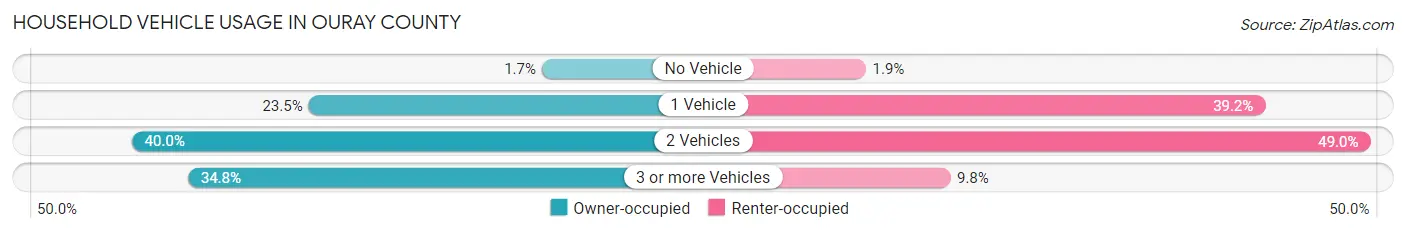
| Vehicles per Household | Owner-occupied | Renter-occupied |
| No Vehicle | 32 (1.7%) | 11 (1.9%) |
| 1 Vehicle | 438 (23.5%) | 224 (39.2%) |
| 2 Vehicles | 746 (40.0%) | 280 (49.0%) |
| 3 or more Vehicles | 648 (34.8%) | 56 (9.8%) |
| Total | 1,864 (100.0%) | 571 (100.0%) |
Real Estate & Mortgages in Ouray County
Real Estate and Mortgage Overview in Ouray County
| Characteristic | Without Mortgage | With Mortgage |
| Housing Units | 1,057 | 807 |
| Median Property Value | $583,700 | $613,700 |
| Median Household Income | $62,096 | $176 |
| Monthly Housing Costs | $553 | $94 |
| Real Estate Taxes | $1,574 | $9 |
Property Value by Mortgage Status in Ouray County
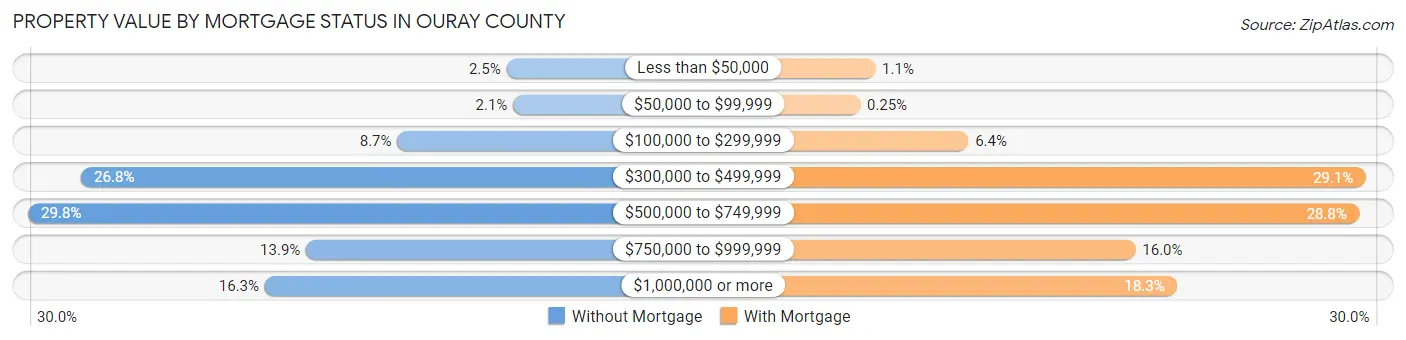
| Property Value | Without Mortgage | With Mortgage |
| Less than $50,000 | 26 (2.5%) | 9 (1.1%) |
| $50,000 to $99,999 | 22 (2.1%) | 2 (0.3%) |
| $100,000 to $299,999 | 92 (8.7%) | 52 (6.4%) |
| $300,000 to $499,999 | 283 (26.8%) | 235 (29.1%) |
| $500,000 to $749,999 | 315 (29.8%) | 232 (28.7%) |
| $750,000 to $999,999 | 147 (13.9%) | 129 (16.0%) |
| $1,000,000 or more | 172 (16.3%) | 148 (18.3%) |
| Total | 1,057 (100.0%) | 807 (100.0%) |
Household Income by Mortgage Status in Ouray County
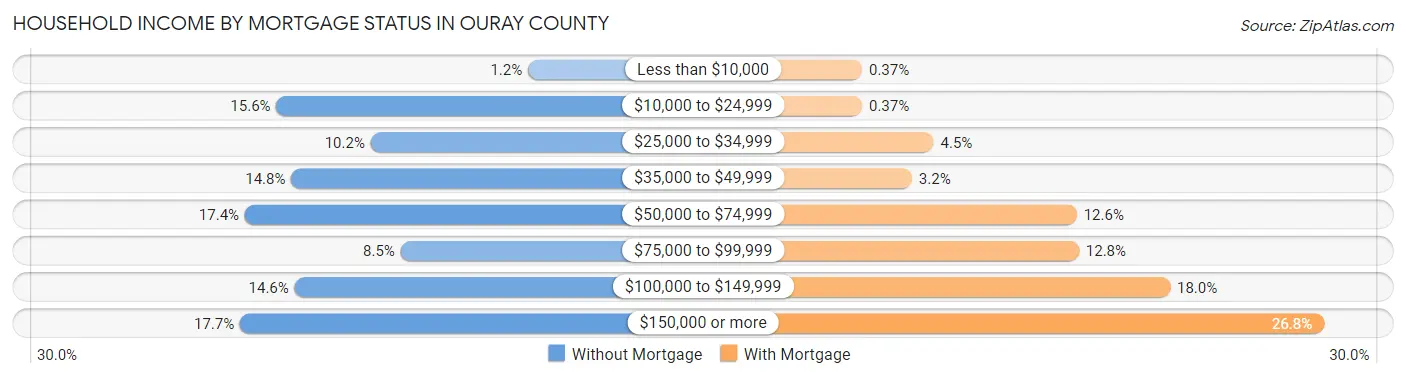
| Household Income | Without Mortgage | With Mortgage |
| Less than $10,000 | 13 (1.2%) | 3 (0.4%) |
| $10,000 to $24,999 | 165 (15.6%) | 3 (0.4%) |
| $25,000 to $34,999 | 108 (10.2%) | 36 (4.5%) |
| $35,000 to $49,999 | 156 (14.8%) | 26 (3.2%) |
| $50,000 to $74,999 | 184 (17.4%) | 102 (12.6%) |
| $75,000 to $99,999 | 90 (8.5%) | 103 (12.8%) |
| $100,000 to $149,999 | 154 (14.6%) | 145 (18.0%) |
| $150,000 or more | 187 (17.7%) | 216 (26.8%) |
| Total | 1,057 (100.0%) | 807 (100.0%) |
Property Value to Household Income Ratio in Ouray County
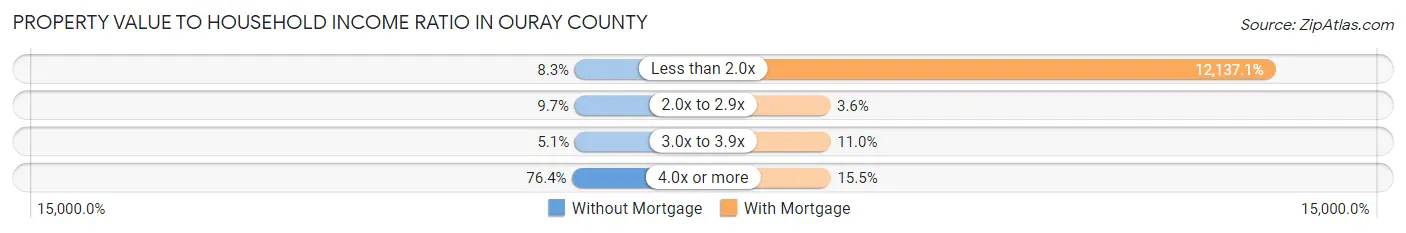
| Value-to-Income Ratio | Without Mortgage | With Mortgage |
| Less than 2.0x | 88 (8.3%) | 97,946 (12,137.1%) |
| 2.0x to 2.9x | 102 (9.7%) | 29 (3.6%) |
| 3.0x to 3.9x | 54 (5.1%) | 89 (11.0%) |
| 4.0x or more | 808 (76.4%) | 125 (15.5%) |
| Total | 1,057 (100.0%) | 807 (100.0%) |
Real Estate Taxes by Mortgage Status in Ouray County
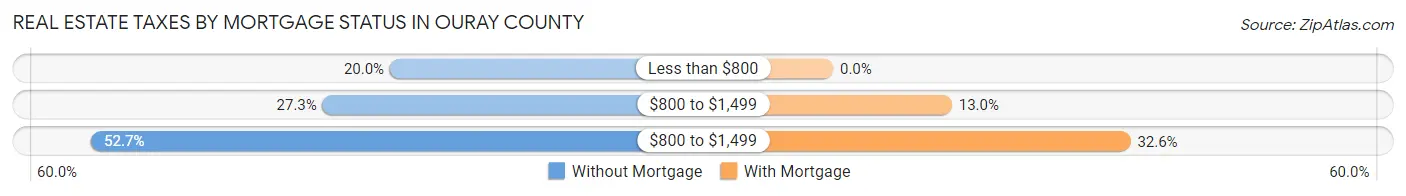
| Property Taxes | Without Mortgage | With Mortgage |
| Less than $800 | 211 (20.0%) | 0 (0.0%) |
| $800 to $1,499 | 289 (27.3%) | 105 (13.0%) |
| $800 to $1,499 | 557 (52.7%) | 263 (32.6%) |
| Total | 1,057 (100.0%) | 807 (100.0%) |
Health & Disability in Ouray County
Health Insurance Coverage by Age in Ouray County
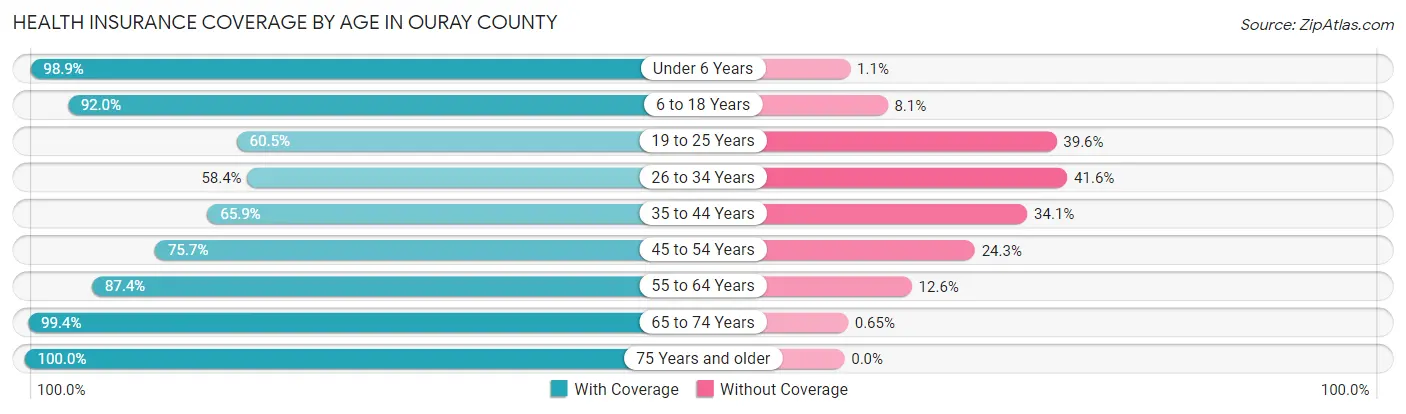
| Age Bracket | With Coverage | Without Coverage |
| Under 6 Years | 181 (98.9%) | 2 (1.1%) |
| 6 to 18 Years | 411 (91.9%) | 36 (8.1%) |
| 19 to 25 Years | 107 (60.5%) | 70 (39.6%) |
| 26 to 34 Years | 270 (58.4%) | 192 (41.6%) |
| 35 to 44 Years | 315 (65.9%) | 163 (34.1%) |
| 45 to 54 Years | 476 (75.7%) | 153 (24.3%) |
| 55 to 64 Years | 682 (87.4%) | 98 (12.6%) |
| 65 to 74 Years | 1,222 (99.4%) | 8 (0.6%) |
| 75 Years and older | 550 (100.0%) | 0 (0.0%) |
| Total | 4,214 (85.4%) | 722 (14.6%) |
Health Insurance Coverage by Citizenship Status in Ouray County
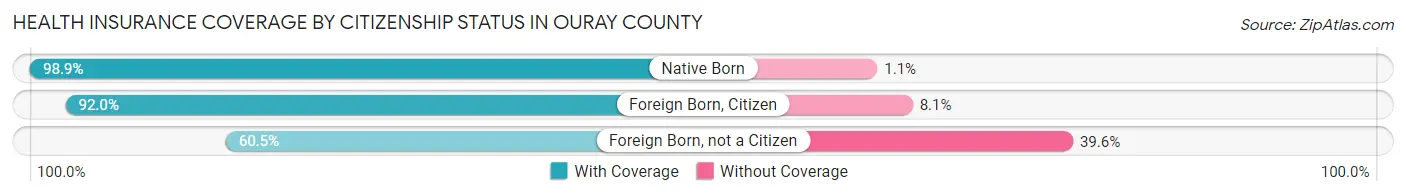
| Citizenship Status | With Coverage | Without Coverage |
| Native Born | 181 (98.9%) | 2 (1.1%) |
| Foreign Born, Citizen | 411 (91.9%) | 36 (8.1%) |
| Foreign Born, not a Citizen | 107 (60.5%) | 70 (39.6%) |
Health Insurance Coverage by Household Income in Ouray County
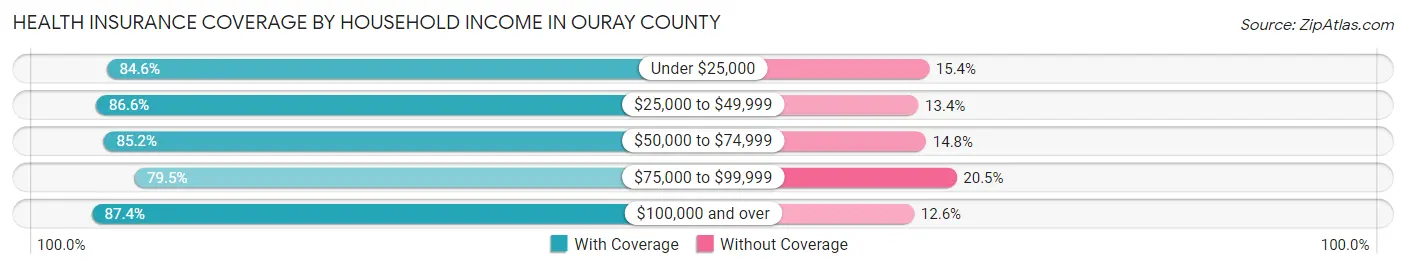
| Household Income | With Coverage | Without Coverage |
| Under $25,000 | 336 (84.6%) | 61 (15.4%) |
| $25,000 to $49,999 | 713 (86.6%) | 110 (13.4%) |
| $50,000 to $74,999 | 575 (85.2%) | 100 (14.8%) |
| $75,000 to $99,999 | 685 (79.5%) | 177 (20.5%) |
| $100,000 and over | 1,905 (87.4%) | 274 (12.6%) |
Public vs Private Health Insurance Coverage by Age in Ouray County
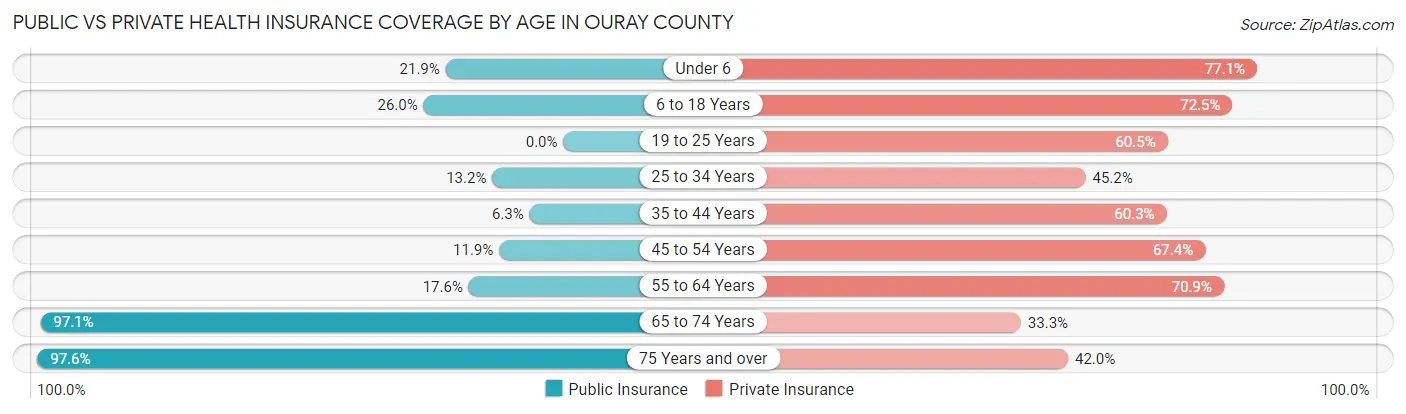
| Age Bracket | Public Insurance | Private Insurance |
| Under 6 | 40 (21.9%) | 141 (77.0%) |
| 6 to 18 Years | 116 (26.0%) | 324 (72.5%) |
| 19 to 25 Years | 0 (0.0%) | 107 (60.5%) |
| 25 to 34 Years | 61 (13.2%) | 209 (45.2%) |
| 35 to 44 Years | 30 (6.3%) | 288 (60.3%) |
| 45 to 54 Years | 75 (11.9%) | 424 (67.4%) |
| 55 to 64 Years | 137 (17.6%) | 553 (70.9%) |
| 65 to 74 Years | 1,194 (97.1%) | 409 (33.3%) |
| 75 Years and over | 537 (97.6%) | 231 (42.0%) |
| Total | 2,190 (44.4%) | 2,686 (54.4%) |
Disability Status by Sex by Age in Ouray County
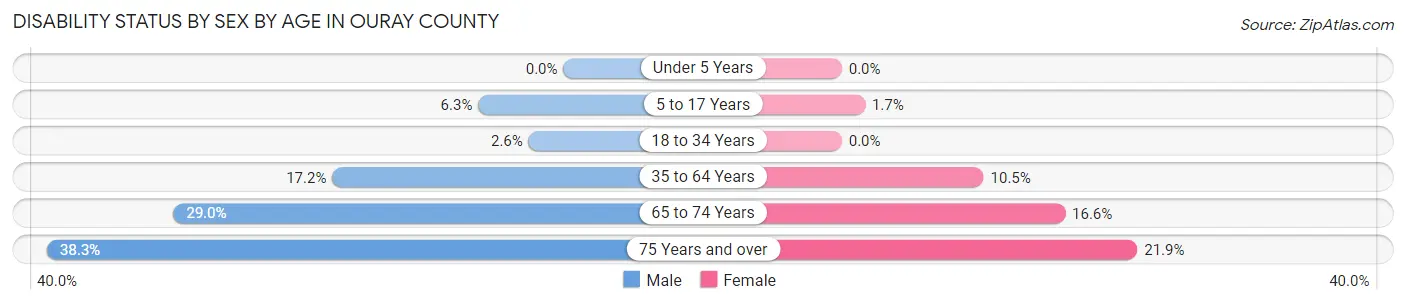
| Age Bracket | Male | Female |
| Under 5 Years | 0 (0.0%) | 0 (0.0%) |
| 5 to 17 Years | 16 (6.3%) | 4 (1.7%) |
| 18 to 34 Years | 8 (2.6%) | 0 (0.0%) |
| 35 to 64 Years | 156 (17.2%) | 103 (10.5%) |
| 65 to 74 Years | 192 (29.0%) | 94 (16.6%) |
| 75 Years and over | 120 (38.3%) | 52 (21.9%) |
Disability Class by Sex by Age in Ouray County
Disability Class: Hearing Difficulty
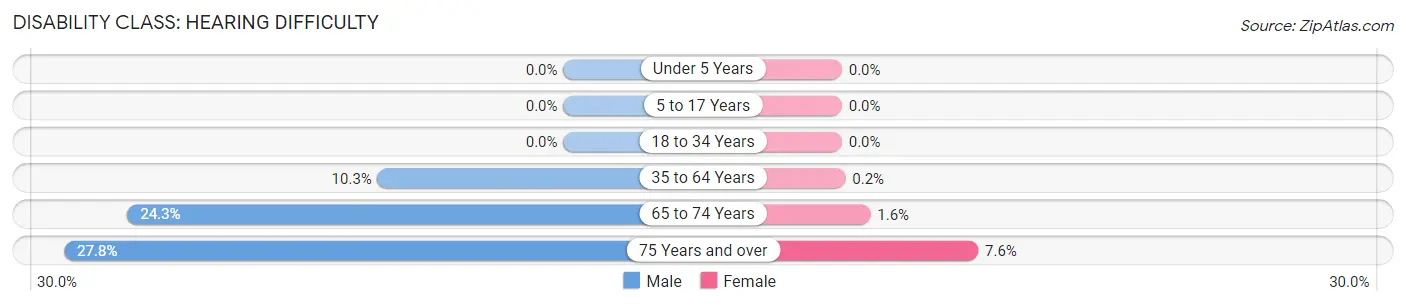
| Age Bracket | Male | Female |
| Under 5 Years | 0 (0.0%) | 0 (0.0%) |
| 5 to 17 Years | 0 (0.0%) | 0 (0.0%) |
| 18 to 34 Years | 0 (0.0%) | 0 (0.0%) |
| 35 to 64 Years | 94 (10.3%) | 2 (0.2%) |
| 65 to 74 Years | 161 (24.3%) | 9 (1.6%) |
| 75 Years and over | 87 (27.8%) | 18 (7.6%) |
Disability Class: Vision Difficulty
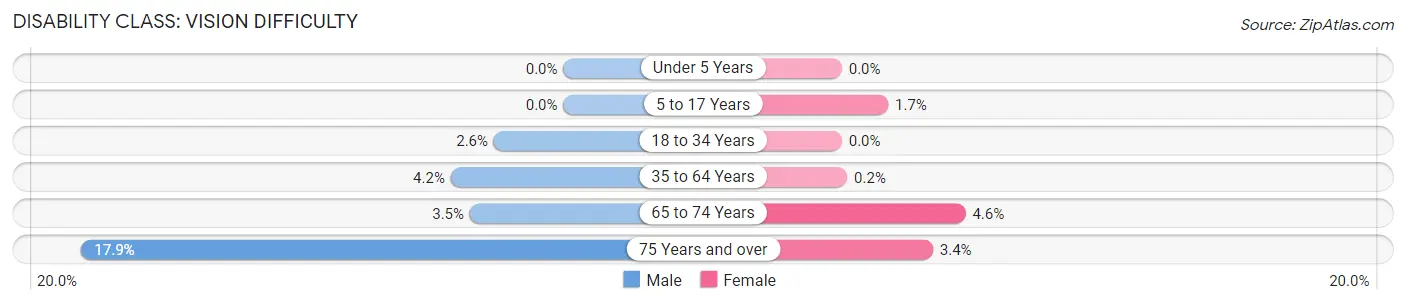
| Age Bracket | Male | Female |
| Under 5 Years | 0 (0.0%) | 0 (0.0%) |
| 5 to 17 Years | 0 (0.0%) | 4 (1.7%) |
| 18 to 34 Years | 8 (2.6%) | 0 (0.0%) |
| 35 to 64 Years | 38 (4.2%) | 2 (0.2%) |
| 65 to 74 Years | 23 (3.5%) | 26 (4.6%) |
| 75 Years and over | 56 (17.9%) | 8 (3.4%) |
Disability Class: Cognitive Difficulty
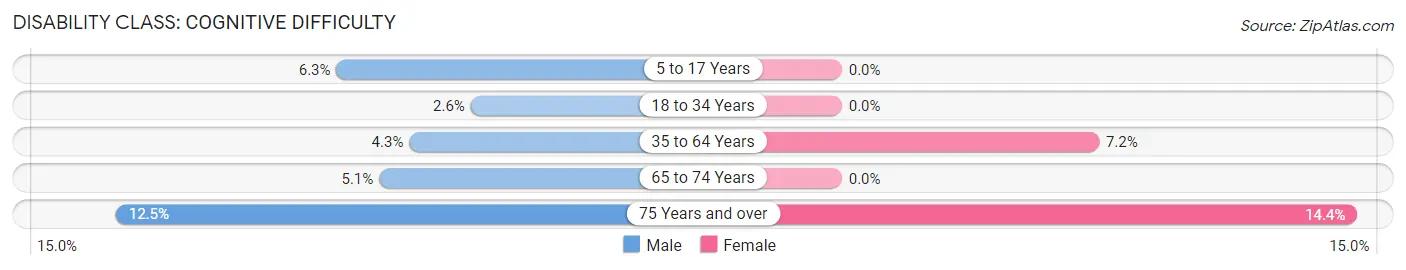
| Age Bracket | Male | Female |
| 5 to 17 Years | 16 (6.3%) | 0 (0.0%) |
| 18 to 34 Years | 8 (2.6%) | 0 (0.0%) |
| 35 to 64 Years | 39 (4.3%) | 70 (7.2%) |
| 65 to 74 Years | 34 (5.1%) | 0 (0.0%) |
| 75 Years and over | 39 (12.5%) | 34 (14.3%) |
Disability Class: Ambulatory Difficulty
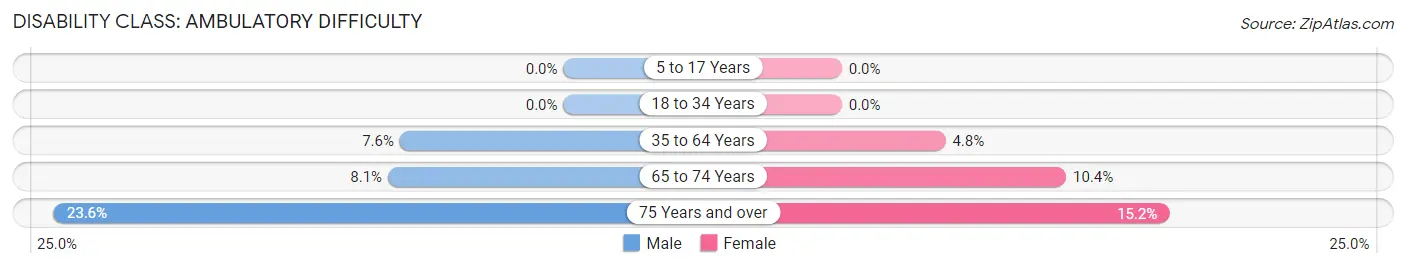
| Age Bracket | Male | Female |
| 5 to 17 Years | 0 (0.0%) | 0 (0.0%) |
| 18 to 34 Years | 0 (0.0%) | 0 (0.0%) |
| 35 to 64 Years | 69 (7.6%) | 47 (4.8%) |
| 65 to 74 Years | 54 (8.1%) | 59 (10.4%) |
| 75 Years and over | 74 (23.6%) | 36 (15.2%) |
Disability Class: Self-Care Difficulty
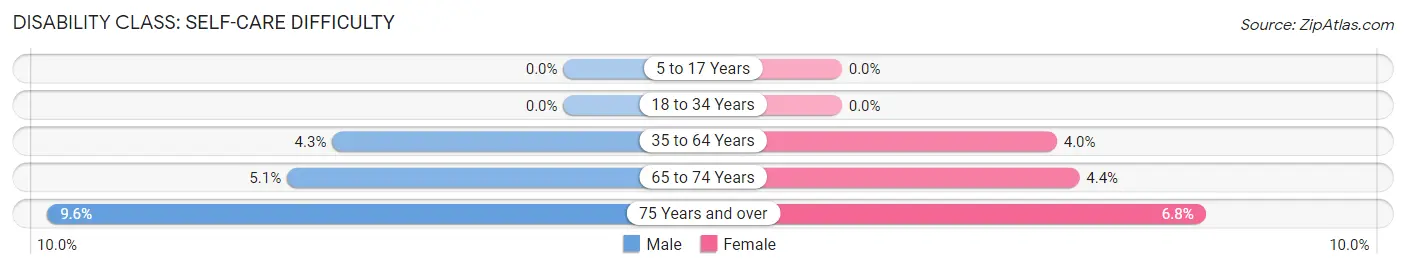
| Age Bracket | Male | Female |
| 5 to 17 Years | 0 (0.0%) | 0 (0.0%) |
| 18 to 34 Years | 0 (0.0%) | 0 (0.0%) |
| 35 to 64 Years | 39 (4.3%) | 39 (4.0%) |
| 65 to 74 Years | 34 (5.1%) | 25 (4.4%) |
| 75 Years and over | 30 (9.6%) | 16 (6.8%) |
Technology Access in Ouray County
Computing Device Access in Ouray County
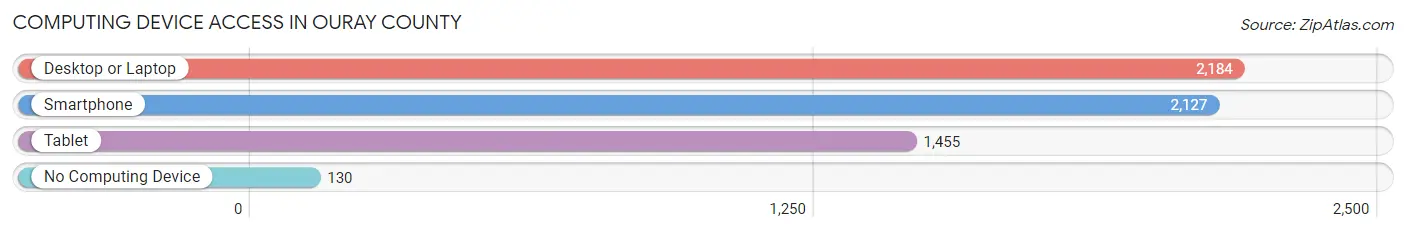
| Device Type | # Households | % Households |
| Desktop or Laptop | 2,184 | 89.7% |
| Smartphone | 2,127 | 87.4% |
| Tablet | 1,455 | 59.8% |
| No Computing Device | 130 | 5.3% |
| Total | 2,435 | 100.0% |
Internet Access in Ouray County
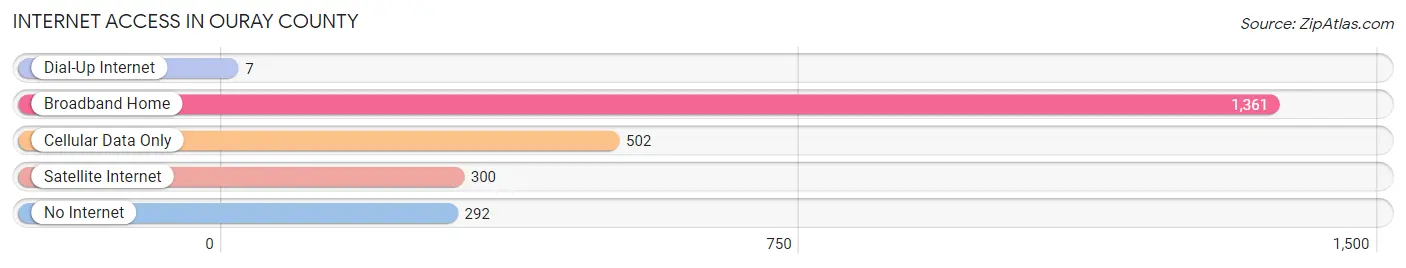
| Internet Type | # Households | % Households |
| Dial-Up Internet | 7 | 0.3% |
| Broadband Home | 1,361 | 55.9% |
| Cellular Data Only | 502 | 20.6% |
| Satellite Internet | 300 | 12.3% |
| No Internet | 292 | 12.0% |
| Total | 2,435 | 100.0% |
Ouray County Summary
Ouray County is located in the southwestern corner of Colorado, and is bordered by San Miguel County to the north, Montrose County to the east, San Juan County to the south, and Hinsdale County to the west. The county seat is Ridgway, and the county is named after Chief Ouray of the Ute Indian tribe. Ouray County covers an area of 1,289 square miles, and has a population of 4,436 as of the 2010 census.
History
The area that is now Ouray County was originally inhabited by the Ute Indians, who were the first to settle in the area. The Ute Indians were nomadic, and moved around the area in search of food and shelter. The first Europeans to settle in the area were miners, who arrived in the late 1800s in search of gold and silver. The area quickly became a popular destination for prospectors, and the town of Ouray was founded in 1876.
The area was originally part of San Juan County, but in 1877, Ouray County was created. The county was named after Chief Ouray of the Ute Indian tribe, who had been a friend to the miners and settlers. The county seat was originally located in Ouray, but was moved to Ridgway in 1883.
Geography
Ouray County is located in the southwestern corner of Colorado, and is bordered by San Miguel County to the north, Montrose County to the east, San Juan County to the south, and Hinsdale County to the west. The county covers an area of 1,289 square miles, and is located in the San Juan Mountains. The county is home to several mountain peaks, including Mount Sneffels, which is the highest peak in the county at 14,150 feet.
The county is home to several rivers and streams, including the Uncompahgre River, which flows through the county from north to south. The county is also home to several lakes, including Lake San Cristobal, which is the largest lake in the county.
Economy
Ouray County’s economy is largely based on tourism, as the county is home to several popular tourist destinations, including the town of Ouray, which is known for its hot springs and scenic mountain views. The county is also home to several ski resorts, including Telluride Ski Resort, which is one of the most popular ski resorts in the state.
The county is also home to several mining operations, including gold and silver mines. The county is also home to several ranches, which raise cattle and sheep.
Demographics
As of the 2010 census, Ouray County had a population of 4,436. The population is largely white (93.3%), with small percentages of Hispanic (3.2%), Native American (1.2%), and African American (0.3%) populations. The median household income in the county is $45,938, and the median age is 44.7 years.
Common Questions
What is Per Capita Income in Ouray County?
Per Capita income in Ouray County is $47,768.
What is the Median Family Income in Ouray County?
Median Family Income in Ouray County is $89,070.
What is the Median Household income in Ouray County?
Median Household Income in Ouray County is $78,750.
What is Income or Wage Gap in Ouray County?
Income or Wage Gap in Ouray County is 27.3%.
Women in Ouray County earn 72.7 cents for every dollar earned by a man.
What is Inequality or Gini Index in Ouray County?
Inequality or Gini Index in Ouray County is 0.44.
What is the Total Population of Ouray County?
Total Population of Ouray County is 4,936.
What is the Total Male Population of Ouray County?
Total Male Population of Ouray County is 2,558.
What is the Total Female Population of Ouray County?
Total Female Population of Ouray County is 2,378.
What is the Ratio of Males per 100 Females in Ouray County?
There are 107.57 Males per 100 Females in Ouray County.
What is the Ratio of Females per 100 Males in Ouray County?
There are 92.96 Females per 100 Males in Ouray County.
What is the Median Population Age in Ouray County?
Median Population Age in Ouray County is 56.8 Years.
What is the Average Family Size in Ouray County
Average Family Size in Ouray County is 2.5 People.
What is the Average Household Size in Ouray County
Average Household Size in Ouray County is 2.0 People.
How Large is the Labor Force in Ouray County?
There are 2,286 People in the Labor Forcein in Ouray County.
What is the Percentage of People in the Labor Force in Ouray County?
51.9% of People are in the Labor Force in Ouray County.
What is the Unemployment Rate in Ouray County?
Unemployment Rate in Ouray County is 4.2%.