Mineral County, CO Map & Demographics
Mineral County Map
Mineral County Overview
$37,647
PER CAPITA INCOME
$67,344
AVG FAMILY INCOME
$58,929
AVG HOUSEHOLD INCOME
54.6%
WAGE / INCOME GAP [ % ]
45.4¢/ $1
WAGE / INCOME GAP [ $ ]
0.39
INEQUALITY / GINI INDEX
794
TOTAL POPULATION
395
MALE POPULATION
399
FEMALE POPULATION
99.00
MALES / 100 FEMALES
101.01
FEMALES / 100 MALES
54.7
MEDIAN AGE
2.4
AVG FAMILY SIZE
1.9
AVG HOUSEHOLD SIZE
436
LABOR FORCE [ PEOPLE ]
61.7%
PERCENT IN LABOR FORCE
4.8%
UNEMPLOYMENT RATE
Mineral County Area Codes
Income in Mineral County
Income Overview in Mineral County
Per Capita Income in Mineral County is $37,647, while median incomes of families and households are $67,344 and $58,929 respectively.
| Characteristic | Number | Measure |
| Per Capita Income | 794 | $37,647 |
| Median Family Income | 255 | $67,344 |
| Mean Family Income | 255 | $88,542 |
| Median Household Income | 418 | $58,929 |
| Mean Household Income | 418 | $72,350 |
| Income Deficit | 255 | $0 |
| Wage / Income Gap (%) | 794 | 54.64% |
| Wage / Income Gap ($) | 794 | 45.36¢ per $1 |
| Gini / Inequality Index | 794 | 0.39 |
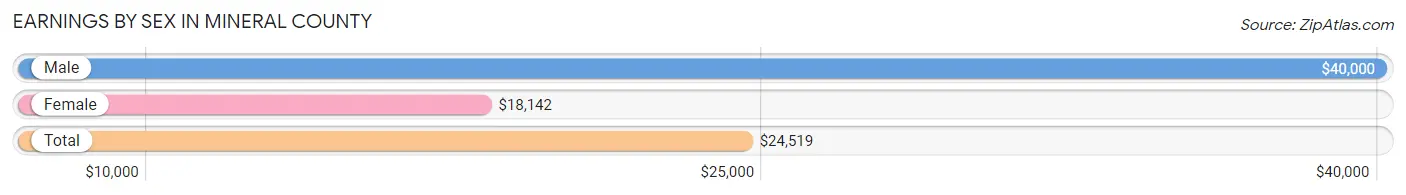
Earnings by Sex in Mineral County
Average Earnings in Mineral County are $24,519, $40,000 for men and $18,142 for women, a difference of 54.6%.
| Sex | Number | Average Earnings |
| Male | 266 (52.7%) | $40,000 |
| Female | 239 (47.3%) | $18,142 |
| Total | 505 (100.0%) | $24,519 |
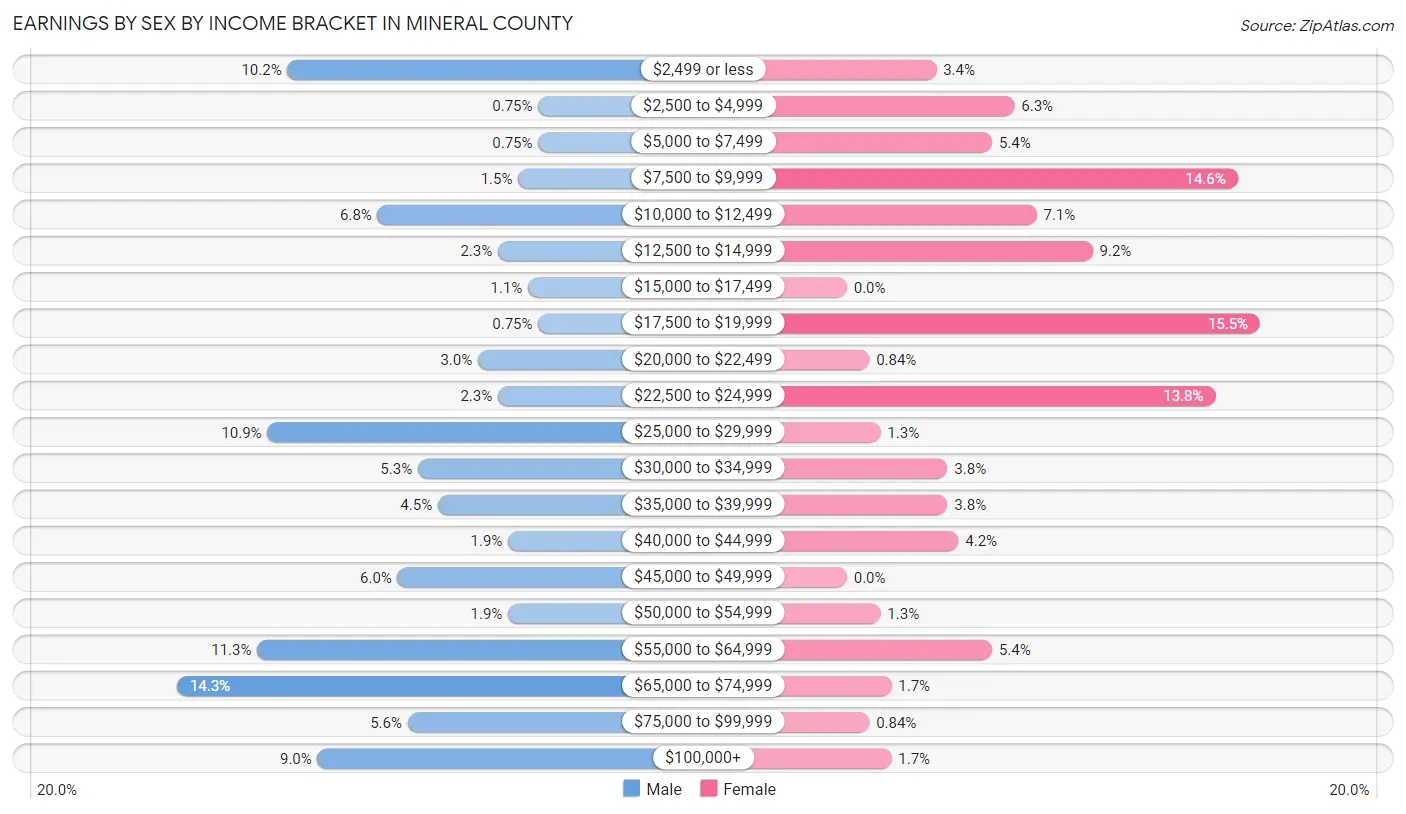
Earnings by Sex by Income Bracket in Mineral County
The most common earnings brackets in Mineral County are $65,000 to $74,999 for men (38 | 14.3%) and $17,500 to $19,999 for women (37 | 15.5%).
| Income | Male | Female |
| $2,499 or less | 27 (10.2%) | 8 (3.4%) |
| $2,500 to $4,999 | 2 (0.7%) | 15 (6.3%) |
| $5,000 to $7,499 | 2 (0.7%) | 13 (5.4%) |
| $7,500 to $9,999 | 4 (1.5%) | 35 (14.6%) |
| $10,000 to $12,499 | 18 (6.8%) | 17 (7.1%) |
| $12,500 to $14,999 | 6 (2.3%) | 22 (9.2%) |
| $15,000 to $17,499 | 3 (1.1%) | 0 (0.0%) |
| $17,500 to $19,999 | 2 (0.7%) | 37 (15.5%) |
| $20,000 to $22,499 | 8 (3.0%) | 2 (0.8%) |
| $22,500 to $24,999 | 6 (2.3%) | 33 (13.8%) |
| $25,000 to $29,999 | 29 (10.9%) | 3 (1.3%) |
| $30,000 to $34,999 | 14 (5.3%) | 9 (3.8%) |
| $35,000 to $39,999 | 12 (4.5%) | 9 (3.8%) |
| $40,000 to $44,999 | 5 (1.9%) | 10 (4.2%) |
| $45,000 to $49,999 | 16 (6.0%) | 0 (0.0%) |
| $50,000 to $54,999 | 5 (1.9%) | 3 (1.3%) |
| $55,000 to $64,999 | 30 (11.3%) | 13 (5.4%) |
| $65,000 to $74,999 | 38 (14.3%) | 4 (1.7%) |
| $75,000 to $99,999 | 15 (5.6%) | 2 (0.8%) |
| $100,000+ | 24 (9.0%) | 4 (1.7%) |
| Total | 266 (100.0%) | 239 (100.0%) |
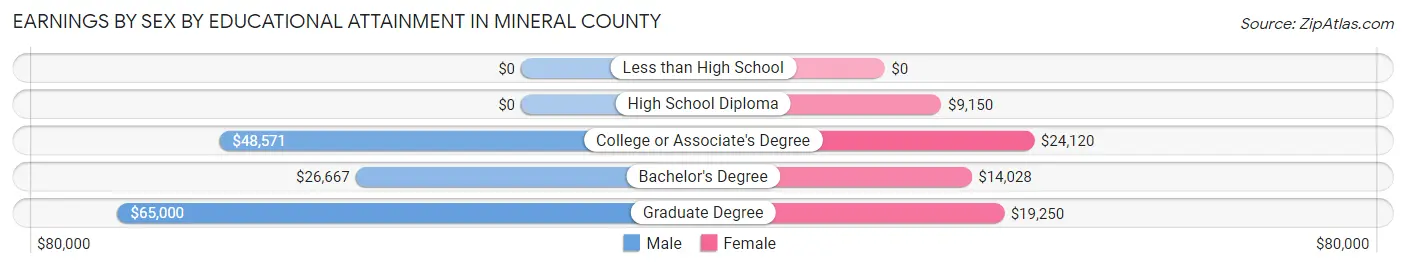
Earnings by Sex by Educational Attainment in Mineral County
Average earnings in Mineral County are $43,750 for men and $18,378 for women, a difference of 58.0%. Men with an educational attainment of graduate degree enjoy the highest average annual earnings of $65,000, while those with bachelor's degree education earn the least with $26,667. Women with an educational attainment of college or associate's degree earn the most with the average annual earnings of $24,120, while those with high school diploma education have the smallest earnings of $9,150.
| Educational Attainment | Male Income | Female Income |
| Less than High School | - | - |
| High School Diploma | - | - |
| College or Associate's Degree | $48,571 | $24,120 |
| Bachelor's Degree | $26,667 | $14,028 |
| Graduate Degree | $65,000 | $19,250 |
| Total | $43,750 | $18,378 |
Family Income in Mineral County
Family Income Brackets in Mineral County
According to the Mineral County family income data, there are 93 families falling into the $50,000 to $74,999 income range, which is the most common income bracket and makes up 36.5% of all families.
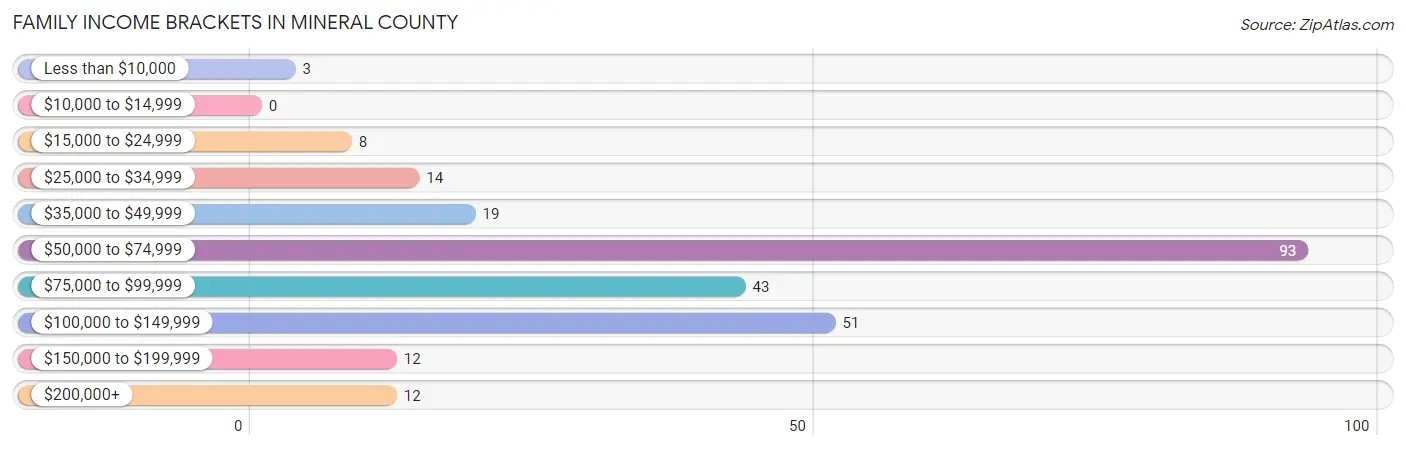
| Income Bracket | # Families | % Families |
| Less than $10,000 | 3 | 1.2% |
| $10,000 to $14,999 | 0 | 0.0% |
| $15,000 to $24,999 | 8 | 3.1% |
| $25,000 to $34,999 | 14 | 5.5% |
| $35,000 to $49,999 | 19 | 7.5% |
| $50,000 to $74,999 | 93 | 36.5% |
| $75,000 to $99,999 | 43 | 16.9% |
| $100,000 to $149,999 | 51 | 20.0% |
| $150,000 to $199,999 | 12 | 4.7% |
| $200,000+ | 12 | 4.7% |
Family Income by Famaliy Size in Mineral County
4-person families (39 | 15.3%) account for the highest median family income in Mineral County with $82,875 per family, while 2-person families (196 | 76.9%) have the highest median income of $33,282 per family member.
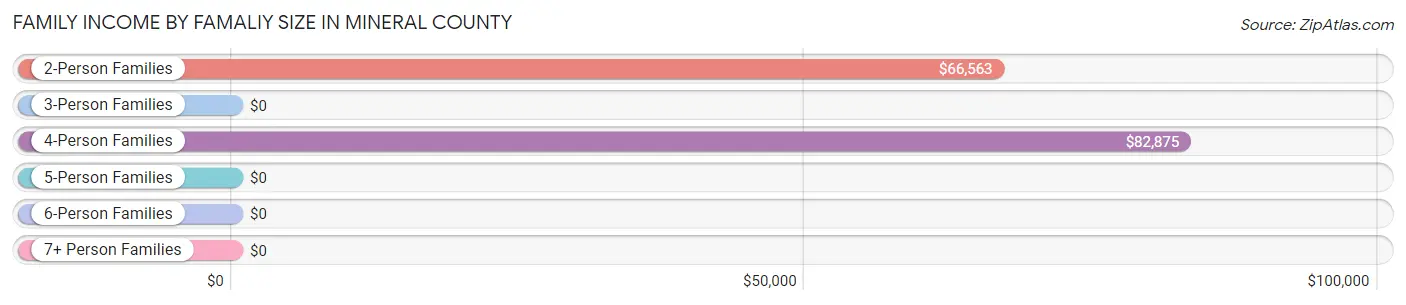
| Income Bracket | # Families | Median Income |
| 2-Person Families | 196 (76.9%) | $66,563 |
| 3-Person Families | 13 (5.1%) | $0 |
| 4-Person Families | 39 (15.3%) | $82,875 |
| 5-Person Families | 7 (2.8%) | $0 |
| 6-Person Families | 0 (0.0%) | $0 |
| 7+ Person Families | 0 (0.0%) | $0 |
| Total | 255 (100.0%) | $67,344 |
Family Income by Number of Earners in Mineral County
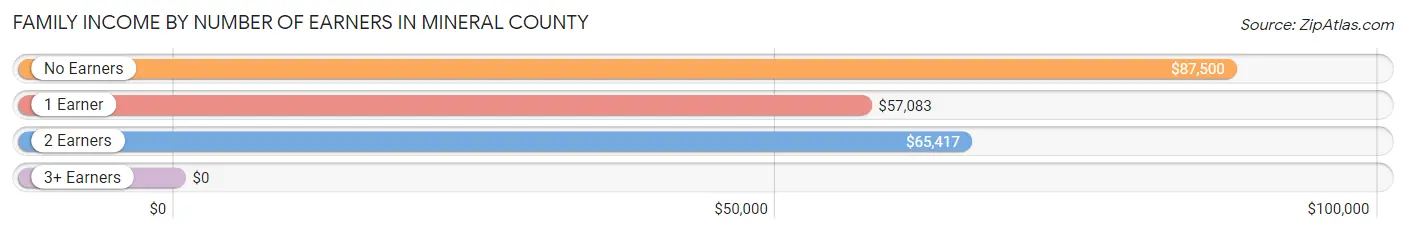
| Number of Earners | # Families | Median Income |
| No Earners | 58 (22.8%) | $87,500 |
| 1 Earner | 35 (13.7%) | $57,083 |
| 2 Earners | 155 (60.8%) | $65,417 |
| 3+ Earners | 7 (2.8%) | $0 |
| Total | 255 (100.0%) | $67,344 |
Household Income in Mineral County
Household Income Brackets in Mineral County
With 130 households falling in the category, the $50,000 to $74,999 income range is the most frequent in Mineral County, accounting for 31.1% of all households. In contrast, only 12 households (2.9%) fall into the $150,000 to $199,999 income bracket, making it the least populous group.
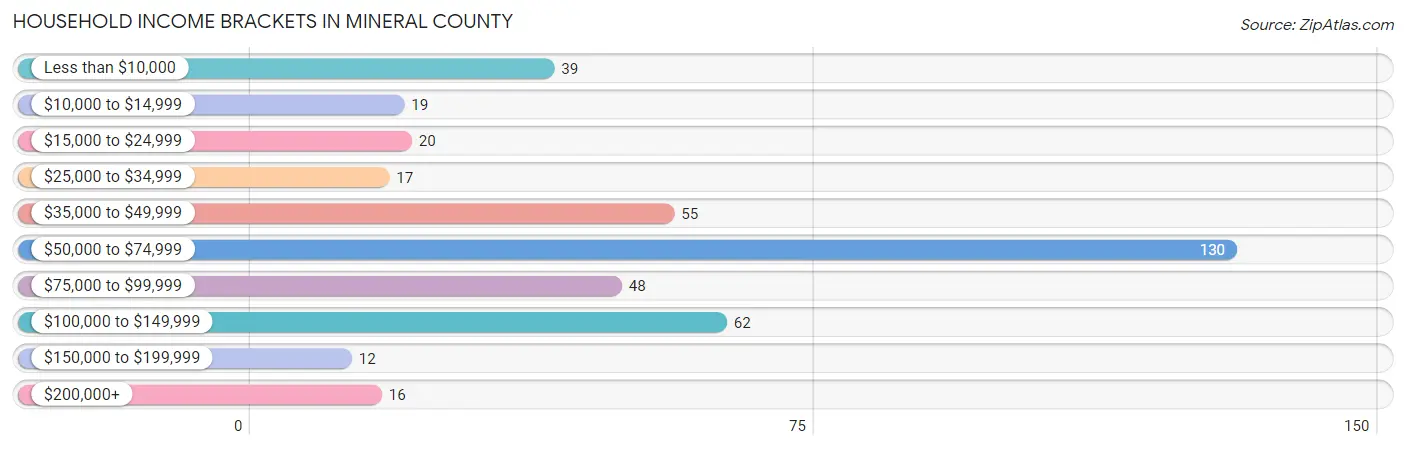
| Income Bracket | # Households | % Households |
| Less than $10,000 | 39 | 9.3% |
| $10,000 to $14,999 | 19 | 4.5% |
| $15,000 to $24,999 | 20 | 4.8% |
| $25,000 to $34,999 | 17 | 4.1% |
| $35,000 to $49,999 | 55 | 13.2% |
| $50,000 to $74,999 | 130 | 31.1% |
| $75,000 to $99,999 | 48 | 11.5% |
| $100,000 to $149,999 | 62 | 14.8% |
| $150,000 to $199,999 | 12 | 2.9% |
| $200,000+ | 16 | 3.8% |
Household Income by Householder Age in Mineral County
The median household income in Mineral County is $58,929, with the highest median household income of $61,538 found in the 45 to 64 years age bracket for the primary householder. A total of 146 households (34.9%) fall into this category.
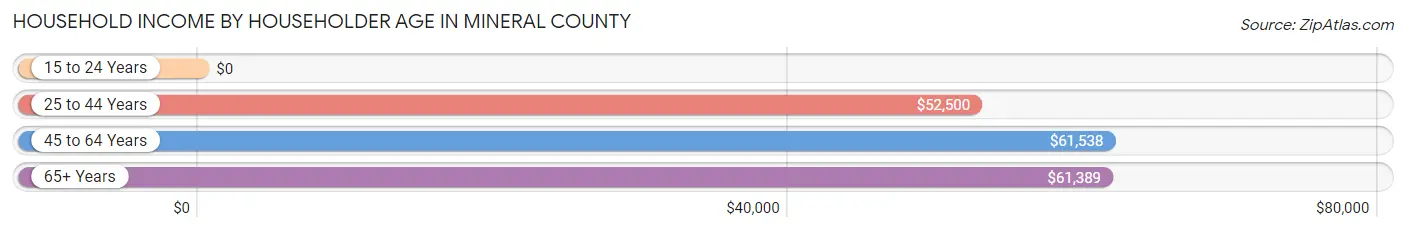
| Income Bracket | # Households | Median Income |
| 15 to 24 Years | 0 (0.0%) | $0 |
| 25 to 44 Years | 128 (30.6%) | $52,500 |
| 45 to 64 Years | 146 (34.9%) | $61,538 |
| 65+ Years | 144 (34.4%) | $61,389 |
| Total | 418 (100.0%) | $58,929 |
Poverty in Mineral County
Income Below Poverty by Sex and Age in Mineral County
With 5.8% poverty level for males and 16.5% for females among the residents of Mineral County, 5 year old males and 25 to 34 year old females are the most vulnerable to poverty, with 3 males (100.0%) and 19 females (42.2%) in their respective age groups living below the poverty level.
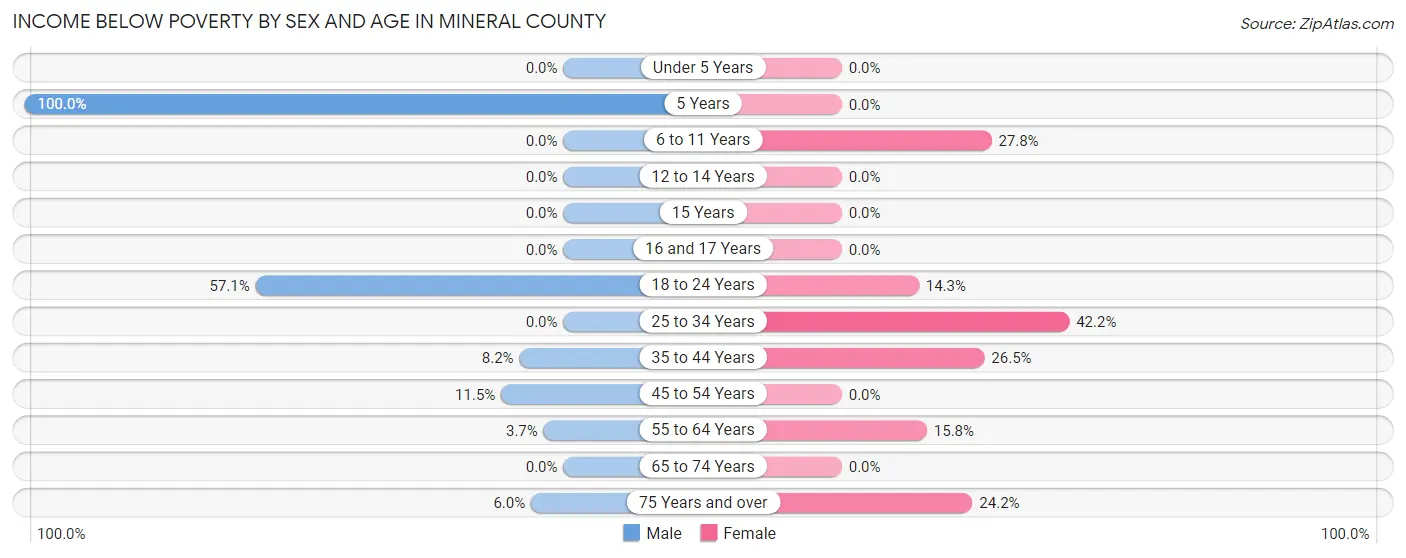
| Age Bracket | Male | Female |
| Under 5 Years | 0 (0.0%) | 0 (0.0%) |
| 5 Years | 3 (100.0%) | 0 (0.0%) |
| 6 to 11 Years | 0 (0.0%) | 5 (27.8%) |
| 12 to 14 Years | 0 (0.0%) | 0 (0.0%) |
| 15 Years | 0 (0.0%) | 0 (0.0%) |
| 16 and 17 Years | 0 (0.0%) | 0 (0.0%) |
| 18 to 24 Years | 4 (57.1%) | 1 (14.3%) |
| 25 to 34 Years | 0 (0.0%) | 19 (42.2%) |
| 35 to 44 Years | 4 (8.2%) | 18 (26.5%) |
| 45 to 54 Years | 6 (11.5%) | 0 (0.0%) |
| 55 to 64 Years | 3 (3.7%) | 15 (15.8%) |
| 65 to 74 Years | 0 (0.0%) | 0 (0.0%) |
| 75 Years and over | 3 (6.0%) | 8 (24.2%) |
| Total | 23 (5.8%) | 66 (16.5%) |
Income Above Poverty by Sex and Age in Mineral County
According to the poverty statistics in Mineral County, males aged under 5 years and females aged under 5 years are the age groups that are most secure financially, with 100.0% of males and 100.0% of females in these age groups living above the poverty line.
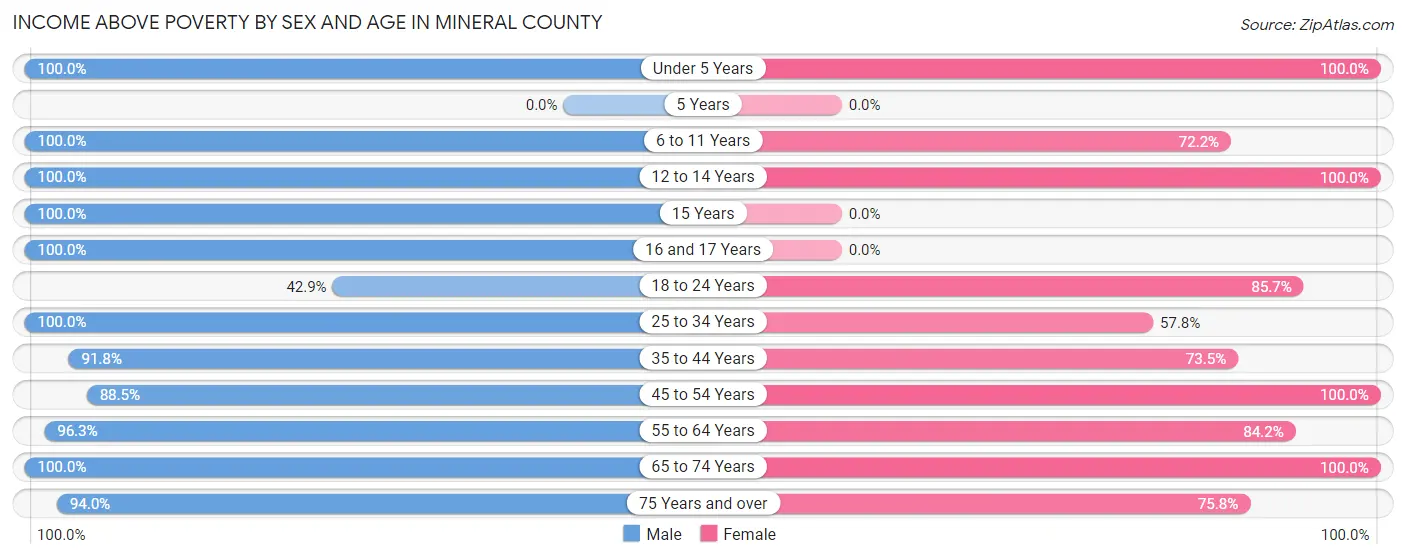
| Age Bracket | Male | Female |
| Under 5 Years | 5 (100.0%) | 26 (100.0%) |
| 5 Years | 0 (0.0%) | 0 (0.0%) |
| 6 to 11 Years | 8 (100.0%) | 13 (72.2%) |
| 12 to 14 Years | 4 (100.0%) | 20 (100.0%) |
| 15 Years | 3 (100.0%) | 0 (0.0%) |
| 16 and 17 Years | 8 (100.0%) | 0 (0.0%) |
| 18 to 24 Years | 3 (42.9%) | 6 (85.7%) |
| 25 to 34 Years | 48 (100.0%) | 26 (57.8%) |
| 35 to 44 Years | 45 (91.8%) | 50 (73.5%) |
| 45 to 54 Years | 46 (88.5%) | 31 (100.0%) |
| 55 to 64 Years | 79 (96.3%) | 80 (84.2%) |
| 65 to 74 Years | 76 (100.0%) | 56 (100.0%) |
| 75 Years and over | 47 (94.0%) | 25 (75.8%) |
| Total | 372 (94.2%) | 333 (83.5%) |
Income Below Poverty Among Married-Couple Families in Mineral County
The poverty statistics for married-couple families in Mineral County show that 2.5% or 6 of the total 245 families live below the poverty line. Families with 1 or 2 children have the highest poverty rate of 6.1%, comprising of 3 families. On the other hand, families with no children have the lowest poverty rate of 1.5%, which includes 3 families.
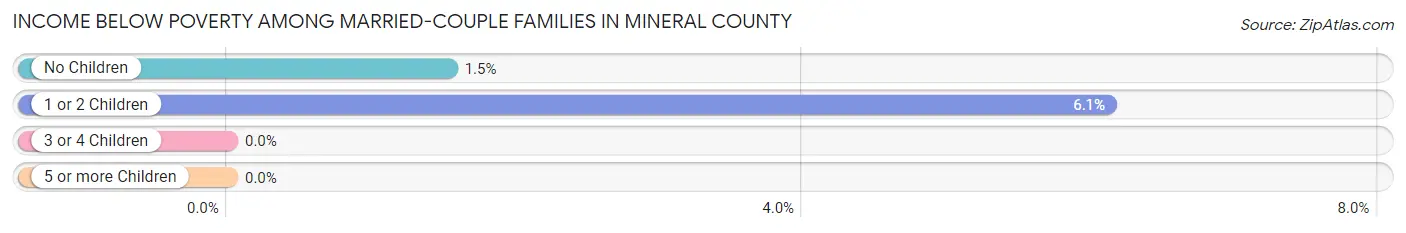
| Children | Above Poverty | Below Poverty |
| No Children | 193 (98.5%) | 3 (1.5%) |
| 1 or 2 Children | 46 (93.9%) | 3 (6.1%) |
| 3 or 4 Children | 0 (0.0%) | 0 (0.0%) |
| 5 or more Children | 0 (0.0%) | 0 (0.0%) |
| Total | 239 (97.6%) | 6 (2.5%) |
Income Below Poverty Among Single-Parent Households in Mineral County
| Children | Single Father | Single Mother |
| No Children | 0 (0.0%) | 0 (0.0%) |
| 1 or 2 Children | 0 (0.0%) | 0 (0.0%) |
| 3 or 4 Children | 0 (0.0%) | 0 (0.0%) |
| 5 or more Children | 0 (0.0%) | 0 (0.0%) |
| Total | 0 (0.0%) | 0 (0.0%) |
Income Below Poverty Among Married-Couple vs Single-Parent Households in Mineral County
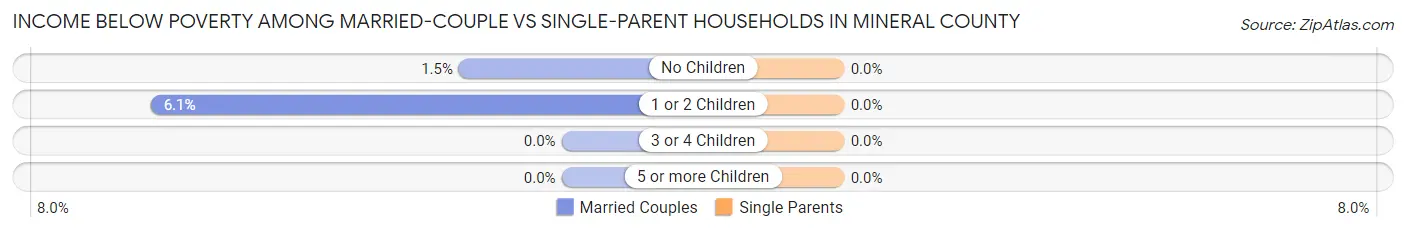
| Children | Married-Couple Families | Single-Parent Households |
| No Children | 3 (1.5%) | 0 (0.0%) |
| 1 or 2 Children | 3 (6.1%) | 0 (0.0%) |
| 3 or 4 Children | 0 (0.0%) | 0 (0.0%) |
| 5 or more Children | 0 (0.0%) | 0 (0.0%) |
| Total | 6 (2.5%) | 0 (0.0%) |
Race in Mineral County
The most populous races in Mineral County are White / Caucasian (747 | 94.1%), Two or more Races (34 | 4.3%), and Hispanic or Latino (21 | 2.6%).
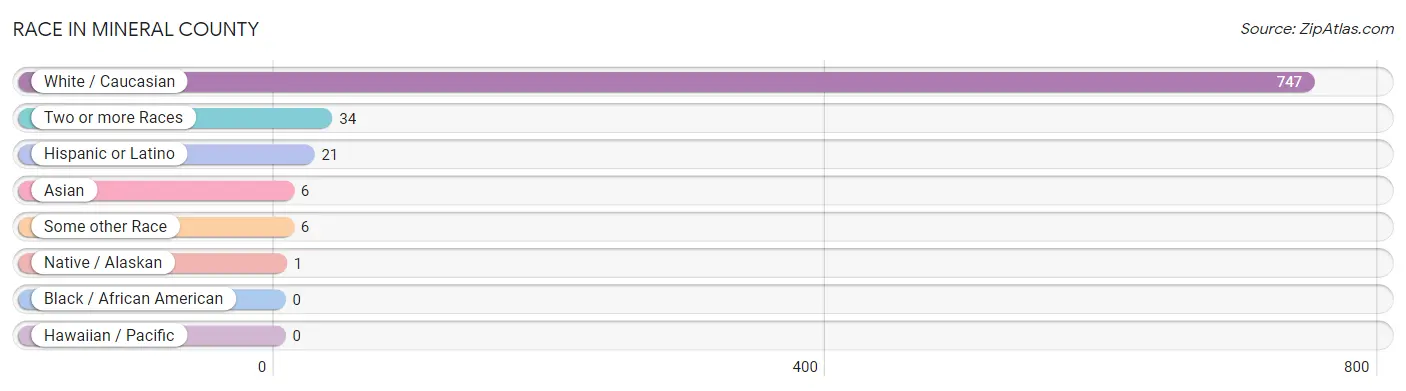
| Race | # Population | % Population |
| Asian | 6 | 0.8% |
| Black / African American | 0 | 0.0% |
| Hawaiian / Pacific | 0 | 0.0% |
| Hispanic or Latino | 21 | 2.6% |
| Native / Alaskan | 1 | 0.1% |
| White / Caucasian | 747 | 94.1% |
| Two or more Races | 34 | 4.3% |
| Some other Race | 6 | 0.8% |
| Total | 794 | 100.0% |
Ancestry in Mineral County
The most populous ancestries reported in Mineral County are German (230 | 29.0%), Irish (147 | 18.5%), English (92 | 11.6%), Italian (49 | 6.2%), and Polish (43 | 5.4%), together accounting for 70.7% of all Mineral County residents.
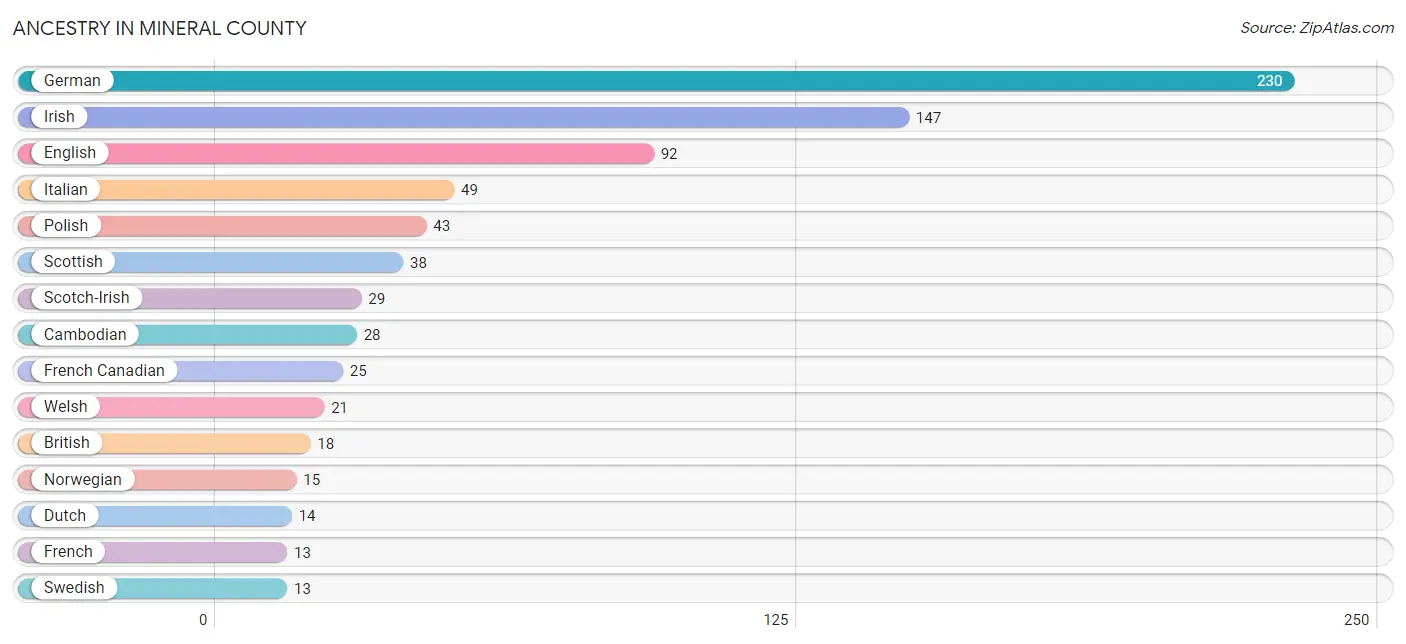
| Ancestry | # Population | % Population |
| American | 12 | 1.5% |
| Austrian | 3 | 0.4% |
| Basque | 7 | 0.9% |
| British | 18 | 2.3% |
| Cambodian | 28 | 3.5% |
| Cherokee | 5 | 0.6% |
| Chickasaw | 4 | 0.5% |
| Czech | 2 | 0.3% |
| Dutch | 14 | 1.8% |
| Eastern European | 8 | 1.0% |
| English | 92 | 11.6% |
| European | 10 | 1.3% |
| French | 13 | 1.6% |
| French Canadian | 25 | 3.2% |
| German | 230 | 29.0% |
| Hungarian | 4 | 0.5% |
| Irish | 147 | 18.5% |
| Italian | 49 | 6.2% |
| Mexican | 8 | 1.0% |
| Northern European | 3 | 0.4% |
| Norwegian | 15 | 1.9% |
| Polish | 43 | 5.4% |
| Portuguese | 8 | 1.0% |
| Russian | 5 | 0.6% |
| Scotch-Irish | 29 | 3.6% |
| Scottish | 38 | 4.8% |
| Spaniard | 5 | 0.6% |
| Swedish | 13 | 1.6% |
| Welsh | 21 | 2.6% |
| Yugoslavian | 5 | 0.6% | View All 30 Rows |
Immigrants in Mineral County
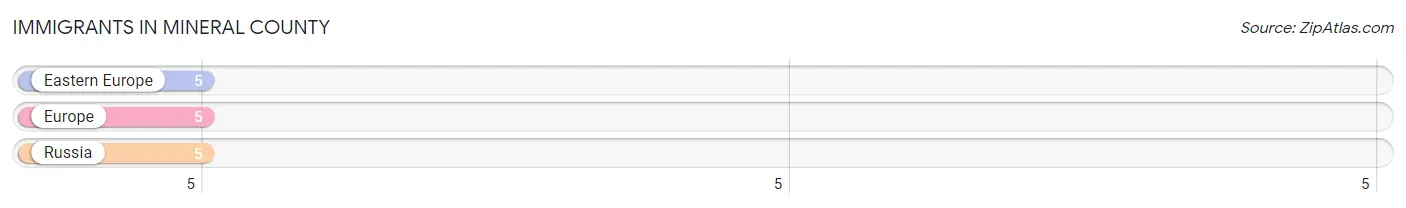
The most numerous immigrant groups reported in Mineral County came from Eastern Europe (5 | 0.6%), Europe (5 | 0.6%), and Russia (5 | 0.6%), together accounting for 1.9% of all Mineral County residents.
| Immigration Origin | # Population | % Population |
| Eastern Europe | 5 | 0.6% |
| Europe | 5 | 0.6% |
| Russia | 5 | 0.6% | View All 3 Rows |
Sex and Age in Mineral County
Sex and Age in Mineral County
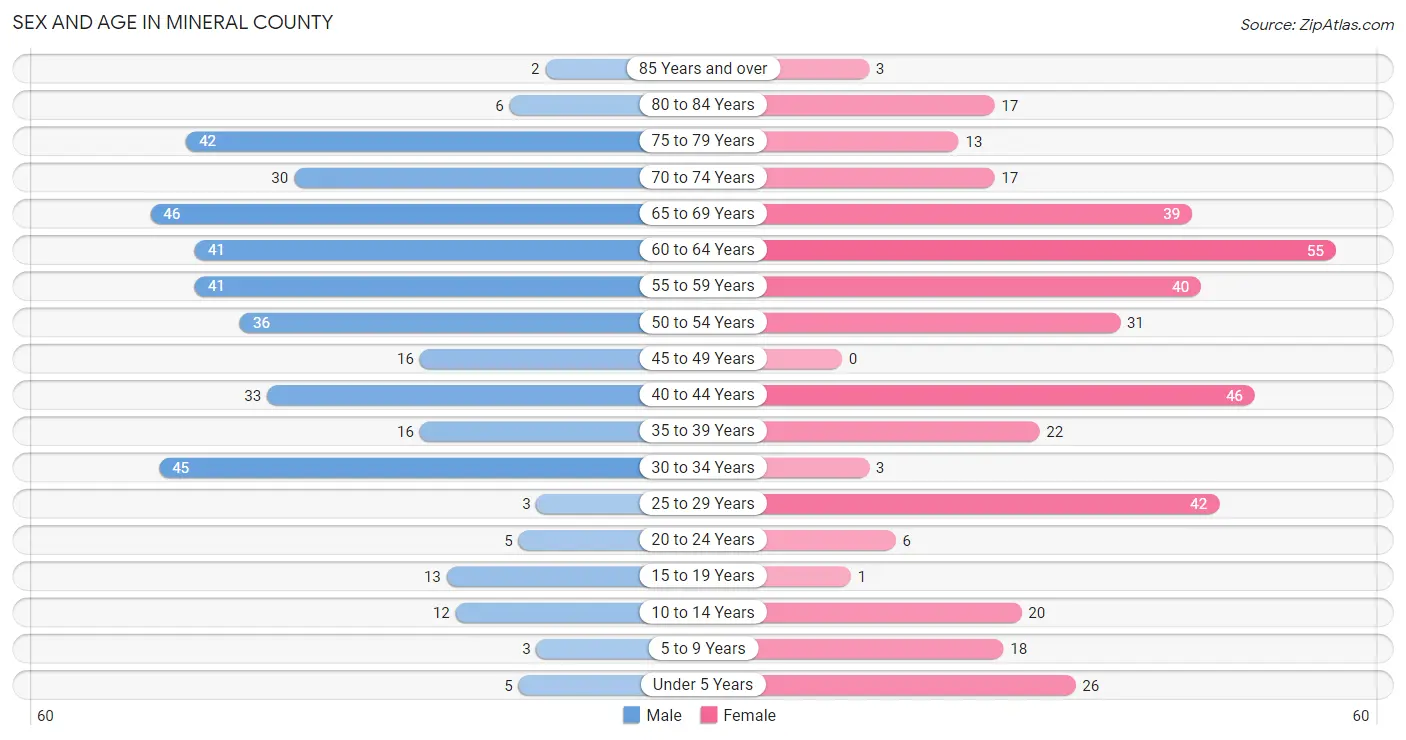
The most populous age groups in Mineral County are 65 to 69 Years (46 | 11.7%) for men and 60 to 64 Years (55 | 13.8%) for women.
| Age Bracket | Male | Female |
| Under 5 Years | 5 (1.3%) | 26 (6.5%) |
| 5 to 9 Years | 3 (0.8%) | 18 (4.5%) |
| 10 to 14 Years | 12 (3.0%) | 20 (5.0%) |
| 15 to 19 Years | 13 (3.3%) | 1 (0.3%) |
| 20 to 24 Years | 5 (1.3%) | 6 (1.5%) |
| 25 to 29 Years | 3 (0.8%) | 42 (10.5%) |
| 30 to 34 Years | 45 (11.4%) | 3 (0.7%) |
| 35 to 39 Years | 16 (4.1%) | 22 (5.5%) |
| 40 to 44 Years | 33 (8.4%) | 46 (11.5%) |
| 45 to 49 Years | 16 (4.1%) | 0 (0.0%) |
| 50 to 54 Years | 36 (9.1%) | 31 (7.8%) |
| 55 to 59 Years | 41 (10.4%) | 40 (10.0%) |
| 60 to 64 Years | 41 (10.4%) | 55 (13.8%) |
| 65 to 69 Years | 46 (11.7%) | 39 (9.8%) |
| 70 to 74 Years | 30 (7.6%) | 17 (4.3%) |
| 75 to 79 Years | 42 (10.6%) | 13 (3.3%) |
| 80 to 84 Years | 6 (1.5%) | 17 (4.3%) |
| 85 Years and over | 2 (0.5%) | 3 (0.7%) |
| Total | 395 (100.0%) | 399 (100.0%) |
Families and Households in Mineral County
Median Family Size in Mineral County
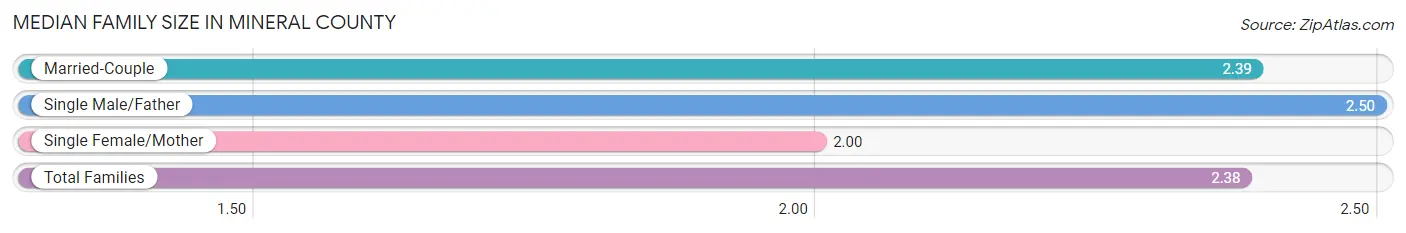
The median family size in Mineral County is 2.38 persons per family, with single male/father families (4 | 1.6%) accounting for the largest median family size of 2.5 persons per family. On the other hand, single female/mother families (6 | 2.4%) represent the smallest median family size with 2.00 persons per family.
| Family Type | # Families | Family Size |
| Married-Couple | 245 (96.1%) | 2.39 |
| Single Male/Father | 4 (1.6%) | 2.50 |
| Single Female/Mother | 6 (2.4%) | 2.00 |
| Total Families | 255 (100.0%) | 2.38 |
Median Household Size in Mineral County
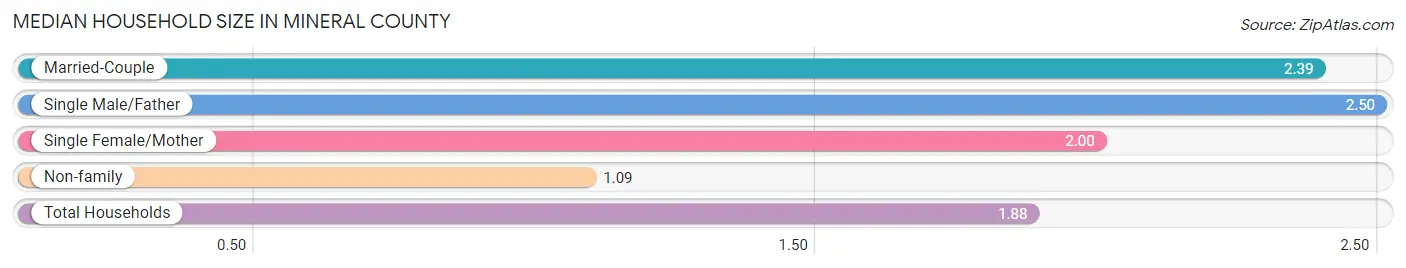
The median household size in Mineral County is 1.88 persons per household, with single male/father households (4 | 1.0%) accounting for the largest median household size of 2.5 persons per household. non-family households (163 | 39.0%) represent the smallest median household size with 1.09 persons per household.
| Household Type | # Households | Household Size |
| Married-Couple | 245 (58.6%) | 2.39 |
| Single Male/Father | 4 (1.0%) | 2.50 |
| Single Female/Mother | 6 (1.4%) | 2.00 |
| Non-family | 163 (39.0%) | 1.09 |
| Total Households | 418 (100.0%) | 1.88 |
Household Size by Marriage Status in Mineral County
Out of a total of 418 households in Mineral County, 255 (61.0%) are family households, while 163 (39.0%) are nonfamily households. The most numerous type of family households are 2-person households, comprising 196, and the most common type of nonfamily households are 1-person households, comprising 145.
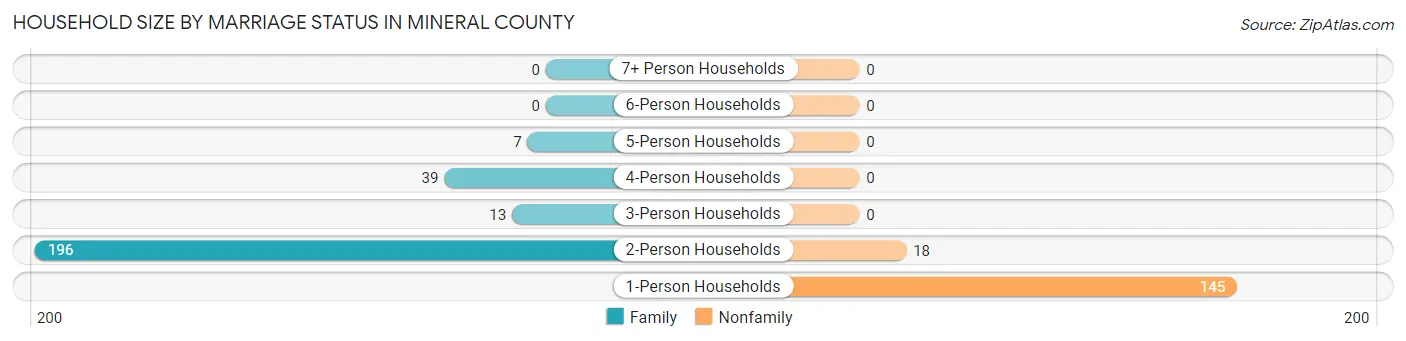
| Household Size | Family Households | Nonfamily Households |
| 1-Person Households | - | 145 (34.7%) |
| 2-Person Households | 196 (46.9%) | 18 (4.3%) |
| 3-Person Households | 13 (3.1%) | 0 (0.0%) |
| 4-Person Households | 39 (9.3%) | 0 (0.0%) |
| 5-Person Households | 7 (1.7%) | 0 (0.0%) |
| 6-Person Households | 0 (0.0%) | 0 (0.0%) |
| 7+ Person Households | 0 (0.0%) | 0 (0.0%) |
| Total | 255 (61.0%) | 163 (39.0%) |
Female Fertility in Mineral County
Fertility by Age in Mineral County
Average fertility rate in Mineral County is 78.0 births per 1,000 women. Women in the age bracket of 35 to 50 years have the highest fertility rate with 132.0 births per 1,000 women. Women in the age bracket of 35 to 50 years acount for 100.0% of all women with births.
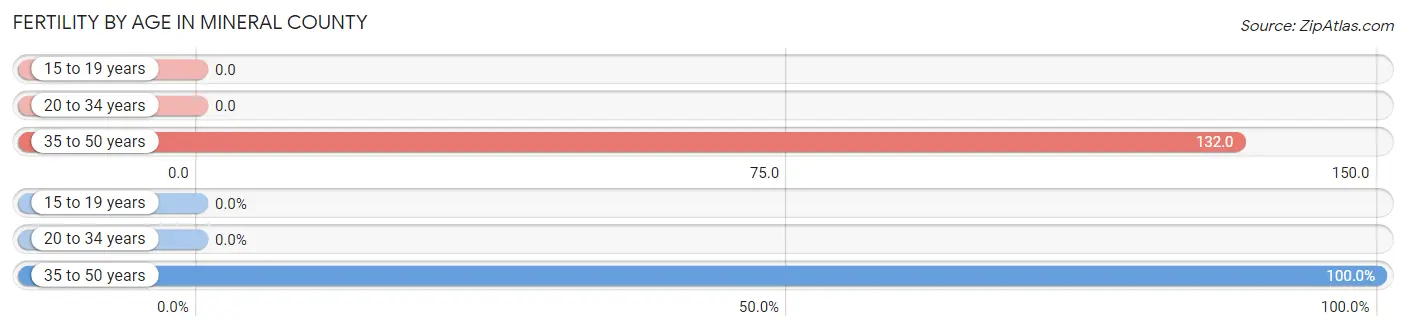
| Age Bracket | Women with Births | Births / 1,000 Women |
| 15 to 19 years | 0 (0.0%) | 0.0 |
| 20 to 34 years | 0 (0.0%) | 0.0 |
| 35 to 50 years | 10 (100.0%) | 132.0 |
| Total | 10 (100.0%) | 78.0 |
Fertility by Age by Marriage Status in Mineral County
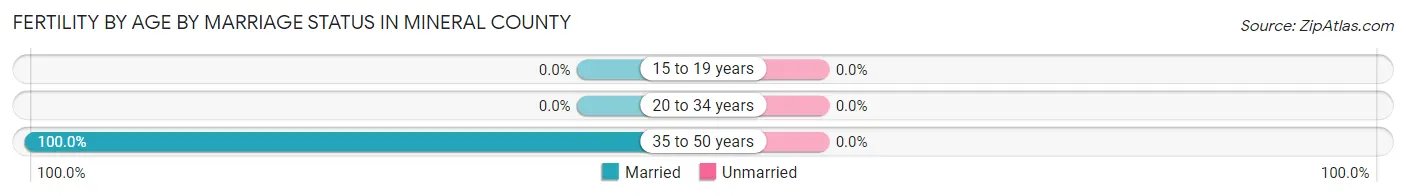
| Age Bracket | Married | Unmarried |
| 15 to 19 years | 0 (0.0%) | 0 (0.0%) |
| 20 to 34 years | 0 (0.0%) | 0 (0.0%) |
| 35 to 50 years | 10 (100.0%) | 0 (0.0%) |
| Total | 10 (100.0%) | 0 (0.0%) |
Fertility by Education in Mineral County
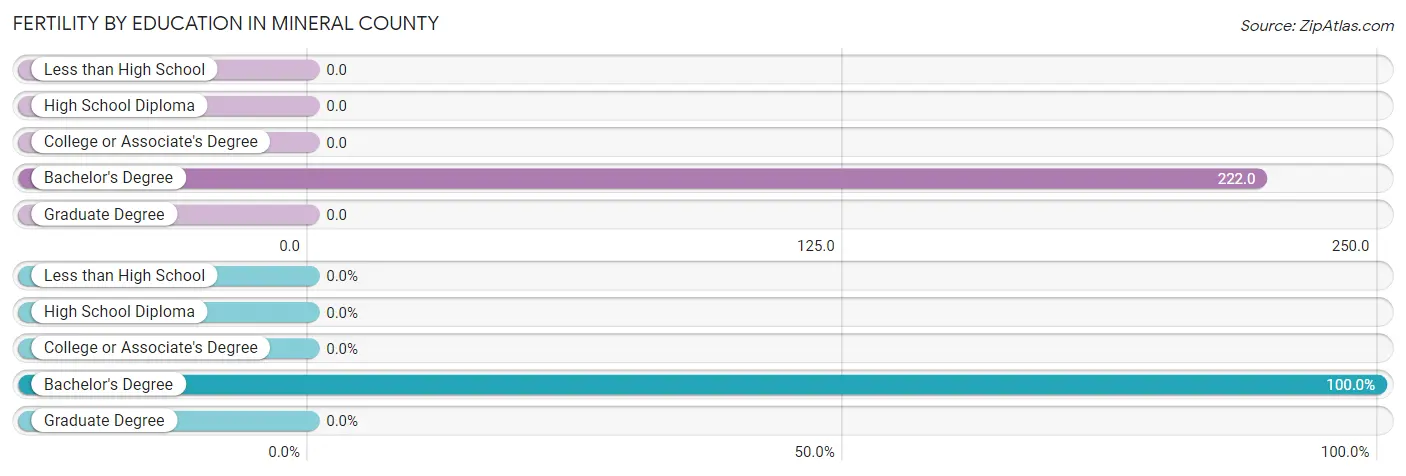
| Educational Attainment | Women with Births | Births / 1,000 Women |
| Less than High School | 0 (0.0%) | 0.0 |
| High School Diploma | 0 (0.0%) | 0.0 |
| College or Associate's Degree | 0 (0.0%) | 0.0 |
| Bachelor's Degree | 10 (100.0%) | 222.0 |
| Graduate Degree | 0 (0.0%) | 0.0 |
| Total | 10 (100.0%) | 78.0 |
Fertility by Education by Marriage Status in Mineral County

| Educational Attainment | Married | Unmarried |
| Less than High School | 0 (0.0%) | 0 (0.0%) |
| High School Diploma | 0 (0.0%) | 0 (0.0%) |
| College or Associate's Degree | 0 (0.0%) | 0 (0.0%) |
| Bachelor's Degree | 10 (100.0%) | 0 (0.0%) |
| Graduate Degree | 0 (0.0%) | 0 (0.0%) |
| Total | 10 (100.0%) | 0 (0.0%) |
Employment Characteristics in Mineral County
Employment by Class of Employer in Mineral County
Among the 413 employed individuals in Mineral County, private company employees (138 | 33.4%), local government employees (61 | 14.8%), and not-for-profit organizations (54 | 13.1%) make up the most common classes of employment.
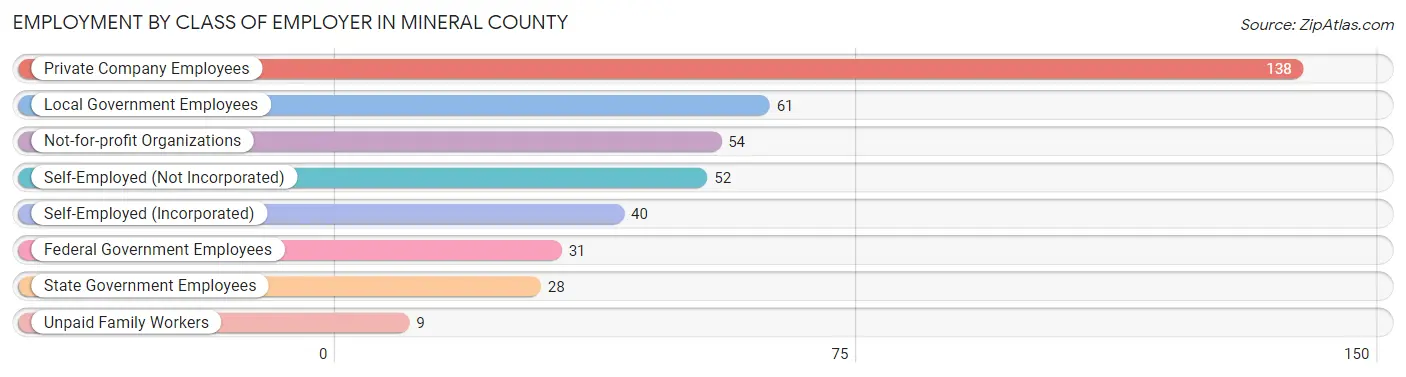
| Employer Class | # Employees | % Employees |
| Private Company Employees | 138 | 33.4% |
| Self-Employed (Incorporated) | 40 | 9.7% |
| Self-Employed (Not Incorporated) | 52 | 12.6% |
| Not-for-profit Organizations | 54 | 13.1% |
| Local Government Employees | 61 | 14.8% |
| State Government Employees | 28 | 6.8% |
| Federal Government Employees | 31 | 7.5% |
| Unpaid Family Workers | 9 | 2.2% |
| Total | 413 | 100.0% |
Employment Status by Age in Mineral County
According to the labor force statistics for Mineral County, out of the total population over 16 years of age (707), 61.7% or 436 individuals are in the labor force, with 4.8% or 21 of them unemployed. The age group with the highest labor force participation rate is 16 to 19 years, with 100.0% or 11 individuals in the labor force. Within the labor force, the 16 to 19 years age range has the highest percentage of unemployed individuals, with 72.7% or 8 of them being unemployed.
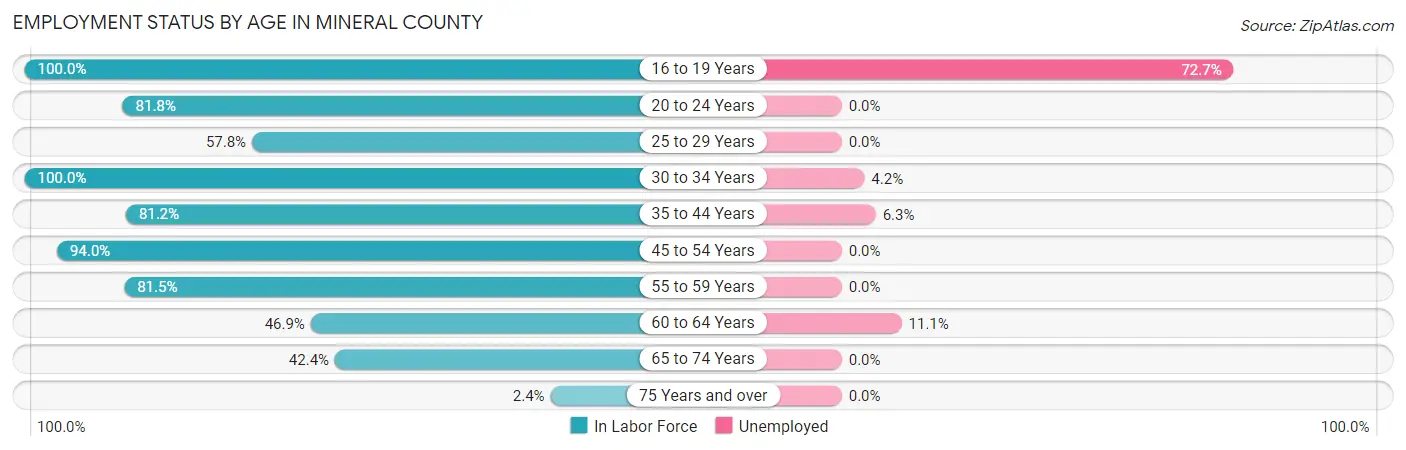
| Age Bracket | In Labor Force | Unemployed |
| 16 to 19 Years | 11 (100.0%) | 8 (72.7%) |
| 20 to 24 Years | 9 (81.8%) | 0 (0.0%) |
| 25 to 29 Years | 26 (57.8%) | 0 (0.0%) |
| 30 to 34 Years | 48 (100.0%) | 2 (4.2%) |
| 35 to 44 Years | 95 (81.2%) | 6 (6.3%) |
| 45 to 54 Years | 78 (94.0%) | 0 (0.0%) |
| 55 to 59 Years | 66 (81.5%) | 0 (0.0%) |
| 60 to 64 Years | 45 (46.9%) | 5 (11.1%) |
| 65 to 74 Years | 56 (42.4%) | 0 (0.0%) |
| 75 Years and over | 2 (2.4%) | 0 (0.0%) |
| Total | 436 (61.7%) | 21 (4.8%) |
Employment Status by Educational Attainment in Mineral County
According to labor force statistics for Mineral County, 76.2% of individuals (358) out of the total population between 25 and 64 years of age (470) are in the labor force, with 3.7% or 13 of them being unemployed. The group with the highest labor force participation rate are those with the educational attainment of bachelor's degree or higher, with 83.5% or 222 individuals in the labor force. Within the labor force, individuals with high school diploma education have the highest percentage of unemployment, with 11.8% or 6 of them being unemployed.
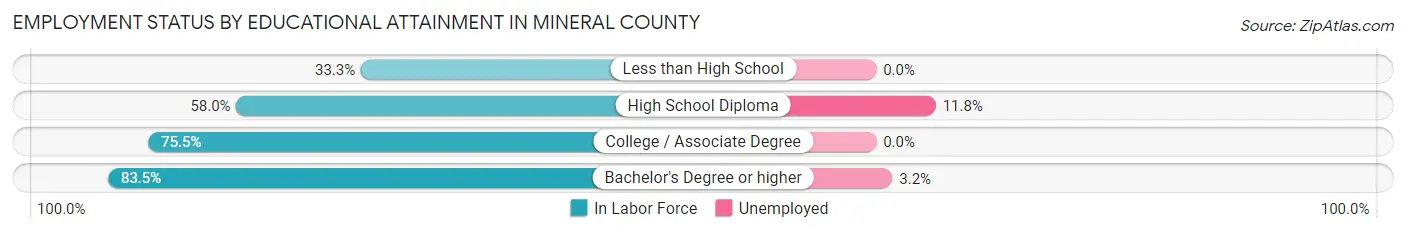
| Educational Attainment | In Labor Force | Unemployed |
| Less than High School | 2 (33.3%) | 0 (0.0%) |
| High School Diploma | 51 (58.0%) | 10 (11.8%) |
| College / Associate Degree | 83 (75.5%) | 0 (0.0%) |
| Bachelor's Degree or higher | 222 (83.5%) | 9 (3.2%) |
| Total | 358 (76.2%) | 17 (3.7%) |
Employment Occupations by Sex in Mineral County
Management, Business, Science and Arts Occupations
The most common Management, Business, Science and Arts occupations in Mineral County are Management (84 | 20.4%), Community & Social Service (68 | 16.5%), Education Instruction & Library (53 | 12.9%), Health Diagnosing & Treating (22 | 5.3%), and Computers, Engineering & Science (20 | 4.9%).
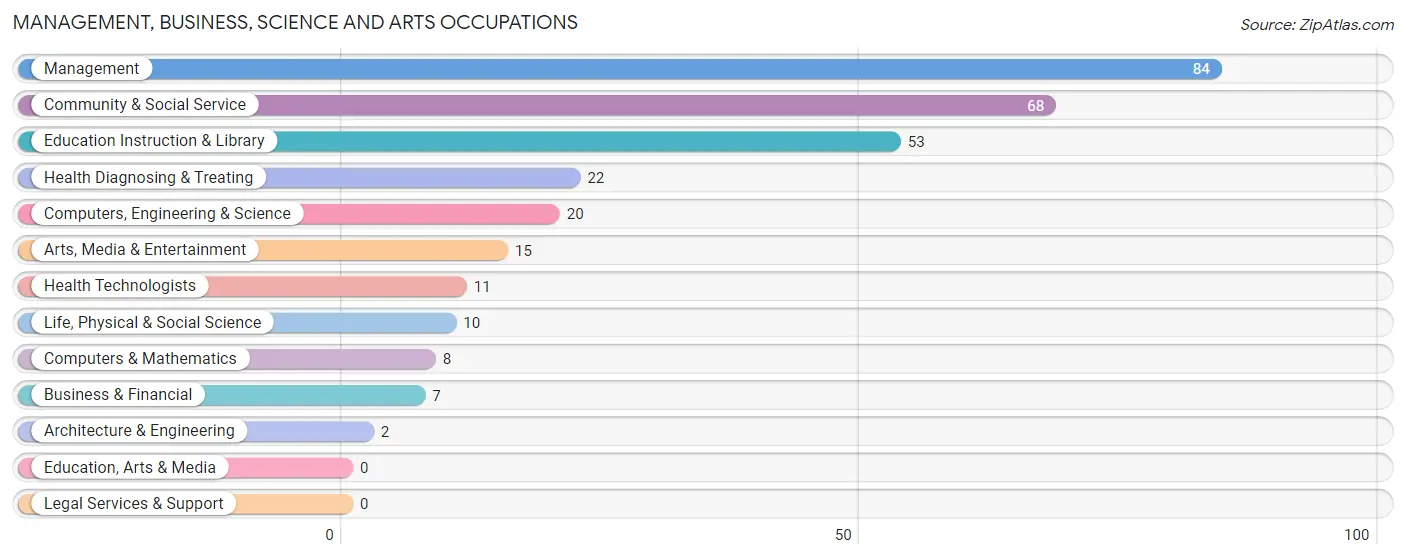
Management, Business, Science and Arts Occupations by Sex
Within the Management, Business, Science and Arts occupations in Mineral County, the most male-oriented occupations are Architecture & Engineering (100.0%), Management (69.1%), and Health Technologists (63.6%), while the most female-oriented occupations are Life, Physical & Social Science (100.0%), Education Instruction & Library (79.2%), and Community & Social Service (73.5%).
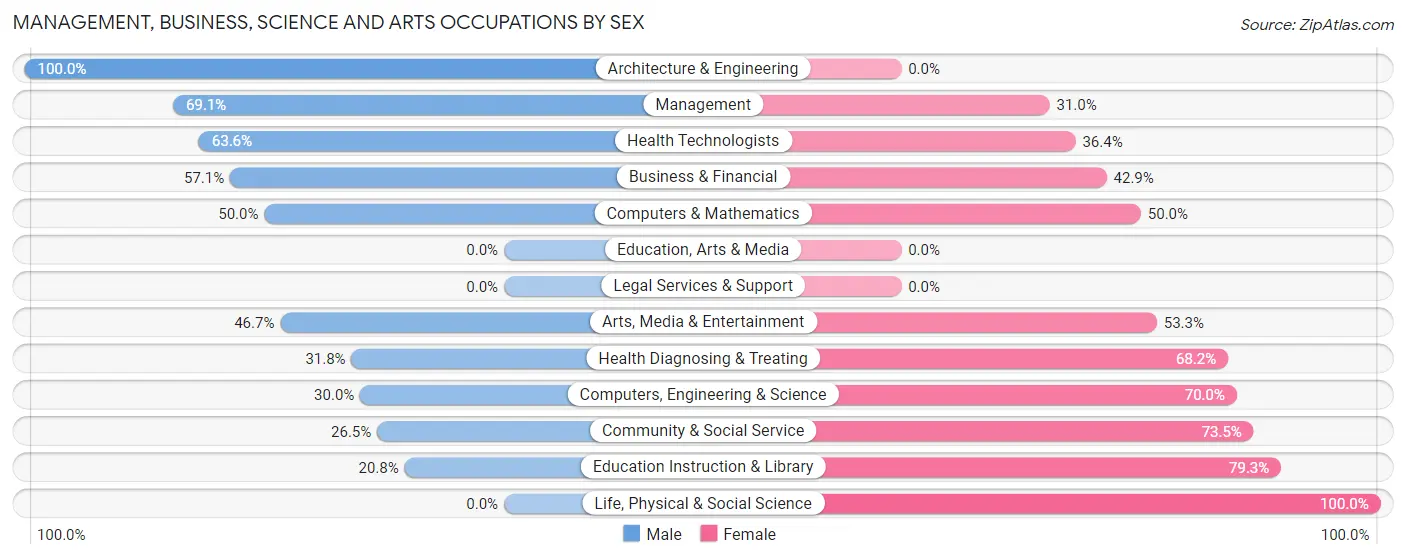
| Occupation | Male | Female |
| Management | 58 (69.1%) | 26 (30.9%) |
| Business & Financial | 4 (57.1%) | 3 (42.9%) |
| Computers, Engineering & Science | 6 (30.0%) | 14 (70.0%) |
| Computers & Mathematics | 4 (50.0%) | 4 (50.0%) |
| Architecture & Engineering | 2 (100.0%) | 0 (0.0%) |
| Life, Physical & Social Science | 0 (0.0%) | 10 (100.0%) |
| Community & Social Service | 18 (26.5%) | 50 (73.5%) |
| Education, Arts & Media | 0 (0.0%) | 0 (0.0%) |
| Legal Services & Support | 0 (0.0%) | 0 (0.0%) |
| Education Instruction & Library | 11 (20.7%) | 42 (79.2%) |
| Arts, Media & Entertainment | 7 (46.7%) | 8 (53.3%) |
| Health Diagnosing & Treating | 7 (31.8%) | 15 (68.2%) |
| Health Technologists | 7 (63.6%) | 4 (36.4%) |
| Total (Category) | 93 (46.3%) | 108 (53.7%) |
| Total (Overall) | 214 (51.9%) | 198 (48.1%) |
Services Occupations
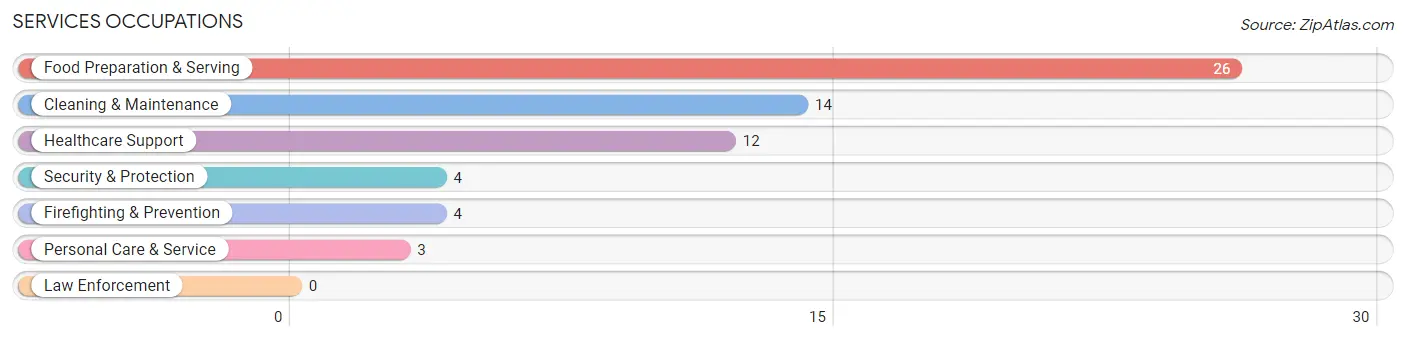
The most common Services occupations in Mineral County are Food Preparation & Serving (26 | 6.3%), Cleaning & Maintenance (14 | 3.4%), Healthcare Support (12 | 2.9%), Security & Protection (4 | 1.0%), and Firefighting & Prevention (4 | 1.0%).
Services Occupations by Sex
Within the Services occupations in Mineral County, the most male-oriented occupations are Security & Protection (100.0%), Firefighting & Prevention (100.0%), and Food Preparation & Serving (73.1%), while the most female-oriented occupations are Healthcare Support (100.0%), Personal Care & Service (100.0%), and Cleaning & Maintenance (42.9%).
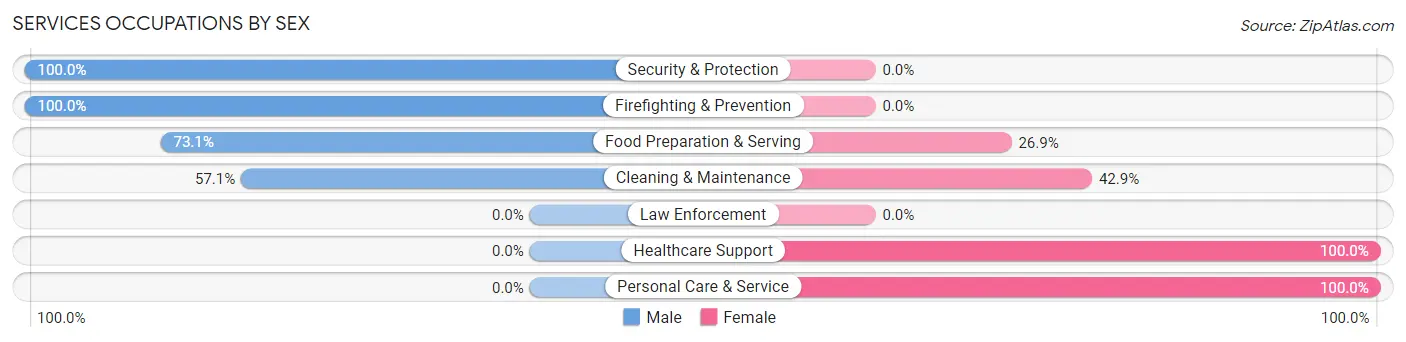
| Occupation | Male | Female |
| Healthcare Support | 0 (0.0%) | 12 (100.0%) |
| Security & Protection | 4 (100.0%) | 0 (0.0%) |
| Firefighting & Prevention | 4 (100.0%) | 0 (0.0%) |
| Law Enforcement | 0 (0.0%) | 0 (0.0%) |
| Food Preparation & Serving | 19 (73.1%) | 7 (26.9%) |
| Cleaning & Maintenance | 8 (57.1%) | 6 (42.9%) |
| Personal Care & Service | 0 (0.0%) | 3 (100.0%) |
| Total (Category) | 31 (52.5%) | 28 (47.5%) |
| Total (Overall) | 214 (51.9%) | 198 (48.1%) |
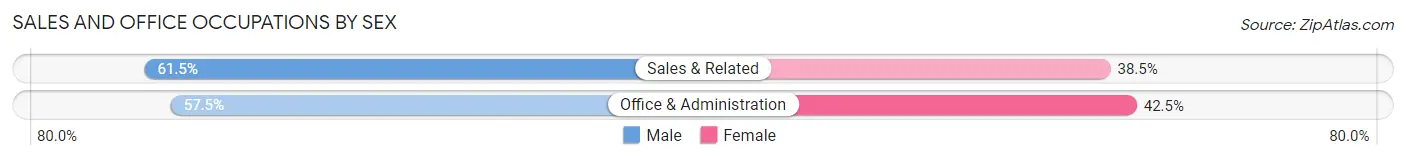
Sales and Office Occupations
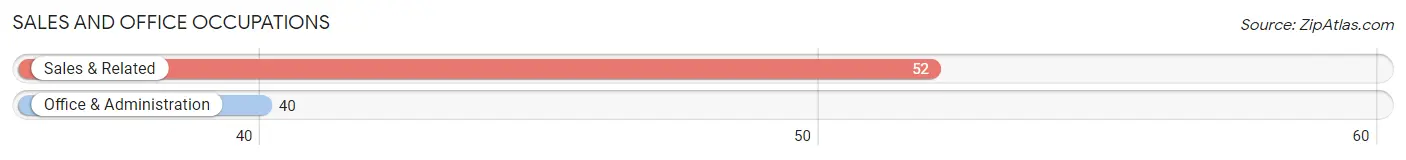
The most common Sales and Office occupations in Mineral County are Sales & Related (52 | 12.6%), and Office & Administration (40 | 9.7%).
Sales and Office Occupations by Sex
| Occupation | Male | Female |
| Sales & Related | 32 (61.5%) | 20 (38.5%) |
| Office & Administration | 23 (57.5%) | 17 (42.5%) |
| Total (Category) | 55 (59.8%) | 37 (40.2%) |
| Total (Overall) | 214 (51.9%) | 198 (48.1%) |
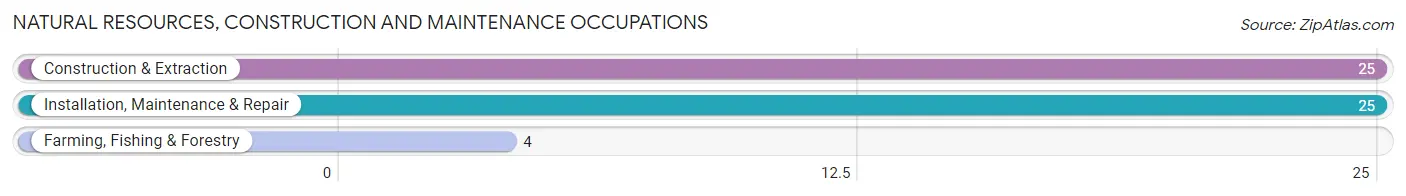
Natural Resources, Construction and Maintenance Occupations
The most common Natural Resources, Construction and Maintenance occupations in Mineral County are Construction & Extraction (25 | 6.1%), Installation, Maintenance & Repair (25 | 6.1%), and Farming, Fishing & Forestry (4 | 1.0%).
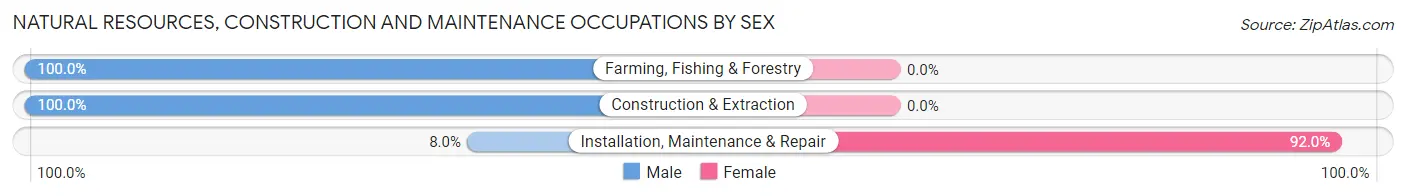
Natural Resources, Construction and Maintenance Occupations by Sex
| Occupation | Male | Female |
| Farming, Fishing & Forestry | 4 (100.0%) | 0 (0.0%) |
| Construction & Extraction | 25 (100.0%) | 0 (0.0%) |
| Installation, Maintenance & Repair | 2 (8.0%) | 23 (92.0%) |
| Total (Category) | 31 (57.4%) | 23 (42.6%) |
| Total (Overall) | 214 (51.9%) | 198 (48.1%) |
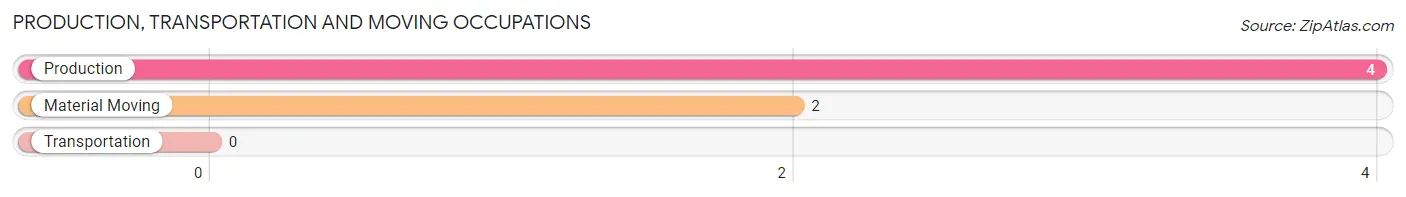
Production, Transportation and Moving Occupations
The most common Production, Transportation and Moving occupations in Mineral County are Production (4 | 1.0%), and Material Moving (2 | 0.5%).
Production, Transportation and Moving Occupations by Sex
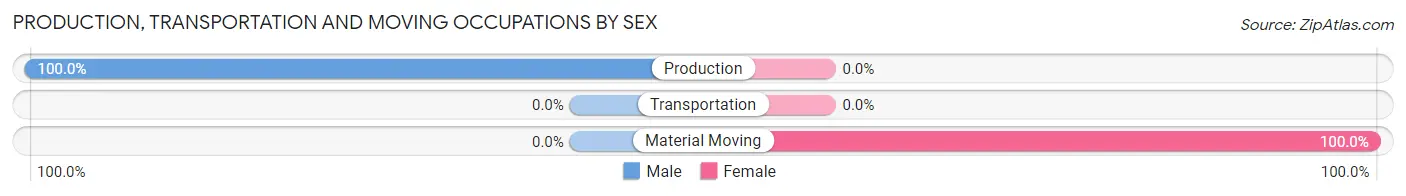
| Occupation | Male | Female |
| Production | 4 (100.0%) | 0 (0.0%) |
| Transportation | 0 (0.0%) | 0 (0.0%) |
| Material Moving | 0 (0.0%) | 2 (100.0%) |
| Total (Category) | 4 (66.7%) | 2 (33.3%) |
| Total (Overall) | 214 (51.9%) | 198 (48.1%) |
Employment Industries by Sex in Mineral County
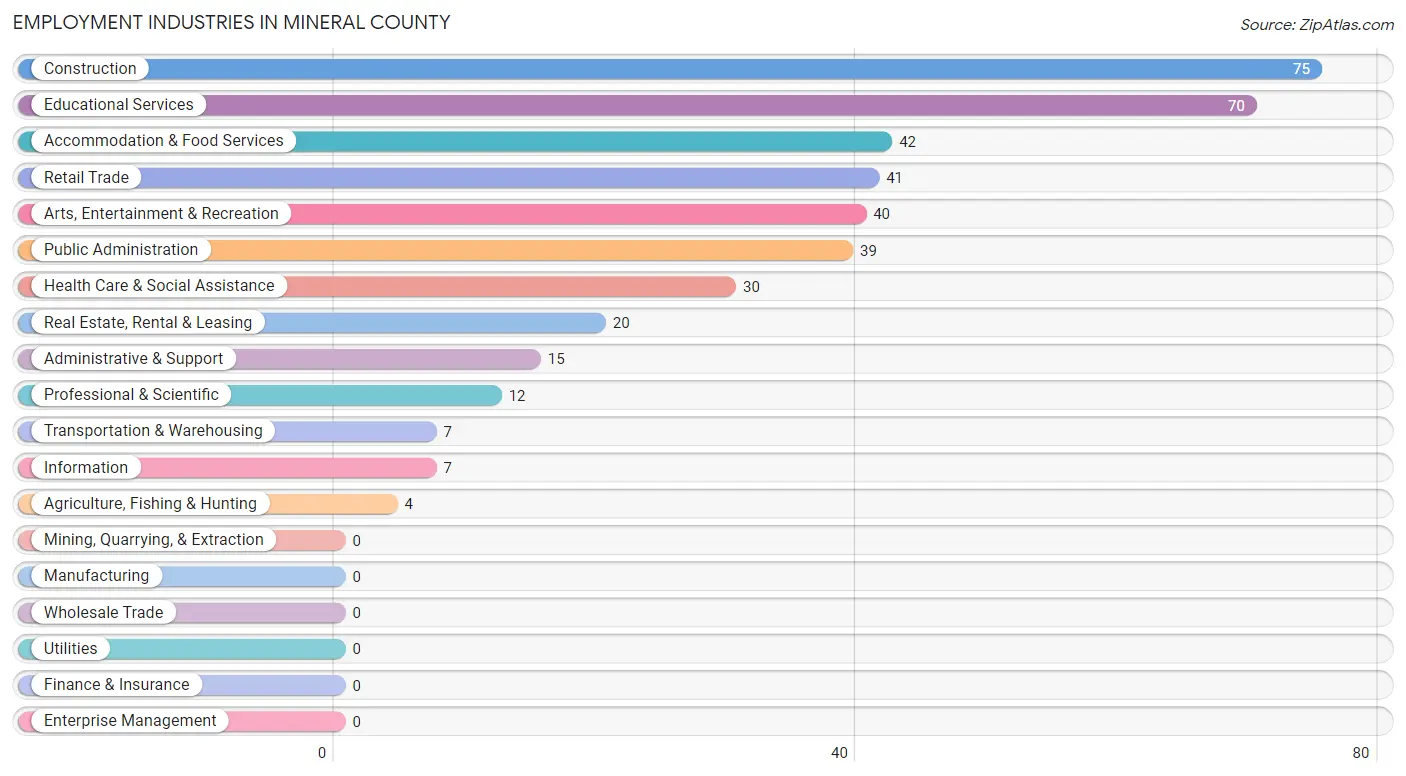
Employment Industries in Mineral County
The major employment industries in Mineral County include Construction (75 | 18.2%), Educational Services (70 | 17.0%), Accommodation & Food Services (42 | 10.2%), Retail Trade (41 | 10.0%), and Arts, Entertainment & Recreation (40 | 9.7%).
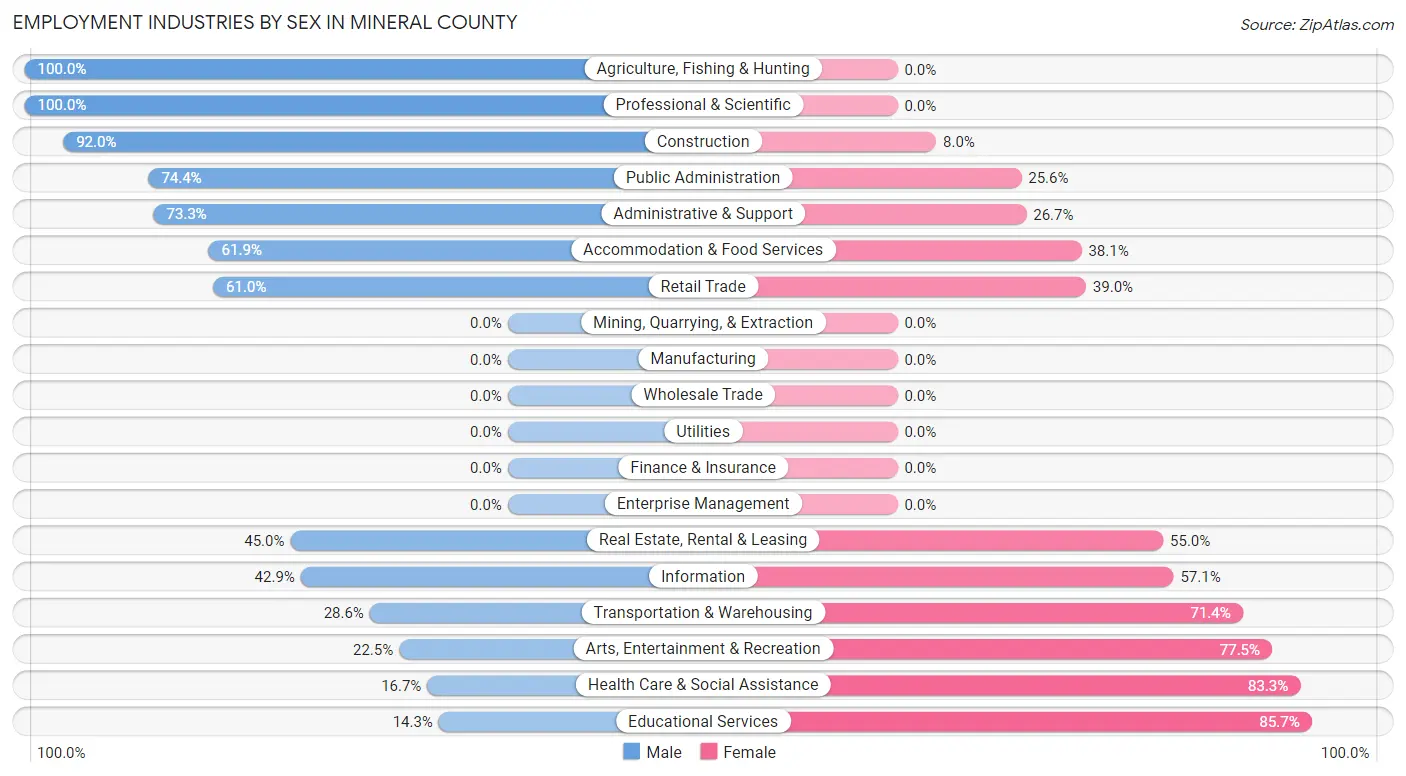
Employment Industries by Sex in Mineral County
The Mineral County industries that see more men than women are Agriculture, Fishing & Hunting (100.0%), Professional & Scientific (100.0%), and Construction (92.0%), whereas the industries that tend to have a higher number of women are Educational Services (85.7%), Health Care & Social Assistance (83.3%), and Arts, Entertainment & Recreation (77.5%).
| Industry | Male | Female |
| Agriculture, Fishing & Hunting | 4 (100.0%) | 0 (0.0%) |
| Mining, Quarrying, & Extraction | 0 (0.0%) | 0 (0.0%) |
| Construction | 69 (92.0%) | 6 (8.0%) |
| Manufacturing | 0 (0.0%) | 0 (0.0%) |
| Wholesale Trade | 0 (0.0%) | 0 (0.0%) |
| Retail Trade | 25 (61.0%) | 16 (39.0%) |
| Transportation & Warehousing | 2 (28.6%) | 5 (71.4%) |
| Utilities | 0 (0.0%) | 0 (0.0%) |
| Information | 3 (42.9%) | 4 (57.1%) |
| Finance & Insurance | 0 (0.0%) | 0 (0.0%) |
| Real Estate, Rental & Leasing | 9 (45.0%) | 11 (55.0%) |
| Professional & Scientific | 12 (100.0%) | 0 (0.0%) |
| Enterprise Management | 0 (0.0%) | 0 (0.0%) |
| Administrative & Support | 11 (73.3%) | 4 (26.7%) |
| Educational Services | 10 (14.3%) | 60 (85.7%) |
| Health Care & Social Assistance | 5 (16.7%) | 25 (83.3%) |
| Arts, Entertainment & Recreation | 9 (22.5%) | 31 (77.5%) |
| Accommodation & Food Services | 26 (61.9%) | 16 (38.1%) |
| Public Administration | 29 (74.4%) | 10 (25.6%) |
| Total | 214 (51.9%) | 198 (48.1%) |
Education in Mineral County
School Enrollment in Mineral County
The most common levels of schooling among the 49 students in Mineral County are middle school (22 | 44.9%), elementary school (13 | 26.5%), and high school (9 | 18.4%).

| School Level | # Students | % Students |
| Nursery / Preschool | 3 | 6.1% |
| Kindergarten | 0 | 0.0% |
| Elementary School | 13 | 26.5% |
| Middle School | 22 | 44.9% |
| High School | 9 | 18.4% |
| College / Undergraduate | 2 | 4.1% |
| Graduate / Professional | 0 | 0.0% |
| Total | 49 | 100.0% |
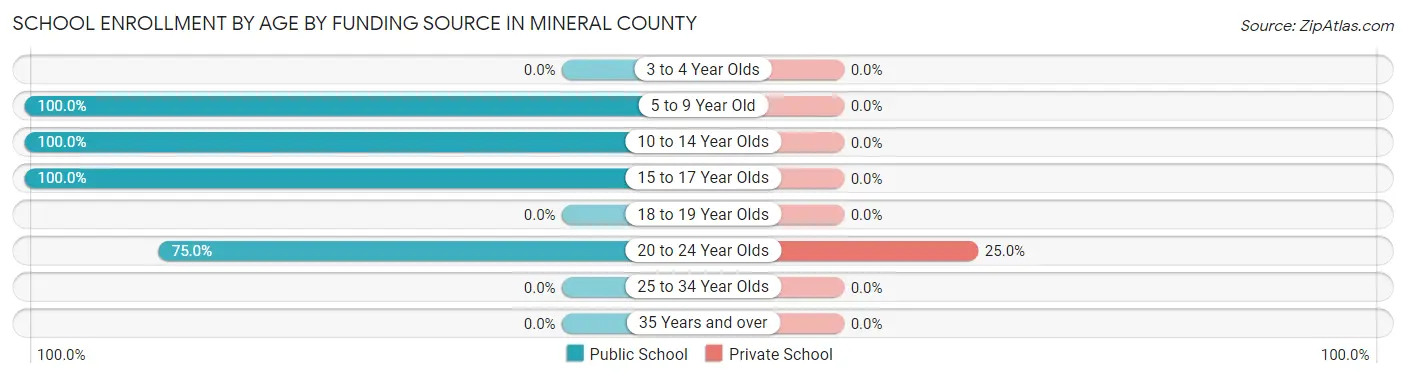
School Enrollment by Age by Funding Source in Mineral County
Out of a total of 49 students who are enrolled in schools in Mineral County, 2 (4.1%) attend a private institution, while the remaining 47 (95.9%) are enrolled in public schools. The age group of 20 to 24 year olds has the highest likelihood of being enrolled in private schools, with 2 (25.0% in the age bracket) enrolled. Conversely, the age group of 5 to 9 year old has the lowest likelihood of being enrolled in a private school, with 16 (100.0% in the age bracket) attending a public institution.
| Age Bracket | Public School | Private School |
| 3 to 4 Year Olds | 0 (0.0%) | 0 (0.0%) |
| 5 to 9 Year Old | 16 (100.0%) | 0 (0.0%) |
| 10 to 14 Year Olds | 22 (100.0%) | 0 (0.0%) |
| 15 to 17 Year Olds | 3 (100.0%) | 0 (0.0%) |
| 18 to 19 Year Olds | 0 (0.0%) | 0 (0.0%) |
| 20 to 24 Year Olds | 6 (75.0%) | 2 (25.0%) |
| 25 to 34 Year Olds | 0 (0.0%) | 0 (0.0%) |
| 35 Years and over | 0 (0.0%) | 0 (0.0%) |
| Total | 47 (95.9%) | 2 (4.1%) |
Educational Attainment by Field of Study in Mineral County
Bio, nature & agricultural (69 | 15.2%), social sciences (59 | 13.0%), visual & performing arts (55 | 12.1%), business (52 | 11.5%), and education (39 | 8.6%) are the most common fields of study among 453 individuals in Mineral County who have obtained a bachelor's degree or higher.
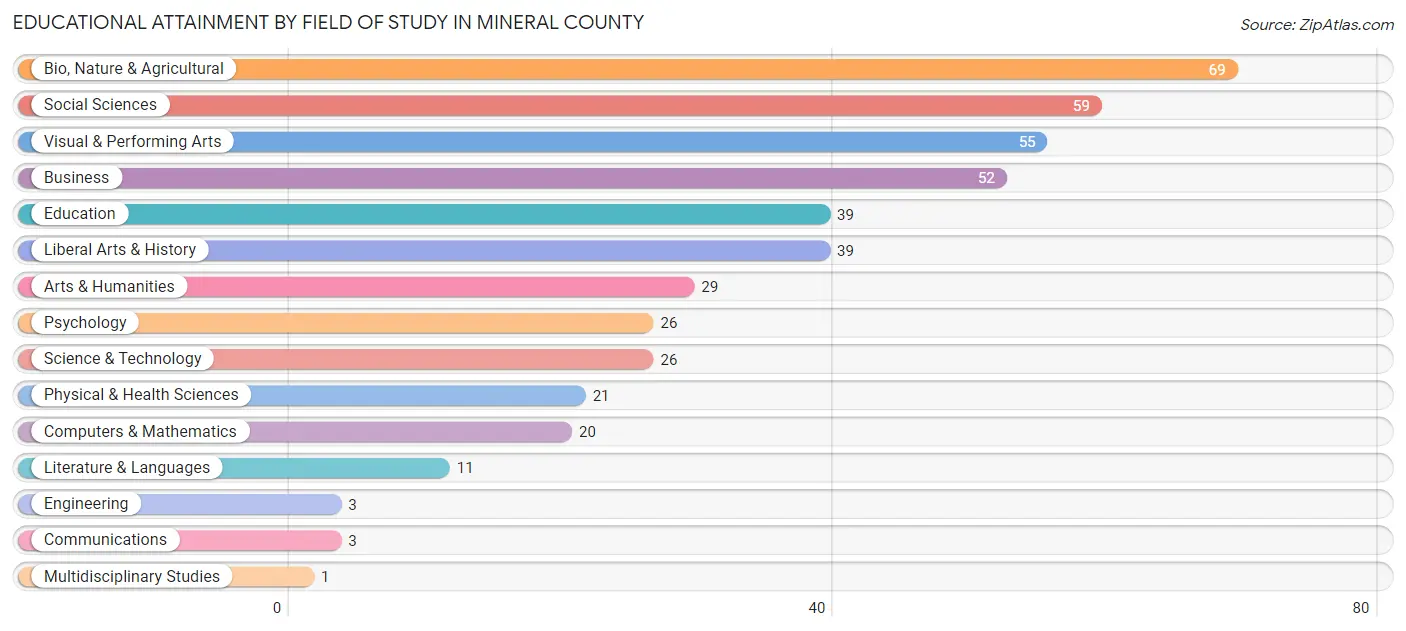
| Field of Study | # Graduates | % Graduates |
| Computers & Mathematics | 20 | 4.4% |
| Bio, Nature & Agricultural | 69 | 15.2% |
| Physical & Health Sciences | 21 | 4.6% |
| Psychology | 26 | 5.7% |
| Social Sciences | 59 | 13.0% |
| Engineering | 3 | 0.7% |
| Multidisciplinary Studies | 1 | 0.2% |
| Science & Technology | 26 | 5.7% |
| Business | 52 | 11.5% |
| Education | 39 | 8.6% |
| Literature & Languages | 11 | 2.4% |
| Liberal Arts & History | 39 | 8.6% |
| Visual & Performing Arts | 55 | 12.1% |
| Communications | 3 | 0.7% |
| Arts & Humanities | 29 | 6.4% |
| Total | 453 | 100.0% |
Transportation & Commute in Mineral County
Vehicle Availability by Sex in Mineral County
The most prevalent vehicle ownership categories in Mineral County are males with 2 vehicles (108, accounting for 51.2%) and females with 2 vehicles (85, making up 55.4%).
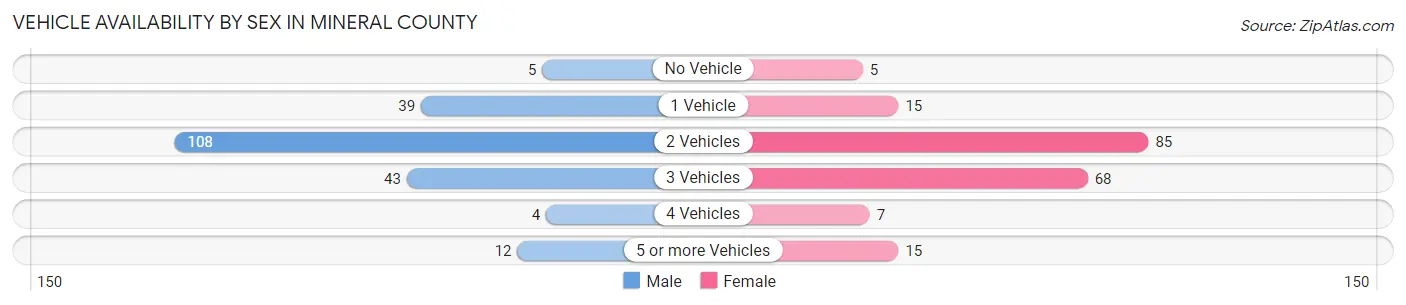
| Vehicles Available | Male | Female |
| No Vehicle | 5 (2.4%) | 5 (2.6%) |
| 1 Vehicle | 39 (18.5%) | 15 (7.7%) |
| 2 Vehicles | 108 (51.2%) | 85 (43.6%) |
| 3 Vehicles | 43 (20.4%) | 68 (34.9%) |
| 4 Vehicles | 4 (1.9%) | 7 (3.6%) |
| 5 or more Vehicles | 12 (5.7%) | 15 (7.7%) |
| Total | 211 (100.0%) | 195 (100.0%) |
Commute Time in Mineral County
The most frequently occuring commute durations in Mineral County are 10 to 14 minutes (108 commuters, 28.6%), 5 to 9 minutes (76 commuters, 20.1%), and 15 to 19 minutes (70 commuters, 18.5%).
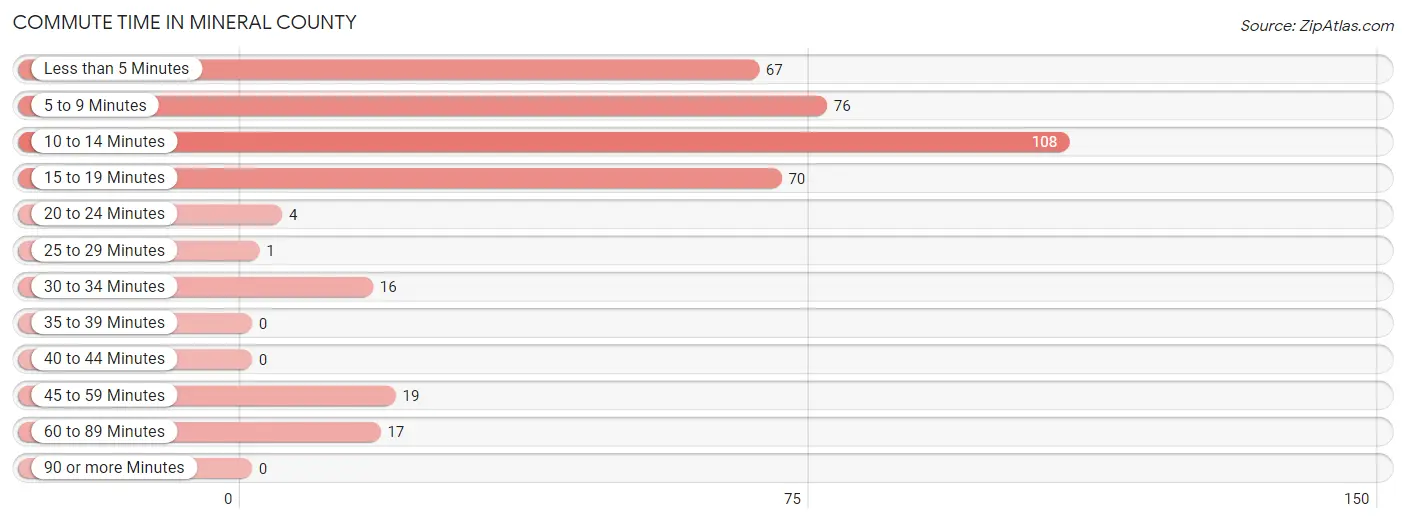
| Commute Time | # Commuters | % Commuters |
| Less than 5 Minutes | 67 | 17.7% |
| 5 to 9 Minutes | 76 | 20.1% |
| 10 to 14 Minutes | 108 | 28.6% |
| 15 to 19 Minutes | 70 | 18.5% |
| 20 to 24 Minutes | 4 | 1.1% |
| 25 to 29 Minutes | 1 | 0.3% |
| 30 to 34 Minutes | 16 | 4.2% |
| 35 to 39 Minutes | 0 | 0.0% |
| 40 to 44 Minutes | 0 | 0.0% |
| 45 to 59 Minutes | 19 | 5.0% |
| 60 to 89 Minutes | 17 | 4.5% |
| 90 or more Minutes | 0 | 0.0% |
Commute Time by Sex in Mineral County
The most common commute times in Mineral County are 15 to 19 minutes (53 commuters, 26.5%) for males and 10 to 14 minutes (65 commuters, 36.5%) for females.
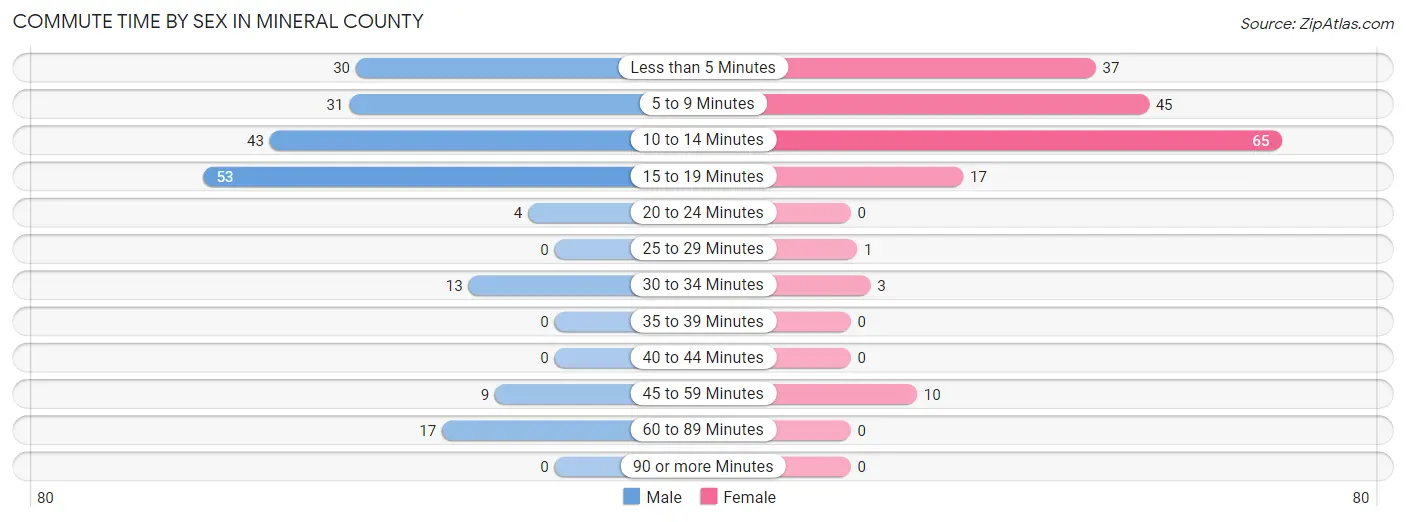
| Commute Time | Male | Female |
| Less than 5 Minutes | 30 (15.0%) | 37 (20.8%) |
| 5 to 9 Minutes | 31 (15.5%) | 45 (25.3%) |
| 10 to 14 Minutes | 43 (21.5%) | 65 (36.5%) |
| 15 to 19 Minutes | 53 (26.5%) | 17 (9.6%) |
| 20 to 24 Minutes | 4 (2.0%) | 0 (0.0%) |
| 25 to 29 Minutes | 0 (0.0%) | 1 (0.6%) |
| 30 to 34 Minutes | 13 (6.5%) | 3 (1.7%) |
| 35 to 39 Minutes | 0 (0.0%) | 0 (0.0%) |
| 40 to 44 Minutes | 0 (0.0%) | 0 (0.0%) |
| 45 to 59 Minutes | 9 (4.5%) | 10 (5.6%) |
| 60 to 89 Minutes | 17 (8.5%) | 0 (0.0%) |
| 90 or more Minutes | 0 (0.0%) | 0 (0.0%) |
Time of Departure to Work by Sex in Mineral County
The most frequent times of departure to work in Mineral County are 7:30 AM to 7:59 AM (58, 29.0%) for males and 9:00 AM to 9:59 AM (49, 27.5%) for females.
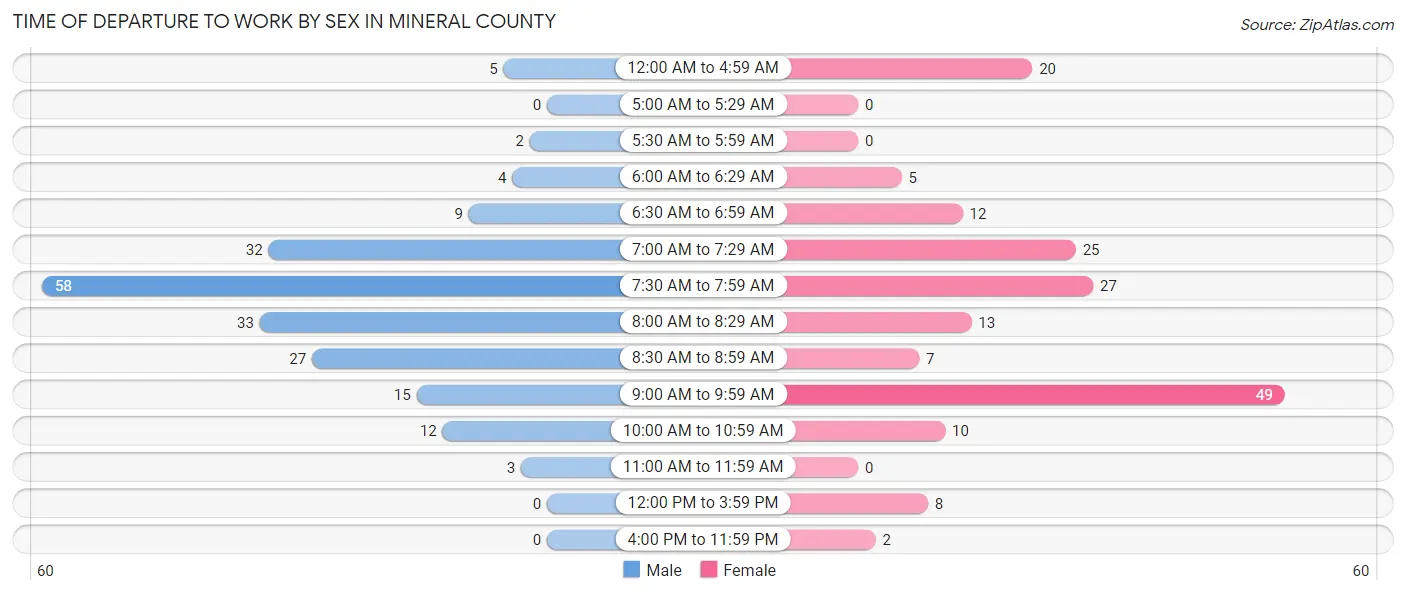
| Time of Departure | Male | Female |
| 12:00 AM to 4:59 AM | 5 (2.5%) | 20 (11.2%) |
| 5:00 AM to 5:29 AM | 0 (0.0%) | 0 (0.0%) |
| 5:30 AM to 5:59 AM | 2 (1.0%) | 0 (0.0%) |
| 6:00 AM to 6:29 AM | 4 (2.0%) | 5 (2.8%) |
| 6:30 AM to 6:59 AM | 9 (4.5%) | 12 (6.7%) |
| 7:00 AM to 7:29 AM | 32 (16.0%) | 25 (14.0%) |
| 7:30 AM to 7:59 AM | 58 (29.0%) | 27 (15.2%) |
| 8:00 AM to 8:29 AM | 33 (16.5%) | 13 (7.3%) |
| 8:30 AM to 8:59 AM | 27 (13.5%) | 7 (3.9%) |
| 9:00 AM to 9:59 AM | 15 (7.5%) | 49 (27.5%) |
| 10:00 AM to 10:59 AM | 12 (6.0%) | 10 (5.6%) |
| 11:00 AM to 11:59 AM | 3 (1.5%) | 0 (0.0%) |
| 12:00 PM to 3:59 PM | 0 (0.0%) | 8 (4.5%) |
| 4:00 PM to 11:59 PM | 0 (0.0%) | 2 (1.1%) |
| Total | 200 (100.0%) | 178 (100.0%) |
Housing Occupancy in Mineral County
Occupancy by Ownership in Mineral County
Of the total 418 dwellings in Mineral County, owner-occupied units account for 308 (73.7%), while renter-occupied units make up 110 (26.3%).
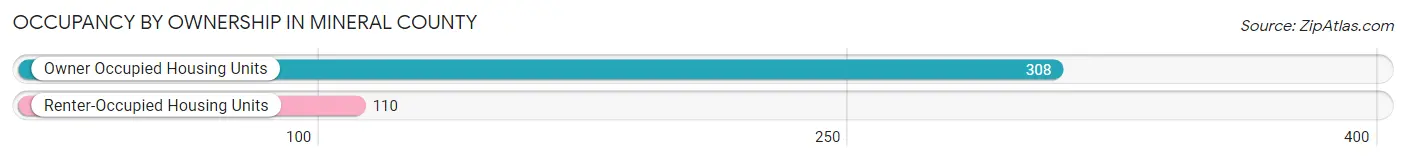
| Occupancy | # Housing Units | % Housing Units |
| Owner Occupied Housing Units | 308 | 73.7% |
| Renter-Occupied Housing Units | 110 | 26.3% |
| Total Occupied Housing Units | 418 | 100.0% |
Occupancy by Household Size in Mineral County
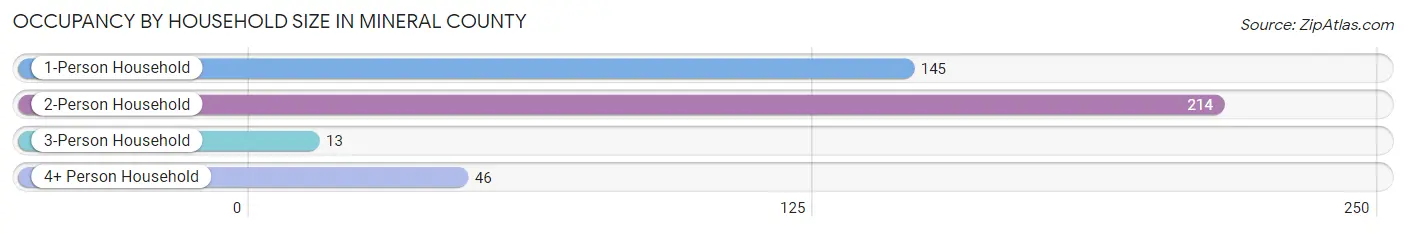
| Household Size | # Housing Units | % Housing Units |
| 1-Person Household | 145 | 34.7% |
| 2-Person Household | 214 | 51.2% |
| 3-Person Household | 13 | 3.1% |
| 4+ Person Household | 46 | 11.0% |
| Total Housing Units | 418 | 100.0% |
Occupancy by Ownership by Household Size in Mineral County
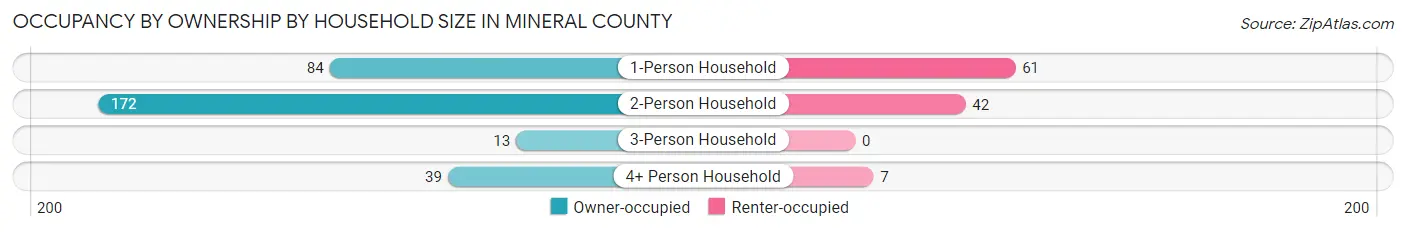
| Household Size | Owner-occupied | Renter-occupied |
| 1-Person Household | 84 (57.9%) | 61 (42.1%) |
| 2-Person Household | 172 (80.4%) | 42 (19.6%) |
| 3-Person Household | 13 (100.0%) | 0 (0.0%) |
| 4+ Person Household | 39 (84.8%) | 7 (15.2%) |
| Total Housing Units | 308 (73.7%) | 110 (26.3%) |
Occupancy by Educational Attainment in Mineral County
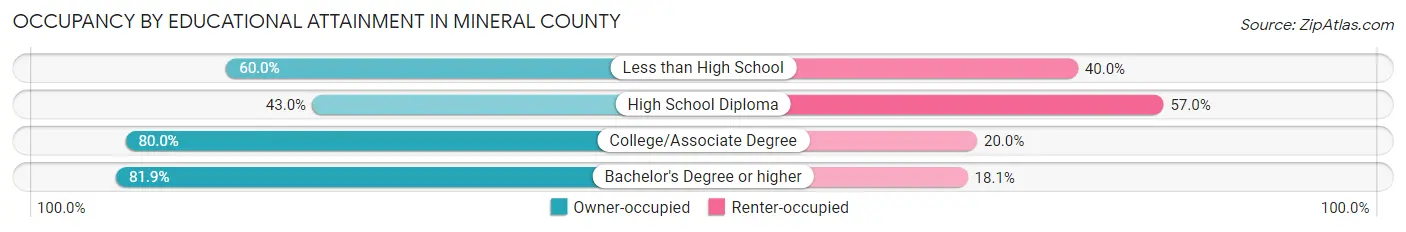
| Household Size | Owner-occupied | Renter-occupied |
| Less than High School | 3 (60.0%) | 2 (40.0%) |
| High School Diploma | 34 (43.0%) | 45 (57.0%) |
| College/Associate Degree | 104 (80.0%) | 26 (20.0%) |
| Bachelor's Degree or higher | 167 (81.9%) | 37 (18.1%) |
Occupancy by Age of Householder in Mineral County
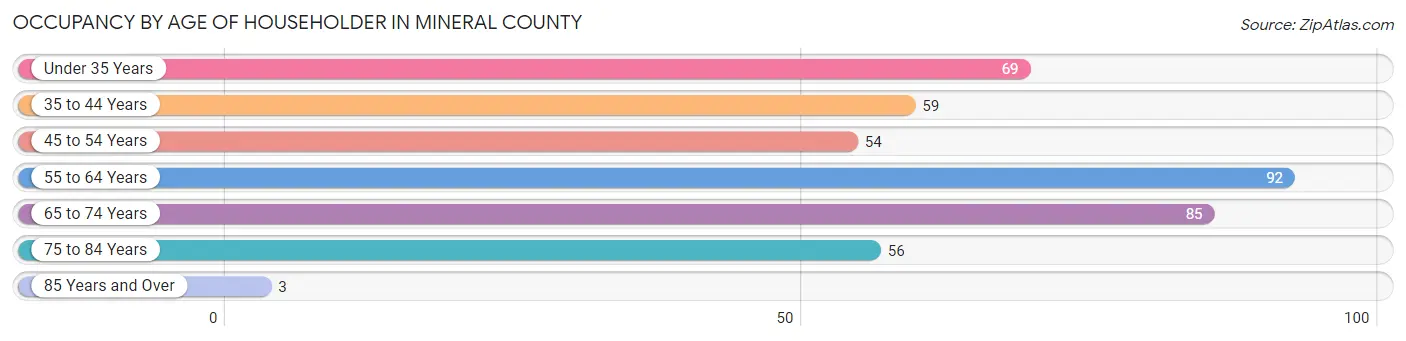
| Age Bracket | # Households | % Households |
| Under 35 Years | 69 | 16.5% |
| 35 to 44 Years | 59 | 14.1% |
| 45 to 54 Years | 54 | 12.9% |
| 55 to 64 Years | 92 | 22.0% |
| 65 to 74 Years | 85 | 20.3% |
| 75 to 84 Years | 56 | 13.4% |
| 85 Years and Over | 3 | 0.7% |
| Total | 418 | 100.0% |
Housing Finances in Mineral County
Median Income by Occupancy in Mineral County
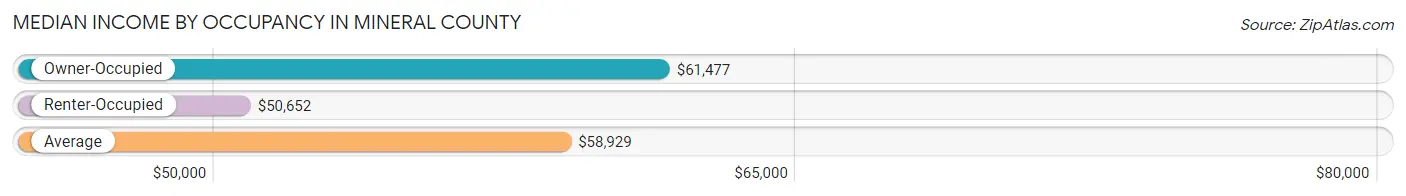
| Occupancy Type | # Households | Median Income |
| Owner-Occupied | 308 (73.7%) | $61,477 |
| Renter-Occupied | 110 (26.3%) | $50,652 |
| Average | 418 (100.0%) | $58,929 |
Occupancy by Householder Income Bracket in Mineral County
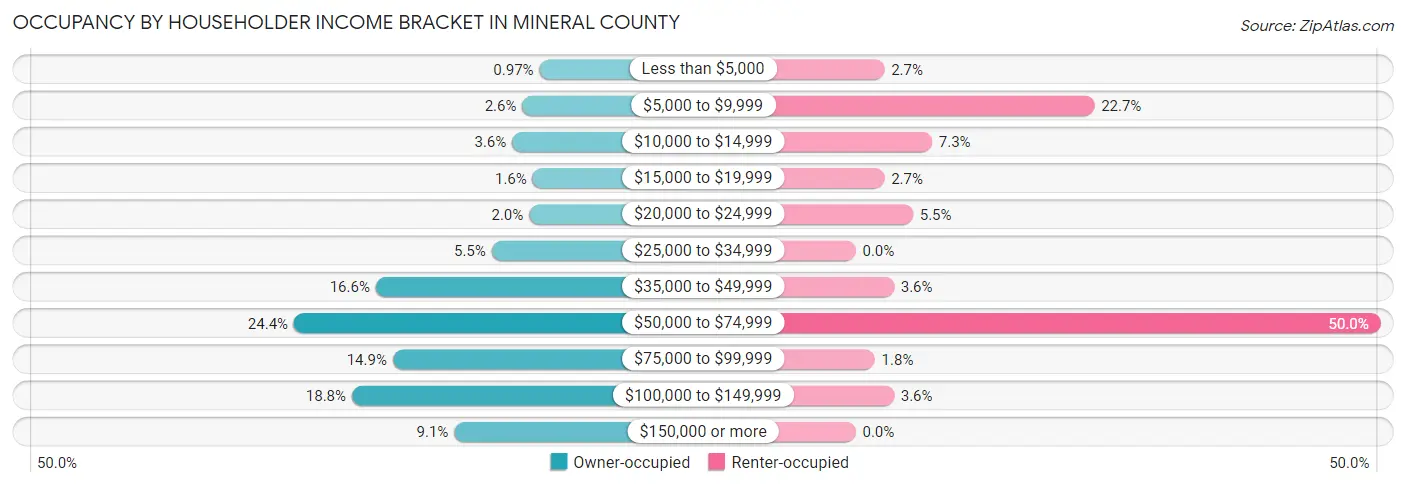
| Income Bracket | Owner-occupied | Renter-occupied |
| Less than $5,000 | 3 (1.0%) | 3 (2.7%) |
| $5,000 to $9,999 | 8 (2.6%) | 25 (22.7%) |
| $10,000 to $14,999 | 11 (3.6%) | 8 (7.3%) |
| $15,000 to $19,999 | 5 (1.6%) | 3 (2.7%) |
| $20,000 to $24,999 | 6 (1.9%) | 6 (5.4%) |
| $25,000 to $34,999 | 17 (5.5%) | 0 (0.0%) |
| $35,000 to $49,999 | 51 (16.6%) | 4 (3.6%) |
| $50,000 to $74,999 | 75 (24.3%) | 55 (50.0%) |
| $75,000 to $99,999 | 46 (14.9%) | 2 (1.8%) |
| $100,000 to $149,999 | 58 (18.8%) | 4 (3.6%) |
| $150,000 or more | 28 (9.1%) | 0 (0.0%) |
| Total | 308 (100.0%) | 110 (100.0%) |
Monthly Housing Cost Tiers in Mineral County
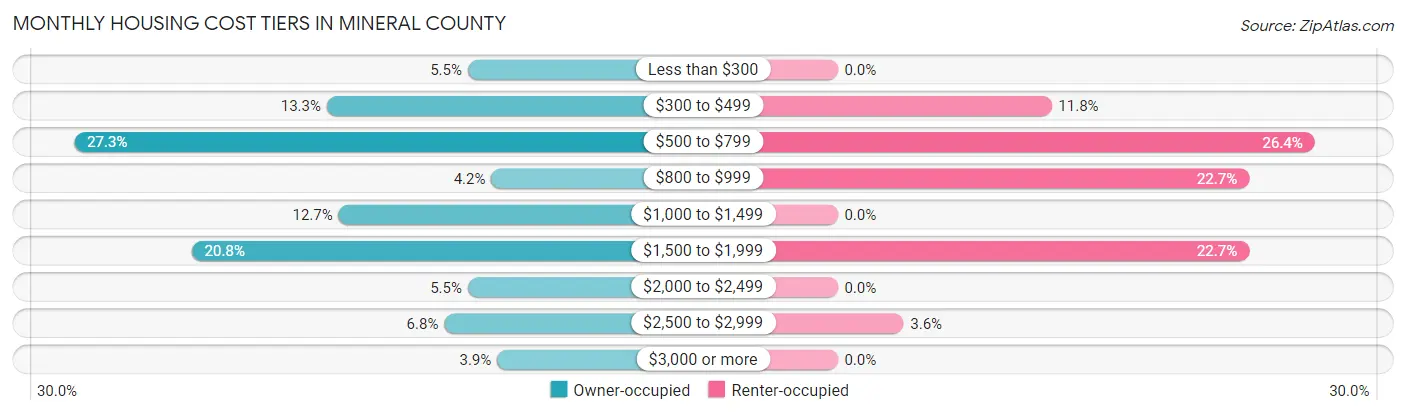
| Monthly Cost | Owner-occupied | Renter-occupied |
| Less than $300 | 17 (5.5%) | 0 (0.0%) |
| $300 to $499 | 41 (13.3%) | 13 (11.8%) |
| $500 to $799 | 84 (27.3%) | 29 (26.4%) |
| $800 to $999 | 13 (4.2%) | 25 (22.7%) |
| $1,000 to $1,499 | 39 (12.7%) | 0 (0.0%) |
| $1,500 to $1,999 | 64 (20.8%) | 25 (22.7%) |
| $2,000 to $2,499 | 17 (5.5%) | 0 (0.0%) |
| $2,500 to $2,999 | 21 (6.8%) | 4 (3.6%) |
| $3,000 or more | 12 (3.9%) | 0 (0.0%) |
| Total | 308 (100.0%) | 110 (100.0%) |
Physical Housing Characteristics in Mineral County
Housing Structures in Mineral County
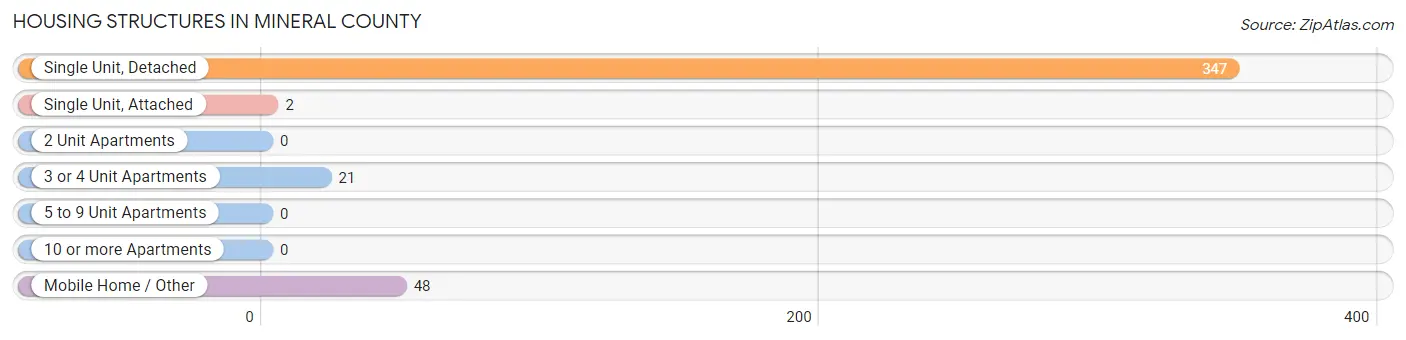
| Structure Type | # Housing Units | % Housing Units |
| Single Unit, Detached | 347 | 83.0% |
| Single Unit, Attached | 2 | 0.5% |
| 2 Unit Apartments | 0 | 0.0% |
| 3 or 4 Unit Apartments | 21 | 5.0% |
| 5 to 9 Unit Apartments | 0 | 0.0% |
| 10 or more Apartments | 0 | 0.0% |
| Mobile Home / Other | 48 | 11.5% |
| Total | 418 | 100.0% |
Housing Structures by Occupancy in Mineral County
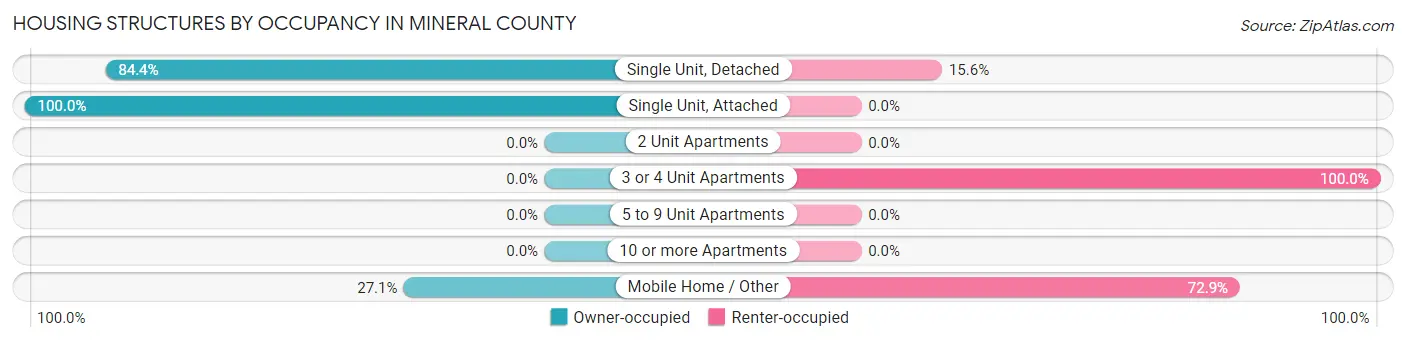
| Structure Type | Owner-occupied | Renter-occupied |
| Single Unit, Detached | 293 (84.4%) | 54 (15.6%) |
| Single Unit, Attached | 2 (100.0%) | 0 (0.0%) |
| 2 Unit Apartments | 0 (0.0%) | 0 (0.0%) |
| 3 or 4 Unit Apartments | 0 (0.0%) | 21 (100.0%) |
| 5 to 9 Unit Apartments | 0 (0.0%) | 0 (0.0%) |
| 10 or more Apartments | 0 (0.0%) | 0 (0.0%) |
| Mobile Home / Other | 13 (27.1%) | 35 (72.9%) |
| Total | 308 (73.7%) | 110 (26.3%) |
Housing Structures by Number of Rooms in Mineral County
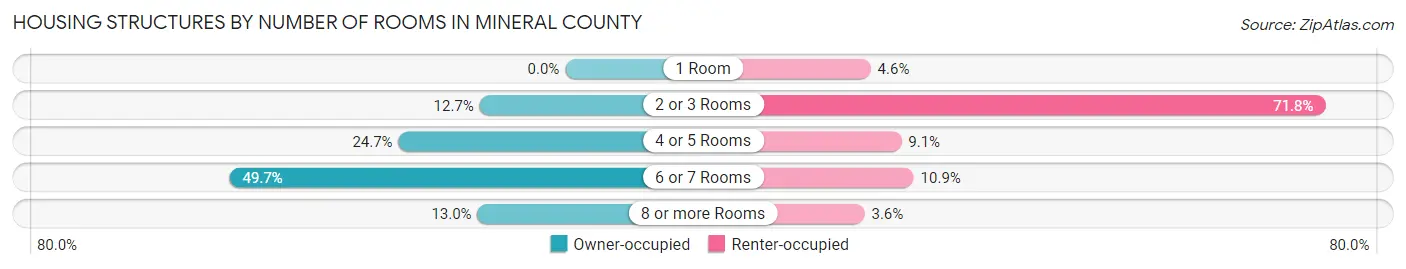
| Number of Rooms | Owner-occupied | Renter-occupied |
| 1 Room | 0 (0.0%) | 5 (4.5%) |
| 2 or 3 Rooms | 39 (12.7%) | 79 (71.8%) |
| 4 or 5 Rooms | 76 (24.7%) | 10 (9.1%) |
| 6 or 7 Rooms | 153 (49.7%) | 12 (10.9%) |
| 8 or more Rooms | 40 (13.0%) | 4 (3.6%) |
| Total | 308 (100.0%) | 110 (100.0%) |
Housing Structure by Heating Type in Mineral County
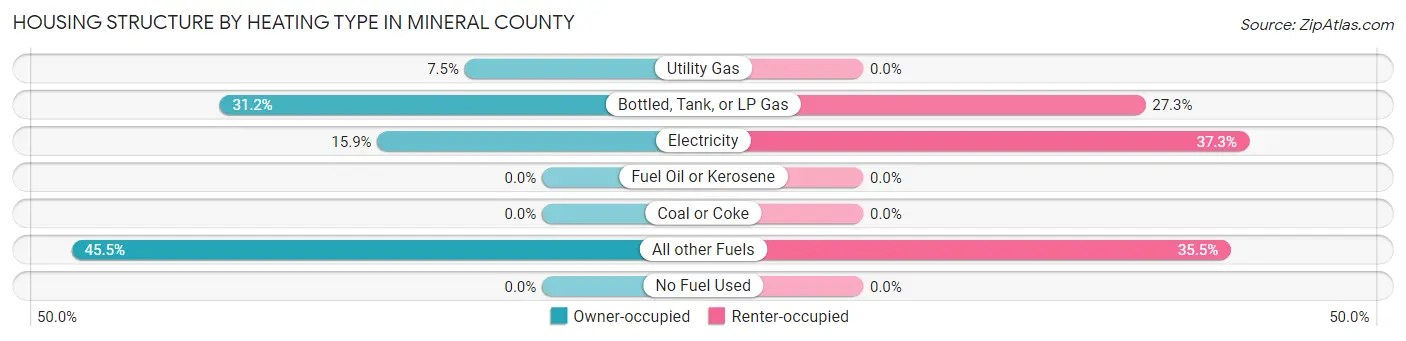
| Heating Type | Owner-occupied | Renter-occupied |
| Utility Gas | 23 (7.5%) | 0 (0.0%) |
| Bottled, Tank, or LP Gas | 96 (31.2%) | 30 (27.3%) |
| Electricity | 49 (15.9%) | 41 (37.3%) |
| Fuel Oil or Kerosene | 0 (0.0%) | 0 (0.0%) |
| Coal or Coke | 0 (0.0%) | 0 (0.0%) |
| All other Fuels | 140 (45.5%) | 39 (35.4%) |
| No Fuel Used | 0 (0.0%) | 0 (0.0%) |
| Total | 308 (100.0%) | 110 (100.0%) |
Household Vehicle Usage in Mineral County
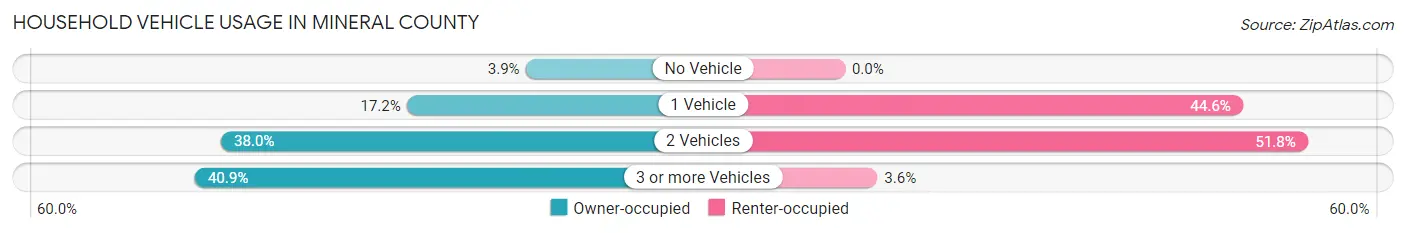
| Vehicles per Household | Owner-occupied | Renter-occupied |
| No Vehicle | 12 (3.9%) | 0 (0.0%) |
| 1 Vehicle | 53 (17.2%) | 49 (44.6%) |
| 2 Vehicles | 117 (38.0%) | 57 (51.8%) |
| 3 or more Vehicles | 126 (40.9%) | 4 (3.6%) |
| Total | 308 (100.0%) | 110 (100.0%) |
Real Estate & Mortgages in Mineral County
Real Estate and Mortgage Overview in Mineral County
| Characteristic | Without Mortgage | With Mortgage |
| Housing Units | 157 | 151 |
| Median Property Value | $372,600 | $385,900 |
| Median Household Income | $61,250 | $5 |
| Monthly Housing Costs | $541 | $12 |
| Real Estate Taxes | $1,431 | $0 |
Property Value by Mortgage Status in Mineral County
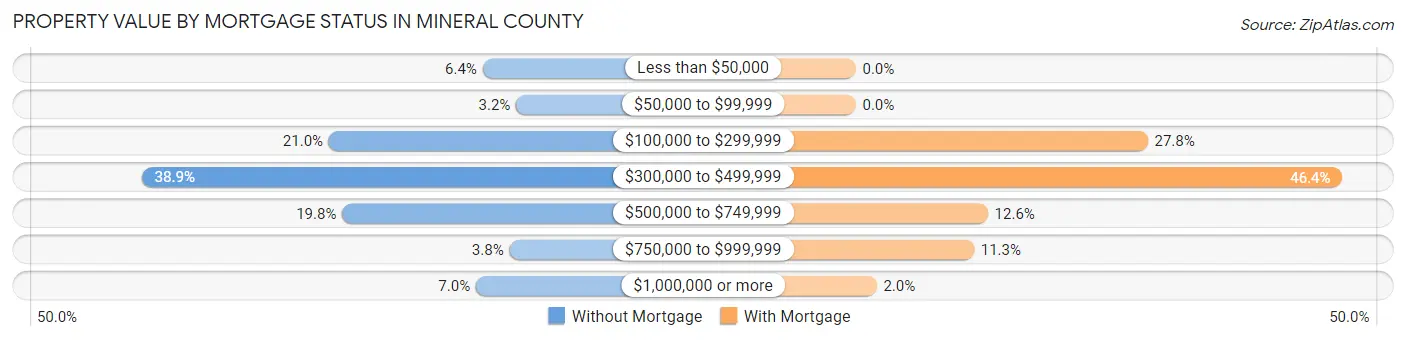
| Property Value | Without Mortgage | With Mortgage |
| Less than $50,000 | 10 (6.4%) | 0 (0.0%) |
| $50,000 to $99,999 | 5 (3.2%) | 0 (0.0%) |
| $100,000 to $299,999 | 33 (21.0%) | 42 (27.8%) |
| $300,000 to $499,999 | 61 (38.9%) | 70 (46.4%) |
| $500,000 to $749,999 | 31 (19.8%) | 19 (12.6%) |
| $750,000 to $999,999 | 6 (3.8%) | 17 (11.3%) |
| $1,000,000 or more | 11 (7.0%) | 3 (2.0%) |
| Total | 157 (100.0%) | 151 (100.0%) |
Household Income by Mortgage Status in Mineral County
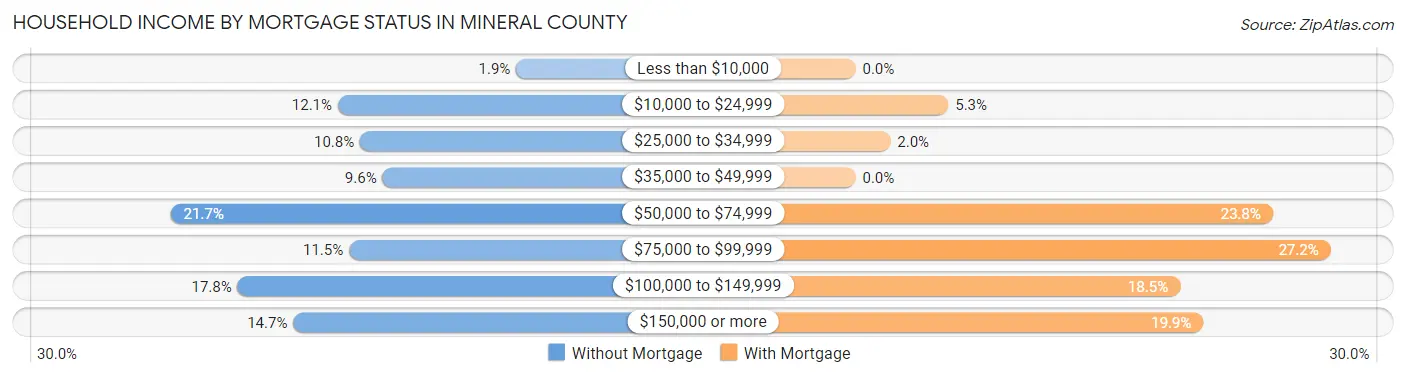
| Household Income | Without Mortgage | With Mortgage |
| Less than $10,000 | 3 (1.9%) | 0 (0.0%) |
| $10,000 to $24,999 | 19 (12.1%) | 8 (5.3%) |
| $25,000 to $34,999 | 17 (10.8%) | 3 (2.0%) |
| $35,000 to $49,999 | 15 (9.6%) | 0 (0.0%) |
| $50,000 to $74,999 | 34 (21.7%) | 36 (23.8%) |
| $75,000 to $99,999 | 18 (11.5%) | 41 (27.2%) |
| $100,000 to $149,999 | 28 (17.8%) | 28 (18.5%) |
| $150,000 or more | 23 (14.6%) | 30 (19.9%) |
| Total | 157 (100.0%) | 151 (100.0%) |
Property Value to Household Income Ratio in Mineral County
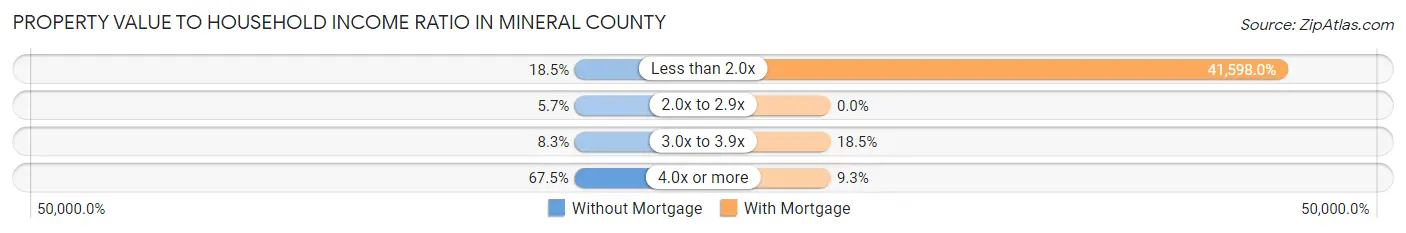
| Value-to-Income Ratio | Without Mortgage | With Mortgage |
| Less than 2.0x | 29 (18.5%) | 62,813 (41,598.0%) |
| 2.0x to 2.9x | 9 (5.7%) | 0 (0.0%) |
| 3.0x to 3.9x | 13 (8.3%) | 28 (18.5%) |
| 4.0x or more | 106 (67.5%) | 14 (9.3%) |
| Total | 157 (100.0%) | 151 (100.0%) |
Real Estate Taxes by Mortgage Status in Mineral County
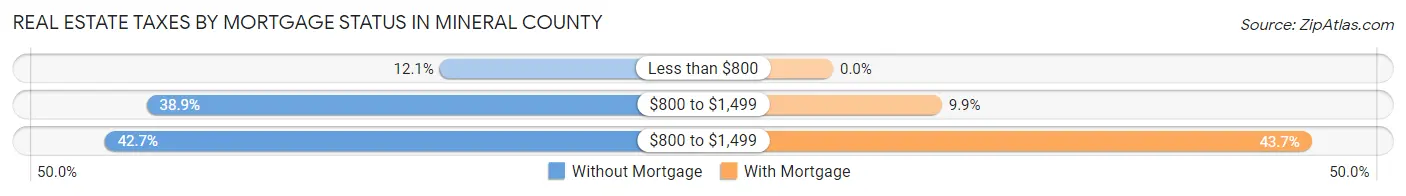
| Property Taxes | Without Mortgage | With Mortgage |
| Less than $800 | 19 (12.1%) | 0 (0.0%) |
| $800 to $1,499 | 61 (38.9%) | 15 (9.9%) |
| $800 to $1,499 | 67 (42.7%) | 66 (43.7%) |
| Total | 157 (100.0%) | 151 (100.0%) |
Health & Disability in Mineral County
Health Insurance Coverage by Age in Mineral County
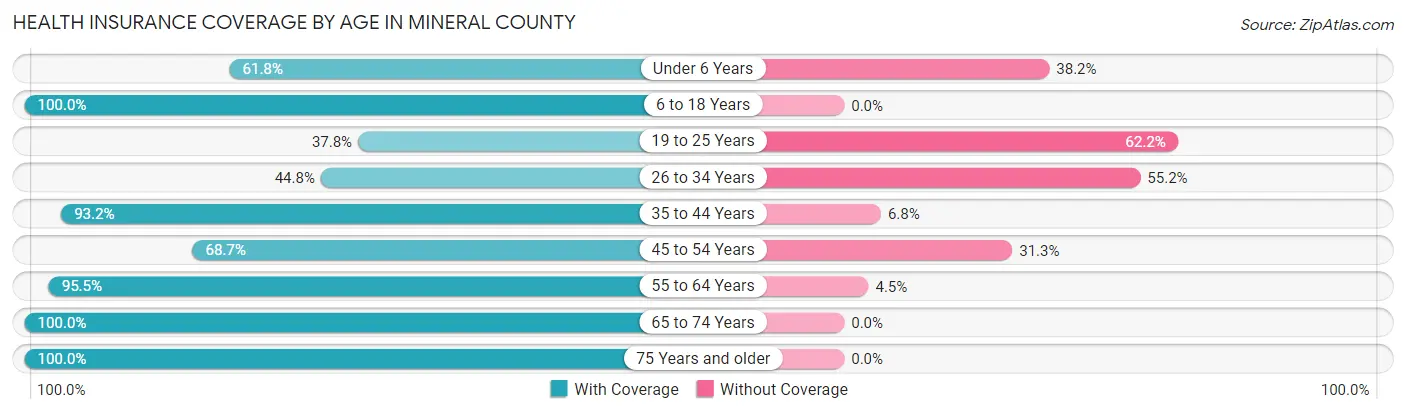
| Age Bracket | With Coverage | Without Coverage |
| Under 6 Years | 21 (61.8%) | 13 (38.2%) |
| 6 to 18 Years | 61 (100.0%) | 0 (0.0%) |
| 19 to 25 Years | 14 (37.8%) | 23 (62.2%) |
| 26 to 34 Years | 30 (44.8%) | 37 (55.2%) |
| 35 to 44 Years | 109 (93.2%) | 8 (6.8%) |
| 45 to 54 Years | 57 (68.7%) | 26 (31.3%) |
| 55 to 64 Years | 169 (95.5%) | 8 (4.5%) |
| 65 to 74 Years | 132 (100.0%) | 0 (0.0%) |
| 75 Years and older | 83 (100.0%) | 0 (0.0%) |
| Total | 676 (85.5%) | 115 (14.5%) |
Health Insurance Coverage by Citizenship Status in Mineral County
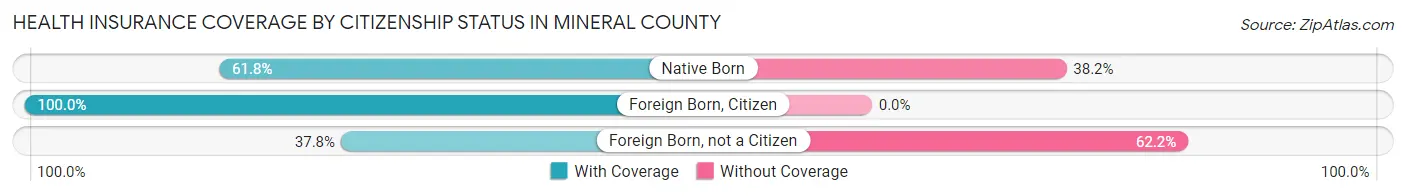
| Citizenship Status | With Coverage | Without Coverage |
| Native Born | 21 (61.8%) | 13 (38.2%) |
| Foreign Born, Citizen | 61 (100.0%) | 0 (0.0%) |
| Foreign Born, not a Citizen | 14 (37.8%) | 23 (62.2%) |
Health Insurance Coverage by Household Income in Mineral County
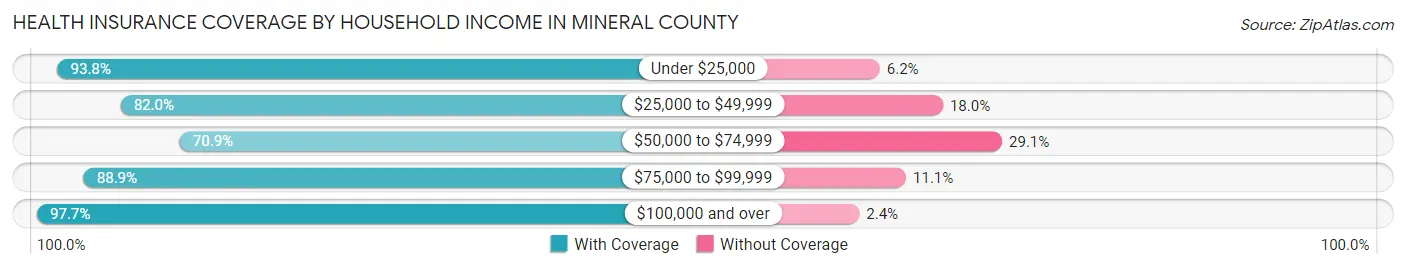
| Household Income | With Coverage | Without Coverage |
| Under $25,000 | 91 (93.8%) | 6 (6.2%) |
| $25,000 to $49,999 | 91 (82.0%) | 20 (18.0%) |
| $50,000 to $74,999 | 173 (70.9%) | 71 (29.1%) |
| $75,000 to $99,999 | 104 (88.9%) | 13 (11.1%) |
| $100,000 and over | 208 (97.7%) | 5 (2.4%) |
Public vs Private Health Insurance Coverage by Age in Mineral County
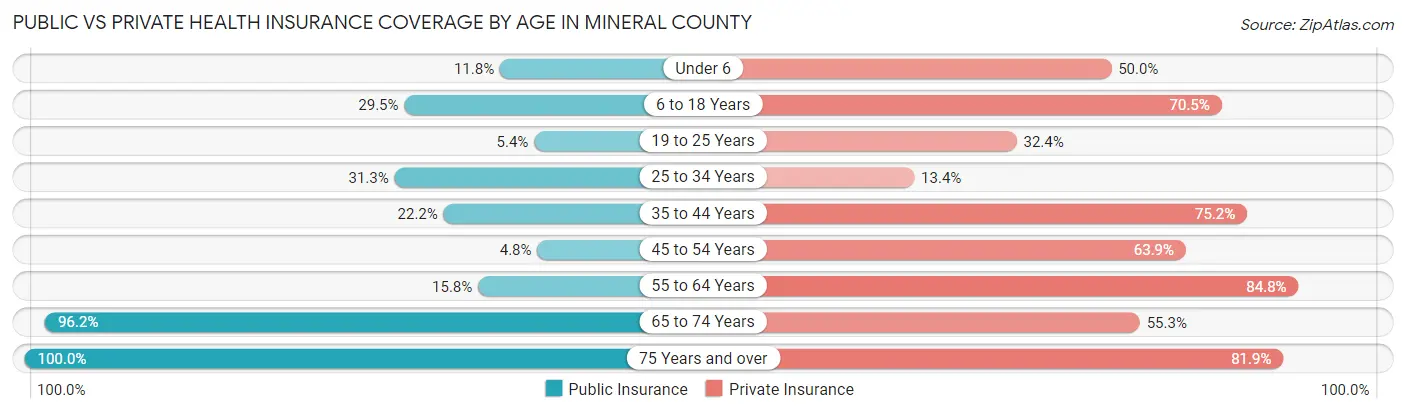
| Age Bracket | Public Insurance | Private Insurance |
| Under 6 | 4 (11.8%) | 17 (50.0%) |
| 6 to 18 Years | 18 (29.5%) | 43 (70.5%) |
| 19 to 25 Years | 2 (5.4%) | 12 (32.4%) |
| 25 to 34 Years | 21 (31.3%) | 9 (13.4%) |
| 35 to 44 Years | 26 (22.2%) | 88 (75.2%) |
| 45 to 54 Years | 4 (4.8%) | 53 (63.9%) |
| 55 to 64 Years | 28 (15.8%) | 150 (84.8%) |
| 65 to 74 Years | 127 (96.2%) | 73 (55.3%) |
| 75 Years and over | 83 (100.0%) | 68 (81.9%) |
| Total | 313 (39.6%) | 513 (64.8%) |
Disability Status by Sex by Age in Mineral County
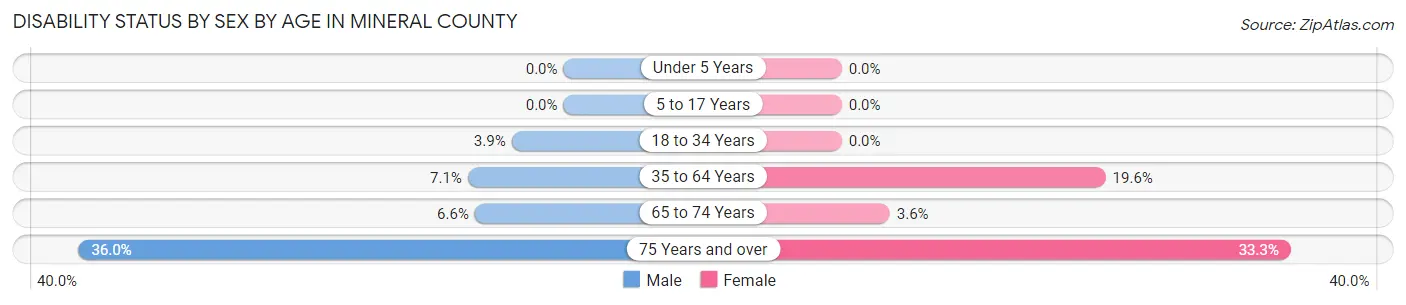
| Age Bracket | Male | Female |
| Under 5 Years | 0 (0.0%) | 0 (0.0%) |
| 5 to 17 Years | 0 (0.0%) | 0 (0.0%) |
| 18 to 34 Years | 2 (3.8%) | 0 (0.0%) |
| 35 to 64 Years | 13 (7.1%) | 38 (19.6%) |
| 65 to 74 Years | 5 (6.6%) | 2 (3.6%) |
| 75 Years and over | 18 (36.0%) | 11 (33.3%) |
Disability Class by Sex by Age in Mineral County
Disability Class: Hearing Difficulty

| Age Bracket | Male | Female |
| Under 5 Years | 0 (0.0%) | 0 (0.0%) |
| 5 to 17 Years | 0 (0.0%) | 0 (0.0%) |
| 18 to 34 Years | 0 (0.0%) | 0 (0.0%) |
| 35 to 64 Years | 5 (2.7%) | 7 (3.6%) |
| 65 to 74 Years | 1 (1.3%) | 2 (3.6%) |
| 75 Years and over | 11 (22.0%) | 5 (15.1%) |
Disability Class: Vision Difficulty

| Age Bracket | Male | Female |
| Under 5 Years | 0 (0.0%) | 0 (0.0%) |
| 5 to 17 Years | 0 (0.0%) | 0 (0.0%) |
| 18 to 34 Years | 2 (3.8%) | 0 (0.0%) |
| 35 to 64 Years | 0 (0.0%) | 14 (7.2%) |
| 65 to 74 Years | 1 (1.3%) | 0 (0.0%) |
| 75 Years and over | 0 (0.0%) | 0 (0.0%) |
Disability Class: Cognitive Difficulty
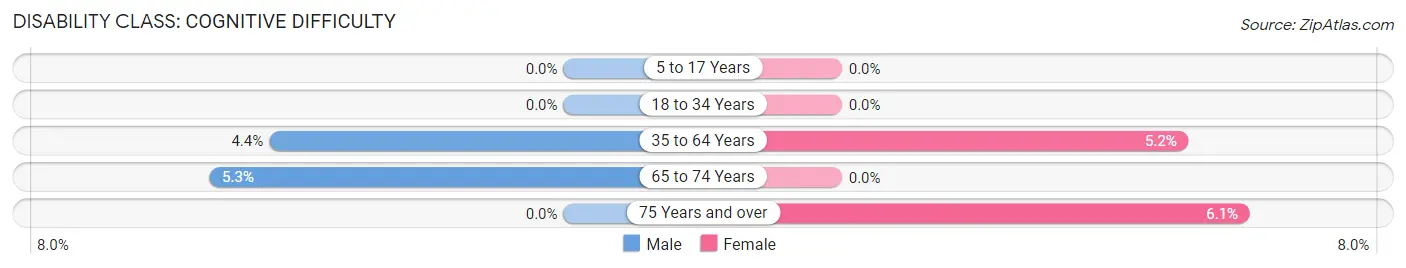
| Age Bracket | Male | Female |
| 5 to 17 Years | 0 (0.0%) | 0 (0.0%) |
| 18 to 34 Years | 0 (0.0%) | 0 (0.0%) |
| 35 to 64 Years | 8 (4.4%) | 10 (5.1%) |
| 65 to 74 Years | 4 (5.3%) | 0 (0.0%) |
| 75 Years and over | 0 (0.0%) | 2 (6.1%) |
Disability Class: Ambulatory Difficulty

| Age Bracket | Male | Female |
| 5 to 17 Years | 0 (0.0%) | 0 (0.0%) |
| 18 to 34 Years | 0 (0.0%) | 0 (0.0%) |
| 35 to 64 Years | 2 (1.1%) | 27 (13.9%) |
| 65 to 74 Years | 0 (0.0%) | 0 (0.0%) |
| 75 Years and over | 7 (14.0%) | 4 (12.1%) |
Disability Class: Self-Care Difficulty

| Age Bracket | Male | Female |
| 5 to 17 Years | 0 (0.0%) | 0 (0.0%) |
| 18 to 34 Years | 0 (0.0%) | 0 (0.0%) |
| 35 to 64 Years | 2 (1.1%) | 3 (1.5%) |
| 65 to 74 Years | 0 (0.0%) | 0 (0.0%) |
| 75 Years and over | 0 (0.0%) | 0 (0.0%) |
Technology Access in Mineral County
Computing Device Access in Mineral County
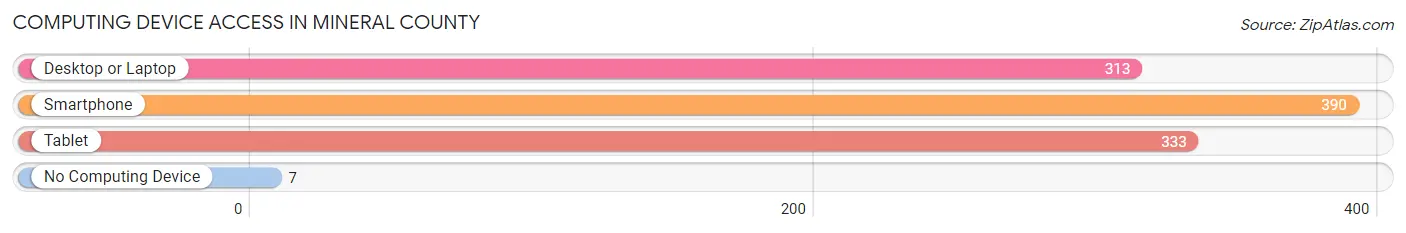
| Device Type | # Households | % Households |
| Desktop or Laptop | 313 | 74.9% |
| Smartphone | 390 | 93.3% |
| Tablet | 333 | 79.7% |
| No Computing Device | 7 | 1.7% |
| Total | 418 | 100.0% |
Internet Access in Mineral County
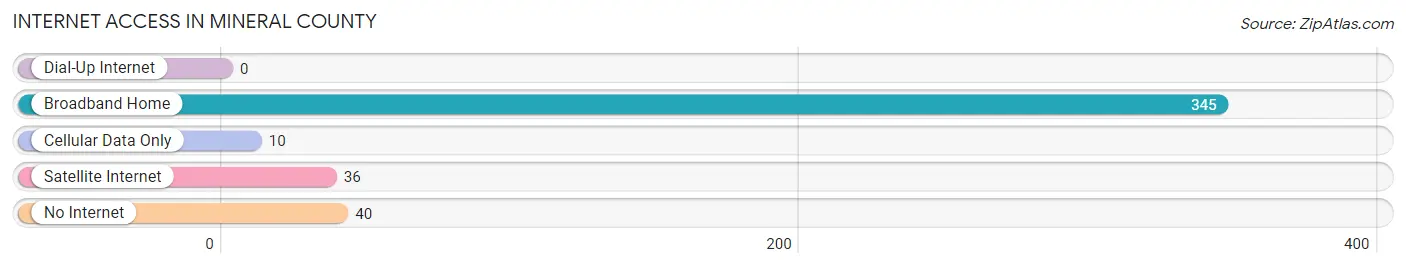
| Internet Type | # Households | % Households |
| Dial-Up Internet | 0 | 0.0% |
| Broadband Home | 345 | 82.5% |
| Cellular Data Only | 10 | 2.4% |
| Satellite Internet | 36 | 8.6% |
| No Internet | 40 | 9.6% |
| Total | 418 | 100.0% |
Mineral County Summary
Mineral County is a county located in the southwestern corner of the state of Colorado in the United States. As of the 2010 census, the population was 712, making it the least populous county in Colorado. The county seat and only incorporated municipality in the county is Creede.
Geography
Mineral County is located in the San Juan Mountains of southwestern Colorado. It is bordered by Rio Grande County to the north, Hinsdale County to the east, Saguache County to the south, and San Juan County, New Mexico to the west. The county covers an area of 1,289 square miles, making it the fifth-smallest county in Colorado by area.
The county is home to several mountain peaks, including Mount Emmons (13,491 feet), Mount Baldy (13,386 feet), and Mount Adams (13,074 feet). The headwaters of the Rio Grande are located in Mineral County, and the river flows through the county for approximately 25 miles. The county also contains several reservoirs, including the Rio Grande Reservoir, the South Fork Reservoir, and the Creede Reservoir.
History
The area that is now Mineral County was originally inhabited by the Ute and Jicarilla Apache tribes. The first European settlers arrived in the area in the late 19th century, and the county was officially established in 1877. The county was named for the numerous mineral deposits found in the area, including gold, silver, copper, and lead.
The county experienced a population boom in the late 19th century due to the discovery of silver in the area. The town of Creede was established in 1889, and quickly became the county seat and the largest town in the county. The town was home to several silver mines, and at its peak had a population of over 10,000 people.
The silver boom ended in 1893, and the population of the county declined rapidly. By the 1930s, the population had dropped to less than 1,000 people. The population has remained relatively stable since then, and as of the 2010 census, the population was 712.
Economy
The economy of Mineral County is largely based on tourism and recreation. The county is home to several ski resorts, including Wolf Creek Ski Area and Creede Ski Area. The county is also home to several national forests and wilderness areas, including the Rio Grande National Forest and the Weminuche Wilderness.
The county is also home to several mining operations, including the Creede Underground Mining Museum. The museum is located in the former Creede Mine, and offers tours of the mine and exhibits on the history of mining in the area.
Demographics
As of the 2010 census, there were 712 people, 327 households, and 191 families residing in the county. The population density was 0.6 people per square mile. There were 517 housing units at an average density of 0.4 per square mile. The racial makeup of the county was 95.2% White, 0.3% Black or African American, 0.6% Native American, 0.3% Asian, 0.1% Pacific Islander, 1.7% from other races, and 1.8% from two or more races. 4.2% of the population were Hispanic or Latino of any race.
There were 327 households, out of which 22.2% had children under the age of 18 living with them, 48.3% were married couples living together, 6.7% had a female householder with no husband present, and 41.2% were non-families. 36.2% of all households were made up of individuals, and 13.2% had someone living alone who was 65 years of age or older. The average household size was 2.17 and the average family size was 2.81.
The median income for a household in the county was $31,250, and the median income for a family was $37,500. Males had a median income of $30,000 versus $20,000 for females. The per capita income for the county was $17,845. About 10.2% of families and 14.2% of the population were below the poverty line, including 16.7% of those under age 18 and 8.3% of those age 65 or over.
Common Questions
What is Per Capita Income in Mineral County?
Per Capita income in Mineral County is $37,647.
What is the Median Family Income in Mineral County?
Median Family Income in Mineral County is $67,344.
What is the Median Household income in Mineral County?
Median Household Income in Mineral County is $58,929.
What is Income or Wage Gap in Mineral County?
Income or Wage Gap in Mineral County is 54.6%.
Women in Mineral County earn 45.4 cents for every dollar earned by a man.
What is Inequality or Gini Index in Mineral County?
Inequality or Gini Index in Mineral County is 0.39.
What is the Total Population of Mineral County?
Total Population of Mineral County is 794.
What is the Total Male Population of Mineral County?
Total Male Population of Mineral County is 395.
What is the Total Female Population of Mineral County?
Total Female Population of Mineral County is 399.
What is the Ratio of Males per 100 Females in Mineral County?
There are 99.00 Males per 100 Females in Mineral County.
What is the Ratio of Females per 100 Males in Mineral County?
There are 101.01 Females per 100 Males in Mineral County.
What is the Median Population Age in Mineral County?
Median Population Age in Mineral County is 54.7 Years.
What is the Average Family Size in Mineral County
Average Family Size in Mineral County is 2.4 People.
What is the Average Household Size in Mineral County
Average Household Size in Mineral County is 1.9 People.
How Large is the Labor Force in Mineral County?
There are 436 People in the Labor Forcein in Mineral County.
What is the Percentage of People in the Labor Force in Mineral County?
61.7% of People are in the Labor Force in Mineral County.
What is the Unemployment Rate in Mineral County?
Unemployment Rate in Mineral County is 4.8%.