Lincoln County, CO Map & Demographics
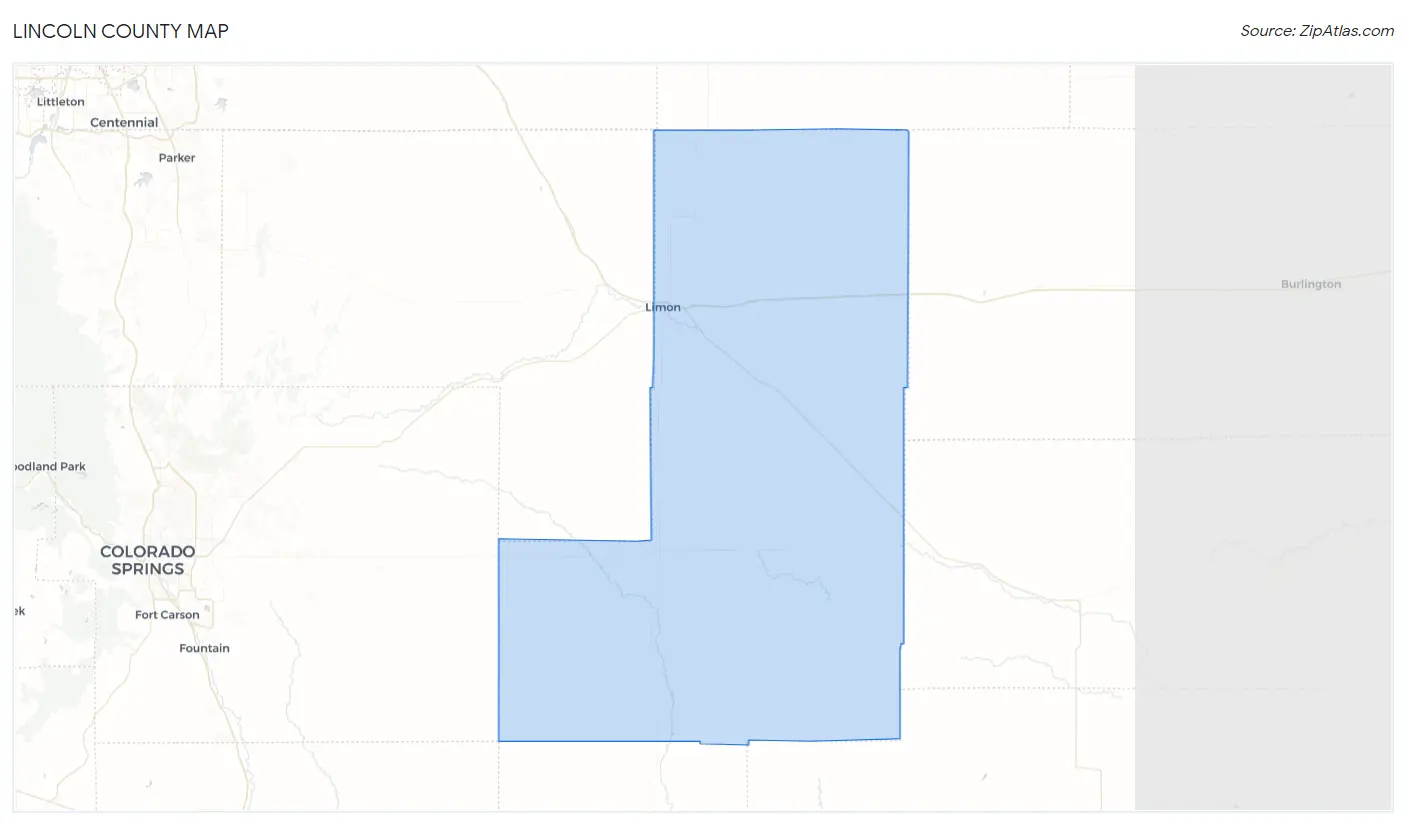
Lincoln County Map
Lincoln County Overview
$27,610
PER CAPITA INCOME
$89,519
AVG FAMILY INCOME
$59,167
AVG HOUSEHOLD INCOME
9.0%
WAGE / INCOME GAP [ % ]
91.0¢/ $1
WAGE / INCOME GAP [ $ ]
$9,275
FAMILY INCOME DEFICIT
0.49
INEQUALITY / GINI INDEX
5,583
TOTAL POPULATION
3,377
MALE POPULATION
2,206
FEMALE POPULATION
153.08
MALES / 100 FEMALES
65.32
FEMALES / 100 MALES
40.4
MEDIAN AGE
2.9
AVG FAMILY SIZE
2.2
AVG HOUSEHOLD SIZE
2,235
LABOR FORCE [ PEOPLE ]
47.3%
PERCENT IN LABOR FORCE
2.3%
UNEMPLOYMENT RATE
Income in Lincoln County
Income Overview in Lincoln County
Per Capita Income in Lincoln County is $27,610, while median incomes of families and households are $89,519 and $59,167 respectively.
| Characteristic | Number | Measure |
| Per Capita Income | 5,583 | $27,610 |
| Median Family Income | 1,118 | $89,519 |
| Mean Family Income | 1,118 | $112,620 |
| Median Household Income | 1,922 | $59,167 |
| Mean Household Income | 1,922 | $83,441 |
| Income Deficit | 1,118 | $9,275 |
| Wage / Income Gap (%) | 5,583 | 9.00% |
| Wage / Income Gap ($) | 5,583 | 91.00¢ per $1 |
| Gini / Inequality Index | 5,583 | 0.49 |
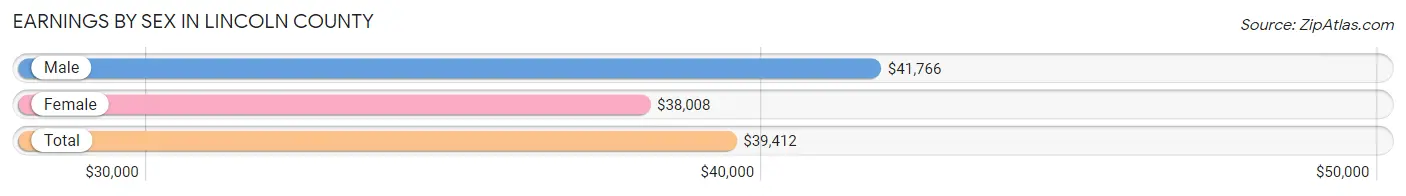
Earnings by Sex in Lincoln County
Average Earnings in Lincoln County are $39,412, $41,766 for men and $38,008 for women, a difference of 9.0%.
| Sex | Number | Average Earnings |
| Male | 1,241 (51.7%) | $41,766 |
| Female | 1,161 (48.3%) | $38,008 |
| Total | 2,402 (100.0%) | $39,412 |
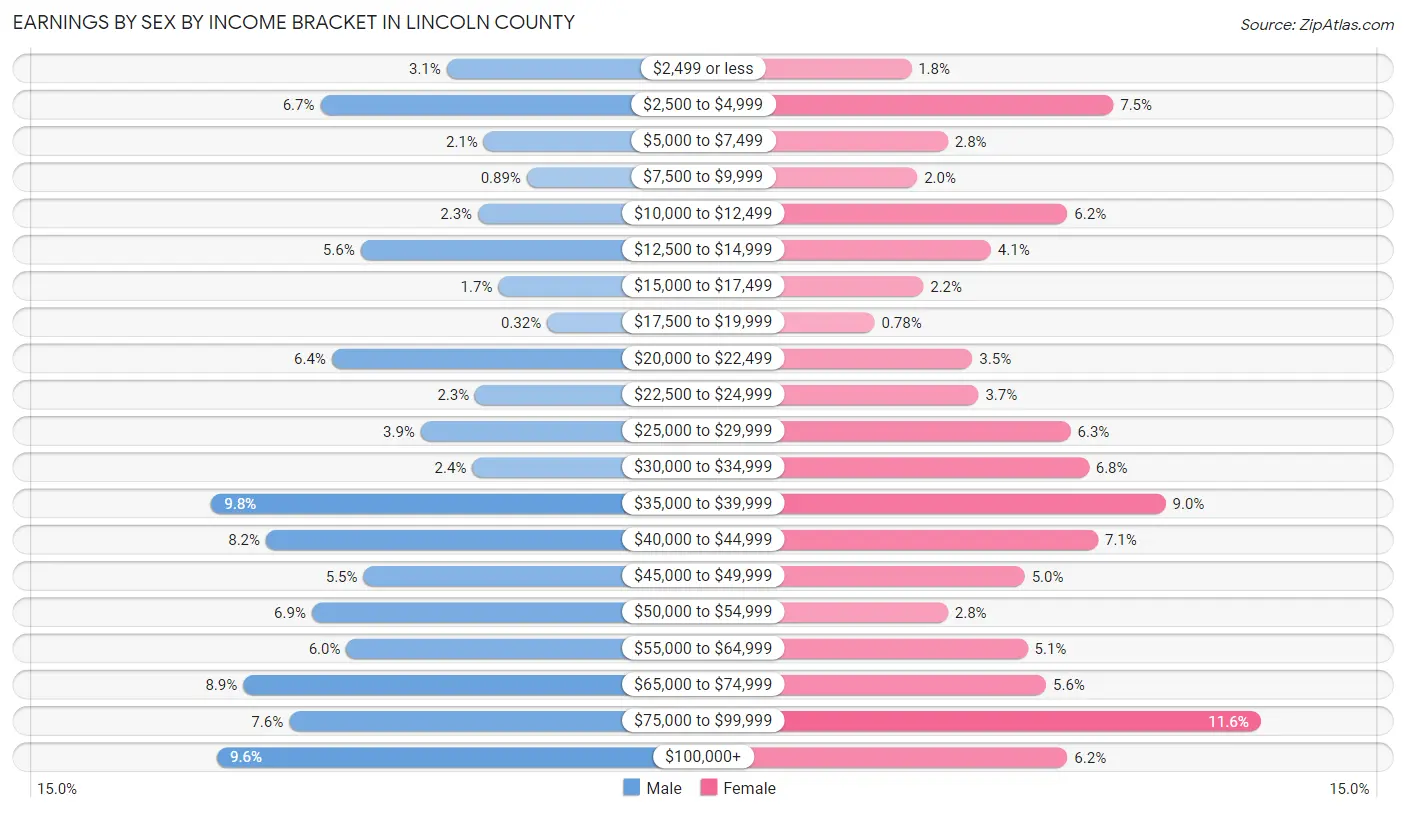
Earnings by Sex by Income Bracket in Lincoln County
The most common earnings brackets in Lincoln County are $35,000 to $39,999 for men (121 | 9.8%) and $75,000 to $99,999 for women (135 | 11.6%).
| Income | Male | Female |
| $2,499 or less | 39 (3.1%) | 21 (1.8%) |
| $2,500 to $4,999 | 83 (6.7%) | 87 (7.5%) |
| $5,000 to $7,499 | 26 (2.1%) | 33 (2.8%) |
| $7,500 to $9,999 | 11 (0.9%) | 23 (2.0%) |
| $10,000 to $12,499 | 28 (2.3%) | 72 (6.2%) |
| $12,500 to $14,999 | 69 (5.6%) | 47 (4.1%) |
| $15,000 to $17,499 | 21 (1.7%) | 25 (2.1%) |
| $17,500 to $19,999 | 4 (0.3%) | 9 (0.8%) |
| $20,000 to $22,499 | 79 (6.4%) | 41 (3.5%) |
| $22,500 to $24,999 | 29 (2.3%) | 43 (3.7%) |
| $25,000 to $29,999 | 48 (3.9%) | 73 (6.3%) |
| $30,000 to $34,999 | 30 (2.4%) | 79 (6.8%) |
| $35,000 to $39,999 | 121 (9.8%) | 104 (9.0%) |
| $40,000 to $44,999 | 102 (8.2%) | 82 (7.1%) |
| $45,000 to $49,999 | 68 (5.5%) | 58 (5.0%) |
| $50,000 to $54,999 | 86 (6.9%) | 33 (2.8%) |
| $55,000 to $64,999 | 74 (6.0%) | 59 (5.1%) |
| $65,000 to $74,999 | 110 (8.9%) | 65 (5.6%) |
| $75,000 to $99,999 | 94 (7.6%) | 135 (11.6%) |
| $100,000+ | 119 (9.6%) | 72 (6.2%) |
| Total | 1,241 (100.0%) | 1,161 (100.0%) |
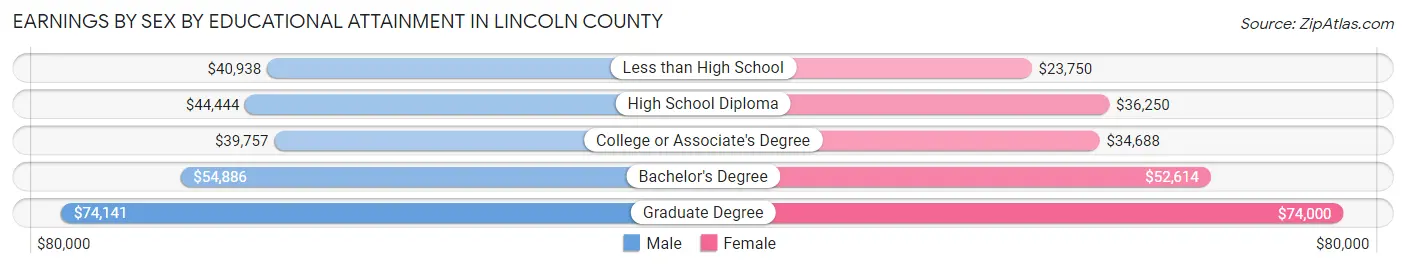
Earnings by Sex by Educational Attainment in Lincoln County
Average earnings in Lincoln County are $44,012 for men and $40,464 for women, a difference of 8.1%. Men with an educational attainment of graduate degree enjoy the highest average annual earnings of $74,141, while those with college or associate's degree education earn the least with $39,757. Women with an educational attainment of graduate degree earn the most with the average annual earnings of $74,000, while those with less than high school education have the smallest earnings of $23,750.
| Educational Attainment | Male Income | Female Income |
| Less than High School | $40,938 | $23,750 |
| High School Diploma | $44,444 | $36,250 |
| College or Associate's Degree | $39,757 | $34,688 |
| Bachelor's Degree | $54,886 | $52,614 |
| Graduate Degree | $74,141 | $74,000 |
| Total | $44,012 | $40,464 |
Family Income in Lincoln County
Family Income Brackets in Lincoln County
According to the Lincoln County family income data, there are 225 families falling into the $100,000 to $149,999 income range, which is the most common income bracket and makes up 20.1% of all families. Conversely, the $10,000 to $14,999 income bracket is the least frequent group with only 10 families (0.9%) belonging to this category.
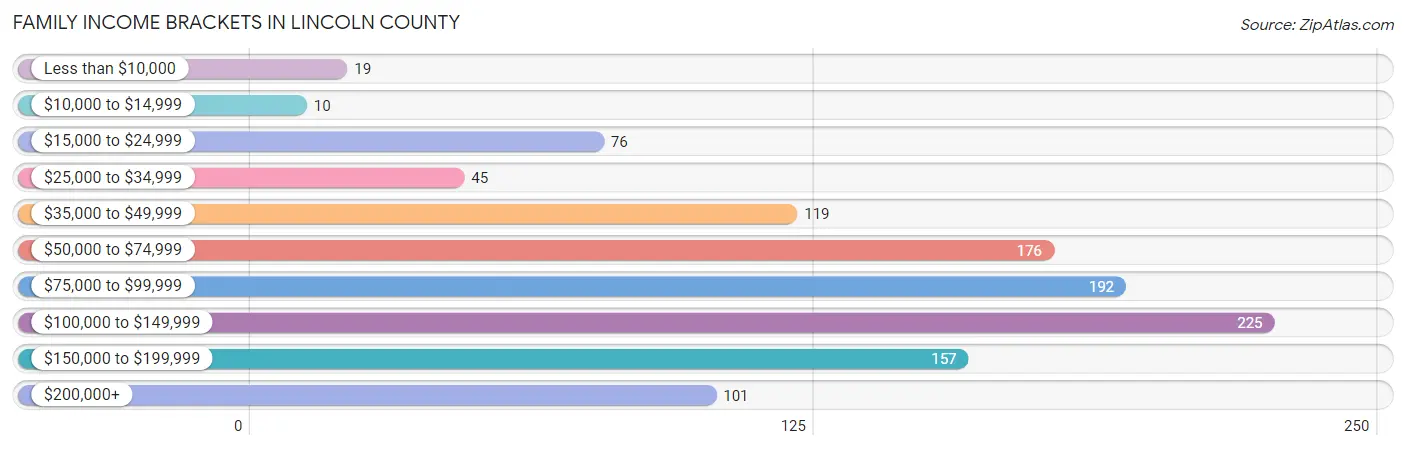
| Income Bracket | # Families | % Families |
| Less than $10,000 | 19 | 1.7% |
| $10,000 to $14,999 | 10 | 0.9% |
| $15,000 to $24,999 | 76 | 6.8% |
| $25,000 to $34,999 | 45 | 4.0% |
| $35,000 to $49,999 | 119 | 10.6% |
| $50,000 to $74,999 | 176 | 15.7% |
| $75,000 to $99,999 | 192 | 17.2% |
| $100,000 to $149,999 | 225 | 20.1% |
| $150,000 to $199,999 | 157 | 14.0% |
| $200,000+ | 101 | 9.0% |
Family Income by Famaliy Size in Lincoln County
7+ person families (51 | 4.6%) account for the highest median family income in Lincoln County with $116,058 per family, while 2-person families (603 | 53.9%) have the highest median income of $44,669 per family member.
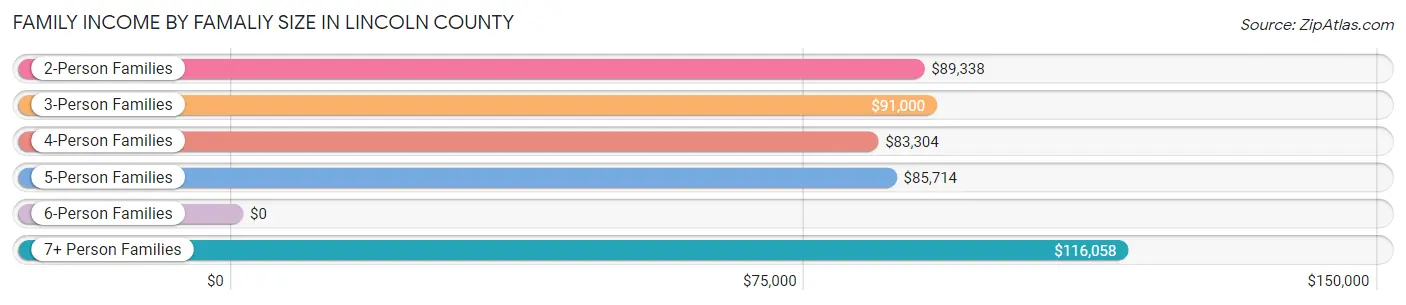
| Income Bracket | # Families | Median Income |
| 2-Person Families | 603 (53.9%) | $89,338 |
| 3-Person Families | 254 (22.7%) | $91,000 |
| 4-Person Families | 131 (11.7%) | $83,304 |
| 5-Person Families | 70 (6.3%) | $85,714 |
| 6-Person Families | 9 (0.8%) | $0 |
| 7+ Person Families | 51 (4.6%) | $116,058 |
| Total | 1,118 (100.0%) | $89,519 |
Family Income by Number of Earners in Lincoln County
The median family income in Lincoln County is $89,519, with families comprising 3+ earners (146) having the highest median family income of $120,625, while families with no earners (111) have the lowest median family income of $47,125, accounting for 13.1% and 9.9% of families, respectively.
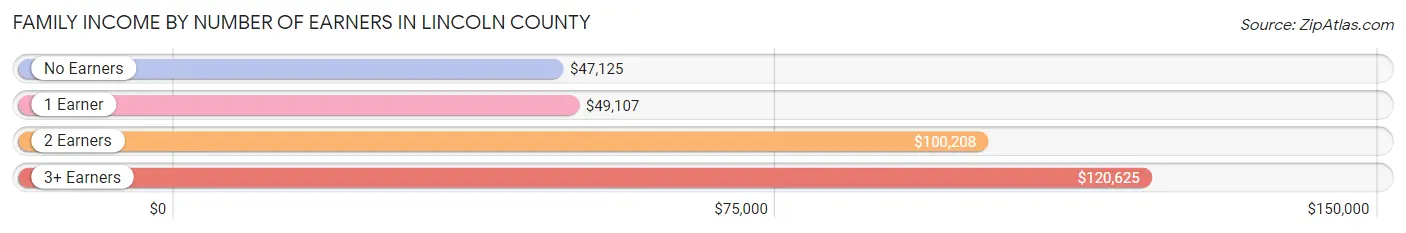
| Number of Earners | # Families | Median Income |
| No Earners | 111 (9.9%) | $47,125 |
| 1 Earner | 242 (21.6%) | $49,107 |
| 2 Earners | 619 (55.4%) | $100,208 |
| 3+ Earners | 146 (13.1%) | $120,625 |
| Total | 1,118 (100.0%) | $89,519 |
Household Income in Lincoln County
Household Income Brackets in Lincoln County
With 284 households falling in the category, the $100,000 to $149,999 income range is the most frequent in Lincoln County, accounting for 14.8% of all households. In contrast, only 110 households (5.7%) fall into the $200,000+ income bracket, making it the least populous group.
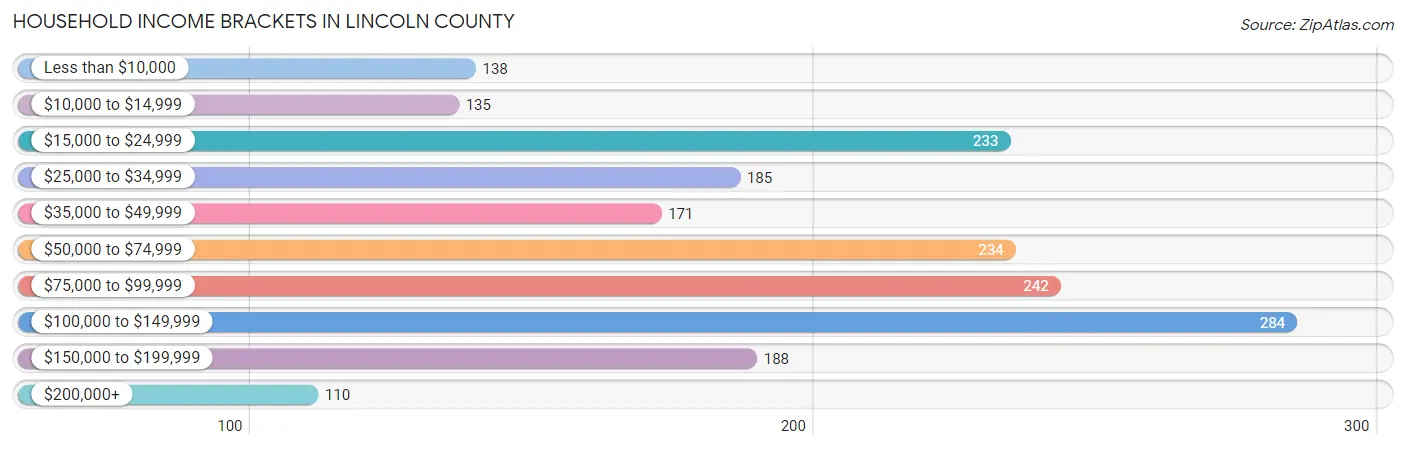
| Income Bracket | # Households | % Households |
| Less than $10,000 | 138 | 7.2% |
| $10,000 to $14,999 | 135 | 7.0% |
| $15,000 to $24,999 | 233 | 12.1% |
| $25,000 to $34,999 | 185 | 9.6% |
| $35,000 to $49,999 | 171 | 8.9% |
| $50,000 to $74,999 | 234 | 12.2% |
| $75,000 to $99,999 | 242 | 12.6% |
| $100,000 to $149,999 | 284 | 14.8% |
| $150,000 to $199,999 | 188 | 9.8% |
| $200,000+ | 110 | 5.7% |
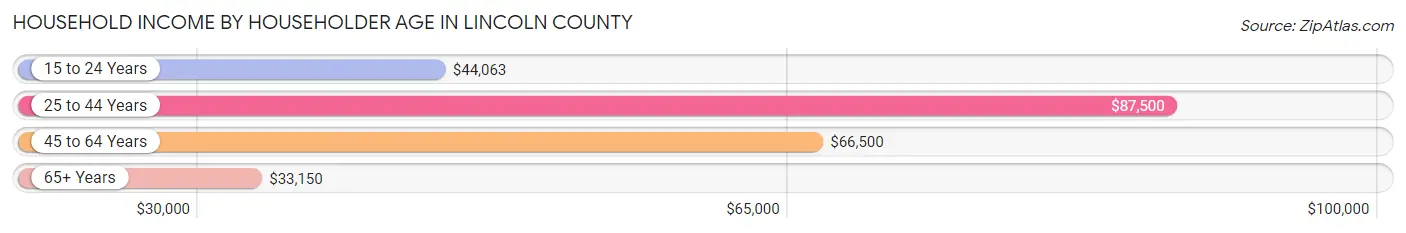
Household Income by Householder Age in Lincoln County
The median household income in Lincoln County is $59,167, with the highest median household income of $87,500 found in the 25 to 44 years age bracket for the primary householder. A total of 510 households (26.5%) fall into this category. Meanwhile, the 65+ years age bracket for the primary householder has the lowest median household income of $33,150, with 645 households (33.6%) in this group.
| Income Bracket | # Households | Median Income |
| 15 to 24 Years | 91 (4.7%) | $44,063 |
| 25 to 44 Years | 510 (26.5%) | $87,500 |
| 45 to 64 Years | 676 (35.2%) | $66,500 |
| 65+ Years | 645 (33.6%) | $33,150 |
| Total | 1,922 (100.0%) | $59,167 |
Poverty in Lincoln County
Income Below Poverty by Sex and Age in Lincoln County
With 10.6% poverty level for males and 12.6% for females among the residents of Lincoln County, 18 to 24 year old males and 75 year old and over females are the most vulnerable to poverty, with 38 males (23.0%) and 56 females (23.6%) in their respective age groups living below the poverty level.
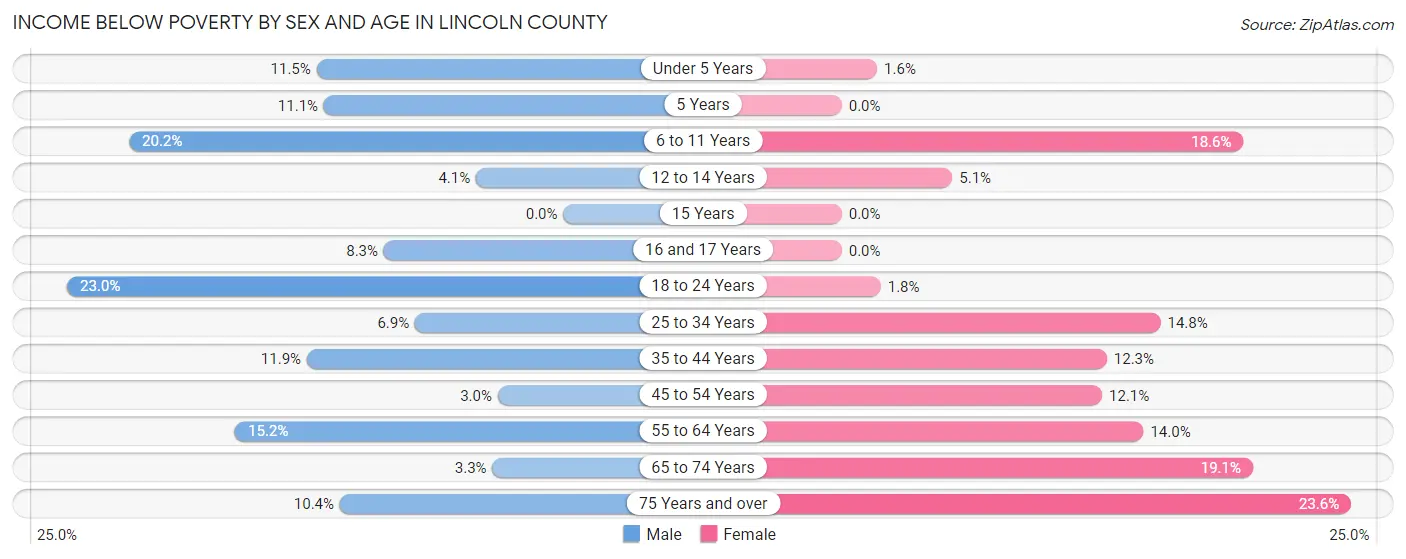
| Age Bracket | Male | Female |
| Under 5 Years | 15 (11.5%) | 2 (1.6%) |
| 5 Years | 3 (11.1%) | 0 (0.0%) |
| 6 to 11 Years | 27 (20.2%) | 19 (18.6%) |
| 12 to 14 Years | 3 (4.1%) | 6 (5.1%) |
| 15 Years | 0 (0.0%) | 0 (0.0%) |
| 16 and 17 Years | 4 (8.3%) | 0 (0.0%) |
| 18 to 24 Years | 38 (23.0%) | 3 (1.8%) |
| 25 to 34 Years | 19 (6.9%) | 38 (14.8%) |
| 35 to 44 Years | 20 (11.9%) | 31 (12.3%) |
| 45 to 54 Years | 8 (3.0%) | 29 (12.1%) |
| 55 to 64 Years | 53 (15.2%) | 42 (14.0%) |
| 65 to 74 Years | 7 (3.3%) | 45 (19.1%) |
| 75 Years and over | 17 (10.4%) | 56 (23.6%) |
| Total | 214 (10.6%) | 271 (12.6%) |
Income Above Poverty by Sex and Age in Lincoln County
According to the poverty statistics in Lincoln County, males aged 15 years and females aged 5 years are the age groups that are most secure financially, with 100.0% of males and 100.0% of females in these age groups living above the poverty line.
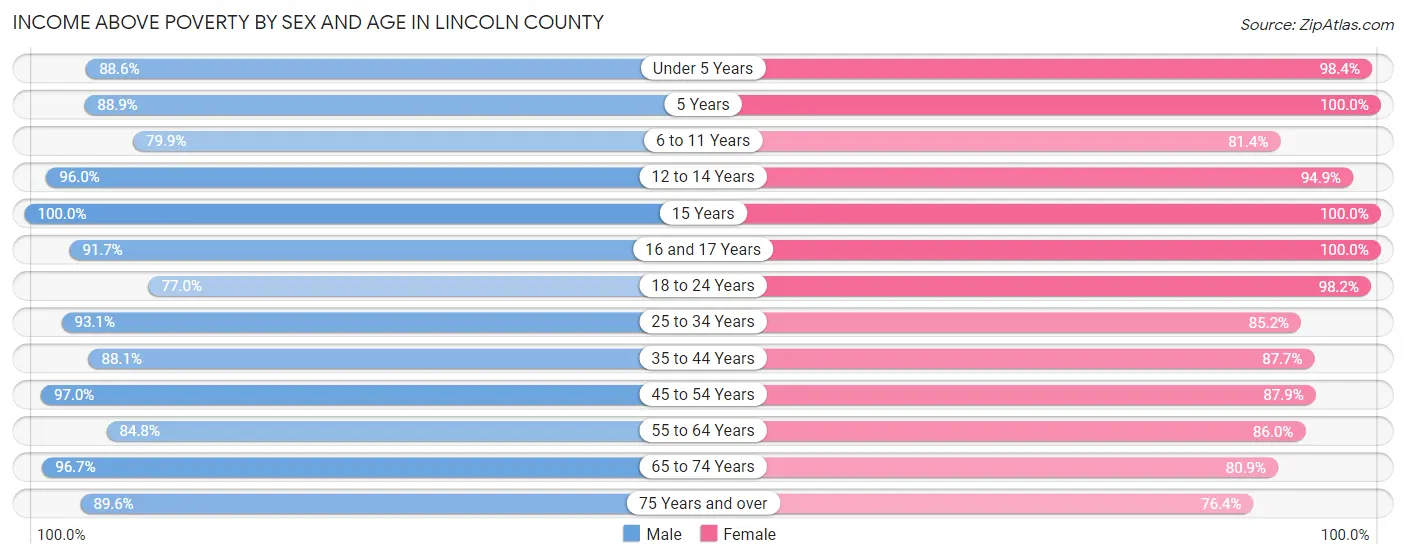
| Age Bracket | Male | Female |
| Under 5 Years | 116 (88.5%) | 120 (98.4%) |
| 5 Years | 24 (88.9%) | 9 (100.0%) |
| 6 to 11 Years | 107 (79.8%) | 83 (81.4%) |
| 12 to 14 Years | 71 (96.0%) | 111 (94.9%) |
| 15 Years | 16 (100.0%) | 64 (100.0%) |
| 16 and 17 Years | 44 (91.7%) | 55 (100.0%) |
| 18 to 24 Years | 127 (77.0%) | 163 (98.2%) |
| 25 to 34 Years | 257 (93.1%) | 219 (85.2%) |
| 35 to 44 Years | 148 (88.1%) | 221 (87.7%) |
| 45 to 54 Years | 255 (97.0%) | 211 (87.9%) |
| 55 to 64 Years | 295 (84.8%) | 258 (86.0%) |
| 65 to 74 Years | 206 (96.7%) | 191 (80.9%) |
| 75 Years and over | 147 (89.6%) | 181 (76.4%) |
| Total | 1,813 (89.4%) | 1,886 (87.4%) |
Income Below Poverty Among Married-Couple Families in Lincoln County
The poverty statistics for married-couple families in Lincoln County show that 3.6% or 34 of the total 940 families live below the poverty line. Families with 3 or 4 children have the highest poverty rate of 22.0%, comprising of 9 families. On the other hand, families with 5 or more children have the lowest poverty rate of 0.0%, which includes 0 families.
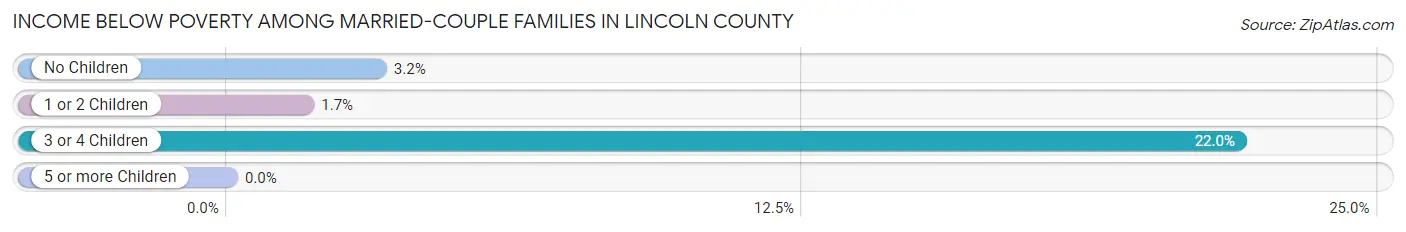
| Children | Above Poverty | Below Poverty |
| No Children | 658 (96.8%) | 22 (3.2%) |
| 1 or 2 Children | 178 (98.3%) | 3 (1.7%) |
| 3 or 4 Children | 32 (78.0%) | 9 (22.0%) |
| 5 or more Children | 38 (100.0%) | 0 (0.0%) |
| Total | 906 (96.4%) | 34 (3.6%) |
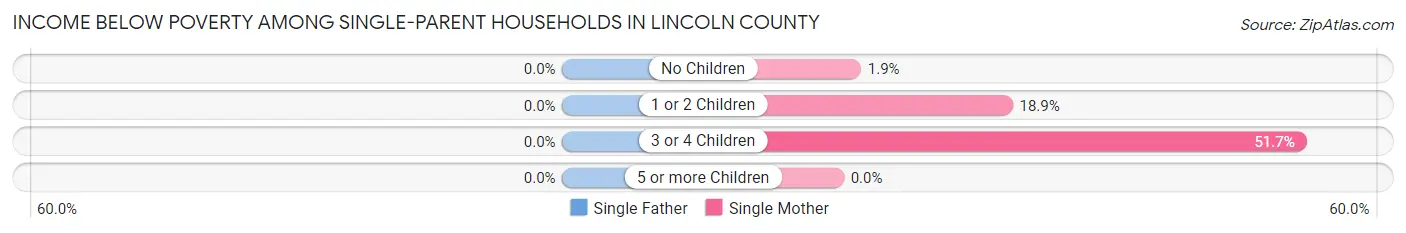
Income Below Poverty Among Single-Parent Households in Lincoln County
| Children | Single Father | Single Mother |
| No Children | 0 (0.0%) | 1 (1.9%) |
| 1 or 2 Children | 0 (0.0%) | 10 (18.9%) |
| 3 or 4 Children | 0 (0.0%) | 15 (51.7%) |
| 5 or more Children | 0 (0.0%) | 0 (0.0%) |
| Total | 0 (0.0%) | 26 (19.4%) |
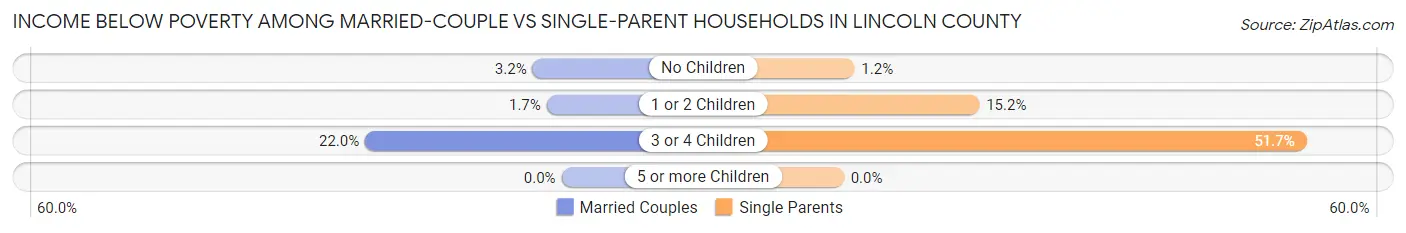
Income Below Poverty Among Married-Couple vs Single-Parent Households in Lincoln County
The poverty data for Lincoln County shows that 34 of the married-couple family households (3.6%) and 26 of the single-parent households (14.6%) are living below the poverty level. Within the married-couple family households, those with 3 or 4 children have the highest poverty rate, with 9 households (22.0%) falling below the poverty line. Among the single-parent households, those with 3 or 4 children have the highest poverty rate, with 15 household (51.7%) living below poverty.
| Children | Married-Couple Families | Single-Parent Households |
| No Children | 22 (3.2%) | 1 (1.2%) |
| 1 or 2 Children | 3 (1.7%) | 10 (15.1%) |
| 3 or 4 Children | 9 (22.0%) | 15 (51.7%) |
| 5 or more Children | 0 (0.0%) | 0 (0.0%) |
| Total | 34 (3.6%) | 26 (14.6%) |
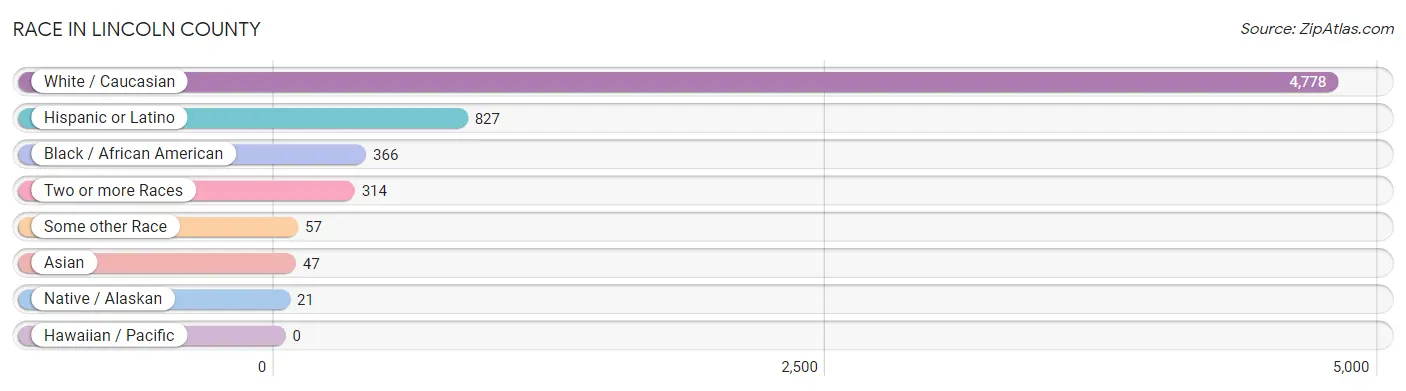
Race in Lincoln County
The most populous races in Lincoln County are White / Caucasian (4,778 | 85.6%), Hispanic or Latino (827 | 14.8%), and Black / African American (366 | 6.6%).
| Race | # Population | % Population |
| Asian | 47 | 0.8% |
| Black / African American | 366 | 6.6% |
| Hawaiian / Pacific | 0 | 0.0% |
| Hispanic or Latino | 827 | 14.8% |
| Native / Alaskan | 21 | 0.4% |
| White / Caucasian | 4,778 | 85.6% |
| Two or more Races | 314 | 5.6% |
| Some other Race | 57 | 1.0% |
| Total | 5,583 | 100.0% |
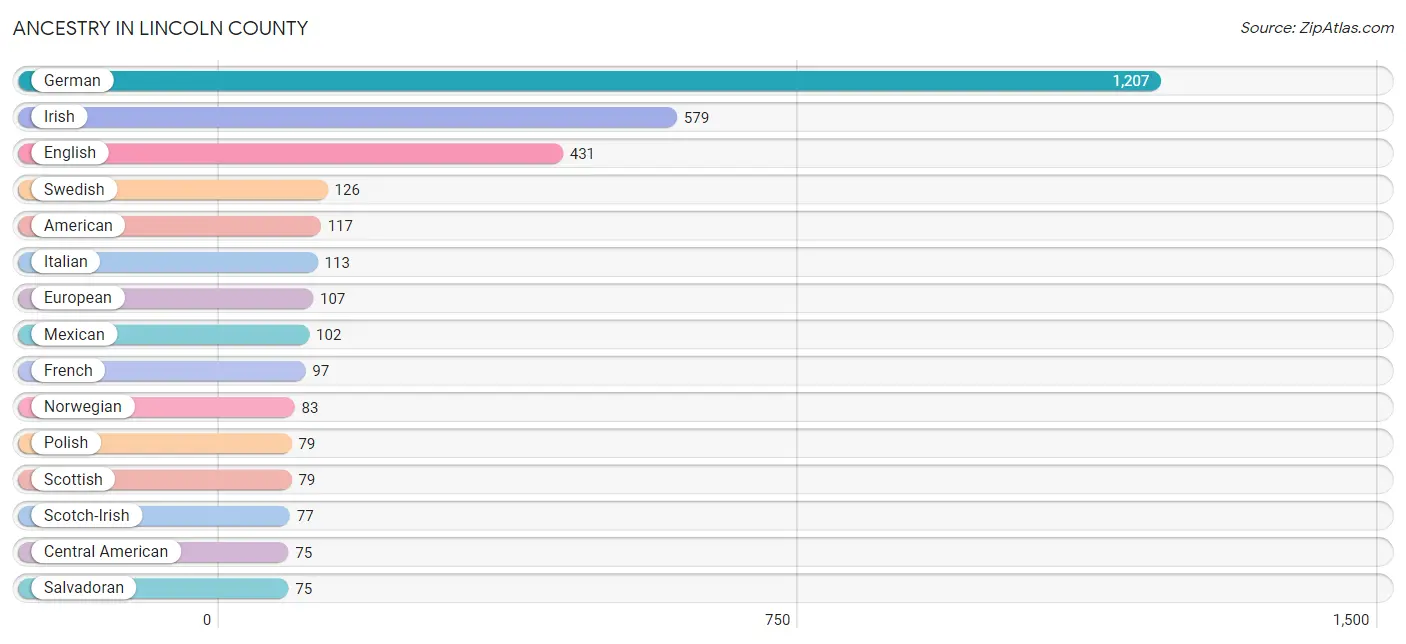
Ancestry in Lincoln County
The most populous ancestries reported in Lincoln County are German (1,207 | 21.6%), Irish (579 | 10.4%), English (431 | 7.7%), Swedish (126 | 2.3%), and American (117 | 2.1%), together accounting for 44.1% of all Lincoln County residents.
| Ancestry | # Population | % Population |
| American | 117 | 2.1% |
| Arab | 4 | 0.1% |
| Austrian | 7 | 0.1% |
| Bhutanese | 5 | 0.1% |
| Blackfeet | 2 | 0.0% |
| Brazilian | 2 | 0.0% |
| British | 21 | 0.4% |
| Cajun | 1 | 0.0% |
| Canadian | 4 | 0.1% |
| Central American | 75 | 1.3% |
| Czech | 33 | 0.6% |
| Czechoslovakian | 3 | 0.1% |
| Danish | 74 | 1.3% |
| Dutch | 73 | 1.3% |
| English | 431 | 7.7% |
| European | 107 | 1.9% |
| French | 97 | 1.7% |
| French Canadian | 10 | 0.2% |
| German | 1,207 | 21.6% |
| Greek | 5 | 0.1% |
| Hungarian | 3 | 0.1% |
| Indian (Asian) | 9 | 0.2% |
| Irish | 579 | 10.4% |
| Italian | 113 | 2.0% |
| Lebanese | 4 | 0.1% |
| Mexican | 102 | 1.8% |
| Native Hawaiian | 5 | 0.1% |
| Northern European | 9 | 0.2% |
| Norwegian | 83 | 1.5% |
| Pennsylvania German | 1 | 0.0% |
| Polish | 79 | 1.4% |
| Portuguese | 9 | 0.2% |
| Romanian | 16 | 0.3% |
| Russian | 56 | 1.0% |
| Salvadoran | 75 | 1.3% |
| Scandinavian | 17 | 0.3% |
| Scotch-Irish | 77 | 1.4% |
| Scottish | 79 | 1.4% |
| Slovak | 5 | 0.1% |
| Spaniard | 26 | 0.5% |
| Spanish | 14 | 0.3% |
| Sri Lankan | 43 | 0.8% |
| Swedish | 126 | 2.3% |
| Swiss | 17 | 0.3% |
| Ukrainian | 4 | 0.1% |
| Welsh | 50 | 0.9% | View All 46 Rows |
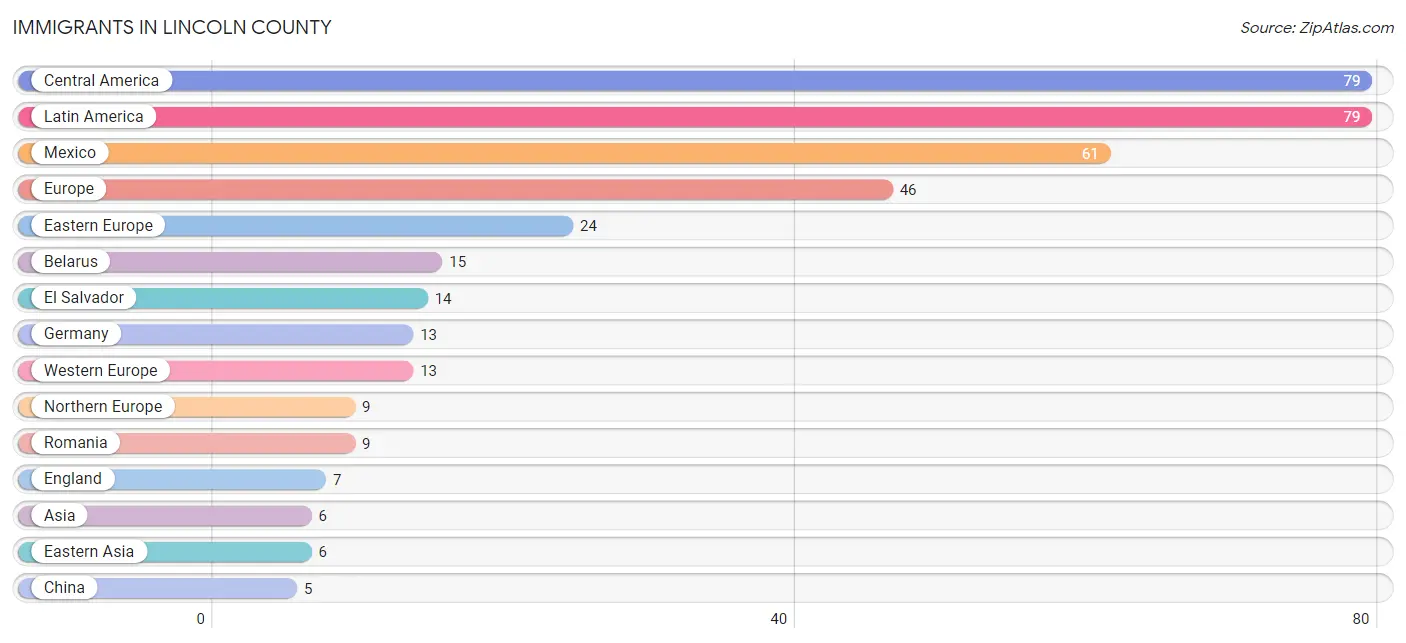
Immigrants in Lincoln County
The most numerous immigrant groups reported in Lincoln County came from Central America (79 | 1.4%), Latin America (79 | 1.4%), Mexico (61 | 1.1%), Europe (46 | 0.8%), and Eastern Europe (24 | 0.4%), together accounting for 5.2% of all Lincoln County residents.
| Immigration Origin | # Population | % Population |
| Africa | 2 | 0.0% |
| Asia | 6 | 0.1% |
| Belarus | 15 | 0.3% |
| Canada | 4 | 0.1% |
| Central America | 79 | 1.4% |
| China | 5 | 0.1% |
| Eastern Asia | 6 | 0.1% |
| Eastern Europe | 24 | 0.4% |
| El Salvador | 14 | 0.3% |
| England | 7 | 0.1% |
| Europe | 46 | 0.8% |
| Germany | 13 | 0.2% |
| Japan | 1 | 0.0% |
| Latin America | 79 | 1.4% |
| Mexico | 61 | 1.1% |
| Nicaragua | 4 | 0.1% |
| Northern Europe | 9 | 0.2% |
| Romania | 9 | 0.2% |
| South Africa | 2 | 0.0% |
| Western Europe | 13 | 0.2% | View All 20 Rows |
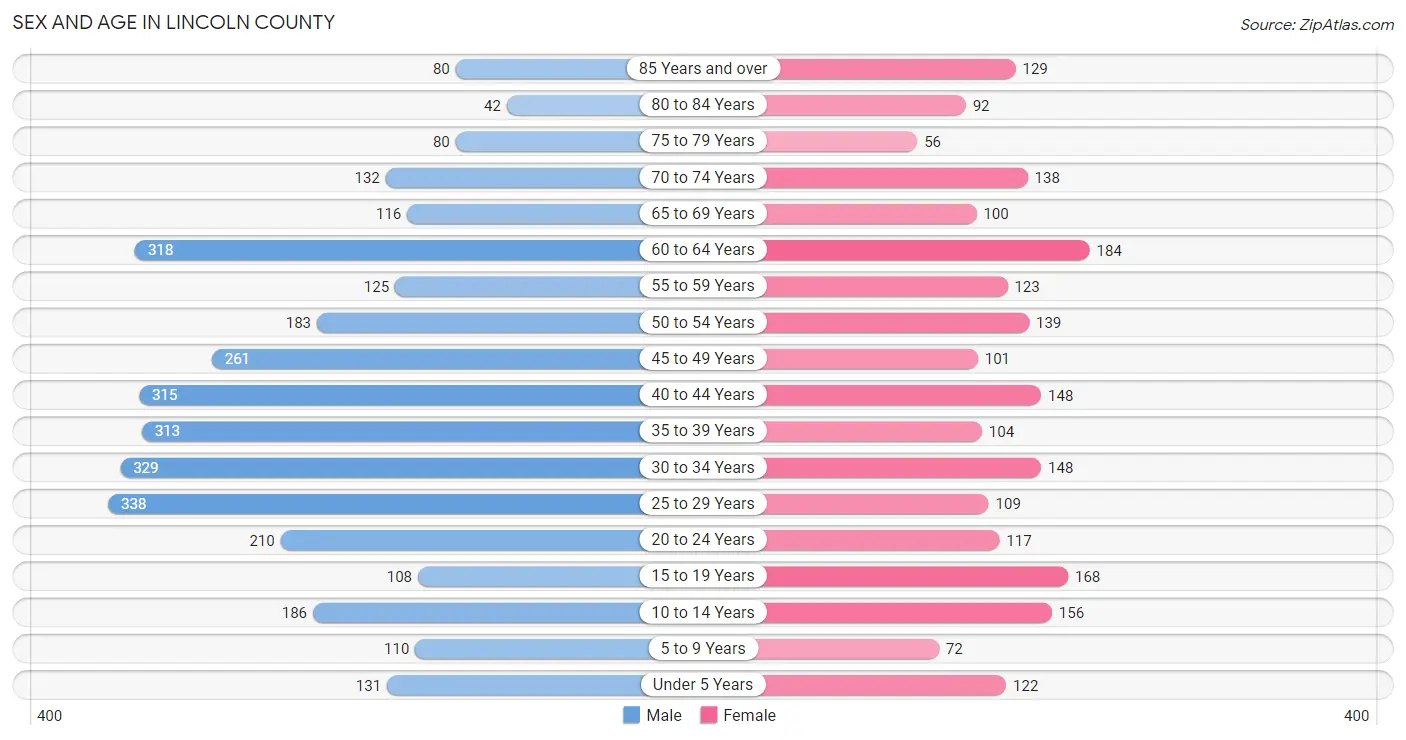
Sex and Age in Lincoln County
Sex and Age in Lincoln County
The most populous age groups in Lincoln County are 25 to 29 Years (338 | 10.0%) for men and 60 to 64 Years (184 | 8.3%) for women.
| Age Bracket | Male | Female |
| Under 5 Years | 131 (3.9%) | 122 (5.5%) |
| 5 to 9 Years | 110 (3.3%) | 72 (3.3%) |
| 10 to 14 Years | 186 (5.5%) | 156 (7.1%) |
| 15 to 19 Years | 108 (3.2%) | 168 (7.6%) |
| 20 to 24 Years | 210 (6.2%) | 117 (5.3%) |
| 25 to 29 Years | 338 (10.0%) | 109 (4.9%) |
| 30 to 34 Years | 329 (9.7%) | 148 (6.7%) |
| 35 to 39 Years | 313 (9.3%) | 104 (4.7%) |
| 40 to 44 Years | 315 (9.3%) | 148 (6.7%) |
| 45 to 49 Years | 261 (7.7%) | 101 (4.6%) |
| 50 to 54 Years | 183 (5.4%) | 139 (6.3%) |
| 55 to 59 Years | 125 (3.7%) | 123 (5.6%) |
| 60 to 64 Years | 318 (9.4%) | 184 (8.3%) |
| 65 to 69 Years | 116 (3.4%) | 100 (4.5%) |
| 70 to 74 Years | 132 (3.9%) | 138 (6.3%) |
| 75 to 79 Years | 80 (2.4%) | 56 (2.5%) |
| 80 to 84 Years | 42 (1.2%) | 92 (4.2%) |
| 85 Years and over | 80 (2.4%) | 129 (5.9%) |
| Total | 3,377 (100.0%) | 2,206 (100.0%) |
Families and Households in Lincoln County
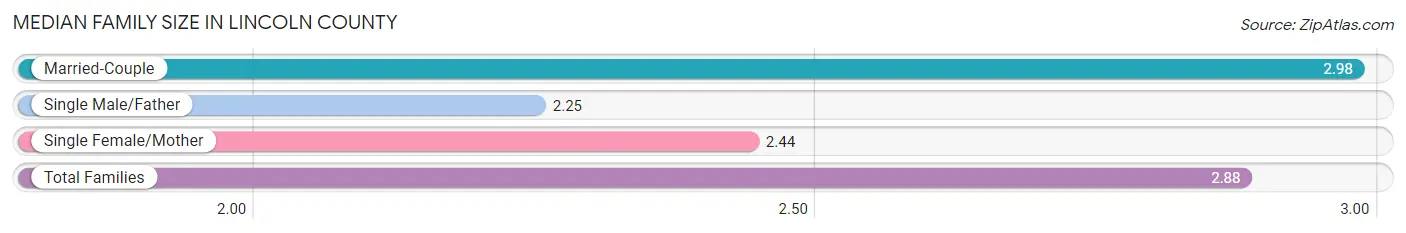
Median Family Size in Lincoln County
The median family size in Lincoln County is 2.88 persons per family, with married-couple families (940 | 84.1%) accounting for the largest median family size of 2.98 persons per family. On the other hand, single male/father families (44 | 3.9%) represent the smallest median family size with 2.25 persons per family.
| Family Type | # Families | Family Size |
| Married-Couple | 940 (84.1%) | 2.98 |
| Single Male/Father | 44 (3.9%) | 2.25 |
| Single Female/Mother | 134 (12.0%) | 2.44 |
| Total Families | 1,118 (100.0%) | 2.88 |
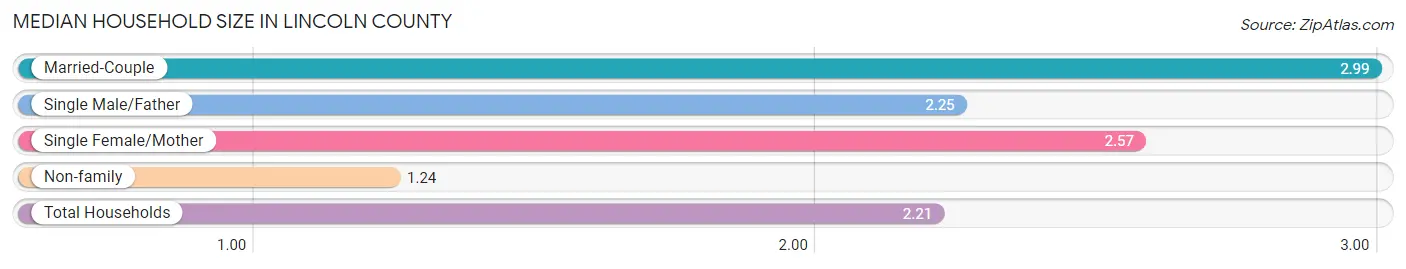
Median Household Size in Lincoln County
The median household size in Lincoln County is 2.21 persons per household, with married-couple households (940 | 48.9%) accounting for the largest median household size of 2.99 persons per household. non-family households (804 | 41.8%) represent the smallest median household size with 1.24 persons per household.
| Household Type | # Households | Household Size |
| Married-Couple | 940 (48.9%) | 2.99 |
| Single Male/Father | 44 (2.3%) | 2.25 |
| Single Female/Mother | 134 (7.0%) | 2.57 |
| Non-family | 804 (41.8%) | 1.24 |
| Total Households | 1,922 (100.0%) | 2.21 |
Household Size by Marriage Status in Lincoln County
Out of a total of 1,922 households in Lincoln County, 1,118 (58.2%) are family households, while 804 (41.8%) are nonfamily households. The most numerous type of family households are 2-person households, comprising 591, and the most common type of nonfamily households are 1-person households, comprising 701.
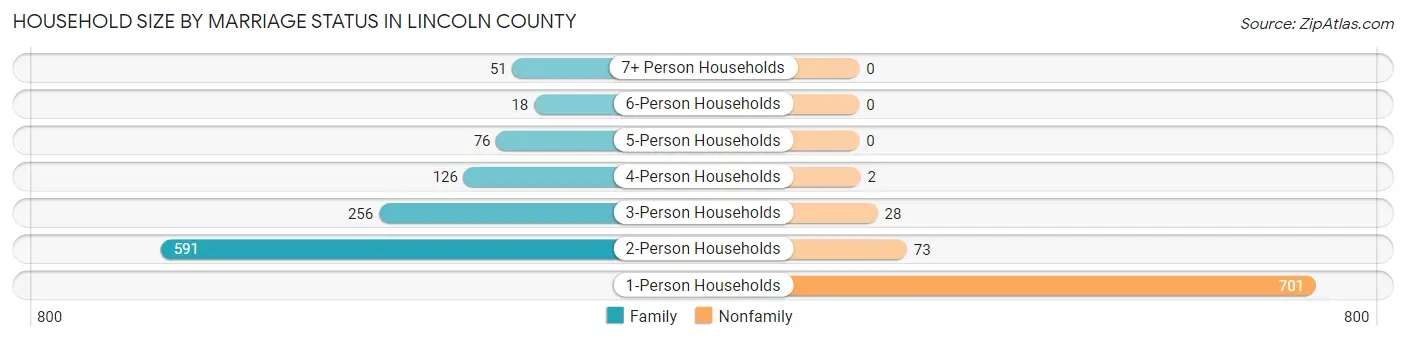
| Household Size | Family Households | Nonfamily Households |
| 1-Person Households | - | 701 (36.5%) |
| 2-Person Households | 591 (30.7%) | 73 (3.8%) |
| 3-Person Households | 256 (13.3%) | 28 (1.5%) |
| 4-Person Households | 126 (6.6%) | 2 (0.1%) |
| 5-Person Households | 76 (4.0%) | 0 (0.0%) |
| 6-Person Households | 18 (0.9%) | 0 (0.0%) |
| 7+ Person Households | 51 (2.6%) | 0 (0.0%) |
| Total | 1,118 (58.2%) | 804 (41.8%) |
Female Fertility in Lincoln County
Fertility by Age in Lincoln County
Average fertility rate in Lincoln County is 46.0 births per 1,000 women. Women in the age bracket of 20 to 34 years have the highest fertility rate with 110.0 births per 1,000 women. Women in the age bracket of 20 to 34 years acount for 95.4% of all women with births.
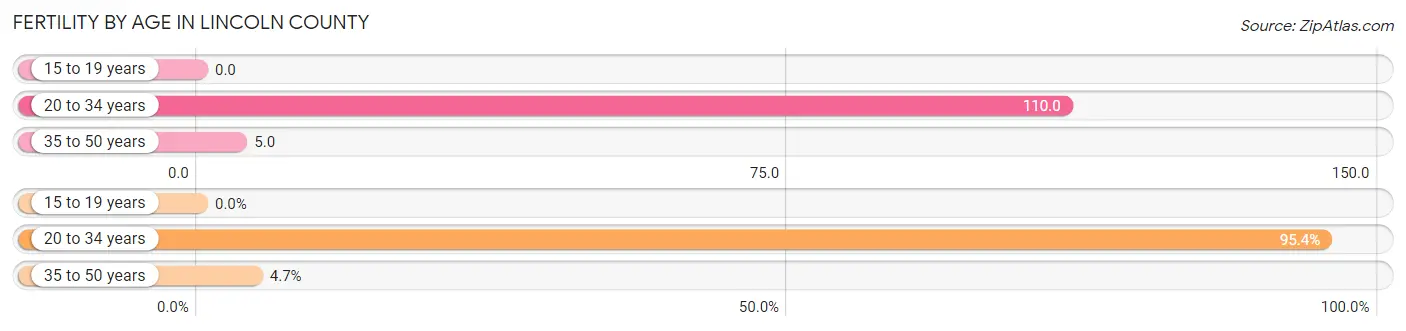
| Age Bracket | Women with Births | Births / 1,000 Women |
| 15 to 19 years | 0 (0.0%) | 0.0 |
| 20 to 34 years | 41 (95.4%) | 110.0 |
| 35 to 50 years | 2 (4.6%) | 5.0 |
| Total | 43 (100.0%) | 46.0 |
Fertility by Age by Marriage Status in Lincoln County
81.4% of women with births (43) in Lincoln County are married. The highest percentage of unmarried women with births falls into 20 to 34 years age bracket with 19.5% of them unmarried at the time of birth, while the lowest percentage of unmarried women with births belong to 35 to 50 years age bracket with 0.0% of them unmarried.
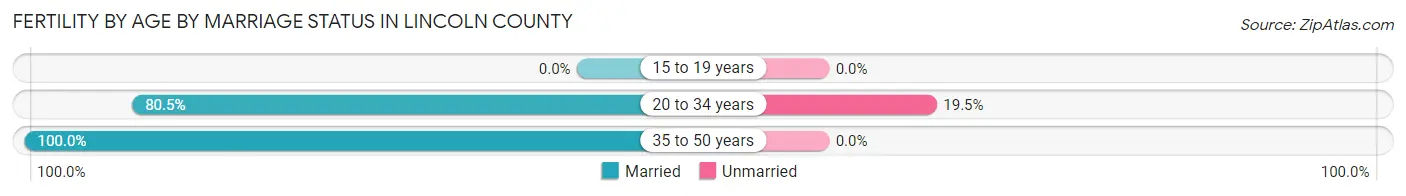
| Age Bracket | Married | Unmarried |
| 15 to 19 years | 0 (0.0%) | 0 (0.0%) |
| 20 to 34 years | 33 (80.5%) | 8 (19.5%) |
| 35 to 50 years | 2 (100.0%) | 0 (0.0%) |
| Total | 35 (81.4%) | 8 (18.6%) |
Fertility by Education in Lincoln County
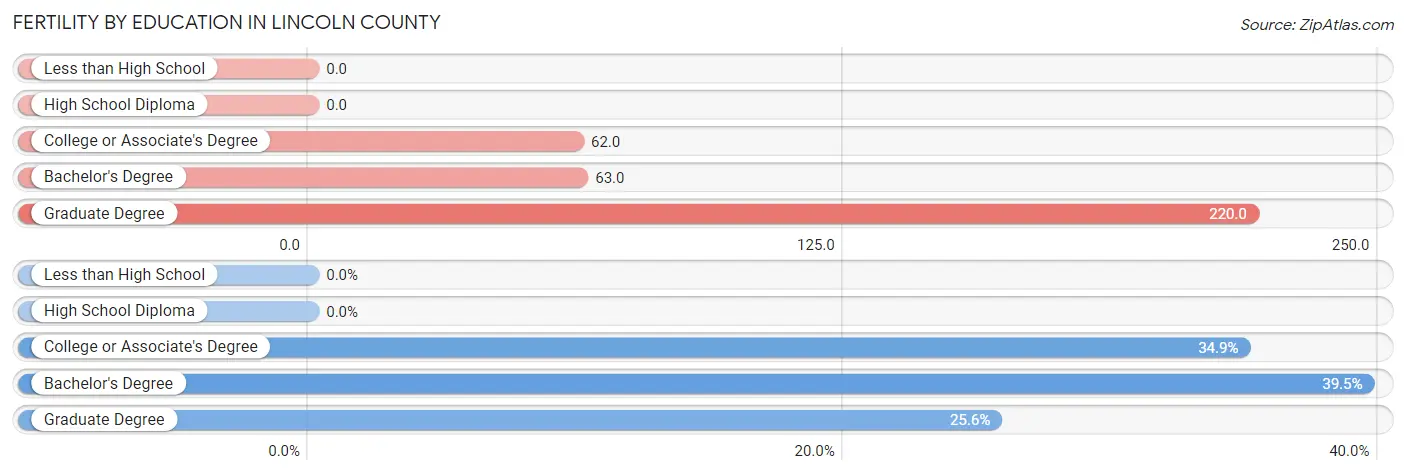
| Educational Attainment | Women with Births | Births / 1,000 Women |
| Less than High School | 0 (0.0%) | 0.0 |
| High School Diploma | 0 (0.0%) | 0.0 |
| College or Associate's Degree | 15 (34.9%) | 62.0 |
| Bachelor's Degree | 17 (39.5%) | 63.0 |
| Graduate Degree | 11 (25.6%) | 220.0 |
| Total | 43 (100.0%) | 46.0 |
Fertility by Education by Marriage Status in Lincoln County
18.6% of women with births in Lincoln County are unmarried. Women with the educational attainment of college or associate's degree are most likely to be married with 100.0% of them married at childbirth, while women with the educational attainment of graduate degree are least likely to be married with 72.7% of them unmarried at childbirth.
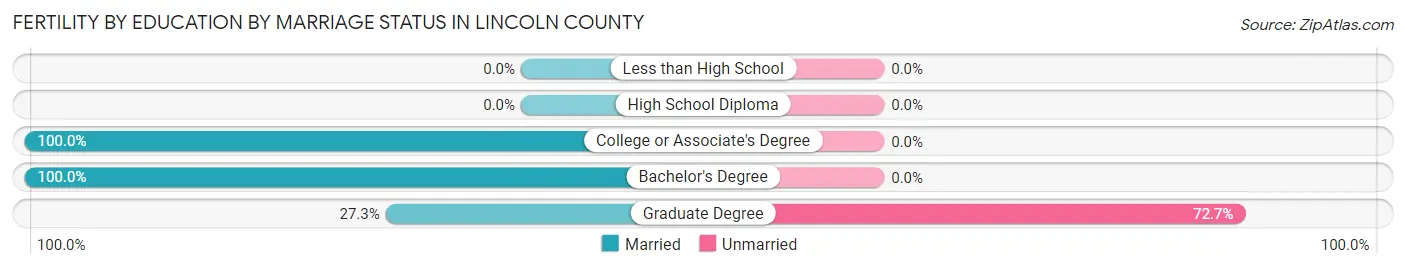
| Educational Attainment | Married | Unmarried |
| Less than High School | 0 (0.0%) | 0 (0.0%) |
| High School Diploma | 0 (0.0%) | 0 (0.0%) |
| College or Associate's Degree | 15 (100.0%) | 0 (0.0%) |
| Bachelor's Degree | 17 (100.0%) | 0 (0.0%) |
| Graduate Degree | 3 (27.3%) | 8 (72.7%) |
| Total | 35 (81.4%) | 8 (18.6%) |
Employment Characteristics in Lincoln County
Employment by Class of Employer in Lincoln County
Among the 2,169 employed individuals in Lincoln County, private company employees (1,089 | 50.2%), self-employed (not incorporated) (335 | 15.4%), and local government employees (233 | 10.7%) make up the most common classes of employment.
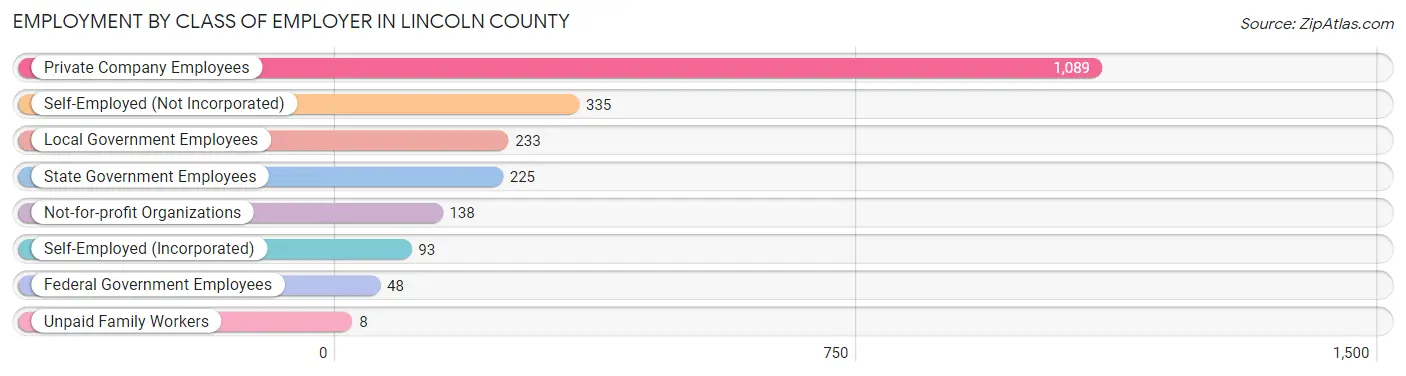
| Employer Class | # Employees | % Employees |
| Private Company Employees | 1,089 | 50.2% |
| Self-Employed (Incorporated) | 93 | 4.3% |
| Self-Employed (Not Incorporated) | 335 | 15.4% |
| Not-for-profit Organizations | 138 | 6.4% |
| Local Government Employees | 233 | 10.7% |
| State Government Employees | 225 | 10.4% |
| Federal Government Employees | 48 | 2.2% |
| Unpaid Family Workers | 8 | 0.4% |
| Total | 2,169 | 100.0% |
Employment Status by Age in Lincoln County
According to the labor force statistics for Lincoln County, out of the total population over 16 years of age (4,726), 47.3% or 2,235 individuals are in the labor force, with 2.3% or 51 of them unemployed. The age group with the highest labor force participation rate is 20 to 24 years, with 73.7% or 241 individuals in the labor force. Within the labor force, the 60 to 64 years age range has the highest percentage of unemployed individuals, with 8.4% or 24 of them being unemployed.
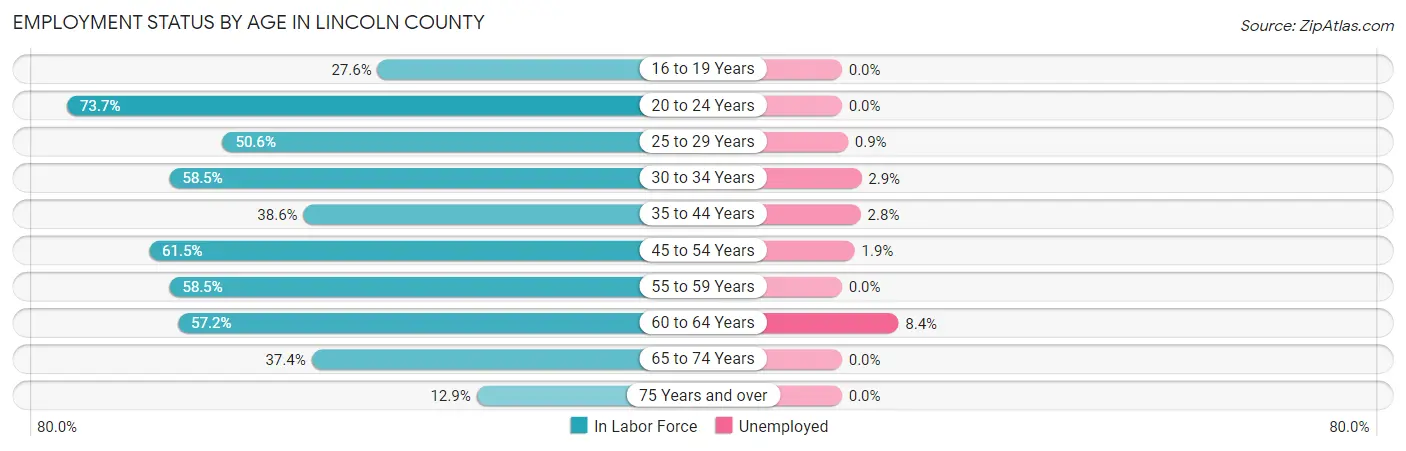
| Age Bracket | In Labor Force | Unemployed |
| 16 to 19 Years | 54 (27.6%) | 0 (0.0%) |
| 20 to 24 Years | 241 (73.7%) | 0 (0.0%) |
| 25 to 29 Years | 226 (50.6%) | 2 (0.9%) |
| 30 to 34 Years | 279 (58.5%) | 8 (2.9%) |
| 35 to 44 Years | 340 (38.6%) | 10 (2.8%) |
| 45 to 54 Years | 421 (61.5%) | 8 (1.9%) |
| 55 to 59 Years | 145 (58.5%) | 0 (0.0%) |
| 60 to 64 Years | 287 (57.2%) | 24 (8.4%) |
| 65 to 74 Years | 182 (37.4%) | 0 (0.0%) |
| 75 Years and over | 62 (12.9%) | 0 (0.0%) |
| Total | 2,235 (47.3%) | 51 (2.3%) |
Employment Status by Educational Attainment in Lincoln County
According to labor force statistics for Lincoln County, 52.4% of individuals (1,697) out of the total population between 25 and 64 years of age (3,238) are in the labor force, with 3.0% or 51 of them being unemployed. The group with the highest labor force participation rate are those with the educational attainment of bachelor's degree or higher, with 81.4% or 587 individuals in the labor force. Within the labor force, individuals with college / associate degree education have the highest percentage of unemployment, with 6.1% or 34 of them being unemployed.
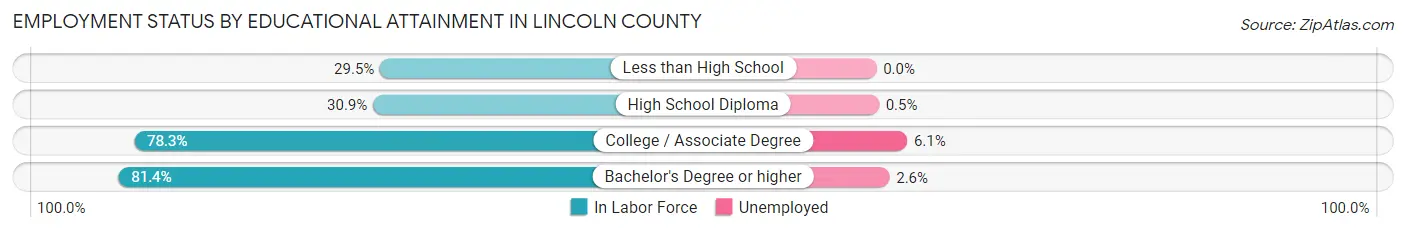
| Educational Attainment | In Labor Force | Unemployed |
| Less than High School | 113 (29.5%) | 0 (0.0%) |
| High School Diploma | 439 (30.9%) | 7 (0.5%) |
| College / Associate Degree | 559 (78.3%) | 44 (6.1%) |
| Bachelor's Degree or higher | 587 (81.4%) | 19 (2.6%) |
| Total | 1,697 (52.4%) | 97 (3.0%) |
Employment Occupations by Sex in Lincoln County
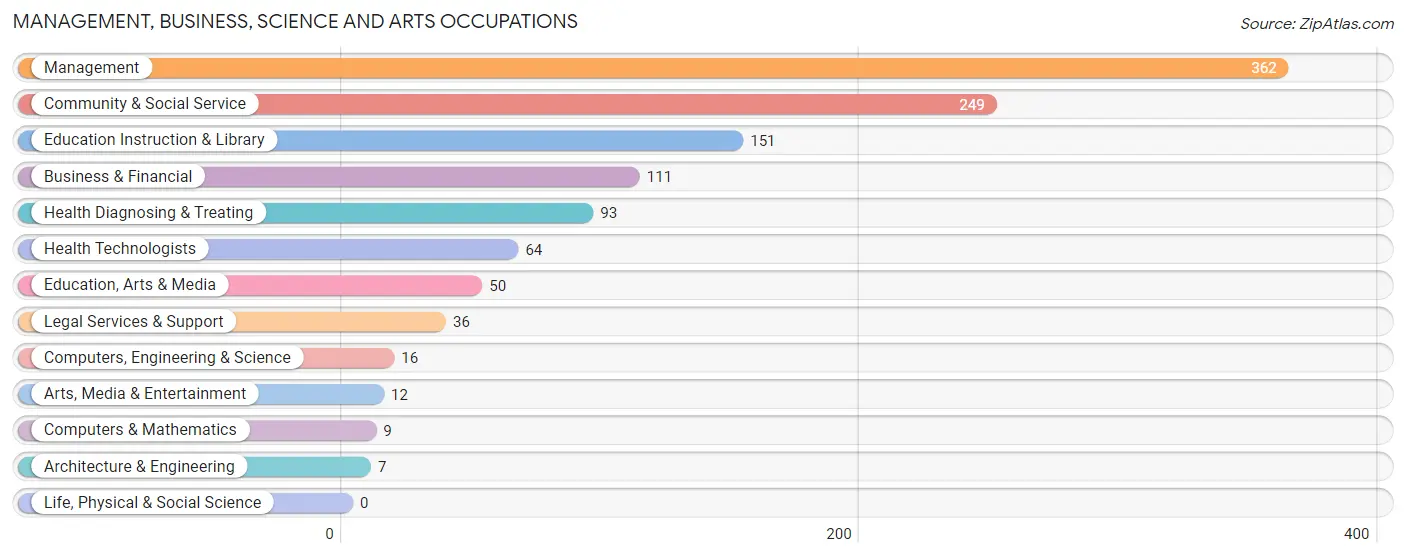
Management, Business, Science and Arts Occupations
The most common Management, Business, Science and Arts occupations in Lincoln County are Management (362 | 16.7%), Community & Social Service (249 | 11.5%), Education Instruction & Library (151 | 7.0%), Business & Financial (111 | 5.1%), and Health Diagnosing & Treating (93 | 4.3%).
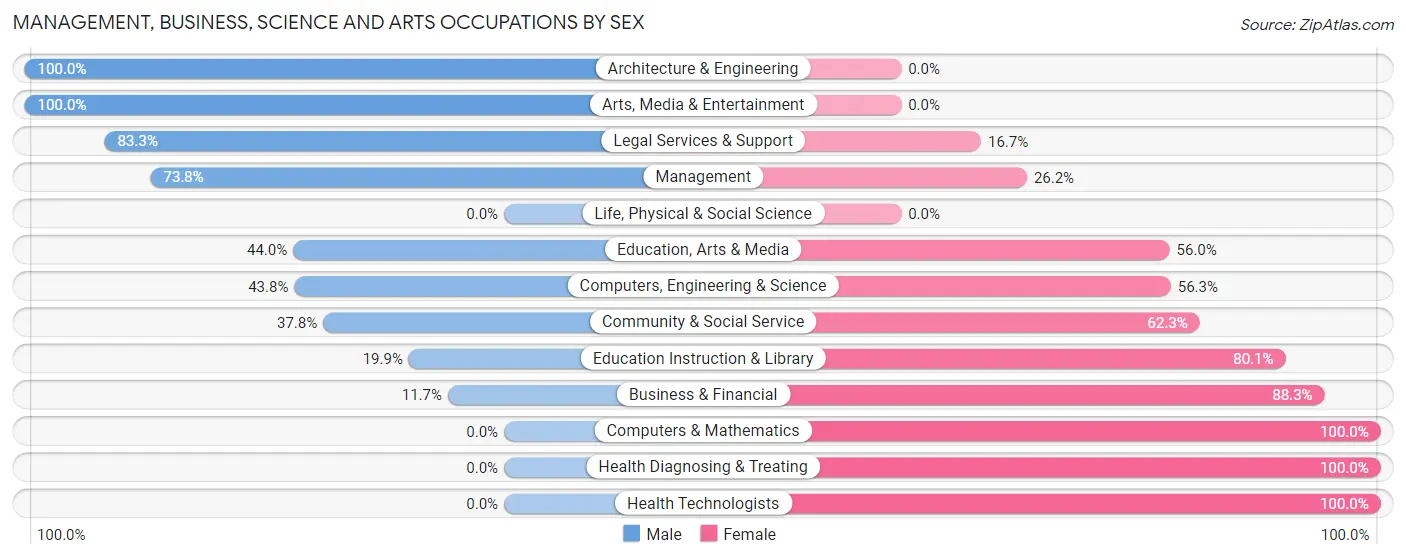
Management, Business, Science and Arts Occupations by Sex
Within the Management, Business, Science and Arts occupations in Lincoln County, the most male-oriented occupations are Architecture & Engineering (100.0%), Arts, Media & Entertainment (100.0%), and Legal Services & Support (83.3%), while the most female-oriented occupations are Computers & Mathematics (100.0%), Health Diagnosing & Treating (100.0%), and Health Technologists (100.0%).
| Occupation | Male | Female |
| Management | 267 (73.8%) | 95 (26.2%) |
| Business & Financial | 13 (11.7%) | 98 (88.3%) |
| Computers, Engineering & Science | 7 (43.8%) | 9 (56.2%) |
| Computers & Mathematics | 0 (0.0%) | 9 (100.0%) |
| Architecture & Engineering | 7 (100.0%) | 0 (0.0%) |
| Life, Physical & Social Science | 0 (0.0%) | 0 (0.0%) |
| Community & Social Service | 94 (37.8%) | 155 (62.3%) |
| Education, Arts & Media | 22 (44.0%) | 28 (56.0%) |
| Legal Services & Support | 30 (83.3%) | 6 (16.7%) |
| Education Instruction & Library | 30 (19.9%) | 121 (80.1%) |
| Arts, Media & Entertainment | 12 (100.0%) | 0 (0.0%) |
| Health Diagnosing & Treating | 0 (0.0%) | 93 (100.0%) |
| Health Technologists | 0 (0.0%) | 64 (100.0%) |
| Total (Category) | 381 (45.9%) | 450 (54.1%) |
| Total (Overall) | 1,123 (51.8%) | 1,046 (48.2%) |
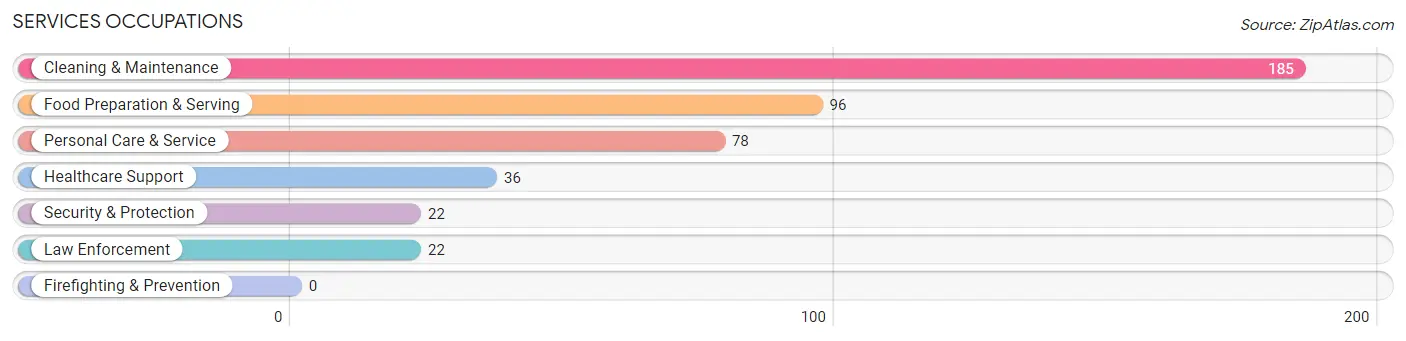
Services Occupations
The most common Services occupations in Lincoln County are Cleaning & Maintenance (185 | 8.5%), Food Preparation & Serving (96 | 4.4%), Personal Care & Service (78 | 3.6%), Healthcare Support (36 | 1.7%), and Security & Protection (22 | 1.0%).
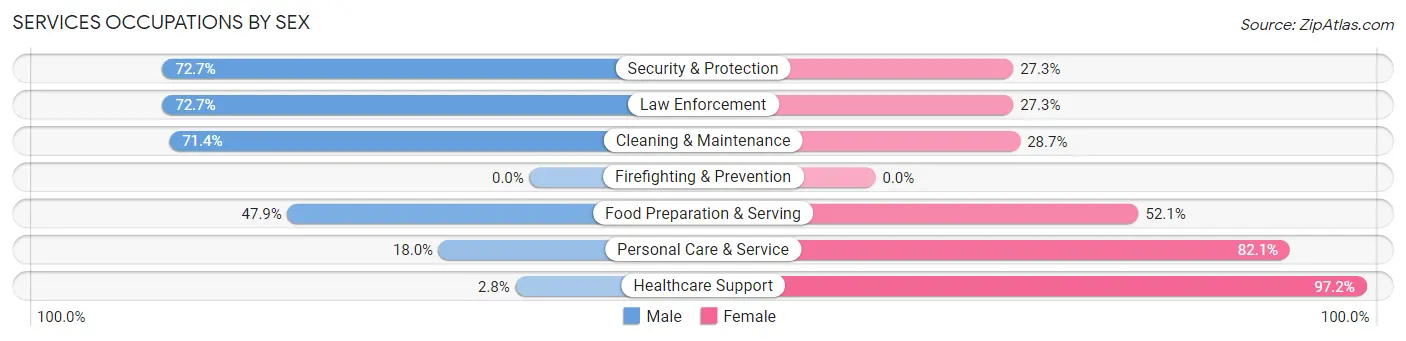
Services Occupations by Sex
Within the Services occupations in Lincoln County, the most male-oriented occupations are Security & Protection (72.7%), Law Enforcement (72.7%), and Cleaning & Maintenance (71.4%), while the most female-oriented occupations are Healthcare Support (97.2%), Personal Care & Service (82.1%), and Food Preparation & Serving (52.1%).
| Occupation | Male | Female |
| Healthcare Support | 1 (2.8%) | 35 (97.2%) |
| Security & Protection | 16 (72.7%) | 6 (27.3%) |
| Firefighting & Prevention | 0 (0.0%) | 0 (0.0%) |
| Law Enforcement | 16 (72.7%) | 6 (27.3%) |
| Food Preparation & Serving | 46 (47.9%) | 50 (52.1%) |
| Cleaning & Maintenance | 132 (71.4%) | 53 (28.6%) |
| Personal Care & Service | 14 (17.9%) | 64 (82.1%) |
| Total (Category) | 209 (50.1%) | 208 (49.9%) |
| Total (Overall) | 1,123 (51.8%) | 1,046 (48.2%) |
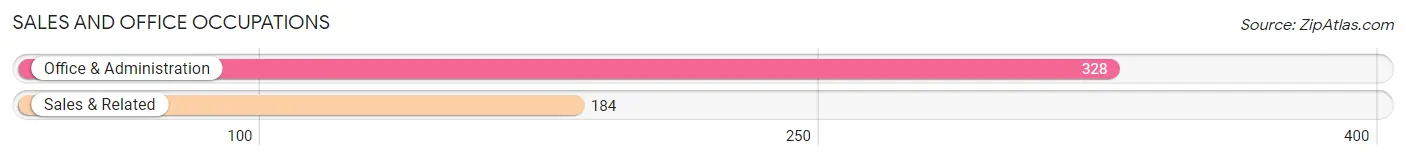
Sales and Office Occupations
The most common Sales and Office occupations in Lincoln County are Office & Administration (328 | 15.1%), and Sales & Related (184 | 8.5%).
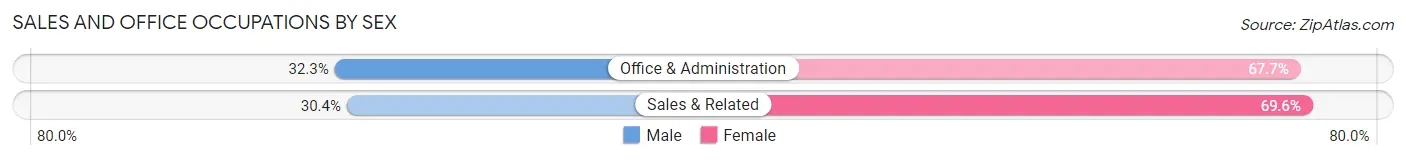
Sales and Office Occupations by Sex
| Occupation | Male | Female |
| Sales & Related | 56 (30.4%) | 128 (69.6%) |
| Office & Administration | 106 (32.3%) | 222 (67.7%) |
| Total (Category) | 162 (31.6%) | 350 (68.4%) |
| Total (Overall) | 1,123 (51.8%) | 1,046 (48.2%) |
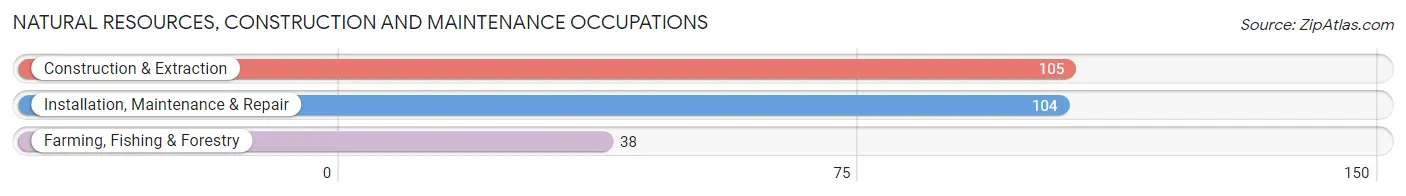
Natural Resources, Construction and Maintenance Occupations
The most common Natural Resources, Construction and Maintenance occupations in Lincoln County are Construction & Extraction (105 | 4.8%), Installation, Maintenance & Repair (104 | 4.8%), and Farming, Fishing & Forestry (38 | 1.8%).
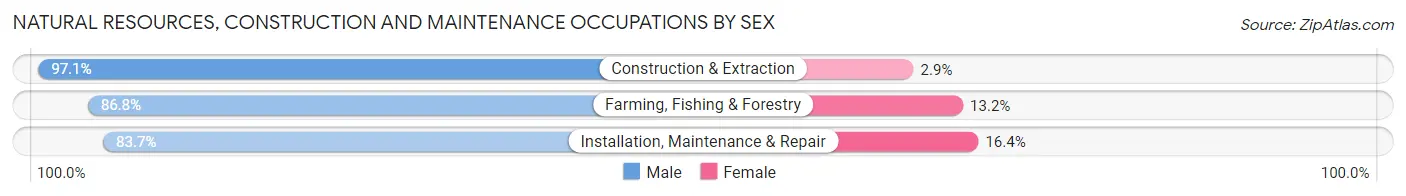
Natural Resources, Construction and Maintenance Occupations by Sex
| Occupation | Male | Female |
| Farming, Fishing & Forestry | 33 (86.8%) | 5 (13.2%) |
| Construction & Extraction | 102 (97.1%) | 3 (2.9%) |
| Installation, Maintenance & Repair | 87 (83.7%) | 17 (16.4%) |
| Total (Category) | 222 (89.9%) | 25 (10.1%) |
| Total (Overall) | 1,123 (51.8%) | 1,046 (48.2%) |
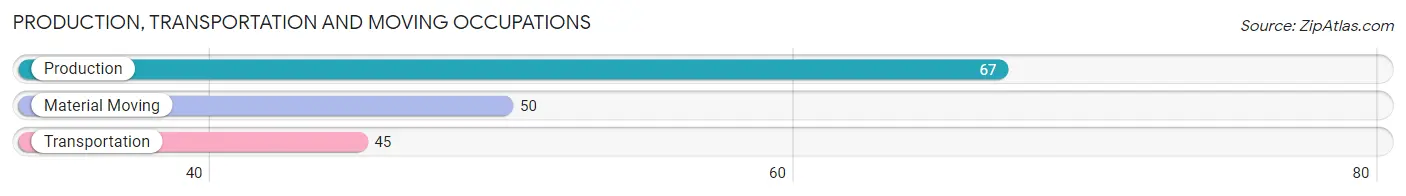
Production, Transportation and Moving Occupations
The most common Production, Transportation and Moving occupations in Lincoln County are Production (67 | 3.1%), Material Moving (50 | 2.3%), and Transportation (45 | 2.1%).
Production, Transportation and Moving Occupations by Sex
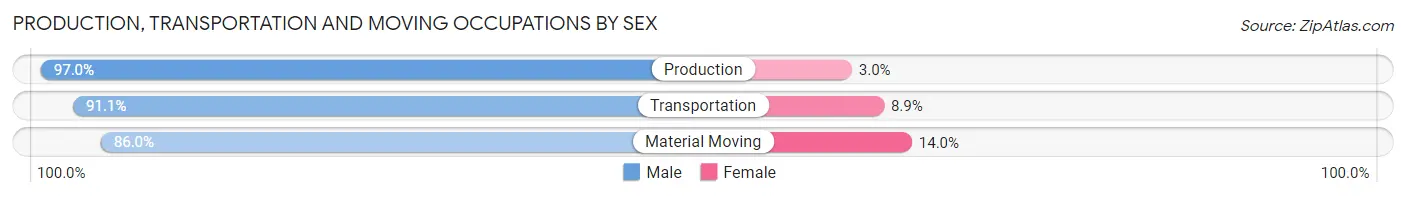
| Occupation | Male | Female |
| Production | 65 (97.0%) | 2 (3.0%) |
| Transportation | 41 (91.1%) | 4 (8.9%) |
| Material Moving | 43 (86.0%) | 7 (14.0%) |
| Total (Category) | 149 (92.0%) | 13 (8.0%) |
| Total (Overall) | 1,123 (51.8%) | 1,046 (48.2%) |
Employment Industries by Sex in Lincoln County
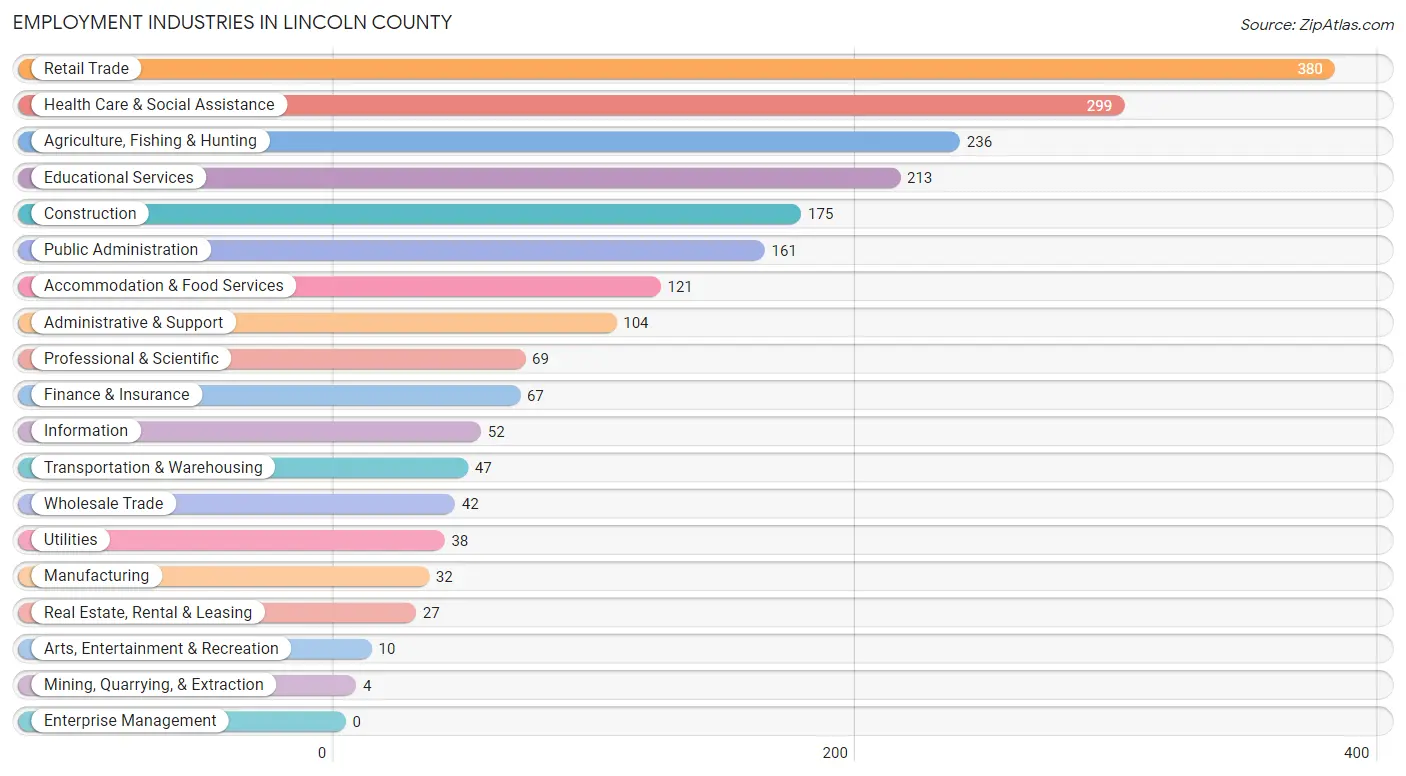
Employment Industries in Lincoln County
The major employment industries in Lincoln County include Retail Trade (380 | 17.5%), Health Care & Social Assistance (299 | 13.8%), Agriculture, Fishing & Hunting (236 | 10.9%), Educational Services (213 | 9.8%), and Construction (175 | 8.1%).
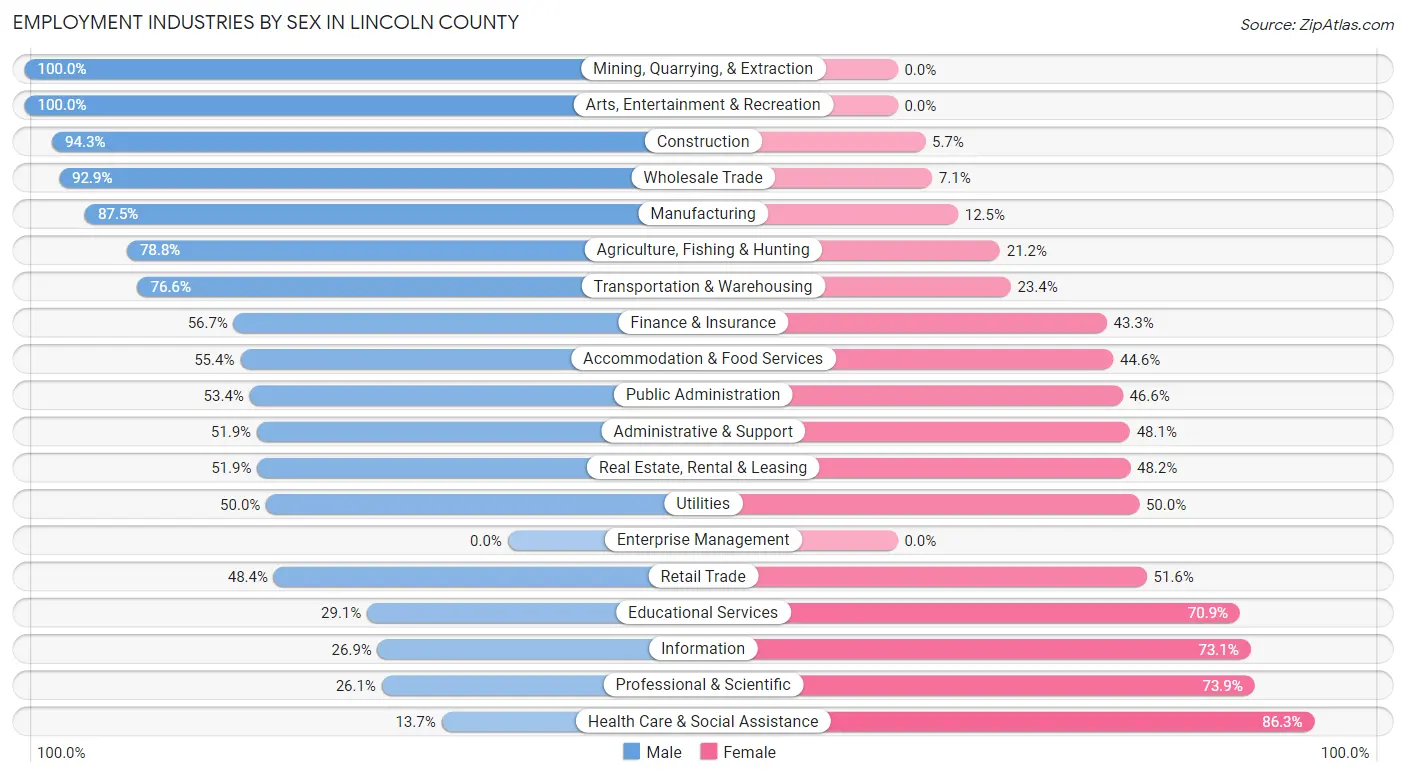
Employment Industries by Sex in Lincoln County
The Lincoln County industries that see more men than women are Mining, Quarrying, & Extraction (100.0%), Arts, Entertainment & Recreation (100.0%), and Construction (94.3%), whereas the industries that tend to have a higher number of women are Health Care & Social Assistance (86.3%), Professional & Scientific (73.9%), and Information (73.1%).
| Industry | Male | Female |
| Agriculture, Fishing & Hunting | 186 (78.8%) | 50 (21.2%) |
| Mining, Quarrying, & Extraction | 4 (100.0%) | 0 (0.0%) |
| Construction | 165 (94.3%) | 10 (5.7%) |
| Manufacturing | 28 (87.5%) | 4 (12.5%) |
| Wholesale Trade | 39 (92.9%) | 3 (7.1%) |
| Retail Trade | 184 (48.4%) | 196 (51.6%) |
| Transportation & Warehousing | 36 (76.6%) | 11 (23.4%) |
| Utilities | 19 (50.0%) | 19 (50.0%) |
| Information | 14 (26.9%) | 38 (73.1%) |
| Finance & Insurance | 38 (56.7%) | 29 (43.3%) |
| Real Estate, Rental & Leasing | 14 (51.8%) | 13 (48.1%) |
| Professional & Scientific | 18 (26.1%) | 51 (73.9%) |
| Enterprise Management | 0 (0.0%) | 0 (0.0%) |
| Administrative & Support | 54 (51.9%) | 50 (48.1%) |
| Educational Services | 62 (29.1%) | 151 (70.9%) |
| Health Care & Social Assistance | 41 (13.7%) | 258 (86.3%) |
| Arts, Entertainment & Recreation | 10 (100.0%) | 0 (0.0%) |
| Accommodation & Food Services | 67 (55.4%) | 54 (44.6%) |
| Public Administration | 86 (53.4%) | 75 (46.6%) |
| Total | 1,123 (51.8%) | 1,046 (48.2%) |
Education in Lincoln County
School Enrollment in Lincoln County
The most common levels of schooling among the 884 students in Lincoln County are high school (311 | 35.2%), elementary school (197 | 22.3%), and middle school (191 | 21.6%).
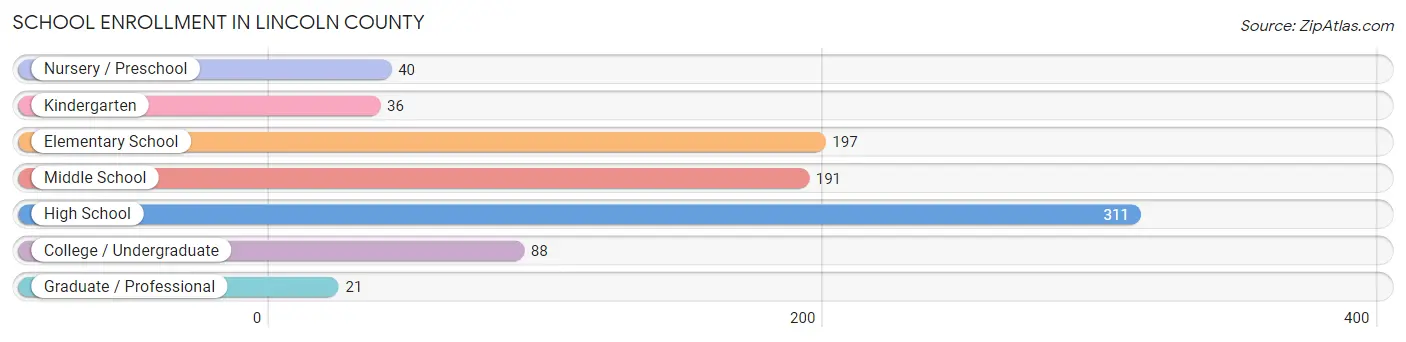
| School Level | # Students | % Students |
| Nursery / Preschool | 40 | 4.5% |
| Kindergarten | 36 | 4.1% |
| Elementary School | 197 | 22.3% |
| Middle School | 191 | 21.6% |
| High School | 311 | 35.2% |
| College / Undergraduate | 88 | 10.0% |
| Graduate / Professional | 21 | 2.4% |
| Total | 884 | 100.0% |
School Enrollment by Age by Funding Source in Lincoln County
Out of a total of 884 students who are enrolled in schools in Lincoln County, 43 (4.9%) attend a private institution, while the remaining 841 (95.1%) are enrolled in public schools. The age group of 25 to 34 year olds has the highest likelihood of being enrolled in private schools, with 16 (47.1% in the age bracket) enrolled. Conversely, the age group of 3 to 4 year olds has the lowest likelihood of being enrolled in a private school, with 26 (100.0% in the age bracket) attending a public institution.
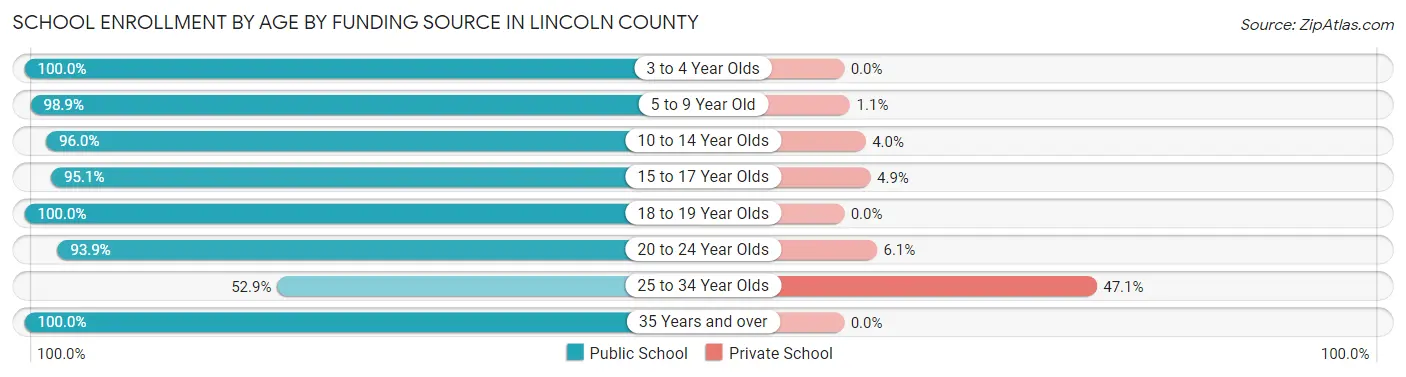
| Age Bracket | Public School | Private School |
| 3 to 4 Year Olds | 26 (100.0%) | 0 (0.0%) |
| 5 to 9 Year Old | 177 (98.9%) | 2 (1.1%) |
| 10 to 14 Year Olds | 311 (96.0%) | 13 (4.0%) |
| 15 to 17 Year Olds | 174 (95.1%) | 9 (4.9%) |
| 18 to 19 Year Olds | 64 (100.0%) | 0 (0.0%) |
| 20 to 24 Year Olds | 46 (93.9%) | 3 (6.1%) |
| 25 to 34 Year Olds | 18 (52.9%) | 16 (47.1%) |
| 35 Years and over | 25 (100.0%) | 0 (0.0%) |
| Total | 841 (95.1%) | 43 (4.9%) |
Educational Attainment by Field of Study in Lincoln County
Education (237 | 23.3%), business (145 | 14.3%), bio, nature & agricultural (111 | 10.9%), engineering (87 | 8.6%), and social sciences (78 | 7.7%) are the most common fields of study among 1,016 individuals in Lincoln County who have obtained a bachelor's degree or higher.
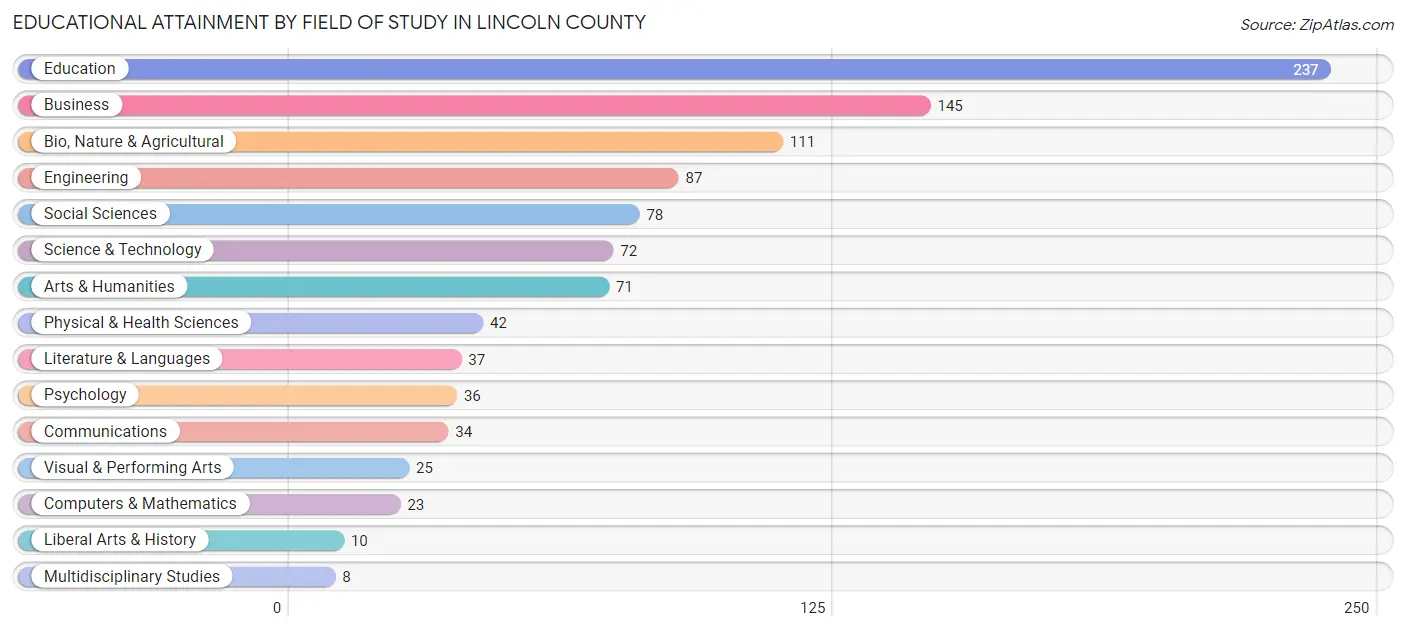
| Field of Study | # Graduates | % Graduates |
| Computers & Mathematics | 23 | 2.3% |
| Bio, Nature & Agricultural | 111 | 10.9% |
| Physical & Health Sciences | 42 | 4.1% |
| Psychology | 36 | 3.5% |
| Social Sciences | 78 | 7.7% |
| Engineering | 87 | 8.6% |
| Multidisciplinary Studies | 8 | 0.8% |
| Science & Technology | 72 | 7.1% |
| Business | 145 | 14.3% |
| Education | 237 | 23.3% |
| Literature & Languages | 37 | 3.6% |
| Liberal Arts & History | 10 | 1.0% |
| Visual & Performing Arts | 25 | 2.5% |
| Communications | 34 | 3.4% |
| Arts & Humanities | 71 | 7.0% |
| Total | 1,016 | 100.0% |
Transportation & Commute in Lincoln County
Vehicle Availability by Sex in Lincoln County
The most prevalent vehicle ownership categories in Lincoln County are males with 2 vehicles (499, accounting for 44.0%) and females with 2 vehicles (385, making up 48.2%).
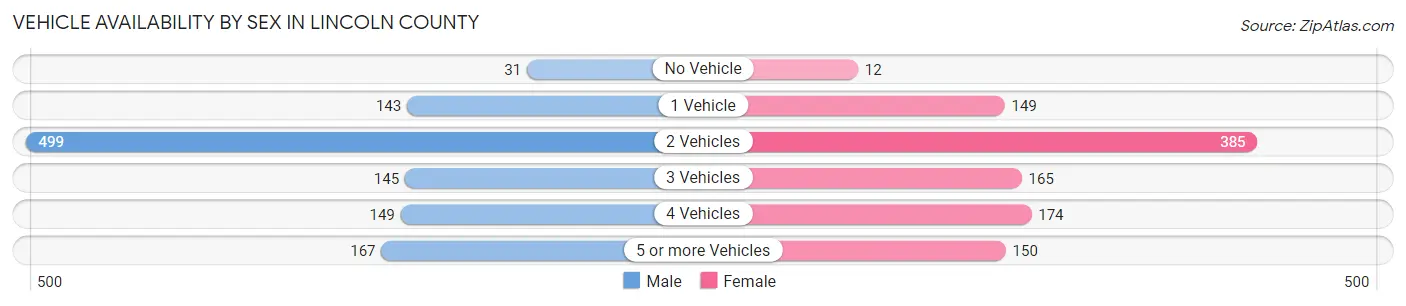
| Vehicles Available | Male | Female |
| No Vehicle | 31 (2.7%) | 12 (1.2%) |
| 1 Vehicle | 143 (12.6%) | 149 (14.4%) |
| 2 Vehicles | 499 (44.0%) | 385 (37.2%) |
| 3 Vehicles | 145 (12.8%) | 165 (15.9%) |
| 4 Vehicles | 149 (13.1%) | 174 (16.8%) |
| 5 or more Vehicles | 167 (14.7%) | 150 (14.5%) |
| Total | 1,134 (100.0%) | 1,035 (100.0%) |
Commute Time in Lincoln County
The most frequently occuring commute durations in Lincoln County are 5 to 9 minutes (618 commuters, 31.3%), less than 5 minutes (457 commuters, 23.2%), and 10 to 14 minutes (183 commuters, 9.3%).
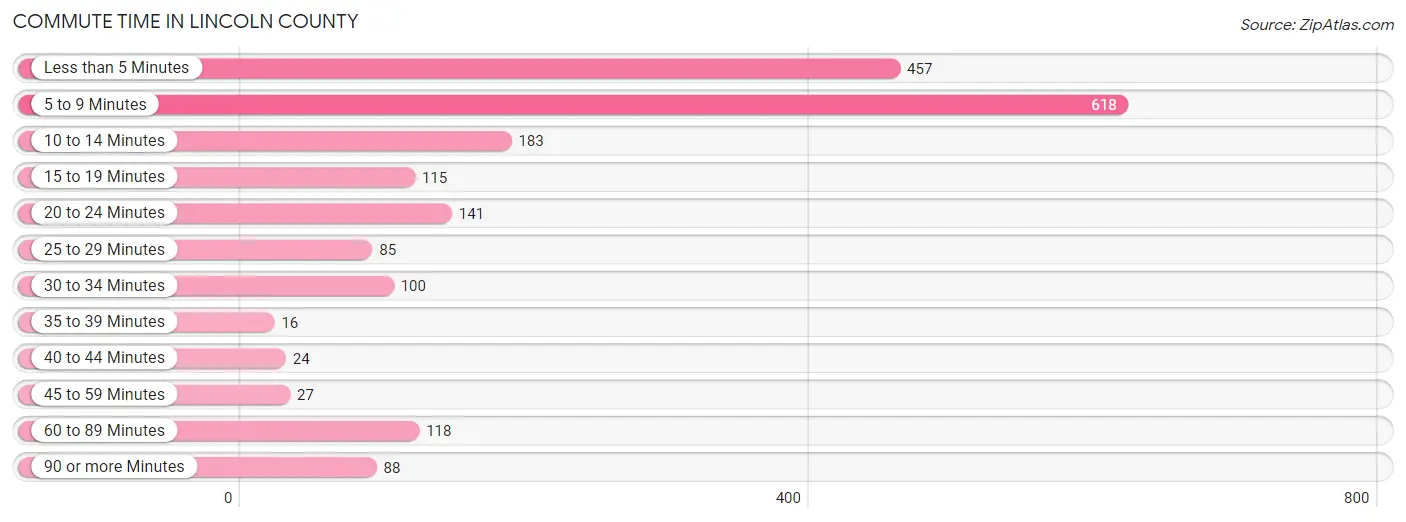
| Commute Time | # Commuters | % Commuters |
| Less than 5 Minutes | 457 | 23.2% |
| 5 to 9 Minutes | 618 | 31.3% |
| 10 to 14 Minutes | 183 | 9.3% |
| 15 to 19 Minutes | 115 | 5.8% |
| 20 to 24 Minutes | 141 | 7.1% |
| 25 to 29 Minutes | 85 | 4.3% |
| 30 to 34 Minutes | 100 | 5.1% |
| 35 to 39 Minutes | 16 | 0.8% |
| 40 to 44 Minutes | 24 | 1.2% |
| 45 to 59 Minutes | 27 | 1.4% |
| 60 to 89 Minutes | 118 | 6.0% |
| 90 or more Minutes | 88 | 4.5% |
Commute Time by Sex in Lincoln County
The most common commute times in Lincoln County are 5 to 9 minutes (278 commuters, 26.5%) for males and 5 to 9 minutes (340 commuters, 36.9%) for females.
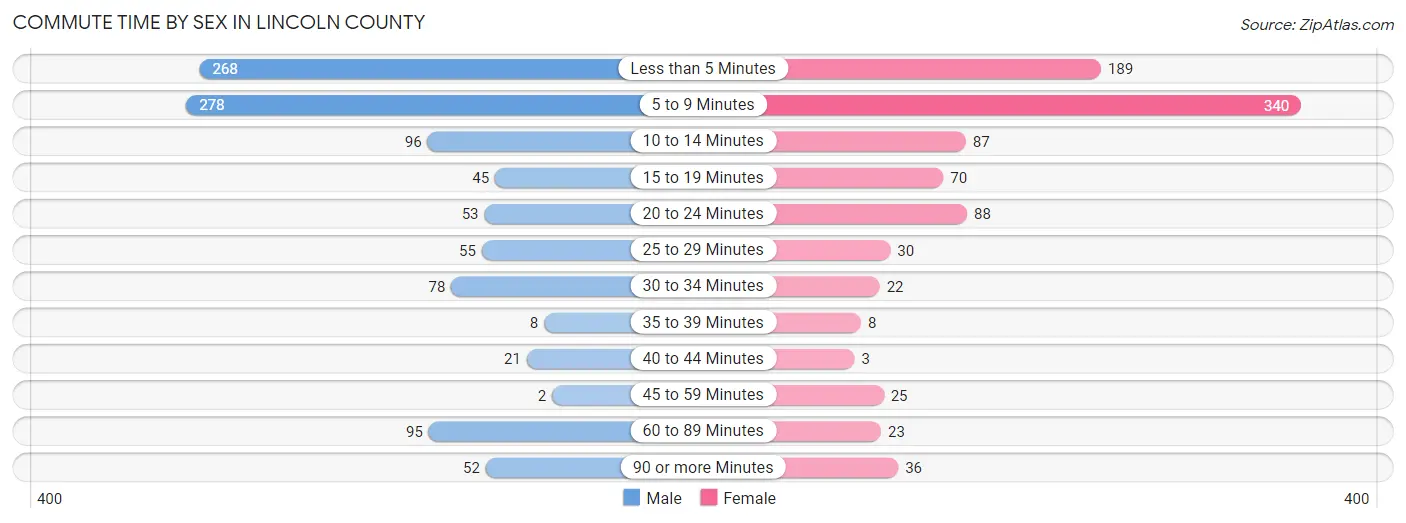
| Commute Time | Male | Female |
| Less than 5 Minutes | 268 (25.5%) | 189 (20.5%) |
| 5 to 9 Minutes | 278 (26.5%) | 340 (36.9%) |
| 10 to 14 Minutes | 96 (9.1%) | 87 (9.5%) |
| 15 to 19 Minutes | 45 (4.3%) | 70 (7.6%) |
| 20 to 24 Minutes | 53 (5.0%) | 88 (9.6%) |
| 25 to 29 Minutes | 55 (5.2%) | 30 (3.3%) |
| 30 to 34 Minutes | 78 (7.4%) | 22 (2.4%) |
| 35 to 39 Minutes | 8 (0.8%) | 8 (0.9%) |
| 40 to 44 Minutes | 21 (2.0%) | 3 (0.3%) |
| 45 to 59 Minutes | 2 (0.2%) | 25 (2.7%) |
| 60 to 89 Minutes | 95 (9.0%) | 23 (2.5%) |
| 90 or more Minutes | 52 (5.0%) | 36 (3.9%) |
Time of Departure to Work by Sex in Lincoln County
The most frequent times of departure to work in Lincoln County are 7:00 AM to 7:29 AM (156, 14.8%) for males and 7:30 AM to 7:59 AM (256, 27.8%) for females.
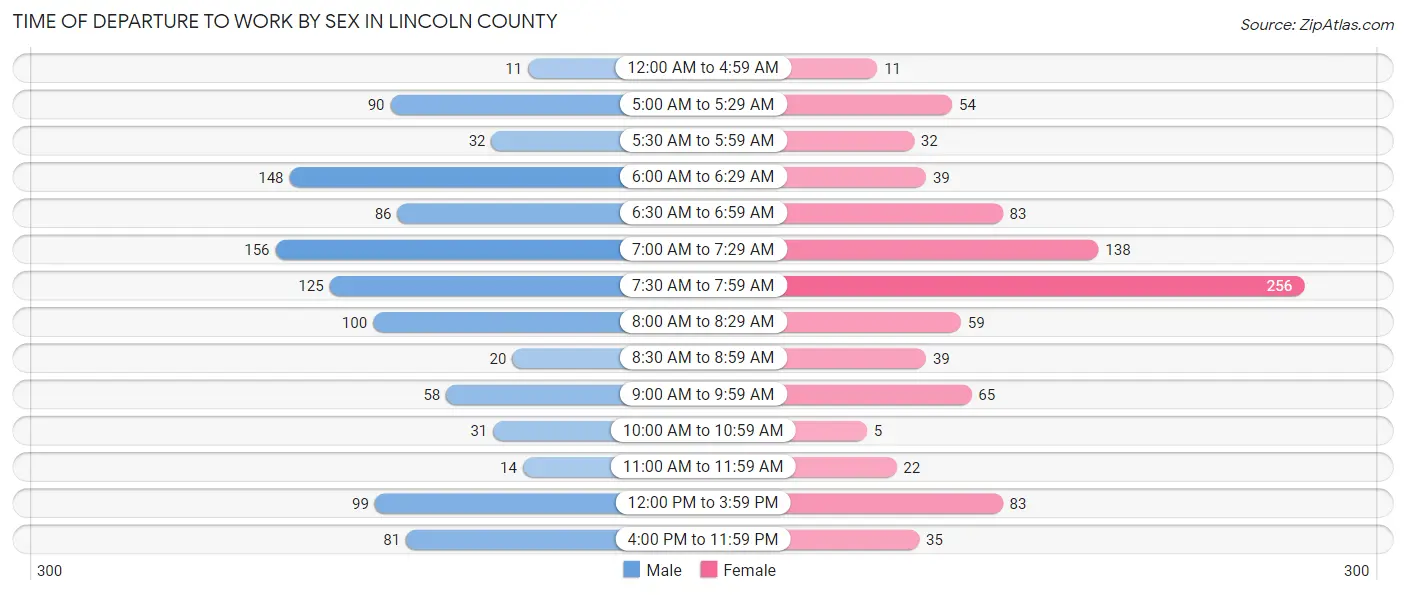
| Time of Departure | Male | Female |
| 12:00 AM to 4:59 AM | 11 (1.1%) | 11 (1.2%) |
| 5:00 AM to 5:29 AM | 90 (8.6%) | 54 (5.9%) |
| 5:30 AM to 5:59 AM | 32 (3.0%) | 32 (3.5%) |
| 6:00 AM to 6:29 AM | 148 (14.1%) | 39 (4.2%) |
| 6:30 AM to 6:59 AM | 86 (8.2%) | 83 (9.0%) |
| 7:00 AM to 7:29 AM | 156 (14.8%) | 138 (15.0%) |
| 7:30 AM to 7:59 AM | 125 (11.9%) | 256 (27.8%) |
| 8:00 AM to 8:29 AM | 100 (9.5%) | 59 (6.4%) |
| 8:30 AM to 8:59 AM | 20 (1.9%) | 39 (4.2%) |
| 9:00 AM to 9:59 AM | 58 (5.5%) | 65 (7.1%) |
| 10:00 AM to 10:59 AM | 31 (2.9%) | 5 (0.5%) |
| 11:00 AM to 11:59 AM | 14 (1.3%) | 22 (2.4%) |
| 12:00 PM to 3:59 PM | 99 (9.4%) | 83 (9.0%) |
| 4:00 PM to 11:59 PM | 81 (7.7%) | 35 (3.8%) |
| Total | 1,051 (100.0%) | 921 (100.0%) |
Housing Occupancy in Lincoln County
Occupancy by Ownership in Lincoln County
Of the total 1,922 dwellings in Lincoln County, owner-occupied units account for 1,368 (71.2%), while renter-occupied units make up 554 (28.8%).
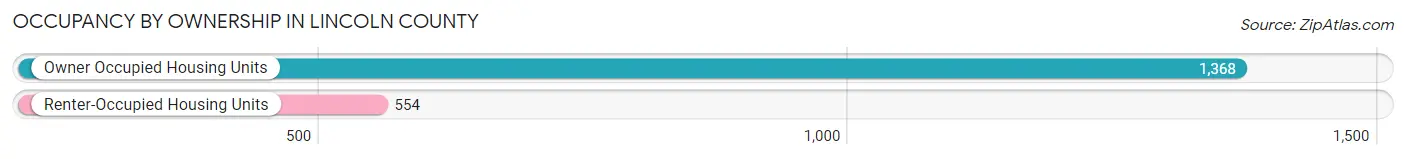
| Occupancy | # Housing Units | % Housing Units |
| Owner Occupied Housing Units | 1,368 | 71.2% |
| Renter-Occupied Housing Units | 554 | 28.8% |
| Total Occupied Housing Units | 1,922 | 100.0% |
Occupancy by Household Size in Lincoln County
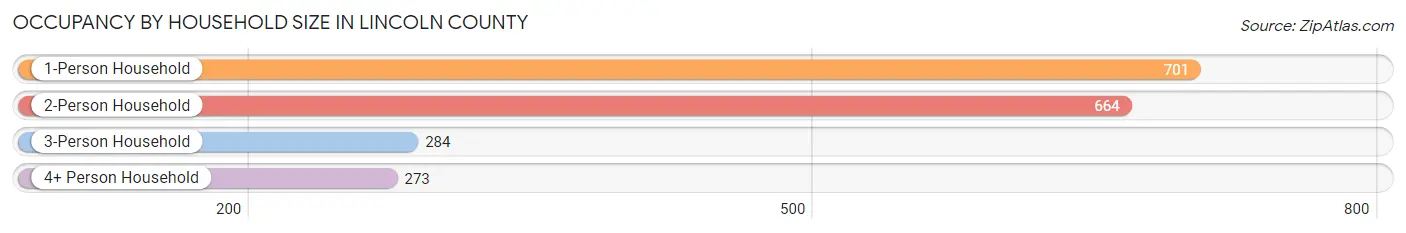
| Household Size | # Housing Units | % Housing Units |
| 1-Person Household | 701 | 36.5% |
| 2-Person Household | 664 | 34.5% |
| 3-Person Household | 284 | 14.8% |
| 4+ Person Household | 273 | 14.2% |
| Total Housing Units | 1,922 | 100.0% |
Occupancy by Ownership by Household Size in Lincoln County
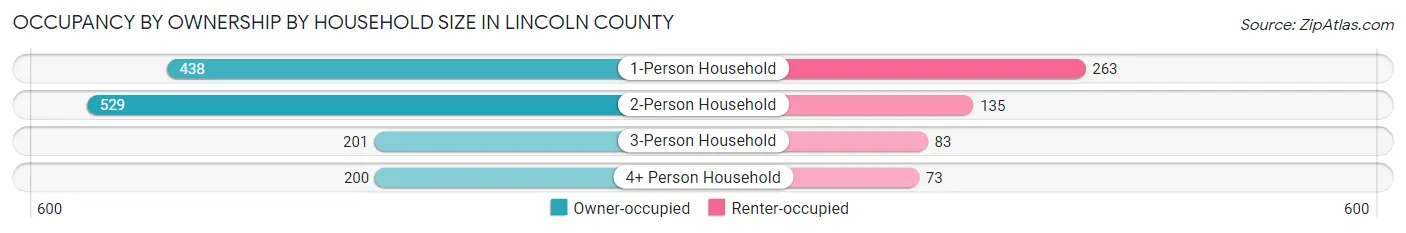
| Household Size | Owner-occupied | Renter-occupied |
| 1-Person Household | 438 (62.5%) | 263 (37.5%) |
| 2-Person Household | 529 (79.7%) | 135 (20.3%) |
| 3-Person Household | 201 (70.8%) | 83 (29.2%) |
| 4+ Person Household | 200 (73.3%) | 73 (26.7%) |
| Total Housing Units | 1,368 (71.2%) | 554 (28.8%) |
Occupancy by Educational Attainment in Lincoln County
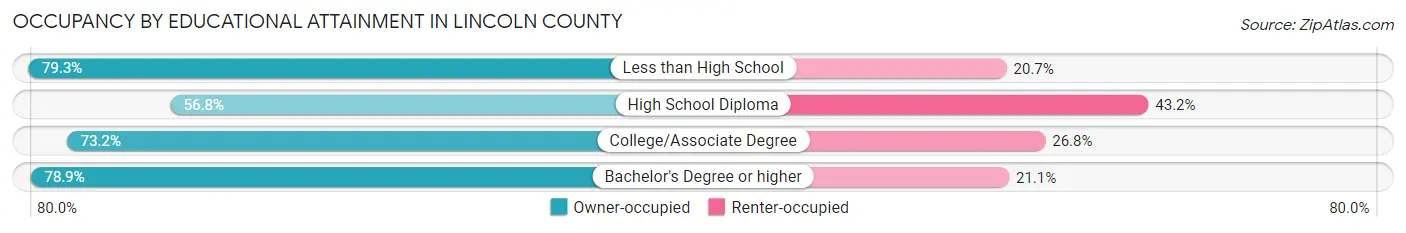
| Household Size | Owner-occupied | Renter-occupied |
| Less than High School | 115 (79.3%) | 30 (20.7%) |
| High School Diploma | 283 (56.8%) | 215 (43.2%) |
| College/Associate Degree | 502 (73.2%) | 184 (26.8%) |
| Bachelor's Degree or higher | 468 (78.9%) | 125 (21.1%) |
Occupancy by Age of Householder in Lincoln County
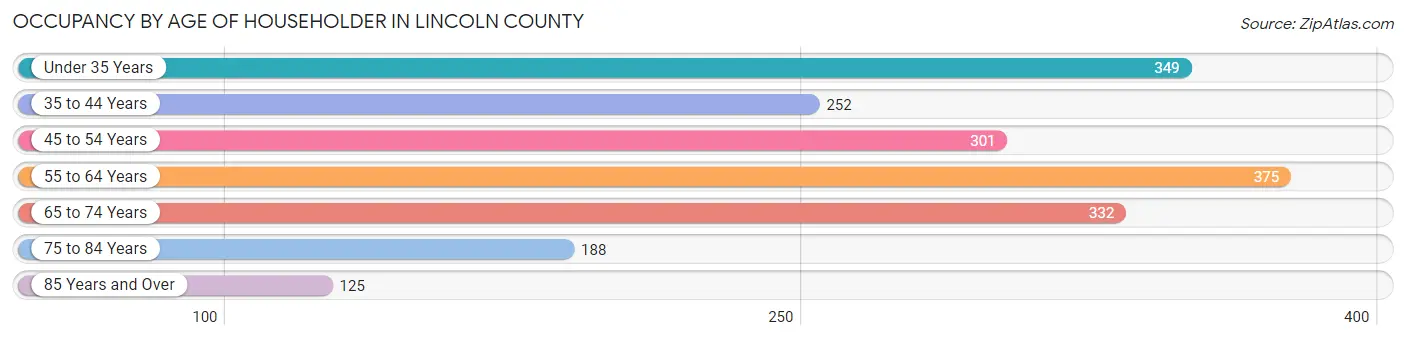
| Age Bracket | # Households | % Households |
| Under 35 Years | 349 | 18.2% |
| 35 to 44 Years | 252 | 13.1% |
| 45 to 54 Years | 301 | 15.7% |
| 55 to 64 Years | 375 | 19.5% |
| 65 to 74 Years | 332 | 17.3% |
| 75 to 84 Years | 188 | 9.8% |
| 85 Years and Over | 125 | 6.5% |
| Total | 1,922 | 100.0% |
Housing Finances in Lincoln County
Median Income by Occupancy in Lincoln County
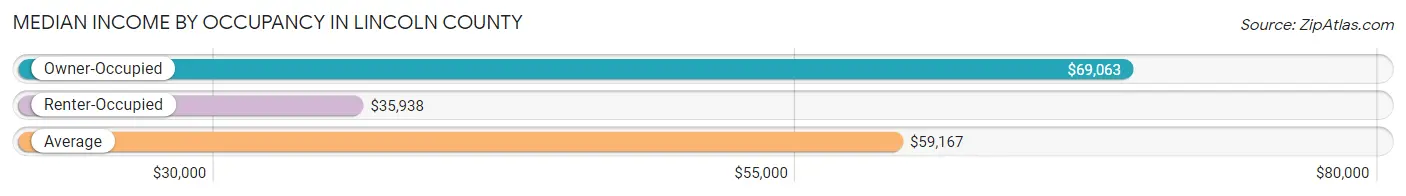
| Occupancy Type | # Households | Median Income |
| Owner-Occupied | 1,368 (71.2%) | $69,063 |
| Renter-Occupied | 554 (28.8%) | $35,938 |
| Average | 1,922 (100.0%) | $59,167 |
Occupancy by Householder Income Bracket in Lincoln County
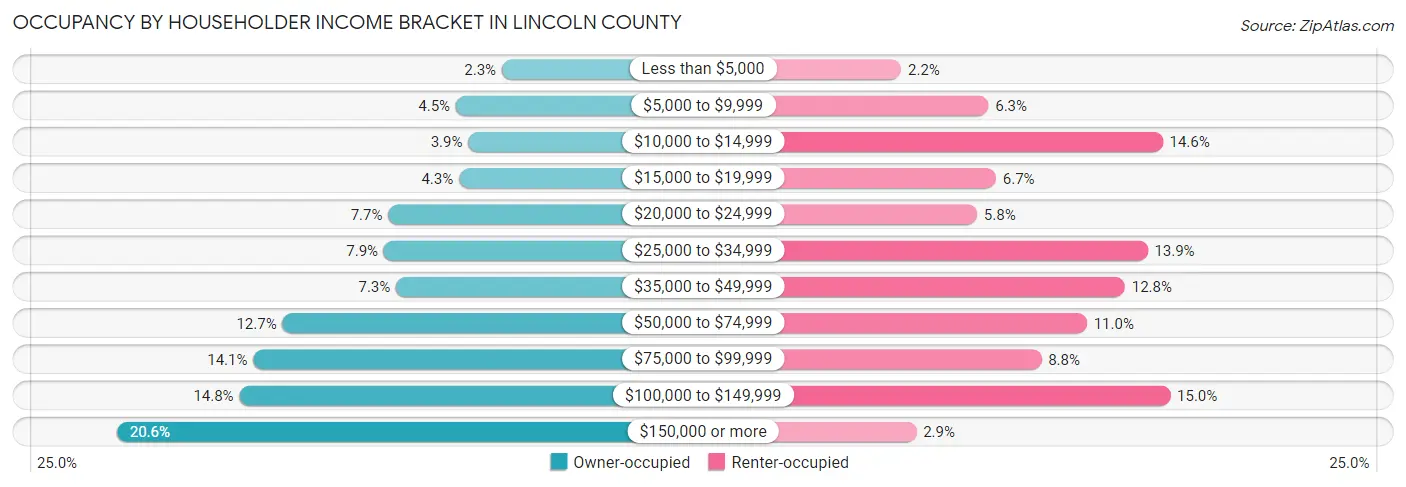
| Income Bracket | Owner-occupied | Renter-occupied |
| Less than $5,000 | 31 (2.3%) | 12 (2.2%) |
| $5,000 to $9,999 | 61 (4.5%) | 35 (6.3%) |
| $10,000 to $14,999 | 53 (3.9%) | 81 (14.6%) |
| $15,000 to $19,999 | 59 (4.3%) | 37 (6.7%) |
| $20,000 to $24,999 | 105 (7.7%) | 32 (5.8%) |
| $25,000 to $34,999 | 108 (7.9%) | 77 (13.9%) |
| $35,000 to $49,999 | 100 (7.3%) | 71 (12.8%) |
| $50,000 to $74,999 | 174 (12.7%) | 61 (11.0%) |
| $75,000 to $99,999 | 193 (14.1%) | 49 (8.8%) |
| $100,000 to $149,999 | 202 (14.8%) | 83 (15.0%) |
| $150,000 or more | 282 (20.6%) | 16 (2.9%) |
| Total | 1,368 (100.0%) | 554 (100.0%) |
Monthly Housing Cost Tiers in Lincoln County
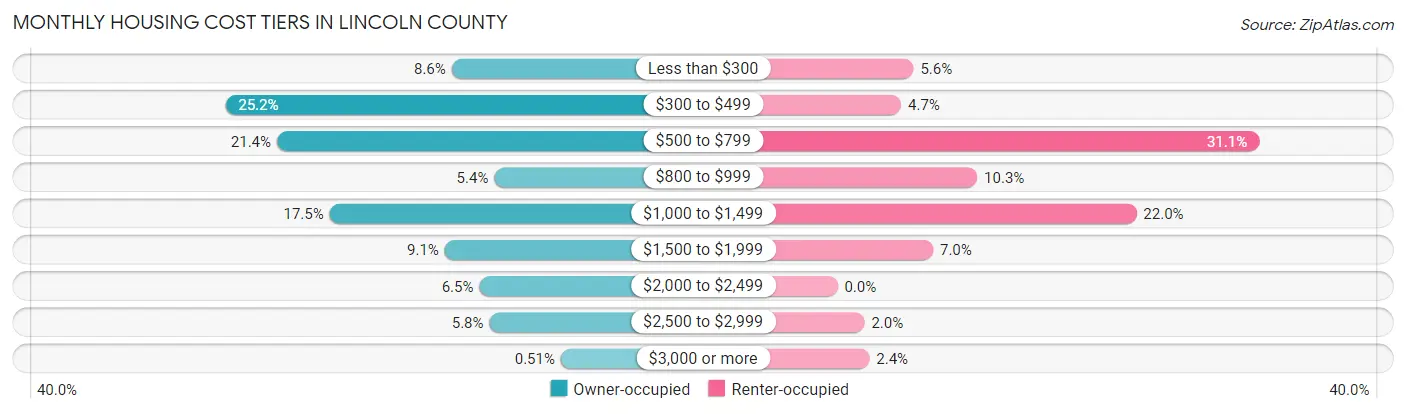
| Monthly Cost | Owner-occupied | Renter-occupied |
| Less than $300 | 117 (8.6%) | 31 (5.6%) |
| $300 to $499 | 345 (25.2%) | 26 (4.7%) |
| $500 to $799 | 293 (21.4%) | 172 (31.0%) |
| $800 to $999 | 74 (5.4%) | 57 (10.3%) |
| $1,000 to $1,499 | 240 (17.5%) | 122 (22.0%) |
| $1,500 to $1,999 | 124 (9.1%) | 39 (7.0%) |
| $2,000 to $2,499 | 89 (6.5%) | 0 (0.0%) |
| $2,500 to $2,999 | 79 (5.8%) | 11 (2.0%) |
| $3,000 or more | 7 (0.5%) | 13 (2.4%) |
| Total | 1,368 (100.0%) | 554 (100.0%) |
Physical Housing Characteristics in Lincoln County
Housing Structures in Lincoln County
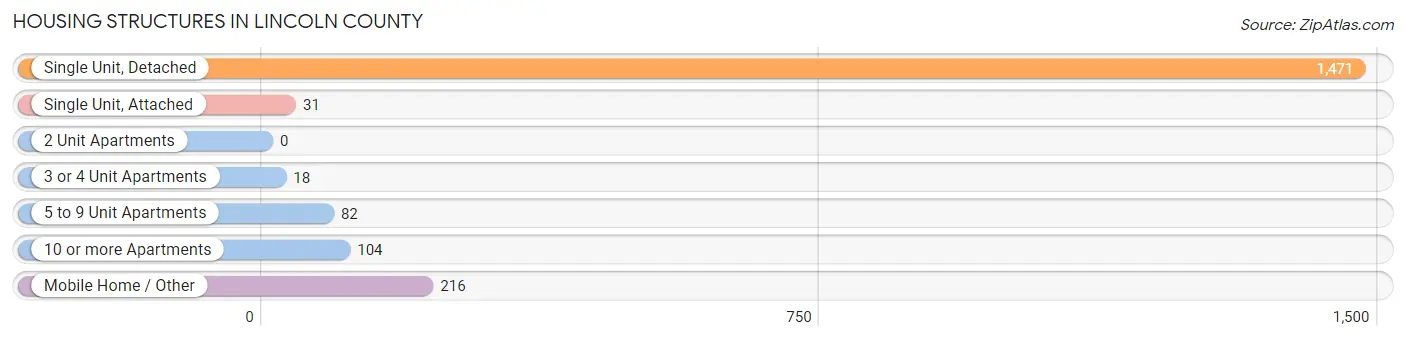
| Structure Type | # Housing Units | % Housing Units |
| Single Unit, Detached | 1,471 | 76.5% |
| Single Unit, Attached | 31 | 1.6% |
| 2 Unit Apartments | 0 | 0.0% |
| 3 or 4 Unit Apartments | 18 | 0.9% |
| 5 to 9 Unit Apartments | 82 | 4.3% |
| 10 or more Apartments | 104 | 5.4% |
| Mobile Home / Other | 216 | 11.2% |
| Total | 1,922 | 100.0% |
Housing Structures by Occupancy in Lincoln County
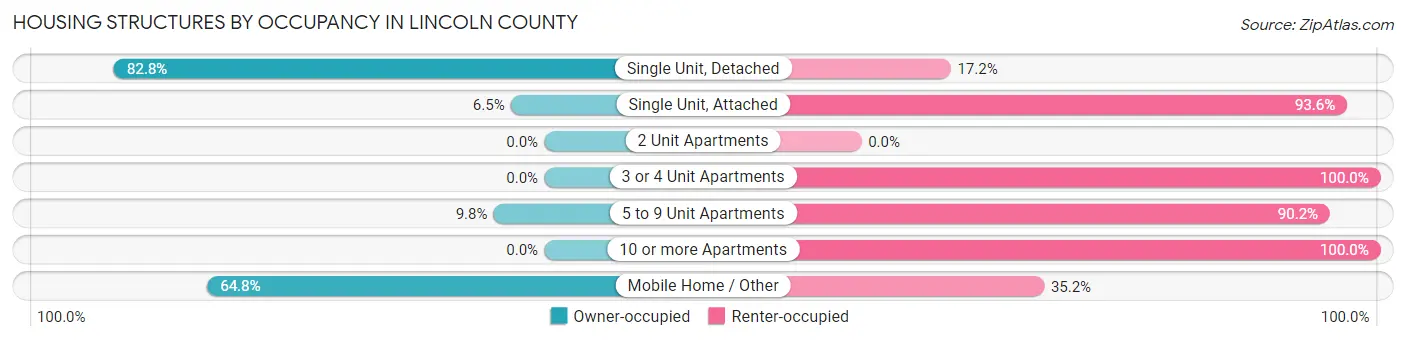
| Structure Type | Owner-occupied | Renter-occupied |
| Single Unit, Detached | 1,218 (82.8%) | 253 (17.2%) |
| Single Unit, Attached | 2 (6.5%) | 29 (93.5%) |
| 2 Unit Apartments | 0 (0.0%) | 0 (0.0%) |
| 3 or 4 Unit Apartments | 0 (0.0%) | 18 (100.0%) |
| 5 to 9 Unit Apartments | 8 (9.8%) | 74 (90.2%) |
| 10 or more Apartments | 0 (0.0%) | 104 (100.0%) |
| Mobile Home / Other | 140 (64.8%) | 76 (35.2%) |
| Total | 1,368 (71.2%) | 554 (28.8%) |
Housing Structures by Number of Rooms in Lincoln County
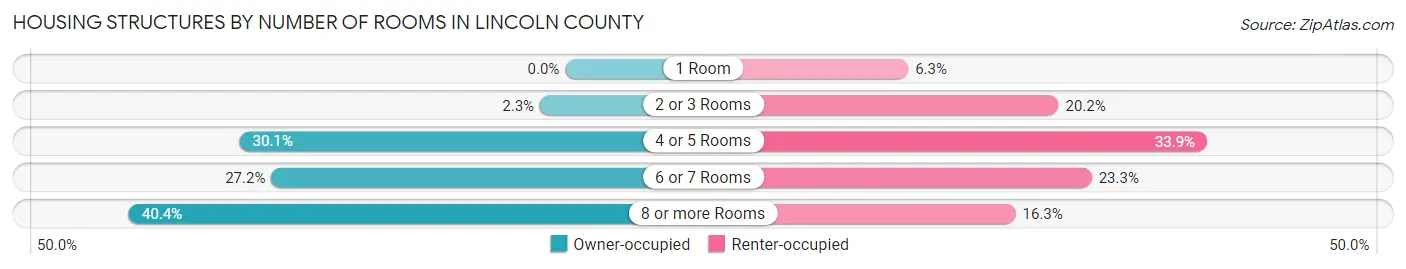
| Number of Rooms | Owner-occupied | Renter-occupied |
| 1 Room | 0 (0.0%) | 35 (6.3%) |
| 2 or 3 Rooms | 32 (2.3%) | 112 (20.2%) |
| 4 or 5 Rooms | 412 (30.1%) | 188 (33.9%) |
| 6 or 7 Rooms | 372 (27.2%) | 129 (23.3%) |
| 8 or more Rooms | 552 (40.4%) | 90 (16.3%) |
| Total | 1,368 (100.0%) | 554 (100.0%) |
Housing Structure by Heating Type in Lincoln County
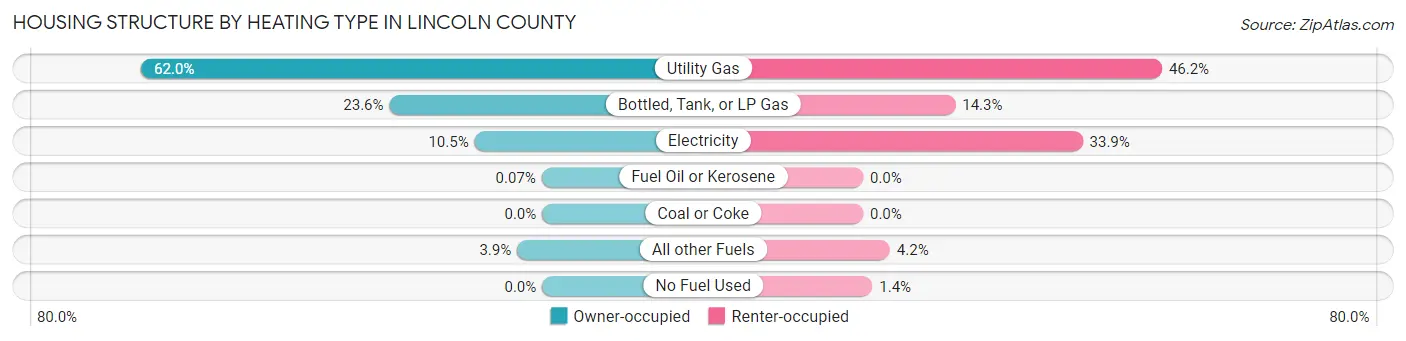
| Heating Type | Owner-occupied | Renter-occupied |
| Utility Gas | 848 (62.0%) | 256 (46.2%) |
| Bottled, Tank, or LP Gas | 323 (23.6%) | 79 (14.3%) |
| Electricity | 143 (10.4%) | 188 (33.9%) |
| Fuel Oil or Kerosene | 1 (0.1%) | 0 (0.0%) |
| Coal or Coke | 0 (0.0%) | 0 (0.0%) |
| All other Fuels | 53 (3.9%) | 23 (4.2%) |
| No Fuel Used | 0 (0.0%) | 8 (1.4%) |
| Total | 1,368 (100.0%) | 554 (100.0%) |
Household Vehicle Usage in Lincoln County
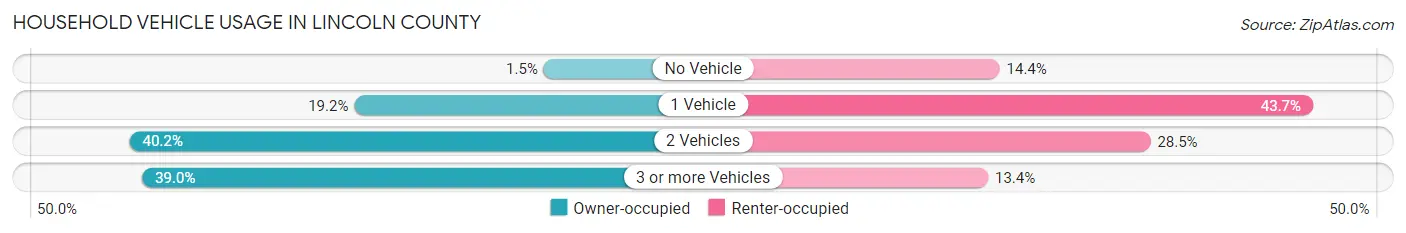
| Vehicles per Household | Owner-occupied | Renter-occupied |
| No Vehicle | 21 (1.5%) | 80 (14.4%) |
| 1 Vehicle | 263 (19.2%) | 242 (43.7%) |
| 2 Vehicles | 550 (40.2%) | 158 (28.5%) |
| 3 or more Vehicles | 534 (39.0%) | 74 (13.4%) |
| Total | 1,368 (100.0%) | 554 (100.0%) |
Real Estate & Mortgages in Lincoln County
Real Estate and Mortgage Overview in Lincoln County
| Characteristic | Without Mortgage | With Mortgage |
| Housing Units | 736 | 632 |
| Median Property Value | $166,700 | $295,000 |
| Median Household Income | $48,393 | $160 |
| Monthly Housing Costs | $443 | $7 |
| Real Estate Taxes | $543 | $11 |
Property Value by Mortgage Status in Lincoln County
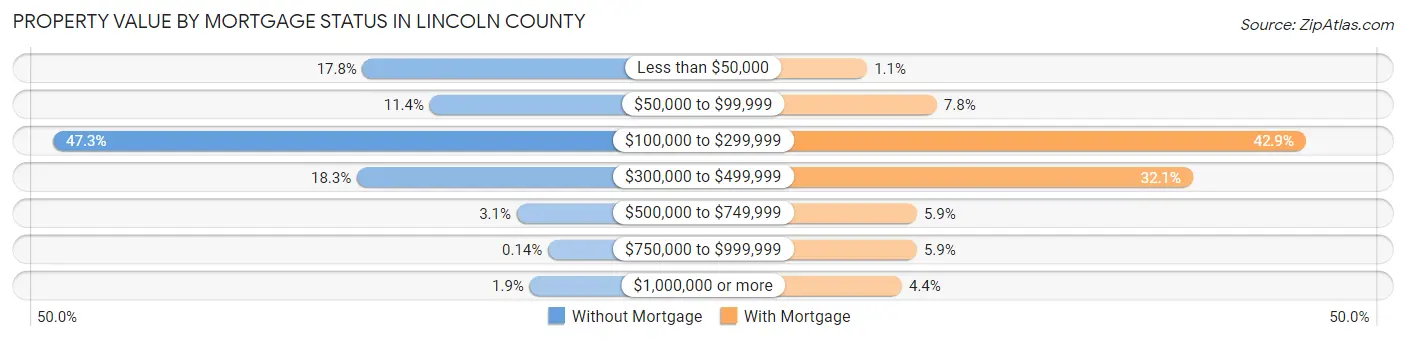
| Property Value | Without Mortgage | With Mortgage |
| Less than $50,000 | 131 (17.8%) | 7 (1.1%) |
| $50,000 to $99,999 | 84 (11.4%) | 49 (7.7%) |
| $100,000 to $299,999 | 348 (47.3%) | 271 (42.9%) |
| $300,000 to $499,999 | 135 (18.3%) | 203 (32.1%) |
| $500,000 to $749,999 | 23 (3.1%) | 37 (5.9%) |
| $750,000 to $999,999 | 1 (0.1%) | 37 (5.9%) |
| $1,000,000 or more | 14 (1.9%) | 28 (4.4%) |
| Total | 736 (100.0%) | 632 (100.0%) |
Household Income by Mortgage Status in Lincoln County
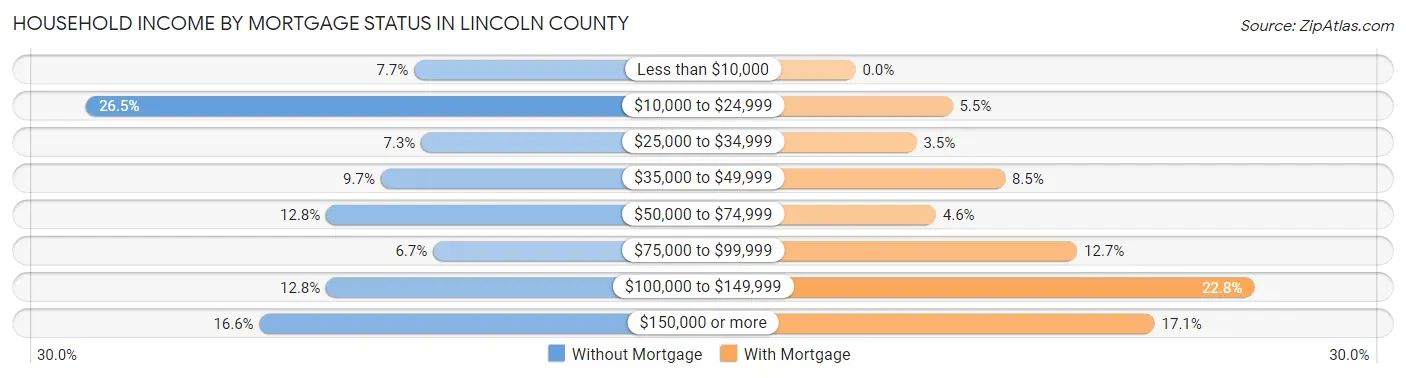
| Household Income | Without Mortgage | With Mortgage |
| Less than $10,000 | 57 (7.7%) | 0 (0.0%) |
| $10,000 to $24,999 | 195 (26.5%) | 35 (5.5%) |
| $25,000 to $34,999 | 54 (7.3%) | 22 (3.5%) |
| $35,000 to $49,999 | 71 (9.7%) | 54 (8.5%) |
| $50,000 to $74,999 | 94 (12.8%) | 29 (4.6%) |
| $75,000 to $99,999 | 49 (6.7%) | 80 (12.7%) |
| $100,000 to $149,999 | 94 (12.8%) | 144 (22.8%) |
| $150,000 or more | 122 (16.6%) | 108 (17.1%) |
| Total | 736 (100.0%) | 632 (100.0%) |
Property Value to Household Income Ratio in Lincoln County
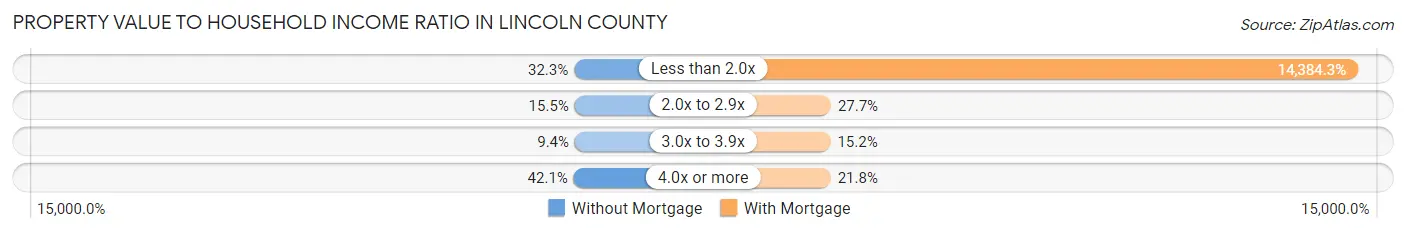
| Value-to-Income Ratio | Without Mortgage | With Mortgage |
| Less than 2.0x | 238 (32.3%) | 90,909 (14,384.3%) |
| 2.0x to 2.9x | 114 (15.5%) | 175 (27.7%) |
| 3.0x to 3.9x | 69 (9.4%) | 96 (15.2%) |
| 4.0x or more | 310 (42.1%) | 138 (21.8%) |
| Total | 736 (100.0%) | 632 (100.0%) |
Real Estate Taxes by Mortgage Status in Lincoln County
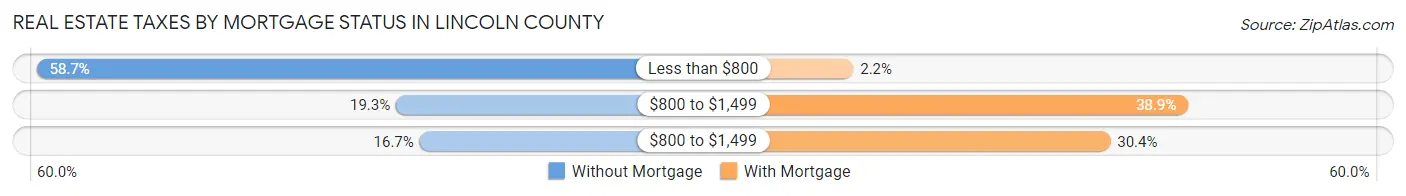
| Property Taxes | Without Mortgage | With Mortgage |
| Less than $800 | 432 (58.7%) | 14 (2.2%) |
| $800 to $1,499 | 142 (19.3%) | 246 (38.9%) |
| $800 to $1,499 | 123 (16.7%) | 192 (30.4%) |
| Total | 736 (100.0%) | 632 (100.0%) |
Health & Disability in Lincoln County
Health Insurance Coverage by Age in Lincoln County
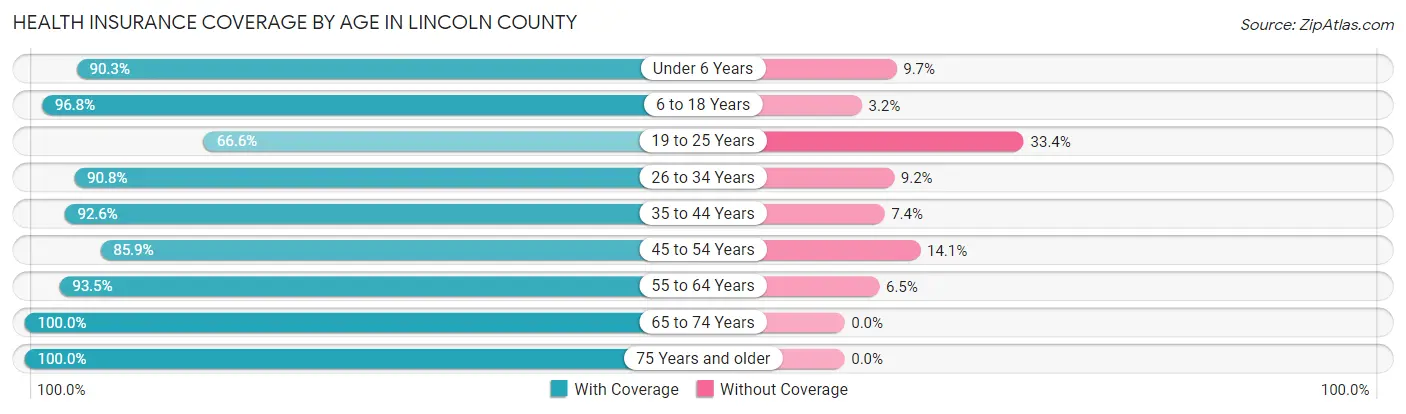
| Age Bracket | With Coverage | Without Coverage |
| Under 6 Years | 261 (90.3%) | 28 (9.7%) |
| 6 to 18 Years | 724 (96.8%) | 24 (3.2%) |
| 19 to 25 Years | 207 (66.6%) | 104 (33.4%) |
| 26 to 34 Years | 432 (90.8%) | 44 (9.2%) |
| 35 to 44 Years | 373 (92.6%) | 30 (7.4%) |
| 45 to 54 Years | 432 (85.9%) | 71 (14.1%) |
| 55 to 64 Years | 606 (93.5%) | 42 (6.5%) |
| 65 to 74 Years | 449 (100.0%) | 0 (0.0%) |
| 75 Years and older | 401 (100.0%) | 0 (0.0%) |
| Total | 3,885 (91.9%) | 343 (8.1%) |
Health Insurance Coverage by Citizenship Status in Lincoln County
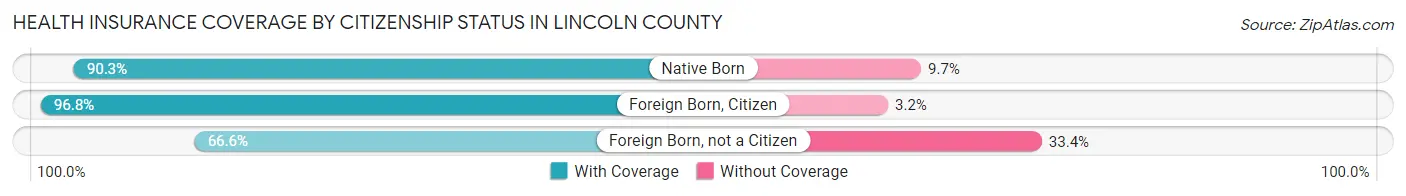
| Citizenship Status | With Coverage | Without Coverage |
| Native Born | 261 (90.3%) | 28 (9.7%) |
| Foreign Born, Citizen | 724 (96.8%) | 24 (3.2%) |
| Foreign Born, not a Citizen | 207 (66.6%) | 104 (33.4%) |
Health Insurance Coverage by Household Income in Lincoln County
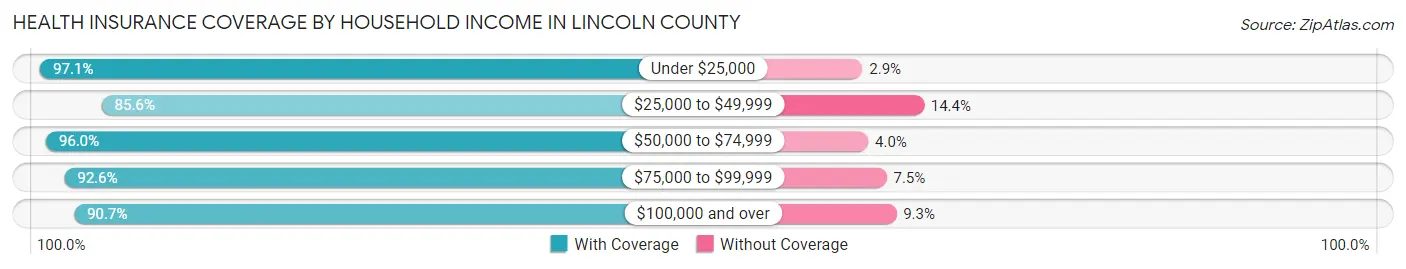
| Household Income | With Coverage | Without Coverage |
| Under $25,000 | 633 (97.1%) | 19 (2.9%) |
| $25,000 to $49,999 | 587 (85.6%) | 99 (14.4%) |
| $50,000 to $74,999 | 529 (96.0%) | 22 (4.0%) |
| $75,000 to $99,999 | 696 (92.5%) | 56 (7.4%) |
| $100,000 and over | 1,440 (90.7%) | 147 (9.3%) |
Public vs Private Health Insurance Coverage by Age in Lincoln County
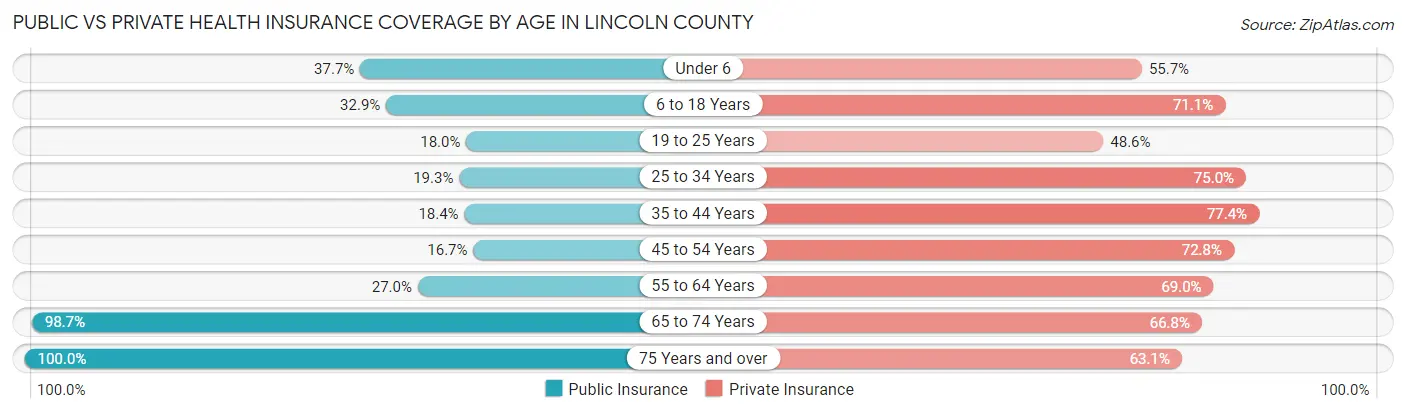
| Age Bracket | Public Insurance | Private Insurance |
| Under 6 | 109 (37.7%) | 161 (55.7%) |
| 6 to 18 Years | 246 (32.9%) | 532 (71.1%) |
| 19 to 25 Years | 56 (18.0%) | 151 (48.5%) |
| 25 to 34 Years | 92 (19.3%) | 357 (75.0%) |
| 35 to 44 Years | 74 (18.4%) | 312 (77.4%) |
| 45 to 54 Years | 84 (16.7%) | 366 (72.8%) |
| 55 to 64 Years | 175 (27.0%) | 447 (69.0%) |
| 65 to 74 Years | 443 (98.7%) | 300 (66.8%) |
| 75 Years and over | 401 (100.0%) | 253 (63.1%) |
| Total | 1,680 (39.7%) | 2,879 (68.1%) |
Disability Status by Sex by Age in Lincoln County
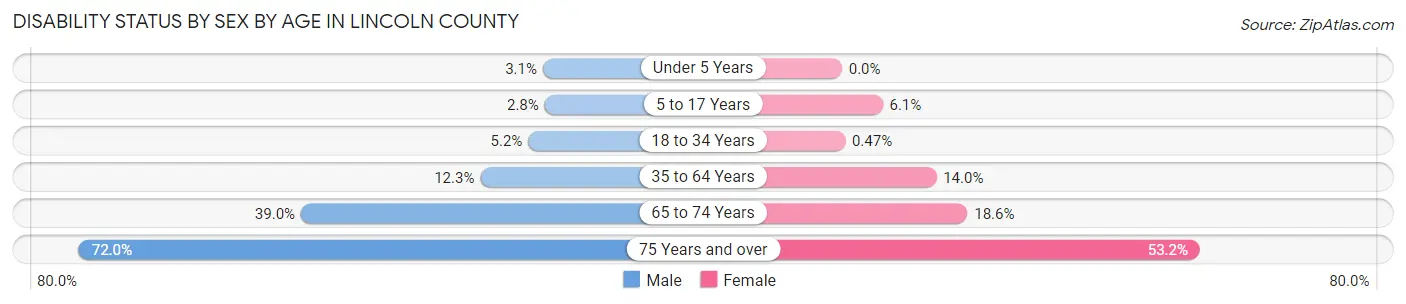
| Age Bracket | Male | Female |
| Under 5 Years | 4 (3.0%) | 0 (0.0%) |
| 5 to 17 Years | 10 (2.8%) | 21 (6.0%) |
| 18 to 34 Years | 23 (5.2%) | 2 (0.5%) |
| 35 to 64 Years | 94 (12.3%) | 111 (14.0%) |
| 65 to 74 Years | 83 (39.0%) | 44 (18.6%) |
| 75 Years and over | 118 (72.0%) | 126 (53.2%) |
Disability Class by Sex by Age in Lincoln County
Disability Class: Hearing Difficulty
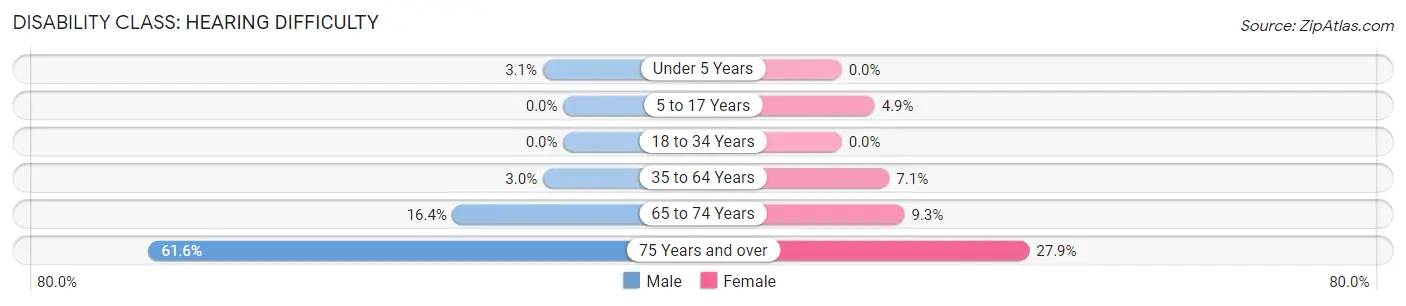
| Age Bracket | Male | Female |
| Under 5 Years | 4 (3.0%) | 0 (0.0%) |
| 5 to 17 Years | 0 (0.0%) | 17 (4.9%) |
| 18 to 34 Years | 0 (0.0%) | 0 (0.0%) |
| 35 to 64 Years | 23 (3.0%) | 56 (7.1%) |
| 65 to 74 Years | 35 (16.4%) | 22 (9.3%) |
| 75 Years and over | 101 (61.6%) | 66 (27.9%) |
Disability Class: Vision Difficulty
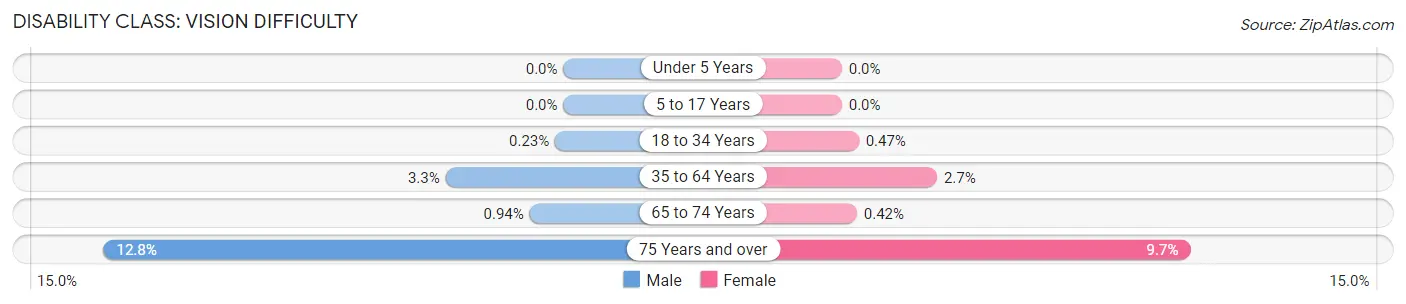
| Age Bracket | Male | Female |
| Under 5 Years | 0 (0.0%) | 0 (0.0%) |
| 5 to 17 Years | 0 (0.0%) | 0 (0.0%) |
| 18 to 34 Years | 1 (0.2%) | 2 (0.5%) |
| 35 to 64 Years | 25 (3.3%) | 21 (2.6%) |
| 65 to 74 Years | 2 (0.9%) | 1 (0.4%) |
| 75 Years and over | 21 (12.8%) | 23 (9.7%) |
Disability Class: Cognitive Difficulty
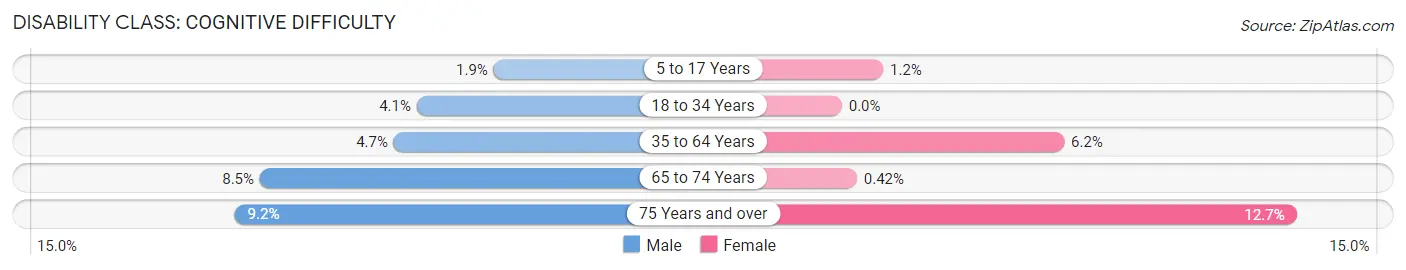
| Age Bracket | Male | Female |
| 5 to 17 Years | 7 (1.9%) | 4 (1.1%) |
| 18 to 34 Years | 18 (4.1%) | 0 (0.0%) |
| 35 to 64 Years | 36 (4.7%) | 49 (6.2%) |
| 65 to 74 Years | 18 (8.5%) | 1 (0.4%) |
| 75 Years and over | 15 (9.1%) | 30 (12.7%) |
Disability Class: Ambulatory Difficulty
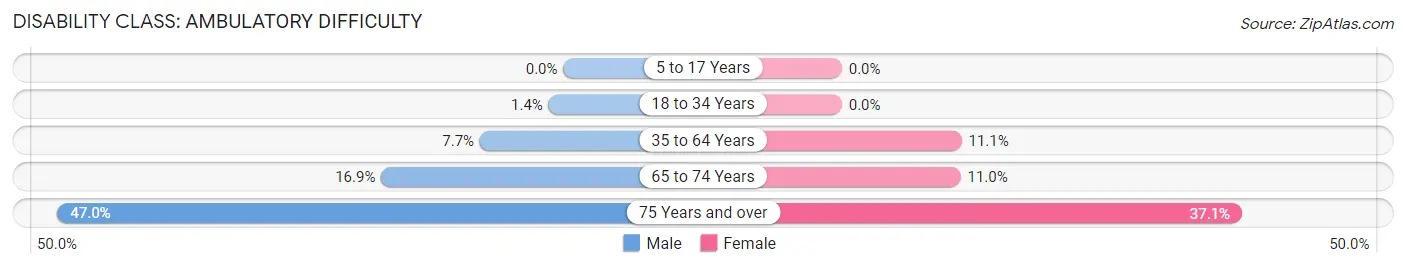
| Age Bracket | Male | Female |
| 5 to 17 Years | 0 (0.0%) | 0 (0.0%) |
| 18 to 34 Years | 6 (1.4%) | 0 (0.0%) |
| 35 to 64 Years | 59 (7.7%) | 88 (11.1%) |
| 65 to 74 Years | 36 (16.9%) | 26 (11.0%) |
| 75 Years and over | 77 (46.9%) | 88 (37.1%) |
Disability Class: Self-Care Difficulty
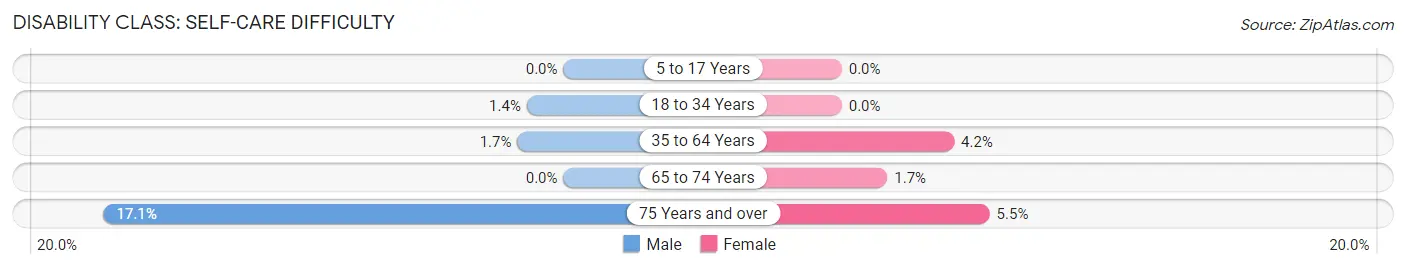
| Age Bracket | Male | Female |
| 5 to 17 Years | 0 (0.0%) | 0 (0.0%) |
| 18 to 34 Years | 6 (1.4%) | 0 (0.0%) |
| 35 to 64 Years | 13 (1.7%) | 33 (4.2%) |
| 65 to 74 Years | 0 (0.0%) | 4 (1.7%) |
| 75 Years and over | 28 (17.1%) | 13 (5.5%) |
Technology Access in Lincoln County
Computing Device Access in Lincoln County
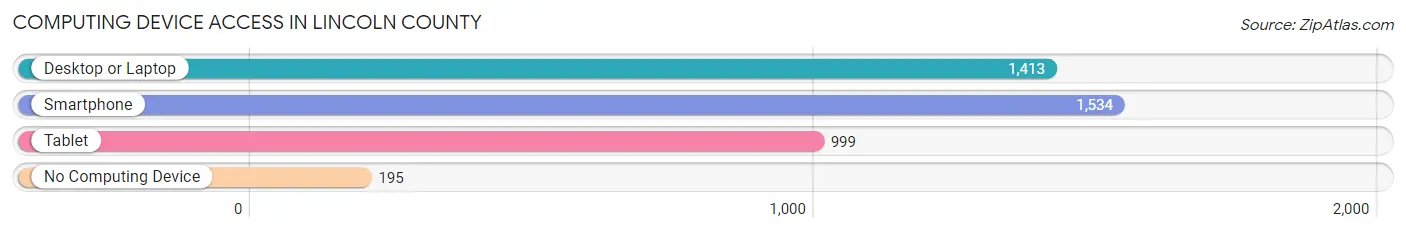
| Device Type | # Households | % Households |
| Desktop or Laptop | 1,413 | 73.5% |
| Smartphone | 1,534 | 79.8% |
| Tablet | 999 | 52.0% |
| No Computing Device | 195 | 10.2% |
| Total | 1,922 | 100.0% |
Internet Access in Lincoln County
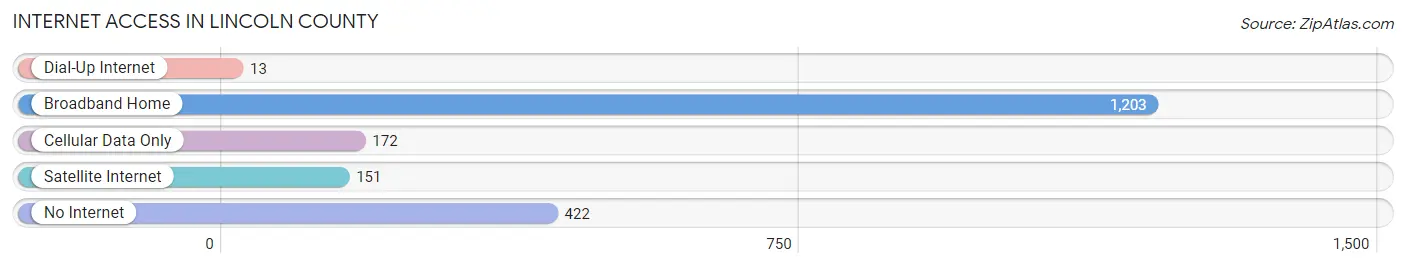
| Internet Type | # Households | % Households |
| Dial-Up Internet | 13 | 0.7% |
| Broadband Home | 1,203 | 62.6% |
| Cellular Data Only | 172 | 8.9% |
| Satellite Internet | 151 | 7.9% |
| No Internet | 422 | 22.0% |
| Total | 1,922 | 100.0% |
Lincoln County Summary
Lincoln County is located in the eastern part of Colorado, and is bordered by Elbert County to the north, El Paso County to the east, Crowley County to the south, and Kit Carson County to the west. The county seat is Hugo, and the county has a total area of 1,541 square miles. As of the 2010 census, the population was 5,467, making it the fourth least populous county in Colorado.
History
Lincoln County was established in 1889, and was named after President Abraham Lincoln. The county was originally part of Elbert County, but was split off in 1889 due to the large population growth in the area. The county was originally populated by Native American tribes, including the Arapaho, Cheyenne, and Ute.
Geography
Lincoln County is located in the eastern part of Colorado, and is bordered by Elbert County to the north, El Paso County to the east, Crowley County to the south, and Kit Carson County to the west. The county has a total area of 1,541 square miles, and is mostly flat, with some rolling hills. The county is located in the High Plains region of Colorado, and is mostly covered in grasslands and shrublands. The county is also home to several small lakes, including Lake Meredith and Lake Henry.
Economy
Lincoln County is primarily an agricultural county, with the majority of the population employed in the farming and ranching industries. The county is also home to several small businesses, including a few restaurants, gas stations, and convenience stores. The county is also home to several oil and gas wells, which provide a significant source of income for the county.
Demographics
As of the 2010 census, the population of Lincoln County was 5,467, making it the fourth least populous county in Colorado. The population is spread out, with the majority of the population living in the rural areas of the county. The racial makeup of the county is 95.3% White, 0.7% Native American, 0.3% Asian, 0.2% Black or African American, 0.1% Pacific Islander, and 2.4% from two or more races. The median household income in the county is $41,945, and the median age is 43.7 years. The county has a poverty rate of 11.3%, and the unemployment rate is 4.2%.
Common Questions
What is Per Capita Income in Lincoln County?
Per Capita income in Lincoln County is $27,610.
What is the Median Family Income in Lincoln County?
Median Family Income in Lincoln County is $89,519.
What is the Median Household income in Lincoln County?
Median Household Income in Lincoln County is $59,167.
What is Income or Wage Gap in Lincoln County?
Income or Wage Gap in Lincoln County is 9.0%.
Women in Lincoln County earn 91.0 cents for every dollar earned by a man.
What is Family Income Deficit in Lincoln County?
Family Income Deficit in Lincoln County is $9,275.
Families that are below poverty line in Lincoln County earn $9,275 less on average than the poverty threshold level.
What is Inequality or Gini Index in Lincoln County?
Inequality or Gini Index in Lincoln County is 0.49.
What is the Total Population of Lincoln County?
Total Population of Lincoln County is 5,583.
What is the Total Male Population of Lincoln County?
Total Male Population of Lincoln County is 3,377.
What is the Total Female Population of Lincoln County?
Total Female Population of Lincoln County is 2,206.
What is the Ratio of Males per 100 Females in Lincoln County?
There are 153.08 Males per 100 Females in Lincoln County.
What is the Ratio of Females per 100 Males in Lincoln County?
There are 65.32 Females per 100 Males in Lincoln County.
What is the Median Population Age in Lincoln County?
Median Population Age in Lincoln County is 40.4 Years.
What is the Average Family Size in Lincoln County
Average Family Size in Lincoln County is 2.9 People.
What is the Average Household Size in Lincoln County
Average Household Size in Lincoln County is 2.2 People.
How Large is the Labor Force in Lincoln County?
There are 2,235 People in the Labor Forcein in Lincoln County.
What is the Percentage of People in the Labor Force in Lincoln County?
47.3% of People are in the Labor Force in Lincoln County.
What is the Unemployment Rate in Lincoln County?
Unemployment Rate in Lincoln County is 2.3%.