Las Animas County, CO Map & Demographics
Las Animas County Overview
$29,432
PER CAPITA INCOME
$63,730
AVG FAMILY INCOME
$48,965
AVG HOUSEHOLD INCOME
20.9%
WAGE / INCOME GAP [ % ]
79.1¢/ $1
WAGE / INCOME GAP [ $ ]
$11,863
FAMILY INCOME DEFICIT
0.47
INEQUALITY / GINI INDEX
14,422
TOTAL POPULATION
7,537
MALE POPULATION
6,885
FEMALE POPULATION
109.47
MALES / 100 FEMALES
91.35
FEMALES / 100 MALES
46.8
MEDIAN AGE
2.6
AVG FAMILY SIZE
2.1
AVG HOUSEHOLD SIZE
6,295
LABOR FORCE [ PEOPLE ]
51.8%
PERCENT IN LABOR FORCE
7.4%
UNEMPLOYMENT RATE
Las Animas County Area Codes
Income in Las Animas County
Income Overview in Las Animas County
Per Capita Income in Las Animas County is $29,432, while median incomes of families and households are $63,730 and $48,965 respectively.
| Characteristic | Number | Measure |
| Per Capita Income | 14,422 | $29,432 |
| Median Family Income | 3,806 | $63,730 |
| Mean Family Income | 3,806 | $79,156 |
| Median Household Income | 6,631 | $48,965 |
| Mean Household Income | 6,631 | $64,640 |
| Income Deficit | 3,806 | $11,863 |
| Wage / Income Gap (%) | 14,422 | 20.89% |
| Wage / Income Gap ($) | 14,422 | 79.11¢ per $1 |
| Gini / Inequality Index | 14,422 | 0.47 |
Earnings by Sex in Las Animas County
Average Earnings in Las Animas County are $32,285, $35,824 for men and $28,339 for women, a difference of 20.9%.
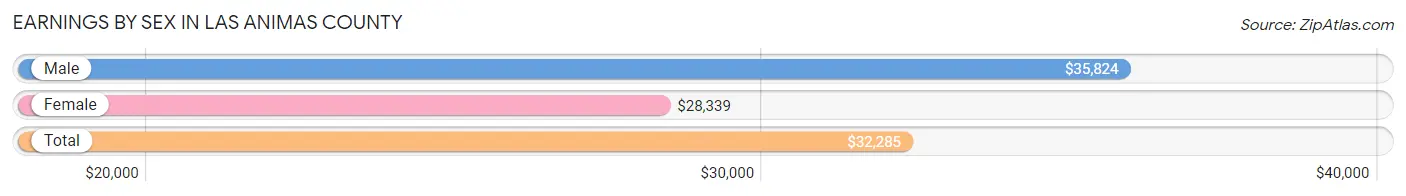
| Sex | Number | Average Earnings |
| Male | 3,555 (54.3%) | $35,824 |
| Female | 2,992 (45.7%) | $28,339 |
| Total | 6,547 (100.0%) | $32,285 |
Earnings by Sex by Income Bracket in Las Animas County
The most common earnings brackets in Las Animas County are $25,000 to $29,999 for men (316 | 8.9%) and $2,499 or less for women (288 | 9.6%).
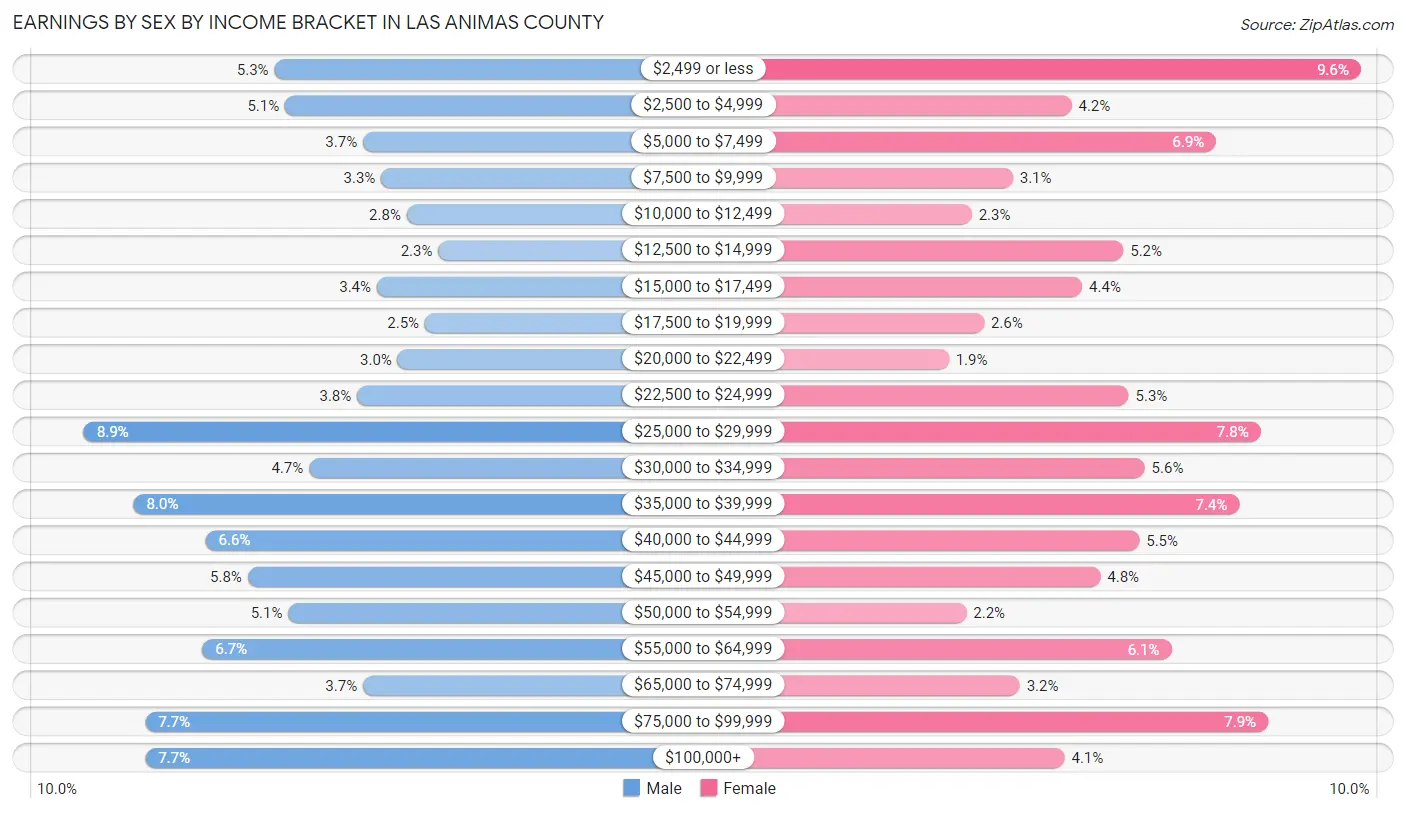
| Income | Male | Female |
| $2,499 or less | 189 (5.3%) | 288 (9.6%) |
| $2,500 to $4,999 | 182 (5.1%) | 126 (4.2%) |
| $5,000 to $7,499 | 130 (3.7%) | 207 (6.9%) |
| $7,500 to $9,999 | 118 (3.3%) | 93 (3.1%) |
| $10,000 to $12,499 | 101 (2.8%) | 70 (2.3%) |
| $12,500 to $14,999 | 80 (2.2%) | 155 (5.2%) |
| $15,000 to $17,499 | 121 (3.4%) | 132 (4.4%) |
| $17,500 to $19,999 | 89 (2.5%) | 77 (2.6%) |
| $20,000 to $22,499 | 107 (3.0%) | 57 (1.9%) |
| $22,500 to $24,999 | 134 (3.8%) | 158 (5.3%) |
| $25,000 to $29,999 | 316 (8.9%) | 232 (7.7%) |
| $30,000 to $34,999 | 166 (4.7%) | 167 (5.6%) |
| $35,000 to $39,999 | 283 (8.0%) | 220 (7.3%) |
| $40,000 to $44,999 | 235 (6.6%) | 164 (5.5%) |
| $45,000 to $49,999 | 207 (5.8%) | 142 (4.8%) |
| $50,000 to $54,999 | 180 (5.1%) | 67 (2.2%) |
| $55,000 to $64,999 | 237 (6.7%) | 182 (6.1%) |
| $65,000 to $74,999 | 130 (3.7%) | 97 (3.2%) |
| $75,000 to $99,999 | 275 (7.7%) | 236 (7.9%) |
| $100,000+ | 275 (7.7%) | 122 (4.1%) |
| Total | 3,555 (100.0%) | 2,992 (100.0%) |
Earnings by Sex by Educational Attainment in Las Animas County
Average earnings in Las Animas County are $40,810 for men and $31,982 for women, a difference of 21.6%. Men with an educational attainment of graduate degree enjoy the highest average annual earnings of $58,750, while those with less than high school education earn the least with $24,000. Women with an educational attainment of graduate degree earn the most with the average annual earnings of $67,083, while those with less than high school education have the smallest earnings of $23,877.
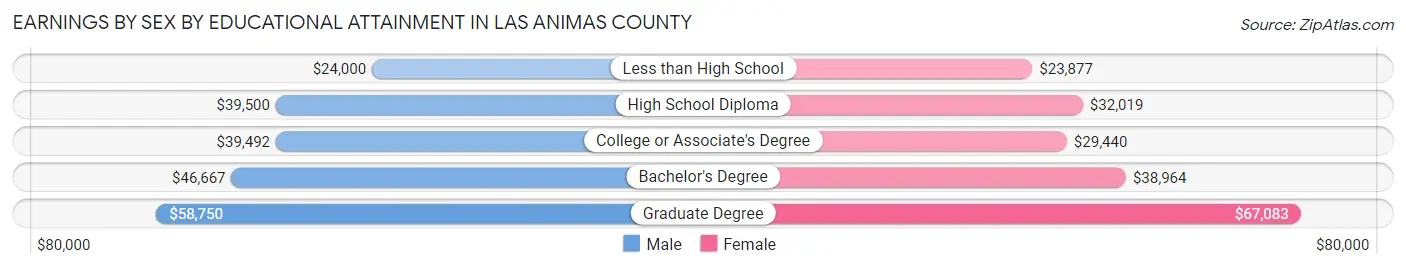
| Educational Attainment | Male Income | Female Income |
| Less than High School | $24,000 | $23,877 |
| High School Diploma | $39,500 | $32,019 |
| College or Associate's Degree | $39,492 | $29,440 |
| Bachelor's Degree | $46,667 | $38,964 |
| Graduate Degree | $58,750 | $67,083 |
| Total | $40,810 | $31,982 |
Family Income in Las Animas County
Family Income Brackets in Las Animas County
According to the Las Animas County family income data, there are 856 families falling into the $50,000 to $74,999 income range, which is the most common income bracket and makes up 22.5% of all families. Conversely, the $10,000 to $14,999 income bracket is the least frequent group with only 88 families (2.3%) belonging to this category.

| Income Bracket | # Families | % Families |
| Less than $10,000 | 171 | 4.5% |
| $10,000 to $14,999 | 88 | 2.3% |
| $15,000 to $24,999 | 312 | 8.2% |
| $25,000 to $34,999 | 403 | 10.6% |
| $35,000 to $49,999 | 472 | 12.4% |
| $50,000 to $74,999 | 856 | 22.5% |
| $75,000 to $99,999 | 556 | 14.6% |
| $100,000 to $149,999 | 556 | 14.6% |
| $150,000 to $199,999 | 202 | 5.3% |
| $200,000+ | 190 | 5.0% |
Family Income by Famaliy Size in Las Animas County
6-person families (64 | 1.7%) account for the highest median family income in Las Animas County with $126,250 per family, while 2-person families (2,393 | 62.9%) have the highest median income of $29,416 per family member.

| Income Bracket | # Families | Median Income |
| 2-Person Families | 2,393 (62.9%) | $58,832 |
| 3-Person Families | 633 (16.6%) | $70,512 |
| 4-Person Families | 414 (10.9%) | $74,551 |
| 5-Person Families | 206 (5.4%) | $84,722 |
| 6-Person Families | 64 (1.7%) | $126,250 |
| 7+ Person Families | 96 (2.5%) | $0 |
| Total | 3,806 (100.0%) | $63,730 |
Family Income by Number of Earners in Las Animas County
The median family income in Las Animas County is $63,730, with families comprising 3+ earners (205) having the highest median family income of $93,750, while families with no earners (927) have the lowest median family income of $44,750, accounting for 5.4% and 24.4% of families, respectively.
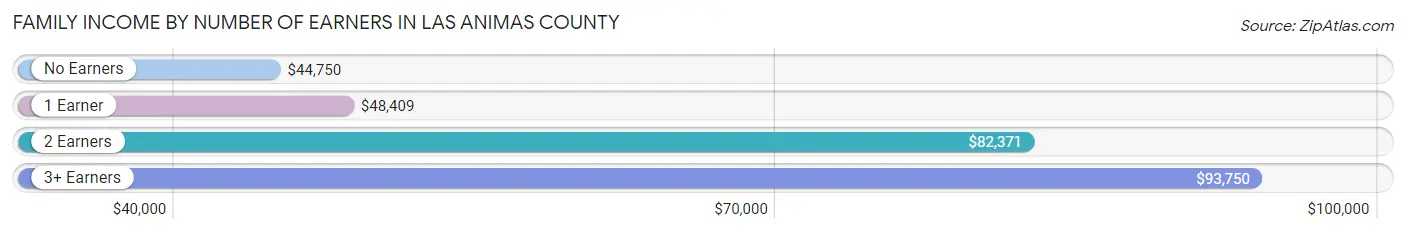
| Number of Earners | # Families | Median Income |
| No Earners | 927 (24.4%) | $44,750 |
| 1 Earner | 1,368 (35.9%) | $48,409 |
| 2 Earners | 1,306 (34.3%) | $82,371 |
| 3+ Earners | 205 (5.4%) | $93,750 |
| Total | 3,806 (100.0%) | $63,730 |
Household Income in Las Animas County
Household Income Brackets in Las Animas County
With 1,339 households falling in the category, the $50,000 to $74,999 income range is the most frequent in Las Animas County, accounting for 20.2% of all households. In contrast, only 153 households (2.3%) fall into the $150,000 to $199,999 income bracket, making it the least populous group.

| Income Bracket | # Households | % Households |
| Less than $10,000 | 570 | 8.6% |
| $10,000 to $14,999 | 484 | 7.3% |
| $15,000 to $24,999 | 716 | 10.8% |
| $25,000 to $34,999 | 763 | 11.5% |
| $35,000 to $49,999 | 842 | 12.7% |
| $50,000 to $74,999 | 1,339 | 20.2% |
| $75,000 to $99,999 | 676 | 10.2% |
| $100,000 to $149,999 | 776 | 11.7% |
| $150,000 to $199,999 | 153 | 2.3% |
| $200,000+ | 312 | 4.7% |
Household Income by Householder Age in Las Animas County
The median household income in Las Animas County is $48,965, with the highest median household income of $57,375 found in the 45 to 64 years age bracket for the primary householder. A total of 2,296 households (34.6%) fall into this category. Meanwhile, the 15 to 24 years age bracket for the primary householder has the lowest median household income of $35,764, with 285 households (4.3%) in this group.

| Income Bracket | # Households | Median Income |
| 15 to 24 Years | 285 (4.3%) | $35,764 |
| 25 to 44 Years | 1,594 (24.0%) | $51,884 |
| 45 to 64 Years | 2,296 (34.6%) | $57,375 |
| 65+ Years | 2,456 (37.0%) | $38,654 |
| Total | 6,631 (100.0%) | $48,965 |
Poverty in Las Animas County
Income Below Poverty by Sex and Age in Las Animas County
With 18.4% poverty level for males and 19.8% for females among the residents of Las Animas County, 15 year old males and 25 to 34 year old females are the most vulnerable to poverty, with 45 males (62.5%) and 264 females (38.9%) in their respective age groups living below the poverty level.
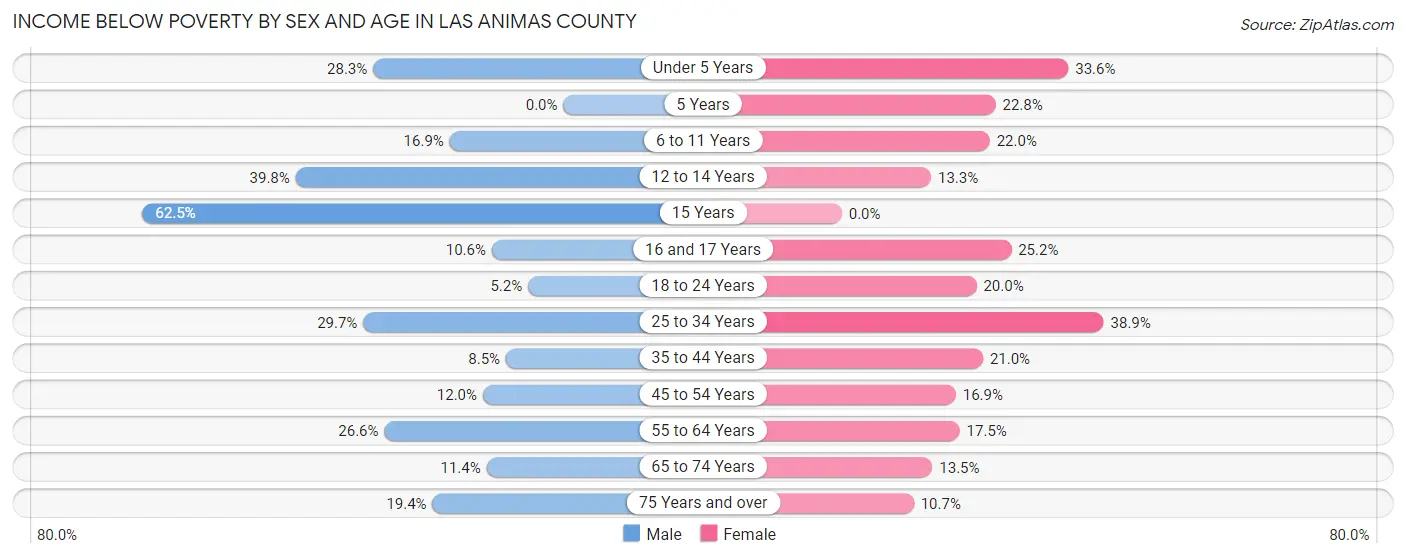
| Age Bracket | Male | Female |
| Under 5 Years | 89 (28.2%) | 114 (33.6%) |
| 5 Years | 0 (0.0%) | 21 (22.8%) |
| 6 to 11 Years | 78 (16.9%) | 87 (22.0%) |
| 12 to 14 Years | 101 (39.8%) | 31 (13.3%) |
| 15 Years | 45 (62.5%) | 0 (0.0%) |
| 16 and 17 Years | 22 (10.6%) | 39 (25.2%) |
| 18 to 24 Years | 30 (5.2%) | 81 (20.0%) |
| 25 to 34 Years | 247 (29.7%) | 264 (38.9%) |
| 35 to 44 Years | 63 (8.5%) | 148 (21.0%) |
| 45 to 54 Years | 93 (11.9%) | 131 (16.9%) |
| 55 to 64 Years | 281 (26.6%) | 192 (17.5%) |
| 65 to 74 Years | 126 (11.4%) | 138 (13.5%) |
| 75 Years and over | 124 (19.4%) | 82 (10.7%) |
| Total | 1,299 (18.4%) | 1,328 (19.8%) |
Income Above Poverty by Sex and Age in Las Animas County
According to the poverty statistics in Las Animas County, males aged 5 years and females aged 15 years are the age groups that are most secure financially, with 100.0% of males and 100.0% of females in these age groups living above the poverty line.
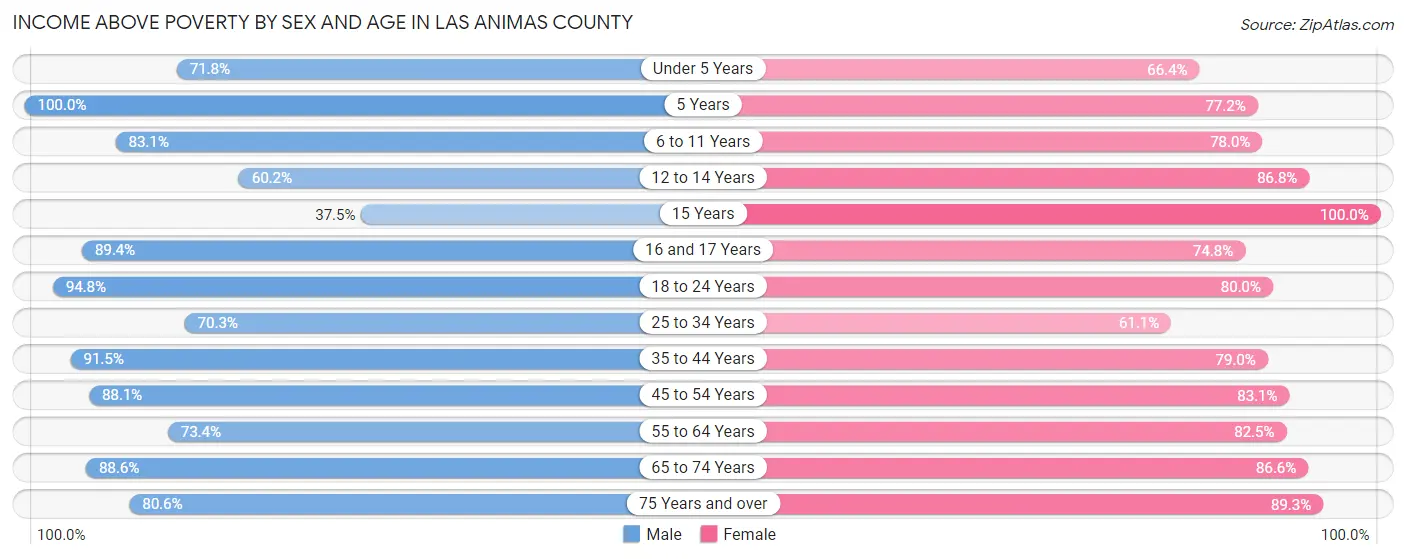
| Age Bracket | Male | Female |
| Under 5 Years | 226 (71.8%) | 225 (66.4%) |
| 5 Years | 41 (100.0%) | 71 (77.2%) |
| 6 to 11 Years | 384 (83.1%) | 309 (78.0%) |
| 12 to 14 Years | 153 (60.2%) | 203 (86.8%) |
| 15 Years | 27 (37.5%) | 48 (100.0%) |
| 16 and 17 Years | 185 (89.4%) | 116 (74.8%) |
| 18 to 24 Years | 543 (94.8%) | 324 (80.0%) |
| 25 to 34 Years | 584 (70.3%) | 415 (61.1%) |
| 35 to 44 Years | 676 (91.5%) | 558 (79.0%) |
| 45 to 54 Years | 685 (88.0%) | 643 (83.1%) |
| 55 to 64 Years | 776 (73.4%) | 905 (82.5%) |
| 65 to 74 Years | 979 (88.6%) | 888 (86.6%) |
| 75 Years and over | 514 (80.6%) | 686 (89.3%) |
| Total | 5,773 (81.6%) | 5,391 (80.2%) |
Income Below Poverty Among Married-Couple Families in Las Animas County
The poverty statistics for married-couple families in Las Animas County show that 6.9% or 180 of the total 2,614 families live below the poverty line. Families with 5 or more children have the highest poverty rate of 61.8%, comprising of 47 families. On the other hand, families with 3 or 4 children have the lowest poverty rate of 0.6%, which includes 1 families.
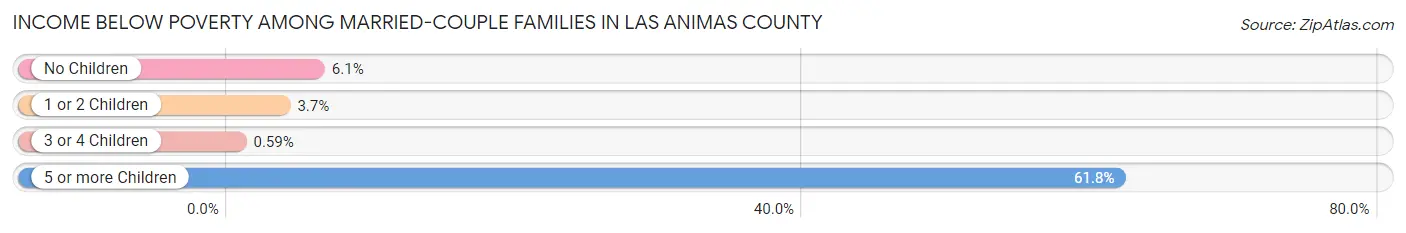
| Children | Above Poverty | Below Poverty |
| No Children | 1,787 (94.0%) | 115 (6.0%) |
| 1 or 2 Children | 449 (96.4%) | 17 (3.6%) |
| 3 or 4 Children | 169 (99.4%) | 1 (0.6%) |
| 5 or more Children | 29 (38.2%) | 47 (61.8%) |
| Total | 2,434 (93.1%) | 180 (6.9%) |
Income Below Poverty Among Single-Parent Households in Las Animas County
According to the poverty data in Las Animas County, 12.0% or 32 single-father households and 25.7% or 238 single-mother households are living below the poverty line. Among single-father households, those with no children have the highest poverty rate, with 28 households (25.2%) experiencing poverty. Likewise, among single-mother households, those with 3 or 4 children have the highest poverty rate, with 55 households (48.7%) falling below the poverty line.
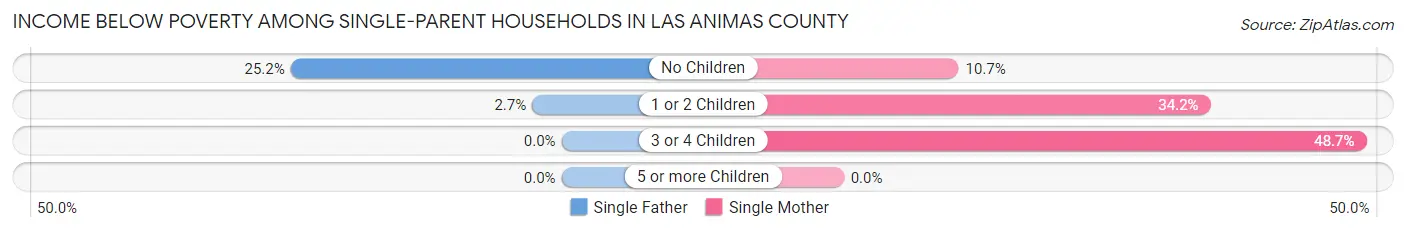
| Children | Single Father | Single Mother |
| No Children | 28 (25.2%) | 43 (10.7%) |
| 1 or 2 Children | 4 (2.7%) | 140 (34.2%) |
| 3 or 4 Children | 0 (0.0%) | 55 (48.7%) |
| 5 or more Children | 0 (0.0%) | 0 (0.0%) |
| Total | 32 (12.0%) | 238 (25.7%) |
Income Below Poverty Among Married-Couple vs Single-Parent Households in Las Animas County
The poverty data for Las Animas County shows that 180 of the married-couple family households (6.9%) and 270 of the single-parent households (22.7%) are living below the poverty level. Within the married-couple family households, those with 5 or more children have the highest poverty rate, with 47 households (61.8%) falling below the poverty line. Among the single-parent households, those with 3 or 4 children have the highest poverty rate, with 55 household (44.7%) living below poverty.
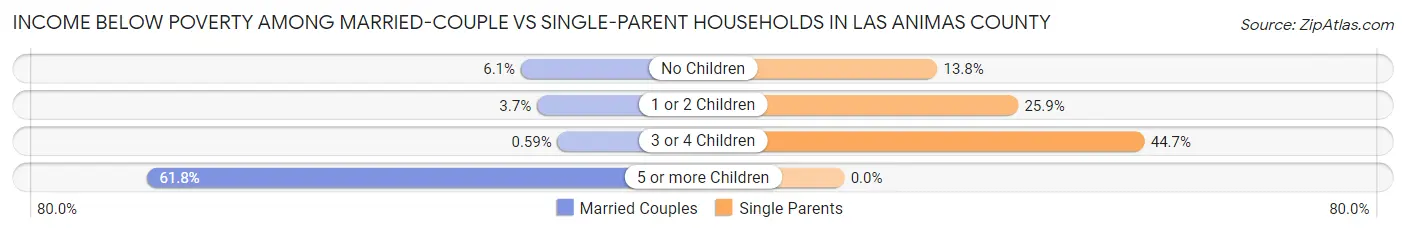
| Children | Married-Couple Families | Single-Parent Households |
| No Children | 115 (6.0%) | 71 (13.8%) |
| 1 or 2 Children | 17 (3.6%) | 144 (25.9%) |
| 3 or 4 Children | 1 (0.6%) | 55 (44.7%) |
| 5 or more Children | 47 (61.8%) | 0 (0.0%) |
| Total | 180 (6.9%) | 270 (22.7%) |
Race in Las Animas County
The most populous races in Las Animas County are White / Caucasian (10,314 | 71.5%), Hispanic or Latino (5,887 | 40.8%), and Two or more Races (2,631 | 18.2%).
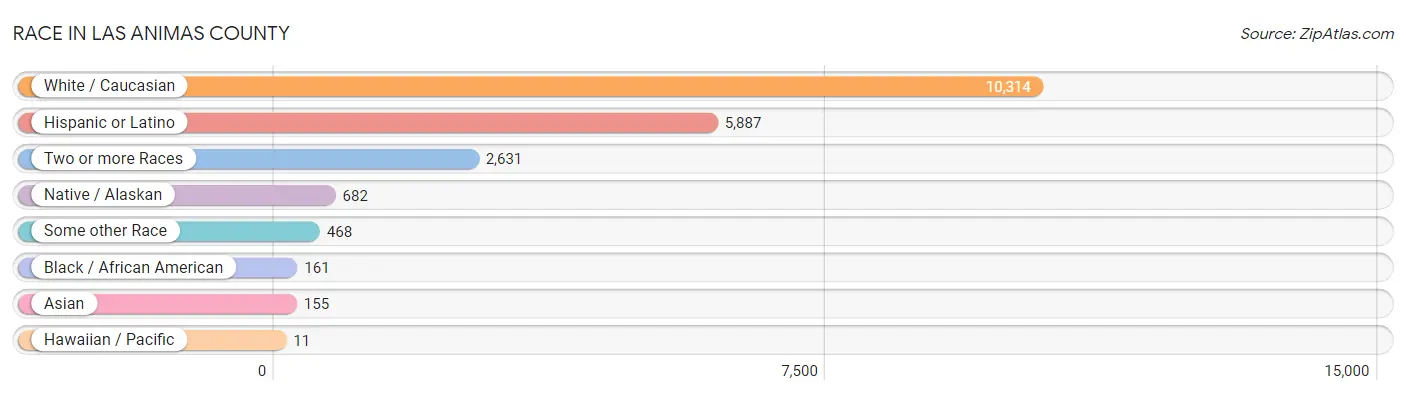
| Race | # Population | % Population |
| Asian | 155 | 1.1% |
| Black / African American | 161 | 1.1% |
| Hawaiian / Pacific | 11 | 0.1% |
| Hispanic or Latino | 5,887 | 40.8% |
| Native / Alaskan | 682 | 4.7% |
| White / Caucasian | 10,314 | 71.5% |
| Two or more Races | 2,631 | 18.2% |
| Some other Race | 468 | 3.3% |
| Total | 14,422 | 100.0% |
Ancestry in Las Animas County
The most populous ancestries reported in Las Animas County are Mexican (3,190 | 22.1%), Italian (1,889 | 13.1%), German (1,840 | 12.8%), Irish (1,437 | 10.0%), and English (1,254 | 8.7%), together accounting for 66.6% of all Las Animas County residents.
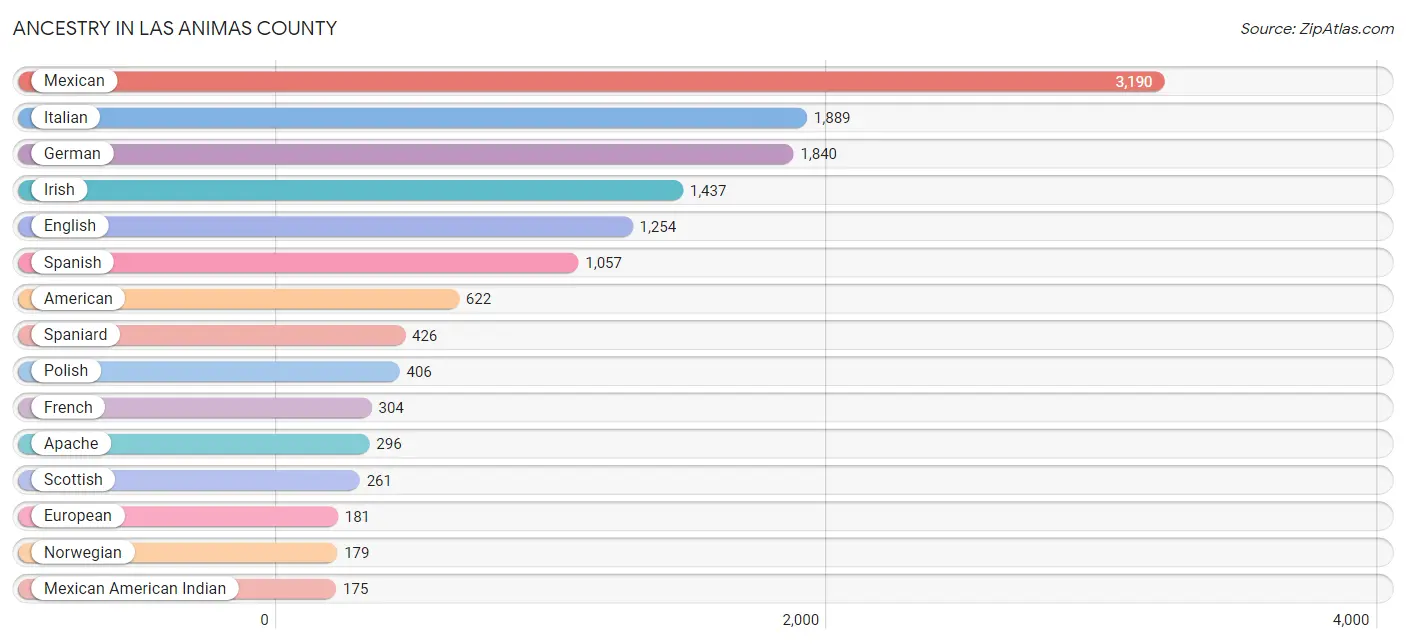
| Ancestry | # Population | % Population |
| African | 11 | 0.1% |
| American | 622 | 4.3% |
| Apache | 296 | 2.1% |
| Arab | 22 | 0.2% |
| Austrian | 39 | 0.3% |
| Basque | 7 | 0.1% |
| Belgian | 18 | 0.1% |
| Bhutanese | 7 | 0.1% |
| Blackfeet | 9 | 0.1% |
| Brazilian | 11 | 0.1% |
| British | 67 | 0.5% |
| Burmese | 85 | 0.6% |
| Canadian | 17 | 0.1% |
| Central American | 7 | 0.1% |
| Cherokee | 133 | 0.9% |
| Cheyenne | 17 | 0.1% |
| Choctaw | 4 | 0.0% |
| Comanche | 27 | 0.2% |
| Costa Rican | 7 | 0.1% |
| Cree | 15 | 0.1% |
| Croatian | 24 | 0.2% |
| Czech | 39 | 0.3% |
| Czechoslovakian | 8 | 0.1% |
| Danish | 49 | 0.3% |
| Dutch | 117 | 0.8% |
| Eastern European | 24 | 0.2% |
| English | 1,254 | 8.7% |
| European | 181 | 1.3% |
| Finnish | 7 | 0.1% |
| French | 304 | 2.1% |
| French Canadian | 119 | 0.8% |
| German | 1,840 | 12.8% |
| Greek | 46 | 0.3% |
| Hungarian | 12 | 0.1% |
| Indian (Asian) | 53 | 0.4% |
| Irish | 1,437 | 10.0% |
| Iroquois | 3 | 0.0% |
| Italian | 1,889 | 13.1% |
| Kiowa | 1 | 0.0% |
| Korean | 81 | 0.6% |
| Laotian | 21 | 0.2% |
| Latvian | 2 | 0.0% |
| Lebanese | 4 | 0.0% |
| Mexican | 3,190 | 22.1% |
| Mexican American Indian | 175 | 1.2% |
| Mongolian | 20 | 0.1% |
| Native Hawaiian | 15 | 0.1% |
| Navajo | 118 | 0.8% |
| Northern European | 14 | 0.1% |
| Norwegian | 179 | 1.2% |
| Pakistani | 115 | 0.8% |
| Polish | 406 | 2.8% |
| Portuguese | 18 | 0.1% |
| Pueblo | 32 | 0.2% |
| Puerto Rican | 52 | 0.4% |
| Romanian | 8 | 0.1% |
| Russian | 21 | 0.2% |
| Samoan | 11 | 0.1% |
| Scandinavian | 50 | 0.4% |
| Scotch-Irish | 175 | 1.2% |
| Scottish | 261 | 1.8% |
| Seminole | 26 | 0.2% |
| Serbian | 7 | 0.1% |
| Sioux | 1 | 0.0% |
| Slavic | 69 | 0.5% |
| Slovene | 22 | 0.2% |
| Spaniard | 426 | 2.9% |
| Spanish | 1,057 | 7.3% |
| Spanish American | 56 | 0.4% |
| Spanish American Indian | 15 | 0.1% |
| Sri Lankan | 4 | 0.0% |
| Subsaharan African | 11 | 0.1% |
| Swedish | 108 | 0.7% |
| Swiss | 55 | 0.4% |
| Thai | 4 | 0.0% |
| Ukrainian | 21 | 0.2% |
| Ute | 39 | 0.3% |
| Welsh | 90 | 0.6% |
| Yaqui | 10 | 0.1% |
| Yugoslavian | 7 | 0.1% | View All 80 Rows |
Immigrants in Las Animas County
The most numerous immigrant groups reported in Las Animas County came from Latin America (323 | 2.2%), Central America (287 | 2.0%), Mexico (279 | 1.9%), Asia (98 | 0.7%), and South Eastern Asia (75 | 0.5%), together accounting for 7.4% of all Las Animas County residents.
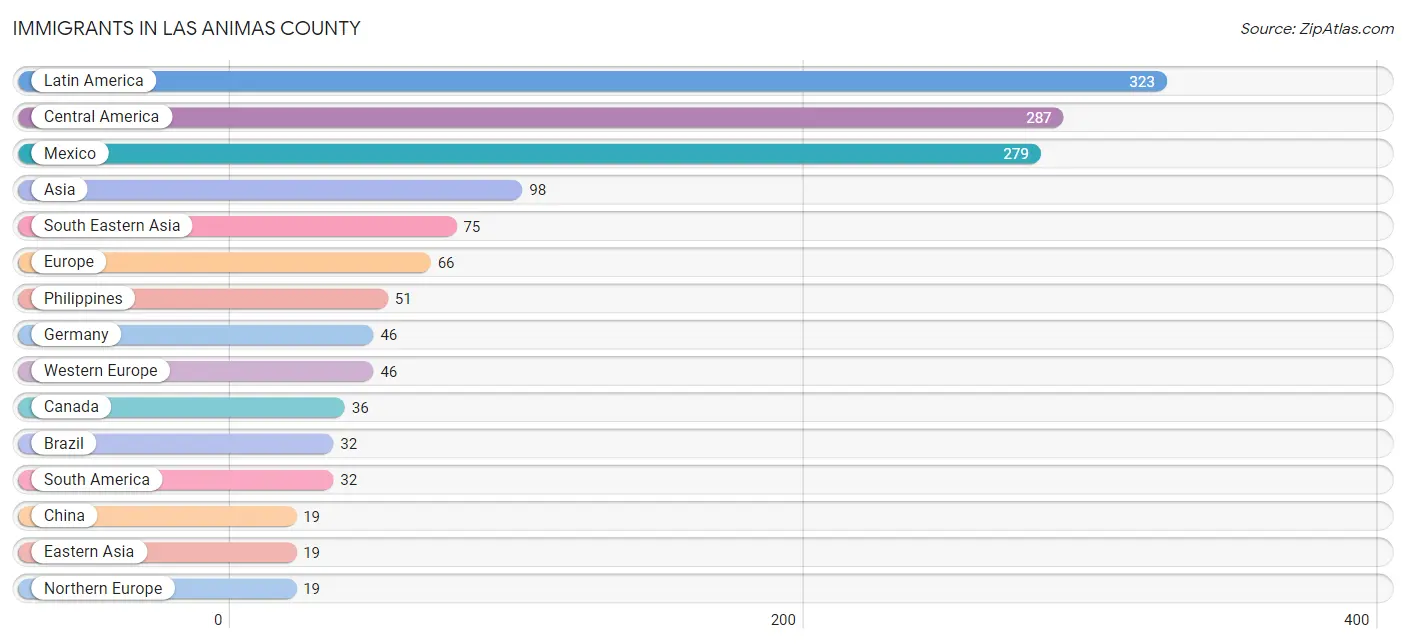
| Immigration Origin | # Population | % Population |
| Africa | 2 | 0.0% |
| Asia | 98 | 0.7% |
| Brazil | 32 | 0.2% |
| Canada | 36 | 0.3% |
| Caribbean | 4 | 0.0% |
| Central America | 287 | 2.0% |
| China | 19 | 0.1% |
| Costa Rica | 7 | 0.1% |
| Eastern Asia | 19 | 0.1% |
| Egypt | 2 | 0.0% |
| El Salvador | 1 | 0.0% |
| Europe | 66 | 0.5% |
| Germany | 46 | 0.3% |
| India | 4 | 0.0% |
| Italy | 1 | 0.0% |
| Jamaica | 4 | 0.0% |
| Latin America | 323 | 2.2% |
| Mexico | 279 | 1.9% |
| Northern Africa | 2 | 0.0% |
| Northern Europe | 19 | 0.1% |
| Philippines | 51 | 0.4% |
| South America | 32 | 0.2% |
| South Central Asia | 4 | 0.0% |
| South Eastern Asia | 75 | 0.5% |
| Southern Europe | 1 | 0.0% |
| Vietnam | 4 | 0.0% |
| Western Europe | 46 | 0.3% | View All 27 Rows |
Sex and Age in Las Animas County
Sex and Age in Las Animas County
The most populous age groups in Las Animas County are 65 to 69 Years (673 | 8.9%) for men and 65 to 69 Years (636 | 9.2%) for women.

| Age Bracket | Male | Female |
| Under 5 Years | 315 (4.2%) | 351 (5.1%) |
| 5 to 9 Years | 377 (5.0%) | 358 (5.2%) |
| 10 to 14 Years | 384 (5.1%) | 364 (5.3%) |
| 15 to 19 Years | 419 (5.6%) | 336 (4.9%) |
| 20 to 24 Years | 557 (7.4%) | 362 (5.3%) |
| 25 to 29 Years | 434 (5.8%) | 349 (5.1%) |
| 30 to 34 Years | 547 (7.3%) | 330 (4.8%) |
| 35 to 39 Years | 434 (5.8%) | 439 (6.4%) |
| 40 to 44 Years | 399 (5.3%) | 267 (3.9%) |
| 45 to 49 Years | 458 (6.1%) | 369 (5.4%) |
| 50 to 54 Years | 326 (4.3%) | 418 (6.1%) |
| 55 to 59 Years | 543 (7.2%) | 509 (7.4%) |
| 60 to 64 Years | 573 (7.6%) | 588 (8.5%) |
| 65 to 69 Years | 673 (8.9%) | 636 (9.2%) |
| 70 to 74 Years | 451 (6.0%) | 408 (5.9%) |
| 75 to 79 Years | 301 (4.0%) | 385 (5.6%) |
| 80 to 84 Years | 232 (3.1%) | 240 (3.5%) |
| 85 Years and over | 114 (1.5%) | 176 (2.6%) |
| Total | 7,537 (100.0%) | 6,885 (100.0%) |
Families and Households in Las Animas County
Median Family Size in Las Animas County
The median family size in Las Animas County is 2.64 persons per family, with married-couple families (2,614 | 68.7%) accounting for the largest median family size of 2.76 persons per family. On the other hand, single male/father families (267 | 7.0%) represent the smallest median family size with 2.02 persons per family.
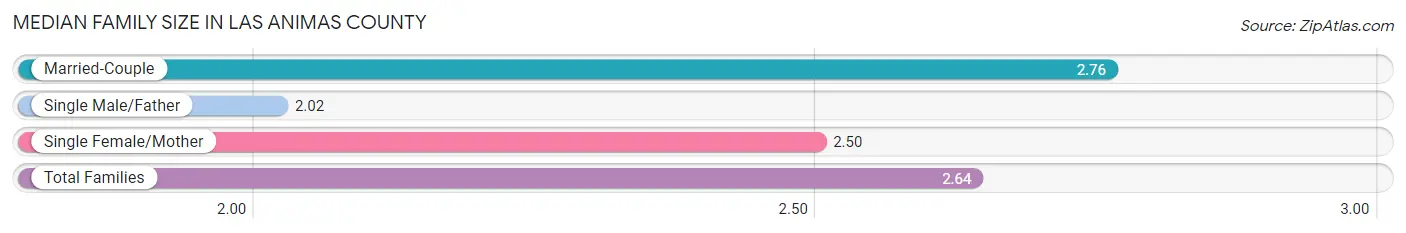
| Family Type | # Families | Family Size |
| Married-Couple | 2,614 (68.7%) | 2.76 |
| Single Male/Father | 267 (7.0%) | 2.02 |
| Single Female/Mother | 925 (24.3%) | 2.50 |
| Total Families | 3,806 (100.0%) | 2.64 |
Median Household Size in Las Animas County
The median household size in Las Animas County is 2.07 persons per household, with single female/mother households (925 | 14.0%) accounting for the largest median household size of 2.79 persons per household. non-family households (2,825 | 42.6%) represent the smallest median household size with 1.16 persons per household.
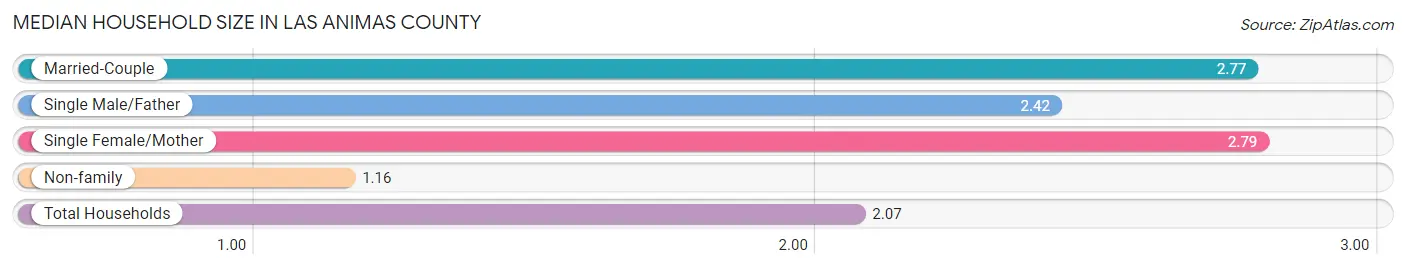
| Household Type | # Households | Household Size |
| Married-Couple | 2,614 (39.4%) | 2.77 |
| Single Male/Father | 267 (4.0%) | 2.42 |
| Single Female/Mother | 925 (14.0%) | 2.79 |
| Non-family | 2,825 (42.6%) | 1.16 |
| Total Households | 6,631 (100.0%) | 2.07 |
Household Size by Marriage Status in Las Animas County
Out of a total of 6,631 households in Las Animas County, 3,806 (57.4%) are family households, while 2,825 (42.6%) are nonfamily households. The most numerous type of family households are 2-person households, comprising 2,167, and the most common type of nonfamily households are 1-person households, comprising 2,442.
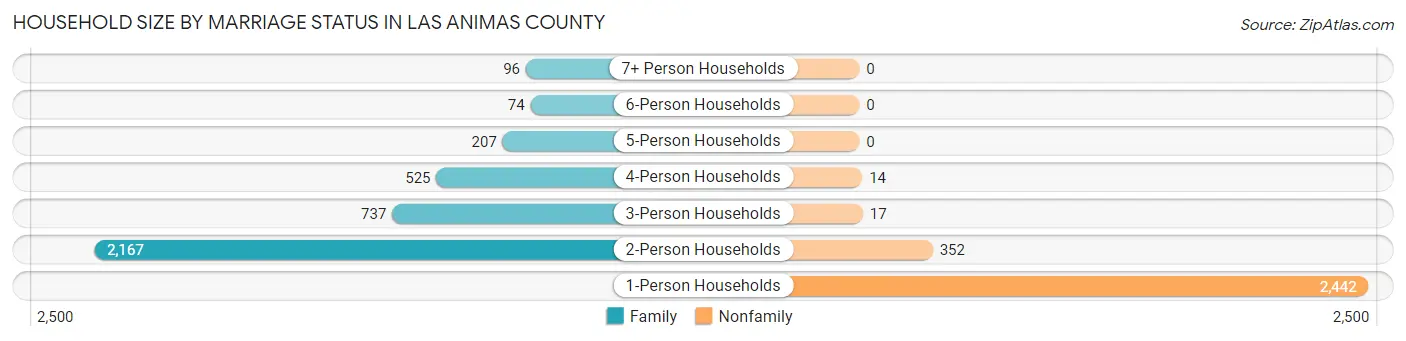
| Household Size | Family Households | Nonfamily Households |
| 1-Person Households | - | 2,442 (36.8%) |
| 2-Person Households | 2,167 (32.7%) | 352 (5.3%) |
| 3-Person Households | 737 (11.1%) | 17 (0.3%) |
| 4-Person Households | 525 (7.9%) | 14 (0.2%) |
| 5-Person Households | 207 (3.1%) | 0 (0.0%) |
| 6-Person Households | 74 (1.1%) | 0 (0.0%) |
| 7+ Person Households | 96 (1.5%) | 0 (0.0%) |
| Total | 3,806 (57.4%) | 2,825 (42.6%) |
Female Fertility in Las Animas County
Fertility by Age in Las Animas County
Average fertility rate in Las Animas County is 24.0 births per 1,000 women. Women in the age bracket of 20 to 34 years have the highest fertility rate with 55.0 births per 1,000 women. Women in the age bracket of 20 to 34 years acount for 93.4% of all women with births.

| Age Bracket | Women with Births | Births / 1,000 Women |
| 15 to 19 years | 0 (0.0%) | 0.0 |
| 20 to 34 years | 57 (93.4%) | 55.0 |
| 35 to 50 years | 4 (6.6%) | 4.0 |
| Total | 61 (100.0%) | 24.0 |
Fertility by Age by Marriage Status in Las Animas County
63.9% of women with births (61) in Las Animas County are married. The highest percentage of unmarried women with births falls into 20 to 34 years age bracket with 38.6% of them unmarried at the time of birth, while the lowest percentage of unmarried women with births belong to 35 to 50 years age bracket with 0.0% of them unmarried.
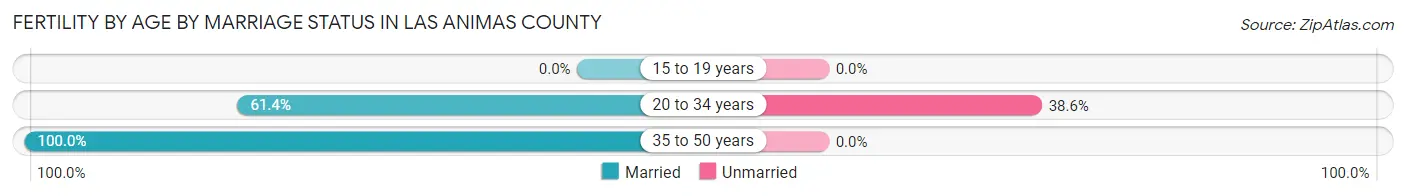
| Age Bracket | Married | Unmarried |
| 15 to 19 years | 0 (0.0%) | 0 (0.0%) |
| 20 to 34 years | 35 (61.4%) | 22 (38.6%) |
| 35 to 50 years | 4 (100.0%) | 0 (0.0%) |
| Total | 39 (63.9%) | 22 (36.1%) |
Fertility by Education in Las Animas County
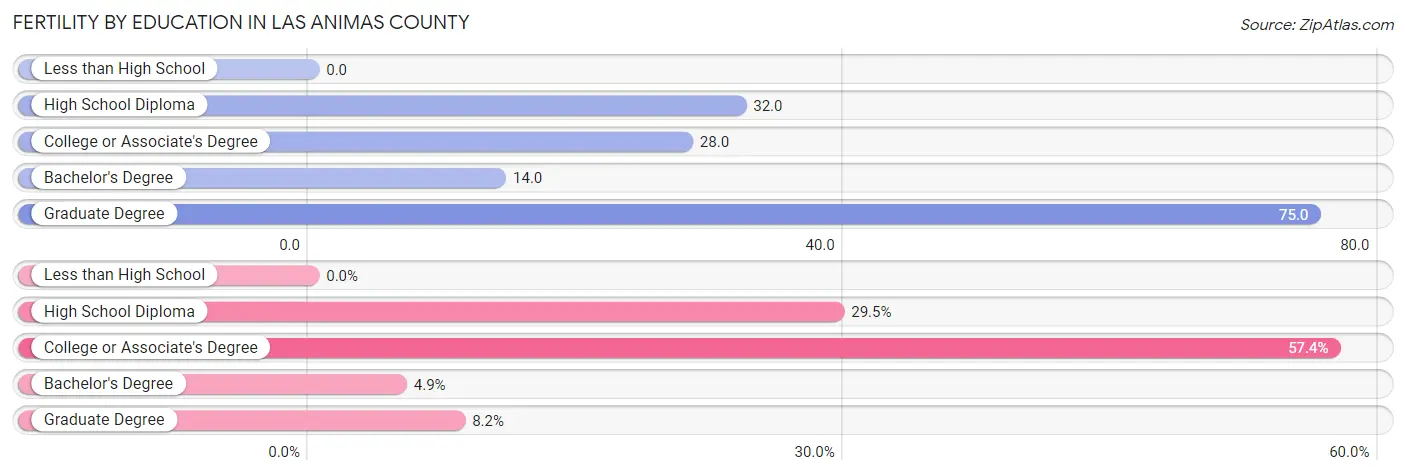
| Educational Attainment | Women with Births | Births / 1,000 Women |
| Less than High School | 0 (0.0%) | 0.0 |
| High School Diploma | 18 (29.5%) | 32.0 |
| College or Associate's Degree | 35 (57.4%) | 28.0 |
| Bachelor's Degree | 3 (4.9%) | 14.0 |
| Graduate Degree | 5 (8.2%) | 75.0 |
| Total | 61 (100.0%) | 24.0 |
Fertility by Education by Marriage Status in Las Animas County
36.1% of women with births in Las Animas County are unmarried. Women with the educational attainment of bachelor's degree are most likely to be married with 100.0% of them married at childbirth, while women with the educational attainment of high school diploma are least likely to be married with 94.4% of them unmarried at childbirth.
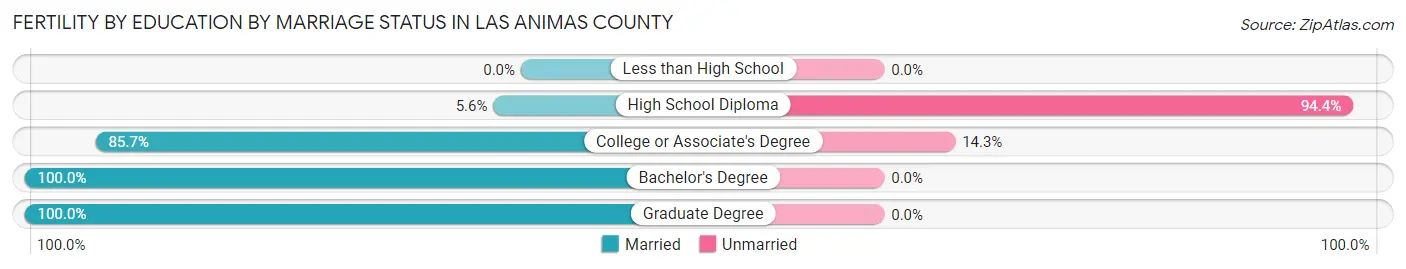
| Educational Attainment | Married | Unmarried |
| Less than High School | 0 (0.0%) | 0 (0.0%) |
| High School Diploma | 1 (5.6%) | 17 (94.4%) |
| College or Associate's Degree | 30 (85.7%) | 5 (14.3%) |
| Bachelor's Degree | 3 (100.0%) | 0 (0.0%) |
| Graduate Degree | 5 (100.0%) | 0 (0.0%) |
| Total | 39 (63.9%) | 22 (36.1%) |
Employment Characteristics in Las Animas County
Employment by Class of Employer in Las Animas County
Among the 5,703 employed individuals in Las Animas County, private company employees (3,321 | 58.2%), local government employees (805 | 14.1%), and self-employed (not incorporated) (463 | 8.1%) make up the most common classes of employment.
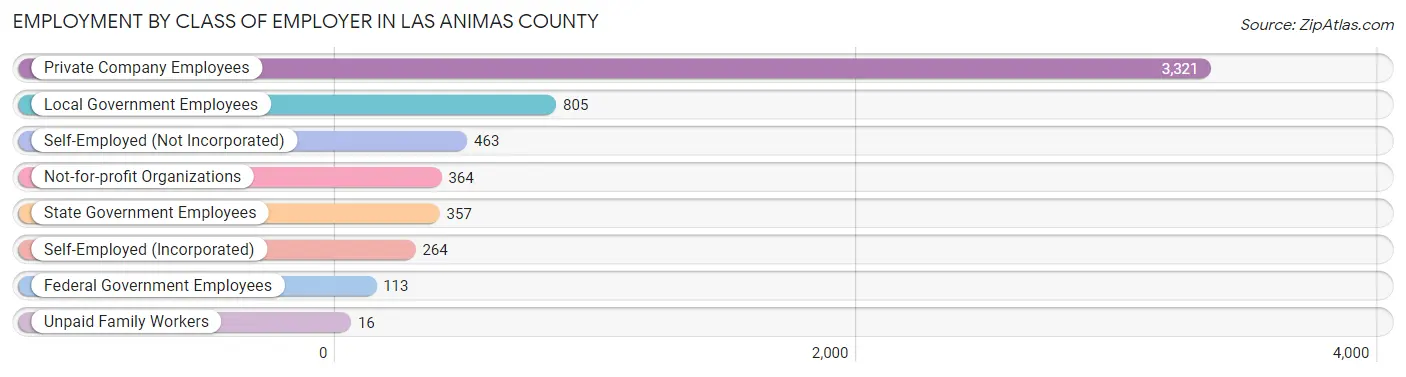
| Employer Class | # Employees | % Employees |
| Private Company Employees | 3,321 | 58.2% |
| Self-Employed (Incorporated) | 264 | 4.6% |
| Self-Employed (Not Incorporated) | 463 | 8.1% |
| Not-for-profit Organizations | 364 | 6.4% |
| Local Government Employees | 805 | 14.1% |
| State Government Employees | 357 | 6.3% |
| Federal Government Employees | 113 | 2.0% |
| Unpaid Family Workers | 16 | 0.3% |
| Total | 5,703 | 100.0% |
Employment Status by Age in Las Animas County
According to the labor force statistics for Las Animas County, out of the total population over 16 years of age (12,153), 51.8% or 6,295 individuals are in the labor force, with 7.4% or 466 of them unemployed. The age group with the highest labor force participation rate is 20 to 24 years, with 80.4% or 739 individuals in the labor force. Within the labor force, the 16 to 19 years age range has the highest percentage of unemployed individuals, with 22.7% or 54 of them being unemployed.
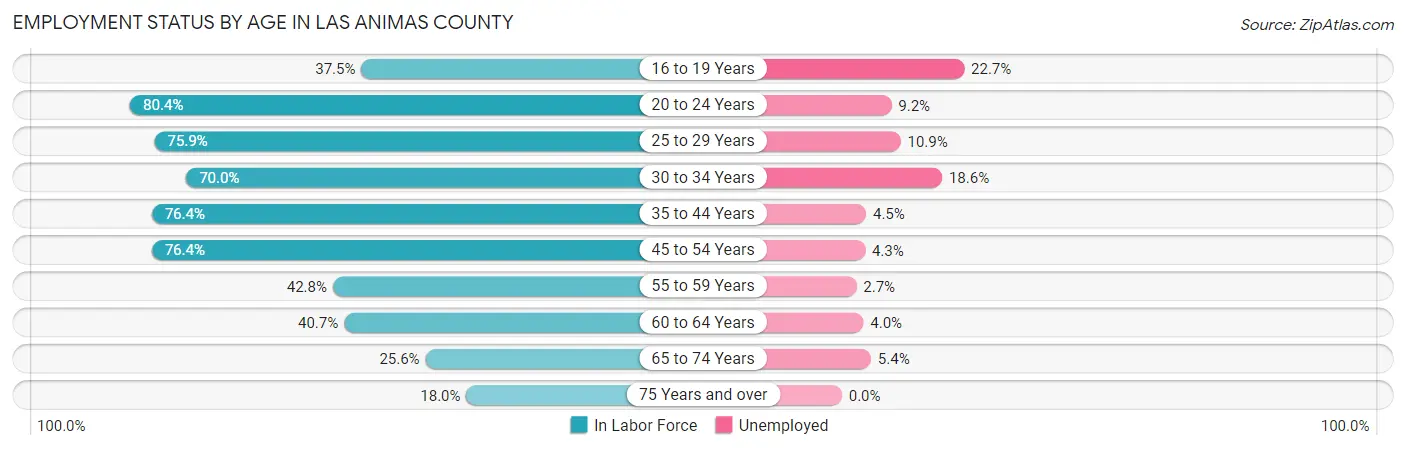
| Age Bracket | In Labor Force | Unemployed |
| 16 to 19 Years | 238 (37.5%) | 54 (22.7%) |
| 20 to 24 Years | 739 (80.4%) | 68 (9.2%) |
| 25 to 29 Years | 594 (75.9%) | 65 (10.9%) |
| 30 to 34 Years | 614 (70.0%) | 114 (18.6%) |
| 35 to 44 Years | 1,176 (76.4%) | 53 (4.5%) |
| 45 to 54 Years | 1,200 (76.4%) | 52 (4.3%) |
| 55 to 59 Years | 450 (42.8%) | 12 (2.7%) |
| 60 to 64 Years | 473 (40.7%) | 19 (4.0%) |
| 65 to 74 Years | 555 (25.6%) | 30 (5.4%) |
| 75 Years and over | 261 (18.0%) | 0 (0.0%) |
| Total | 6,295 (51.8%) | 466 (7.4%) |
Employment Status by Educational Attainment in Las Animas County
According to labor force statistics for Las Animas County, 64.5% of individuals (4,504) out of the total population between 25 and 64 years of age (6,983) are in the labor force, with 7.0% or 315 of them being unemployed. The group with the highest labor force participation rate are those with the educational attainment of bachelor's degree or higher, with 76.3% or 732 individuals in the labor force. Within the labor force, individuals with less than high school education have the highest percentage of unemployment, with 23.5% or 71 of them being unemployed.
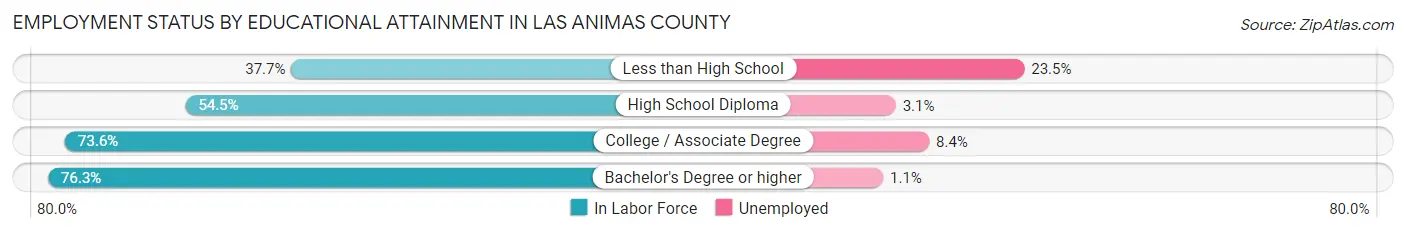
| Educational Attainment | In Labor Force | Unemployed |
| Less than High School | 302 (37.7%) | 188 (23.5%) |
| High School Diploma | 1,058 (54.5%) | 60 (3.1%) |
| College / Associate Degree | 2,415 (73.6%) | 276 (8.4%) |
| Bachelor's Degree or higher | 732 (76.3%) | 11 (1.1%) |
| Total | 4,504 (64.5%) | 489 (7.0%) |
Employment Occupations by Sex in Las Animas County
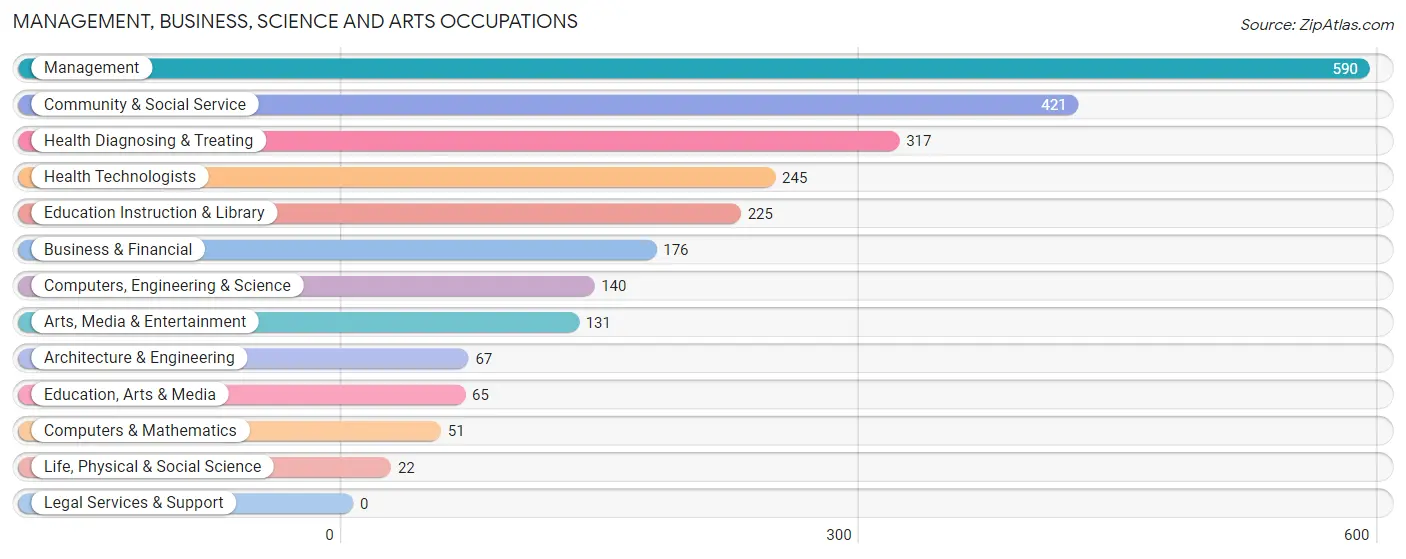
Management, Business, Science and Arts Occupations
The most common Management, Business, Science and Arts occupations in Las Animas County are Management (590 | 10.1%), Community & Social Service (421 | 7.2%), Health Diagnosing & Treating (317 | 5.4%), Health Technologists (245 | 4.2%), and Education Instruction & Library (225 | 3.9%).
Management, Business, Science and Arts Occupations by Sex
Within the Management, Business, Science and Arts occupations in Las Animas County, the most male-oriented occupations are Computers & Mathematics (94.1%), Computers, Engineering & Science (79.3%), and Architecture & Engineering (79.1%), while the most female-oriented occupations are Education, Arts & Media (87.7%), Health Technologists (75.5%), and Business & Financial (69.9%).
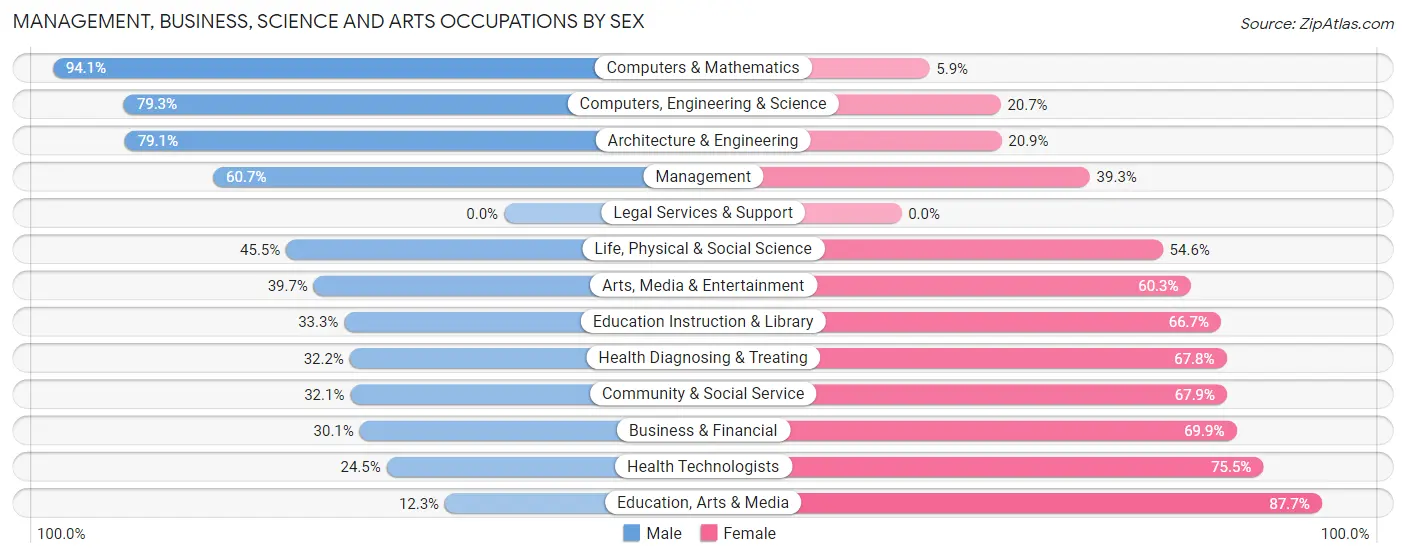
| Occupation | Male | Female |
| Management | 358 (60.7%) | 232 (39.3%) |
| Business & Financial | 53 (30.1%) | 123 (69.9%) |
| Computers, Engineering & Science | 111 (79.3%) | 29 (20.7%) |
| Computers & Mathematics | 48 (94.1%) | 3 (5.9%) |
| Architecture & Engineering | 53 (79.1%) | 14 (20.9%) |
| Life, Physical & Social Science | 10 (45.5%) | 12 (54.5%) |
| Community & Social Service | 135 (32.1%) | 286 (67.9%) |
| Education, Arts & Media | 8 (12.3%) | 57 (87.7%) |
| Legal Services & Support | 0 (0.0%) | 0 (0.0%) |
| Education Instruction & Library | 75 (33.3%) | 150 (66.7%) |
| Arts, Media & Entertainment | 52 (39.7%) | 79 (60.3%) |
| Health Diagnosing & Treating | 102 (32.2%) | 215 (67.8%) |
| Health Technologists | 60 (24.5%) | 185 (75.5%) |
| Total (Category) | 759 (46.2%) | 885 (53.8%) |
| Total (Overall) | 3,209 (55.0%) | 2,625 (45.0%) |
Services Occupations
The most common Services occupations in Las Animas County are Healthcare Support (507 | 8.7%), Food Preparation & Serving (390 | 6.7%), Security & Protection (236 | 4.1%), Cleaning & Maintenance (225 | 3.9%), and Law Enforcement (187 | 3.2%).
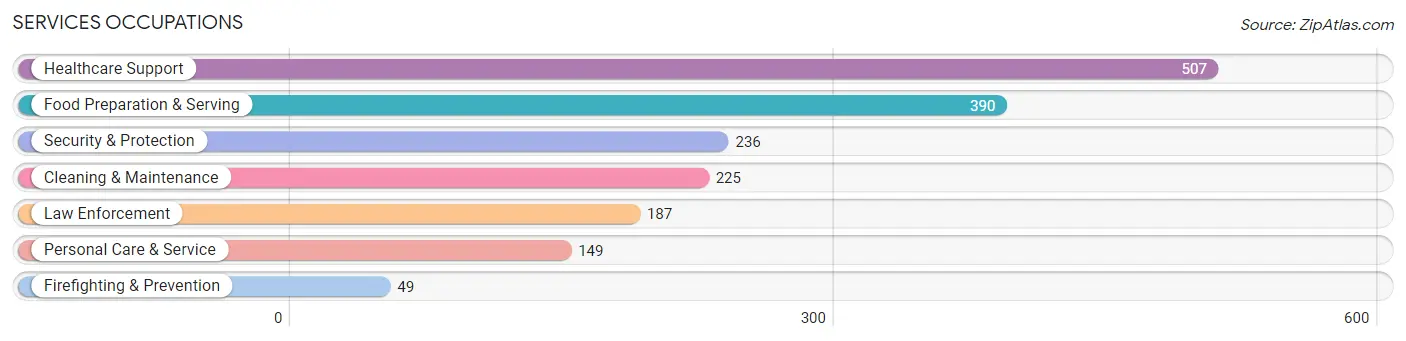
Services Occupations by Sex
Within the Services occupations in Las Animas County, the most male-oriented occupations are Firefighting & Prevention (100.0%), Security & Protection (97.9%), and Law Enforcement (97.3%), while the most female-oriented occupations are Healthcare Support (91.9%), Personal Care & Service (49.7%), and Cleaning & Maintenance (40.4%).

| Occupation | Male | Female |
| Healthcare Support | 41 (8.1%) | 466 (91.9%) |
| Security & Protection | 231 (97.9%) | 5 (2.1%) |
| Firefighting & Prevention | 49 (100.0%) | 0 (0.0%) |
| Law Enforcement | 182 (97.3%) | 5 (2.7%) |
| Food Preparation & Serving | 262 (67.2%) | 128 (32.8%) |
| Cleaning & Maintenance | 134 (59.6%) | 91 (40.4%) |
| Personal Care & Service | 75 (50.3%) | 74 (49.7%) |
| Total (Category) | 743 (49.3%) | 764 (50.7%) |
| Total (Overall) | 3,209 (55.0%) | 2,625 (45.0%) |
Sales and Office Occupations
The most common Sales and Office occupations in Las Animas County are Office & Administration (756 | 13.0%), and Sales & Related (435 | 7.5%).
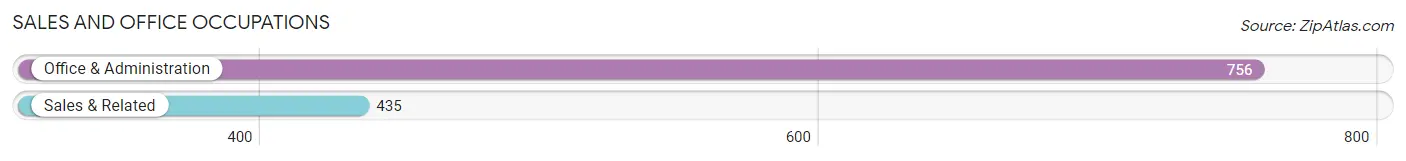
Sales and Office Occupations by Sex

| Occupation | Male | Female |
| Sales & Related | 169 (38.9%) | 266 (61.2%) |
| Office & Administration | 171 (22.6%) | 585 (77.4%) |
| Total (Category) | 340 (28.5%) | 851 (71.5%) |
| Total (Overall) | 3,209 (55.0%) | 2,625 (45.0%) |
Natural Resources, Construction and Maintenance Occupations
The most common Natural Resources, Construction and Maintenance occupations in Las Animas County are Construction & Extraction (418 | 7.2%), Installation, Maintenance & Repair (229 | 3.9%), and Farming, Fishing & Forestry (124 | 2.1%).
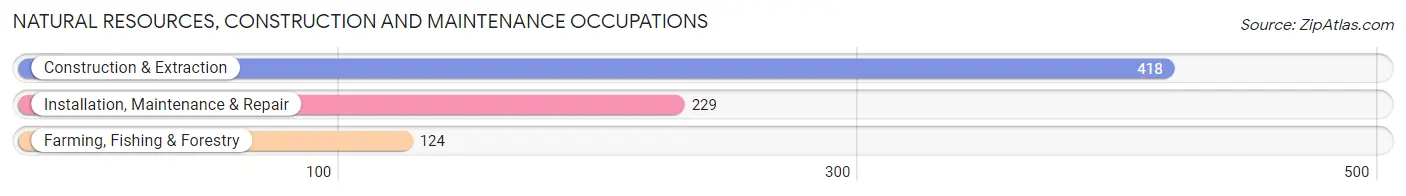
Natural Resources, Construction and Maintenance Occupations by Sex
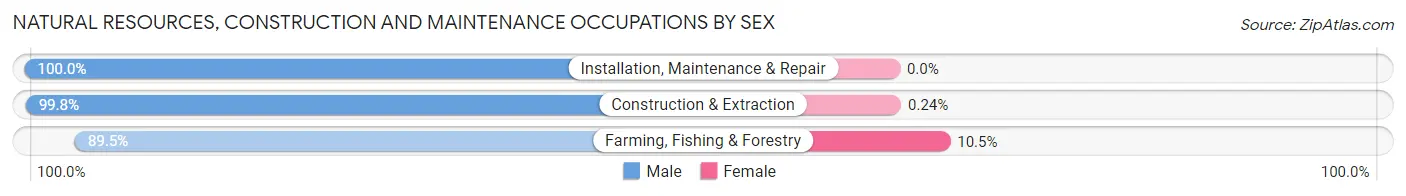
| Occupation | Male | Female |
| Farming, Fishing & Forestry | 111 (89.5%) | 13 (10.5%) |
| Construction & Extraction | 417 (99.8%) | 1 (0.2%) |
| Installation, Maintenance & Repair | 229 (100.0%) | 0 (0.0%) |
| Total (Category) | 757 (98.2%) | 14 (1.8%) |
| Total (Overall) | 3,209 (55.0%) | 2,625 (45.0%) |
Production, Transportation and Moving Occupations
The most common Production, Transportation and Moving occupations in Las Animas County are Transportation (352 | 6.0%), Production (218 | 3.7%), and Material Moving (151 | 2.6%).
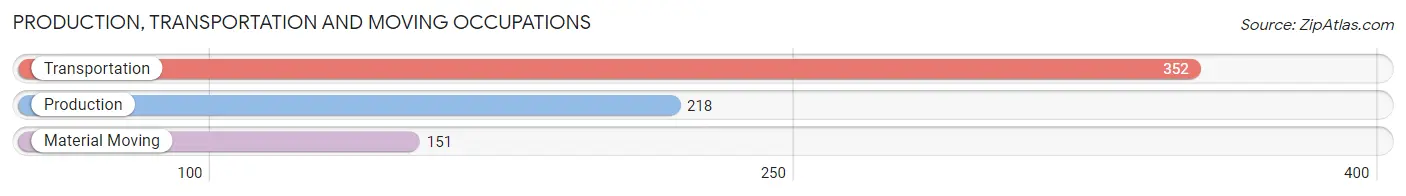
Production, Transportation and Moving Occupations by Sex
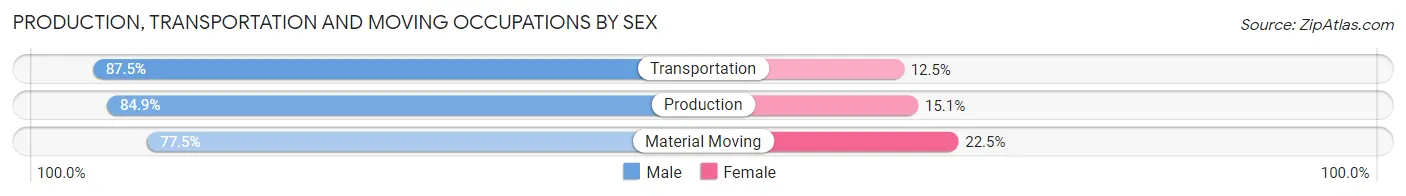
| Occupation | Male | Female |
| Production | 185 (84.9%) | 33 (15.1%) |
| Transportation | 308 (87.5%) | 44 (12.5%) |
| Material Moving | 117 (77.5%) | 34 (22.5%) |
| Total (Category) | 610 (84.6%) | 111 (15.4%) |
| Total (Overall) | 3,209 (55.0%) | 2,625 (45.0%) |
Employment Industries by Sex in Las Animas County
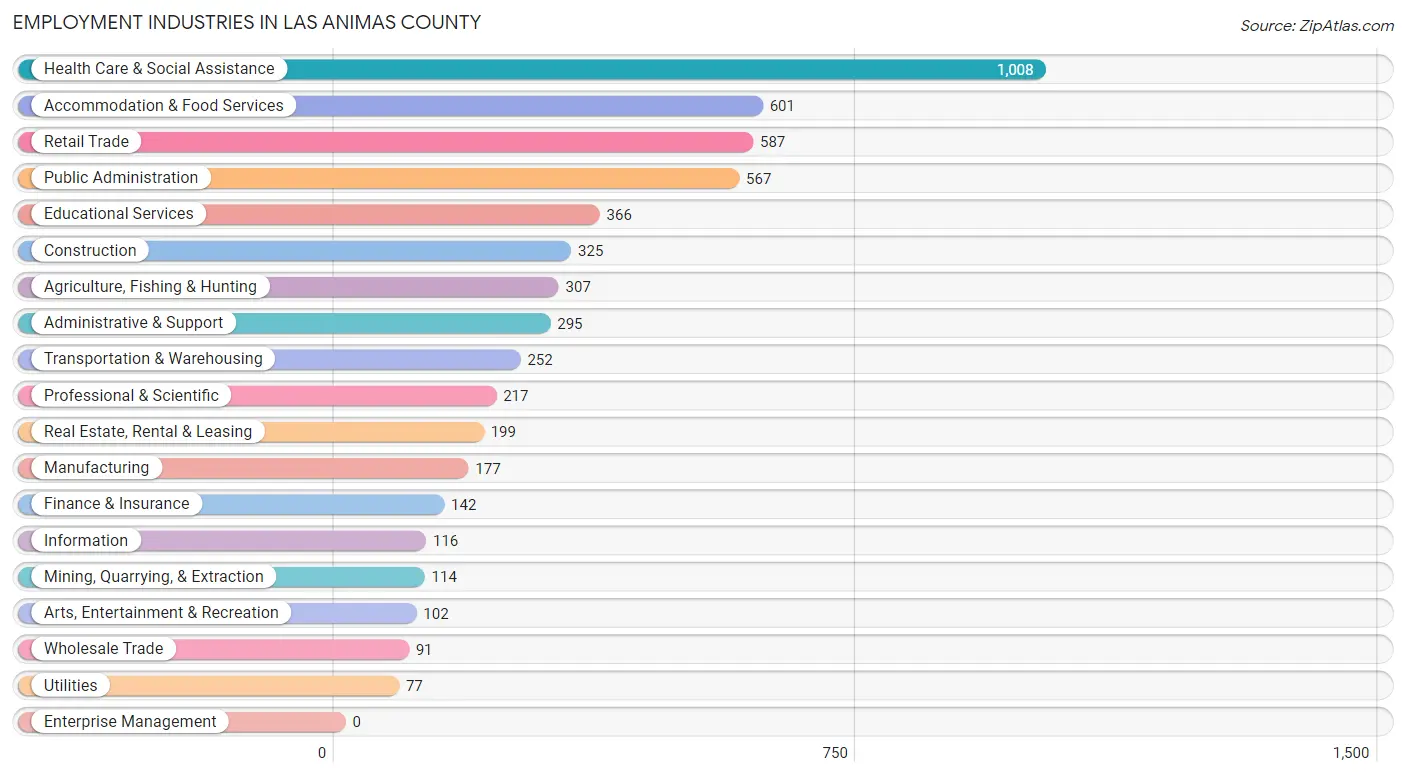
Employment Industries in Las Animas County
The major employment industries in Las Animas County include Health Care & Social Assistance (1,008 | 17.3%), Accommodation & Food Services (601 | 10.3%), Retail Trade (587 | 10.1%), Public Administration (567 | 9.7%), and Educational Services (366 | 6.3%).
Employment Industries by Sex in Las Animas County
The Las Animas County industries that see more men than women are Wholesale Trade (96.7%), Mining, Quarrying, & Extraction (93.9%), and Construction (93.9%), whereas the industries that tend to have a higher number of women are Health Care & Social Assistance (80.5%), Professional & Scientific (73.7%), and Finance & Insurance (71.1%).
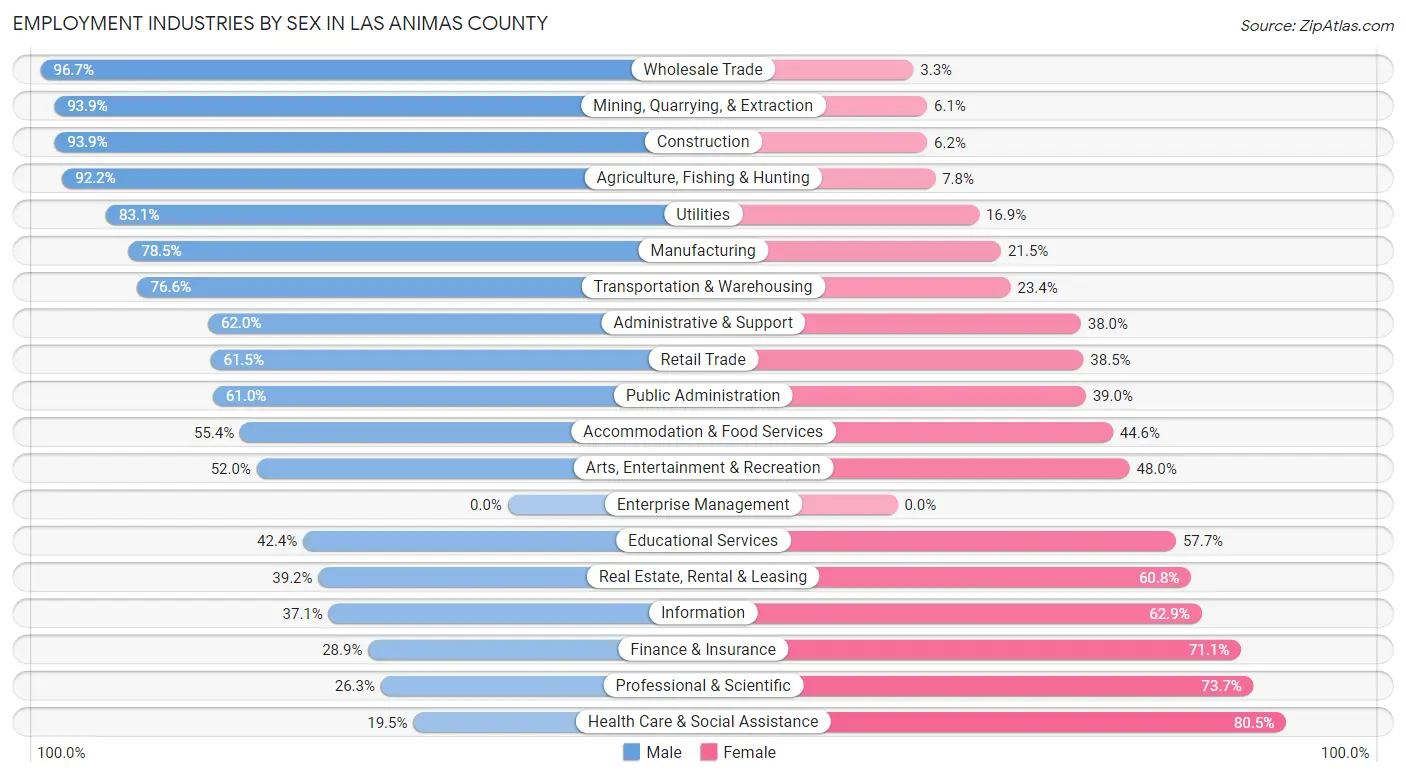
| Industry | Male | Female |
| Agriculture, Fishing & Hunting | 283 (92.2%) | 24 (7.8%) |
| Mining, Quarrying, & Extraction | 107 (93.9%) | 7 (6.1%) |
| Construction | 305 (93.9%) | 20 (6.1%) |
| Manufacturing | 139 (78.5%) | 38 (21.5%) |
| Wholesale Trade | 88 (96.7%) | 3 (3.3%) |
| Retail Trade | 361 (61.5%) | 226 (38.5%) |
| Transportation & Warehousing | 193 (76.6%) | 59 (23.4%) |
| Utilities | 64 (83.1%) | 13 (16.9%) |
| Information | 43 (37.1%) | 73 (62.9%) |
| Finance & Insurance | 41 (28.9%) | 101 (71.1%) |
| Real Estate, Rental & Leasing | 78 (39.2%) | 121 (60.8%) |
| Professional & Scientific | 57 (26.3%) | 160 (73.7%) |
| Enterprise Management | 0 (0.0%) | 0 (0.0%) |
| Administrative & Support | 183 (62.0%) | 112 (38.0%) |
| Educational Services | 155 (42.3%) | 211 (57.7%) |
| Health Care & Social Assistance | 197 (19.5%) | 811 (80.5%) |
| Arts, Entertainment & Recreation | 53 (52.0%) | 49 (48.0%) |
| Accommodation & Food Services | 333 (55.4%) | 268 (44.6%) |
| Public Administration | 346 (61.0%) | 221 (39.0%) |
| Total | 3,209 (55.0%) | 2,625 (45.0%) |
Education in Las Animas County
School Enrollment in Las Animas County
The most common levels of schooling among the 2,856 students in Las Animas County are college / undergraduate (764 | 26.8%), elementary school (656 | 23.0%), and middle school (630 | 22.1%).
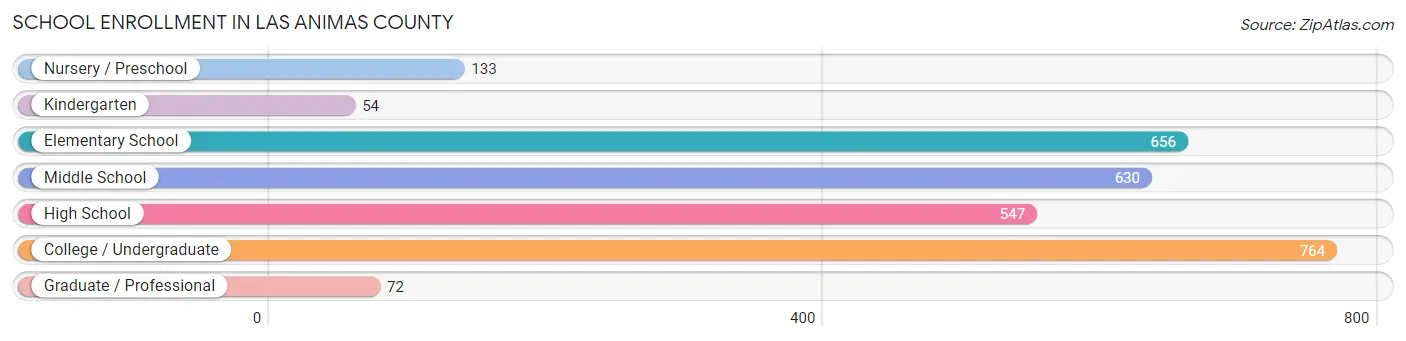
| School Level | # Students | % Students |
| Nursery / Preschool | 133 | 4.7% |
| Kindergarten | 54 | 1.9% |
| Elementary School | 656 | 23.0% |
| Middle School | 630 | 22.1% |
| High School | 547 | 19.2% |
| College / Undergraduate | 764 | 26.8% |
| Graduate / Professional | 72 | 2.5% |
| Total | 2,856 | 100.0% |
School Enrollment by Age by Funding Source in Las Animas County
Out of a total of 2,856 students who are enrolled in schools in Las Animas County, 231 (8.1%) attend a private institution, while the remaining 2,625 (91.9%) are enrolled in public schools. The age group of 25 to 34 year olds has the highest likelihood of being enrolled in private schools, with 34 (21.2% in the age bracket) enrolled. Conversely, the age group of 3 to 4 year olds has the lowest likelihood of being enrolled in a private school, with 62 (100.0% in the age bracket) attending a public institution.
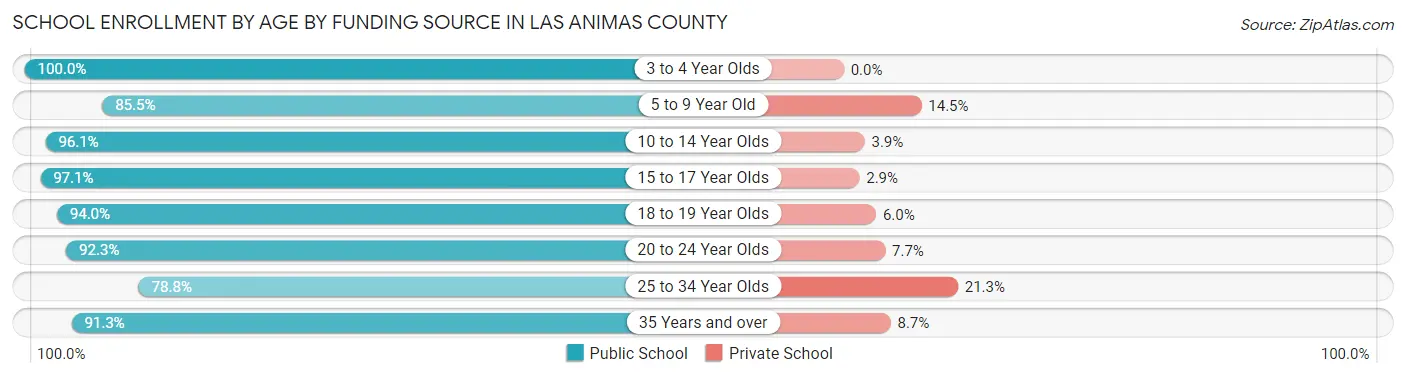
| Age Bracket | Public School | Private School |
| 3 to 4 Year Olds | 62 (100.0%) | 0 (0.0%) |
| 5 to 9 Year Old | 597 (85.5%) | 101 (14.5%) |
| 10 to 14 Year Olds | 716 (96.1%) | 29 (3.9%) |
| 15 to 17 Year Olds | 467 (97.1%) | 14 (2.9%) |
| 18 to 19 Year Olds | 172 (94.0%) | 11 (6.0%) |
| 20 to 24 Year Olds | 275 (92.3%) | 23 (7.7%) |
| 25 to 34 Year Olds | 126 (78.7%) | 34 (21.2%) |
| 35 Years and over | 209 (91.3%) | 20 (8.7%) |
| Total | 2,625 (91.9%) | 231 (8.1%) |
Educational Attainment by Field of Study in Las Animas County
Education (454 | 22.6%), business (276 | 13.8%), social sciences (188 | 9.4%), science & technology (175 | 8.7%), and psychology (144 | 7.2%) are the most common fields of study among 2,005 individuals in Las Animas County who have obtained a bachelor's degree or higher.
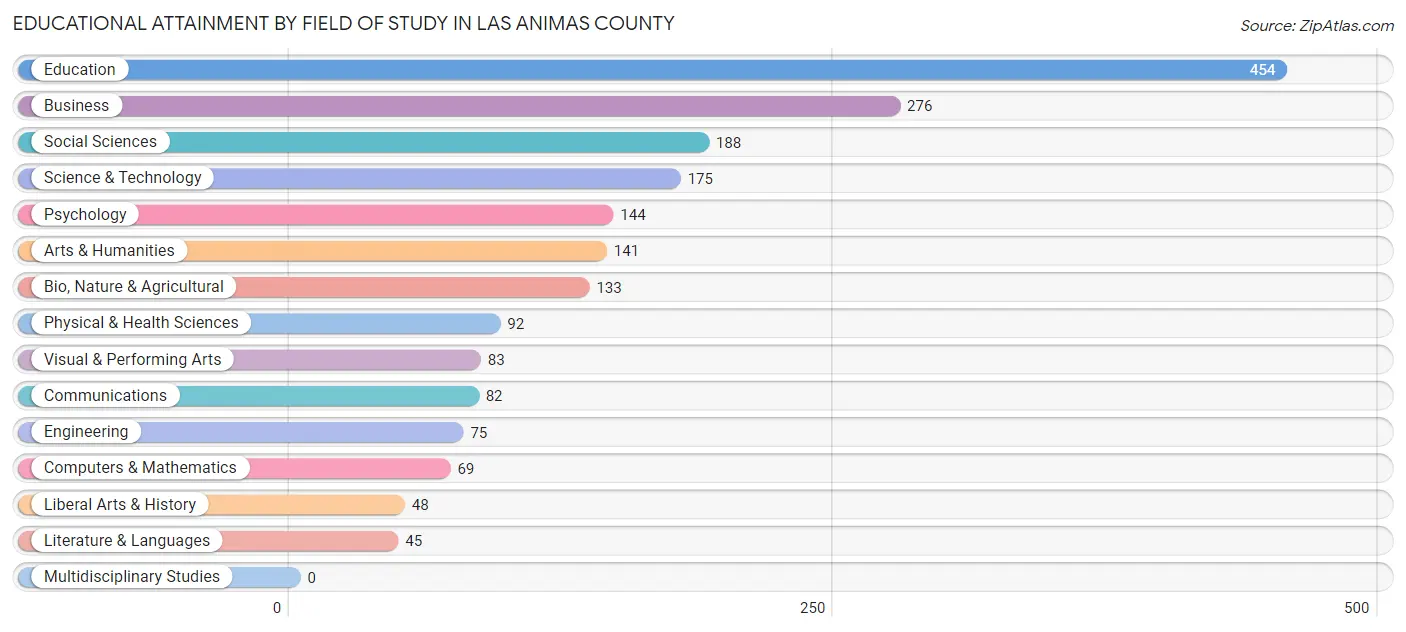
| Field of Study | # Graduates | % Graduates |
| Computers & Mathematics | 69 | 3.4% |
| Bio, Nature & Agricultural | 133 | 6.6% |
| Physical & Health Sciences | 92 | 4.6% |
| Psychology | 144 | 7.2% |
| Social Sciences | 188 | 9.4% |
| Engineering | 75 | 3.7% |
| Multidisciplinary Studies | 0 | 0.0% |
| Science & Technology | 175 | 8.7% |
| Business | 276 | 13.8% |
| Education | 454 | 22.6% |
| Literature & Languages | 45 | 2.2% |
| Liberal Arts & History | 48 | 2.4% |
| Visual & Performing Arts | 83 | 4.1% |
| Communications | 82 | 4.1% |
| Arts & Humanities | 141 | 7.0% |
| Total | 2,005 | 100.0% |
Transportation & Commute in Las Animas County
Vehicle Availability by Sex in Las Animas County
The most prevalent vehicle ownership categories in Las Animas County are males with 2 vehicles (1,171, accounting for 38.2%) and females with 2 vehicles (1,065, making up 45.1%).
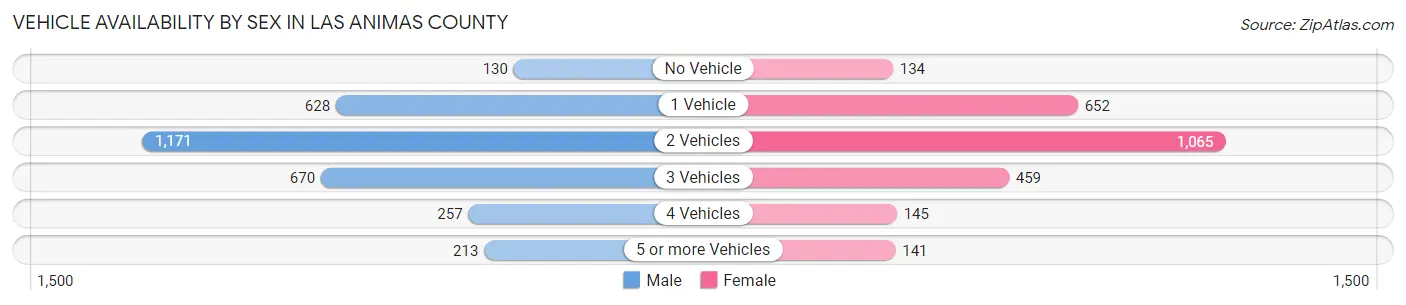
| Vehicles Available | Male | Female |
| No Vehicle | 130 (4.2%) | 134 (5.2%) |
| 1 Vehicle | 628 (20.5%) | 652 (25.1%) |
| 2 Vehicles | 1,171 (38.2%) | 1,065 (41.0%) |
| 3 Vehicles | 670 (21.8%) | 459 (17.7%) |
| 4 Vehicles | 257 (8.4%) | 145 (5.6%) |
| 5 or more Vehicles | 213 (6.9%) | 141 (5.4%) |
| Total | 3,069 (100.0%) | 2,596 (100.0%) |
Commute Time in Las Animas County
The most frequently occuring commute durations in Las Animas County are 5 to 9 minutes (1,381 commuters, 26.8%), 10 to 14 minutes (1,106 commuters, 21.4%), and less than 5 minutes (587 commuters, 11.4%).
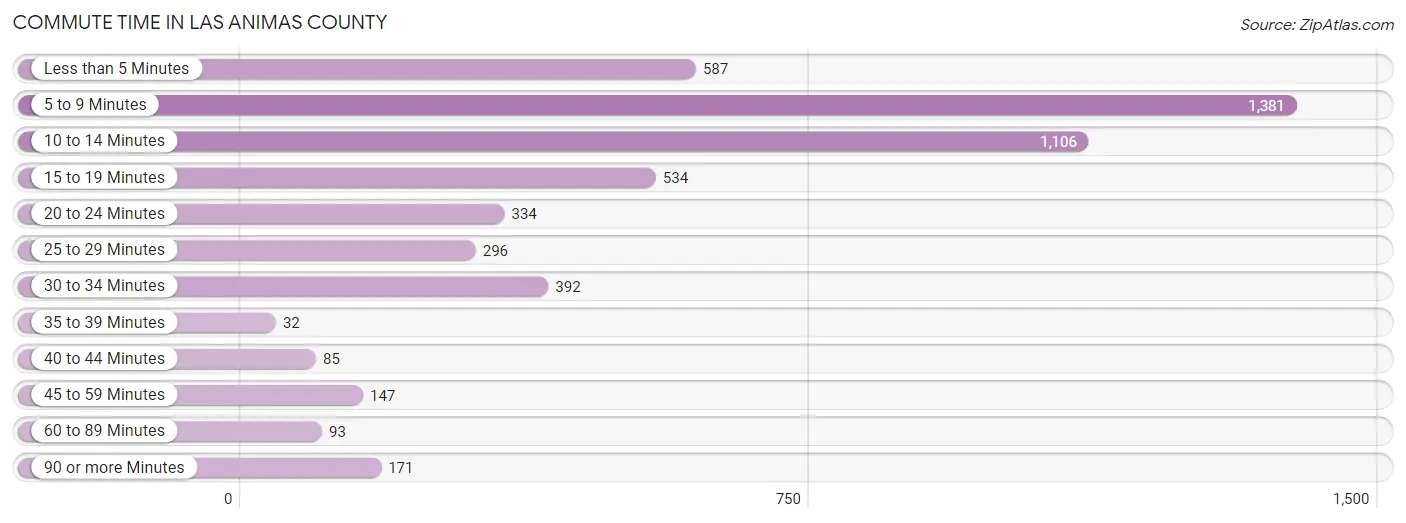
| Commute Time | # Commuters | % Commuters |
| Less than 5 Minutes | 587 | 11.4% |
| 5 to 9 Minutes | 1,381 | 26.8% |
| 10 to 14 Minutes | 1,106 | 21.4% |
| 15 to 19 Minutes | 534 | 10.3% |
| 20 to 24 Minutes | 334 | 6.5% |
| 25 to 29 Minutes | 296 | 5.7% |
| 30 to 34 Minutes | 392 | 7.6% |
| 35 to 39 Minutes | 32 | 0.6% |
| 40 to 44 Minutes | 85 | 1.7% |
| 45 to 59 Minutes | 147 | 2.9% |
| 60 to 89 Minutes | 93 | 1.8% |
| 90 or more Minutes | 171 | 3.3% |
Commute Time by Sex in Las Animas County
The most common commute times in Las Animas County are 5 to 9 minutes (642 commuters, 22.4%) for males and 5 to 9 minutes (739 commuters, 32.2%) for females.
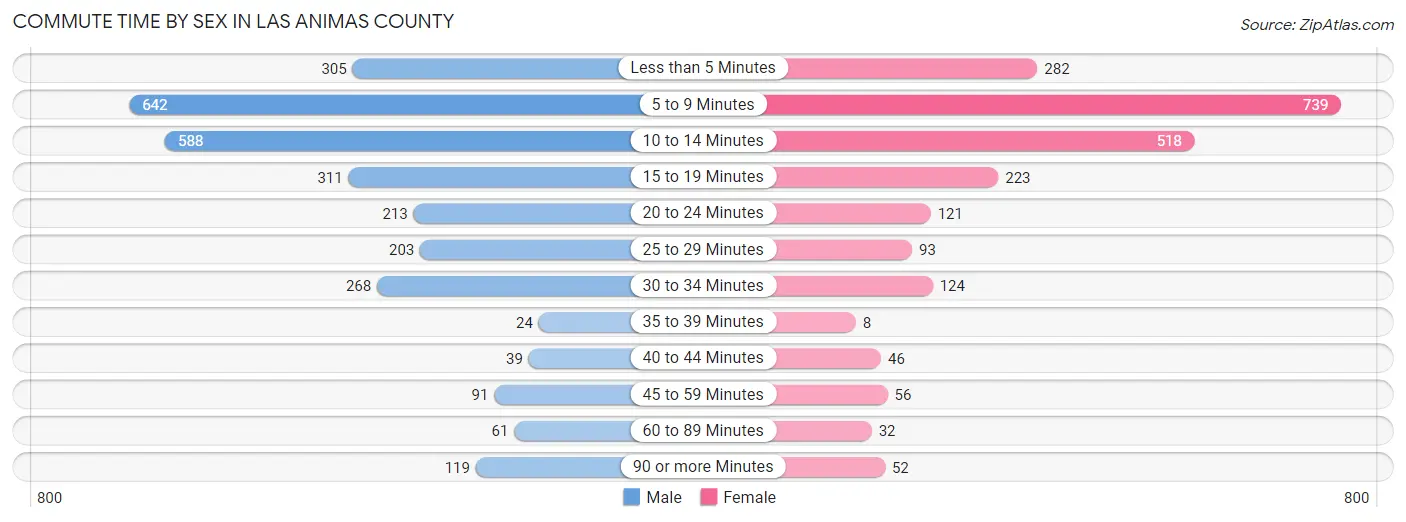
| Commute Time | Male | Female |
| Less than 5 Minutes | 305 (10.6%) | 282 (12.3%) |
| 5 to 9 Minutes | 642 (22.4%) | 739 (32.2%) |
| 10 to 14 Minutes | 588 (20.5%) | 518 (22.6%) |
| 15 to 19 Minutes | 311 (10.9%) | 223 (9.7%) |
| 20 to 24 Minutes | 213 (7.4%) | 121 (5.3%) |
| 25 to 29 Minutes | 203 (7.1%) | 93 (4.1%) |
| 30 to 34 Minutes | 268 (9.4%) | 124 (5.4%) |
| 35 to 39 Minutes | 24 (0.8%) | 8 (0.4%) |
| 40 to 44 Minutes | 39 (1.4%) | 46 (2.0%) |
| 45 to 59 Minutes | 91 (3.2%) | 56 (2.4%) |
| 60 to 89 Minutes | 61 (2.1%) | 32 (1.4%) |
| 90 or more Minutes | 119 (4.2%) | 52 (2.3%) |
Time of Departure to Work by Sex in Las Animas County
The most frequent times of departure to work in Las Animas County are 7:30 AM to 7:59 AM (403, 14.1%) for males and 7:00 AM to 7:29 AM (374, 16.3%) for females.
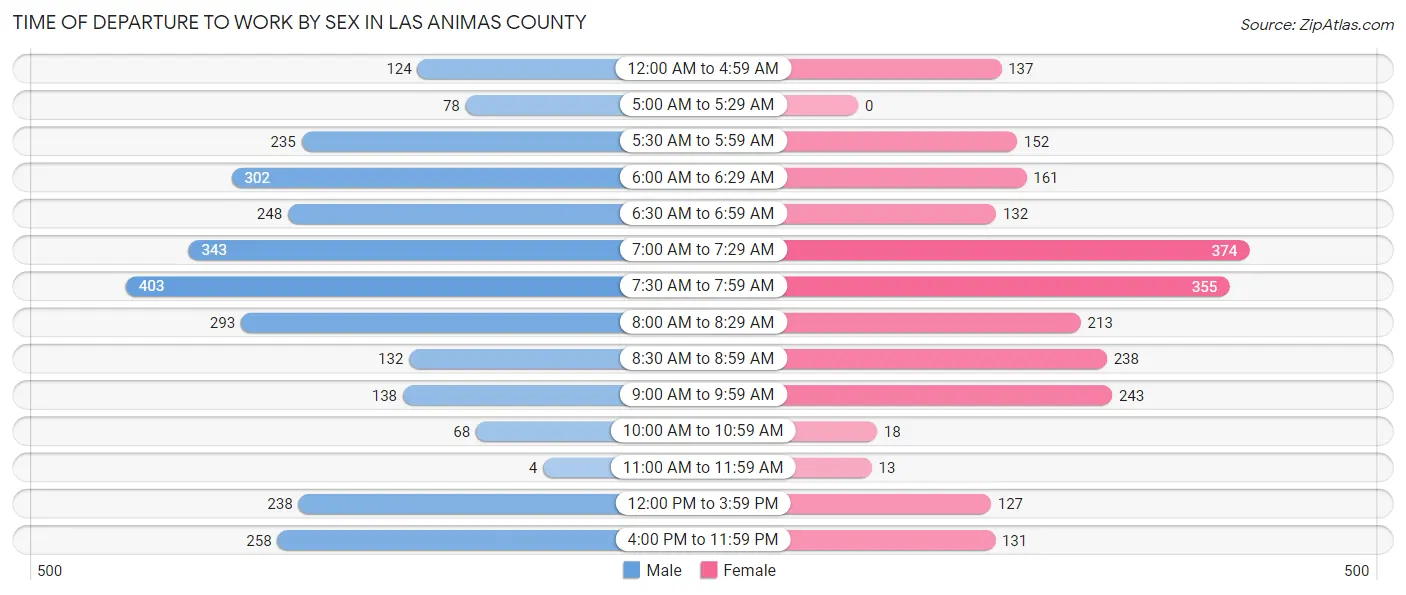
| Time of Departure | Male | Female |
| 12:00 AM to 4:59 AM | 124 (4.3%) | 137 (6.0%) |
| 5:00 AM to 5:29 AM | 78 (2.7%) | 0 (0.0%) |
| 5:30 AM to 5:59 AM | 235 (8.2%) | 152 (6.6%) |
| 6:00 AM to 6:29 AM | 302 (10.5%) | 161 (7.0%) |
| 6:30 AM to 6:59 AM | 248 (8.7%) | 132 (5.8%) |
| 7:00 AM to 7:29 AM | 343 (12.0%) | 374 (16.3%) |
| 7:30 AM to 7:59 AM | 403 (14.1%) | 355 (15.5%) |
| 8:00 AM to 8:29 AM | 293 (10.2%) | 213 (9.3%) |
| 8:30 AM to 8:59 AM | 132 (4.6%) | 238 (10.4%) |
| 9:00 AM to 9:59 AM | 138 (4.8%) | 243 (10.6%) |
| 10:00 AM to 10:59 AM | 68 (2.4%) | 18 (0.8%) |
| 11:00 AM to 11:59 AM | 4 (0.1%) | 13 (0.6%) |
| 12:00 PM to 3:59 PM | 238 (8.3%) | 127 (5.5%) |
| 4:00 PM to 11:59 PM | 258 (9.0%) | 131 (5.7%) |
| Total | 2,864 (100.0%) | 2,294 (100.0%) |
Housing Occupancy in Las Animas County
Occupancy by Ownership in Las Animas County
Of the total 6,631 dwellings in Las Animas County, owner-occupied units account for 4,688 (70.7%), while renter-occupied units make up 1,943 (29.3%).
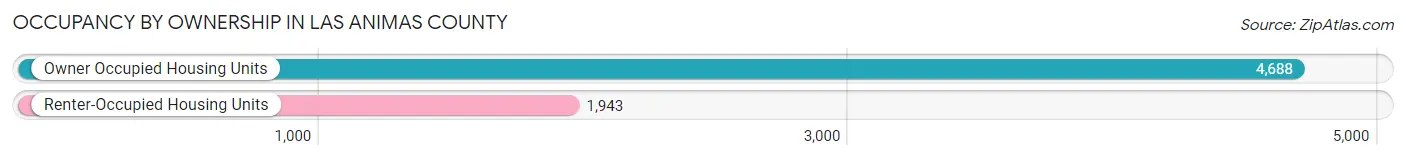
| Occupancy | # Housing Units | % Housing Units |
| Owner Occupied Housing Units | 4,688 | 70.7% |
| Renter-Occupied Housing Units | 1,943 | 29.3% |
| Total Occupied Housing Units | 6,631 | 100.0% |
Occupancy by Household Size in Las Animas County
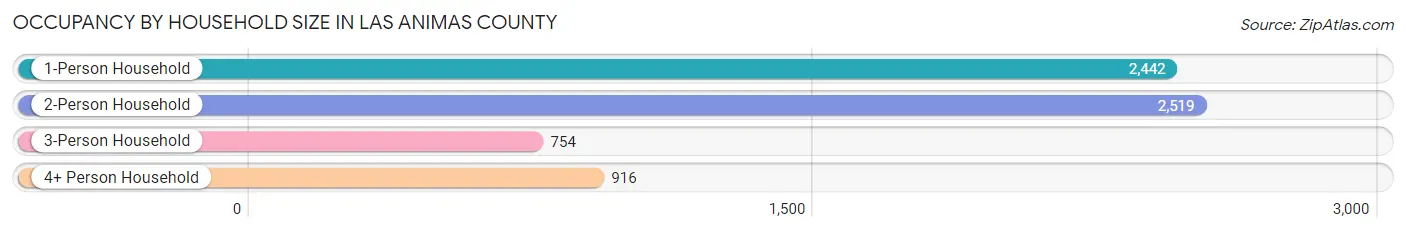
| Household Size | # Housing Units | % Housing Units |
| 1-Person Household | 2,442 | 36.8% |
| 2-Person Household | 2,519 | 38.0% |
| 3-Person Household | 754 | 11.4% |
| 4+ Person Household | 916 | 13.8% |
| Total Housing Units | 6,631 | 100.0% |
Occupancy by Ownership by Household Size in Las Animas County
| Household Size | Owner-occupied | Renter-occupied |
| 1-Person Household | 1,614 (66.1%) | 828 (33.9%) |
| 2-Person Household | 1,841 (73.1%) | 678 (26.9%) |
| 3-Person Household | 568 (75.3%) | 186 (24.7%) |
| 4+ Person Household | 665 (72.6%) | 251 (27.4%) |
| Total Housing Units | 4,688 (70.7%) | 1,943 (29.3%) |
Occupancy by Educational Attainment in Las Animas County
| Household Size | Owner-occupied | Renter-occupied |
| Less than High School | 427 (56.1%) | 334 (43.9%) |
| High School Diploma | 974 (66.8%) | 483 (33.2%) |
| College/Associate Degree | 2,364 (72.3%) | 906 (27.7%) |
| Bachelor's Degree or higher | 923 (80.7%) | 220 (19.3%) |
Occupancy by Age of Householder in Las Animas County
| Age Bracket | # Households | % Households |
| Under 35 Years | 1,014 | 15.3% |
| 35 to 44 Years | 865 | 13.0% |
| 45 to 54 Years | 976 | 14.7% |
| 55 to 64 Years | 1,320 | 19.9% |
| 65 to 74 Years | 1,368 | 20.6% |
| 75 to 84 Years | 897 | 13.5% |
| 85 Years and Over | 191 | 2.9% |
| Total | 6,631 | 100.0% |
Housing Finances in Las Animas County
Median Income by Occupancy in Las Animas County
| Occupancy Type | # Households | Median Income |
| Owner-Occupied | 4,688 (70.7%) | $57,722 |
| Renter-Occupied | 1,943 (29.3%) | $28,977 |
| Average | 6,631 (100.0%) | $48,965 |
Occupancy by Householder Income Bracket in Las Animas County
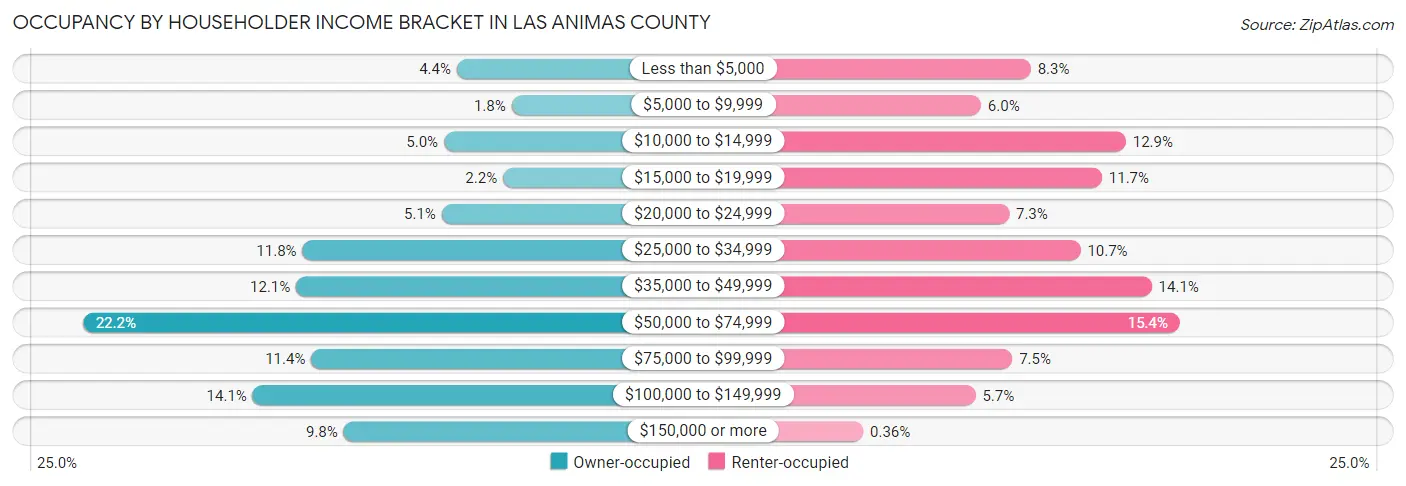
| Income Bracket | Owner-occupied | Renter-occupied |
| Less than $5,000 | 207 (4.4%) | 162 (8.3%) |
| $5,000 to $9,999 | 85 (1.8%) | 116 (6.0%) |
| $10,000 to $14,999 | 236 (5.0%) | 250 (12.9%) |
| $15,000 to $19,999 | 104 (2.2%) | 228 (11.7%) |
| $20,000 to $24,999 | 241 (5.1%) | 142 (7.3%) |
| $25,000 to $34,999 | 552 (11.8%) | 208 (10.7%) |
| $35,000 to $49,999 | 566 (12.1%) | 274 (14.1%) |
| $50,000 to $74,999 | 1,042 (22.2%) | 300 (15.4%) |
| $75,000 to $99,999 | 532 (11.4%) | 145 (7.5%) |
| $100,000 to $149,999 | 663 (14.1%) | 111 (5.7%) |
| $150,000 or more | 460 (9.8%) | 7 (0.4%) |
| Total | 4,688 (100.0%) | 1,943 (100.0%) |
Monthly Housing Cost Tiers in Las Animas County
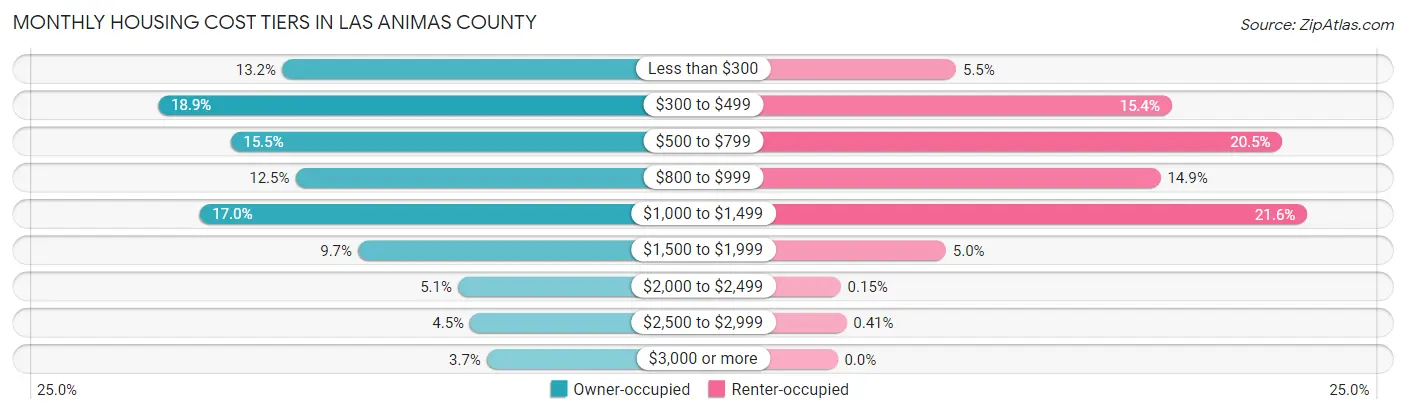
| Monthly Cost | Owner-occupied | Renter-occupied |
| Less than $300 | 617 (13.2%) | 106 (5.5%) |
| $300 to $499 | 884 (18.9%) | 299 (15.4%) |
| $500 to $799 | 728 (15.5%) | 398 (20.5%) |
| $800 to $999 | 588 (12.5%) | 289 (14.9%) |
| $1,000 to $1,499 | 795 (17.0%) | 420 (21.6%) |
| $1,500 to $1,999 | 453 (9.7%) | 97 (5.0%) |
| $2,000 to $2,499 | 237 (5.1%) | 3 (0.2%) |
| $2,500 to $2,999 | 211 (4.5%) | 8 (0.4%) |
| $3,000 or more | 175 (3.7%) | 0 (0.0%) |
| Total | 4,688 (100.0%) | 1,943 (100.0%) |
Physical Housing Characteristics in Las Animas County
Housing Structures in Las Animas County
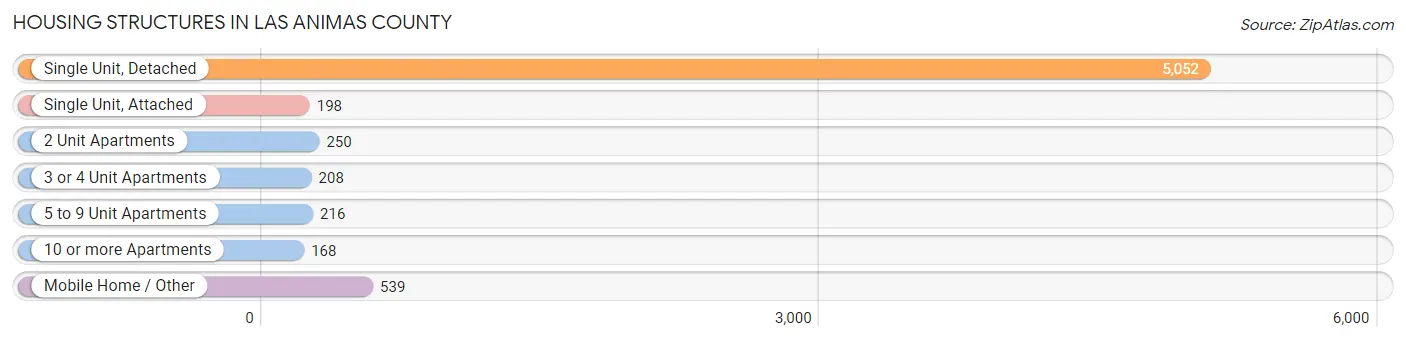
| Structure Type | # Housing Units | % Housing Units |
| Single Unit, Detached | 5,052 | 76.2% |
| Single Unit, Attached | 198 | 3.0% |
| 2 Unit Apartments | 250 | 3.8% |
| 3 or 4 Unit Apartments | 208 | 3.1% |
| 5 to 9 Unit Apartments | 216 | 3.3% |
| 10 or more Apartments | 168 | 2.5% |
| Mobile Home / Other | 539 | 8.1% |
| Total | 6,631 | 100.0% |
Housing Structures by Occupancy in Las Animas County
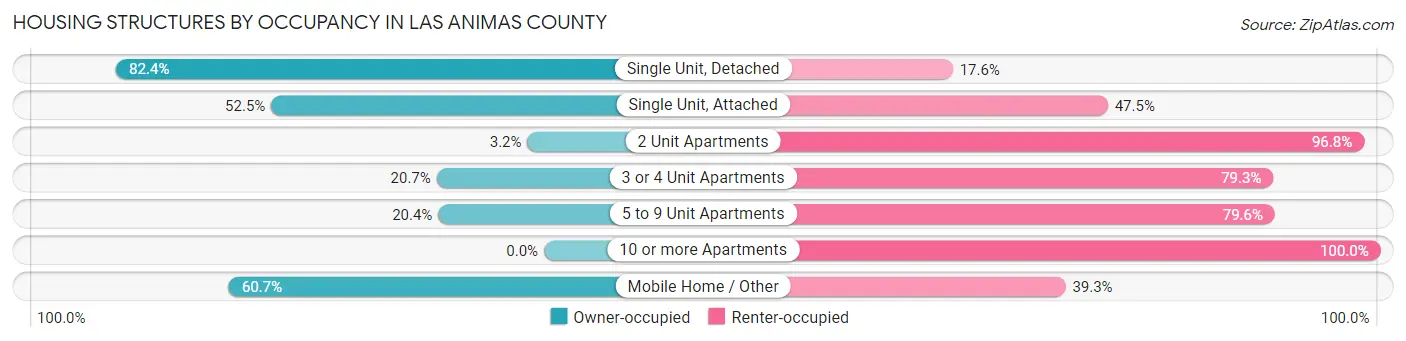
| Structure Type | Owner-occupied | Renter-occupied |
| Single Unit, Detached | 4,162 (82.4%) | 890 (17.6%) |
| Single Unit, Attached | 104 (52.5%) | 94 (47.5%) |
| 2 Unit Apartments | 8 (3.2%) | 242 (96.8%) |
| 3 or 4 Unit Apartments | 43 (20.7%) | 165 (79.3%) |
| 5 to 9 Unit Apartments | 44 (20.4%) | 172 (79.6%) |
| 10 or more Apartments | 0 (0.0%) | 168 (100.0%) |
| Mobile Home / Other | 327 (60.7%) | 212 (39.3%) |
| Total | 4,688 (70.7%) | 1,943 (29.3%) |
Housing Structures by Number of Rooms in Las Animas County
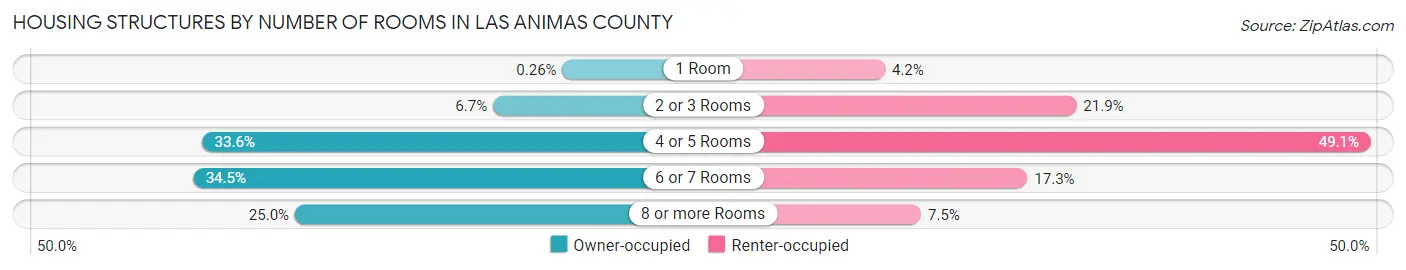
| Number of Rooms | Owner-occupied | Renter-occupied |
| 1 Room | 12 (0.3%) | 81 (4.2%) |
| 2 or 3 Rooms | 313 (6.7%) | 425 (21.9%) |
| 4 or 5 Rooms | 1,576 (33.6%) | 954 (49.1%) |
| 6 or 7 Rooms | 1,615 (34.4%) | 337 (17.3%) |
| 8 or more Rooms | 1,172 (25.0%) | 146 (7.5%) |
| Total | 4,688 (100.0%) | 1,943 (100.0%) |
Housing Structure by Heating Type in Las Animas County
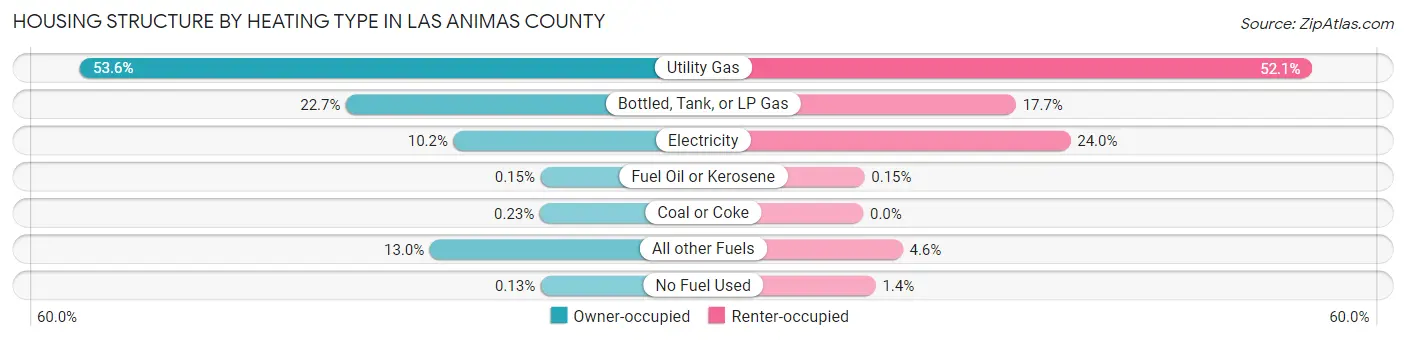
| Heating Type | Owner-occupied | Renter-occupied |
| Utility Gas | 2,511 (53.6%) | 1,012 (52.1%) |
| Bottled, Tank, or LP Gas | 1,064 (22.7%) | 344 (17.7%) |
| Electricity | 480 (10.2%) | 467 (24.0%) |
| Fuel Oil or Kerosene | 7 (0.2%) | 3 (0.2%) |
| Coal or Coke | 11 (0.2%) | 0 (0.0%) |
| All other Fuels | 609 (13.0%) | 89 (4.6%) |
| No Fuel Used | 6 (0.1%) | 28 (1.4%) |
| Total | 4,688 (100.0%) | 1,943 (100.0%) |
Household Vehicle Usage in Las Animas County
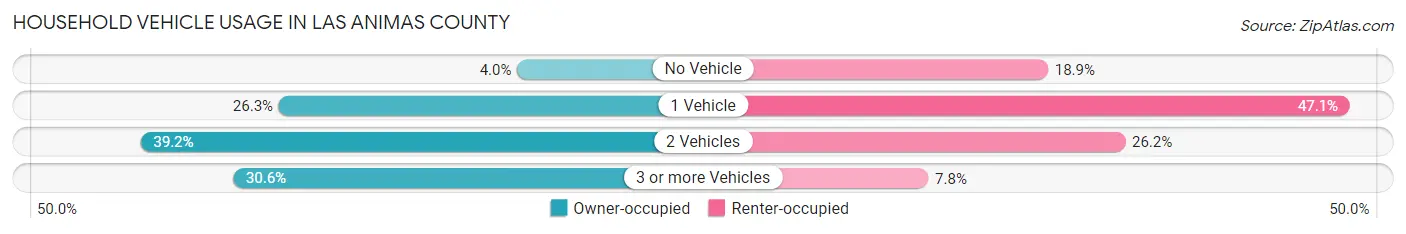
| Vehicles per Household | Owner-occupied | Renter-occupied |
| No Vehicle | 188 (4.0%) | 368 (18.9%) |
| 1 Vehicle | 1,231 (26.3%) | 916 (47.1%) |
| 2 Vehicles | 1,837 (39.2%) | 508 (26.2%) |
| 3 or more Vehicles | 1,432 (30.5%) | 151 (7.8%) |
| Total | 4,688 (100.0%) | 1,943 (100.0%) |
Real Estate & Mortgages in Las Animas County
Real Estate and Mortgage Overview in Las Animas County
| Characteristic | Without Mortgage | With Mortgage |
| Housing Units | 2,079 | 2,609 |
| Median Property Value | $168,200 | $219,200 |
| Median Household Income | $43,426 | $348 |
| Monthly Housing Costs | $382 | $155 |
| Real Estate Taxes | $388 | $54 |
Property Value by Mortgage Status in Las Animas County
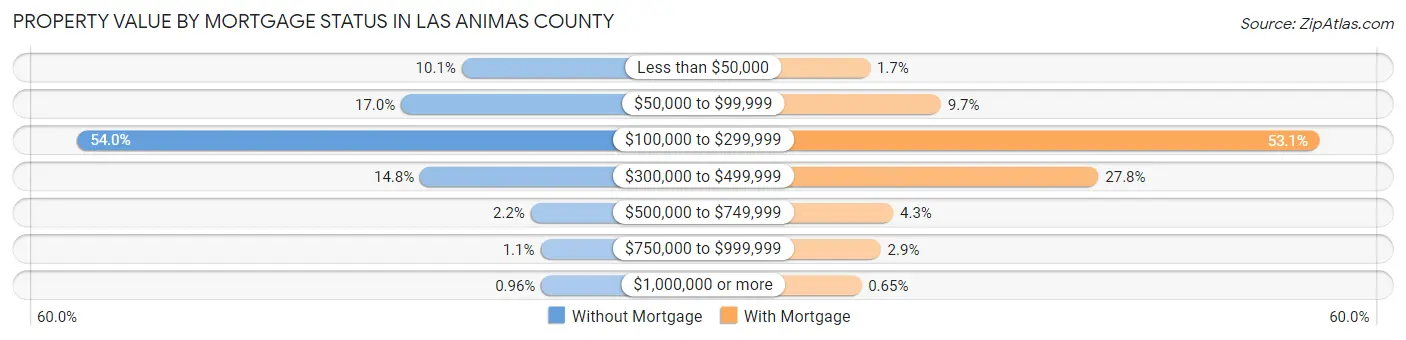
| Property Value | Without Mortgage | With Mortgage |
| Less than $50,000 | 209 (10.1%) | 43 (1.7%) |
| $50,000 to $99,999 | 353 (17.0%) | 254 (9.7%) |
| $100,000 to $299,999 | 1,122 (54.0%) | 1,384 (53.0%) |
| $300,000 to $499,999 | 308 (14.8%) | 724 (27.8%) |
| $500,000 to $749,999 | 45 (2.2%) | 112 (4.3%) |
| $750,000 to $999,999 | 22 (1.1%) | 75 (2.9%) |
| $1,000,000 or more | 20 (1.0%) | 17 (0.6%) |
| Total | 2,079 (100.0%) | 2,609 (100.0%) |
Household Income by Mortgage Status in Las Animas County

| Household Income | Without Mortgage | With Mortgage |
| Less than $10,000 | 173 (8.3%) | 62 (2.4%) |
| $10,000 to $24,999 | 414 (19.9%) | 119 (4.6%) |
| $25,000 to $34,999 | 309 (14.9%) | 167 (6.4%) |
| $35,000 to $49,999 | 279 (13.4%) | 243 (9.3%) |
| $50,000 to $74,999 | 403 (19.4%) | 287 (11.0%) |
| $75,000 to $99,999 | 151 (7.3%) | 639 (24.5%) |
| $100,000 to $149,999 | 238 (11.5%) | 381 (14.6%) |
| $150,000 or more | 112 (5.4%) | 425 (16.3%) |
| Total | 2,079 (100.0%) | 2,609 (100.0%) |
Property Value to Household Income Ratio in Las Animas County
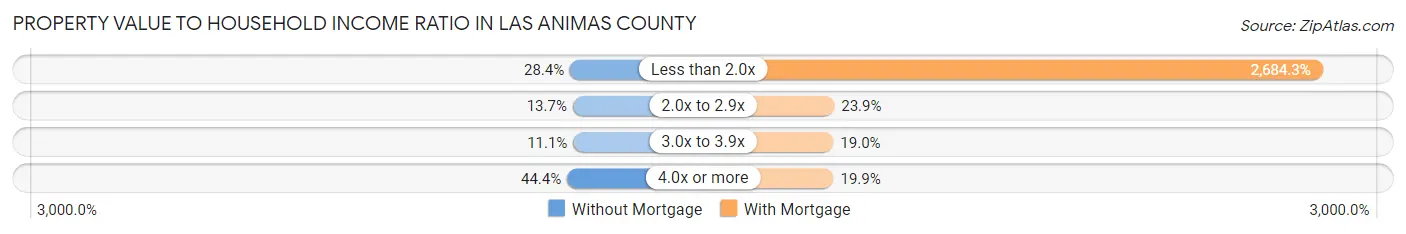
| Value-to-Income Ratio | Without Mortgage | With Mortgage |
| Less than 2.0x | 590 (28.4%) | 70,032 (2,684.3%) |
| 2.0x to 2.9x | 284 (13.7%) | 623 (23.9%) |
| 3.0x to 3.9x | 230 (11.1%) | 495 (19.0%) |
| 4.0x or more | 923 (44.4%) | 518 (19.9%) |
| Total | 2,079 (100.0%) | 2,609 (100.0%) |
Real Estate Taxes by Mortgage Status in Las Animas County

| Property Taxes | Without Mortgage | With Mortgage |
| Less than $800 | 1,721 (82.8%) | 44 (1.7%) |
| $800 to $1,499 | 195 (9.4%) | 1,539 (59.0%) |
| $800 to $1,499 | 120 (5.8%) | 565 (21.7%) |
| Total | 2,079 (100.0%) | 2,609 (100.0%) |
Health & Disability in Las Animas County
Health Insurance Coverage by Age in Las Animas County
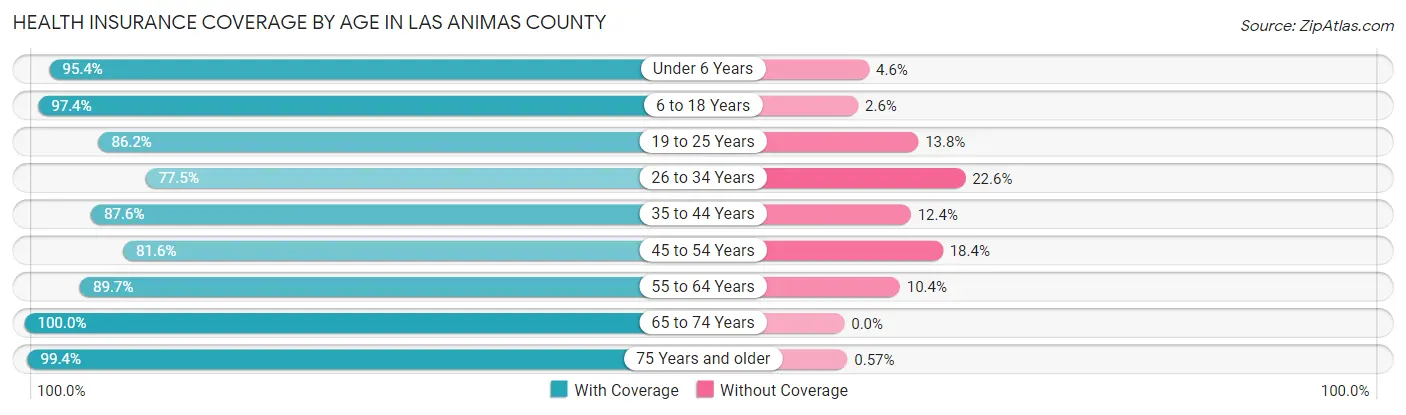
| Age Bracket | With Coverage | Without Coverage |
| Under 6 Years | 762 (95.4%) | 37 (4.6%) |
| 6 to 18 Years | 1,972 (97.4%) | 52 (2.6%) |
| 19 to 25 Years | 926 (86.2%) | 148 (13.8%) |
| 26 to 34 Years | 1,099 (77.4%) | 320 (22.6%) |
| 35 to 44 Years | 1,266 (87.6%) | 179 (12.4%) |
| 45 to 54 Years | 1,267 (81.6%) | 285 (18.4%) |
| 55 to 64 Years | 1,931 (89.6%) | 223 (10.3%) |
| 65 to 74 Years | 2,131 (100.0%) | 0 (0.0%) |
| 75 Years and older | 1,398 (99.4%) | 8 (0.6%) |
| Total | 12,752 (91.1%) | 1,252 (8.9%) |
Health Insurance Coverage by Citizenship Status in Las Animas County
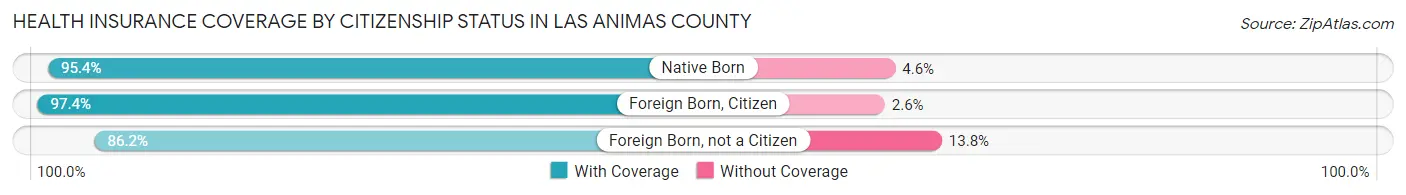
| Citizenship Status | With Coverage | Without Coverage |
| Native Born | 762 (95.4%) | 37 (4.6%) |
| Foreign Born, Citizen | 1,972 (97.4%) | 52 (2.6%) |
| Foreign Born, not a Citizen | 926 (86.2%) | 148 (13.8%) |
Health Insurance Coverage by Household Income in Las Animas County
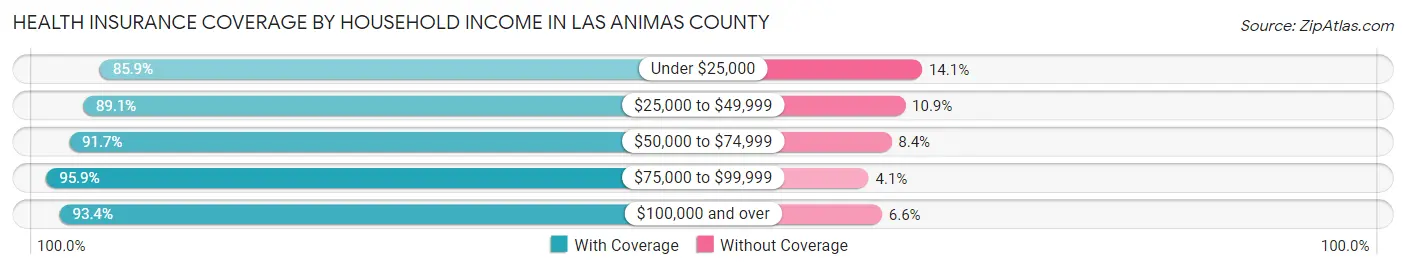
| Household Income | With Coverage | Without Coverage |
| Under $25,000 | 2,409 (85.9%) | 395 (14.1%) |
| $25,000 to $49,999 | 2,633 (89.1%) | 323 (10.9%) |
| $50,000 to $74,999 | 2,548 (91.6%) | 232 (8.4%) |
| $75,000 to $99,999 | 1,670 (95.9%) | 71 (4.1%) |
| $100,000 and over | 3,227 (93.4%) | 227 (6.6%) |
Public vs Private Health Insurance Coverage by Age in Las Animas County
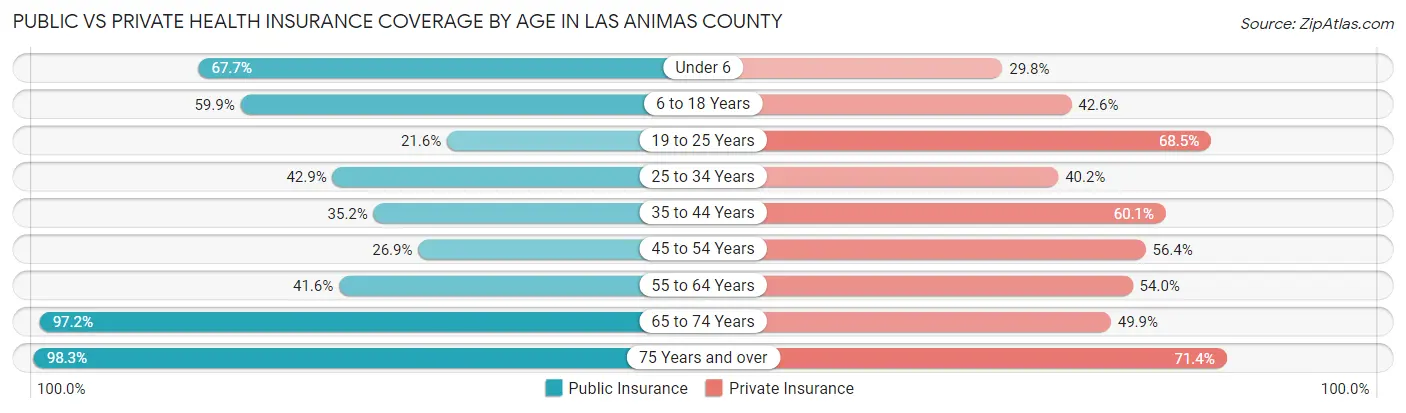
| Age Bracket | Public Insurance | Private Insurance |
| Under 6 | 541 (67.7%) | 238 (29.8%) |
| 6 to 18 Years | 1,213 (59.9%) | 862 (42.6%) |
| 19 to 25 Years | 232 (21.6%) | 736 (68.5%) |
| 25 to 34 Years | 608 (42.8%) | 570 (40.2%) |
| 35 to 44 Years | 509 (35.2%) | 869 (60.1%) |
| 45 to 54 Years | 418 (26.9%) | 875 (56.4%) |
| 55 to 64 Years | 897 (41.6%) | 1,163 (54.0%) |
| 65 to 74 Years | 2,071 (97.2%) | 1,064 (49.9%) |
| 75 Years and over | 1,382 (98.3%) | 1,004 (71.4%) |
| Total | 7,871 (56.2%) | 7,381 (52.7%) |
Disability Status by Sex by Age in Las Animas County
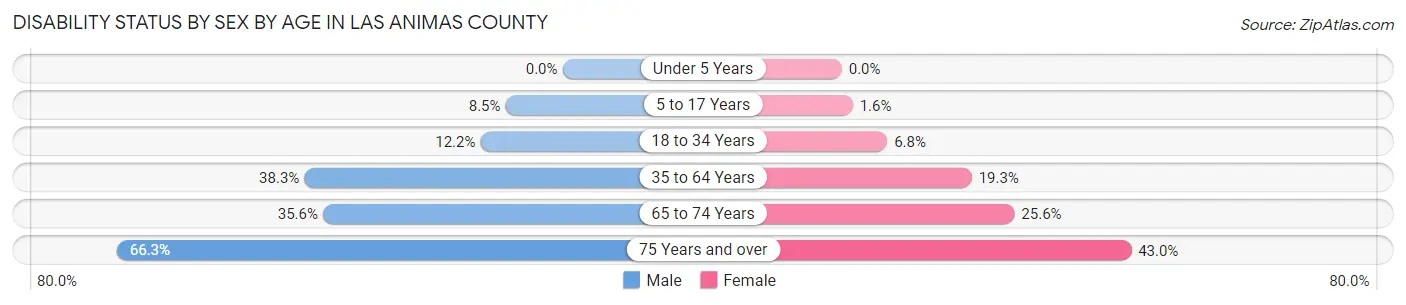
| Age Bracket | Male | Female |
| Under 5 Years | 0 (0.0%) | 0 (0.0%) |
| 5 to 17 Years | 88 (8.5%) | 15 (1.6%) |
| 18 to 34 Years | 184 (12.2%) | 79 (6.8%) |
| 35 to 64 Years | 987 (38.3%) | 497 (19.3%) |
| 65 to 74 Years | 393 (35.6%) | 263 (25.6%) |
| 75 Years and over | 423 (66.3%) | 330 (43.0%) |
Disability Class by Sex by Age in Las Animas County
Disability Class: Hearing Difficulty
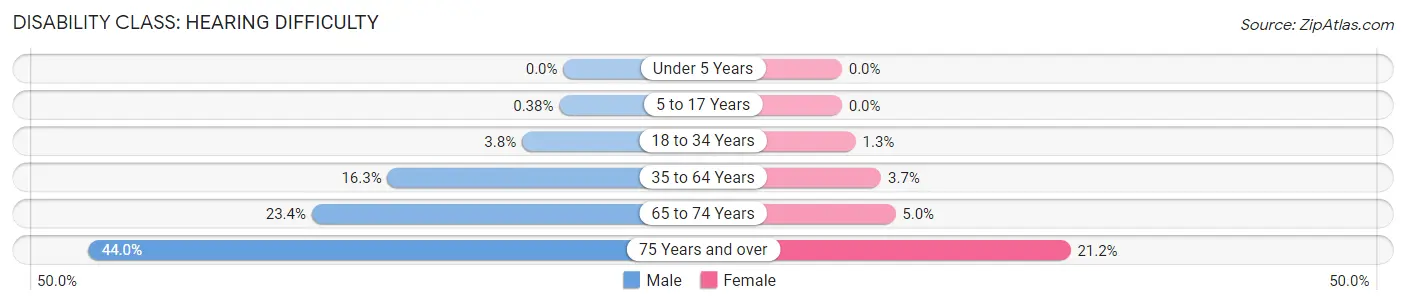
| Age Bracket | Male | Female |
| Under 5 Years | 0 (0.0%) | 0 (0.0%) |
| 5 to 17 Years | 4 (0.4%) | 0 (0.0%) |
| 18 to 34 Years | 58 (3.8%) | 15 (1.3%) |
| 35 to 64 Years | 420 (16.3%) | 94 (3.6%) |
| 65 to 74 Years | 258 (23.4%) | 51 (5.0%) |
| 75 Years and over | 281 (44.0%) | 163 (21.2%) |
Disability Class: Vision Difficulty
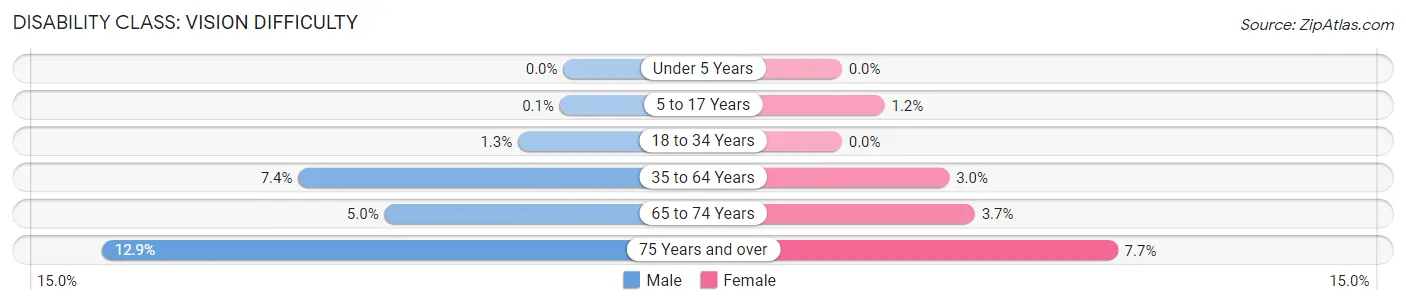
| Age Bracket | Male | Female |
| Under 5 Years | 0 (0.0%) | 0 (0.0%) |
| 5 to 17 Years | 1 (0.1%) | 11 (1.2%) |
| 18 to 34 Years | 19 (1.3%) | 0 (0.0%) |
| 35 to 64 Years | 190 (7.4%) | 77 (3.0%) |
| 65 to 74 Years | 55 (5.0%) | 38 (3.7%) |
| 75 Years and over | 82 (12.9%) | 59 (7.7%) |
Disability Class: Cognitive Difficulty
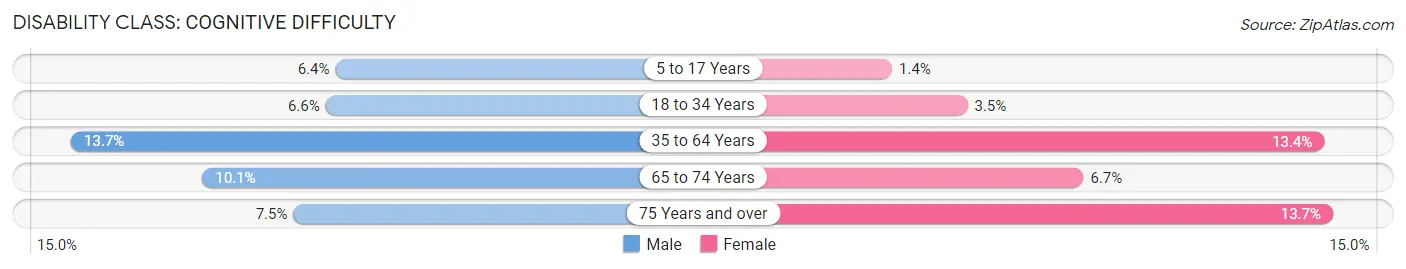
| Age Bracket | Male | Female |
| 5 to 17 Years | 66 (6.4%) | 13 (1.4%) |
| 18 to 34 Years | 100 (6.6%) | 41 (3.5%) |
| 35 to 64 Years | 353 (13.7%) | 346 (13.4%) |
| 65 to 74 Years | 111 (10.1%) | 69 (6.7%) |
| 75 Years and over | 48 (7.5%) | 105 (13.7%) |
Disability Class: Ambulatory Difficulty
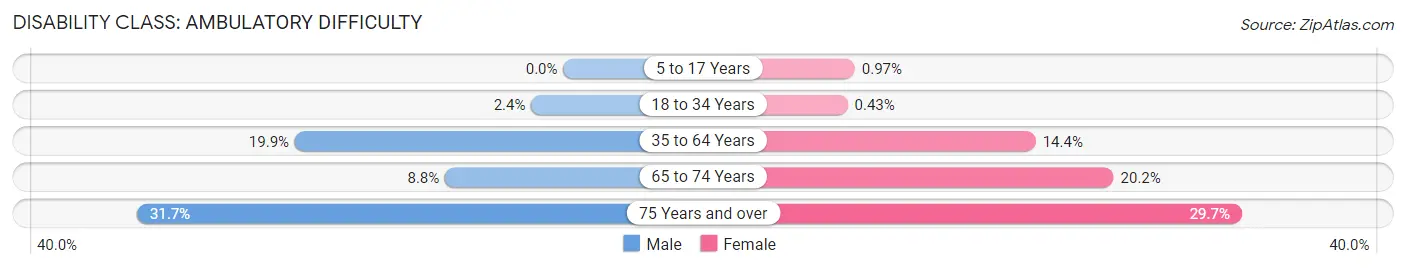
| Age Bracket | Male | Female |
| 5 to 17 Years | 0 (0.0%) | 9 (1.0%) |
| 18 to 34 Years | 36 (2.4%) | 5 (0.4%) |
| 35 to 64 Years | 513 (19.9%) | 371 (14.4%) |
| 65 to 74 Years | 97 (8.8%) | 207 (20.2%) |
| 75 Years and over | 202 (31.7%) | 228 (29.7%) |
Disability Class: Self-Care Difficulty
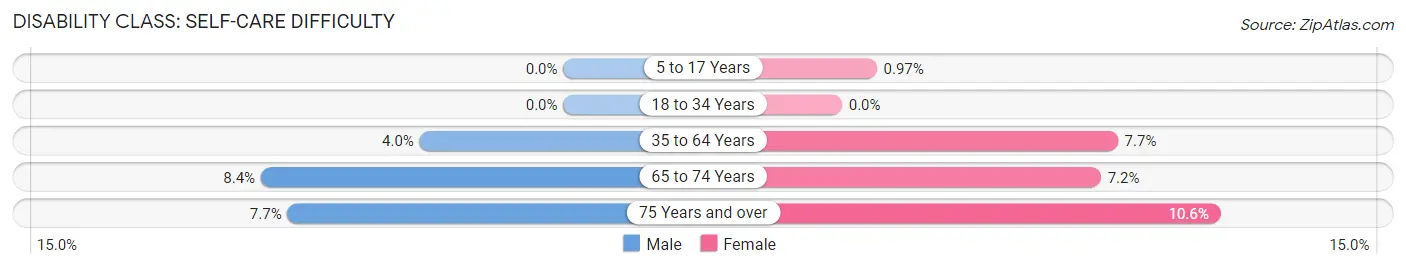
| Age Bracket | Male | Female |
| 5 to 17 Years | 0 (0.0%) | 9 (1.0%) |
| 18 to 34 Years | 0 (0.0%) | 0 (0.0%) |
| 35 to 64 Years | 103 (4.0%) | 198 (7.7%) |
| 65 to 74 Years | 93 (8.4%) | 74 (7.2%) |
| 75 Years and over | 49 (7.7%) | 81 (10.5%) |
Technology Access in Las Animas County
Computing Device Access in Las Animas County
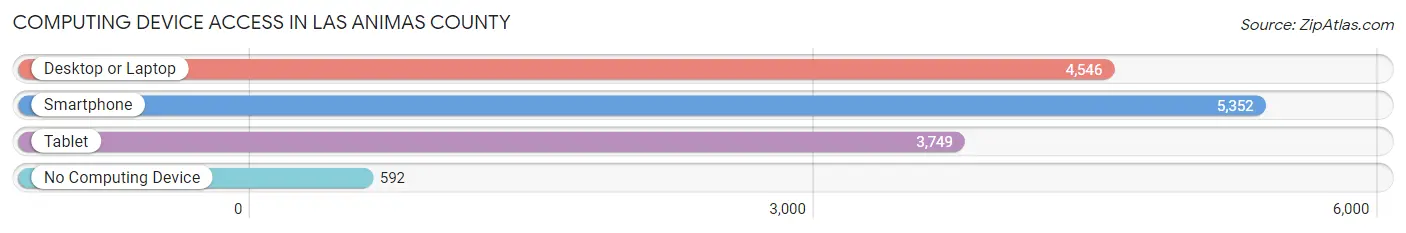
| Device Type | # Households | % Households |
| Desktop or Laptop | 4,546 | 68.6% |
| Smartphone | 5,352 | 80.7% |
| Tablet | 3,749 | 56.5% |
| No Computing Device | 592 | 8.9% |
| Total | 6,631 | 100.0% |
Internet Access in Las Animas County
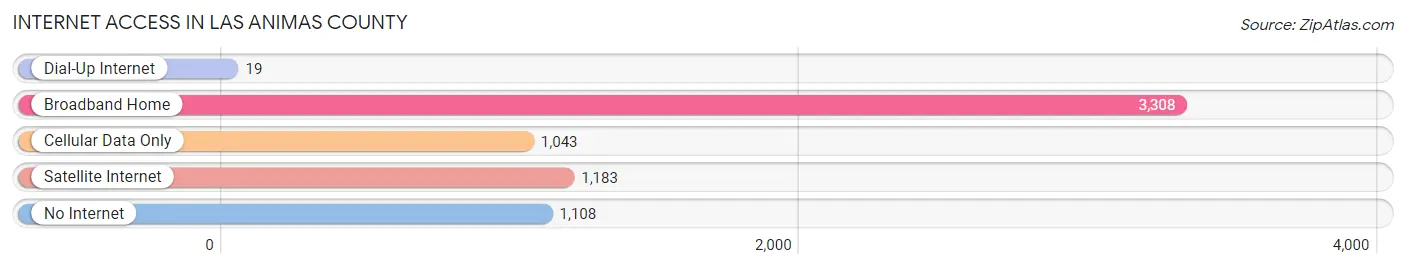
| Internet Type | # Households | % Households |
| Dial-Up Internet | 19 | 0.3% |
| Broadband Home | 3,308 | 49.9% |
| Cellular Data Only | 1,043 | 15.7% |
| Satellite Internet | 1,183 | 17.8% |
| No Internet | 1,108 | 16.7% |
| Total | 6,631 | 100.0% |
Las Animas County Summary
Animas County is located in the southwestern corner of Colorado, bordered by New Mexico to the south and west, La Plata County to the north, and Archuleta County to the east. The county seat is the town of Durango, which is also the largest city in the county. Animas County covers an area of 1,945 square miles and has a population of 33,844 as of the 2020 census.
History
The area that is now Animas County was originally inhabited by the Ute and Navajo tribes. The first Europeans to explore the area were Spanish explorers in the late 1700s. The area was part of the New Mexico Territory until 1861, when it became part of the Colorado Territory. Animas County was officially established in 1883, and the county seat was moved to Durango in 1885.
The county was named after the Animas River, which runs through the county. The river was named by Spanish explorer Antonio de Espejo in 1582, who named it after the Spanish word for “souls”.
Geography
Animas County is located in the southwestern corner of Colorado, bordered by New Mexico to the south and west, La Plata County to the north, and Archuleta County to the east. The county covers an area of 1,945 square miles and has a population of 33,844 as of the 2020 census.
The county is located in the San Juan Mountains, and is home to several mountain peaks, including Engineer Mountain (12,968 feet), Animas Mountain (12,841 feet), and Hesperus Mountain (12,717 feet). The county is also home to the Animas River, which runs through the county and is a popular destination for whitewater rafting and kayaking.
Economy
Animas County’s economy is largely based on tourism, with the county’s proximity to the San Juan Mountains and the Animas River making it a popular destination for outdoor recreation. The county is also home to several ski resorts, including Purgatory Resort and Hesperus Ski Area.
The county is also home to several mining operations, including the Summitville Mine, which is located in the San Juan Mountains. The mine has been in operation since the late 1800s and is one of the largest gold mines in the United States.
Demographics
As of the 2020 census, Animas County had a population of 33,844. The racial makeup of the county was 87.3% White, 0.7% Black or African American, 1.2% Native American, 0.7% Asian, 0.1% Pacific Islander, 8.2% from other races, and 2.0% from two or more races. Hispanic or Latino of any race were 20.2% of the population.
The median household income in Animas County was $50,945, and the median family income was $60,945. The per capita income was $27,945. About 11.2% of the population was below the poverty line.
The largest employers in the county are the Durango School District, Mercy Regional Medical Center, and the City of Durango. The county is also home to several higher education institutions, including Fort Lewis College and the Colorado Mountain College Durango Campus.
Common Questions
What is Per Capita Income in Las Animas County?
Per Capita income in Las Animas County is $29,432.
What is the Median Family Income in Las Animas County?
Median Family Income in Las Animas County is $63,730.
What is the Median Household income in Las Animas County?
Median Household Income in Las Animas County is $48,965.
What is Income or Wage Gap in Las Animas County?
Income or Wage Gap in Las Animas County is 20.9%.
Women in Las Animas County earn 79.1 cents for every dollar earned by a man.
What is Family Income Deficit in Las Animas County?
Family Income Deficit in Las Animas County is $11,863.
Families that are below poverty line in Las Animas County earn $11,863 less on average than the poverty threshold level.
What is Inequality or Gini Index in Las Animas County?
Inequality or Gini Index in Las Animas County is 0.47.
What is the Total Population of Las Animas County?
Total Population of Las Animas County is 14,422.
What is the Total Male Population of Las Animas County?
Total Male Population of Las Animas County is 7,537.
What is the Total Female Population of Las Animas County?
Total Female Population of Las Animas County is 6,885.
What is the Ratio of Males per 100 Females in Las Animas County?
There are 109.47 Males per 100 Females in Las Animas County.
What is the Ratio of Females per 100 Males in Las Animas County?
There are 91.35 Females per 100 Males in Las Animas County.
What is the Median Population Age in Las Animas County?
Median Population Age in Las Animas County is 46.8 Years.
What is the Average Family Size in Las Animas County
Average Family Size in Las Animas County is 2.6 People.
What is the Average Household Size in Las Animas County
Average Household Size in Las Animas County is 2.1 People.
How Large is the Labor Force in Las Animas County?
There are 6,295 People in the Labor Forcein in Las Animas County.
What is the Percentage of People in the Labor Force in Las Animas County?
51.8% of People are in the Labor Force in Las Animas County.
What is the Unemployment Rate in Las Animas County?
Unemployment Rate in Las Animas County is 7.4%.