Lake County, CO Map & Demographics
Lake County Map
Lake County Overview
$44,794
PER CAPITA INCOME
$98,158
AVG FAMILY INCOME
$78,942
AVG HOUSEHOLD INCOME
11.1%
WAGE / INCOME GAP [ % ]
88.9¢/ $1
WAGE / INCOME GAP [ $ ]
0.40
INEQUALITY / GINI INDEX
7,403
TOTAL POPULATION
3,920
MALE POPULATION
3,483
FEMALE POPULATION
112.55
MALES / 100 FEMALES
88.85
FEMALES / 100 MALES
36.8
MEDIAN AGE
3.5
AVG FAMILY SIZE
2.6
AVG HOUSEHOLD SIZE
4,720
LABOR FORCE [ PEOPLE ]
74.7%
PERCENT IN LABOR FORCE
2.4%
UNEMPLOYMENT RATE
Lake County Area Codes
Income in Lake County
Income Overview in Lake County
Per Capita Income in Lake County is $44,794, while median incomes of families and households are $98,158 and $78,942 respectively.
| Characteristic | Number | Measure |
| Per Capita Income | 7,403 | $44,794 |
| Median Family Income | 1,412 | $98,158 |
| Mean Family Income | 1,412 | $120,025 |
| Median Household Income | 2,837 | $78,942 |
| Mean Household Income | 2,837 | $95,574 |
| Income Deficit | 1,412 | $0 |
| Wage / Income Gap (%) | 7,403 | 11.09% |
| Wage / Income Gap ($) | 7,403 | 88.91¢ per $1 |
| Gini / Inequality Index | 7,403 | 0.40 |
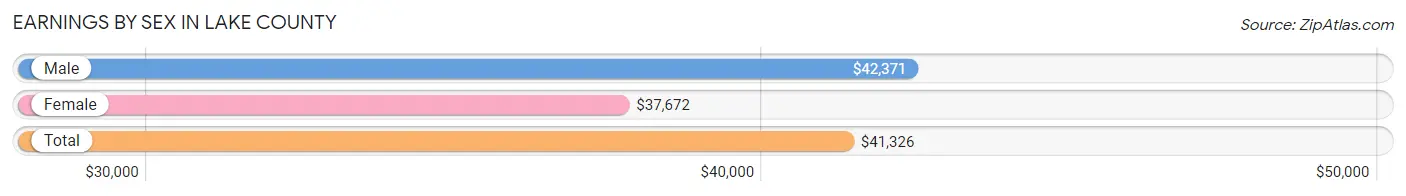
Earnings by Sex in Lake County
Average Earnings in Lake County are $41,326, $42,371 for men and $37,672 for women, a difference of 11.1%.
| Sex | Number | Average Earnings |
| Male | 2,897 (56.8%) | $42,371 |
| Female | 2,206 (43.2%) | $37,672 |
| Total | 5,103 (100.0%) | $41,326 |
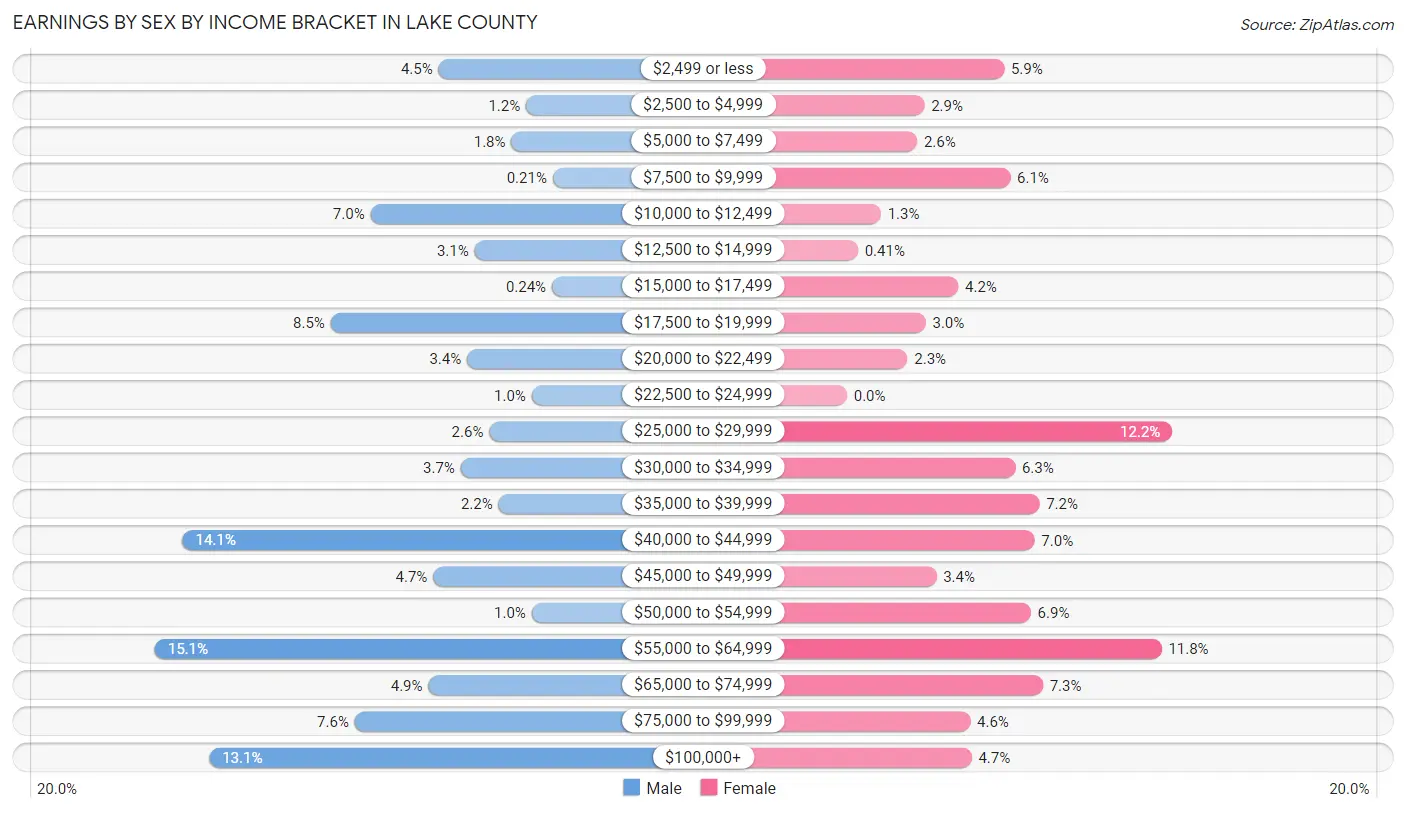
Earnings by Sex by Income Bracket in Lake County
The most common earnings brackets in Lake County are $55,000 to $64,999 for men (438 | 15.1%) and $25,000 to $29,999 for women (269 | 12.2%).
| Income | Male | Female |
| $2,499 or less | 130 (4.5%) | 130 (5.9%) |
| $2,500 to $4,999 | 35 (1.2%) | 64 (2.9%) |
| $5,000 to $7,499 | 51 (1.8%) | 58 (2.6%) |
| $7,500 to $9,999 | 6 (0.2%) | 135 (6.1%) |
| $10,000 to $12,499 | 204 (7.0%) | 28 (1.3%) |
| $12,500 to $14,999 | 91 (3.1%) | 9 (0.4%) |
| $15,000 to $17,499 | 7 (0.2%) | 92 (4.2%) |
| $17,500 to $19,999 | 247 (8.5%) | 65 (2.9%) |
| $20,000 to $22,499 | 99 (3.4%) | 50 (2.3%) |
| $22,500 to $24,999 | 29 (1.0%) | 0 (0.0%) |
| $25,000 to $29,999 | 75 (2.6%) | 269 (12.2%) |
| $30,000 to $34,999 | 106 (3.7%) | 139 (6.3%) |
| $35,000 to $39,999 | 65 (2.2%) | 159 (7.2%) |
| $40,000 to $44,999 | 408 (14.1%) | 155 (7.0%) |
| $45,000 to $49,999 | 136 (4.7%) | 74 (3.4%) |
| $50,000 to $54,999 | 29 (1.0%) | 152 (6.9%) |
| $55,000 to $64,999 | 438 (15.1%) | 260 (11.8%) |
| $65,000 to $74,999 | 141 (4.9%) | 162 (7.3%) |
| $75,000 to $99,999 | 221 (7.6%) | 102 (4.6%) |
| $100,000+ | 379 (13.1%) | 103 (4.7%) |
| Total | 2,897 (100.0%) | 2,206 (100.0%) |
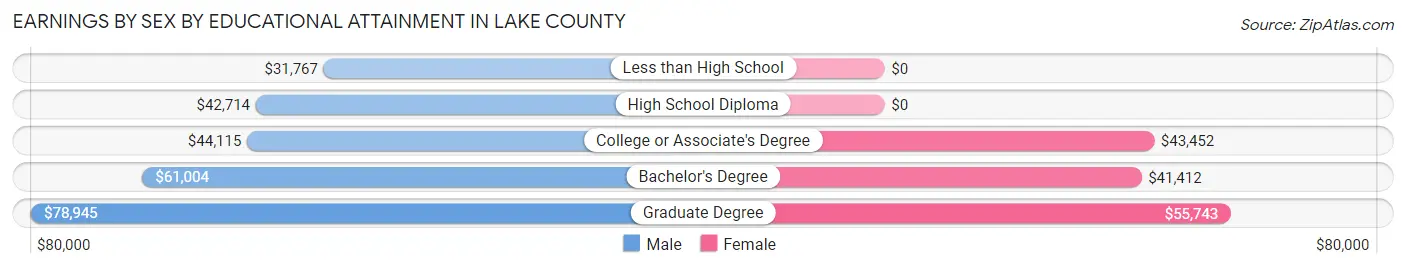
Earnings by Sex by Educational Attainment in Lake County
Average earnings in Lake County are $56,189 for men and $43,460 for women, a difference of 22.7%. Men with an educational attainment of graduate degree enjoy the highest average annual earnings of $78,945, while those with less than high school education earn the least with $31,767. Women with an educational attainment of graduate degree earn the most with the average annual earnings of $55,743, while those with bachelor's degree education have the smallest earnings of $41,412.
| Educational Attainment | Male Income | Female Income |
| Less than High School | $31,767 | $0 |
| High School Diploma | $42,714 | $0 |
| College or Associate's Degree | $44,115 | $43,452 |
| Bachelor's Degree | $61,004 | $41,412 |
| Graduate Degree | $78,945 | $55,743 |
| Total | $56,189 | $43,460 |
Family Income in Lake County
Family Income Brackets in Lake County
According to the Lake County family income data, there are 347 families falling into the $100,000 to $149,999 income range, which is the most common income bracket and makes up 24.6% of all families. Conversely, the $15,000 to $24,999 income bracket is the least frequent group with only 16 families (1.1%) belonging to this category.
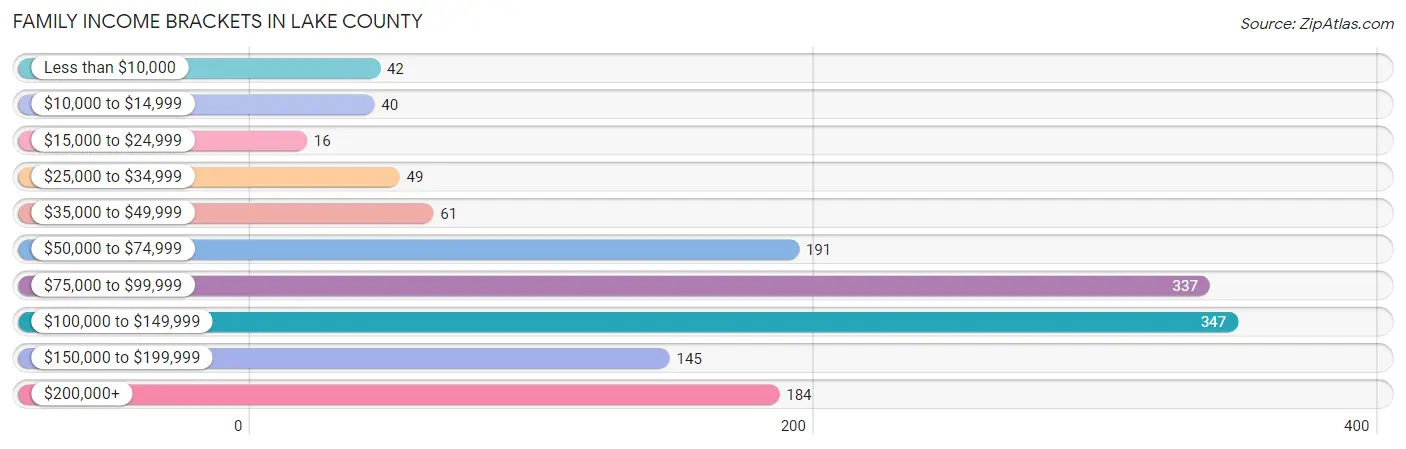
| Income Bracket | # Families | % Families |
| Less than $10,000 | 42 | 3.0% |
| $10,000 to $14,999 | 40 | 2.8% |
| $15,000 to $24,999 | 16 | 1.1% |
| $25,000 to $34,999 | 49 | 3.5% |
| $35,000 to $49,999 | 61 | 4.3% |
| $50,000 to $74,999 | 191 | 13.5% |
| $75,000 to $99,999 | 337 | 23.9% |
| $100,000 to $149,999 | 347 | 24.6% |
| $150,000 to $199,999 | 145 | 10.3% |
| $200,000+ | 184 | 13.0% |
Family Income by Famaliy Size in Lake County
4-person families (296 | 21.0%) account for the highest median family income in Lake County with $168,304 per family, while 2-person families (746 | 52.8%) have the highest median income of $47,378 per family member.
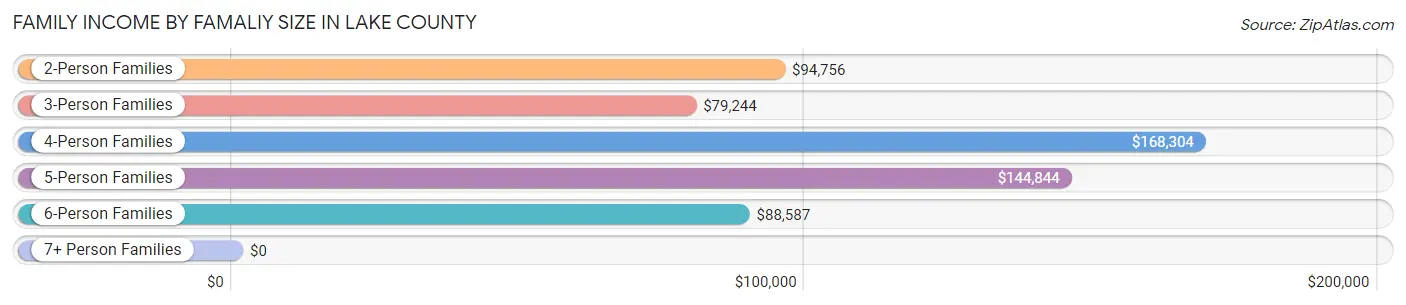
| Income Bracket | # Families | Median Income |
| 2-Person Families | 746 (52.8%) | $94,756 |
| 3-Person Families | 242 (17.1%) | $79,244 |
| 4-Person Families | 296 (21.0%) | $168,304 |
| 5-Person Families | 31 (2.2%) | $144,844 |
| 6-Person Families | 80 (5.7%) | $88,587 |
| 7+ Person Families | 17 (1.2%) | $0 |
| Total | 1,412 (100.0%) | $98,158 |
Family Income by Number of Earners in Lake County
The median family income in Lake County is $98,158, with families comprising 3+ earners (268) having the highest median family income of $169,107, while families with no earners (176) have the lowest median family income of $73,056, accounting for 19.0% and 12.5% of families, respectively.

| Number of Earners | # Families | Median Income |
| No Earners | 176 (12.5%) | $73,056 |
| 1 Earner | 295 (20.9%) | $73,942 |
| 2 Earners | 673 (47.7%) | $103,580 |
| 3+ Earners | 268 (19.0%) | $169,107 |
| Total | 1,412 (100.0%) | $98,158 |
Household Income in Lake County
Household Income Brackets in Lake County
With 647 households falling in the category, the $50,000 to $74,999 income range is the most frequent in Lake County, accounting for 22.8% of all households. In contrast, only 68 households (2.4%) fall into the $25,000 to $34,999 income bracket, making it the least populous group.
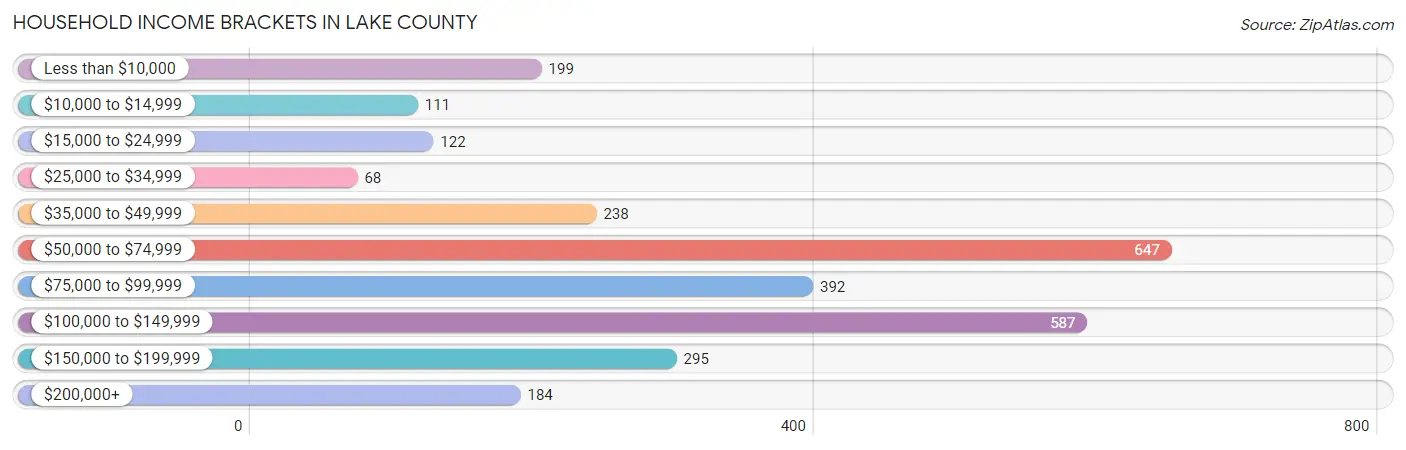
| Income Bracket | # Households | % Households |
| Less than $10,000 | 199 | 7.0% |
| $10,000 to $14,999 | 111 | 3.9% |
| $15,000 to $24,999 | 122 | 4.3% |
| $25,000 to $34,999 | 68 | 2.4% |
| $35,000 to $49,999 | 238 | 8.4% |
| $50,000 to $74,999 | 647 | 22.8% |
| $75,000 to $99,999 | 392 | 13.8% |
| $100,000 to $149,999 | 587 | 20.7% |
| $150,000 to $199,999 | 295 | 10.4% |
| $200,000+ | 184 | 6.5% |
Household Income by Householder Age in Lake County
The median household income in Lake County is $78,942, with the highest median household income of $99,063 found in the 25 to 44 years age bracket for the primary householder. A total of 1,018 households (35.9%) fall into this category. Meanwhile, the 15 to 24 years age bracket for the primary householder has the lowest median household income of $0, with 89 households (3.1%) in this group.
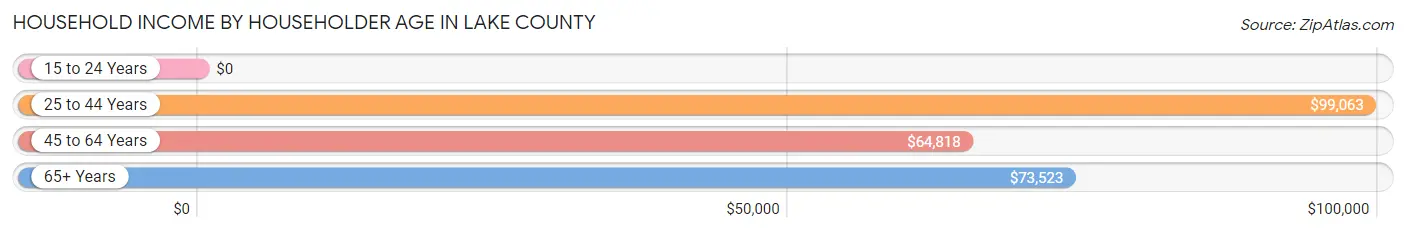
| Income Bracket | # Households | Median Income |
| 15 to 24 Years | 89 (3.1%) | $0 |
| 25 to 44 Years | 1,018 (35.9%) | $99,063 |
| 45 to 64 Years | 1,148 (40.5%) | $64,818 |
| 65+ Years | 582 (20.5%) | $73,523 |
| Total | 2,837 (100.0%) | $78,942 |
Poverty in Lake County
Income Below Poverty by Sex and Age in Lake County
With 4.6% poverty level for males and 10.2% for females among the residents of Lake County, 55 to 64 year old males and 15 year old females are the most vulnerable to poverty, with 55 males (17.9%) and 30 females (83.3%) in their respective age groups living below the poverty level.
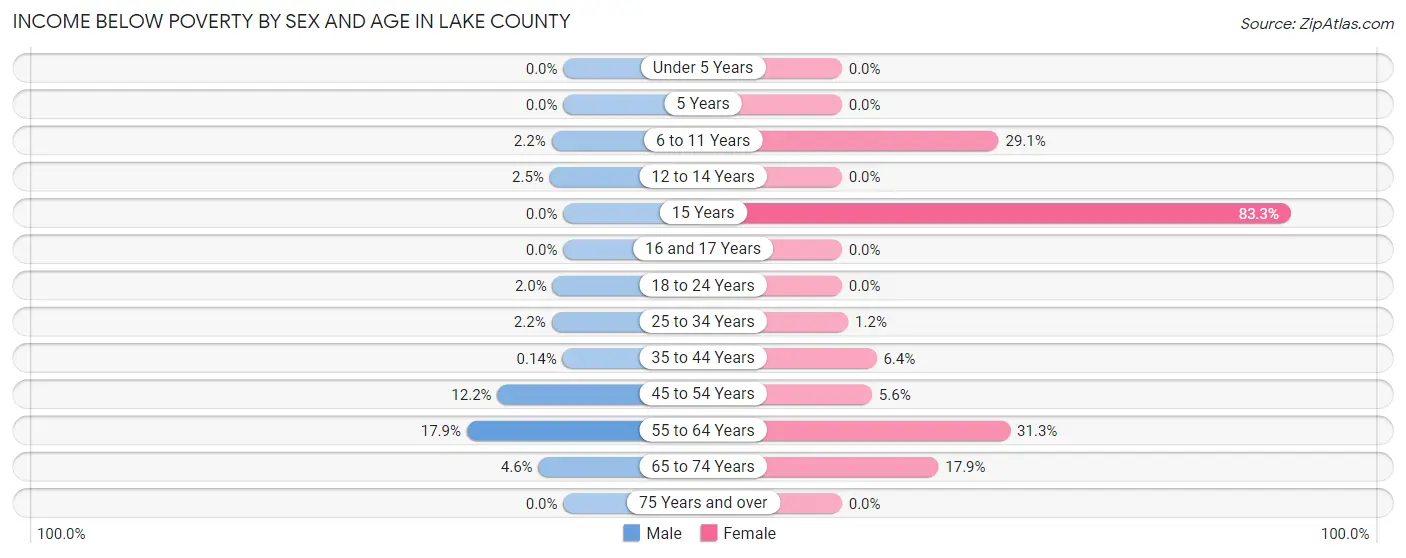
| Age Bracket | Male | Female |
| Under 5 Years | 0 (0.0%) | 0 (0.0%) |
| 5 Years | 0 (0.0%) | 0 (0.0%) |
| 6 to 11 Years | 4 (2.2%) | 55 (29.1%) |
| 12 to 14 Years | 3 (2.5%) | 0 (0.0%) |
| 15 Years | 0 (0.0%) | 30 (83.3%) |
| 16 and 17 Years | 0 (0.0%) | 0 (0.0%) |
| 18 to 24 Years | 10 (2.0%) | 0 (0.0%) |
| 25 to 34 Years | 16 (2.2%) | 8 (1.2%) |
| 35 to 44 Years | 1 (0.1%) | 32 (6.4%) |
| 45 to 54 Years | 66 (12.2%) | 18 (5.6%) |
| 55 to 64 Years | 55 (17.9%) | 135 (31.2%) |
| 65 to 74 Years | 20 (4.6%) | 74 (17.9%) |
| 75 Years and over | 0 (0.0%) | 0 (0.0%) |
| Total | 175 (4.6%) | 352 (10.2%) |
Income Above Poverty by Sex and Age in Lake County
According to the poverty statistics in Lake County, males aged under 5 years and females aged under 5 years are the age groups that are most secure financially, with 100.0% of males and 100.0% of females in these age groups living above the poverty line.
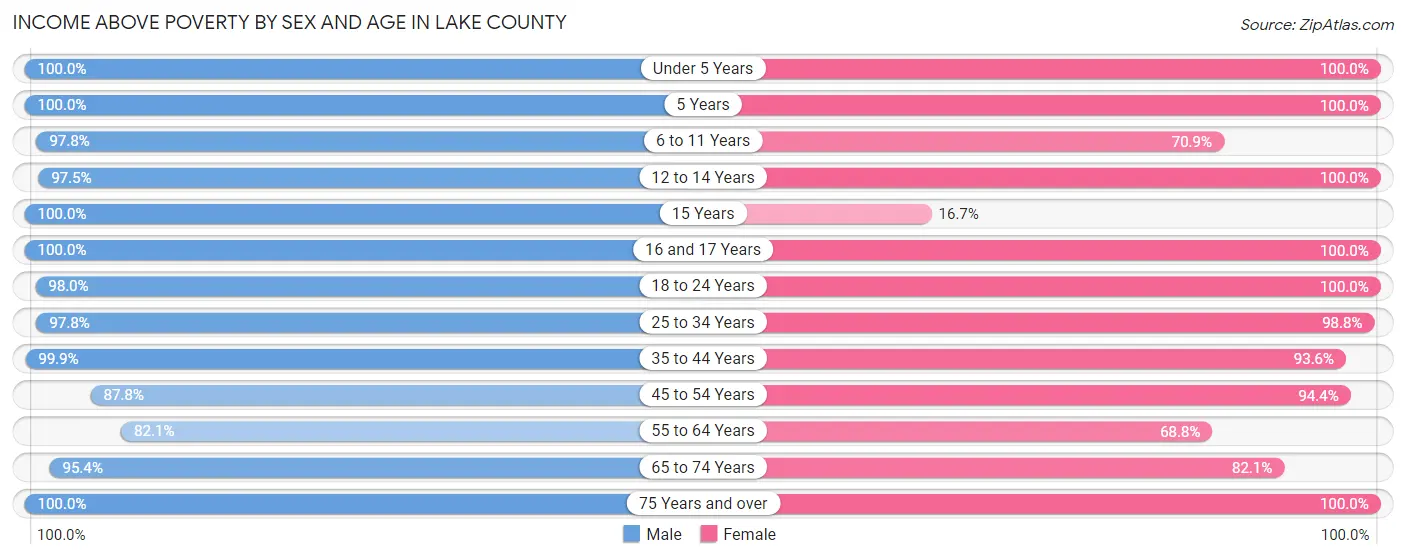
| Age Bracket | Male | Female |
| Under 5 Years | 71 (100.0%) | 242 (100.0%) |
| 5 Years | 21 (100.0%) | 17 (100.0%) |
| 6 to 11 Years | 178 (97.8%) | 134 (70.9%) |
| 12 to 14 Years | 115 (97.5%) | 164 (100.0%) |
| 15 Years | 30 (100.0%) | 6 (16.7%) |
| 16 and 17 Years | 86 (100.0%) | 65 (100.0%) |
| 18 to 24 Years | 491 (98.0%) | 316 (100.0%) |
| 25 to 34 Years | 712 (97.8%) | 668 (98.8%) |
| 35 to 44 Years | 690 (99.9%) | 465 (93.6%) |
| 45 to 54 Years | 473 (87.8%) | 304 (94.4%) |
| 55 to 64 Years | 252 (82.1%) | 297 (68.8%) |
| 65 to 74 Years | 412 (95.4%) | 339 (82.1%) |
| 75 Years and over | 114 (100.0%) | 73 (100.0%) |
| Total | 3,645 (95.4%) | 3,090 (89.8%) |
Income Below Poverty Among Married-Couple Families in Lake County
The poverty statistics for married-couple families in Lake County show that 4.2% or 49 of the total 1,173 families live below the poverty line. Families with 1 or 2 children have the highest poverty rate of 7.1%, comprising of 29 families. On the other hand, families with 3 or 4 children have the lowest poverty rate of 0.0%, which includes 0 families.
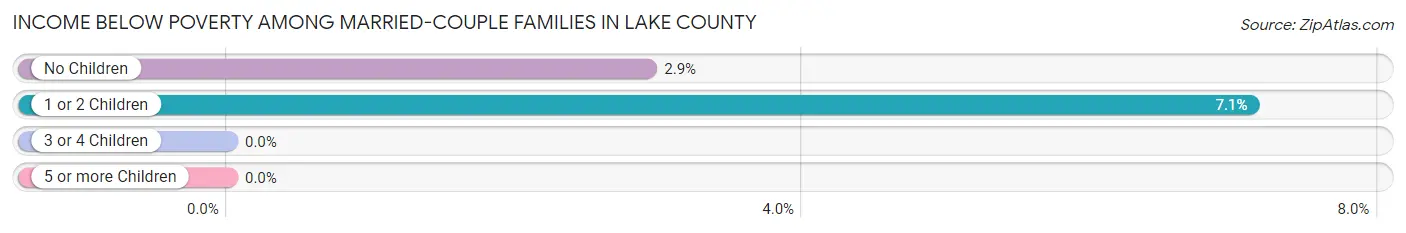
| Children | Above Poverty | Below Poverty |
| No Children | 664 (97.1%) | 20 (2.9%) |
| 1 or 2 Children | 379 (92.9%) | 29 (7.1%) |
| 3 or 4 Children | 81 (100.0%) | 0 (0.0%) |
| 5 or more Children | 0 (0.0%) | 0 (0.0%) |
| Total | 1,124 (95.8%) | 49 (4.2%) |
Income Below Poverty Among Single-Parent Households in Lake County
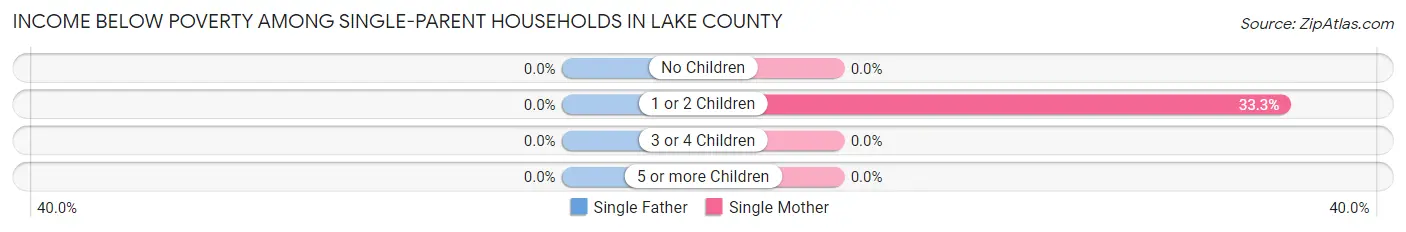
| Children | Single Father | Single Mother |
| No Children | 0 (0.0%) | 0 (0.0%) |
| 1 or 2 Children | 0 (0.0%) | 32 (33.3%) |
| 3 or 4 Children | 0 (0.0%) | 0 (0.0%) |
| 5 or more Children | 0 (0.0%) | 0 (0.0%) |
| Total | 0 (0.0%) | 32 (13.6%) |
Income Below Poverty Among Married-Couple vs Single-Parent Households in Lake County
The poverty data for Lake County shows that 49 of the married-couple family households (4.2%) and 32 of the single-parent households (13.4%) are living below the poverty level. Within the married-couple family households, those with 1 or 2 children have the highest poverty rate, with 29 households (7.1%) falling below the poverty line. Among the single-parent households, those with 1 or 2 children have the highest poverty rate, with 32 household (33.3%) living below poverty.
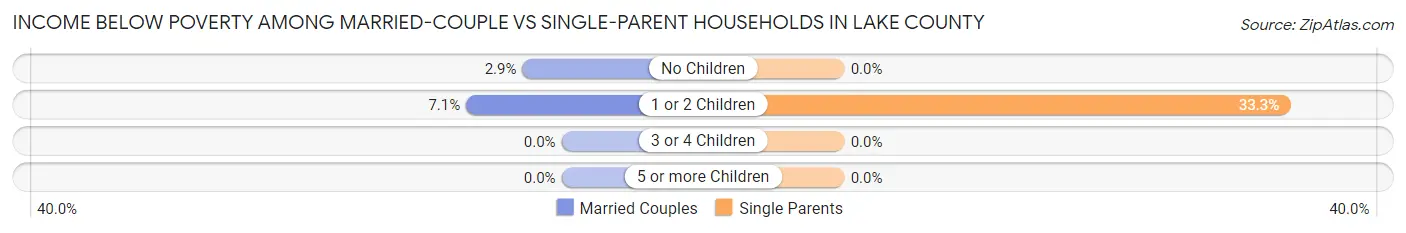
| Children | Married-Couple Families | Single-Parent Households |
| No Children | 20 (2.9%) | 0 (0.0%) |
| 1 or 2 Children | 29 (7.1%) | 32 (33.3%) |
| 3 or 4 Children | 0 (0.0%) | 0 (0.0%) |
| 5 or more Children | 0 (0.0%) | 0 (0.0%) |
| Total | 49 (4.2%) | 32 (13.4%) |
Race in Lake County
The most populous races in Lake County are White / Caucasian (5,470 | 73.9%), Hispanic or Latino (2,269 | 30.6%), and Two or more Races (1,286 | 17.4%).

| Race | # Population | % Population |
| Asian | 24 | 0.3% |
| Black / African American | 9 | 0.1% |
| Hawaiian / Pacific | 2 | 0.0% |
| Hispanic or Latino | 2,269 | 30.6% |
| Native / Alaskan | 182 | 2.5% |
| White / Caucasian | 5,470 | 73.9% |
| Two or more Races | 1,286 | 17.4% |
| Some other Race | 430 | 5.8% |
| Total | 7,403 | 100.0% |
Ancestry in Lake County
The most populous ancestries reported in Lake County are Mexican (1,624 | 21.9%), German (960 | 13.0%), Irish (854 | 11.5%), English (718 | 9.7%), and Italian (346 | 4.7%), together accounting for 60.8% of all Lake County residents.

| Ancestry | # Population | % Population |
| American | 101 | 1.4% |
| Apache | 105 | 1.4% |
| Austrian | 38 | 0.5% |
| Belgian | 19 | 0.3% |
| Bhutanese | 9 | 0.1% |
| Burmese | 24 | 0.3% |
| Cajun | 8 | 0.1% |
| Canadian | 12 | 0.2% |
| Carpatho Rusyn | 18 | 0.2% |
| Central American | 30 | 0.4% |
| Cherokee | 14 | 0.2% |
| Cheyenne | 21 | 0.3% |
| Chinese | 10 | 0.1% |
| Chippewa | 2 | 0.0% |
| Choctaw | 38 | 0.5% |
| Colombian | 3 | 0.0% |
| Danish | 66 | 0.9% |
| Dutch | 46 | 0.6% |
| Eastern European | 20 | 0.3% |
| Ecuadorian | 217 | 2.9% |
| English | 718 | 9.7% |
| European | 245 | 3.3% |
| French | 185 | 2.5% |
| French Canadian | 49 | 0.7% |
| German | 960 | 13.0% |
| Greek | 10 | 0.1% |
| Guatemalan | 30 | 0.4% |
| Guyanese | 9 | 0.1% |
| Hopi | 4 | 0.1% |
| Hungarian | 2 | 0.0% |
| Indian (Asian) | 23 | 0.3% |
| Inupiat | 34 | 0.5% |
| Irish | 854 | 11.5% |
| Italian | 346 | 4.7% |
| Lithuanian | 39 | 0.5% |
| Mexican | 1,624 | 21.9% |
| Mexican American Indian | 10 | 0.1% |
| Native Hawaiian | 4 | 0.1% |
| Navajo | 50 | 0.7% |
| Northern European | 21 | 0.3% |
| Norwegian | 190 | 2.6% |
| Peruvian | 9 | 0.1% |
| Polish | 147 | 2.0% |
| Potawatomi | 2 | 0.0% |
| Pueblo | 14 | 0.2% |
| Romanian | 115 | 1.5% |
| Russian | 4 | 0.1% |
| Scotch-Irish | 94 | 1.3% |
| Scottish | 237 | 3.2% |
| Sioux | 25 | 0.3% |
| Slavic | 18 | 0.2% |
| Slovak | 10 | 0.1% |
| Slovene | 46 | 0.6% |
| South American | 229 | 3.1% |
| Spaniard | 24 | 0.3% |
| Spanish | 49 | 0.7% |
| Swedish | 86 | 1.2% |
| Swiss | 65 | 0.9% |
| Thai | 11 | 0.2% |
| Ukrainian | 11 | 0.2% |
| Welsh | 9 | 0.1% |
| Yugoslavian | 7 | 0.1% | View All 62 Rows |
Immigrants in Lake County
The most numerous immigrant groups reported in Lake County came from Central America (745 | 10.1%), Latin America (745 | 10.1%), Mexico (745 | 10.1%), Canada (17 | 0.2%), and Asia (10 | 0.1%), together accounting for 30.5% of all Lake County residents.

| Immigration Origin | # Population | % Population |
| Asia | 10 | 0.1% |
| Belgium | 9 | 0.1% |
| Canada | 17 | 0.2% |
| Central America | 745 | 10.1% |
| Eastern Asia | 8 | 0.1% |
| Europe | 9 | 0.1% |
| India | 2 | 0.0% |
| Korea | 8 | 0.1% |
| Latin America | 745 | 10.1% |
| Mexico | 745 | 10.1% |
| South Central Asia | 2 | 0.0% |
| Western Europe | 9 | 0.1% | View All 12 Rows |
Sex and Age in Lake County
Sex and Age in Lake County
The most populous age groups in Lake County are 40 to 44 Years (432 | 11.0%) for men and 30 to 34 Years (439 | 12.6%) for women.
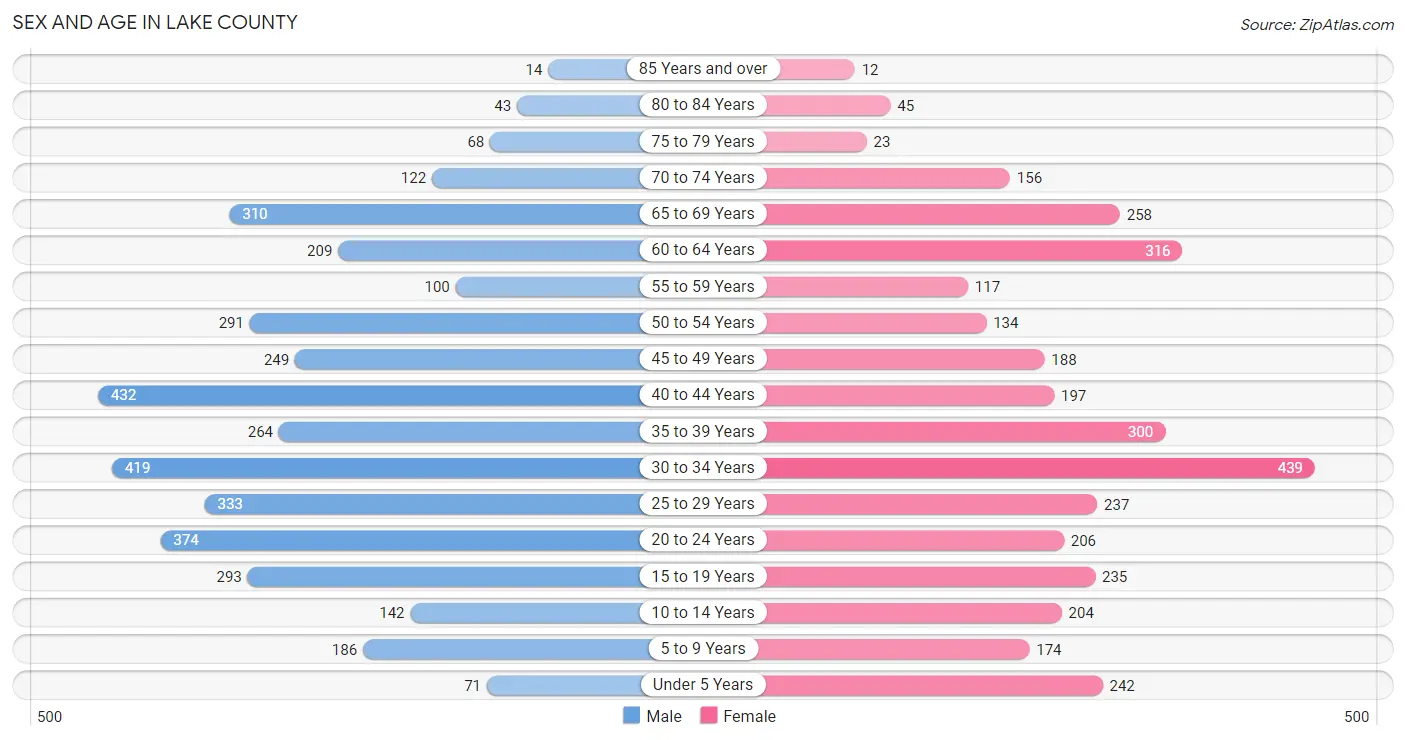
| Age Bracket | Male | Female |
| Under 5 Years | 71 (1.8%) | 242 (7.0%) |
| 5 to 9 Years | 186 (4.7%) | 174 (5.0%) |
| 10 to 14 Years | 142 (3.6%) | 204 (5.9%) |
| 15 to 19 Years | 293 (7.5%) | 235 (6.8%) |
| 20 to 24 Years | 374 (9.5%) | 206 (5.9%) |
| 25 to 29 Years | 333 (8.5%) | 237 (6.8%) |
| 30 to 34 Years | 419 (10.7%) | 439 (12.6%) |
| 35 to 39 Years | 264 (6.7%) | 300 (8.6%) |
| 40 to 44 Years | 432 (11.0%) | 197 (5.7%) |
| 45 to 49 Years | 249 (6.4%) | 188 (5.4%) |
| 50 to 54 Years | 291 (7.4%) | 134 (3.8%) |
| 55 to 59 Years | 100 (2.5%) | 117 (3.4%) |
| 60 to 64 Years | 209 (5.3%) | 316 (9.1%) |
| 65 to 69 Years | 310 (7.9%) | 258 (7.4%) |
| 70 to 74 Years | 122 (3.1%) | 156 (4.5%) |
| 75 to 79 Years | 68 (1.7%) | 23 (0.7%) |
| 80 to 84 Years | 43 (1.1%) | 45 (1.3%) |
| 85 Years and over | 14 (0.4%) | 12 (0.3%) |
| Total | 3,920 (100.0%) | 3,483 (100.0%) |
Families and Households in Lake County
Median Family Size in Lake County
The median family size in Lake County is 3.50 persons per family, with single male/father families (4 | 0.3%) accounting for the largest median family size of 4.5 persons per family. On the other hand, single female/mother families (235 | 16.6%) represent the smallest median family size with 3.02 persons per family.
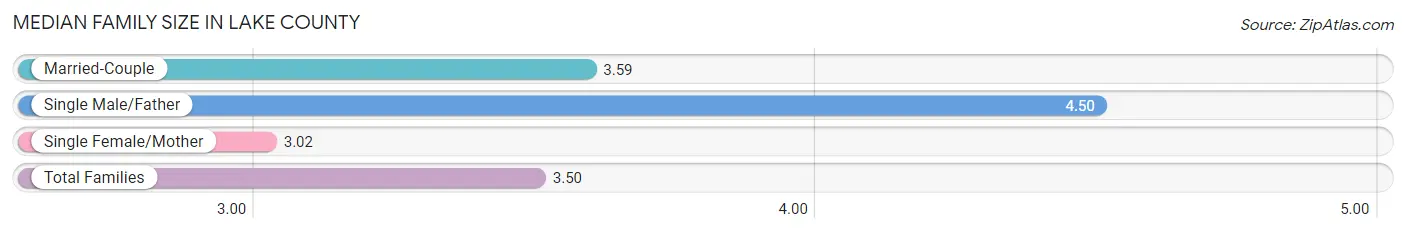
| Family Type | # Families | Family Size |
| Married-Couple | 1,173 (83.1%) | 3.59 |
| Single Male/Father | 4 (0.3%) | 4.50 |
| Single Female/Mother | 235 (16.6%) | 3.02 |
| Total Families | 1,412 (100.0%) | 3.50 |
Median Household Size in Lake County
The median household size in Lake County is 2.56 persons per household, with single male/father households (4 | 0.1%) accounting for the largest median household size of 4.5 persons per household. non-family households (1,425 | 50.2%) represent the smallest median household size with 1.54 persons per household.
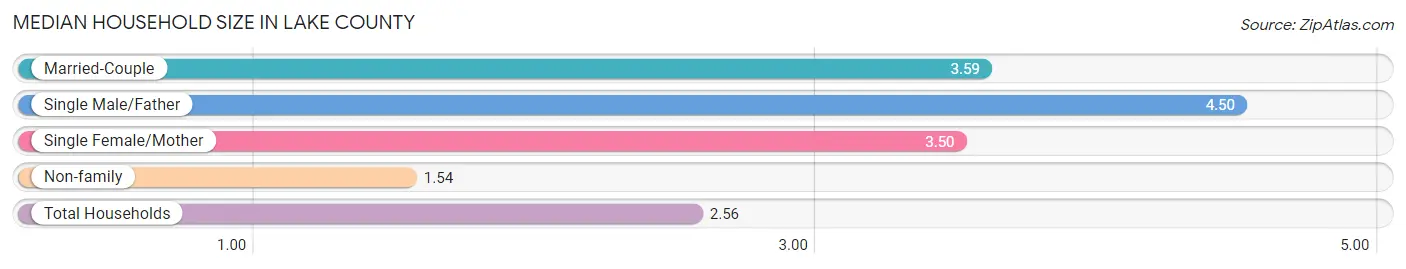
| Household Type | # Households | Household Size |
| Married-Couple | 1,173 (41.3%) | 3.59 |
| Single Male/Father | 4 (0.1%) | 4.50 |
| Single Female/Mother | 235 (8.3%) | 3.50 |
| Non-family | 1,425 (50.2%) | 1.54 |
| Total Households | 2,837 (100.0%) | 2.56 |
Household Size by Marriage Status in Lake County
Out of a total of 2,837 households in Lake County, 1,412 (49.8%) are family households, while 1,425 (50.2%) are nonfamily households. The most numerous type of family households are 2-person households, comprising 705, and the most common type of nonfamily households are 1-person households, comprising 1,105.

| Household Size | Family Households | Nonfamily Households |
| 1-Person Households | - | 1,105 (39.0%) |
| 2-Person Households | 705 (24.8%) | 298 (10.5%) |
| 3-Person Households | 264 (9.3%) | 20 (0.7%) |
| 4-Person Households | 315 (11.1%) | 2 (0.1%) |
| 5-Person Households | 31 (1.1%) | 0 (0.0%) |
| 6-Person Households | 80 (2.8%) | 0 (0.0%) |
| 7+ Person Households | 17 (0.6%) | 0 (0.0%) |
| Total | 1,412 (49.8%) | 1,425 (50.2%) |
Female Fertility in Lake County
Fertility by Age in Lake County
Average fertility rate in Lake County is 15.0 births per 1,000 women. Women in the age bracket of 20 to 34 years have the highest fertility rate with 26.0 births per 1,000 women. Women in the age bracket of 20 to 34 years acount for 79.3% of all women with births.
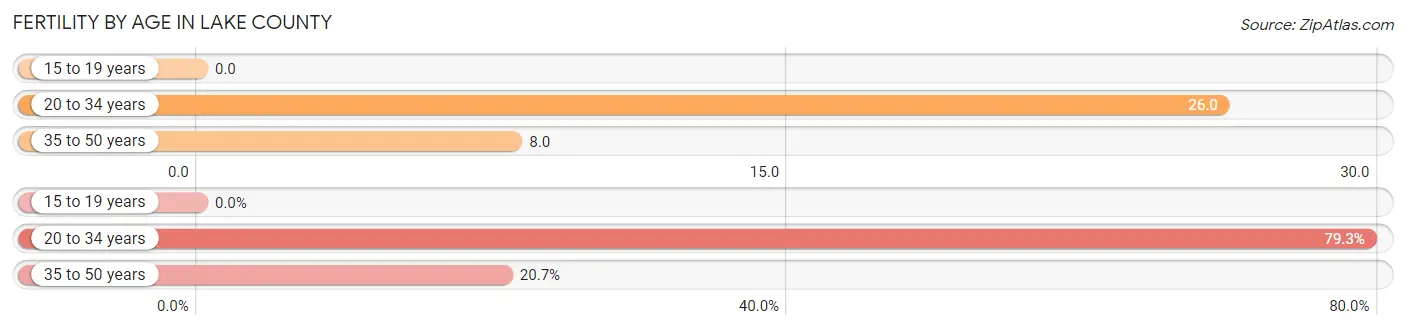
| Age Bracket | Women with Births | Births / 1,000 Women |
| 15 to 19 years | 0 (0.0%) | 0.0 |
| 20 to 34 years | 23 (79.3%) | 26.0 |
| 35 to 50 years | 6 (20.7%) | 8.0 |
| Total | 29 (100.0%) | 15.0 |
Fertility by Age by Marriage Status in Lake County
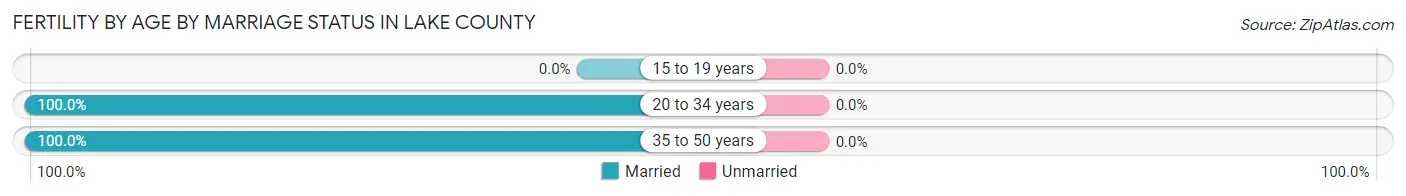
| Age Bracket | Married | Unmarried |
| 15 to 19 years | 0 (0.0%) | 0 (0.0%) |
| 20 to 34 years | 23 (100.0%) | 0 (0.0%) |
| 35 to 50 years | 6 (100.0%) | 0 (0.0%) |
| Total | 29 (100.0%) | 0 (0.0%) |
Fertility by Education in Lake County
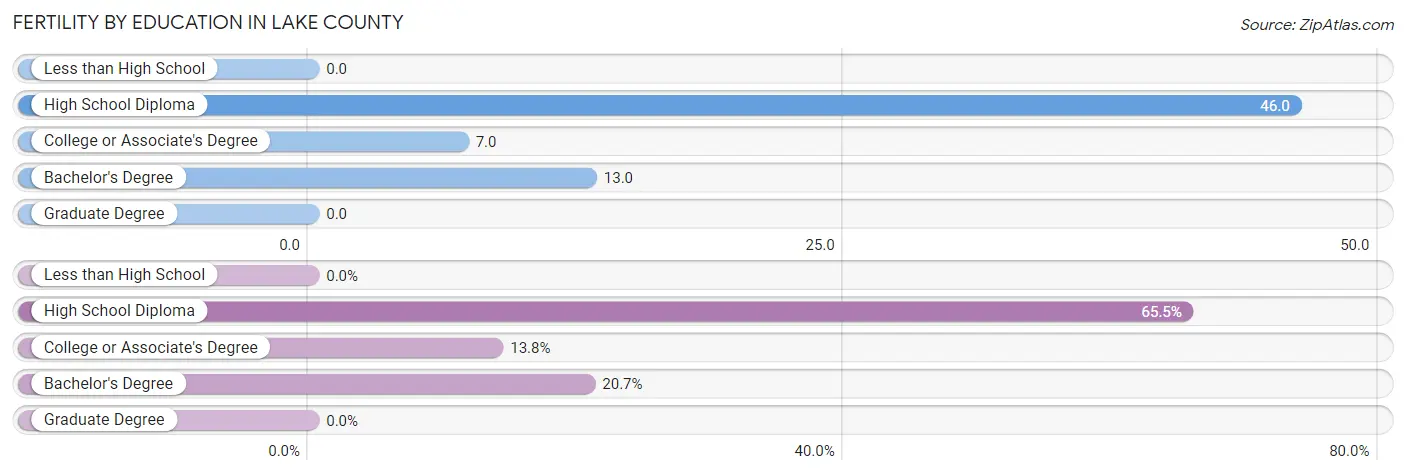
| Educational Attainment | Women with Births | Births / 1,000 Women |
| Less than High School | 0 (0.0%) | 0.0 |
| High School Diploma | 19 (65.5%) | 46.0 |
| College or Associate's Degree | 4 (13.8%) | 7.0 |
| Bachelor's Degree | 6 (20.7%) | 13.0 |
| Graduate Degree | 0 (0.0%) | 0.0 |
| Total | 29 (100.0%) | 15.0 |
Fertility by Education by Marriage Status in Lake County

| Educational Attainment | Married | Unmarried |
| Less than High School | 0 (0.0%) | 0 (0.0%) |
| High School Diploma | 19 (100.0%) | 0 (0.0%) |
| College or Associate's Degree | 4 (100.0%) | 0 (0.0%) |
| Bachelor's Degree | 6 (100.0%) | 0 (0.0%) |
| Graduate Degree | 0 (0.0%) | 0 (0.0%) |
| Total | 29 (100.0%) | 0 (0.0%) |
Employment Characteristics in Lake County
Employment by Class of Employer in Lake County
Among the 4,390 employed individuals in Lake County, private company employees (2,640 | 60.1%), local government employees (410 | 9.3%), and not-for-profit organizations (380 | 8.7%) make up the most common classes of employment.
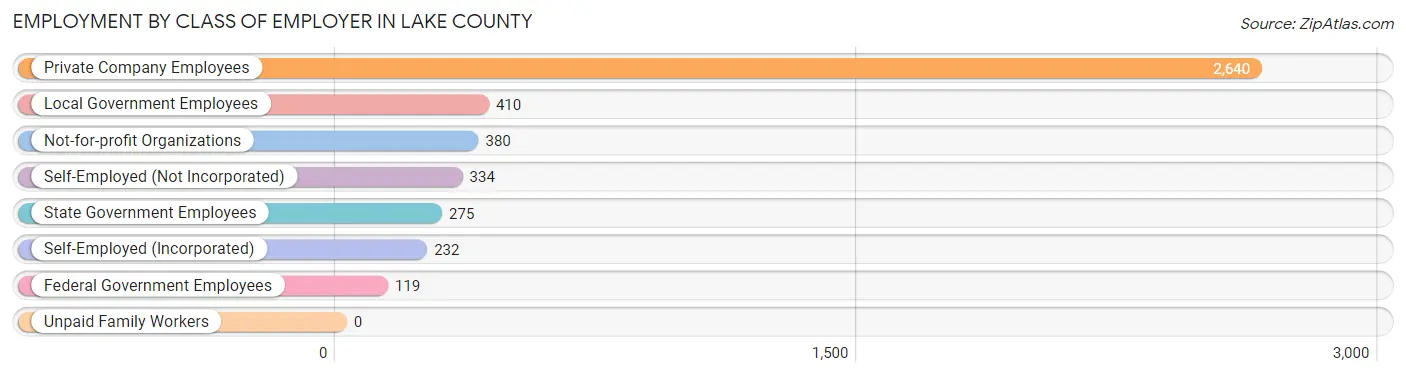
| Employer Class | # Employees | % Employees |
| Private Company Employees | 2,640 | 60.1% |
| Self-Employed (Incorporated) | 232 | 5.3% |
| Self-Employed (Not Incorporated) | 334 | 7.6% |
| Not-for-profit Organizations | 380 | 8.7% |
| Local Government Employees | 410 | 9.3% |
| State Government Employees | 275 | 6.3% |
| Federal Government Employees | 119 | 2.7% |
| Unpaid Family Workers | 0 | 0.0% |
| Total | 4,390 | 100.0% |
Employment Status by Age in Lake County
According to the labor force statistics for Lake County, out of the total population over 16 years of age (6,318), 74.7% or 4,720 individuals are in the labor force, with 2.4% or 113 of them unemployed. The age group with the highest labor force participation rate is 25 to 29 years, with 96.7% or 551 individuals in the labor force. Within the labor force, the 35 to 44 years age range has the highest percentage of unemployed individuals, with 6.1% or 59 of them being unemployed.
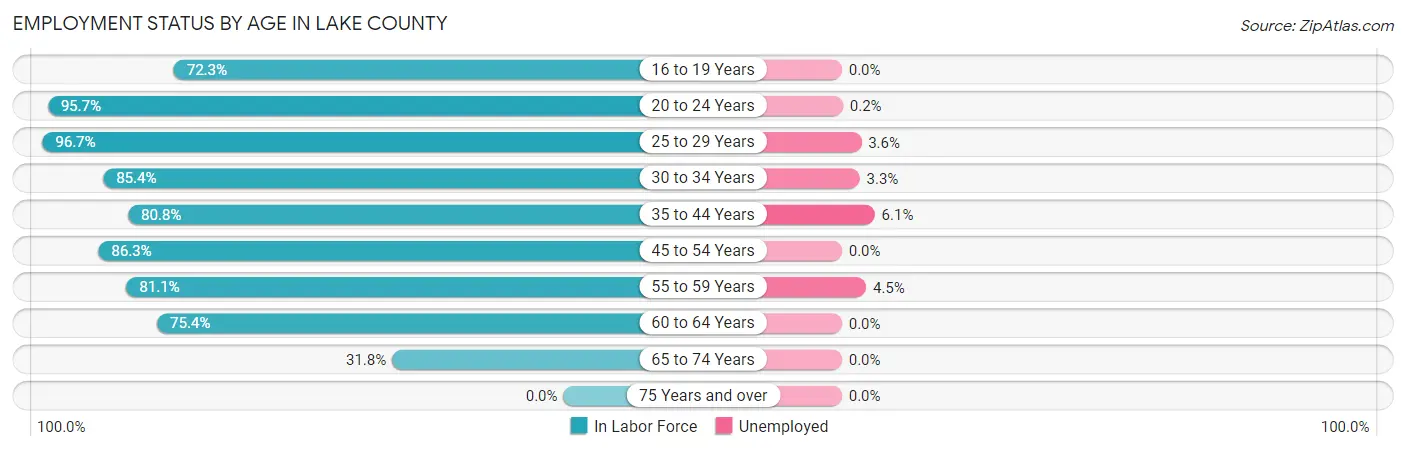
| Age Bracket | In Labor Force | Unemployed |
| 16 to 19 Years | 334 (72.3%) | 0 (0.0%) |
| 20 to 24 Years | 555 (95.7%) | 1 (0.2%) |
| 25 to 29 Years | 551 (96.7%) | 20 (3.6%) |
| 30 to 34 Years | 733 (85.4%) | 24 (3.3%) |
| 35 to 44 Years | 964 (80.8%) | 59 (6.1%) |
| 45 to 54 Years | 744 (86.3%) | 0 (0.0%) |
| 55 to 59 Years | 176 (81.1%) | 8 (4.5%) |
| 60 to 64 Years | 396 (75.4%) | 0 (0.0%) |
| 65 to 74 Years | 269 (31.8%) | 0 (0.0%) |
| 75 Years and over | 0 (0.0%) | 0 (0.0%) |
| Total | 4,720 (74.7%) | 113 (2.4%) |
Employment Status by Educational Attainment in Lake County
According to labor force statistics for Lake County, 84.4% of individuals (3,566) out of the total population between 25 and 64 years of age (4,225) are in the labor force, with 3.1% or 111 of them being unemployed. The group with the highest labor force participation rate are those with the educational attainment of bachelor's degree or higher, with 95.2% or 1,597 individuals in the labor force. Within the labor force, individuals with college / associate degree education have the highest percentage of unemployment, with 5.6% or 59 of them being unemployed.
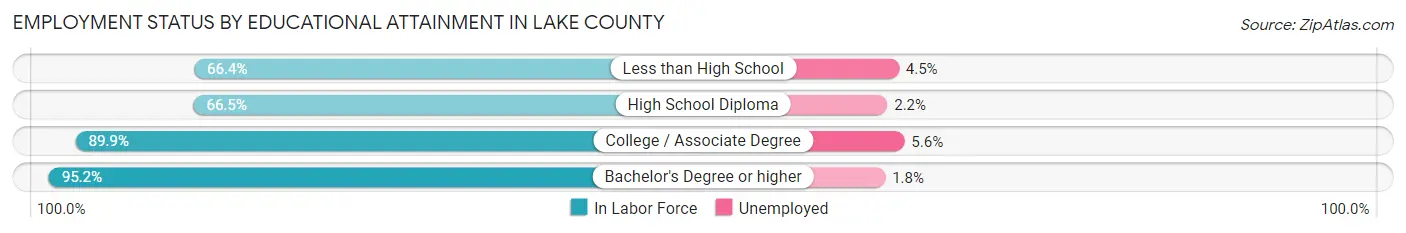
| Educational Attainment | In Labor Force | Unemployed |
| Less than High School | 176 (66.4%) | 12 (4.5%) |
| High School Diploma | 740 (66.5%) | 24 (2.2%) |
| College / Associate Degree | 1,051 (89.9%) | 65 (5.6%) |
| Bachelor's Degree or higher | 1,597 (95.2%) | 30 (1.8%) |
| Total | 3,566 (84.4%) | 131 (3.1%) |
Employment Occupations by Sex in Lake County
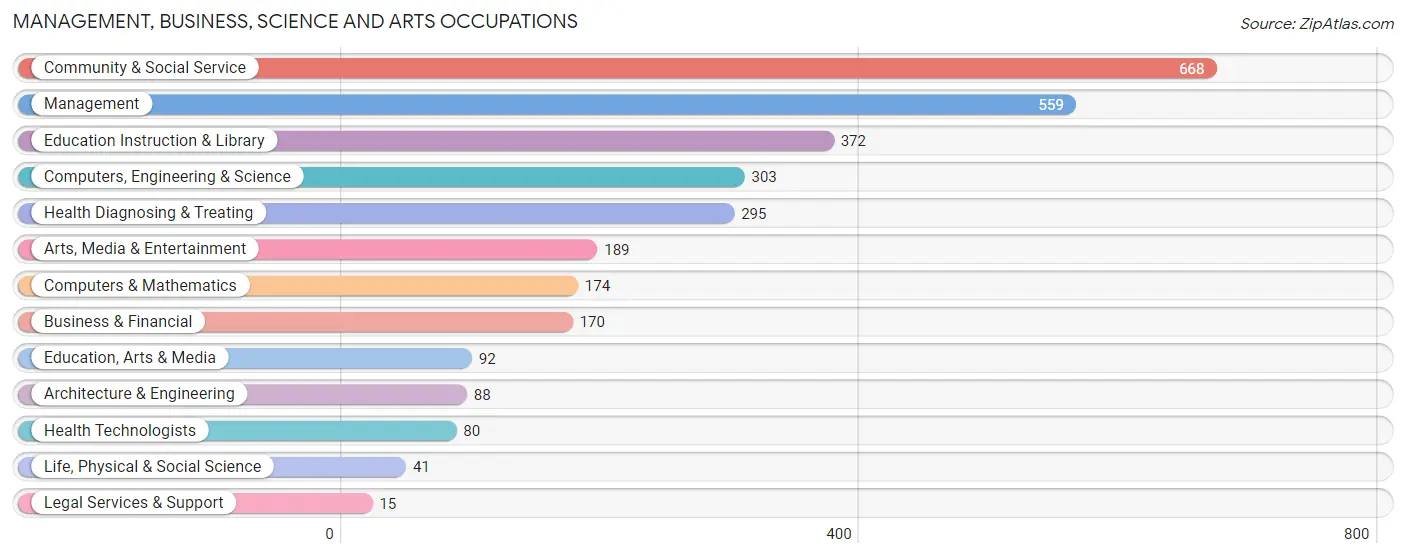
Management, Business, Science and Arts Occupations
The most common Management, Business, Science and Arts occupations in Lake County are Community & Social Service (668 | 14.5%), Management (559 | 12.1%), Education Instruction & Library (372 | 8.1%), Computers, Engineering & Science (303 | 6.6%), and Health Diagnosing & Treating (295 | 6.4%).
Management, Business, Science and Arts Occupations by Sex
Within the Management, Business, Science and Arts occupations in Lake County, the most male-oriented occupations are Architecture & Engineering (100.0%), Life, Physical & Social Science (100.0%), and Computers, Engineering & Science (78.5%), while the most female-oriented occupations are Legal Services & Support (100.0%), Education Instruction & Library (91.1%), and Education, Arts & Media (89.1%).
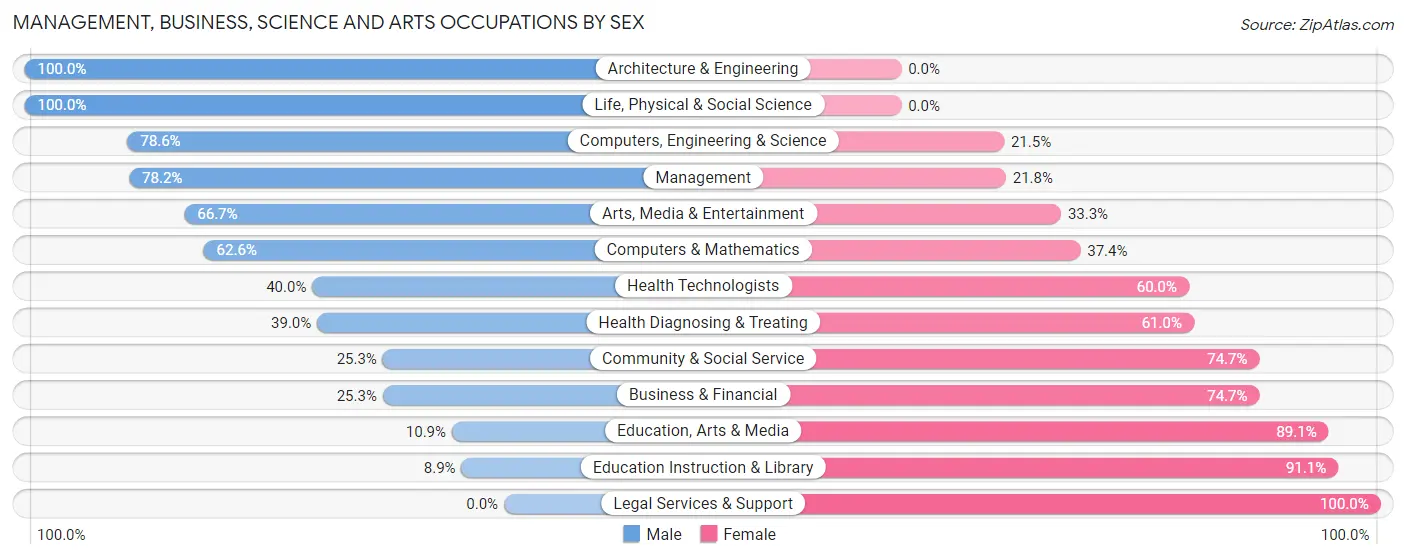
| Occupation | Male | Female |
| Management | 437 (78.2%) | 122 (21.8%) |
| Business & Financial | 43 (25.3%) | 127 (74.7%) |
| Computers, Engineering & Science | 238 (78.5%) | 65 (21.4%) |
| Computers & Mathematics | 109 (62.6%) | 65 (37.4%) |
| Architecture & Engineering | 88 (100.0%) | 0 (0.0%) |
| Life, Physical & Social Science | 41 (100.0%) | 0 (0.0%) |
| Community & Social Service | 169 (25.3%) | 499 (74.7%) |
| Education, Arts & Media | 10 (10.9%) | 82 (89.1%) |
| Legal Services & Support | 0 (0.0%) | 15 (100.0%) |
| Education Instruction & Library | 33 (8.9%) | 339 (91.1%) |
| Arts, Media & Entertainment | 126 (66.7%) | 63 (33.3%) |
| Health Diagnosing & Treating | 115 (39.0%) | 180 (61.0%) |
| Health Technologists | 32 (40.0%) | 48 (60.0%) |
| Total (Category) | 1,002 (50.2%) | 993 (49.8%) |
| Total (Overall) | 2,623 (57.0%) | 1,983 (43.0%) |
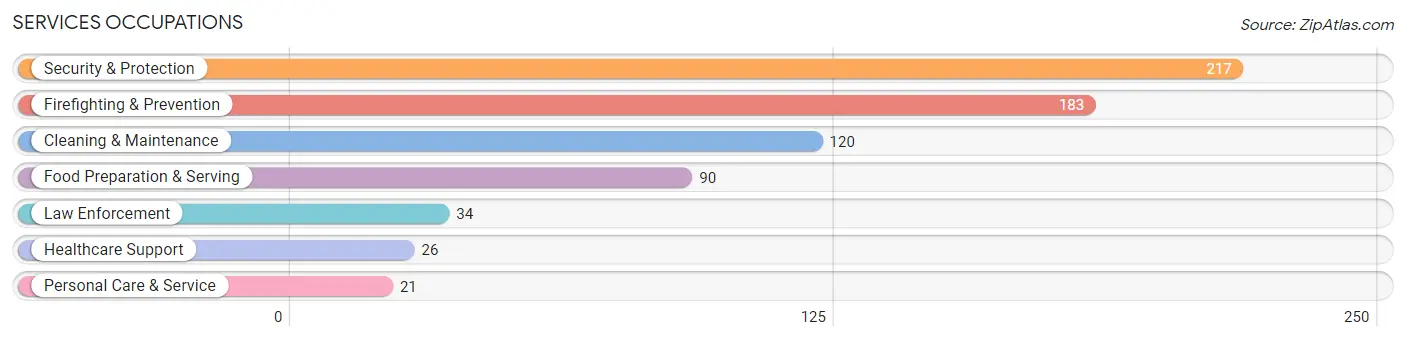
Services Occupations
The most common Services occupations in Lake County are Security & Protection (217 | 4.7%), Firefighting & Prevention (183 | 4.0%), Cleaning & Maintenance (120 | 2.6%), Food Preparation & Serving (90 | 1.9%), and Law Enforcement (34 | 0.7%).
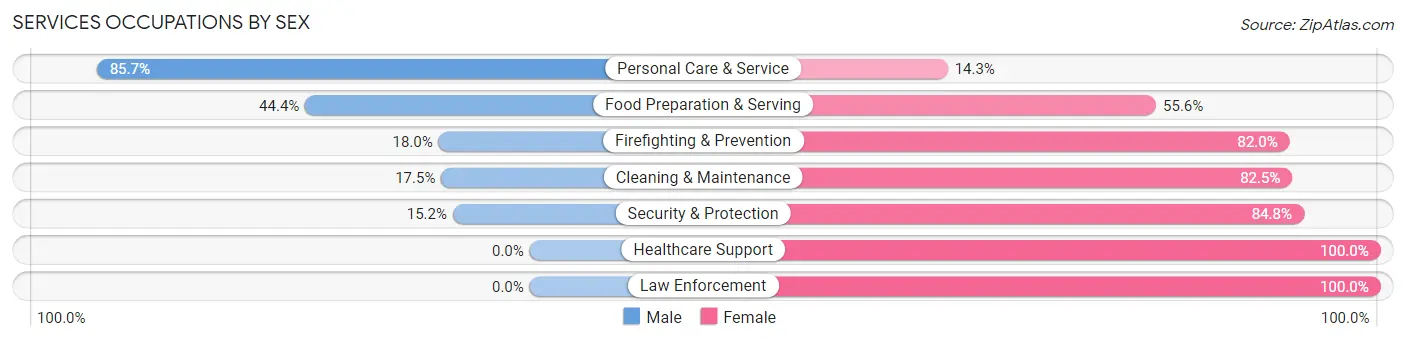
Services Occupations by Sex
Within the Services occupations in Lake County, the most male-oriented occupations are Personal Care & Service (85.7%), Food Preparation & Serving (44.4%), and Firefighting & Prevention (18.0%), while the most female-oriented occupations are Healthcare Support (100.0%), Law Enforcement (100.0%), and Security & Protection (84.8%).
| Occupation | Male | Female |
| Healthcare Support | 0 (0.0%) | 26 (100.0%) |
| Security & Protection | 33 (15.2%) | 184 (84.8%) |
| Firefighting & Prevention | 33 (18.0%) | 150 (82.0%) |
| Law Enforcement | 0 (0.0%) | 34 (100.0%) |
| Food Preparation & Serving | 40 (44.4%) | 50 (55.6%) |
| Cleaning & Maintenance | 21 (17.5%) | 99 (82.5%) |
| Personal Care & Service | 18 (85.7%) | 3 (14.3%) |
| Total (Category) | 112 (23.6%) | 362 (76.4%) |
| Total (Overall) | 2,623 (57.0%) | 1,983 (43.0%) |
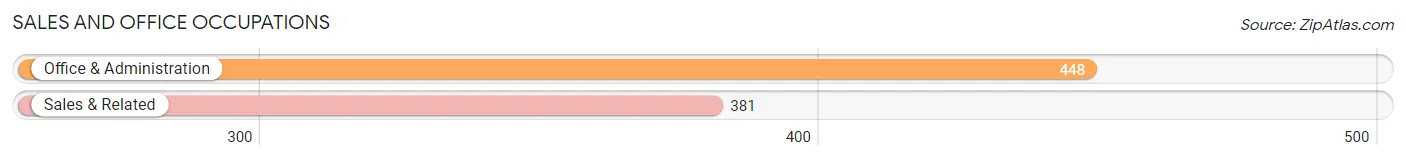
Sales and Office Occupations
The most common Sales and Office occupations in Lake County are Office & Administration (448 | 9.7%), and Sales & Related (381 | 8.3%).
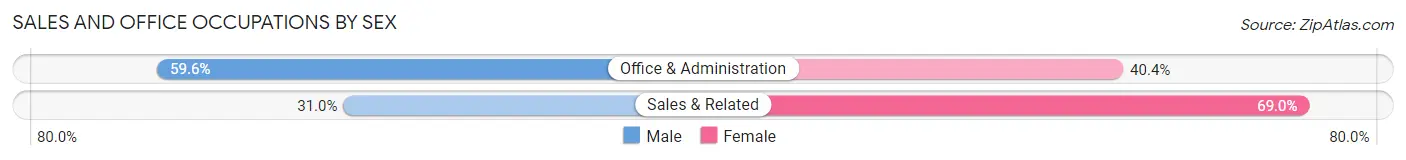
Sales and Office Occupations by Sex
| Occupation | Male | Female |
| Sales & Related | 118 (31.0%) | 263 (69.0%) |
| Office & Administration | 267 (59.6%) | 181 (40.4%) |
| Total (Category) | 385 (46.4%) | 444 (53.6%) |
| Total (Overall) | 2,623 (57.0%) | 1,983 (43.0%) |
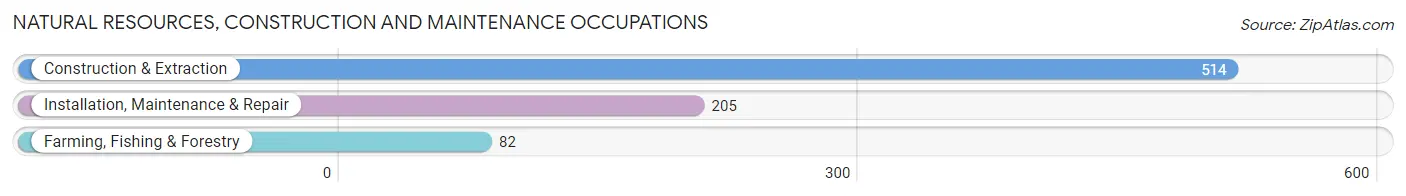
Natural Resources, Construction and Maintenance Occupations
The most common Natural Resources, Construction and Maintenance occupations in Lake County are Construction & Extraction (514 | 11.2%), Installation, Maintenance & Repair (205 | 4.4%), and Farming, Fishing & Forestry (82 | 1.8%).
Natural Resources, Construction and Maintenance Occupations by Sex
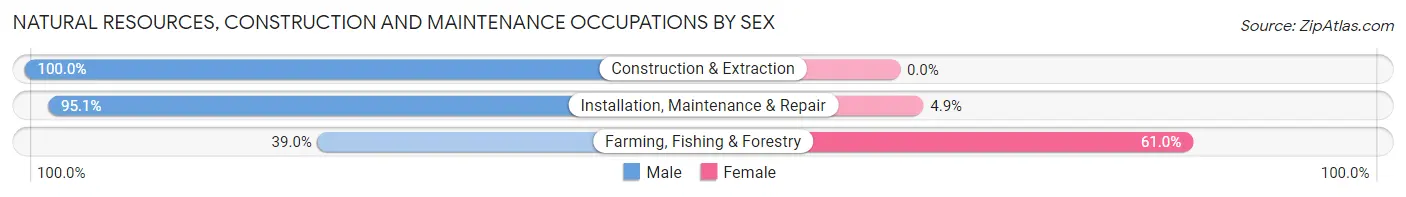
| Occupation | Male | Female |
| Farming, Fishing & Forestry | 32 (39.0%) | 50 (61.0%) |
| Construction & Extraction | 514 (100.0%) | 0 (0.0%) |
| Installation, Maintenance & Repair | 195 (95.1%) | 10 (4.9%) |
| Total (Category) | 741 (92.5%) | 60 (7.5%) |
| Total (Overall) | 2,623 (57.0%) | 1,983 (43.0%) |
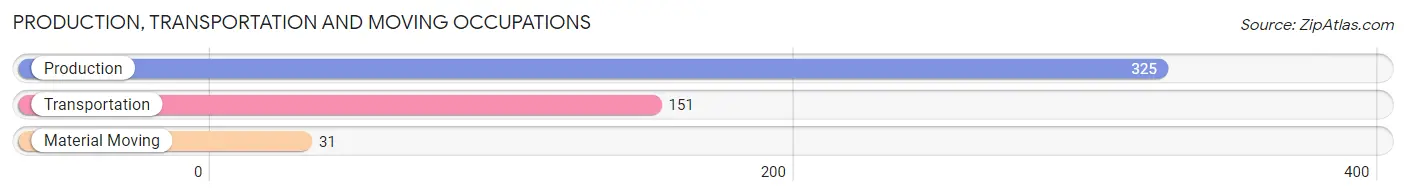
Production, Transportation and Moving Occupations
The most common Production, Transportation and Moving occupations in Lake County are Production (325 | 7.1%), Transportation (151 | 3.3%), and Material Moving (31 | 0.7%).
Production, Transportation and Moving Occupations by Sex
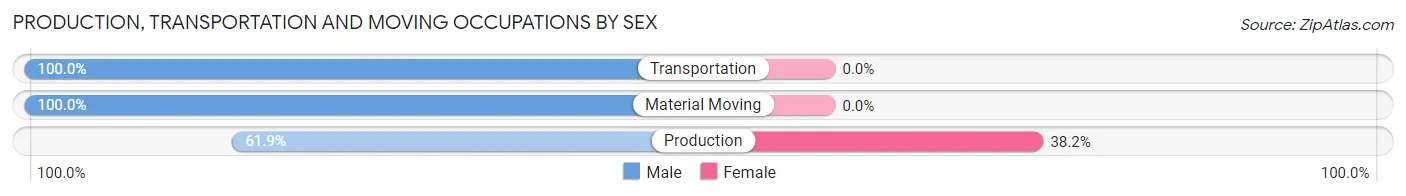
| Occupation | Male | Female |
| Production | 201 (61.9%) | 124 (38.2%) |
| Transportation | 151 (100.0%) | 0 (0.0%) |
| Material Moving | 31 (100.0%) | 0 (0.0%) |
| Total (Category) | 383 (75.5%) | 124 (24.5%) |
| Total (Overall) | 2,623 (57.0%) | 1,983 (43.0%) |
Employment Industries by Sex in Lake County
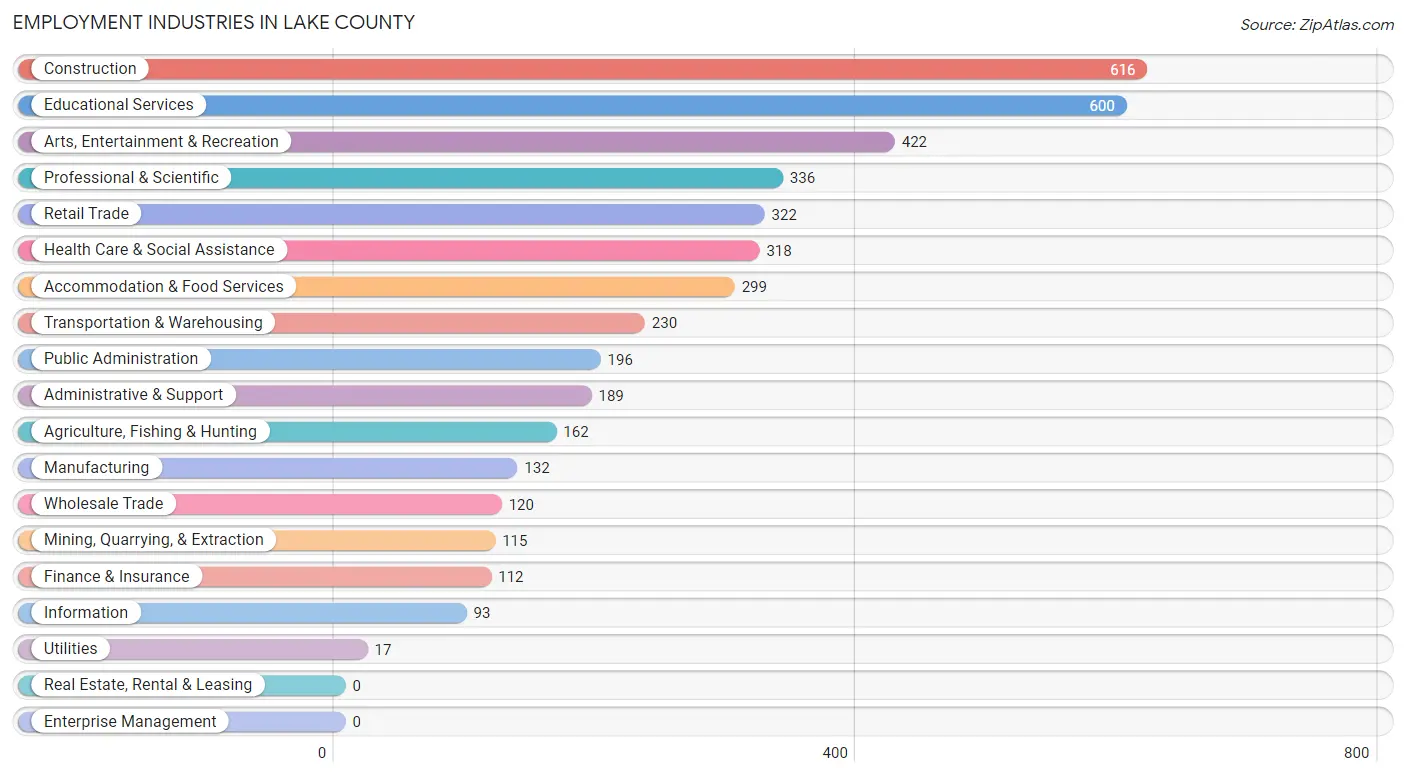
Employment Industries in Lake County
The major employment industries in Lake County include Construction (616 | 13.4%), Educational Services (600 | 13.0%), Arts, Entertainment & Recreation (422 | 9.2%), Professional & Scientific (336 | 7.3%), and Retail Trade (322 | 7.0%).
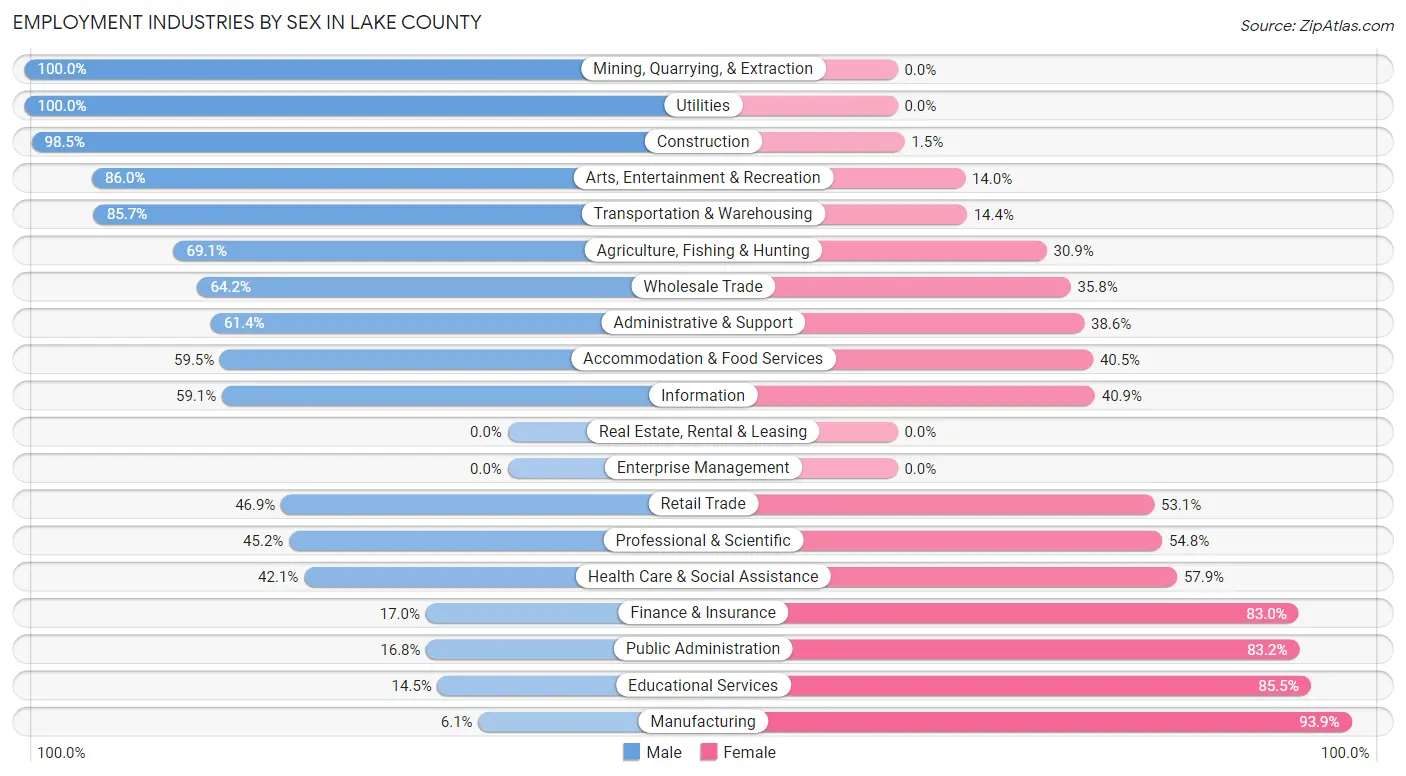
Employment Industries by Sex in Lake County
The Lake County industries that see more men than women are Mining, Quarrying, & Extraction (100.0%), Utilities (100.0%), and Construction (98.5%), whereas the industries that tend to have a higher number of women are Manufacturing (93.9%), Educational Services (85.5%), and Public Administration (83.2%).
| Industry | Male | Female |
| Agriculture, Fishing & Hunting | 112 (69.1%) | 50 (30.9%) |
| Mining, Quarrying, & Extraction | 115 (100.0%) | 0 (0.0%) |
| Construction | 607 (98.5%) | 9 (1.5%) |
| Manufacturing | 8 (6.1%) | 124 (93.9%) |
| Wholesale Trade | 77 (64.2%) | 43 (35.8%) |
| Retail Trade | 151 (46.9%) | 171 (53.1%) |
| Transportation & Warehousing | 197 (85.7%) | 33 (14.3%) |
| Utilities | 17 (100.0%) | 0 (0.0%) |
| Information | 55 (59.1%) | 38 (40.9%) |
| Finance & Insurance | 19 (17.0%) | 93 (83.0%) |
| Real Estate, Rental & Leasing | 0 (0.0%) | 0 (0.0%) |
| Professional & Scientific | 152 (45.2%) | 184 (54.8%) |
| Enterprise Management | 0 (0.0%) | 0 (0.0%) |
| Administrative & Support | 116 (61.4%) | 73 (38.6%) |
| Educational Services | 87 (14.5%) | 513 (85.5%) |
| Health Care & Social Assistance | 134 (42.1%) | 184 (57.9%) |
| Arts, Entertainment & Recreation | 363 (86.0%) | 59 (14.0%) |
| Accommodation & Food Services | 178 (59.5%) | 121 (40.5%) |
| Public Administration | 33 (16.8%) | 163 (83.2%) |
| Total | 2,623 (57.0%) | 1,983 (43.0%) |
Education in Lake County
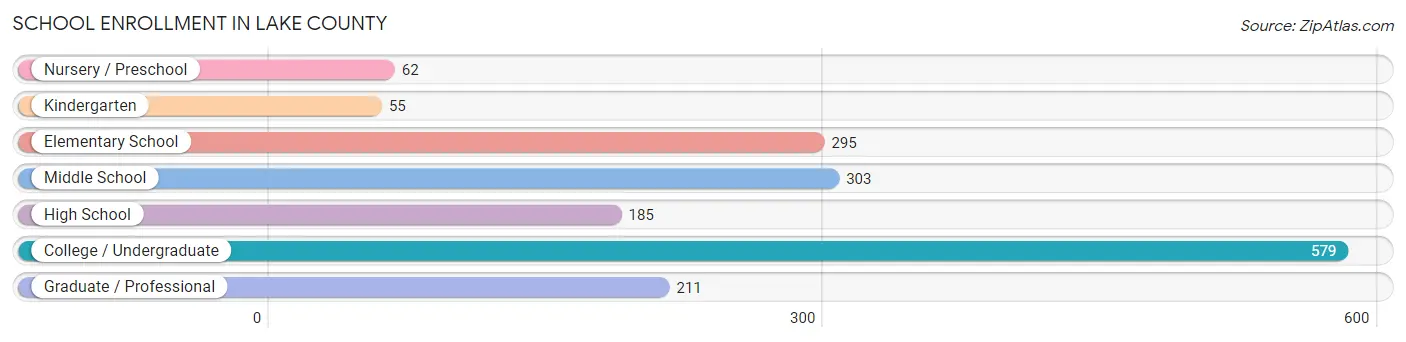
School Enrollment in Lake County
The most common levels of schooling among the 1,690 students in Lake County are college / undergraduate (579 | 34.3%), middle school (303 | 17.9%), and elementary school (295 | 17.5%).
| School Level | # Students | % Students |
| Nursery / Preschool | 62 | 3.7% |
| Kindergarten | 55 | 3.3% |
| Elementary School | 295 | 17.5% |
| Middle School | 303 | 17.9% |
| High School | 185 | 11.0% |
| College / Undergraduate | 579 | 34.3% |
| Graduate / Professional | 211 | 12.5% |
| Total | 1,690 | 100.0% |
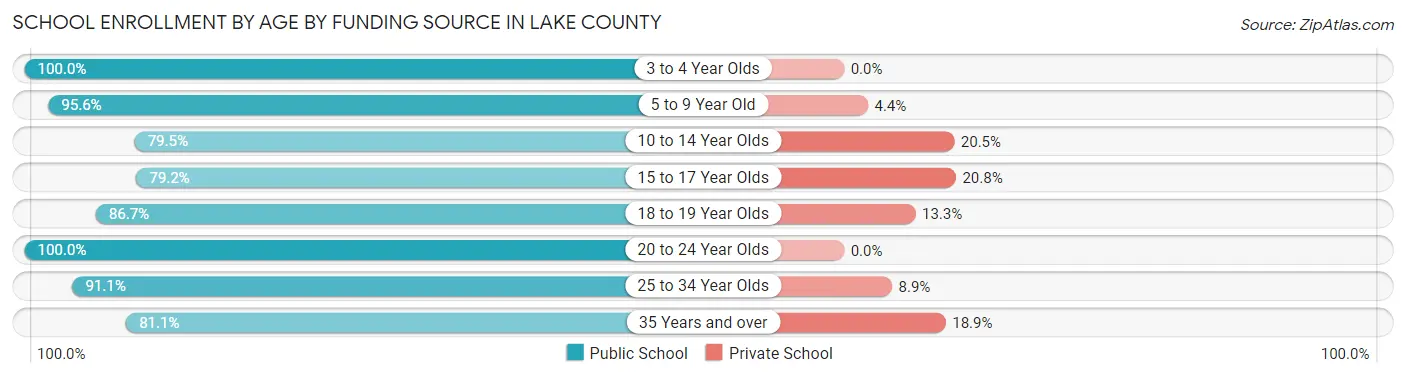
School Enrollment by Age by Funding Source in Lake County
Out of a total of 1,690 students who are enrolled in schools in Lake County, 226 (13.4%) attend a private institution, while the remaining 1,464 (86.6%) are enrolled in public schools. The age group of 15 to 17 year olds has the highest likelihood of being enrolled in private schools, with 30 (20.8% in the age bracket) enrolled. Conversely, the age group of 3 to 4 year olds has the lowest likelihood of being enrolled in a private school, with 41 (100.0% in the age bracket) attending a public institution.
| Age Bracket | Public School | Private School |
| 3 to 4 Year Olds | 41 (100.0%) | 0 (0.0%) |
| 5 to 9 Year Old | 344 (95.6%) | 16 (4.4%) |
| 10 to 14 Year Olds | 275 (79.5%) | 71 (20.5%) |
| 15 to 17 Year Olds | 114 (79.2%) | 30 (20.8%) |
| 18 to 19 Year Olds | 137 (86.7%) | 21 (13.3%) |
| 20 to 24 Year Olds | 117 (100.0%) | 0 (0.0%) |
| 25 to 34 Year Olds | 102 (91.1%) | 10 (8.9%) |
| 35 Years and over | 334 (81.1%) | 78 (18.9%) |
| Total | 1,464 (86.6%) | 226 (13.4%) |
Educational Attainment by Field of Study in Lake County
Education (369 | 15.2%), social sciences (282 | 11.6%), business (270 | 11.1%), computers & mathematics (230 | 9.5%), and bio, nature & agricultural (219 | 9.0%) are the most common fields of study among 2,423 individuals in Lake County who have obtained a bachelor's degree or higher.
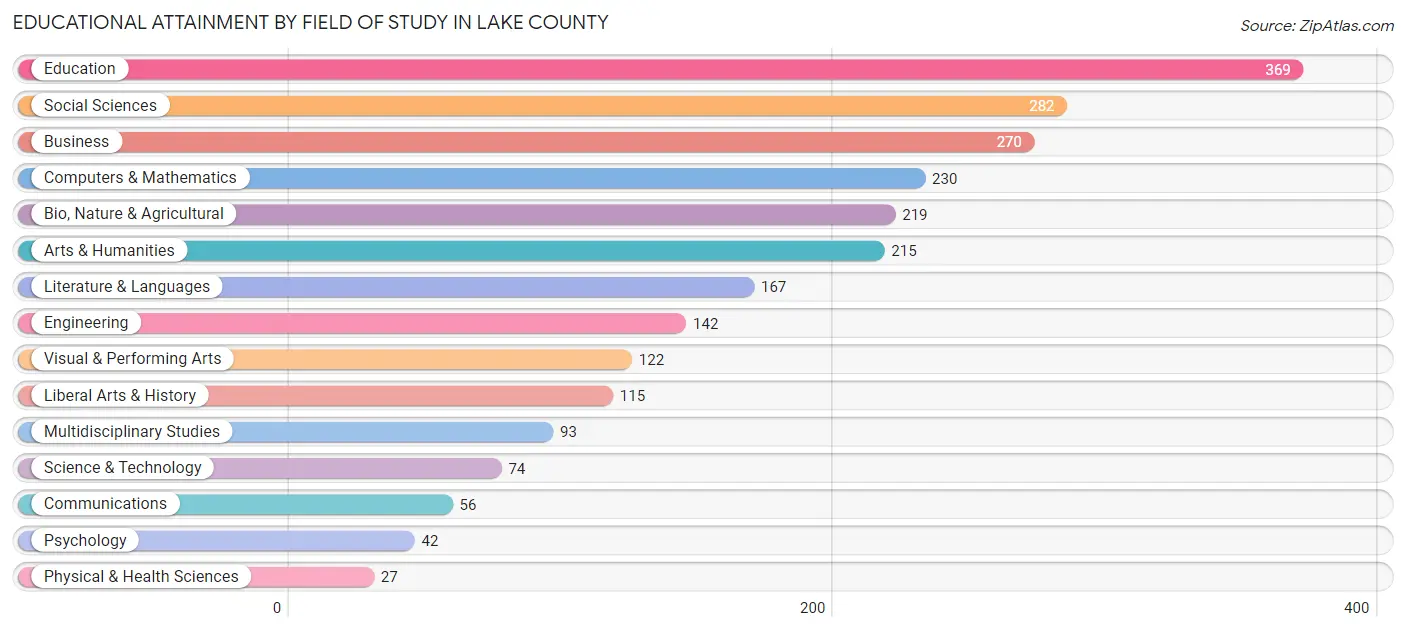
| Field of Study | # Graduates | % Graduates |
| Computers & Mathematics | 230 | 9.5% |
| Bio, Nature & Agricultural | 219 | 9.0% |
| Physical & Health Sciences | 27 | 1.1% |
| Psychology | 42 | 1.7% |
| Social Sciences | 282 | 11.6% |
| Engineering | 142 | 5.9% |
| Multidisciplinary Studies | 93 | 3.8% |
| Science & Technology | 74 | 3.0% |
| Business | 270 | 11.1% |
| Education | 369 | 15.2% |
| Literature & Languages | 167 | 6.9% |
| Liberal Arts & History | 115 | 4.8% |
| Visual & Performing Arts | 122 | 5.0% |
| Communications | 56 | 2.3% |
| Arts & Humanities | 215 | 8.9% |
| Total | 2,423 | 100.0% |
Transportation & Commute in Lake County
Vehicle Availability by Sex in Lake County
The most prevalent vehicle ownership categories in Lake County are males with 2 vehicles (1,106, accounting for 44.7%) and females with 2 vehicles (688, making up 59.2%).
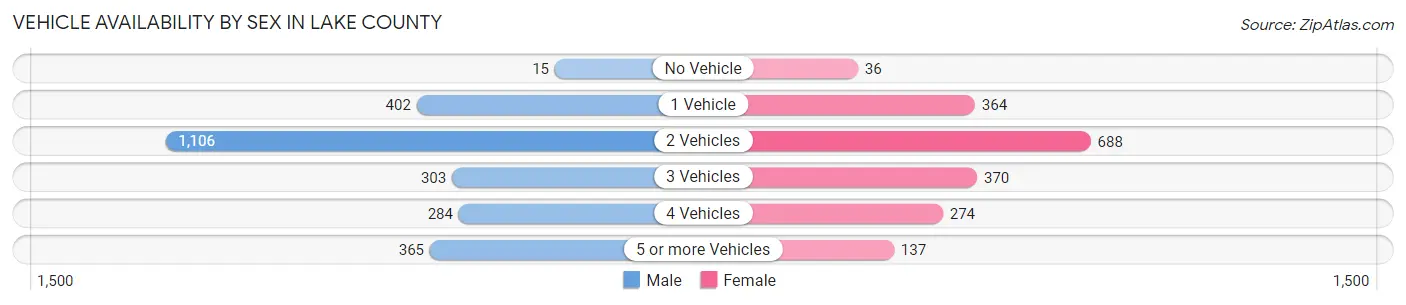
| Vehicles Available | Male | Female |
| No Vehicle | 15 (0.6%) | 36 (1.9%) |
| 1 Vehicle | 402 (16.2%) | 364 (19.5%) |
| 2 Vehicles | 1,106 (44.7%) | 688 (36.8%) |
| 3 Vehicles | 303 (12.2%) | 370 (19.8%) |
| 4 Vehicles | 284 (11.5%) | 274 (14.7%) |
| 5 or more Vehicles | 365 (14.7%) | 137 (7.3%) |
| Total | 2,475 (100.0%) | 1,869 (100.0%) |
Commute Time in Lake County
The most frequently occuring commute durations in Lake County are 5 to 9 minutes (1,000 commuters, 24.5%), 45 to 59 minutes (626 commuters, 15.4%), and 40 to 44 minutes (431 commuters, 10.6%).
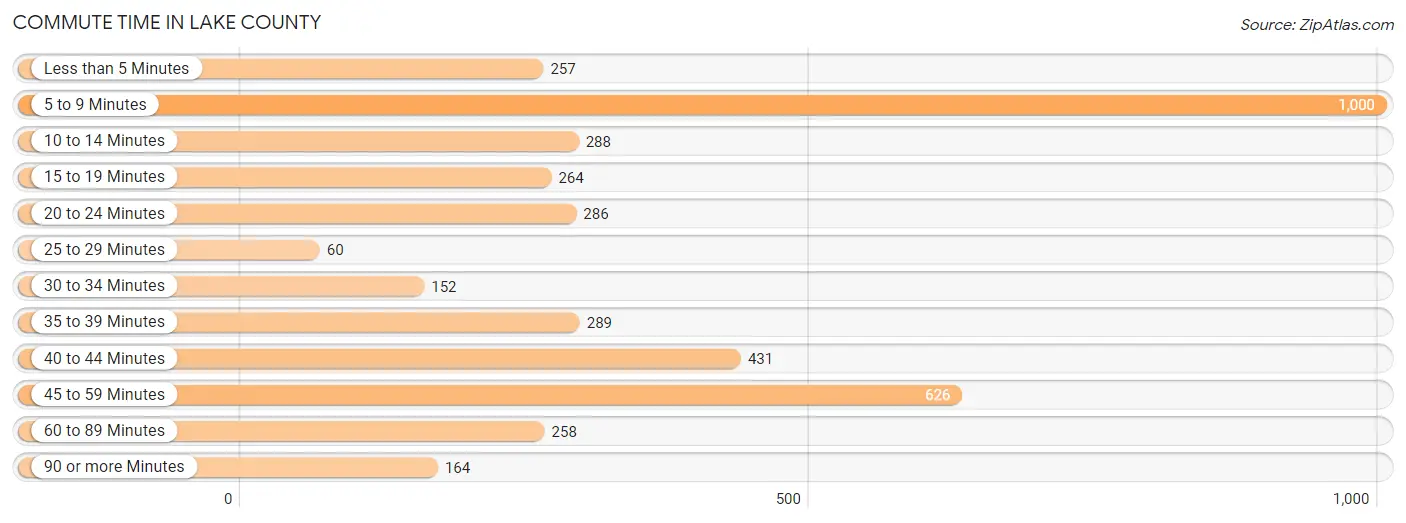
| Commute Time | # Commuters | % Commuters |
| Less than 5 Minutes | 257 | 6.3% |
| 5 to 9 Minutes | 1,000 | 24.5% |
| 10 to 14 Minutes | 288 | 7.1% |
| 15 to 19 Minutes | 264 | 6.5% |
| 20 to 24 Minutes | 286 | 7.0% |
| 25 to 29 Minutes | 60 | 1.5% |
| 30 to 34 Minutes | 152 | 3.7% |
| 35 to 39 Minutes | 289 | 7.1% |
| 40 to 44 Minutes | 431 | 10.6% |
| 45 to 59 Minutes | 626 | 15.4% |
| 60 to 89 Minutes | 258 | 6.3% |
| 90 or more Minutes | 164 | 4.0% |
Commute Time by Sex in Lake County
The most common commute times in Lake County are 5 to 9 minutes (560 commuters, 23.7%) for males and 5 to 9 minutes (440 commuters, 25.7%) for females.
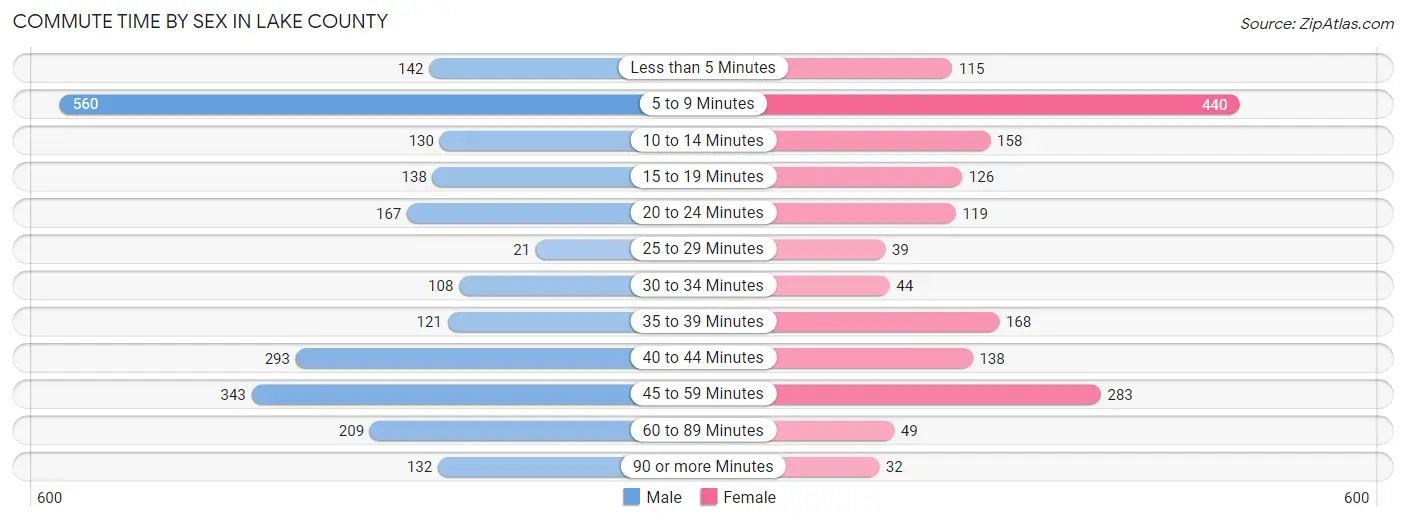
| Commute Time | Male | Female |
| Less than 5 Minutes | 142 (6.0%) | 115 (6.7%) |
| 5 to 9 Minutes | 560 (23.7%) | 440 (25.7%) |
| 10 to 14 Minutes | 130 (5.5%) | 158 (9.2%) |
| 15 to 19 Minutes | 138 (5.8%) | 126 (7.4%) |
| 20 to 24 Minutes | 167 (7.1%) | 119 (7.0%) |
| 25 to 29 Minutes | 21 (0.9%) | 39 (2.3%) |
| 30 to 34 Minutes | 108 (4.6%) | 44 (2.6%) |
| 35 to 39 Minutes | 121 (5.1%) | 168 (9.8%) |
| 40 to 44 Minutes | 293 (12.4%) | 138 (8.1%) |
| 45 to 59 Minutes | 343 (14.5%) | 283 (16.5%) |
| 60 to 89 Minutes | 209 (8.8%) | 49 (2.9%) |
| 90 or more Minutes | 132 (5.6%) | 32 (1.9%) |
Time of Departure to Work by Sex in Lake County
The most frequent times of departure to work in Lake County are 8:00 AM to 8:29 AM (584, 24.7%) for males and 7:30 AM to 7:59 AM (379, 22.2%) for females.
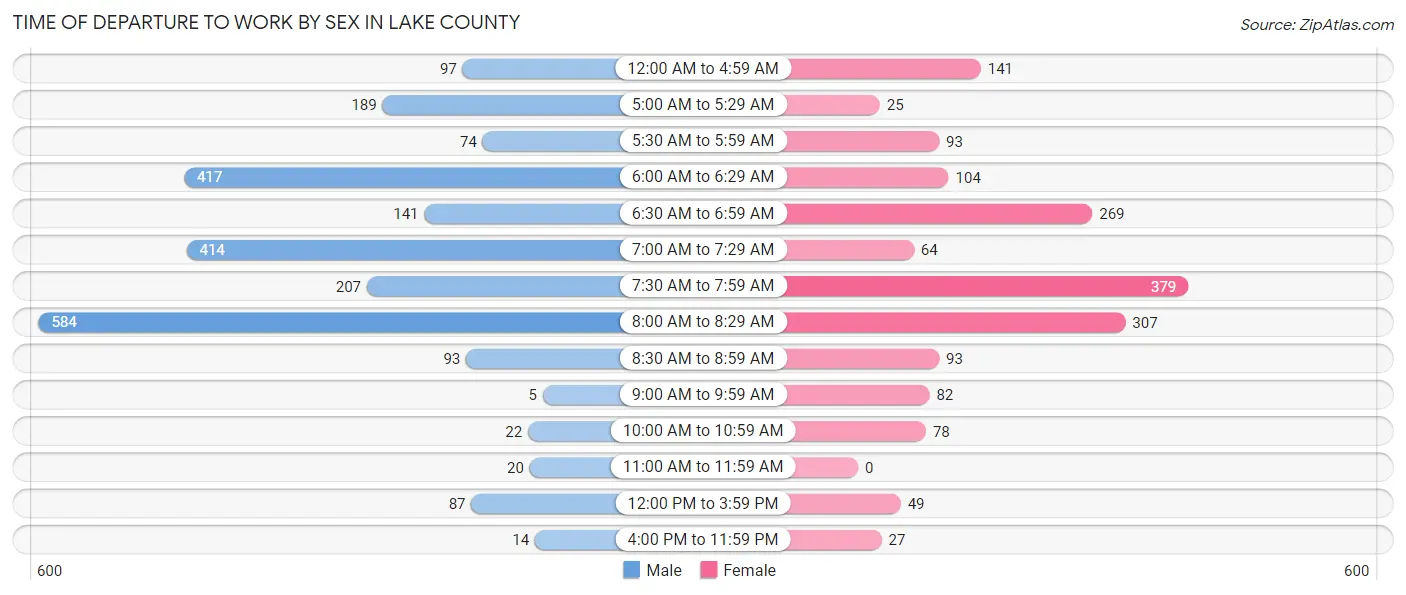
| Time of Departure | Male | Female |
| 12:00 AM to 4:59 AM | 97 (4.1%) | 141 (8.2%) |
| 5:00 AM to 5:29 AM | 189 (8.0%) | 25 (1.5%) |
| 5:30 AM to 5:59 AM | 74 (3.1%) | 93 (5.4%) |
| 6:00 AM to 6:29 AM | 417 (17.6%) | 104 (6.1%) |
| 6:30 AM to 6:59 AM | 141 (6.0%) | 269 (15.7%) |
| 7:00 AM to 7:29 AM | 414 (17.5%) | 64 (3.7%) |
| 7:30 AM to 7:59 AM | 207 (8.8%) | 379 (22.2%) |
| 8:00 AM to 8:29 AM | 584 (24.7%) | 307 (17.9%) |
| 8:30 AM to 8:59 AM | 93 (3.9%) | 93 (5.4%) |
| 9:00 AM to 9:59 AM | 5 (0.2%) | 82 (4.8%) |
| 10:00 AM to 10:59 AM | 22 (0.9%) | 78 (4.6%) |
| 11:00 AM to 11:59 AM | 20 (0.9%) | 0 (0.0%) |
| 12:00 PM to 3:59 PM | 87 (3.7%) | 49 (2.9%) |
| 4:00 PM to 11:59 PM | 14 (0.6%) | 27 (1.6%) |
| Total | 2,364 (100.0%) | 1,711 (100.0%) |
Housing Occupancy in Lake County
Occupancy by Ownership in Lake County
Of the total 2,837 dwellings in Lake County, owner-occupied units account for 2,196 (77.4%), while renter-occupied units make up 641 (22.6%).
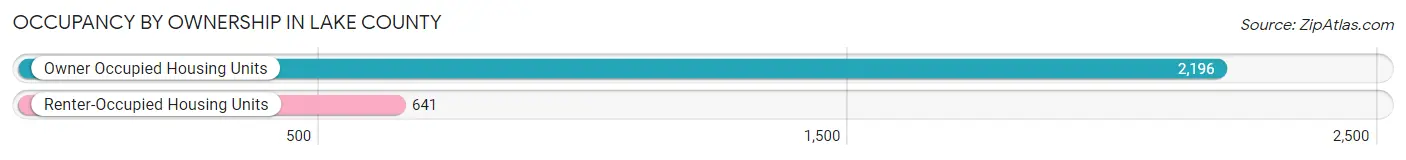
| Occupancy | # Housing Units | % Housing Units |
| Owner Occupied Housing Units | 2,196 | 77.4% |
| Renter-Occupied Housing Units | 641 | 22.6% |
| Total Occupied Housing Units | 2,837 | 100.0% |
Occupancy by Household Size in Lake County
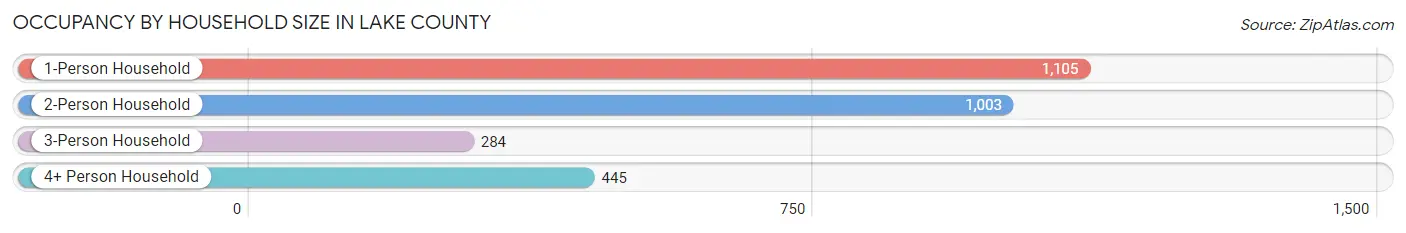
| Household Size | # Housing Units | % Housing Units |
| 1-Person Household | 1,105 | 39.0% |
| 2-Person Household | 1,003 | 35.3% |
| 3-Person Household | 284 | 10.0% |
| 4+ Person Household | 445 | 15.7% |
| Total Housing Units | 2,837 | 100.0% |
Occupancy by Ownership by Household Size in Lake County
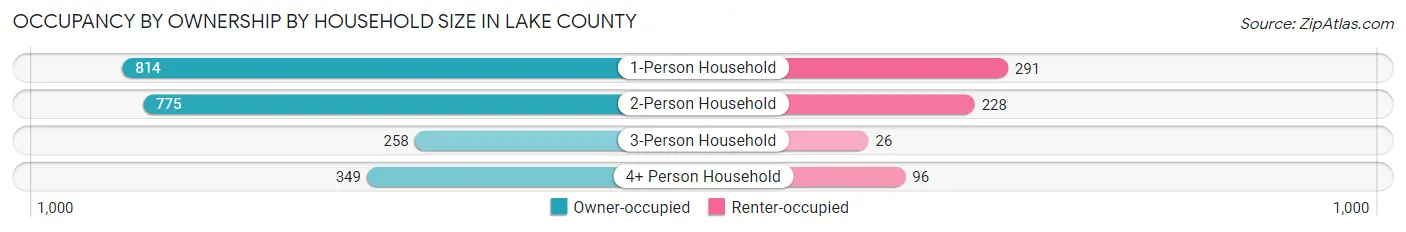
| Household Size | Owner-occupied | Renter-occupied |
| 1-Person Household | 814 (73.7%) | 291 (26.3%) |
| 2-Person Household | 775 (77.3%) | 228 (22.7%) |
| 3-Person Household | 258 (90.8%) | 26 (9.1%) |
| 4+ Person Household | 349 (78.4%) | 96 (21.6%) |
| Total Housing Units | 2,196 (77.4%) | 641 (22.6%) |
Occupancy by Educational Attainment in Lake County
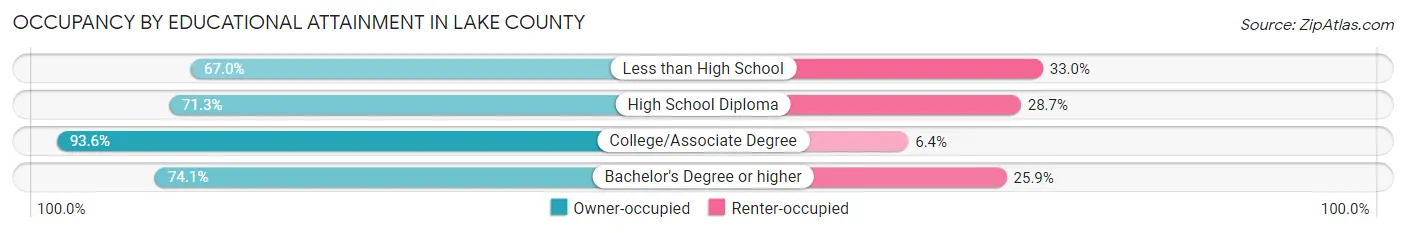
| Household Size | Owner-occupied | Renter-occupied |
| Less than High School | 73 (67.0%) | 36 (33.0%) |
| High School Diploma | 637 (71.3%) | 256 (28.7%) |
| College/Associate Degree | 603 (93.6%) | 41 (6.4%) |
| Bachelor's Degree or higher | 883 (74.1%) | 308 (25.9%) |
Occupancy by Age of Householder in Lake County
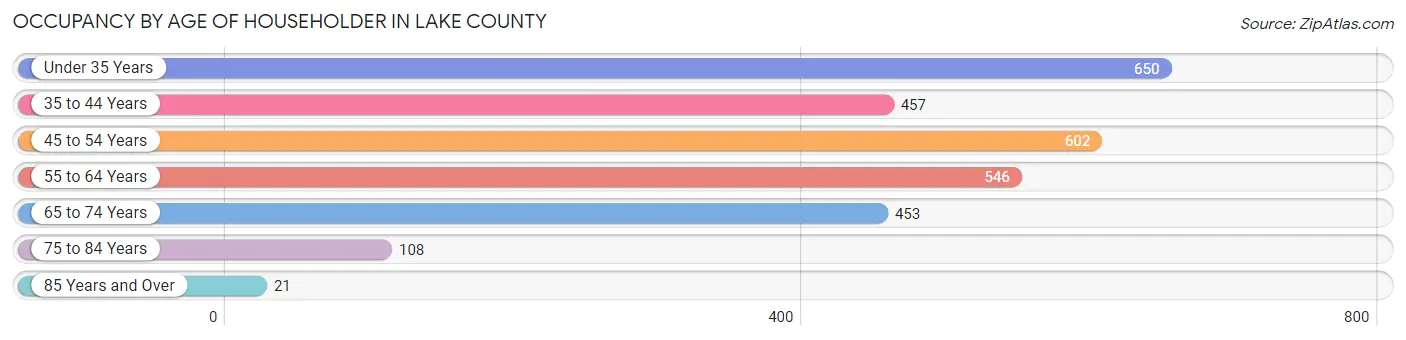
| Age Bracket | # Households | % Households |
| Under 35 Years | 650 | 22.9% |
| 35 to 44 Years | 457 | 16.1% |
| 45 to 54 Years | 602 | 21.2% |
| 55 to 64 Years | 546 | 19.3% |
| 65 to 74 Years | 453 | 16.0% |
| 75 to 84 Years | 108 | 3.8% |
| 85 Years and Over | 21 | 0.7% |
| Total | 2,837 | 100.0% |
Housing Finances in Lake County
Median Income by Occupancy in Lake County
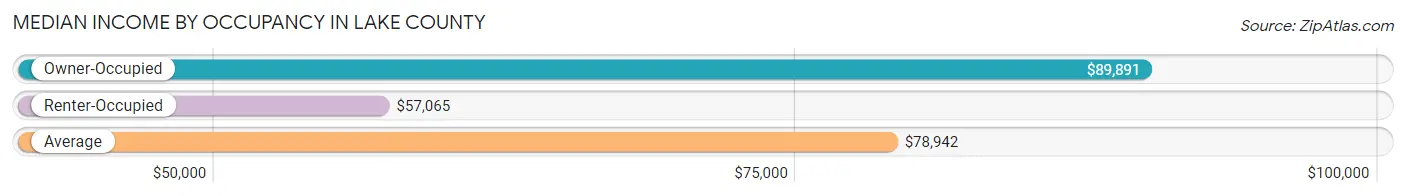
| Occupancy Type | # Households | Median Income |
| Owner-Occupied | 2,196 (77.4%) | $89,891 |
| Renter-Occupied | 641 (22.6%) | $57,065 |
| Average | 2,837 (100.0%) | $78,942 |
Occupancy by Householder Income Bracket in Lake County
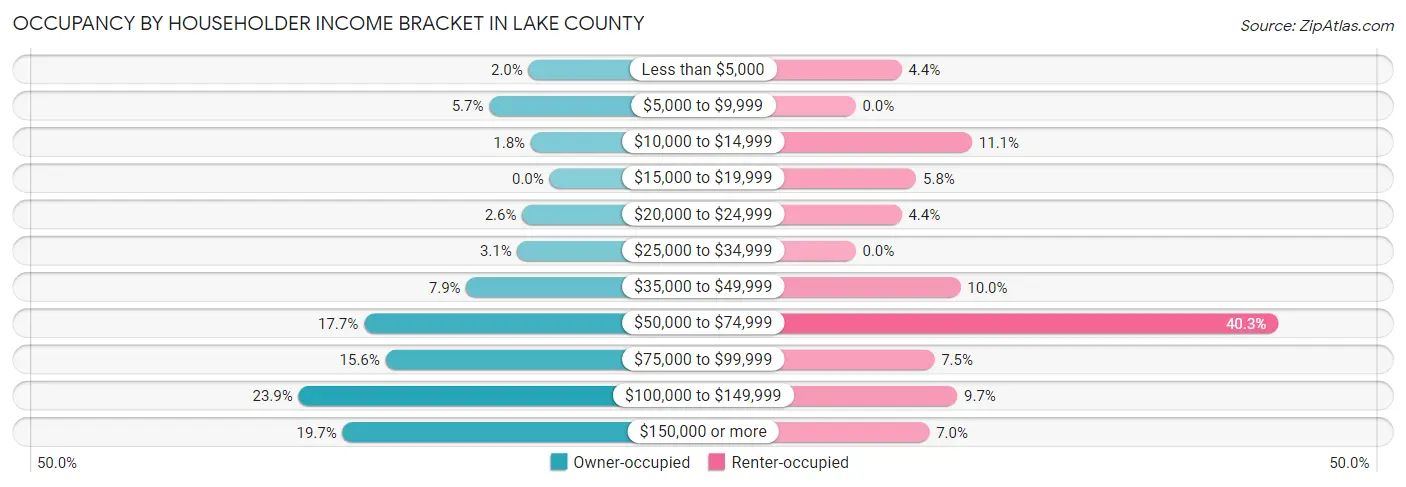
| Income Bracket | Owner-occupied | Renter-occupied |
| Less than $5,000 | 44 (2.0%) | 28 (4.4%) |
| $5,000 to $9,999 | 126 (5.7%) | 0 (0.0%) |
| $10,000 to $14,999 | 39 (1.8%) | 71 (11.1%) |
| $15,000 to $19,999 | 0 (0.0%) | 37 (5.8%) |
| $20,000 to $24,999 | 57 (2.6%) | 28 (4.4%) |
| $25,000 to $34,999 | 67 (3.0%) | 0 (0.0%) |
| $35,000 to $49,999 | 174 (7.9%) | 64 (10.0%) |
| $50,000 to $74,999 | 388 (17.7%) | 258 (40.3%) |
| $75,000 to $99,999 | 343 (15.6%) | 48 (7.5%) |
| $100,000 to $149,999 | 525 (23.9%) | 62 (9.7%) |
| $150,000 or more | 433 (19.7%) | 45 (7.0%) |
| Total | 2,196 (100.0%) | 641 (100.0%) |
Monthly Housing Cost Tiers in Lake County
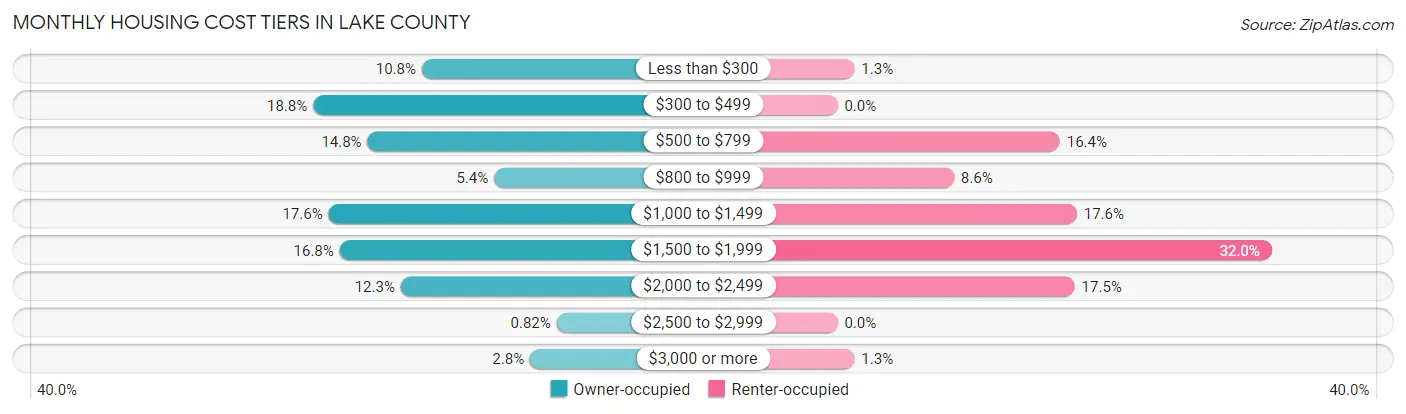
| Monthly Cost | Owner-occupied | Renter-occupied |
| Less than $300 | 236 (10.7%) | 8 (1.3%) |
| $300 to $499 | 412 (18.8%) | 0 (0.0%) |
| $500 to $799 | 324 (14.7%) | 105 (16.4%) |
| $800 to $999 | 119 (5.4%) | 55 (8.6%) |
| $1,000 to $1,499 | 387 (17.6%) | 113 (17.6%) |
| $1,500 to $1,999 | 369 (16.8%) | 205 (32.0%) |
| $2,000 to $2,499 | 270 (12.3%) | 112 (17.5%) |
| $2,500 to $2,999 | 18 (0.8%) | 0 (0.0%) |
| $3,000 or more | 61 (2.8%) | 8 (1.3%) |
| Total | 2,196 (100.0%) | 641 (100.0%) |
Physical Housing Characteristics in Lake County
Housing Structures in Lake County
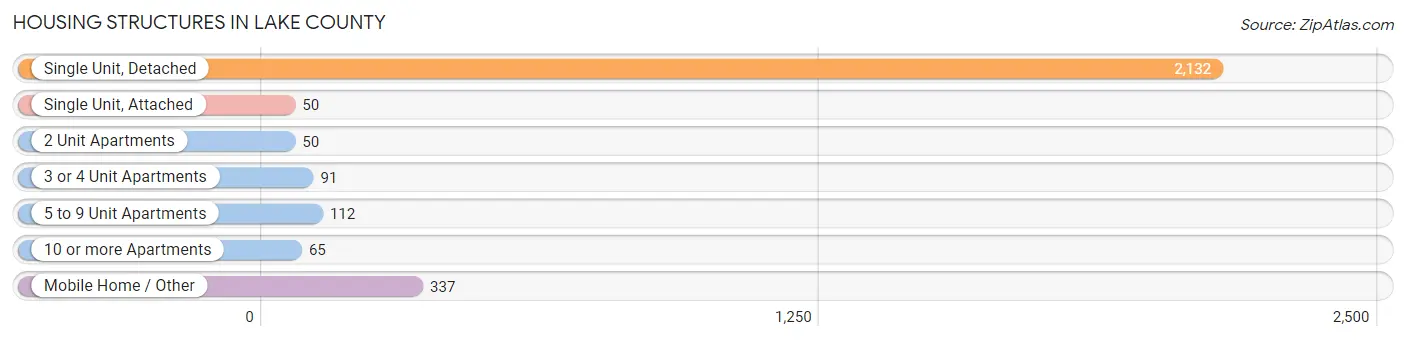
| Structure Type | # Housing Units | % Housing Units |
| Single Unit, Detached | 2,132 | 75.1% |
| Single Unit, Attached | 50 | 1.8% |
| 2 Unit Apartments | 50 | 1.8% |
| 3 or 4 Unit Apartments | 91 | 3.2% |
| 5 to 9 Unit Apartments | 112 | 4.0% |
| 10 or more Apartments | 65 | 2.3% |
| Mobile Home / Other | 337 | 11.9% |
| Total | 2,837 | 100.0% |
Housing Structures by Occupancy in Lake County
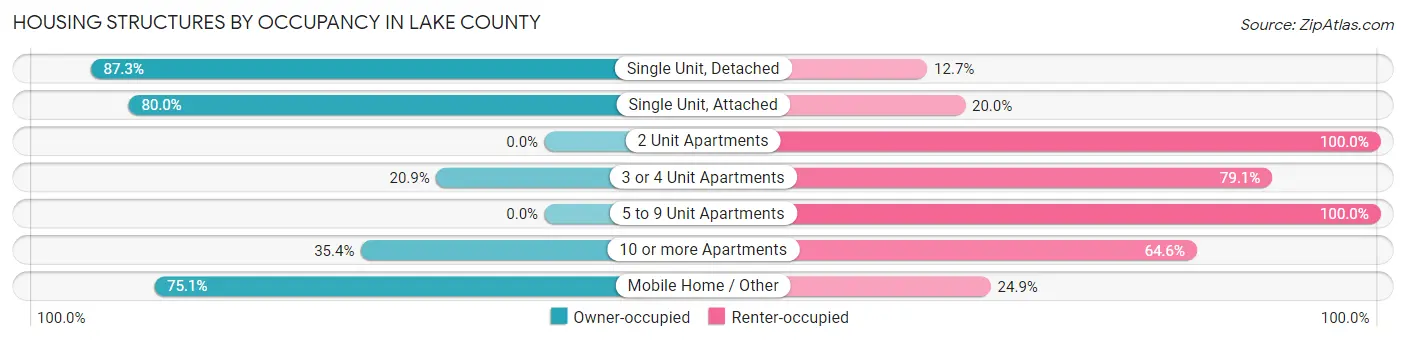
| Structure Type | Owner-occupied | Renter-occupied |
| Single Unit, Detached | 1,861 (87.3%) | 271 (12.7%) |
| Single Unit, Attached | 40 (80.0%) | 10 (20.0%) |
| 2 Unit Apartments | 0 (0.0%) | 50 (100.0%) |
| 3 or 4 Unit Apartments | 19 (20.9%) | 72 (79.1%) |
| 5 to 9 Unit Apartments | 0 (0.0%) | 112 (100.0%) |
| 10 or more Apartments | 23 (35.4%) | 42 (64.6%) |
| Mobile Home / Other | 253 (75.1%) | 84 (24.9%) |
| Total | 2,196 (77.4%) | 641 (22.6%) |
Housing Structures by Number of Rooms in Lake County
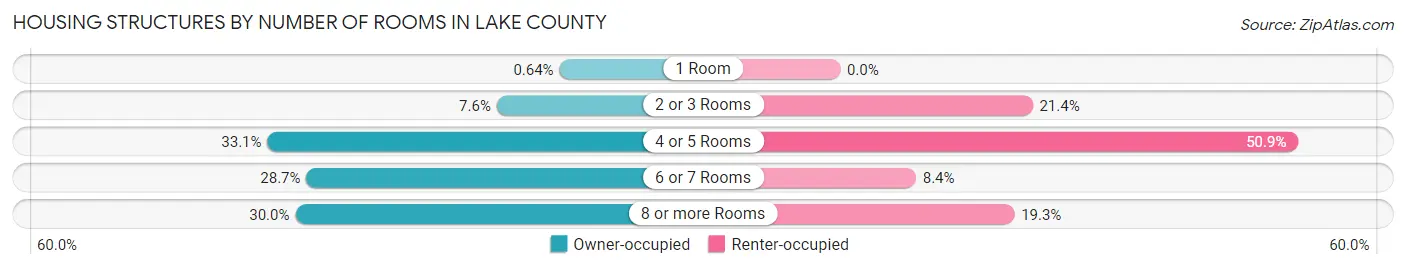
| Number of Rooms | Owner-occupied | Renter-occupied |
| 1 Room | 14 (0.6%) | 0 (0.0%) |
| 2 or 3 Rooms | 167 (7.6%) | 137 (21.4%) |
| 4 or 5 Rooms | 726 (33.1%) | 326 (50.9%) |
| 6 or 7 Rooms | 631 (28.7%) | 54 (8.4%) |
| 8 or more Rooms | 658 (30.0%) | 124 (19.3%) |
| Total | 2,196 (100.0%) | 641 (100.0%) |
Housing Structure by Heating Type in Lake County
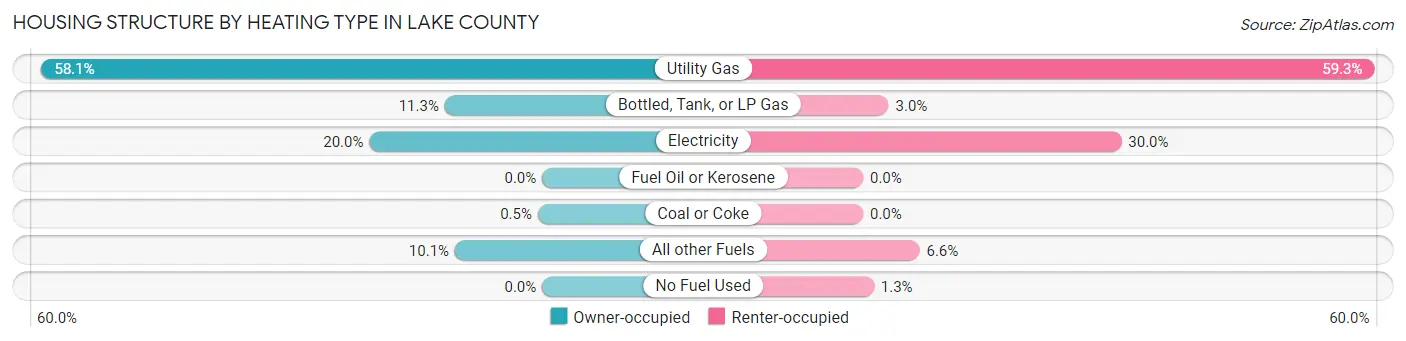
| Heating Type | Owner-occupied | Renter-occupied |
| Utility Gas | 1,275 (58.1%) | 380 (59.3%) |
| Bottled, Tank, or LP Gas | 248 (11.3%) | 19 (3.0%) |
| Electricity | 440 (20.0%) | 192 (29.9%) |
| Fuel Oil or Kerosene | 0 (0.0%) | 0 (0.0%) |
| Coal or Coke | 11 (0.5%) | 0 (0.0%) |
| All other Fuels | 222 (10.1%) | 42 (6.6%) |
| No Fuel Used | 0 (0.0%) | 8 (1.3%) |
| Total | 2,196 (100.0%) | 641 (100.0%) |
Household Vehicle Usage in Lake County
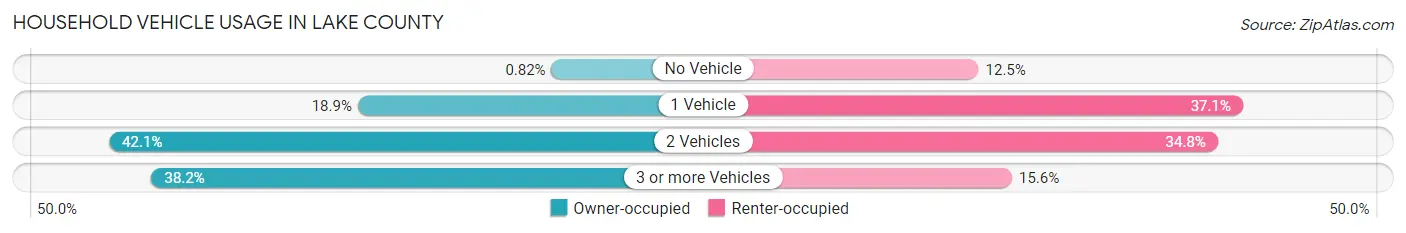
| Vehicles per Household | Owner-occupied | Renter-occupied |
| No Vehicle | 18 (0.8%) | 80 (12.5%) |
| 1 Vehicle | 415 (18.9%) | 238 (37.1%) |
| 2 Vehicles | 925 (42.1%) | 223 (34.8%) |
| 3 or more Vehicles | 838 (38.2%) | 100 (15.6%) |
| Total | 2,196 (100.0%) | 641 (100.0%) |
Real Estate & Mortgages in Lake County
Real Estate and Mortgage Overview in Lake County
| Characteristic | Without Mortgage | With Mortgage |
| Housing Units | 1,037 | 1,159 |
| Median Property Value | $245,200 | $387,500 |
| Median Household Income | $73,212 | $247 |
| Monthly Housing Costs | $428 | $61 |
| Real Estate Taxes | $808 | $0 |
Property Value by Mortgage Status in Lake County
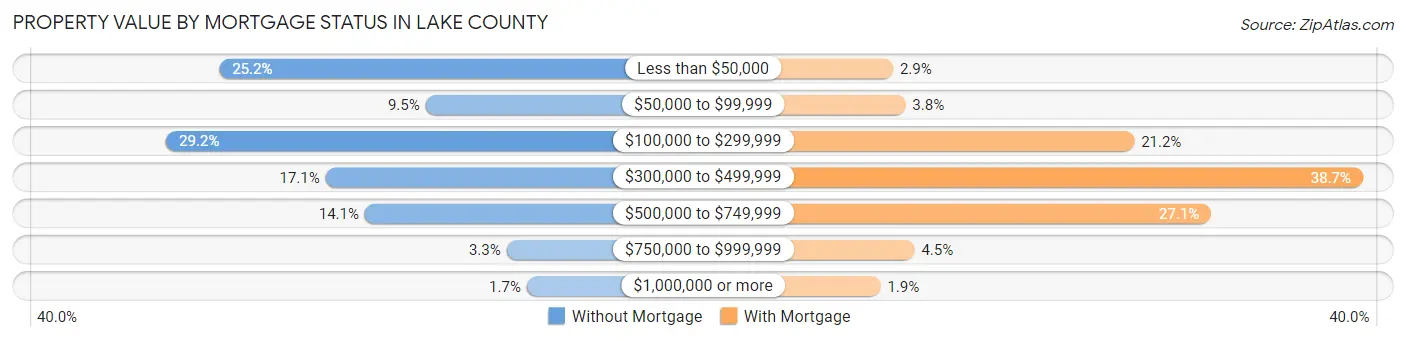
| Property Value | Without Mortgage | With Mortgage |
| Less than $50,000 | 261 (25.2%) | 33 (2.9%) |
| $50,000 to $99,999 | 98 (9.5%) | 44 (3.8%) |
| $100,000 to $299,999 | 303 (29.2%) | 246 (21.2%) |
| $300,000 to $499,999 | 177 (17.1%) | 448 (38.7%) |
| $500,000 to $749,999 | 146 (14.1%) | 314 (27.1%) |
| $750,000 to $999,999 | 34 (3.3%) | 52 (4.5%) |
| $1,000,000 or more | 18 (1.7%) | 22 (1.9%) |
| Total | 1,037 (100.0%) | 1,159 (100.0%) |
Household Income by Mortgage Status in Lake County
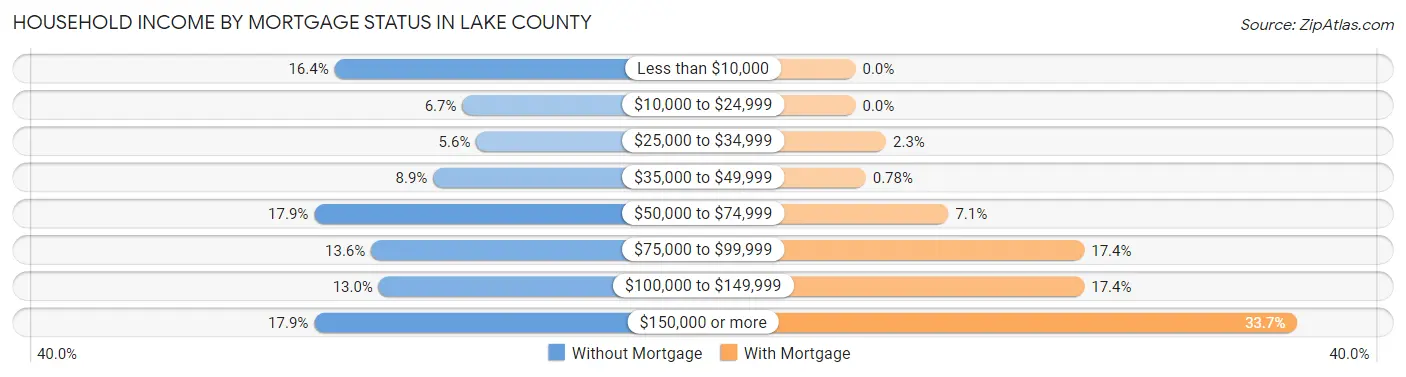
| Household Income | Without Mortgage | With Mortgage |
| Less than $10,000 | 170 (16.4%) | 0 (0.0%) |
| $10,000 to $24,999 | 69 (6.7%) | 0 (0.0%) |
| $25,000 to $34,999 | 58 (5.6%) | 27 (2.3%) |
| $35,000 to $49,999 | 92 (8.9%) | 9 (0.8%) |
| $50,000 to $74,999 | 186 (17.9%) | 82 (7.1%) |
| $75,000 to $99,999 | 141 (13.6%) | 202 (17.4%) |
| $100,000 to $149,999 | 135 (13.0%) | 202 (17.4%) |
| $150,000 or more | 186 (17.9%) | 390 (33.7%) |
| Total | 1,037 (100.0%) | 1,159 (100.0%) |
Property Value to Household Income Ratio in Lake County
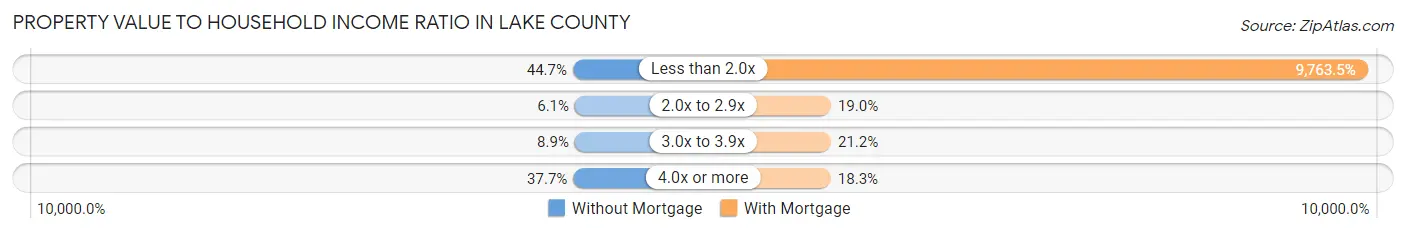
| Value-to-Income Ratio | Without Mortgage | With Mortgage |
| Less than 2.0x | 463 (44.7%) | 113,159 (9,763.5%) |
| 2.0x to 2.9x | 63 (6.1%) | 220 (19.0%) |
| 3.0x to 3.9x | 92 (8.9%) | 246 (21.2%) |
| 4.0x or more | 391 (37.7%) | 212 (18.3%) |
| Total | 1,037 (100.0%) | 1,159 (100.0%) |
Real Estate Taxes by Mortgage Status in Lake County
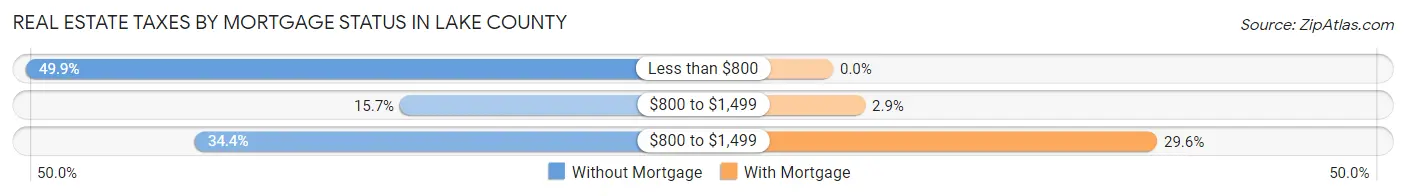
| Property Taxes | Without Mortgage | With Mortgage |
| Less than $800 | 517 (49.9%) | 0 (0.0%) |
| $800 to $1,499 | 163 (15.7%) | 34 (2.9%) |
| $800 to $1,499 | 357 (34.4%) | 343 (29.6%) |
| Total | 1,037 (100.0%) | 1,159 (100.0%) |
Health & Disability in Lake County
Health Insurance Coverage by Age in Lake County
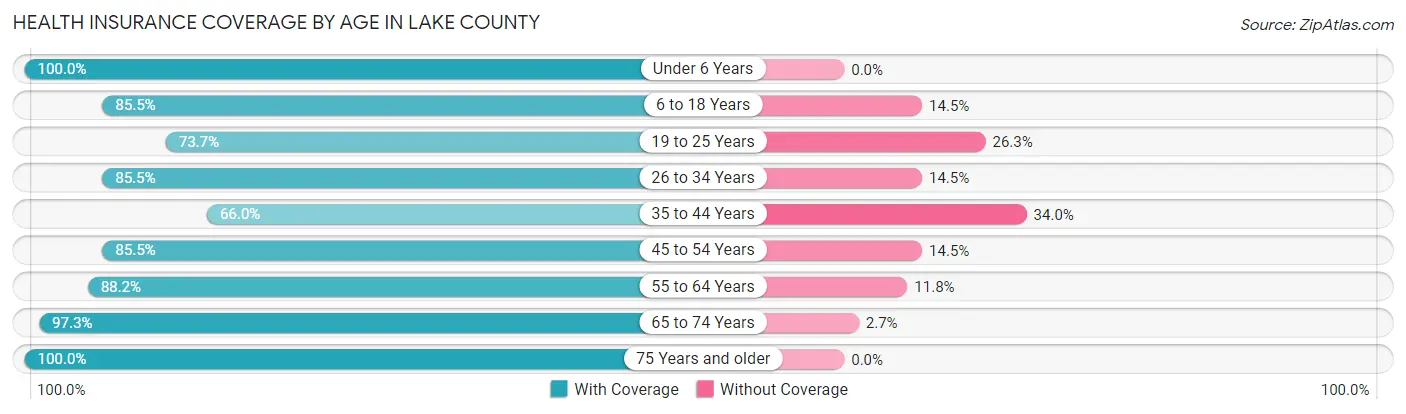
| Age Bracket | With Coverage | Without Coverage |
| Under 6 Years | 351 (100.0%) | 0 (0.0%) |
| 6 to 18 Years | 795 (85.5%) | 135 (14.5%) |
| 19 to 25 Years | 632 (73.7%) | 226 (26.3%) |
| 26 to 34 Years | 1,185 (85.5%) | 201 (14.5%) |
| 35 to 44 Years | 784 (66.0%) | 404 (34.0%) |
| 45 to 54 Years | 736 (85.5%) | 125 (14.5%) |
| 55 to 64 Years | 652 (88.2%) | 87 (11.8%) |
| 65 to 74 Years | 822 (97.3%) | 23 (2.7%) |
| 75 Years and older | 187 (100.0%) | 0 (0.0%) |
| Total | 6,144 (83.7%) | 1,201 (16.4%) |
Health Insurance Coverage by Citizenship Status in Lake County
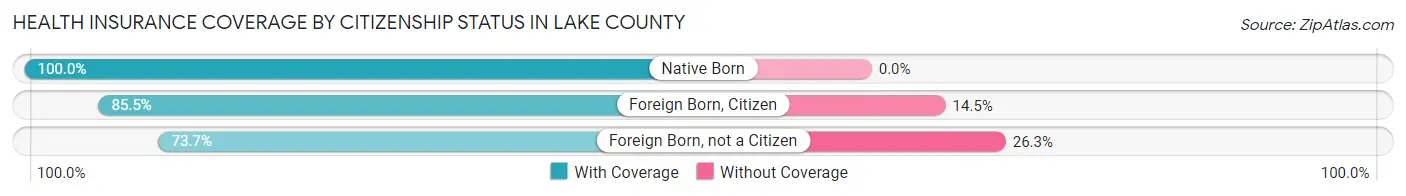
| Citizenship Status | With Coverage | Without Coverage |
| Native Born | 351 (100.0%) | 0 (0.0%) |
| Foreign Born, Citizen | 795 (85.5%) | 135 (14.5%) |
| Foreign Born, not a Citizen | 632 (73.7%) | 226 (26.3%) |
Health Insurance Coverage by Household Income in Lake County

| Household Income | With Coverage | Without Coverage |
| Under $25,000 | 406 (64.1%) | 227 (35.9%) |
| $25,000 to $49,999 | 521 (86.4%) | 82 (13.6%) |
| $50,000 to $74,999 | 1,156 (80.8%) | 274 (19.2%) |
| $75,000 to $99,999 | 1,049 (90.2%) | 114 (9.8%) |
| $100,000 and over | 2,933 (85.6%) | 493 (14.4%) |
Public vs Private Health Insurance Coverage by Age in Lake County
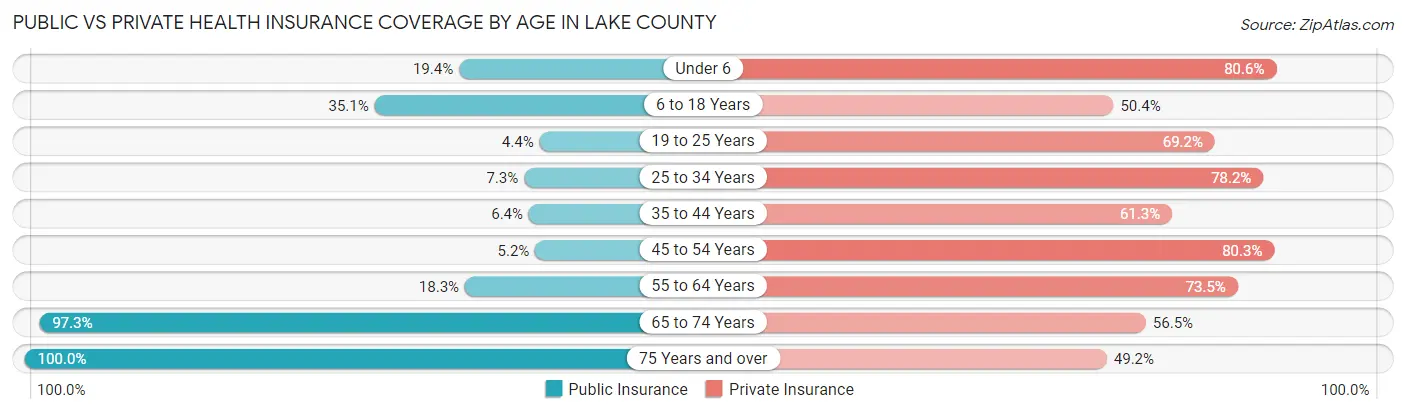
| Age Bracket | Public Insurance | Private Insurance |
| Under 6 | 68 (19.4%) | 283 (80.6%) |
| 6 to 18 Years | 326 (35.0%) | 469 (50.4%) |
| 19 to 25 Years | 38 (4.4%) | 594 (69.2%) |
| 25 to 34 Years | 101 (7.3%) | 1,084 (78.2%) |
| 35 to 44 Years | 76 (6.4%) | 728 (61.3%) |
| 45 to 54 Years | 45 (5.2%) | 691 (80.3%) |
| 55 to 64 Years | 135 (18.3%) | 543 (73.5%) |
| 65 to 74 Years | 822 (97.3%) | 477 (56.5%) |
| 75 Years and over | 187 (100.0%) | 92 (49.2%) |
| Total | 1,798 (24.5%) | 4,961 (67.5%) |
Disability Status by Sex by Age in Lake County
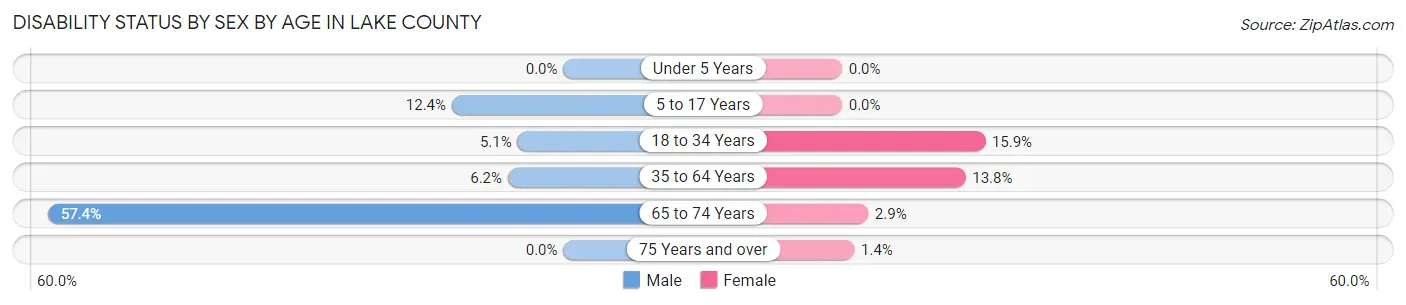
| Age Bracket | Male | Female |
| Under 5 Years | 0 (0.0%) | 0 (0.0%) |
| 5 to 17 Years | 55 (12.4%) | 0 (0.0%) |
| 18 to 34 Years | 65 (5.1%) | 162 (15.9%) |
| 35 to 64 Years | 95 (6.2%) | 172 (13.8%) |
| 65 to 74 Years | 248 (57.4%) | 12 (2.9%) |
| 75 Years and over | 0 (0.0%) | 1 (1.4%) |
Disability Class by Sex by Age in Lake County
Disability Class: Hearing Difficulty

| Age Bracket | Male | Female |
| Under 5 Years | 0 (0.0%) | 0 (0.0%) |
| 5 to 17 Years | 0 (0.0%) | 0 (0.0%) |
| 18 to 34 Years | 0 (0.0%) | 126 (12.4%) |
| 35 to 64 Years | 49 (3.2%) | 68 (5.4%) |
| 65 to 74 Years | 0 (0.0%) | 0 (0.0%) |
| 75 Years and over | 0 (0.0%) | 1 (1.4%) |
Disability Class: Vision Difficulty

| Age Bracket | Male | Female |
| Under 5 Years | 0 (0.0%) | 0 (0.0%) |
| 5 to 17 Years | 41 (9.3%) | 0 (0.0%) |
| 18 to 34 Years | 42 (3.3%) | 0 (0.0%) |
| 35 to 64 Years | 0 (0.0%) | 37 (3.0%) |
| 65 to 74 Years | 11 (2.5%) | 0 (0.0%) |
| 75 Years and over | 0 (0.0%) | 0 (0.0%) |
Disability Class: Cognitive Difficulty
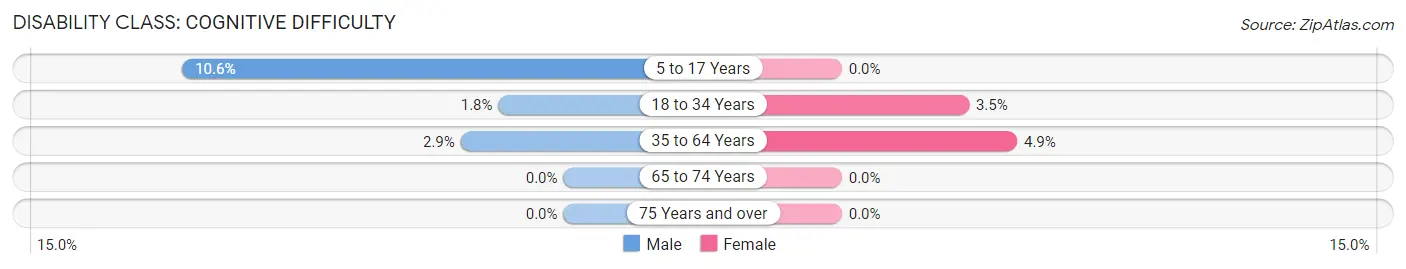
| Age Bracket | Male | Female |
| 5 to 17 Years | 47 (10.6%) | 0 (0.0%) |
| 18 to 34 Years | 23 (1.8%) | 36 (3.5%) |
| 35 to 64 Years | 44 (2.9%) | 61 (4.9%) |
| 65 to 74 Years | 0 (0.0%) | 0 (0.0%) |
| 75 Years and over | 0 (0.0%) | 0 (0.0%) |
Disability Class: Ambulatory Difficulty
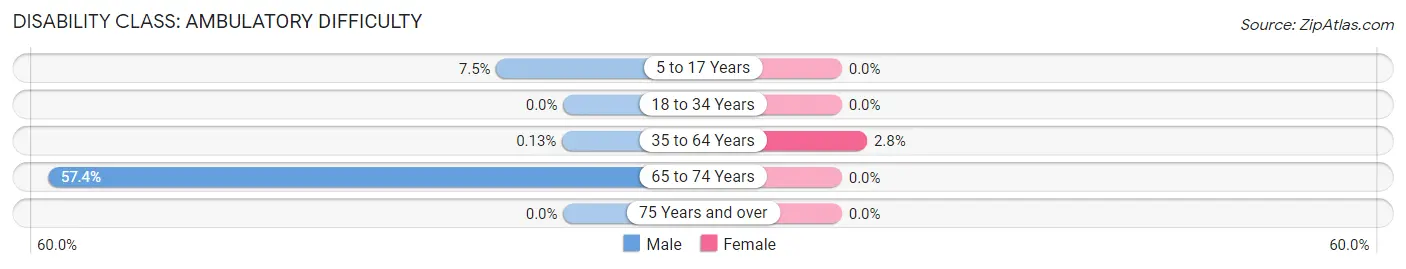
| Age Bracket | Male | Female |
| 5 to 17 Years | 33 (7.4%) | 0 (0.0%) |
| 18 to 34 Years | 0 (0.0%) | 0 (0.0%) |
| 35 to 64 Years | 2 (0.1%) | 35 (2.8%) |
| 65 to 74 Years | 248 (57.4%) | 0 (0.0%) |
| 75 Years and over | 0 (0.0%) | 0 (0.0%) |
Disability Class: Self-Care Difficulty
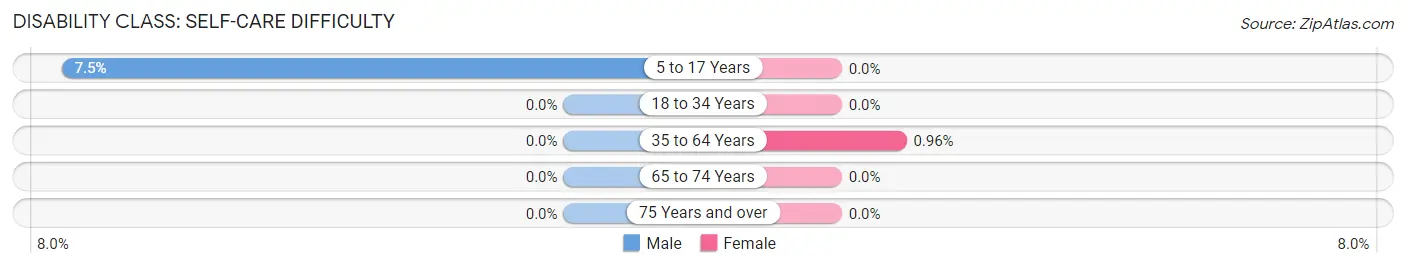
| Age Bracket | Male | Female |
| 5 to 17 Years | 33 (7.4%) | 0 (0.0%) |
| 18 to 34 Years | 0 (0.0%) | 0 (0.0%) |
| 35 to 64 Years | 0 (0.0%) | 12 (1.0%) |
| 65 to 74 Years | 0 (0.0%) | 0 (0.0%) |
| 75 Years and over | 0 (0.0%) | 0 (0.0%) |
Technology Access in Lake County
Computing Device Access in Lake County
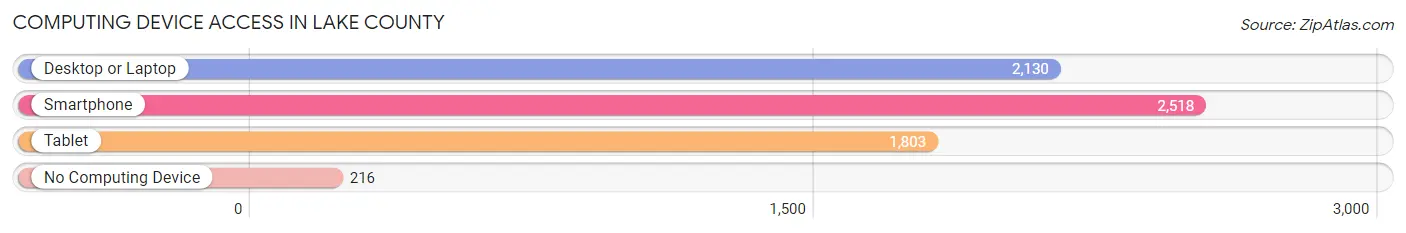
| Device Type | # Households | % Households |
| Desktop or Laptop | 2,130 | 75.1% |
| Smartphone | 2,518 | 88.8% |
| Tablet | 1,803 | 63.5% |
| No Computing Device | 216 | 7.6% |
| Total | 2,837 | 100.0% |
Internet Access in Lake County
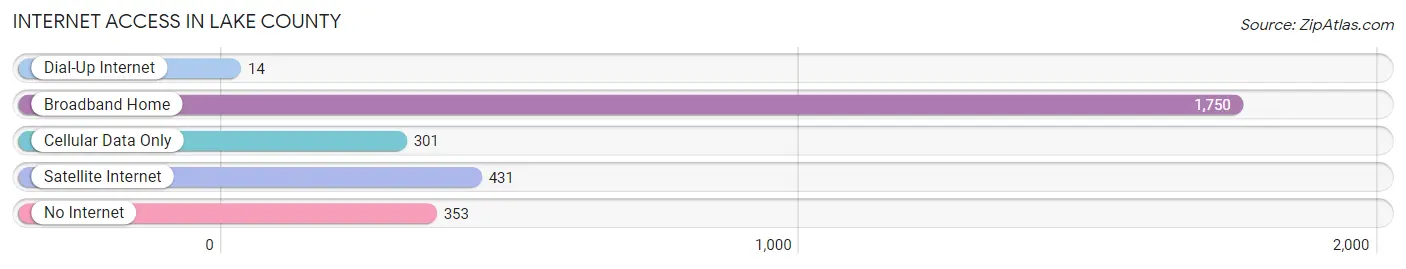
| Internet Type | # Households | % Households |
| Dial-Up Internet | 14 | 0.5% |
| Broadband Home | 1,750 | 61.7% |
| Cellular Data Only | 301 | 10.6% |
| Satellite Internet | 431 | 15.2% |
| No Internet | 353 | 12.4% |
| Total | 2,837 | 100.0% |
Lake County Summary
Lake County is located in the south-central part of Colorado, and is the ninth least populous county in the state. It is bordered by Park County to the north, Chaffee County to the east, Fremont County to the south, and Park and Teller counties to the west. The county seat is Leadville, and the county has a total area of 1,164 square miles.
History
The area that is now Lake County was originally inhabited by the Ute and Arapaho tribes. The first European settlers arrived in the area in the 1860s, and the county was officially established in 1861. The county was named after the many lakes in the area, including Twin Lakes, Turquoise Lake, and Lake San Cristobal.
In the late 19th century, the area became a popular destination for prospectors during the Colorado Silver Boom. Leadville, the county seat, was founded in 1877 and quickly became the largest city in the area. The city was home to many of the area’s silver mines, and was the site of the famous Matchless Mine, which was the largest silver mine in the world at the time.
The area was also home to many of the area’s early ski resorts, including Ski Cooper, which opened in 1937. The area was also home to the famous 10th Mountain Division, which trained in the area during World War II.
Geography
Lake County is located in the south-central part of Colorado, and is bordered by Park County to the north, Chaffee County to the east, Fremont County to the south, and Park and Teller counties to the west. The county has a total area of 1,164 square miles, and is the ninth least populous county in the state.
The county is located in the Rocky Mountains, and is home to many of the state’s highest peaks, including Mount Elbert, which is the highest peak in Colorado. The county is also home to many of the state’s largest lakes, including Twin Lakes, Turquoise Lake, and Lake San Cristobal.
Economy
The economy of Lake County is largely based on tourism, mining, and agriculture. The county is home to many of the state’s ski resorts, including Ski Cooper, which opened in 1937. The area is also home to many of the state’s silver mines, and is the site of the famous Matchless Mine, which was the largest silver mine in the world at the time.
Agriculture is also an important part of the county’s economy, and the area is home to many farms and ranches. The county is also home to many of the state’s wineries, and is a popular destination for wine enthusiasts.
Demographics
As of the 2010 census, the population of Lake County was 7,310, and the population density was 6.3 people per square mile. The racial makeup of the county was 94.2% White, 0.7% Black or African American, 0.7% Native American, 0.3% Asian, 0.1% Pacific Islander, 2.2% from other races, and 1.8% from two or more races. Hispanic or Latino of any race were 5.3% of the population.
The median income for a household in the county was $41,944, and the median income for a family was $50,944. The per capita income for the county was $21,944. About 11.2% of families and 14.2% of the population were below the poverty line, including 18.2% of those under age 18 and 8.2% of those age 65 or over.
Common Questions
What is Per Capita Income in Lake County?
Per Capita income in Lake County is $44,794.
What is the Median Family Income in Lake County?
Median Family Income in Lake County is $98,158.
What is the Median Household income in Lake County?
Median Household Income in Lake County is $78,942.
What is Income or Wage Gap in Lake County?
Income or Wage Gap in Lake County is 11.1%.
Women in Lake County earn 88.9 cents for every dollar earned by a man.
What is Inequality or Gini Index in Lake County?
Inequality or Gini Index in Lake County is 0.40.
What is the Total Population of Lake County?
Total Population of Lake County is 7,403.
What is the Total Male Population of Lake County?
Total Male Population of Lake County is 3,920.
What is the Total Female Population of Lake County?
Total Female Population of Lake County is 3,483.
What is the Ratio of Males per 100 Females in Lake County?
There are 112.55 Males per 100 Females in Lake County.
What is the Ratio of Females per 100 Males in Lake County?
There are 88.85 Females per 100 Males in Lake County.
What is the Median Population Age in Lake County?
Median Population Age in Lake County is 36.8 Years.
What is the Average Family Size in Lake County
Average Family Size in Lake County is 3.5 People.
What is the Average Household Size in Lake County
Average Household Size in Lake County is 2.6 People.
How Large is the Labor Force in Lake County?
There are 4,720 People in the Labor Forcein in Lake County.
What is the Percentage of People in the Labor Force in Lake County?
74.7% of People are in the Labor Force in Lake County.
What is the Unemployment Rate in Lake County?
Unemployment Rate in Lake County is 2.4%.