Kit Carson County, CO Map & Demographics
Kit Carson County Map
Kit Carson County Overview
$36,039
PER CAPITA INCOME
$72,062
AVG FAMILY INCOME
$58,992
AVG HOUSEHOLD INCOME
40.2%
WAGE / INCOME GAP [ % ]
59.8¢/ $1
WAGE / INCOME GAP [ $ ]
$7,976
FAMILY INCOME DEFICIT
0.46
INEQUALITY / GINI INDEX
7,039
TOTAL POPULATION
3,499
MALE POPULATION
3,540
FEMALE POPULATION
98.84
MALES / 100 FEMALES
101.17
FEMALES / 100 MALES
39.2
MEDIAN AGE
2.9
AVG FAMILY SIZE
2.3
AVG HOUSEHOLD SIZE
3,662
LABOR FORCE [ PEOPLE ]
68.0%
PERCENT IN LABOR FORCE
2.6%
UNEMPLOYMENT RATE
Income in Kit Carson County
Income Overview in Kit Carson County
Per Capita Income in Kit Carson County is $36,039, while median incomes of families and households are $72,062 and $58,992 respectively.
| Characteristic | Number | Measure |
| Per Capita Income | 7,039 | $36,039 |
| Median Family Income | 1,931 | $72,062 |
| Mean Family Income | 1,931 | $93,400 |
| Median Household Income | 2,979 | $58,992 |
| Mean Household Income | 2,979 | $84,540 |
| Income Deficit | 1,931 | $7,976 |
| Wage / Income Gap (%) | 7,039 | 40.19% |
| Wage / Income Gap ($) | 7,039 | 59.81¢ per $1 |
| Gini / Inequality Index | 7,039 | 0.46 |
Earnings by Sex in Kit Carson County
Average Earnings in Kit Carson County are $37,233, $45,090 for men and $26,970 for women, a difference of 40.2%.

| Sex | Number | Average Earnings |
| Male | 2,080 (52.7%) | $45,090 |
| Female | 1,863 (47.2%) | $26,970 |
| Total | 3,943 (100.0%) | $37,233 |
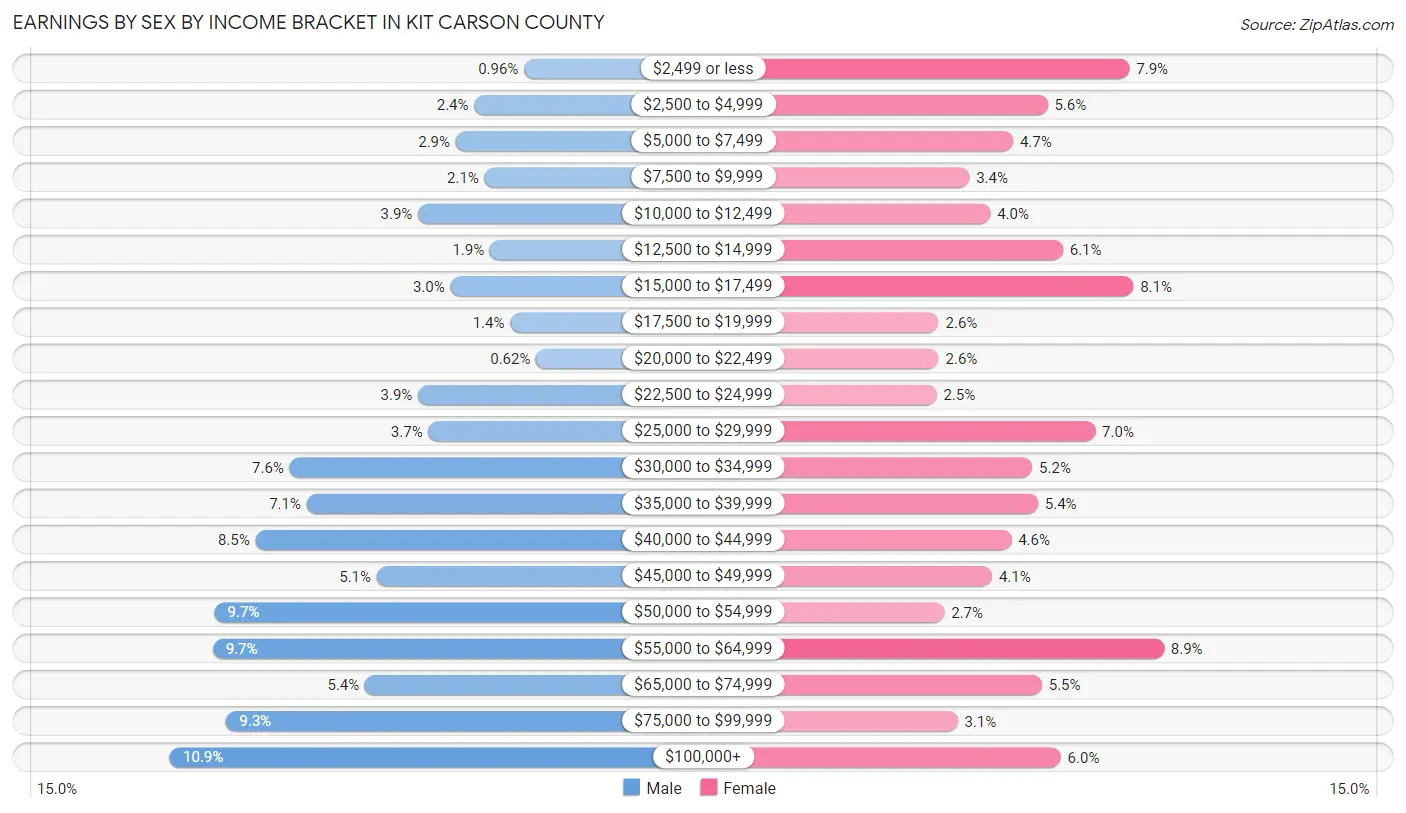
Earnings by Sex by Income Bracket in Kit Carson County
The most common earnings brackets in Kit Carson County are $100,000+ for men (227 | 10.9%) and $55,000 to $64,999 for women (166 | 8.9%).
| Income | Male | Female |
| $2,499 or less | 20 (1.0%) | 148 (7.9%) |
| $2,500 to $4,999 | 49 (2.4%) | 105 (5.6%) |
| $5,000 to $7,499 | 60 (2.9%) | 87 (4.7%) |
| $7,500 to $9,999 | 43 (2.1%) | 64 (3.4%) |
| $10,000 to $12,499 | 82 (3.9%) | 75 (4.0%) |
| $12,500 to $14,999 | 40 (1.9%) | 113 (6.1%) |
| $15,000 to $17,499 | 63 (3.0%) | 150 (8.1%) |
| $17,500 to $19,999 | 28 (1.3%) | 48 (2.6%) |
| $20,000 to $22,499 | 13 (0.6%) | 48 (2.6%) |
| $22,500 to $24,999 | 82 (3.9%) | 47 (2.5%) |
| $25,000 to $29,999 | 76 (3.6%) | 130 (7.0%) |
| $30,000 to $34,999 | 157 (7.5%) | 97 (5.2%) |
| $35,000 to $39,999 | 147 (7.1%) | 100 (5.4%) |
| $40,000 to $44,999 | 177 (8.5%) | 86 (4.6%) |
| $45,000 to $49,999 | 106 (5.1%) | 76 (4.1%) |
| $50,000 to $54,999 | 201 (9.7%) | 51 (2.7%) |
| $55,000 to $64,999 | 202 (9.7%) | 166 (8.9%) |
| $65,000 to $74,999 | 113 (5.4%) | 102 (5.5%) |
| $75,000 to $99,999 | 194 (9.3%) | 58 (3.1%) |
| $100,000+ | 227 (10.9%) | 112 (6.0%) |
| Total | 2,080 (100.0%) | 1,863 (100.0%) |
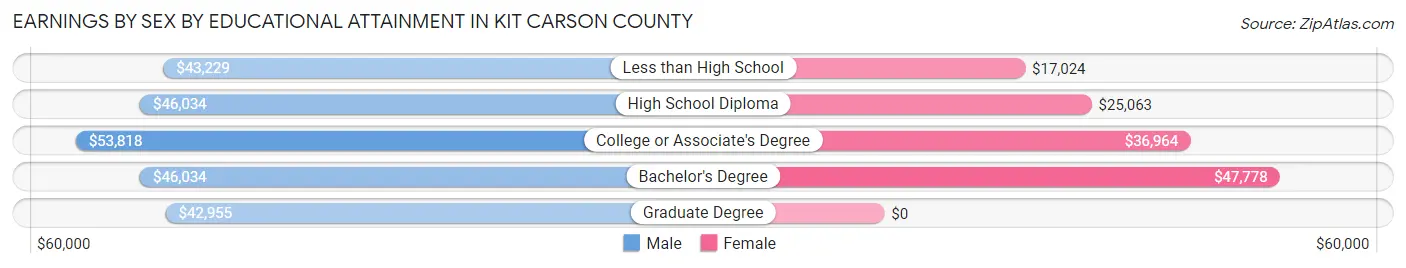
Earnings by Sex by Educational Attainment in Kit Carson County
Average earnings in Kit Carson County are $50,136 for men and $32,500 for women, a difference of 35.2%. Men with an educational attainment of college or associate's degree enjoy the highest average annual earnings of $53,818, while those with graduate degree education earn the least with $42,955. Women with an educational attainment of bachelor's degree earn the most with the average annual earnings of $47,778, while those with less than high school education have the smallest earnings of $17,024.
| Educational Attainment | Male Income | Female Income |
| Less than High School | $43,229 | $17,024 |
| High School Diploma | $46,034 | $25,063 |
| College or Associate's Degree | $53,818 | $36,964 |
| Bachelor's Degree | $46,034 | $47,778 |
| Graduate Degree | $42,955 | $0 |
| Total | $50,136 | $32,500 |
Family Income in Kit Carson County
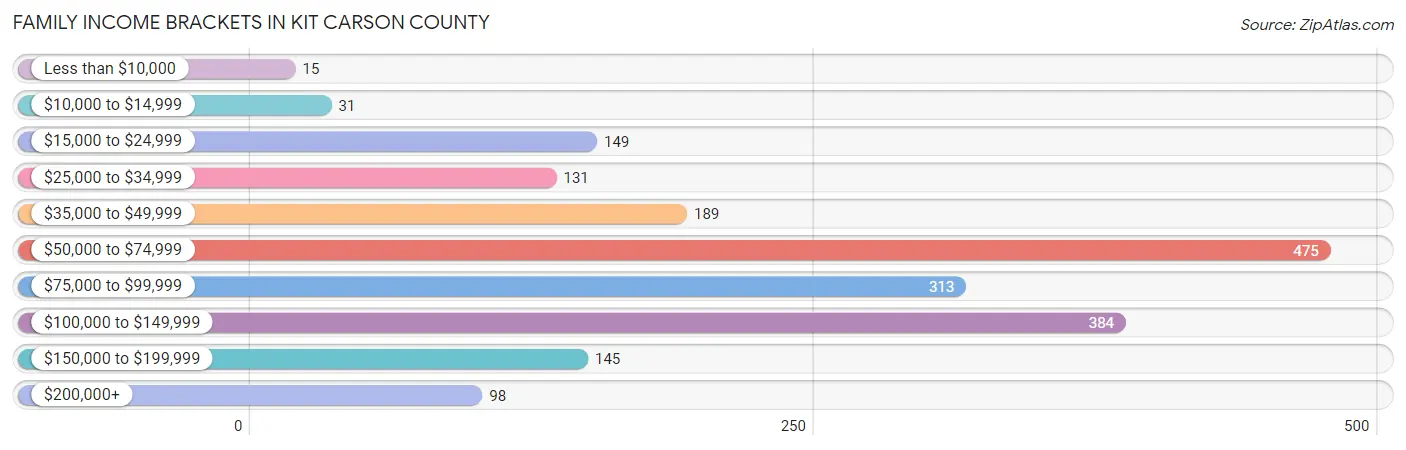
Family Income Brackets in Kit Carson County
According to the Kit Carson County family income data, there are 475 families falling into the $50,000 to $74,999 income range, which is the most common income bracket and makes up 24.6% of all families. Conversely, the less than $10,000 income bracket is the least frequent group with only 15 families (0.8%) belonging to this category.
| Income Bracket | # Families | % Families |
| Less than $10,000 | 15 | 0.8% |
| $10,000 to $14,999 | 31 | 1.6% |
| $15,000 to $24,999 | 149 | 7.7% |
| $25,000 to $34,999 | 131 | 6.8% |
| $35,000 to $49,999 | 189 | 9.8% |
| $50,000 to $74,999 | 475 | 24.6% |
| $75,000 to $99,999 | 313 | 16.2% |
| $100,000 to $149,999 | 384 | 19.9% |
| $150,000 to $199,999 | 145 | 7.5% |
| $200,000+ | 98 | 5.1% |
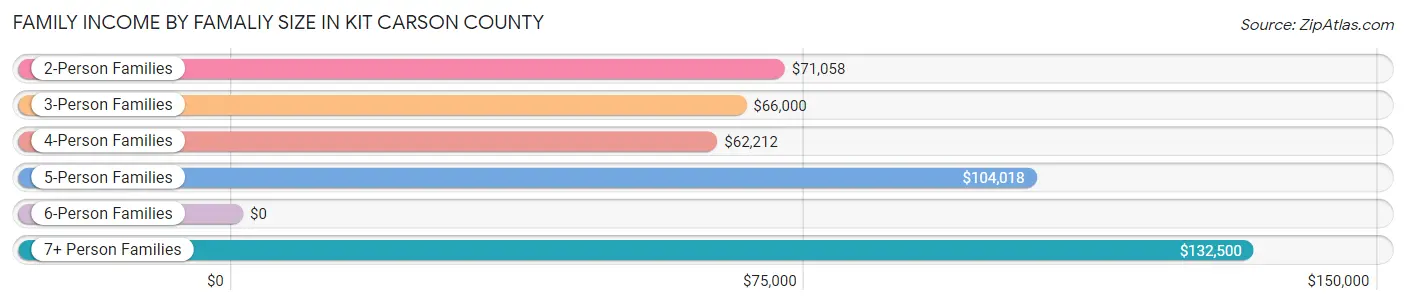
Family Income by Famaliy Size in Kit Carson County
7+ person families (4 | 0.2%) account for the highest median family income in Kit Carson County with $132,500 per family, while 2-person families (968 | 50.1%) have the highest median income of $35,529 per family member.
| Income Bracket | # Families | Median Income |
| 2-Person Families | 968 (50.1%) | $71,058 |
| 3-Person Families | 340 (17.6%) | $66,000 |
| 4-Person Families | 395 (20.5%) | $62,212 |
| 5-Person Families | 207 (10.7%) | $104,018 |
| 6-Person Families | 17 (0.9%) | $0 |
| 7+ Person Families | 4 (0.2%) | $132,500 |
| Total | 1,931 (100.0%) | $72,062 |
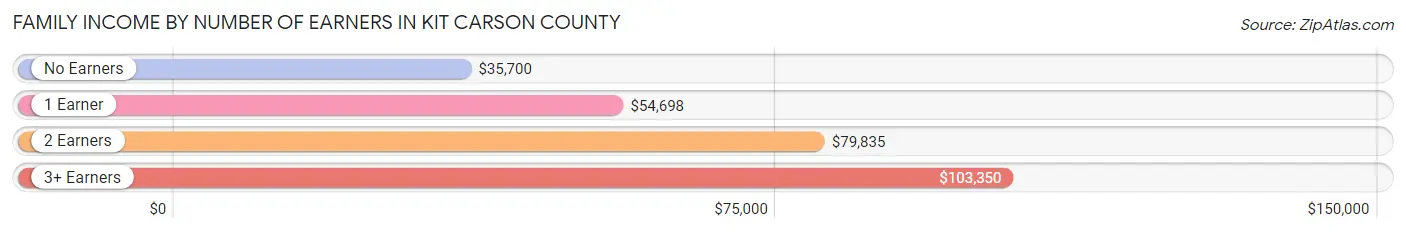
Family Income by Number of Earners in Kit Carson County
The median family income in Kit Carson County is $72,062, with families comprising 3+ earners (157) having the highest median family income of $103,350, while families with no earners (204) have the lowest median family income of $35,700, accounting for 8.1% and 10.6% of families, respectively.
| Number of Earners | # Families | Median Income |
| No Earners | 204 (10.6%) | $35,700 |
| 1 Earner | 539 (27.9%) | $54,698 |
| 2 Earners | 1,031 (53.4%) | $79,835 |
| 3+ Earners | 157 (8.1%) | $103,350 |
| Total | 1,931 (100.0%) | $72,062 |
Household Income in Kit Carson County
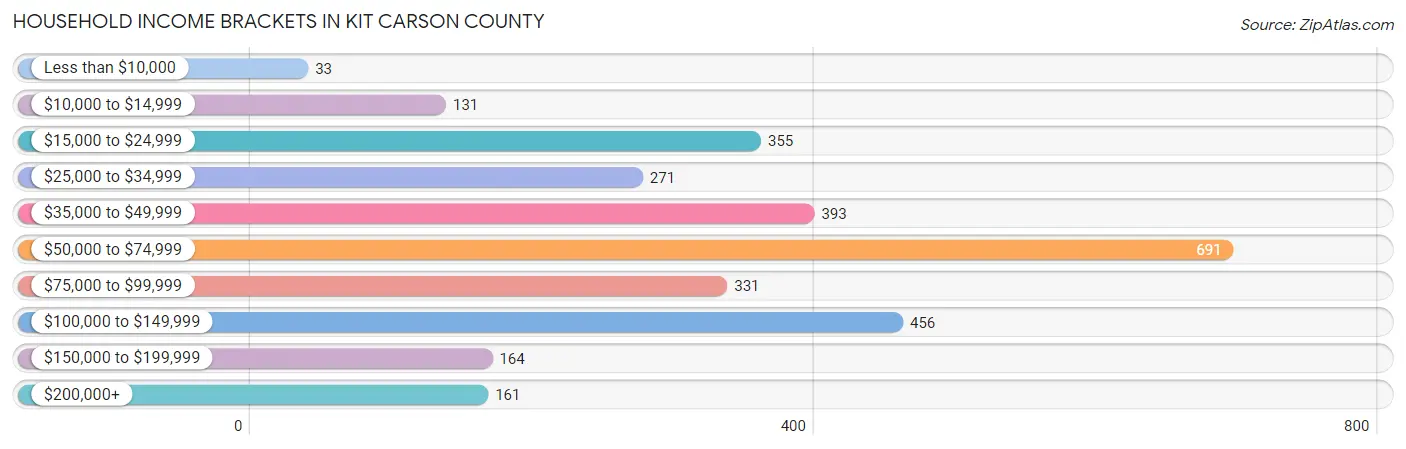
Household Income Brackets in Kit Carson County
With 691 households falling in the category, the $50,000 to $74,999 income range is the most frequent in Kit Carson County, accounting for 23.2% of all households. In contrast, only 33 households (1.1%) fall into the less than $10,000 income bracket, making it the least populous group.
| Income Bracket | # Households | % Households |
| Less than $10,000 | 33 | 1.1% |
| $10,000 to $14,999 | 131 | 4.4% |
| $15,000 to $24,999 | 355 | 11.9% |
| $25,000 to $34,999 | 271 | 9.1% |
| $35,000 to $49,999 | 393 | 13.2% |
| $50,000 to $74,999 | 691 | 23.2% |
| $75,000 to $99,999 | 331 | 11.1% |
| $100,000 to $149,999 | 456 | 15.3% |
| $150,000 to $199,999 | 164 | 5.5% |
| $200,000+ | 161 | 5.4% |
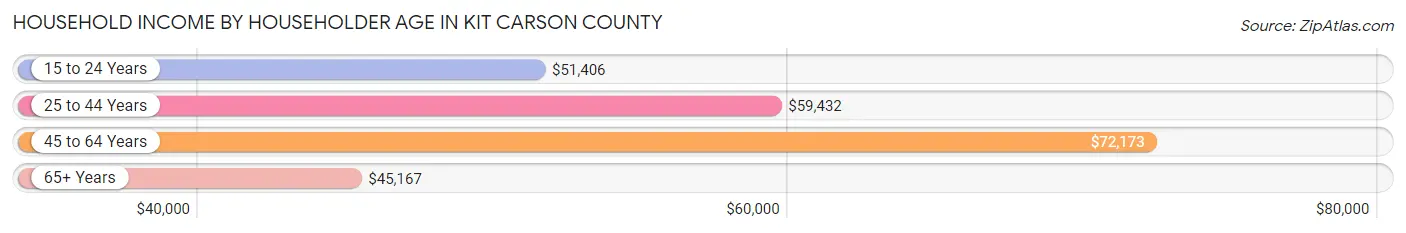
Household Income by Householder Age in Kit Carson County
The median household income in Kit Carson County is $58,992, with the highest median household income of $72,173 found in the 45 to 64 years age bracket for the primary householder. A total of 989 households (33.2%) fall into this category. Meanwhile, the 65+ years age bracket for the primary householder has the lowest median household income of $45,167, with 812 households (27.3%) in this group.
| Income Bracket | # Households | Median Income |
| 15 to 24 Years | 161 (5.4%) | $51,406 |
| 25 to 44 Years | 1,017 (34.1%) | $59,432 |
| 45 to 64 Years | 989 (33.2%) | $72,173 |
| 65+ Years | 812 (27.3%) | $45,167 |
| Total | 2,979 (100.0%) | $58,992 |
Poverty in Kit Carson County
Income Below Poverty by Sex and Age in Kit Carson County
With 9.1% poverty level for males and 9.7% for females among the residents of Kit Carson County, 16 and 17 year old males and 5 year old females are the most vulnerable to poverty, with 40 males (72.7%) and 23 females (26.1%) in their respective age groups living below the poverty level.

| Age Bracket | Male | Female |
| Under 5 Years | 34 (12.2%) | 0 (0.0%) |
| 5 Years | 2 (4.3%) | 23 (26.1%) |
| 6 to 11 Years | 32 (8.0%) | 32 (10.0%) |
| 12 to 14 Years | 7 (8.1%) | 10 (7.1%) |
| 15 Years | 10 (19.2%) | 3 (5.3%) |
| 16 and 17 Years | 40 (72.7%) | 6 (5.8%) |
| 18 to 24 Years | 6 (2.8%) | 26 (12.1%) |
| 25 to 34 Years | 49 (10.9%) | 41 (10.2%) |
| 35 to 44 Years | 14 (3.0%) | 71 (15.3%) |
| 45 to 54 Years | 37 (12.7%) | 37 (10.7%) |
| 55 to 64 Years | 25 (5.7%) | 29 (5.6%) |
| 65 to 74 Years | 34 (7.9%) | 13 (3.8%) |
| 75 Years and over | 23 (8.9%) | 48 (14.8%) |
| Total | 313 (9.1%) | 339 (9.7%) |
Income Above Poverty by Sex and Age in Kit Carson County
According to the poverty statistics in Kit Carson County, males aged 18 to 24 years and females aged under 5 years are the age groups that are most secure financially, with 97.2% of males and 100.0% of females in these age groups living above the poverty line.
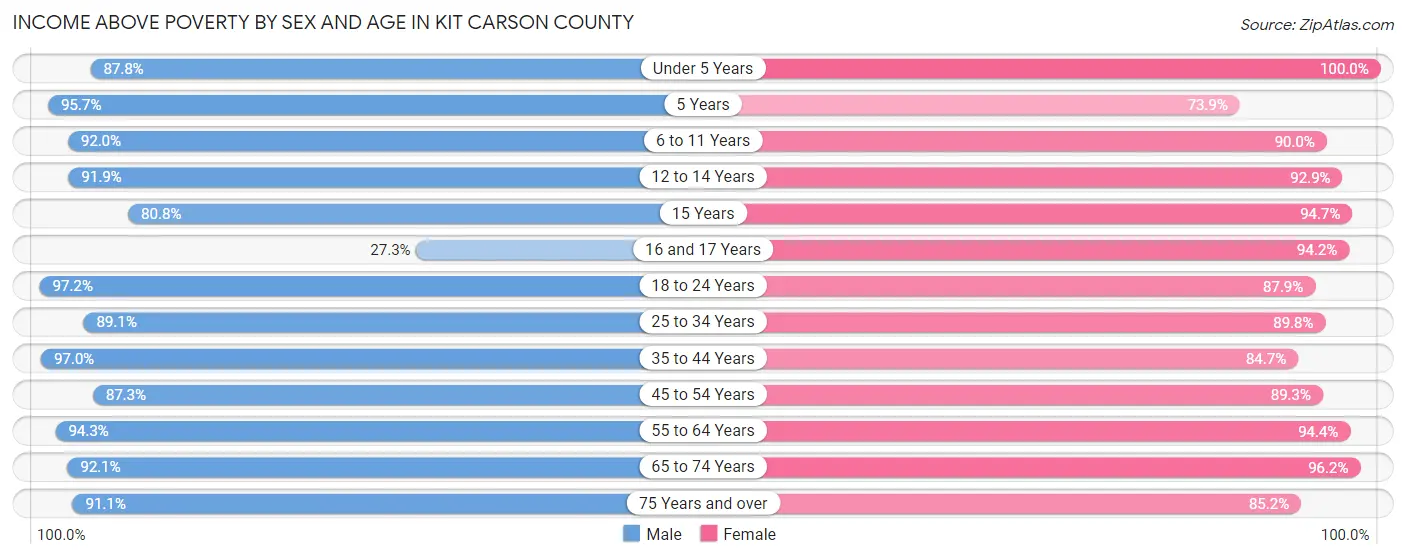
| Age Bracket | Male | Female |
| Under 5 Years | 244 (87.8%) | 180 (100.0%) |
| 5 Years | 44 (95.7%) | 65 (73.9%) |
| 6 to 11 Years | 366 (92.0%) | 288 (90.0%) |
| 12 to 14 Years | 79 (91.9%) | 131 (92.9%) |
| 15 Years | 42 (80.8%) | 54 (94.7%) |
| 16 and 17 Years | 15 (27.3%) | 97 (94.2%) |
| 18 to 24 Years | 210 (97.2%) | 188 (87.8%) |
| 25 to 34 Years | 399 (89.1%) | 359 (89.7%) |
| 35 to 44 Years | 446 (97.0%) | 392 (84.7%) |
| 45 to 54 Years | 255 (87.3%) | 308 (89.3%) |
| 55 to 64 Years | 411 (94.3%) | 485 (94.4%) |
| 65 to 74 Years | 395 (92.1%) | 331 (96.2%) |
| 75 Years and over | 235 (91.1%) | 277 (85.2%) |
| Total | 3,141 (90.9%) | 3,155 (90.3%) |
Income Below Poverty Among Married-Couple Families in Kit Carson County
The poverty statistics for married-couple families in Kit Carson County show that 6.1% or 93 of the total 1,516 families live below the poverty line. Families with 3 or 4 children have the highest poverty rate of 7.9%, comprising of 10 families. On the other hand, families with 5 or more children have the lowest poverty rate of 0.0%, which includes 0 families.
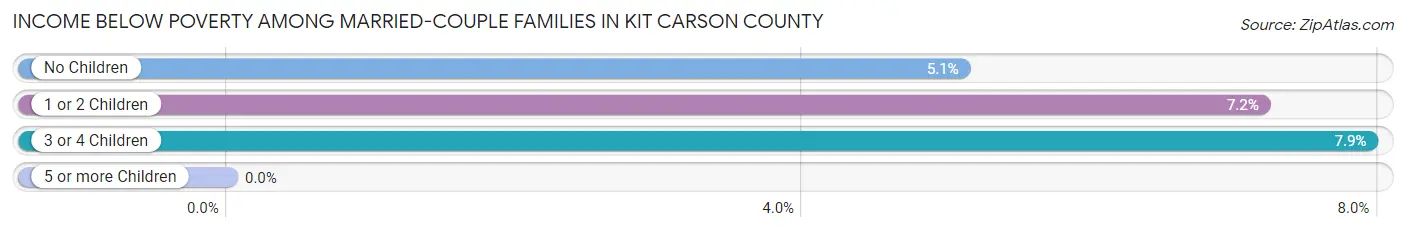
| Children | Above Poverty | Below Poverty |
| No Children | 763 (94.9%) | 41 (5.1%) |
| 1 or 2 Children | 542 (92.8%) | 42 (7.2%) |
| 3 or 4 Children | 116 (92.1%) | 10 (7.9%) |
| 5 or more Children | 2 (100.0%) | 0 (0.0%) |
| Total | 1,423 (93.9%) | 93 (6.1%) |
Income Below Poverty Among Single-Parent Households in Kit Carson County
According to the poverty data in Kit Carson County, 12.1% or 18 single-father households and 9.0% or 24 single-mother households are living below the poverty line. Among single-father households, those with 1 or 2 children have the highest poverty rate, with 13 households (16.1%) experiencing poverty. Likewise, among single-mother households, those with 1 or 2 children have the highest poverty rate, with 21 households (12.6%) falling below the poverty line.
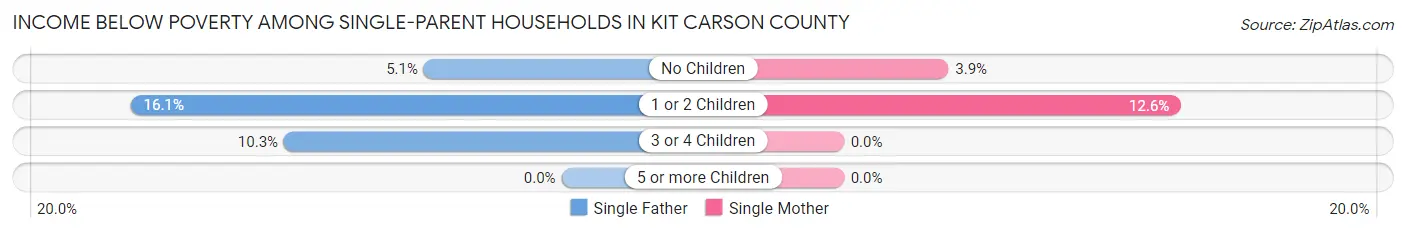
| Children | Single Father | Single Mother |
| No Children | 2 (5.1%) | 3 (3.9%) |
| 1 or 2 Children | 13 (16.1%) | 21 (12.6%) |
| 3 or 4 Children | 3 (10.3%) | 0 (0.0%) |
| 5 or more Children | 0 (0.0%) | 0 (0.0%) |
| Total | 18 (12.1%) | 24 (9.0%) |
Income Below Poverty Among Married-Couple vs Single-Parent Households in Kit Carson County
The poverty data for Kit Carson County shows that 93 of the married-couple family households (6.1%) and 42 of the single-parent households (10.1%) are living below the poverty level. Within the married-couple family households, those with 3 or 4 children have the highest poverty rate, with 10 households (7.9%) falling below the poverty line. Among the single-parent households, those with 1 or 2 children have the highest poverty rate, with 34 household (13.7%) living below poverty.
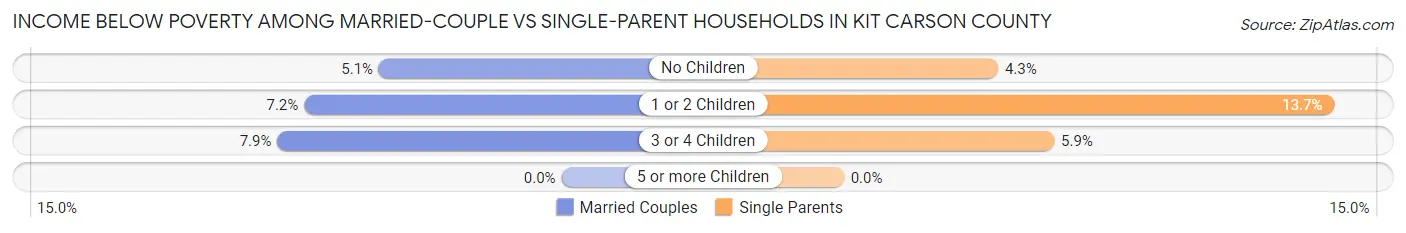
| Children | Married-Couple Families | Single-Parent Households |
| No Children | 41 (5.1%) | 5 (4.3%) |
| 1 or 2 Children | 42 (7.2%) | 34 (13.7%) |
| 3 or 4 Children | 10 (7.9%) | 3 (5.9%) |
| 5 or more Children | 0 (0.0%) | 0 (0.0%) |
| Total | 93 (6.1%) | 42 (10.1%) |
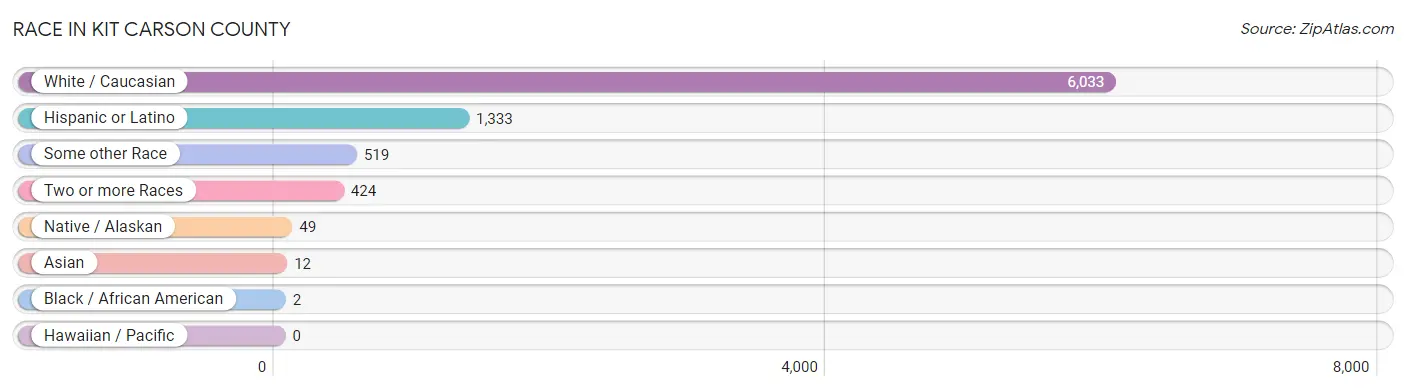
Race in Kit Carson County
The most populous races in Kit Carson County are White / Caucasian (6,033 | 85.7%), Hispanic or Latino (1,333 | 18.9%), and Some other Race (519 | 7.4%).
| Race | # Population | % Population |
| Asian | 12 | 0.2% |
| Black / African American | 2 | 0.0% |
| Hawaiian / Pacific | 0 | 0.0% |
| Hispanic or Latino | 1,333 | 18.9% |
| Native / Alaskan | 49 | 0.7% |
| White / Caucasian | 6,033 | 85.7% |
| Two or more Races | 424 | 6.0% |
| Some other Race | 519 | 7.4% |
| Total | 7,039 | 100.0% |
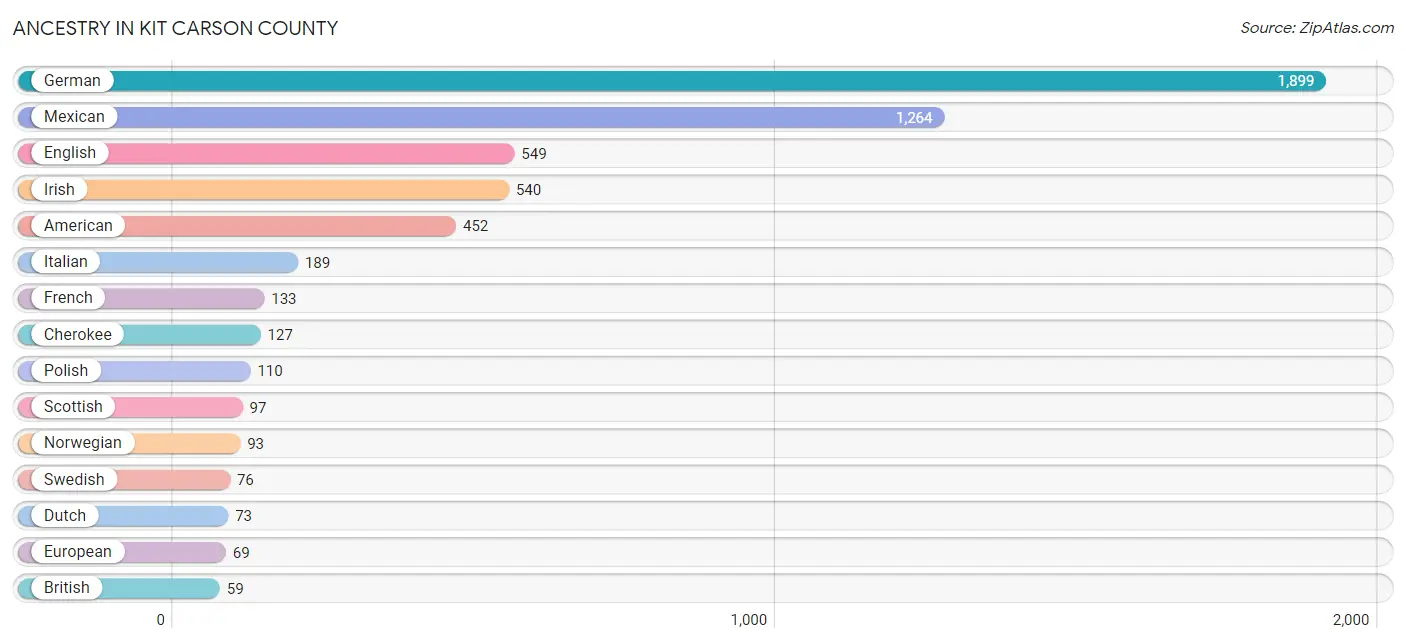
Ancestry in Kit Carson County
The most populous ancestries reported in Kit Carson County are German (1,899 | 27.0%), Mexican (1,264 | 18.0%), English (549 | 7.8%), Irish (540 | 7.7%), and American (452 | 6.4%), together accounting for 66.8% of all Kit Carson County residents.
| Ancestry | # Population | % Population |
| American | 452 | 6.4% |
| Australian | 6 | 0.1% |
| Austrian | 4 | 0.1% |
| Belgian | 3 | 0.0% |
| Bhutanese | 25 | 0.4% |
| British | 59 | 0.8% |
| Burmese | 22 | 0.3% |
| Canadian | 10 | 0.1% |
| Cherokee | 127 | 1.8% |
| Chippewa | 10 | 0.1% |
| Cuban | 4 | 0.1% |
| Czech | 50 | 0.7% |
| Danish | 43 | 0.6% |
| Delaware | 3 | 0.0% |
| Dutch | 73 | 1.0% |
| English | 549 | 7.8% |
| Ethiopian | 4 | 0.1% |
| European | 69 | 1.0% |
| French | 133 | 1.9% |
| French Canadian | 3 | 0.0% |
| German | 1,899 | 27.0% |
| Greek | 38 | 0.5% |
| Hungarian | 26 | 0.4% |
| Indian (Asian) | 4 | 0.1% |
| Irish | 540 | 7.7% |
| Italian | 189 | 2.7% |
| Korean | 44 | 0.6% |
| Laotian | 4 | 0.1% |
| Mexican | 1,264 | 18.0% |
| Mexican American Indian | 9 | 0.1% |
| Navajo | 1 | 0.0% |
| Norwegian | 93 | 1.3% |
| Osage | 16 | 0.2% |
| Pennsylvania German | 26 | 0.4% |
| Peruvian | 9 | 0.1% |
| Polish | 110 | 1.6% |
| Puerto Rican | 10 | 0.1% |
| Romanian | 7 | 0.1% |
| Russian | 50 | 0.7% |
| Scotch-Irish | 54 | 0.8% |
| Scottish | 97 | 1.4% |
| Sierra Leonean | 2 | 0.0% |
| Sioux | 10 | 0.1% |
| Slovene | 5 | 0.1% |
| South American | 9 | 0.1% |
| Spanish | 29 | 0.4% |
| Spanish American | 9 | 0.1% |
| Subsaharan African | 6 | 0.1% |
| Swedish | 76 | 1.1% |
| Swiss | 9 | 0.1% |
| Tohono O'Odham | 2 | 0.0% |
| Welsh | 49 | 0.7% |
| Yugoslavian | 2 | 0.0% | View All 53 Rows |
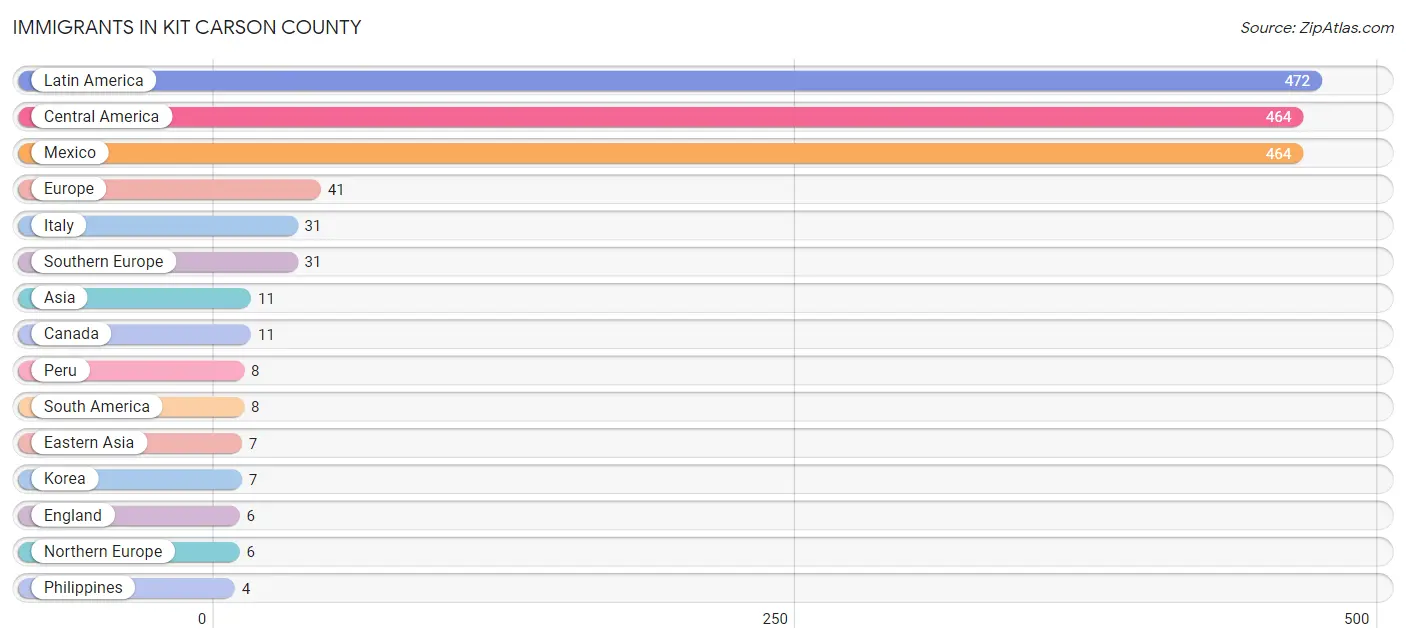
Immigrants in Kit Carson County
The most numerous immigrant groups reported in Kit Carson County came from Latin America (472 | 6.7%), Central America (464 | 6.6%), Mexico (464 | 6.6%), Europe (41 | 0.6%), and Italy (31 | 0.4%), together accounting for 20.9% of all Kit Carson County residents.
| Immigration Origin | # Population | % Population |
| Africa | 2 | 0.0% |
| Asia | 11 | 0.2% |
| Canada | 11 | 0.2% |
| Central America | 464 | 6.6% |
| Eastern Asia | 7 | 0.1% |
| England | 6 | 0.1% |
| Europe | 41 | 0.6% |
| France | 2 | 0.0% |
| Germany | 2 | 0.0% |
| Italy | 31 | 0.4% |
| Korea | 7 | 0.1% |
| Latin America | 472 | 6.7% |
| Mexico | 464 | 6.6% |
| Northern Europe | 6 | 0.1% |
| Peru | 8 | 0.1% |
| Philippines | 4 | 0.1% |
| Sierra Leone | 2 | 0.0% |
| South America | 8 | 0.1% |
| South Eastern Asia | 4 | 0.1% |
| Southern Europe | 31 | 0.4% |
| Western Africa | 2 | 0.0% |
| Western Europe | 4 | 0.1% | View All 22 Rows |
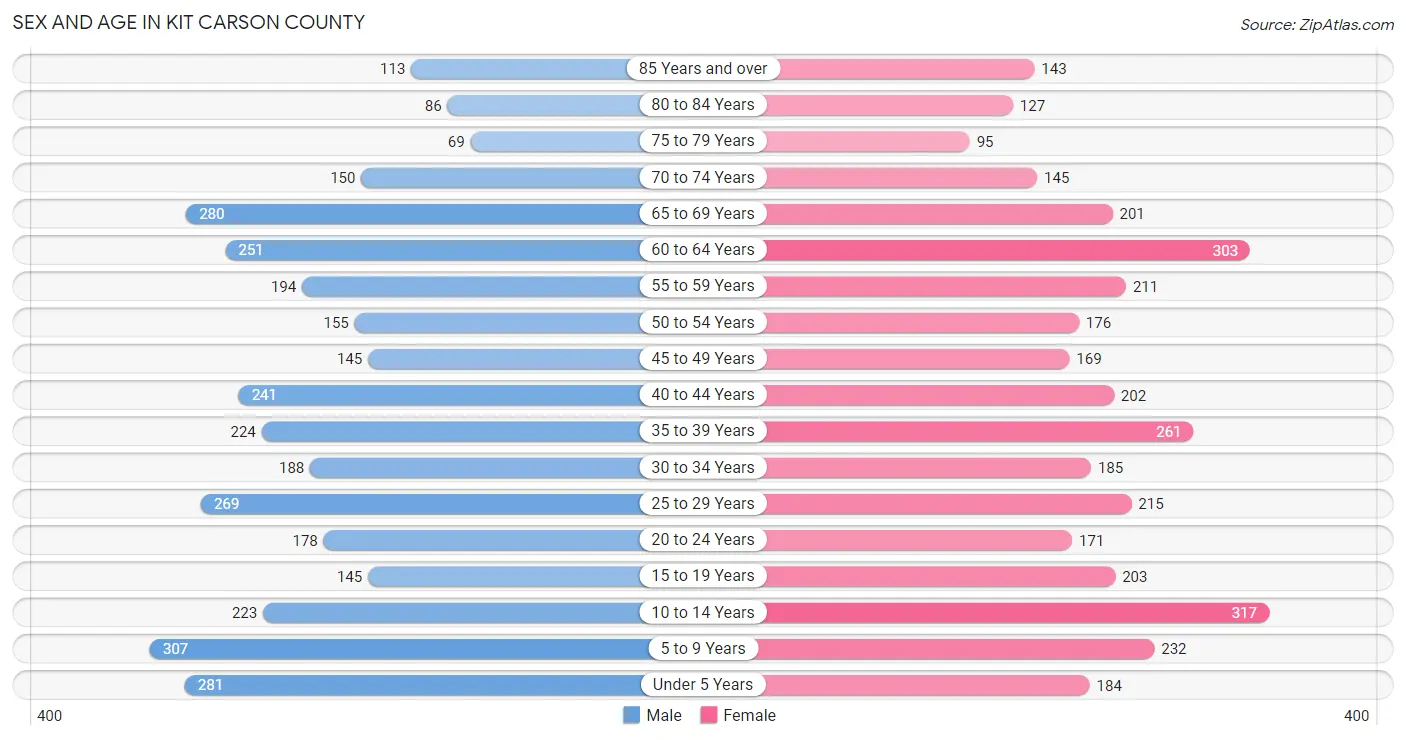
Sex and Age in Kit Carson County
Sex and Age in Kit Carson County
The most populous age groups in Kit Carson County are 5 to 9 Years (307 | 8.8%) for men and 10 to 14 Years (317 | 8.9%) for women.
| Age Bracket | Male | Female |
| Under 5 Years | 281 (8.0%) | 184 (5.2%) |
| 5 to 9 Years | 307 (8.8%) | 232 (6.6%) |
| 10 to 14 Years | 223 (6.4%) | 317 (8.9%) |
| 15 to 19 Years | 145 (4.1%) | 203 (5.7%) |
| 20 to 24 Years | 178 (5.1%) | 171 (4.8%) |
| 25 to 29 Years | 269 (7.7%) | 215 (6.1%) |
| 30 to 34 Years | 188 (5.4%) | 185 (5.2%) |
| 35 to 39 Years | 224 (6.4%) | 261 (7.4%) |
| 40 to 44 Years | 241 (6.9%) | 202 (5.7%) |
| 45 to 49 Years | 145 (4.1%) | 169 (4.8%) |
| 50 to 54 Years | 155 (4.4%) | 176 (5.0%) |
| 55 to 59 Years | 194 (5.5%) | 211 (6.0%) |
| 60 to 64 Years | 251 (7.2%) | 303 (8.6%) |
| 65 to 69 Years | 280 (8.0%) | 201 (5.7%) |
| 70 to 74 Years | 150 (4.3%) | 145 (4.1%) |
| 75 to 79 Years | 69 (2.0%) | 95 (2.7%) |
| 80 to 84 Years | 86 (2.5%) | 127 (3.6%) |
| 85 Years and over | 113 (3.2%) | 143 (4.0%) |
| Total | 3,499 (100.0%) | 3,540 (100.0%) |
Families and Households in Kit Carson County
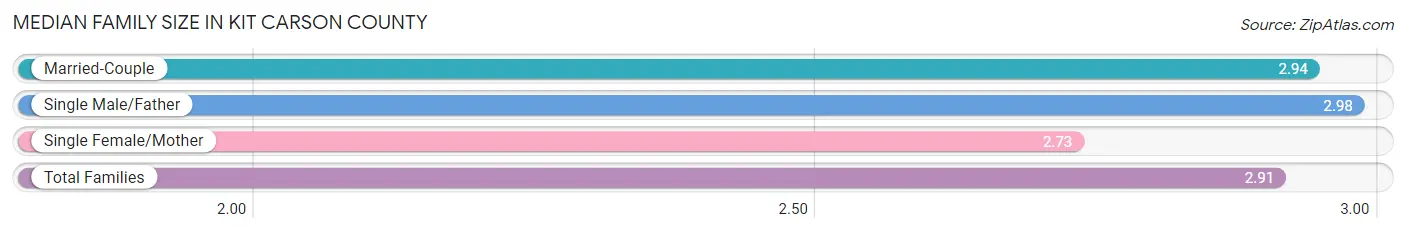
Median Family Size in Kit Carson County
The median family size in Kit Carson County is 2.91 persons per family, with single male/father families (149 | 7.7%) accounting for the largest median family size of 2.98 persons per family. On the other hand, single female/mother families (266 | 13.8%) represent the smallest median family size with 2.73 persons per family.
| Family Type | # Families | Family Size |
| Married-Couple | 1,516 (78.5%) | 2.94 |
| Single Male/Father | 149 (7.7%) | 2.98 |
| Single Female/Mother | 266 (13.8%) | 2.73 |
| Total Families | 1,931 (100.0%) | 2.91 |
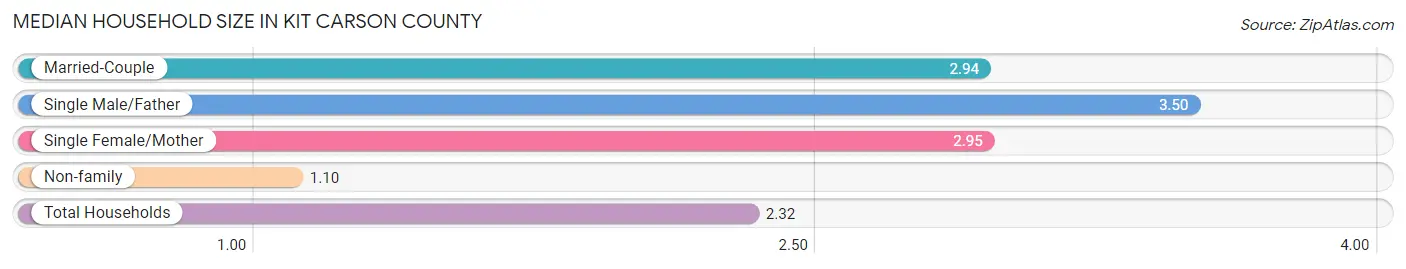
Median Household Size in Kit Carson County
The median household size in Kit Carson County is 2.32 persons per household, with single male/father households (149 | 5.0%) accounting for the largest median household size of 3.5 persons per household. non-family households (1,048 | 35.2%) represent the smallest median household size with 1.10 persons per household.
| Household Type | # Households | Household Size |
| Married-Couple | 1,516 (50.9%) | 2.94 |
| Single Male/Father | 149 (5.0%) | 3.50 |
| Single Female/Mother | 266 (8.9%) | 2.95 |
| Non-family | 1,048 (35.2%) | 1.10 |
| Total Households | 2,979 (100.0%) | 2.32 |
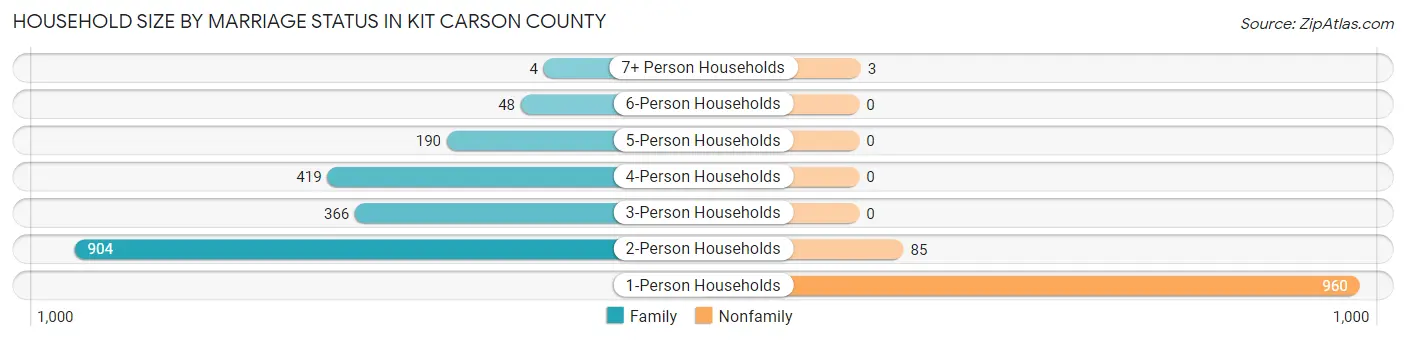
Household Size by Marriage Status in Kit Carson County
Out of a total of 2,979 households in Kit Carson County, 1,931 (64.8%) are family households, while 1,048 (35.2%) are nonfamily households. The most numerous type of family households are 2-person households, comprising 904, and the most common type of nonfamily households are 1-person households, comprising 960.
| Household Size | Family Households | Nonfamily Households |
| 1-Person Households | - | 960 (32.2%) |
| 2-Person Households | 904 (30.3%) | 85 (2.9%) |
| 3-Person Households | 366 (12.3%) | 0 (0.0%) |
| 4-Person Households | 419 (14.1%) | 0 (0.0%) |
| 5-Person Households | 190 (6.4%) | 0 (0.0%) |
| 6-Person Households | 48 (1.6%) | 0 (0.0%) |
| 7+ Person Households | 4 (0.1%) | 3 (0.1%) |
| Total | 1,931 (64.8%) | 1,048 (35.2%) |
Female Fertility in Kit Carson County
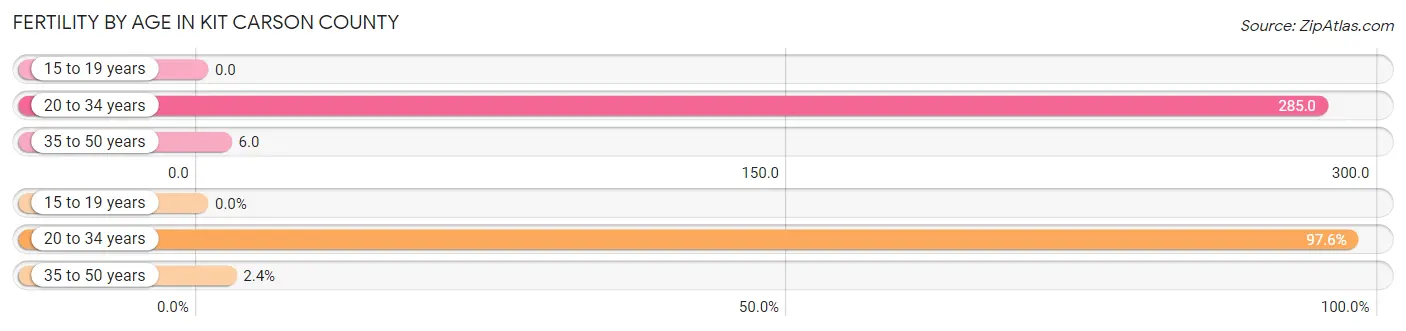
Fertility by Age in Kit Carson County
Average fertility rate in Kit Carson County is 118.0 births per 1,000 women. Women in the age bracket of 20 to 34 years have the highest fertility rate with 285.0 births per 1,000 women. Women in the age bracket of 20 to 34 years acount for 97.6% of all women with births.
| Age Bracket | Women with Births | Births / 1,000 Women |
| 15 to 19 years | 0 (0.0%) | 0.0 |
| 20 to 34 years | 163 (97.6%) | 285.0 |
| 35 to 50 years | 4 (2.4%) | 6.0 |
| Total | 167 (100.0%) | 118.0 |
Fertility by Age by Marriage Status in Kit Carson County
86.8% of women with births (167) in Kit Carson County are married. The highest percentage of unmarried women with births falls into 20 to 34 years age bracket with 13.5% of them unmarried at the time of birth, while the lowest percentage of unmarried women with births belong to 35 to 50 years age bracket with 0.0% of them unmarried.
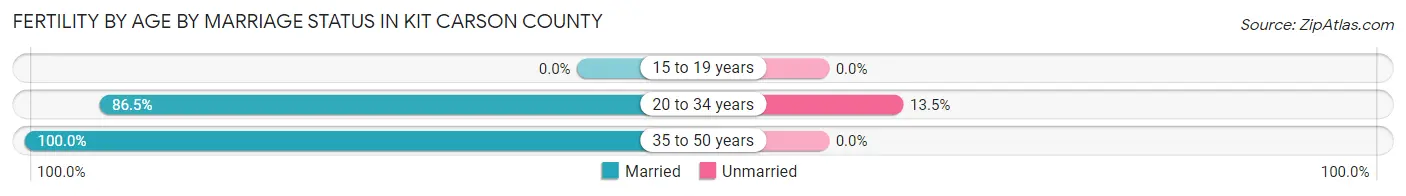
| Age Bracket | Married | Unmarried |
| 15 to 19 years | 0 (0.0%) | 0 (0.0%) |
| 20 to 34 years | 141 (86.5%) | 22 (13.5%) |
| 35 to 50 years | 4 (100.0%) | 0 (0.0%) |
| Total | 145 (86.8%) | 22 (13.2%) |
Fertility by Education in Kit Carson County
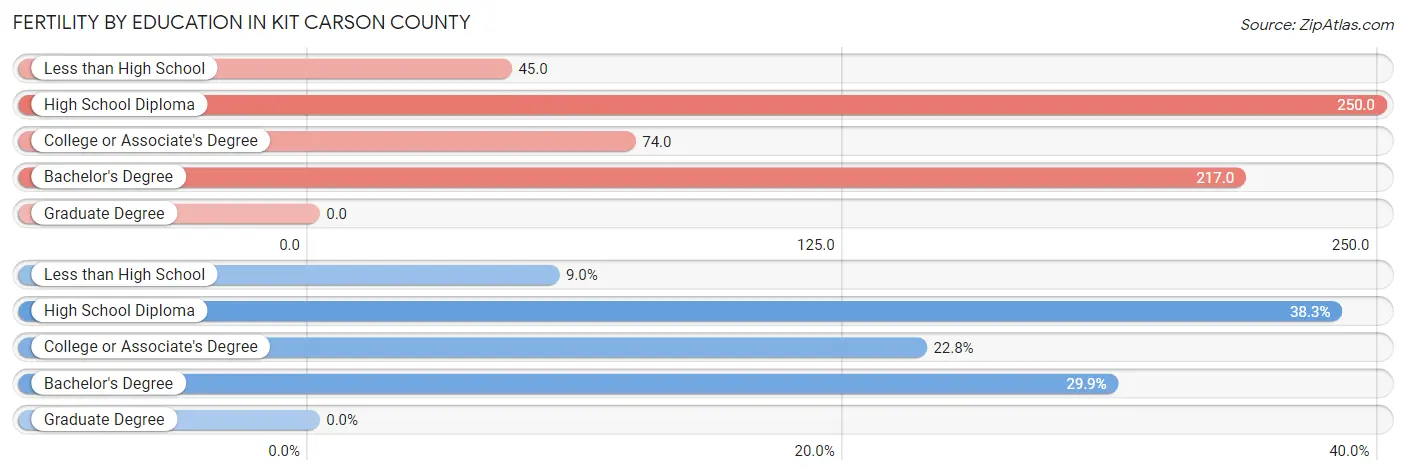
| Educational Attainment | Women with Births | Births / 1,000 Women |
| Less than High School | 15 (9.0%) | 45.0 |
| High School Diploma | 64 (38.3%) | 250.0 |
| College or Associate's Degree | 38 (22.8%) | 74.0 |
| Bachelor's Degree | 50 (29.9%) | 217.0 |
| Graduate Degree | 0 (0.0%) | 0.0 |
| Total | 167 (100.0%) | 118.0 |
Fertility by Education by Marriage Status in Kit Carson County
13.2% of women with births in Kit Carson County are unmarried. Women with the educational attainment of bachelor's degree are most likely to be married with 100.0% of them married at childbirth, while women with the educational attainment of less than high school are least likely to be married with 26.7% of them unmarried at childbirth.
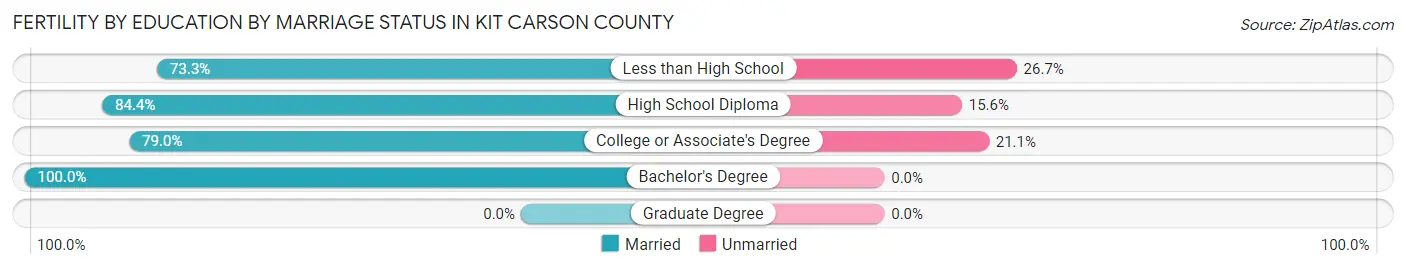
| Educational Attainment | Married | Unmarried |
| Less than High School | 11 (73.3%) | 4 (26.7%) |
| High School Diploma | 54 (84.4%) | 10 (15.6%) |
| College or Associate's Degree | 30 (78.9%) | 8 (21.0%) |
| Bachelor's Degree | 50 (100.0%) | 0 (0.0%) |
| Graduate Degree | 0 (0.0%) | 0 (0.0%) |
| Total | 145 (86.8%) | 22 (13.2%) |
Employment Characteristics in Kit Carson County
Employment by Class of Employer in Kit Carson County
Among the 3,444 employed individuals in Kit Carson County, private company employees (2,080 | 60.4%), local government employees (469 | 13.6%), and self-employed (not incorporated) (269 | 7.8%) make up the most common classes of employment.
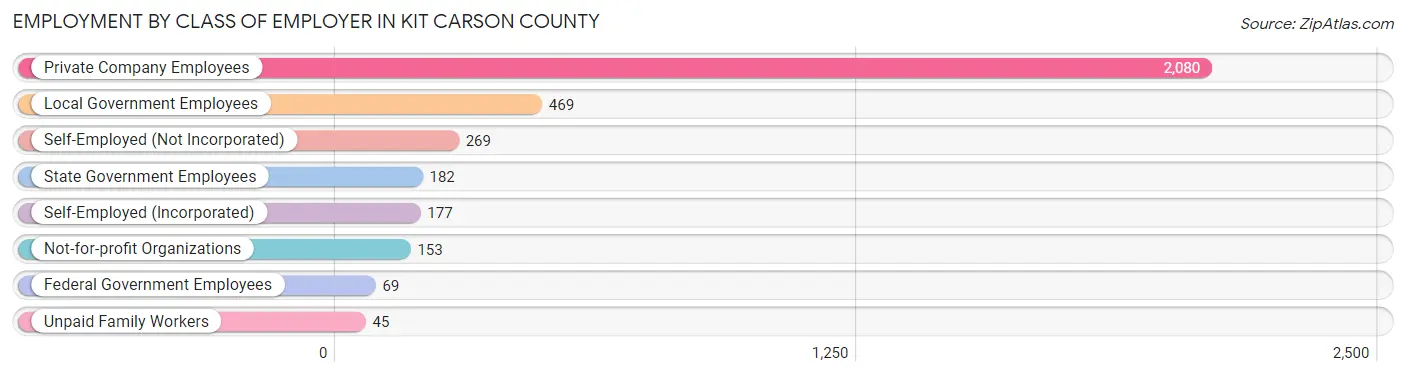
| Employer Class | # Employees | % Employees |
| Private Company Employees | 2,080 | 60.4% |
| Self-Employed (Incorporated) | 177 | 5.1% |
| Self-Employed (Not Incorporated) | 269 | 7.8% |
| Not-for-profit Organizations | 153 | 4.4% |
| Local Government Employees | 469 | 13.6% |
| State Government Employees | 182 | 5.3% |
| Federal Government Employees | 69 | 2.0% |
| Unpaid Family Workers | 45 | 1.3% |
| Total | 3,444 | 100.0% |
Employment Status by Age in Kit Carson County
According to the labor force statistics for Kit Carson County, out of the total population over 16 years of age (5,386), 68.0% or 3,662 individuals are in the labor force, with 2.6% or 95 of them unemployed. The age group with the highest labor force participation rate is 25 to 29 years, with 90.3% or 437 individuals in the labor force. Within the labor force, the 30 to 34 years age range has the highest percentage of unemployed individuals, with 9.9% or 30 of them being unemployed.
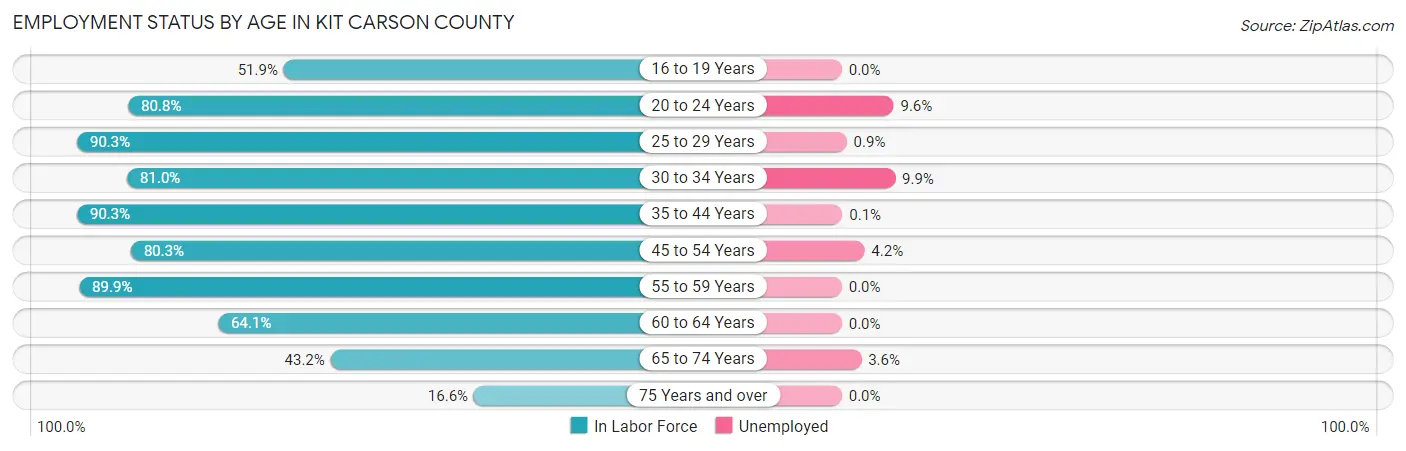
| Age Bracket | In Labor Force | Unemployed |
| 16 to 19 Years | 124 (51.9%) | 0 (0.0%) |
| 20 to 24 Years | 282 (80.8%) | 27 (9.6%) |
| 25 to 29 Years | 437 (90.3%) | 4 (0.9%) |
| 30 to 34 Years | 302 (81.0%) | 30 (9.9%) |
| 35 to 44 Years | 838 (90.3%) | 1 (0.1%) |
| 45 to 54 Years | 518 (80.3%) | 22 (4.2%) |
| 55 to 59 Years | 364 (89.9%) | 0 (0.0%) |
| 60 to 64 Years | 355 (64.1%) | 0 (0.0%) |
| 65 to 74 Years | 335 (43.2%) | 12 (3.6%) |
| 75 Years and over | 105 (16.6%) | 0 (0.0%) |
| Total | 3,662 (68.0%) | 95 (2.6%) |
Employment Status by Educational Attainment in Kit Carson County
According to labor force statistics for Kit Carson County, 83.0% of individuals (2,813) out of the total population between 25 and 64 years of age (3,389) are in the labor force, with 2.0% or 56 of them being unemployed. The group with the highest labor force participation rate are those with the educational attainment of bachelor's degree or higher, with 91.1% or 571 individuals in the labor force. Within the labor force, individuals with less than high school education have the highest percentage of unemployment, with 6.0% or 17 of them being unemployed.
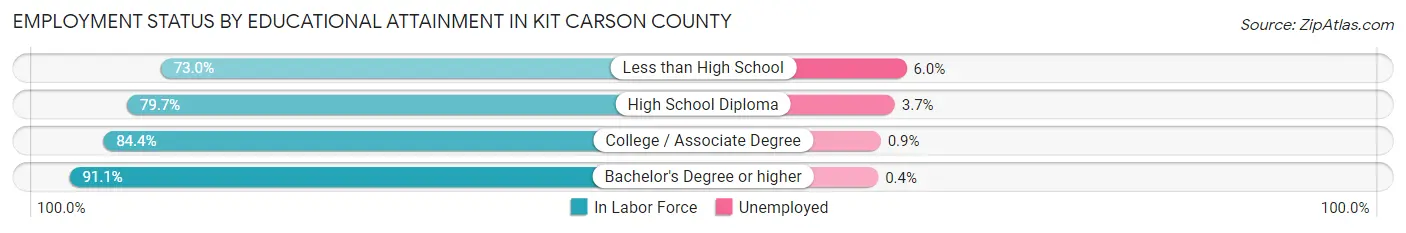
| Educational Attainment | In Labor Force | Unemployed |
| Less than High School | 284 (73.0%) | 23 (6.0%) |
| High School Diploma | 734 (79.7%) | 34 (3.7%) |
| College / Associate Degree | 1,225 (84.4%) | 13 (0.9%) |
| Bachelor's Degree or higher | 571 (91.1%) | 3 (0.4%) |
| Total | 2,813 (83.0%) | 68 (2.0%) |
Employment Occupations by Sex in Kit Carson County
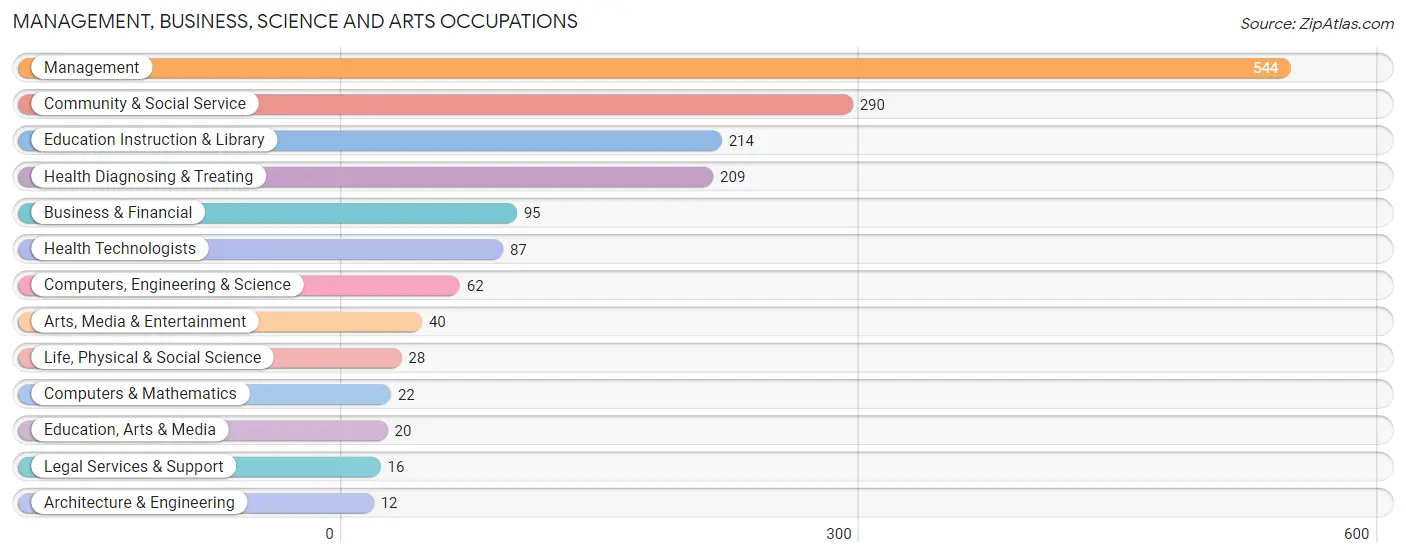
Management, Business, Science and Arts Occupations
The most common Management, Business, Science and Arts occupations in Kit Carson County are Management (544 | 15.3%), Community & Social Service (290 | 8.1%), Education Instruction & Library (214 | 6.0%), Health Diagnosing & Treating (209 | 5.9%), and Business & Financial (95 | 2.7%).
Management, Business, Science and Arts Occupations by Sex
Within the Management, Business, Science and Arts occupations in Kit Carson County, the most male-oriented occupations are Computers & Mathematics (100.0%), Computers, Engineering & Science (85.5%), and Architecture & Engineering (83.3%), while the most female-oriented occupations are Health Diagnosing & Treating (98.1%), Health Technologists (95.4%), and Legal Services & Support (75.0%).
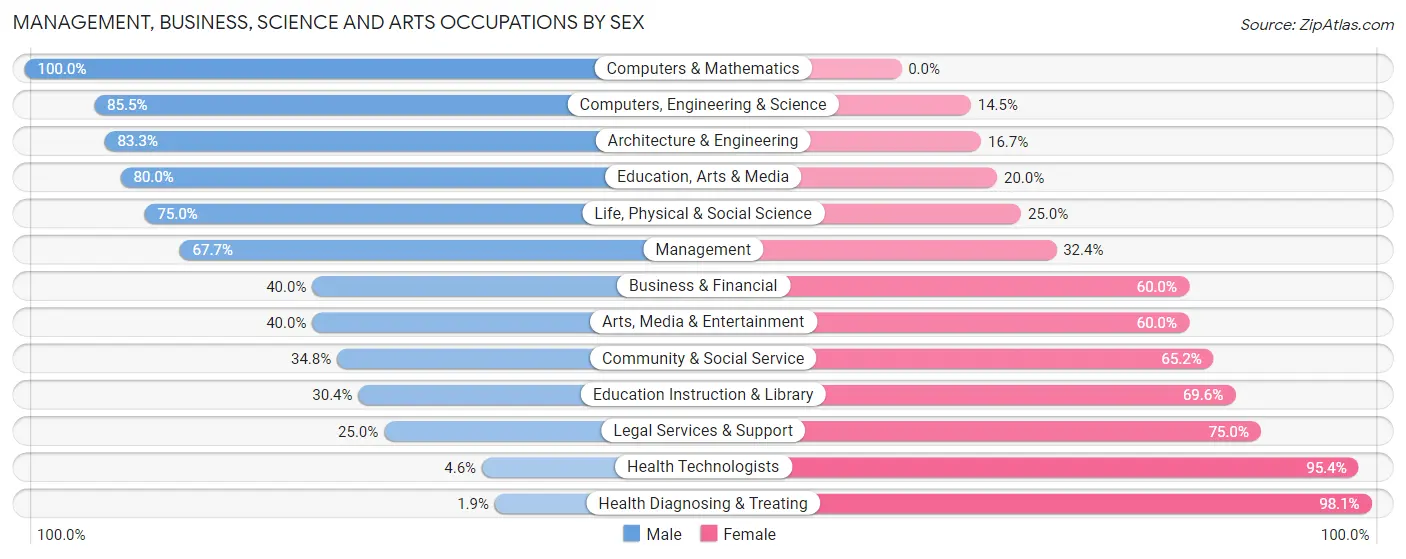
| Occupation | Male | Female |
| Management | 368 (67.6%) | 176 (32.4%) |
| Business & Financial | 38 (40.0%) | 57 (60.0%) |
| Computers, Engineering & Science | 53 (85.5%) | 9 (14.5%) |
| Computers & Mathematics | 22 (100.0%) | 0 (0.0%) |
| Architecture & Engineering | 10 (83.3%) | 2 (16.7%) |
| Life, Physical & Social Science | 21 (75.0%) | 7 (25.0%) |
| Community & Social Service | 101 (34.8%) | 189 (65.2%) |
| Education, Arts & Media | 16 (80.0%) | 4 (20.0%) |
| Legal Services & Support | 4 (25.0%) | 12 (75.0%) |
| Education Instruction & Library | 65 (30.4%) | 149 (69.6%) |
| Arts, Media & Entertainment | 16 (40.0%) | 24 (60.0%) |
| Health Diagnosing & Treating | 4 (1.9%) | 205 (98.1%) |
| Health Technologists | 4 (4.6%) | 83 (95.4%) |
| Total (Category) | 564 (47.0%) | 636 (53.0%) |
| Total (Overall) | 1,970 (55.3%) | 1,594 (44.7%) |
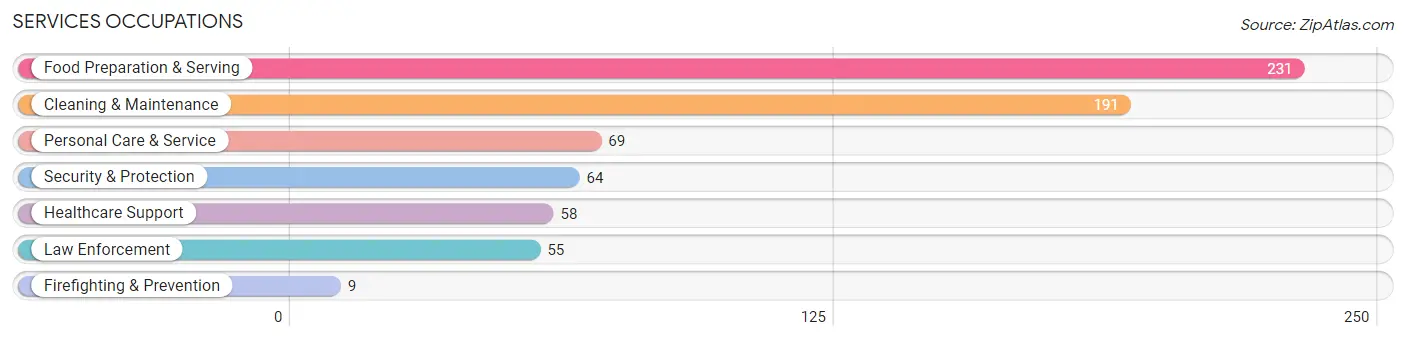
Services Occupations
The most common Services occupations in Kit Carson County are Food Preparation & Serving (231 | 6.5%), Cleaning & Maintenance (191 | 5.4%), Personal Care & Service (69 | 1.9%), Security & Protection (64 | 1.8%), and Healthcare Support (58 | 1.6%).
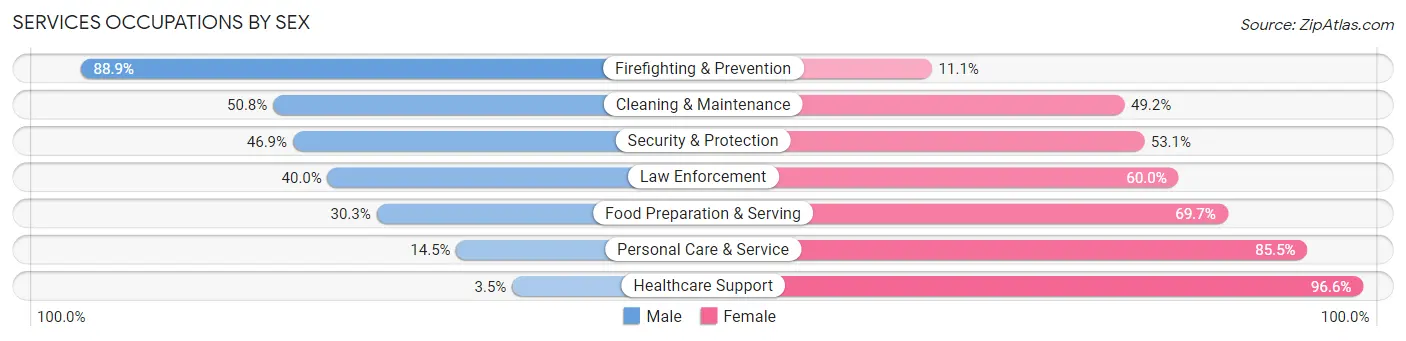
Services Occupations by Sex
Within the Services occupations in Kit Carson County, the most male-oriented occupations are Firefighting & Prevention (88.9%), Cleaning & Maintenance (50.8%), and Security & Protection (46.9%), while the most female-oriented occupations are Healthcare Support (96.6%), Personal Care & Service (85.5%), and Food Preparation & Serving (69.7%).
| Occupation | Male | Female |
| Healthcare Support | 2 (3.5%) | 56 (96.6%) |
| Security & Protection | 30 (46.9%) | 34 (53.1%) |
| Firefighting & Prevention | 8 (88.9%) | 1 (11.1%) |
| Law Enforcement | 22 (40.0%) | 33 (60.0%) |
| Food Preparation & Serving | 70 (30.3%) | 161 (69.7%) |
| Cleaning & Maintenance | 97 (50.8%) | 94 (49.2%) |
| Personal Care & Service | 10 (14.5%) | 59 (85.5%) |
| Total (Category) | 209 (34.1%) | 404 (65.9%) |
| Total (Overall) | 1,970 (55.3%) | 1,594 (44.7%) |
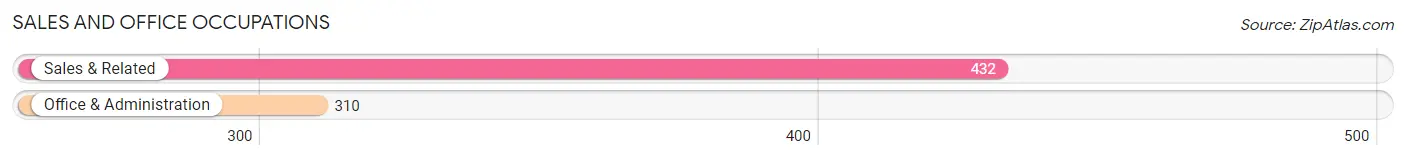
Sales and Office Occupations
The most common Sales and Office occupations in Kit Carson County are Sales & Related (432 | 12.1%), and Office & Administration (310 | 8.7%).
Sales and Office Occupations by Sex
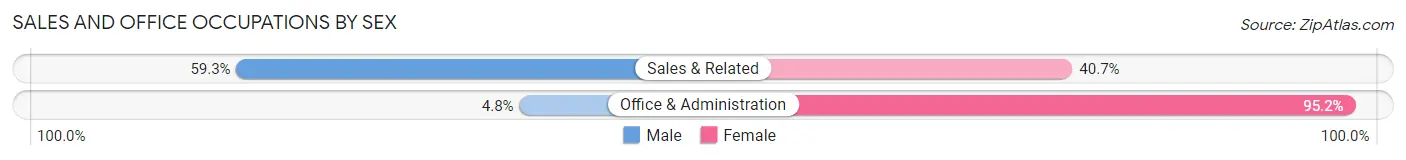
| Occupation | Male | Female |
| Sales & Related | 256 (59.3%) | 176 (40.7%) |
| Office & Administration | 15 (4.8%) | 295 (95.2%) |
| Total (Category) | 271 (36.5%) | 471 (63.5%) |
| Total (Overall) | 1,970 (55.3%) | 1,594 (44.7%) |
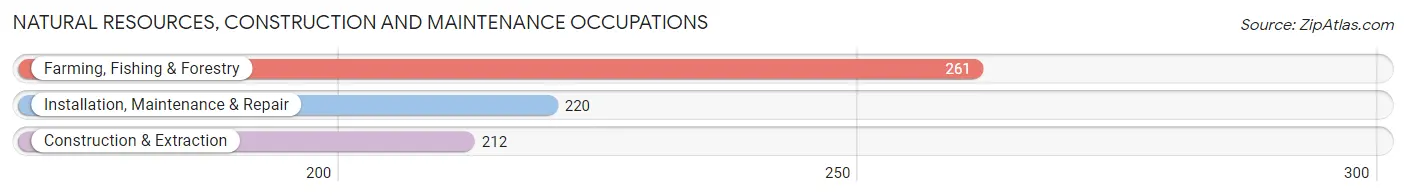
Natural Resources, Construction and Maintenance Occupations
The most common Natural Resources, Construction and Maintenance occupations in Kit Carson County are Farming, Fishing & Forestry (261 | 7.3%), Installation, Maintenance & Repair (220 | 6.2%), and Construction & Extraction (212 | 5.9%).
Natural Resources, Construction and Maintenance Occupations by Sex
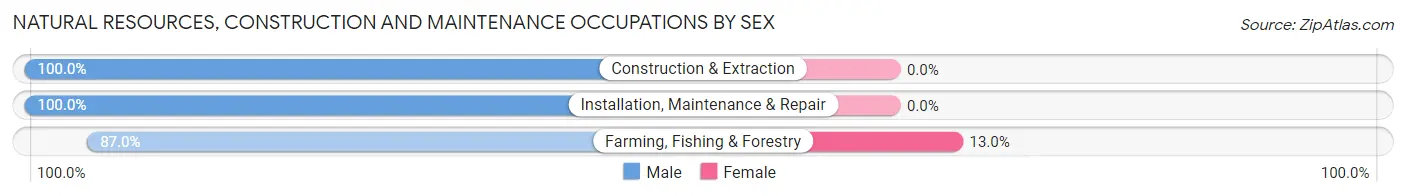
| Occupation | Male | Female |
| Farming, Fishing & Forestry | 227 (87.0%) | 34 (13.0%) |
| Construction & Extraction | 212 (100.0%) | 0 (0.0%) |
| Installation, Maintenance & Repair | 220 (100.0%) | 0 (0.0%) |
| Total (Category) | 659 (95.1%) | 34 (4.9%) |
| Total (Overall) | 1,970 (55.3%) | 1,594 (44.7%) |
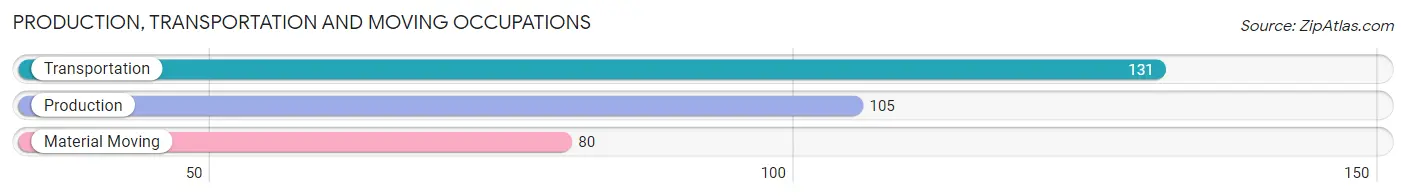
Production, Transportation and Moving Occupations
The most common Production, Transportation and Moving occupations in Kit Carson County are Transportation (131 | 3.7%), Production (105 | 2.9%), and Material Moving (80 | 2.2%).
Production, Transportation and Moving Occupations by Sex
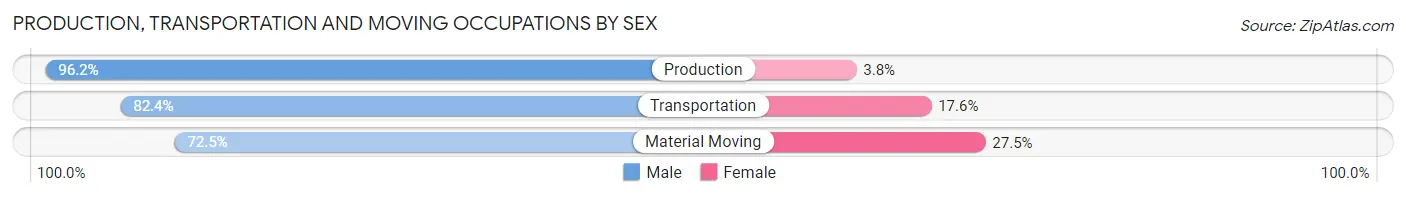
| Occupation | Male | Female |
| Production | 101 (96.2%) | 4 (3.8%) |
| Transportation | 108 (82.4%) | 23 (17.6%) |
| Material Moving | 58 (72.5%) | 22 (27.5%) |
| Total (Category) | 267 (84.5%) | 49 (15.5%) |
| Total (Overall) | 1,970 (55.3%) | 1,594 (44.7%) |
Employment Industries by Sex in Kit Carson County
Employment Industries in Kit Carson County
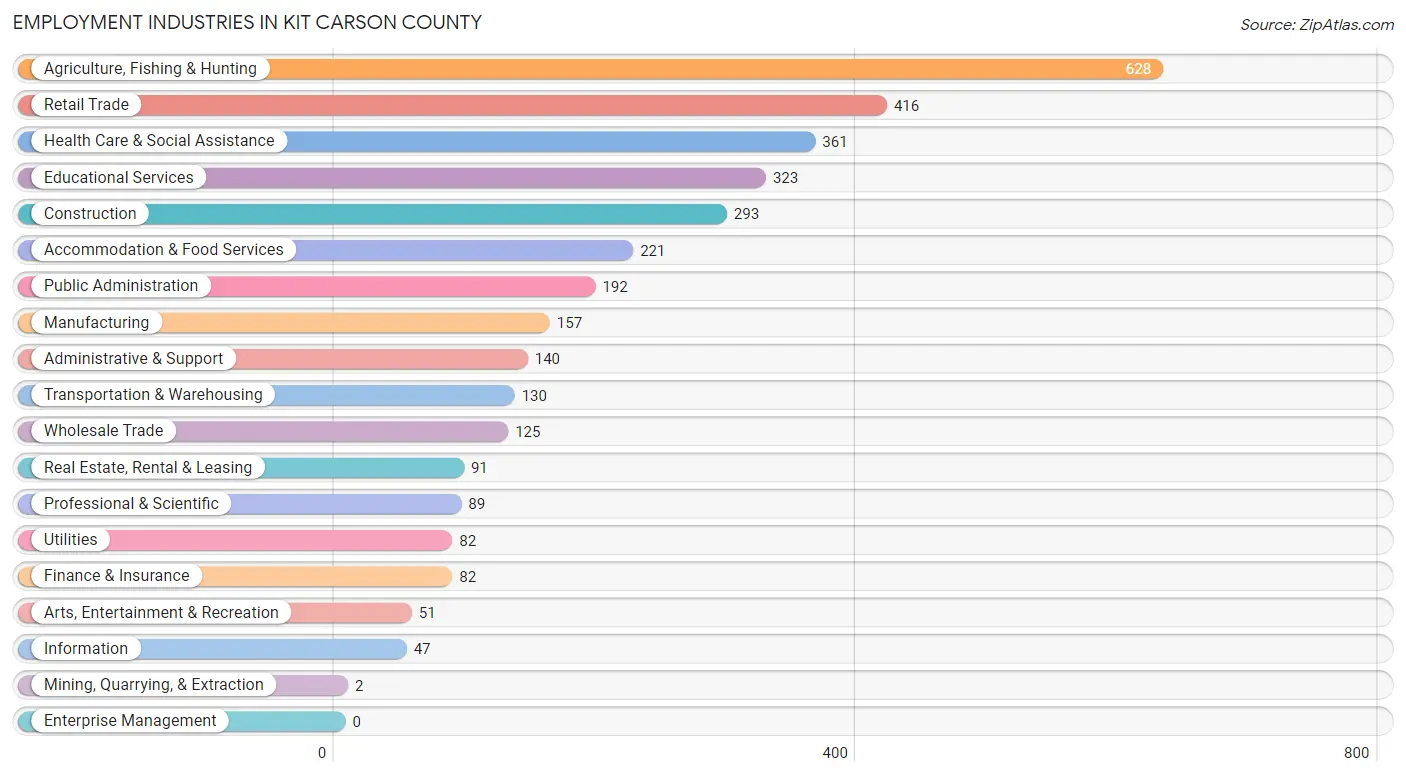
The major employment industries in Kit Carson County include Agriculture, Fishing & Hunting (628 | 17.6%), Retail Trade (416 | 11.7%), Health Care & Social Assistance (361 | 10.1%), Educational Services (323 | 9.1%), and Construction (293 | 8.2%).
Employment Industries by Sex in Kit Carson County
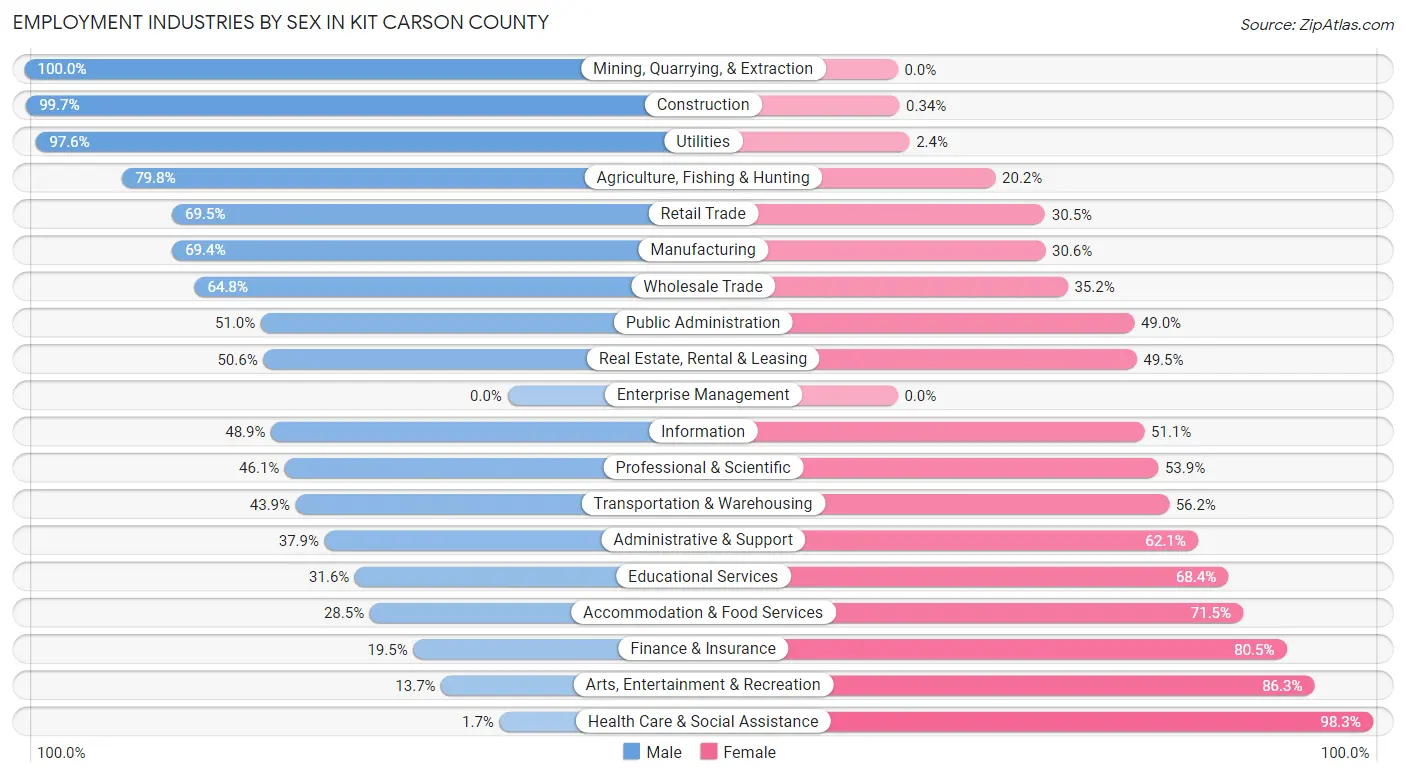
The Kit Carson County industries that see more men than women are Mining, Quarrying, & Extraction (100.0%), Construction (99.7%), and Utilities (97.6%), whereas the industries that tend to have a higher number of women are Health Care & Social Assistance (98.3%), Arts, Entertainment & Recreation (86.3%), and Finance & Insurance (80.5%).
| Industry | Male | Female |
| Agriculture, Fishing & Hunting | 501 (79.8%) | 127 (20.2%) |
| Mining, Quarrying, & Extraction | 2 (100.0%) | 0 (0.0%) |
| Construction | 292 (99.7%) | 1 (0.3%) |
| Manufacturing | 109 (69.4%) | 48 (30.6%) |
| Wholesale Trade | 81 (64.8%) | 44 (35.2%) |
| Retail Trade | 289 (69.5%) | 127 (30.5%) |
| Transportation & Warehousing | 57 (43.9%) | 73 (56.1%) |
| Utilities | 80 (97.6%) | 2 (2.4%) |
| Information | 23 (48.9%) | 24 (51.1%) |
| Finance & Insurance | 16 (19.5%) | 66 (80.5%) |
| Real Estate, Rental & Leasing | 46 (50.5%) | 45 (49.4%) |
| Professional & Scientific | 41 (46.1%) | 48 (53.9%) |
| Enterprise Management | 0 (0.0%) | 0 (0.0%) |
| Administrative & Support | 53 (37.9%) | 87 (62.1%) |
| Educational Services | 102 (31.6%) | 221 (68.4%) |
| Health Care & Social Assistance | 6 (1.7%) | 355 (98.3%) |
| Arts, Entertainment & Recreation | 7 (13.7%) | 44 (86.3%) |
| Accommodation & Food Services | 63 (28.5%) | 158 (71.5%) |
| Public Administration | 98 (51.0%) | 94 (49.0%) |
| Total | 1,970 (55.3%) | 1,594 (44.7%) |
Education in Kit Carson County
School Enrollment in Kit Carson County
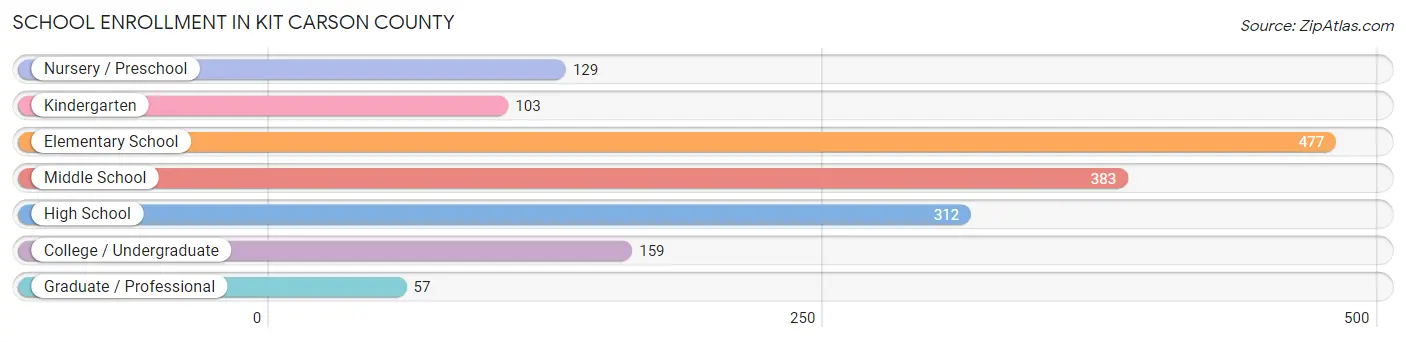
The most common levels of schooling among the 1,620 students in Kit Carson County are elementary school (477 | 29.4%), middle school (383 | 23.6%), and high school (312 | 19.3%).
| School Level | # Students | % Students |
| Nursery / Preschool | 129 | 8.0% |
| Kindergarten | 103 | 6.4% |
| Elementary School | 477 | 29.4% |
| Middle School | 383 | 23.6% |
| High School | 312 | 19.3% |
| College / Undergraduate | 159 | 9.8% |
| Graduate / Professional | 57 | 3.5% |
| Total | 1,620 | 100.0% |
School Enrollment by Age by Funding Source in Kit Carson County
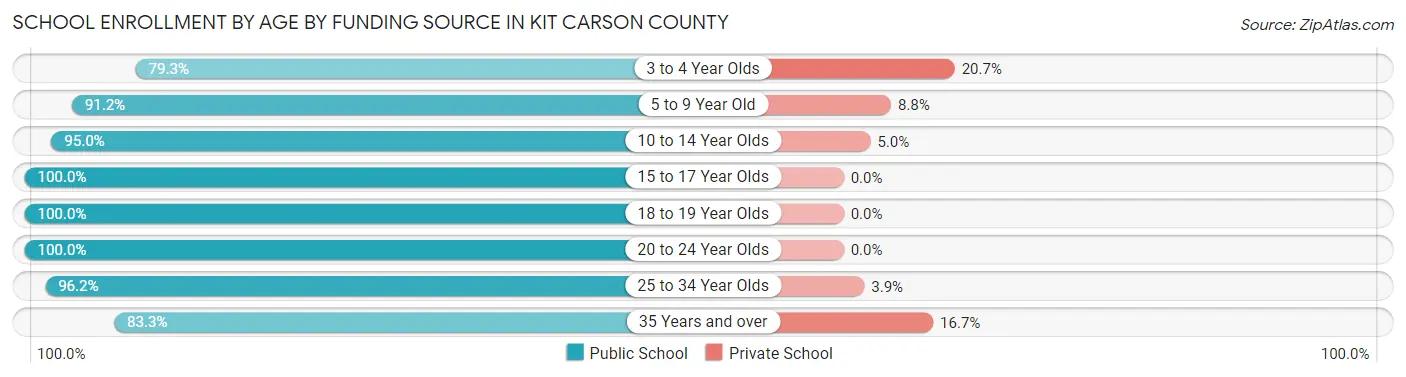
Out of a total of 1,620 students who are enrolled in schools in Kit Carson County, 96 (5.9%) attend a private institution, while the remaining 1,524 (94.1%) are enrolled in public schools. The age group of 3 to 4 year olds has the highest likelihood of being enrolled in private schools, with 6 (20.7% in the age bracket) enrolled. Conversely, the age group of 15 to 17 year olds has the lowest likelihood of being enrolled in a private school, with 267 (100.0% in the age bracket) attending a public institution.
| Age Bracket | Public School | Private School |
| 3 to 4 Year Olds | 23 (79.3%) | 6 (20.7%) |
| 5 to 9 Year Old | 486 (91.2%) | 47 (8.8%) |
| 10 to 14 Year Olds | 513 (95.0%) | 27 (5.0%) |
| 15 to 17 Year Olds | 267 (100.0%) | 0 (0.0%) |
| 18 to 19 Year Olds | 50 (100.0%) | 0 (0.0%) |
| 20 to 24 Year Olds | 71 (100.0%) | 0 (0.0%) |
| 25 to 34 Year Olds | 50 (96.2%) | 2 (3.8%) |
| 35 Years and over | 65 (83.3%) | 13 (16.7%) |
| Total | 1,524 (94.1%) | 96 (5.9%) |
Educational Attainment by Field of Study in Kit Carson County
Education (213 | 22.8%), bio, nature & agricultural (183 | 19.6%), business (128 | 13.7%), arts & humanities (83 | 8.9%), and science & technology (78 | 8.3%) are the most common fields of study among 935 individuals in Kit Carson County who have obtained a bachelor's degree or higher.
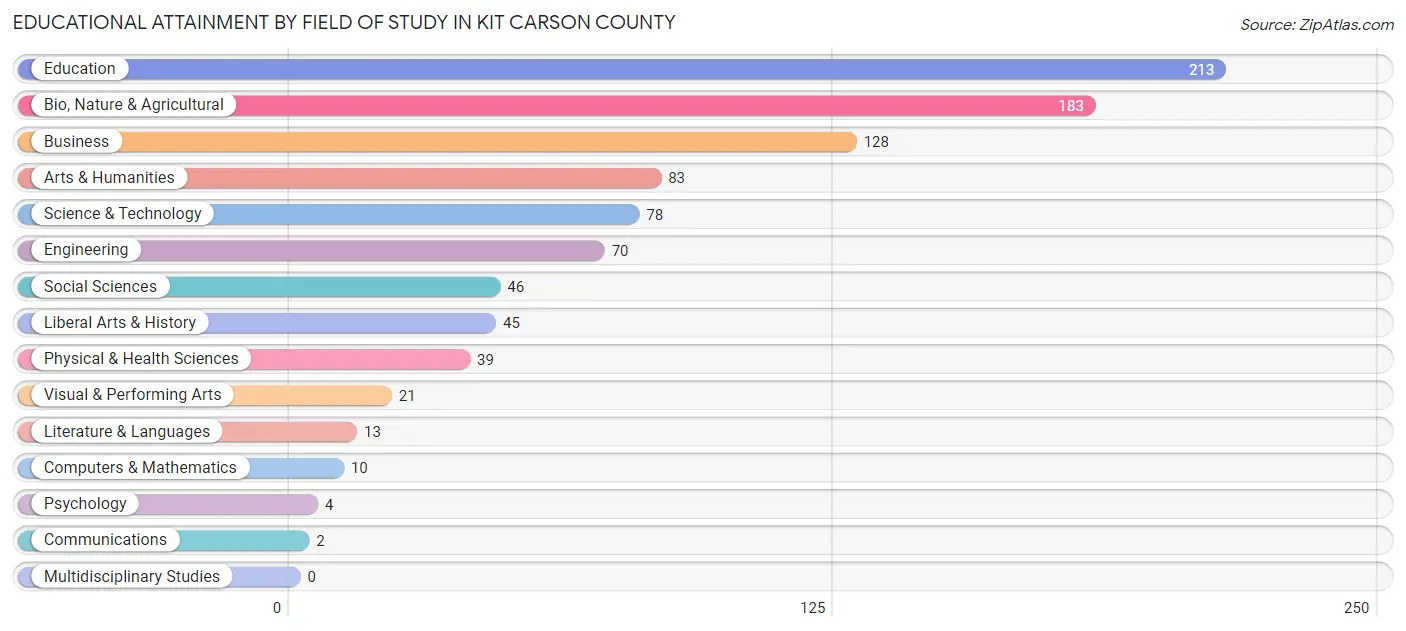
| Field of Study | # Graduates | % Graduates |
| Computers & Mathematics | 10 | 1.1% |
| Bio, Nature & Agricultural | 183 | 19.6% |
| Physical & Health Sciences | 39 | 4.2% |
| Psychology | 4 | 0.4% |
| Social Sciences | 46 | 4.9% |
| Engineering | 70 | 7.5% |
| Multidisciplinary Studies | 0 | 0.0% |
| Science & Technology | 78 | 8.3% |
| Business | 128 | 13.7% |
| Education | 213 | 22.8% |
| Literature & Languages | 13 | 1.4% |
| Liberal Arts & History | 45 | 4.8% |
| Visual & Performing Arts | 21 | 2.2% |
| Communications | 2 | 0.2% |
| Arts & Humanities | 83 | 8.9% |
| Total | 935 | 100.0% |
Transportation & Commute in Kit Carson County
Vehicle Availability by Sex in Kit Carson County
The most prevalent vehicle ownership categories in Kit Carson County are males with 2 vehicles (747, accounting for 39.0%) and females with 2 vehicles (546, making up 49.5%).
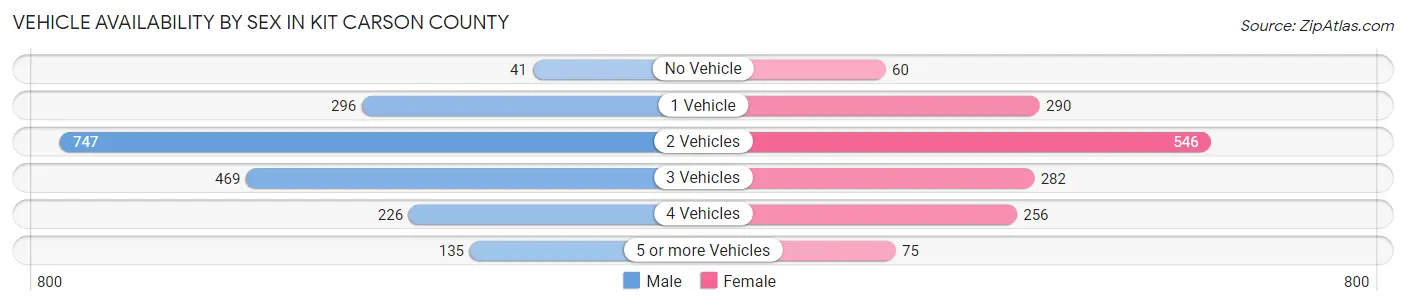
| Vehicles Available | Male | Female |
| No Vehicle | 41 (2.1%) | 60 (4.0%) |
| 1 Vehicle | 296 (15.5%) | 290 (19.2%) |
| 2 Vehicles | 747 (39.0%) | 546 (36.2%) |
| 3 Vehicles | 469 (24.5%) | 282 (18.7%) |
| 4 Vehicles | 226 (11.8%) | 256 (17.0%) |
| 5 or more Vehicles | 135 (7.0%) | 75 (5.0%) |
| Total | 1,914 (100.0%) | 1,509 (100.0%) |
Commute Time in Kit Carson County
The most frequently occuring commute durations in Kit Carson County are 5 to 9 minutes (987 commuters, 31.3%), 10 to 14 minutes (491 commuters, 15.6%), and less than 5 minutes (477 commuters, 15.1%).
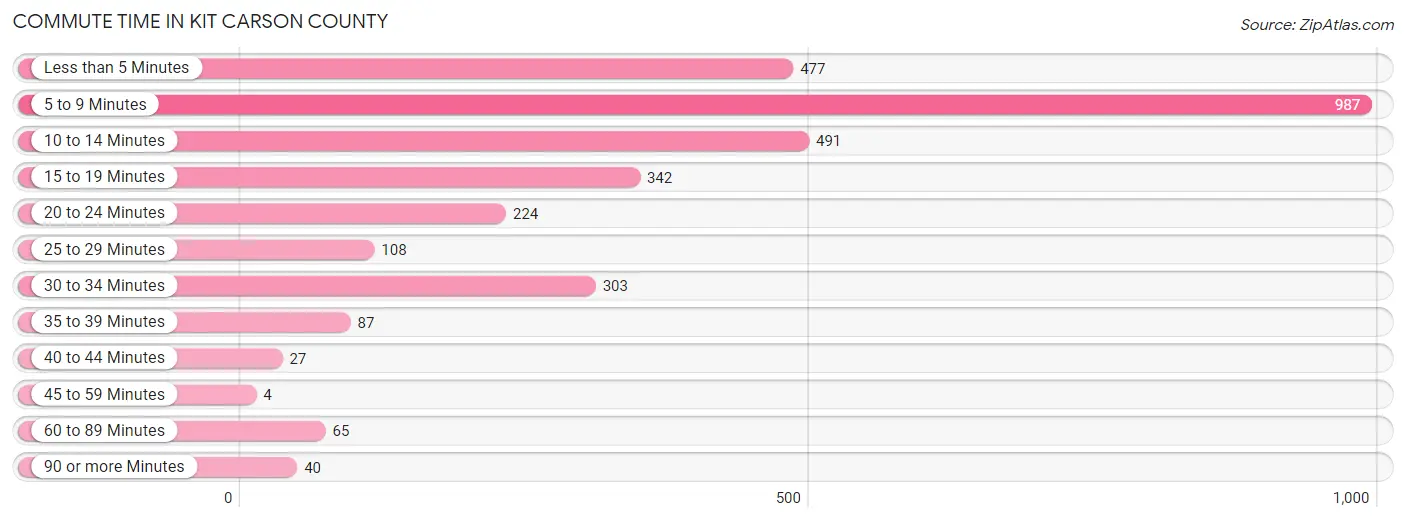
| Commute Time | # Commuters | % Commuters |
| Less than 5 Minutes | 477 | 15.1% |
| 5 to 9 Minutes | 987 | 31.3% |
| 10 to 14 Minutes | 491 | 15.6% |
| 15 to 19 Minutes | 342 | 10.8% |
| 20 to 24 Minutes | 224 | 7.1% |
| 25 to 29 Minutes | 108 | 3.4% |
| 30 to 34 Minutes | 303 | 9.6% |
| 35 to 39 Minutes | 87 | 2.8% |
| 40 to 44 Minutes | 27 | 0.9% |
| 45 to 59 Minutes | 4 | 0.1% |
| 60 to 89 Minutes | 65 | 2.1% |
| 90 or more Minutes | 40 | 1.3% |
Commute Time by Sex in Kit Carson County
The most common commute times in Kit Carson County are 5 to 9 minutes (553 commuters, 31.0%) for males and 5 to 9 minutes (434 commuters, 31.6%) for females.
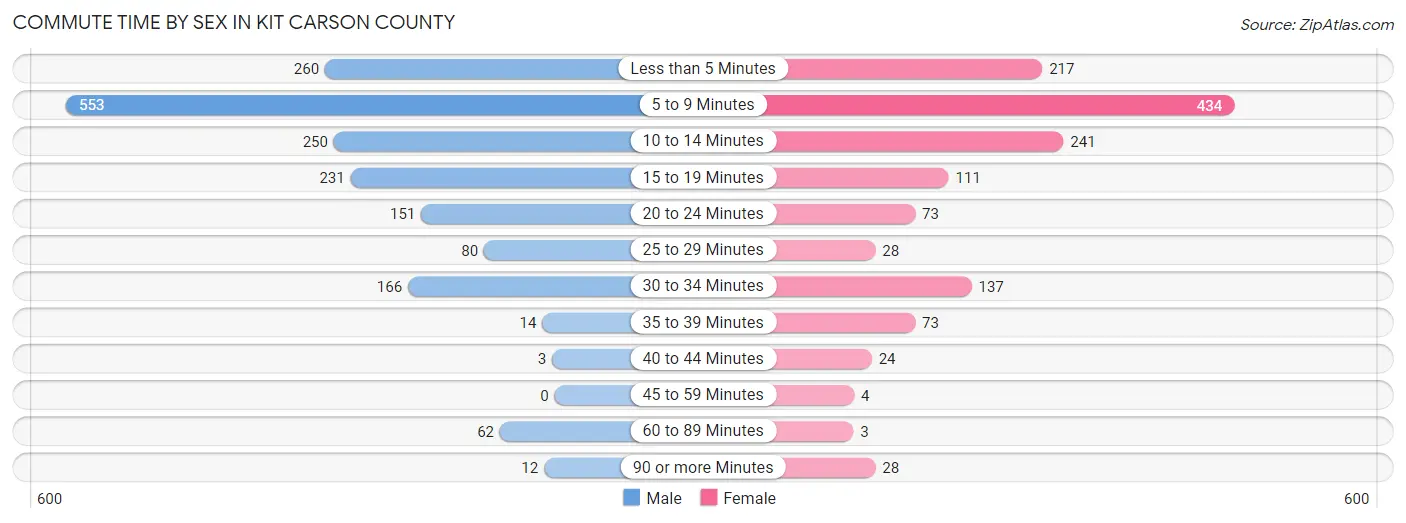
| Commute Time | Male | Female |
| Less than 5 Minutes | 260 (14.6%) | 217 (15.8%) |
| 5 to 9 Minutes | 553 (31.0%) | 434 (31.6%) |
| 10 to 14 Minutes | 250 (14.0%) | 241 (17.5%) |
| 15 to 19 Minutes | 231 (13.0%) | 111 (8.1%) |
| 20 to 24 Minutes | 151 (8.5%) | 73 (5.3%) |
| 25 to 29 Minutes | 80 (4.5%) | 28 (2.0%) |
| 30 to 34 Minutes | 166 (9.3%) | 137 (10.0%) |
| 35 to 39 Minutes | 14 (0.8%) | 73 (5.3%) |
| 40 to 44 Minutes | 3 (0.2%) | 24 (1.8%) |
| 45 to 59 Minutes | 0 (0.0%) | 4 (0.3%) |
| 60 to 89 Minutes | 62 (3.5%) | 3 (0.2%) |
| 90 or more Minutes | 12 (0.7%) | 28 (2.0%) |
Time of Departure to Work by Sex in Kit Carson County
The most frequent times of departure to work in Kit Carson County are 6:30 AM to 6:59 AM (411, 23.1%) for males and 7:30 AM to 7:59 AM (324, 23.6%) for females.
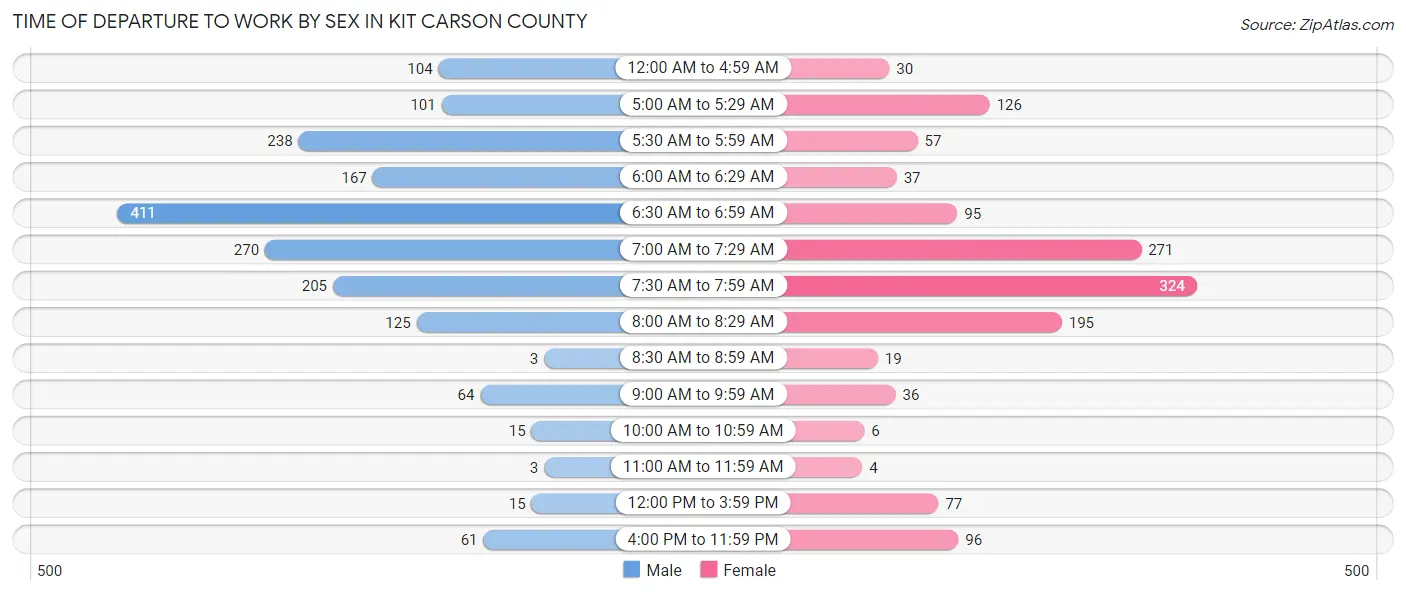
| Time of Departure | Male | Female |
| 12:00 AM to 4:59 AM | 104 (5.8%) | 30 (2.2%) |
| 5:00 AM to 5:29 AM | 101 (5.7%) | 126 (9.2%) |
| 5:30 AM to 5:59 AM | 238 (13.4%) | 57 (4.2%) |
| 6:00 AM to 6:29 AM | 167 (9.4%) | 37 (2.7%) |
| 6:30 AM to 6:59 AM | 411 (23.1%) | 95 (6.9%) |
| 7:00 AM to 7:29 AM | 270 (15.1%) | 271 (19.7%) |
| 7:30 AM to 7:59 AM | 205 (11.5%) | 324 (23.6%) |
| 8:00 AM to 8:29 AM | 125 (7.0%) | 195 (14.2%) |
| 8:30 AM to 8:59 AM | 3 (0.2%) | 19 (1.4%) |
| 9:00 AM to 9:59 AM | 64 (3.6%) | 36 (2.6%) |
| 10:00 AM to 10:59 AM | 15 (0.8%) | 6 (0.4%) |
| 11:00 AM to 11:59 AM | 3 (0.2%) | 4 (0.3%) |
| 12:00 PM to 3:59 PM | 15 (0.8%) | 77 (5.6%) |
| 4:00 PM to 11:59 PM | 61 (3.4%) | 96 (7.0%) |
| Total | 1,782 (100.0%) | 1,373 (100.0%) |
Housing Occupancy in Kit Carson County
Occupancy by Ownership in Kit Carson County
Of the total 2,979 dwellings in Kit Carson County, owner-occupied units account for 2,004 (67.3%), while renter-occupied units make up 975 (32.7%).
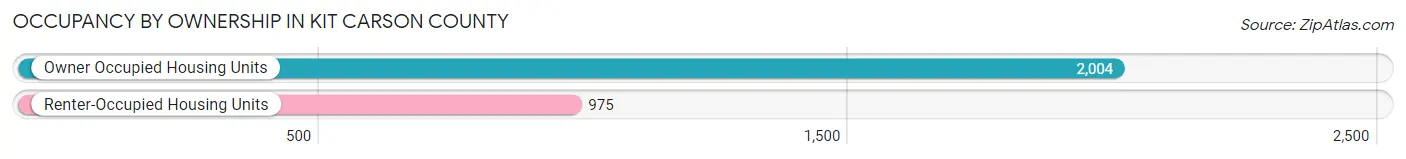
| Occupancy | # Housing Units | % Housing Units |
| Owner Occupied Housing Units | 2,004 | 67.3% |
| Renter-Occupied Housing Units | 975 | 32.7% |
| Total Occupied Housing Units | 2,979 | 100.0% |
Occupancy by Household Size in Kit Carson County
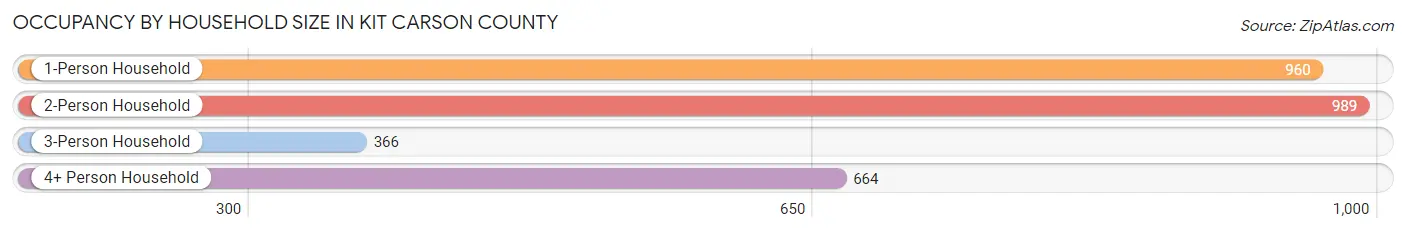
| Household Size | # Housing Units | % Housing Units |
| 1-Person Household | 960 | 32.2% |
| 2-Person Household | 989 | 33.2% |
| 3-Person Household | 366 | 12.3% |
| 4+ Person Household | 664 | 22.3% |
| Total Housing Units | 2,979 | 100.0% |
Occupancy by Ownership by Household Size in Kit Carson County
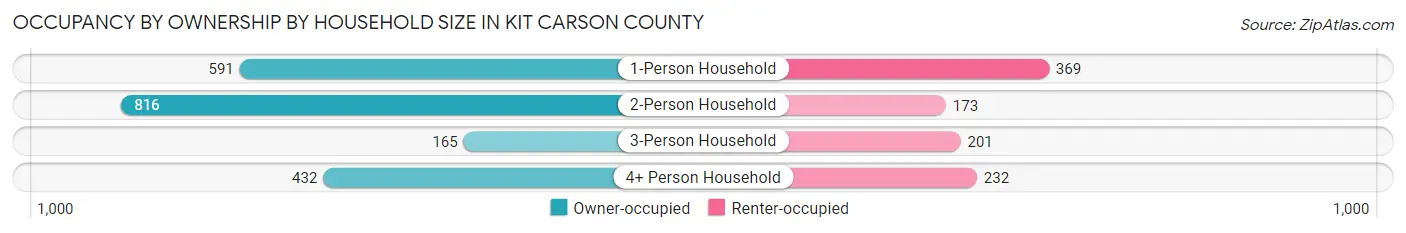
| Household Size | Owner-occupied | Renter-occupied |
| 1-Person Household | 591 (61.6%) | 369 (38.4%) |
| 2-Person Household | 816 (82.5%) | 173 (17.5%) |
| 3-Person Household | 165 (45.1%) | 201 (54.9%) |
| 4+ Person Household | 432 (65.1%) | 232 (34.9%) |
| Total Housing Units | 2,004 (67.3%) | 975 (32.7%) |
Occupancy by Educational Attainment in Kit Carson County
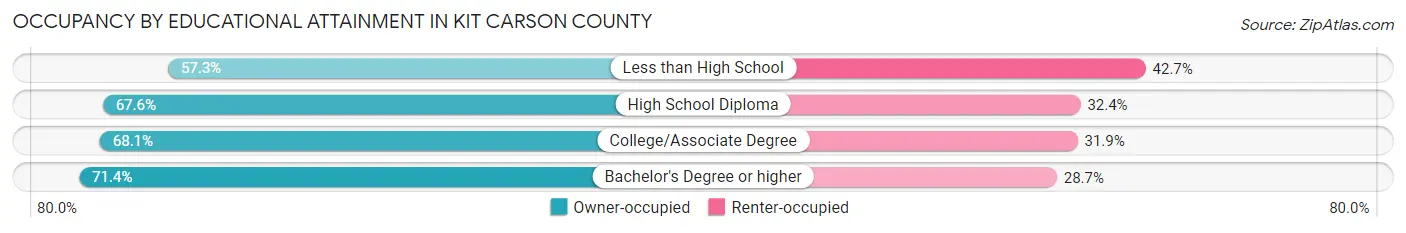
| Household Size | Owner-occupied | Renter-occupied |
| Less than High School | 205 (57.3%) | 153 (42.7%) |
| High School Diploma | 557 (67.6%) | 267 (32.4%) |
| College/Associate Degree | 831 (68.1%) | 390 (31.9%) |
| Bachelor's Degree or higher | 411 (71.4%) | 165 (28.6%) |
Occupancy by Age of Householder in Kit Carson County
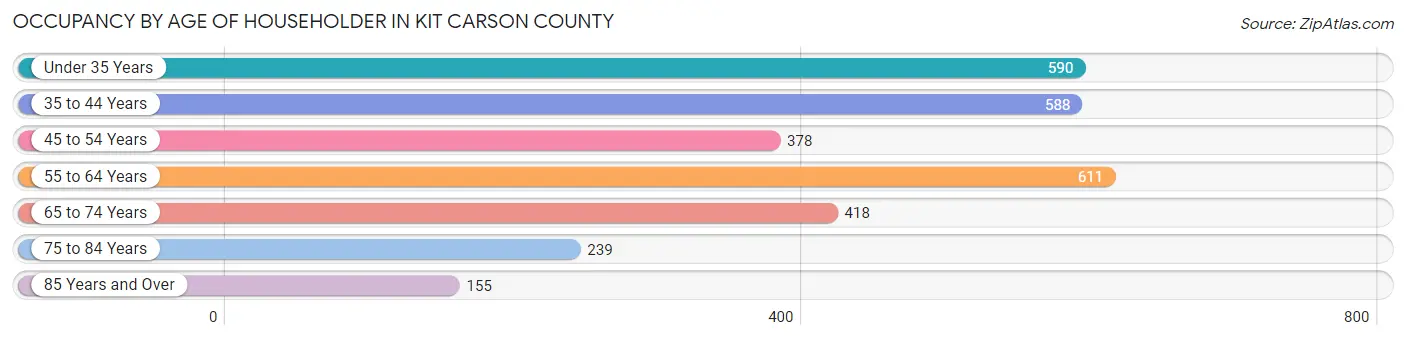
| Age Bracket | # Households | % Households |
| Under 35 Years | 590 | 19.8% |
| 35 to 44 Years | 588 | 19.7% |
| 45 to 54 Years | 378 | 12.7% |
| 55 to 64 Years | 611 | 20.5% |
| 65 to 74 Years | 418 | 14.0% |
| 75 to 84 Years | 239 | 8.0% |
| 85 Years and Over | 155 | 5.2% |
| Total | 2,979 | 100.0% |
Housing Finances in Kit Carson County
Median Income by Occupancy in Kit Carson County
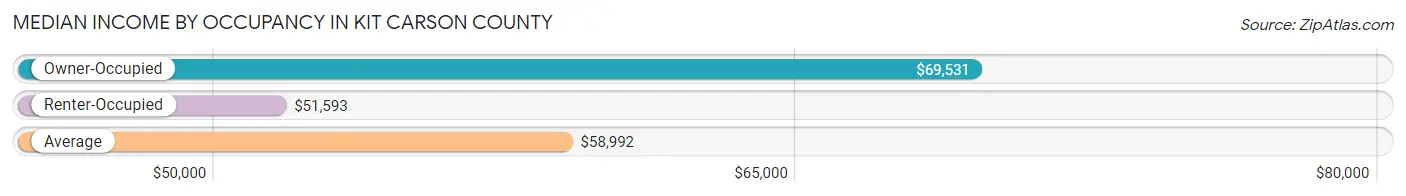
| Occupancy Type | # Households | Median Income |
| Owner-Occupied | 2,004 (67.3%) | $69,531 |
| Renter-Occupied | 975 (32.7%) | $51,593 |
| Average | 2,979 (100.0%) | $58,992 |
Occupancy by Householder Income Bracket in Kit Carson County
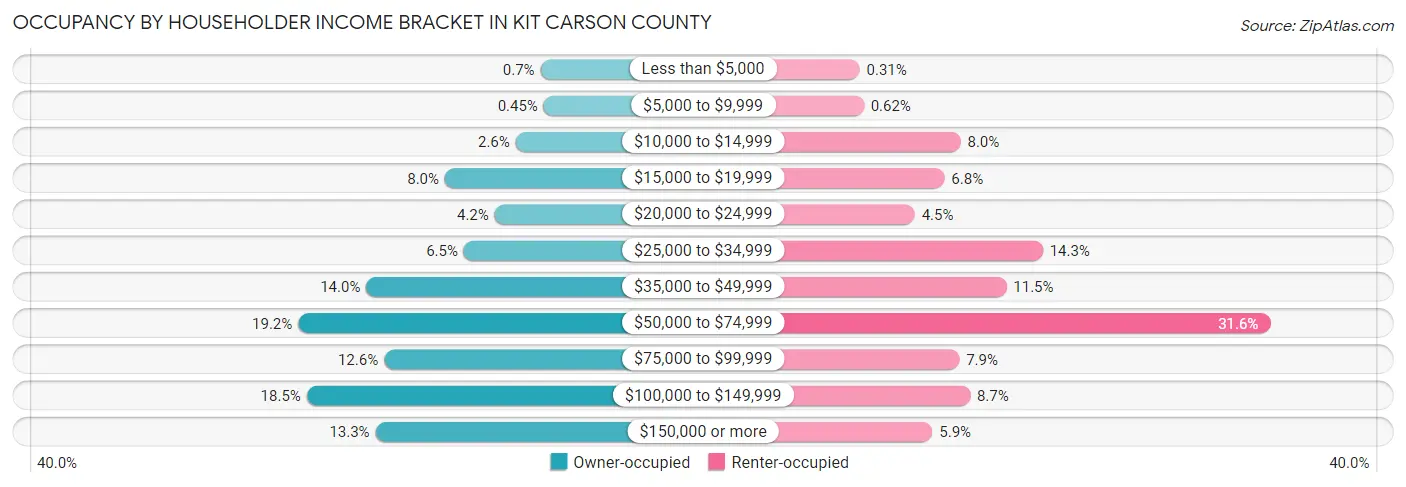
| Income Bracket | Owner-occupied | Renter-occupied |
| Less than $5,000 | 14 (0.7%) | 3 (0.3%) |
| $5,000 to $9,999 | 9 (0.4%) | 6 (0.6%) |
| $10,000 to $14,999 | 52 (2.6%) | 78 (8.0%) |
| $15,000 to $19,999 | 160 (8.0%) | 66 (6.8%) |
| $20,000 to $24,999 | 84 (4.2%) | 44 (4.5%) |
| $25,000 to $34,999 | 131 (6.5%) | 139 (14.3%) |
| $35,000 to $49,999 | 280 (14.0%) | 112 (11.5%) |
| $50,000 to $74,999 | 384 (19.2%) | 308 (31.6%) |
| $75,000 to $99,999 | 253 (12.6%) | 77 (7.9%) |
| $100,000 to $149,999 | 371 (18.5%) | 85 (8.7%) |
| $150,000 or more | 266 (13.3%) | 57 (5.9%) |
| Total | 2,004 (100.0%) | 975 (100.0%) |
Monthly Housing Cost Tiers in Kit Carson County
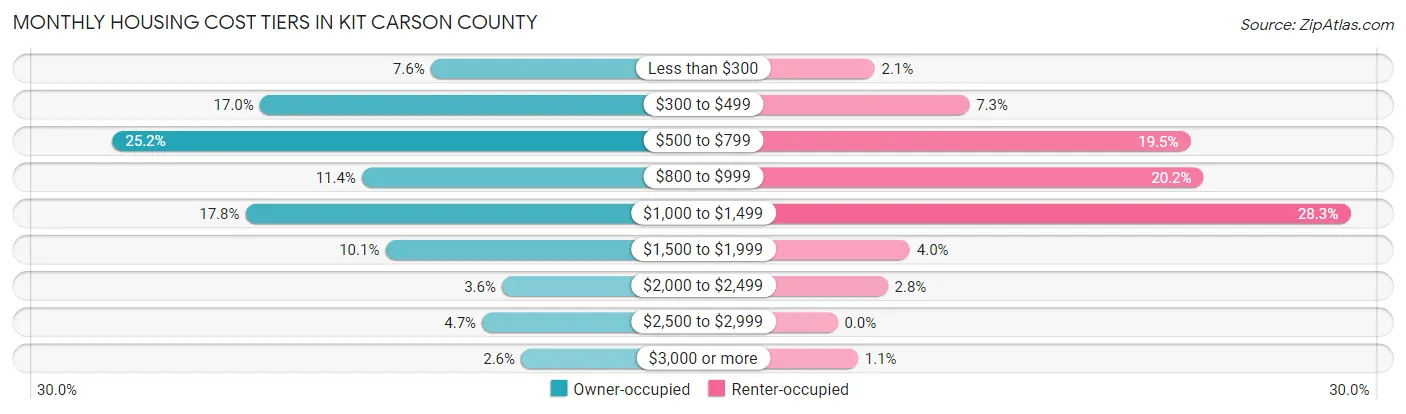
| Monthly Cost | Owner-occupied | Renter-occupied |
| Less than $300 | 152 (7.6%) | 20 (2.1%) |
| $300 to $499 | 341 (17.0%) | 71 (7.3%) |
| $500 to $799 | 504 (25.2%) | 190 (19.5%) |
| $800 to $999 | 228 (11.4%) | 197 (20.2%) |
| $1,000 to $1,499 | 357 (17.8%) | 276 (28.3%) |
| $1,500 to $1,999 | 202 (10.1%) | 39 (4.0%) |
| $2,000 to $2,499 | 73 (3.6%) | 27 (2.8%) |
| $2,500 to $2,999 | 95 (4.7%) | 0 (0.0%) |
| $3,000 or more | 52 (2.6%) | 11 (1.1%) |
| Total | 2,004 (100.0%) | 975 (100.0%) |
Physical Housing Characteristics in Kit Carson County
Housing Structures in Kit Carson County
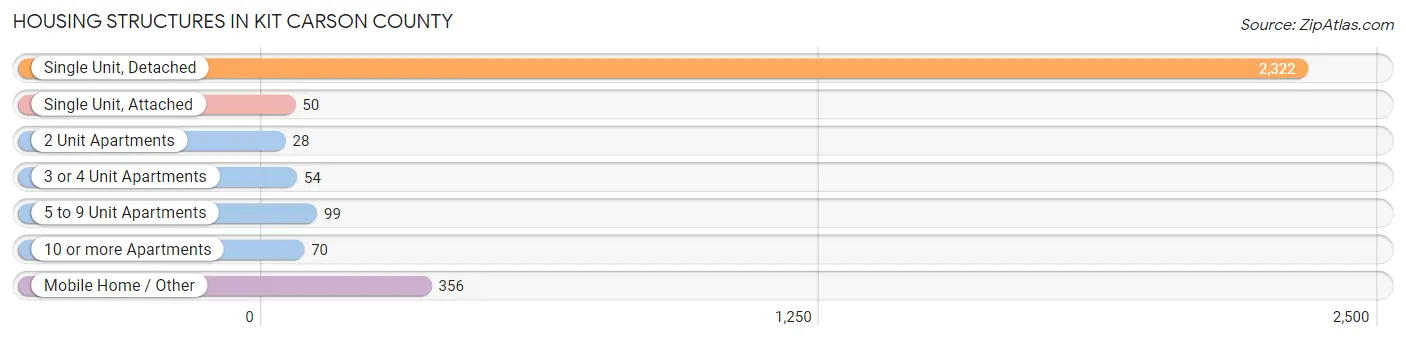
| Structure Type | # Housing Units | % Housing Units |
| Single Unit, Detached | 2,322 | 77.9% |
| Single Unit, Attached | 50 | 1.7% |
| 2 Unit Apartments | 28 | 0.9% |
| 3 or 4 Unit Apartments | 54 | 1.8% |
| 5 to 9 Unit Apartments | 99 | 3.3% |
| 10 or more Apartments | 70 | 2.4% |
| Mobile Home / Other | 356 | 11.9% |
| Total | 2,979 | 100.0% |
Housing Structures by Occupancy in Kit Carson County
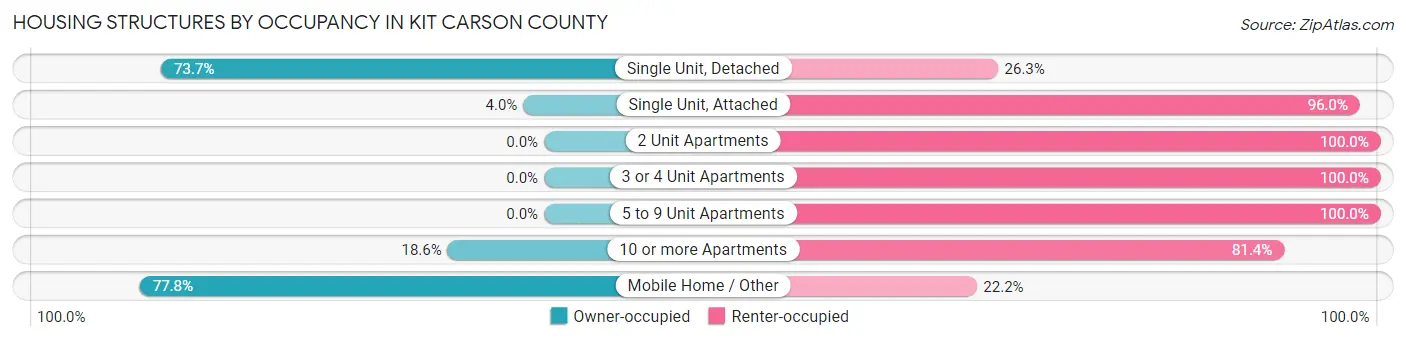
| Structure Type | Owner-occupied | Renter-occupied |
| Single Unit, Detached | 1,712 (73.7%) | 610 (26.3%) |
| Single Unit, Attached | 2 (4.0%) | 48 (96.0%) |
| 2 Unit Apartments | 0 (0.0%) | 28 (100.0%) |
| 3 or 4 Unit Apartments | 0 (0.0%) | 54 (100.0%) |
| 5 to 9 Unit Apartments | 0 (0.0%) | 99 (100.0%) |
| 10 or more Apartments | 13 (18.6%) | 57 (81.4%) |
| Mobile Home / Other | 277 (77.8%) | 79 (22.2%) |
| Total | 2,004 (67.3%) | 975 (32.7%) |
Housing Structures by Number of Rooms in Kit Carson County
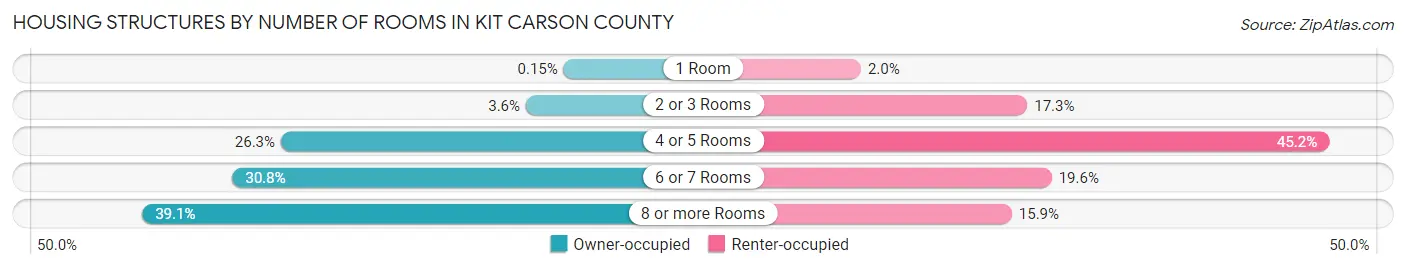
| Number of Rooms | Owner-occupied | Renter-occupied |
| 1 Room | 3 (0.2%) | 19 (1.9%) |
| 2 or 3 Rooms | 73 (3.6%) | 169 (17.3%) |
| 4 or 5 Rooms | 527 (26.3%) | 441 (45.2%) |
| 6 or 7 Rooms | 617 (30.8%) | 191 (19.6%) |
| 8 or more Rooms | 784 (39.1%) | 155 (15.9%) |
| Total | 2,004 (100.0%) | 975 (100.0%) |
Housing Structure by Heating Type in Kit Carson County
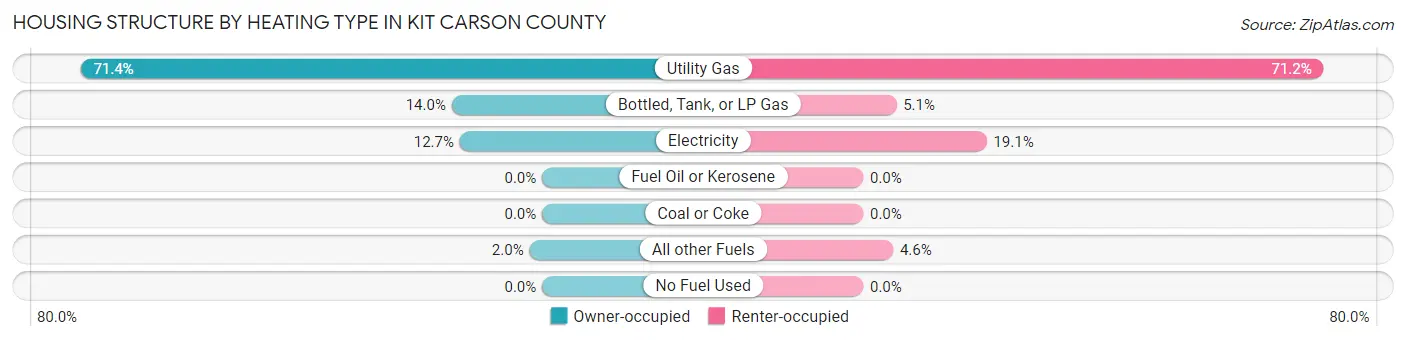
| Heating Type | Owner-occupied | Renter-occupied |
| Utility Gas | 1,430 (71.4%) | 694 (71.2%) |
| Bottled, Tank, or LP Gas | 280 (14.0%) | 50 (5.1%) |
| Electricity | 255 (12.7%) | 186 (19.1%) |
| Fuel Oil or Kerosene | 0 (0.0%) | 0 (0.0%) |
| Coal or Coke | 0 (0.0%) | 0 (0.0%) |
| All other Fuels | 39 (1.9%) | 45 (4.6%) |
| No Fuel Used | 0 (0.0%) | 0 (0.0%) |
| Total | 2,004 (100.0%) | 975 (100.0%) |
Household Vehicle Usage in Kit Carson County
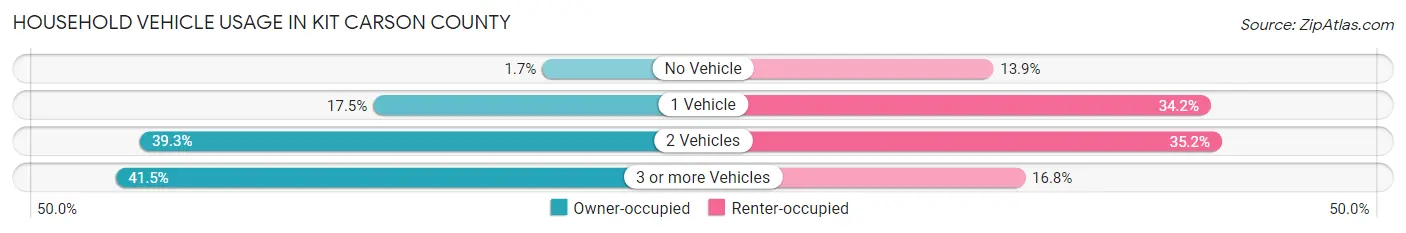
| Vehicles per Household | Owner-occupied | Renter-occupied |
| No Vehicle | 34 (1.7%) | 135 (13.9%) |
| 1 Vehicle | 350 (17.5%) | 333 (34.2%) |
| 2 Vehicles | 788 (39.3%) | 343 (35.2%) |
| 3 or more Vehicles | 832 (41.5%) | 164 (16.8%) |
| Total | 2,004 (100.0%) | 975 (100.0%) |
Real Estate & Mortgages in Kit Carson County
Real Estate and Mortgage Overview in Kit Carson County
| Characteristic | Without Mortgage | With Mortgage |
| Housing Units | 1,023 | 981 |
| Median Property Value | $147,300 | $200,400 |
| Median Household Income | $55,795 | $178 |
| Monthly Housing Costs | $509 | $52 |
| Real Estate Taxes | $598 | $43 |
Property Value by Mortgage Status in Kit Carson County
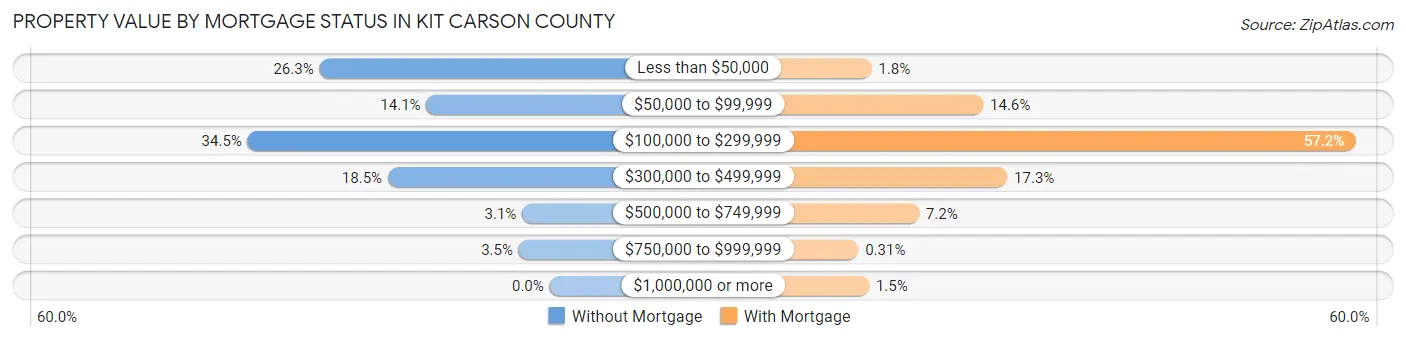
| Property Value | Without Mortgage | With Mortgage |
| Less than $50,000 | 269 (26.3%) | 18 (1.8%) |
| $50,000 to $99,999 | 144 (14.1%) | 143 (14.6%) |
| $100,000 to $299,999 | 353 (34.5%) | 561 (57.2%) |
| $300,000 to $499,999 | 189 (18.5%) | 170 (17.3%) |
| $500,000 to $749,999 | 32 (3.1%) | 71 (7.2%) |
| $750,000 to $999,999 | 36 (3.5%) | 3 (0.3%) |
| $1,000,000 or more | 0 (0.0%) | 15 (1.5%) |
| Total | 1,023 (100.0%) | 981 (100.0%) |
Household Income by Mortgage Status in Kit Carson County
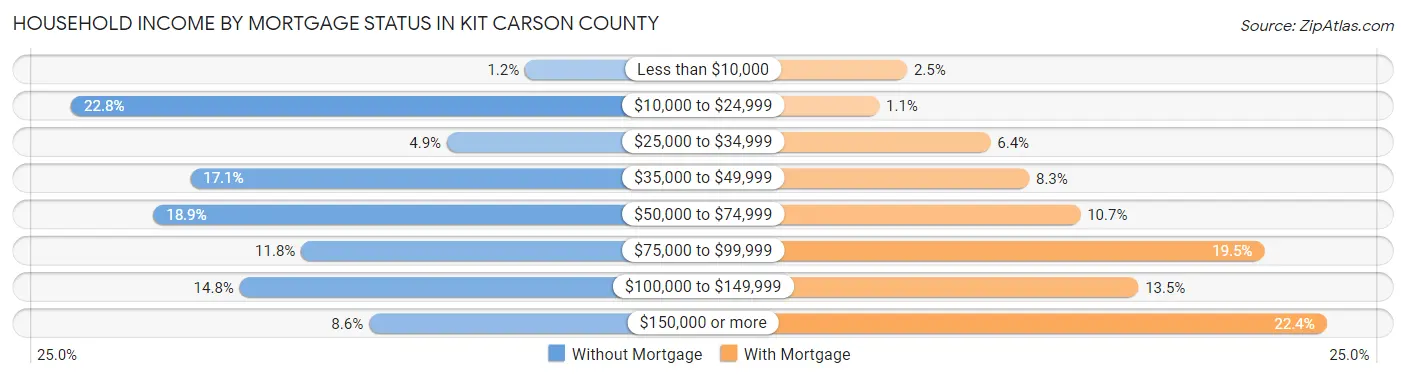
| Household Income | Without Mortgage | With Mortgage |
| Less than $10,000 | 12 (1.2%) | 24 (2.5%) |
| $10,000 to $24,999 | 233 (22.8%) | 11 (1.1%) |
| $25,000 to $34,999 | 50 (4.9%) | 63 (6.4%) |
| $35,000 to $49,999 | 175 (17.1%) | 81 (8.3%) |
| $50,000 to $74,999 | 193 (18.9%) | 105 (10.7%) |
| $75,000 to $99,999 | 121 (11.8%) | 191 (19.5%) |
| $100,000 to $149,999 | 151 (14.8%) | 132 (13.5%) |
| $150,000 or more | 88 (8.6%) | 220 (22.4%) |
| Total | 1,023 (100.0%) | 981 (100.0%) |
Property Value to Household Income Ratio in Kit Carson County
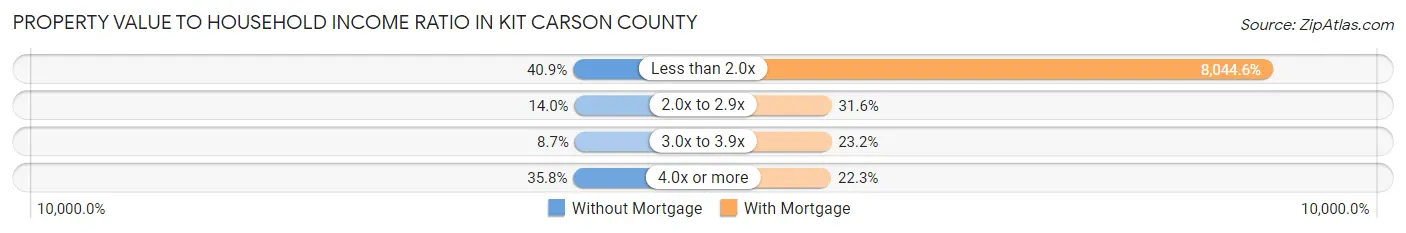
| Value-to-Income Ratio | Without Mortgage | With Mortgage |
| Less than 2.0x | 418 (40.9%) | 78,917 (8,044.5%) |
| 2.0x to 2.9x | 143 (14.0%) | 310 (31.6%) |
| 3.0x to 3.9x | 89 (8.7%) | 228 (23.2%) |
| 4.0x or more | 366 (35.8%) | 219 (22.3%) |
| Total | 1,023 (100.0%) | 981 (100.0%) |
Real Estate Taxes by Mortgage Status in Kit Carson County

| Property Taxes | Without Mortgage | With Mortgage |
| Less than $800 | 562 (54.9%) | 3 (0.3%) |
| $800 to $1,499 | 188 (18.4%) | 213 (21.7%) |
| $800 to $1,499 | 233 (22.8%) | 386 (39.4%) |
| Total | 1,023 (100.0%) | 981 (100.0%) |
Health & Disability in Kit Carson County
Health Insurance Coverage by Age in Kit Carson County
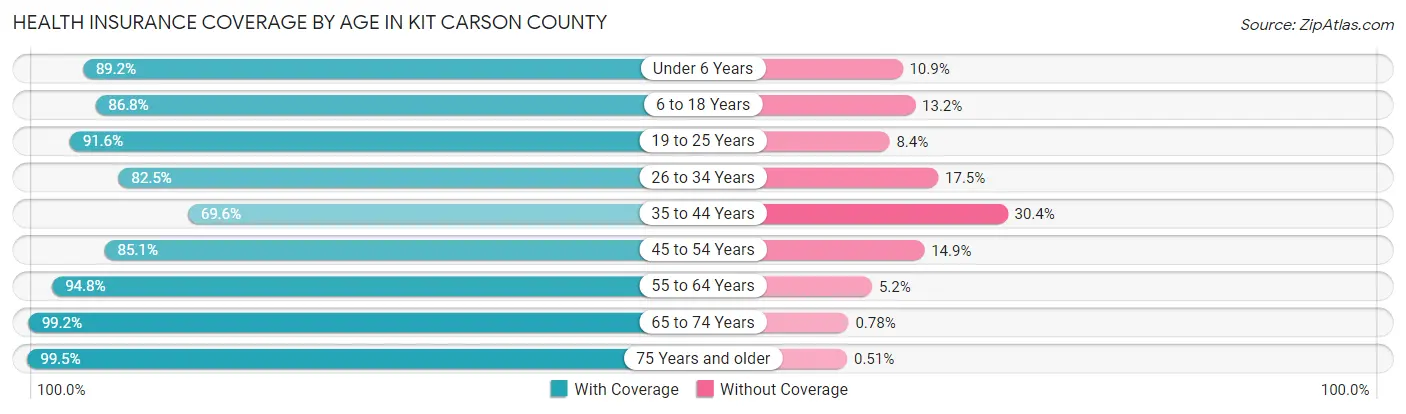
| Age Bracket | With Coverage | Without Coverage |
| Under 6 Years | 534 (89.1%) | 65 (10.8%) |
| 6 to 18 Years | 1,092 (86.8%) | 166 (13.2%) |
| 19 to 25 Years | 380 (91.6%) | 35 (8.4%) |
| 26 to 34 Years | 674 (82.5%) | 143 (17.5%) |
| 35 to 44 Years | 642 (69.6%) | 281 (30.4%) |
| 45 to 54 Years | 542 (85.1%) | 95 (14.9%) |
| 55 to 64 Years | 901 (94.8%) | 49 (5.2%) |
| 65 to 74 Years | 767 (99.2%) | 6 (0.8%) |
| 75 Years and older | 580 (99.5%) | 3 (0.5%) |
| Total | 6,112 (87.9%) | 843 (12.1%) |
Health Insurance Coverage by Citizenship Status in Kit Carson County
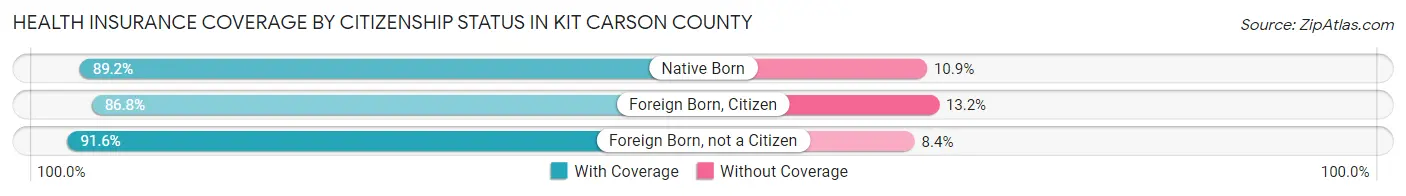
| Citizenship Status | With Coverage | Without Coverage |
| Native Born | 534 (89.1%) | 65 (10.8%) |
| Foreign Born, Citizen | 1,092 (86.8%) | 166 (13.2%) |
| Foreign Born, not a Citizen | 380 (91.6%) | 35 (8.4%) |
Health Insurance Coverage by Household Income in Kit Carson County
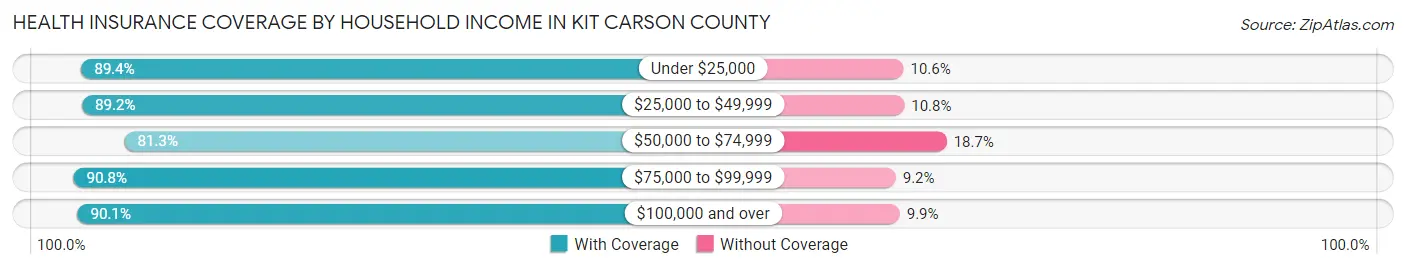
| Household Income | With Coverage | Without Coverage |
| Under $25,000 | 748 (89.4%) | 89 (10.6%) |
| $25,000 to $49,999 | 1,208 (89.2%) | 146 (10.8%) |
| $50,000 to $74,999 | 1,342 (81.3%) | 309 (18.7%) |
| $75,000 to $99,999 | 782 (90.8%) | 79 (9.2%) |
| $100,000 and over | 1,996 (90.1%) | 220 (9.9%) |
Public vs Private Health Insurance Coverage by Age in Kit Carson County
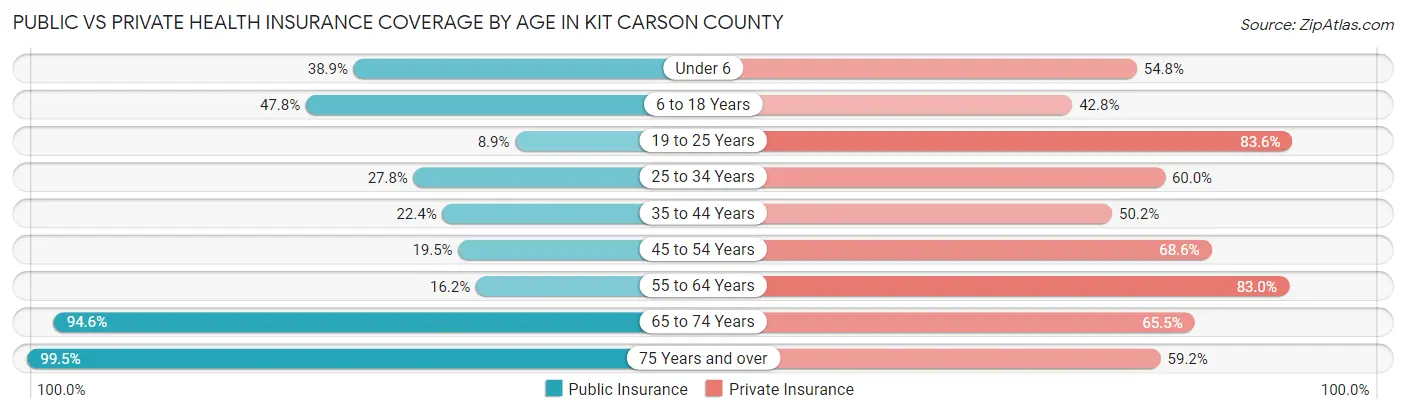
| Age Bracket | Public Insurance | Private Insurance |
| Under 6 | 233 (38.9%) | 328 (54.8%) |
| 6 to 18 Years | 601 (47.8%) | 538 (42.8%) |
| 19 to 25 Years | 37 (8.9%) | 347 (83.6%) |
| 25 to 34 Years | 227 (27.8%) | 490 (60.0%) |
| 35 to 44 Years | 207 (22.4%) | 463 (50.2%) |
| 45 to 54 Years | 124 (19.5%) | 437 (68.6%) |
| 55 to 64 Years | 154 (16.2%) | 788 (83.0%) |
| 65 to 74 Years | 731 (94.6%) | 506 (65.5%) |
| 75 Years and over | 580 (99.5%) | 345 (59.2%) |
| Total | 2,894 (41.6%) | 4,242 (61.0%) |
Disability Status by Sex by Age in Kit Carson County
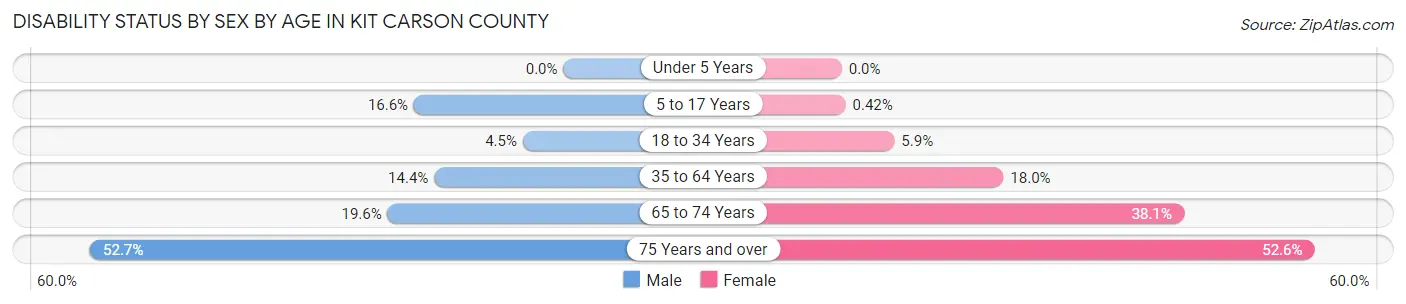
| Age Bracket | Male | Female |
| Under 5 Years | 0 (0.0%) | 0 (0.0%) |
| 5 to 17 Years | 106 (16.6%) | 3 (0.4%) |
| 18 to 34 Years | 30 (4.5%) | 36 (5.9%) |
| 35 to 64 Years | 171 (14.4%) | 238 (18.0%) |
| 65 to 74 Years | 84 (19.6%) | 131 (38.1%) |
| 75 Years and over | 136 (52.7%) | 171 (52.6%) |
Disability Class by Sex by Age in Kit Carson County
Disability Class: Hearing Difficulty
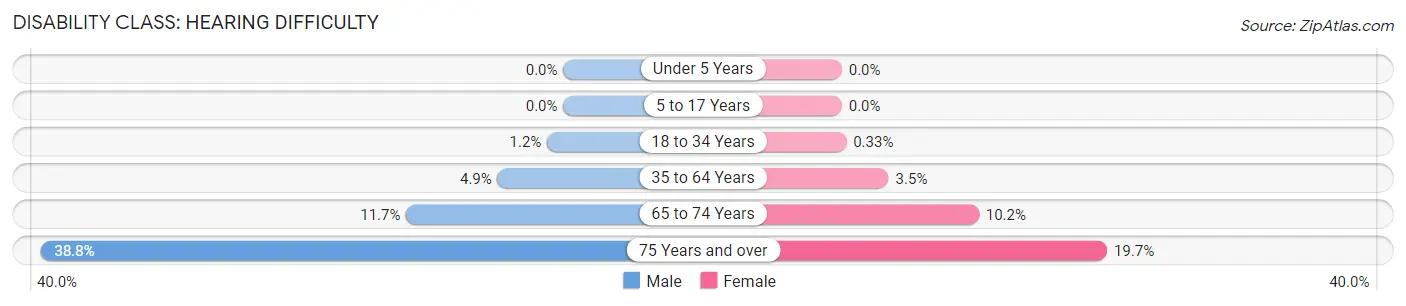
| Age Bracket | Male | Female |
| Under 5 Years | 0 (0.0%) | 0 (0.0%) |
| 5 to 17 Years | 0 (0.0%) | 0 (0.0%) |
| 18 to 34 Years | 8 (1.2%) | 2 (0.3%) |
| 35 to 64 Years | 58 (4.9%) | 46 (3.5%) |
| 65 to 74 Years | 50 (11.7%) | 35 (10.2%) |
| 75 Years and over | 100 (38.8%) | 64 (19.7%) |
Disability Class: Vision Difficulty
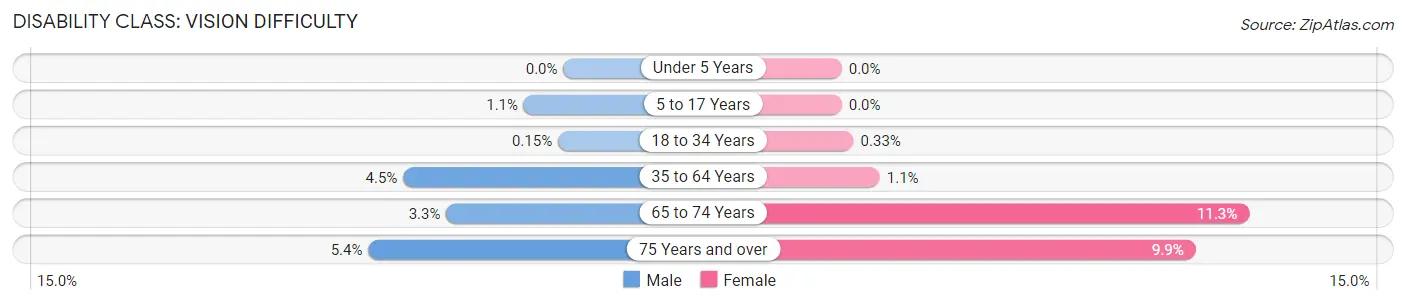
| Age Bracket | Male | Female |
| Under 5 Years | 0 (0.0%) | 0 (0.0%) |
| 5 to 17 Years | 7 (1.1%) | 0 (0.0%) |
| 18 to 34 Years | 1 (0.2%) | 2 (0.3%) |
| 35 to 64 Years | 53 (4.5%) | 14 (1.1%) |
| 65 to 74 Years | 14 (3.3%) | 39 (11.3%) |
| 75 Years and over | 14 (5.4%) | 32 (9.9%) |
Disability Class: Cognitive Difficulty
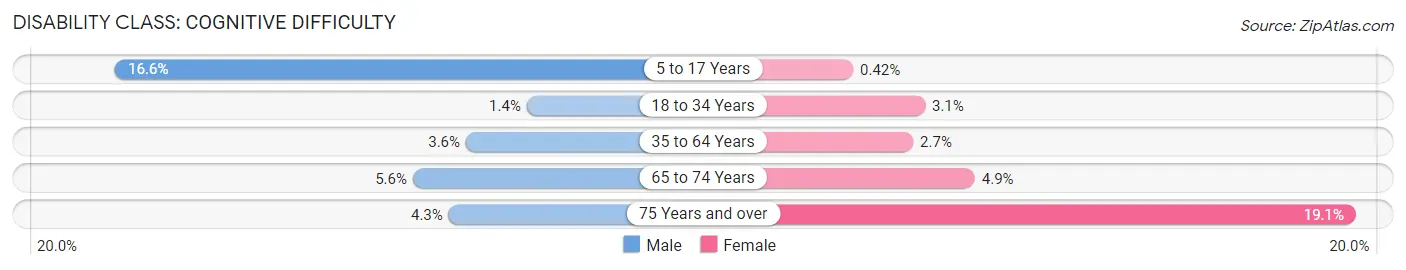
| Age Bracket | Male | Female |
| 5 to 17 Years | 106 (16.6%) | 3 (0.4%) |
| 18 to 34 Years | 9 (1.4%) | 19 (3.1%) |
| 35 to 64 Years | 43 (3.6%) | 35 (2.6%) |
| 65 to 74 Years | 24 (5.6%) | 17 (4.9%) |
| 75 Years and over | 11 (4.3%) | 62 (19.1%) |
Disability Class: Ambulatory Difficulty
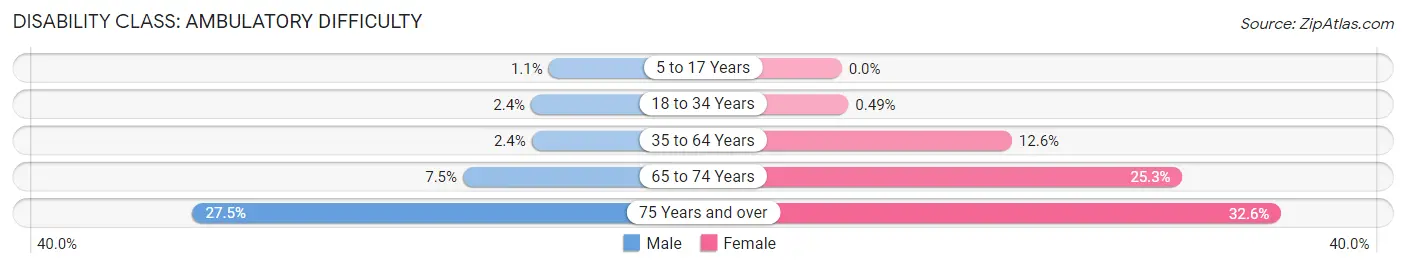
| Age Bracket | Male | Female |
| 5 to 17 Years | 7 (1.1%) | 0 (0.0%) |
| 18 to 34 Years | 16 (2.4%) | 3 (0.5%) |
| 35 to 64 Years | 28 (2.4%) | 167 (12.6%) |
| 65 to 74 Years | 32 (7.5%) | 87 (25.3%) |
| 75 Years and over | 71 (27.5%) | 106 (32.6%) |
Disability Class: Self-Care Difficulty
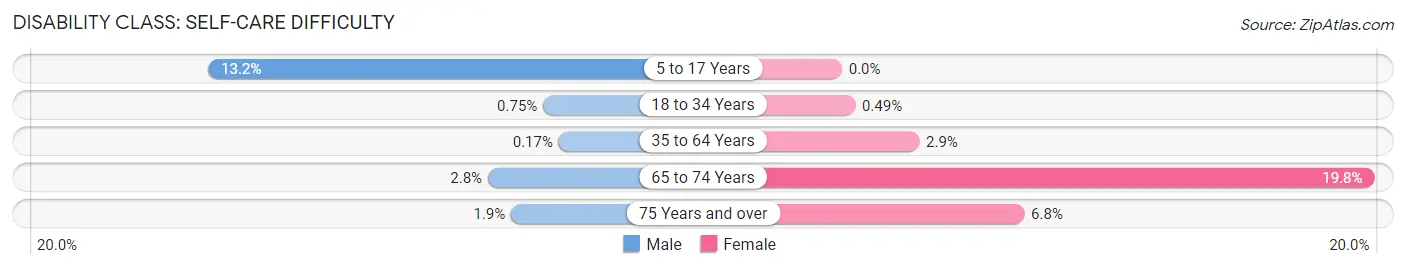
| Age Bracket | Male | Female |
| 5 to 17 Years | 84 (13.2%) | 0 (0.0%) |
| 18 to 34 Years | 5 (0.7%) | 3 (0.5%) |
| 35 to 64 Years | 2 (0.2%) | 38 (2.9%) |
| 65 to 74 Years | 12 (2.8%) | 68 (19.8%) |
| 75 Years and over | 5 (1.9%) | 22 (6.8%) |
Technology Access in Kit Carson County
Computing Device Access in Kit Carson County
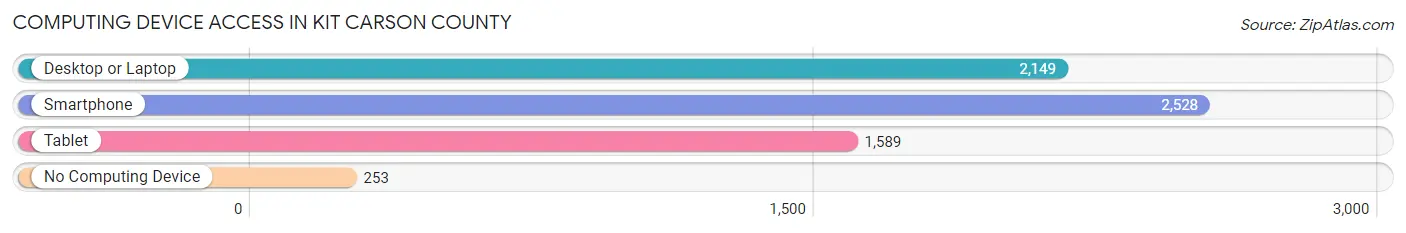
| Device Type | # Households | % Households |
| Desktop or Laptop | 2,149 | 72.1% |
| Smartphone | 2,528 | 84.9% |
| Tablet | 1,589 | 53.3% |
| No Computing Device | 253 | 8.5% |
| Total | 2,979 | 100.0% |
Internet Access in Kit Carson County
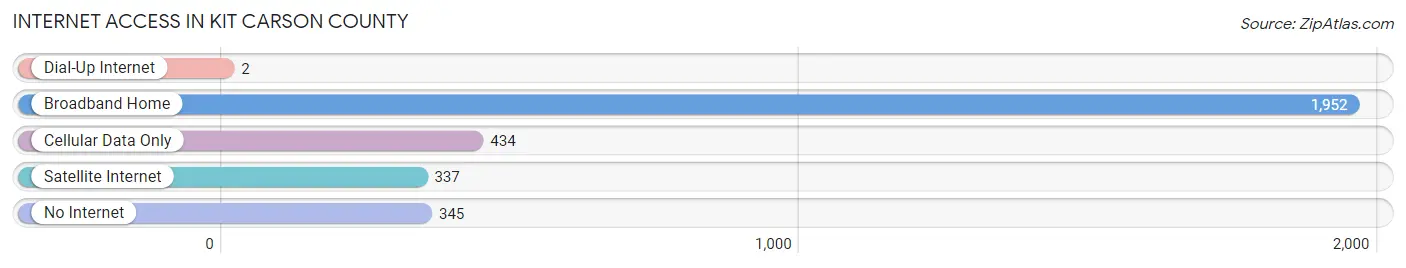
| Internet Type | # Households | % Households |
| Dial-Up Internet | 2 | 0.1% |
| Broadband Home | 1,952 | 65.5% |
| Cellular Data Only | 434 | 14.6% |
| Satellite Internet | 337 | 11.3% |
| No Internet | 345 | 11.6% |
| Total | 2,979 | 100.0% |
Kit Carson County Summary
Carson County, Colorado is located in the eastern part of the state, in the South Platte River Valley. It is bordered by Weld County to the north, Yuma County to the east, Cheyenne County to the south, and Washington County to the west. The county seat is Burlington, and the county is named after the famous frontiersman, Kit Carson.
Geography
Carson County covers an area of 1,845 square miles, making it the fourth largest county in Colorado. The county is mostly flat, with some rolling hills in the western part. The South Platte River runs through the county, and there are several small lakes and reservoirs. The county is mostly rural, with some small towns and villages scattered throughout. The largest town is Burlington, with a population of about 2,000.
The climate of Carson County is semi-arid, with hot summers and cold winters. The average annual precipitation is about 15 inches, and the average annual temperature is about 50 degrees Fahrenheit.
Economy
The economy of Carson County is largely based on agriculture. The county is home to several large farms, which produce wheat, corn, and other crops. Livestock is also raised in the county, including cattle, sheep, and horses.
The county also has some manufacturing and service industries. Burlington is home to several small businesses, including a furniture factory, a printing company, and a machine shop.
Demographics
As of the 2010 census, Carson County had a population of 5,039. The population is mostly white (94.3%), with small percentages of Hispanic (2.7%), African American (1.2%), and Native American (0.7%) residents. The median household income is $45,000, and the median home value is $125,000.
The county is served by two school districts, Burlington School District and Kit Carson County School District. The county also has several private schools, including a Catholic school and a Christian school.
Conclusion
Carson County, Colorado is a rural county located in the eastern part of the state. The county is mostly agricultural, with some small towns and villages scattered throughout. The population is mostly white, with small percentages of Hispanic, African American, and Native American residents. The economy is largely based on agriculture, with some manufacturing and service industries. The county is served by two school districts, and there are several private schools in the area.
Common Questions
What is Per Capita Income in Kit Carson County?
Per Capita income in Kit Carson County is $36,039.
What is the Median Family Income in Kit Carson County?
Median Family Income in Kit Carson County is $72,062.
What is the Median Household income in Kit Carson County?
Median Household Income in Kit Carson County is $58,992.
What is Income or Wage Gap in Kit Carson County?
Income or Wage Gap in Kit Carson County is 40.2%.
Women in Kit Carson County earn 59.8 cents for every dollar earned by a man.
What is Family Income Deficit in Kit Carson County?
Family Income Deficit in Kit Carson County is $7,976.
Families that are below poverty line in Kit Carson County earn $7,976 less on average than the poverty threshold level.
What is Inequality or Gini Index in Kit Carson County?
Inequality or Gini Index in Kit Carson County is 0.46.
What is the Total Population of Kit Carson County?
Total Population of Kit Carson County is 7,039.
What is the Total Male Population of Kit Carson County?
Total Male Population of Kit Carson County is 3,499.
What is the Total Female Population of Kit Carson County?
Total Female Population of Kit Carson County is 3,540.
What is the Ratio of Males per 100 Females in Kit Carson County?
There are 98.84 Males per 100 Females in Kit Carson County.
What is the Ratio of Females per 100 Males in Kit Carson County?
There are 101.17 Females per 100 Males in Kit Carson County.
What is the Median Population Age in Kit Carson County?
Median Population Age in Kit Carson County is 39.2 Years.
What is the Average Family Size in Kit Carson County
Average Family Size in Kit Carson County is 2.9 People.
What is the Average Household Size in Kit Carson County
Average Household Size in Kit Carson County is 2.3 People.
How Large is the Labor Force in Kit Carson County?
There are 3,662 People in the Labor Forcein in Kit Carson County.
What is the Percentage of People in the Labor Force in Kit Carson County?
68.0% of People are in the Labor Force in Kit Carson County.
What is the Unemployment Rate in Kit Carson County?
Unemployment Rate in Kit Carson County is 2.6%.