Kiowa County, CO Map & Demographics
Kiowa County Map
Kiowa County Overview
$27,957
PER CAPITA INCOME
$60,000
AVG FAMILY INCOME
$45,250
AVG HOUSEHOLD INCOME
30.3%
WAGE / INCOME GAP [ % ]
69.7¢/ $1
WAGE / INCOME GAP [ $ ]
$10,043
FAMILY INCOME DEFICIT
0.45
INEQUALITY / GINI INDEX
1,347
TOTAL POPULATION
632
MALE POPULATION
715
FEMALE POPULATION
88.39
MALES / 100 FEMALES
113.13
FEMALES / 100 MALES
43.3
MEDIAN AGE
3.0
AVG FAMILY SIZE
2.4
AVG HOUSEHOLD SIZE
649
LABOR FORCE [ PEOPLE ]
62.0%
PERCENT IN LABOR FORCE
Kiowa County Area Codes
Income in Kiowa County
Income Overview in Kiowa County
Per Capita Income in Kiowa County is $27,957, while median incomes of families and households are $60,000 and $45,250 respectively.
| Characteristic | Number | Measure |
| Per Capita Income | 1,347 | $27,957 |
| Median Family Income | 338 | $60,000 |
| Mean Family Income | 338 | $84,330 |
| Median Household Income | 551 | $45,250 |
| Mean Household Income | 551 | $66,747 |
| Income Deficit | 338 | $10,043 |
| Wage / Income Gap (%) | 1,347 | 30.28% |
| Wage / Income Gap ($) | 1,347 | 69.72¢ per $1 |
| Gini / Inequality Index | 1,347 | 0.45 |
Earnings by Sex in Kiowa County
Average Earnings in Kiowa County are $32,760, $40,815 for men and $28,456 for women, a difference of 30.3%.
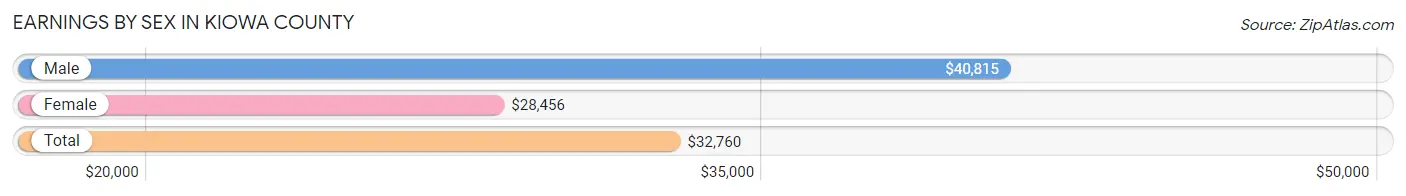
| Sex | Number | Average Earnings |
| Male | 333 (49.3%) | $40,815 |
| Female | 343 (50.7%) | $28,456 |
| Total | 676 (100.0%) | $32,760 |
Earnings by Sex by Income Bracket in Kiowa County
The most common earnings brackets in Kiowa County are $100,000+ for men (43 | 12.9%) and $30,000 to $34,999 for women (50 | 14.6%).
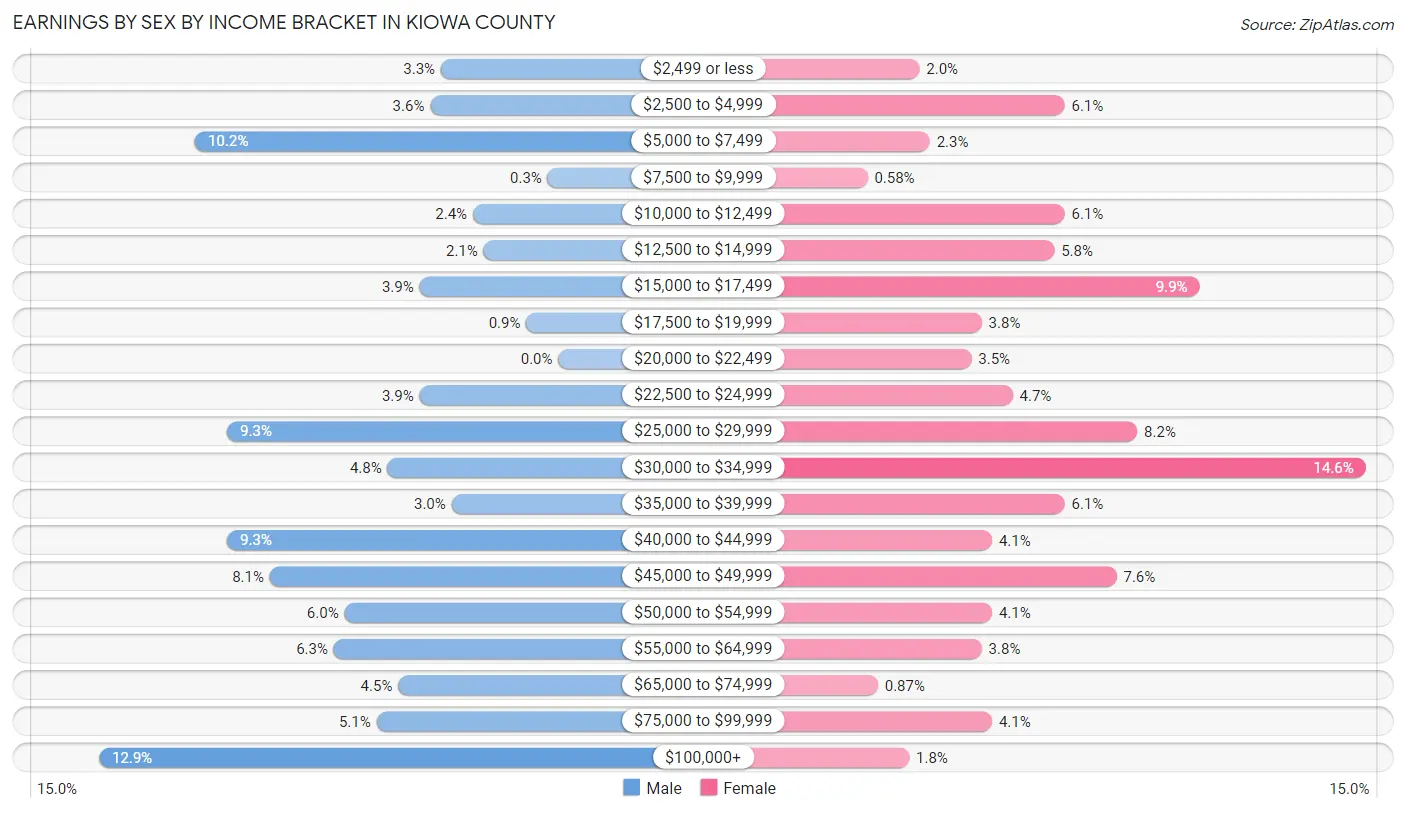
| Income | Male | Female |
| $2,499 or less | 11 (3.3%) | 7 (2.0%) |
| $2,500 to $4,999 | 12 (3.6%) | 21 (6.1%) |
| $5,000 to $7,499 | 34 (10.2%) | 8 (2.3%) |
| $7,500 to $9,999 | 1 (0.3%) | 2 (0.6%) |
| $10,000 to $12,499 | 8 (2.4%) | 21 (6.1%) |
| $12,500 to $14,999 | 7 (2.1%) | 20 (5.8%) |
| $15,000 to $17,499 | 13 (3.9%) | 34 (9.9%) |
| $17,500 to $19,999 | 3 (0.9%) | 13 (3.8%) |
| $20,000 to $22,499 | 0 (0.0%) | 12 (3.5%) |
| $22,500 to $24,999 | 13 (3.9%) | 16 (4.7%) |
| $25,000 to $29,999 | 31 (9.3%) | 28 (8.2%) |
| $30,000 to $34,999 | 16 (4.8%) | 50 (14.6%) |
| $35,000 to $39,999 | 10 (3.0%) | 21 (6.1%) |
| $40,000 to $44,999 | 31 (9.3%) | 14 (4.1%) |
| $45,000 to $49,999 | 27 (8.1%) | 26 (7.6%) |
| $50,000 to $54,999 | 20 (6.0%) | 14 (4.1%) |
| $55,000 to $64,999 | 21 (6.3%) | 13 (3.8%) |
| $65,000 to $74,999 | 15 (4.5%) | 3 (0.9%) |
| $75,000 to $99,999 | 17 (5.1%) | 14 (4.1%) |
| $100,000+ | 43 (12.9%) | 6 (1.8%) |
| Total | 333 (100.0%) | 343 (100.0%) |
Earnings by Sex by Educational Attainment in Kiowa County
Average earnings in Kiowa County are $43,594 for men and $33,049 for women, a difference of 24.2%. Men with an educational attainment of high school diploma enjoy the highest average annual earnings of $50,625, while those with college or associate's degree education earn the least with $34,583. Women with an educational attainment of graduate degree earn the most with the average annual earnings of $46,528, while those with college or associate's degree education have the smallest earnings of $32,539.
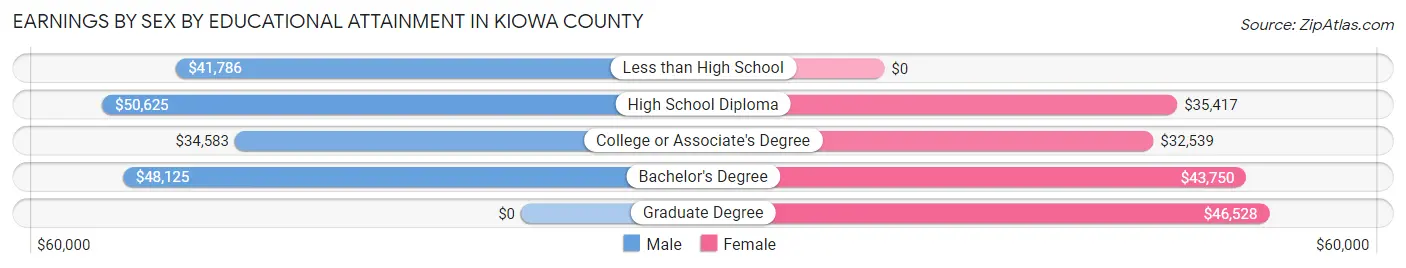
| Educational Attainment | Male Income | Female Income |
| Less than High School | $41,786 | $0 |
| High School Diploma | $50,625 | $35,417 |
| College or Associate's Degree | $34,583 | $32,539 |
| Bachelor's Degree | $48,125 | $43,750 |
| Graduate Degree | - | - |
| Total | $43,594 | $33,049 |
Family Income in Kiowa County
Family Income Brackets in Kiowa County
According to the Kiowa County family income data, there are 72 families falling into the $50,000 to $74,999 income range, which is the most common income bracket and makes up 21.3% of all families. Conversely, the $15,000 to $24,999 income bracket is the least frequent group with only 3 families (0.9%) belonging to this category.
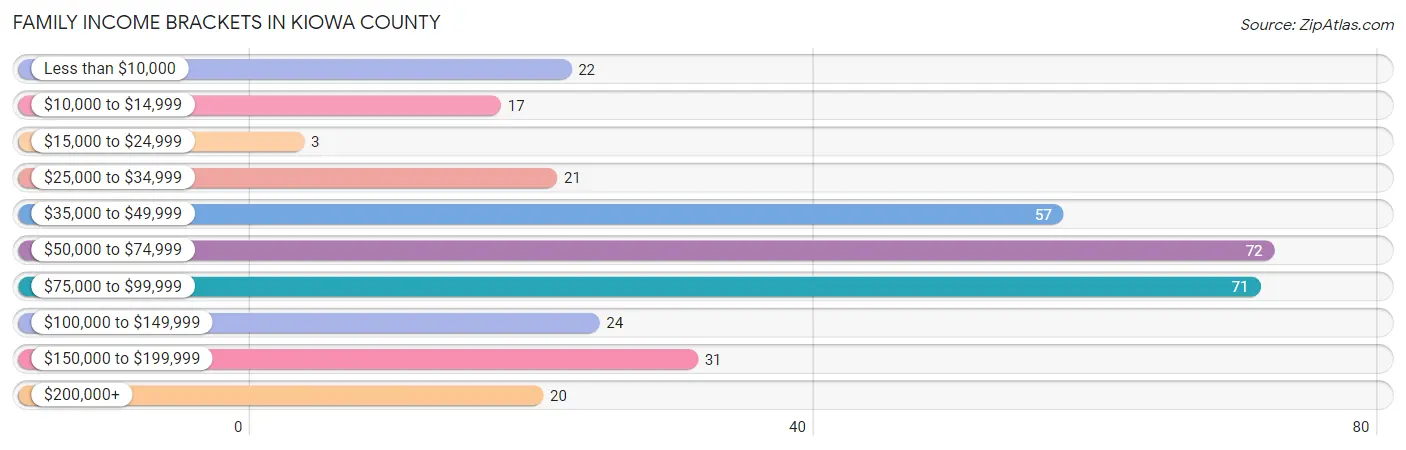
| Income Bracket | # Families | % Families |
| Less than $10,000 | 22 | 6.5% |
| $10,000 to $14,999 | 17 | 5.0% |
| $15,000 to $24,999 | 3 | 0.9% |
| $25,000 to $34,999 | 21 | 6.2% |
| $35,000 to $49,999 | 57 | 16.9% |
| $50,000 to $74,999 | 72 | 21.3% |
| $75,000 to $99,999 | 71 | 21.0% |
| $100,000 to $149,999 | 24 | 7.1% |
| $150,000 to $199,999 | 31 | 9.2% |
| $200,000+ | 20 | 5.9% |
Family Income by Famaliy Size in Kiowa County
4-person families (28 | 8.3%) account for the highest median family income in Kiowa County with $143,750 per family, while 4-person families (28 | 8.3%) have the highest median income of $35,938 per family member.
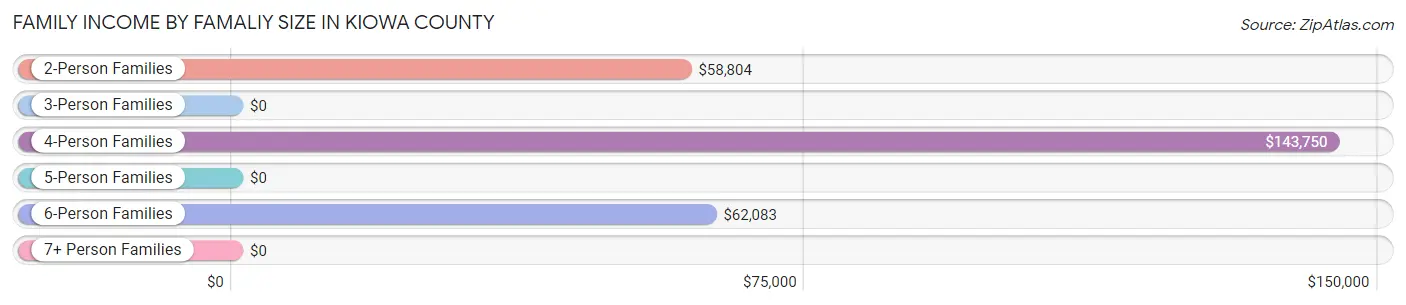
| Income Bracket | # Families | Median Income |
| 2-Person Families | 224 (66.3%) | $58,804 |
| 3-Person Families | 37 (11.0%) | $0 |
| 4-Person Families | 28 (8.3%) | $143,750 |
| 5-Person Families | 22 (6.5%) | $0 |
| 6-Person Families | 27 (8.0%) | $62,083 |
| 7+ Person Families | 0 (0.0%) | $0 |
| Total | 338 (100.0%) | $60,000 |
Family Income by Number of Earners in Kiowa County
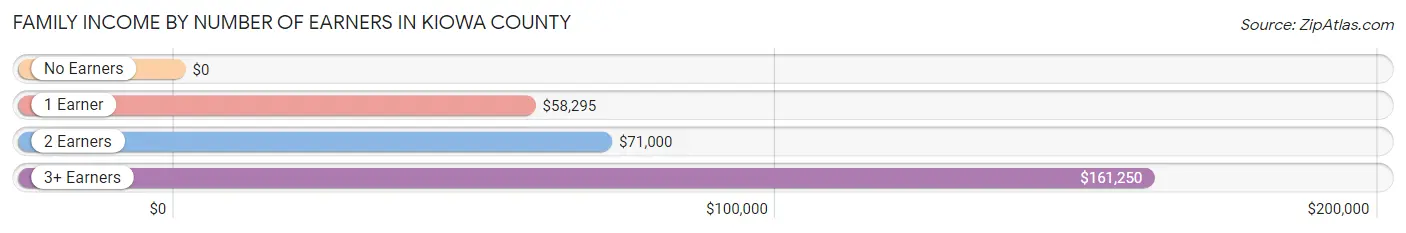
| Number of Earners | # Families | Median Income |
| No Earners | 45 (13.3%) | $0 |
| 1 Earner | 111 (32.8%) | $58,295 |
| 2 Earners | 172 (50.9%) | $71,000 |
| 3+ Earners | 10 (3.0%) | $161,250 |
| Total | 338 (100.0%) | $60,000 |
Household Income in Kiowa County
Household Income Brackets in Kiowa County
With 111 households falling in the category, the $35,000 to $49,999 income range is the most frequent in Kiowa County, accounting for 20.2% of all households. In contrast, only 20 households (3.6%) fall into the $200,000+ income bracket, making it the least populous group.
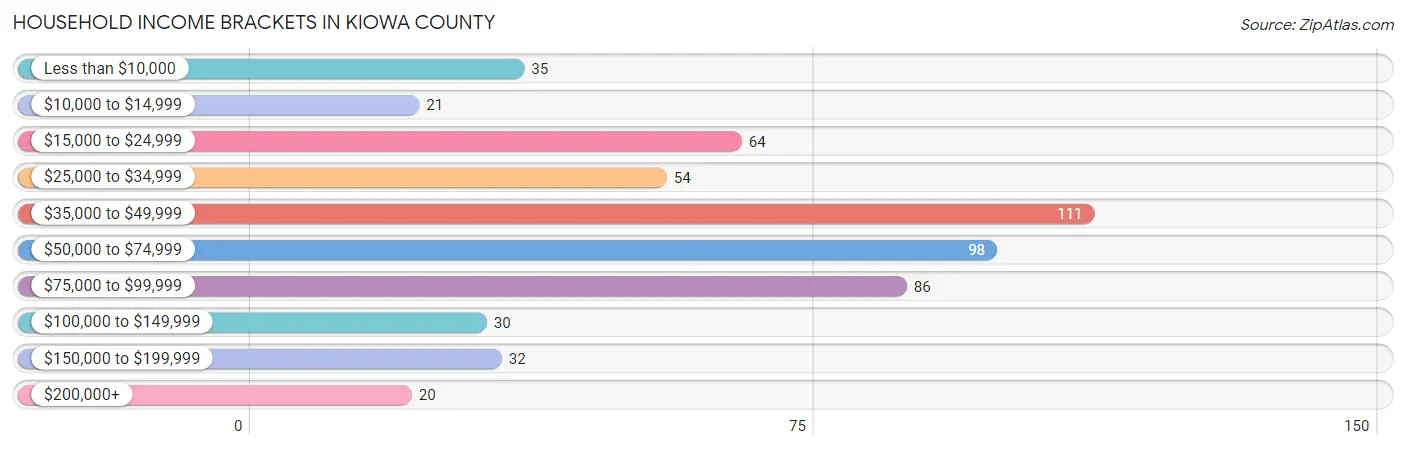
| Income Bracket | # Households | % Households |
| Less than $10,000 | 35 | 6.4% |
| $10,000 to $14,999 | 21 | 3.8% |
| $15,000 to $24,999 | 64 | 11.6% |
| $25,000 to $34,999 | 54 | 9.8% |
| $35,000 to $49,999 | 111 | 20.1% |
| $50,000 to $74,999 | 98 | 17.8% |
| $75,000 to $99,999 | 86 | 15.6% |
| $100,000 to $149,999 | 30 | 5.4% |
| $150,000 to $199,999 | 32 | 5.8% |
| $200,000+ | 20 | 3.6% |
Household Income by Householder Age in Kiowa County
The median household income in Kiowa County is $45,250, with the highest median household income of $61,250 found in the 45 to 64 years age bracket for the primary householder. A total of 181 households (32.9%) fall into this category. Meanwhile, the 15 to 24 years age bracket for the primary householder has the lowest median household income of $42,688, with 39 households (7.1%) in this group.
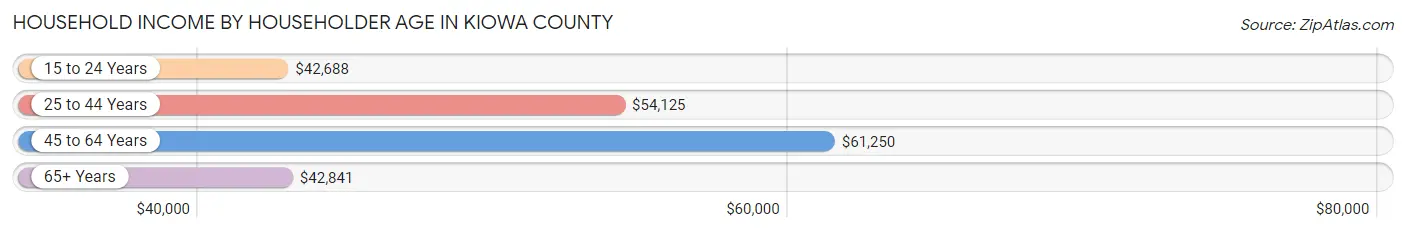
| Income Bracket | # Households | Median Income |
| 15 to 24 Years | 39 (7.1%) | $42,688 |
| 25 to 44 Years | 149 (27.0%) | $54,125 |
| 45 to 64 Years | 181 (32.9%) | $61,250 |
| 65+ Years | 182 (33.0%) | $42,841 |
| Total | 551 (100.0%) | $45,250 |
Poverty in Kiowa County
Income Below Poverty by Sex and Age in Kiowa County
With 12.3% poverty level for males and 19.3% for females among the residents of Kiowa County, under 5 year old males and 18 to 24 year old females are the most vulnerable to poverty, with 25 males (42.4%) and 40 females (66.7%) in their respective age groups living below the poverty level.
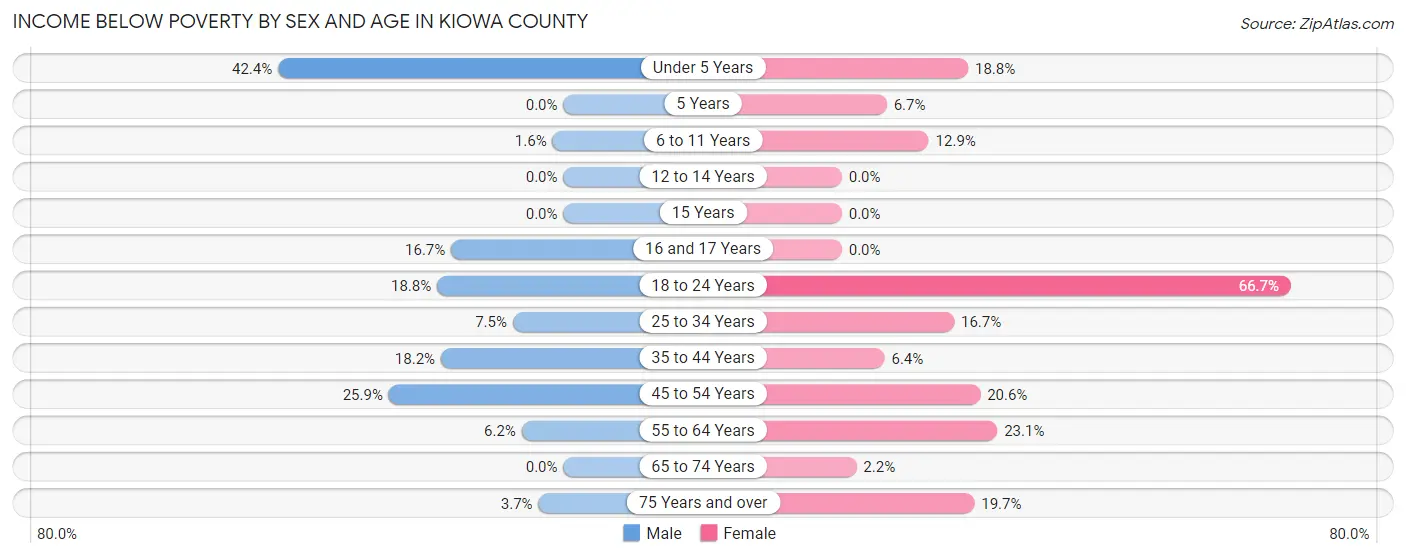
| Age Bracket | Male | Female |
| Under 5 Years | 25 (42.4%) | 12 (18.8%) |
| 5 Years | 0 (0.0%) | 1 (6.7%) |
| 6 to 11 Years | 1 (1.6%) | 4 (12.9%) |
| 12 to 14 Years | 0 (0.0%) | 0 (0.0%) |
| 15 Years | 0 (0.0%) | 0 (0.0%) |
| 16 and 17 Years | 3 (16.7%) | 0 (0.0%) |
| 18 to 24 Years | 6 (18.8%) | 40 (66.7%) |
| 25 to 34 Years | 3 (7.5%) | 13 (16.7%) |
| 35 to 44 Years | 18 (18.2%) | 4 (6.4%) |
| 45 to 54 Years | 14 (25.9%) | 15 (20.5%) |
| 55 to 64 Years | 6 (6.2%) | 30 (23.1%) |
| 65 to 74 Years | 0 (0.0%) | 2 (2.2%) |
| 75 Years and over | 1 (3.7%) | 12 (19.7%) |
| Total | 77 (12.3%) | 133 (19.3%) |
Income Above Poverty by Sex and Age in Kiowa County
According to the poverty statistics in Kiowa County, males aged 5 years and females aged 12 to 14 years are the age groups that are most secure financially, with 100.0% of males and 100.0% of females in these age groups living above the poverty line.
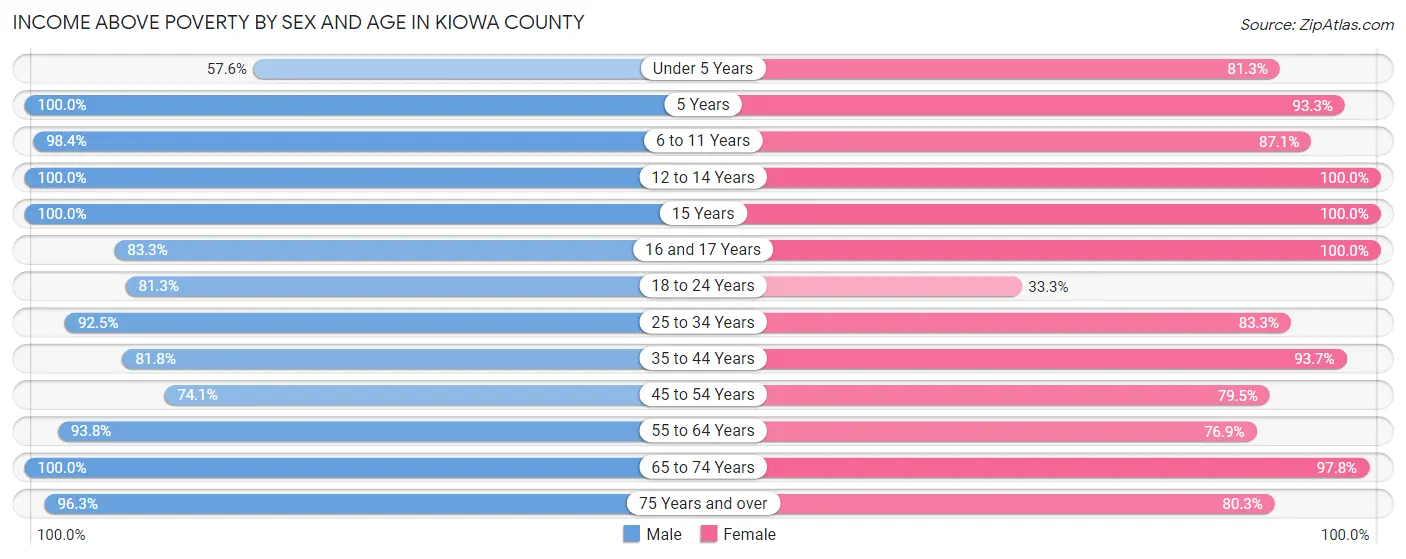
| Age Bracket | Male | Female |
| Under 5 Years | 34 (57.6%) | 52 (81.2%) |
| 5 Years | 4 (100.0%) | 14 (93.3%) |
| 6 to 11 Years | 61 (98.4%) | 27 (87.1%) |
| 12 to 14 Years | 23 (100.0%) | 7 (100.0%) |
| 15 Years | 27 (100.0%) | 8 (100.0%) |
| 16 and 17 Years | 15 (83.3%) | 7 (100.0%) |
| 18 to 24 Years | 26 (81.2%) | 20 (33.3%) |
| 25 to 34 Years | 37 (92.5%) | 65 (83.3%) |
| 35 to 44 Years | 81 (81.8%) | 59 (93.6%) |
| 45 to 54 Years | 40 (74.1%) | 58 (79.4%) |
| 55 to 64 Years | 91 (93.8%) | 100 (76.9%) |
| 65 to 74 Years | 86 (100.0%) | 90 (97.8%) |
| 75 Years and over | 26 (96.3%) | 49 (80.3%) |
| Total | 551 (87.7%) | 556 (80.7%) |
Income Below Poverty Among Married-Couple Families in Kiowa County
The poverty statistics for married-couple families in Kiowa County show that 10.3% or 29 of the total 281 families live below the poverty line. Families with 3 or 4 children have the highest poverty rate of 14.0%, comprising of 6 families. On the other hand, families with 1 or 2 children have the lowest poverty rate of 0.0%, which includes 0 families.
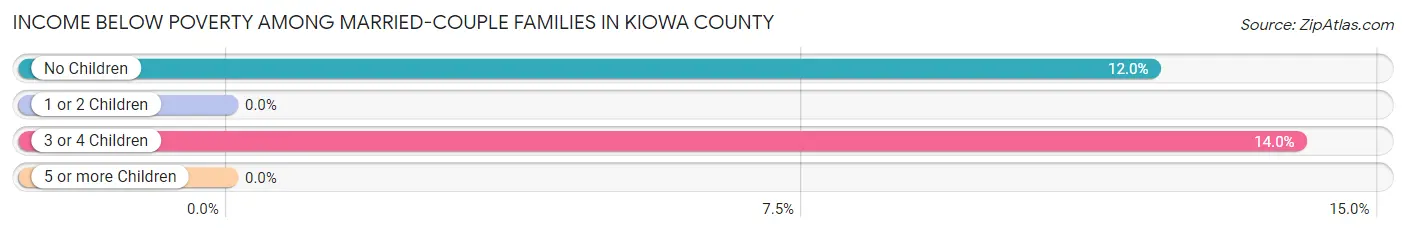
| Children | Above Poverty | Below Poverty |
| No Children | 168 (88.0%) | 23 (12.0%) |
| 1 or 2 Children | 47 (100.0%) | 0 (0.0%) |
| 3 or 4 Children | 37 (86.1%) | 6 (14.0%) |
| 5 or more Children | 0 (0.0%) | 0 (0.0%) |
| Total | 252 (89.7%) | 29 (10.3%) |
Income Below Poverty Among Single-Parent Households in Kiowa County
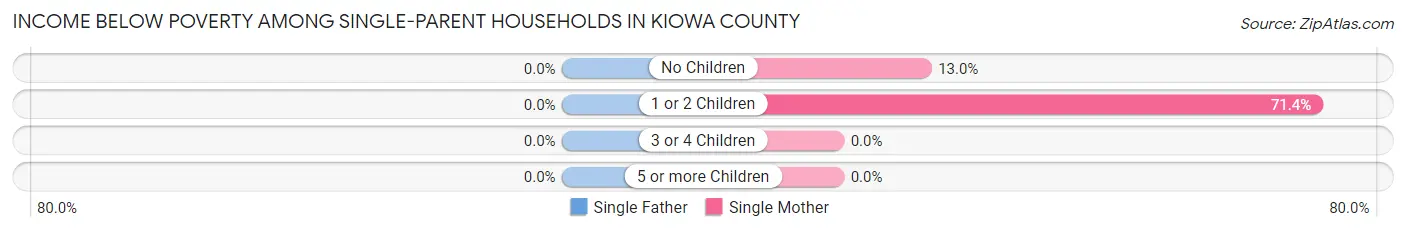
| Children | Single Father | Single Mother |
| No Children | 0 (0.0%) | 3 (13.0%) |
| 1 or 2 Children | 0 (0.0%) | 15 (71.4%) |
| 3 or 4 Children | 0 (0.0%) | 0 (0.0%) |
| 5 or more Children | 0 (0.0%) | 0 (0.0%) |
| Total | 0 (0.0%) | 18 (39.1%) |
Income Below Poverty Among Married-Couple vs Single-Parent Households in Kiowa County
The poverty data for Kiowa County shows that 29 of the married-couple family households (10.3%) and 18 of the single-parent households (31.6%) are living below the poverty level. Within the married-couple family households, those with 3 or 4 children have the highest poverty rate, with 6 households (14.0%) falling below the poverty line. Among the single-parent households, those with 1 or 2 children have the highest poverty rate, with 15 household (53.6%) living below poverty.
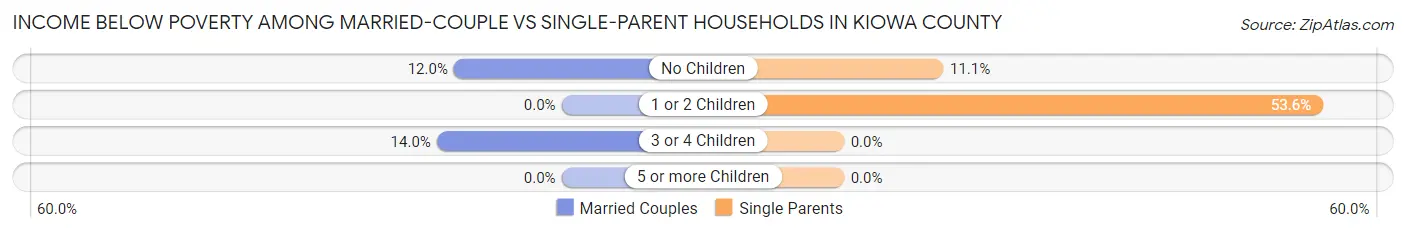
| Children | Married-Couple Families | Single-Parent Households |
| No Children | 23 (12.0%) | 3 (11.1%) |
| 1 or 2 Children | 0 (0.0%) | 15 (53.6%) |
| 3 or 4 Children | 6 (14.0%) | 0 (0.0%) |
| 5 or more Children | 0 (0.0%) | 0 (0.0%) |
| Total | 29 (10.3%) | 18 (31.6%) |
Race in Kiowa County
The most populous races in Kiowa County are White / Caucasian (1,306 | 97.0%), Hispanic or Latino (82 | 6.1%), and Two or more Races (24 | 1.8%).
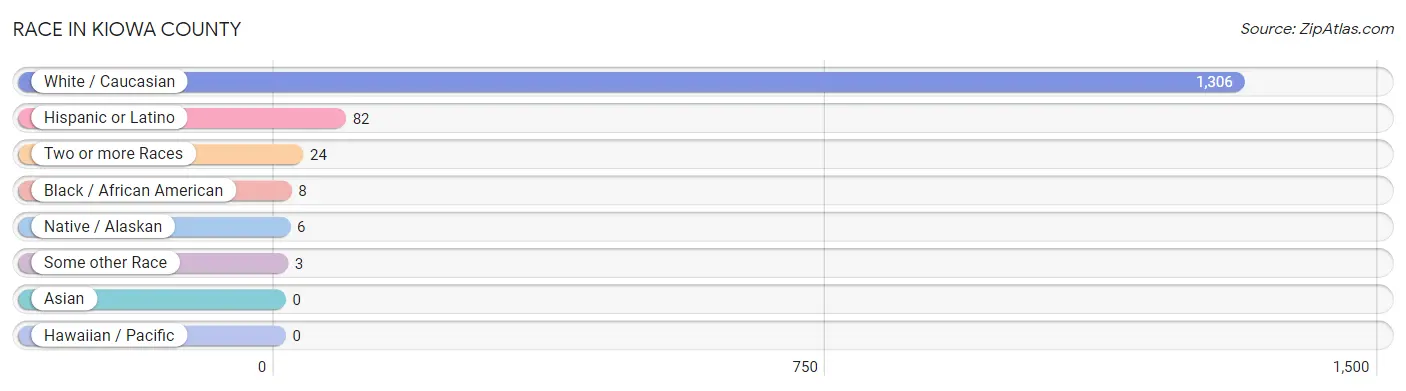
| Race | # Population | % Population |
| Asian | 0 | 0.0% |
| Black / African American | 8 | 0.6% |
| Hawaiian / Pacific | 0 | 0.0% |
| Hispanic or Latino | 82 | 6.1% |
| Native / Alaskan | 6 | 0.4% |
| White / Caucasian | 1,306 | 97.0% |
| Two or more Races | 24 | 1.8% |
| Some other Race | 3 | 0.2% |
| Total | 1,347 | 100.0% |
Ancestry in Kiowa County
The most populous ancestries reported in Kiowa County are German (454 | 33.7%), Irish (222 | 16.5%), English (197 | 14.6%), Mexican (82 | 6.1%), and American (72 | 5.3%), together accounting for 76.2% of all Kiowa County residents.
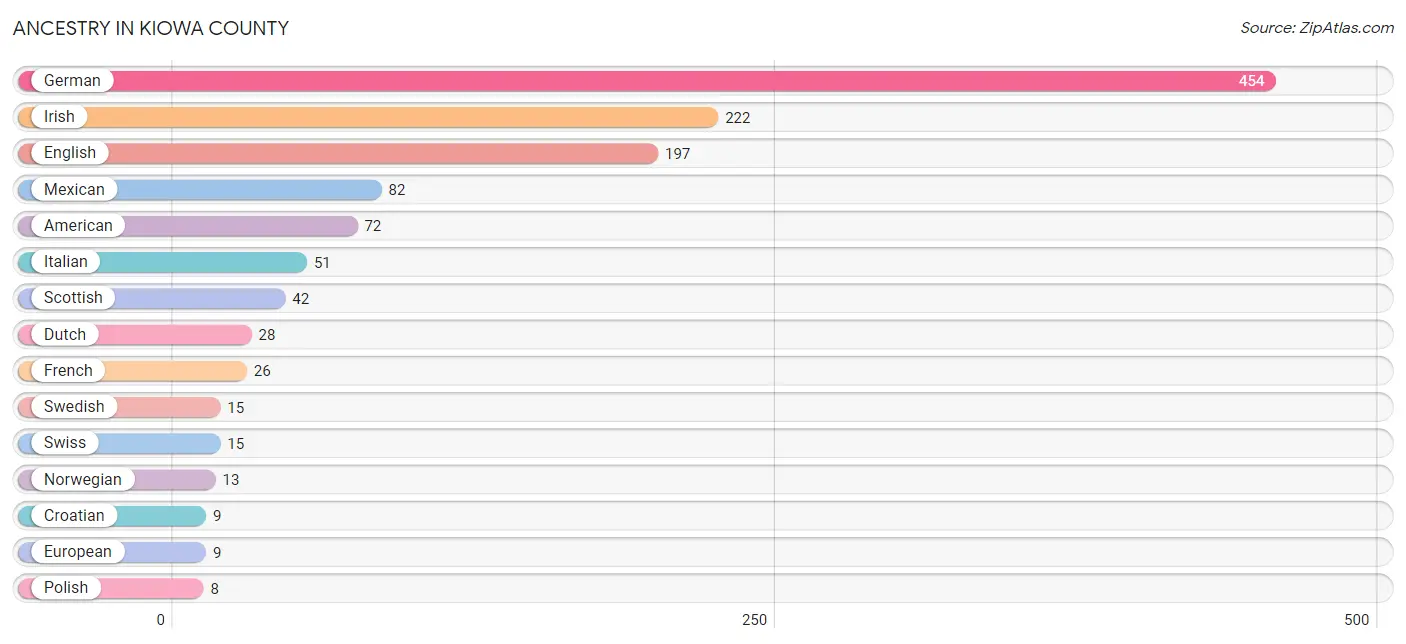
| Ancestry | # Population | % Population |
| American | 72 | 5.3% |
| Bulgarian | 1 | 0.1% |
| Cherokee | 2 | 0.2% |
| Chippewa | 3 | 0.2% |
| Colville | 2 | 0.2% |
| Croatian | 9 | 0.7% |
| Dutch | 28 | 2.1% |
| Eastern European | 2 | 0.2% |
| English | 197 | 14.6% |
| European | 9 | 0.7% |
| French | 26 | 1.9% |
| French Canadian | 2 | 0.2% |
| German | 454 | 33.7% |
| Irish | 222 | 16.5% |
| Italian | 51 | 3.8% |
| Mexican | 82 | 6.1% |
| Norwegian | 13 | 1.0% |
| Pennsylvania German | 2 | 0.2% |
| Polish | 8 | 0.6% |
| Potawatomi | 1 | 0.1% |
| Scandinavian | 3 | 0.2% |
| Scotch-Irish | 3 | 0.2% |
| Scottish | 42 | 3.1% |
| Slovene | 2 | 0.2% |
| Swedish | 15 | 1.1% |
| Swiss | 15 | 1.1% |
| Welsh | 2 | 0.2% | View All 27 Rows |
Immigrants in Kiowa County
The most numerous immigrant groups reported in Kiowa County came from Central America (35 | 2.6%), Latin America (35 | 2.6%), Mexico (35 | 2.6%), Eastern Europe (4 | 0.3%), and Europe (4 | 0.3%), together accounting for 8.4% of all Kiowa County residents.
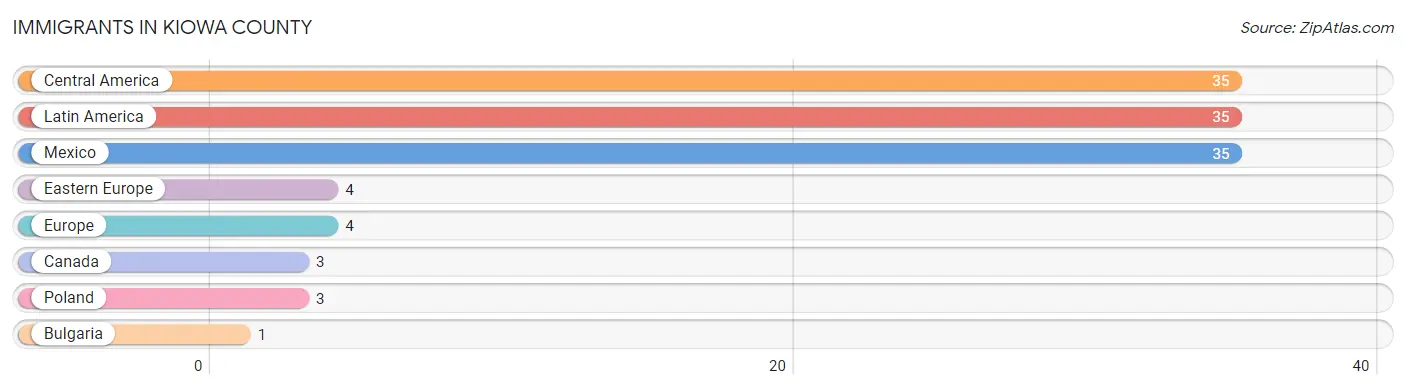
| Immigration Origin | # Population | % Population |
| Bulgaria | 1 | 0.1% |
| Canada | 3 | 0.2% |
| Central America | 35 | 2.6% |
| Eastern Europe | 4 | 0.3% |
| Europe | 4 | 0.3% |
| Latin America | 35 | 2.6% |
| Mexico | 35 | 2.6% |
| Poland | 3 | 0.2% | View All 8 Rows |
Sex and Age in Kiowa County
Sex and Age in Kiowa County
The most populous age groups in Kiowa County are 65 to 69 Years (64 | 10.1%) for men and 60 to 64 Years (72 | 10.1%) for women.
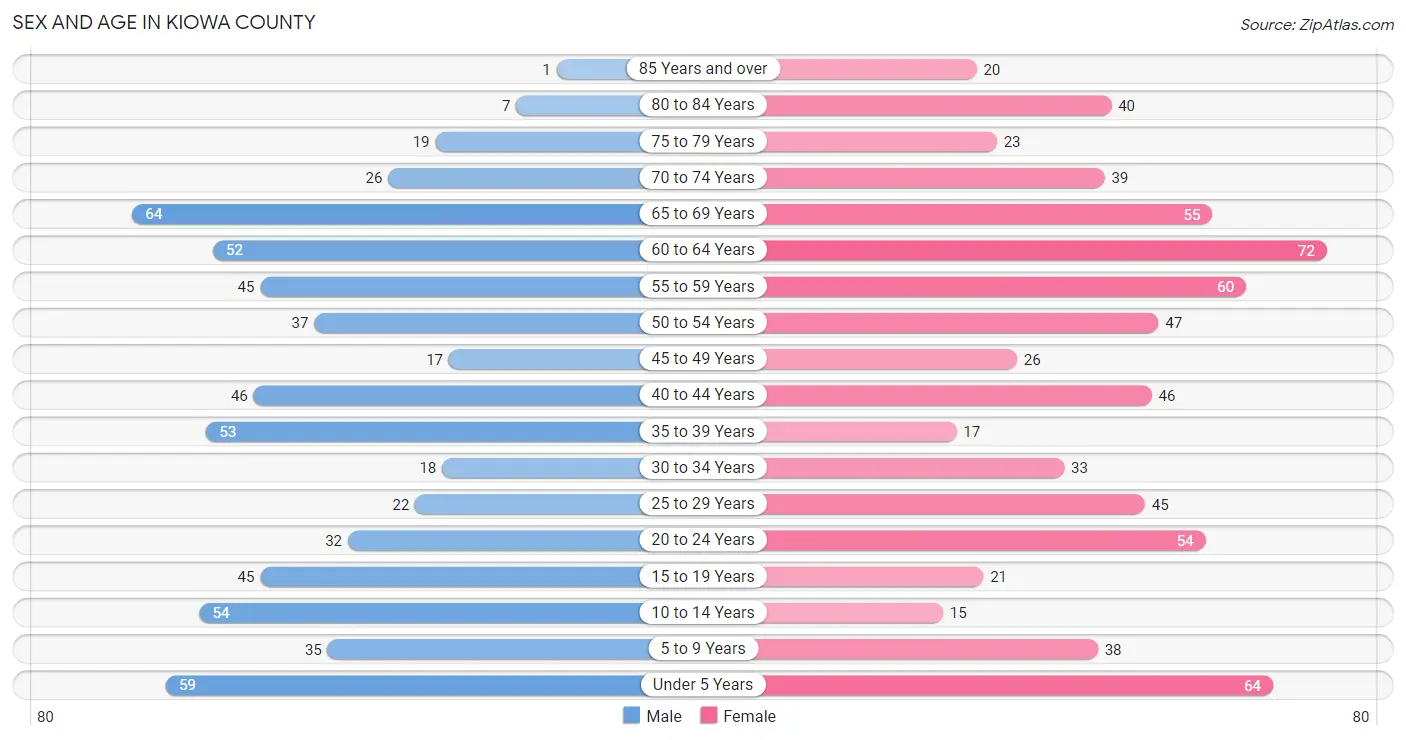
| Age Bracket | Male | Female |
| Under 5 Years | 59 (9.3%) | 64 (8.9%) |
| 5 to 9 Years | 35 (5.5%) | 38 (5.3%) |
| 10 to 14 Years | 54 (8.5%) | 15 (2.1%) |
| 15 to 19 Years | 45 (7.1%) | 21 (2.9%) |
| 20 to 24 Years | 32 (5.1%) | 54 (7.5%) |
| 25 to 29 Years | 22 (3.5%) | 45 (6.3%) |
| 30 to 34 Years | 18 (2.9%) | 33 (4.6%) |
| 35 to 39 Years | 53 (8.4%) | 17 (2.4%) |
| 40 to 44 Years | 46 (7.3%) | 46 (6.4%) |
| 45 to 49 Years | 17 (2.7%) | 26 (3.6%) |
| 50 to 54 Years | 37 (5.9%) | 47 (6.6%) |
| 55 to 59 Years | 45 (7.1%) | 60 (8.4%) |
| 60 to 64 Years | 52 (8.2%) | 72 (10.1%) |
| 65 to 69 Years | 64 (10.1%) | 55 (7.7%) |
| 70 to 74 Years | 26 (4.1%) | 39 (5.4%) |
| 75 to 79 Years | 19 (3.0%) | 23 (3.2%) |
| 80 to 84 Years | 7 (1.1%) | 40 (5.6%) |
| 85 Years and over | 1 (0.2%) | 20 (2.8%) |
| Total | 632 (100.0%) | 715 (100.0%) |
Families and Households in Kiowa County
Median Family Size in Kiowa County
The median family size in Kiowa County is 2.96 persons per family, with married-couple families (281 | 83.1%) accounting for the largest median family size of 3.07 persons per family. On the other hand, single female/mother families (46 | 13.6%) represent the smallest median family size with 2.24 persons per family.
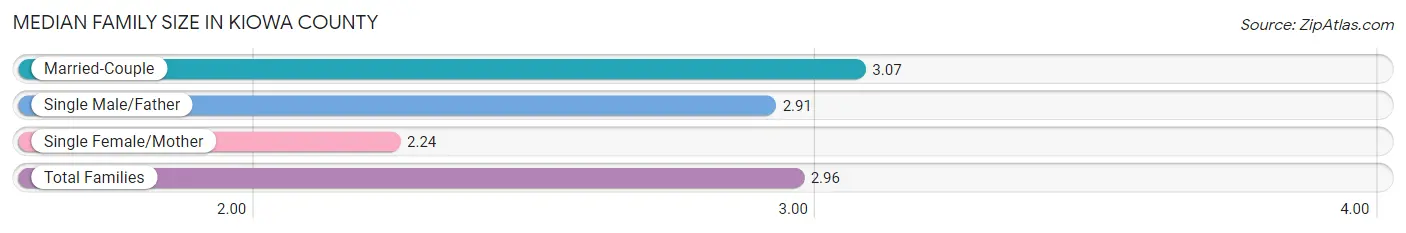
| Family Type | # Families | Family Size |
| Married-Couple | 281 (83.1%) | 3.07 |
| Single Male/Father | 11 (3.3%) | 2.91 |
| Single Female/Mother | 46 (13.6%) | 2.24 |
| Total Families | 338 (100.0%) | 2.96 |
Median Household Size in Kiowa County
The median household size in Kiowa County is 2.37 persons per household, with single male/father households (11 | 2.0%) accounting for the largest median household size of 3.27 persons per household. non-family households (213 | 38.7%) represent the smallest median household size with 1.37 persons per household.
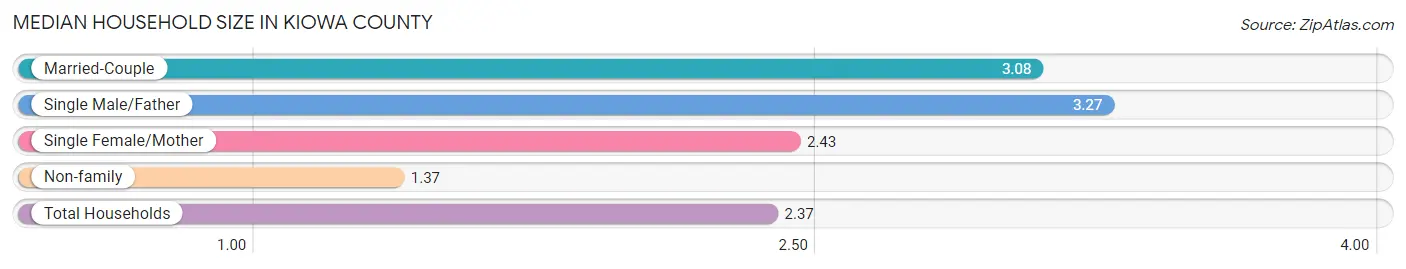
| Household Type | # Households | Household Size |
| Married-Couple | 281 (51.0%) | 3.08 |
| Single Male/Father | 11 (2.0%) | 3.27 |
| Single Female/Mother | 46 (8.4%) | 2.43 |
| Non-family | 213 (38.7%) | 1.37 |
| Total Households | 551 (100.0%) | 2.37 |
Household Size by Marriage Status in Kiowa County
Out of a total of 551 households in Kiowa County, 338 (61.3%) are family households, while 213 (38.7%) are nonfamily households. The most numerous type of family households are 2-person households, comprising 212, and the most common type of nonfamily households are 1-person households, comprising 151.
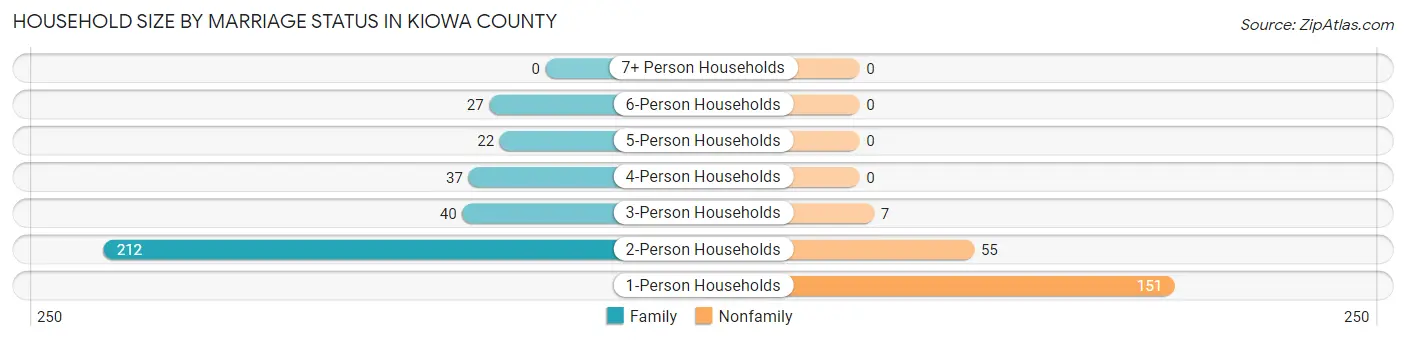
| Household Size | Family Households | Nonfamily Households |
| 1-Person Households | - | 151 (27.4%) |
| 2-Person Households | 212 (38.5%) | 55 (10.0%) |
| 3-Person Households | 40 (7.3%) | 7 (1.3%) |
| 4-Person Households | 37 (6.7%) | 0 (0.0%) |
| 5-Person Households | 22 (4.0%) | 0 (0.0%) |
| 6-Person Households | 27 (4.9%) | 0 (0.0%) |
| 7+ Person Households | 0 (0.0%) | 0 (0.0%) |
| Total | 338 (61.3%) | 213 (38.7%) |
Female Fertility in Kiowa County
Fertility by Age in Kiowa County
Average fertility rate in Kiowa County is 103.0 births per 1,000 women. Women in the age bracket of 20 to 34 years have the highest fertility rate with 159.0 births per 1,000 women. Women in the age bracket of 20 to 34 years acount for 84.0% of all women with births.
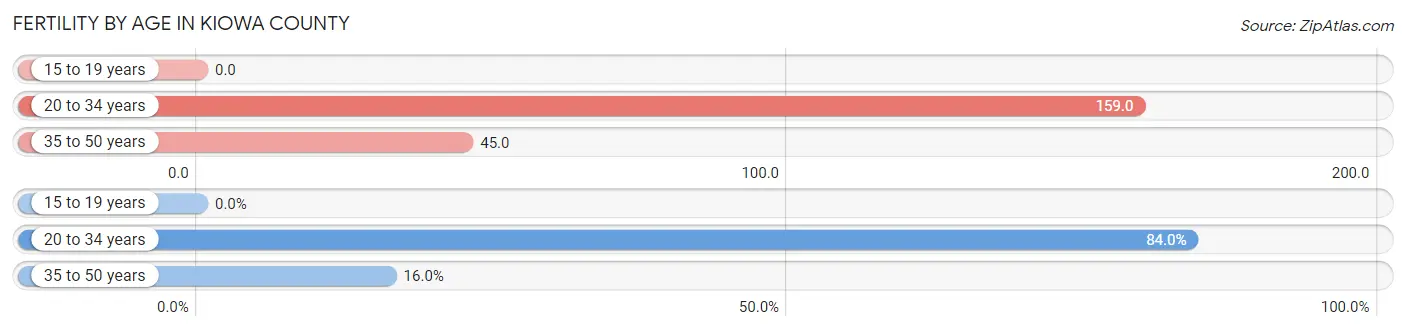
| Age Bracket | Women with Births | Births / 1,000 Women |
| 15 to 19 years | 0 (0.0%) | 0.0 |
| 20 to 34 years | 21 (84.0%) | 159.0 |
| 35 to 50 years | 4 (16.0%) | 45.0 |
| Total | 25 (100.0%) | 103.0 |
Fertility by Age by Marriage Status in Kiowa County
44.0% of women with births (25) in Kiowa County are married. The highest percentage of unmarried women with births falls into 20 to 34 years age bracket with 66.7% of them unmarried at the time of birth, while the lowest percentage of unmarried women with births belong to 35 to 50 years age bracket with 0.0% of them unmarried.
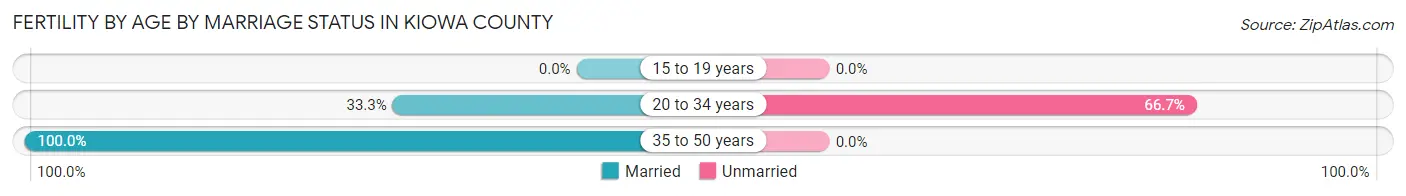
| Age Bracket | Married | Unmarried |
| 15 to 19 years | 0 (0.0%) | 0 (0.0%) |
| 20 to 34 years | 7 (33.3%) | 14 (66.7%) |
| 35 to 50 years | 4 (100.0%) | 0 (0.0%) |
| Total | 11 (44.0%) | 14 (56.0%) |
Fertility by Education in Kiowa County
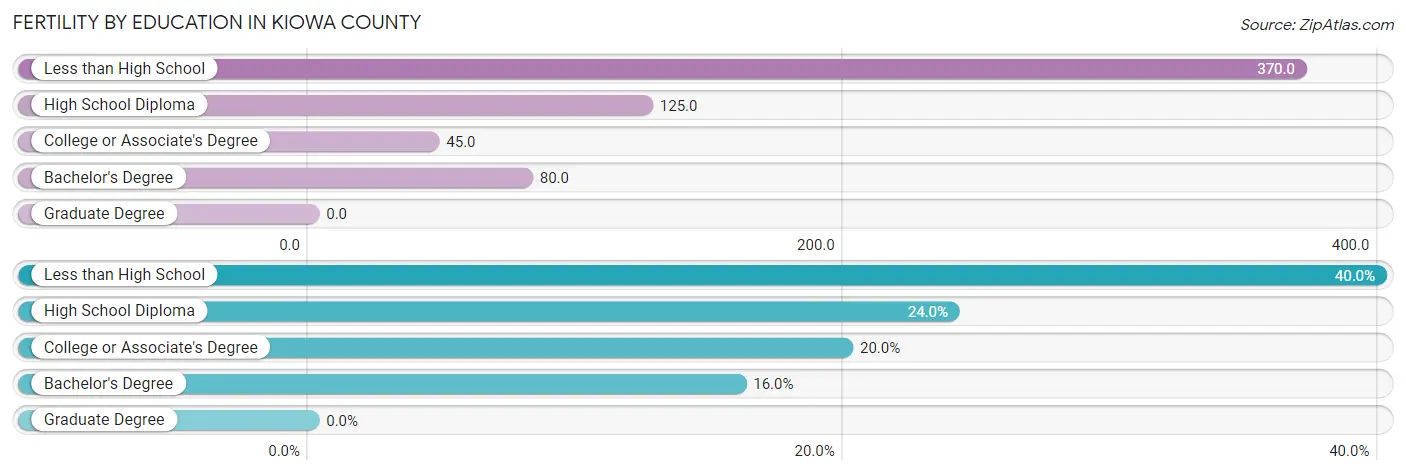
| Educational Attainment | Women with Births | Births / 1,000 Women |
| Less than High School | 10 (40.0%) | 370.0 |
| High School Diploma | 6 (24.0%) | 125.0 |
| College or Associate's Degree | 5 (20.0%) | 45.0 |
| Bachelor's Degree | 4 (16.0%) | 80.0 |
| Graduate Degree | 0 (0.0%) | 0.0 |
| Total | 25 (100.0%) | 103.0 |
Fertility by Education by Marriage Status in Kiowa County
56.0% of women with births in Kiowa County are unmarried. Women with the educational attainment of high school diploma are most likely to be married with 100.0% of them married at childbirth, while women with the educational attainment of college or associate's degree are least likely to be married with 100.0% of them unmarried at childbirth.
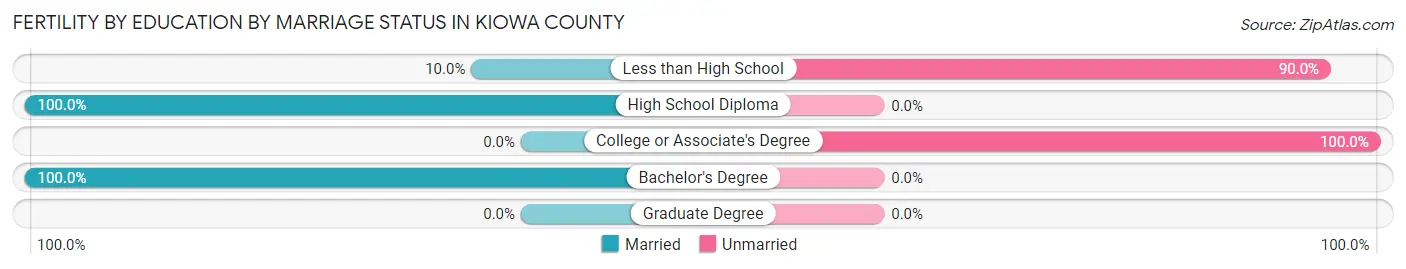
| Educational Attainment | Married | Unmarried |
| Less than High School | 1 (10.0%) | 9 (90.0%) |
| High School Diploma | 6 (100.0%) | 0 (0.0%) |
| College or Associate's Degree | 0 (0.0%) | 5 (100.0%) |
| Bachelor's Degree | 4 (100.0%) | 0 (0.0%) |
| Graduate Degree | 0 (0.0%) | 0 (0.0%) |
| Total | 11 (44.0%) | 14 (56.0%) |
Employment Characteristics in Kiowa County
Employment by Class of Employer in Kiowa County
Among the 624 employed individuals in Kiowa County, private company employees (280 | 44.9%), local government employees (98 | 15.7%), and self-employed (not incorporated) (82 | 13.1%) make up the most common classes of employment.
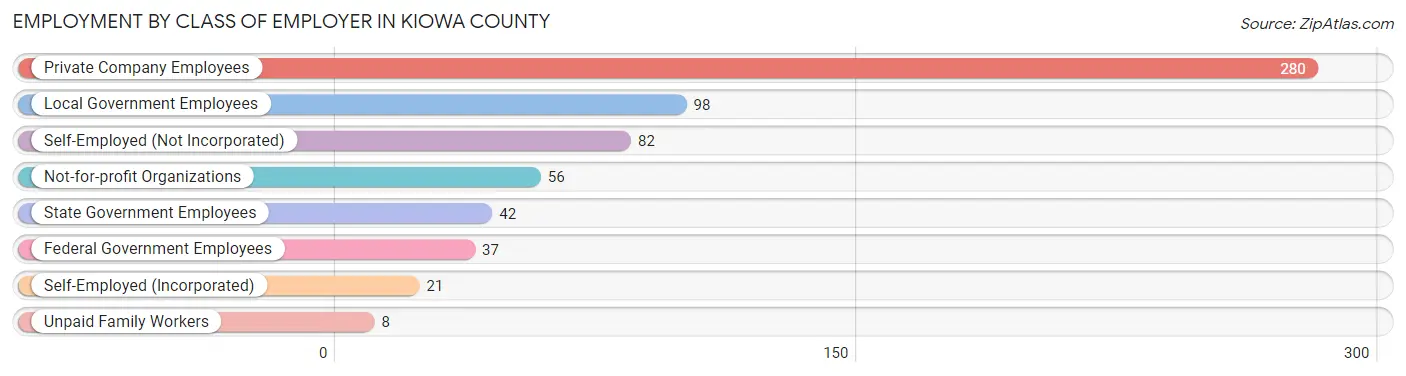
| Employer Class | # Employees | % Employees |
| Private Company Employees | 280 | 44.9% |
| Self-Employed (Incorporated) | 21 | 3.4% |
| Self-Employed (Not Incorporated) | 82 | 13.1% |
| Not-for-profit Organizations | 56 | 9.0% |
| Local Government Employees | 98 | 15.7% |
| State Government Employees | 42 | 6.7% |
| Federal Government Employees | 37 | 5.9% |
| Unpaid Family Workers | 8 | 1.3% |
| Total | 624 | 100.0% |
Employment Status by Age in Kiowa County
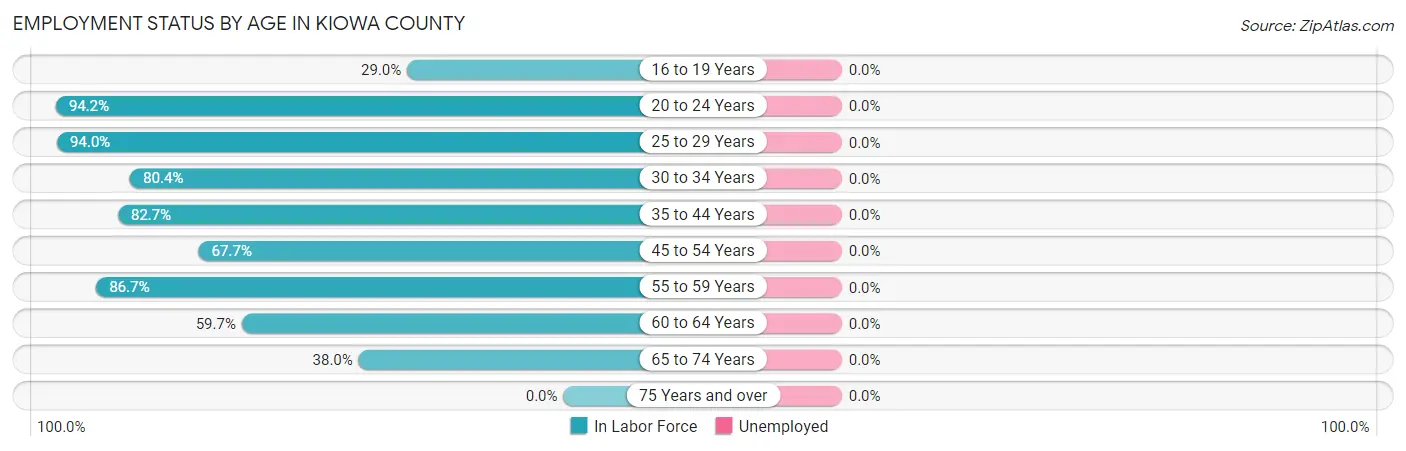
| Age Bracket | In Labor Force | Unemployed |
| 16 to 19 Years | 9 (29.0%) | 0 (0.0%) |
| 20 to 24 Years | 81 (94.2%) | 0 (0.0%) |
| 25 to 29 Years | 63 (94.0%) | 0 (0.0%) |
| 30 to 34 Years | 41 (80.4%) | 0 (0.0%) |
| 35 to 44 Years | 134 (82.7%) | 0 (0.0%) |
| 45 to 54 Years | 86 (67.7%) | 0 (0.0%) |
| 55 to 59 Years | 91 (86.7%) | 0 (0.0%) |
| 60 to 64 Years | 74 (59.7%) | 0 (0.0%) |
| 65 to 74 Years | 70 (38.0%) | 0 (0.0%) |
| 75 Years and over | 0 (0.0%) | 0 (0.0%) |
| Total | 649 (62.0%) | 0 (0.0%) |
Employment Status by Educational Attainment in Kiowa County
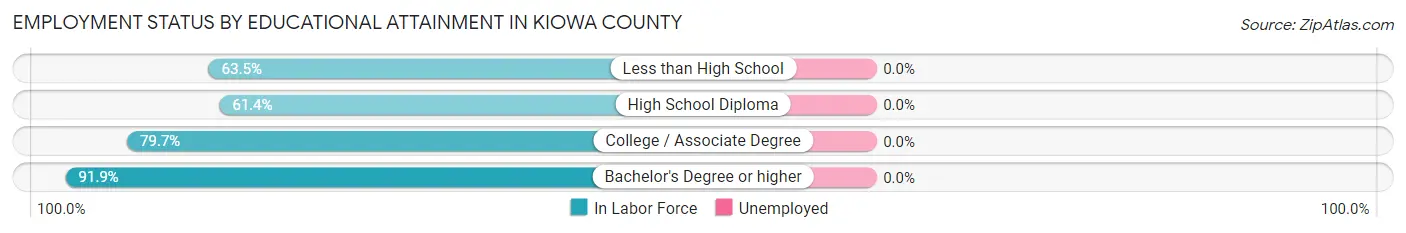
| Educational Attainment | In Labor Force | Unemployed |
| Less than High School | 40 (63.5%) | 0 (0.0%) |
| High School Diploma | 81 (61.4%) | 0 (0.0%) |
| College / Associate Degree | 244 (79.7%) | 0 (0.0%) |
| Bachelor's Degree or higher | 124 (91.9%) | 0 (0.0%) |
| Total | 489 (76.9%) | 0 (0.0%) |
Employment Occupations by Sex in Kiowa County
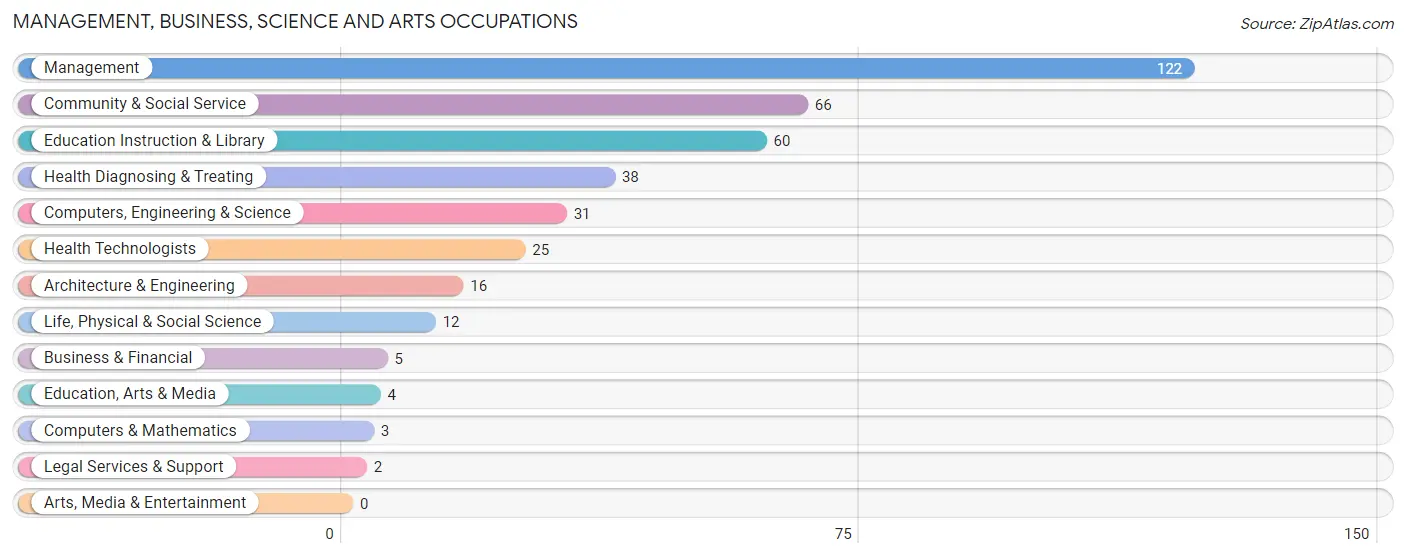
Management, Business, Science and Arts Occupations
The most common Management, Business, Science and Arts occupations in Kiowa County are Management (122 | 18.8%), Community & Social Service (66 | 10.2%), Education Instruction & Library (60 | 9.2%), Health Diagnosing & Treating (38 | 5.9%), and Computers, Engineering & Science (31 | 4.8%).
Management, Business, Science and Arts Occupations by Sex
Within the Management, Business, Science and Arts occupations in Kiowa County, the most male-oriented occupations are Architecture & Engineering (100.0%), Legal Services & Support (100.0%), and Management (76.2%), while the most female-oriented occupations are Computers & Mathematics (100.0%), Life, Physical & Social Science (100.0%), and Health Diagnosing & Treating (100.0%).
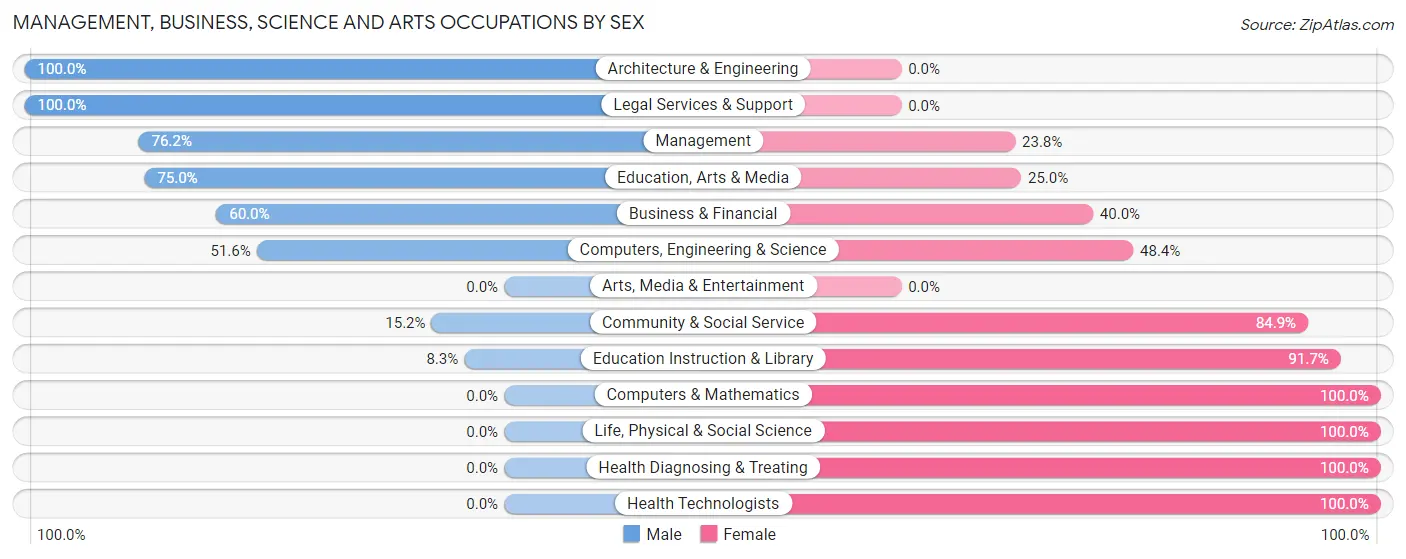
| Occupation | Male | Female |
| Management | 93 (76.2%) | 29 (23.8%) |
| Business & Financial | 3 (60.0%) | 2 (40.0%) |
| Computers, Engineering & Science | 16 (51.6%) | 15 (48.4%) |
| Computers & Mathematics | 0 (0.0%) | 3 (100.0%) |
| Architecture & Engineering | 16 (100.0%) | 0 (0.0%) |
| Life, Physical & Social Science | 0 (0.0%) | 12 (100.0%) |
| Community & Social Service | 10 (15.1%) | 56 (84.9%) |
| Education, Arts & Media | 3 (75.0%) | 1 (25.0%) |
| Legal Services & Support | 2 (100.0%) | 0 (0.0%) |
| Education Instruction & Library | 5 (8.3%) | 55 (91.7%) |
| Arts, Media & Entertainment | 0 (0.0%) | 0 (0.0%) |
| Health Diagnosing & Treating | 0 (0.0%) | 38 (100.0%) |
| Health Technologists | 0 (0.0%) | 25 (100.0%) |
| Total (Category) | 122 (46.6%) | 140 (53.4%) |
| Total (Overall) | 320 (49.3%) | 329 (50.7%) |
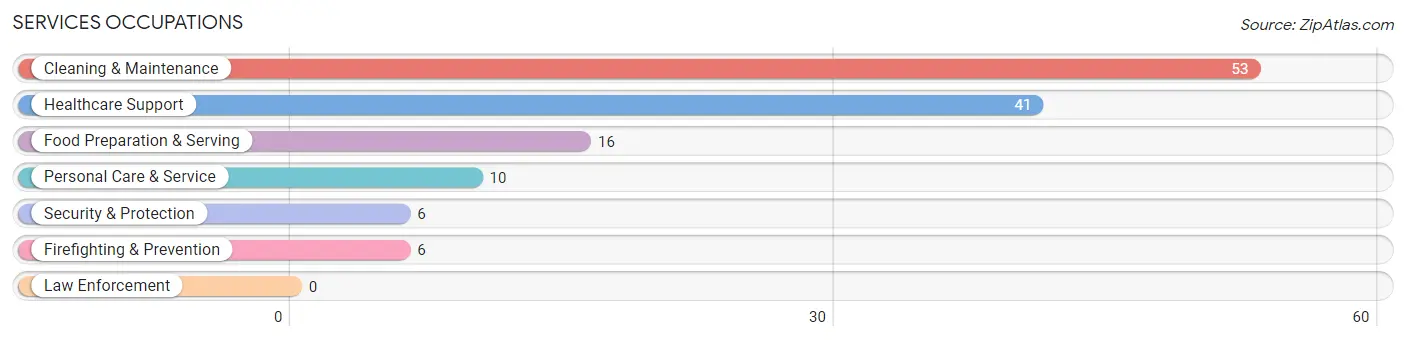
Services Occupations
The most common Services occupations in Kiowa County are Cleaning & Maintenance (53 | 8.2%), Healthcare Support (41 | 6.3%), Food Preparation & Serving (16 | 2.5%), Personal Care & Service (10 | 1.5%), and Security & Protection (6 | 0.9%).
Services Occupations by Sex
Within the Services occupations in Kiowa County, the most male-oriented occupations are Security & Protection (66.7%), Firefighting & Prevention (66.7%), and Food Preparation & Serving (12.5%), while the most female-oriented occupations are Personal Care & Service (100.0%), Healthcare Support (92.7%), and Cleaning & Maintenance (88.7%).
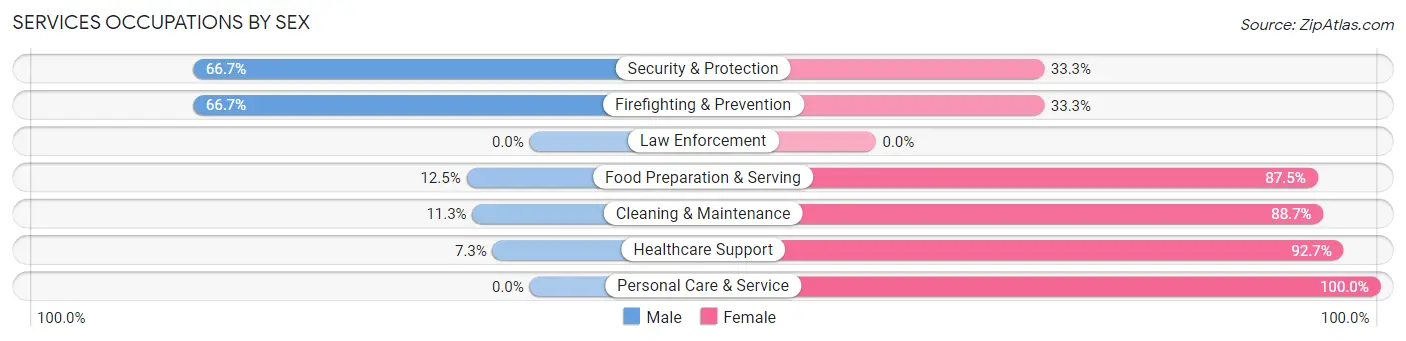
| Occupation | Male | Female |
| Healthcare Support | 3 (7.3%) | 38 (92.7%) |
| Security & Protection | 4 (66.7%) | 2 (33.3%) |
| Firefighting & Prevention | 4 (66.7%) | 2 (33.3%) |
| Law Enforcement | 0 (0.0%) | 0 (0.0%) |
| Food Preparation & Serving | 2 (12.5%) | 14 (87.5%) |
| Cleaning & Maintenance | 6 (11.3%) | 47 (88.7%) |
| Personal Care & Service | 0 (0.0%) | 10 (100.0%) |
| Total (Category) | 15 (11.9%) | 111 (88.1%) |
| Total (Overall) | 320 (49.3%) | 329 (50.7%) |
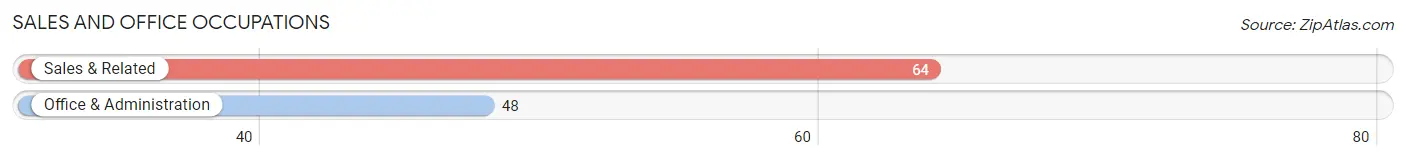
Sales and Office Occupations
The most common Sales and Office occupations in Kiowa County are Sales & Related (64 | 9.9%), and Office & Administration (48 | 7.4%).
Sales and Office Occupations by Sex
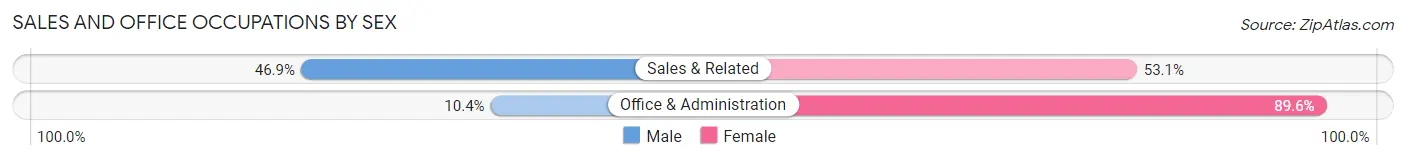
| Occupation | Male | Female |
| Sales & Related | 30 (46.9%) | 34 (53.1%) |
| Office & Administration | 5 (10.4%) | 43 (89.6%) |
| Total (Category) | 35 (31.2%) | 77 (68.8%) |
| Total (Overall) | 320 (49.3%) | 329 (50.7%) |
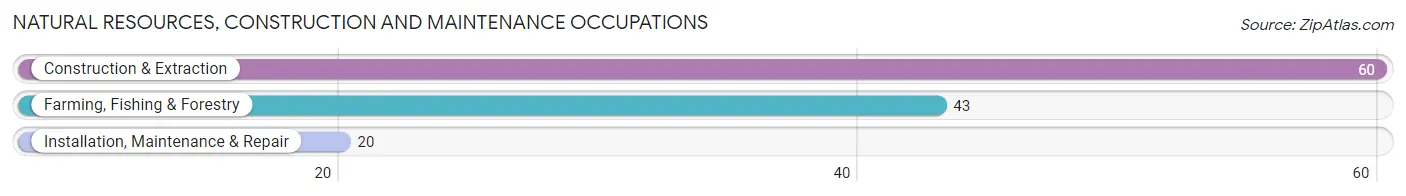
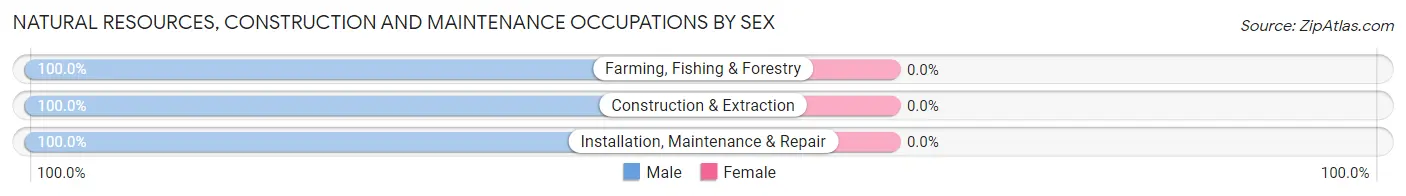
Natural Resources, Construction and Maintenance Occupations
The most common Natural Resources, Construction and Maintenance occupations in Kiowa County are Construction & Extraction (60 | 9.2%), Farming, Fishing & Forestry (43 | 6.6%), and Installation, Maintenance & Repair (20 | 3.1%).
Natural Resources, Construction and Maintenance Occupations by Sex
| Occupation | Male | Female |
| Farming, Fishing & Forestry | 43 (100.0%) | 0 (0.0%) |
| Construction & Extraction | 60 (100.0%) | 0 (0.0%) |
| Installation, Maintenance & Repair | 20 (100.0%) | 0 (0.0%) |
| Total (Category) | 123 (100.0%) | 0 (0.0%) |
| Total (Overall) | 320 (49.3%) | 329 (50.7%) |
Production, Transportation and Moving Occupations
The most common Production, Transportation and Moving occupations in Kiowa County are Transportation (21 | 3.2%), Production (3 | 0.5%), and Material Moving (2 | 0.3%).
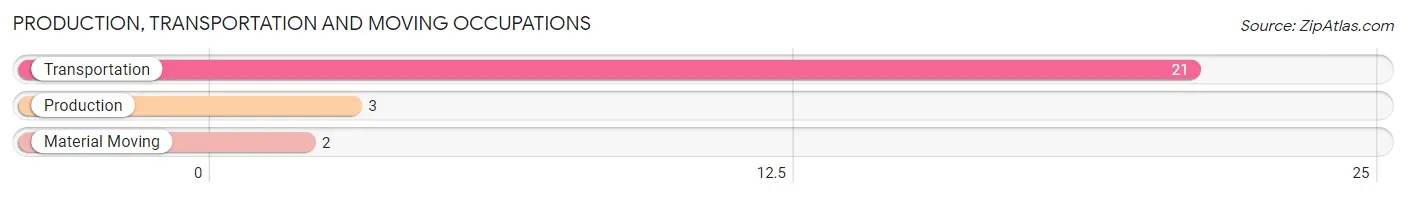
Production, Transportation and Moving Occupations by Sex
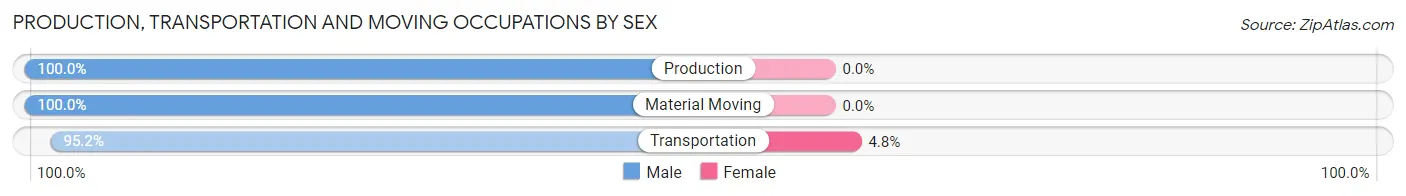
| Occupation | Male | Female |
| Production | 3 (100.0%) | 0 (0.0%) |
| Transportation | 20 (95.2%) | 1 (4.8%) |
| Material Moving | 2 (100.0%) | 0 (0.0%) |
| Total (Category) | 25 (96.2%) | 1 (3.8%) |
| Total (Overall) | 320 (49.3%) | 329 (50.7%) |
Employment Industries by Sex in Kiowa County
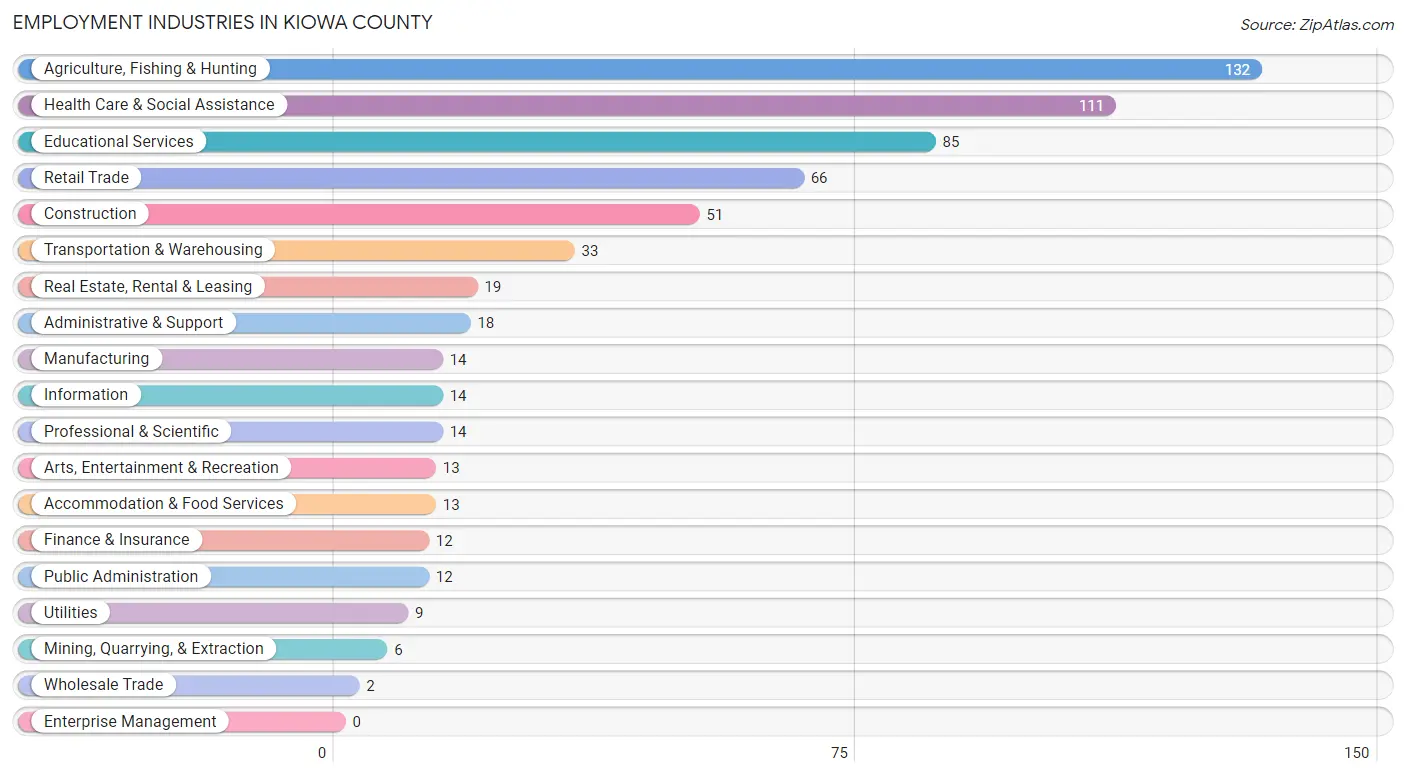
Employment Industries in Kiowa County
The major employment industries in Kiowa County include Agriculture, Fishing & Hunting (132 | 20.3%), Health Care & Social Assistance (111 | 17.1%), Educational Services (85 | 13.1%), Retail Trade (66 | 10.2%), and Construction (51 | 7.9%).
Employment Industries by Sex in Kiowa County
The Kiowa County industries that see more men than women are Mining, Quarrying, & Extraction (100.0%), Construction (100.0%), and Agriculture, Fishing & Hunting (90.9%), whereas the industries that tend to have a higher number of women are Finance & Insurance (100.0%), Health Care & Social Assistance (95.5%), and Real Estate, Rental & Leasing (94.7%).
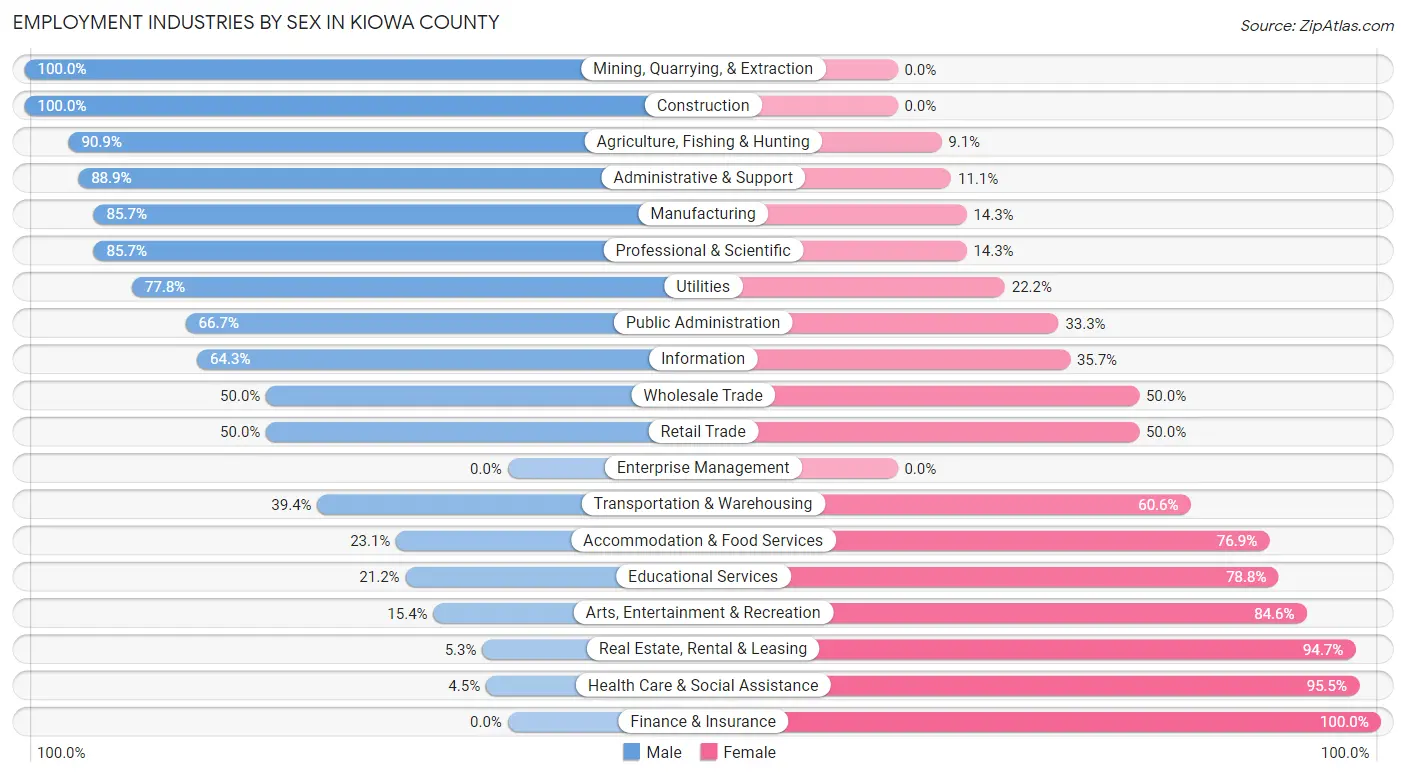
| Industry | Male | Female |
| Agriculture, Fishing & Hunting | 120 (90.9%) | 12 (9.1%) |
| Mining, Quarrying, & Extraction | 6 (100.0%) | 0 (0.0%) |
| Construction | 51 (100.0%) | 0 (0.0%) |
| Manufacturing | 12 (85.7%) | 2 (14.3%) |
| Wholesale Trade | 1 (50.0%) | 1 (50.0%) |
| Retail Trade | 33 (50.0%) | 33 (50.0%) |
| Transportation & Warehousing | 13 (39.4%) | 20 (60.6%) |
| Utilities | 7 (77.8%) | 2 (22.2%) |
| Information | 9 (64.3%) | 5 (35.7%) |
| Finance & Insurance | 0 (0.0%) | 12 (100.0%) |
| Real Estate, Rental & Leasing | 1 (5.3%) | 18 (94.7%) |
| Professional & Scientific | 12 (85.7%) | 2 (14.3%) |
| Enterprise Management | 0 (0.0%) | 0 (0.0%) |
| Administrative & Support | 16 (88.9%) | 2 (11.1%) |
| Educational Services | 18 (21.2%) | 67 (78.8%) |
| Health Care & Social Assistance | 5 (4.5%) | 106 (95.5%) |
| Arts, Entertainment & Recreation | 2 (15.4%) | 11 (84.6%) |
| Accommodation & Food Services | 3 (23.1%) | 10 (76.9%) |
| Public Administration | 8 (66.7%) | 4 (33.3%) |
| Total | 320 (49.3%) | 329 (50.7%) |
Education in Kiowa County
School Enrollment in Kiowa County
The most common levels of schooling among the 308 students in Kiowa County are nursery / preschool (75 | 24.3%), elementary school (70 | 22.7%), and high school (60 | 19.5%).
| School Level | # Students | % Students |
| Nursery / Preschool | 75 | 24.3% |
| Kindergarten | 14 | 4.5% |
| Elementary School | 70 | 22.7% |
| Middle School | 41 | 13.3% |
| High School | 60 | 19.5% |
| College / Undergraduate | 47 | 15.3% |
| Graduate / Professional | 1 | 0.3% |
| Total | 308 | 100.0% |
School Enrollment by Age by Funding Source in Kiowa County
Out of a total of 308 students who are enrolled in schools in Kiowa County, 23 (7.5%) attend a private institution, while the remaining 285 (92.5%) are enrolled in public schools. The age group of 25 to 34 year olds has the highest likelihood of being enrolled in private schools, with 9 (30.0% in the age bracket) enrolled. Conversely, the age group of 15 to 17 year olds has the lowest likelihood of being enrolled in a private school, with 60 (100.0% in the age bracket) attending a public institution.
| Age Bracket | Public School | Private School |
| 3 to 4 Year Olds | 53 (91.4%) | 5 (8.6%) |
| 5 to 9 Year Old | 65 (89.0%) | 8 (11.0%) |
| 10 to 14 Year Olds | 68 (98.6%) | 1 (1.5%) |
| 15 to 17 Year Olds | 60 (100.0%) | 0 (0.0%) |
| 18 to 19 Year Olds | 6 (100.0%) | 0 (0.0%) |
| 20 to 24 Year Olds | 12 (100.0%) | 0 (0.0%) |
| 25 to 34 Year Olds | 21 (70.0%) | 9 (30.0%) |
| 35 Years and over | 0 (0.0%) | 0 (0.0%) |
| Total | 285 (92.5%) | 23 (7.5%) |
Educational Attainment by Field of Study in Kiowa County
Business (43 | 21.6%), bio, nature & agricultural (40 | 20.1%), education (33 | 16.6%), social sciences (19 | 9.6%), and liberal arts & history (14 | 7.0%) are the most common fields of study among 199 individuals in Kiowa County who have obtained a bachelor's degree or higher.
| Field of Study | # Graduates | % Graduates |
| Computers & Mathematics | 12 | 6.0% |
| Bio, Nature & Agricultural | 40 | 20.1% |
| Physical & Health Sciences | 4 | 2.0% |
| Psychology | 4 | 2.0% |
| Social Sciences | 19 | 9.6% |
| Engineering | 3 | 1.5% |
| Multidisciplinary Studies | 0 | 0.0% |
| Science & Technology | 12 | 6.0% |
| Business | 43 | 21.6% |
| Education | 33 | 16.6% |
| Literature & Languages | 8 | 4.0% |
| Liberal Arts & History | 14 | 7.0% |
| Visual & Performing Arts | 2 | 1.0% |
| Communications | 1 | 0.5% |
| Arts & Humanities | 4 | 2.0% |
| Total | 199 | 100.0% |
Transportation & Commute in Kiowa County
Vehicle Availability by Sex in Kiowa County
The most prevalent vehicle ownership categories in Kiowa County are males with 2 vehicles (149, accounting for 48.7%) and females with 2 vehicles (118, making up 47.8%).
| Vehicles Available | Male | Female |
| No Vehicle | 0 (0.0%) | 0 (0.0%) |
| 1 Vehicle | 36 (11.8%) | 64 (20.5%) |
| 2 Vehicles | 149 (48.7%) | 118 (37.8%) |
| 3 Vehicles | 68 (22.2%) | 70 (22.4%) |
| 4 Vehicles | 26 (8.5%) | 38 (12.2%) |
| 5 or more Vehicles | 27 (8.8%) | 22 (7.0%) |
| Total | 306 (100.0%) | 312 (100.0%) |
Commute Time in Kiowa County
The most frequently occuring commute durations in Kiowa County are less than 5 minutes (191 commuters, 31.4%), 5 to 9 minutes (132 commuters, 21.7%), and 20 to 24 minutes (56 commuters, 9.2%).
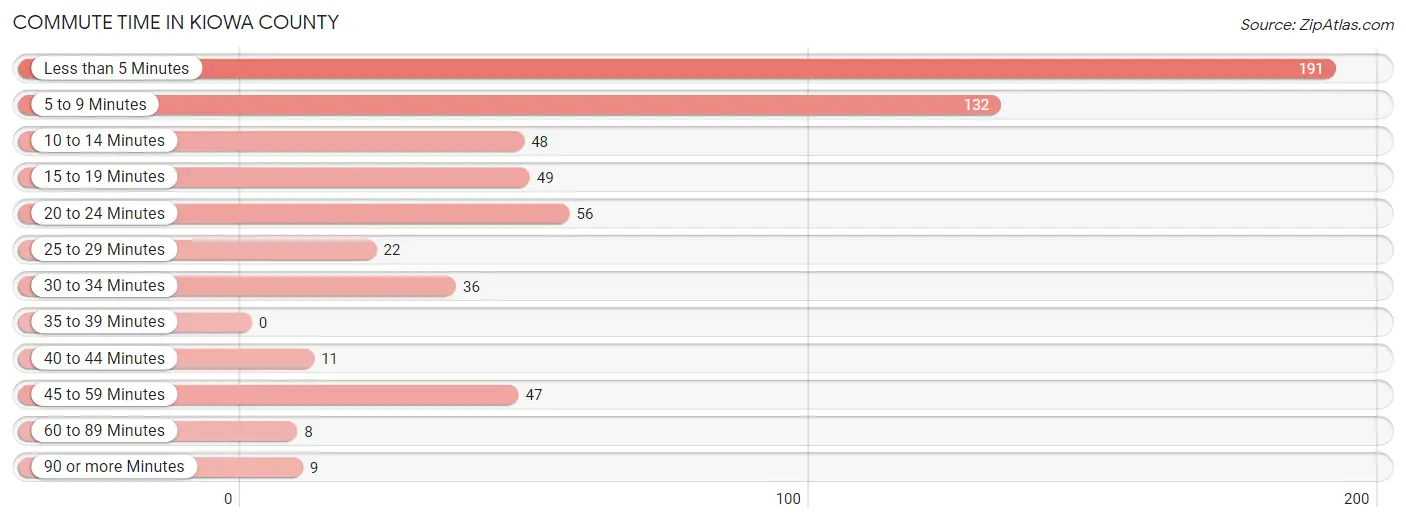
| Commute Time | # Commuters | % Commuters |
| Less than 5 Minutes | 191 | 31.4% |
| 5 to 9 Minutes | 132 | 21.7% |
| 10 to 14 Minutes | 48 | 7.9% |
| 15 to 19 Minutes | 49 | 8.1% |
| 20 to 24 Minutes | 56 | 9.2% |
| 25 to 29 Minutes | 22 | 3.6% |
| 30 to 34 Minutes | 36 | 5.9% |
| 35 to 39 Minutes | 0 | 0.0% |
| 40 to 44 Minutes | 11 | 1.8% |
| 45 to 59 Minutes | 47 | 7.7% |
| 60 to 89 Minutes | 8 | 1.3% |
| 90 or more Minutes | 9 | 1.5% |
Commute Time by Sex in Kiowa County
The most common commute times in Kiowa County are less than 5 minutes (73 commuters, 23.5%) for males and less than 5 minutes (118 commuters, 39.6%) for females.
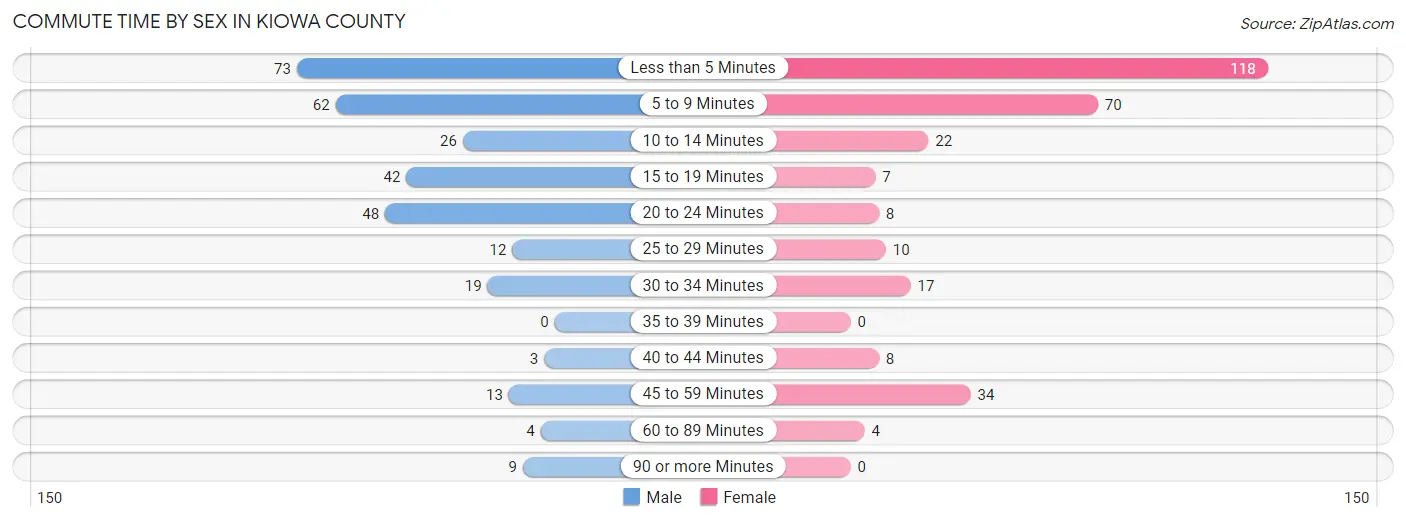
| Commute Time | Male | Female |
| Less than 5 Minutes | 73 (23.5%) | 118 (39.6%) |
| 5 to 9 Minutes | 62 (19.9%) | 70 (23.5%) |
| 10 to 14 Minutes | 26 (8.4%) | 22 (7.4%) |
| 15 to 19 Minutes | 42 (13.5%) | 7 (2.4%) |
| 20 to 24 Minutes | 48 (15.4%) | 8 (2.7%) |
| 25 to 29 Minutes | 12 (3.9%) | 10 (3.4%) |
| 30 to 34 Minutes | 19 (6.1%) | 17 (5.7%) |
| 35 to 39 Minutes | 0 (0.0%) | 0 (0.0%) |
| 40 to 44 Minutes | 3 (1.0%) | 8 (2.7%) |
| 45 to 59 Minutes | 13 (4.2%) | 34 (11.4%) |
| 60 to 89 Minutes | 4 (1.3%) | 4 (1.3%) |
| 90 or more Minutes | 9 (2.9%) | 0 (0.0%) |
Time of Departure to Work by Sex in Kiowa County
The most frequent times of departure to work in Kiowa County are 8:00 AM to 8:29 AM (81, 26.1%) for males and 7:30 AM to 7:59 AM (76, 25.5%) for females.
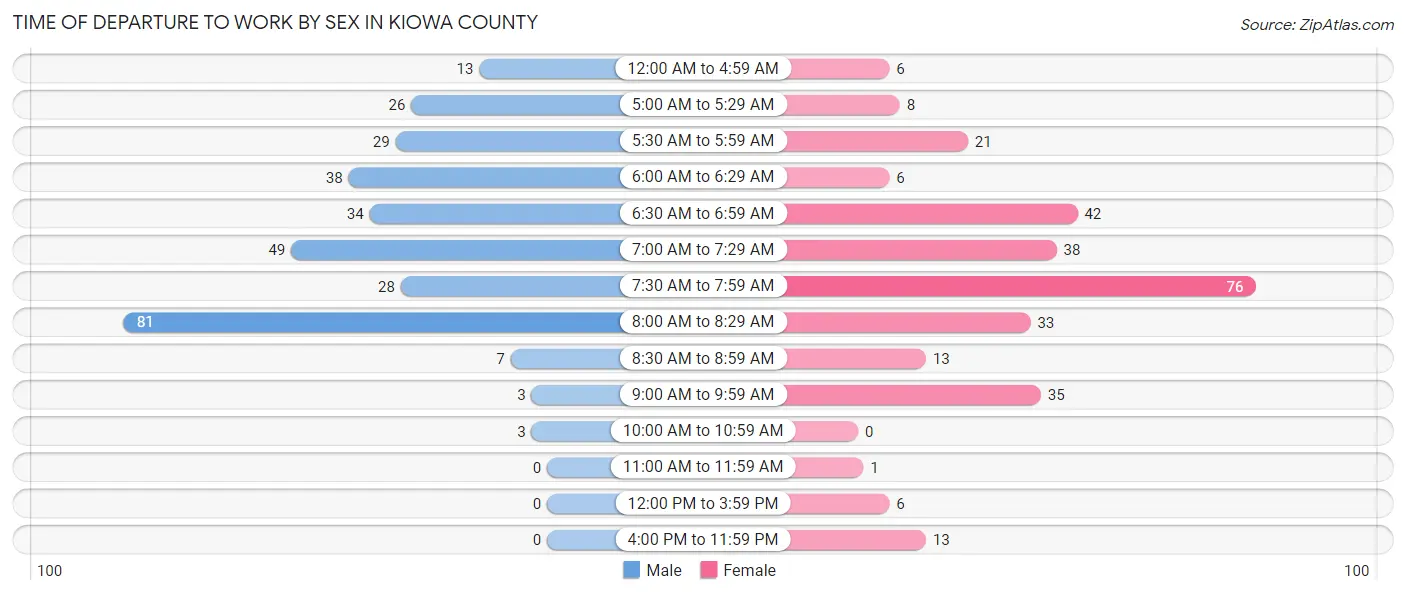
| Time of Departure | Male | Female |
| 12:00 AM to 4:59 AM | 13 (4.2%) | 6 (2.0%) |
| 5:00 AM to 5:29 AM | 26 (8.4%) | 8 (2.7%) |
| 5:30 AM to 5:59 AM | 29 (9.3%) | 21 (7.0%) |
| 6:00 AM to 6:29 AM | 38 (12.2%) | 6 (2.0%) |
| 6:30 AM to 6:59 AM | 34 (10.9%) | 42 (14.1%) |
| 7:00 AM to 7:29 AM | 49 (15.8%) | 38 (12.8%) |
| 7:30 AM to 7:59 AM | 28 (9.0%) | 76 (25.5%) |
| 8:00 AM to 8:29 AM | 81 (26.1%) | 33 (11.1%) |
| 8:30 AM to 8:59 AM | 7 (2.2%) | 13 (4.4%) |
| 9:00 AM to 9:59 AM | 3 (1.0%) | 35 (11.7%) |
| 10:00 AM to 10:59 AM | 3 (1.0%) | 0 (0.0%) |
| 11:00 AM to 11:59 AM | 0 (0.0%) | 1 (0.3%) |
| 12:00 PM to 3:59 PM | 0 (0.0%) | 6 (2.0%) |
| 4:00 PM to 11:59 PM | 0 (0.0%) | 13 (4.4%) |
| Total | 311 (100.0%) | 298 (100.0%) |
Housing Occupancy in Kiowa County
Occupancy by Ownership in Kiowa County
Of the total 551 dwellings in Kiowa County, owner-occupied units account for 407 (73.9%), while renter-occupied units make up 144 (26.1%).
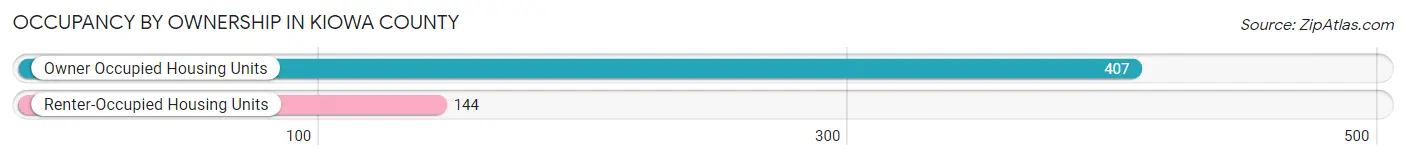
| Occupancy | # Housing Units | % Housing Units |
| Owner Occupied Housing Units | 407 | 73.9% |
| Renter-Occupied Housing Units | 144 | 26.1% |
| Total Occupied Housing Units | 551 | 100.0% |
Occupancy by Household Size in Kiowa County
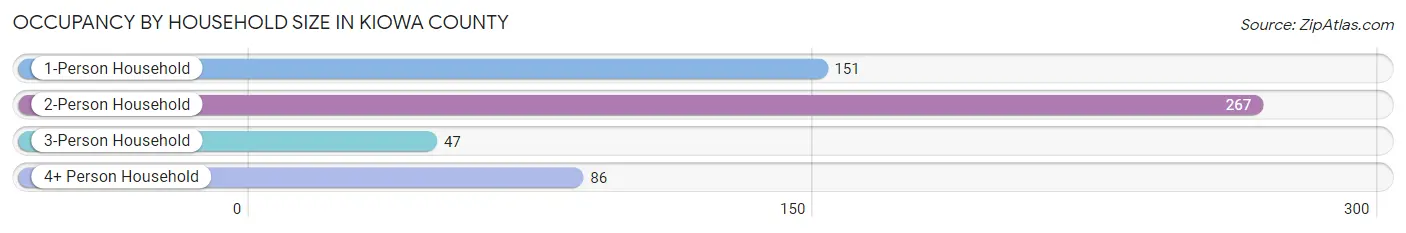
| Household Size | # Housing Units | % Housing Units |
| 1-Person Household | 151 | 27.4% |
| 2-Person Household | 267 | 48.5% |
| 3-Person Household | 47 | 8.5% |
| 4+ Person Household | 86 | 15.6% |
| Total Housing Units | 551 | 100.0% |
Occupancy by Ownership by Household Size in Kiowa County
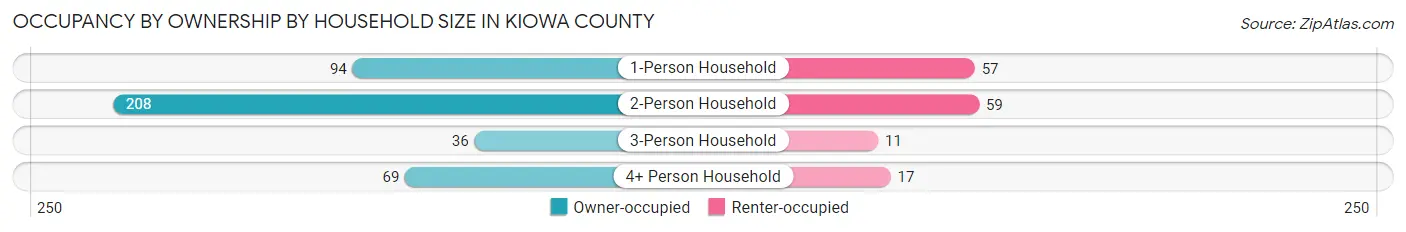
| Household Size | Owner-occupied | Renter-occupied |
| 1-Person Household | 94 (62.3%) | 57 (37.8%) |
| 2-Person Household | 208 (77.9%) | 59 (22.1%) |
| 3-Person Household | 36 (76.6%) | 11 (23.4%) |
| 4+ Person Household | 69 (80.2%) | 17 (19.8%) |
| Total Housing Units | 407 (73.9%) | 144 (26.1%) |
Occupancy by Educational Attainment in Kiowa County
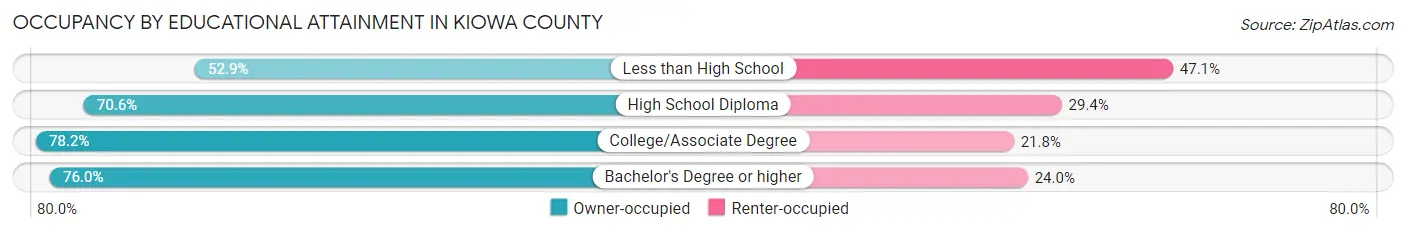
| Household Size | Owner-occupied | Renter-occupied |
| Less than High School | 18 (52.9%) | 16 (47.1%) |
| High School Diploma | 120 (70.6%) | 50 (29.4%) |
| College/Associate Degree | 190 (78.2%) | 53 (21.8%) |
| Bachelor's Degree or higher | 79 (76.0%) | 25 (24.0%) |
Occupancy by Age of Householder in Kiowa County
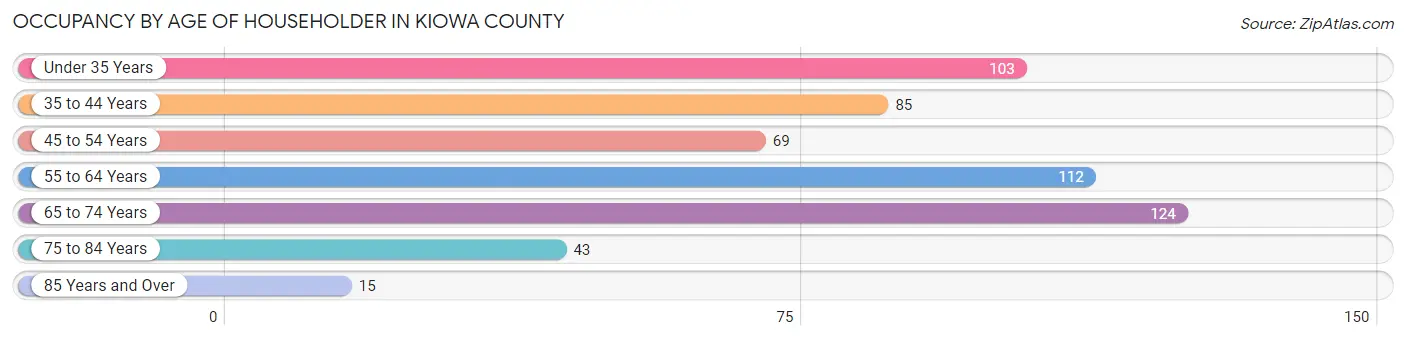
| Age Bracket | # Households | % Households |
| Under 35 Years | 103 | 18.7% |
| 35 to 44 Years | 85 | 15.4% |
| 45 to 54 Years | 69 | 12.5% |
| 55 to 64 Years | 112 | 20.3% |
| 65 to 74 Years | 124 | 22.5% |
| 75 to 84 Years | 43 | 7.8% |
| 85 Years and Over | 15 | 2.7% |
| Total | 551 | 100.0% |
Housing Finances in Kiowa County
Median Income by Occupancy in Kiowa County
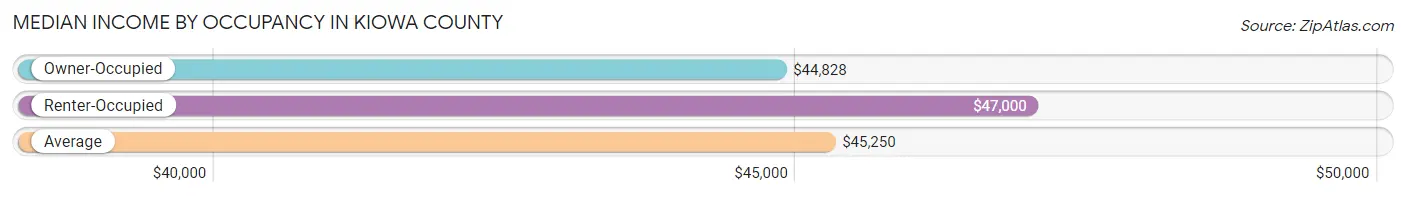
| Occupancy Type | # Households | Median Income |
| Owner-Occupied | 407 (73.9%) | $44,828 |
| Renter-Occupied | 144 (26.1%) | $47,000 |
| Average | 551 (100.0%) | $45,250 |
Occupancy by Householder Income Bracket in Kiowa County
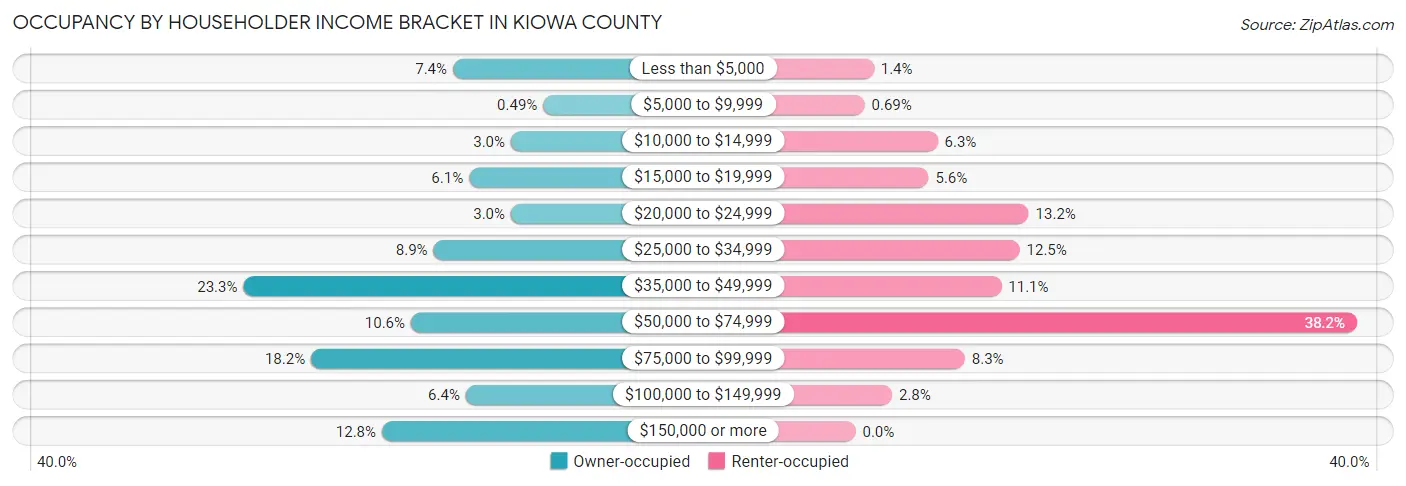
| Income Bracket | Owner-occupied | Renter-occupied |
| Less than $5,000 | 30 (7.4%) | 2 (1.4%) |
| $5,000 to $9,999 | 2 (0.5%) | 1 (0.7%) |
| $10,000 to $14,999 | 12 (2.9%) | 9 (6.2%) |
| $15,000 to $19,999 | 25 (6.1%) | 8 (5.6%) |
| $20,000 to $24,999 | 12 (2.9%) | 19 (13.2%) |
| $25,000 to $34,999 | 36 (8.8%) | 18 (12.5%) |
| $35,000 to $49,999 | 95 (23.3%) | 16 (11.1%) |
| $50,000 to $74,999 | 43 (10.6%) | 55 (38.2%) |
| $75,000 to $99,999 | 74 (18.2%) | 12 (8.3%) |
| $100,000 to $149,999 | 26 (6.4%) | 4 (2.8%) |
| $150,000 or more | 52 (12.8%) | 0 (0.0%) |
| Total | 407 (100.0%) | 144 (100.0%) |
Monthly Housing Cost Tiers in Kiowa County
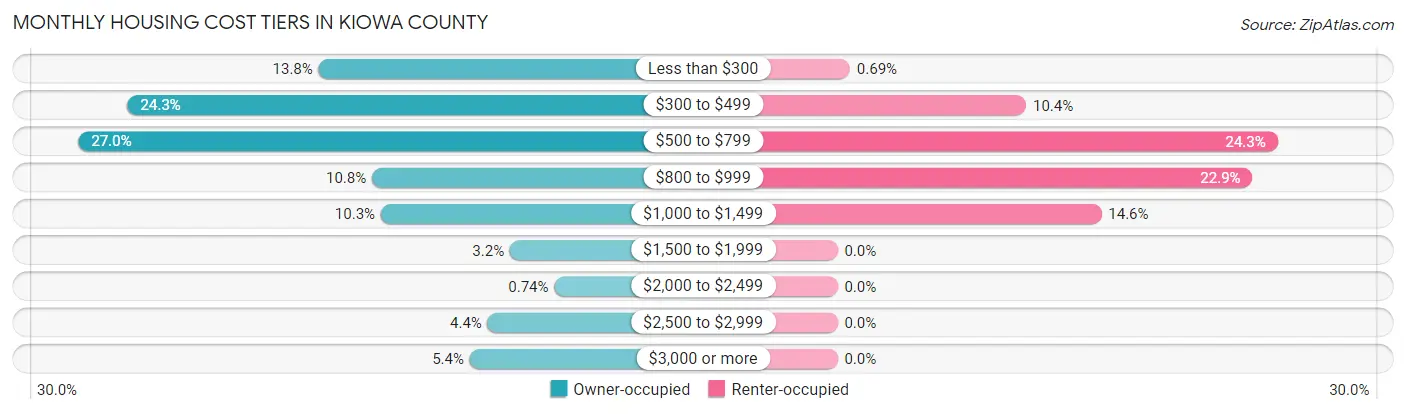
| Monthly Cost | Owner-occupied | Renter-occupied |
| Less than $300 | 56 (13.8%) | 1 (0.7%) |
| $300 to $499 | 99 (24.3%) | 15 (10.4%) |
| $500 to $799 | 110 (27.0%) | 35 (24.3%) |
| $800 to $999 | 44 (10.8%) | 33 (22.9%) |
| $1,000 to $1,499 | 42 (10.3%) | 21 (14.6%) |
| $1,500 to $1,999 | 13 (3.2%) | 0 (0.0%) |
| $2,000 to $2,499 | 3 (0.7%) | 0 (0.0%) |
| $2,500 to $2,999 | 18 (4.4%) | 0 (0.0%) |
| $3,000 or more | 22 (5.4%) | 0 (0.0%) |
| Total | 407 (100.0%) | 144 (100.0%) |
Physical Housing Characteristics in Kiowa County
Housing Structures in Kiowa County
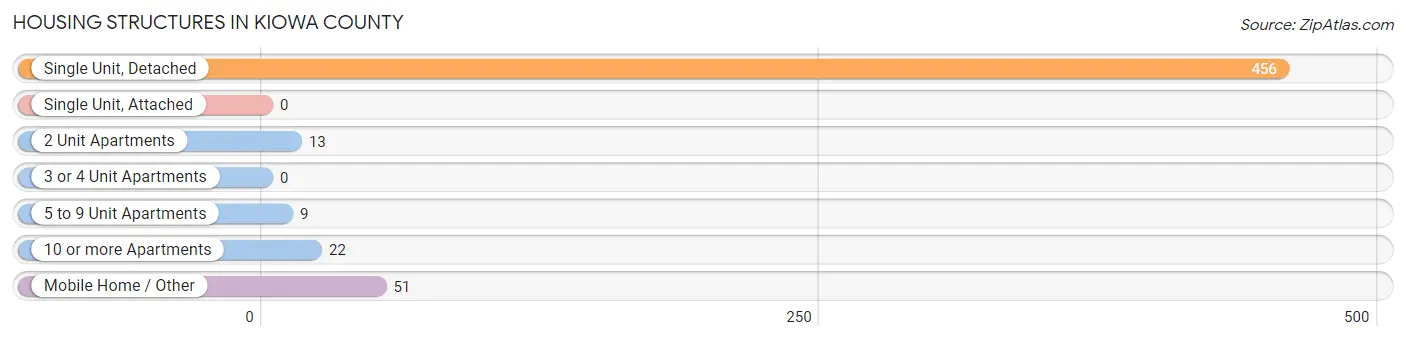
| Structure Type | # Housing Units | % Housing Units |
| Single Unit, Detached | 456 | 82.8% |
| Single Unit, Attached | 0 | 0.0% |
| 2 Unit Apartments | 13 | 2.4% |
| 3 or 4 Unit Apartments | 0 | 0.0% |
| 5 to 9 Unit Apartments | 9 | 1.6% |
| 10 or more Apartments | 22 | 4.0% |
| Mobile Home / Other | 51 | 9.3% |
| Total | 551 | 100.0% |
Housing Structures by Occupancy in Kiowa County
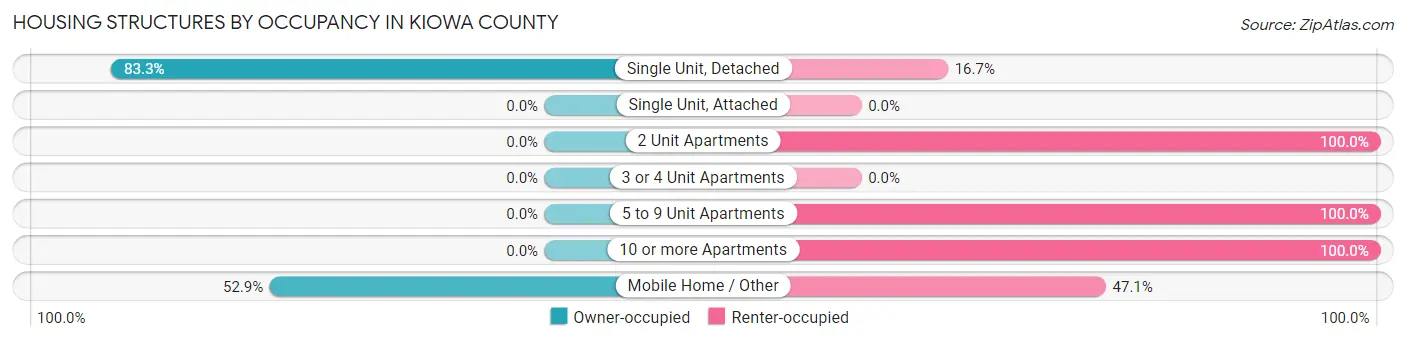
| Structure Type | Owner-occupied | Renter-occupied |
| Single Unit, Detached | 380 (83.3%) | 76 (16.7%) |
| Single Unit, Attached | 0 (0.0%) | 0 (0.0%) |
| 2 Unit Apartments | 0 (0.0%) | 13 (100.0%) |
| 3 or 4 Unit Apartments | 0 (0.0%) | 0 (0.0%) |
| 5 to 9 Unit Apartments | 0 (0.0%) | 9 (100.0%) |
| 10 or more Apartments | 0 (0.0%) | 22 (100.0%) |
| Mobile Home / Other | 27 (52.9%) | 24 (47.1%) |
| Total | 407 (73.9%) | 144 (26.1%) |
Housing Structures by Number of Rooms in Kiowa County
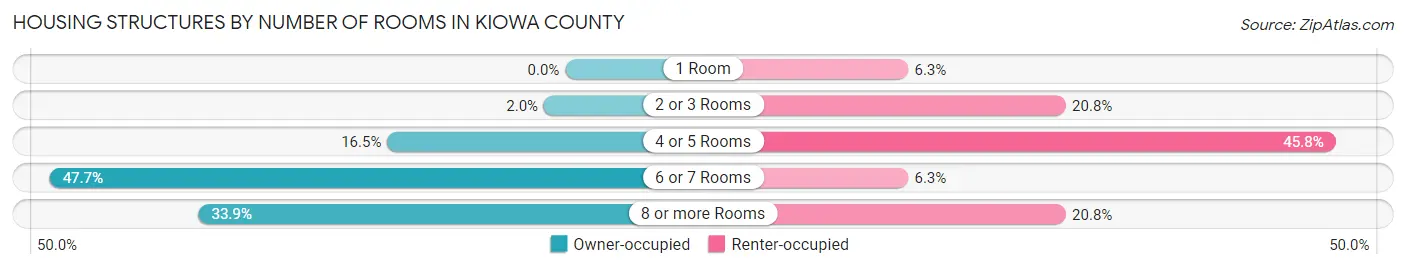
| Number of Rooms | Owner-occupied | Renter-occupied |
| 1 Room | 0 (0.0%) | 9 (6.2%) |
| 2 or 3 Rooms | 8 (2.0%) | 30 (20.8%) |
| 4 or 5 Rooms | 67 (16.5%) | 66 (45.8%) |
| 6 or 7 Rooms | 194 (47.7%) | 9 (6.2%) |
| 8 or more Rooms | 138 (33.9%) | 30 (20.8%) |
| Total | 407 (100.0%) | 144 (100.0%) |
Housing Structure by Heating Type in Kiowa County
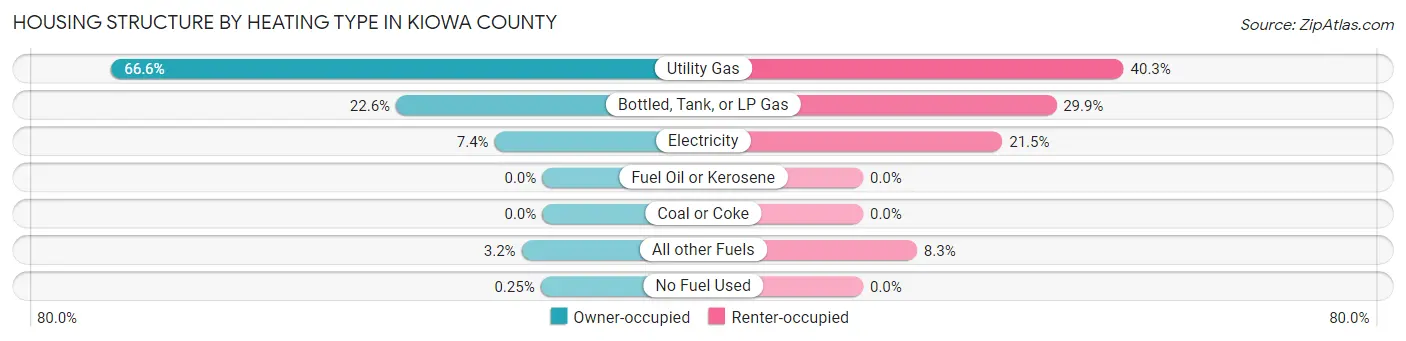
| Heating Type | Owner-occupied | Renter-occupied |
| Utility Gas | 271 (66.6%) | 58 (40.3%) |
| Bottled, Tank, or LP Gas | 92 (22.6%) | 43 (29.9%) |
| Electricity | 30 (7.4%) | 31 (21.5%) |
| Fuel Oil or Kerosene | 0 (0.0%) | 0 (0.0%) |
| Coal or Coke | 0 (0.0%) | 0 (0.0%) |
| All other Fuels | 13 (3.2%) | 12 (8.3%) |
| No Fuel Used | 1 (0.3%) | 0 (0.0%) |
| Total | 407 (100.0%) | 144 (100.0%) |
Household Vehicle Usage in Kiowa County
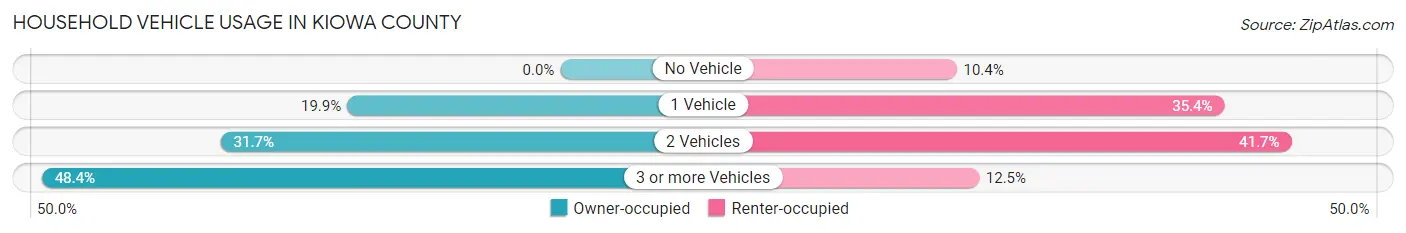
| Vehicles per Household | Owner-occupied | Renter-occupied |
| No Vehicle | 0 (0.0%) | 15 (10.4%) |
| 1 Vehicle | 81 (19.9%) | 51 (35.4%) |
| 2 Vehicles | 129 (31.7%) | 60 (41.7%) |
| 3 or more Vehicles | 197 (48.4%) | 18 (12.5%) |
| Total | 407 (100.0%) | 144 (100.0%) |
Real Estate & Mortgages in Kiowa County
Real Estate and Mortgage Overview in Kiowa County
| Characteristic | Without Mortgage | With Mortgage |
| Housing Units | 248 | 159 |
| Median Property Value | $120,500 | $142,200 |
| Median Household Income | $42,500 | $30 |
| Monthly Housing Costs | $443 | $22 |
| Real Estate Taxes | $566 | $2 |
Property Value by Mortgage Status in Kiowa County
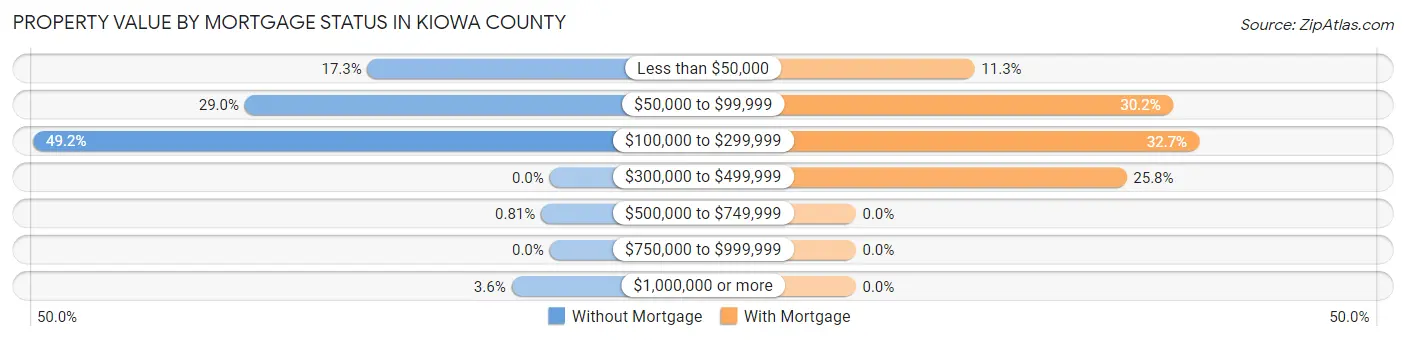
| Property Value | Without Mortgage | With Mortgage |
| Less than $50,000 | 43 (17.3%) | 18 (11.3%) |
| $50,000 to $99,999 | 72 (29.0%) | 48 (30.2%) |
| $100,000 to $299,999 | 122 (49.2%) | 52 (32.7%) |
| $300,000 to $499,999 | 0 (0.0%) | 41 (25.8%) |
| $500,000 to $749,999 | 2 (0.8%) | 0 (0.0%) |
| $750,000 to $999,999 | 0 (0.0%) | 0 (0.0%) |
| $1,000,000 or more | 9 (3.6%) | 0 (0.0%) |
| Total | 248 (100.0%) | 159 (100.0%) |
Household Income by Mortgage Status in Kiowa County
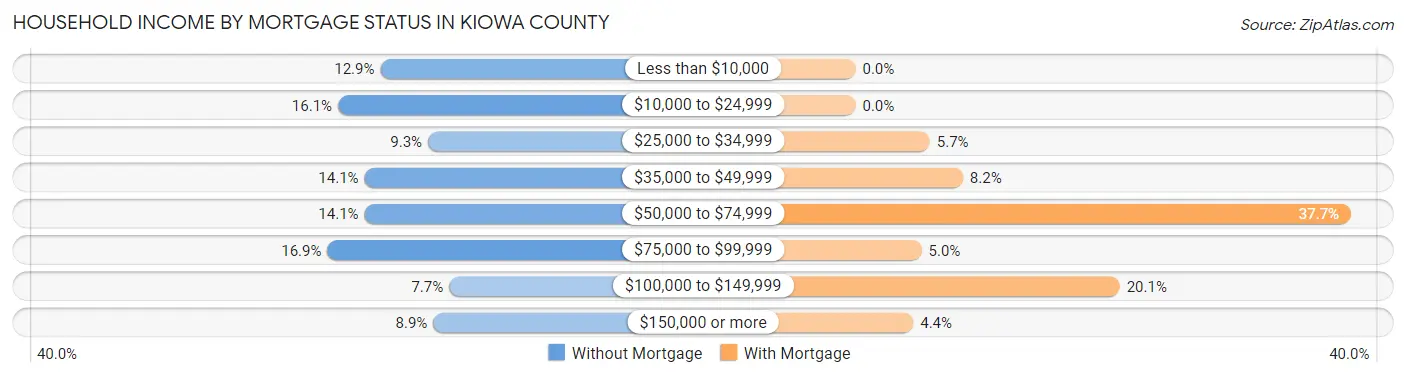
| Household Income | Without Mortgage | With Mortgage |
| Less than $10,000 | 32 (12.9%) | 0 (0.0%) |
| $10,000 to $24,999 | 40 (16.1%) | 0 (0.0%) |
| $25,000 to $34,999 | 23 (9.3%) | 9 (5.7%) |
| $35,000 to $49,999 | 35 (14.1%) | 13 (8.2%) |
| $50,000 to $74,999 | 35 (14.1%) | 60 (37.7%) |
| $75,000 to $99,999 | 42 (16.9%) | 8 (5.0%) |
| $100,000 to $149,999 | 19 (7.7%) | 32 (20.1%) |
| $150,000 or more | 22 (8.9%) | 7 (4.4%) |
| Total | 248 (100.0%) | 159 (100.0%) |
Property Value to Household Income Ratio in Kiowa County
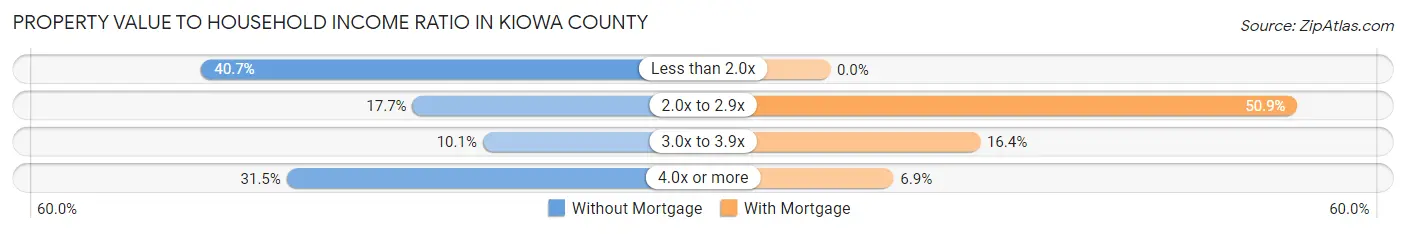
| Value-to-Income Ratio | Without Mortgage | With Mortgage |
| Less than 2.0x | 101 (40.7%) | 0 (0.0%) |
| 2.0x to 2.9x | 44 (17.7%) | 81 (50.9%) |
| 3.0x to 3.9x | 25 (10.1%) | 26 (16.4%) |
| 4.0x or more | 78 (31.5%) | 11 (6.9%) |
| Total | 248 (100.0%) | 159 (100.0%) |
Real Estate Taxes by Mortgage Status in Kiowa County
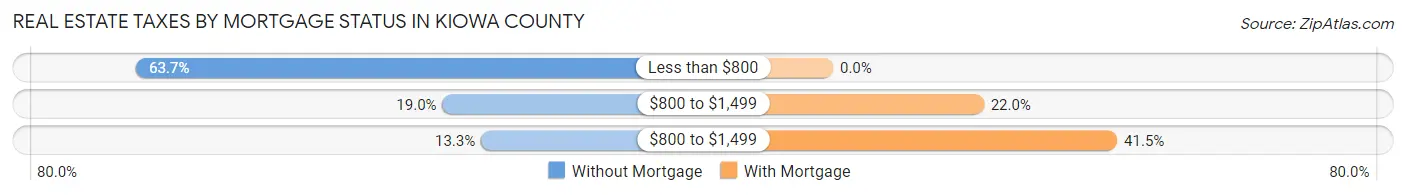
| Property Taxes | Without Mortgage | With Mortgage |
| Less than $800 | 158 (63.7%) | 0 (0.0%) |
| $800 to $1,499 | 47 (19.0%) | 35 (22.0%) |
| $800 to $1,499 | 33 (13.3%) | 66 (41.5%) |
| Total | 248 (100.0%) | 159 (100.0%) |
Health & Disability in Kiowa County
Health Insurance Coverage by Age in Kiowa County
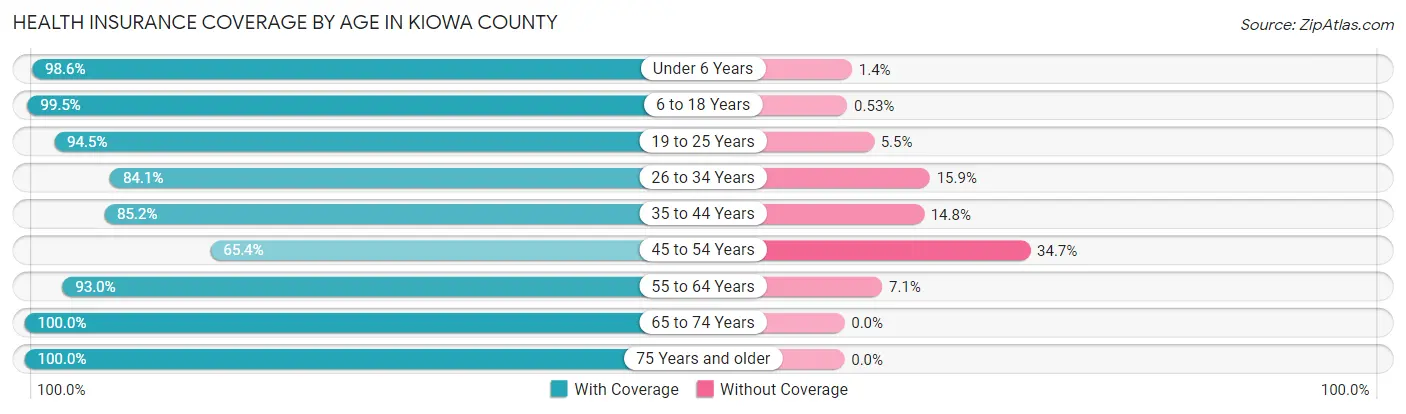
| Age Bracket | With Coverage | Without Coverage |
| Under 6 Years | 140 (98.6%) | 2 (1.4%) |
| 6 to 18 Years | 188 (99.5%) | 1 (0.5%) |
| 19 to 25 Years | 86 (94.5%) | 5 (5.5%) |
| 26 to 34 Years | 95 (84.1%) | 18 (15.9%) |
| 35 to 44 Years | 138 (85.2%) | 24 (14.8%) |
| 45 to 54 Years | 83 (65.3%) | 44 (34.6%) |
| 55 to 64 Years | 211 (92.9%) | 16 (7.0%) |
| 65 to 74 Years | 178 (100.0%) | 0 (0.0%) |
| 75 Years and older | 88 (100.0%) | 0 (0.0%) |
| Total | 1,207 (91.6%) | 110 (8.4%) |
Health Insurance Coverage by Citizenship Status in Kiowa County
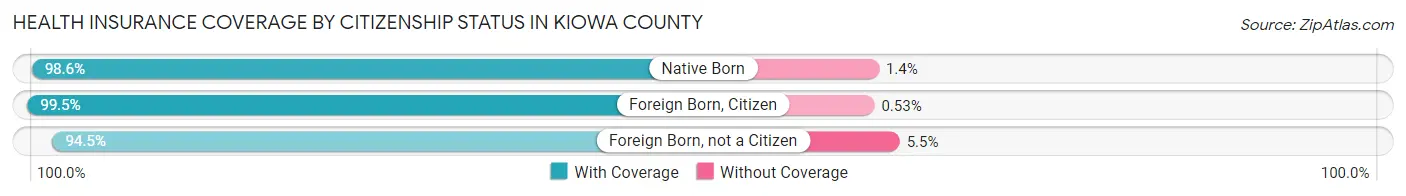
| Citizenship Status | With Coverage | Without Coverage |
| Native Born | 140 (98.6%) | 2 (1.4%) |
| Foreign Born, Citizen | 188 (99.5%) | 1 (0.5%) |
| Foreign Born, not a Citizen | 86 (94.5%) | 5 (5.5%) |
Health Insurance Coverage by Household Income in Kiowa County
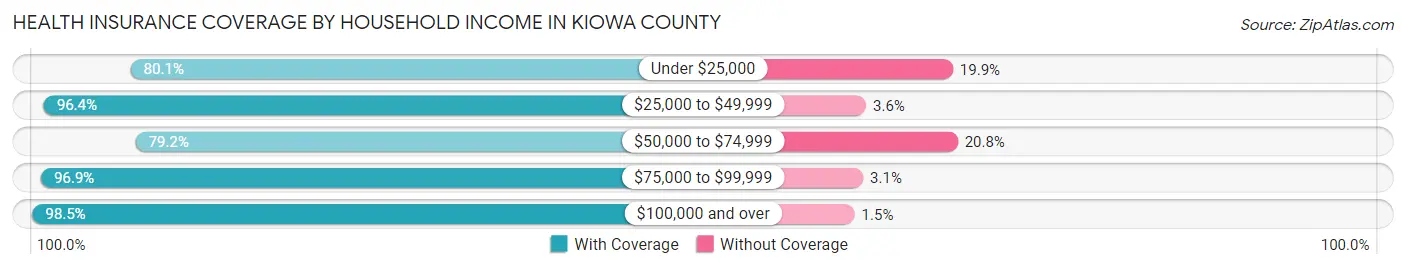
| Household Income | With Coverage | Without Coverage |
| Under $25,000 | 129 (80.1%) | 32 (19.9%) |
| $25,000 to $49,999 | 374 (96.4%) | 14 (3.6%) |
| $50,000 to $74,999 | 202 (79.2%) | 53 (20.8%) |
| $75,000 to $99,999 | 221 (96.9%) | 7 (3.1%) |
| $100,000 and over | 269 (98.5%) | 4 (1.5%) |
Public vs Private Health Insurance Coverage by Age in Kiowa County
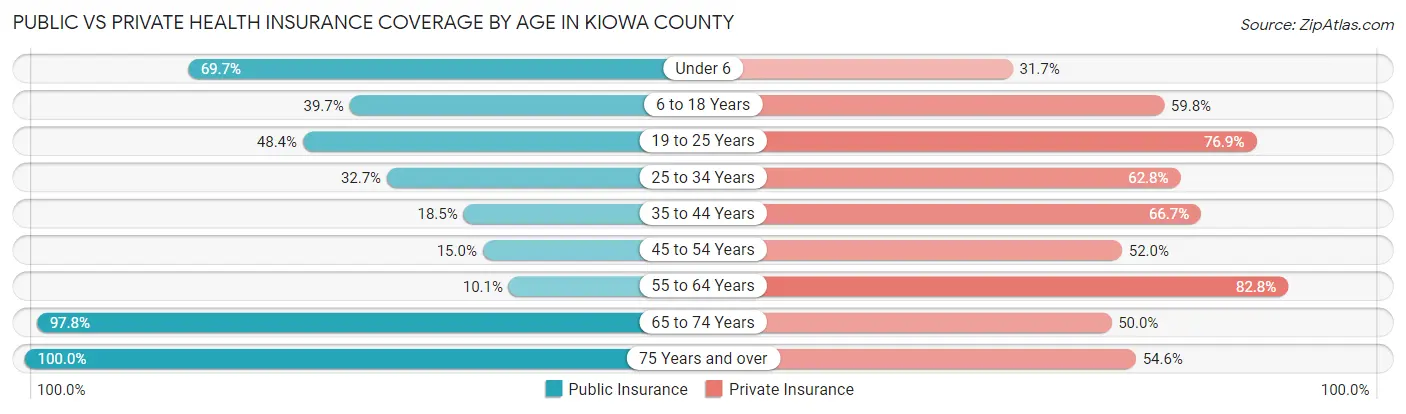
| Age Bracket | Public Insurance | Private Insurance |
| Under 6 | 99 (69.7%) | 45 (31.7%) |
| 6 to 18 Years | 75 (39.7%) | 113 (59.8%) |
| 19 to 25 Years | 44 (48.3%) | 70 (76.9%) |
| 25 to 34 Years | 37 (32.7%) | 71 (62.8%) |
| 35 to 44 Years | 30 (18.5%) | 108 (66.7%) |
| 45 to 54 Years | 19 (15.0%) | 66 (52.0%) |
| 55 to 64 Years | 23 (10.1%) | 188 (82.8%) |
| 65 to 74 Years | 174 (97.8%) | 89 (50.0%) |
| 75 Years and over | 88 (100.0%) | 48 (54.5%) |
| Total | 589 (44.7%) | 798 (60.6%) |
Disability Status by Sex by Age in Kiowa County
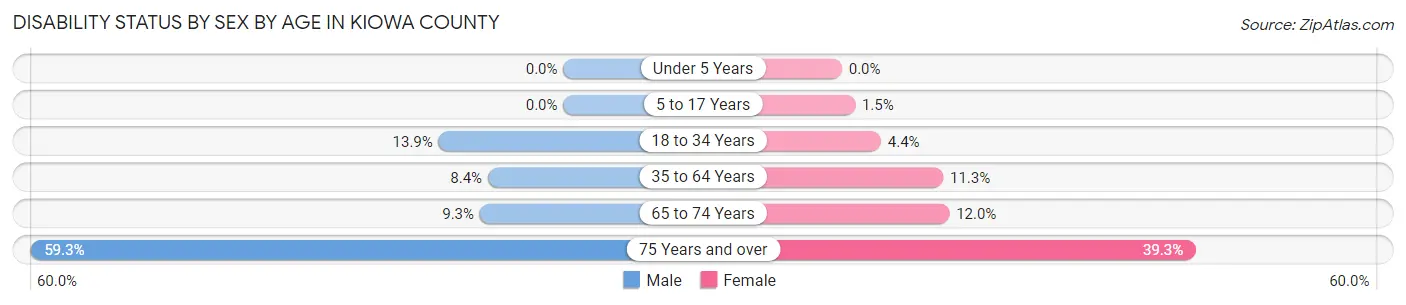
| Age Bracket | Male | Female |
| Under 5 Years | 0 (0.0%) | 0 (0.0%) |
| 5 to 17 Years | 0 (0.0%) | 1 (1.5%) |
| 18 to 34 Years | 10 (13.9%) | 6 (4.3%) |
| 35 to 64 Years | 21 (8.4%) | 30 (11.3%) |
| 65 to 74 Years | 8 (9.3%) | 11 (12.0%) |
| 75 Years and over | 16 (59.3%) | 24 (39.3%) |
Disability Class by Sex by Age in Kiowa County
Disability Class: Hearing Difficulty
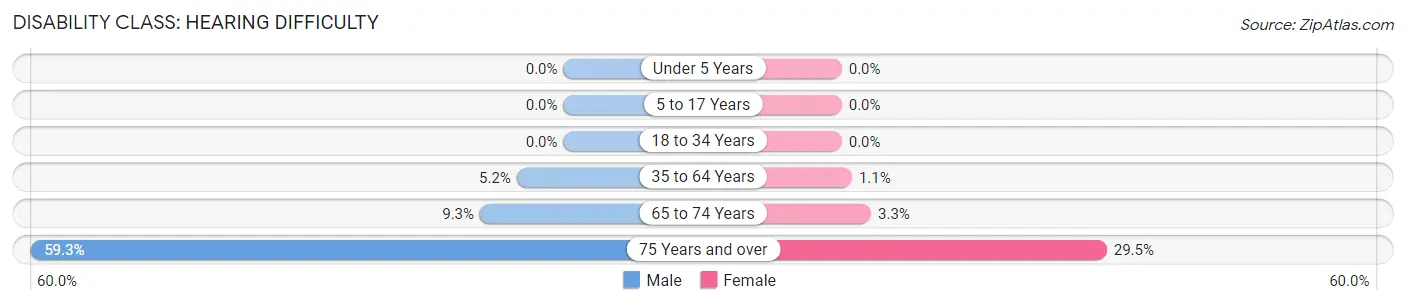
| Age Bracket | Male | Female |
| Under 5 Years | 0 (0.0%) | 0 (0.0%) |
| 5 to 17 Years | 0 (0.0%) | 0 (0.0%) |
| 18 to 34 Years | 0 (0.0%) | 0 (0.0%) |
| 35 to 64 Years | 13 (5.2%) | 3 (1.1%) |
| 65 to 74 Years | 8 (9.3%) | 3 (3.3%) |
| 75 Years and over | 16 (59.3%) | 18 (29.5%) |
Disability Class: Vision Difficulty
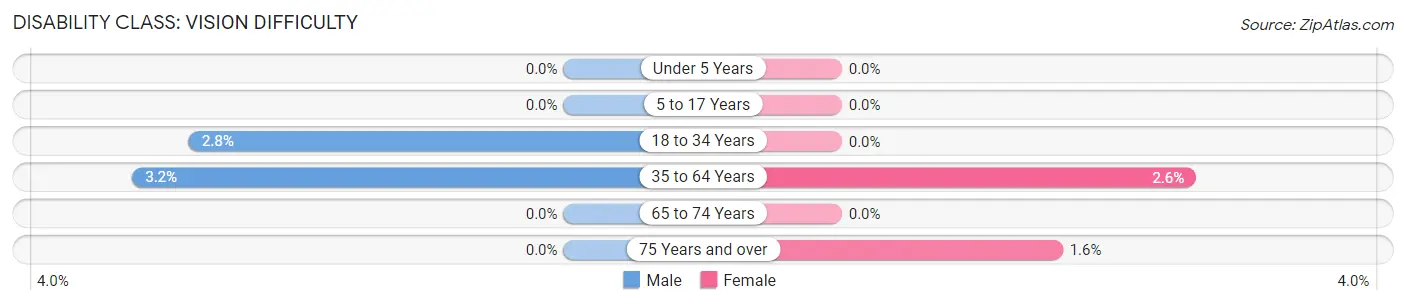
| Age Bracket | Male | Female |
| Under 5 Years | 0 (0.0%) | 0 (0.0%) |
| 5 to 17 Years | 0 (0.0%) | 0 (0.0%) |
| 18 to 34 Years | 2 (2.8%) | 0 (0.0%) |
| 35 to 64 Years | 8 (3.2%) | 7 (2.6%) |
| 65 to 74 Years | 0 (0.0%) | 0 (0.0%) |
| 75 Years and over | 0 (0.0%) | 1 (1.6%) |
Disability Class: Cognitive Difficulty
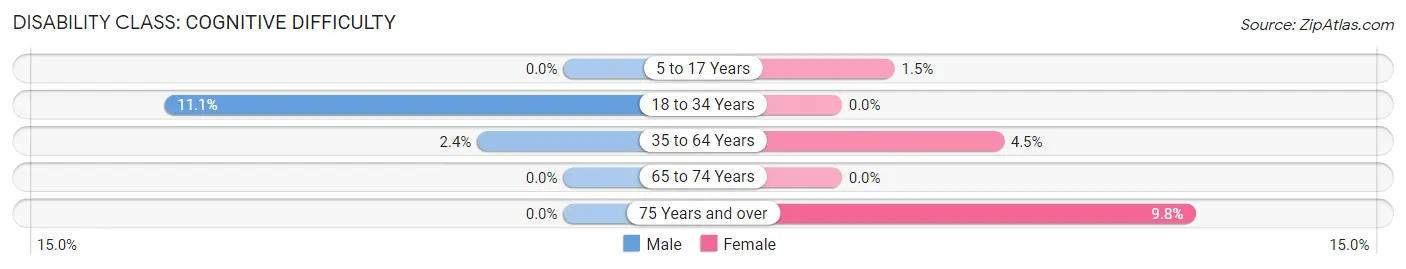
| Age Bracket | Male | Female |
| 5 to 17 Years | 0 (0.0%) | 1 (1.5%) |
| 18 to 34 Years | 8 (11.1%) | 0 (0.0%) |
| 35 to 64 Years | 6 (2.4%) | 12 (4.5%) |
| 65 to 74 Years | 0 (0.0%) | 0 (0.0%) |
| 75 Years and over | 0 (0.0%) | 6 (9.8%) |
Disability Class: Ambulatory Difficulty
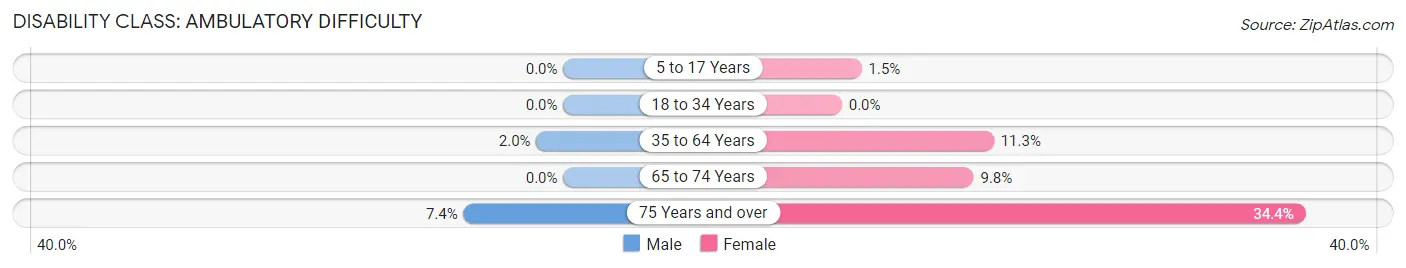
| Age Bracket | Male | Female |
| 5 to 17 Years | 0 (0.0%) | 1 (1.5%) |
| 18 to 34 Years | 0 (0.0%) | 0 (0.0%) |
| 35 to 64 Years | 5 (2.0%) | 30 (11.3%) |
| 65 to 74 Years | 0 (0.0%) | 9 (9.8%) |
| 75 Years and over | 2 (7.4%) | 21 (34.4%) |
Disability Class: Self-Care Difficulty
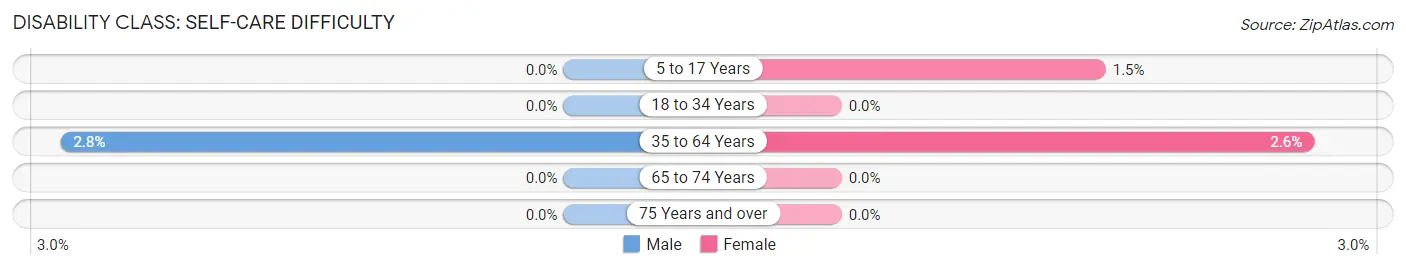
| Age Bracket | Male | Female |
| 5 to 17 Years | 0 (0.0%) | 1 (1.5%) |
| 18 to 34 Years | 0 (0.0%) | 0 (0.0%) |
| 35 to 64 Years | 7 (2.8%) | 7 (2.6%) |
| 65 to 74 Years | 0 (0.0%) | 0 (0.0%) |
| 75 Years and over | 0 (0.0%) | 0 (0.0%) |
Technology Access in Kiowa County
Computing Device Access in Kiowa County
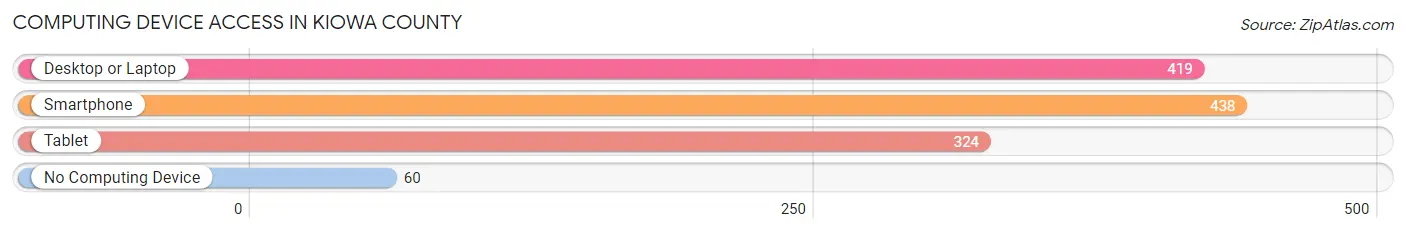
| Device Type | # Households | % Households |
| Desktop or Laptop | 419 | 76.0% |
| Smartphone | 438 | 79.5% |
| Tablet | 324 | 58.8% |
| No Computing Device | 60 | 10.9% |
| Total | 551 | 100.0% |
Internet Access in Kiowa County
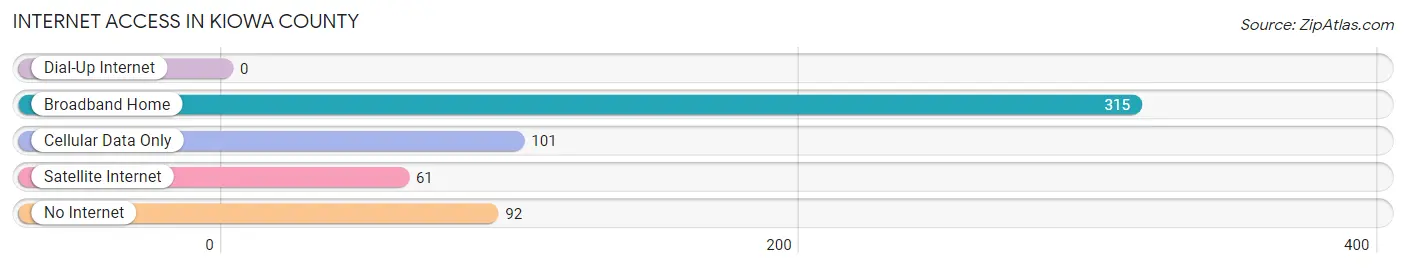
| Internet Type | # Households | % Households |
| Dial-Up Internet | 0 | 0.0% |
| Broadband Home | 315 | 57.2% |
| Cellular Data Only | 101 | 18.3% |
| Satellite Internet | 61 | 11.1% |
| No Internet | 92 | 16.7% |
| Total | 551 | 100.0% |
Kiowa County Summary
Kiowa County is located in the southeastern corner of Colorado, and is bordered by Lincoln County to the north, Prowers County to the east, Bent County to the south, and Crowley County to the west. The county seat is Eads, and the county has a total area of 1,741 square miles, of which 1,739 square miles is land and 2 square miles is water. As of the 2010 census, the population was 1,398, making it the second least populous county in Colorado.
Geography
Kiowa County is located in the High Plains region of Colorado, and is characterized by flat to rolling terrain. The county is mostly covered in shortgrass prairie, with some areas of sand hills and sagebrush. The Arkansas River flows through the county, and is the main source of water for the area. The county is also home to several small lakes, including Lake Meredith, which is located in the northern part of the county.
The climate of Kiowa County is semi-arid, with hot summers and cold winters. The average annual precipitation is around 15 inches, with most of it falling in the spring and summer months.
Economy
The economy of Kiowa County is largely based on agriculture, with wheat, corn, and sorghum being the main crops. Cattle ranching is also an important part of the local economy, and the county is home to several large ranches. Oil and gas production is also an important part of the economy, and the county is home to several oil and gas wells.
Demographics
As of the 2010 census, there were 1,398 people, 545 households, and 382 families living in Kiowa County. The population density was 0.8 people per square mile. The racial makeup of the county was 95.2% White, 0.3% African American, 0.9% Native American, 0.1% Asian, 0.1% Pacific Islander, 1.6% from other races, and 1.8% from two or more races. Hispanic or Latino of any race were 4.3% of the population.
The median income for a household in the county was $35,000, and the median income for a family was $41,000. The per capita income for the county was $17,000. About 11.2% of families and 14.2% of the population were below the poverty line, including 17.2% of those under age 18 and 8.3% of those age 65 or over.
Conclusion
Kiowa County is a rural county located in the southeastern corner of Colorado. The county is characterized by flat to rolling terrain, and is mostly covered in shortgrass prairie. The economy of the county is largely based on agriculture, with wheat, corn, and sorghum being the main crops. Oil and gas production is also an important part of the economy. As of the 2010 census, the population of the county was 1,398, and the median income for a household was $35,000.
Common Questions
What is Per Capita Income in Kiowa County?
Per Capita income in Kiowa County is $27,957.
What is the Median Family Income in Kiowa County?
Median Family Income in Kiowa County is $60,000.
What is the Median Household income in Kiowa County?
Median Household Income in Kiowa County is $45,250.
What is Income or Wage Gap in Kiowa County?
Income or Wage Gap in Kiowa County is 30.3%.
Women in Kiowa County earn 69.7 cents for every dollar earned by a man.
What is Family Income Deficit in Kiowa County?
Family Income Deficit in Kiowa County is $10,043.
Families that are below poverty line in Kiowa County earn $10,043 less on average than the poverty threshold level.
What is Inequality or Gini Index in Kiowa County?
Inequality or Gini Index in Kiowa County is 0.45.
What is the Total Population of Kiowa County?
Total Population of Kiowa County is 1,347.
What is the Total Male Population of Kiowa County?
Total Male Population of Kiowa County is 632.
What is the Total Female Population of Kiowa County?
Total Female Population of Kiowa County is 715.
What is the Ratio of Males per 100 Females in Kiowa County?
There are 88.39 Males per 100 Females in Kiowa County.
What is the Ratio of Females per 100 Males in Kiowa County?
There are 113.13 Females per 100 Males in Kiowa County.
What is the Median Population Age in Kiowa County?
Median Population Age in Kiowa County is 43.3 Years.
What is the Average Family Size in Kiowa County
Average Family Size in Kiowa County is 3.0 People.
What is the Average Household Size in Kiowa County
Average Household Size in Kiowa County is 2.4 People.
How Large is the Labor Force in Kiowa County?
There are 649 People in the Labor Forcein in Kiowa County.
What is the Percentage of People in the Labor Force in Kiowa County?
62.0% of People are in the Labor Force in Kiowa County.