Jackson County, CO Map & Demographics
Jackson County Map
Jackson County Overview
$29,657
PER CAPITA INCOME
$53,750
AVG FAMILY INCOME
$38,686
AVG HOUSEHOLD INCOME
52.7%
WAGE / INCOME GAP [ % ]
47.3¢/ $1
WAGE / INCOME GAP [ $ ]
0.49
INEQUALITY / GINI INDEX
1,440
TOTAL POPULATION
748
MALE POPULATION
692
FEMALE POPULATION
108.09
MALES / 100 FEMALES
92.51
FEMALES / 100 MALES
51.5
MEDIAN AGE
2.8
AVG FAMILY SIZE
2.2
AVG HOUSEHOLD SIZE
719
LABOR FORCE [ PEOPLE ]
57.0%
PERCENT IN LABOR FORCE
8.2%
UNEMPLOYMENT RATE
Jackson County Area Codes
Income in Jackson County
Income Overview in Jackson County
Per Capita Income in Jackson County is $29,657, while median incomes of families and households are $53,750 and $38,686 respectively.
| Characteristic | Number | Measure |
| Per Capita Income | 1,440 | $29,657 |
| Median Family Income | 395 | $53,750 |
| Mean Family Income | 395 | $76,497 |
| Median Household Income | 645 | $38,686 |
| Mean Household Income | 645 | $63,900 |
| Income Deficit | 395 | $0 |
| Wage / Income Gap (%) | 1,440 | 52.67% |
| Wage / Income Gap ($) | 1,440 | 47.33¢ per $1 |
| Gini / Inequality Index | 1,440 | 0.49 |
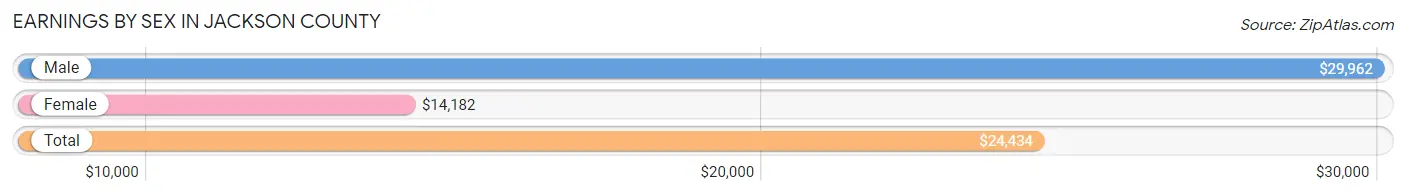
Earnings by Sex in Jackson County
Average Earnings in Jackson County are $24,434, $29,962 for men and $14,182 for women, a difference of 52.7%.
| Sex | Number | Average Earnings |
| Male | 393 (50.5%) | $29,962 |
| Female | 385 (49.5%) | $14,182 |
| Total | 778 (100.0%) | $24,434 |
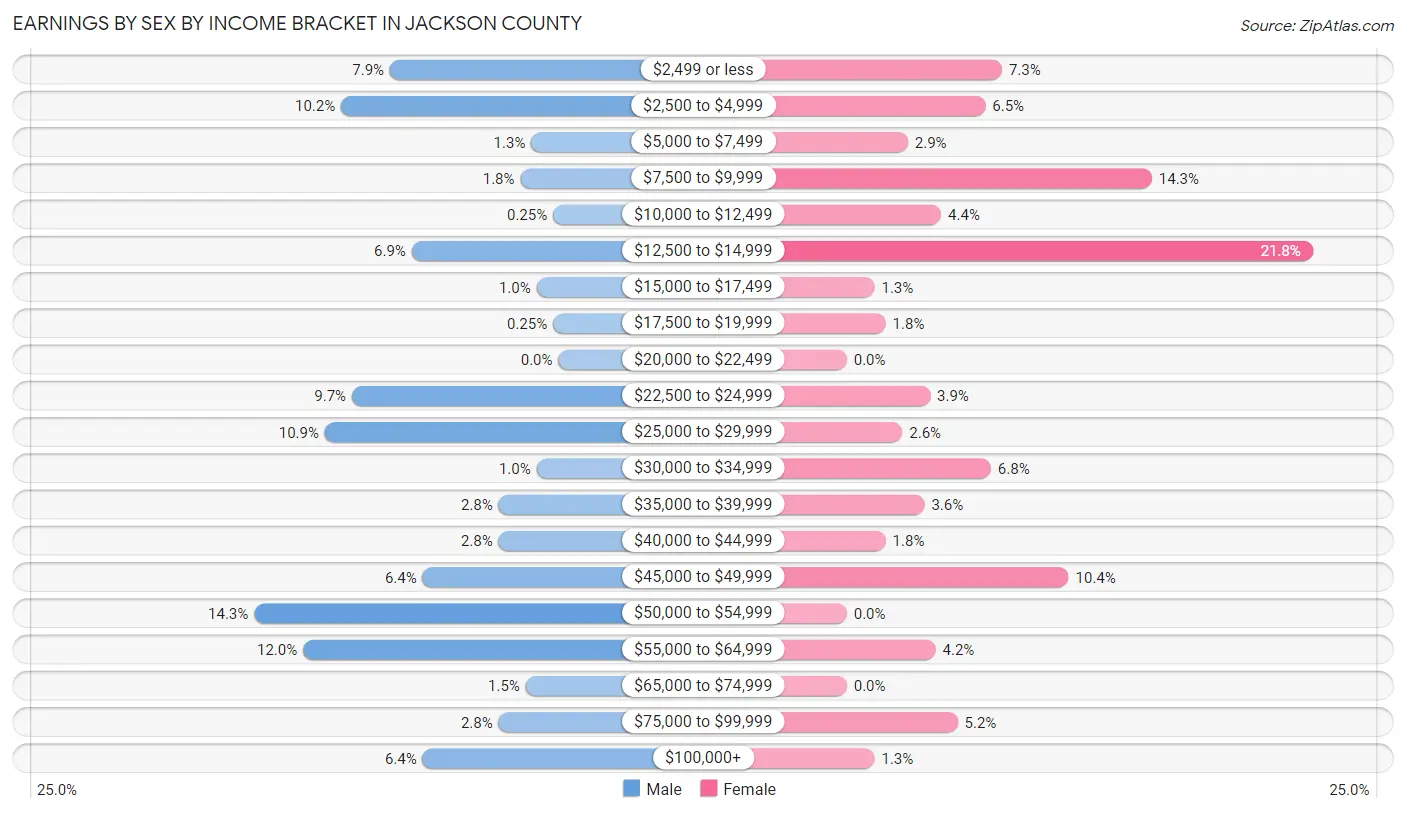
Earnings by Sex by Income Bracket in Jackson County
The most common earnings brackets in Jackson County are $50,000 to $54,999 for men (56 | 14.2%) and $12,500 to $14,999 for women (84 | 21.8%).
| Income | Male | Female |
| $2,499 or less | 31 (7.9%) | 28 (7.3%) |
| $2,500 to $4,999 | 40 (10.2%) | 25 (6.5%) |
| $5,000 to $7,499 | 5 (1.3%) | 11 (2.9%) |
| $7,500 to $9,999 | 7 (1.8%) | 55 (14.3%) |
| $10,000 to $12,499 | 1 (0.3%) | 17 (4.4%) |
| $12,500 to $14,999 | 27 (6.9%) | 84 (21.8%) |
| $15,000 to $17,499 | 4 (1.0%) | 5 (1.3%) |
| $17,500 to $19,999 | 1 (0.3%) | 7 (1.8%) |
| $20,000 to $22,499 | 0 (0.0%) | 0 (0.0%) |
| $22,500 to $24,999 | 38 (9.7%) | 15 (3.9%) |
| $25,000 to $29,999 | 43 (10.9%) | 10 (2.6%) |
| $30,000 to $34,999 | 4 (1.0%) | 26 (6.8%) |
| $35,000 to $39,999 | 11 (2.8%) | 14 (3.6%) |
| $40,000 to $44,999 | 11 (2.8%) | 7 (1.8%) |
| $45,000 to $49,999 | 25 (6.4%) | 40 (10.4%) |
| $50,000 to $54,999 | 56 (14.2%) | 0 (0.0%) |
| $55,000 to $64,999 | 47 (12.0%) | 16 (4.2%) |
| $65,000 to $74,999 | 6 (1.5%) | 0 (0.0%) |
| $75,000 to $99,999 | 11 (2.8%) | 20 (5.2%) |
| $100,000+ | 25 (6.4%) | 5 (1.3%) |
| Total | 393 (100.0%) | 385 (100.0%) |
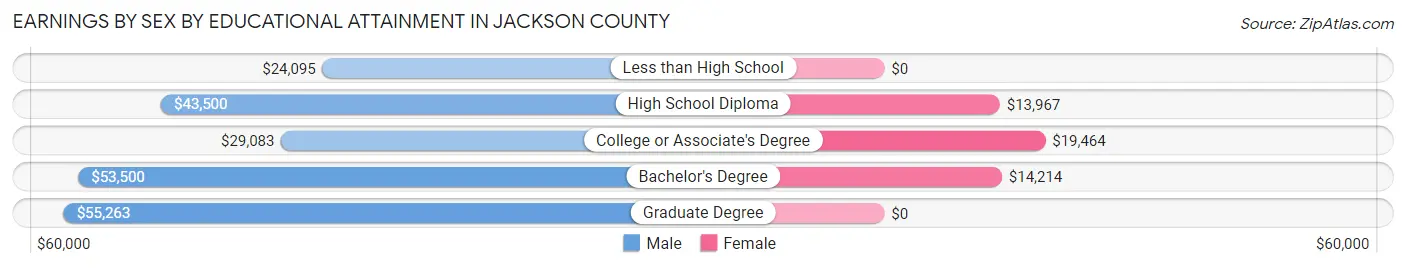
Earnings by Sex by Educational Attainment in Jackson County
Average earnings in Jackson County are $39,286 for men and $14,970 for women, a difference of 61.9%. Men with an educational attainment of graduate degree enjoy the highest average annual earnings of $55,263, while those with less than high school education earn the least with $24,095. Women with an educational attainment of college or associate's degree earn the most with the average annual earnings of $19,464, while those with high school diploma education have the smallest earnings of $13,967.
| Educational Attainment | Male Income | Female Income |
| Less than High School | $24,095 | $0 |
| High School Diploma | $43,500 | $13,967 |
| College or Associate's Degree | $29,083 | $19,464 |
| Bachelor's Degree | $53,500 | $14,214 |
| Graduate Degree | $55,263 | $0 |
| Total | $39,286 | $14,970 |
Family Income in Jackson County
Family Income Brackets in Jackson County
According to the Jackson County family income data, there are 78 families falling into the $25,000 to $34,999 income range, which is the most common income bracket and makes up 19.8% of all families. Conversely, the $10,000 to $14,999 income bracket is the least frequent group with only 6 families (1.5%) belonging to this category.
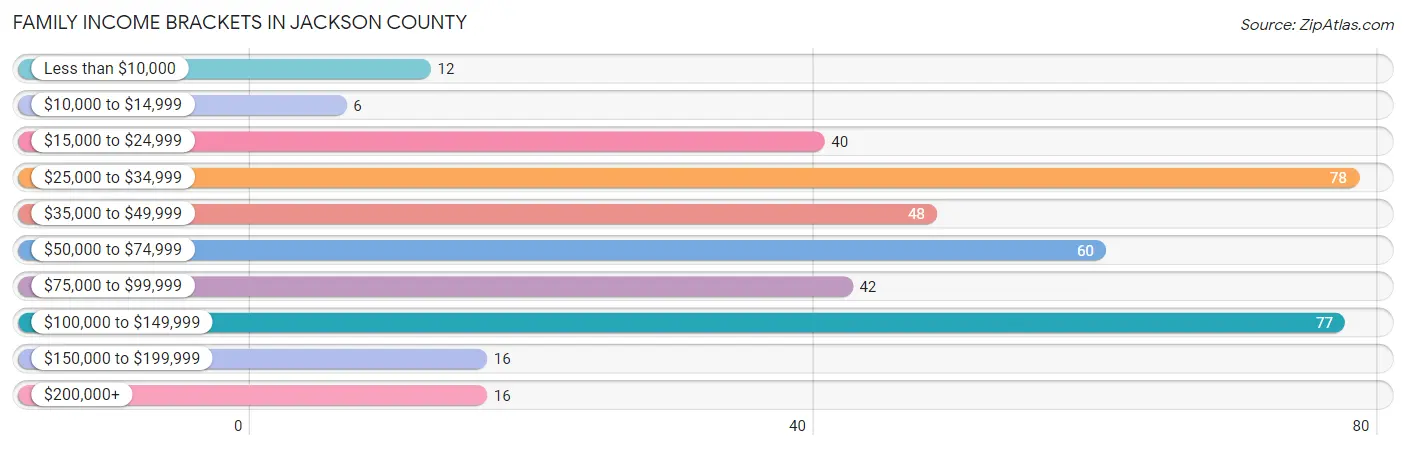
| Income Bracket | # Families | % Families |
| Less than $10,000 | 12 | 3.0% |
| $10,000 to $14,999 | 6 | 1.5% |
| $15,000 to $24,999 | 40 | 10.1% |
| $25,000 to $34,999 | 78 | 19.7% |
| $35,000 to $49,999 | 48 | 12.2% |
| $50,000 to $74,999 | 60 | 15.2% |
| $75,000 to $99,999 | 42 | 10.6% |
| $100,000 to $149,999 | 77 | 19.5% |
| $150,000 to $199,999 | 16 | 4.1% |
| $200,000+ | 16 | 4.1% |
Family Income by Famaliy Size in Jackson County
3-person families (47 | 11.9%) account for the highest median family income in Jackson County with $58,036 per family, while 2-person families (229 | 58.0%) have the highest median income of $25,438 per family member.
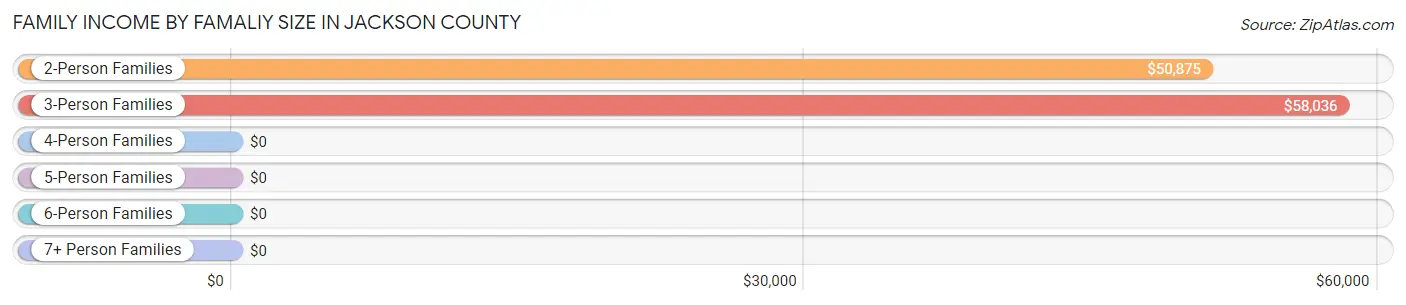
| Income Bracket | # Families | Median Income |
| 2-Person Families | 229 (58.0%) | $50,875 |
| 3-Person Families | 47 (11.9%) | $58,036 |
| 4-Person Families | 101 (25.6%) | $0 |
| 5-Person Families | 18 (4.6%) | $0 |
| 6-Person Families | 0 (0.0%) | $0 |
| 7+ Person Families | 0 (0.0%) | $0 |
| Total | 395 (100.0%) | $53,750 |
Family Income by Number of Earners in Jackson County
The median family income in Jackson County is $53,750, with families comprising 3+ earners (46) having the highest median family income of $153,409, while families with no earners (69) have the lowest median family income of $30,536, accounting for 11.7% and 17.5% of families, respectively.

| Number of Earners | # Families | Median Income |
| No Earners | 69 (17.5%) | $30,536 |
| 1 Earner | 153 (38.7%) | $39,455 |
| 2 Earners | 127 (32.2%) | $82,656 |
| 3+ Earners | 46 (11.7%) | $153,409 |
| Total | 395 (100.0%) | $53,750 |
Household Income in Jackson County
Household Income Brackets in Jackson County
With 136 households falling in the category, the $25,000 to $34,999 income range is the most frequent in Jackson County, accounting for 21.1% of all households. In contrast, only 16 households (2.5%) fall into the $150,000 to $199,999 income bracket, making it the least populous group.
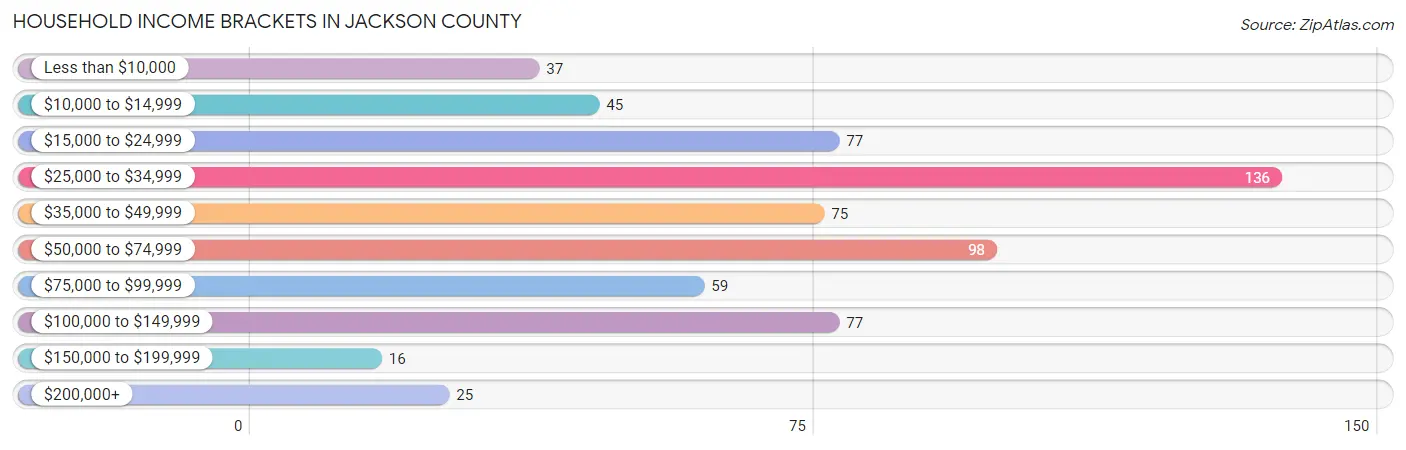
| Income Bracket | # Households | % Households |
| Less than $10,000 | 37 | 5.7% |
| $10,000 to $14,999 | 45 | 7.0% |
| $15,000 to $24,999 | 77 | 11.9% |
| $25,000 to $34,999 | 136 | 21.1% |
| $35,000 to $49,999 | 75 | 11.6% |
| $50,000 to $74,999 | 98 | 15.2% |
| $75,000 to $99,999 | 59 | 9.1% |
| $100,000 to $149,999 | 77 | 11.9% |
| $150,000 to $199,999 | 16 | 2.5% |
| $200,000+ | 25 | 3.9% |
Household Income by Householder Age in Jackson County
The median household income in Jackson County is $38,686, with the highest median household income of $53,056 found in the 25 to 44 years age bracket for the primary householder. A total of 136 households (21.1%) fall into this category.
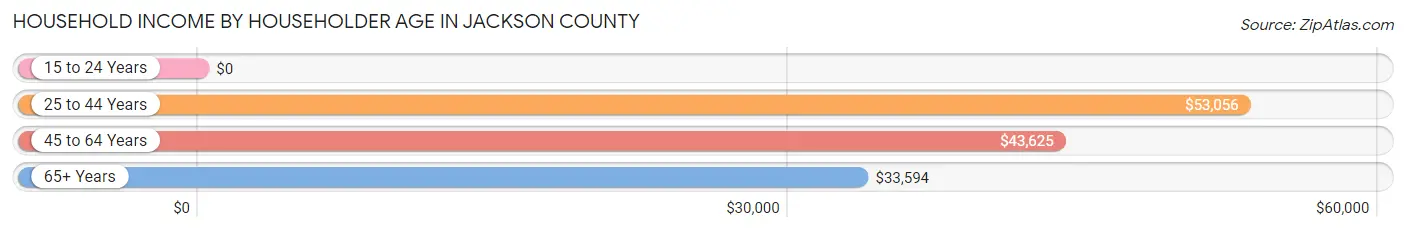
| Income Bracket | # Households | Median Income |
| 15 to 24 Years | 0 (0.0%) | $0 |
| 25 to 44 Years | 136 (21.1%) | $53,056 |
| 45 to 64 Years | 231 (35.8%) | $43,625 |
| 65+ Years | 278 (43.1%) | $33,594 |
| Total | 645 (100.0%) | $38,686 |
Poverty in Jackson County
Income Below Poverty by Sex and Age in Jackson County
With 20.6% poverty level for males and 21.1% for females among the residents of Jackson County, 6 to 11 year old males and 16 and 17 year old females are the most vulnerable to poverty, with 25 males (100.0%) and 26 females (48.1%) in their respective age groups living below the poverty level.
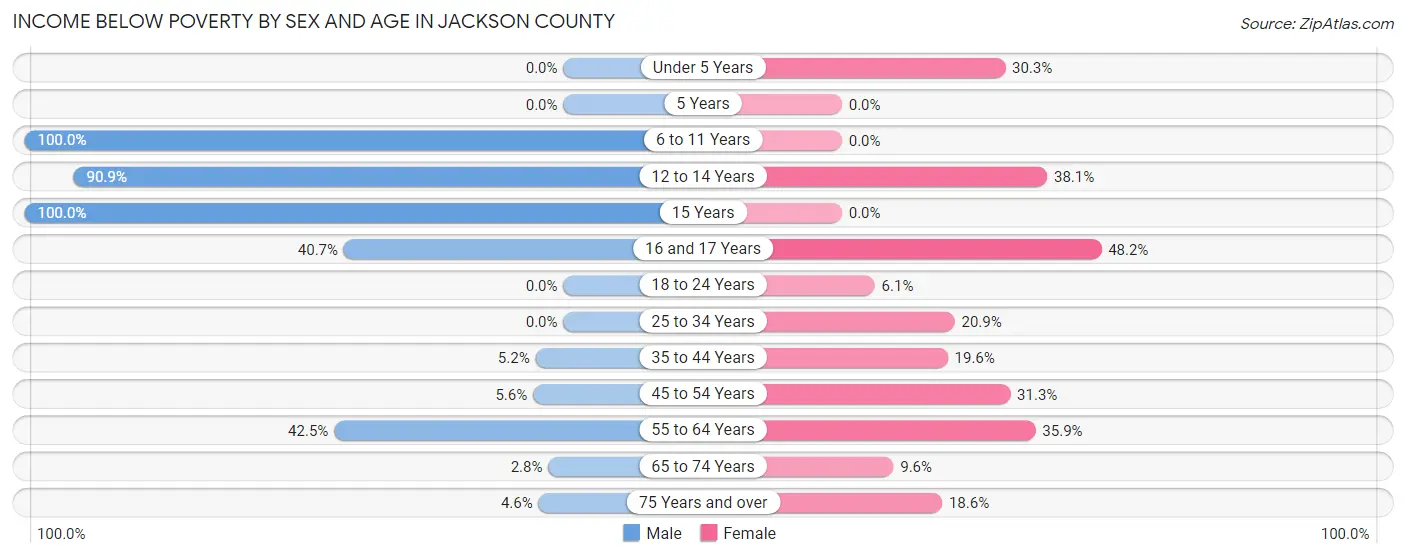
| Age Bracket | Male | Female |
| Under 5 Years | 0 (0.0%) | 10 (30.3%) |
| 5 Years | 0 (0.0%) | 0 (0.0%) |
| 6 to 11 Years | 25 (100.0%) | 0 (0.0%) |
| 12 to 14 Years | 40 (90.9%) | 8 (38.1%) |
| 15 Years | 4 (100.0%) | 0 (0.0%) |
| 16 and 17 Years | 11 (40.7%) | 26 (48.1%) |
| 18 to 24 Years | 0 (0.0%) | 5 (6.1%) |
| 25 to 34 Years | 0 (0.0%) | 9 (20.9%) |
| 35 to 44 Years | 3 (5.2%) | 11 (19.6%) |
| 45 to 54 Years | 5 (5.6%) | 25 (31.2%) |
| 55 to 64 Years | 57 (42.5%) | 23 (35.9%) |
| 65 to 74 Years | 4 (2.8%) | 13 (9.6%) |
| 75 Years and over | 4 (4.6%) | 16 (18.6%) |
| Total | 153 (20.6%) | 146 (21.1%) |
Income Above Poverty by Sex and Age in Jackson County
According to the poverty statistics in Jackson County, males aged under 5 years and females aged 5 years are the age groups that are most secure financially, with 100.0% of males and 100.0% of females in these age groups living above the poverty line.
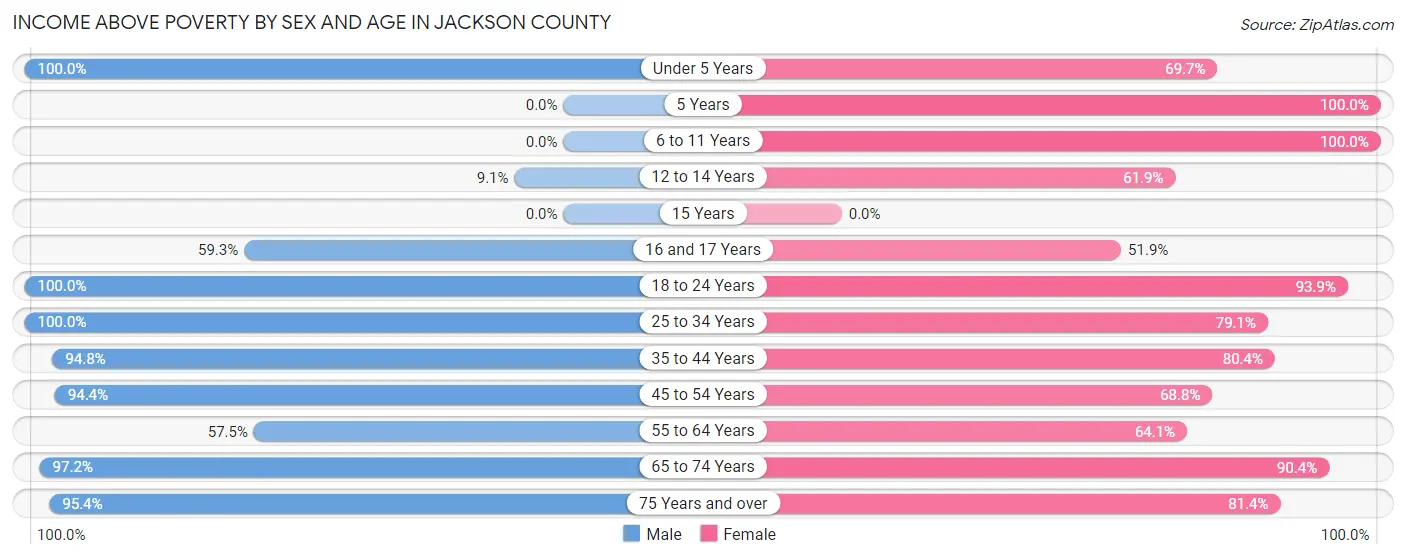
| Age Bracket | Male | Female |
| Under 5 Years | 14 (100.0%) | 23 (69.7%) |
| 5 Years | 0 (0.0%) | 13 (100.0%) |
| 6 to 11 Years | 0 (0.0%) | 24 (100.0%) |
| 12 to 14 Years | 4 (9.1%) | 13 (61.9%) |
| 15 Years | 0 (0.0%) | 0 (0.0%) |
| 16 and 17 Years | 16 (59.3%) | 28 (51.8%) |
| 18 to 24 Years | 22 (100.0%) | 77 (93.9%) |
| 25 to 34 Years | 95 (100.0%) | 34 (79.1%) |
| 35 to 44 Years | 55 (94.8%) | 45 (80.4%) |
| 45 to 54 Years | 84 (94.4%) | 55 (68.8%) |
| 55 to 64 Years | 77 (57.5%) | 41 (64.1%) |
| 65 to 74 Years | 139 (97.2%) | 123 (90.4%) |
| 75 Years and over | 83 (95.4%) | 70 (81.4%) |
| Total | 589 (79.4%) | 546 (78.9%) |
Income Below Poverty Among Married-Couple Families in Jackson County
The poverty statistics for married-couple families in Jackson County show that 7.8% or 25 of the total 321 families live below the poverty line. Families with 1 or 2 children have the highest poverty rate of 25.0%, comprising of 25 families. On the other hand, families with no children have the lowest poverty rate of 0.0%, which includes 0 families.
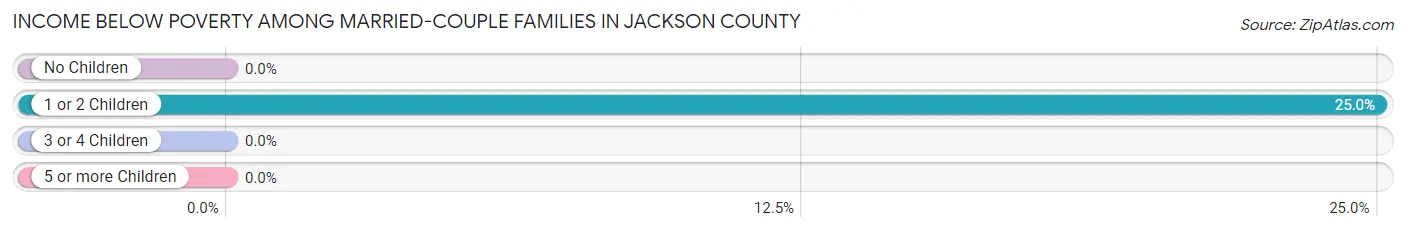
| Children | Above Poverty | Below Poverty |
| No Children | 214 (100.0%) | 0 (0.0%) |
| 1 or 2 Children | 75 (75.0%) | 25 (25.0%) |
| 3 or 4 Children | 7 (100.0%) | 0 (0.0%) |
| 5 or more Children | 0 (0.0%) | 0 (0.0%) |
| Total | 296 (92.2%) | 25 (7.8%) |
Income Below Poverty Among Single-Parent Households in Jackson County
According to the poverty data in Jackson County, 9.4% or 3 single-father households and 83.3% or 35 single-mother households are living below the poverty line. Among single-father households, those with 1 or 2 children have the highest poverty rate, with 3 households (100.0%) experiencing poverty. Likewise, among single-mother households, those with 1 or 2 children have the highest poverty rate, with 12 households (100.0%) falling below the poverty line.
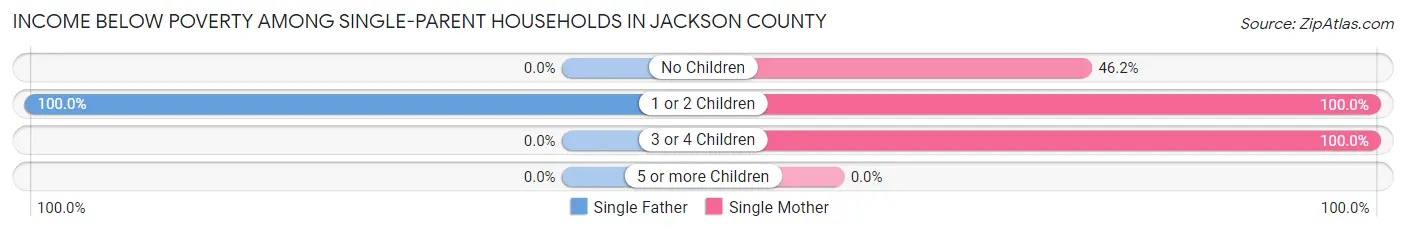
| Children | Single Father | Single Mother |
| No Children | 0 (0.0%) | 6 (46.2%) |
| 1 or 2 Children | 3 (100.0%) | 12 (100.0%) |
| 3 or 4 Children | 0 (0.0%) | 17 (100.0%) |
| 5 or more Children | 0 (0.0%) | 0 (0.0%) |
| Total | 3 (9.4%) | 35 (83.3%) |
Income Below Poverty Among Married-Couple vs Single-Parent Households in Jackson County
The poverty data for Jackson County shows that 25 of the married-couple family households (7.8%) and 38 of the single-parent households (51.3%) are living below the poverty level. Within the married-couple family households, those with 1 or 2 children have the highest poverty rate, with 25 households (25.0%) falling below the poverty line. Among the single-parent households, those with 1 or 2 children have the highest poverty rate, with 15 household (100.0%) living below poverty.
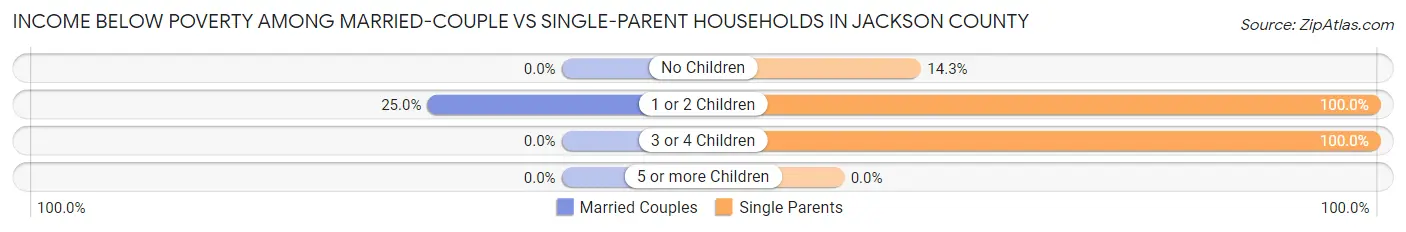
| Children | Married-Couple Families | Single-Parent Households |
| No Children | 0 (0.0%) | 6 (14.3%) |
| 1 or 2 Children | 25 (25.0%) | 15 (100.0%) |
| 3 or 4 Children | 0 (0.0%) | 17 (100.0%) |
| 5 or more Children | 0 (0.0%) | 0 (0.0%) |
| Total | 25 (7.8%) | 38 (51.3%) |
Race in Jackson County
The most populous races in Jackson County are White / Caucasian (1,346 | 93.5%), Hispanic or Latino (165 | 11.5%), and Two or more Races (85 | 5.9%).

| Race | # Population | % Population |
| Asian | 0 | 0.0% |
| Black / African American | 9 | 0.6% |
| Hawaiian / Pacific | 0 | 0.0% |
| Hispanic or Latino | 165 | 11.5% |
| Native / Alaskan | 0 | 0.0% |
| White / Caucasian | 1,346 | 93.5% |
| Two or more Races | 85 | 5.9% |
| Some other Race | 0 | 0.0% |
| Total | 1,440 | 100.0% |
Ancestry in Jackson County
The most populous ancestries reported in Jackson County are German (323 | 22.4%), Mexican (157 | 10.9%), English (111 | 7.7%), Irish (99 | 6.9%), and Swedish (95 | 6.6%), together accounting for 54.5% of all Jackson County residents.
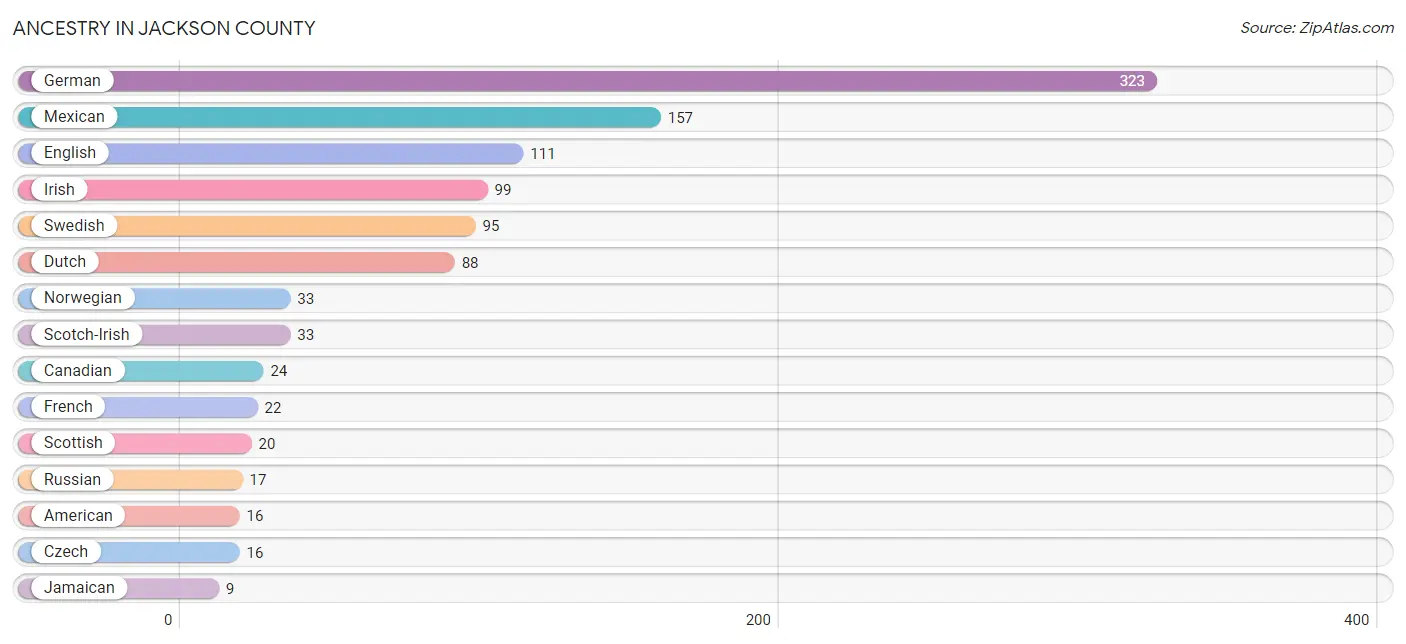
| Ancestry | # Population | % Population |
| American | 16 | 1.1% |
| Canadian | 24 | 1.7% |
| Choctaw | 1 | 0.1% |
| Czech | 16 | 1.1% |
| Dutch | 88 | 6.1% |
| English | 111 | 7.7% |
| European | 4 | 0.3% |
| French | 22 | 1.5% |
| French Canadian | 4 | 0.3% |
| German | 323 | 22.4% |
| Hungarian | 3 | 0.2% |
| Irish | 99 | 6.9% |
| Italian | 3 | 0.2% |
| Jamaican | 9 | 0.6% |
| Mexican | 157 | 10.9% |
| Norwegian | 33 | 2.3% |
| Russian | 17 | 1.2% |
| Scotch-Irish | 33 | 2.3% |
| Scottish | 20 | 1.4% |
| South American | 6 | 0.4% |
| Swedish | 95 | 6.6% |
| Venezuelan | 6 | 0.4% |
| Yugoslavian | 5 | 0.4% | View All 23 Rows |
Immigrants in Jackson County
The most numerous immigrant groups reported in Jackson County came from Latin America (6 | 0.4%), South America (6 | 0.4%), and Venezuela (6 | 0.4%), together accounting for 1.3% of all Jackson County residents.

| Immigration Origin | # Population | % Population |
| Latin America | 6 | 0.4% |
| South America | 6 | 0.4% |
| Venezuela | 6 | 0.4% | View All 3 Rows |
Sex and Age in Jackson County
Sex and Age in Jackson County
The most populous age groups in Jackson County are 65 to 69 Years (87 | 11.6%) for men and 65 to 69 Years (113 | 16.3%) for women.
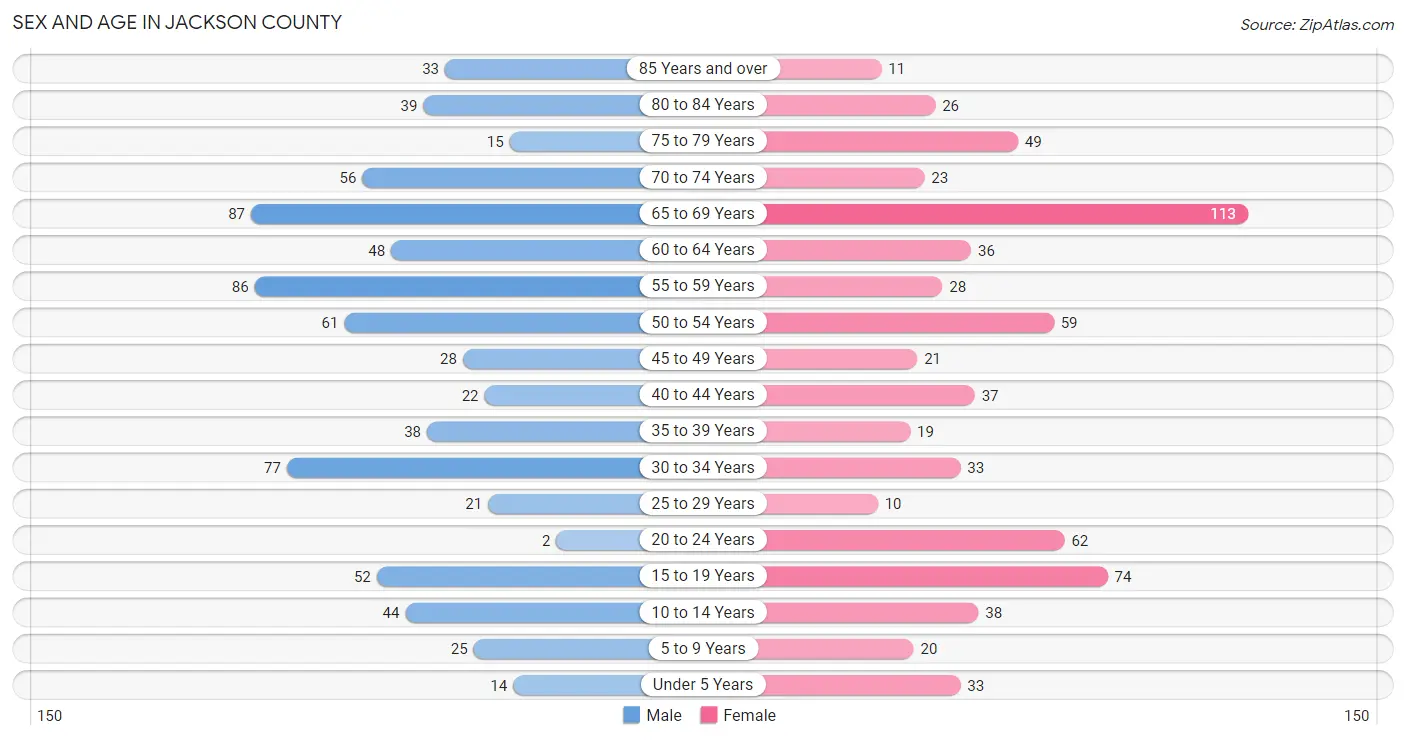
| Age Bracket | Male | Female |
| Under 5 Years | 14 (1.9%) | 33 (4.8%) |
| 5 to 9 Years | 25 (3.3%) | 20 (2.9%) |
| 10 to 14 Years | 44 (5.9%) | 38 (5.5%) |
| 15 to 19 Years | 52 (7.0%) | 74 (10.7%) |
| 20 to 24 Years | 2 (0.3%) | 62 (9.0%) |
| 25 to 29 Years | 21 (2.8%) | 10 (1.5%) |
| 30 to 34 Years | 77 (10.3%) | 33 (4.8%) |
| 35 to 39 Years | 38 (5.1%) | 19 (2.8%) |
| 40 to 44 Years | 22 (2.9%) | 37 (5.3%) |
| 45 to 49 Years | 28 (3.7%) | 21 (3.0%) |
| 50 to 54 Years | 61 (8.2%) | 59 (8.5%) |
| 55 to 59 Years | 86 (11.5%) | 28 (4.1%) |
| 60 to 64 Years | 48 (6.4%) | 36 (5.2%) |
| 65 to 69 Years | 87 (11.6%) | 113 (16.3%) |
| 70 to 74 Years | 56 (7.5%) | 23 (3.3%) |
| 75 to 79 Years | 15 (2.0%) | 49 (7.1%) |
| 80 to 84 Years | 39 (5.2%) | 26 (3.8%) |
| 85 Years and over | 33 (4.4%) | 11 (1.6%) |
| Total | 748 (100.0%) | 692 (100.0%) |
Families and Households in Jackson County
Median Family Size in Jackson County
The median family size in Jackson County is 2.83 persons per family, with single female/mother families (42 | 10.6%) accounting for the largest median family size of 3.12 persons per family. On the other hand, married-couple families (321 | 81.3%) represent the smallest median family size with 2.79 persons per family.
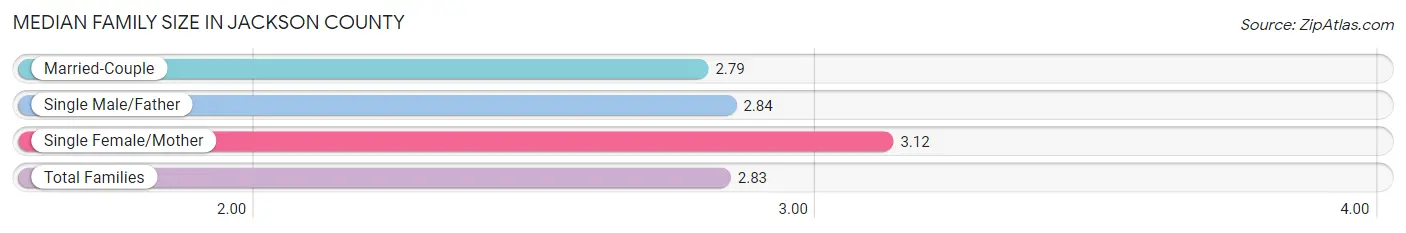
| Family Type | # Families | Family Size |
| Married-Couple | 321 (81.3%) | 2.79 |
| Single Male/Father | 32 (8.1%) | 2.84 |
| Single Female/Mother | 42 (10.6%) | 3.12 |
| Total Families | 395 (100.0%) | 2.83 |
Median Household Size in Jackson County
The median household size in Jackson County is 2.20 persons per household, with single female/mother households (42 | 6.5%) accounting for the largest median household size of 3.12 persons per household. non-family households (250 | 38.8%) represent the smallest median household size with 1.20 persons per household.
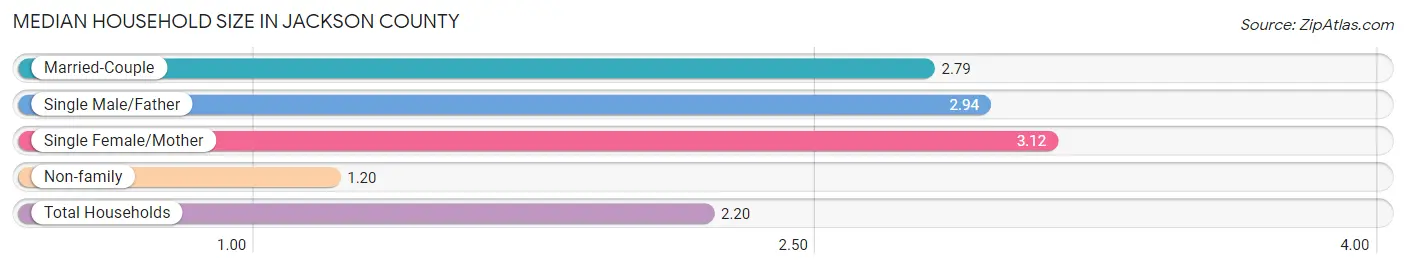
| Household Type | # Households | Household Size |
| Married-Couple | 321 (49.8%) | 2.79 |
| Single Male/Father | 32 (5.0%) | 2.94 |
| Single Female/Mother | 42 (6.5%) | 3.12 |
| Non-family | 250 (38.8%) | 1.20 |
| Total Households | 645 (100.0%) | 2.20 |
Household Size by Marriage Status in Jackson County
Out of a total of 645 households in Jackson County, 395 (61.2%) are family households, while 250 (38.8%) are nonfamily households. The most numerous type of family households are 2-person households, comprising 229, and the most common type of nonfamily households are 1-person households, comprising 222.

| Household Size | Family Households | Nonfamily Households |
| 1-Person Households | - | 222 (34.4%) |
| 2-Person Households | 229 (35.5%) | 28 (4.3%) |
| 3-Person Households | 44 (6.8%) | 0 (0.0%) |
| 4-Person Households | 104 (16.1%) | 0 (0.0%) |
| 5-Person Households | 18 (2.8%) | 0 (0.0%) |
| 6-Person Households | 0 (0.0%) | 0 (0.0%) |
| 7+ Person Households | 0 (0.0%) | 0 (0.0%) |
| Total | 395 (61.2%) | 250 (38.8%) |
Female Fertility in Jackson County
Fertility by Age in Jackson County
| Age Bracket | Women with Births | Births / 1,000 Women |
| 15 to 19 years | 0 (0.0%) | 0.0 |
| 20 to 34 years | 0 (0.0%) | 0.0 |
| 35 to 50 years | 0 (0.0%) | 0.0 |
| Total | 0 (0.0%) | 0.0 |
Fertility by Age by Marriage Status in Jackson County
| Age Bracket | Married | Unmarried |
| 15 to 19 years | 0 (0.0%) | 0 (0.0%) |
| 20 to 34 years | 0 (0.0%) | 0 (0.0%) |
| 35 to 50 years | 0 (0.0%) | 0 (0.0%) |
| Total | 0 (0.0%) | 0 (0.0%) |
Fertility by Education in Jackson County
| Educational Attainment | Women with Births | Births / 1,000 Women |
| Less than High School | 0 (0.0%) | 0.0 |
| High School Diploma | 0 (0.0%) | 0.0 |
| College or Associate's Degree | 0 (0.0%) | 0.0 |
| Bachelor's Degree | 0 (0.0%) | 0.0 |
| Graduate Degree | 0 (0.0%) | 0.0 |
| Total | 0 (0.0%) | 0.0 |
Fertility by Education by Marriage Status in Jackson County
| Educational Attainment | Married | Unmarried |
| Less than High School | 0 (0.0%) | 0 (0.0%) |
| High School Diploma | 0 (0.0%) | 0 (0.0%) |
| College or Associate's Degree | 0 (0.0%) | 0 (0.0%) |
| Bachelor's Degree | 0 (0.0%) | 0 (0.0%) |
| Graduate Degree | 0 (0.0%) | 0 (0.0%) |
| Total | 0 (0.0%) | 0 (0.0%) |
Employment Characteristics in Jackson County
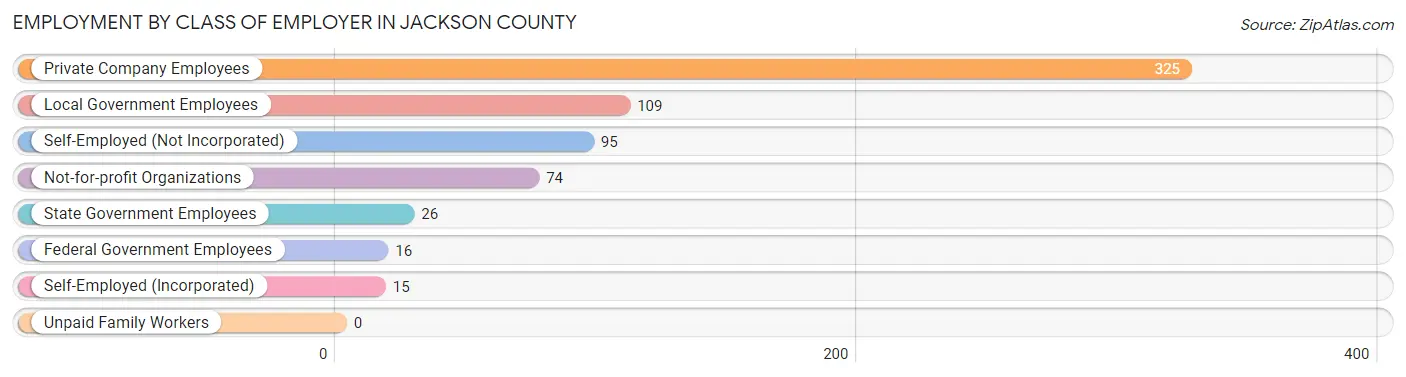
Employment by Class of Employer in Jackson County
Among the 660 employed individuals in Jackson County, private company employees (325 | 49.2%), local government employees (109 | 16.5%), and self-employed (not incorporated) (95 | 14.4%) make up the most common classes of employment.
| Employer Class | # Employees | % Employees |
| Private Company Employees | 325 | 49.2% |
| Self-Employed (Incorporated) | 15 | 2.3% |
| Self-Employed (Not Incorporated) | 95 | 14.4% |
| Not-for-profit Organizations | 74 | 11.2% |
| Local Government Employees | 109 | 16.5% |
| State Government Employees | 26 | 3.9% |
| Federal Government Employees | 16 | 2.4% |
| Unpaid Family Workers | 0 | 0.0% |
| Total | 660 | 100.0% |
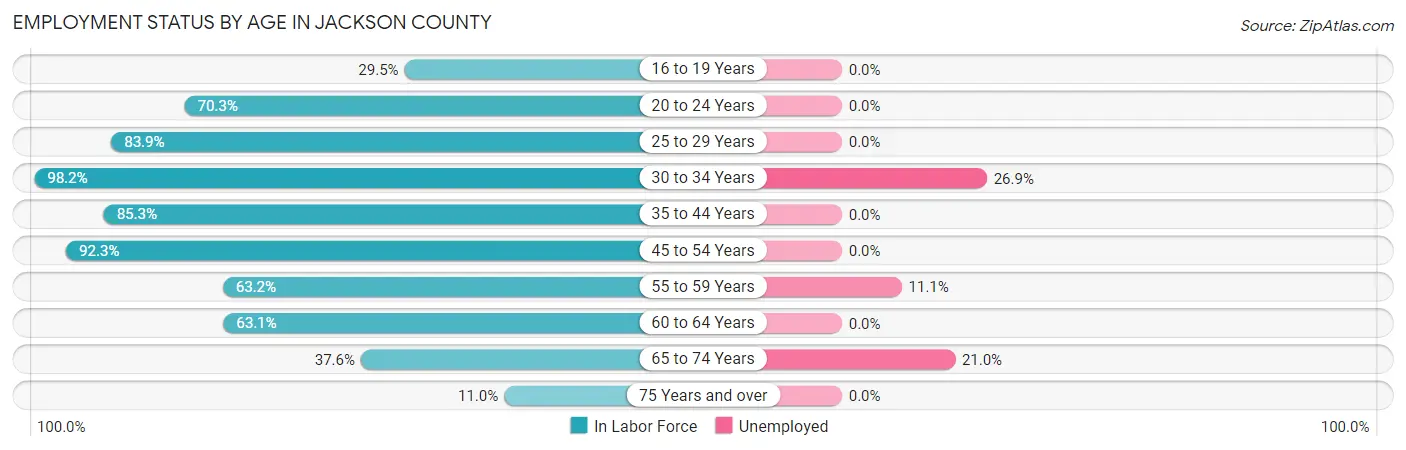
Employment Status by Age in Jackson County
According to the labor force statistics for Jackson County, out of the total population over 16 years of age (1,262), 57.0% or 719 individuals are in the labor force, with 8.2% or 59 of them unemployed. The age group with the highest labor force participation rate is 30 to 34 years, with 98.2% or 108 individuals in the labor force. Within the labor force, the 30 to 34 years age range has the highest percentage of unemployed individuals, with 26.9% or 29 of them being unemployed.
| Age Bracket | In Labor Force | Unemployed |
| 16 to 19 Years | 36 (29.5%) | 0 (0.0%) |
| 20 to 24 Years | 45 (70.3%) | 0 (0.0%) |
| 25 to 29 Years | 26 (83.9%) | 0 (0.0%) |
| 30 to 34 Years | 108 (98.2%) | 29 (26.9%) |
| 35 to 44 Years | 99 (85.3%) | 0 (0.0%) |
| 45 to 54 Years | 156 (92.3%) | 0 (0.0%) |
| 55 to 59 Years | 72 (63.2%) | 8 (11.1%) |
| 60 to 64 Years | 53 (63.1%) | 0 (0.0%) |
| 65 to 74 Years | 105 (37.6%) | 22 (21.0%) |
| 75 Years and over | 19 (11.0%) | 0 (0.0%) |
| Total | 719 (57.0%) | 59 (8.2%) |
Employment Status by Educational Attainment in Jackson County
According to labor force statistics for Jackson County, 82.4% of individuals (514) out of the total population between 25 and 64 years of age (624) are in the labor force, with 7.2% or 37 of them being unemployed. The group with the highest labor force participation rate are those with the educational attainment of bachelor's degree or higher, with 86.3% or 139 individuals in the labor force. Within the labor force, individuals with less than high school education have the highest percentage of unemployment, with 29.0% or 29 of them being unemployed.

| Educational Attainment | In Labor Force | Unemployed |
| Less than High School | 100 (82.6%) | 35 (29.0%) |
| High School Diploma | 107 (74.3%) | 0 (0.0%) |
| College / Associate Degree | 168 (84.8%) | 5 (2.4%) |
| Bachelor's Degree or higher | 139 (86.3%) | 5 (2.9%) |
| Total | 514 (82.4%) | 45 (7.2%) |
Employment Occupations by Sex in Jackson County
Management, Business, Science and Arts Occupations
The most common Management, Business, Science and Arts occupations in Jackson County are Management (120 | 18.2%), Community & Social Service (63 | 9.6%), Education Instruction & Library (27 | 4.1%), Education, Arts & Media (25 | 3.8%), and Health Diagnosing & Treating (13 | 2.0%).
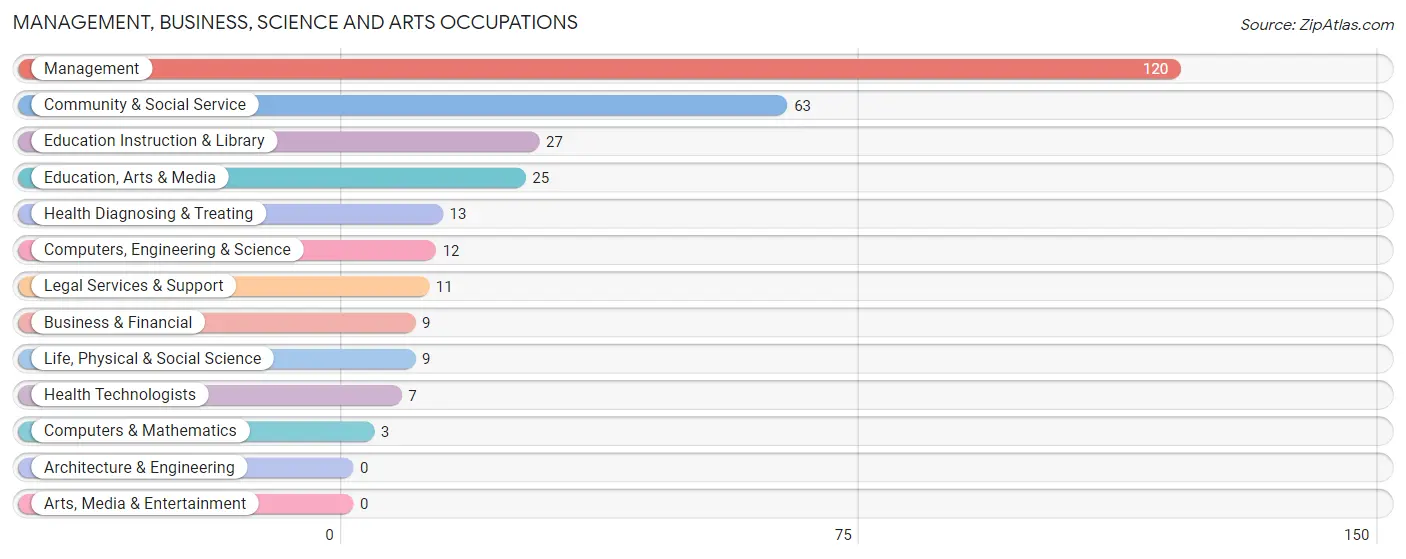
Management, Business, Science and Arts Occupations by Sex
Within the Management, Business, Science and Arts occupations in Jackson County, the most male-oriented occupations are Business & Financial (100.0%), Computers & Mathematics (100.0%), and Management (53.3%), while the most female-oriented occupations are Life, Physical & Social Science (100.0%), Education, Arts & Media (100.0%), and Legal Services & Support (100.0%).
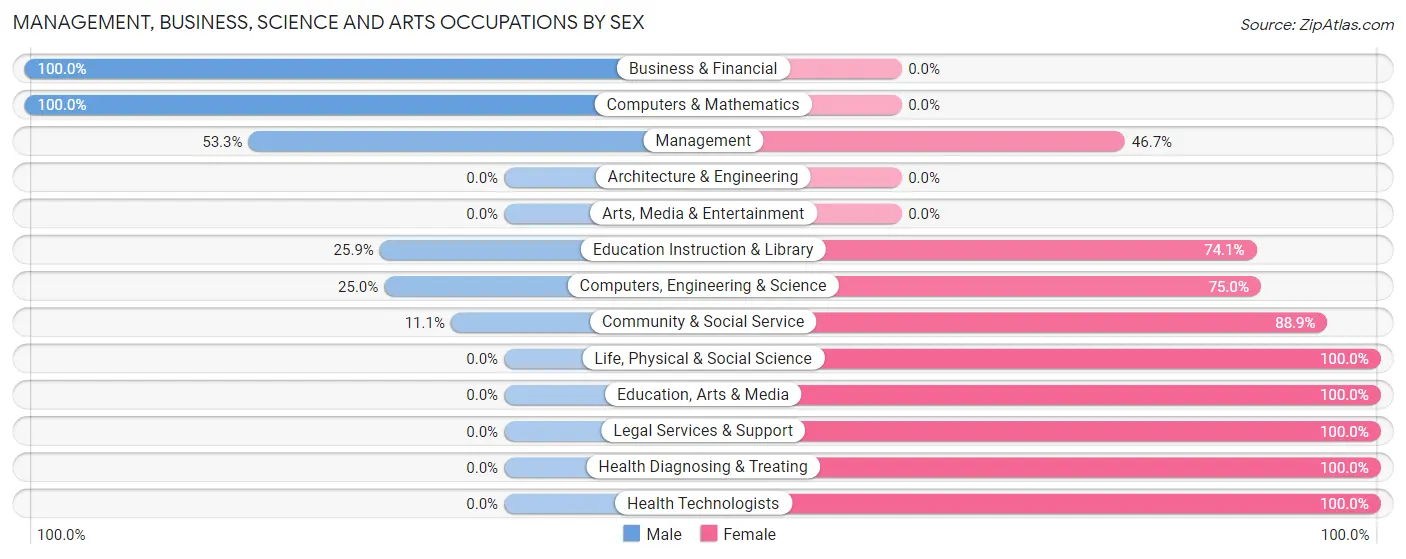
| Occupation | Male | Female |
| Management | 64 (53.3%) | 56 (46.7%) |
| Business & Financial | 9 (100.0%) | 0 (0.0%) |
| Computers, Engineering & Science | 3 (25.0%) | 9 (75.0%) |
| Computers & Mathematics | 3 (100.0%) | 0 (0.0%) |
| Architecture & Engineering | 0 (0.0%) | 0 (0.0%) |
| Life, Physical & Social Science | 0 (0.0%) | 9 (100.0%) |
| Community & Social Service | 7 (11.1%) | 56 (88.9%) |
| Education, Arts & Media | 0 (0.0%) | 25 (100.0%) |
| Legal Services & Support | 0 (0.0%) | 11 (100.0%) |
| Education Instruction & Library | 7 (25.9%) | 20 (74.1%) |
| Arts, Media & Entertainment | 0 (0.0%) | 0 (0.0%) |
| Health Diagnosing & Treating | 0 (0.0%) | 13 (100.0%) |
| Health Technologists | 0 (0.0%) | 7 (100.0%) |
| Total (Category) | 83 (38.3%) | 134 (61.8%) |
| Total (Overall) | 315 (47.7%) | 345 (52.3%) |
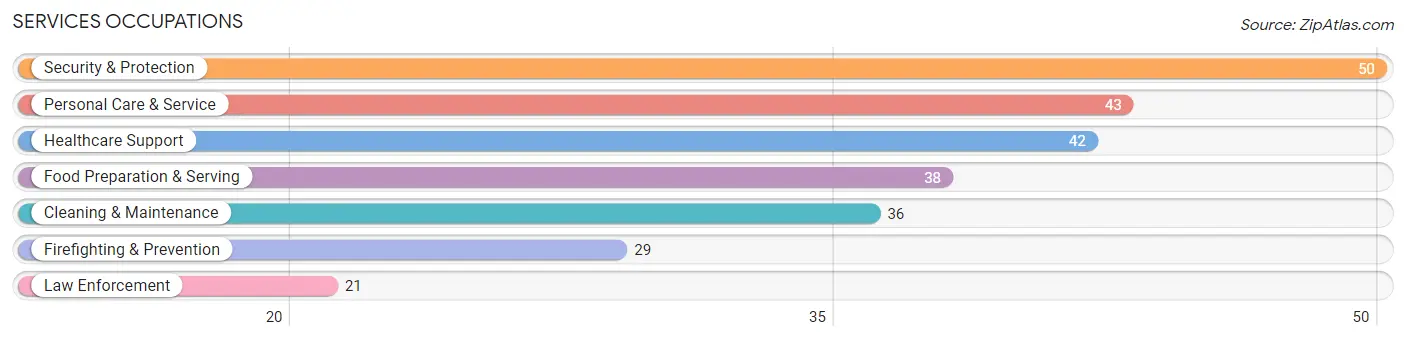
Services Occupations
The most common Services occupations in Jackson County are Security & Protection (50 | 7.6%), Personal Care & Service (43 | 6.5%), Healthcare Support (42 | 6.4%), Food Preparation & Serving (38 | 5.8%), and Cleaning & Maintenance (36 | 5.4%).
Services Occupations by Sex
Within the Services occupations in Jackson County, the most male-oriented occupations are Law Enforcement (100.0%), Security & Protection (64.0%), and Food Preparation & Serving (57.9%), while the most female-oriented occupations are Healthcare Support (100.0%), Firefighting & Prevention (62.1%), and Cleaning & Maintenance (58.3%).
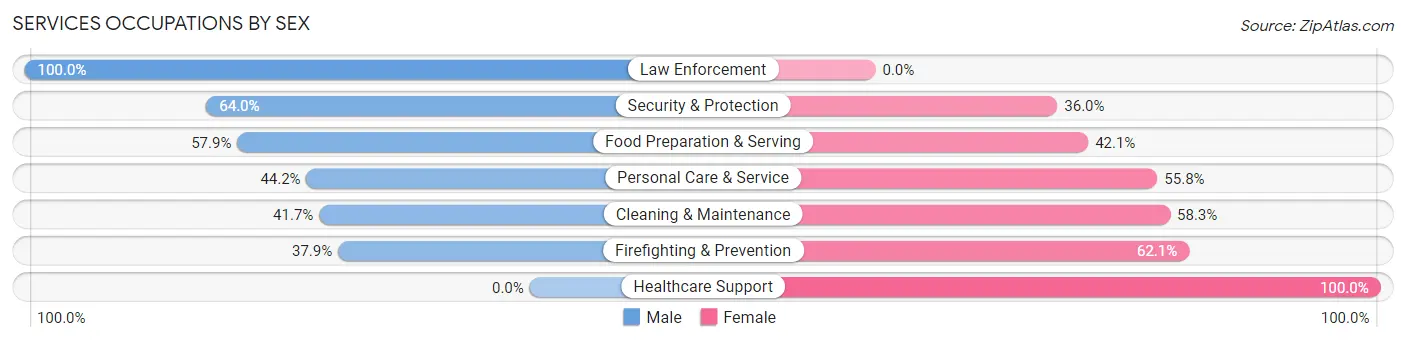
| Occupation | Male | Female |
| Healthcare Support | 0 (0.0%) | 42 (100.0%) |
| Security & Protection | 32 (64.0%) | 18 (36.0%) |
| Firefighting & Prevention | 11 (37.9%) | 18 (62.1%) |
| Law Enforcement | 21 (100.0%) | 0 (0.0%) |
| Food Preparation & Serving | 22 (57.9%) | 16 (42.1%) |
| Cleaning & Maintenance | 15 (41.7%) | 21 (58.3%) |
| Personal Care & Service | 19 (44.2%) | 24 (55.8%) |
| Total (Category) | 88 (42.1%) | 121 (57.9%) |
| Total (Overall) | 315 (47.7%) | 345 (52.3%) |
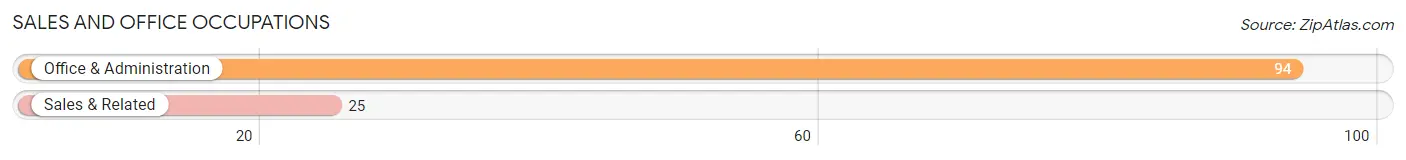
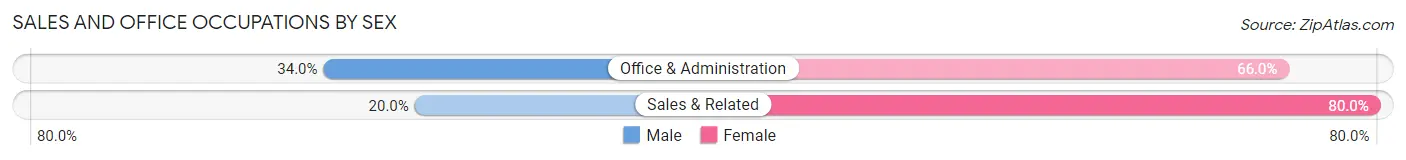
Sales and Office Occupations
The most common Sales and Office occupations in Jackson County are Office & Administration (94 | 14.2%), and Sales & Related (25 | 3.8%).
Sales and Office Occupations by Sex
| Occupation | Male | Female |
| Sales & Related | 5 (20.0%) | 20 (80.0%) |
| Office & Administration | 32 (34.0%) | 62 (66.0%) |
| Total (Category) | 37 (31.1%) | 82 (68.9%) |
| Total (Overall) | 315 (47.7%) | 345 (52.3%) |
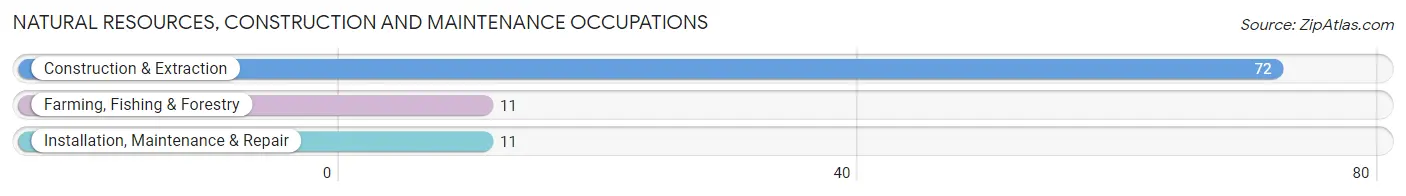
Natural Resources, Construction and Maintenance Occupations
The most common Natural Resources, Construction and Maintenance occupations in Jackson County are Construction & Extraction (72 | 10.9%), Farming, Fishing & Forestry (11 | 1.7%), and Installation, Maintenance & Repair (11 | 1.7%).
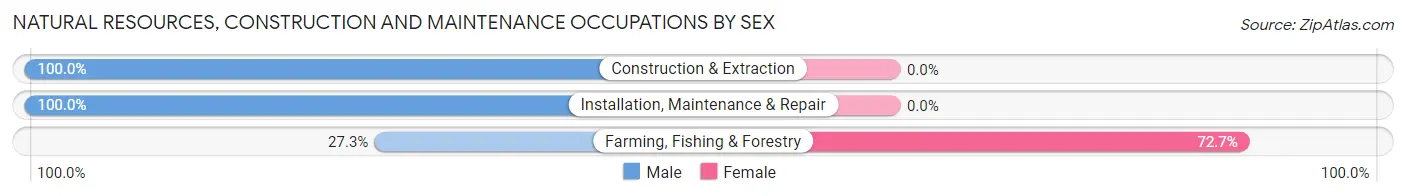
Natural Resources, Construction and Maintenance Occupations by Sex
| Occupation | Male | Female |
| Farming, Fishing & Forestry | 3 (27.3%) | 8 (72.7%) |
| Construction & Extraction | 72 (100.0%) | 0 (0.0%) |
| Installation, Maintenance & Repair | 11 (100.0%) | 0 (0.0%) |
| Total (Category) | 86 (91.5%) | 8 (8.5%) |
| Total (Overall) | 315 (47.7%) | 345 (52.3%) |
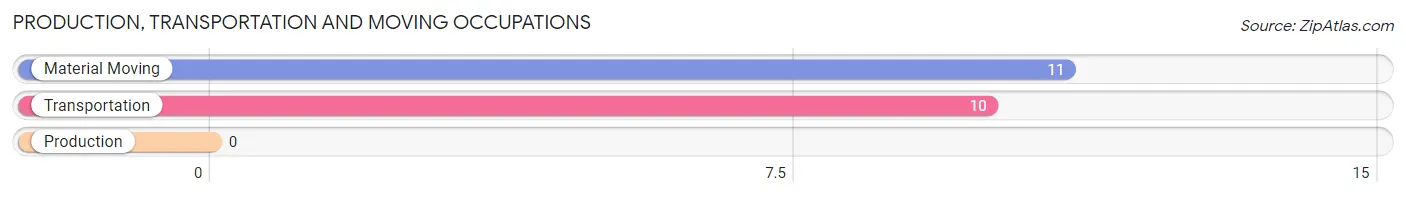
Production, Transportation and Moving Occupations
The most common Production, Transportation and Moving occupations in Jackson County are Material Moving (11 | 1.7%), and Transportation (10 | 1.5%).
Production, Transportation and Moving Occupations by Sex
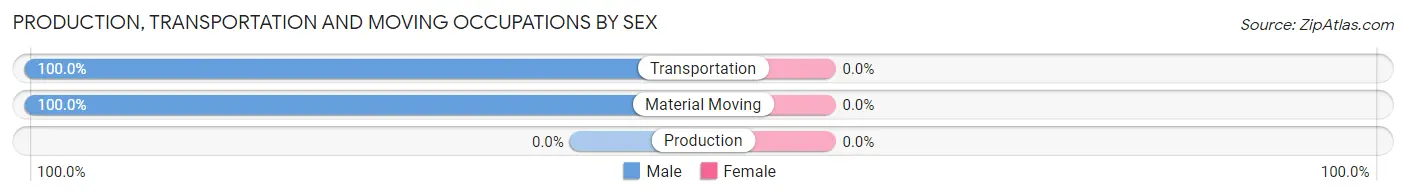
| Occupation | Male | Female |
| Production | 0 (0.0%) | 0 (0.0%) |
| Transportation | 10 (100.0%) | 0 (0.0%) |
| Material Moving | 11 (100.0%) | 0 (0.0%) |
| Total (Category) | 21 (100.0%) | 0 (0.0%) |
| Total (Overall) | 315 (47.7%) | 345 (52.3%) |
Employment Industries by Sex in Jackson County
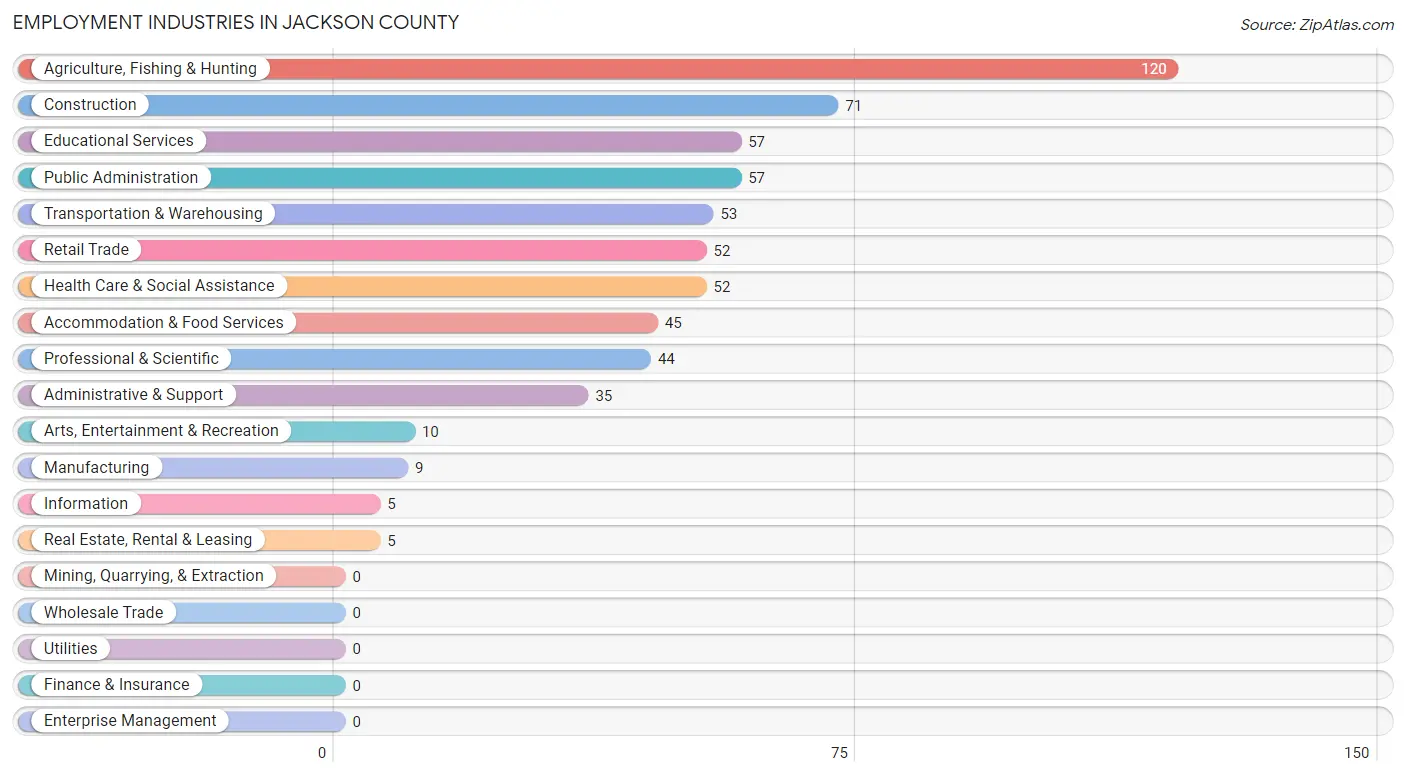
Employment Industries in Jackson County
The major employment industries in Jackson County include Agriculture, Fishing & Hunting (120 | 18.2%), Construction (71 | 10.8%), Educational Services (57 | 8.6%), Public Administration (57 | 8.6%), and Transportation & Warehousing (53 | 8.0%).
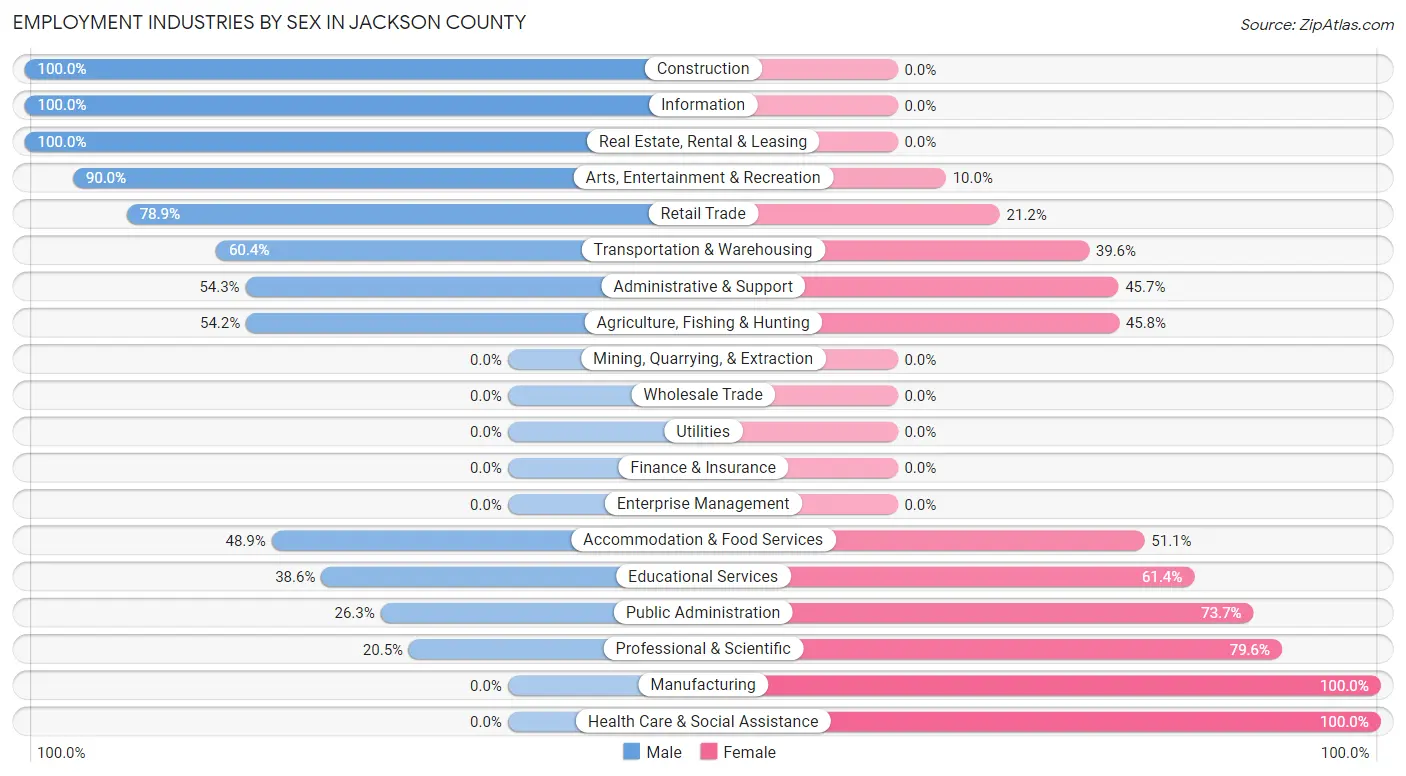
Employment Industries by Sex in Jackson County
The Jackson County industries that see more men than women are Construction (100.0%), Information (100.0%), and Real Estate, Rental & Leasing (100.0%), whereas the industries that tend to have a higher number of women are Manufacturing (100.0%), Health Care & Social Assistance (100.0%), and Professional & Scientific (79.5%).
| Industry | Male | Female |
| Agriculture, Fishing & Hunting | 65 (54.2%) | 55 (45.8%) |
| Mining, Quarrying, & Extraction | 0 (0.0%) | 0 (0.0%) |
| Construction | 71 (100.0%) | 0 (0.0%) |
| Manufacturing | 0 (0.0%) | 9 (100.0%) |
| Wholesale Trade | 0 (0.0%) | 0 (0.0%) |
| Retail Trade | 41 (78.8%) | 11 (21.1%) |
| Transportation & Warehousing | 32 (60.4%) | 21 (39.6%) |
| Utilities | 0 (0.0%) | 0 (0.0%) |
| Information | 5 (100.0%) | 0 (0.0%) |
| Finance & Insurance | 0 (0.0%) | 0 (0.0%) |
| Real Estate, Rental & Leasing | 5 (100.0%) | 0 (0.0%) |
| Professional & Scientific | 9 (20.4%) | 35 (79.5%) |
| Enterprise Management | 0 (0.0%) | 0 (0.0%) |
| Administrative & Support | 19 (54.3%) | 16 (45.7%) |
| Educational Services | 22 (38.6%) | 35 (61.4%) |
| Health Care & Social Assistance | 0 (0.0%) | 52 (100.0%) |
| Arts, Entertainment & Recreation | 9 (90.0%) | 1 (10.0%) |
| Accommodation & Food Services | 22 (48.9%) | 23 (51.1%) |
| Public Administration | 15 (26.3%) | 42 (73.7%) |
| Total | 315 (47.7%) | 345 (52.3%) |
Education in Jackson County
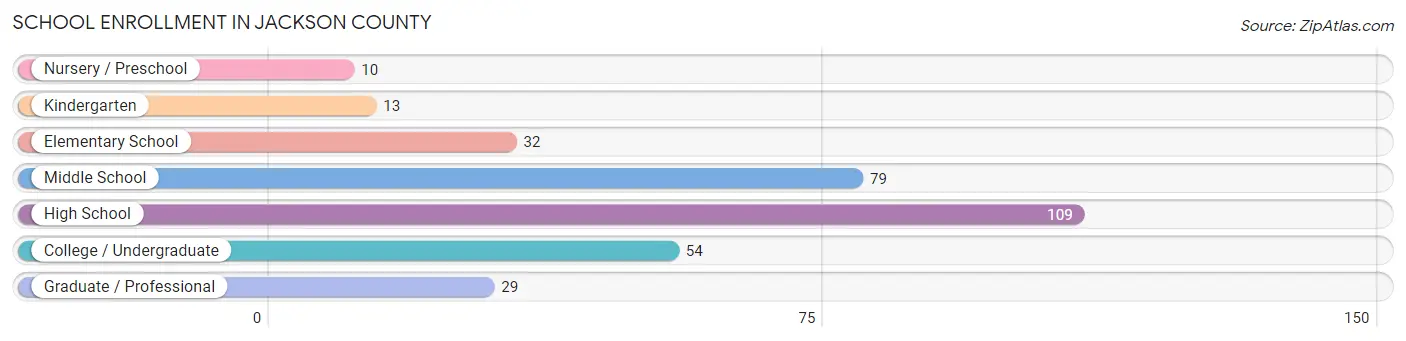
School Enrollment in Jackson County
The most common levels of schooling among the 326 students in Jackson County are high school (109 | 33.4%), middle school (79 | 24.2%), and college / undergraduate (54 | 16.6%).
| School Level | # Students | % Students |
| Nursery / Preschool | 10 | 3.1% |
| Kindergarten | 13 | 4.0% |
| Elementary School | 32 | 9.8% |
| Middle School | 79 | 24.2% |
| High School | 109 | 33.4% |
| College / Undergraduate | 54 | 16.6% |
| Graduate / Professional | 29 | 8.9% |
| Total | 326 | 100.0% |
School Enrollment by Age by Funding Source in Jackson County
Out of a total of 326 students who are enrolled in schools in Jackson County, 45 (13.8%) attend a private institution, while the remaining 281 (86.2%) are enrolled in public schools. The age group of 20 to 24 year olds has the highest likelihood of being enrolled in private schools, with 31 (100.0% in the age bracket) enrolled. Conversely, the age group of 3 to 4 year olds has the lowest likelihood of being enrolled in a private school, with 10 (100.0% in the age bracket) attending a public institution.
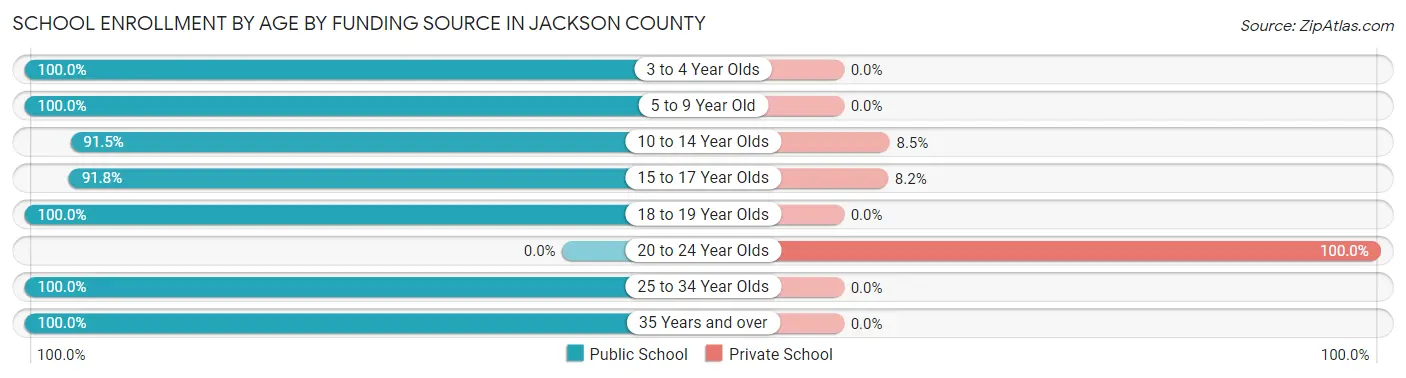
| Age Bracket | Public School | Private School |
| 3 to 4 Year Olds | 10 (100.0%) | 0 (0.0%) |
| 5 to 9 Year Old | 45 (100.0%) | 0 (0.0%) |
| 10 to 14 Year Olds | 75 (91.5%) | 7 (8.5%) |
| 15 to 17 Year Olds | 78 (91.8%) | 7 (8.2%) |
| 18 to 19 Year Olds | 41 (100.0%) | 0 (0.0%) |
| 20 to 24 Year Olds | 0 (0.0%) | 31 (100.0%) |
| 25 to 34 Year Olds | 11 (100.0%) | 0 (0.0%) |
| 35 Years and over | 21 (100.0%) | 0 (0.0%) |
| Total | 281 (86.2%) | 45 (13.8%) |
Educational Attainment by Field of Study in Jackson County
Education (116 | 37.8%), business (60 | 19.5%), bio, nature & agricultural (56 | 18.2%), science & technology (34 | 11.1%), and engineering (22 | 7.2%) are the most common fields of study among 307 individuals in Jackson County who have obtained a bachelor's degree or higher.
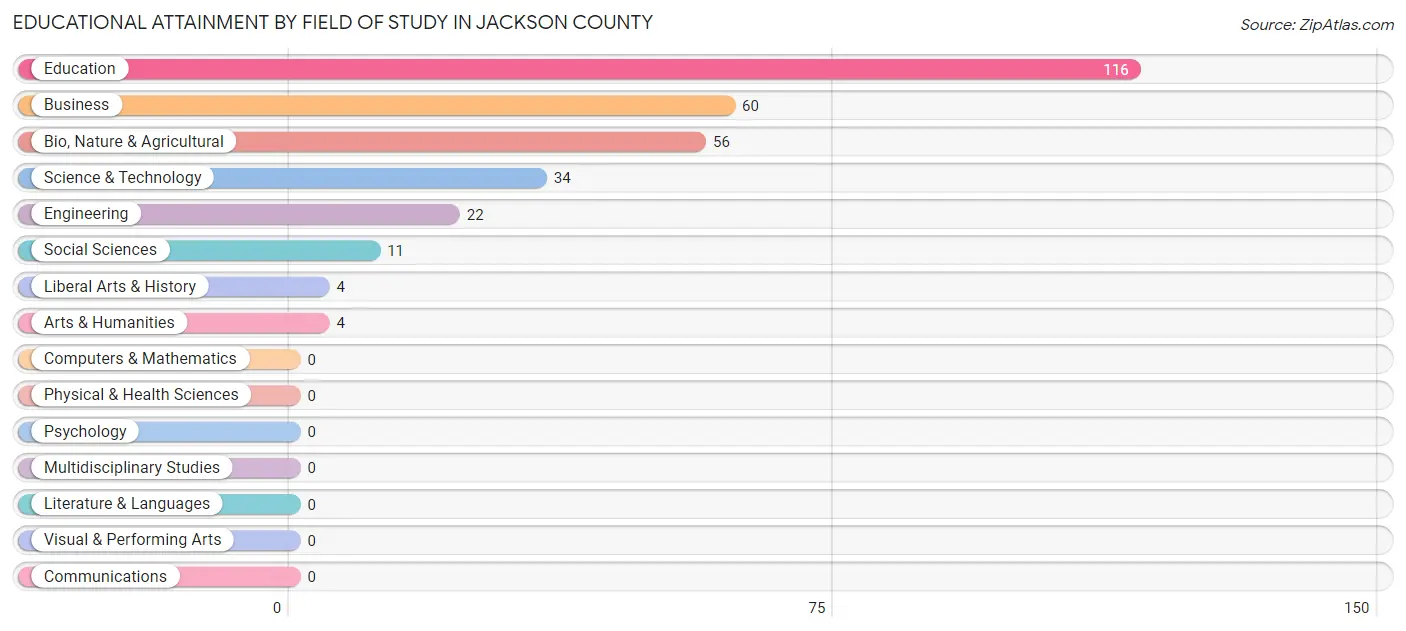
| Field of Study | # Graduates | % Graduates |
| Computers & Mathematics | 0 | 0.0% |
| Bio, Nature & Agricultural | 56 | 18.2% |
| Physical & Health Sciences | 0 | 0.0% |
| Psychology | 0 | 0.0% |
| Social Sciences | 11 | 3.6% |
| Engineering | 22 | 7.2% |
| Multidisciplinary Studies | 0 | 0.0% |
| Science & Technology | 34 | 11.1% |
| Business | 60 | 19.5% |
| Education | 116 | 37.8% |
| Literature & Languages | 0 | 0.0% |
| Liberal Arts & History | 4 | 1.3% |
| Visual & Performing Arts | 0 | 0.0% |
| Communications | 0 | 0.0% |
| Arts & Humanities | 4 | 1.3% |
| Total | 307 | 100.0% |
Transportation & Commute in Jackson County
Vehicle Availability by Sex in Jackson County
The most prevalent vehicle ownership categories in Jackson County are males with 2 vehicles (140, accounting for 45.0%) and females with 2 vehicles (131, making up 40.8%).
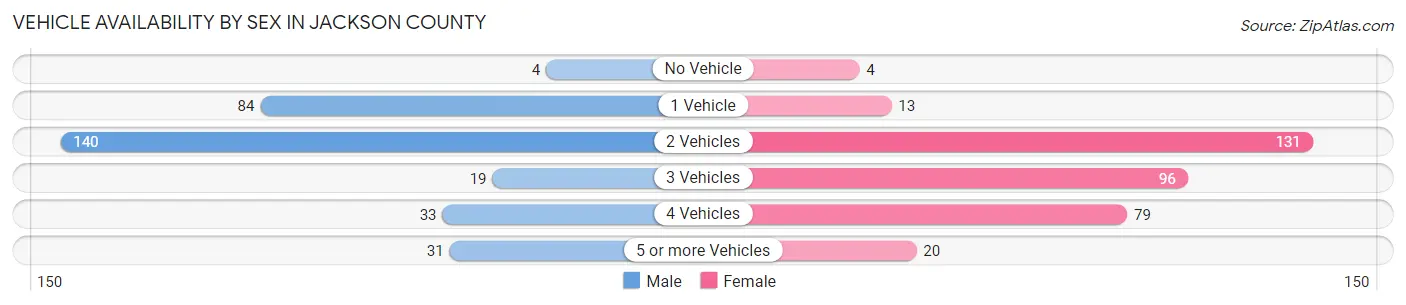
| Vehicles Available | Male | Female |
| No Vehicle | 4 (1.3%) | 4 (1.2%) |
| 1 Vehicle | 84 (27.0%) | 13 (3.8%) |
| 2 Vehicles | 140 (45.0%) | 131 (38.2%) |
| 3 Vehicles | 19 (6.1%) | 96 (28.0%) |
| 4 Vehicles | 33 (10.6%) | 79 (23.0%) |
| 5 or more Vehicles | 31 (10.0%) | 20 (5.8%) |
| Total | 311 (100.0%) | 343 (100.0%) |
Commute Time in Jackson County
The most frequently occuring commute durations in Jackson County are 5 to 9 minutes (242 commuters, 47.9%), 15 to 19 minutes (50 commuters, 9.9%), and 25 to 29 minutes (43 commuters, 8.5%).
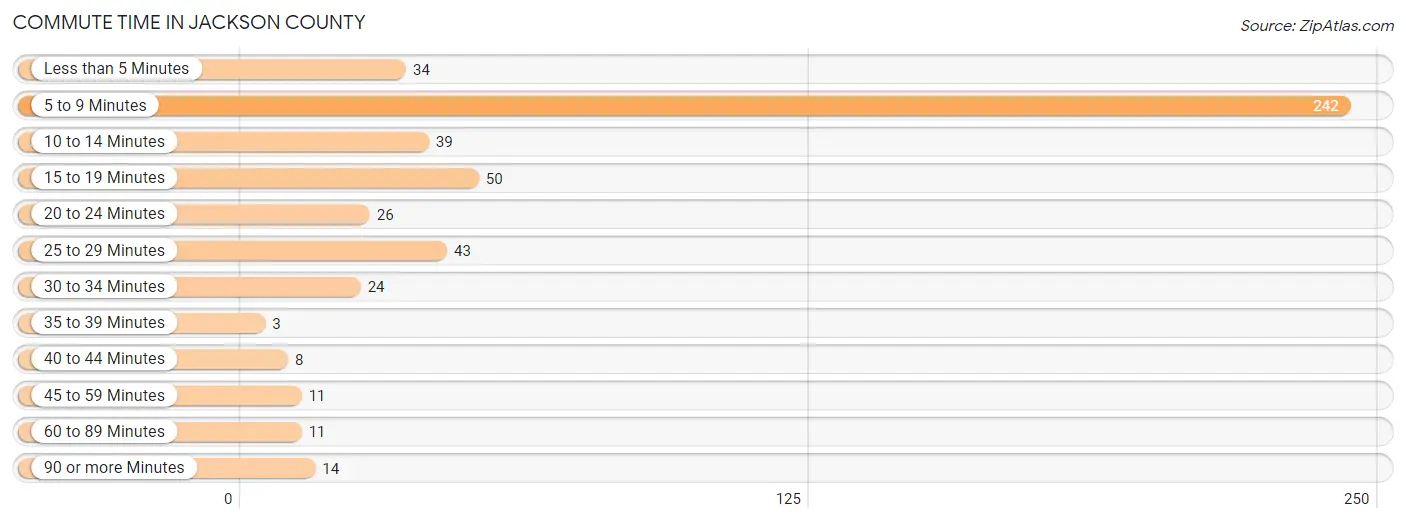
| Commute Time | # Commuters | % Commuters |
| Less than 5 Minutes | 34 | 6.7% |
| 5 to 9 Minutes | 242 | 47.9% |
| 10 to 14 Minutes | 39 | 7.7% |
| 15 to 19 Minutes | 50 | 9.9% |
| 20 to 24 Minutes | 26 | 5.1% |
| 25 to 29 Minutes | 43 | 8.5% |
| 30 to 34 Minutes | 24 | 4.8% |
| 35 to 39 Minutes | 3 | 0.6% |
| 40 to 44 Minutes | 8 | 1.6% |
| 45 to 59 Minutes | 11 | 2.2% |
| 60 to 89 Minutes | 11 | 2.2% |
| 90 or more Minutes | 14 | 2.8% |
Commute Time by Sex in Jackson County
The most common commute times in Jackson County are 5 to 9 minutes (110 commuters, 44.5%) for males and 5 to 9 minutes (132 commuters, 51.2%) for females.

| Commute Time | Male | Female |
| Less than 5 Minutes | 19 (7.7%) | 15 (5.8%) |
| 5 to 9 Minutes | 110 (44.5%) | 132 (51.2%) |
| 10 to 14 Minutes | 20 (8.1%) | 19 (7.4%) |
| 15 to 19 Minutes | 18 (7.3%) | 32 (12.4%) |
| 20 to 24 Minutes | 26 (10.5%) | 0 (0.0%) |
| 25 to 29 Minutes | 22 (8.9%) | 21 (8.1%) |
| 30 to 34 Minutes | 11 (4.4%) | 13 (5.0%) |
| 35 to 39 Minutes | 3 (1.2%) | 0 (0.0%) |
| 40 to 44 Minutes | 4 (1.6%) | 4 (1.5%) |
| 45 to 59 Minutes | 11 (4.4%) | 0 (0.0%) |
| 60 to 89 Minutes | 0 (0.0%) | 11 (4.3%) |
| 90 or more Minutes | 3 (1.2%) | 11 (4.3%) |
Time of Departure to Work by Sex in Jackson County
The most frequent times of departure to work in Jackson County are 6:30 AM to 6:59 AM (55, 22.3%) for males and 8:30 AM to 8:59 AM (67, 26.0%) for females.

| Time of Departure | Male | Female |
| 12:00 AM to 4:59 AM | 30 (12.1%) | 0 (0.0%) |
| 5:00 AM to 5:29 AM | 12 (4.9%) | 0 (0.0%) |
| 5:30 AM to 5:59 AM | 0 (0.0%) | 1 (0.4%) |
| 6:00 AM to 6:29 AM | 54 (21.9%) | 7 (2.7%) |
| 6:30 AM to 6:59 AM | 55 (22.3%) | 31 (12.0%) |
| 7:00 AM to 7:29 AM | 29 (11.7%) | 30 (11.6%) |
| 7:30 AM to 7:59 AM | 21 (8.5%) | 20 (7.7%) |
| 8:00 AM to 8:29 AM | 35 (14.2%) | 14 (5.4%) |
| 8:30 AM to 8:59 AM | 11 (4.4%) | 67 (26.0%) |
| 9:00 AM to 9:59 AM | 0 (0.0%) | 45 (17.4%) |
| 10:00 AM to 10:59 AM | 0 (0.0%) | 0 (0.0%) |
| 11:00 AM to 11:59 AM | 0 (0.0%) | 0 (0.0%) |
| 12:00 PM to 3:59 PM | 0 (0.0%) | 43 (16.7%) |
| 4:00 PM to 11:59 PM | 0 (0.0%) | 0 (0.0%) |
| Total | 247 (100.0%) | 258 (100.0%) |
Housing Occupancy in Jackson County
Occupancy by Ownership in Jackson County
Of the total 645 dwellings in Jackson County, owner-occupied units account for 496 (76.9%), while renter-occupied units make up 149 (23.1%).
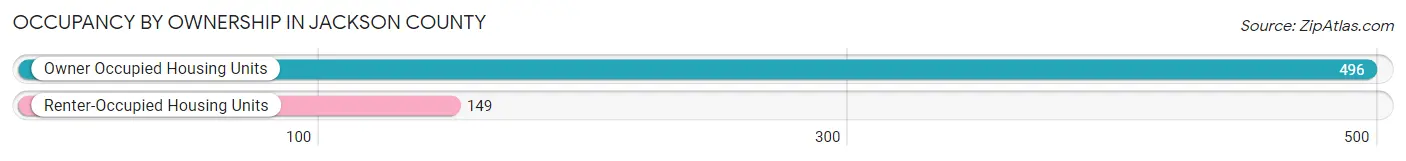
| Occupancy | # Housing Units | % Housing Units |
| Owner Occupied Housing Units | 496 | 76.9% |
| Renter-Occupied Housing Units | 149 | 23.1% |
| Total Occupied Housing Units | 645 | 100.0% |
Occupancy by Household Size in Jackson County
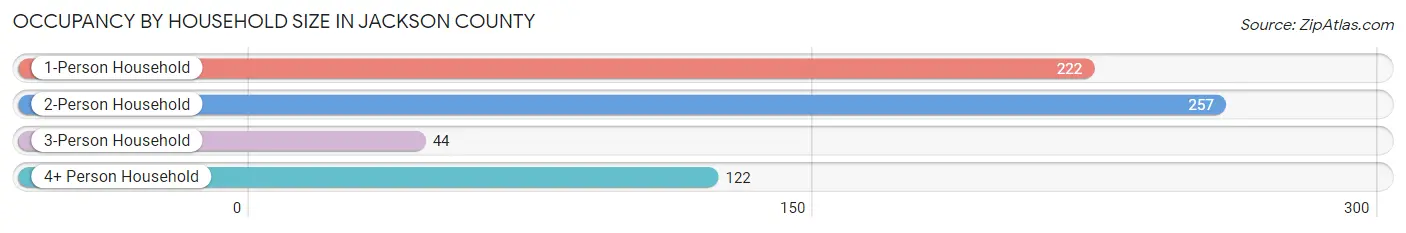
| Household Size | # Housing Units | % Housing Units |
| 1-Person Household | 222 | 34.4% |
| 2-Person Household | 257 | 39.8% |
| 3-Person Household | 44 | 6.8% |
| 4+ Person Household | 122 | 18.9% |
| Total Housing Units | 645 | 100.0% |
Occupancy by Ownership by Household Size in Jackson County
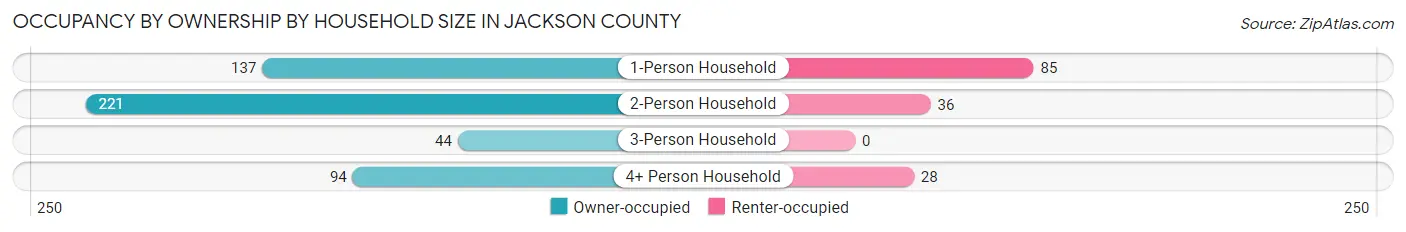
| Household Size | Owner-occupied | Renter-occupied |
| 1-Person Household | 137 (61.7%) | 85 (38.3%) |
| 2-Person Household | 221 (86.0%) | 36 (14.0%) |
| 3-Person Household | 44 (100.0%) | 0 (0.0%) |
| 4+ Person Household | 94 (77.0%) | 28 (23.0%) |
| Total Housing Units | 496 (76.9%) | 149 (23.1%) |
Occupancy by Educational Attainment in Jackson County
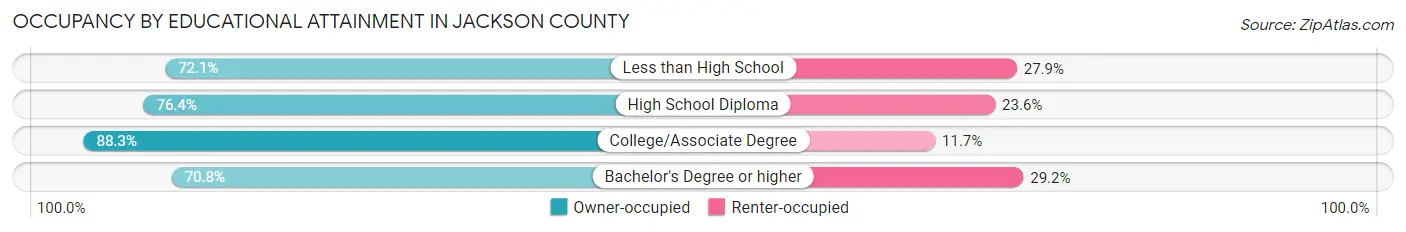
| Household Size | Owner-occupied | Renter-occupied |
| Less than High School | 75 (72.1%) | 29 (27.9%) |
| High School Diploma | 149 (76.4%) | 46 (23.6%) |
| College/Associate Degree | 136 (88.3%) | 18 (11.7%) |
| Bachelor's Degree or higher | 136 (70.8%) | 56 (29.2%) |
Occupancy by Age of Householder in Jackson County
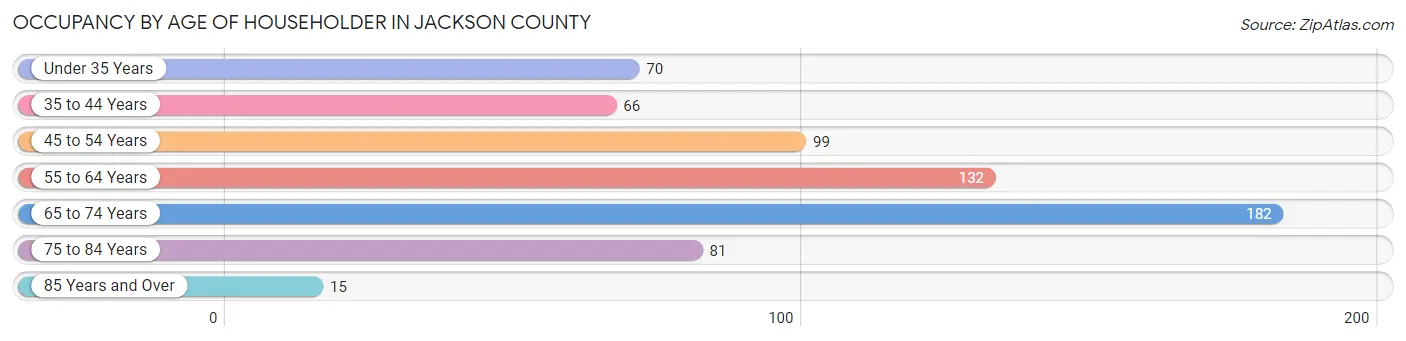
| Age Bracket | # Households | % Households |
| Under 35 Years | 70 | 10.8% |
| 35 to 44 Years | 66 | 10.2% |
| 45 to 54 Years | 99 | 15.3% |
| 55 to 64 Years | 132 | 20.5% |
| 65 to 74 Years | 182 | 28.2% |
| 75 to 84 Years | 81 | 12.6% |
| 85 Years and Over | 15 | 2.3% |
| Total | 645 | 100.0% |
Housing Finances in Jackson County
Median Income by Occupancy in Jackson County
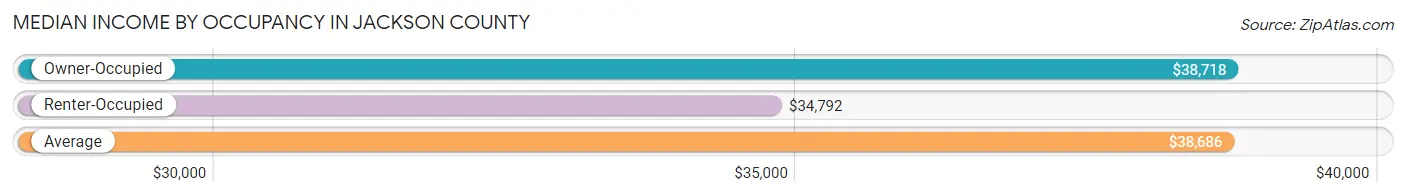
| Occupancy Type | # Households | Median Income |
| Owner-Occupied | 496 (76.9%) | $38,718 |
| Renter-Occupied | 149 (23.1%) | $34,792 |
| Average | 645 (100.0%) | $38,686 |
Occupancy by Householder Income Bracket in Jackson County

| Income Bracket | Owner-occupied | Renter-occupied |
| Less than $5,000 | 24 (4.8%) | 0 (0.0%) |
| $5,000 to $9,999 | 13 (2.6%) | 0 (0.0%) |
| $10,000 to $14,999 | 45 (9.1%) | 0 (0.0%) |
| $15,000 to $19,999 | 21 (4.2%) | 22 (14.8%) |
| $20,000 to $24,999 | 34 (6.9%) | 0 (0.0%) |
| $25,000 to $34,999 | 83 (16.7%) | 53 (35.6%) |
| $35,000 to $49,999 | 62 (12.5%) | 13 (8.7%) |
| $50,000 to $74,999 | 67 (13.5%) | 31 (20.8%) |
| $75,000 to $99,999 | 59 (11.9%) | 0 (0.0%) |
| $100,000 to $149,999 | 47 (9.5%) | 30 (20.1%) |
| $150,000 or more | 41 (8.3%) | 0 (0.0%) |
| Total | 496 (100.0%) | 149 (100.0%) |
Monthly Housing Cost Tiers in Jackson County
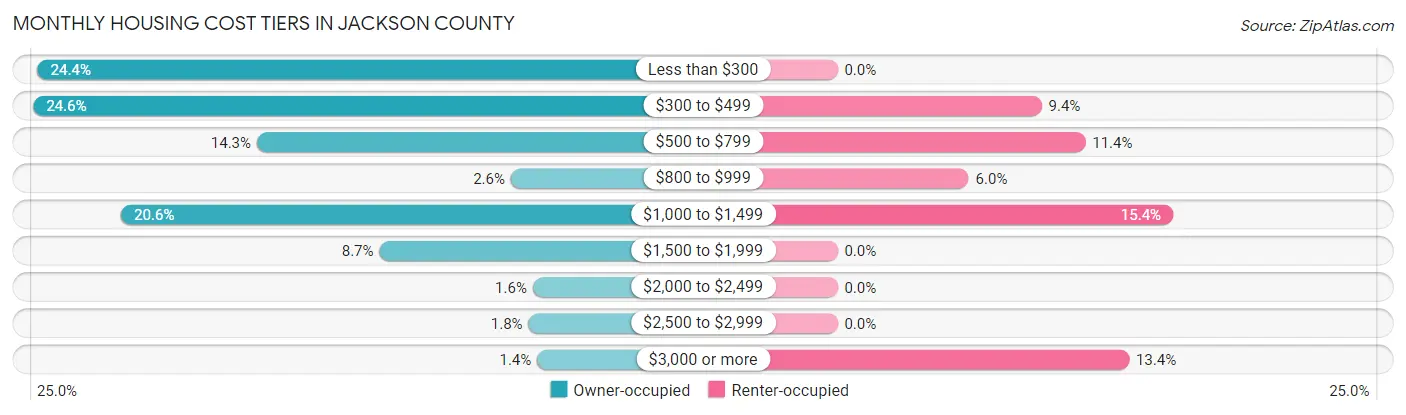
| Monthly Cost | Owner-occupied | Renter-occupied |
| Less than $300 | 121 (24.4%) | 0 (0.0%) |
| $300 to $499 | 122 (24.6%) | 14 (9.4%) |
| $500 to $799 | 71 (14.3%) | 17 (11.4%) |
| $800 to $999 | 13 (2.6%) | 9 (6.0%) |
| $1,000 to $1,499 | 102 (20.6%) | 23 (15.4%) |
| $1,500 to $1,999 | 43 (8.7%) | 0 (0.0%) |
| $2,000 to $2,499 | 8 (1.6%) | 0 (0.0%) |
| $2,500 to $2,999 | 9 (1.8%) | 0 (0.0%) |
| $3,000 or more | 7 (1.4%) | 20 (13.4%) |
| Total | 496 (100.0%) | 149 (100.0%) |
Physical Housing Characteristics in Jackson County
Housing Structures in Jackson County
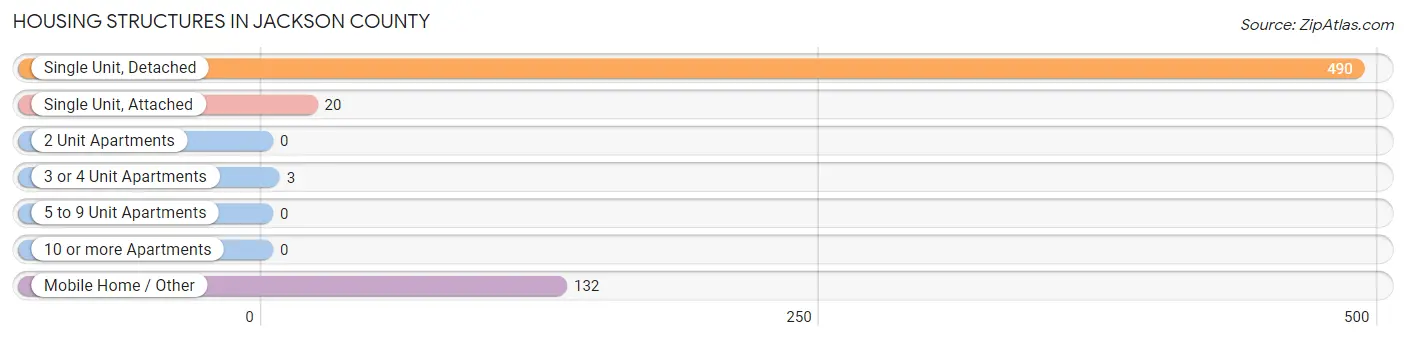
| Structure Type | # Housing Units | % Housing Units |
| Single Unit, Detached | 490 | 76.0% |
| Single Unit, Attached | 20 | 3.1% |
| 2 Unit Apartments | 0 | 0.0% |
| 3 or 4 Unit Apartments | 3 | 0.5% |
| 5 to 9 Unit Apartments | 0 | 0.0% |
| 10 or more Apartments | 0 | 0.0% |
| Mobile Home / Other | 132 | 20.5% |
| Total | 645 | 100.0% |
Housing Structures by Occupancy in Jackson County
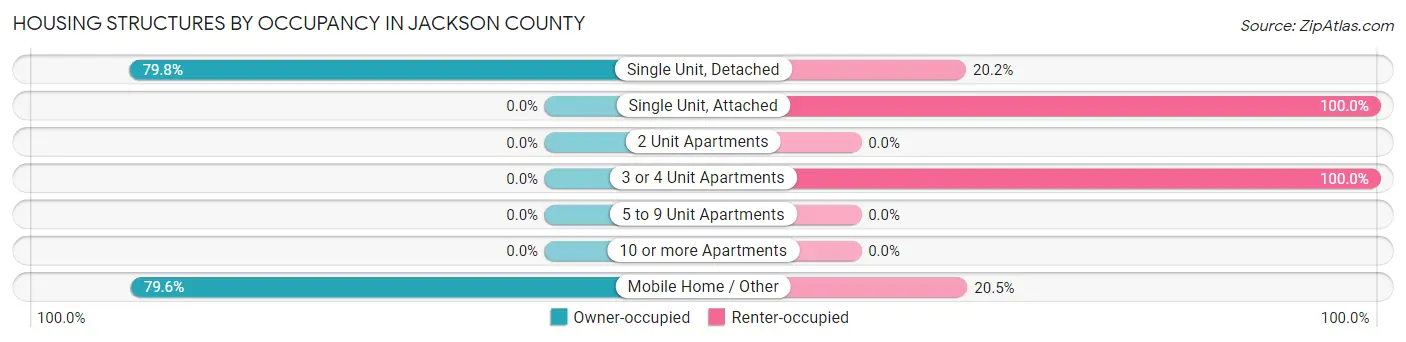
| Structure Type | Owner-occupied | Renter-occupied |
| Single Unit, Detached | 391 (79.8%) | 99 (20.2%) |
| Single Unit, Attached | 0 (0.0%) | 20 (100.0%) |
| 2 Unit Apartments | 0 (0.0%) | 0 (0.0%) |
| 3 or 4 Unit Apartments | 0 (0.0%) | 3 (100.0%) |
| 5 to 9 Unit Apartments | 0 (0.0%) | 0 (0.0%) |
| 10 or more Apartments | 0 (0.0%) | 0 (0.0%) |
| Mobile Home / Other | 105 (79.5%) | 27 (20.4%) |
| Total | 496 (76.9%) | 149 (23.1%) |
Housing Structures by Number of Rooms in Jackson County
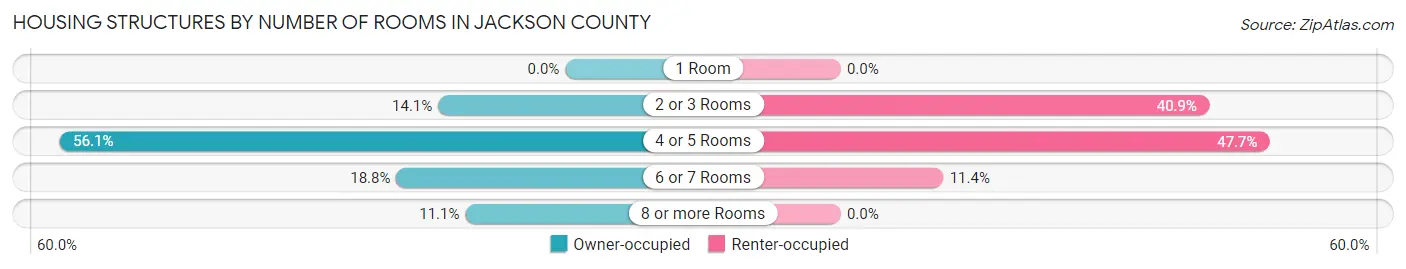
| Number of Rooms | Owner-occupied | Renter-occupied |
| 1 Room | 0 (0.0%) | 0 (0.0%) |
| 2 or 3 Rooms | 70 (14.1%) | 61 (40.9%) |
| 4 or 5 Rooms | 278 (56.0%) | 71 (47.6%) |
| 6 or 7 Rooms | 93 (18.8%) | 17 (11.4%) |
| 8 or more Rooms | 55 (11.1%) | 0 (0.0%) |
| Total | 496 (100.0%) | 149 (100.0%) |
Housing Structure by Heating Type in Jackson County
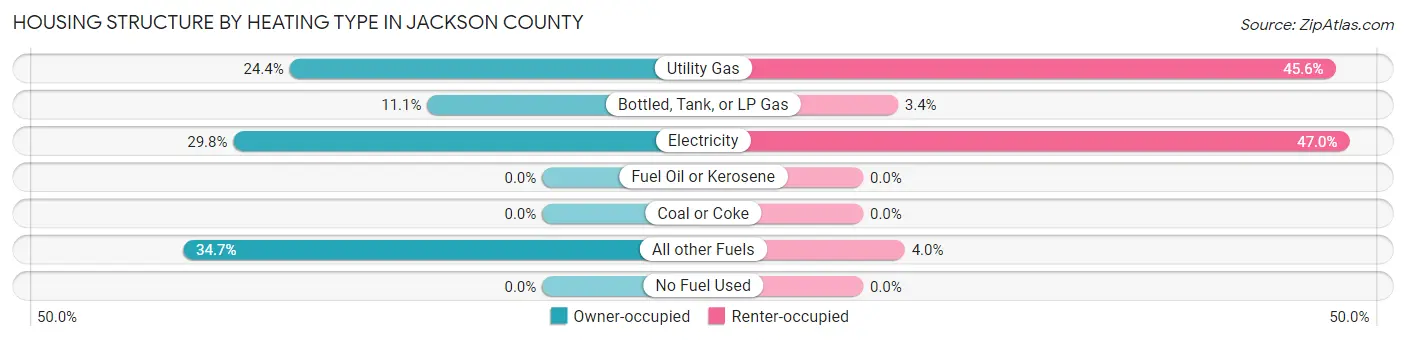
| Heating Type | Owner-occupied | Renter-occupied |
| Utility Gas | 121 (24.4%) | 68 (45.6%) |
| Bottled, Tank, or LP Gas | 55 (11.1%) | 5 (3.4%) |
| Electricity | 148 (29.8%) | 70 (47.0%) |
| Fuel Oil or Kerosene | 0 (0.0%) | 0 (0.0%) |
| Coal or Coke | 0 (0.0%) | 0 (0.0%) |
| All other Fuels | 172 (34.7%) | 6 (4.0%) |
| No Fuel Used | 0 (0.0%) | 0 (0.0%) |
| Total | 496 (100.0%) | 149 (100.0%) |
Household Vehicle Usage in Jackson County
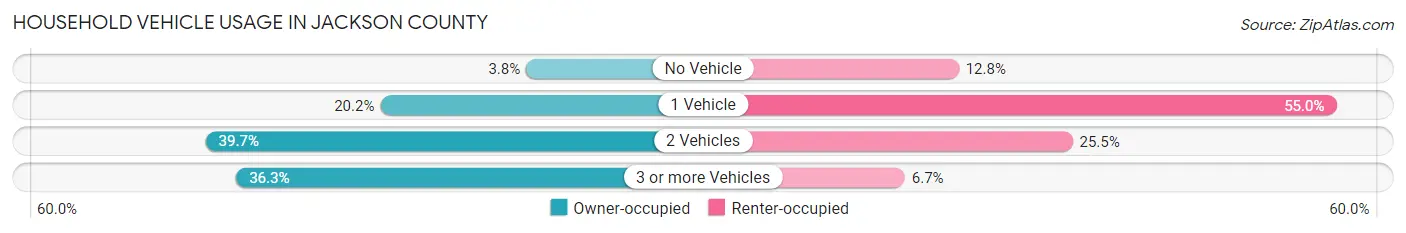
| Vehicles per Household | Owner-occupied | Renter-occupied |
| No Vehicle | 19 (3.8%) | 19 (12.8%) |
| 1 Vehicle | 100 (20.2%) | 82 (55.0%) |
| 2 Vehicles | 197 (39.7%) | 38 (25.5%) |
| 3 or more Vehicles | 180 (36.3%) | 10 (6.7%) |
| Total | 496 (100.0%) | 149 (100.0%) |
Real Estate & Mortgages in Jackson County
Real Estate and Mortgage Overview in Jackson County
| Characteristic | Without Mortgage | With Mortgage |
| Housing Units | 331 | 165 |
| Median Property Value | $206,900 | $262,500 |
| Median Household Income | $30,586 | $25 |
| Monthly Housing Costs | $403 | $7 |
| Real Estate Taxes | $481 | $21 |
Property Value by Mortgage Status in Jackson County
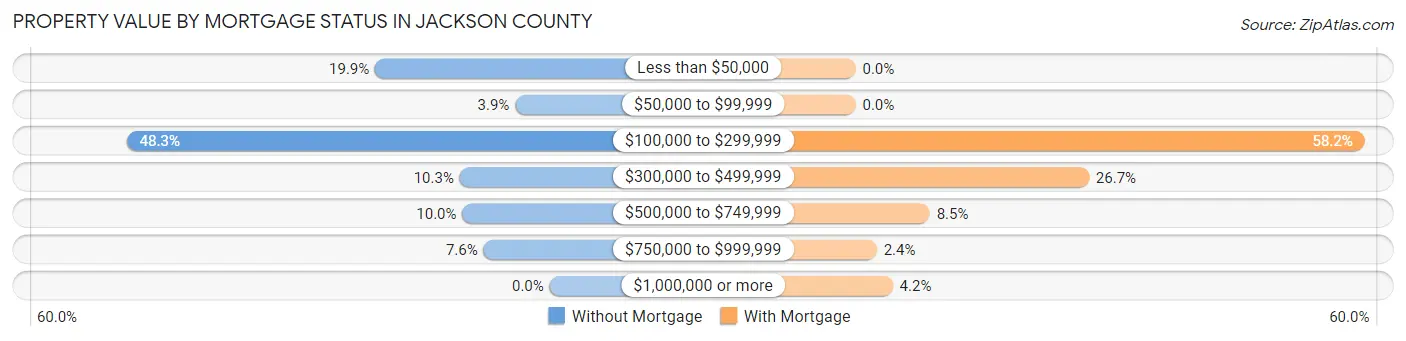
| Property Value | Without Mortgage | With Mortgage |
| Less than $50,000 | 66 (19.9%) | 0 (0.0%) |
| $50,000 to $99,999 | 13 (3.9%) | 0 (0.0%) |
| $100,000 to $299,999 | 160 (48.3%) | 96 (58.2%) |
| $300,000 to $499,999 | 34 (10.3%) | 44 (26.7%) |
| $500,000 to $749,999 | 33 (10.0%) | 14 (8.5%) |
| $750,000 to $999,999 | 25 (7.5%) | 4 (2.4%) |
| $1,000,000 or more | 0 (0.0%) | 7 (4.2%) |
| Total | 331 (100.0%) | 165 (100.0%) |
Household Income by Mortgage Status in Jackson County
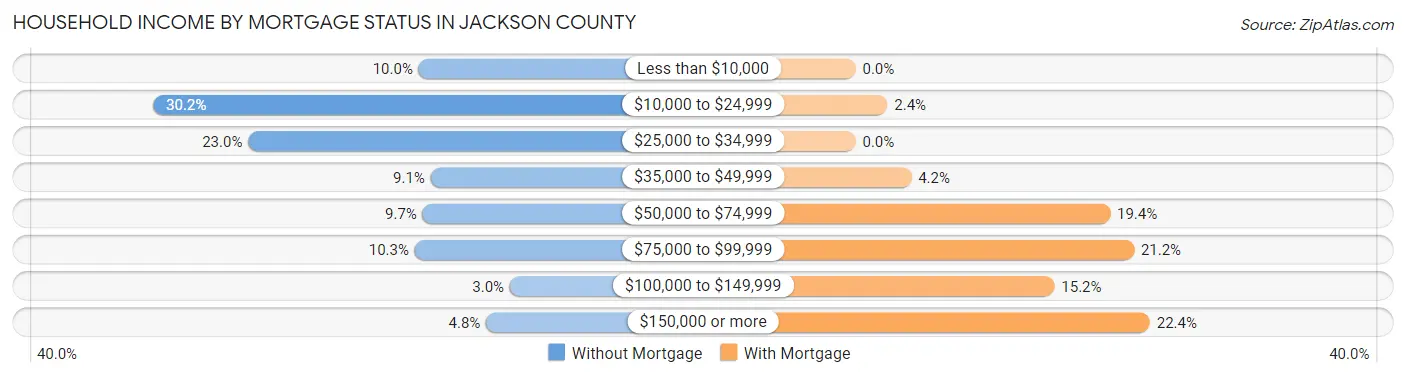
| Household Income | Without Mortgage | With Mortgage |
| Less than $10,000 | 33 (10.0%) | 0 (0.0%) |
| $10,000 to $24,999 | 100 (30.2%) | 4 (2.4%) |
| $25,000 to $34,999 | 76 (23.0%) | 0 (0.0%) |
| $35,000 to $49,999 | 30 (9.1%) | 7 (4.2%) |
| $50,000 to $74,999 | 32 (9.7%) | 32 (19.4%) |
| $75,000 to $99,999 | 34 (10.3%) | 35 (21.2%) |
| $100,000 to $149,999 | 10 (3.0%) | 25 (15.1%) |
| $150,000 or more | 16 (4.8%) | 37 (22.4%) |
| Total | 331 (100.0%) | 165 (100.0%) |
Property Value to Household Income Ratio in Jackson County
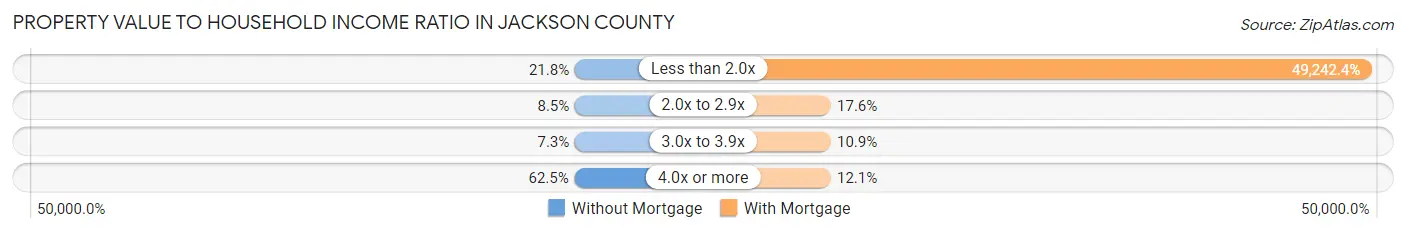
| Value-to-Income Ratio | Without Mortgage | With Mortgage |
| Less than 2.0x | 72 (21.7%) | 81,250 (49,242.4%) |
| 2.0x to 2.9x | 28 (8.5%) | 29 (17.6%) |
| 3.0x to 3.9x | 24 (7.2%) | 18 (10.9%) |
| 4.0x or more | 207 (62.5%) | 20 (12.1%) |
| Total | 331 (100.0%) | 165 (100.0%) |
Real Estate Taxes by Mortgage Status in Jackson County
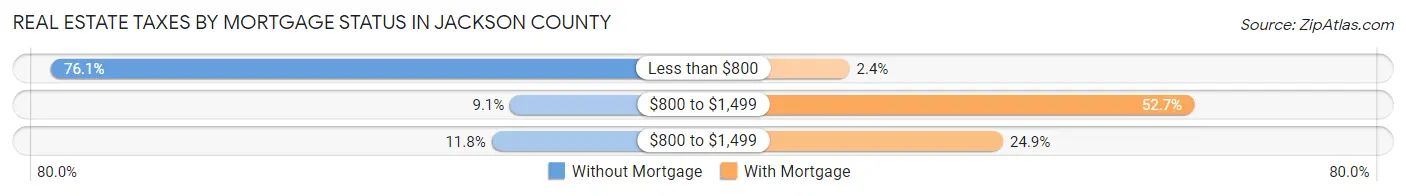
| Property Taxes | Without Mortgage | With Mortgage |
| Less than $800 | 252 (76.1%) | 4 (2.4%) |
| $800 to $1,499 | 30 (9.1%) | 87 (52.7%) |
| $800 to $1,499 | 39 (11.8%) | 41 (24.8%) |
| Total | 331 (100.0%) | 165 (100.0%) |
Health & Disability in Jackson County
Health Insurance Coverage by Age in Jackson County
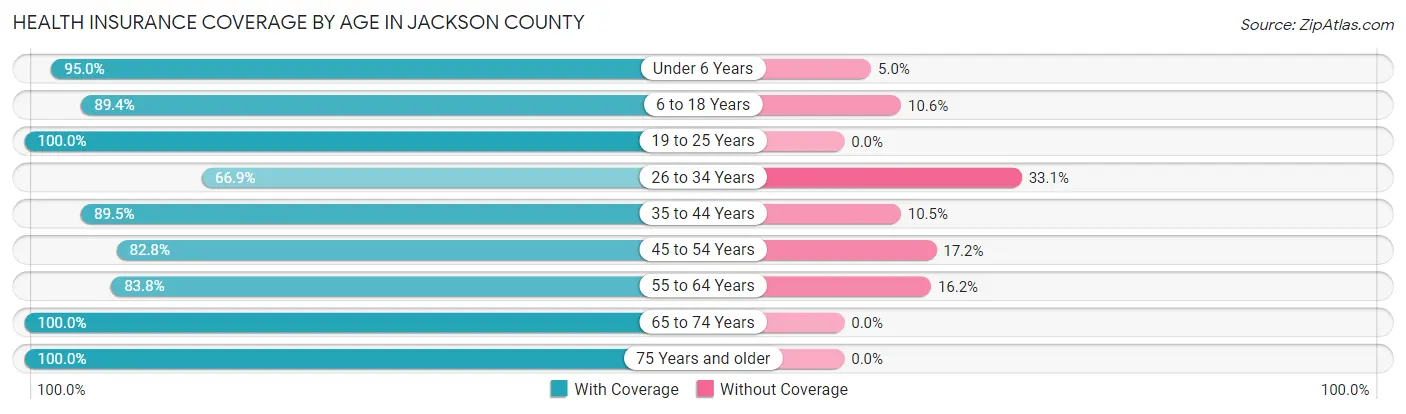
| Age Bracket | With Coverage | Without Coverage |
| Under 6 Years | 57 (95.0%) | 3 (5.0%) |
| 6 to 18 Years | 186 (89.4%) | 22 (10.6%) |
| 19 to 25 Years | 97 (100.0%) | 0 (0.0%) |
| 26 to 34 Years | 91 (66.9%) | 45 (33.1%) |
| 35 to 44 Years | 102 (89.5%) | 12 (10.5%) |
| 45 to 54 Years | 140 (82.8%) | 29 (17.2%) |
| 55 to 64 Years | 166 (83.8%) | 32 (16.2%) |
| 65 to 74 Years | 279 (100.0%) | 0 (0.0%) |
| 75 Years and older | 173 (100.0%) | 0 (0.0%) |
| Total | 1,291 (90.0%) | 143 (10.0%) |
Health Insurance Coverage by Citizenship Status in Jackson County
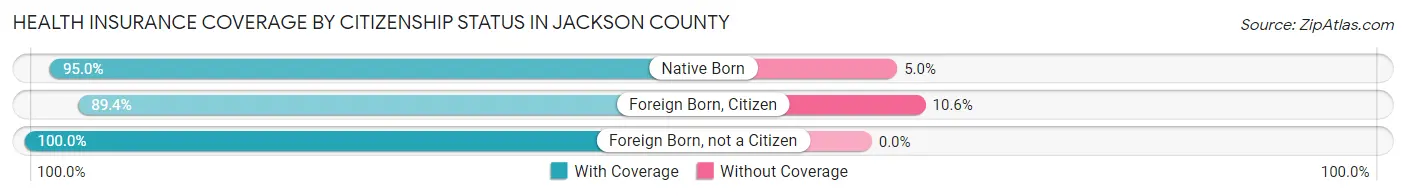
| Citizenship Status | With Coverage | Without Coverage |
| Native Born | 57 (95.0%) | 3 (5.0%) |
| Foreign Born, Citizen | 186 (89.4%) | 22 (10.6%) |
| Foreign Born, not a Citizen | 97 (100.0%) | 0 (0.0%) |
Health Insurance Coverage by Household Income in Jackson County

| Household Income | With Coverage | Without Coverage |
| Under $25,000 | 203 (83.9%) | 39 (16.1%) |
| $25,000 to $49,999 | 381 (85.8%) | 63 (14.2%) |
| $50,000 to $74,999 | 203 (94.9%) | 11 (5.1%) |
| $75,000 to $99,999 | 142 (100.0%) | 0 (0.0%) |
| $100,000 and over | 352 (92.6%) | 28 (7.4%) |
Public vs Private Health Insurance Coverage by Age in Jackson County
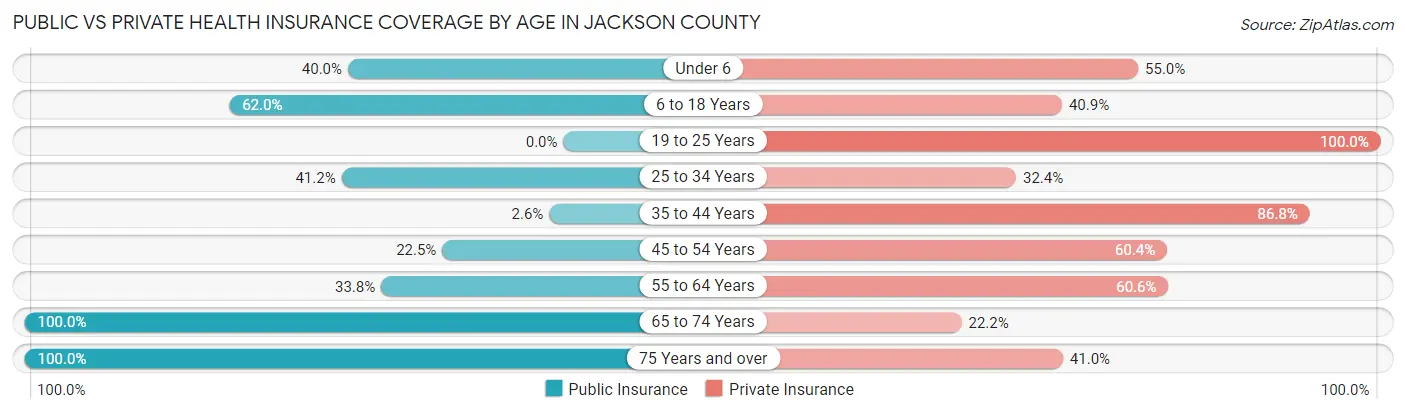
| Age Bracket | Public Insurance | Private Insurance |
| Under 6 | 24 (40.0%) | 33 (55.0%) |
| 6 to 18 Years | 129 (62.0%) | 85 (40.9%) |
| 19 to 25 Years | 0 (0.0%) | 97 (100.0%) |
| 25 to 34 Years | 56 (41.2%) | 44 (32.4%) |
| 35 to 44 Years | 3 (2.6%) | 99 (86.8%) |
| 45 to 54 Years | 38 (22.5%) | 102 (60.4%) |
| 55 to 64 Years | 67 (33.8%) | 120 (60.6%) |
| 65 to 74 Years | 279 (100.0%) | 62 (22.2%) |
| 75 Years and over | 173 (100.0%) | 71 (41.0%) |
| Total | 769 (53.6%) | 713 (49.7%) |
Disability Status by Sex by Age in Jackson County

| Age Bracket | Male | Female |
| Under 5 Years | 0 (0.0%) | 10 (30.3%) |
| 5 to 17 Years | 0 (0.0%) | 10 (8.9%) |
| 18 to 34 Years | 0 (0.0%) | 0 (0.0%) |
| 35 to 64 Years | 11 (3.9%) | 9 (4.5%) |
| 65 to 74 Years | 19 (13.3%) | 30 (22.1%) |
| 75 Years and over | 44 (50.6%) | 49 (57.0%) |
Disability Class by Sex by Age in Jackson County
Disability Class: Hearing Difficulty

| Age Bracket | Male | Female |
| Under 5 Years | 0 (0.0%) | 10 (30.3%) |
| 5 to 17 Years | 0 (0.0%) | 0 (0.0%) |
| 18 to 34 Years | 0 (0.0%) | 0 (0.0%) |
| 35 to 64 Years | 5 (1.8%) | 0 (0.0%) |
| 65 to 74 Years | 19 (13.3%) | 13 (9.6%) |
| 75 Years and over | 29 (33.3%) | 30 (34.9%) |
Disability Class: Vision Difficulty

| Age Bracket | Male | Female |
| Under 5 Years | 0 (0.0%) | 10 (30.3%) |
| 5 to 17 Years | 0 (0.0%) | 0 (0.0%) |
| 18 to 34 Years | 0 (0.0%) | 0 (0.0%) |
| 35 to 64 Years | 0 (0.0%) | 0 (0.0%) |
| 65 to 74 Years | 10 (7.0%) | 0 (0.0%) |
| 75 Years and over | 15 (17.2%) | 22 (25.6%) |
Disability Class: Cognitive Difficulty
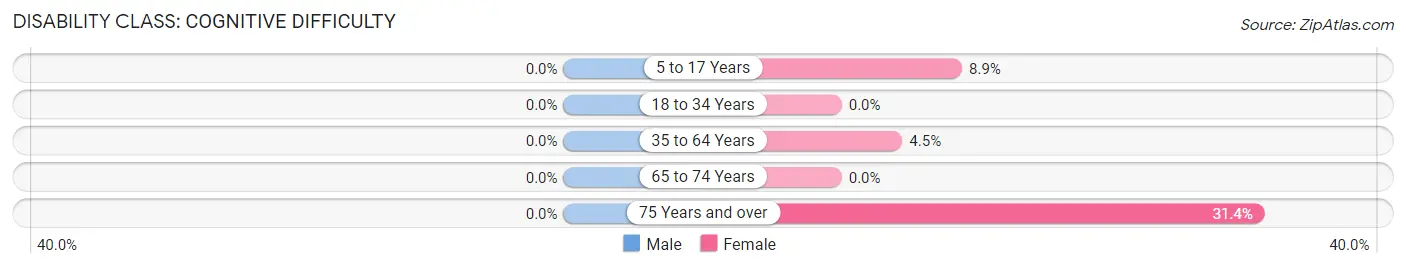
| Age Bracket | Male | Female |
| 5 to 17 Years | 0 (0.0%) | 10 (8.9%) |
| 18 to 34 Years | 0 (0.0%) | 0 (0.0%) |
| 35 to 64 Years | 0 (0.0%) | 9 (4.5%) |
| 65 to 74 Years | 0 (0.0%) | 0 (0.0%) |
| 75 Years and over | 0 (0.0%) | 27 (31.4%) |
Disability Class: Ambulatory Difficulty
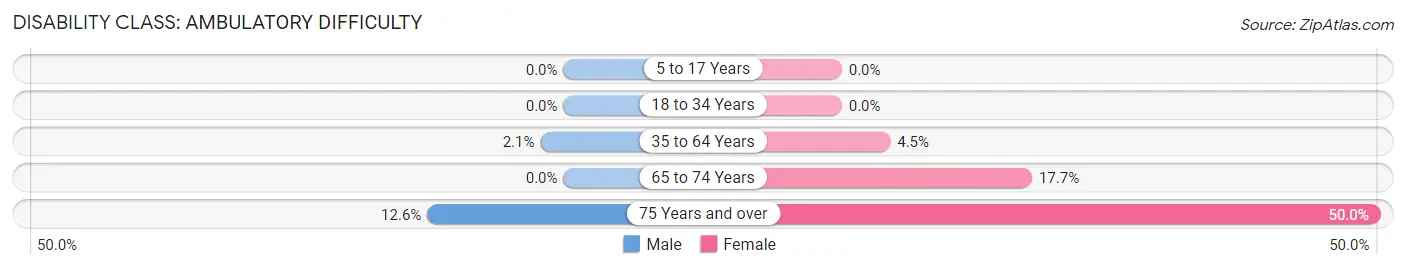
| Age Bracket | Male | Female |
| 5 to 17 Years | 0 (0.0%) | 0 (0.0%) |
| 18 to 34 Years | 0 (0.0%) | 0 (0.0%) |
| 35 to 64 Years | 6 (2.1%) | 9 (4.5%) |
| 65 to 74 Years | 0 (0.0%) | 24 (17.6%) |
| 75 Years and over | 11 (12.6%) | 43 (50.0%) |
Disability Class: Self-Care Difficulty
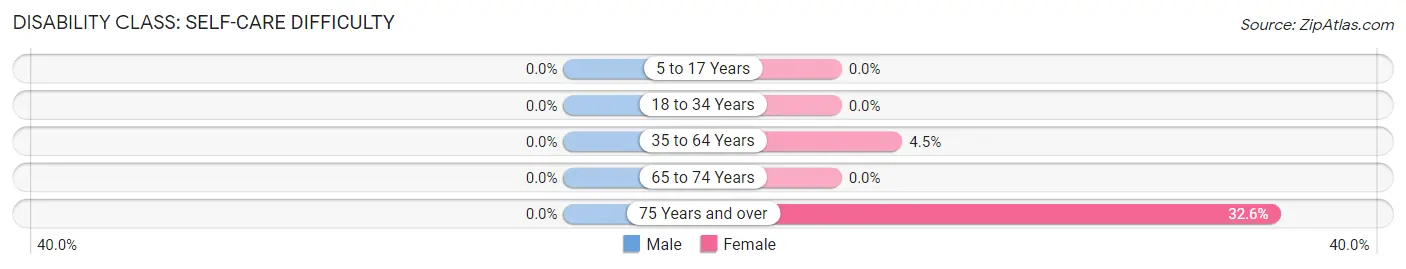
| Age Bracket | Male | Female |
| 5 to 17 Years | 0 (0.0%) | 0 (0.0%) |
| 18 to 34 Years | 0 (0.0%) | 0 (0.0%) |
| 35 to 64 Years | 0 (0.0%) | 9 (4.5%) |
| 65 to 74 Years | 0 (0.0%) | 0 (0.0%) |
| 75 Years and over | 0 (0.0%) | 28 (32.6%) |
Technology Access in Jackson County
Computing Device Access in Jackson County
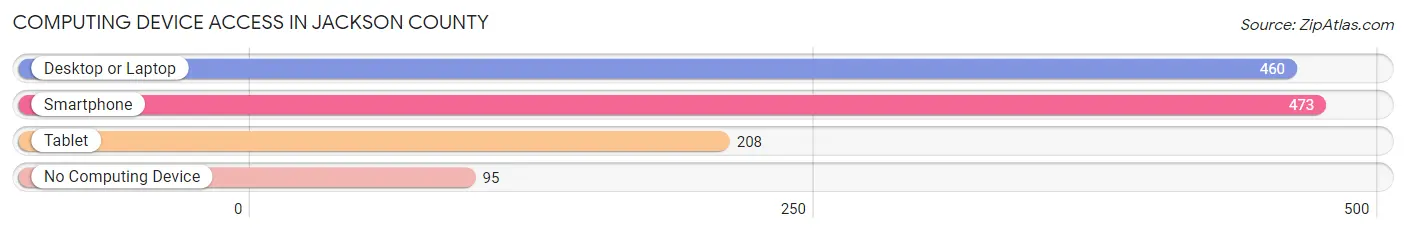
| Device Type | # Households | % Households |
| Desktop or Laptop | 460 | 71.3% |
| Smartphone | 473 | 73.3% |
| Tablet | 208 | 32.3% |
| No Computing Device | 95 | 14.7% |
| Total | 645 | 100.0% |
Internet Access in Jackson County
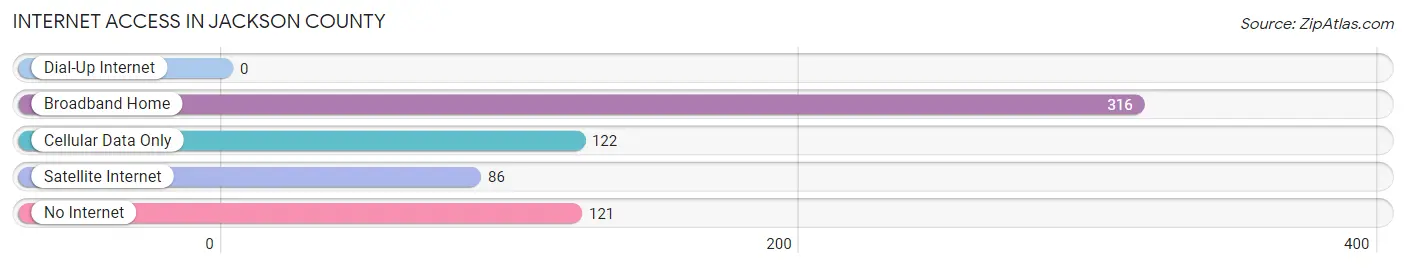
| Internet Type | # Households | % Households |
| Dial-Up Internet | 0 | 0.0% |
| Broadband Home | 316 | 49.0% |
| Cellular Data Only | 122 | 18.9% |
| Satellite Internet | 86 | 13.3% |
| No Internet | 121 | 18.8% |
| Total | 645 | 100.0% |
Jackson County Summary
Jackson County is located in the northeastern corner of Colorado, and is bordered by Wyoming to the north, Nebraska to the east, and the South Platte River to the south. The county seat is Walden, and the county is named after President Andrew Jackson. The county has a total area of 1,621 square miles, of which 1,619 square miles is land and 2.3 square miles is water.
Geography
Jackson County is located in the High Plains region of Colorado, and is characterized by rolling hills, grasslands, and sagebrush. The county is home to several mountain ranges, including the Medicine Bow Mountains, the Park Range, and the Never Summer Mountains. The county is also home to several rivers, including the North Platte River, the Laramie River, and the South Platte River.
The county has a semi-arid climate, with hot summers and cold winters. The average annual precipitation is 16.5 inches, and the average annual snowfall is 33.5 inches.
Economy
The economy of Jackson County is largely based on agriculture and ranching. The county is home to several large cattle ranches, and the county is also home to several large farms that produce wheat, corn, and hay. The county is also home to several oil and gas wells, and the county is home to several coal mines.
The county is also home to several small businesses, including restaurants, retail stores, and service providers. The county is also home to several tourist attractions, including the Never Summer Mountains, the Medicine Bow Mountains, and the Park Range.
Demographics
As of the 2010 census, the population of Jackson County was 5,631, and the population density was 3.5 people per square mile. The median age was 44.2 years, and the median household income was $41,944. The racial makeup of the county was 95.3% White, 0.3% African American, 0.7% Native American, 0.2% Asian, 0.1% Pacific Islander, 1.7% from other races, and 1.9% from two or more races.
The largest ancestry groups in Jackson County were German (25.3%), English (17.2%), Irish (14.2%), and American (13.2%). The county is also home to a large Hispanic population, with 24.3% of the population identifying as Hispanic or Latino.
Conclusion
Jackson County is located in the northeastern corner of Colorado, and is bordered by Wyoming to the north, Nebraska to the east, and the South Platte River to the south. The county has a semi-arid climate, with hot summers and cold winters. The economy of Jackson County is largely based on agriculture and ranching, and the county is also home to several small businesses, tourist attractions, and oil and gas wells. As of the 2010 census, the population of Jackson County was 5,631, and the racial makeup of the county was 95.3% White, 0.3% African American, 0.7% Native American, 0.2% Asian, 0.1% Pacific Islander, 1.7% from other races, and 1.9% from two or more races. The largest ancestry groups in Jackson County were German (25.3%), English (17.2%), Irish (14.2%), and American (13.2%).
Common Questions
What is Per Capita Income in Jackson County?
Per Capita income in Jackson County is $29,657.
What is the Median Family Income in Jackson County?
Median Family Income in Jackson County is $53,750.
What is the Median Household income in Jackson County?
Median Household Income in Jackson County is $38,686.
What is Income or Wage Gap in Jackson County?
Income or Wage Gap in Jackson County is 52.7%.
Women in Jackson County earn 47.3 cents for every dollar earned by a man.
What is Inequality or Gini Index in Jackson County?
Inequality or Gini Index in Jackson County is 0.49.
What is the Total Population of Jackson County?
Total Population of Jackson County is 1,440.
What is the Total Male Population of Jackson County?
Total Male Population of Jackson County is 748.
What is the Total Female Population of Jackson County?
Total Female Population of Jackson County is 692.
What is the Ratio of Males per 100 Females in Jackson County?
There are 108.09 Males per 100 Females in Jackson County.
What is the Ratio of Females per 100 Males in Jackson County?
There are 92.51 Females per 100 Males in Jackson County.
What is the Median Population Age in Jackson County?
Median Population Age in Jackson County is 51.5 Years.
What is the Average Family Size in Jackson County
Average Family Size in Jackson County is 2.8 People.
What is the Average Household Size in Jackson County
Average Household Size in Jackson County is 2.2 People.
How Large is the Labor Force in Jackson County?
There are 719 People in the Labor Forcein in Jackson County.
What is the Percentage of People in the Labor Force in Jackson County?
57.0% of People are in the Labor Force in Jackson County.
What is the Unemployment Rate in Jackson County?
Unemployment Rate in Jackson County is 8.2%.