Huerfano County, CO Map & Demographics
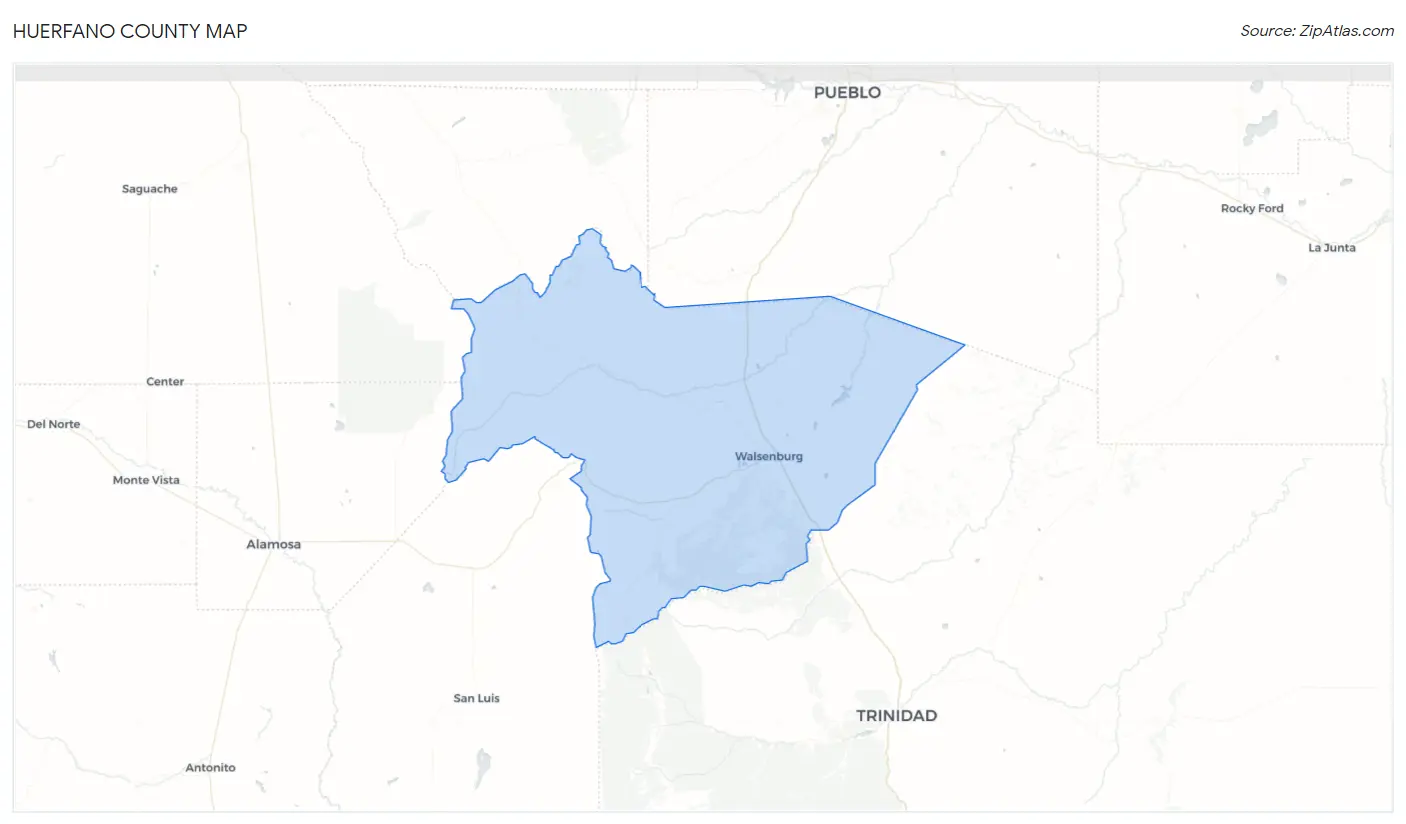
Huerfano County Map
Huerfano County Overview
$29,508
PER CAPITA INCOME
$65,211
AVG FAMILY INCOME
$49,631
AVG HOUSEHOLD INCOME
24.5%
WAGE / INCOME GAP [ % ]
75.5¢/ $1
WAGE / INCOME GAP [ $ ]
$9,010
FAMILY INCOME DEFICIT
0.45
INEQUALITY / GINI INDEX
6,896
TOTAL POPULATION
3,607
MALE POPULATION
3,289
FEMALE POPULATION
109.67
MALES / 100 FEMALES
91.18
FEMALES / 100 MALES
55.4
MEDIAN AGE
3.0
AVG FAMILY SIZE
2.3
AVG HOUSEHOLD SIZE
2,672
LABOR FORCE [ PEOPLE ]
44.6%
PERCENT IN LABOR FORCE
6.4%
UNEMPLOYMENT RATE
Huerfano County Area Codes
Income in Huerfano County
Income Overview in Huerfano County
Per Capita Income in Huerfano County is $29,508, while median incomes of families and households are $65,211 and $49,631 respectively.
| Characteristic | Number | Measure |
| Per Capita Income | 6,896 | $29,508 |
| Median Family Income | 1,763 | $65,211 |
| Mean Family Income | 1,763 | $75,572 |
| Median Household Income | 2,877 | $49,631 |
| Mean Household Income | 2,877 | $64,924 |
| Income Deficit | 1,763 | $9,010 |
| Wage / Income Gap (%) | 6,896 | 24.45% |
| Wage / Income Gap ($) | 6,896 | 75.55¢ per $1 |
| Gini / Inequality Index | 6,896 | 0.45 |
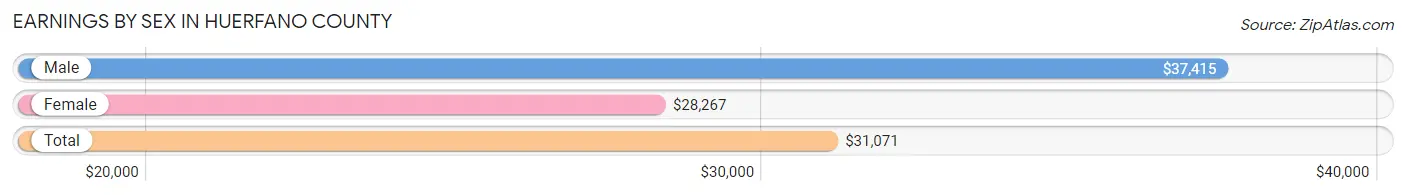
Earnings by Sex in Huerfano County
Average Earnings in Huerfano County are $31,071, $37,415 for men and $28,267 for women, a difference of 24.4%.
| Sex | Number | Average Earnings |
| Male | 1,394 (49.4%) | $37,415 |
| Female | 1,426 (50.6%) | $28,267 |
| Total | 2,820 (100.0%) | $31,071 |
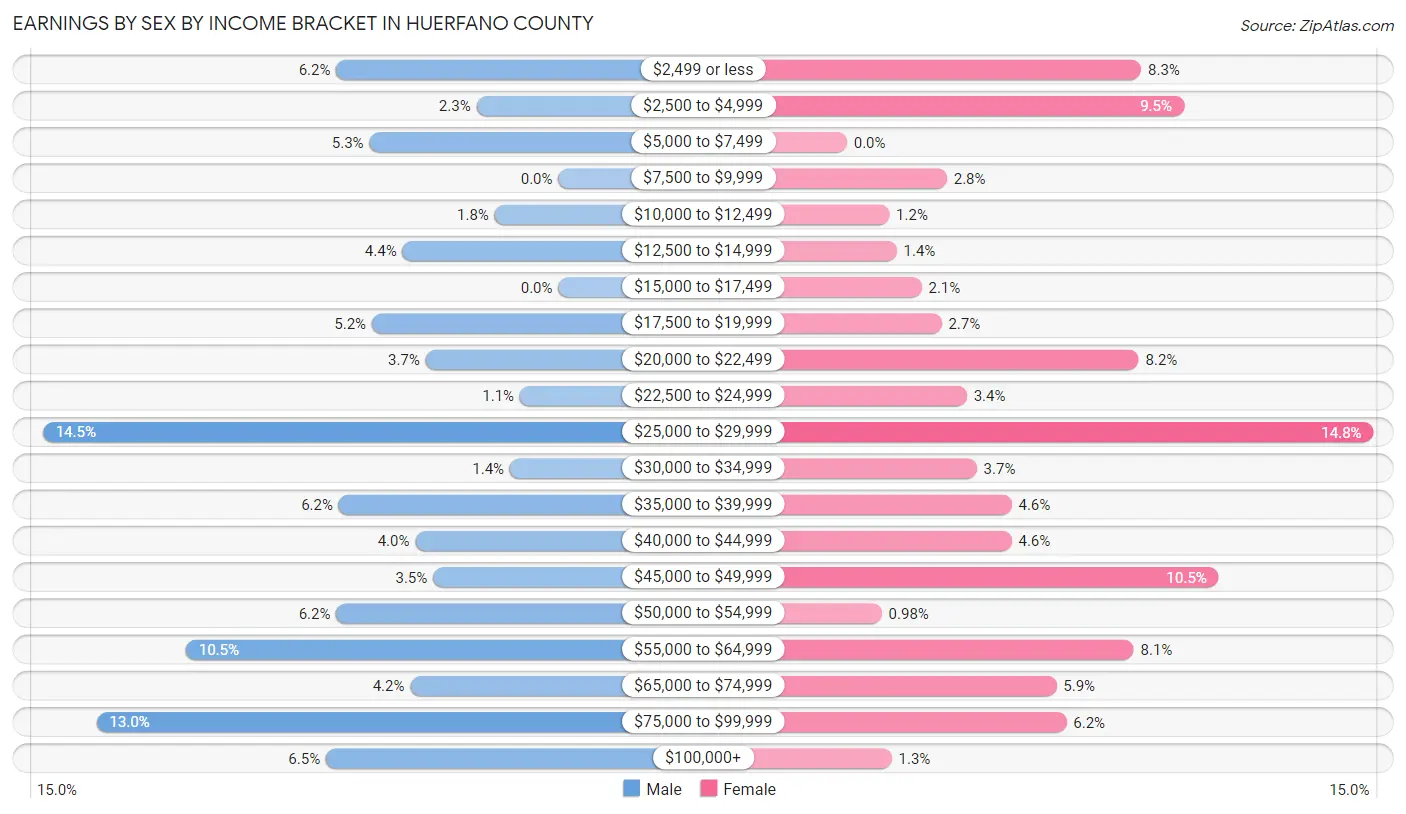
Earnings by Sex by Income Bracket in Huerfano County
The most common earnings brackets in Huerfano County are $25,000 to $29,999 for men (202 | 14.5%) and $25,000 to $29,999 for women (211 | 14.8%).
| Income | Male | Female |
| $2,499 or less | 87 (6.2%) | 118 (8.3%) |
| $2,500 to $4,999 | 32 (2.3%) | 135 (9.5%) |
| $5,000 to $7,499 | 74 (5.3%) | 0 (0.0%) |
| $7,500 to $9,999 | 0 (0.0%) | 40 (2.8%) |
| $10,000 to $12,499 | 25 (1.8%) | 17 (1.2%) |
| $12,500 to $14,999 | 61 (4.4%) | 20 (1.4%) |
| $15,000 to $17,499 | 0 (0.0%) | 30 (2.1%) |
| $17,500 to $19,999 | 73 (5.2%) | 38 (2.7%) |
| $20,000 to $22,499 | 52 (3.7%) | 117 (8.2%) |
| $22,500 to $24,999 | 15 (1.1%) | 48 (3.4%) |
| $25,000 to $29,999 | 202 (14.5%) | 211 (14.8%) |
| $30,000 to $34,999 | 19 (1.4%) | 52 (3.6%) |
| $35,000 to $39,999 | 86 (6.2%) | 66 (4.6%) |
| $40,000 to $44,999 | 56 (4.0%) | 66 (4.6%) |
| $45,000 to $49,999 | 49 (3.5%) | 149 (10.4%) |
| $50,000 to $54,999 | 87 (6.2%) | 14 (1.0%) |
| $55,000 to $64,999 | 146 (10.5%) | 115 (8.1%) |
| $65,000 to $74,999 | 58 (4.2%) | 84 (5.9%) |
| $75,000 to $99,999 | 181 (13.0%) | 88 (6.2%) |
| $100,000+ | 91 (6.5%) | 18 (1.3%) |
| Total | 1,394 (100.0%) | 1,426 (100.0%) |
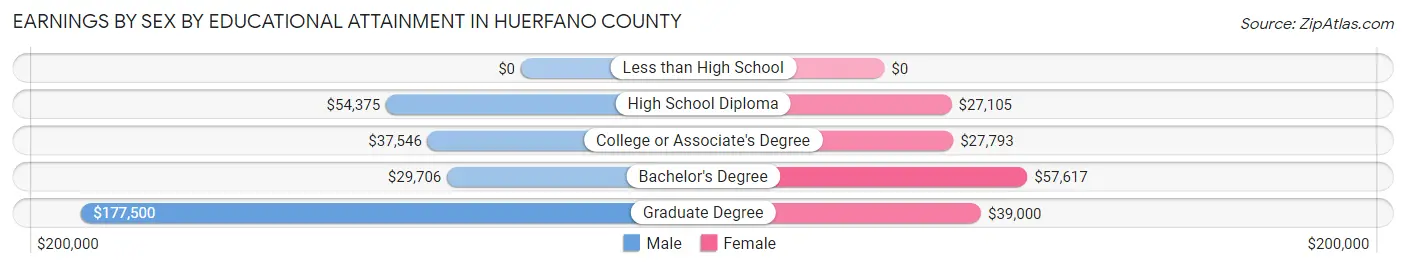
Earnings by Sex by Educational Attainment in Huerfano County
Average earnings in Huerfano County are $41,719 for men and $29,389 for women, a difference of 29.5%. Men with an educational attainment of graduate degree enjoy the highest average annual earnings of $177,500, while those with bachelor's degree education earn the least with $29,706. Women with an educational attainment of bachelor's degree earn the most with the average annual earnings of $57,617, while those with high school diploma education have the smallest earnings of $27,105.
| Educational Attainment | Male Income | Female Income |
| Less than High School | - | - |
| High School Diploma | $54,375 | $27,105 |
| College or Associate's Degree | $37,546 | $27,793 |
| Bachelor's Degree | $29,706 | $57,617 |
| Graduate Degree | $177,500 | $39,000 |
| Total | $41,719 | $29,389 |
Family Income in Huerfano County
Family Income Brackets in Huerfano County
According to the Huerfano County family income data, there are 363 families falling into the $100,000 to $149,999 income range, which is the most common income bracket and makes up 20.6% of all families. Conversely, the $150,000 to $199,999 income bracket is the least frequent group with only 51 families (2.9%) belonging to this category.
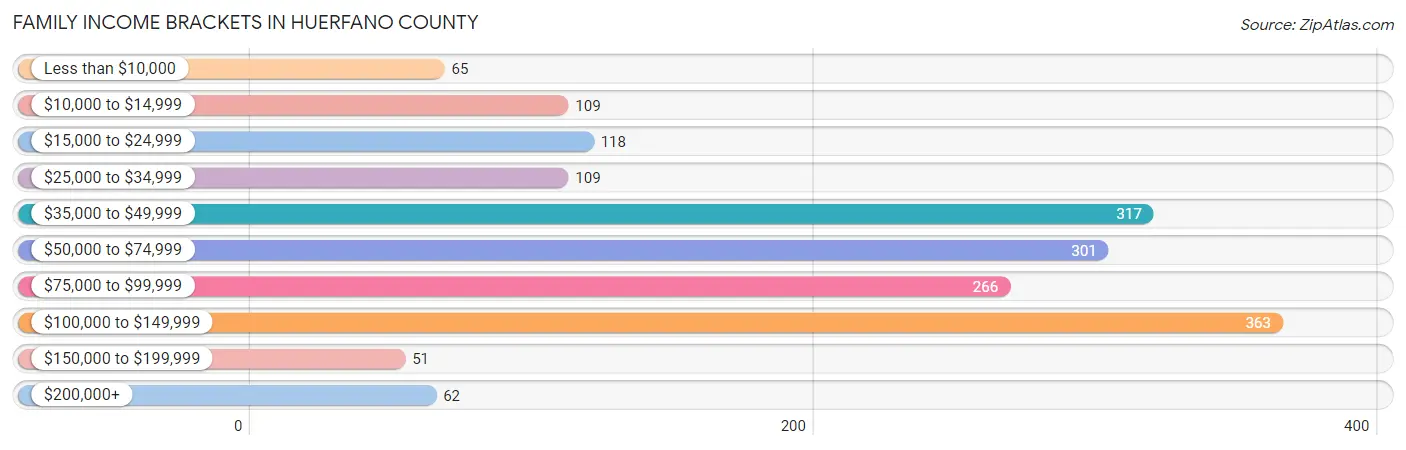
| Income Bracket | # Families | % Families |
| Less than $10,000 | 65 | 3.7% |
| $10,000 to $14,999 | 109 | 6.2% |
| $15,000 to $24,999 | 118 | 6.7% |
| $25,000 to $34,999 | 109 | 6.2% |
| $35,000 to $49,999 | 317 | 18.0% |
| $50,000 to $74,999 | 301 | 17.1% |
| $75,000 to $99,999 | 266 | 15.1% |
| $100,000 to $149,999 | 363 | 20.6% |
| $150,000 to $199,999 | 51 | 2.9% |
| $200,000+ | 62 | 3.5% |
Family Income by Famaliy Size in Huerfano County
4-person families (175 | 9.9%) account for the highest median family income in Huerfano County with $71,875 per family, while 2-person families (1,125 | 63.8%) have the highest median income of $33,544 per family member.
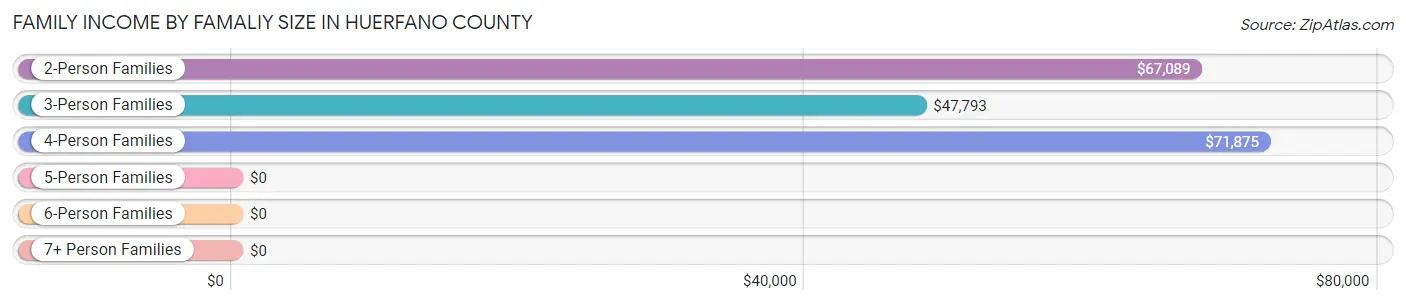
| Income Bracket | # Families | Median Income |
| 2-Person Families | 1,125 (63.8%) | $67,089 |
| 3-Person Families | 349 (19.8%) | $47,793 |
| 4-Person Families | 175 (9.9%) | $71,875 |
| 5-Person Families | 68 (3.9%) | $0 |
| 6-Person Families | 0 (0.0%) | $0 |
| 7+ Person Families | 46 (2.6%) | $0 |
| Total | 1,763 (100.0%) | $65,211 |
Family Income by Number of Earners in Huerfano County
The median family income in Huerfano County is $65,211, with families comprising 3+ earners (120) having the highest median family income of $137,880, while families with no earners (479) have the lowest median family income of $35,668, accounting for 6.8% and 27.2% of families, respectively.

| Number of Earners | # Families | Median Income |
| No Earners | 479 (27.2%) | $35,668 |
| 1 Earner | 665 (37.7%) | $57,031 |
| 2 Earners | 499 (28.3%) | $88,558 |
| 3+ Earners | 120 (6.8%) | $137,880 |
| Total | 1,763 (100.0%) | $65,211 |
Household Income in Huerfano County
Household Income Brackets in Huerfano County
With 463 households falling in the category, the $100,000 to $149,999 income range is the most frequent in Huerfano County, accounting for 16.1% of all households. In contrast, only 66 households (2.3%) fall into the $150,000 to $199,999 income bracket, making it the least populous group.
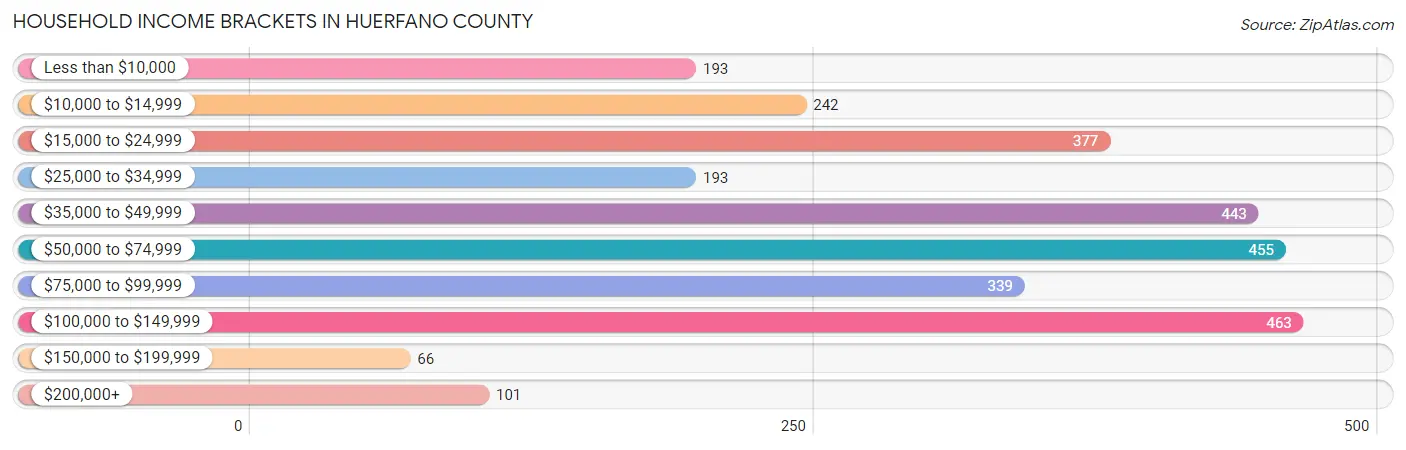
| Income Bracket | # Households | % Households |
| Less than $10,000 | 193 | 6.7% |
| $10,000 to $14,999 | 242 | 8.4% |
| $15,000 to $24,999 | 377 | 13.1% |
| $25,000 to $34,999 | 193 | 6.7% |
| $35,000 to $49,999 | 443 | 15.4% |
| $50,000 to $74,999 | 455 | 15.8% |
| $75,000 to $99,999 | 339 | 11.8% |
| $100,000 to $149,999 | 463 | 16.1% |
| $150,000 to $199,999 | 66 | 2.3% |
| $200,000+ | 101 | 3.5% |
Household Income by Householder Age in Huerfano County
The median household income in Huerfano County is $49,631, with the highest median household income of $71,731 found in the 45 to 64 years age bracket for the primary householder. A total of 962 households (33.4%) fall into this category. Meanwhile, the 15 to 24 years age bracket for the primary householder has the lowest median household income of $0, with 25 households (0.9%) in this group.
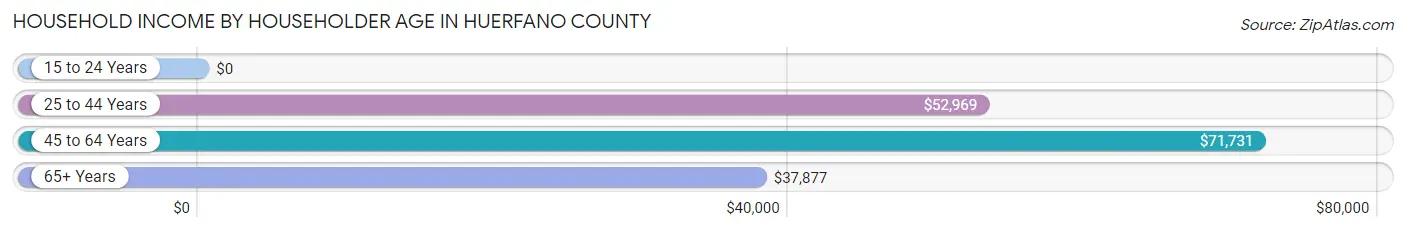
| Income Bracket | # Households | Median Income |
| 15 to 24 Years | 25 (0.9%) | $0 |
| 25 to 44 Years | 412 (14.3%) | $52,969 |
| 45 to 64 Years | 962 (33.4%) | $71,731 |
| 65+ Years | 1,478 (51.4%) | $37,877 |
| Total | 2,877 (100.0%) | $49,631 |
Poverty in Huerfano County
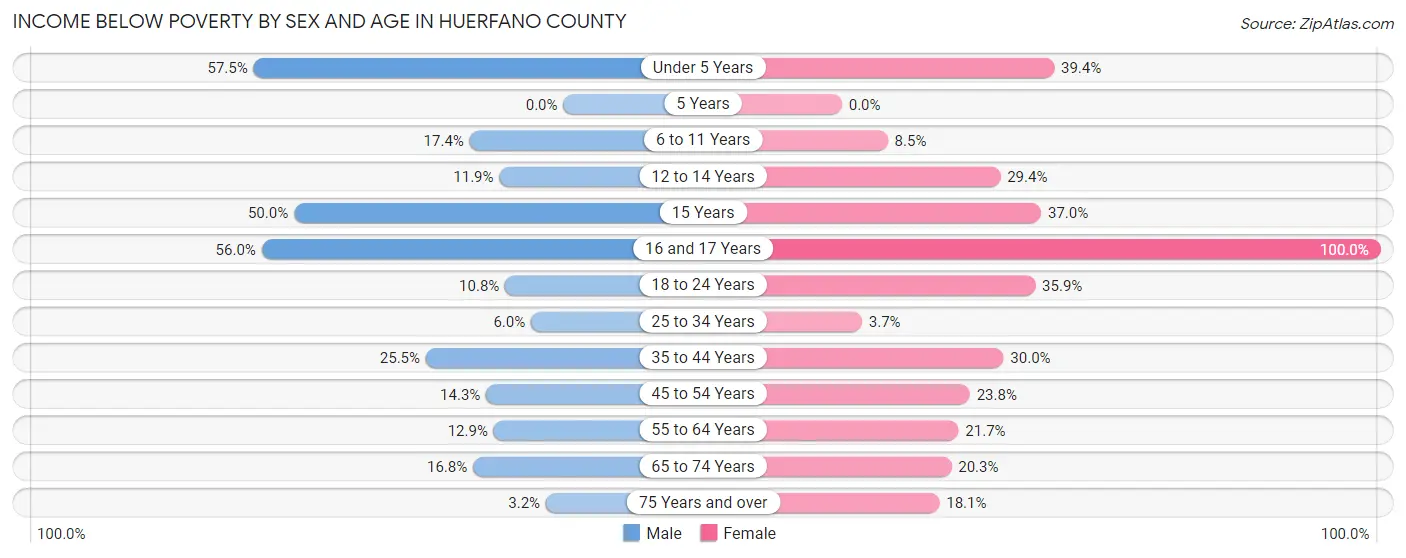
Income Below Poverty by Sex and Age in Huerfano County
With 16.8% poverty level for males and 24.7% for females among the residents of Huerfano County, under 5 year old males and 16 and 17 year old females are the most vulnerable to poverty, with 92 males (57.5%) and 85 females (100.0%) in their respective age groups living below the poverty level.
| Age Bracket | Male | Female |
| Under 5 Years | 92 (57.5%) | 65 (39.4%) |
| 5 Years | 0 (0.0%) | 0 (0.0%) |
| 6 to 11 Years | 32 (17.4%) | 8 (8.5%) |
| 12 to 14 Years | 12 (11.9%) | 10 (29.4%) |
| 15 Years | 40 (50.0%) | 27 (37.0%) |
| 16 and 17 Years | 56 (56.0%) | 85 (100.0%) |
| 18 to 24 Years | 38 (10.8%) | 103 (35.9%) |
| 25 to 34 Years | 13 (6.0%) | 9 (3.7%) |
| 35 to 44 Years | 61 (25.5%) | 69 (30.0%) |
| 45 to 54 Years | 50 (14.3%) | 81 (23.7%) |
| 55 to 64 Years | 70 (12.9%) | 144 (21.6%) |
| 65 to 74 Years | 105 (16.8%) | 125 (20.3%) |
| 75 Years and over | 17 (3.2%) | 78 (18.1%) |
| Total | 586 (16.8%) | 804 (24.7%) |
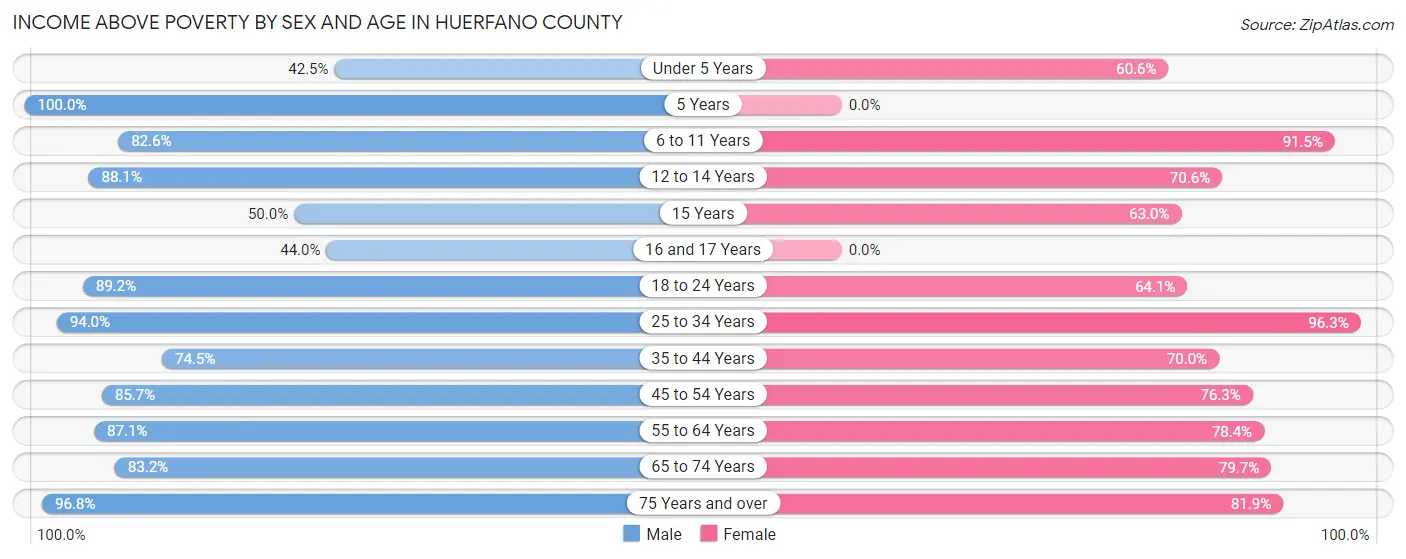
Income Above Poverty by Sex and Age in Huerfano County
According to the poverty statistics in Huerfano County, males aged 5 years and females aged 25 to 34 years are the age groups that are most secure financially, with 100.0% of males and 96.3% of females in these age groups living above the poverty line.
| Age Bracket | Male | Female |
| Under 5 Years | 68 (42.5%) | 100 (60.6%) |
| 5 Years | 14 (100.0%) | 0 (0.0%) |
| 6 to 11 Years | 152 (82.6%) | 86 (91.5%) |
| 12 to 14 Years | 89 (88.1%) | 24 (70.6%) |
| 15 Years | 40 (50.0%) | 46 (63.0%) |
| 16 and 17 Years | 44 (44.0%) | 0 (0.0%) |
| 18 to 24 Years | 314 (89.2%) | 184 (64.1%) |
| 25 to 34 Years | 204 (94.0%) | 232 (96.3%) |
| 35 to 44 Years | 178 (74.5%) | 161 (70.0%) |
| 45 to 54 Years | 299 (85.7%) | 260 (76.2%) |
| 55 to 64 Years | 472 (87.1%) | 521 (78.3%) |
| 65 to 74 Years | 521 (83.2%) | 490 (79.7%) |
| 75 Years and over | 507 (96.8%) | 353 (81.9%) |
| Total | 2,902 (83.2%) | 2,457 (75.3%) |
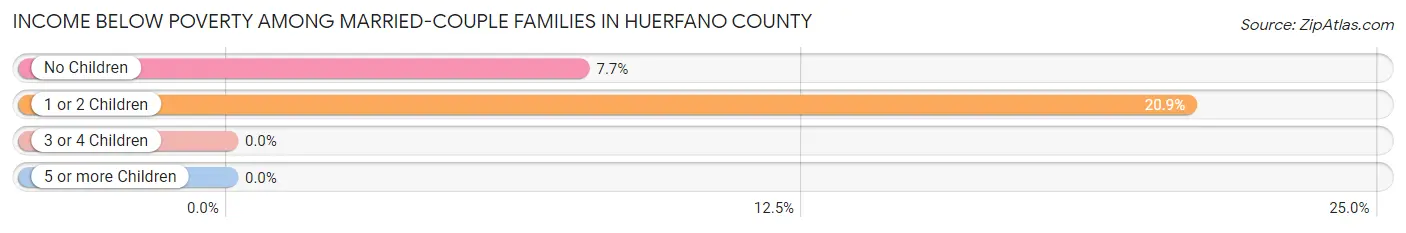
Income Below Poverty Among Married-Couple Families in Huerfano County
The poverty statistics for married-couple families in Huerfano County show that 9.7% or 128 of the total 1,322 families live below the poverty line. Families with 1 or 2 children have the highest poverty rate of 20.9%, comprising of 48 families. On the other hand, families with 3 or 4 children have the lowest poverty rate of 0.0%, which includes 0 families.
| Children | Above Poverty | Below Poverty |
| No Children | 966 (92.3%) | 80 (7.6%) |
| 1 or 2 Children | 182 (79.1%) | 48 (20.9%) |
| 3 or 4 Children | 46 (100.0%) | 0 (0.0%) |
| 5 or more Children | 0 (0.0%) | 0 (0.0%) |
| Total | 1,194 (90.3%) | 128 (9.7%) |
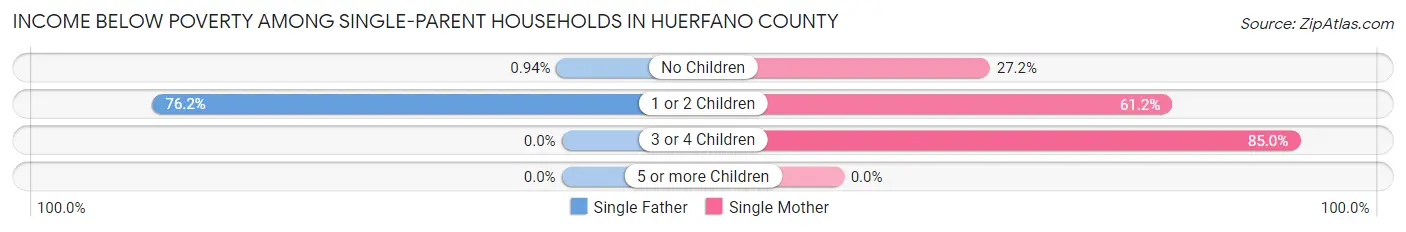
Income Below Poverty Among Single-Parent Households in Huerfano County
According to the poverty data in Huerfano County, 13.4% or 17 single-father households and 47.4% or 149 single-mother households are living below the poverty line. Among single-father households, those with 1 or 2 children have the highest poverty rate, with 16 households (76.2%) experiencing poverty. Likewise, among single-mother households, those with 3 or 4 children have the highest poverty rate, with 51 households (85.0%) falling below the poverty line.
| Children | Single Father | Single Mother |
| No Children | 1 (0.9%) | 46 (27.2%) |
| 1 or 2 Children | 16 (76.2%) | 52 (61.2%) |
| 3 or 4 Children | 0 (0.0%) | 51 (85.0%) |
| 5 or more Children | 0 (0.0%) | 0 (0.0%) |
| Total | 17 (13.4%) | 149 (47.4%) |
Income Below Poverty Among Married-Couple vs Single-Parent Households in Huerfano County
The poverty data for Huerfano County shows that 128 of the married-couple family households (9.7%) and 166 of the single-parent households (37.6%) are living below the poverty level. Within the married-couple family households, those with 1 or 2 children have the highest poverty rate, with 48 households (20.9%) falling below the poverty line. Among the single-parent households, those with 3 or 4 children have the highest poverty rate, with 51 household (85.0%) living below poverty.
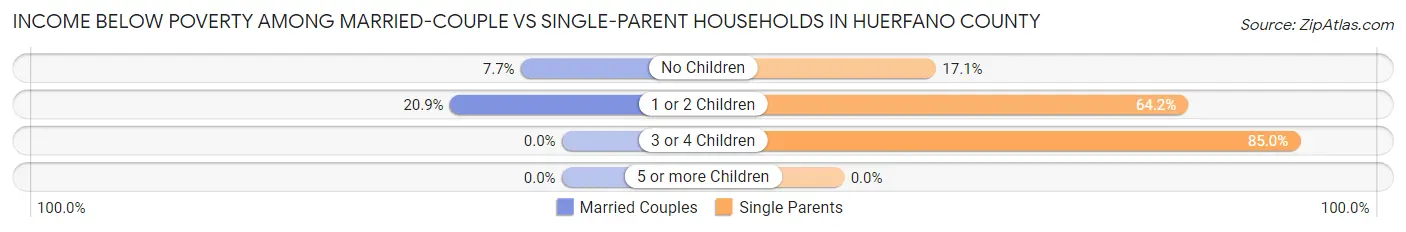
| Children | Married-Couple Families | Single-Parent Households |
| No Children | 80 (7.6%) | 47 (17.1%) |
| 1 or 2 Children | 48 (20.9%) | 68 (64.1%) |
| 3 or 4 Children | 0 (0.0%) | 51 (85.0%) |
| 5 or more Children | 0 (0.0%) | 0 (0.0%) |
| Total | 128 (9.7%) | 166 (37.6%) |
Race in Huerfano County
The most populous races in Huerfano County are White / Caucasian (6,026 | 87.4%), Hispanic or Latino (2,282 | 33.1%), and Two or more Races (349 | 5.1%).

| Race | # Population | % Population |
| Asian | 5 | 0.1% |
| Black / African American | 3 | 0.0% |
| Hawaiian / Pacific | 0 | 0.0% |
| Hispanic or Latino | 2,282 | 33.1% |
| Native / Alaskan | 229 | 3.3% |
| White / Caucasian | 6,026 | 87.4% |
| Two or more Races | 349 | 5.1% |
| Some other Race | 284 | 4.1% |
| Total | 6,896 | 100.0% |
Ancestry in Huerfano County
The most populous ancestries reported in Huerfano County are Mexican (1,283 | 18.6%), German (1,214 | 17.6%), English (572 | 8.3%), Irish (566 | 8.2%), and Spanish (453 | 6.6%), together accounting for 59.3% of all Huerfano County residents.

| Ancestry | # Population | % Population |
| American | 125 | 1.8% |
| Apache | 11 | 0.2% |
| Arab | 13 | 0.2% |
| Australian | 8 | 0.1% |
| Austrian | 41 | 0.6% |
| Blackfeet | 41 | 0.6% |
| British | 23 | 0.3% |
| Burmese | 65 | 0.9% |
| Canadian | 26 | 0.4% |
| Celtic | 3 | 0.0% |
| Cherokee | 17 | 0.3% |
| Chippewa | 22 | 0.3% |
| Choctaw | 157 | 2.3% |
| Czech | 124 | 1.8% |
| Danish | 13 | 0.2% |
| Dutch | 89 | 1.3% |
| Eastern European | 47 | 0.7% |
| English | 572 | 8.3% |
| European | 94 | 1.4% |
| French | 56 | 0.8% |
| French Canadian | 14 | 0.2% |
| German | 1,214 | 17.6% |
| Greek | 24 | 0.4% |
| Inupiat | 3 | 0.0% |
| Irish | 566 | 8.2% |
| Italian | 331 | 4.8% |
| Lebanese | 13 | 0.2% |
| Menominee | 15 | 0.2% |
| Mexican | 1,283 | 18.6% |
| Mexican American Indian | 11 | 0.2% |
| Navajo | 26 | 0.4% |
| Northern European | 7 | 0.1% |
| Norwegian | 44 | 0.6% |
| Polish | 63 | 0.9% |
| Portuguese | 7 | 0.1% |
| Puerto Rican | 15 | 0.2% |
| Romanian | 6 | 0.1% |
| Russian | 31 | 0.4% |
| Scandinavian | 61 | 0.9% |
| Scotch-Irish | 61 | 0.9% |
| Scottish | 98 | 1.4% |
| Sioux | 37 | 0.5% |
| Slavic | 12 | 0.2% |
| Slovak | 9 | 0.1% |
| Spaniard | 112 | 1.6% |
| Spanish | 453 | 6.6% |
| Swedish | 41 | 0.6% |
| Swiss | 18 | 0.3% |
| Thai | 5 | 0.1% |
| Turkish | 3 | 0.0% |
| Welsh | 26 | 0.4% |
| Yugoslavian | 21 | 0.3% | View All 52 Rows |
Immigrants in Huerfano County
The most numerous immigrant groups reported in Huerfano County came from Latin America (108 | 1.6%), Central America (96 | 1.4%), Mexico (96 | 1.4%), Peru (12 | 0.2%), and South America (12 | 0.2%), together accounting for 4.7% of all Huerfano County residents.

| Immigration Origin | # Population | % Population |
| Asia | 3 | 0.0% |
| Central America | 96 | 1.4% |
| England | 9 | 0.1% |
| Europe | 9 | 0.1% |
| Latin America | 108 | 1.6% |
| Mexico | 96 | 1.4% |
| Northern Europe | 9 | 0.1% |
| Peru | 12 | 0.2% |
| South America | 12 | 0.2% |
| Turkey | 3 | 0.0% |
| Western Asia | 3 | 0.0% | View All 11 Rows |
Sex and Age in Huerfano County
Sex and Age in Huerfano County
The most populous age groups in Huerfano County are 65 to 69 Years (352 | 9.8%) for men and 60 to 64 Years (356 | 10.8%) for women.
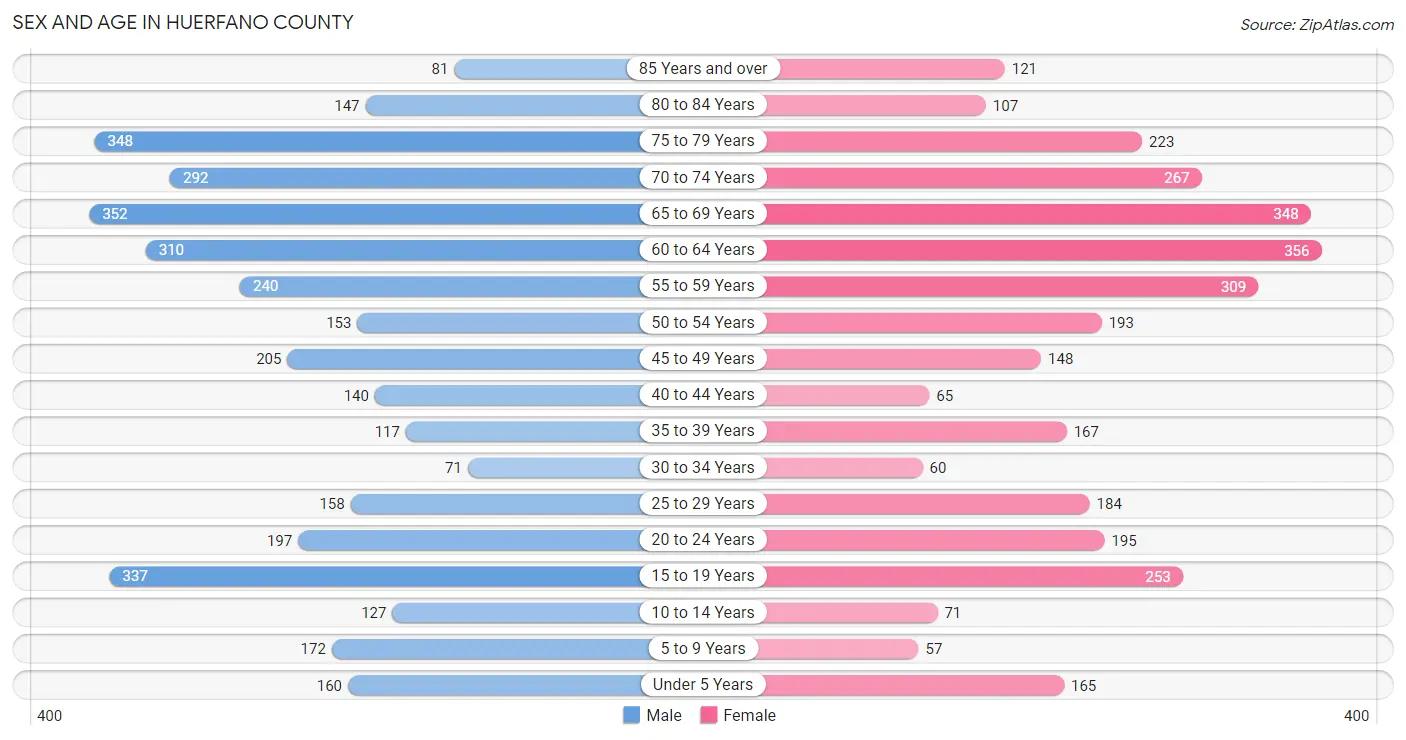
| Age Bracket | Male | Female |
| Under 5 Years | 160 (4.4%) | 165 (5.0%) |
| 5 to 9 Years | 172 (4.8%) | 57 (1.7%) |
| 10 to 14 Years | 127 (3.5%) | 71 (2.2%) |
| 15 to 19 Years | 337 (9.3%) | 253 (7.7%) |
| 20 to 24 Years | 197 (5.5%) | 195 (5.9%) |
| 25 to 29 Years | 158 (4.4%) | 184 (5.6%) |
| 30 to 34 Years | 71 (2.0%) | 60 (1.8%) |
| 35 to 39 Years | 117 (3.2%) | 167 (5.1%) |
| 40 to 44 Years | 140 (3.9%) | 65 (2.0%) |
| 45 to 49 Years | 205 (5.7%) | 148 (4.5%) |
| 50 to 54 Years | 153 (4.2%) | 193 (5.9%) |
| 55 to 59 Years | 240 (6.7%) | 309 (9.4%) |
| 60 to 64 Years | 310 (8.6%) | 356 (10.8%) |
| 65 to 69 Years | 352 (9.8%) | 348 (10.6%) |
| 70 to 74 Years | 292 (8.1%) | 267 (8.1%) |
| 75 to 79 Years | 348 (9.7%) | 223 (6.8%) |
| 80 to 84 Years | 147 (4.1%) | 107 (3.3%) |
| 85 Years and over | 81 (2.2%) | 121 (3.7%) |
| Total | 3,607 (100.0%) | 3,289 (100.0%) |
Families and Households in Huerfano County
Median Family Size in Huerfano County
The median family size in Huerfano County is 2.98 persons per family, with single female/mother families (314 | 17.8%) accounting for the largest median family size of 3.96 persons per family. On the other hand, married-couple families (1,322 | 75.0%) represent the smallest median family size with 2.70 persons per family.
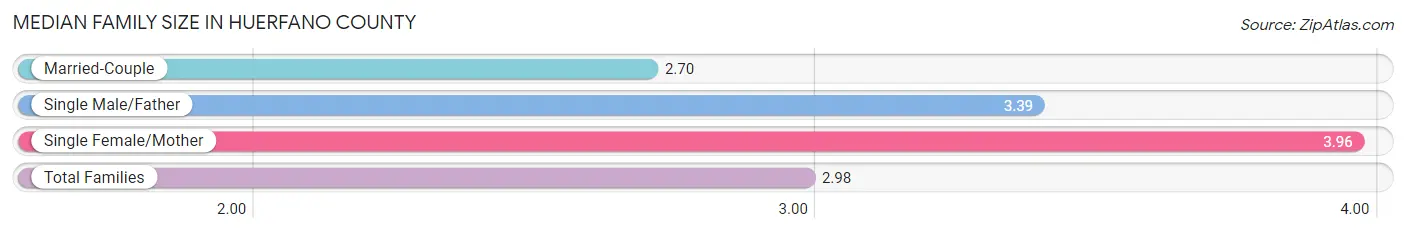
| Family Type | # Families | Family Size |
| Married-Couple | 1,322 (75.0%) | 2.70 |
| Single Male/Father | 127 (7.2%) | 3.39 |
| Single Female/Mother | 314 (17.8%) | 3.96 |
| Total Families | 1,763 (100.0%) | 2.98 |
Median Household Size in Huerfano County
The median household size in Huerfano County is 2.33 persons per household, with single female/mother households (314 | 10.9%) accounting for the largest median household size of 4.47 persons per household. non-family households (1,114 | 38.7%) represent the smallest median household size with 1.12 persons per household.
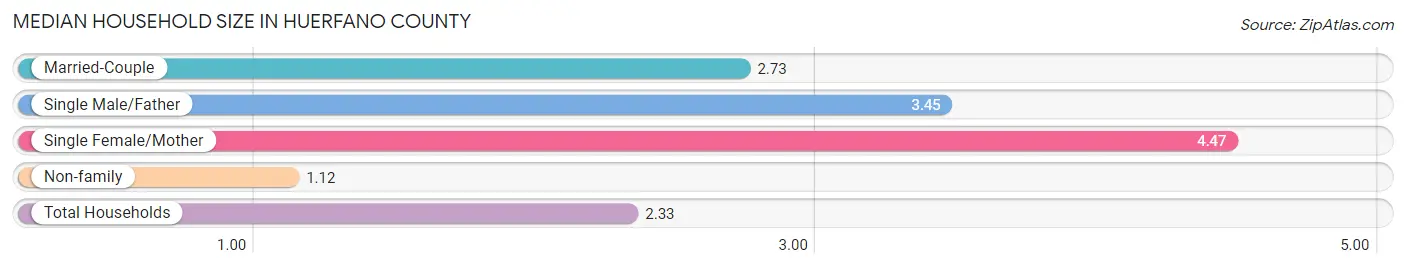
| Household Type | # Households | Household Size |
| Married-Couple | 1,322 (46.0%) | 2.73 |
| Single Male/Father | 127 (4.4%) | 3.45 |
| Single Female/Mother | 314 (10.9%) | 4.47 |
| Non-family | 1,114 (38.7%) | 1.12 |
| Total Households | 2,877 (100.0%) | 2.33 |
Household Size by Marriage Status in Huerfano County
Out of a total of 2,877 households in Huerfano County, 1,763 (61.3%) are family households, while 1,114 (38.7%) are nonfamily households. The most numerous type of family households are 2-person households, comprising 1,117, and the most common type of nonfamily households are 1-person households, comprising 1,021.

| Household Size | Family Households | Nonfamily Households |
| 1-Person Households | - | 1,021 (35.5%) |
| 2-Person Households | 1,117 (38.8%) | 93 (3.2%) |
| 3-Person Households | 356 (12.4%) | 0 (0.0%) |
| 4-Person Households | 126 (4.4%) | 0 (0.0%) |
| 5-Person Households | 100 (3.5%) | 0 (0.0%) |
| 6-Person Households | 9 (0.3%) | 0 (0.0%) |
| 7+ Person Households | 55 (1.9%) | 0 (0.0%) |
| Total | 1,763 (61.3%) | 1,114 (38.7%) |
Female Fertility in Huerfano County
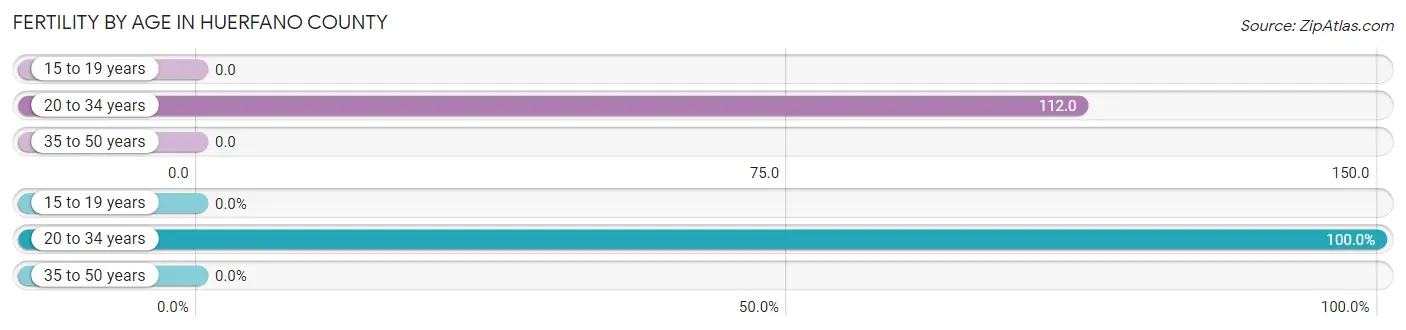
Fertility by Age in Huerfano County
Average fertility rate in Huerfano County is 44.0 births per 1,000 women. Women in the age bracket of 20 to 34 years have the highest fertility rate with 112.0 births per 1,000 women. Women in the age bracket of 20 to 34 years acount for 100.0% of all women with births.
| Age Bracket | Women with Births | Births / 1,000 Women |
| 15 to 19 years | 0 (0.0%) | 0.0 |
| 20 to 34 years | 49 (100.0%) | 112.0 |
| 35 to 50 years | 0 (0.0%) | 0.0 |
| Total | 49 (100.0%) | 44.0 |
Fertility by Age by Marriage Status in Huerfano County
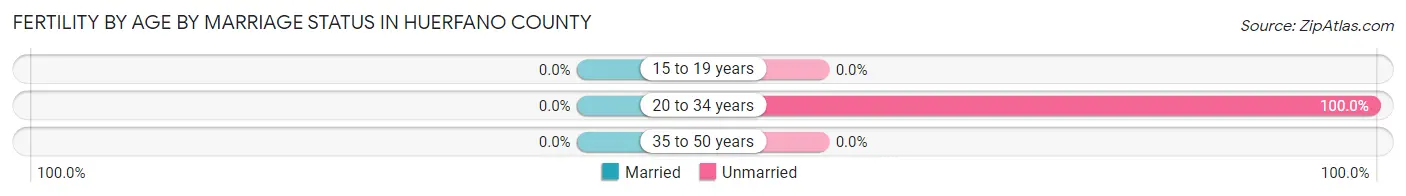
| Age Bracket | Married | Unmarried |
| 15 to 19 years | 0 (0.0%) | 0 (0.0%) |
| 20 to 34 years | 0 (0.0%) | 49 (100.0%) |
| 35 to 50 years | 0 (0.0%) | 0 (0.0%) |
| Total | 0 (0.0%) | 49 (100.0%) |
Fertility by Education in Huerfano County
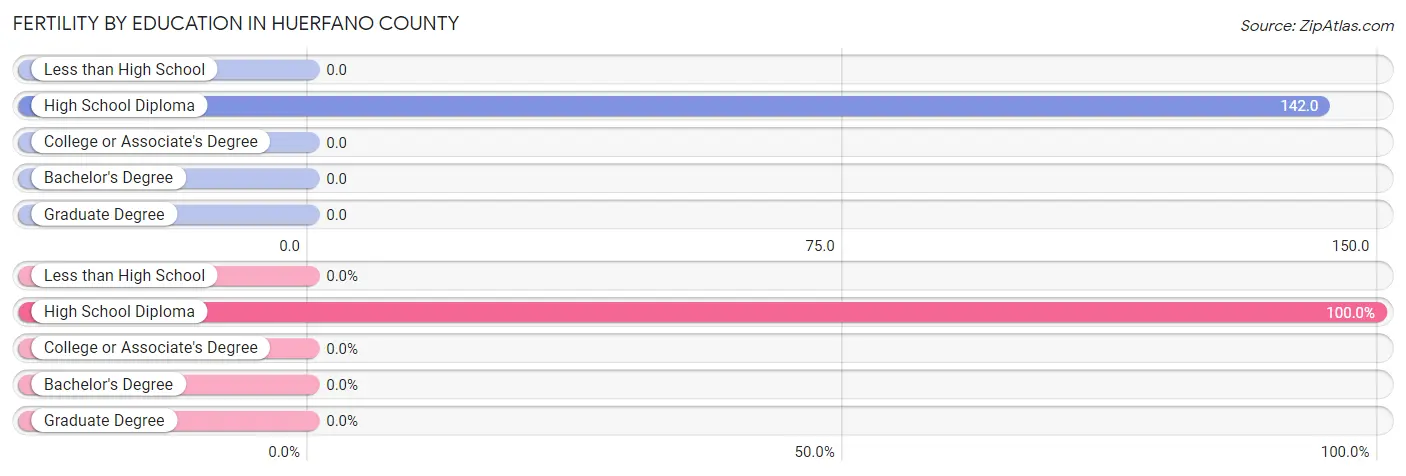
| Educational Attainment | Women with Births | Births / 1,000 Women |
| Less than High School | 0 (0.0%) | 0.0 |
| High School Diploma | 49 (100.0%) | 142.0 |
| College or Associate's Degree | 0 (0.0%) | 0.0 |
| Bachelor's Degree | 0 (0.0%) | 0.0 |
| Graduate Degree | 0 (0.0%) | 0.0 |
| Total | 49 (100.0%) | 44.0 |
Fertility by Education by Marriage Status in Huerfano County
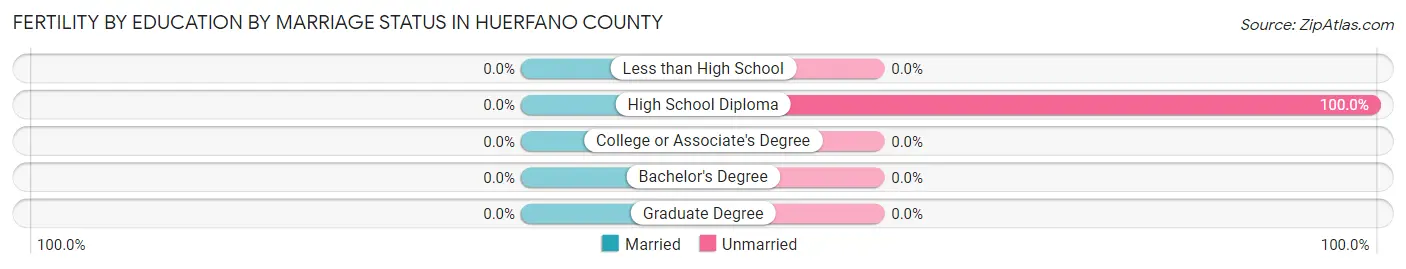
| Educational Attainment | Married | Unmarried |
| Less than High School | 0 (0.0%) | 0 (0.0%) |
| High School Diploma | 0 (0.0%) | 49 (100.0%) |
| College or Associate's Degree | 0 (0.0%) | 0 (0.0%) |
| Bachelor's Degree | 0 (0.0%) | 0 (0.0%) |
| Graduate Degree | 0 (0.0%) | 0 (0.0%) |
| Total | 0 (0.0%) | 49 (100.0%) |
Employment Characteristics in Huerfano County
Employment by Class of Employer in Huerfano County
Among the 2,498 employed individuals in Huerfano County, private company employees (1,351 | 54.1%), local government employees (433 | 17.3%), and self-employed (not incorporated) (321 | 12.9%) make up the most common classes of employment.
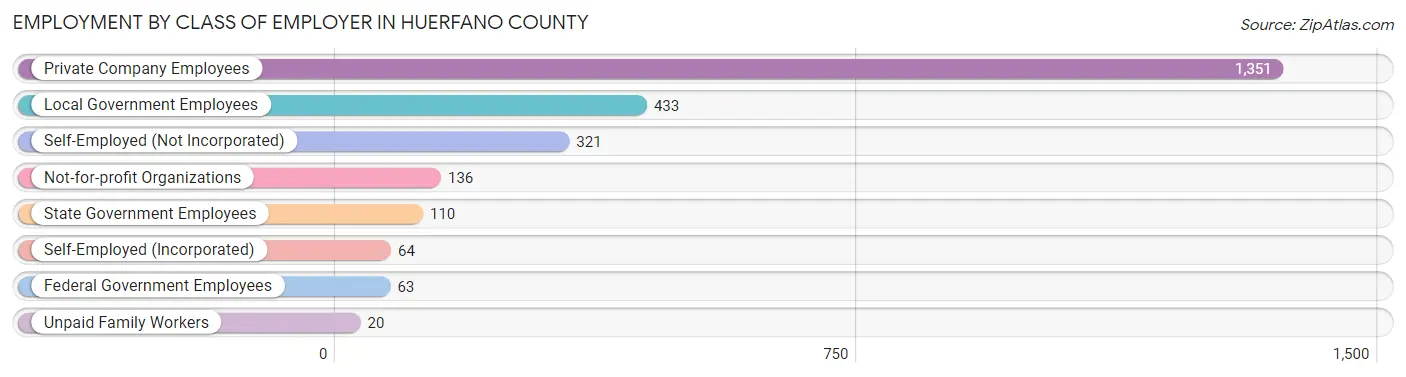
| Employer Class | # Employees | % Employees |
| Private Company Employees | 1,351 | 54.1% |
| Self-Employed (Incorporated) | 64 | 2.6% |
| Self-Employed (Not Incorporated) | 321 | 12.9% |
| Not-for-profit Organizations | 136 | 5.4% |
| Local Government Employees | 433 | 17.3% |
| State Government Employees | 110 | 4.4% |
| Federal Government Employees | 63 | 2.5% |
| Unpaid Family Workers | 20 | 0.8% |
| Total | 2,498 | 100.0% |
Employment Status by Age in Huerfano County
According to the labor force statistics for Huerfano County, out of the total population over 16 years of age (5,991), 44.6% or 2,672 individuals are in the labor force, with 6.4% or 171 of them unemployed. The age group with the highest labor force participation rate is 25 to 29 years, with 87.7% or 300 individuals in the labor force. Within the labor force, the 45 to 54 years age range has the highest percentage of unemployed individuals, with 16.0% or 91 of them being unemployed.
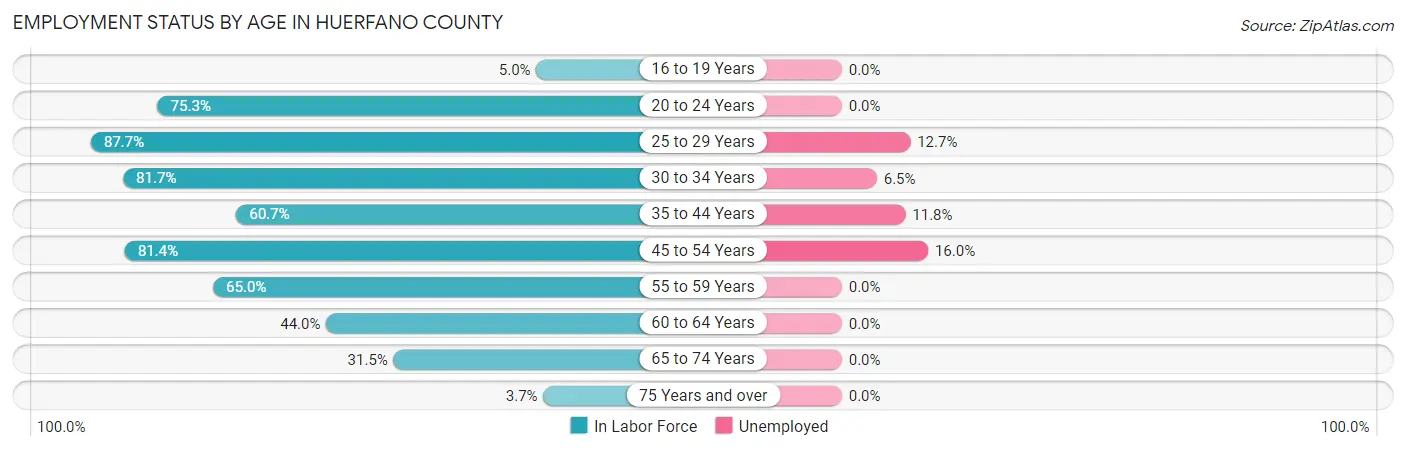
| Age Bracket | In Labor Force | Unemployed |
| 16 to 19 Years | 22 (5.0%) | 0 (0.0%) |
| 20 to 24 Years | 295 (75.3%) | 0 (0.0%) |
| 25 to 29 Years | 300 (87.7%) | 38 (12.7%) |
| 30 to 34 Years | 107 (81.7%) | 7 (6.5%) |
| 35 to 44 Years | 297 (60.7%) | 35 (11.8%) |
| 45 to 54 Years | 569 (81.4%) | 91 (16.0%) |
| 55 to 59 Years | 357 (65.0%) | 0 (0.0%) |
| 60 to 64 Years | 293 (44.0%) | 0 (0.0%) |
| 65 to 74 Years | 397 (31.5%) | 0 (0.0%) |
| 75 Years and over | 38 (3.7%) | 0 (0.0%) |
| Total | 2,672 (44.6%) | 171 (6.4%) |
Employment Status by Educational Attainment in Huerfano County
According to labor force statistics for Huerfano County, 66.9% of individuals (1,924) out of the total population between 25 and 64 years of age (2,876) are in the labor force, with 8.9% or 171 of them being unemployed. The group with the highest labor force participation rate are those with the educational attainment of bachelor's degree or higher, with 74.3% or 448 individuals in the labor force. Within the labor force, individuals with less than high school education have the highest percentage of unemployment, with 52.0% or 13 of them being unemployed.

| Educational Attainment | In Labor Force | Unemployed |
| Less than High School | 25 (29.1%) | 45 (52.0%) |
| High School Diploma | 467 (60.6%) | 89 (11.6%) |
| College / Associate Degree | 983 (69.4%) | 150 (10.6%) |
| Bachelor's Degree or higher | 448 (74.3%) | 0 (0.0%) |
| Total | 1,924 (66.9%) | 256 (8.9%) |
Employment Occupations by Sex in Huerfano County
Management, Business, Science and Arts Occupations
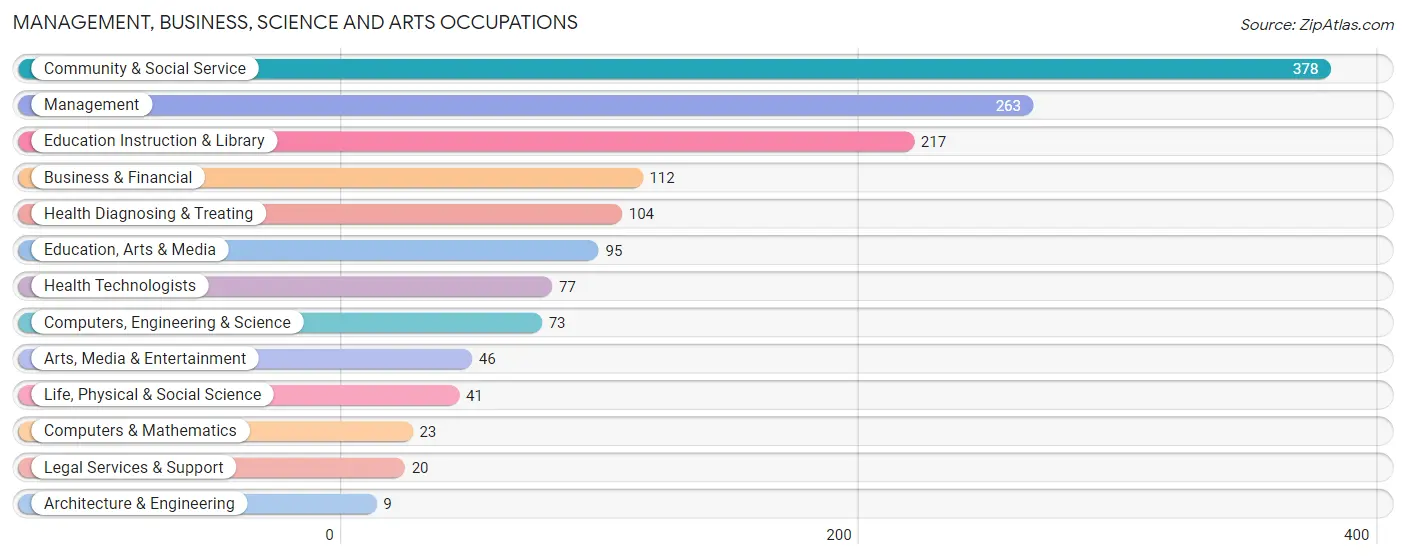
The most common Management, Business, Science and Arts occupations in Huerfano County are Community & Social Service (378 | 15.1%), Management (263 | 10.5%), Education Instruction & Library (217 | 8.7%), Business & Financial (112 | 4.5%), and Health Diagnosing & Treating (104 | 4.2%).
Management, Business, Science and Arts Occupations by Sex
Within the Management, Business, Science and Arts occupations in Huerfano County, the most male-oriented occupations are Architecture & Engineering (100.0%), Business & Financial (96.4%), and Arts, Media & Entertainment (89.1%), while the most female-oriented occupations are Legal Services & Support (100.0%), Health Technologists (88.3%), and Health Diagnosing & Treating (83.7%).
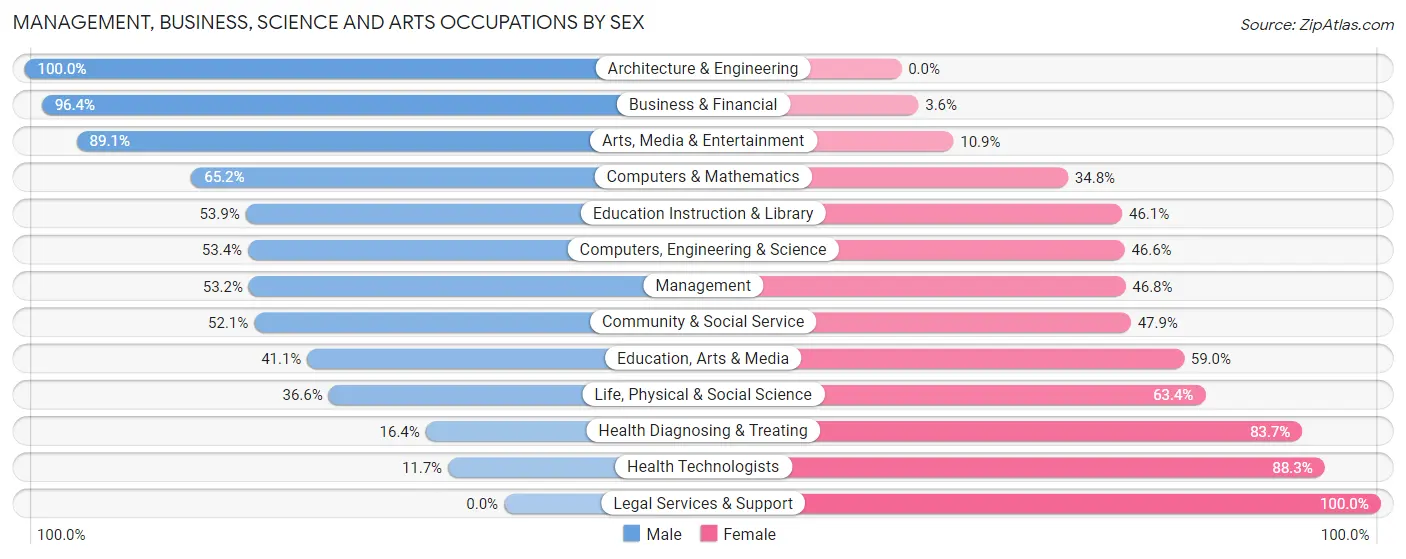
| Occupation | Male | Female |
| Management | 140 (53.2%) | 123 (46.8%) |
| Business & Financial | 108 (96.4%) | 4 (3.6%) |
| Computers, Engineering & Science | 39 (53.4%) | 34 (46.6%) |
| Computers & Mathematics | 15 (65.2%) | 8 (34.8%) |
| Architecture & Engineering | 9 (100.0%) | 0 (0.0%) |
| Life, Physical & Social Science | 15 (36.6%) | 26 (63.4%) |
| Community & Social Service | 197 (52.1%) | 181 (47.9%) |
| Education, Arts & Media | 39 (41.0%) | 56 (59.0%) |
| Legal Services & Support | 0 (0.0%) | 20 (100.0%) |
| Education Instruction & Library | 117 (53.9%) | 100 (46.1%) |
| Arts, Media & Entertainment | 41 (89.1%) | 5 (10.9%) |
| Health Diagnosing & Treating | 17 (16.4%) | 87 (83.7%) |
| Health Technologists | 9 (11.7%) | 68 (88.3%) |
| Total (Category) | 501 (53.9%) | 429 (46.1%) |
| Total (Overall) | 1,259 (50.3%) | 1,244 (49.7%) |
Services Occupations
The most common Services occupations in Huerfano County are Food Preparation & Serving (176 | 7.0%), Cleaning & Maintenance (126 | 5.0%), Security & Protection (122 | 4.9%), Law Enforcement (100 | 4.0%), and Healthcare Support (95 | 3.8%).

Services Occupations by Sex
Within the Services occupations in Huerfano County, the most male-oriented occupations are Security & Protection (100.0%), Firefighting & Prevention (100.0%), and Law Enforcement (100.0%), while the most female-oriented occupations are Healthcare Support (100.0%), Personal Care & Service (100.0%), and Cleaning & Maintenance (54.0%).
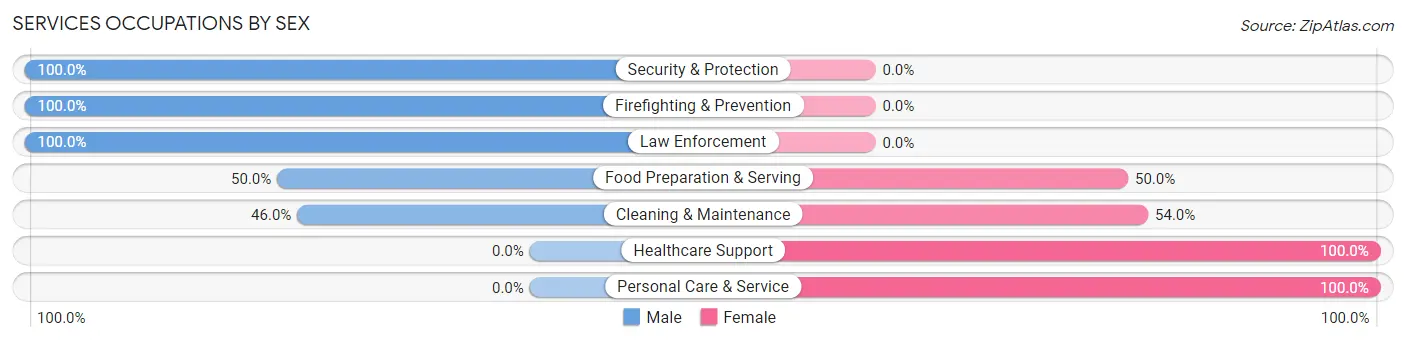
| Occupation | Male | Female |
| Healthcare Support | 0 (0.0%) | 95 (100.0%) |
| Security & Protection | 122 (100.0%) | 0 (0.0%) |
| Firefighting & Prevention | 22 (100.0%) | 0 (0.0%) |
| Law Enforcement | 100 (100.0%) | 0 (0.0%) |
| Food Preparation & Serving | 88 (50.0%) | 88 (50.0%) |
| Cleaning & Maintenance | 58 (46.0%) | 68 (54.0%) |
| Personal Care & Service | 0 (0.0%) | 21 (100.0%) |
| Total (Category) | 268 (49.6%) | 272 (50.4%) |
| Total (Overall) | 1,259 (50.3%) | 1,244 (49.7%) |
Sales and Office Occupations
The most common Sales and Office occupations in Huerfano County are Office & Administration (300 | 12.0%), and Sales & Related (229 | 9.1%).

Sales and Office Occupations by Sex

| Occupation | Male | Female |
| Sales & Related | 116 (50.7%) | 113 (49.3%) |
| Office & Administration | 22 (7.3%) | 278 (92.7%) |
| Total (Category) | 138 (26.1%) | 391 (73.9%) |
| Total (Overall) | 1,259 (50.3%) | 1,244 (49.7%) |
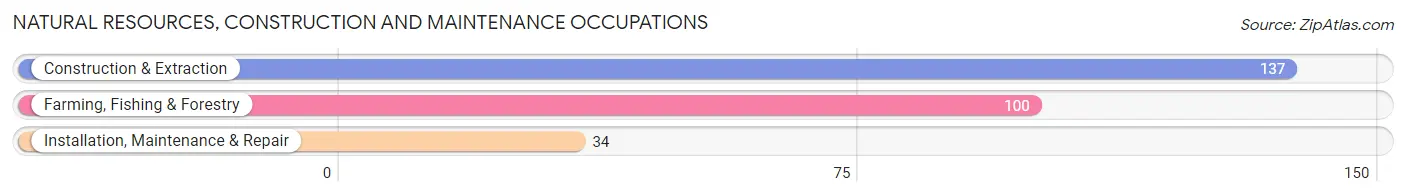
Natural Resources, Construction and Maintenance Occupations
The most common Natural Resources, Construction and Maintenance occupations in Huerfano County are Construction & Extraction (137 | 5.5%), Farming, Fishing & Forestry (100 | 4.0%), and Installation, Maintenance & Repair (34 | 1.4%).
Natural Resources, Construction and Maintenance Occupations by Sex
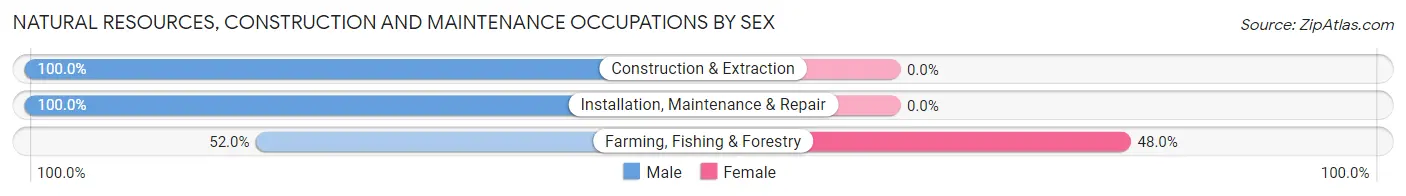
| Occupation | Male | Female |
| Farming, Fishing & Forestry | 52 (52.0%) | 48 (48.0%) |
| Construction & Extraction | 137 (100.0%) | 0 (0.0%) |
| Installation, Maintenance & Repair | 34 (100.0%) | 0 (0.0%) |
| Total (Category) | 223 (82.3%) | 48 (17.7%) |
| Total (Overall) | 1,259 (50.3%) | 1,244 (49.7%) |
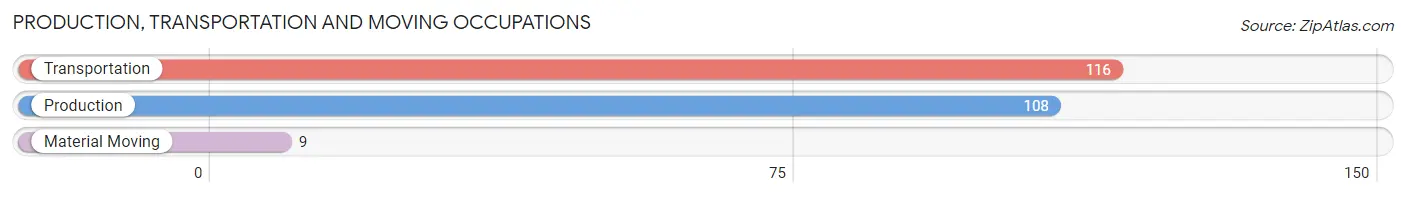
Production, Transportation and Moving Occupations
The most common Production, Transportation and Moving occupations in Huerfano County are Transportation (116 | 4.6%), Production (108 | 4.3%), and Material Moving (9 | 0.4%).
Production, Transportation and Moving Occupations by Sex
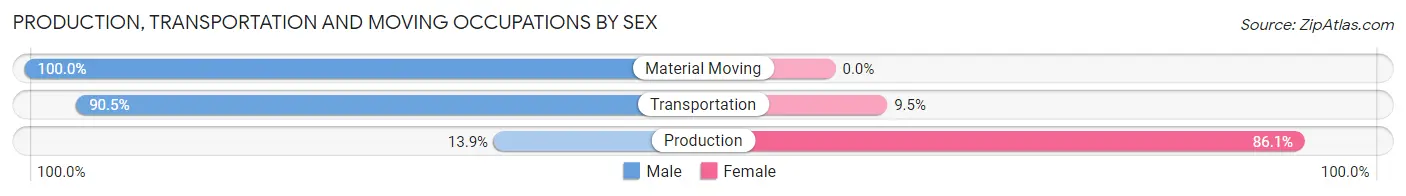
| Occupation | Male | Female |
| Production | 15 (13.9%) | 93 (86.1%) |
| Transportation | 105 (90.5%) | 11 (9.5%) |
| Material Moving | 9 (100.0%) | 0 (0.0%) |
| Total (Category) | 129 (55.4%) | 104 (44.6%) |
| Total (Overall) | 1,259 (50.3%) | 1,244 (49.7%) |
Employment Industries by Sex in Huerfano County
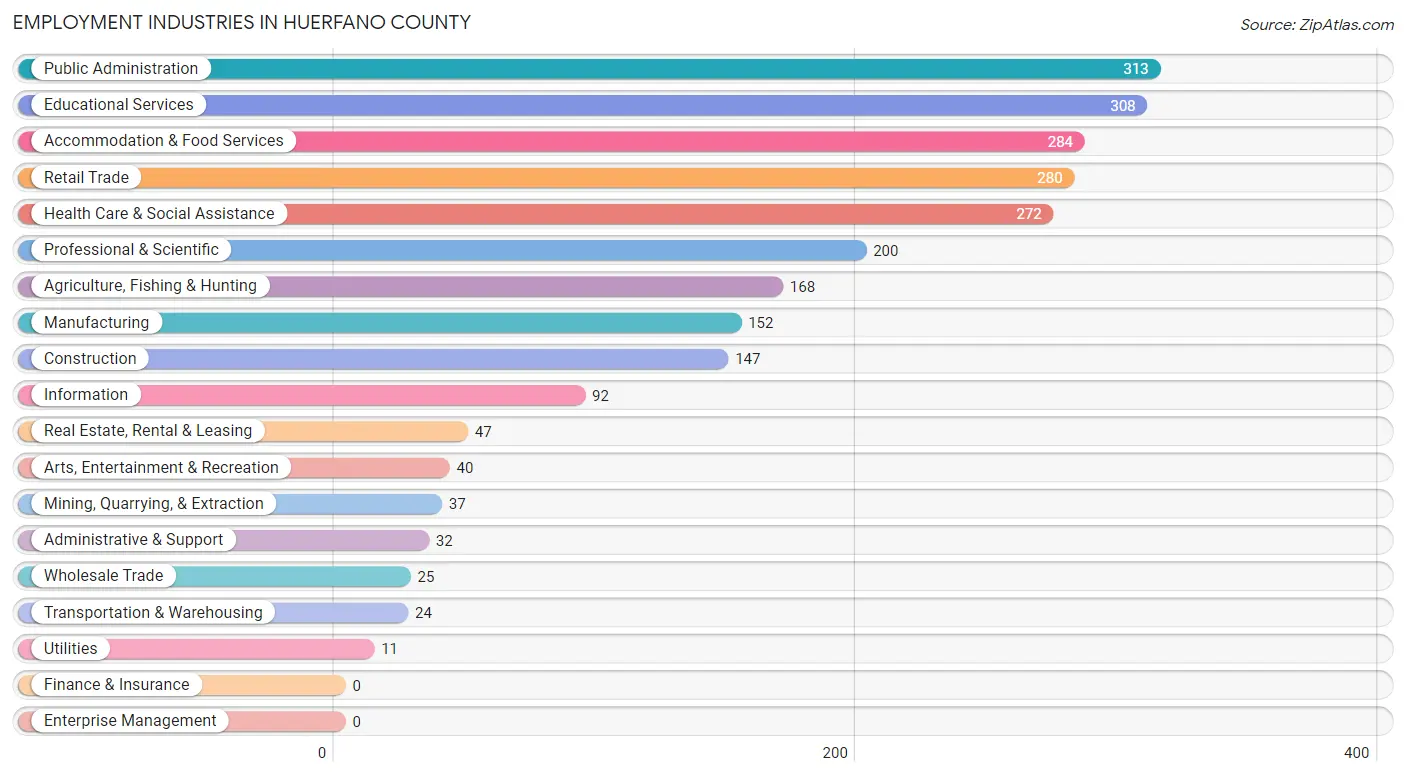
Employment Industries in Huerfano County
The major employment industries in Huerfano County include Public Administration (313 | 12.5%), Educational Services (308 | 12.3%), Accommodation & Food Services (284 | 11.4%), Retail Trade (280 | 11.2%), and Health Care & Social Assistance (272 | 10.9%).
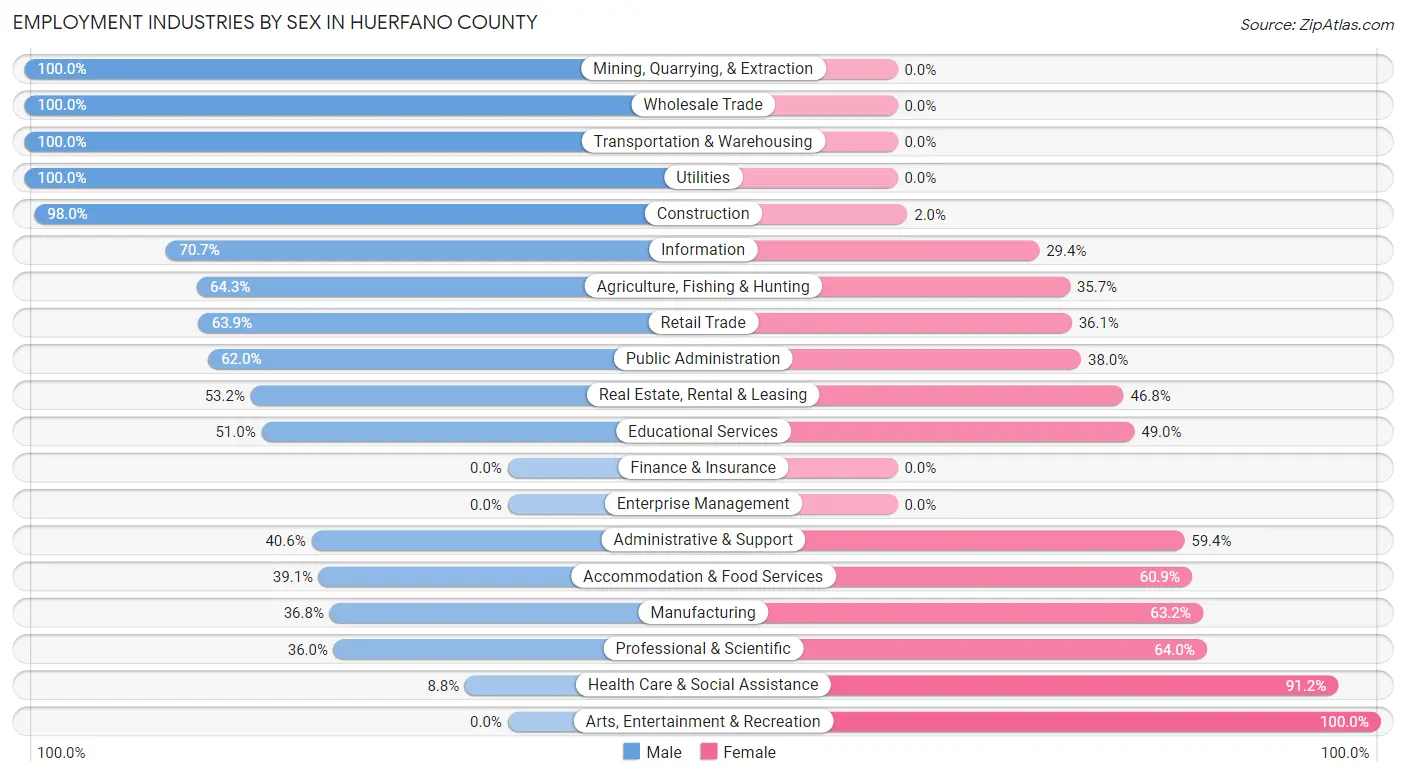
Employment Industries by Sex in Huerfano County
The Huerfano County industries that see more men than women are Mining, Quarrying, & Extraction (100.0%), Wholesale Trade (100.0%), and Transportation & Warehousing (100.0%), whereas the industries that tend to have a higher number of women are Arts, Entertainment & Recreation (100.0%), Health Care & Social Assistance (91.2%), and Professional & Scientific (64.0%).
| Industry | Male | Female |
| Agriculture, Fishing & Hunting | 108 (64.3%) | 60 (35.7%) |
| Mining, Quarrying, & Extraction | 37 (100.0%) | 0 (0.0%) |
| Construction | 144 (98.0%) | 3 (2.0%) |
| Manufacturing | 56 (36.8%) | 96 (63.2%) |
| Wholesale Trade | 25 (100.0%) | 0 (0.0%) |
| Retail Trade | 179 (63.9%) | 101 (36.1%) |
| Transportation & Warehousing | 24 (100.0%) | 0 (0.0%) |
| Utilities | 11 (100.0%) | 0 (0.0%) |
| Information | 65 (70.7%) | 27 (29.3%) |
| Finance & Insurance | 0 (0.0%) | 0 (0.0%) |
| Real Estate, Rental & Leasing | 25 (53.2%) | 22 (46.8%) |
| Professional & Scientific | 72 (36.0%) | 128 (64.0%) |
| Enterprise Management | 0 (0.0%) | 0 (0.0%) |
| Administrative & Support | 13 (40.6%) | 19 (59.4%) |
| Educational Services | 157 (51.0%) | 151 (49.0%) |
| Health Care & Social Assistance | 24 (8.8%) | 248 (91.2%) |
| Arts, Entertainment & Recreation | 0 (0.0%) | 40 (100.0%) |
| Accommodation & Food Services | 111 (39.1%) | 173 (60.9%) |
| Public Administration | 194 (62.0%) | 119 (38.0%) |
| Total | 1,259 (50.3%) | 1,244 (49.7%) |
Education in Huerfano County
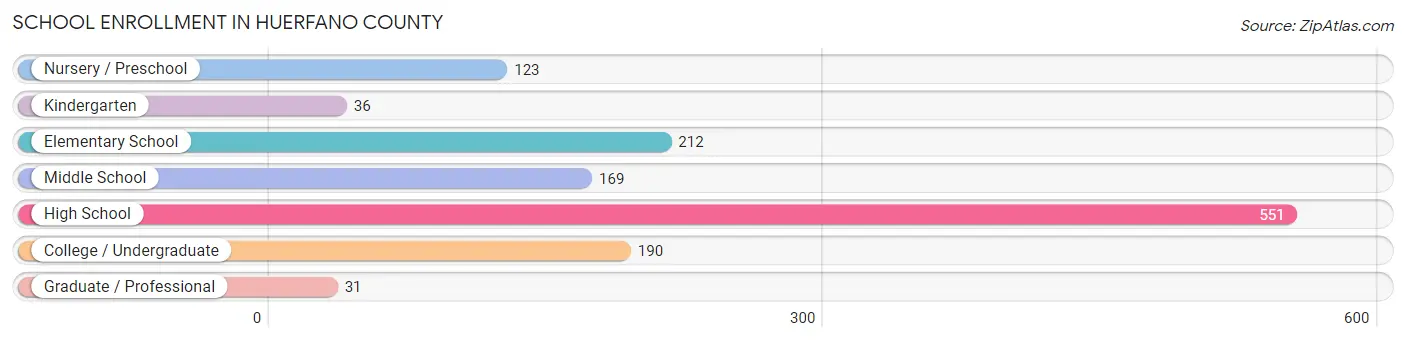
School Enrollment in Huerfano County
The most common levels of schooling among the 1,312 students in Huerfano County are high school (551 | 42.0%), elementary school (212 | 16.2%), and college / undergraduate (190 | 14.5%).
| School Level | # Students | % Students |
| Nursery / Preschool | 123 | 9.4% |
| Kindergarten | 36 | 2.7% |
| Elementary School | 212 | 16.2% |
| Middle School | 169 | 12.9% |
| High School | 551 | 42.0% |
| College / Undergraduate | 190 | 14.5% |
| Graduate / Professional | 31 | 2.4% |
| Total | 1,312 | 100.0% |
School Enrollment by Age by Funding Source in Huerfano County
Out of a total of 1,312 students who are enrolled in schools in Huerfano County, 125 (9.5%) attend a private institution, while the remaining 1,187 (90.5%) are enrolled in public schools. The age group of 35 years and over has the highest likelihood of being enrolled in private schools, with 40 (46.5% in the age bracket) enrolled. Conversely, the age group of 5 to 9 year old has the lowest likelihood of being enrolled in a private school, with 229 (100.0% in the age bracket) attending a public institution.
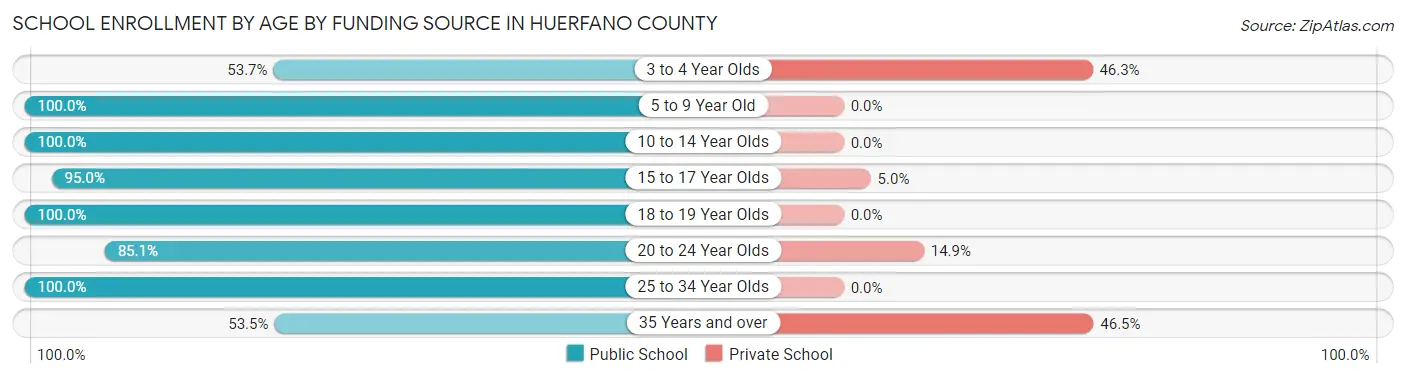
| Age Bracket | Public School | Private School |
| 3 to 4 Year Olds | 66 (53.7%) | 57 (46.3%) |
| 5 to 9 Year Old | 229 (100.0%) | 0 (0.0%) |
| 10 to 14 Year Olds | 198 (100.0%) | 0 (0.0%) |
| 15 to 17 Year Olds | 321 (95.0%) | 17 (5.0%) |
| 18 to 19 Year Olds | 214 (100.0%) | 0 (0.0%) |
| 20 to 24 Year Olds | 57 (85.1%) | 10 (14.9%) |
| 25 to 34 Year Olds | 57 (100.0%) | 0 (0.0%) |
| 35 Years and over | 46 (53.5%) | 40 (46.5%) |
| Total | 1,187 (90.5%) | 125 (9.5%) |
Educational Attainment by Field of Study in Huerfano County
Education (360 | 25.3%), business (282 | 19.8%), bio, nature & agricultural (174 | 12.2%), social sciences (129 | 9.0%), and science & technology (105 | 7.4%) are the most common fields of study among 1,426 individuals in Huerfano County who have obtained a bachelor's degree or higher.
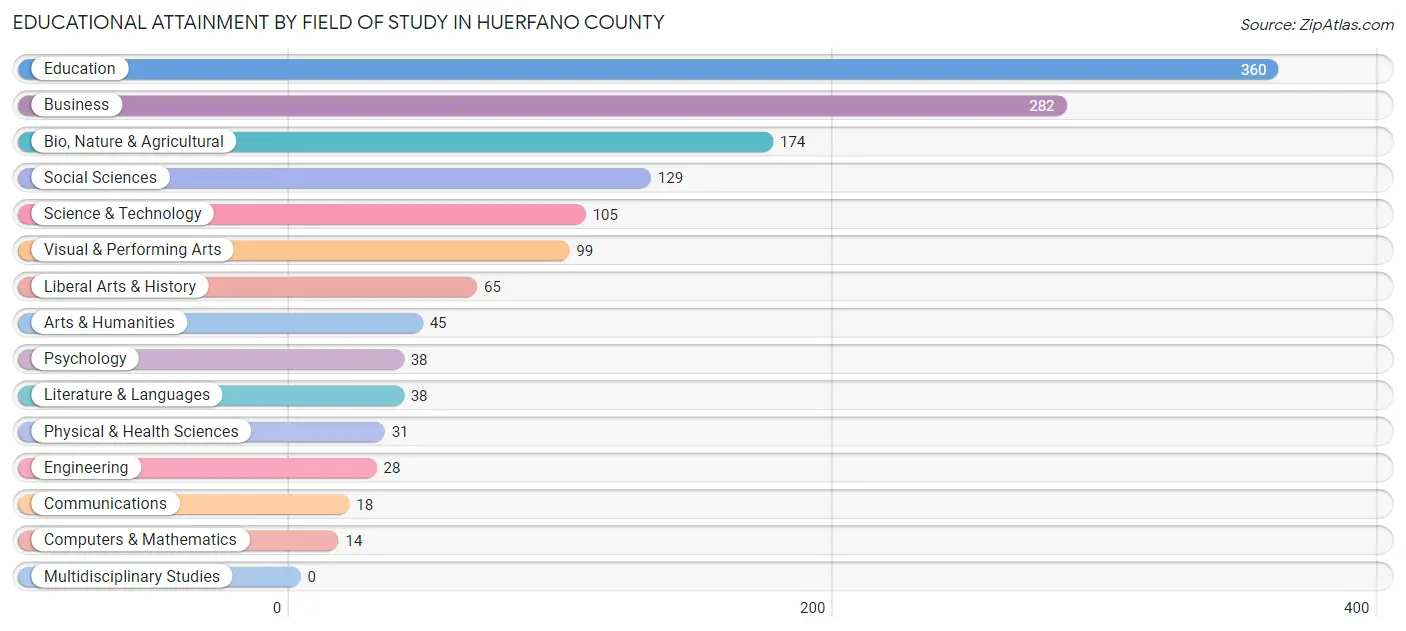
| Field of Study | # Graduates | % Graduates |
| Computers & Mathematics | 14 | 1.0% |
| Bio, Nature & Agricultural | 174 | 12.2% |
| Physical & Health Sciences | 31 | 2.2% |
| Psychology | 38 | 2.7% |
| Social Sciences | 129 | 9.0% |
| Engineering | 28 | 2.0% |
| Multidisciplinary Studies | 0 | 0.0% |
| Science & Technology | 105 | 7.4% |
| Business | 282 | 19.8% |
| Education | 360 | 25.3% |
| Literature & Languages | 38 | 2.7% |
| Liberal Arts & History | 65 | 4.6% |
| Visual & Performing Arts | 99 | 6.9% |
| Communications | 18 | 1.3% |
| Arts & Humanities | 45 | 3.2% |
| Total | 1,426 | 100.0% |
Transportation & Commute in Huerfano County
Vehicle Availability by Sex in Huerfano County
The most prevalent vehicle ownership categories in Huerfano County are males with 2 vehicles (382, accounting for 31.2%) and females with 2 vehicles (310, making up 30.8%).
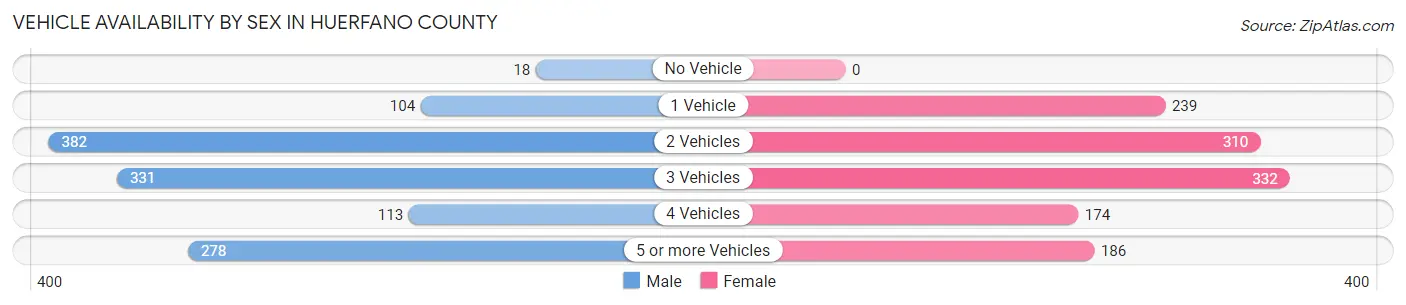
| Vehicles Available | Male | Female |
| No Vehicle | 18 (1.5%) | 0 (0.0%) |
| 1 Vehicle | 104 (8.5%) | 239 (19.3%) |
| 2 Vehicles | 382 (31.2%) | 310 (25.0%) |
| 3 Vehicles | 331 (27.0%) | 332 (26.8%) |
| 4 Vehicles | 113 (9.2%) | 174 (14.0%) |
| 5 or more Vehicles | 278 (22.7%) | 186 (15.0%) |
| Total | 1,226 (100.0%) | 1,241 (100.0%) |
Commute Time in Huerfano County
The most frequently occuring commute durations in Huerfano County are 5 to 9 minutes (454 commuters, 22.2%), 10 to 14 minutes (284 commuters, 13.9%), and 30 to 34 minutes (189 commuters, 9.2%).
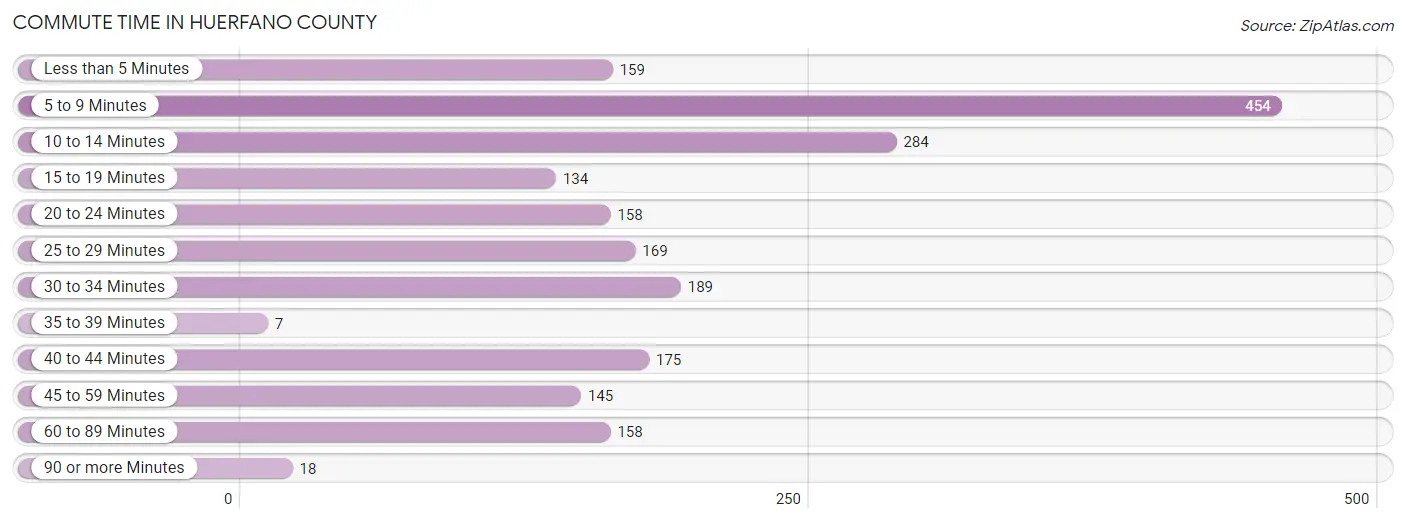
| Commute Time | # Commuters | % Commuters |
| Less than 5 Minutes | 159 | 7.8% |
| 5 to 9 Minutes | 454 | 22.2% |
| 10 to 14 Minutes | 284 | 13.9% |
| 15 to 19 Minutes | 134 | 6.5% |
| 20 to 24 Minutes | 158 | 7.7% |
| 25 to 29 Minutes | 169 | 8.2% |
| 30 to 34 Minutes | 189 | 9.2% |
| 35 to 39 Minutes | 7 | 0.3% |
| 40 to 44 Minutes | 175 | 8.5% |
| 45 to 59 Minutes | 145 | 7.1% |
| 60 to 89 Minutes | 158 | 7.7% |
| 90 or more Minutes | 18 | 0.9% |
Commute Time by Sex in Huerfano County
The most common commute times in Huerfano County are 5 to 9 minutes (250 commuters, 25.7%) for males and 10 to 14 minutes (236 commuters, 21.9%) for females.
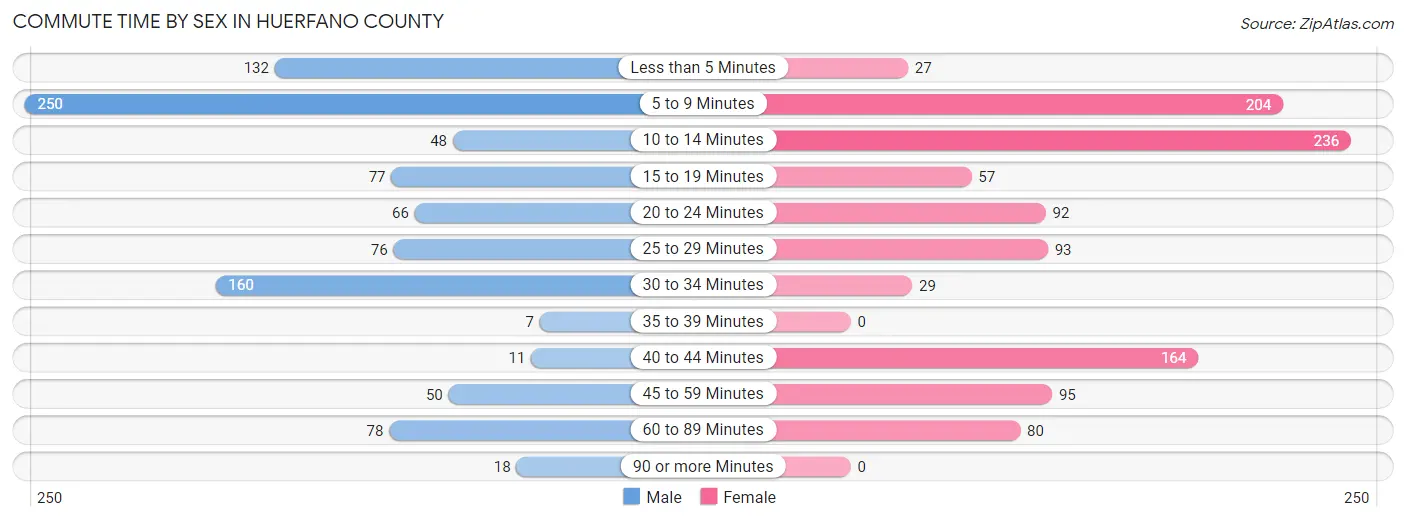
| Commute Time | Male | Female |
| Less than 5 Minutes | 132 (13.6%) | 27 (2.5%) |
| 5 to 9 Minutes | 250 (25.7%) | 204 (18.9%) |
| 10 to 14 Minutes | 48 (4.9%) | 236 (21.9%) |
| 15 to 19 Minutes | 77 (7.9%) | 57 (5.3%) |
| 20 to 24 Minutes | 66 (6.8%) | 92 (8.5%) |
| 25 to 29 Minutes | 76 (7.8%) | 93 (8.6%) |
| 30 to 34 Minutes | 160 (16.4%) | 29 (2.7%) |
| 35 to 39 Minutes | 7 (0.7%) | 0 (0.0%) |
| 40 to 44 Minutes | 11 (1.1%) | 164 (15.2%) |
| 45 to 59 Minutes | 50 (5.1%) | 95 (8.8%) |
| 60 to 89 Minutes | 78 (8.0%) | 80 (7.4%) |
| 90 or more Minutes | 18 (1.8%) | 0 (0.0%) |
Time of Departure to Work by Sex in Huerfano County
The most frequent times of departure to work in Huerfano County are 7:00 AM to 7:29 AM (219, 22.5%) for males and 7:00 AM to 7:29 AM (203, 18.9%) for females.
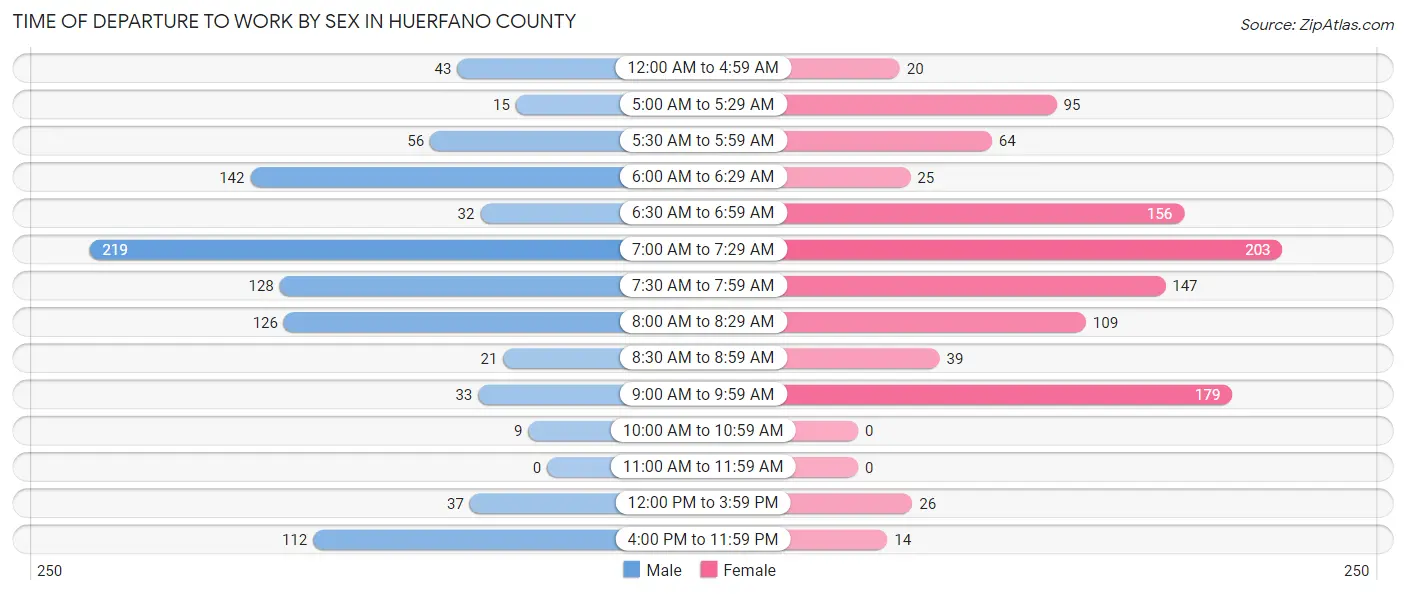
| Time of Departure | Male | Female |
| 12:00 AM to 4:59 AM | 43 (4.4%) | 20 (1.9%) |
| 5:00 AM to 5:29 AM | 15 (1.5%) | 95 (8.8%) |
| 5:30 AM to 5:59 AM | 56 (5.8%) | 64 (5.9%) |
| 6:00 AM to 6:29 AM | 142 (14.6%) | 25 (2.3%) |
| 6:30 AM to 6:59 AM | 32 (3.3%) | 156 (14.5%) |
| 7:00 AM to 7:29 AM | 219 (22.5%) | 203 (18.9%) |
| 7:30 AM to 7:59 AM | 128 (13.2%) | 147 (13.7%) |
| 8:00 AM to 8:29 AM | 126 (13.0%) | 109 (10.1%) |
| 8:30 AM to 8:59 AM | 21 (2.2%) | 39 (3.6%) |
| 9:00 AM to 9:59 AM | 33 (3.4%) | 179 (16.6%) |
| 10:00 AM to 10:59 AM | 9 (0.9%) | 0 (0.0%) |
| 11:00 AM to 11:59 AM | 0 (0.0%) | 0 (0.0%) |
| 12:00 PM to 3:59 PM | 37 (3.8%) | 26 (2.4%) |
| 4:00 PM to 11:59 PM | 112 (11.5%) | 14 (1.3%) |
| Total | 973 (100.0%) | 1,077 (100.0%) |
Housing Occupancy in Huerfano County
Occupancy by Ownership in Huerfano County
Of the total 2,877 dwellings in Huerfano County, owner-occupied units account for 2,231 (77.5%), while renter-occupied units make up 646 (22.5%).
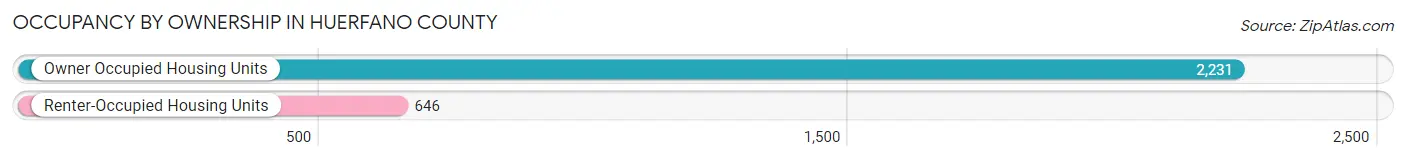
| Occupancy | # Housing Units | % Housing Units |
| Owner Occupied Housing Units | 2,231 | 77.5% |
| Renter-Occupied Housing Units | 646 | 22.5% |
| Total Occupied Housing Units | 2,877 | 100.0% |
Occupancy by Household Size in Huerfano County
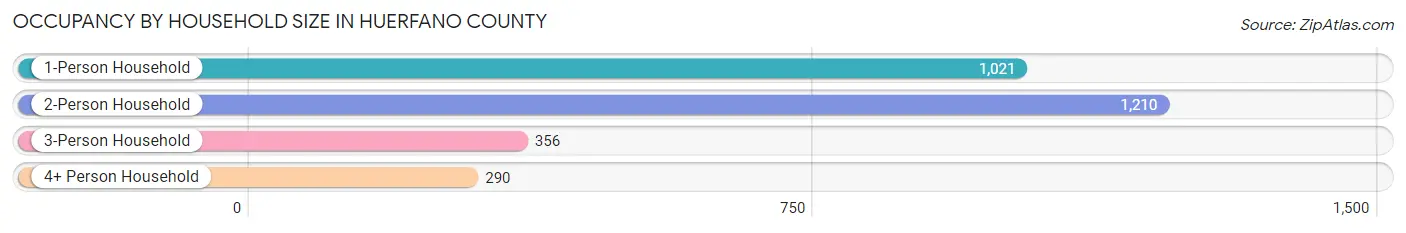
| Household Size | # Housing Units | % Housing Units |
| 1-Person Household | 1,021 | 35.5% |
| 2-Person Household | 1,210 | 42.1% |
| 3-Person Household | 356 | 12.4% |
| 4+ Person Household | 290 | 10.1% |
| Total Housing Units | 2,877 | 100.0% |
Occupancy by Ownership by Household Size in Huerfano County
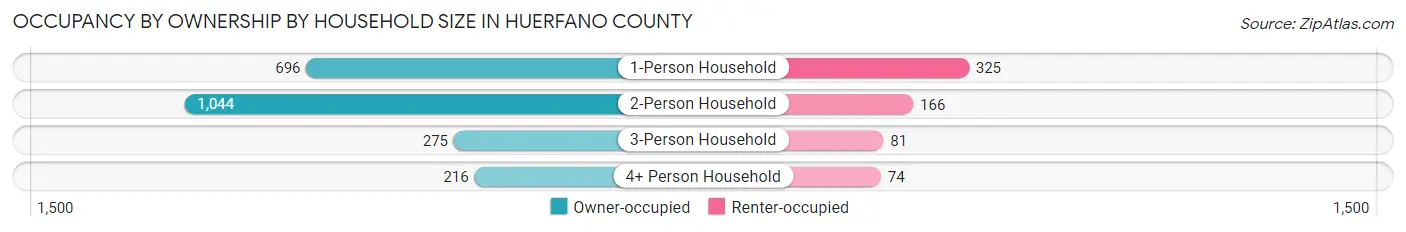
| Household Size | Owner-occupied | Renter-occupied |
| 1-Person Household | 696 (68.2%) | 325 (31.8%) |
| 2-Person Household | 1,044 (86.3%) | 166 (13.7%) |
| 3-Person Household | 275 (77.2%) | 81 (22.8%) |
| 4+ Person Household | 216 (74.5%) | 74 (25.5%) |
| Total Housing Units | 2,231 (77.5%) | 646 (22.5%) |
Occupancy by Educational Attainment in Huerfano County
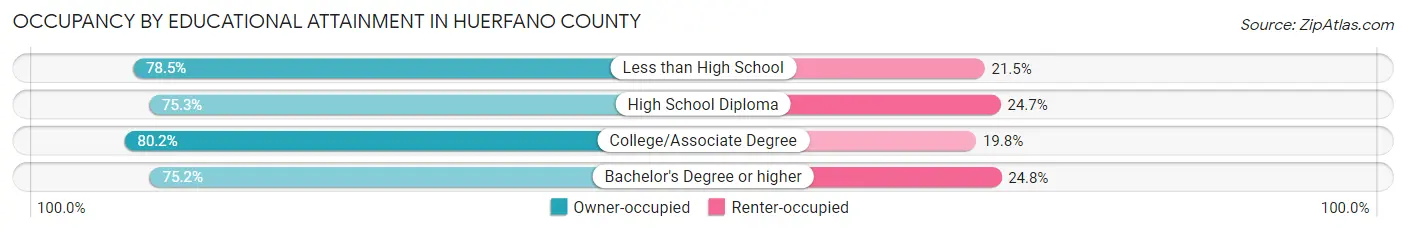
| Household Size | Owner-occupied | Renter-occupied |
| Less than High School | 95 (78.5%) | 26 (21.5%) |
| High School Diploma | 498 (75.3%) | 163 (24.7%) |
| College/Associate Degree | 1,001 (80.2%) | 247 (19.8%) |
| Bachelor's Degree or higher | 637 (75.2%) | 210 (24.8%) |
Occupancy by Age of Householder in Huerfano County
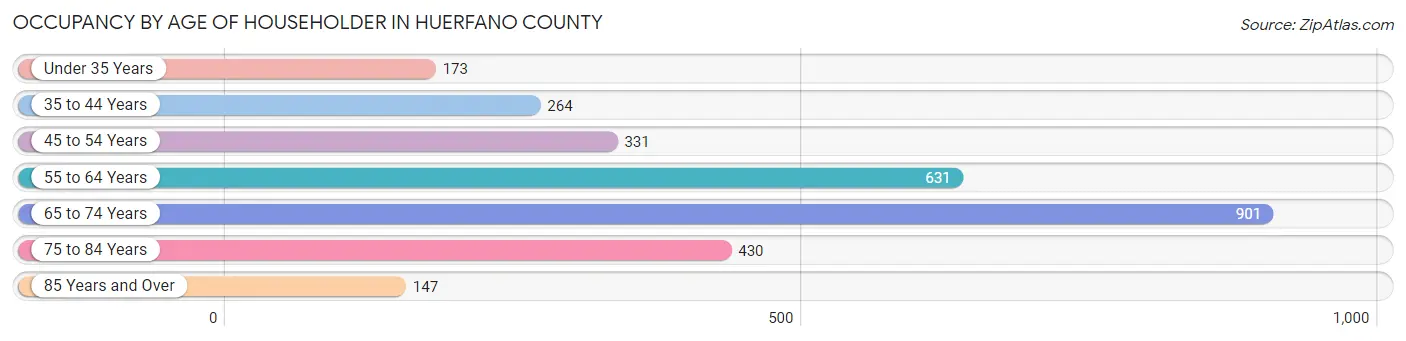
| Age Bracket | # Households | % Households |
| Under 35 Years | 173 | 6.0% |
| 35 to 44 Years | 264 | 9.2% |
| 45 to 54 Years | 331 | 11.5% |
| 55 to 64 Years | 631 | 21.9% |
| 65 to 74 Years | 901 | 31.3% |
| 75 to 84 Years | 430 | 14.9% |
| 85 Years and Over | 147 | 5.1% |
| Total | 2,877 | 100.0% |
Housing Finances in Huerfano County
Median Income by Occupancy in Huerfano County

| Occupancy Type | # Households | Median Income |
| Owner-Occupied | 2,231 (77.5%) | $59,672 |
| Renter-Occupied | 646 (22.5%) | $22,000 |
| Average | 2,877 (100.0%) | $49,631 |
Occupancy by Householder Income Bracket in Huerfano County

| Income Bracket | Owner-occupied | Renter-occupied |
| Less than $5,000 | 65 (2.9%) | 77 (11.9%) |
| $5,000 to $9,999 | 42 (1.9%) | 10 (1.5%) |
| $10,000 to $14,999 | 72 (3.2%) | 171 (26.5%) |
| $15,000 to $19,999 | 162 (7.3%) | 9 (1.4%) |
| $20,000 to $24,999 | 106 (4.8%) | 99 (15.3%) |
| $25,000 to $34,999 | 175 (7.8%) | 18 (2.8%) |
| $35,000 to $49,999 | 318 (14.2%) | 126 (19.5%) |
| $50,000 to $74,999 | 387 (17.3%) | 69 (10.7%) |
| $75,000 to $99,999 | 296 (13.3%) | 43 (6.7%) |
| $100,000 to $149,999 | 461 (20.7%) | 2 (0.3%) |
| $150,000 or more | 147 (6.6%) | 22 (3.4%) |
| Total | 2,231 (100.0%) | 646 (100.0%) |
Monthly Housing Cost Tiers in Huerfano County
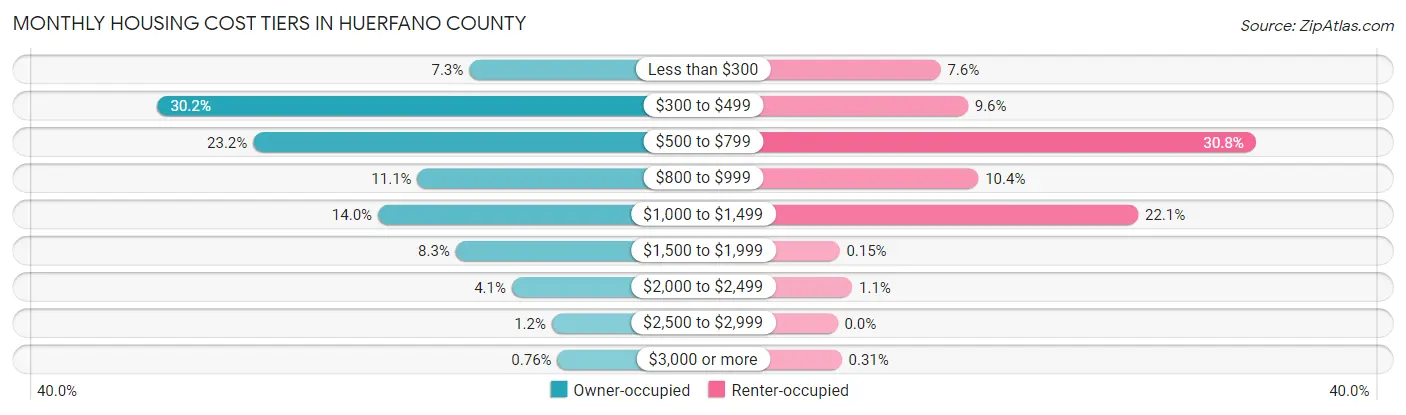
| Monthly Cost | Owner-occupied | Renter-occupied |
| Less than $300 | 162 (7.3%) | 49 (7.6%) |
| $300 to $499 | 674 (30.2%) | 62 (9.6%) |
| $500 to $799 | 517 (23.2%) | 199 (30.8%) |
| $800 to $999 | 247 (11.1%) | 67 (10.4%) |
| $1,000 to $1,499 | 312 (14.0%) | 143 (22.1%) |
| $1,500 to $1,999 | 184 (8.3%) | 1 (0.2%) |
| $2,000 to $2,499 | 92 (4.1%) | 7 (1.1%) |
| $2,500 to $2,999 | 26 (1.2%) | 0 (0.0%) |
| $3,000 or more | 17 (0.8%) | 2 (0.3%) |
| Total | 2,231 (100.0%) | 646 (100.0%) |
Physical Housing Characteristics in Huerfano County
Housing Structures in Huerfano County
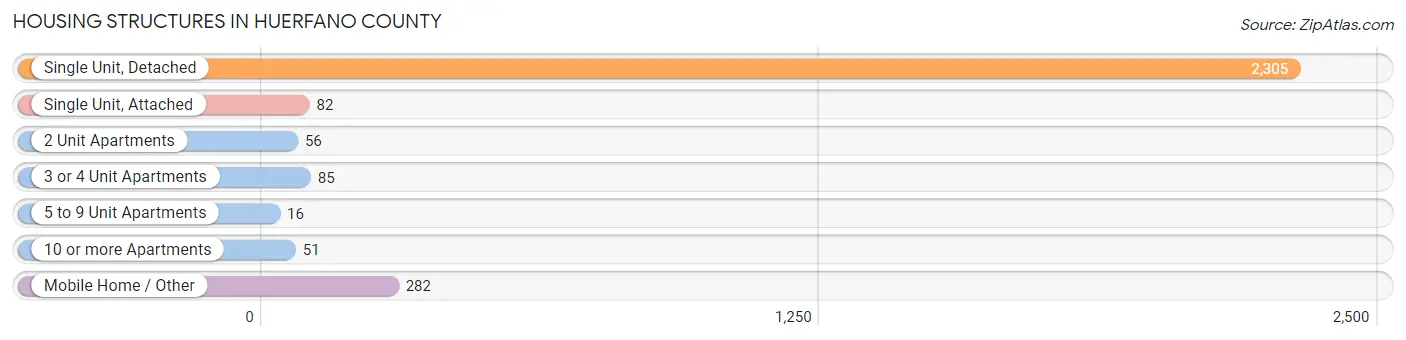
| Structure Type | # Housing Units | % Housing Units |
| Single Unit, Detached | 2,305 | 80.1% |
| Single Unit, Attached | 82 | 2.9% |
| 2 Unit Apartments | 56 | 1.9% |
| 3 or 4 Unit Apartments | 85 | 2.9% |
| 5 to 9 Unit Apartments | 16 | 0.6% |
| 10 or more Apartments | 51 | 1.8% |
| Mobile Home / Other | 282 | 9.8% |
| Total | 2,877 | 100.0% |
Housing Structures by Occupancy in Huerfano County
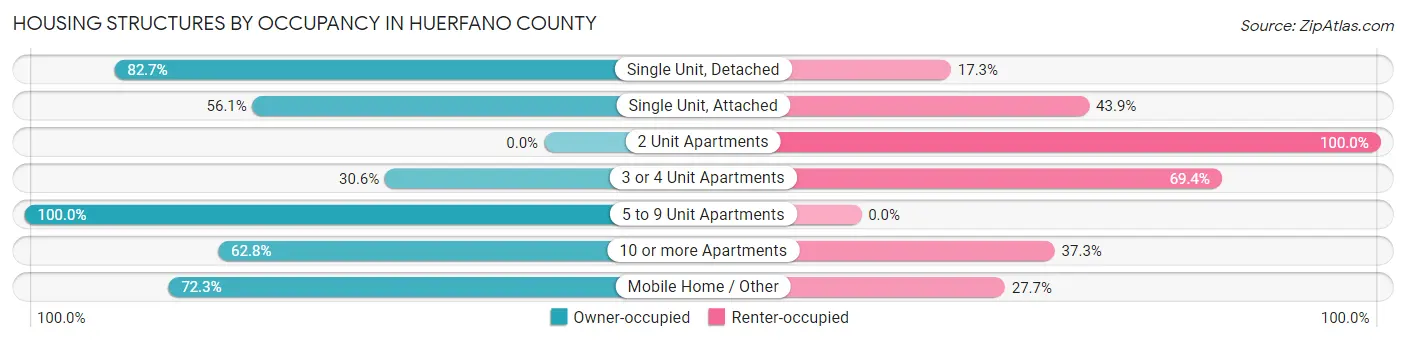
| Structure Type | Owner-occupied | Renter-occupied |
| Single Unit, Detached | 1,907 (82.7%) | 398 (17.3%) |
| Single Unit, Attached | 46 (56.1%) | 36 (43.9%) |
| 2 Unit Apartments | 0 (0.0%) | 56 (100.0%) |
| 3 or 4 Unit Apartments | 26 (30.6%) | 59 (69.4%) |
| 5 to 9 Unit Apartments | 16 (100.0%) | 0 (0.0%) |
| 10 or more Apartments | 32 (62.7%) | 19 (37.2%) |
| Mobile Home / Other | 204 (72.3%) | 78 (27.7%) |
| Total | 2,231 (77.5%) | 646 (22.5%) |
Housing Structures by Number of Rooms in Huerfano County
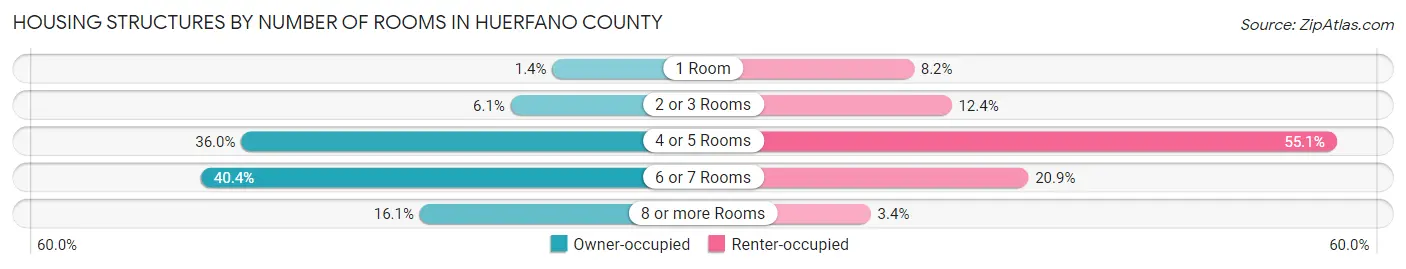
| Number of Rooms | Owner-occupied | Renter-occupied |
| 1 Room | 32 (1.4%) | 53 (8.2%) |
| 2 or 3 Rooms | 135 (6.0%) | 80 (12.4%) |
| 4 or 5 Rooms | 802 (35.9%) | 356 (55.1%) |
| 6 or 7 Rooms | 902 (40.4%) | 135 (20.9%) |
| 8 or more Rooms | 360 (16.1%) | 22 (3.4%) |
| Total | 2,231 (100.0%) | 646 (100.0%) |
Housing Structure by Heating Type in Huerfano County
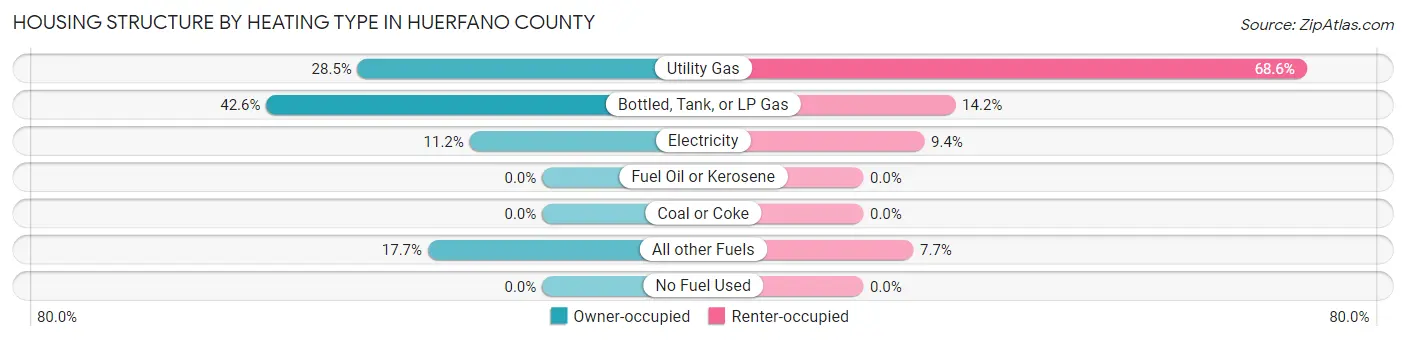
| Heating Type | Owner-occupied | Renter-occupied |
| Utility Gas | 636 (28.5%) | 443 (68.6%) |
| Bottled, Tank, or LP Gas | 951 (42.6%) | 92 (14.2%) |
| Electricity | 250 (11.2%) | 61 (9.4%) |
| Fuel Oil or Kerosene | 0 (0.0%) | 0 (0.0%) |
| Coal or Coke | 0 (0.0%) | 0 (0.0%) |
| All other Fuels | 394 (17.7%) | 50 (7.7%) |
| No Fuel Used | 0 (0.0%) | 0 (0.0%) |
| Total | 2,231 (100.0%) | 646 (100.0%) |
Household Vehicle Usage in Huerfano County
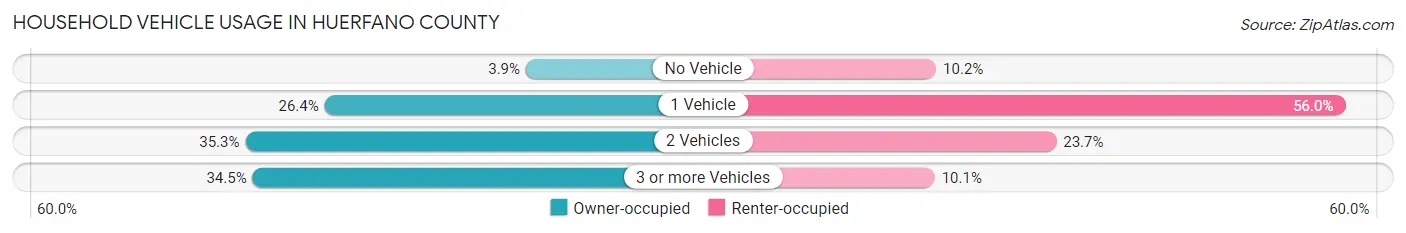
| Vehicles per Household | Owner-occupied | Renter-occupied |
| No Vehicle | 86 (3.8%) | 66 (10.2%) |
| 1 Vehicle | 589 (26.4%) | 362 (56.0%) |
| 2 Vehicles | 787 (35.3%) | 153 (23.7%) |
| 3 or more Vehicles | 769 (34.5%) | 65 (10.1%) |
| Total | 2,231 (100.0%) | 646 (100.0%) |
Real Estate & Mortgages in Huerfano County
Real Estate and Mortgage Overview in Huerfano County
| Characteristic | Without Mortgage | With Mortgage |
| Housing Units | 1,402 | 829 |
| Median Property Value | $240,900 | $223,100 |
| Median Household Income | $48,371 | $47 |
| Monthly Housing Costs | $462 | $17 |
| Real Estate Taxes | $644 | $32 |
Property Value by Mortgage Status in Huerfano County
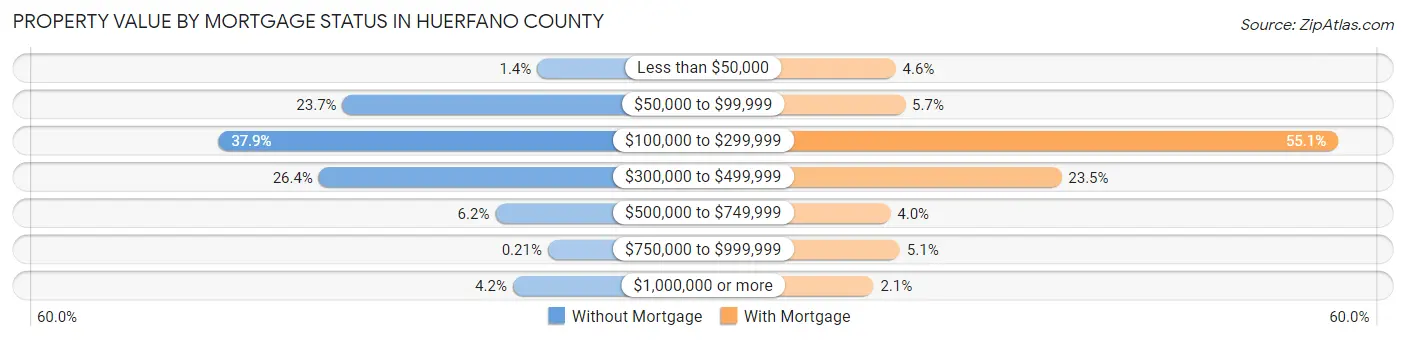
| Property Value | Without Mortgage | With Mortgage |
| Less than $50,000 | 20 (1.4%) | 38 (4.6%) |
| $50,000 to $99,999 | 332 (23.7%) | 47 (5.7%) |
| $100,000 to $299,999 | 531 (37.9%) | 457 (55.1%) |
| $300,000 to $499,999 | 370 (26.4%) | 195 (23.5%) |
| $500,000 to $749,999 | 87 (6.2%) | 33 (4.0%) |
| $750,000 to $999,999 | 3 (0.2%) | 42 (5.1%) |
| $1,000,000 or more | 59 (4.2%) | 17 (2.1%) |
| Total | 1,402 (100.0%) | 829 (100.0%) |
Household Income by Mortgage Status in Huerfano County
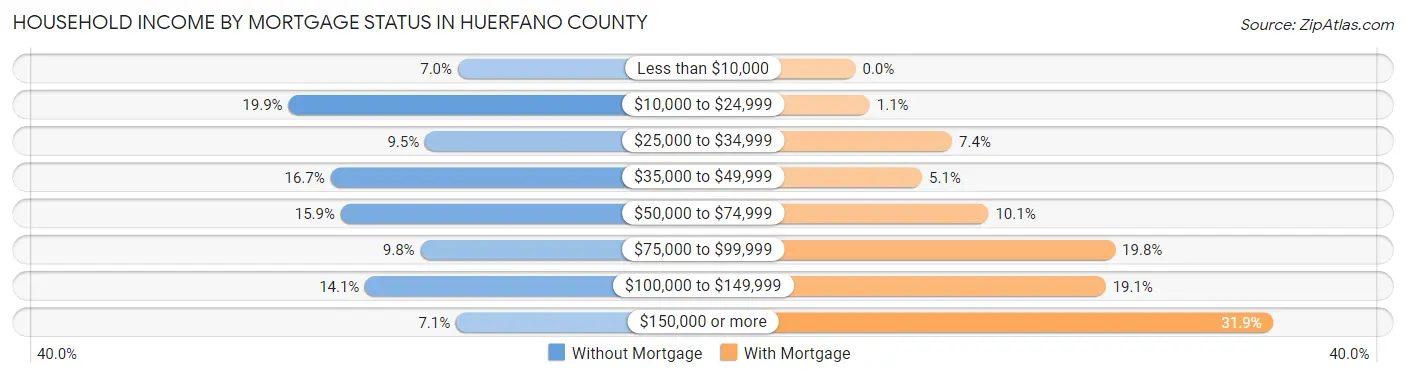
| Household Income | Without Mortgage | With Mortgage |
| Less than $10,000 | 98 (7.0%) | 0 (0.0%) |
| $10,000 to $24,999 | 279 (19.9%) | 9 (1.1%) |
| $25,000 to $34,999 | 133 (9.5%) | 61 (7.4%) |
| $35,000 to $49,999 | 234 (16.7%) | 42 (5.1%) |
| $50,000 to $74,999 | 223 (15.9%) | 84 (10.1%) |
| $75,000 to $99,999 | 138 (9.8%) | 164 (19.8%) |
| $100,000 to $149,999 | 197 (14.1%) | 158 (19.1%) |
| $150,000 or more | 100 (7.1%) | 264 (31.9%) |
| Total | 1,402 (100.0%) | 829 (100.0%) |
Property Value to Household Income Ratio in Huerfano County

| Value-to-Income Ratio | Without Mortgage | With Mortgage |
| Less than 2.0x | 156 (11.1%) | 78,750 (9,499.4%) |
| 2.0x to 2.9x | 171 (12.2%) | 303 (36.5%) |
| 3.0x to 3.9x | 322 (23.0%) | 144 (17.4%) |
| 4.0x or more | 742 (52.9%) | 69 (8.3%) |
| Total | 1,402 (100.0%) | 829 (100.0%) |
Real Estate Taxes by Mortgage Status in Huerfano County
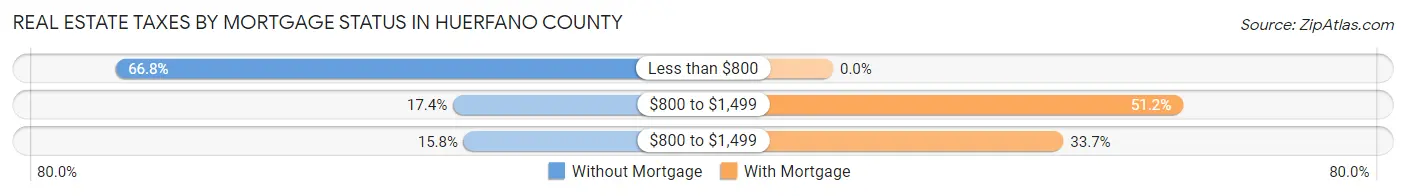
| Property Taxes | Without Mortgage | With Mortgage |
| Less than $800 | 936 (66.8%) | 0 (0.0%) |
| $800 to $1,499 | 244 (17.4%) | 424 (51.1%) |
| $800 to $1,499 | 222 (15.8%) | 279 (33.7%) |
| Total | 1,402 (100.0%) | 829 (100.0%) |
Health & Disability in Huerfano County
Health Insurance Coverage by Age in Huerfano County
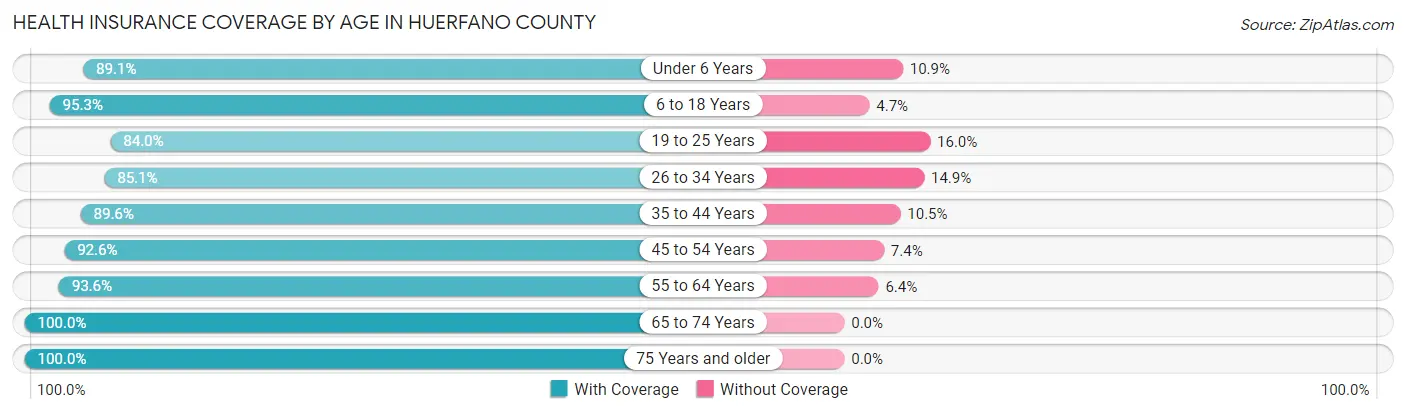
| Age Bracket | With Coverage | Without Coverage |
| Under 6 Years | 302 (89.1%) | 37 (10.9%) |
| 6 to 18 Years | 797 (95.3%) | 39 (4.7%) |
| 19 to 25 Years | 483 (84.0%) | 92 (16.0%) |
| 26 to 34 Years | 372 (85.1%) | 65 (14.9%) |
| 35 to 44 Years | 420 (89.5%) | 49 (10.4%) |
| 45 to 54 Years | 639 (92.6%) | 51 (7.4%) |
| 55 to 64 Years | 1,130 (93.6%) | 77 (6.4%) |
| 65 to 74 Years | 1,241 (100.0%) | 0 (0.0%) |
| 75 Years and older | 955 (100.0%) | 0 (0.0%) |
| Total | 6,339 (93.9%) | 410 (6.1%) |
Health Insurance Coverage by Citizenship Status in Huerfano County
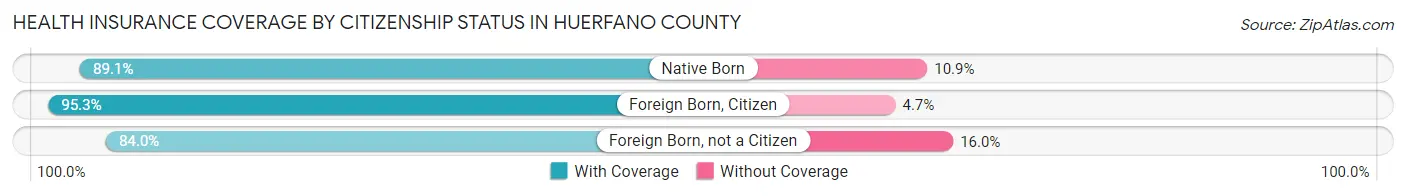
| Citizenship Status | With Coverage | Without Coverage |
| Native Born | 302 (89.1%) | 37 (10.9%) |
| Foreign Born, Citizen | 797 (95.3%) | 39 (4.7%) |
| Foreign Born, not a Citizen | 483 (84.0%) | 92 (16.0%) |
Health Insurance Coverage by Household Income in Huerfano County

| Household Income | With Coverage | Without Coverage |
| Under $25,000 | 1,222 (91.7%) | 111 (8.3%) |
| $25,000 to $49,999 | 1,186 (93.8%) | 79 (6.2%) |
| $50,000 to $74,999 | 1,254 (92.1%) | 107 (7.9%) |
| $75,000 to $99,999 | 672 (100.0%) | 0 (0.0%) |
| $100,000 and over | 1,958 (94.5%) | 113 (5.5%) |
Public vs Private Health Insurance Coverage by Age in Huerfano County
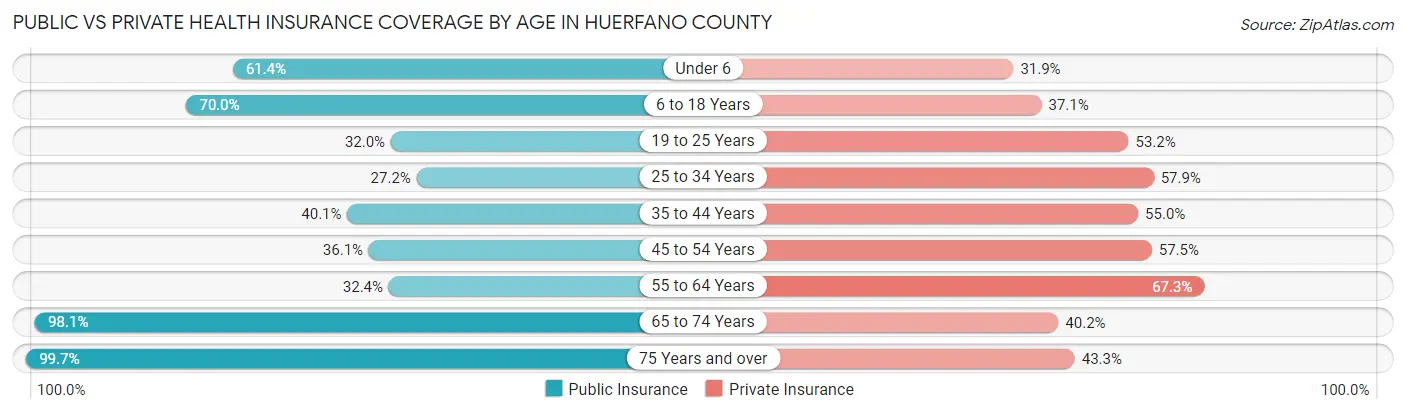
| Age Bracket | Public Insurance | Private Insurance |
| Under 6 | 208 (61.4%) | 108 (31.9%) |
| 6 to 18 Years | 585 (70.0%) | 310 (37.1%) |
| 19 to 25 Years | 184 (32.0%) | 306 (53.2%) |
| 25 to 34 Years | 119 (27.2%) | 253 (57.9%) |
| 35 to 44 Years | 188 (40.1%) | 258 (55.0%) |
| 45 to 54 Years | 249 (36.1%) | 397 (57.5%) |
| 55 to 64 Years | 391 (32.4%) | 812 (67.3%) |
| 65 to 74 Years | 1,217 (98.1%) | 499 (40.2%) |
| 75 Years and over | 952 (99.7%) | 413 (43.2%) |
| Total | 4,093 (60.7%) | 3,356 (49.7%) |
Disability Status by Sex by Age in Huerfano County
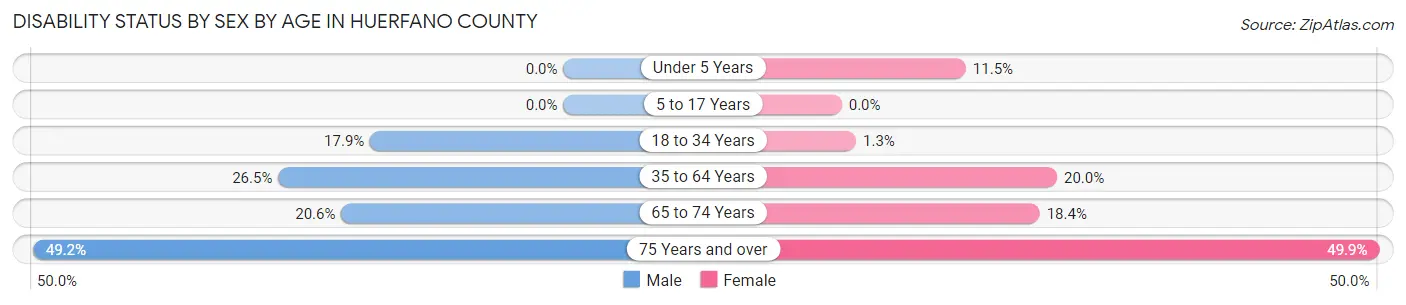
| Age Bracket | Male | Female |
| Under 5 Years | 0 (0.0%) | 19 (11.5%) |
| 5 to 17 Years | 0 (0.0%) | 0 (0.0%) |
| 18 to 34 Years | 102 (17.9%) | 7 (1.3%) |
| 35 to 64 Years | 299 (26.5%) | 247 (20.0%) |
| 65 to 74 Years | 129 (20.6%) | 113 (18.4%) |
| 75 Years and over | 258 (49.2%) | 215 (49.9%) |
Disability Class by Sex by Age in Huerfano County
Disability Class: Hearing Difficulty

| Age Bracket | Male | Female |
| Under 5 Years | 0 (0.0%) | 19 (11.5%) |
| 5 to 17 Years | 0 (0.0%) | 0 (0.0%) |
| 18 to 34 Years | 8 (1.4%) | 0 (0.0%) |
| 35 to 64 Years | 59 (5.2%) | 10 (0.8%) |
| 65 to 74 Years | 84 (13.4%) | 36 (5.9%) |
| 75 Years and over | 195 (37.2%) | 36 (8.4%) |
Disability Class: Vision Difficulty
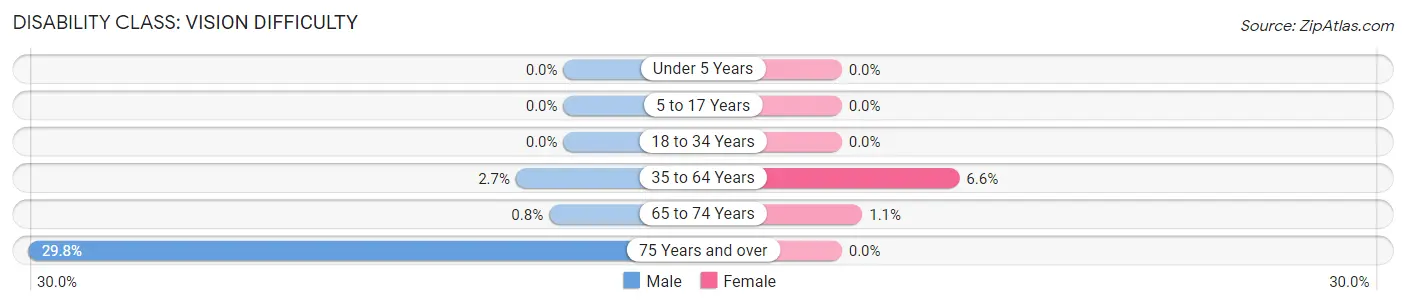
| Age Bracket | Male | Female |
| Under 5 Years | 0 (0.0%) | 0 (0.0%) |
| 5 to 17 Years | 0 (0.0%) | 0 (0.0%) |
| 18 to 34 Years | 0 (0.0%) | 0 (0.0%) |
| 35 to 64 Years | 30 (2.6%) | 81 (6.6%) |
| 65 to 74 Years | 5 (0.8%) | 7 (1.1%) |
| 75 Years and over | 156 (29.8%) | 0 (0.0%) |
Disability Class: Cognitive Difficulty
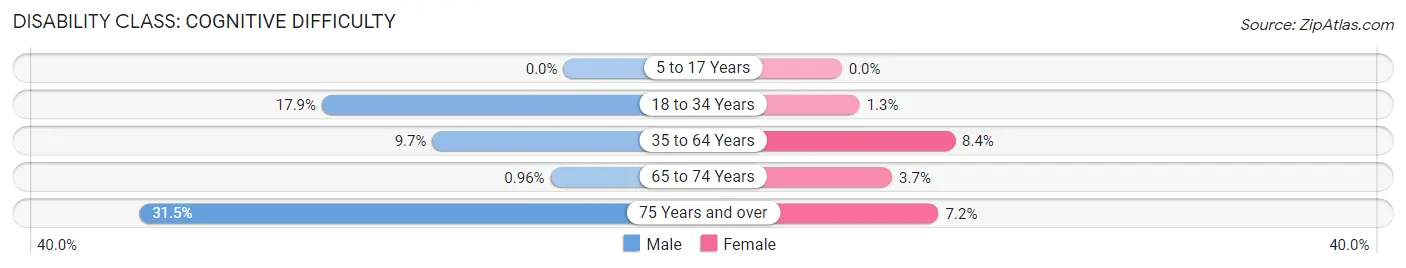
| Age Bracket | Male | Female |
| 5 to 17 Years | 0 (0.0%) | 0 (0.0%) |
| 18 to 34 Years | 102 (17.9%) | 7 (1.3%) |
| 35 to 64 Years | 110 (9.7%) | 104 (8.4%) |
| 65 to 74 Years | 6 (1.0%) | 23 (3.7%) |
| 75 Years and over | 165 (31.5%) | 31 (7.2%) |
Disability Class: Ambulatory Difficulty
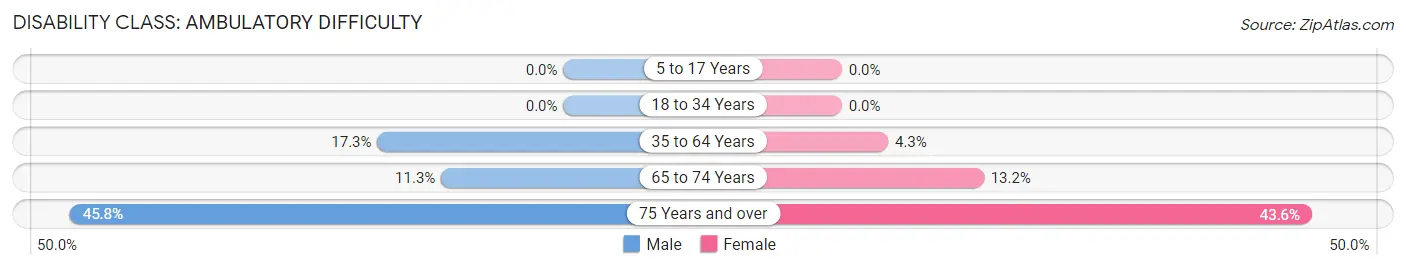
| Age Bracket | Male | Female |
| 5 to 17 Years | 0 (0.0%) | 0 (0.0%) |
| 18 to 34 Years | 0 (0.0%) | 0 (0.0%) |
| 35 to 64 Years | 195 (17.3%) | 53 (4.3%) |
| 65 to 74 Years | 71 (11.3%) | 81 (13.2%) |
| 75 Years and over | 240 (45.8%) | 188 (43.6%) |
Disability Class: Self-Care Difficulty
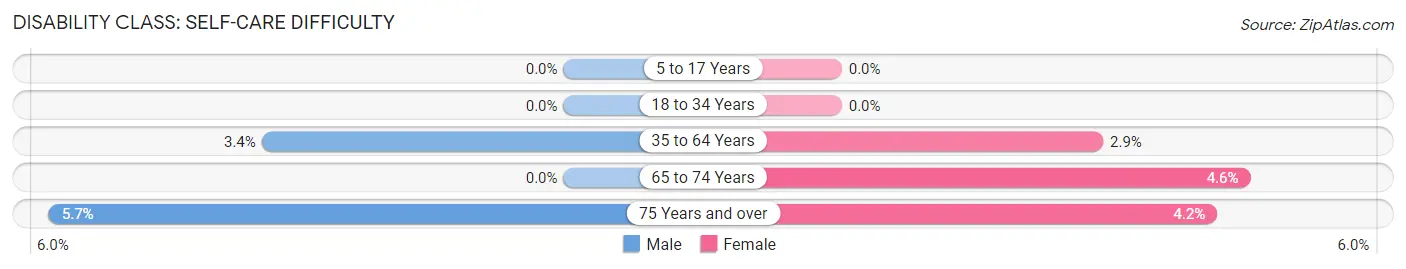
| Age Bracket | Male | Female |
| 5 to 17 Years | 0 (0.0%) | 0 (0.0%) |
| 18 to 34 Years | 0 (0.0%) | 0 (0.0%) |
| 35 to 64 Years | 38 (3.4%) | 36 (2.9%) |
| 65 to 74 Years | 0 (0.0%) | 28 (4.5%) |
| 75 Years and over | 30 (5.7%) | 18 (4.2%) |
Technology Access in Huerfano County
Computing Device Access in Huerfano County
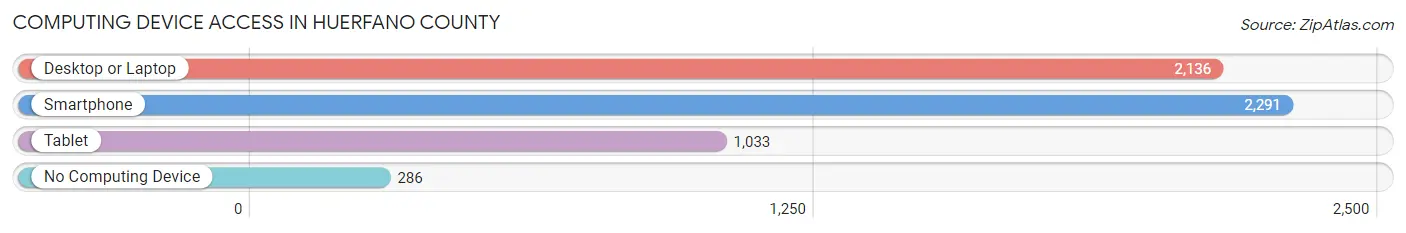
| Device Type | # Households | % Households |
| Desktop or Laptop | 2,136 | 74.2% |
| Smartphone | 2,291 | 79.6% |
| Tablet | 1,033 | 35.9% |
| No Computing Device | 286 | 9.9% |
| Total | 2,877 | 100.0% |
Internet Access in Huerfano County
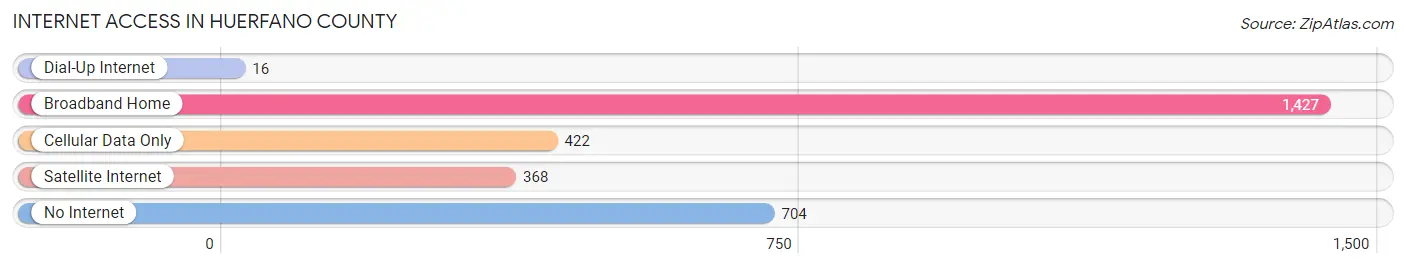
| Internet Type | # Households | % Households |
| Dial-Up Internet | 16 | 0.6% |
| Broadband Home | 1,427 | 49.6% |
| Cellular Data Only | 422 | 14.7% |
| Satellite Internet | 368 | 12.8% |
| No Internet | 704 | 24.5% |
| Total | 2,877 | 100.0% |
Huerfano County Summary
Huerfano County is located in the south-central region of Colorado, and is part of the San Luis Valley. It is bordered by Las Animas County to the north, Costilla County to the east, Custer County to the south, and Pueblo County to the west. The county seat is Walsenburg, and the county has a total area of 1,591 square miles.
History
Huerfano County was established in 1861 as one of the original 17 counties of the Colorado Territory. The county was named for the Spanish word for “orphan”, as it was the only county in the territory without a mountain range. The county was originally inhabited by the Ute and Apache tribes, and was later settled by Spanish and Mexican settlers.
The first permanent settlement in the county was established in 1858 by a group of miners from New Mexico. The settlement was named Walsenburg, after the Spanish explorer Francisco Vásquez de Coronado. The town quickly grew, and by the 1870s it was the largest town in the county.
The county experienced a period of rapid growth in the late 19th century, as miners flocked to the area in search of gold, silver, and coal. The coal mining industry was particularly important to the county’s economy, and by the early 20th century, Huerfano County was the largest coal-producing county in the state.
Geography
Huerfano County is located in the south-central region of Colorado, and is part of the San Luis Valley. The county is bordered by Las Animas County to the north, Costilla County to the east, Custer County to the south, and Pueblo County to the west. The county has a total area of 1,591 square miles, and is located at an elevation of 7,000 feet.
The county is mostly mountainous, with the Sangre de Cristo Mountains to the east and the San Juan Mountains to the west. The county is also home to several rivers, including the Huerfano River, the Cucharas River, and the Purgatoire River.
Economy
Huerfano County’s economy is largely based on agriculture and tourism. The county is home to several large farms, which produce a variety of crops, including potatoes, alfalfa, and hay. The county is also home to several wineries, which produce a variety of wines.
Tourism is also an important part of the county’s economy. The county is home to several popular attractions, including the Lathrop State Park, the Spanish Peaks, and the Huerfano River. The county is also home to several ski resorts, which attract visitors from all over the world.
Demographics
As of the 2010 census, Huerfano County had a population of 6,711. The county’s population is largely Hispanic, with over 70% of the population identifying as Hispanic or Latino. The county’s median household income is $37,945, and the median age is 38.7 years. The county’s poverty rate is 18.3%, and the unemployment rate is 6.2%.
Common Questions
What is Per Capita Income in Huerfano County?
Per Capita income in Huerfano County is $29,508.
What is the Median Family Income in Huerfano County?
Median Family Income in Huerfano County is $65,211.
What is the Median Household income in Huerfano County?
Median Household Income in Huerfano County is $49,631.
What is Income or Wage Gap in Huerfano County?
Income or Wage Gap in Huerfano County is 24.5%.
Women in Huerfano County earn 75.5 cents for every dollar earned by a man.
What is Family Income Deficit in Huerfano County?
Family Income Deficit in Huerfano County is $9,010.
Families that are below poverty line in Huerfano County earn $9,010 less on average than the poverty threshold level.
What is Inequality or Gini Index in Huerfano County?
Inequality or Gini Index in Huerfano County is 0.45.
What is the Total Population of Huerfano County?
Total Population of Huerfano County is 6,896.
What is the Total Male Population of Huerfano County?
Total Male Population of Huerfano County is 3,607.
What is the Total Female Population of Huerfano County?
Total Female Population of Huerfano County is 3,289.
What is the Ratio of Males per 100 Females in Huerfano County?
There are 109.67 Males per 100 Females in Huerfano County.
What is the Ratio of Females per 100 Males in Huerfano County?
There are 91.18 Females per 100 Males in Huerfano County.
What is the Median Population Age in Huerfano County?
Median Population Age in Huerfano County is 55.4 Years.
What is the Average Family Size in Huerfano County
Average Family Size in Huerfano County is 3.0 People.
What is the Average Household Size in Huerfano County
Average Household Size in Huerfano County is 2.3 People.
How Large is the Labor Force in Huerfano County?
There are 2,672 People in the Labor Forcein in Huerfano County.
What is the Percentage of People in the Labor Force in Huerfano County?
44.6% of People are in the Labor Force in Huerfano County.
What is the Unemployment Rate in Huerfano County?
Unemployment Rate in Huerfano County is 6.4%.