Hinsdale County, CO Map & Demographics
Hinsdale County Map
Hinsdale County Overview
$46,944
PER CAPITA INCOME
$73,977
AVG FAMILY INCOME
$58,712
AVG HOUSEHOLD INCOME
37.0%
WAGE / INCOME GAP [ % ]
63.0¢/ $1
WAGE / INCOME GAP [ $ ]
0.45
INEQUALITY / GINI INDEX
911
TOTAL POPULATION
425
MALE POPULATION
486
FEMALE POPULATION
87.45
MALES / 100 FEMALES
114.35
FEMALES / 100 MALES
56.9
MEDIAN AGE
2.3
AVG FAMILY SIZE
1.9
AVG HOUSEHOLD SIZE
423
LABOR FORCE [ PEOPLE ]
51.6%
PERCENT IN LABOR FORCE
1.9%
UNEMPLOYMENT RATE
Hinsdale County Area Codes
Income in Hinsdale County
Income Overview in Hinsdale County
Per Capita Income in Hinsdale County is $46,944, while median incomes of families and households are $73,977 and $58,712 respectively.
| Characteristic | Number | Measure |
| Per Capita Income | 911 | $46,944 |
| Median Family Income | 311 | $73,977 |
| Mean Family Income | 311 | $109,779 |
| Median Household Income | 478 | $58,712 |
| Mean Household Income | 478 | $86,692 |
| Income Deficit | 311 | $0 |
| Wage / Income Gap (%) | 911 | 37.01% |
| Wage / Income Gap ($) | 911 | 62.99¢ per $1 |
| Gini / Inequality Index | 911 | 0.45 |
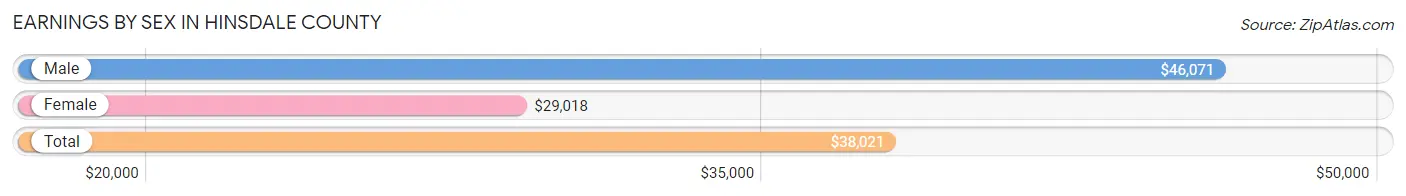
Earnings by Sex in Hinsdale County
Average Earnings in Hinsdale County are $38,021, $46,071 for men and $29,018 for women, a difference of 37.0%.
| Sex | Number | Average Earnings |
| Male | 252 (53.7%) | $46,071 |
| Female | 217 (46.3%) | $29,018 |
| Total | 469 (100.0%) | $38,021 |
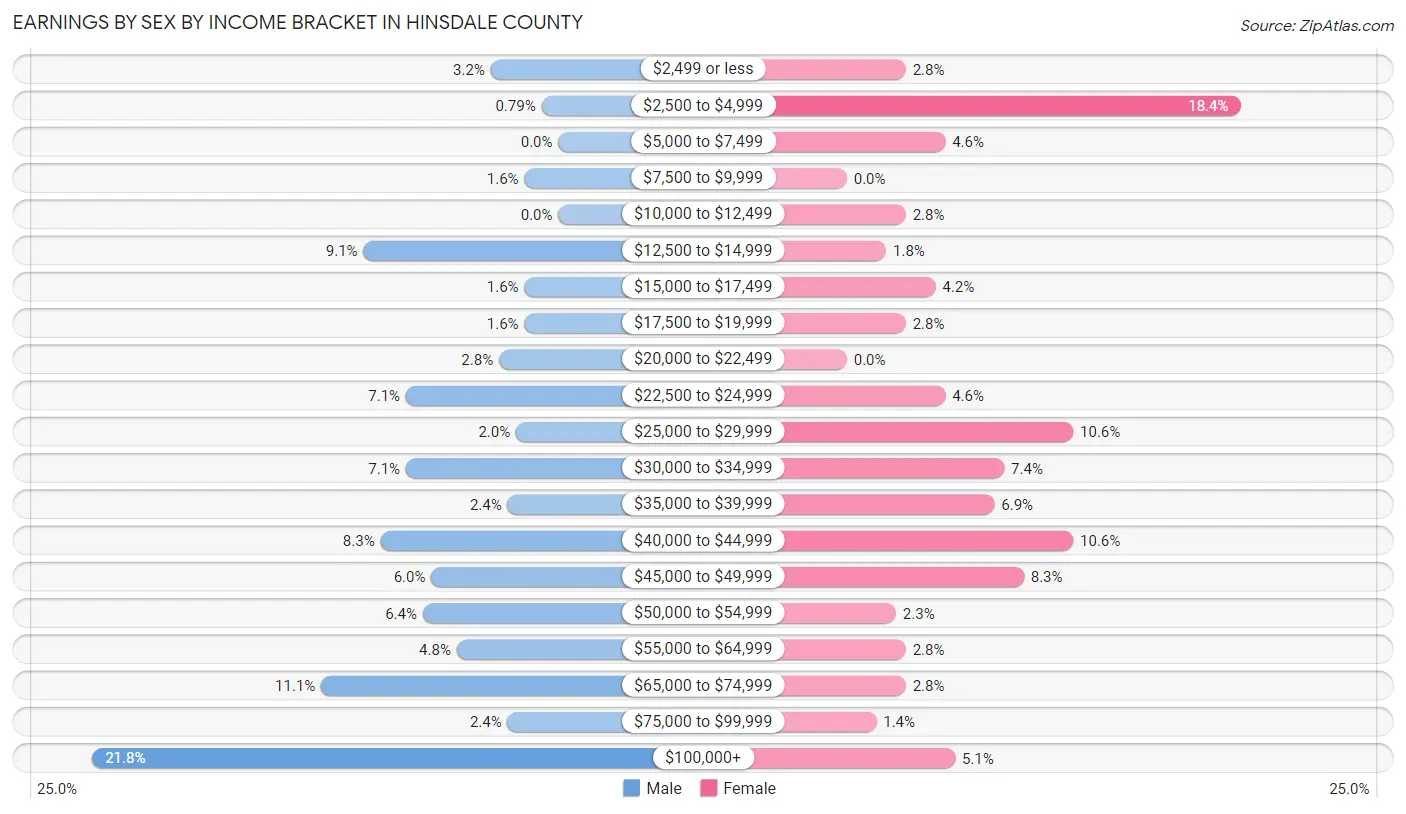
Earnings by Sex by Income Bracket in Hinsdale County
The most common earnings brackets in Hinsdale County are $100,000+ for men (55 | 21.8%) and $2,500 to $4,999 for women (40 | 18.4%).
| Income | Male | Female |
| $2,499 or less | 8 (3.2%) | 6 (2.8%) |
| $2,500 to $4,999 | 2 (0.8%) | 40 (18.4%) |
| $5,000 to $7,499 | 0 (0.0%) | 10 (4.6%) |
| $7,500 to $9,999 | 4 (1.6%) | 0 (0.0%) |
| $10,000 to $12,499 | 0 (0.0%) | 6 (2.8%) |
| $12,500 to $14,999 | 23 (9.1%) | 4 (1.8%) |
| $15,000 to $17,499 | 4 (1.6%) | 9 (4.2%) |
| $17,500 to $19,999 | 4 (1.6%) | 6 (2.8%) |
| $20,000 to $22,499 | 7 (2.8%) | 0 (0.0%) |
| $22,500 to $24,999 | 18 (7.1%) | 10 (4.6%) |
| $25,000 to $29,999 | 5 (2.0%) | 23 (10.6%) |
| $30,000 to $34,999 | 18 (7.1%) | 16 (7.4%) |
| $35,000 to $39,999 | 6 (2.4%) | 15 (6.9%) |
| $40,000 to $44,999 | 21 (8.3%) | 23 (10.6%) |
| $45,000 to $49,999 | 15 (5.9%) | 18 (8.3%) |
| $50,000 to $54,999 | 16 (6.4%) | 5 (2.3%) |
| $55,000 to $64,999 | 12 (4.8%) | 6 (2.8%) |
| $65,000 to $74,999 | 28 (11.1%) | 6 (2.8%) |
| $75,000 to $99,999 | 6 (2.4%) | 3 (1.4%) |
| $100,000+ | 55 (21.8%) | 11 (5.1%) |
| Total | 252 (100.0%) | 217 (100.0%) |
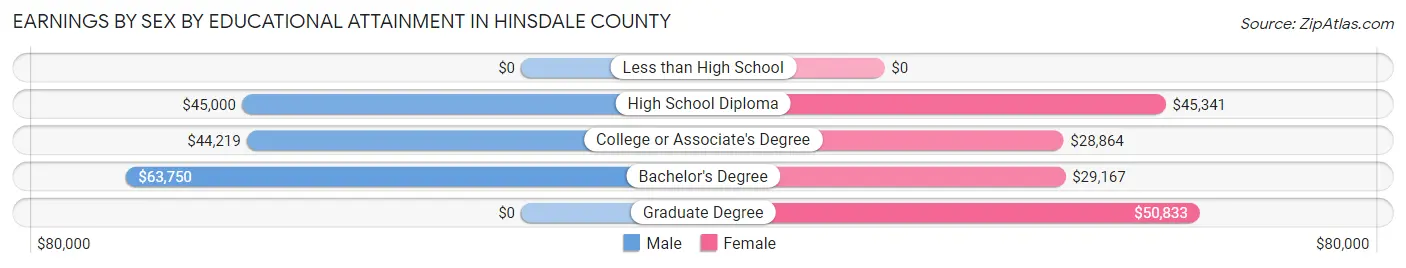
Earnings by Sex by Educational Attainment in Hinsdale County
Average earnings in Hinsdale County are $47,411 for men and $29,554 for women, a difference of 37.7%. Men with an educational attainment of bachelor's degree enjoy the highest average annual earnings of $63,750, while those with college or associate's degree education earn the least with $44,219. Women with an educational attainment of graduate degree earn the most with the average annual earnings of $50,833, while those with college or associate's degree education have the smallest earnings of $28,864.
| Educational Attainment | Male Income | Female Income |
| Less than High School | - | - |
| High School Diploma | $45,000 | $45,341 |
| College or Associate's Degree | $44,219 | $28,864 |
| Bachelor's Degree | $63,750 | $29,167 |
| Graduate Degree | - | - |
| Total | $47,411 | $29,554 |
Family Income in Hinsdale County
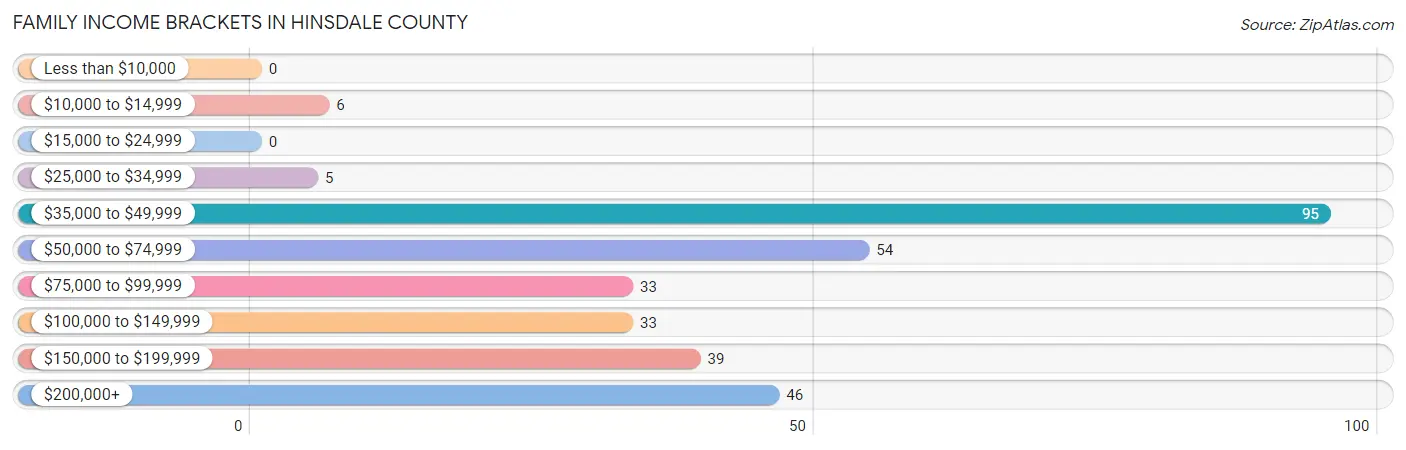
Family Income Brackets in Hinsdale County
According to the Hinsdale County family income data, there are 95 families falling into the $35,000 to $49,999 income range, which is the most common income bracket and makes up 30.5% of all families.
| Income Bracket | # Families | % Families |
| Less than $10,000 | 0 | 0.0% |
| $10,000 to $14,999 | 6 | 1.9% |
| $15,000 to $24,999 | 0 | 0.0% |
| $25,000 to $34,999 | 5 | 1.6% |
| $35,000 to $49,999 | 95 | 30.5% |
| $50,000 to $74,999 | 54 | 17.4% |
| $75,000 to $99,999 | 33 | 10.6% |
| $100,000 to $149,999 | 33 | 10.6% |
| $150,000 to $199,999 | 39 | 12.5% |
| $200,000+ | 46 | 14.8% |
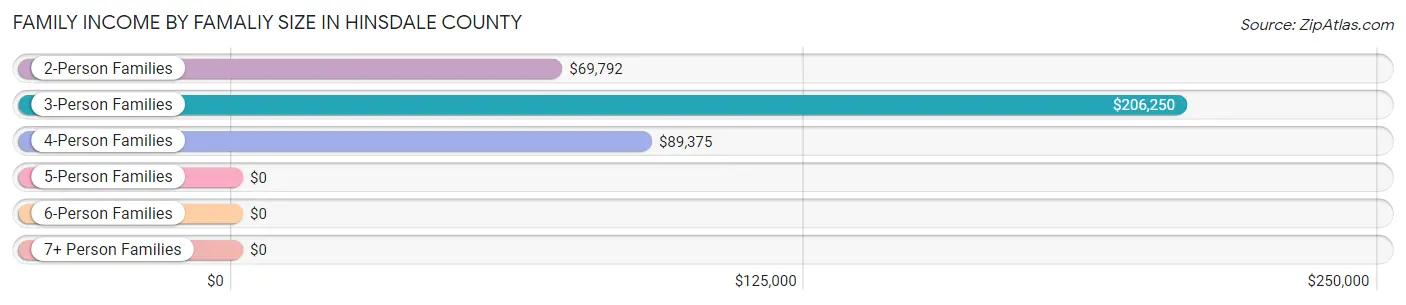
Family Income by Famaliy Size in Hinsdale County
3-person families (21 | 6.8%) account for the highest median family income in Hinsdale County with $206,250 per family, while 3-person families (21 | 6.8%) have the highest median income of $68,750 per family member.
| Income Bracket | # Families | Median Income |
| 2-Person Families | 261 (83.9%) | $69,792 |
| 3-Person Families | 21 (6.8%) | $206,250 |
| 4-Person Families | 19 (6.1%) | $89,375 |
| 5-Person Families | 7 (2.2%) | $0 |
| 6-Person Families | 3 (1.0%) | $0 |
| 7+ Person Families | 0 (0.0%) | $0 |
| Total | 311 (100.0%) | $73,977 |
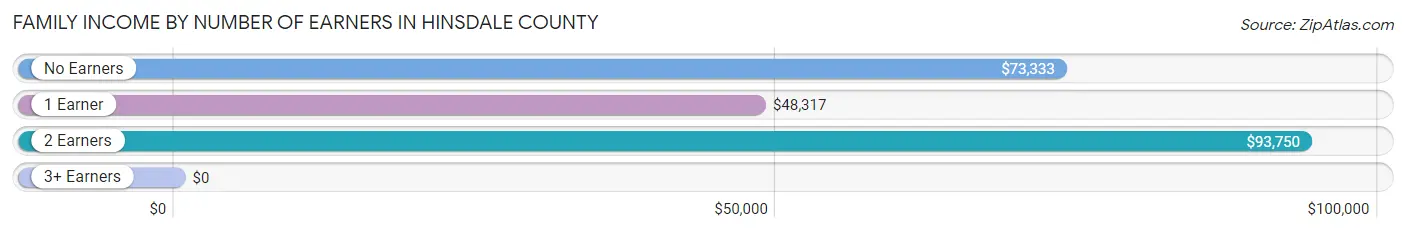
Family Income by Number of Earners in Hinsdale County
| Number of Earners | # Families | Median Income |
| No Earners | 94 (30.2%) | $73,333 |
| 1 Earner | 103 (33.1%) | $48,317 |
| 2 Earners | 104 (33.4%) | $93,750 |
| 3+ Earners | 10 (3.2%) | $0 |
| Total | 311 (100.0%) | $73,977 |
Household Income in Hinsdale County
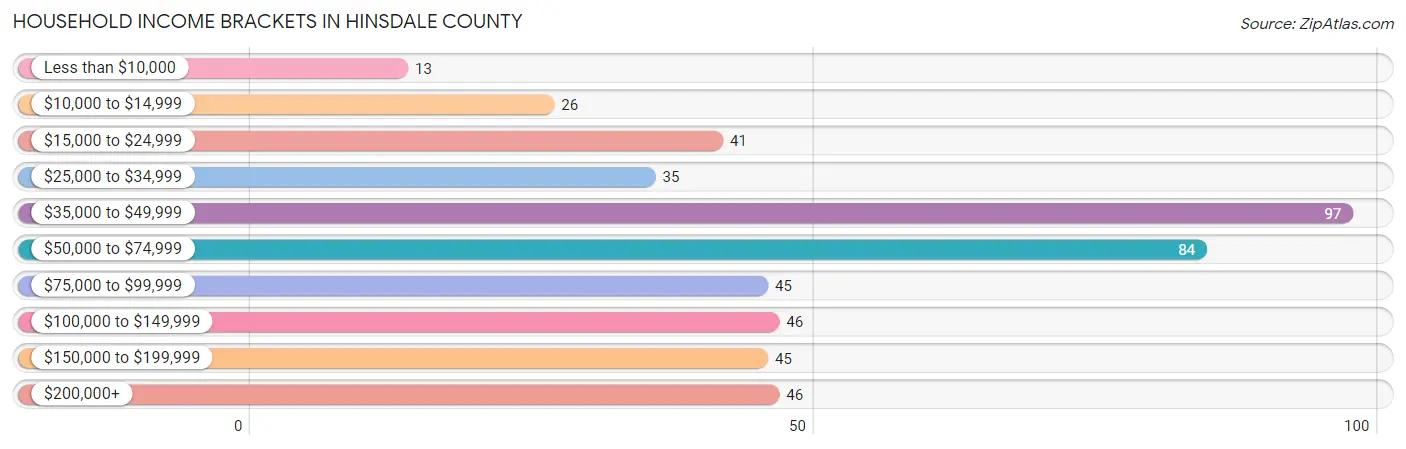
Household Income Brackets in Hinsdale County
With 97 households falling in the category, the $35,000 to $49,999 income range is the most frequent in Hinsdale County, accounting for 20.3% of all households. In contrast, only 13 households (2.7%) fall into the less than $10,000 income bracket, making it the least populous group.
| Income Bracket | # Households | % Households |
| Less than $10,000 | 13 | 2.7% |
| $10,000 to $14,999 | 26 | 5.4% |
| $15,000 to $24,999 | 41 | 8.6% |
| $25,000 to $34,999 | 35 | 7.3% |
| $35,000 to $49,999 | 97 | 20.3% |
| $50,000 to $74,999 | 84 | 17.6% |
| $75,000 to $99,999 | 45 | 9.4% |
| $100,000 to $149,999 | 46 | 9.6% |
| $150,000 to $199,999 | 45 | 9.4% |
| $200,000+ | 46 | 9.6% |
Household Income by Householder Age in Hinsdale County
The median household income in Hinsdale County is $58,712, with the highest median household income of $73,125 found in the 65+ years age bracket for the primary householder. A total of 189 households (39.5%) fall into this category.
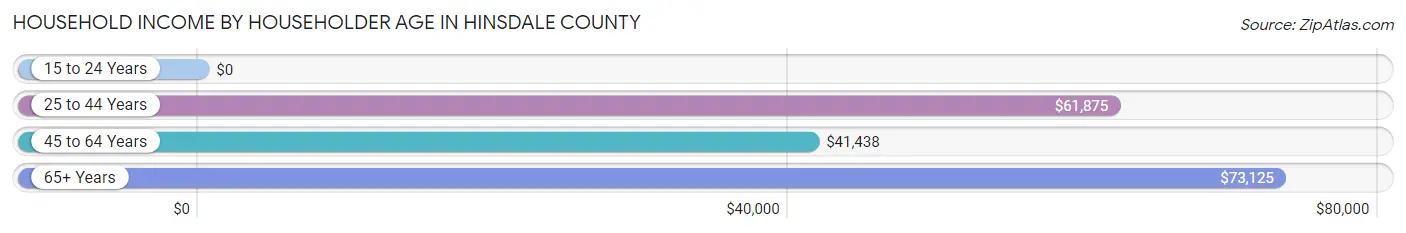
| Income Bracket | # Households | Median Income |
| 15 to 24 Years | 0 (0.0%) | $0 |
| 25 to 44 Years | 99 (20.7%) | $61,875 |
| 45 to 64 Years | 190 (39.8%) | $41,438 |
| 65+ Years | 189 (39.5%) | $73,125 |
| Total | 478 (100.0%) | $58,712 |
Poverty in Hinsdale County
Income Below Poverty by Sex and Age in Hinsdale County
With 6.4% poverty level for males and 8.2% for females among the residents of Hinsdale County, 25 to 34 year old males and 18 to 24 year old females are the most vulnerable to poverty, with 13 males (21.3%) and 7 females (100.0%) in their respective age groups living below the poverty level.
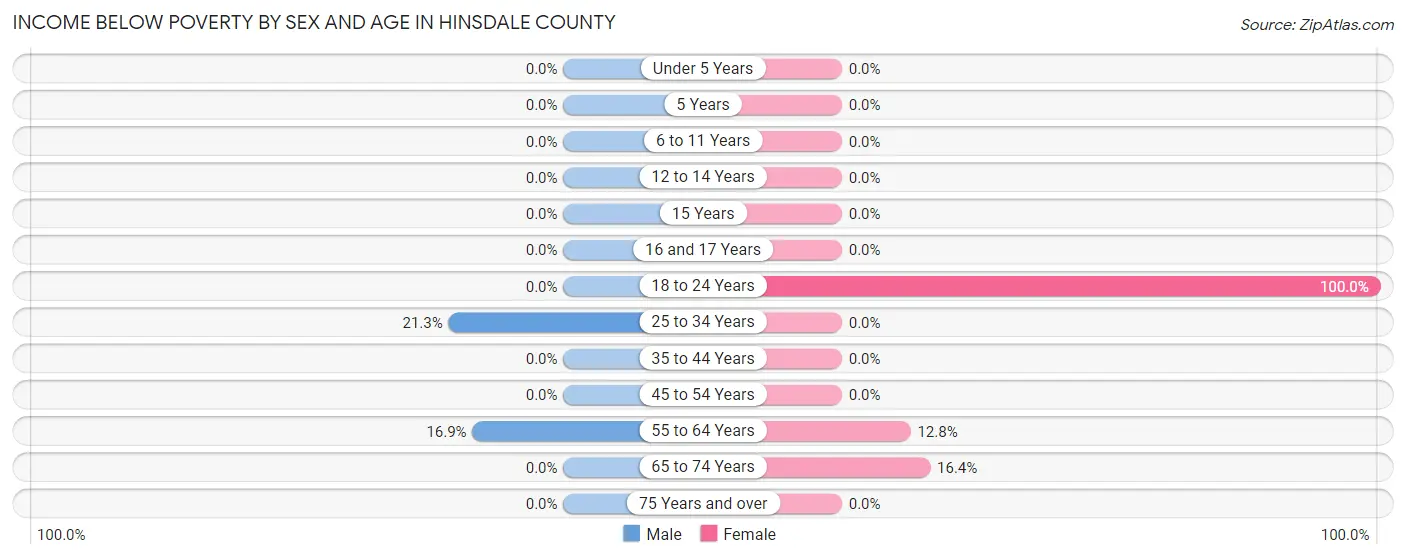
| Age Bracket | Male | Female |
| Under 5 Years | 0 (0.0%) | 0 (0.0%) |
| 5 Years | 0 (0.0%) | 0 (0.0%) |
| 6 to 11 Years | 0 (0.0%) | 0 (0.0%) |
| 12 to 14 Years | 0 (0.0%) | 0 (0.0%) |
| 15 Years | 0 (0.0%) | 0 (0.0%) |
| 16 and 17 Years | 0 (0.0%) | 0 (0.0%) |
| 18 to 24 Years | 0 (0.0%) | 7 (100.0%) |
| 25 to 34 Years | 13 (21.3%) | 0 (0.0%) |
| 35 to 44 Years | 0 (0.0%) | 0 (0.0%) |
| 45 to 54 Years | 0 (0.0%) | 0 (0.0%) |
| 55 to 64 Years | 14 (16.9%) | 13 (12.8%) |
| 65 to 74 Years | 0 (0.0%) | 20 (16.4%) |
| 75 Years and over | 0 (0.0%) | 0 (0.0%) |
| Total | 27 (6.4%) | 40 (8.2%) |
Income Above Poverty by Sex and Age in Hinsdale County
According to the poverty statistics in Hinsdale County, males aged under 5 years and females aged under 5 years are the age groups that are most secure financially, with 100.0% of males and 100.0% of females in these age groups living above the poverty line.
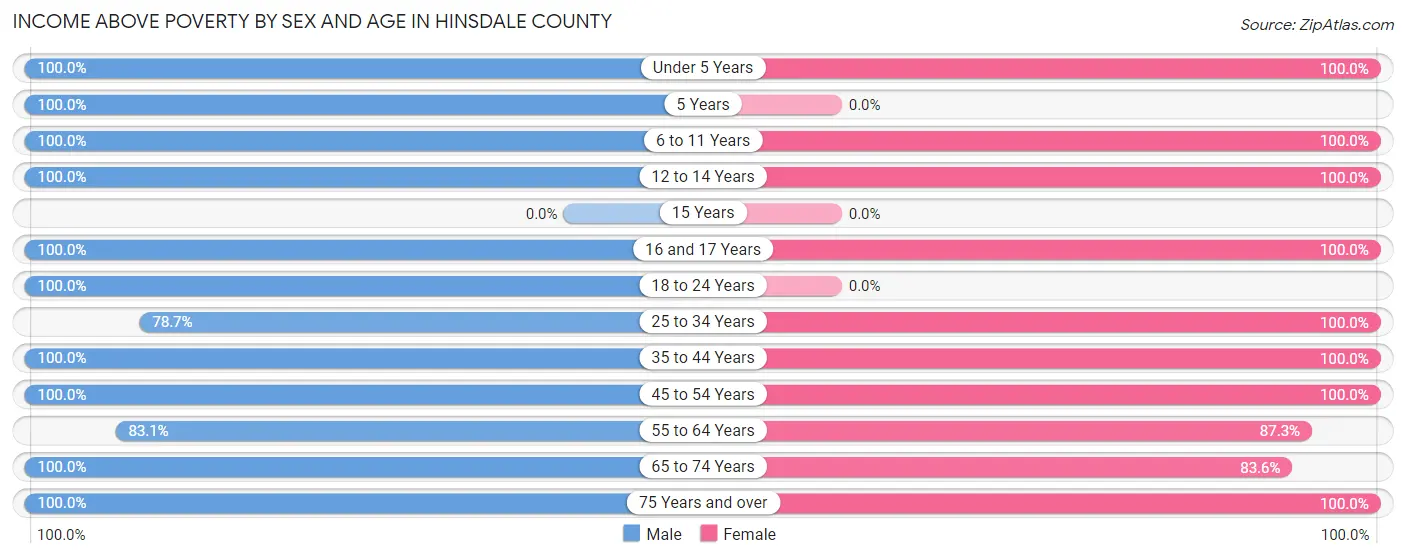
| Age Bracket | Male | Female |
| Under 5 Years | 7 (100.0%) | 16 (100.0%) |
| 5 Years | 18 (100.0%) | 0 (0.0%) |
| 6 to 11 Years | 10 (100.0%) | 25 (100.0%) |
| 12 to 14 Years | 3 (100.0%) | 13 (100.0%) |
| 15 Years | 0 (0.0%) | 0 (0.0%) |
| 16 and 17 Years | 3 (100.0%) | 6 (100.0%) |
| 18 to 24 Years | 16 (100.0%) | 0 (0.0%) |
| 25 to 34 Years | 48 (78.7%) | 49 (100.0%) |
| 35 to 44 Years | 48 (100.0%) | 32 (100.0%) |
| 45 to 54 Years | 30 (100.0%) | 72 (100.0%) |
| 55 to 64 Years | 69 (83.1%) | 89 (87.3%) |
| 65 to 74 Years | 90 (100.0%) | 102 (83.6%) |
| 75 Years and over | 56 (100.0%) | 42 (100.0%) |
| Total | 398 (93.6%) | 446 (91.8%) |
Income Below Poverty Among Married-Couple Families in Hinsdale County
The poverty statistics for married-couple families in Hinsdale County show that 2.4% or 6 of the total 250 families live below the poverty line. Families with no children have the highest poverty rate of 2.8%, comprising of 6 families. On the other hand, families with 1 or 2 children have the lowest poverty rate of 0.0%, which includes 0 families.
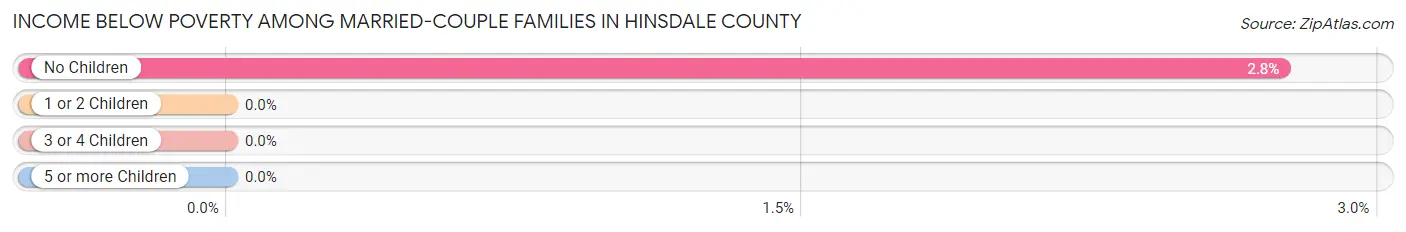
| Children | Above Poverty | Below Poverty |
| No Children | 212 (97.3%) | 6 (2.8%) |
| 1 or 2 Children | 22 (100.0%) | 0 (0.0%) |
| 3 or 4 Children | 10 (100.0%) | 0 (0.0%) |
| 5 or more Children | 0 (0.0%) | 0 (0.0%) |
| Total | 244 (97.6%) | 6 (2.4%) |
Income Below Poverty Among Single-Parent Households in Hinsdale County
| Children | Single Father | Single Mother |
| No Children | 0 (0.0%) | 0 (0.0%) |
| 1 or 2 Children | 0 (0.0%) | 0 (0.0%) |
| 3 or 4 Children | 0 (0.0%) | 0 (0.0%) |
| 5 or more Children | 0 (0.0%) | 0 (0.0%) |
| Total | 0 (0.0%) | 0 (0.0%) |
Income Below Poverty Among Married-Couple vs Single-Parent Households in Hinsdale County
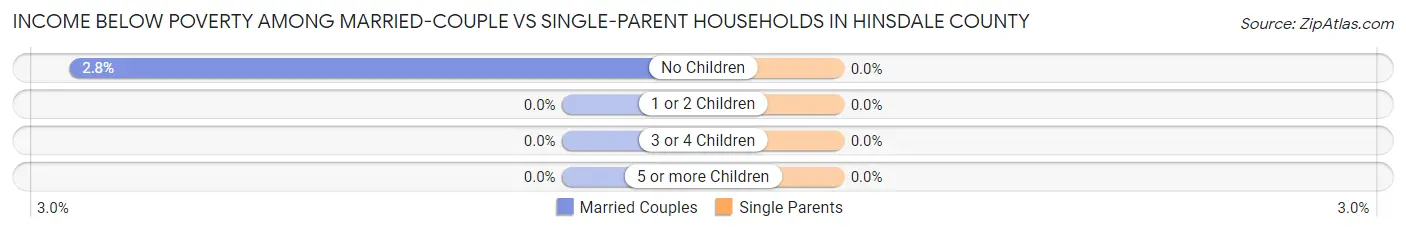
| Children | Married-Couple Families | Single-Parent Households |
| No Children | 6 (2.8%) | 0 (0.0%) |
| 1 or 2 Children | 0 (0.0%) | 0 (0.0%) |
| 3 or 4 Children | 0 (0.0%) | 0 (0.0%) |
| 5 or more Children | 0 (0.0%) | 0 (0.0%) |
| Total | 6 (2.4%) | 0 (0.0%) |
Race in Hinsdale County
The most populous races in Hinsdale County are White / Caucasian (834 | 91.5%), Two or more Races (55 | 6.0%), and Hispanic or Latino (22 | 2.4%).

| Race | # Population | % Population |
| Asian | 1 | 0.1% |
| Black / African American | 9 | 1.0% |
| Hawaiian / Pacific | 0 | 0.0% |
| Hispanic or Latino | 22 | 2.4% |
| Native / Alaskan | 12 | 1.3% |
| White / Caucasian | 834 | 91.5% |
| Two or more Races | 55 | 6.0% |
| Some other Race | 0 | 0.0% |
| Total | 911 | 100.0% |
Ancestry in Hinsdale County
The most populous ancestries reported in Hinsdale County are English (247 | 27.1%), German (232 | 25.5%), Irish (178 | 19.5%), French (77 | 8.5%), and Scottish (71 | 7.8%), together accounting for 88.4% of all Hinsdale County residents.
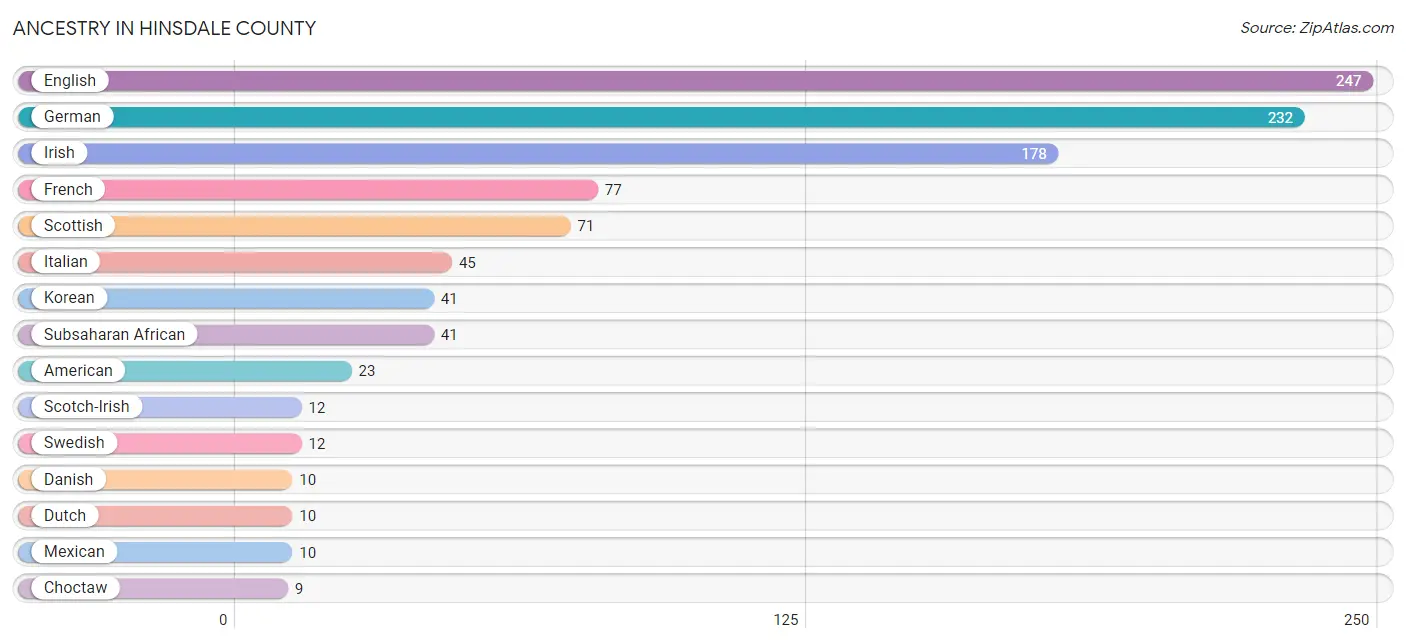
| Ancestry | # Population | % Population |
| American | 23 | 2.5% |
| Apache | 6 | 0.7% |
| Arab | 5 | 0.5% |
| Canadian | 6 | 0.7% |
| Cherokee | 3 | 0.3% |
| Choctaw | 9 | 1.0% |
| Czech | 4 | 0.4% |
| Danish | 10 | 1.1% |
| Dutch | 10 | 1.1% |
| English | 247 | 27.1% |
| European | 7 | 0.8% |
| French | 77 | 8.5% |
| French Canadian | 6 | 0.7% |
| German | 232 | 25.5% |
| Greek | 6 | 0.7% |
| Inupiat | 3 | 0.3% |
| Iraqi | 5 | 0.5% |
| Irish | 178 | 19.5% |
| Italian | 45 | 4.9% |
| Korean | 41 | 4.5% |
| Mexican | 10 | 1.1% |
| Norwegian | 7 | 0.8% |
| Polish | 7 | 0.8% |
| Scandinavian | 2 | 0.2% |
| Scotch-Irish | 12 | 1.3% |
| Scottish | 71 | 7.8% |
| Slavic | 9 | 1.0% |
| Subsaharan African | 41 | 4.5% |
| Swedish | 12 | 1.3% |
| Swiss | 2 | 0.2% |
| Thai | 1 | 0.1% |
| Welsh | 4 | 0.4% | View All 32 Rows |
Immigrants in Hinsdale County
The most numerous immigrant groups reported in Hinsdale County came from Europe (4 | 0.4%), Ireland (4 | 0.4%), Northern Europe (4 | 0.4%), Asia (1 | 0.1%), and India (1 | 0.1%), together accounting for 1.5% of all Hinsdale County residents.
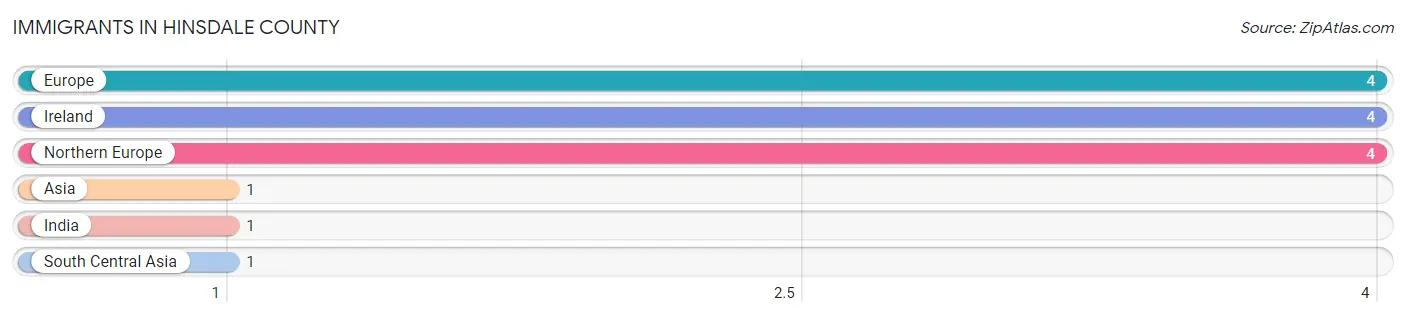
| Immigration Origin | # Population | % Population |
| Asia | 1 | 0.1% |
| Europe | 4 | 0.4% |
| India | 1 | 0.1% |
| Ireland | 4 | 0.4% |
| Northern Europe | 4 | 0.4% |
| South Central Asia | 1 | 0.1% | View All 6 Rows |
Sex and Age in Hinsdale County
Sex and Age in Hinsdale County
The most populous age groups in Hinsdale County are 60 to 64 Years (55 | 12.9%) for men and 65 to 69 Years (67 | 13.8%) for women.
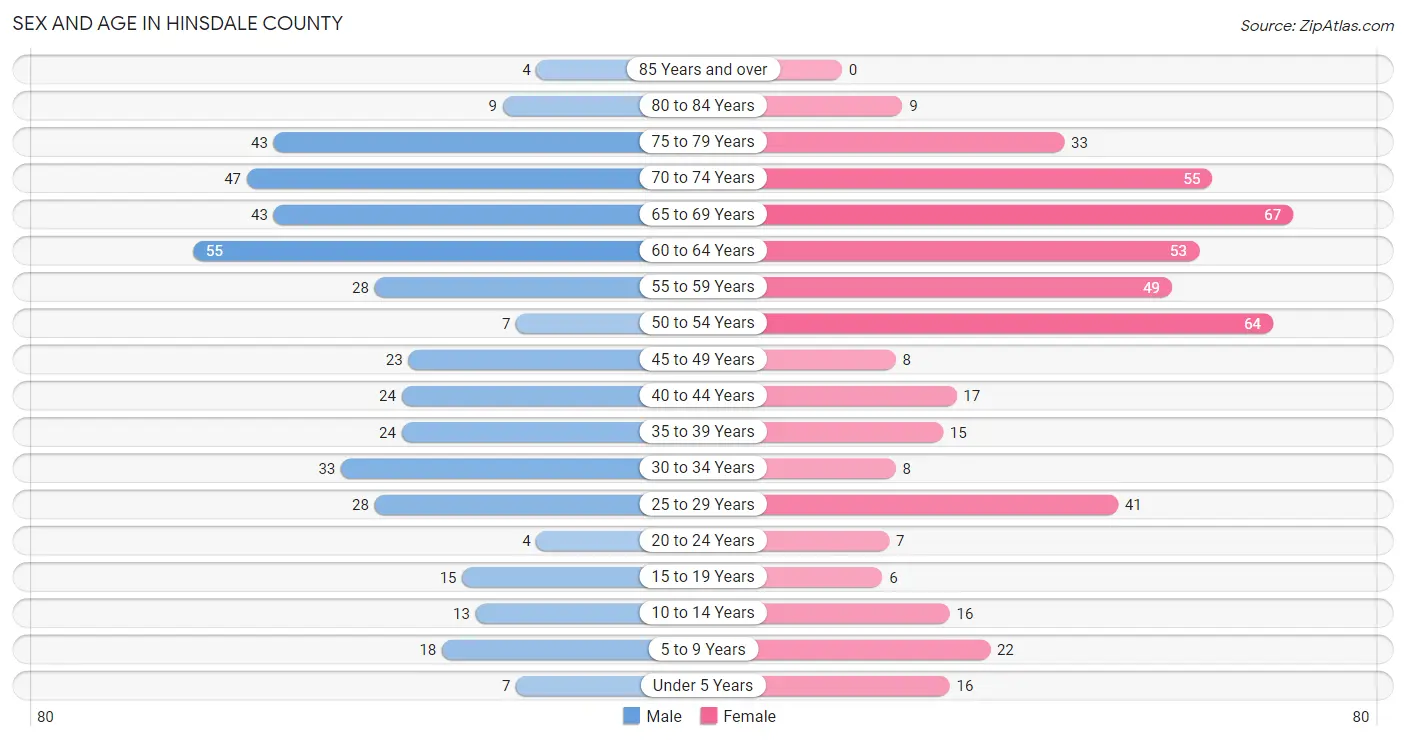
| Age Bracket | Male | Female |
| Under 5 Years | 7 (1.7%) | 16 (3.3%) |
| 5 to 9 Years | 18 (4.2%) | 22 (4.5%) |
| 10 to 14 Years | 13 (3.1%) | 16 (3.3%) |
| 15 to 19 Years | 15 (3.5%) | 6 (1.2%) |
| 20 to 24 Years | 4 (0.9%) | 7 (1.4%) |
| 25 to 29 Years | 28 (6.6%) | 41 (8.4%) |
| 30 to 34 Years | 33 (7.8%) | 8 (1.7%) |
| 35 to 39 Years | 24 (5.7%) | 15 (3.1%) |
| 40 to 44 Years | 24 (5.7%) | 17 (3.5%) |
| 45 to 49 Years | 23 (5.4%) | 8 (1.7%) |
| 50 to 54 Years | 7 (1.7%) | 64 (13.2%) |
| 55 to 59 Years | 28 (6.6%) | 49 (10.1%) |
| 60 to 64 Years | 55 (12.9%) | 53 (10.9%) |
| 65 to 69 Years | 43 (10.1%) | 67 (13.8%) |
| 70 to 74 Years | 47 (11.1%) | 55 (11.3%) |
| 75 to 79 Years | 43 (10.1%) | 33 (6.8%) |
| 80 to 84 Years | 9 (2.1%) | 9 (1.8%) |
| 85 Years and over | 4 (0.9%) | 0 (0.0%) |
| Total | 425 (100.0%) | 486 (100.0%) |
Families and Households in Hinsdale County
Median Family Size in Hinsdale County
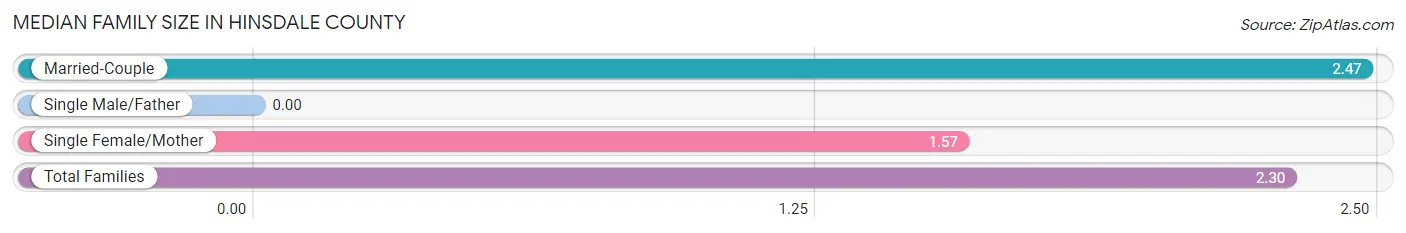
| Family Type | # Families | Family Size |
| Married-Couple | 250 (80.4%) | 2.47 |
| Single Male/Father | 0 (0.0%) | - |
| Single Female/Mother | 61 (19.6%) | 1.57 |
| Total Families | 311 (100.0%) | 2.30 |
Median Household Size in Hinsdale County
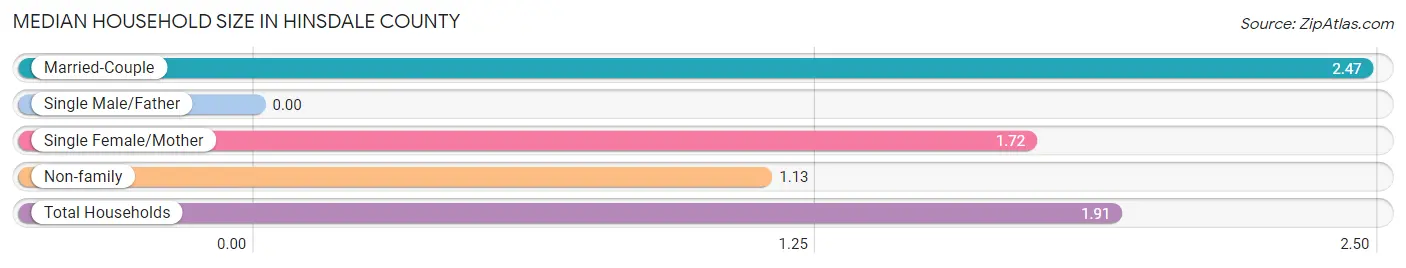
| Household Type | # Households | Household Size |
| Married-Couple | 250 (52.3%) | 2.47 |
| Single Male/Father | 0 (0.0%) | - |
| Single Female/Mother | 61 (12.8%) | 1.72 |
| Non-family | 167 (34.9%) | 1.13 |
| Total Households | 478 (100.0%) | 1.91 |
Household Size by Marriage Status in Hinsdale County
Out of a total of 478 households in Hinsdale County, 311 (65.1%) are family households, while 167 (34.9%) are nonfamily households. The most numerous type of family households are 2-person households, comprising 238, and the most common type of nonfamily households are 1-person households, comprising 139.

| Household Size | Family Households | Nonfamily Households |
| 1-Person Households | - | 139 (29.1%) |
| 2-Person Households | 238 (49.8%) | 28 (5.9%) |
| 3-Person Households | 44 (9.2%) | 0 (0.0%) |
| 4-Person Households | 19 (4.0%) | 0 (0.0%) |
| 5-Person Households | 7 (1.5%) | 0 (0.0%) |
| 6-Person Households | 3 (0.6%) | 0 (0.0%) |
| 7+ Person Households | 0 (0.0%) | 0 (0.0%) |
| Total | 311 (65.1%) | 167 (34.9%) |
Female Fertility in Hinsdale County
Fertility by Age in Hinsdale County
Average fertility rate in Hinsdale County is 29.0 births per 1,000 women. Women in the age bracket of 20 to 34 years have the highest fertility rate with 54.0 births per 1,000 women. Women in the age bracket of 20 to 34 years acount for 100.0% of all women with births.
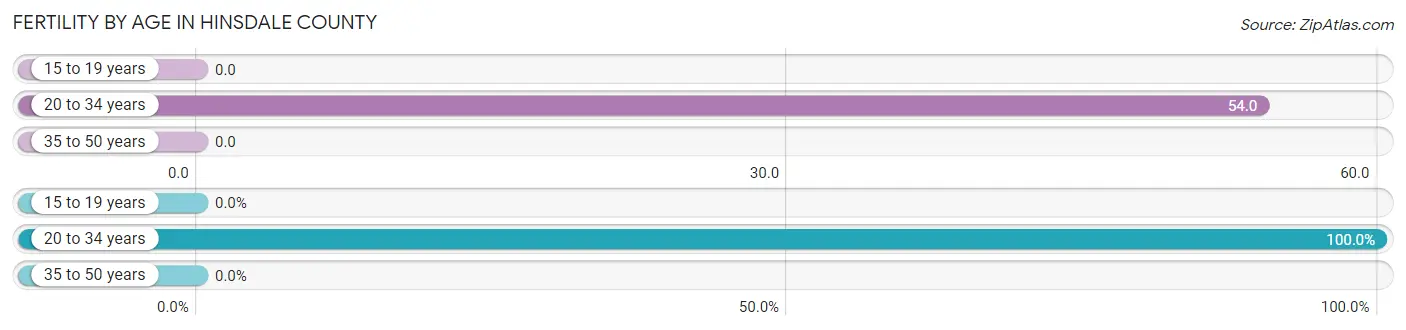
| Age Bracket | Women with Births | Births / 1,000 Women |
| 15 to 19 years | 0 (0.0%) | 0.0 |
| 20 to 34 years | 3 (100.0%) | 54.0 |
| 35 to 50 years | 0 (0.0%) | 0.0 |
| Total | 3 (100.0%) | 29.0 |
Fertility by Age by Marriage Status in Hinsdale County
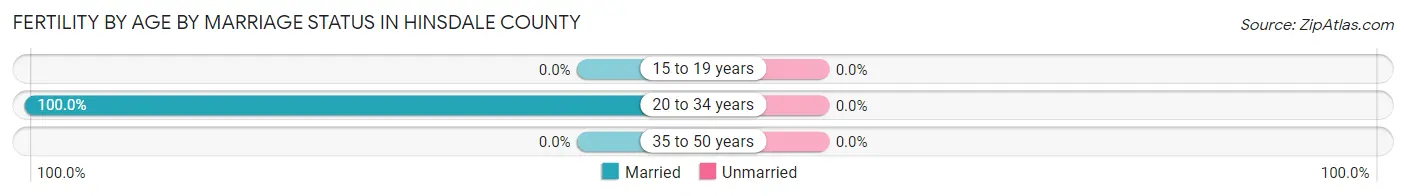
| Age Bracket | Married | Unmarried |
| 15 to 19 years | 0 (0.0%) | 0 (0.0%) |
| 20 to 34 years | 3 (100.0%) | 0 (0.0%) |
| 35 to 50 years | 0 (0.0%) | 0 (0.0%) |
| Total | 3 (100.0%) | 0 (0.0%) |
Fertility by Education in Hinsdale County
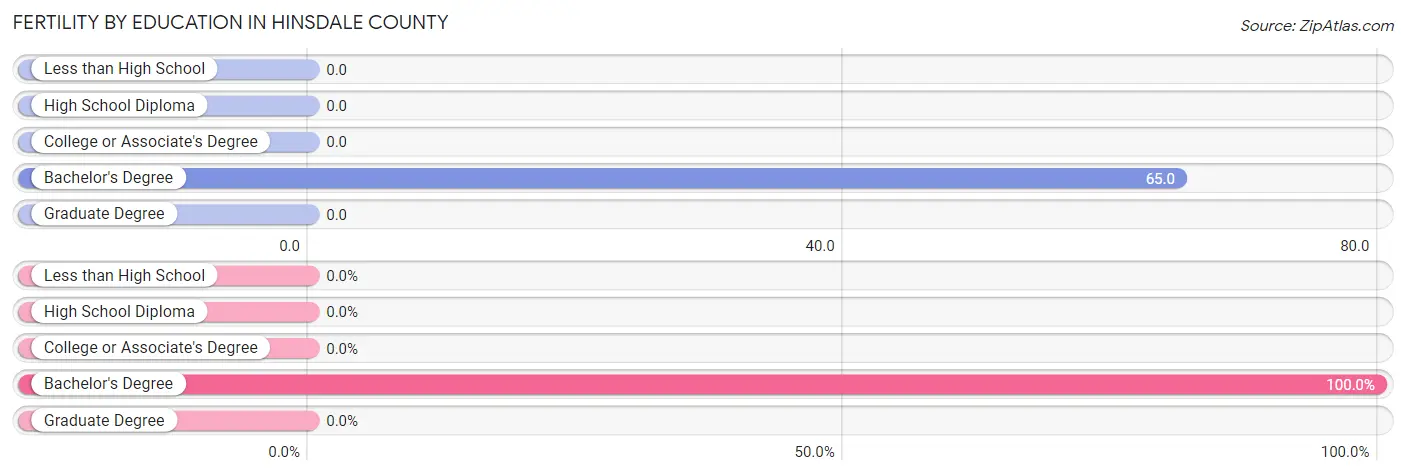
| Educational Attainment | Women with Births | Births / 1,000 Women |
| Less than High School | 0 (0.0%) | 0.0 |
| High School Diploma | 0 (0.0%) | 0.0 |
| College or Associate's Degree | 0 (0.0%) | 0.0 |
| Bachelor's Degree | 3 (100.0%) | 65.0 |
| Graduate Degree | 0 (0.0%) | 0.0 |
| Total | 3 (100.0%) | 29.0 |
Fertility by Education by Marriage Status in Hinsdale County
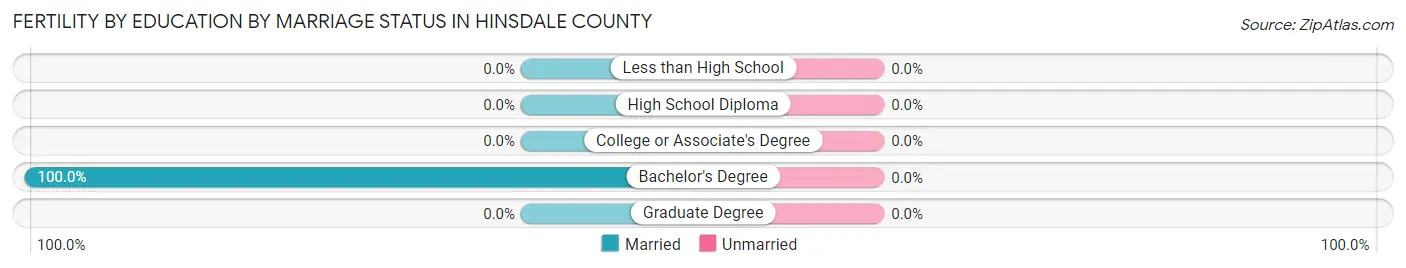
| Educational Attainment | Married | Unmarried |
| Less than High School | 0 (0.0%) | 0 (0.0%) |
| High School Diploma | 0 (0.0%) | 0 (0.0%) |
| College or Associate's Degree | 0 (0.0%) | 0 (0.0%) |
| Bachelor's Degree | 3 (100.0%) | 0 (0.0%) |
| Graduate Degree | 0 (0.0%) | 0 (0.0%) |
| Total | 3 (100.0%) | 0 (0.0%) |
Employment Characteristics in Hinsdale County
Employment by Class of Employer in Hinsdale County
Among the 408 employed individuals in Hinsdale County, private company employees (168 | 41.2%), local government employees (78 | 19.1%), and self-employed (incorporated) (52 | 12.8%) make up the most common classes of employment.
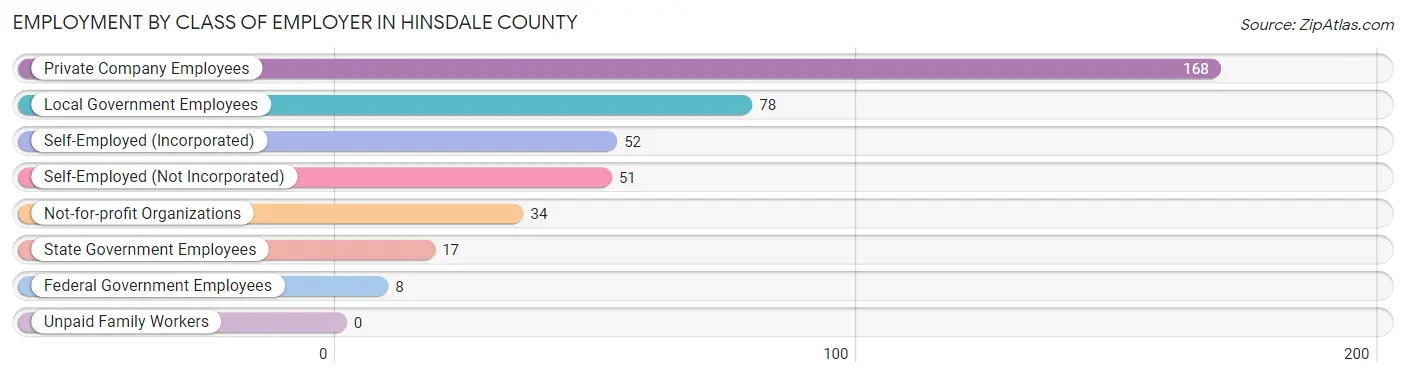
| Employer Class | # Employees | % Employees |
| Private Company Employees | 168 | 41.2% |
| Self-Employed (Incorporated) | 52 | 12.8% |
| Self-Employed (Not Incorporated) | 51 | 12.5% |
| Not-for-profit Organizations | 34 | 8.3% |
| Local Government Employees | 78 | 19.1% |
| State Government Employees | 17 | 4.2% |
| Federal Government Employees | 8 | 2.0% |
| Unpaid Family Workers | 0 | 0.0% |
| Total | 408 | 100.0% |
Employment Status by Age in Hinsdale County
According to the labor force statistics for Hinsdale County, out of the total population over 16 years of age (819), 51.6% or 423 individuals are in the labor force, with 1.9% or 8 of them unemployed. The age group with the highest labor force participation rate is 25 to 29 years, with 100.0% or 69 individuals in the labor force. Within the labor force, the 55 to 59 years age range has the highest percentage of unemployed individuals, with 22.9% or 8 of them being unemployed.
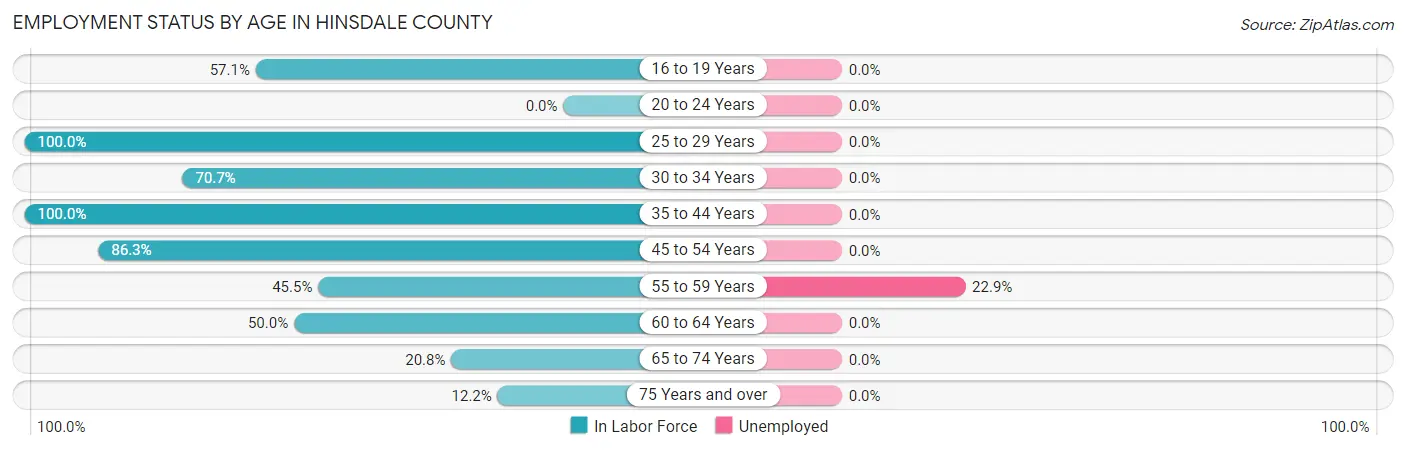
| Age Bracket | In Labor Force | Unemployed |
| 16 to 19 Years | 12 (57.1%) | 0 (0.0%) |
| 20 to 24 Years | 0 (0.0%) | 0 (0.0%) |
| 25 to 29 Years | 69 (100.0%) | 0 (0.0%) |
| 30 to 34 Years | 29 (70.7%) | 0 (0.0%) |
| 35 to 44 Years | 80 (100.0%) | 0 (0.0%) |
| 45 to 54 Years | 88 (86.3%) | 0 (0.0%) |
| 55 to 59 Years | 35 (45.5%) | 8 (22.9%) |
| 60 to 64 Years | 54 (50.0%) | 0 (0.0%) |
| 65 to 74 Years | 44 (20.8%) | 0 (0.0%) |
| 75 Years and over | 12 (12.2%) | 0 (0.0%) |
| Total | 423 (51.6%) | 8 (1.9%) |
Employment Status by Educational Attainment in Hinsdale County
According to labor force statistics for Hinsdale County, 74.4% of individuals (355) out of the total population between 25 and 64 years of age (477) are in the labor force, with 2.3% or 8 of them being unemployed. The group with the highest labor force participation rate are those with the educational attainment of college / associate degree, with 87.8% or 180 individuals in the labor force. Within the labor force, individuals with high school diploma education have the highest percentage of unemployment, with 8.1% or 3 of them being unemployed.

| Educational Attainment | In Labor Force | Unemployed |
| Less than High School | 4 (33.3%) | 0 (0.0%) |
| High School Diploma | 37 (52.9%) | 6 (8.1%) |
| College / Associate Degree | 180 (87.8%) | 0 (0.0%) |
| Bachelor's Degree or higher | 134 (70.5%) | 7 (3.7%) |
| Total | 355 (74.4%) | 11 (2.3%) |
Employment Occupations by Sex in Hinsdale County
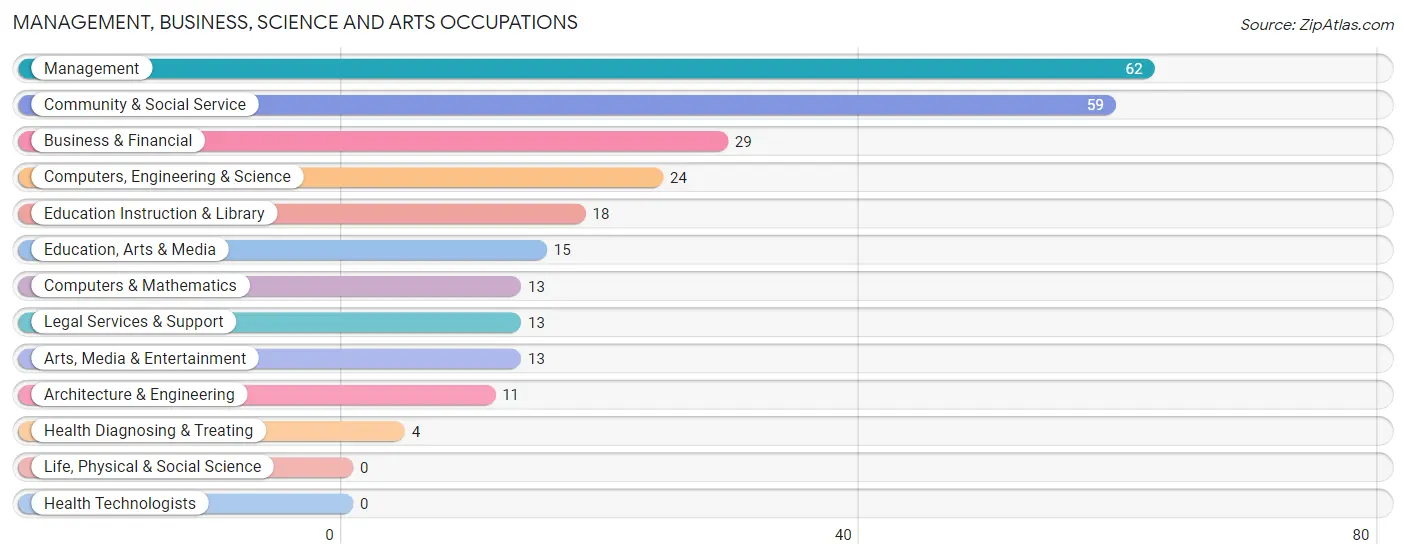
Management, Business, Science and Arts Occupations
The most common Management, Business, Science and Arts occupations in Hinsdale County are Management (62 | 14.9%), Community & Social Service (59 | 14.2%), Business & Financial (29 | 7.0%), Computers, Engineering & Science (24 | 5.8%), and Education Instruction & Library (18 | 4.3%).
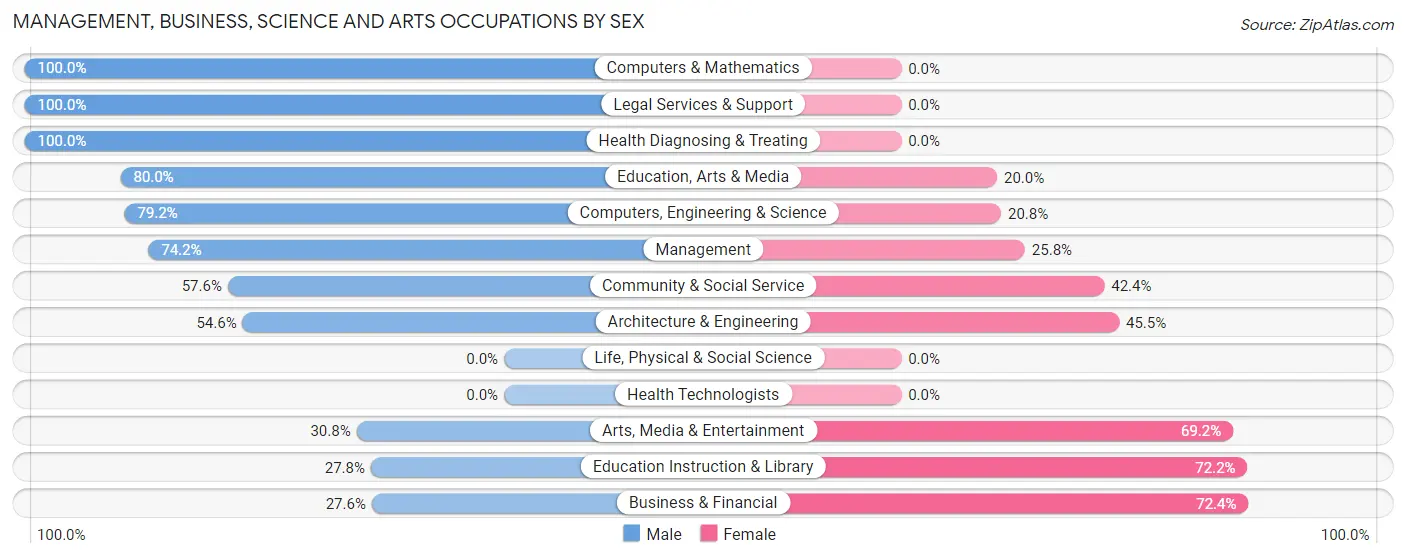
Management, Business, Science and Arts Occupations by Sex
Within the Management, Business, Science and Arts occupations in Hinsdale County, the most male-oriented occupations are Computers & Mathematics (100.0%), Legal Services & Support (100.0%), and Health Diagnosing & Treating (100.0%), while the most female-oriented occupations are Business & Financial (72.4%), Education Instruction & Library (72.2%), and Arts, Media & Entertainment (69.2%).
| Occupation | Male | Female |
| Management | 46 (74.2%) | 16 (25.8%) |
| Business & Financial | 8 (27.6%) | 21 (72.4%) |
| Computers, Engineering & Science | 19 (79.2%) | 5 (20.8%) |
| Computers & Mathematics | 13 (100.0%) | 0 (0.0%) |
| Architecture & Engineering | 6 (54.5%) | 5 (45.5%) |
| Life, Physical & Social Science | 0 (0.0%) | 0 (0.0%) |
| Community & Social Service | 34 (57.6%) | 25 (42.4%) |
| Education, Arts & Media | 12 (80.0%) | 3 (20.0%) |
| Legal Services & Support | 13 (100.0%) | 0 (0.0%) |
| Education Instruction & Library | 5 (27.8%) | 13 (72.2%) |
| Arts, Media & Entertainment | 4 (30.8%) | 9 (69.2%) |
| Health Diagnosing & Treating | 4 (100.0%) | 0 (0.0%) |
| Health Technologists | 0 (0.0%) | 0 (0.0%) |
| Total (Category) | 111 (62.4%) | 67 (37.6%) |
| Total (Overall) | 224 (54.0%) | 191 (46.0%) |
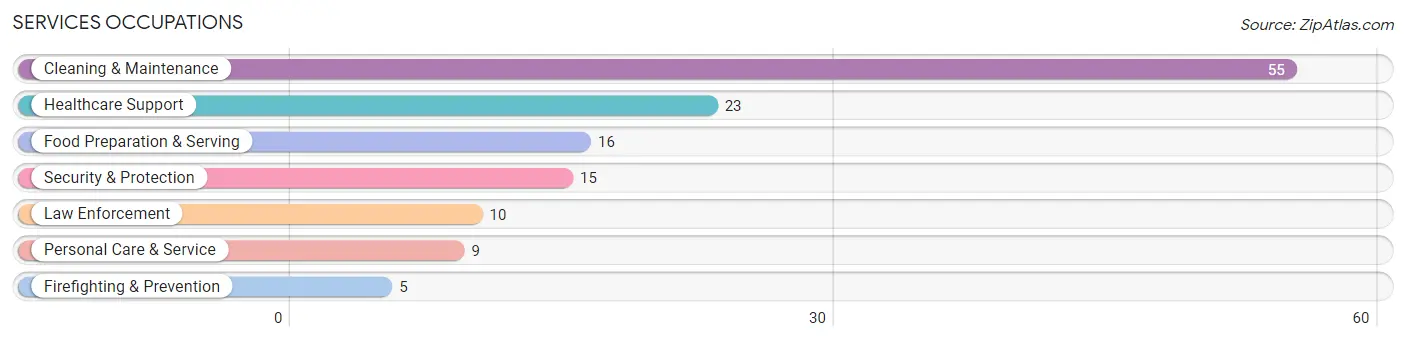
Services Occupations
The most common Services occupations in Hinsdale County are Cleaning & Maintenance (55 | 13.3%), Healthcare Support (23 | 5.5%), Food Preparation & Serving (16 | 3.9%), Security & Protection (15 | 3.6%), and Law Enforcement (10 | 2.4%).
Services Occupations by Sex
Within the Services occupations in Hinsdale County, the most male-oriented occupations are Security & Protection (100.0%), Firefighting & Prevention (100.0%), and Law Enforcement (100.0%), while the most female-oriented occupations are Healthcare Support (100.0%), Cleaning & Maintenance (81.8%), and Food Preparation & Serving (56.2%).
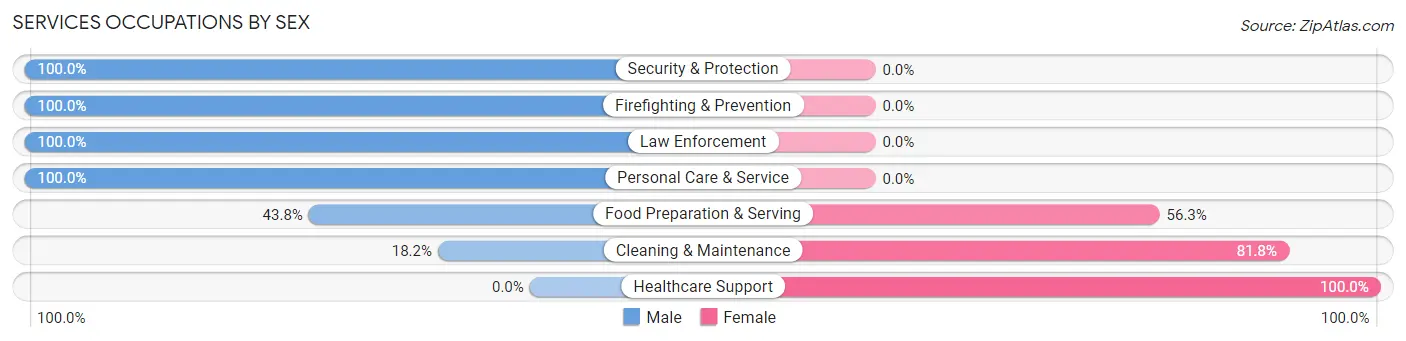
| Occupation | Male | Female |
| Healthcare Support | 0 (0.0%) | 23 (100.0%) |
| Security & Protection | 15 (100.0%) | 0 (0.0%) |
| Firefighting & Prevention | 5 (100.0%) | 0 (0.0%) |
| Law Enforcement | 10 (100.0%) | 0 (0.0%) |
| Food Preparation & Serving | 7 (43.8%) | 9 (56.2%) |
| Cleaning & Maintenance | 10 (18.2%) | 45 (81.8%) |
| Personal Care & Service | 9 (100.0%) | 0 (0.0%) |
| Total (Category) | 41 (34.7%) | 77 (65.2%) |
| Total (Overall) | 224 (54.0%) | 191 (46.0%) |
Sales and Office Occupations
The most common Sales and Office occupations in Hinsdale County are Office & Administration (49 | 11.8%), and Sales & Related (19 | 4.6%).

Sales and Office Occupations by Sex
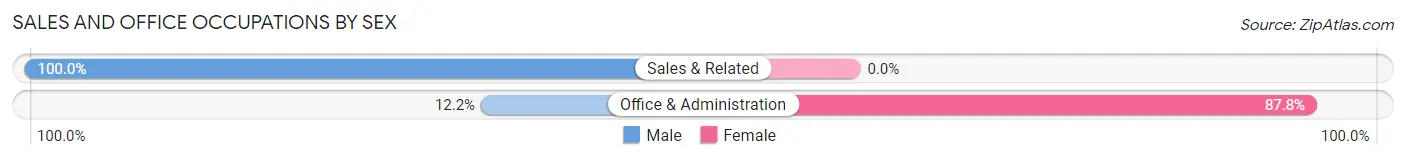
| Occupation | Male | Female |
| Sales & Related | 19 (100.0%) | 0 (0.0%) |
| Office & Administration | 6 (12.2%) | 43 (87.8%) |
| Total (Category) | 25 (36.8%) | 43 (63.2%) |
| Total (Overall) | 224 (54.0%) | 191 (46.0%) |
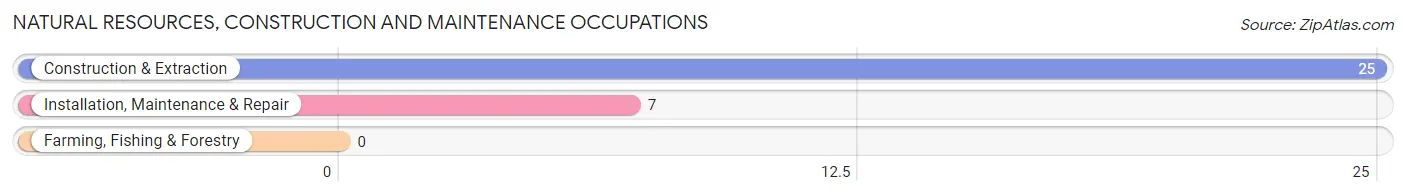
Natural Resources, Construction and Maintenance Occupations
The most common Natural Resources, Construction and Maintenance occupations in Hinsdale County are Construction & Extraction (25 | 6.0%), and Installation, Maintenance & Repair (7 | 1.7%).
Natural Resources, Construction and Maintenance Occupations by Sex
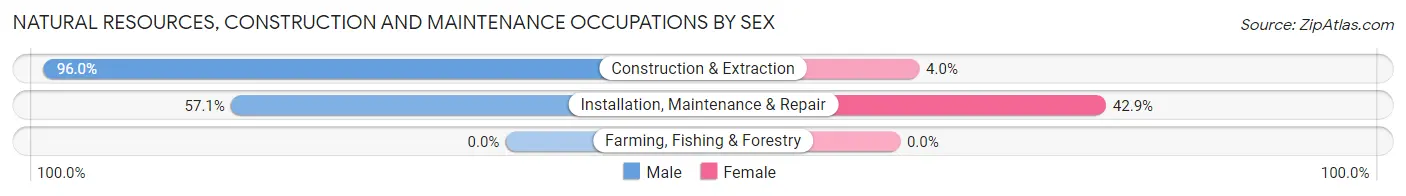
| Occupation | Male | Female |
| Farming, Fishing & Forestry | 0 (0.0%) | 0 (0.0%) |
| Construction & Extraction | 24 (96.0%) | 1 (4.0%) |
| Installation, Maintenance & Repair | 4 (57.1%) | 3 (42.9%) |
| Total (Category) | 28 (87.5%) | 4 (12.5%) |
| Total (Overall) | 224 (54.0%) | 191 (46.0%) |
Production, Transportation and Moving Occupations
The most common Production, Transportation and Moving occupations in Hinsdale County are Material Moving (10 | 2.4%), and Transportation (9 | 2.2%).
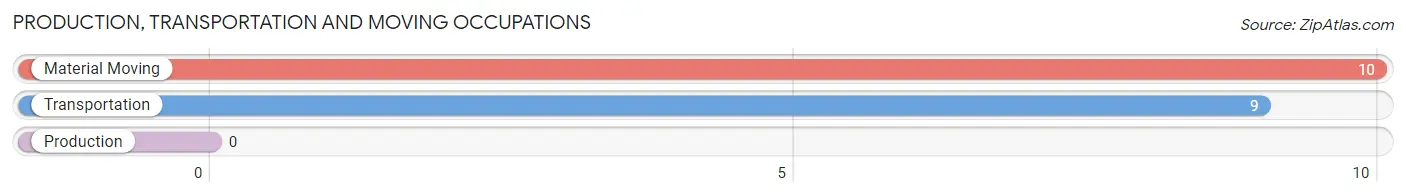
Production, Transportation and Moving Occupations by Sex
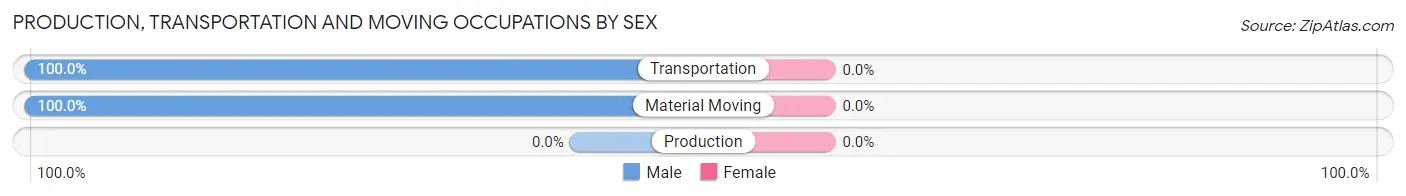
| Occupation | Male | Female |
| Production | 0 (0.0%) | 0 (0.0%) |
| Transportation | 9 (100.0%) | 0 (0.0%) |
| Material Moving | 10 (100.0%) | 0 (0.0%) |
| Total (Category) | 19 (100.0%) | 0 (0.0%) |
| Total (Overall) | 224 (54.0%) | 191 (46.0%) |
Employment Industries by Sex in Hinsdale County
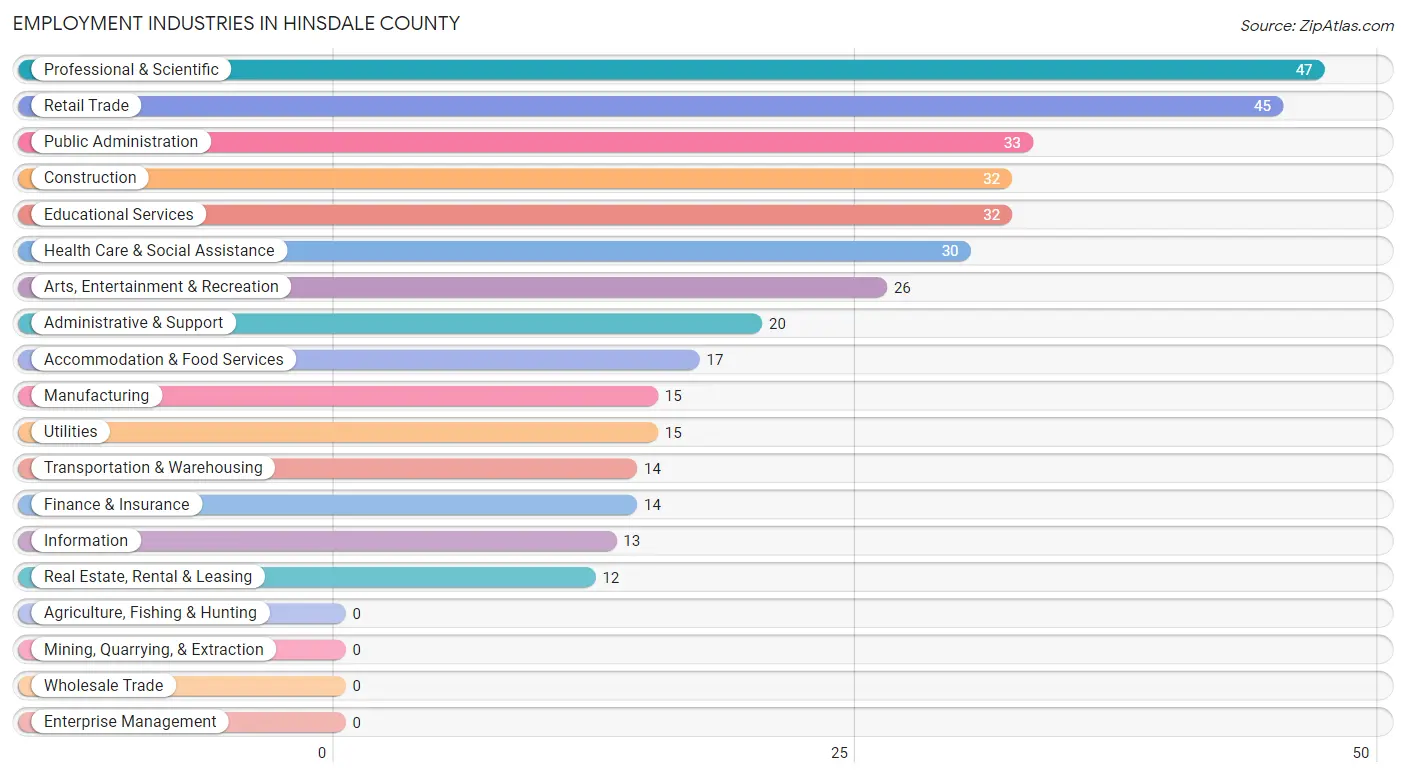
Employment Industries in Hinsdale County
The major employment industries in Hinsdale County include Professional & Scientific (47 | 11.3%), Retail Trade (45 | 10.8%), Public Administration (33 | 8.0%), Construction (32 | 7.7%), and Educational Services (32 | 7.7%).
Employment Industries by Sex in Hinsdale County
The Hinsdale County industries that see more men than women are Utilities (100.0%), Information (100.0%), and Construction (96.9%), whereas the industries that tend to have a higher number of women are Administrative & Support (100.0%), Health Care & Social Assistance (86.7%), and Real Estate, Rental & Leasing (83.3%).
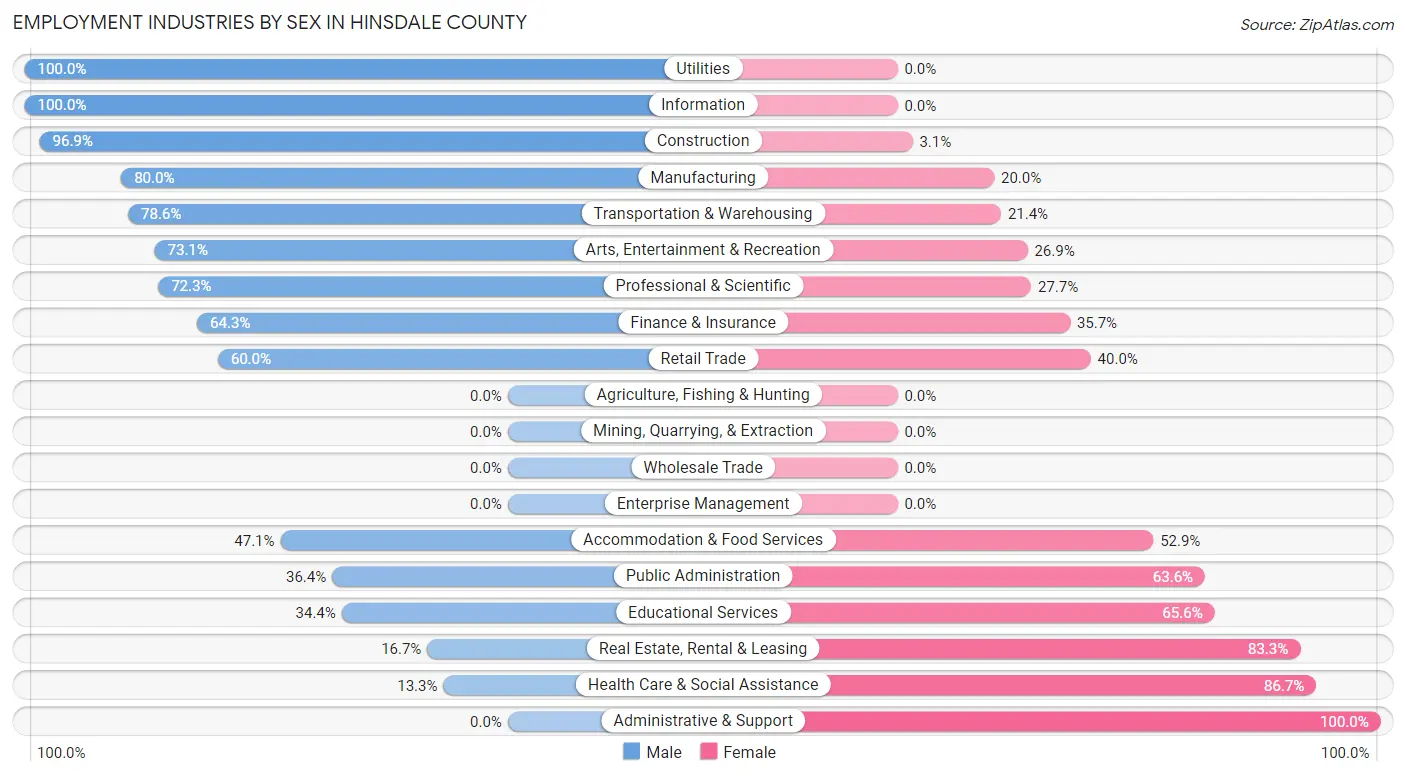
| Industry | Male | Female |
| Agriculture, Fishing & Hunting | 0 (0.0%) | 0 (0.0%) |
| Mining, Quarrying, & Extraction | 0 (0.0%) | 0 (0.0%) |
| Construction | 31 (96.9%) | 1 (3.1%) |
| Manufacturing | 12 (80.0%) | 3 (20.0%) |
| Wholesale Trade | 0 (0.0%) | 0 (0.0%) |
| Retail Trade | 27 (60.0%) | 18 (40.0%) |
| Transportation & Warehousing | 11 (78.6%) | 3 (21.4%) |
| Utilities | 15 (100.0%) | 0 (0.0%) |
| Information | 13 (100.0%) | 0 (0.0%) |
| Finance & Insurance | 9 (64.3%) | 5 (35.7%) |
| Real Estate, Rental & Leasing | 2 (16.7%) | 10 (83.3%) |
| Professional & Scientific | 34 (72.3%) | 13 (27.7%) |
| Enterprise Management | 0 (0.0%) | 0 (0.0%) |
| Administrative & Support | 0 (0.0%) | 20 (100.0%) |
| Educational Services | 11 (34.4%) | 21 (65.6%) |
| Health Care & Social Assistance | 4 (13.3%) | 26 (86.7%) |
| Arts, Entertainment & Recreation | 19 (73.1%) | 7 (26.9%) |
| Accommodation & Food Services | 8 (47.1%) | 9 (52.9%) |
| Public Administration | 12 (36.4%) | 21 (63.6%) |
| Total | 224 (54.0%) | 191 (46.0%) |
Education in Hinsdale County
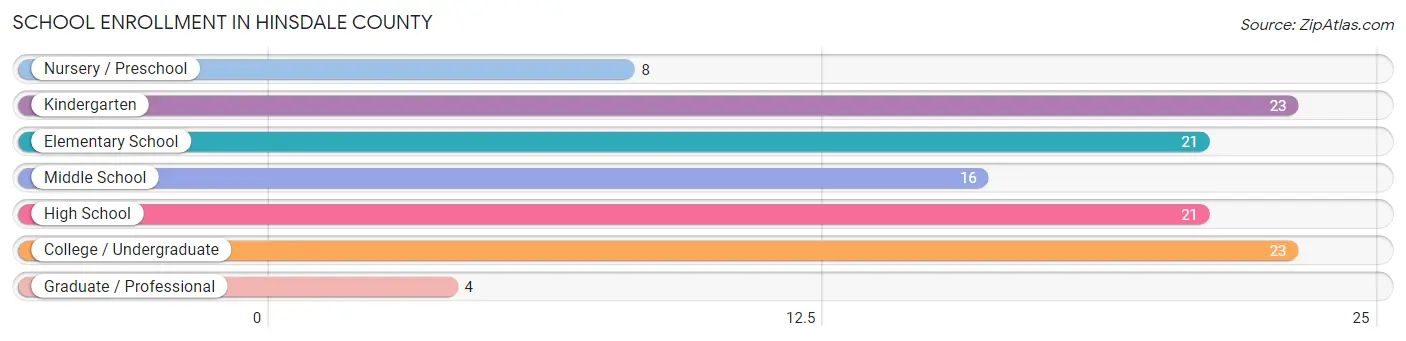
School Enrollment in Hinsdale County
The most common levels of schooling among the 116 students in Hinsdale County are kindergarten (23 | 19.8%), college / undergraduate (23 | 19.8%), and elementary school (21 | 18.1%).
| School Level | # Students | % Students |
| Nursery / Preschool | 8 | 6.9% |
| Kindergarten | 23 | 19.8% |
| Elementary School | 21 | 18.1% |
| Middle School | 16 | 13.8% |
| High School | 21 | 18.1% |
| College / Undergraduate | 23 | 19.8% |
| Graduate / Professional | 4 | 3.5% |
| Total | 116 | 100.0% |
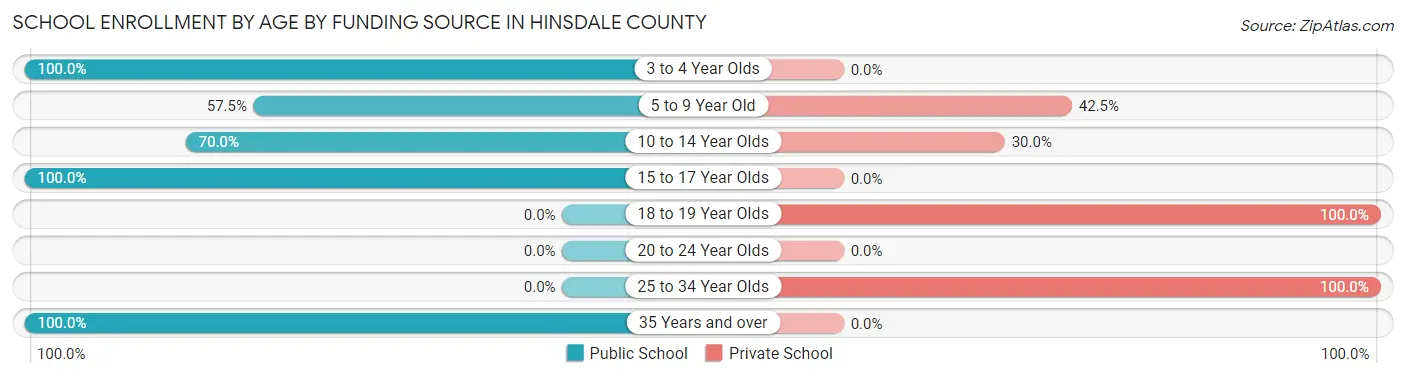
School Enrollment by Age by Funding Source in Hinsdale County
Out of a total of 116 students who are enrolled in schools in Hinsdale County, 58 (50.0%) attend a private institution, while the remaining 58 (50.0%) are enrolled in public schools. The age group of 18 to 19 year olds has the highest likelihood of being enrolled in private schools, with 12 (100.0% in the age bracket) enrolled. Conversely, the age group of 3 to 4 year olds has the lowest likelihood of being enrolled in a private school, with 8 (100.0% in the age bracket) attending a public institution.
| Age Bracket | Public School | Private School |
| 3 to 4 Year Olds | 8 (100.0%) | 0 (0.0%) |
| 5 to 9 Year Old | 23 (57.5%) | 17 (42.5%) |
| 10 to 14 Year Olds | 14 (70.0%) | 6 (30.0%) |
| 15 to 17 Year Olds | 9 (100.0%) | 0 (0.0%) |
| 18 to 19 Year Olds | 0 (0.0%) | 12 (100.0%) |
| 20 to 24 Year Olds | 0 (0.0%) | 0 (0.0%) |
| 25 to 34 Year Olds | 0 (0.0%) | 23 (100.0%) |
| 35 Years and over | 4 (100.0%) | 0 (0.0%) |
| Total | 58 (50.0%) | 58 (50.0%) |
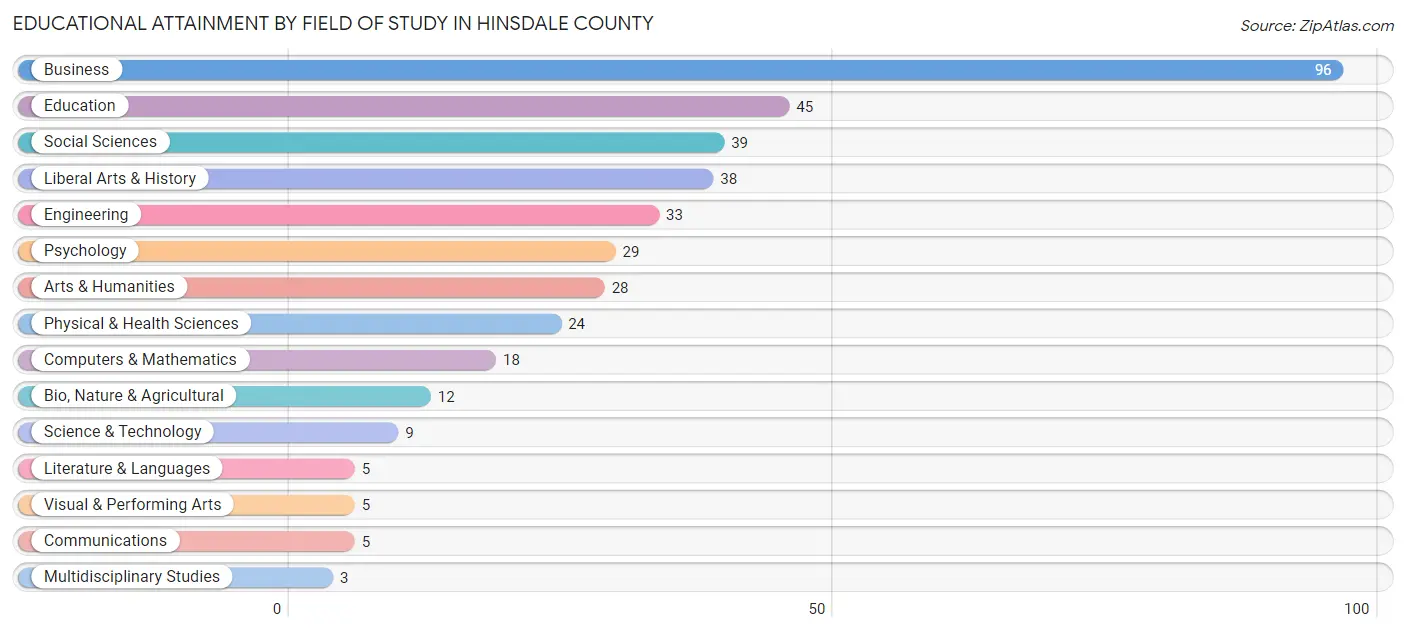
Educational Attainment by Field of Study in Hinsdale County
Business (96 | 24.7%), education (45 | 11.6%), social sciences (39 | 10.0%), liberal arts & history (38 | 9.8%), and engineering (33 | 8.5%) are the most common fields of study among 389 individuals in Hinsdale County who have obtained a bachelor's degree or higher.
| Field of Study | # Graduates | % Graduates |
| Computers & Mathematics | 18 | 4.6% |
| Bio, Nature & Agricultural | 12 | 3.1% |
| Physical & Health Sciences | 24 | 6.2% |
| Psychology | 29 | 7.5% |
| Social Sciences | 39 | 10.0% |
| Engineering | 33 | 8.5% |
| Multidisciplinary Studies | 3 | 0.8% |
| Science & Technology | 9 | 2.3% |
| Business | 96 | 24.7% |
| Education | 45 | 11.6% |
| Literature & Languages | 5 | 1.3% |
| Liberal Arts & History | 38 | 9.8% |
| Visual & Performing Arts | 5 | 1.3% |
| Communications | 5 | 1.3% |
| Arts & Humanities | 28 | 7.2% |
| Total | 389 | 100.0% |
Transportation & Commute in Hinsdale County
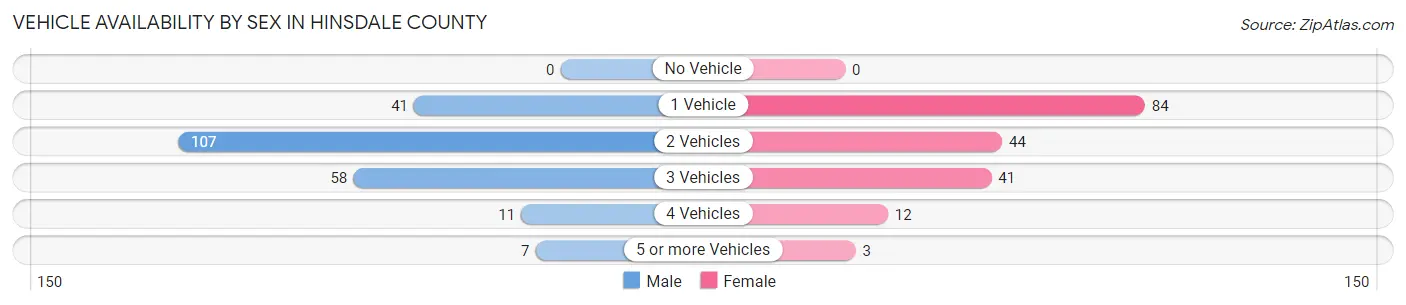
Vehicle Availability by Sex in Hinsdale County
The most prevalent vehicle ownership categories in Hinsdale County are males with 2 vehicles (107, accounting for 47.8%) and females with 2 vehicles (44, making up 58.2%).
| Vehicles Available | Male | Female |
| No Vehicle | 0 (0.0%) | 0 (0.0%) |
| 1 Vehicle | 41 (18.3%) | 84 (45.7%) |
| 2 Vehicles | 107 (47.8%) | 44 (23.9%) |
| 3 Vehicles | 58 (25.9%) | 41 (22.3%) |
| 4 Vehicles | 11 (4.9%) | 12 (6.5%) |
| 5 or more Vehicles | 7 (3.1%) | 3 (1.6%) |
| Total | 224 (100.0%) | 184 (100.0%) |
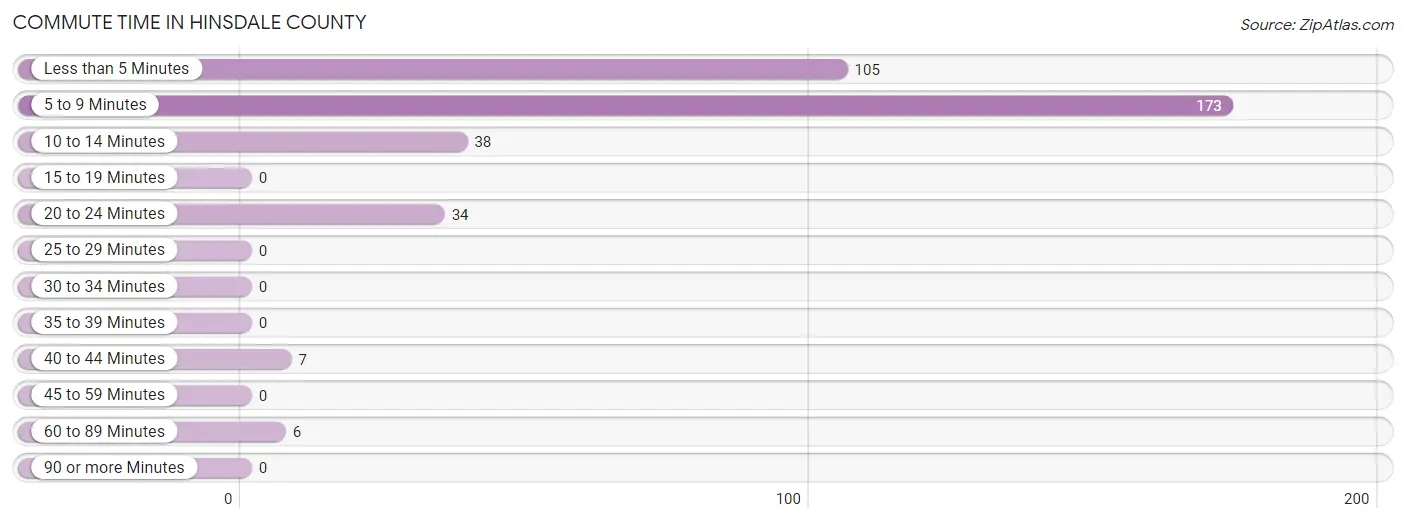
Commute Time in Hinsdale County
The most frequently occuring commute durations in Hinsdale County are 5 to 9 minutes (173 commuters, 47.7%), less than 5 minutes (105 commuters, 28.9%), and 10 to 14 minutes (38 commuters, 10.5%).
| Commute Time | # Commuters | % Commuters |
| Less than 5 Minutes | 105 | 28.9% |
| 5 to 9 Minutes | 173 | 47.7% |
| 10 to 14 Minutes | 38 | 10.5% |
| 15 to 19 Minutes | 0 | 0.0% |
| 20 to 24 Minutes | 34 | 9.4% |
| 25 to 29 Minutes | 0 | 0.0% |
| 30 to 34 Minutes | 0 | 0.0% |
| 35 to 39 Minutes | 0 | 0.0% |
| 40 to 44 Minutes | 7 | 1.9% |
| 45 to 59 Minutes | 0 | 0.0% |
| 60 to 89 Minutes | 6 | 1.7% |
| 90 or more Minutes | 0 | 0.0% |
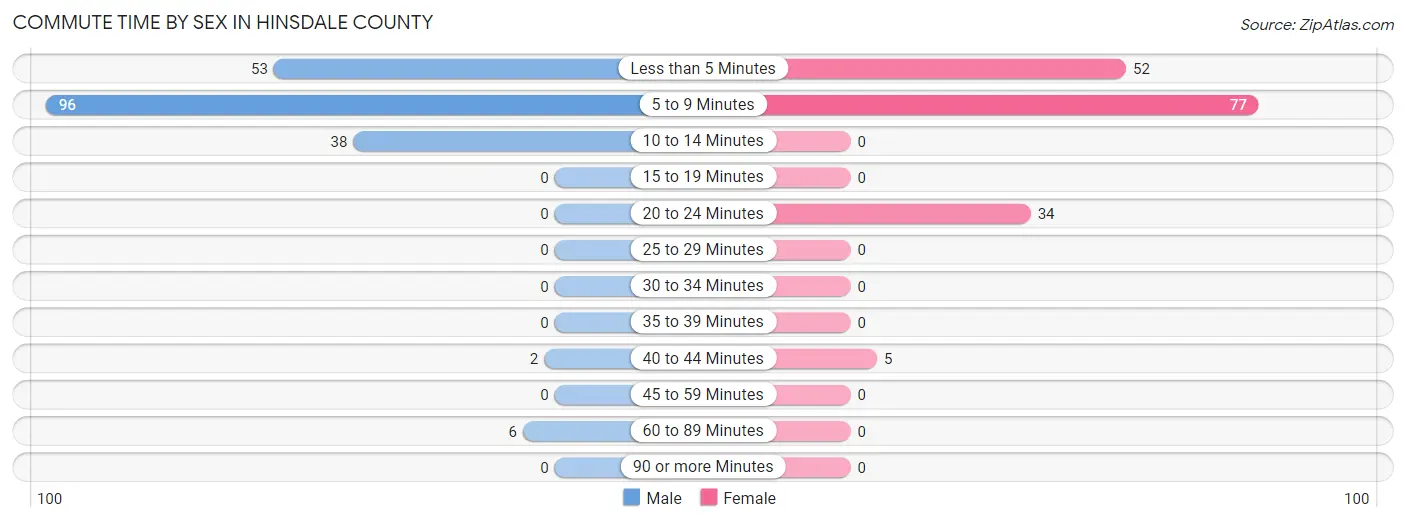
Commute Time by Sex in Hinsdale County
The most common commute times in Hinsdale County are 5 to 9 minutes (96 commuters, 49.2%) for males and 5 to 9 minutes (77 commuters, 45.8%) for females.
| Commute Time | Male | Female |
| Less than 5 Minutes | 53 (27.2%) | 52 (30.9%) |
| 5 to 9 Minutes | 96 (49.2%) | 77 (45.8%) |
| 10 to 14 Minutes | 38 (19.5%) | 0 (0.0%) |
| 15 to 19 Minutes | 0 (0.0%) | 0 (0.0%) |
| 20 to 24 Minutes | 0 (0.0%) | 34 (20.2%) |
| 25 to 29 Minutes | 0 (0.0%) | 0 (0.0%) |
| 30 to 34 Minutes | 0 (0.0%) | 0 (0.0%) |
| 35 to 39 Minutes | 0 (0.0%) | 0 (0.0%) |
| 40 to 44 Minutes | 2 (1.0%) | 5 (3.0%) |
| 45 to 59 Minutes | 0 (0.0%) | 0 (0.0%) |
| 60 to 89 Minutes | 6 (3.1%) | 0 (0.0%) |
| 90 or more Minutes | 0 (0.0%) | 0 (0.0%) |
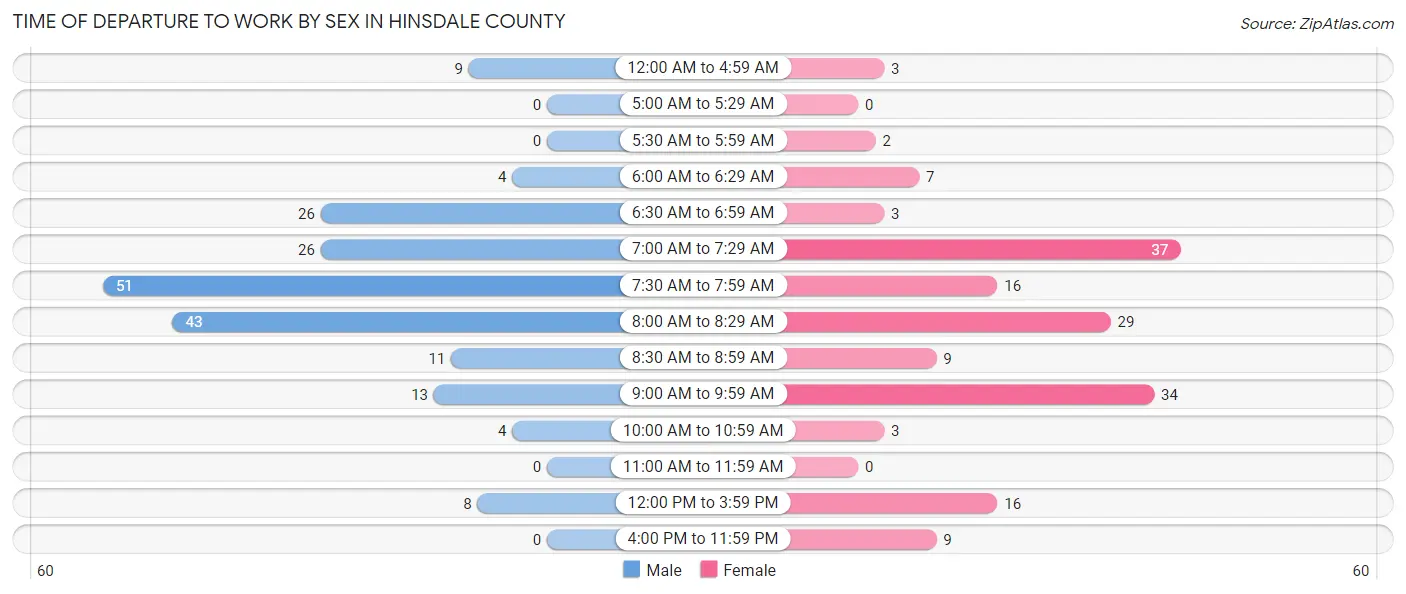
Time of Departure to Work by Sex in Hinsdale County
The most frequent times of departure to work in Hinsdale County are 7:30 AM to 7:59 AM (51, 26.2%) for males and 7:00 AM to 7:29 AM (37, 22.0%) for females.
| Time of Departure | Male | Female |
| 12:00 AM to 4:59 AM | 9 (4.6%) | 3 (1.8%) |
| 5:00 AM to 5:29 AM | 0 (0.0%) | 0 (0.0%) |
| 5:30 AM to 5:59 AM | 0 (0.0%) | 2 (1.2%) |
| 6:00 AM to 6:29 AM | 4 (2.1%) | 7 (4.2%) |
| 6:30 AM to 6:59 AM | 26 (13.3%) | 3 (1.8%) |
| 7:00 AM to 7:29 AM | 26 (13.3%) | 37 (22.0%) |
| 7:30 AM to 7:59 AM | 51 (26.2%) | 16 (9.5%) |
| 8:00 AM to 8:29 AM | 43 (22.1%) | 29 (17.3%) |
| 8:30 AM to 8:59 AM | 11 (5.6%) | 9 (5.4%) |
| 9:00 AM to 9:59 AM | 13 (6.7%) | 34 (20.2%) |
| 10:00 AM to 10:59 AM | 4 (2.1%) | 3 (1.8%) |
| 11:00 AM to 11:59 AM | 0 (0.0%) | 0 (0.0%) |
| 12:00 PM to 3:59 PM | 8 (4.1%) | 16 (9.5%) |
| 4:00 PM to 11:59 PM | 0 (0.0%) | 9 (5.4%) |
| Total | 195 (100.0%) | 168 (100.0%) |
Housing Occupancy in Hinsdale County
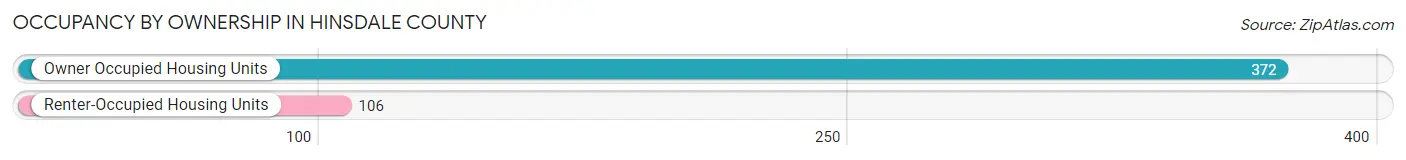
Occupancy by Ownership in Hinsdale County
Of the total 478 dwellings in Hinsdale County, owner-occupied units account for 372 (77.8%), while renter-occupied units make up 106 (22.2%).
| Occupancy | # Housing Units | % Housing Units |
| Owner Occupied Housing Units | 372 | 77.8% |
| Renter-Occupied Housing Units | 106 | 22.2% |
| Total Occupied Housing Units | 478 | 100.0% |
Occupancy by Household Size in Hinsdale County
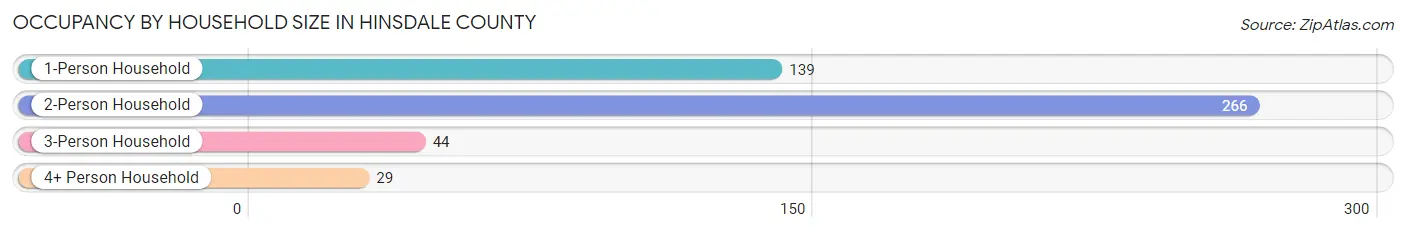
| Household Size | # Housing Units | % Housing Units |
| 1-Person Household | 139 | 29.1% |
| 2-Person Household | 266 | 55.6% |
| 3-Person Household | 44 | 9.2% |
| 4+ Person Household | 29 | 6.1% |
| Total Housing Units | 478 | 100.0% |
Occupancy by Ownership by Household Size in Hinsdale County
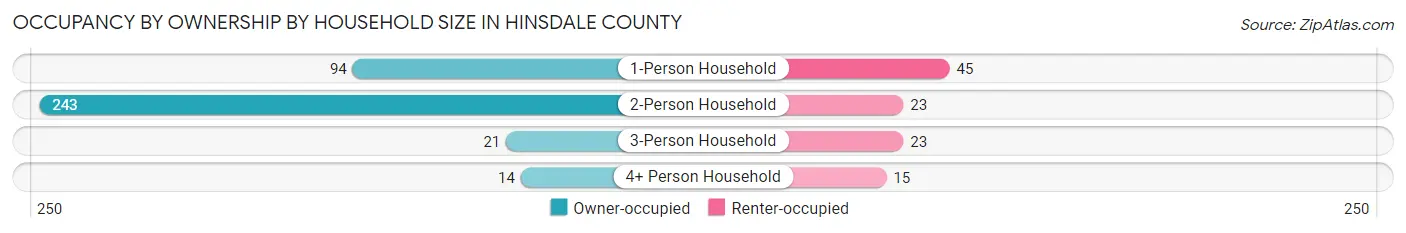
| Household Size | Owner-occupied | Renter-occupied |
| 1-Person Household | 94 (67.6%) | 45 (32.4%) |
| 2-Person Household | 243 (91.3%) | 23 (8.6%) |
| 3-Person Household | 21 (47.7%) | 23 (52.3%) |
| 4+ Person Household | 14 (48.3%) | 15 (51.7%) |
| Total Housing Units | 372 (77.8%) | 106 (22.2%) |
Occupancy by Educational Attainment in Hinsdale County
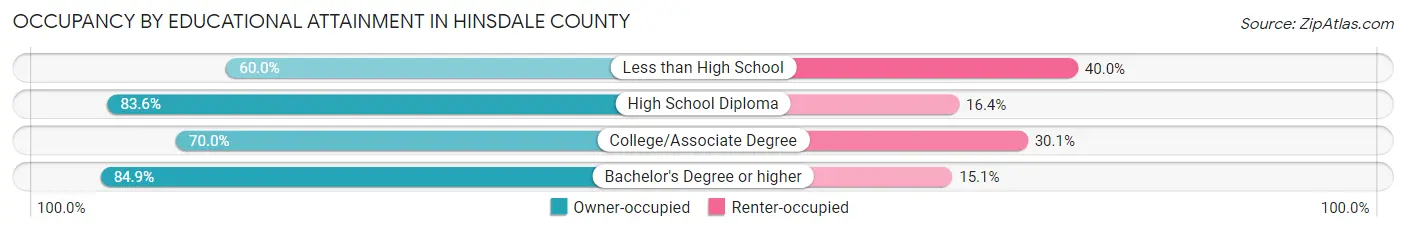
| Household Size | Owner-occupied | Renter-occupied |
| Less than High School | 6 (60.0%) | 4 (40.0%) |
| High School Diploma | 61 (83.6%) | 12 (16.4%) |
| College/Associate Degree | 142 (70.0%) | 61 (30.0%) |
| Bachelor's Degree or higher | 163 (84.9%) | 29 (15.1%) |
Occupancy by Age of Householder in Hinsdale County
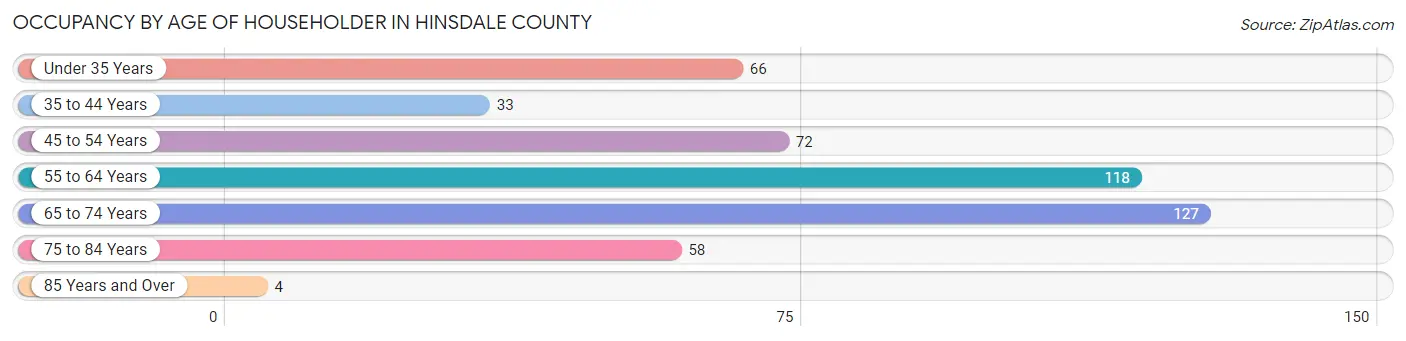
| Age Bracket | # Households | % Households |
| Under 35 Years | 66 | 13.8% |
| 35 to 44 Years | 33 | 6.9% |
| 45 to 54 Years | 72 | 15.1% |
| 55 to 64 Years | 118 | 24.7% |
| 65 to 74 Years | 127 | 26.6% |
| 75 to 84 Years | 58 | 12.1% |
| 85 Years and Over | 4 | 0.8% |
| Total | 478 | 100.0% |
Housing Finances in Hinsdale County
Median Income by Occupancy in Hinsdale County

| Occupancy Type | # Households | Median Income |
| Owner-Occupied | 372 (77.8%) | $67,500 |
| Renter-Occupied | 106 (22.2%) | $52,500 |
| Average | 478 (100.0%) | $58,712 |
Occupancy by Householder Income Bracket in Hinsdale County

| Income Bracket | Owner-occupied | Renter-occupied |
| Less than $5,000 | 5 (1.3%) | 0 (0.0%) |
| $5,000 to $9,999 | 4 (1.1%) | 4 (3.8%) |
| $10,000 to $14,999 | 26 (7.0%) | 0 (0.0%) |
| $15,000 to $19,999 | 6 (1.6%) | 7 (6.6%) |
| $20,000 to $24,999 | 28 (7.5%) | 0 (0.0%) |
| $25,000 to $34,999 | 19 (5.1%) | 16 (15.1%) |
| $35,000 to $49,999 | 71 (19.1%) | 26 (24.5%) |
| $50,000 to $74,999 | 44 (11.8%) | 40 (37.7%) |
| $75,000 to $99,999 | 35 (9.4%) | 10 (9.4%) |
| $100,000 to $149,999 | 46 (12.4%) | 0 (0.0%) |
| $150,000 or more | 88 (23.7%) | 3 (2.8%) |
| Total | 372 (100.0%) | 106 (100.0%) |
Monthly Housing Cost Tiers in Hinsdale County
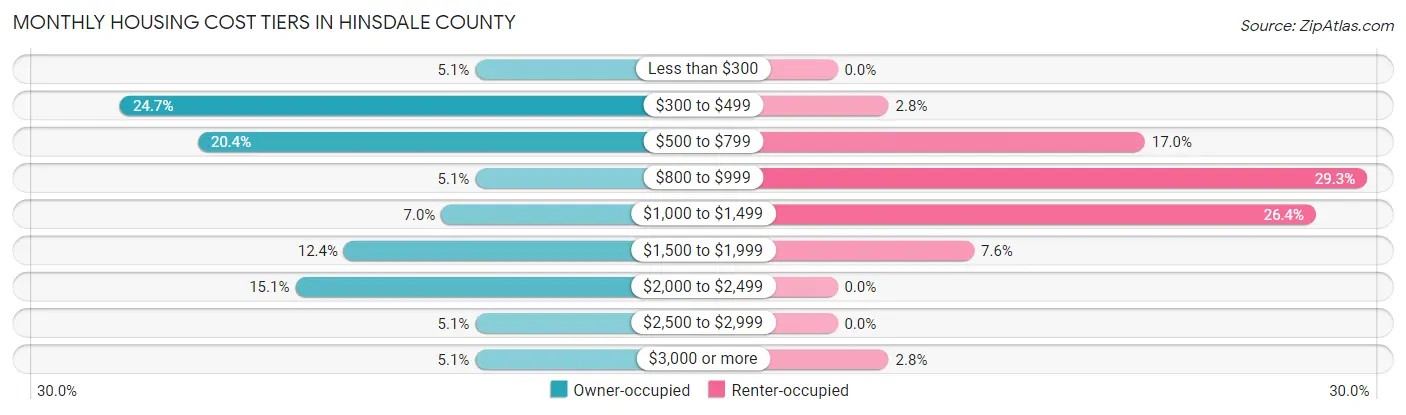
| Monthly Cost | Owner-occupied | Renter-occupied |
| Less than $300 | 19 (5.1%) | 0 (0.0%) |
| $300 to $499 | 92 (24.7%) | 3 (2.8%) |
| $500 to $799 | 76 (20.4%) | 18 (17.0%) |
| $800 to $999 | 19 (5.1%) | 31 (29.2%) |
| $1,000 to $1,499 | 26 (7.0%) | 28 (26.4%) |
| $1,500 to $1,999 | 46 (12.4%) | 8 (7.5%) |
| $2,000 to $2,499 | 56 (15.0%) | 0 (0.0%) |
| $2,500 to $2,999 | 19 (5.1%) | 0 (0.0%) |
| $3,000 or more | 19 (5.1%) | 3 (2.8%) |
| Total | 372 (100.0%) | 106 (100.0%) |
Physical Housing Characteristics in Hinsdale County
Housing Structures in Hinsdale County
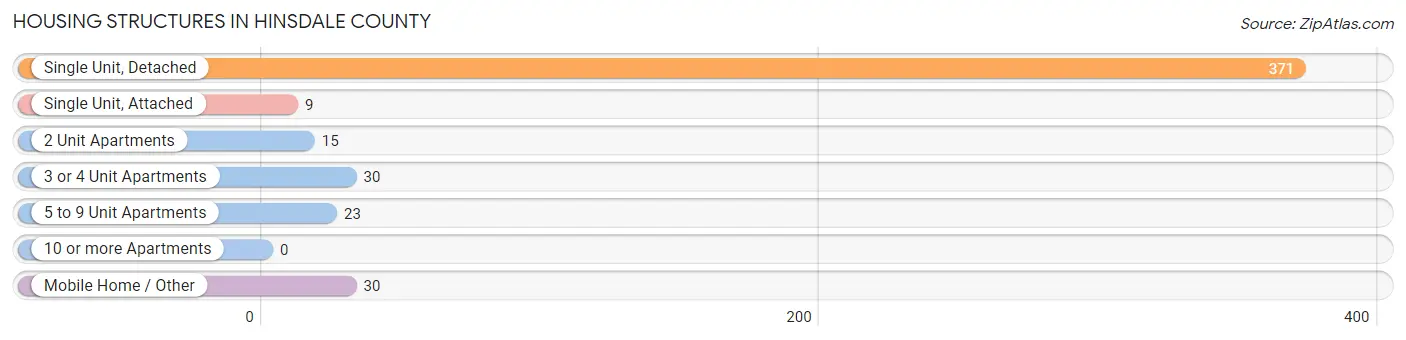
| Structure Type | # Housing Units | % Housing Units |
| Single Unit, Detached | 371 | 77.6% |
| Single Unit, Attached | 9 | 1.9% |
| 2 Unit Apartments | 15 | 3.1% |
| 3 or 4 Unit Apartments | 30 | 6.3% |
| 5 to 9 Unit Apartments | 23 | 4.8% |
| 10 or more Apartments | 0 | 0.0% |
| Mobile Home / Other | 30 | 6.3% |
| Total | 478 | 100.0% |
Housing Structures by Occupancy in Hinsdale County
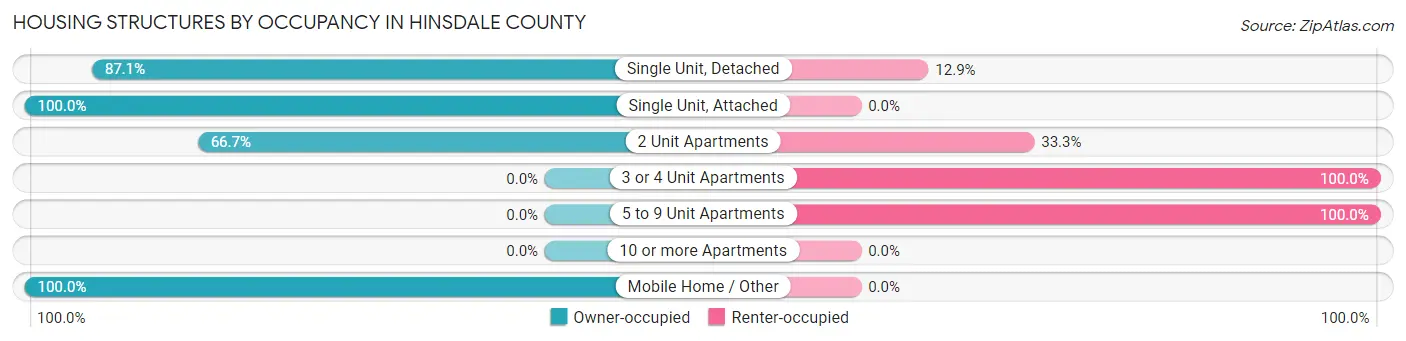
| Structure Type | Owner-occupied | Renter-occupied |
| Single Unit, Detached | 323 (87.1%) | 48 (12.9%) |
| Single Unit, Attached | 9 (100.0%) | 0 (0.0%) |
| 2 Unit Apartments | 10 (66.7%) | 5 (33.3%) |
| 3 or 4 Unit Apartments | 0 (0.0%) | 30 (100.0%) |
| 5 to 9 Unit Apartments | 0 (0.0%) | 23 (100.0%) |
| 10 or more Apartments | 0 (0.0%) | 0 (0.0%) |
| Mobile Home / Other | 30 (100.0%) | 0 (0.0%) |
| Total | 372 (77.8%) | 106 (22.2%) |
Housing Structures by Number of Rooms in Hinsdale County
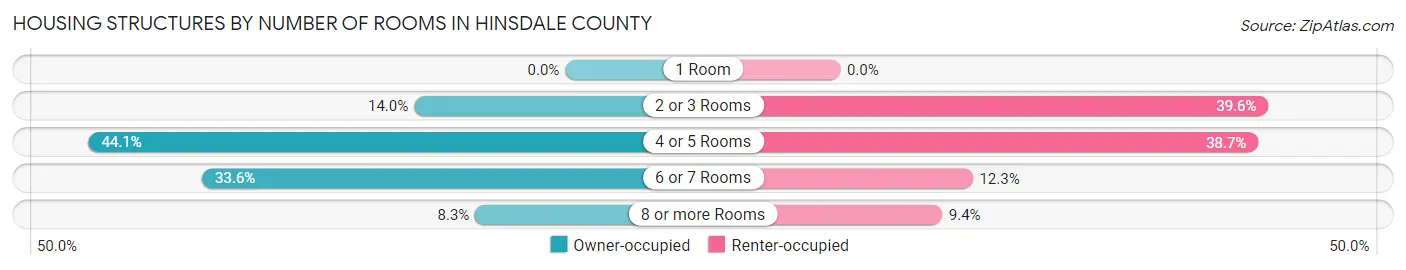
| Number of Rooms | Owner-occupied | Renter-occupied |
| 1 Room | 0 (0.0%) | 0 (0.0%) |
| 2 or 3 Rooms | 52 (14.0%) | 42 (39.6%) |
| 4 or 5 Rooms | 164 (44.1%) | 41 (38.7%) |
| 6 or 7 Rooms | 125 (33.6%) | 13 (12.3%) |
| 8 or more Rooms | 31 (8.3%) | 10 (9.4%) |
| Total | 372 (100.0%) | 106 (100.0%) |
Housing Structure by Heating Type in Hinsdale County
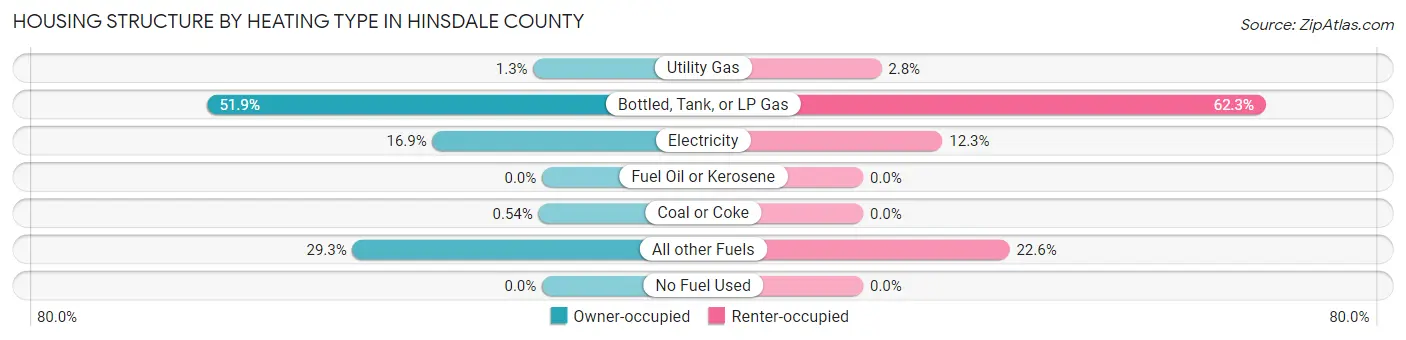
| Heating Type | Owner-occupied | Renter-occupied |
| Utility Gas | 5 (1.3%) | 3 (2.8%) |
| Bottled, Tank, or LP Gas | 193 (51.9%) | 66 (62.3%) |
| Electricity | 63 (16.9%) | 13 (12.3%) |
| Fuel Oil or Kerosene | 0 (0.0%) | 0 (0.0%) |
| Coal or Coke | 2 (0.5%) | 0 (0.0%) |
| All other Fuels | 109 (29.3%) | 24 (22.6%) |
| No Fuel Used | 0 (0.0%) | 0 (0.0%) |
| Total | 372 (100.0%) | 106 (100.0%) |
Household Vehicle Usage in Hinsdale County
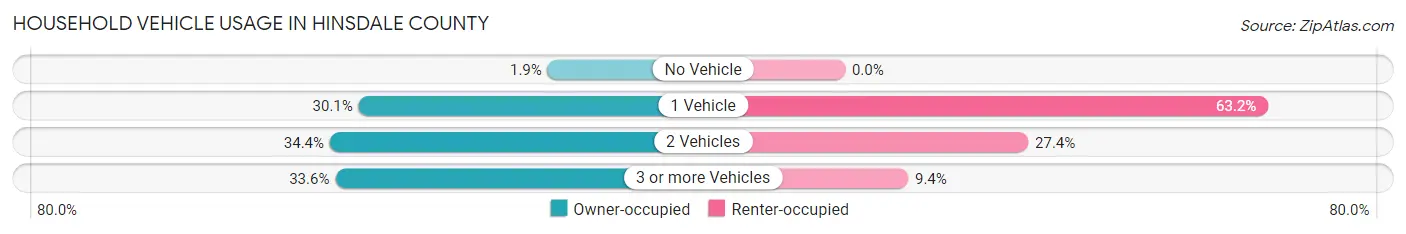
| Vehicles per Household | Owner-occupied | Renter-occupied |
| No Vehicle | 7 (1.9%) | 0 (0.0%) |
| 1 Vehicle | 112 (30.1%) | 67 (63.2%) |
| 2 Vehicles | 128 (34.4%) | 29 (27.4%) |
| 3 or more Vehicles | 125 (33.6%) | 10 (9.4%) |
| Total | 372 (100.0%) | 106 (100.0%) |
Real Estate & Mortgages in Hinsdale County
Real Estate and Mortgage Overview in Hinsdale County
| Characteristic | Without Mortgage | With Mortgage |
| Housing Units | 201 | 171 |
| Median Property Value | $377,600 | $362,500 |
| Median Household Income | $66,979 | $43 |
| Monthly Housing Costs | $471 | $19 |
| Real Estate Taxes | $1,196 | $0 |
Property Value by Mortgage Status in Hinsdale County
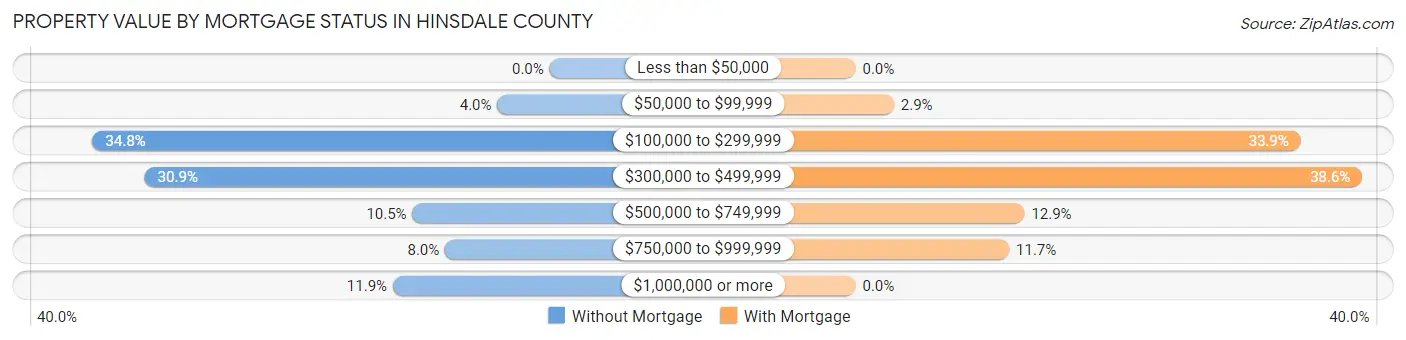
| Property Value | Without Mortgage | With Mortgage |
| Less than $50,000 | 0 (0.0%) | 0 (0.0%) |
| $50,000 to $99,999 | 8 (4.0%) | 5 (2.9%) |
| $100,000 to $299,999 | 70 (34.8%) | 58 (33.9%) |
| $300,000 to $499,999 | 62 (30.8%) | 66 (38.6%) |
| $500,000 to $749,999 | 21 (10.4%) | 22 (12.9%) |
| $750,000 to $999,999 | 16 (8.0%) | 20 (11.7%) |
| $1,000,000 or more | 24 (11.9%) | 0 (0.0%) |
| Total | 201 (100.0%) | 171 (100.0%) |
Household Income by Mortgage Status in Hinsdale County
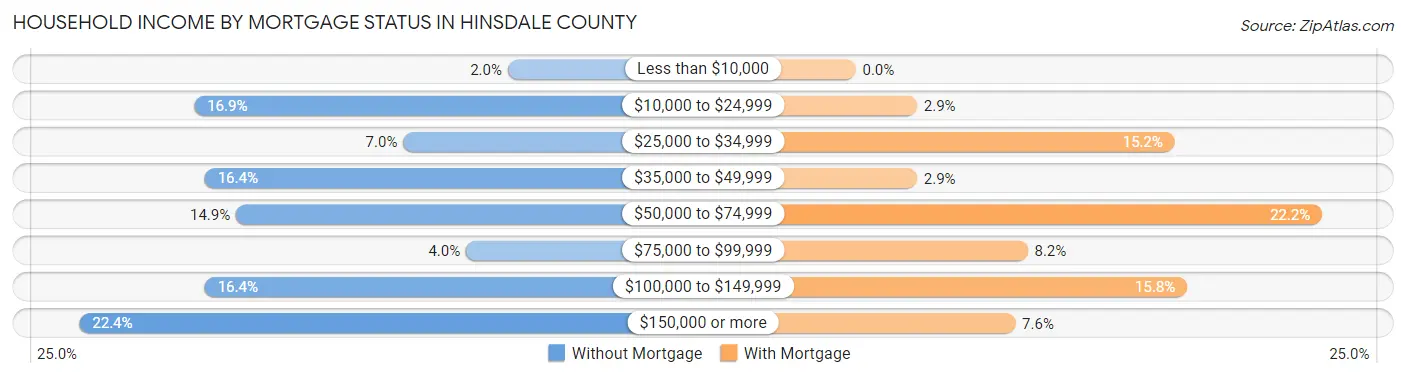
| Household Income | Without Mortgage | With Mortgage |
| Less than $10,000 | 4 (2.0%) | 0 (0.0%) |
| $10,000 to $24,999 | 34 (16.9%) | 5 (2.9%) |
| $25,000 to $34,999 | 14 (7.0%) | 26 (15.2%) |
| $35,000 to $49,999 | 33 (16.4%) | 5 (2.9%) |
| $50,000 to $74,999 | 30 (14.9%) | 38 (22.2%) |
| $75,000 to $99,999 | 8 (4.0%) | 14 (8.2%) |
| $100,000 to $149,999 | 33 (16.4%) | 27 (15.8%) |
| $150,000 or more | 45 (22.4%) | 13 (7.6%) |
| Total | 201 (100.0%) | 171 (100.0%) |
Property Value to Household Income Ratio in Hinsdale County
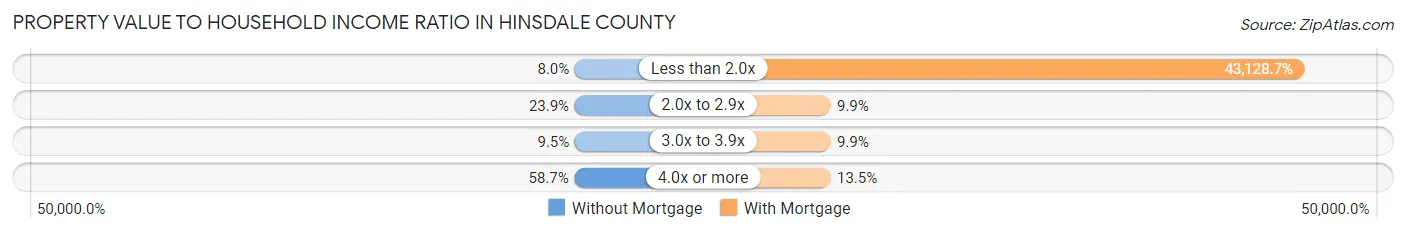
| Value-to-Income Ratio | Without Mortgage | With Mortgage |
| Less than 2.0x | 16 (8.0%) | 73,750 (43,128.6%) |
| 2.0x to 2.9x | 48 (23.9%) | 17 (9.9%) |
| 3.0x to 3.9x | 19 (9.5%) | 17 (9.9%) |
| 4.0x or more | 118 (58.7%) | 23 (13.5%) |
| Total | 201 (100.0%) | 171 (100.0%) |
Real Estate Taxes by Mortgage Status in Hinsdale County
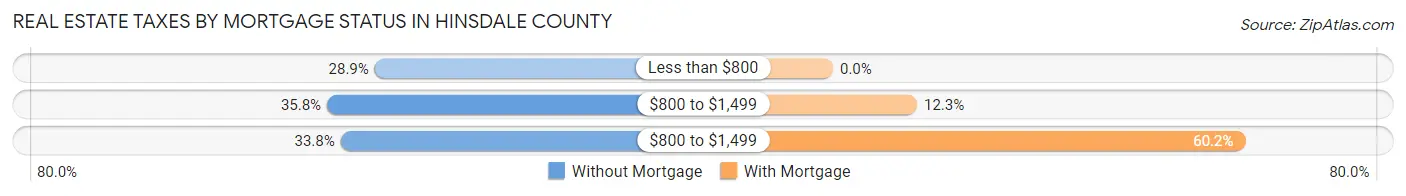
| Property Taxes | Without Mortgage | With Mortgage |
| Less than $800 | 58 (28.9%) | 0 (0.0%) |
| $800 to $1,499 | 72 (35.8%) | 21 (12.3%) |
| $800 to $1,499 | 68 (33.8%) | 103 (60.2%) |
| Total | 201 (100.0%) | 171 (100.0%) |
Health & Disability in Hinsdale County
Health Insurance Coverage by Age in Hinsdale County
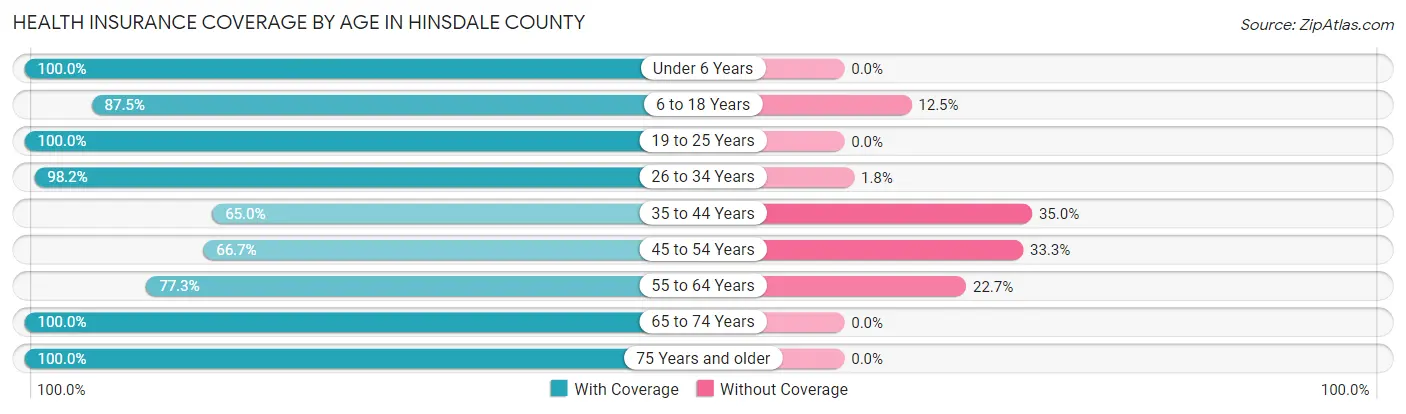
| Age Bracket | With Coverage | Without Coverage |
| Under 6 Years | 41 (100.0%) | 0 (0.0%) |
| 6 to 18 Years | 63 (87.5%) | 9 (12.5%) |
| 19 to 25 Years | 11 (100.0%) | 0 (0.0%) |
| 26 to 34 Years | 108 (98.2%) | 2 (1.8%) |
| 35 to 44 Years | 52 (65.0%) | 28 (35.0%) |
| 45 to 54 Years | 68 (66.7%) | 34 (33.3%) |
| 55 to 64 Years | 143 (77.3%) | 42 (22.7%) |
| 65 to 74 Years | 212 (100.0%) | 0 (0.0%) |
| 75 Years and older | 98 (100.0%) | 0 (0.0%) |
| Total | 796 (87.4%) | 115 (12.6%) |
Health Insurance Coverage by Citizenship Status in Hinsdale County
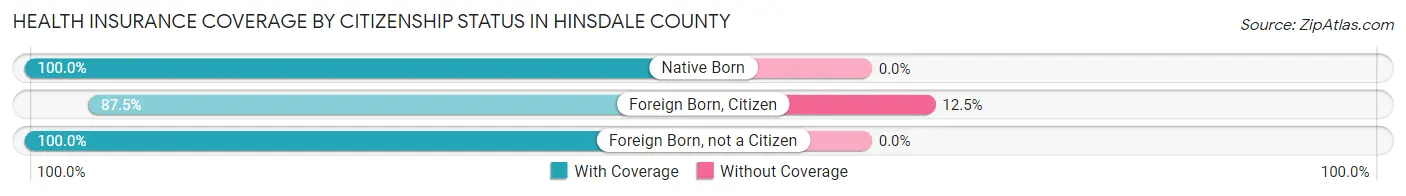
| Citizenship Status | With Coverage | Without Coverage |
| Native Born | 41 (100.0%) | 0 (0.0%) |
| Foreign Born, Citizen | 63 (87.5%) | 9 (12.5%) |
| Foreign Born, not a Citizen | 11 (100.0%) | 0 (0.0%) |
Health Insurance Coverage by Household Income in Hinsdale County

| Household Income | With Coverage | Without Coverage |
| Under $25,000 | 84 (87.5%) | 12 (12.5%) |
| $25,000 to $49,999 | 133 (66.5%) | 67 (33.5%) |
| $50,000 to $74,999 | 169 (89.9%) | 19 (10.1%) |
| $75,000 to $99,999 | 94 (88.7%) | 12 (11.3%) |
| $100,000 and over | 316 (98.4%) | 5 (1.6%) |
Public vs Private Health Insurance Coverage by Age in Hinsdale County
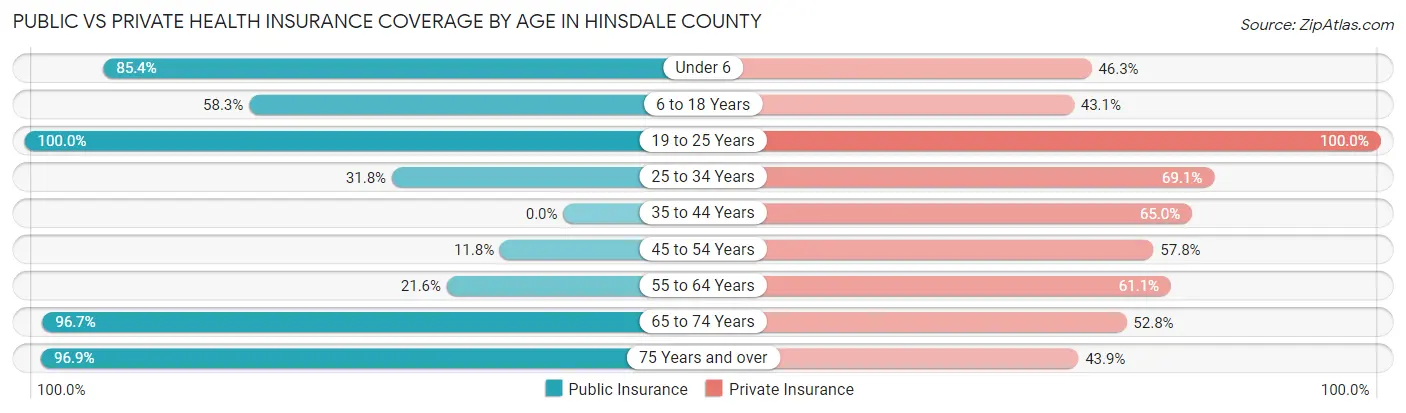
| Age Bracket | Public Insurance | Private Insurance |
| Under 6 | 35 (85.4%) | 19 (46.3%) |
| 6 to 18 Years | 42 (58.3%) | 31 (43.1%) |
| 19 to 25 Years | 11 (100.0%) | 11 (100.0%) |
| 25 to 34 Years | 35 (31.8%) | 76 (69.1%) |
| 35 to 44 Years | 0 (0.0%) | 52 (65.0%) |
| 45 to 54 Years | 12 (11.8%) | 59 (57.8%) |
| 55 to 64 Years | 40 (21.6%) | 113 (61.1%) |
| 65 to 74 Years | 205 (96.7%) | 112 (52.8%) |
| 75 Years and over | 95 (96.9%) | 43 (43.9%) |
| Total | 475 (52.1%) | 516 (56.6%) |
Disability Status by Sex by Age in Hinsdale County
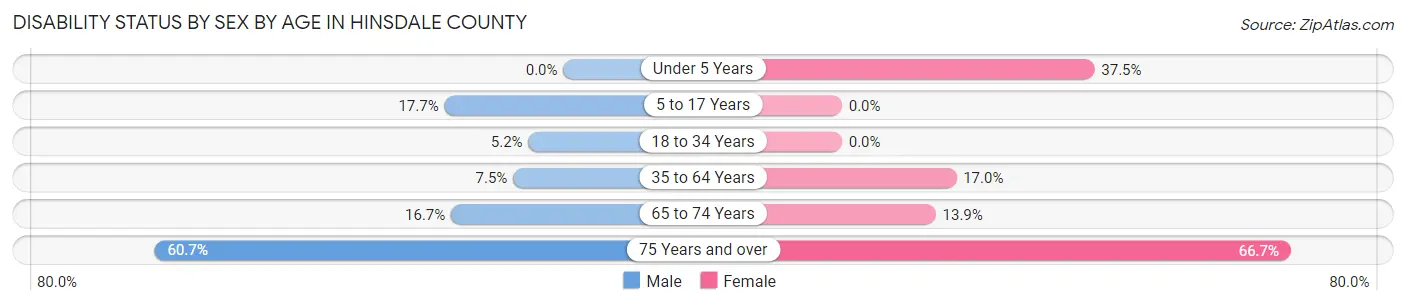
| Age Bracket | Male | Female |
| Under 5 Years | 0 (0.0%) | 6 (37.5%) |
| 5 to 17 Years | 6 (17.6%) | 0 (0.0%) |
| 18 to 34 Years | 4 (5.2%) | 0 (0.0%) |
| 35 to 64 Years | 12 (7.4%) | 35 (17.0%) |
| 65 to 74 Years | 15 (16.7%) | 17 (13.9%) |
| 75 Years and over | 34 (60.7%) | 28 (66.7%) |
Disability Class by Sex by Age in Hinsdale County
Disability Class: Hearing Difficulty
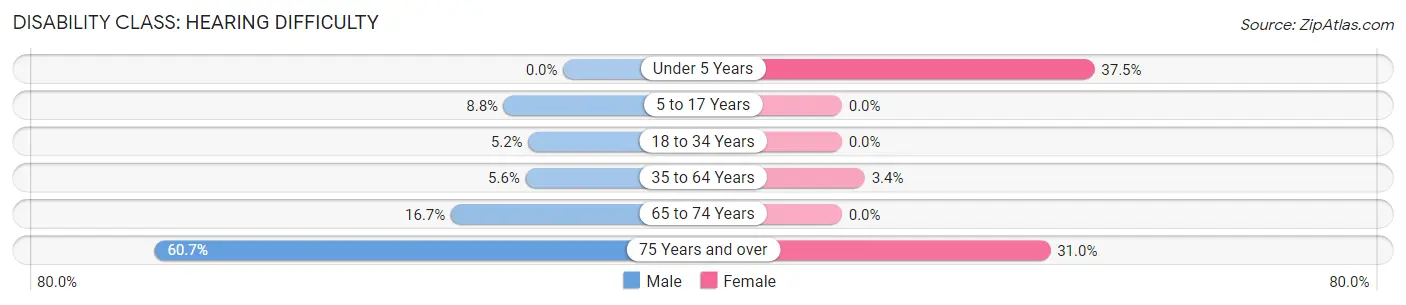
| Age Bracket | Male | Female |
| Under 5 Years | 0 (0.0%) | 6 (37.5%) |
| 5 to 17 Years | 3 (8.8%) | 0 (0.0%) |
| 18 to 34 Years | 4 (5.2%) | 0 (0.0%) |
| 35 to 64 Years | 9 (5.6%) | 7 (3.4%) |
| 65 to 74 Years | 15 (16.7%) | 0 (0.0%) |
| 75 Years and over | 34 (60.7%) | 13 (30.9%) |
Disability Class: Vision Difficulty
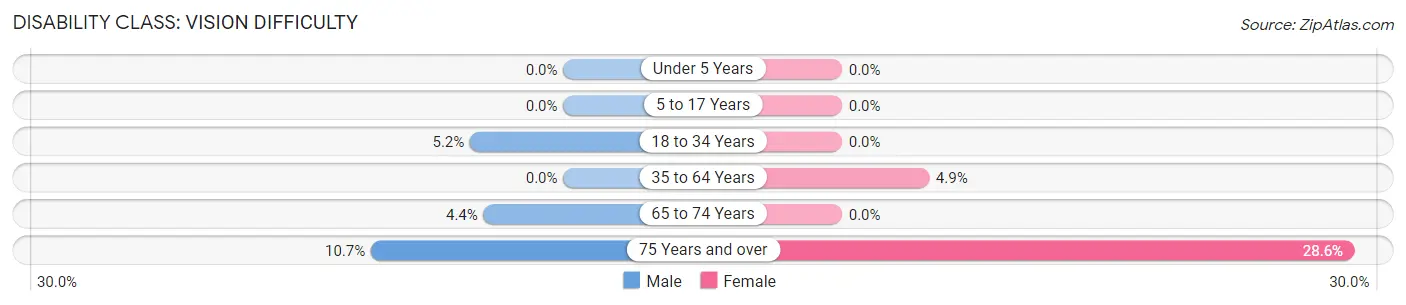
| Age Bracket | Male | Female |
| Under 5 Years | 0 (0.0%) | 0 (0.0%) |
| 5 to 17 Years | 0 (0.0%) | 0 (0.0%) |
| 18 to 34 Years | 4 (5.2%) | 0 (0.0%) |
| 35 to 64 Years | 0 (0.0%) | 10 (4.9%) |
| 65 to 74 Years | 4 (4.4%) | 0 (0.0%) |
| 75 Years and over | 6 (10.7%) | 12 (28.6%) |
Disability Class: Cognitive Difficulty
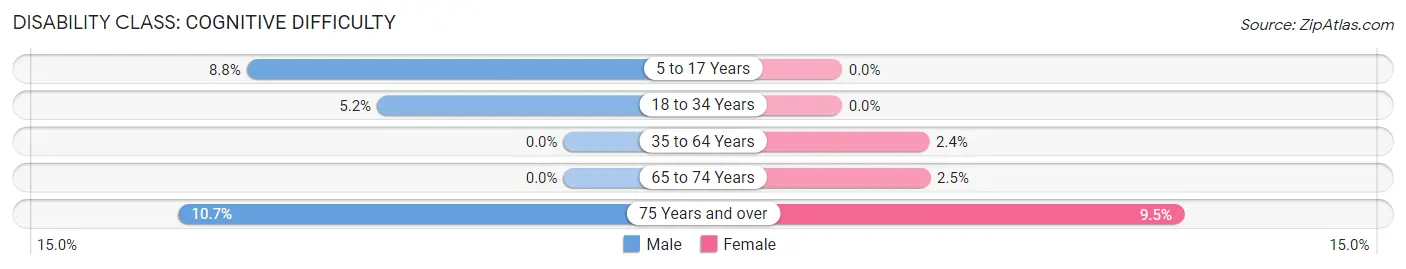
| Age Bracket | Male | Female |
| 5 to 17 Years | 3 (8.8%) | 0 (0.0%) |
| 18 to 34 Years | 4 (5.2%) | 0 (0.0%) |
| 35 to 64 Years | 0 (0.0%) | 5 (2.4%) |
| 65 to 74 Years | 0 (0.0%) | 3 (2.5%) |
| 75 Years and over | 6 (10.7%) | 4 (9.5%) |
Disability Class: Ambulatory Difficulty
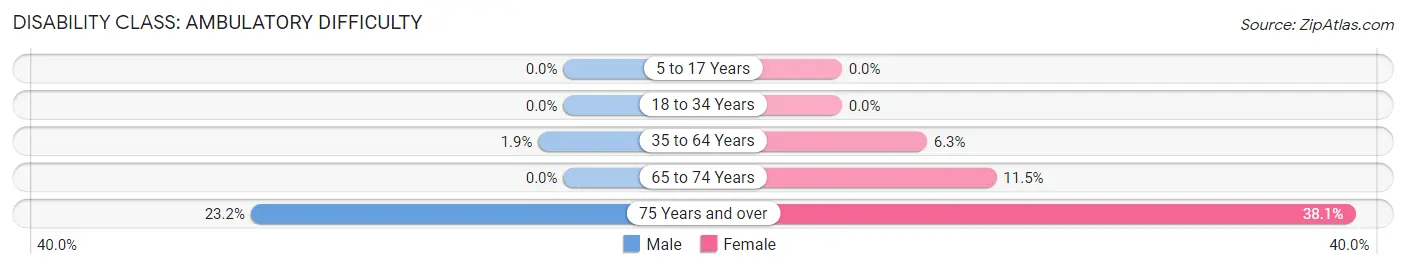
| Age Bracket | Male | Female |
| 5 to 17 Years | 0 (0.0%) | 0 (0.0%) |
| 18 to 34 Years | 0 (0.0%) | 0 (0.0%) |
| 35 to 64 Years | 3 (1.9%) | 13 (6.3%) |
| 65 to 74 Years | 0 (0.0%) | 14 (11.5%) |
| 75 Years and over | 13 (23.2%) | 16 (38.1%) |
Disability Class: Self-Care Difficulty
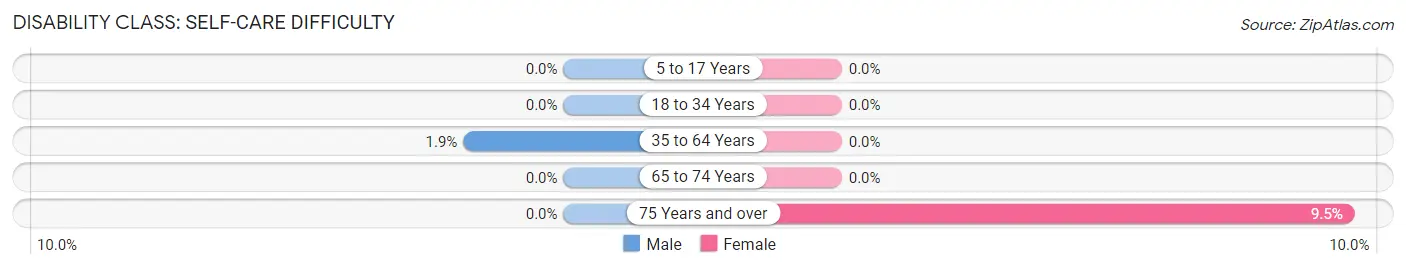
| Age Bracket | Male | Female |
| 5 to 17 Years | 0 (0.0%) | 0 (0.0%) |
| 18 to 34 Years | 0 (0.0%) | 0 (0.0%) |
| 35 to 64 Years | 3 (1.9%) | 0 (0.0%) |
| 65 to 74 Years | 0 (0.0%) | 0 (0.0%) |
| 75 Years and over | 0 (0.0%) | 4 (9.5%) |
Technology Access in Hinsdale County
Computing Device Access in Hinsdale County
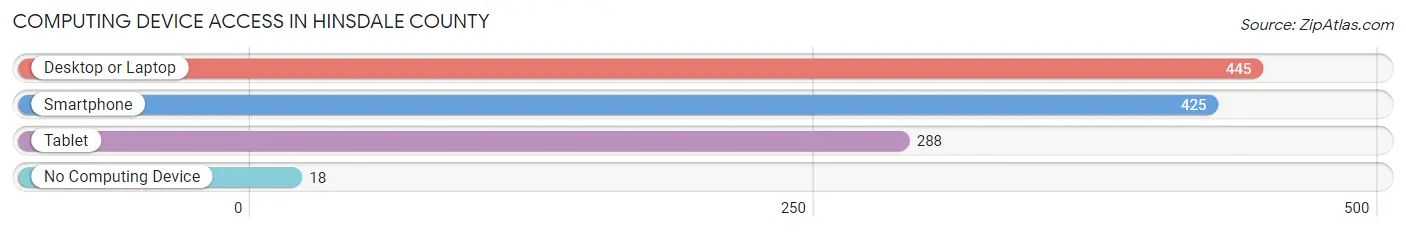
| Device Type | # Households | % Households |
| Desktop or Laptop | 445 | 93.1% |
| Smartphone | 425 | 88.9% |
| Tablet | 288 | 60.3% |
| No Computing Device | 18 | 3.8% |
| Total | 478 | 100.0% |
Internet Access in Hinsdale County
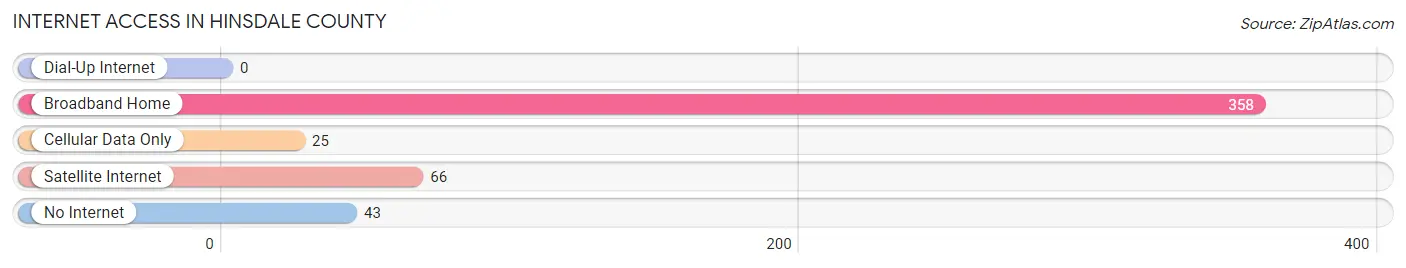
| Internet Type | # Households | % Households |
| Dial-Up Internet | 0 | 0.0% |
| Broadband Home | 358 | 74.9% |
| Cellular Data Only | 25 | 5.2% |
| Satellite Internet | 66 | 13.8% |
| No Internet | 43 | 9.0% |
| Total | 478 | 100.0% |
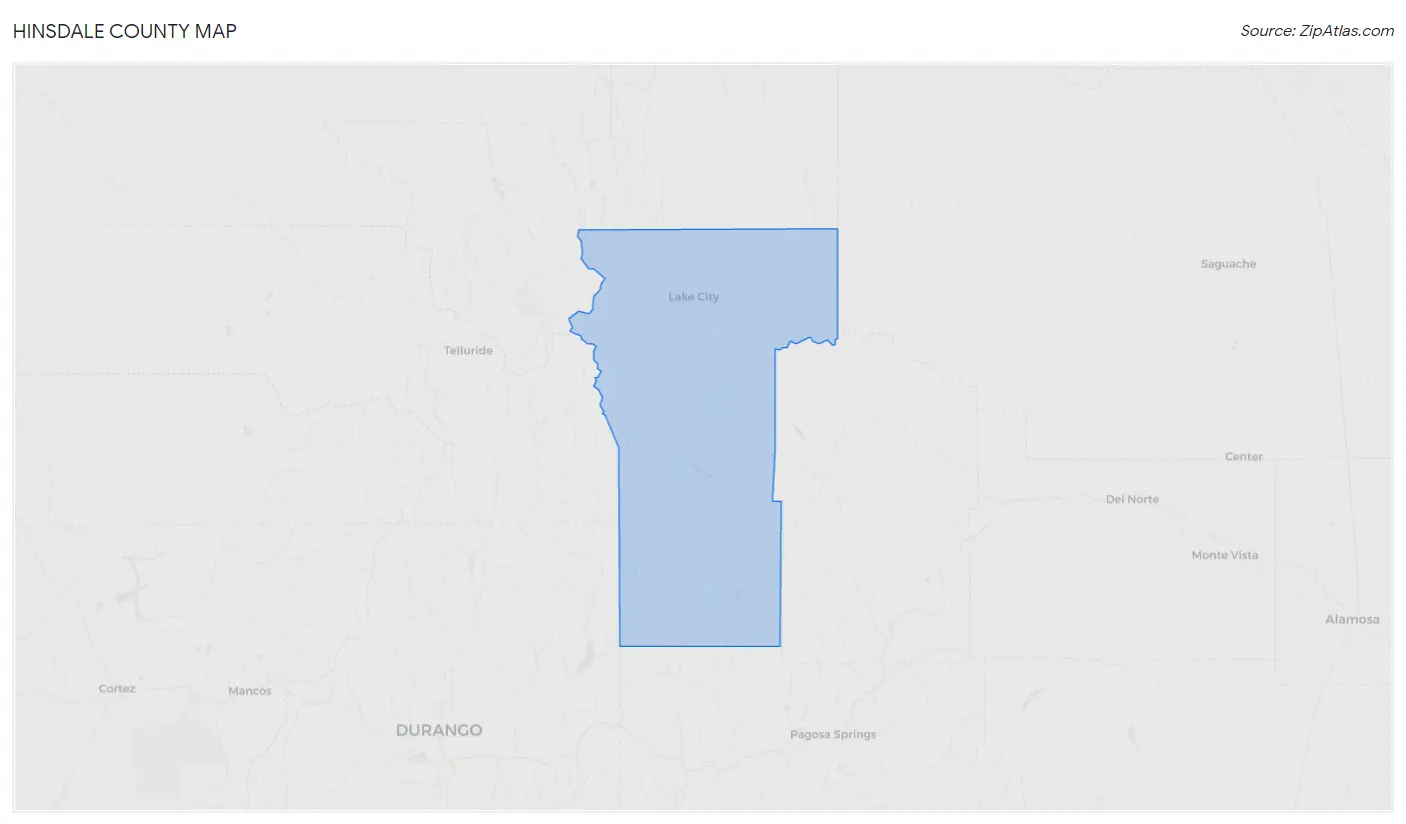
Hinsdale County Summary
Hinsdale County is located in the southwestern corner of Colorado, and is bordered by San Juan County to the north, Mineral County to the east, and Archuleta County to the south. The county seat is Lake City, and the county has a total area of 1,123 square miles. The county is home to the San Juan National Forest, which covers much of the county.
Hinsdale County was established in 1874, and was named after George A. Hinsdale, a prominent Colorado politician. The county was originally part of the Ute Indian Reservation, and was later opened up to settlement by homesteaders. The county was originally populated by miners, ranchers, and loggers, and the population has remained relatively small since then.
Geography
Hinsdale County is located in the San Juan Mountains of southwestern Colorado. The county is home to the San Juan National Forest, which covers much of the county. The county is also home to several mountain peaks, including Uncompahgre Peak, which is the highest peak in the county at 14,309 feet. The county is also home to several rivers, including the Rio Grande, the San Miguel, and the Animas.
The county has a total area of 1,123 square miles, and is mostly mountainous. The county has an average elevation of 8,000 feet, and the highest point in the county is Uncompahgre Peak at 14,309 feet. The county has a semi-arid climate, with hot summers and cold winters.
Economy
Hinsdale County has a small, but diverse economy. The county is home to several small businesses, including restaurants, retail stores, and lodging. The county is also home to several tourist attractions, including the San Juan National Forest, which attracts visitors from all over the world. The county is also home to several mining operations, including gold, silver, and uranium.
The county is also home to several ranches, which raise cattle, sheep, and horses. The county is also home to several logging operations, which harvest timber from the San Juan National Forest. The county is also home to several ski resorts, which attract visitors from all over the world.
Demographics
As of the 2010 census, Hinsdale County had a population of 843. The population is spread out, with 48.3% male and 51.7% female. The median age is 44.7 years, and the median household income is $41,944. The county is predominantly white, with 92.2% of the population identifying as white. The county is also home to a small Hispanic population, with 4.2% of the population identifying as Hispanic or Latino.
Conclusion
Hinsdale County is a small, but diverse county located in the southwestern corner of Colorado. The county is home to the San Juan National Forest, which covers much of the county. The county has a small, but diverse economy, and is home to several small businesses, tourist attractions, mining operations, ranches, and logging operations. The county has a population of 843, and is predominantly white, with a small Hispanic population.
Common Questions
What is Per Capita Income in Hinsdale County?
Per Capita income in Hinsdale County is $46,944.
What is the Median Family Income in Hinsdale County?
Median Family Income in Hinsdale County is $73,977.
What is the Median Household income in Hinsdale County?
Median Household Income in Hinsdale County is $58,712.
What is Income or Wage Gap in Hinsdale County?
Income or Wage Gap in Hinsdale County is 37.0%.
Women in Hinsdale County earn 63.0 cents for every dollar earned by a man.
What is Inequality or Gini Index in Hinsdale County?
Inequality or Gini Index in Hinsdale County is 0.45.
What is the Total Population of Hinsdale County?
Total Population of Hinsdale County is 911.
What is the Total Male Population of Hinsdale County?
Total Male Population of Hinsdale County is 425.
What is the Total Female Population of Hinsdale County?
Total Female Population of Hinsdale County is 486.
What is the Ratio of Males per 100 Females in Hinsdale County?
There are 87.45 Males per 100 Females in Hinsdale County.
What is the Ratio of Females per 100 Males in Hinsdale County?
There are 114.35 Females per 100 Males in Hinsdale County.
What is the Median Population Age in Hinsdale County?
Median Population Age in Hinsdale County is 56.9 Years.
What is the Average Family Size in Hinsdale County
Average Family Size in Hinsdale County is 2.3 People.
What is the Average Household Size in Hinsdale County
Average Household Size in Hinsdale County is 1.9 People.
How Large is the Labor Force in Hinsdale County?
There are 423 People in the Labor Forcein in Hinsdale County.
What is the Percentage of People in the Labor Force in Hinsdale County?
51.6% of People are in the Labor Force in Hinsdale County.
What is the Unemployment Rate in Hinsdale County?
Unemployment Rate in Hinsdale County is 1.9%.