Grand County, CO Map & Demographics
Grand County Overview
$43,553
PER CAPITA INCOME
$104,579
AVG FAMILY INCOME
$79,367
AVG HOUSEHOLD INCOME
22.7%
WAGE / INCOME GAP [ % ]
77.3¢/ $1
WAGE / INCOME GAP [ $ ]
$10,116
FAMILY INCOME DEFICIT
0.42
INEQUALITY / GINI INDEX
15,724
TOTAL POPULATION
8,211
MALE POPULATION
7,513
FEMALE POPULATION
109.29
MALES / 100 FEMALES
91.50
FEMALES / 100 MALES
44.6
MEDIAN AGE
3.1
AVG FAMILY SIZE
2.5
AVG HOUSEHOLD SIZE
9,211
LABOR FORCE [ PEOPLE ]
68.5%
PERCENT IN LABOR FORCE
4.6%
UNEMPLOYMENT RATE
Grand County Area Codes
Income in Grand County
Income Overview in Grand County
Per Capita Income in Grand County is $43,553, while median incomes of families and households are $104,579 and $79,367 respectively.
| Characteristic | Number | Measure |
| Per Capita Income | 15,724 | $43,553 |
| Median Family Income | 3,687 | $104,579 |
| Mean Family Income | 3,687 | $122,709 |
| Median Household Income | 6,238 | $79,367 |
| Mean Household Income | 6,238 | $97,139 |
| Income Deficit | 3,687 | $10,116 |
| Wage / Income Gap (%) | 15,724 | 22.68% |
| Wage / Income Gap ($) | 15,724 | 77.32¢ per $1 |
| Gini / Inequality Index | 15,724 | 0.42 |
Earnings by Sex in Grand County
Average Earnings in Grand County are $43,160, $49,701 for men and $38,430 for women, a difference of 22.7%.
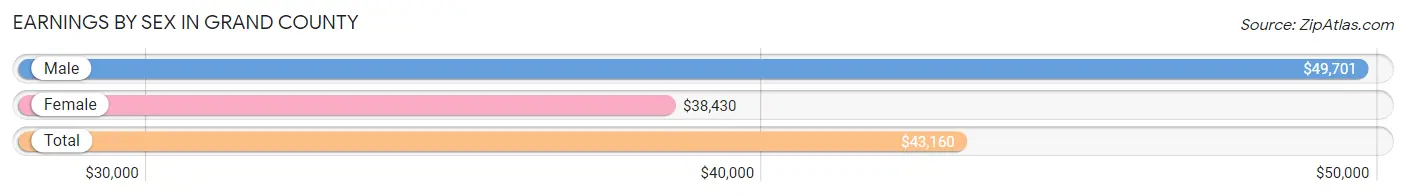
| Sex | Number | Average Earnings |
| Male | 5,252 (55.1%) | $49,701 |
| Female | 4,278 (44.9%) | $38,430 |
| Total | 9,530 (100.0%) | $43,160 |
Earnings by Sex by Income Bracket in Grand County
The most common earnings brackets in Grand County are $100,000+ for men (1,065 | 20.3%) and $40,000 to $44,999 for women (600 | 14.0%).
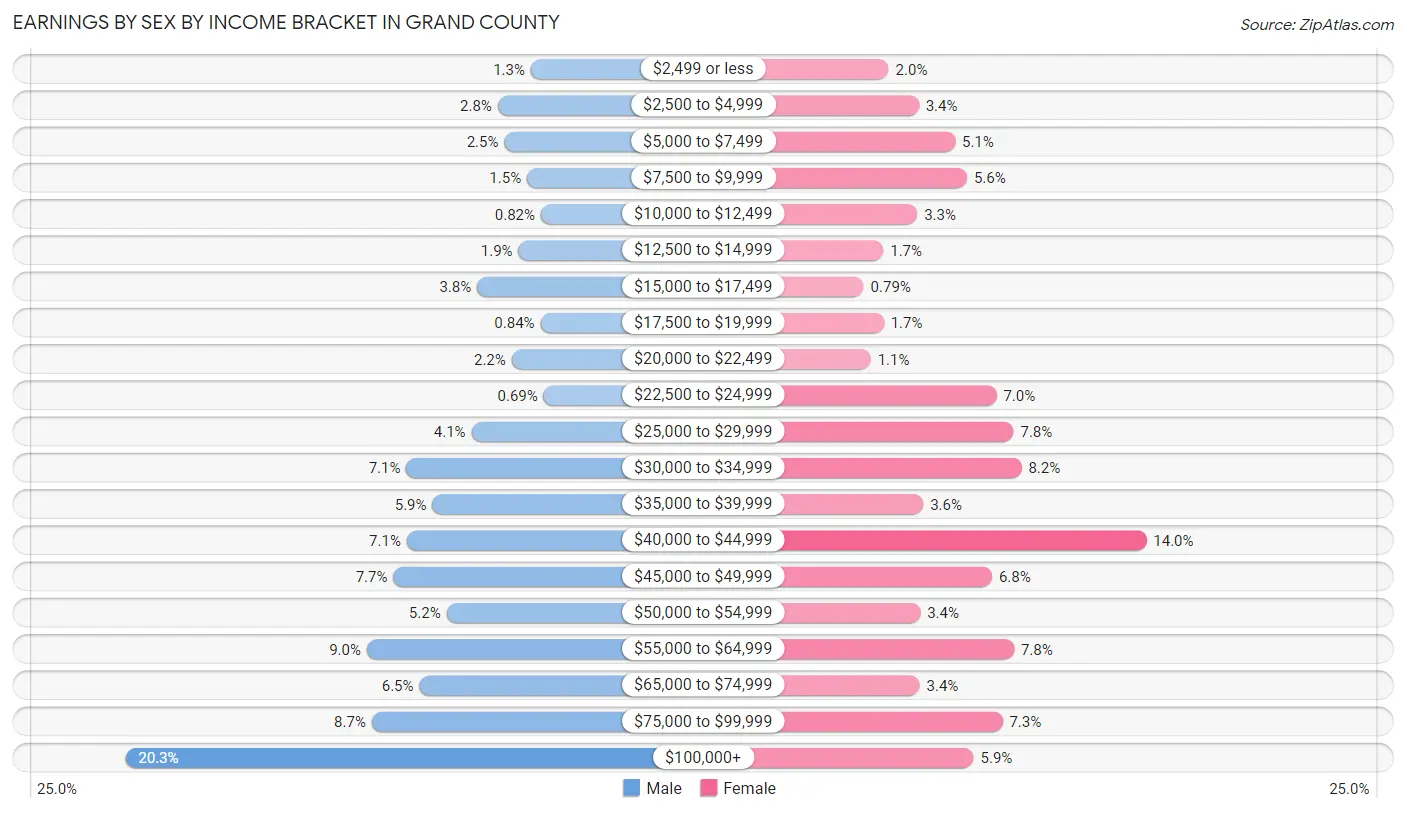
| Income | Male | Female |
| $2,499 or less | 68 (1.3%) | 84 (2.0%) |
| $2,500 to $4,999 | 149 (2.8%) | 144 (3.4%) |
| $5,000 to $7,499 | 133 (2.5%) | 217 (5.1%) |
| $7,500 to $9,999 | 77 (1.5%) | 241 (5.6%) |
| $10,000 to $12,499 | 43 (0.8%) | 141 (3.3%) |
| $12,500 to $14,999 | 98 (1.9%) | 73 (1.7%) |
| $15,000 to $17,499 | 200 (3.8%) | 34 (0.8%) |
| $17,500 to $19,999 | 44 (0.8%) | 74 (1.7%) |
| $20,000 to $22,499 | 115 (2.2%) | 48 (1.1%) |
| $22,500 to $24,999 | 36 (0.7%) | 300 (7.0%) |
| $25,000 to $29,999 | 214 (4.1%) | 334 (7.8%) |
| $30,000 to $34,999 | 374 (7.1%) | 350 (8.2%) |
| $35,000 to $39,999 | 310 (5.9%) | 153 (3.6%) |
| $40,000 to $44,999 | 373 (7.1%) | 600 (14.0%) |
| $45,000 to $49,999 | 406 (7.7%) | 291 (6.8%) |
| $50,000 to $54,999 | 275 (5.2%) | 147 (3.4%) |
| $55,000 to $64,999 | 471 (9.0%) | 335 (7.8%) |
| $65,000 to $74,999 | 342 (6.5%) | 146 (3.4%) |
| $75,000 to $99,999 | 459 (8.7%) | 312 (7.3%) |
| $100,000+ | 1,065 (20.3%) | 254 (5.9%) |
| Total | 5,252 (100.0%) | 4,278 (100.0%) |
Earnings by Sex by Educational Attainment in Grand County
Average earnings in Grand County are $52,474 for men and $41,573 for women, a difference of 20.8%. Men with an educational attainment of graduate degree enjoy the highest average annual earnings of $110,469, while those with high school diploma education earn the least with $46,852. Women with an educational attainment of graduate degree earn the most with the average annual earnings of $46,575, while those with high school diploma education have the smallest earnings of $29,558.
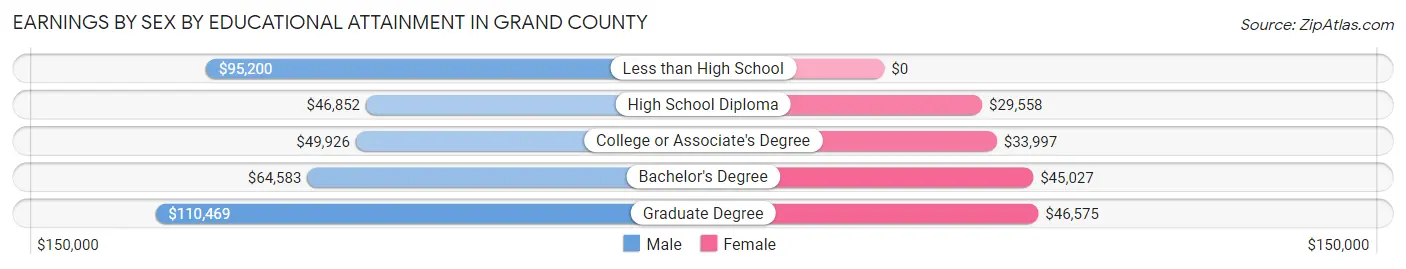
| Educational Attainment | Male Income | Female Income |
| Less than High School | $95,200 | $0 |
| High School Diploma | $46,852 | $29,558 |
| College or Associate's Degree | $49,926 | $33,997 |
| Bachelor's Degree | $64,583 | $45,027 |
| Graduate Degree | $110,469 | $46,575 |
| Total | $52,474 | $41,573 |
Family Income in Grand County
Family Income Brackets in Grand County
According to the Grand County family income data, there are 1,069 families falling into the $100,000 to $149,999 income range, which is the most common income bracket and makes up 29.0% of all families. Conversely, the $15,000 to $24,999 income bracket is the least frequent group with only 7 families (0.2%) belonging to this category.
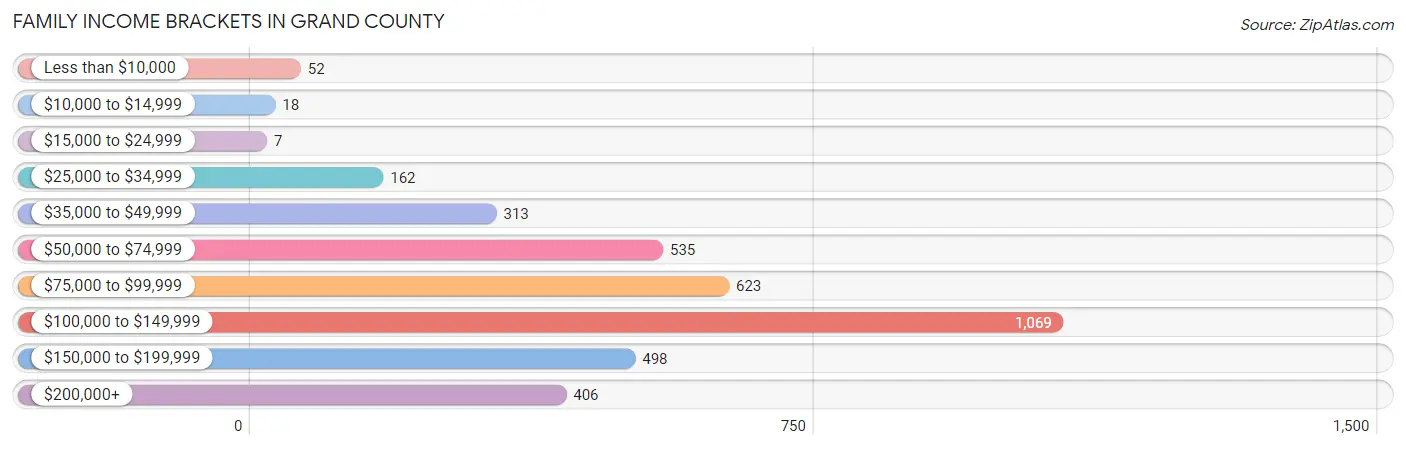
| Income Bracket | # Families | % Families |
| Less than $10,000 | 52 | 1.4% |
| $10,000 to $14,999 | 18 | 0.5% |
| $15,000 to $24,999 | 7 | 0.2% |
| $25,000 to $34,999 | 162 | 4.4% |
| $35,000 to $49,999 | 313 | 8.5% |
| $50,000 to $74,999 | 535 | 14.5% |
| $75,000 to $99,999 | 623 | 16.9% |
| $100,000 to $149,999 | 1,069 | 29.0% |
| $150,000 to $199,999 | 498 | 13.5% |
| $200,000+ | 406 | 11.0% |
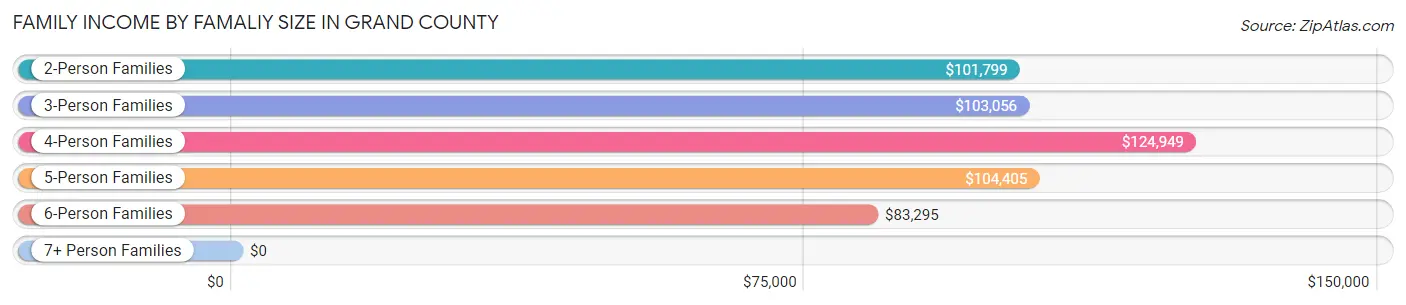
Family Income by Famaliy Size in Grand County
4-person families (478 | 13.0%) account for the highest median family income in Grand County with $124,949 per family, while 2-person families (2,487 | 67.4%) have the highest median income of $50,900 per family member.
| Income Bracket | # Families | Median Income |
| 2-Person Families | 2,487 (67.4%) | $101,799 |
| 3-Person Families | 510 (13.8%) | $103,056 |
| 4-Person Families | 478 (13.0%) | $124,949 |
| 5-Person Families | 134 (3.6%) | $104,405 |
| 6-Person Families | 73 (2.0%) | $83,295 |
| 7+ Person Families | 5 (0.1%) | $0 |
| Total | 3,687 (100.0%) | $104,579 |
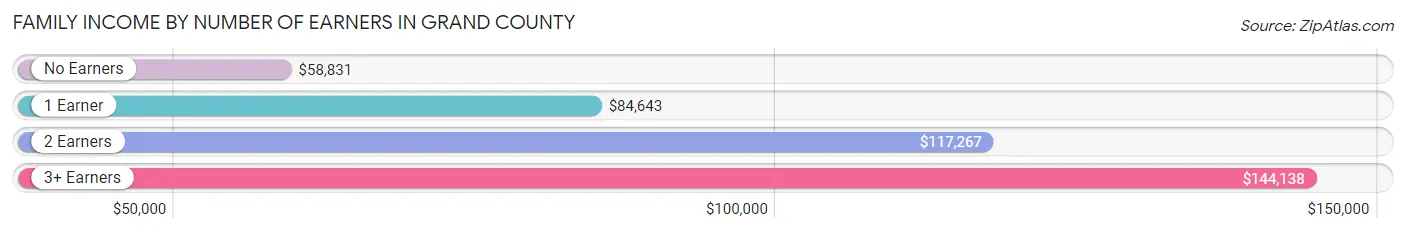
Family Income by Number of Earners in Grand County
The median family income in Grand County is $104,579, with families comprising 3+ earners (224) having the highest median family income of $144,138, while families with no earners (653) have the lowest median family income of $58,831, accounting for 6.1% and 17.7% of families, respectively.
| Number of Earners | # Families | Median Income |
| No Earners | 653 (17.7%) | $58,831 |
| 1 Earner | 760 (20.6%) | $84,643 |
| 2 Earners | 2,050 (55.6%) | $117,267 |
| 3+ Earners | 224 (6.1%) | $144,138 |
| Total | 3,687 (100.0%) | $104,579 |
Household Income in Grand County
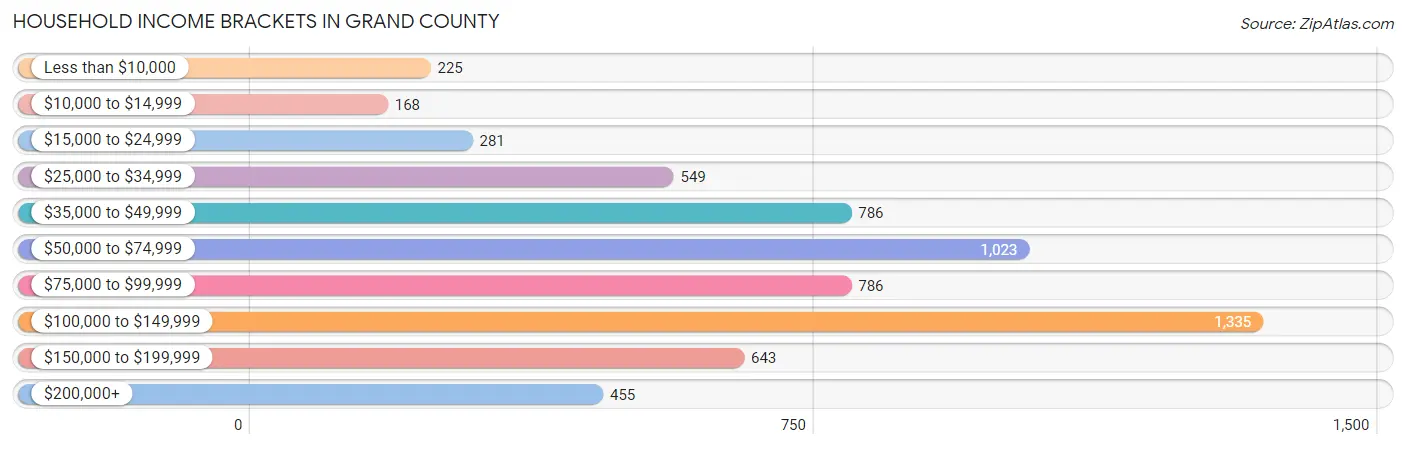
Household Income Brackets in Grand County
With 1,335 households falling in the category, the $100,000 to $149,999 income range is the most frequent in Grand County, accounting for 21.4% of all households. In contrast, only 168 households (2.7%) fall into the $10,000 to $14,999 income bracket, making it the least populous group.
| Income Bracket | # Households | % Households |
| Less than $10,000 | 225 | 3.6% |
| $10,000 to $14,999 | 168 | 2.7% |
| $15,000 to $24,999 | 281 | 4.5% |
| $25,000 to $34,999 | 549 | 8.8% |
| $35,000 to $49,999 | 786 | 12.6% |
| $50,000 to $74,999 | 1,023 | 16.4% |
| $75,000 to $99,999 | 786 | 12.6% |
| $100,000 to $149,999 | 1,335 | 21.4% |
| $150,000 to $199,999 | 643 | 10.3% |
| $200,000+ | 455 | 7.3% |
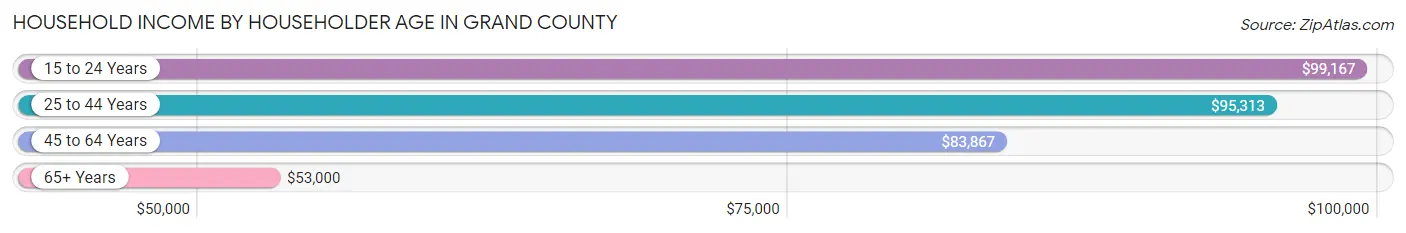
Household Income by Householder Age in Grand County
The median household income in Grand County is $79,367, with the highest median household income of $99,167 found in the 15 to 24 years age bracket for the primary householder. A total of 100 households (1.6%) fall into this category. Meanwhile, the 65+ years age bracket for the primary householder has the lowest median household income of $53,000, with 1,760 households (28.2%) in this group.
| Income Bracket | # Households | Median Income |
| 15 to 24 Years | 100 (1.6%) | $99,167 |
| 25 to 44 Years | 1,668 (26.7%) | $95,313 |
| 45 to 64 Years | 2,710 (43.4%) | $83,867 |
| 65+ Years | 1,760 (28.2%) | $53,000 |
| Total | 6,238 (100.0%) | $79,367 |
Poverty in Grand County
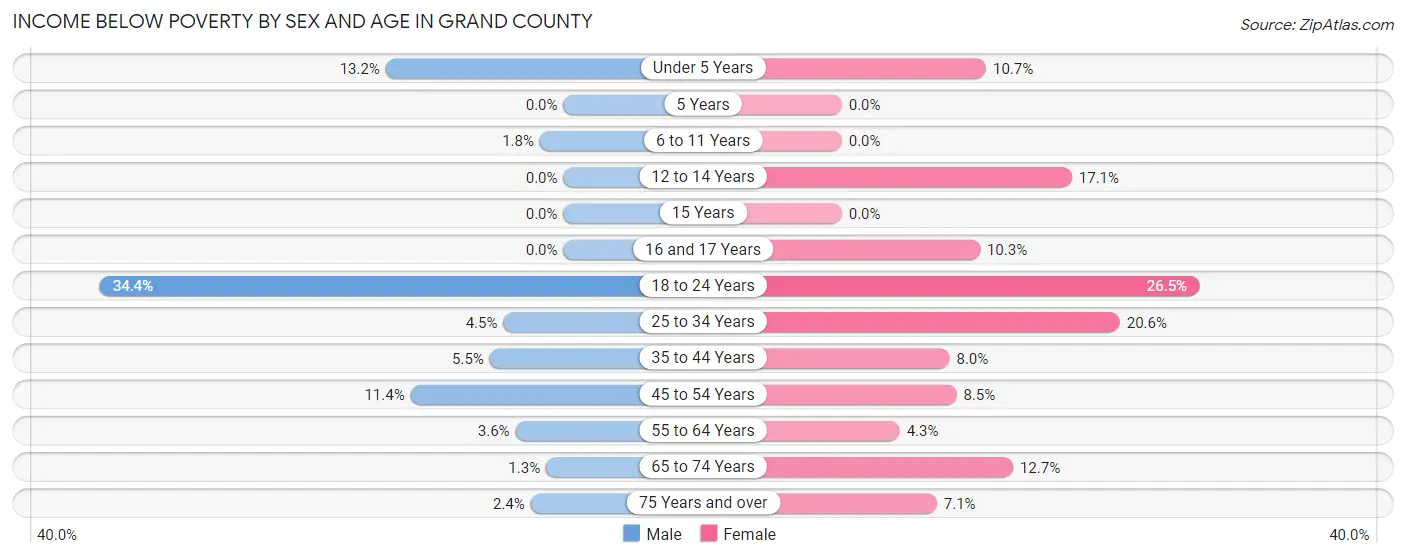
Income Below Poverty by Sex and Age in Grand County
With 6.7% poverty level for males and 10.7% for females among the residents of Grand County, 18 to 24 year old males and 18 to 24 year old females are the most vulnerable to poverty, with 191 males (34.4%) and 114 females (26.5%) in their respective age groups living below the poverty level.
| Age Bracket | Male | Female |
| Under 5 Years | 38 (13.2%) | 39 (10.7%) |
| 5 Years | 0 (0.0%) | 0 (0.0%) |
| 6 to 11 Years | 8 (1.8%) | 0 (0.0%) |
| 12 to 14 Years | 0 (0.0%) | 48 (17.1%) |
| 15 Years | 0 (0.0%) | 0 (0.0%) |
| 16 and 17 Years | 0 (0.0%) | 32 (10.3%) |
| 18 to 24 Years | 191 (34.4%) | 114 (26.5%) |
| 25 to 34 Years | 58 (4.5%) | 199 (20.6%) |
| 35 to 44 Years | 57 (5.5%) | 69 (8.0%) |
| 45 to 54 Years | 119 (11.4%) | 88 (8.5%) |
| 55 to 64 Years | 48 (3.6%) | 59 (4.3%) |
| 65 to 74 Years | 15 (1.3%) | 121 (12.7%) |
| 75 Years and over | 12 (2.4%) | 30 (7.1%) |
| Total | 546 (6.7%) | 799 (10.7%) |
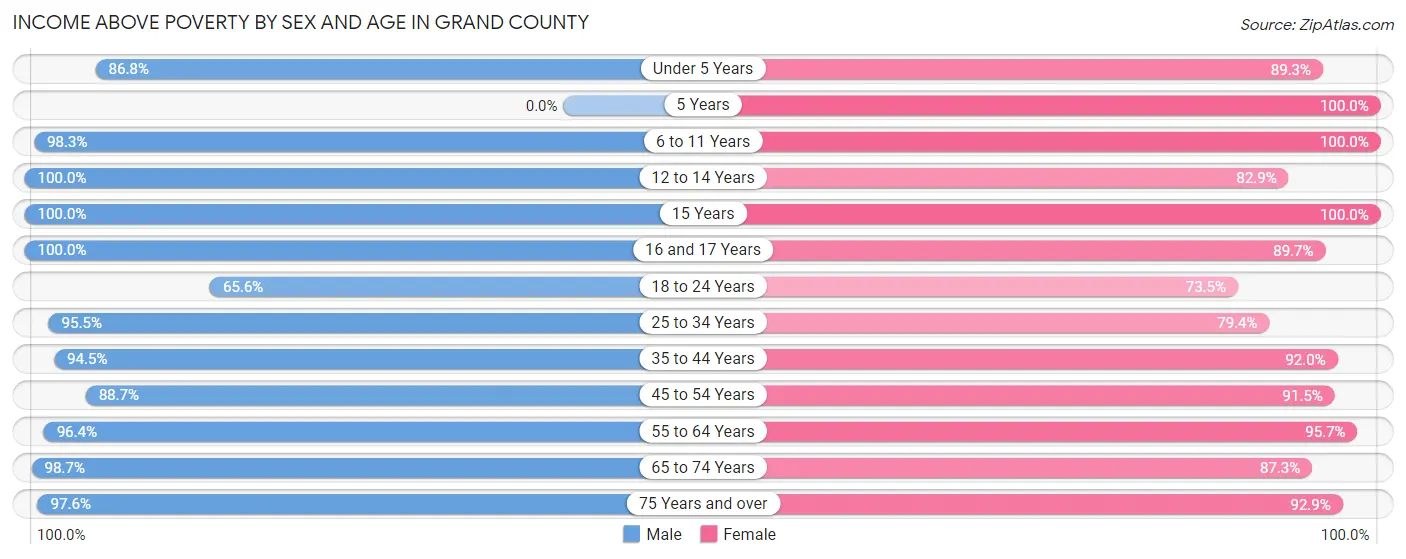
Income Above Poverty by Sex and Age in Grand County
According to the poverty statistics in Grand County, males aged 12 to 14 years and females aged 5 years are the age groups that are most secure financially, with 100.0% of males and 100.0% of females in these age groups living above the poverty line.
| Age Bracket | Male | Female |
| Under 5 Years | 250 (86.8%) | 325 (89.3%) |
| 5 Years | 0 (0.0%) | 49 (100.0%) |
| 6 to 11 Years | 449 (98.3%) | 392 (100.0%) |
| 12 to 14 Years | 288 (100.0%) | 233 (82.9%) |
| 15 Years | 100 (100.0%) | 58 (100.0%) |
| 16 and 17 Years | 102 (100.0%) | 280 (89.7%) |
| 18 to 24 Years | 364 (65.6%) | 316 (73.5%) |
| 25 to 34 Years | 1,242 (95.5%) | 765 (79.4%) |
| 35 to 44 Years | 985 (94.5%) | 794 (92.0%) |
| 45 to 54 Years | 929 (88.6%) | 945 (91.5%) |
| 55 to 64 Years | 1,299 (96.4%) | 1,314 (95.7%) |
| 65 to 74 Years | 1,147 (98.7%) | 831 (87.3%) |
| 75 Years and over | 482 (97.6%) | 395 (92.9%) |
| Total | 7,637 (93.3%) | 6,697 (89.3%) |
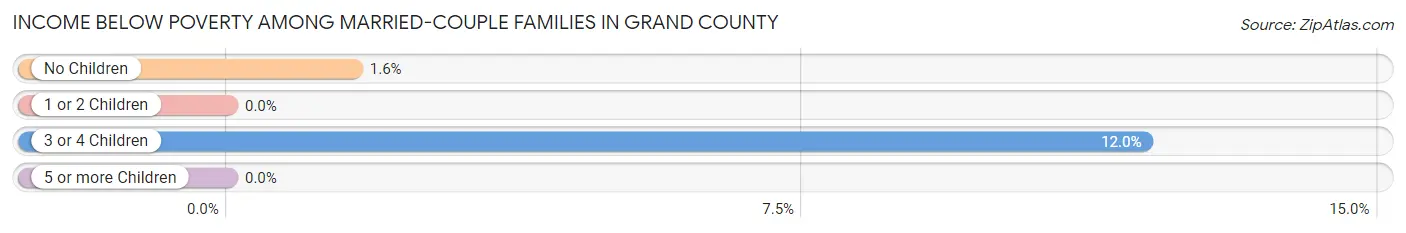
Income Below Poverty Among Married-Couple Families in Grand County
The poverty statistics for married-couple families in Grand County show that 1.8% or 60 of the total 3,316 families live below the poverty line. Families with 3 or 4 children have the highest poverty rate of 11.9%, comprising of 19 families. On the other hand, families with 1 or 2 children have the lowest poverty rate of 0.0%, which includes 0 families.
| Children | Above Poverty | Below Poverty |
| No Children | 2,473 (98.4%) | 41 (1.6%) |
| 1 or 2 Children | 638 (100.0%) | 0 (0.0%) |
| 3 or 4 Children | 140 (88.0%) | 19 (11.9%) |
| 5 or more Children | 5 (100.0%) | 0 (0.0%) |
| Total | 3,256 (98.2%) | 60 (1.8%) |
Income Below Poverty Among Single-Parent Households in Grand County
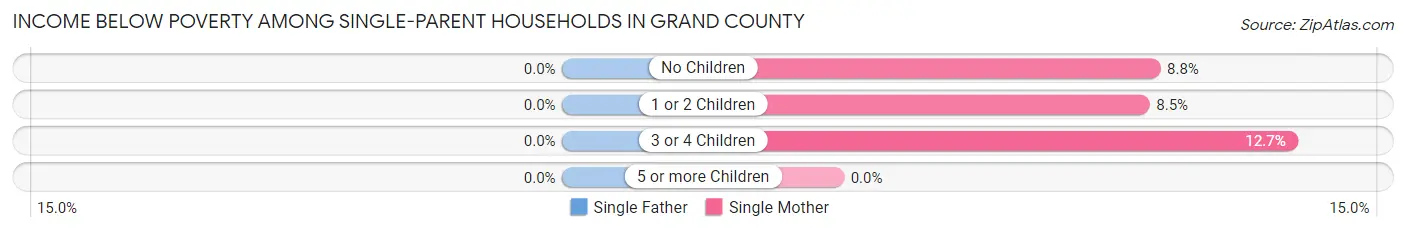
| Children | Single Father | Single Mother |
| No Children | 0 (0.0%) | 13 (8.8%) |
| 1 or 2 Children | 0 (0.0%) | 7 (8.5%) |
| 3 or 4 Children | 0 (0.0%) | 9 (12.7%) |
| 5 or more Children | 0 (0.0%) | 0 (0.0%) |
| Total | 0 (0.0%) | 29 (9.7%) |
Income Below Poverty Among Married-Couple vs Single-Parent Households in Grand County
The poverty data for Grand County shows that 60 of the married-couple family households (1.8%) and 29 of the single-parent households (7.8%) are living below the poverty level. Within the married-couple family households, those with 3 or 4 children have the highest poverty rate, with 19 households (11.9%) falling below the poverty line. Among the single-parent households, those with 3 or 4 children have the highest poverty rate, with 9 household (12.7%) living below poverty.
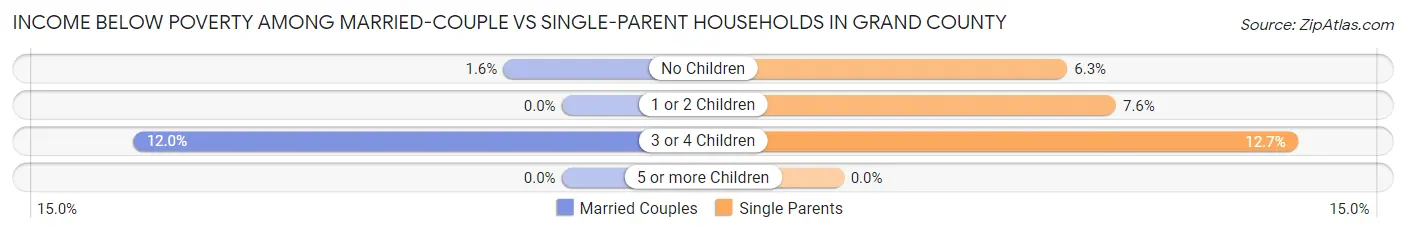
| Children | Married-Couple Families | Single-Parent Households |
| No Children | 41 (1.6%) | 13 (6.2%) |
| 1 or 2 Children | 0 (0.0%) | 7 (7.6%) |
| 3 or 4 Children | 19 (11.9%) | 9 (12.7%) |
| 5 or more Children | 0 (0.0%) | 0 (0.0%) |
| Total | 60 (1.8%) | 29 (7.8%) |
Race in Grand County
The most populous races in Grand County are White / Caucasian (13,595 | 86.5%), Two or more Races (1,866 | 11.9%), and Hispanic or Latino (1,543 | 9.8%).
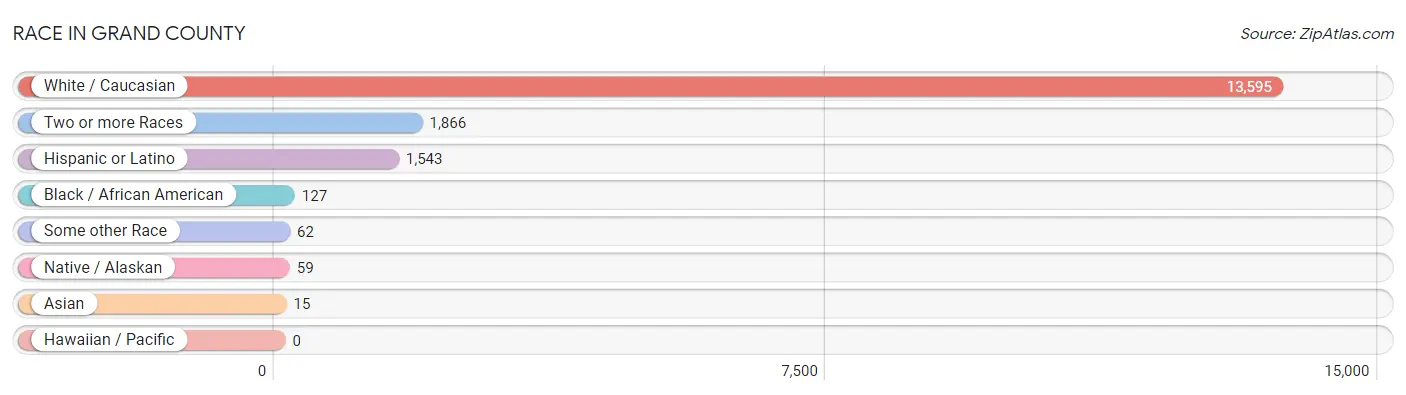
| Race | # Population | % Population |
| Asian | 15 | 0.1% |
| Black / African American | 127 | 0.8% |
| Hawaiian / Pacific | 0 | 0.0% |
| Hispanic or Latino | 1,543 | 9.8% |
| Native / Alaskan | 59 | 0.4% |
| White / Caucasian | 13,595 | 86.5% |
| Two or more Races | 1,866 | 11.9% |
| Some other Race | 62 | 0.4% |
| Total | 15,724 | 100.0% |
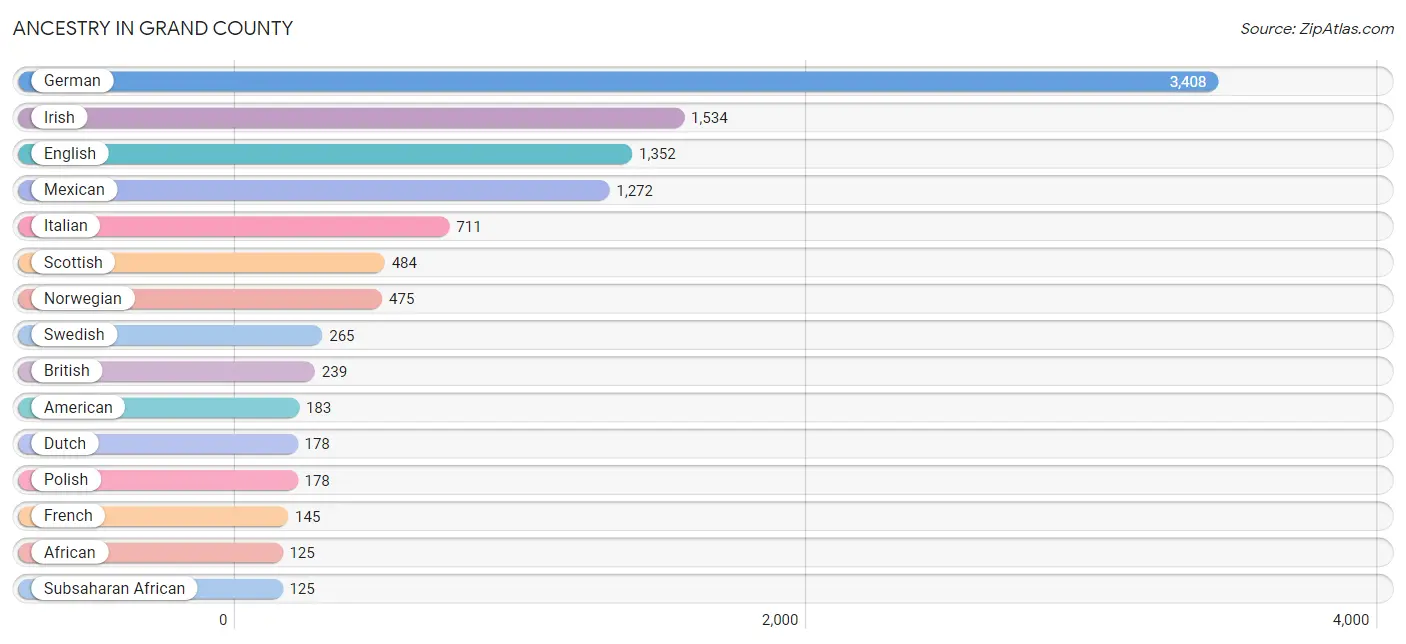
Ancestry in Grand County
The most populous ancestries reported in Grand County are German (3,408 | 21.7%), Irish (1,534 | 9.8%), English (1,352 | 8.6%), Mexican (1,272 | 8.1%), and Italian (711 | 4.5%), together accounting for 52.6% of all Grand County residents.
| Ancestry | # Population | % Population |
| African | 125 | 0.8% |
| American | 183 | 1.2% |
| Apache | 5 | 0.0% |
| Armenian | 9 | 0.1% |
| Austrian | 25 | 0.2% |
| Basque | 10 | 0.1% |
| Belgian | 10 | 0.1% |
| Bhutanese | 18 | 0.1% |
| British | 239 | 1.5% |
| Canadian | 45 | 0.3% |
| Choctaw | 16 | 0.1% |
| Colombian | 34 | 0.2% |
| Croatian | 6 | 0.0% |
| Czech | 71 | 0.4% |
| Danish | 21 | 0.1% |
| Dutch | 178 | 1.1% |
| English | 1,352 | 8.6% |
| European | 44 | 0.3% |
| Finnish | 26 | 0.2% |
| French | 145 | 0.9% |
| French Canadian | 34 | 0.2% |
| German | 3,408 | 21.7% |
| Hungarian | 49 | 0.3% |
| Indian (Asian) | 1 | 0.0% |
| Irish | 1,534 | 9.8% |
| Italian | 711 | 4.5% |
| Jamaican | 22 | 0.1% |
| Latvian | 44 | 0.3% |
| Lithuanian | 98 | 0.6% |
| Luxembourger | 53 | 0.3% |
| Mexican | 1,272 | 8.1% |
| Mexican American Indian | 75 | 0.5% |
| Native Hawaiian | 3 | 0.0% |
| Navajo | 21 | 0.1% |
| Norwegian | 475 | 3.0% |
| Peruvian | 3 | 0.0% |
| Polish | 178 | 1.1% |
| Portuguese | 8 | 0.1% |
| Pueblo | 17 | 0.1% |
| Puerto Rican | 61 | 0.4% |
| Romanian | 3 | 0.0% |
| Russian | 20 | 0.1% |
| Scandinavian | 2 | 0.0% |
| Scotch-Irish | 119 | 0.8% |
| Scottish | 484 | 3.1% |
| Slovak | 42 | 0.3% |
| Slovene | 45 | 0.3% |
| South American | 47 | 0.3% |
| Spaniard | 97 | 0.6% |
| Spanish | 38 | 0.2% |
| Subsaharan African | 125 | 0.8% |
| Swedish | 265 | 1.7% |
| Swiss | 20 | 0.1% |
| Turkish | 53 | 0.3% |
| Uruguayan | 10 | 0.1% |
| Welsh | 117 | 0.7% |
| Yugoslavian | 9 | 0.1% | View All 57 Rows |
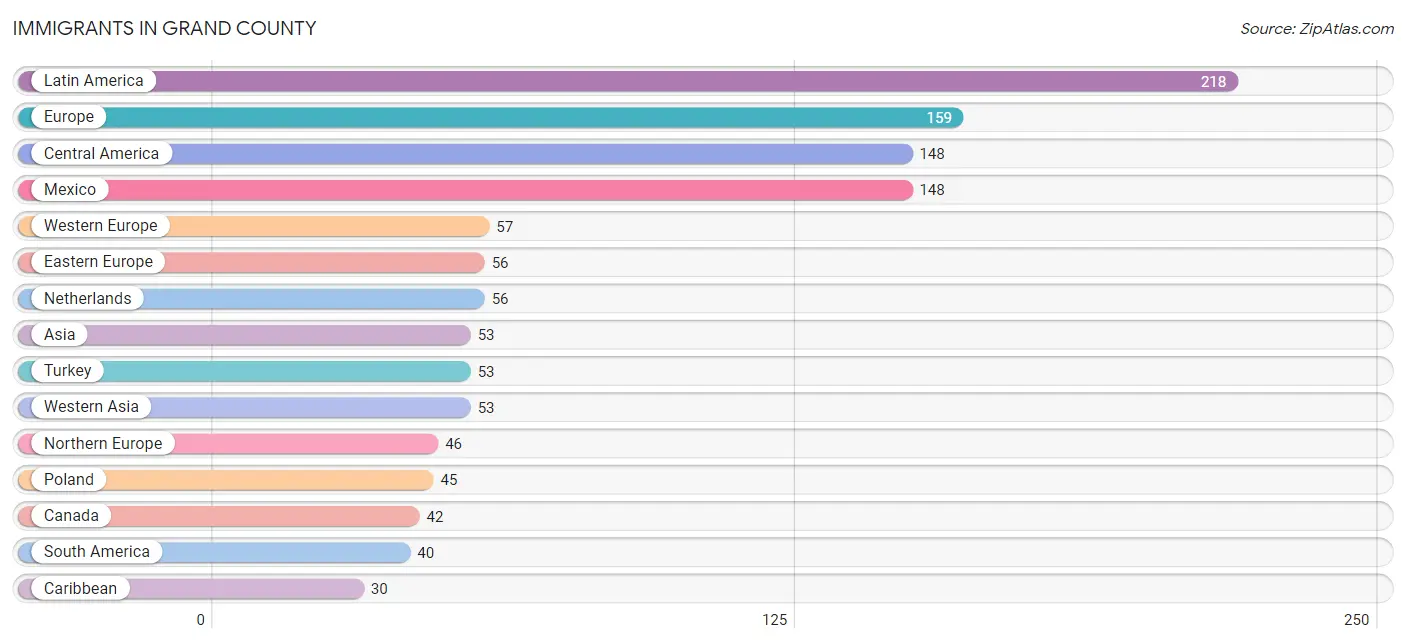
Immigrants in Grand County
The most numerous immigrant groups reported in Grand County came from Latin America (218 | 1.4%), Europe (159 | 1.0%), Central America (148 | 0.9%), Mexico (148 | 0.9%), and Western Europe (57 | 0.4%), together accounting for 4.6% of all Grand County residents.
| Immigration Origin | # Population | % Population |
| Asia | 53 | 0.3% |
| Brazil | 15 | 0.1% |
| Canada | 42 | 0.3% |
| Caribbean | 30 | 0.2% |
| Central America | 148 | 0.9% |
| Colombia | 12 | 0.1% |
| Eastern Europe | 56 | 0.4% |
| England | 16 | 0.1% |
| Europe | 159 | 1.0% |
| Haiti | 8 | 0.1% |
| Jamaica | 22 | 0.1% |
| Latin America | 218 | 1.4% |
| Mexico | 148 | 0.9% |
| Netherlands | 56 | 0.4% |
| Northern Europe | 46 | 0.3% |
| Norway | 10 | 0.1% |
| Peru | 3 | 0.0% |
| Poland | 45 | 0.3% |
| Russia | 11 | 0.1% |
| South America | 40 | 0.3% |
| Sweden | 10 | 0.1% |
| Switzerland | 1 | 0.0% |
| Turkey | 53 | 0.3% |
| Uruguay | 10 | 0.1% |
| Western Asia | 53 | 0.3% |
| Western Europe | 57 | 0.4% | View All 26 Rows |
Sex and Age in Grand County
Sex and Age in Grand County
The most populous age groups in Grand County are 60 to 64 Years (734 | 8.9%) for men and 60 to 64 Years (807 | 10.7%) for women.
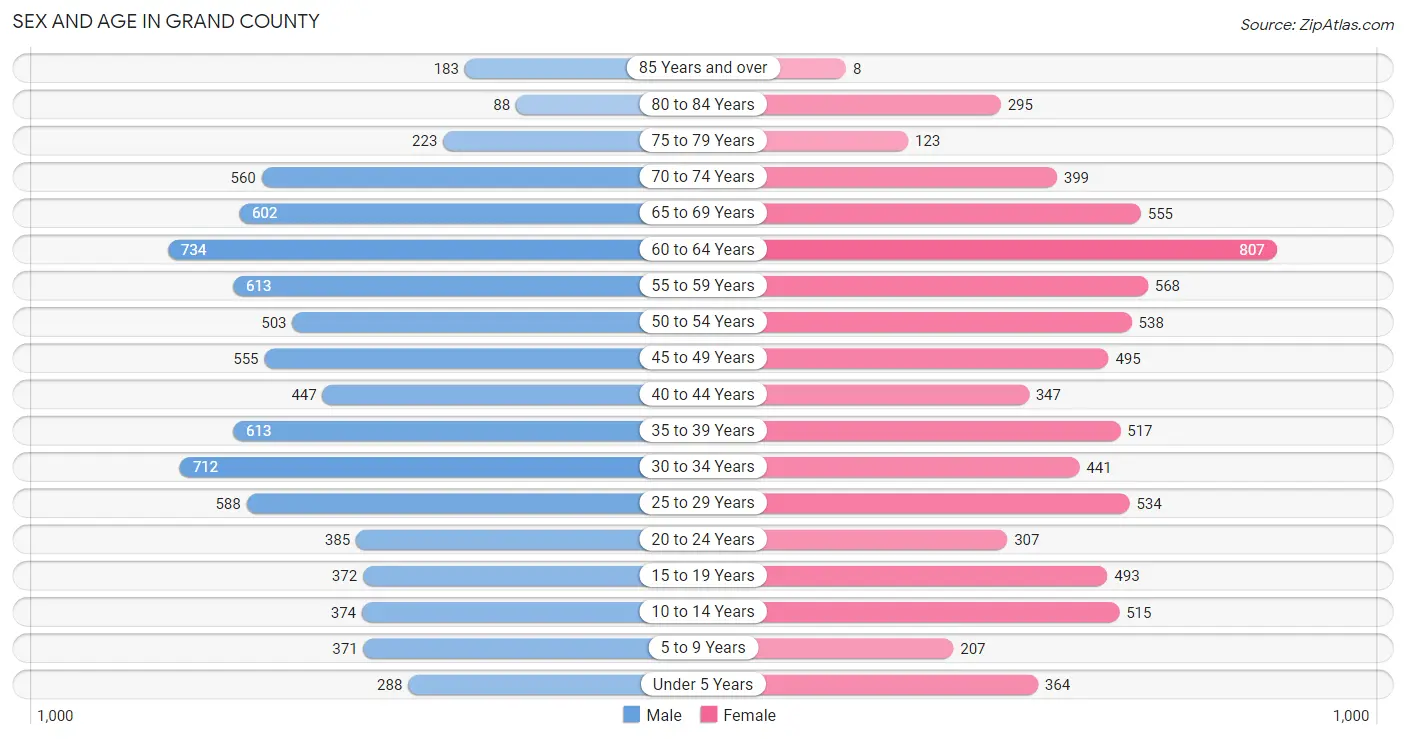
| Age Bracket | Male | Female |
| Under 5 Years | 288 (3.5%) | 364 (4.8%) |
| 5 to 9 Years | 371 (4.5%) | 207 (2.8%) |
| 10 to 14 Years | 374 (4.5%) | 515 (6.9%) |
| 15 to 19 Years | 372 (4.5%) | 493 (6.6%) |
| 20 to 24 Years | 385 (4.7%) | 307 (4.1%) |
| 25 to 29 Years | 588 (7.2%) | 534 (7.1%) |
| 30 to 34 Years | 712 (8.7%) | 441 (5.9%) |
| 35 to 39 Years | 613 (7.5%) | 517 (6.9%) |
| 40 to 44 Years | 447 (5.4%) | 347 (4.6%) |
| 45 to 49 Years | 555 (6.8%) | 495 (6.6%) |
| 50 to 54 Years | 503 (6.1%) | 538 (7.2%) |
| 55 to 59 Years | 613 (7.5%) | 568 (7.6%) |
| 60 to 64 Years | 734 (8.9%) | 807 (10.7%) |
| 65 to 69 Years | 602 (7.3%) | 555 (7.4%) |
| 70 to 74 Years | 560 (6.8%) | 399 (5.3%) |
| 75 to 79 Years | 223 (2.7%) | 123 (1.6%) |
| 80 to 84 Years | 88 (1.1%) | 295 (3.9%) |
| 85 Years and over | 183 (2.2%) | 8 (0.1%) |
| Total | 8,211 (100.0%) | 7,513 (100.0%) |
Families and Households in Grand County
Median Family Size in Grand County
The median family size in Grand County is 3.09 persons per family, with single female/mother families (300 | 8.1%) accounting for the largest median family size of 4.04 persons per family. On the other hand, married-couple families (3,316 | 89.9%) represent the smallest median family size with 2.98 persons per family.
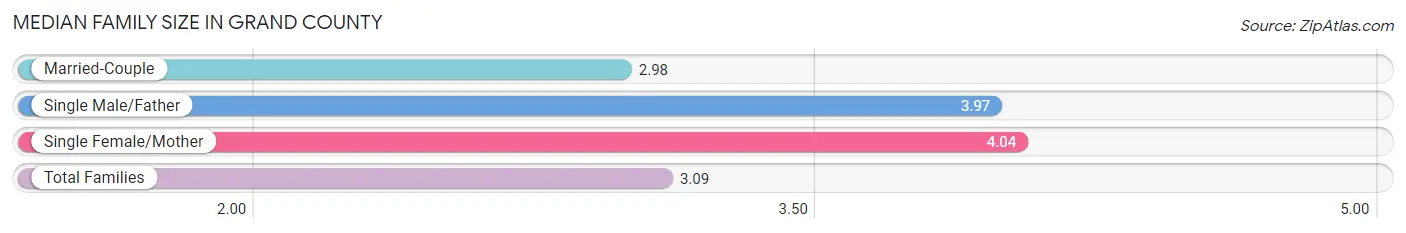
| Family Type | # Families | Family Size |
| Married-Couple | 3,316 (89.9%) | 2.98 |
| Single Male/Father | 71 (1.9%) | 3.97 |
| Single Female/Mother | 300 (8.1%) | 4.04 |
| Total Families | 3,687 (100.0%) | 3.09 |
Median Household Size in Grand County
The median household size in Grand County is 2.47 persons per household, with single female/mother households (300 | 4.8%) accounting for the largest median household size of 4.07 persons per household. non-family households (2,551 | 40.9%) represent the smallest median household size with 1.52 persons per household.
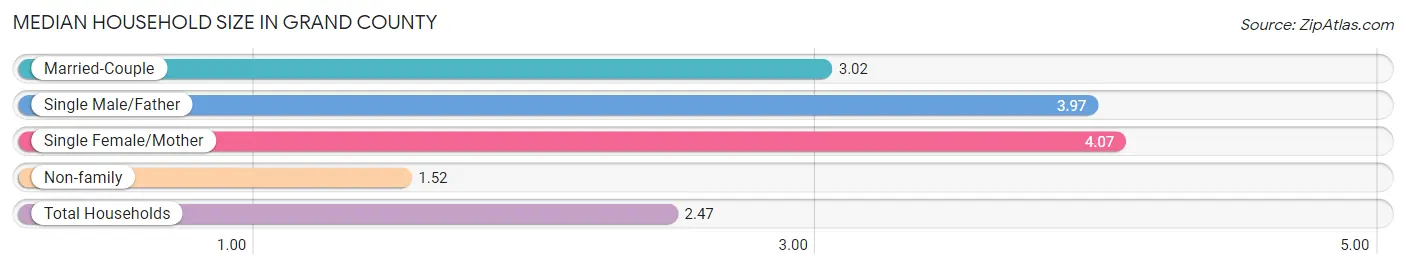
| Household Type | # Households | Household Size |
| Married-Couple | 3,316 (53.2%) | 3.02 |
| Single Male/Father | 71 (1.1%) | 3.97 |
| Single Female/Mother | 300 (4.8%) | 4.07 |
| Non-family | 2,551 (40.9%) | 1.52 |
| Total Households | 6,238 (100.0%) | 2.47 |
Household Size by Marriage Status in Grand County
Out of a total of 6,238 households in Grand County, 3,687 (59.1%) are family households, while 2,551 (40.9%) are nonfamily households. The most numerous type of family households are 2-person households, comprising 2,470, and the most common type of nonfamily households are 1-person households, comprising 2,182.
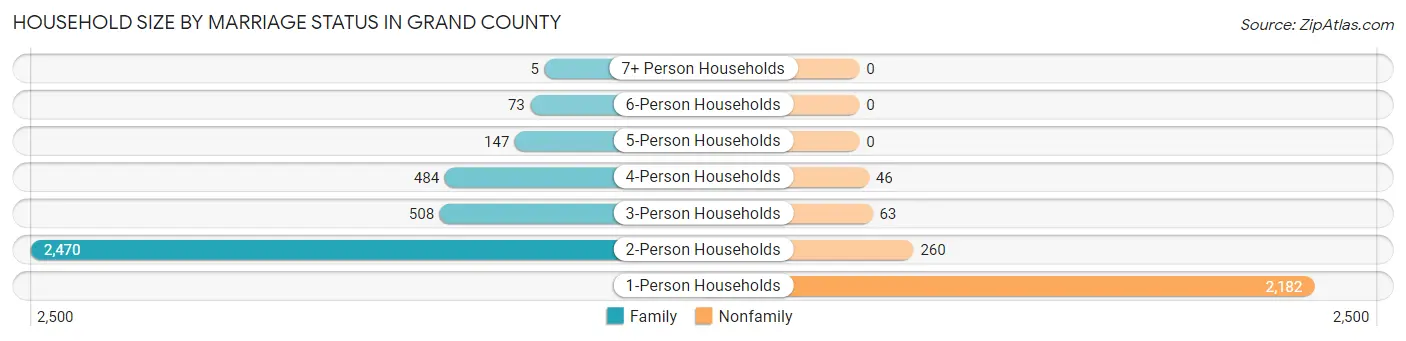
| Household Size | Family Households | Nonfamily Households |
| 1-Person Households | - | 2,182 (35.0%) |
| 2-Person Households | 2,470 (39.6%) | 260 (4.2%) |
| 3-Person Households | 508 (8.1%) | 63 (1.0%) |
| 4-Person Households | 484 (7.8%) | 46 (0.7%) |
| 5-Person Households | 147 (2.4%) | 0 (0.0%) |
| 6-Person Households | 73 (1.2%) | 0 (0.0%) |
| 7+ Person Households | 5 (0.1%) | 0 (0.0%) |
| Total | 3,687 (59.1%) | 2,551 (40.9%) |
Female Fertility in Grand County
Fertility by Age in Grand County
Average fertility rate in Grand County is 29.0 births per 1,000 women. Women in the age bracket of 20 to 34 years have the highest fertility rate with 59.0 births per 1,000 women. Women in the age bracket of 20 to 34 years acount for 78.9% of all women with births.
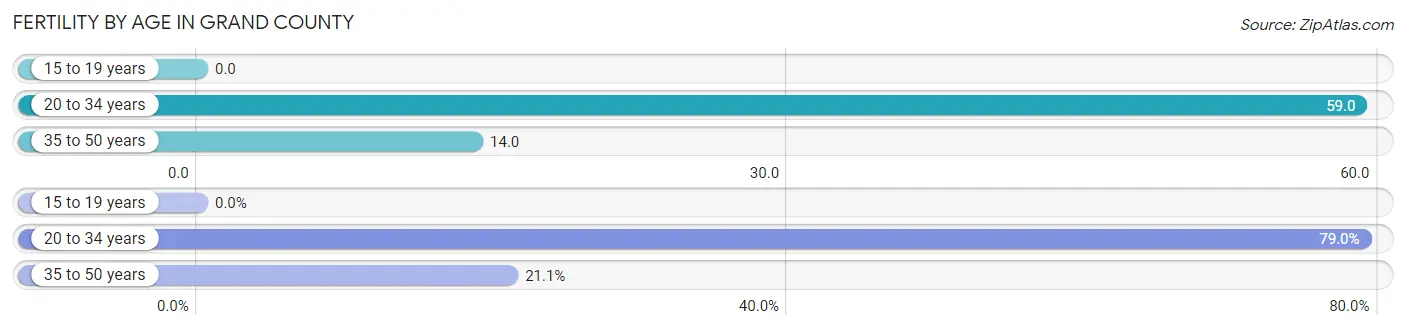
| Age Bracket | Women with Births | Births / 1,000 Women |
| 15 to 19 years | 0 (0.0%) | 0.0 |
| 20 to 34 years | 75 (78.9%) | 59.0 |
| 35 to 50 years | 20 (21.0%) | 14.0 |
| Total | 95 (100.0%) | 29.0 |
Fertility by Age by Marriage Status in Grand County
95.8% of women with births (95) in Grand County are married. The highest percentage of unmarried women with births falls into 35 to 50 years age bracket with 20.0% of them unmarried at the time of birth, while the lowest percentage of unmarried women with births belong to 20 to 34 years age bracket with 0.0% of them unmarried.
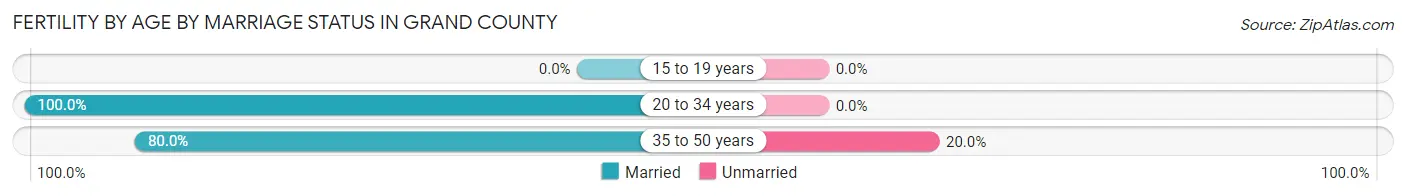
| Age Bracket | Married | Unmarried |
| 15 to 19 years | 0 (0.0%) | 0 (0.0%) |
| 20 to 34 years | 75 (100.0%) | 0 (0.0%) |
| 35 to 50 years | 16 (80.0%) | 4 (20.0%) |
| Total | 91 (95.8%) | 4 (4.2%) |
Fertility by Education in Grand County
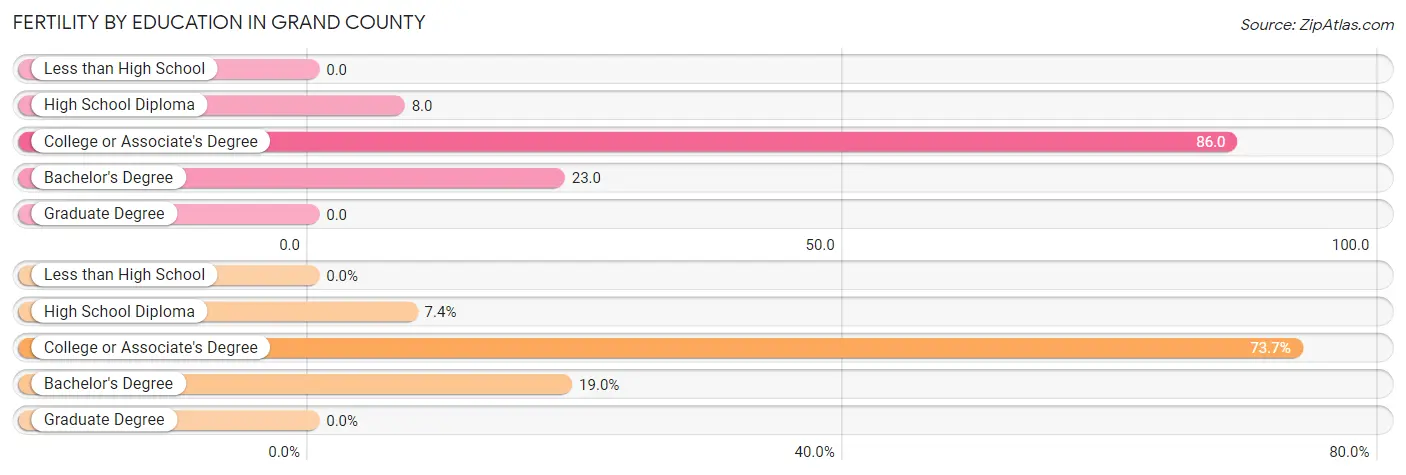
| Educational Attainment | Women with Births | Births / 1,000 Women |
| Less than High School | 0 (0.0%) | 0.0 |
| High School Diploma | 7 (7.4%) | 8.0 |
| College or Associate's Degree | 70 (73.7%) | 86.0 |
| Bachelor's Degree | 18 (19.0%) | 23.0 |
| Graduate Degree | 0 (0.0%) | 0.0 |
| Total | 95 (100.0%) | 29.0 |
Fertility by Education by Marriage Status in Grand County
4.2% of women with births in Grand County are unmarried. Women with the educational attainment of high school diploma are most likely to be married with 100.0% of them married at childbirth, while women with the educational attainment of college or associate's degree are least likely to be married with 5.7% of them unmarried at childbirth.
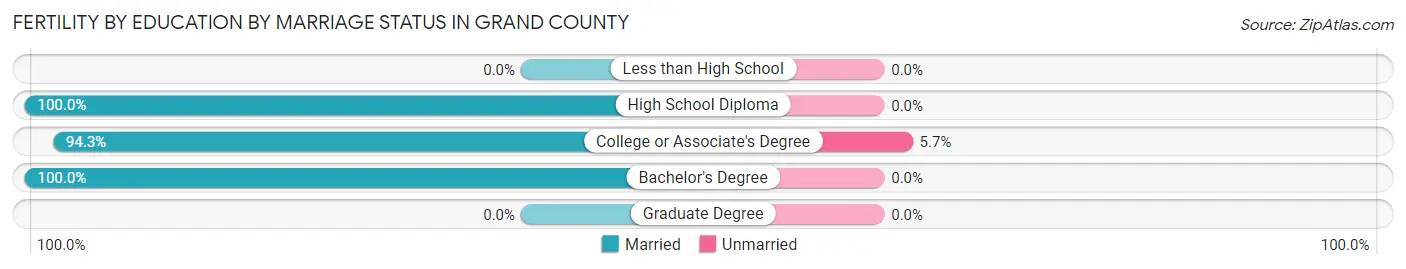
| Educational Attainment | Married | Unmarried |
| Less than High School | 0 (0.0%) | 0 (0.0%) |
| High School Diploma | 7 (100.0%) | 0 (0.0%) |
| College or Associate's Degree | 66 (94.3%) | 4 (5.7%) |
| Bachelor's Degree | 18 (100.0%) | 0 (0.0%) |
| Graduate Degree | 0 (0.0%) | 0 (0.0%) |
| Total | 91 (95.8%) | 4 (4.2%) |
Employment Characteristics in Grand County
Employment by Class of Employer in Grand County
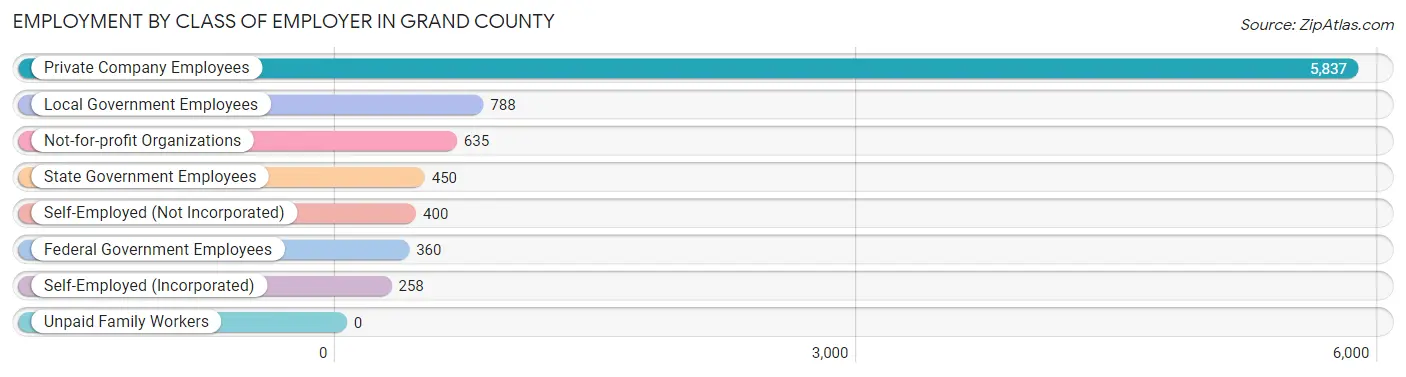
Among the 8,728 employed individuals in Grand County, private company employees (5,837 | 66.9%), local government employees (788 | 9.0%), and not-for-profit organizations (635 | 7.3%) make up the most common classes of employment.
| Employer Class | # Employees | % Employees |
| Private Company Employees | 5,837 | 66.9% |
| Self-Employed (Incorporated) | 258 | 3.0% |
| Self-Employed (Not Incorporated) | 400 | 4.6% |
| Not-for-profit Organizations | 635 | 7.3% |
| Local Government Employees | 788 | 9.0% |
| State Government Employees | 450 | 5.2% |
| Federal Government Employees | 360 | 4.1% |
| Unpaid Family Workers | 0 | 0.0% |
| Total | 8,728 | 100.0% |
Employment Status by Age in Grand County
According to the labor force statistics for Grand County, out of the total population over 16 years of age (13,447), 68.5% or 9,211 individuals are in the labor force, with 4.6% or 424 of them unemployed. The age group with the highest labor force participation rate is 35 to 44 years, with 91.2% or 1,755 individuals in the labor force. Within the labor force, the 30 to 34 years age range has the highest percentage of unemployed individuals, with 24.0% or 240 of them being unemployed.
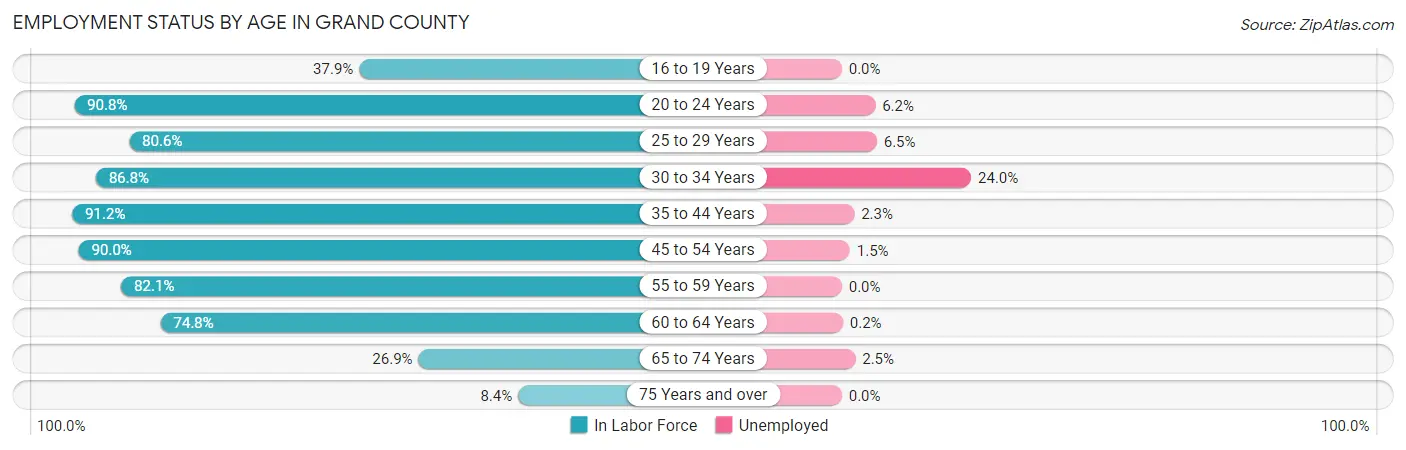
| Age Bracket | In Labor Force | Unemployed |
| 16 to 19 Years | 268 (37.9%) | 0 (0.0%) |
| 20 to 24 Years | 628 (90.8%) | 39 (6.2%) |
| 25 to 29 Years | 904 (80.6%) | 59 (6.5%) |
| 30 to 34 Years | 1,001 (86.8%) | 240 (24.0%) |
| 35 to 44 Years | 1,755 (91.2%) | 40 (2.3%) |
| 45 to 54 Years | 1,882 (90.0%) | 28 (1.5%) |
| 55 to 59 Years | 970 (82.1%) | 0 (0.0%) |
| 60 to 64 Years | 1,153 (74.8%) | 2 (0.2%) |
| 65 to 74 Years | 569 (26.9%) | 14 (2.5%) |
| 75 Years and over | 77 (8.4%) | 0 (0.0%) |
| Total | 9,211 (68.5%) | 424 (4.6%) |
Employment Status by Educational Attainment in Grand County
According to labor force statistics for Grand County, 85.1% of individuals (7,669) out of the total population between 25 and 64 years of age (9,012) are in the labor force, with 4.8% or 368 of them being unemployed. The group with the highest labor force participation rate are those with the educational attainment of bachelor's degree or higher, with 91.4% or 2,796 individuals in the labor force. Within the labor force, individuals with less than high school education have the highest percentage of unemployment, with 20.8% or 69 of them being unemployed.
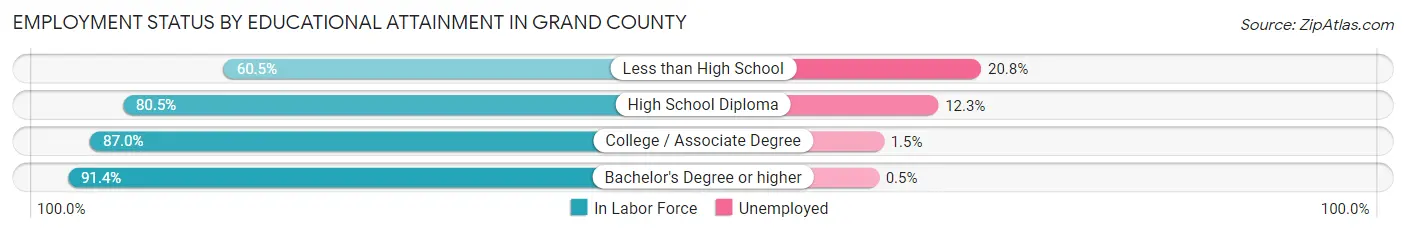
| Educational Attainment | In Labor Force | Unemployed |
| Less than High School | 331 (60.5%) | 114 (20.8%) |
| High School Diploma | 2,013 (80.5%) | 308 (12.3%) |
| College / Associate Degree | 2,527 (87.0%) | 44 (1.5%) |
| Bachelor's Degree or higher | 2,796 (91.4%) | 15 (0.5%) |
| Total | 7,669 (85.1%) | 433 (4.8%) |
Employment Occupations by Sex in Grand County
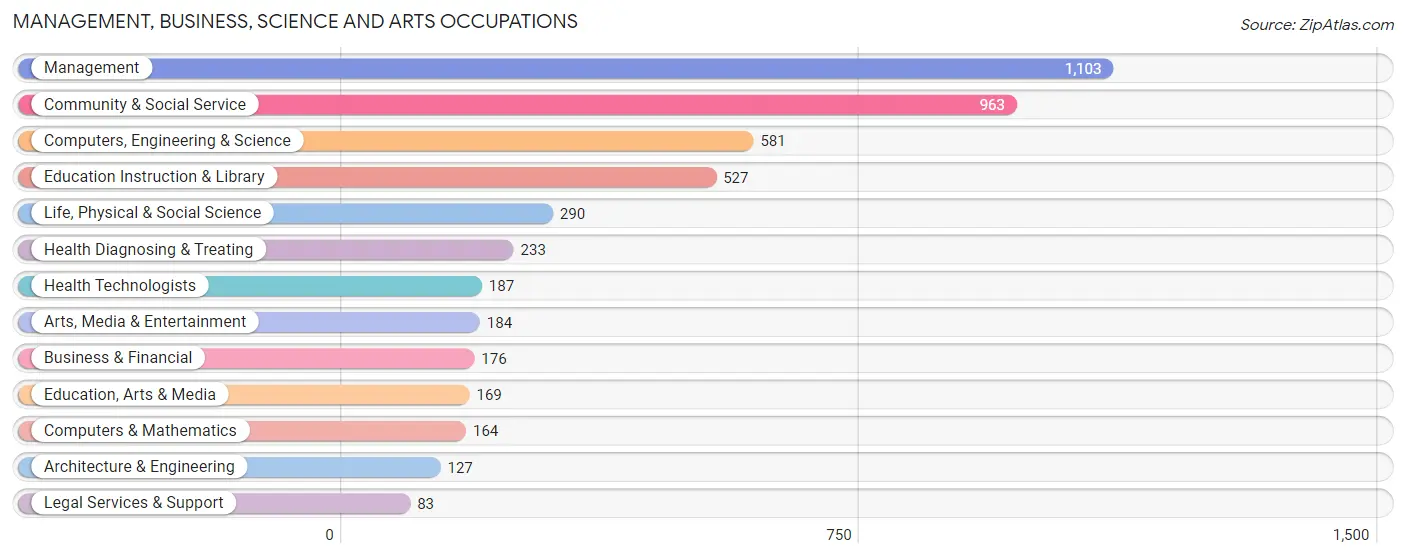
Management, Business, Science and Arts Occupations
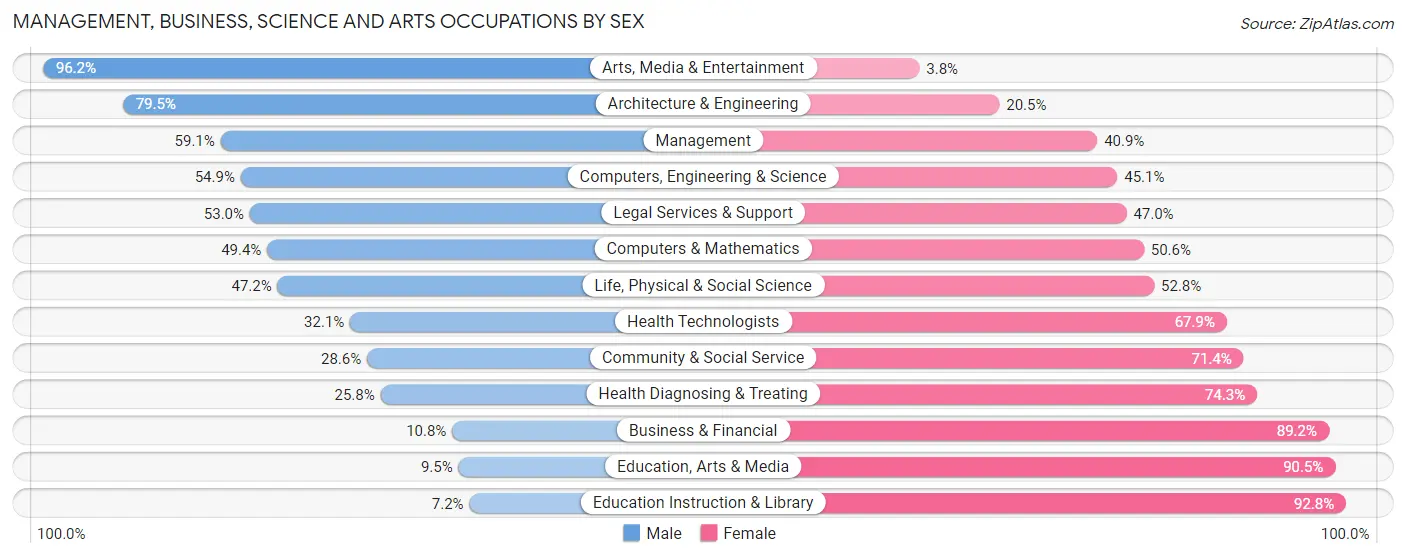
The most common Management, Business, Science and Arts occupations in Grand County are Management (1,103 | 12.6%), Community & Social Service (963 | 11.0%), Computers, Engineering & Science (581 | 6.6%), Education Instruction & Library (527 | 6.0%), and Life, Physical & Social Science (290 | 3.3%).
Management, Business, Science and Arts Occupations by Sex
Within the Management, Business, Science and Arts occupations in Grand County, the most male-oriented occupations are Arts, Media & Entertainment (96.2%), Architecture & Engineering (79.5%), and Management (59.1%), while the most female-oriented occupations are Education Instruction & Library (92.8%), Education, Arts & Media (90.5%), and Business & Financial (89.2%).
| Occupation | Male | Female |
| Management | 652 (59.1%) | 451 (40.9%) |
| Business & Financial | 19 (10.8%) | 157 (89.2%) |
| Computers, Engineering & Science | 319 (54.9%) | 262 (45.1%) |
| Computers & Mathematics | 81 (49.4%) | 83 (50.6%) |
| Architecture & Engineering | 101 (79.5%) | 26 (20.5%) |
| Life, Physical & Social Science | 137 (47.2%) | 153 (52.8%) |
| Community & Social Service | 275 (28.6%) | 688 (71.4%) |
| Education, Arts & Media | 16 (9.5%) | 153 (90.5%) |
| Legal Services & Support | 44 (53.0%) | 39 (47.0%) |
| Education Instruction & Library | 38 (7.2%) | 489 (92.8%) |
| Arts, Media & Entertainment | 177 (96.2%) | 7 (3.8%) |
| Health Diagnosing & Treating | 60 (25.8%) | 173 (74.3%) |
| Health Technologists | 60 (32.1%) | 127 (67.9%) |
| Total (Category) | 1,325 (43.4%) | 1,731 (56.6%) |
| Total (Overall) | 4,797 (54.6%) | 3,989 (45.4%) |
Services Occupations
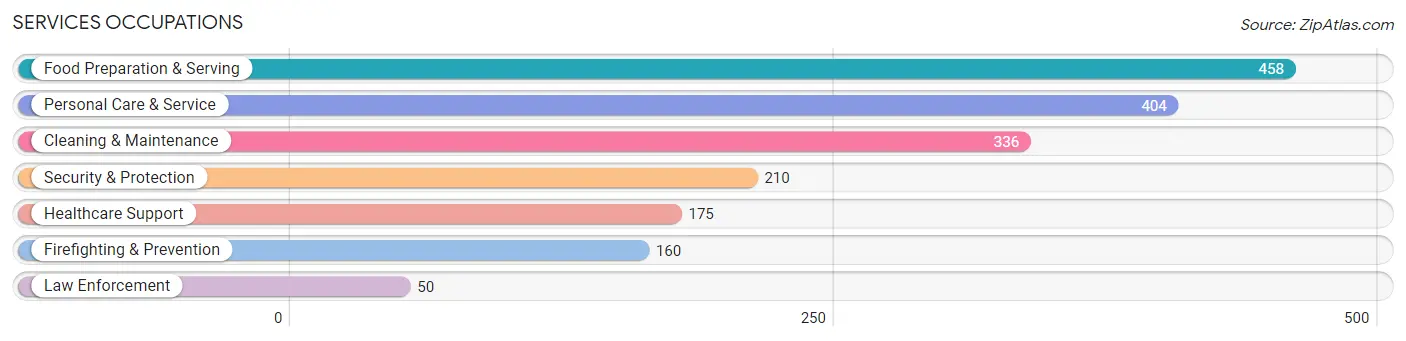
The most common Services occupations in Grand County are Food Preparation & Serving (458 | 5.2%), Personal Care & Service (404 | 4.6%), Cleaning & Maintenance (336 | 3.8%), Security & Protection (210 | 2.4%), and Healthcare Support (175 | 2.0%).
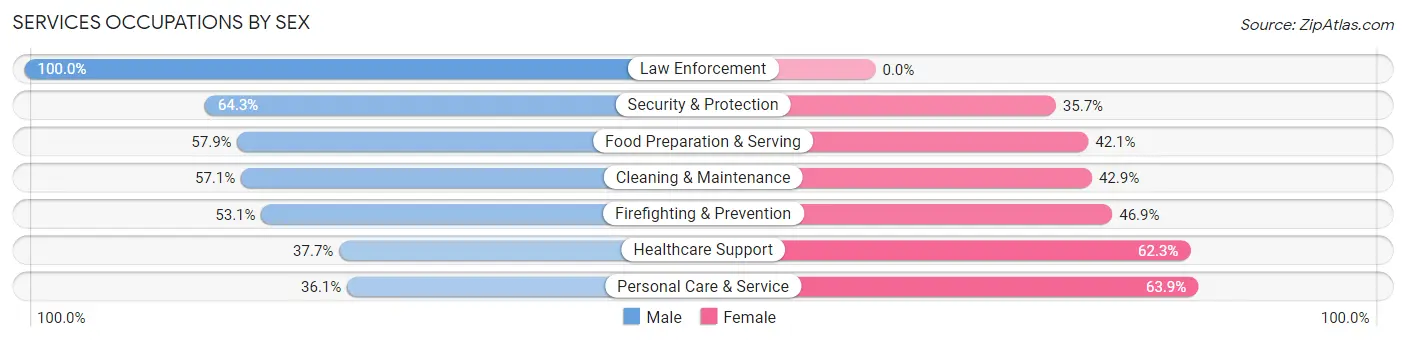
Services Occupations by Sex
Within the Services occupations in Grand County, the most male-oriented occupations are Law Enforcement (100.0%), Security & Protection (64.3%), and Food Preparation & Serving (57.9%), while the most female-oriented occupations are Personal Care & Service (63.9%), Healthcare Support (62.3%), and Firefighting & Prevention (46.9%).
| Occupation | Male | Female |
| Healthcare Support | 66 (37.7%) | 109 (62.3%) |
| Security & Protection | 135 (64.3%) | 75 (35.7%) |
| Firefighting & Prevention | 85 (53.1%) | 75 (46.9%) |
| Law Enforcement | 50 (100.0%) | 0 (0.0%) |
| Food Preparation & Serving | 265 (57.9%) | 193 (42.1%) |
| Cleaning & Maintenance | 192 (57.1%) | 144 (42.9%) |
| Personal Care & Service | 146 (36.1%) | 258 (63.9%) |
| Total (Category) | 804 (50.8%) | 779 (49.2%) |
| Total (Overall) | 4,797 (54.6%) | 3,989 (45.4%) |
Sales and Office Occupations
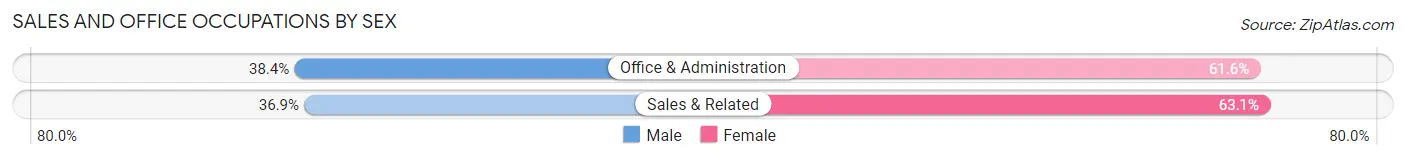
The most common Sales and Office occupations in Grand County are Sales & Related (1,063 | 12.1%), and Office & Administration (995 | 11.3%).

Sales and Office Occupations by Sex
| Occupation | Male | Female |
| Sales & Related | 392 (36.9%) | 671 (63.1%) |
| Office & Administration | 382 (38.4%) | 613 (61.6%) |
| Total (Category) | 774 (37.6%) | 1,284 (62.4%) |
| Total (Overall) | 4,797 (54.6%) | 3,989 (45.4%) |
Natural Resources, Construction and Maintenance Occupations
The most common Natural Resources, Construction and Maintenance occupations in Grand County are Construction & Extraction (825 | 9.4%), Installation, Maintenance & Repair (410 | 4.7%), and Farming, Fishing & Forestry (128 | 1.5%).

Natural Resources, Construction and Maintenance Occupations by Sex
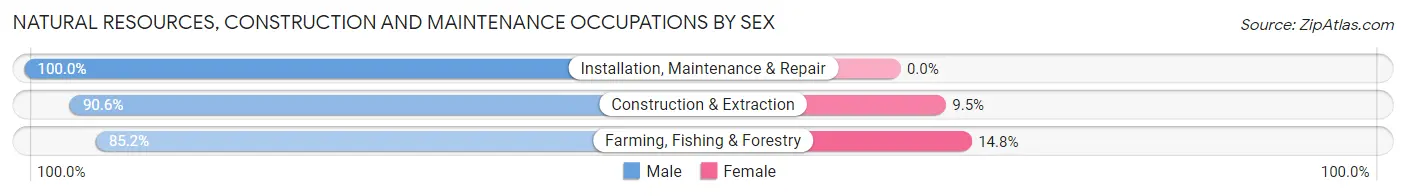
| Occupation | Male | Female |
| Farming, Fishing & Forestry | 109 (85.2%) | 19 (14.8%) |
| Construction & Extraction | 747 (90.5%) | 78 (9.5%) |
| Installation, Maintenance & Repair | 410 (100.0%) | 0 (0.0%) |
| Total (Category) | 1,266 (92.9%) | 97 (7.1%) |
| Total (Overall) | 4,797 (54.6%) | 3,989 (45.4%) |
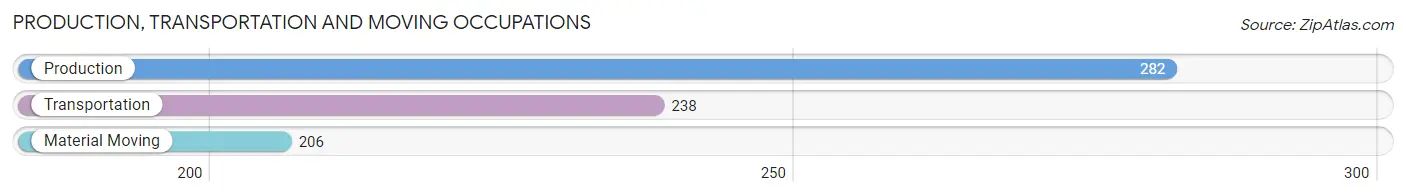
Production, Transportation and Moving Occupations
The most common Production, Transportation and Moving occupations in Grand County are Production (282 | 3.2%), Transportation (238 | 2.7%), and Material Moving (206 | 2.3%).
Production, Transportation and Moving Occupations by Sex
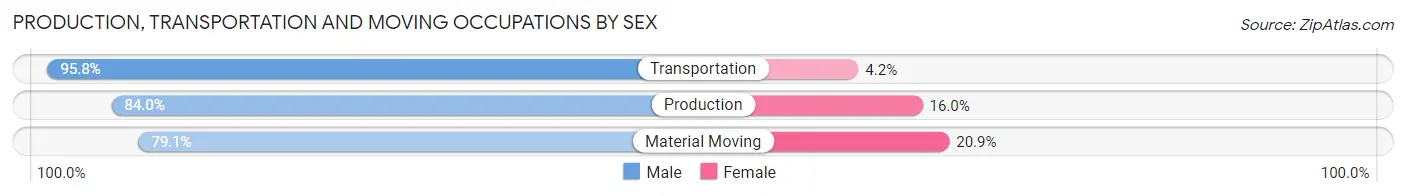
| Occupation | Male | Female |
| Production | 237 (84.0%) | 45 (16.0%) |
| Transportation | 228 (95.8%) | 10 (4.2%) |
| Material Moving | 163 (79.1%) | 43 (20.9%) |
| Total (Category) | 628 (86.5%) | 98 (13.5%) |
| Total (Overall) | 4,797 (54.6%) | 3,989 (45.4%) |
Employment Industries by Sex in Grand County
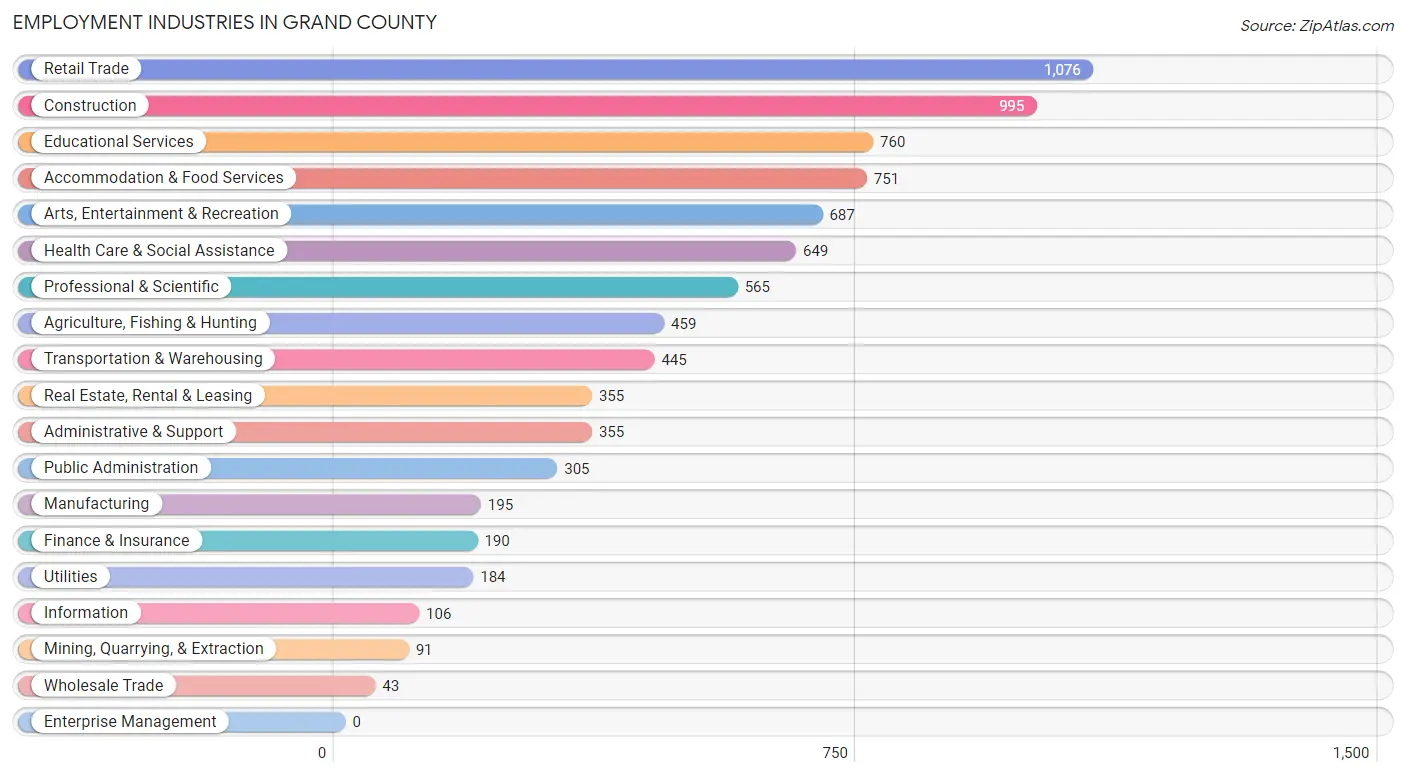
Employment Industries in Grand County
The major employment industries in Grand County include Retail Trade (1,076 | 12.2%), Construction (995 | 11.3%), Educational Services (760 | 8.6%), Accommodation & Food Services (751 | 8.6%), and Arts, Entertainment & Recreation (687 | 7.8%).
Employment Industries by Sex in Grand County
The Grand County industries that see more men than women are Mining, Quarrying, & Extraction (100.0%), Wholesale Trade (100.0%), and Utilities (100.0%), whereas the industries that tend to have a higher number of women are Educational Services (88.3%), Health Care & Social Assistance (78.3%), and Finance & Insurance (76.8%).
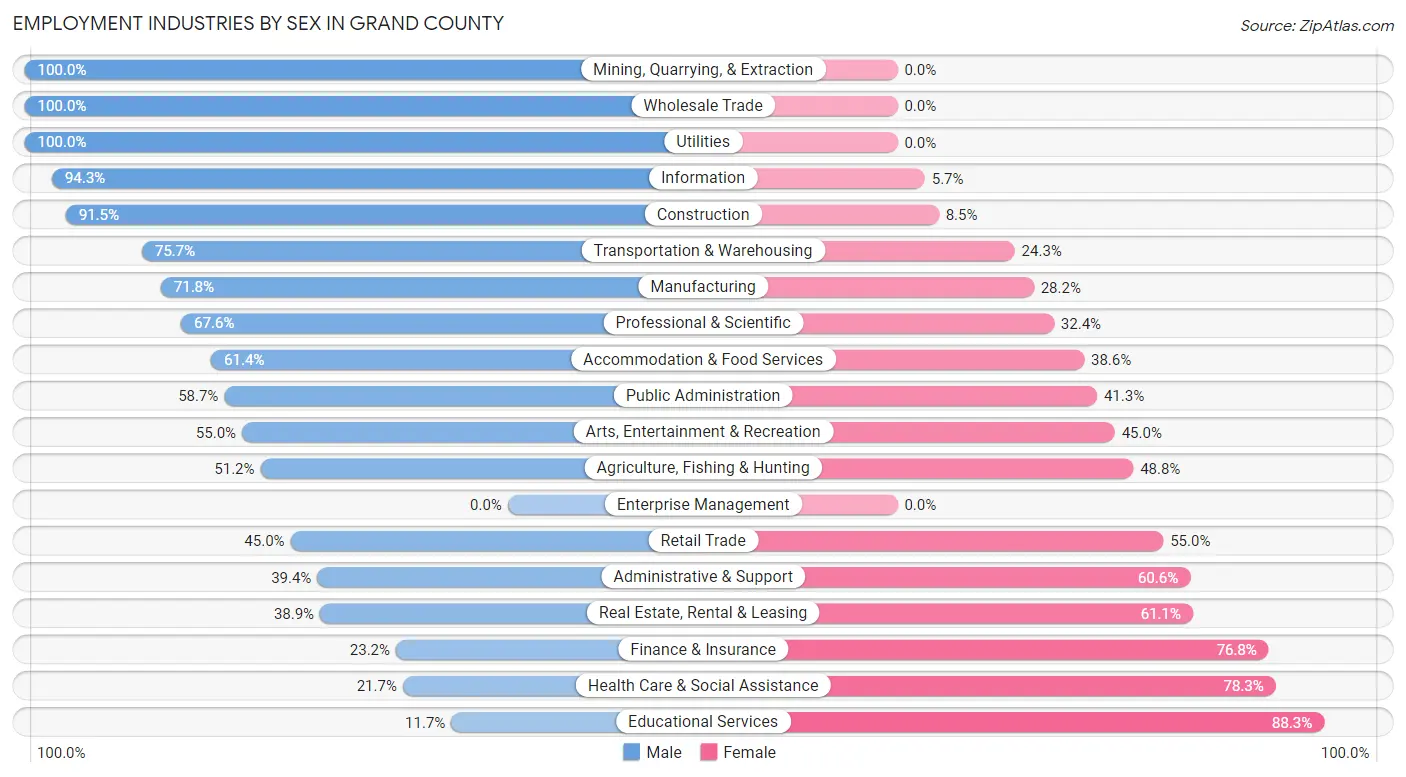
| Industry | Male | Female |
| Agriculture, Fishing & Hunting | 235 (51.2%) | 224 (48.8%) |
| Mining, Quarrying, & Extraction | 91 (100.0%) | 0 (0.0%) |
| Construction | 910 (91.5%) | 85 (8.5%) |
| Manufacturing | 140 (71.8%) | 55 (28.2%) |
| Wholesale Trade | 43 (100.0%) | 0 (0.0%) |
| Retail Trade | 484 (45.0%) | 592 (55.0%) |
| Transportation & Warehousing | 337 (75.7%) | 108 (24.3%) |
| Utilities | 184 (100.0%) | 0 (0.0%) |
| Information | 100 (94.3%) | 6 (5.7%) |
| Finance & Insurance | 44 (23.2%) | 146 (76.8%) |
| Real Estate, Rental & Leasing | 138 (38.9%) | 217 (61.1%) |
| Professional & Scientific | 382 (67.6%) | 183 (32.4%) |
| Enterprise Management | 0 (0.0%) | 0 (0.0%) |
| Administrative & Support | 140 (39.4%) | 215 (60.6%) |
| Educational Services | 89 (11.7%) | 671 (88.3%) |
| Health Care & Social Assistance | 141 (21.7%) | 508 (78.3%) |
| Arts, Entertainment & Recreation | 378 (55.0%) | 309 (45.0%) |
| Accommodation & Food Services | 461 (61.4%) | 290 (38.6%) |
| Public Administration | 179 (58.7%) | 126 (41.3%) |
| Total | 4,797 (54.6%) | 3,989 (45.4%) |
Education in Grand County
School Enrollment in Grand County
The most common levels of schooling among the 2,668 students in Grand County are high school (848 | 31.8%), middle school (650 | 24.4%), and elementary school (513 | 19.2%).
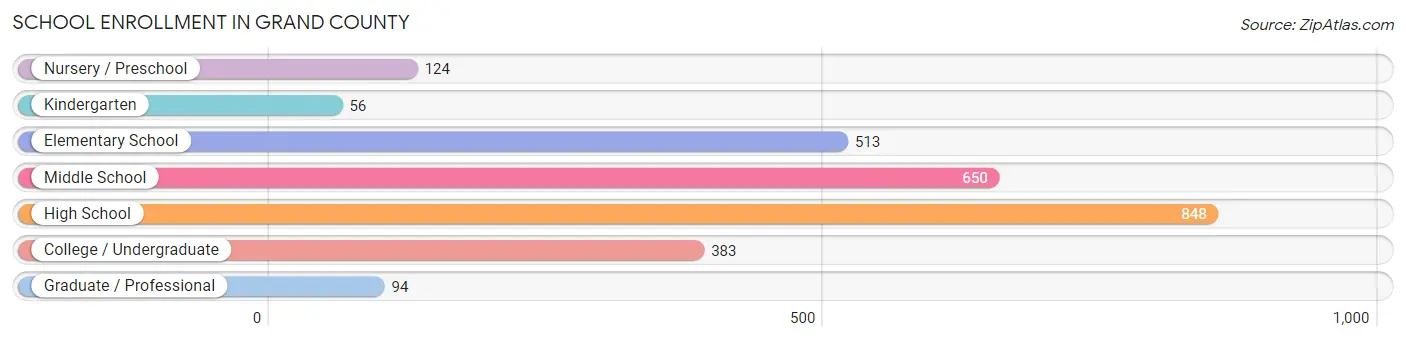
| School Level | # Students | % Students |
| Nursery / Preschool | 124 | 4.6% |
| Kindergarten | 56 | 2.1% |
| Elementary School | 513 | 19.2% |
| Middle School | 650 | 24.4% |
| High School | 848 | 31.8% |
| College / Undergraduate | 383 | 14.4% |
| Graduate / Professional | 94 | 3.5% |
| Total | 2,668 | 100.0% |
School Enrollment by Age by Funding Source in Grand County
Out of a total of 2,668 students who are enrolled in schools in Grand County, 243 (9.1%) attend a private institution, while the remaining 2,425 (90.9%) are enrolled in public schools. The age group of 35 years and over has the highest likelihood of being enrolled in private schools, with 54 (22.7% in the age bracket) enrolled. Conversely, the age group of 18 to 19 year olds has the lowest likelihood of being enrolled in a private school, with 168 (100.0% in the age bracket) attending a public institution.
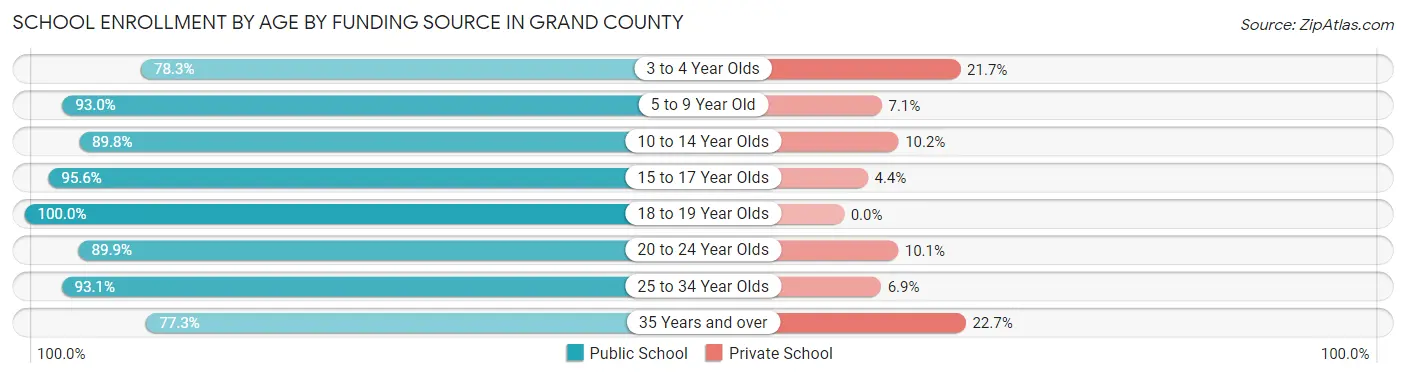
| Age Bracket | Public School | Private School |
| 3 to 4 Year Olds | 83 (78.3%) | 23 (21.7%) |
| 5 to 9 Year Old | 514 (92.9%) | 39 (7.0%) |
| 10 to 14 Year Olds | 743 (89.8%) | 84 (10.2%) |
| 15 to 17 Year Olds | 517 (95.6%) | 24 (4.4%) |
| 18 to 19 Year Olds | 168 (100.0%) | 0 (0.0%) |
| 20 to 24 Year Olds | 107 (89.9%) | 12 (10.1%) |
| 25 to 34 Year Olds | 108 (93.1%) | 8 (6.9%) |
| 35 Years and over | 184 (77.3%) | 54 (22.7%) |
| Total | 2,425 (90.9%) | 243 (9.1%) |
Educational Attainment by Field of Study in Grand County
Education (709 | 14.9%), science & technology (613 | 12.9%), business (580 | 12.1%), bio, nature & agricultural (545 | 11.4%), and physical & health sciences (374 | 7.8%) are the most common fields of study among 4,772 individuals in Grand County who have obtained a bachelor's degree or higher.
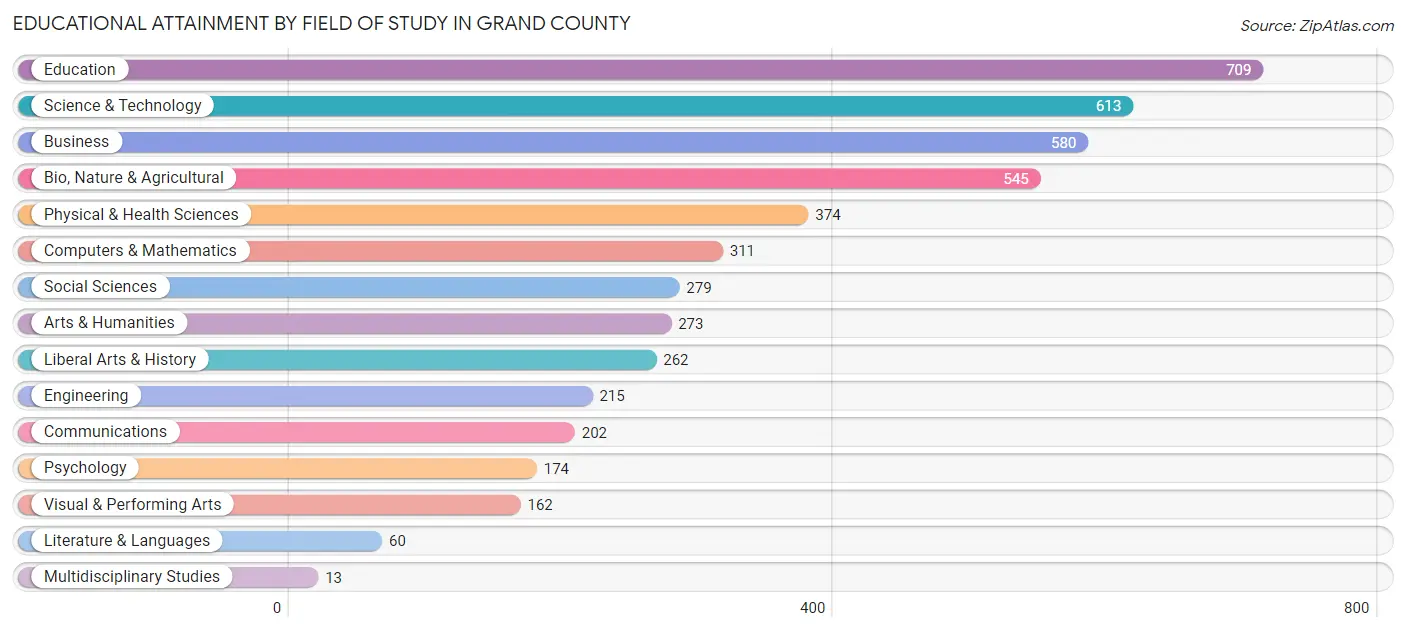
| Field of Study | # Graduates | % Graduates |
| Computers & Mathematics | 311 | 6.5% |
| Bio, Nature & Agricultural | 545 | 11.4% |
| Physical & Health Sciences | 374 | 7.8% |
| Psychology | 174 | 3.6% |
| Social Sciences | 279 | 5.9% |
| Engineering | 215 | 4.5% |
| Multidisciplinary Studies | 13 | 0.3% |
| Science & Technology | 613 | 12.9% |
| Business | 580 | 12.1% |
| Education | 709 | 14.9% |
| Literature & Languages | 60 | 1.3% |
| Liberal Arts & History | 262 | 5.5% |
| Visual & Performing Arts | 162 | 3.4% |
| Communications | 202 | 4.2% |
| Arts & Humanities | 273 | 5.7% |
| Total | 4,772 | 100.0% |
Transportation & Commute in Grand County
Vehicle Availability by Sex in Grand County
The most prevalent vehicle ownership categories in Grand County are males with 2 vehicles (1,880, accounting for 40.2%) and females with 2 vehicles (1,280, making up 48.6%).
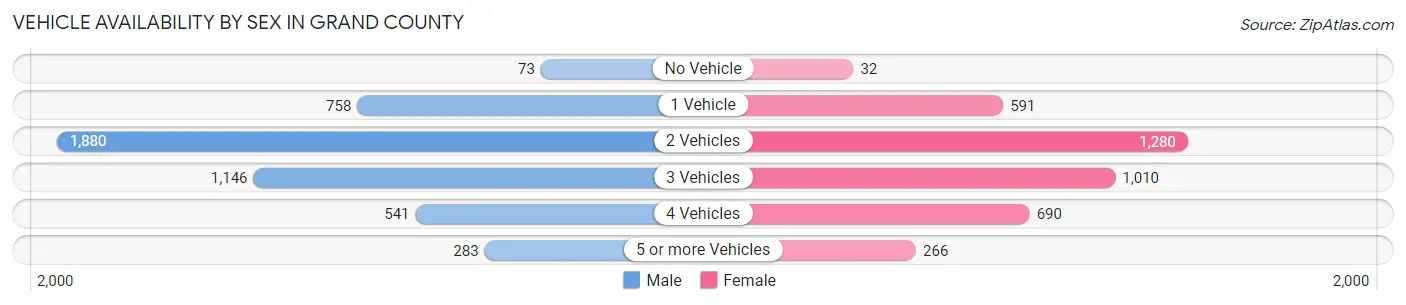
| Vehicles Available | Male | Female |
| No Vehicle | 73 (1.6%) | 32 (0.8%) |
| 1 Vehicle | 758 (16.2%) | 591 (15.3%) |
| 2 Vehicles | 1,880 (40.2%) | 1,280 (33.1%) |
| 3 Vehicles | 1,146 (24.5%) | 1,010 (26.1%) |
| 4 Vehicles | 541 (11.6%) | 690 (17.8%) |
| 5 or more Vehicles | 283 (6.0%) | 266 (6.9%) |
| Total | 4,681 (100.0%) | 3,869 (100.0%) |
Commute Time in Grand County
The most frequently occuring commute durations in Grand County are 10 to 14 minutes (1,205 commuters, 17.0%), 5 to 9 minutes (999 commuters, 14.1%), and 20 to 24 minutes (939 commuters, 13.2%).
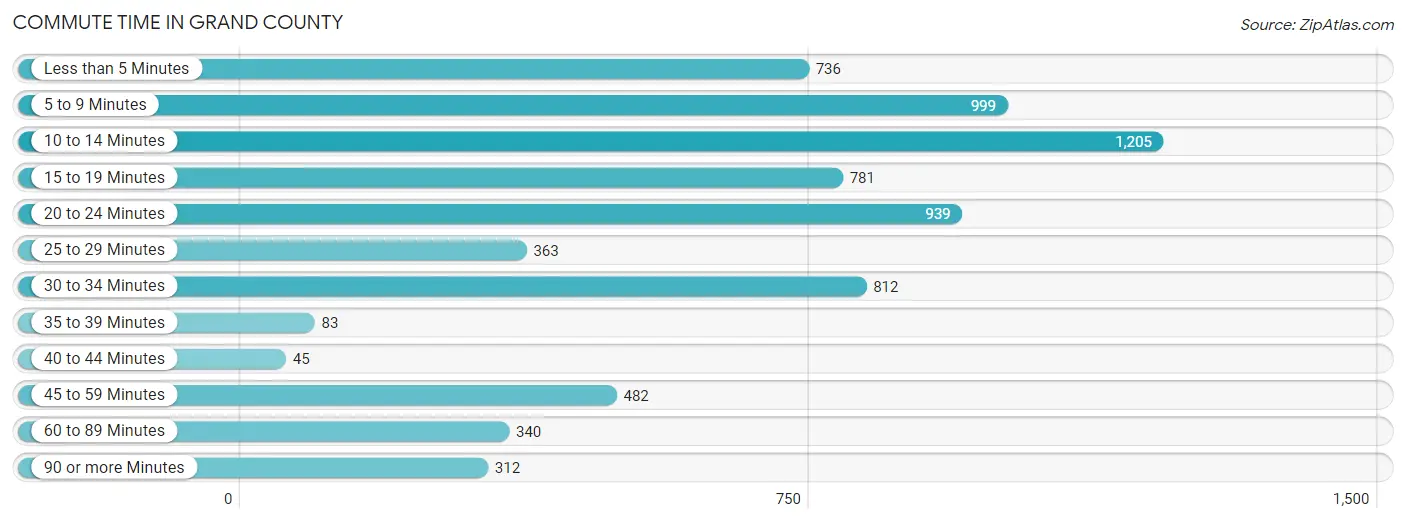
| Commute Time | # Commuters | % Commuters |
| Less than 5 Minutes | 736 | 10.4% |
| 5 to 9 Minutes | 999 | 14.1% |
| 10 to 14 Minutes | 1,205 | 17.0% |
| 15 to 19 Minutes | 781 | 11.0% |
| 20 to 24 Minutes | 939 | 13.2% |
| 25 to 29 Minutes | 363 | 5.1% |
| 30 to 34 Minutes | 812 | 11.4% |
| 35 to 39 Minutes | 83 | 1.2% |
| 40 to 44 Minutes | 45 | 0.6% |
| 45 to 59 Minutes | 482 | 6.8% |
| 60 to 89 Minutes | 340 | 4.8% |
| 90 or more Minutes | 312 | 4.4% |
Commute Time by Sex in Grand County
The most common commute times in Grand County are 5 to 9 minutes (575 commuters, 14.3%) for males and 10 to 14 minutes (671 commuters, 21.8%) for females.
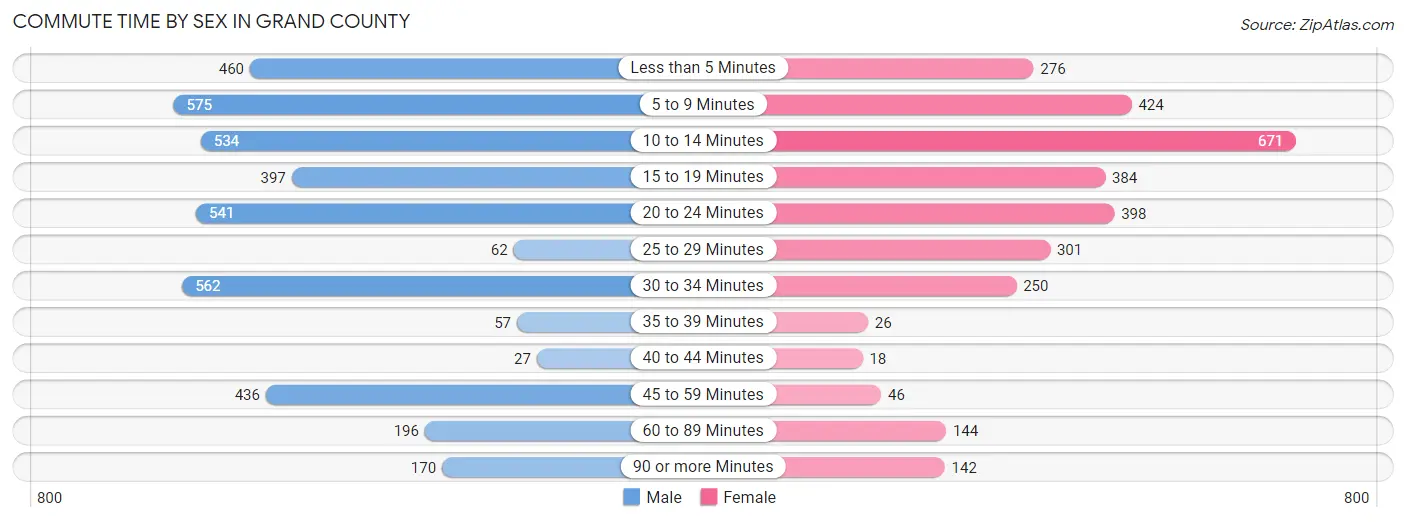
| Commute Time | Male | Female |
| Less than 5 Minutes | 460 (11.5%) | 276 (9.0%) |
| 5 to 9 Minutes | 575 (14.3%) | 424 (13.8%) |
| 10 to 14 Minutes | 534 (13.3%) | 671 (21.8%) |
| 15 to 19 Minutes | 397 (9.9%) | 384 (12.5%) |
| 20 to 24 Minutes | 541 (13.5%) | 398 (12.9%) |
| 25 to 29 Minutes | 62 (1.5%) | 301 (9.8%) |
| 30 to 34 Minutes | 562 (14.0%) | 250 (8.1%) |
| 35 to 39 Minutes | 57 (1.4%) | 26 (0.8%) |
| 40 to 44 Minutes | 27 (0.7%) | 18 (0.6%) |
| 45 to 59 Minutes | 436 (10.8%) | 46 (1.5%) |
| 60 to 89 Minutes | 196 (4.9%) | 144 (4.7%) |
| 90 or more Minutes | 170 (4.2%) | 142 (4.6%) |
Time of Departure to Work by Sex in Grand County
The most frequent times of departure to work in Grand County are 7:00 AM to 7:29 AM (631, 15.7%) for males and 7:00 AM to 7:29 AM (722, 23.4%) for females.
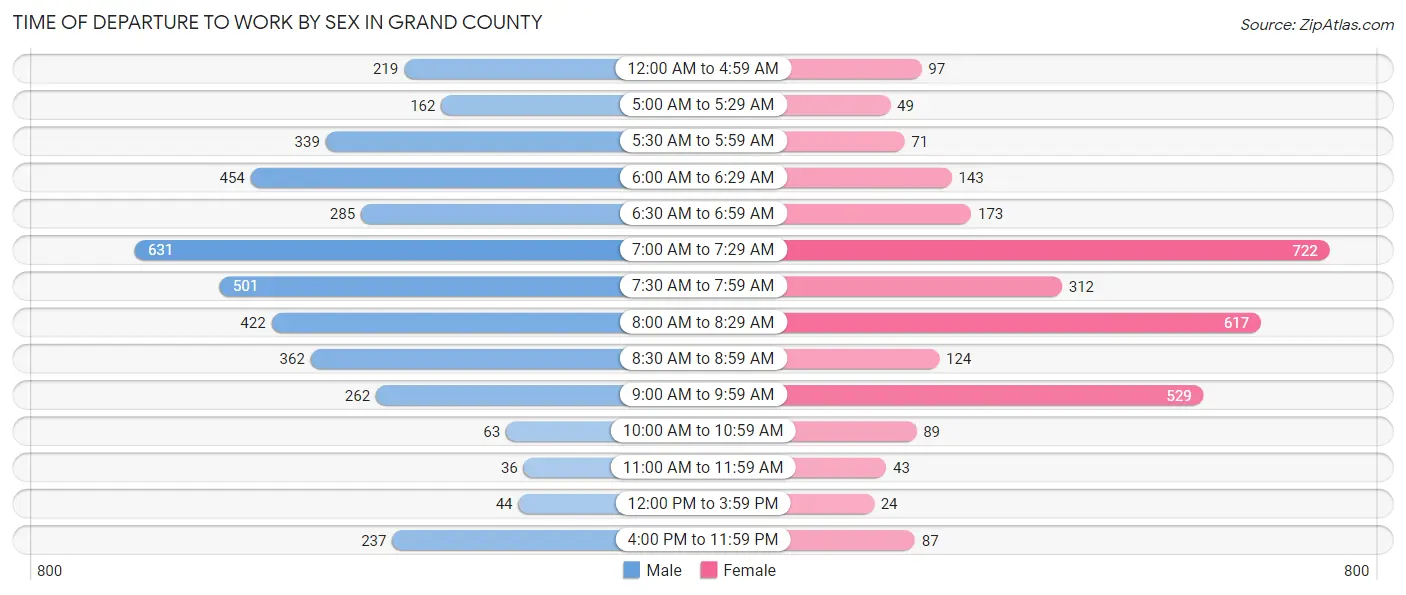
| Time of Departure | Male | Female |
| 12:00 AM to 4:59 AM | 219 (5.4%) | 97 (3.2%) |
| 5:00 AM to 5:29 AM | 162 (4.0%) | 49 (1.6%) |
| 5:30 AM to 5:59 AM | 339 (8.4%) | 71 (2.3%) |
| 6:00 AM to 6:29 AM | 454 (11.3%) | 143 (4.6%) |
| 6:30 AM to 6:59 AM | 285 (7.1%) | 173 (5.6%) |
| 7:00 AM to 7:29 AM | 631 (15.7%) | 722 (23.4%) |
| 7:30 AM to 7:59 AM | 501 (12.5%) | 312 (10.1%) |
| 8:00 AM to 8:29 AM | 422 (10.5%) | 617 (20.0%) |
| 8:30 AM to 8:59 AM | 362 (9.0%) | 124 (4.0%) |
| 9:00 AM to 9:59 AM | 262 (6.5%) | 529 (17.2%) |
| 10:00 AM to 10:59 AM | 63 (1.6%) | 89 (2.9%) |
| 11:00 AM to 11:59 AM | 36 (0.9%) | 43 (1.4%) |
| 12:00 PM to 3:59 PM | 44 (1.1%) | 24 (0.8%) |
| 4:00 PM to 11:59 PM | 237 (5.9%) | 87 (2.8%) |
| Total | 4,017 (100.0%) | 3,080 (100.0%) |
Housing Occupancy in Grand County
Occupancy by Ownership in Grand County
Of the total 6,238 dwellings in Grand County, owner-occupied units account for 4,535 (72.7%), while renter-occupied units make up 1,703 (27.3%).
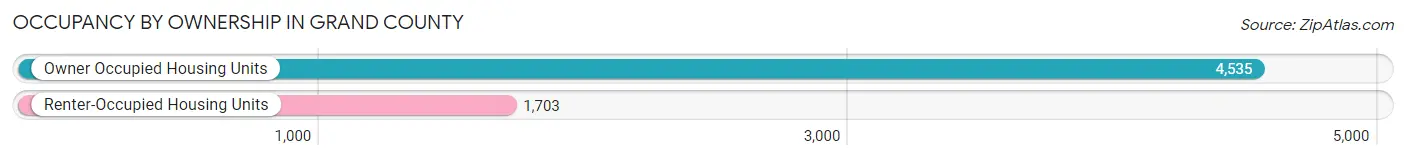
| Occupancy | # Housing Units | % Housing Units |
| Owner Occupied Housing Units | 4,535 | 72.7% |
| Renter-Occupied Housing Units | 1,703 | 27.3% |
| Total Occupied Housing Units | 6,238 | 100.0% |
Occupancy by Household Size in Grand County
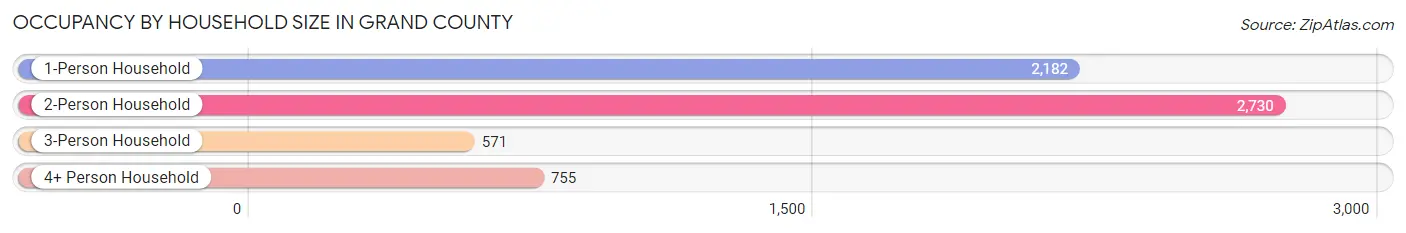
| Household Size | # Housing Units | % Housing Units |
| 1-Person Household | 2,182 | 35.0% |
| 2-Person Household | 2,730 | 43.8% |
| 3-Person Household | 571 | 9.1% |
| 4+ Person Household | 755 | 12.1% |
| Total Housing Units | 6,238 | 100.0% |
Occupancy by Ownership by Household Size in Grand County
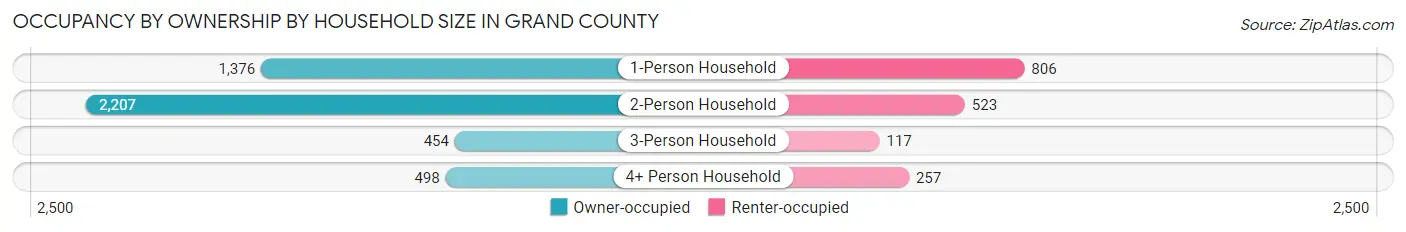
| Household Size | Owner-occupied | Renter-occupied |
| 1-Person Household | 1,376 (63.1%) | 806 (36.9%) |
| 2-Person Household | 2,207 (80.8%) | 523 (19.2%) |
| 3-Person Household | 454 (79.5%) | 117 (20.5%) |
| 4+ Person Household | 498 (66.0%) | 257 (34.0%) |
| Total Housing Units | 4,535 (72.7%) | 1,703 (27.3%) |
Occupancy by Educational Attainment in Grand County
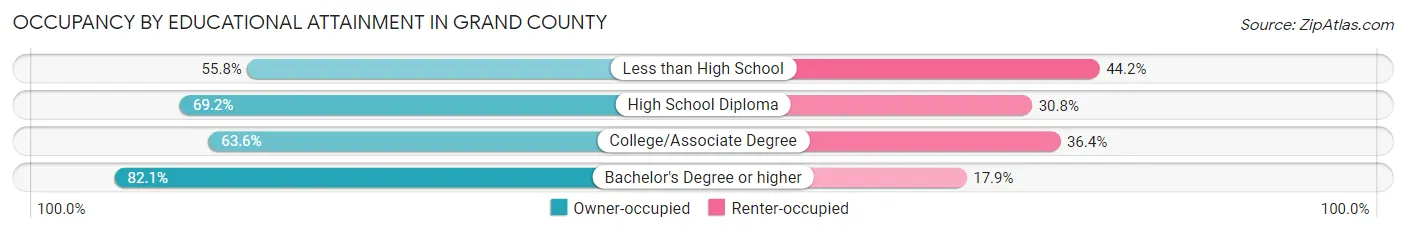
| Household Size | Owner-occupied | Renter-occupied |
| Less than High School | 145 (55.8%) | 115 (44.2%) |
| High School Diploma | 1,000 (69.2%) | 446 (30.8%) |
| College/Associate Degree | 1,137 (63.6%) | 652 (36.4%) |
| Bachelor's Degree or higher | 2,253 (82.1%) | 490 (17.9%) |
Occupancy by Age of Householder in Grand County
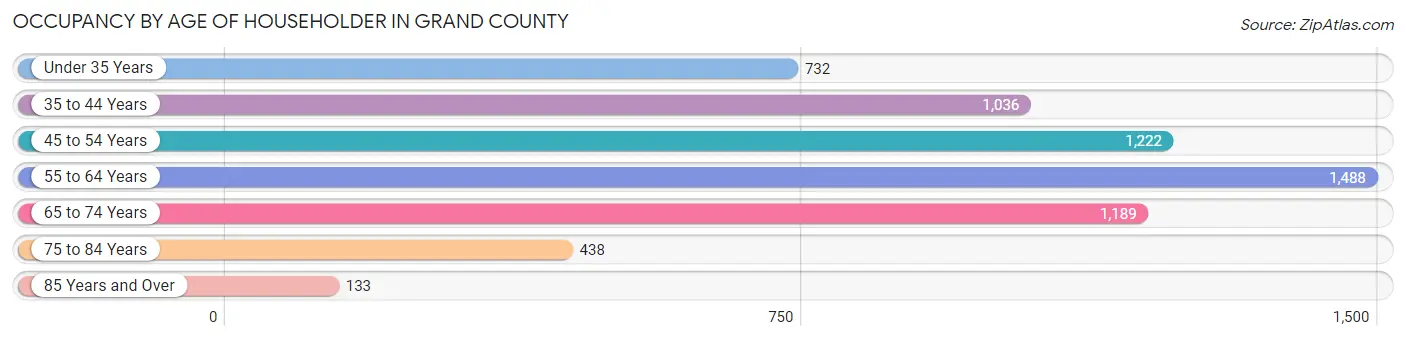
| Age Bracket | # Households | % Households |
| Under 35 Years | 732 | 11.7% |
| 35 to 44 Years | 1,036 | 16.6% |
| 45 to 54 Years | 1,222 | 19.6% |
| 55 to 64 Years | 1,488 | 23.8% |
| 65 to 74 Years | 1,189 | 19.1% |
| 75 to 84 Years | 438 | 7.0% |
| 85 Years and Over | 133 | 2.1% |
| Total | 6,238 | 100.0% |
Housing Finances in Grand County
Median Income by Occupancy in Grand County
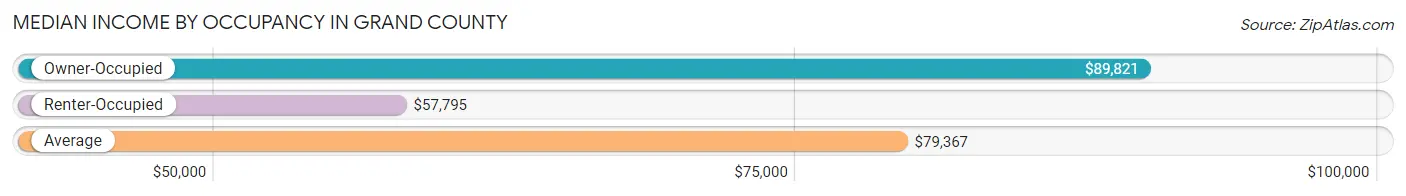
| Occupancy Type | # Households | Median Income |
| Owner-Occupied | 4,535 (72.7%) | $89,821 |
| Renter-Occupied | 1,703 (27.3%) | $57,795 |
| Average | 6,238 (100.0%) | $79,367 |
Occupancy by Householder Income Bracket in Grand County
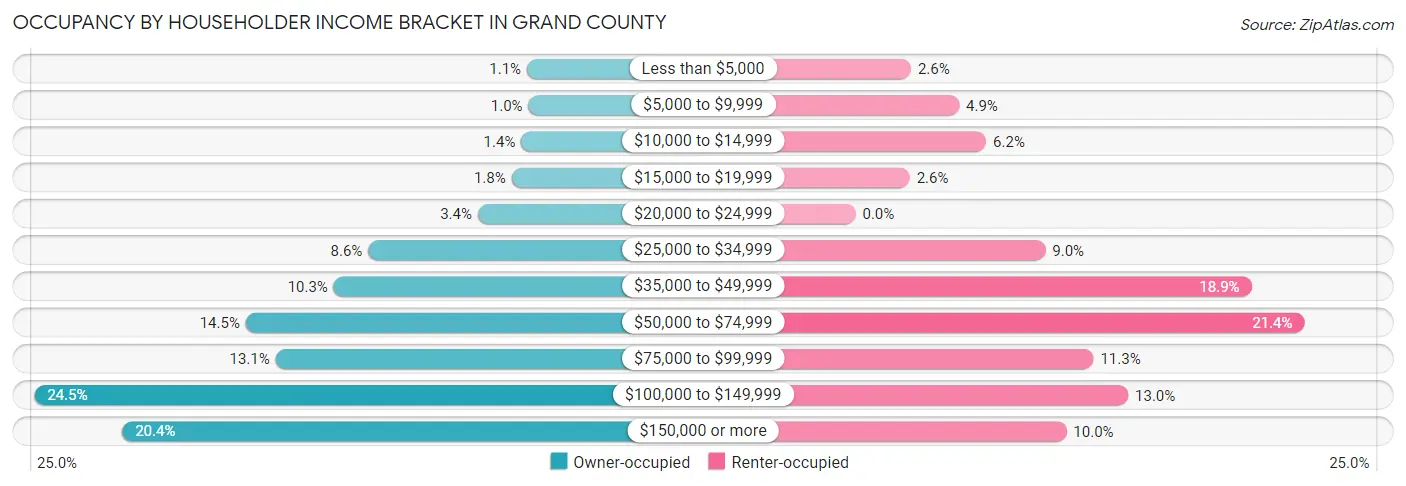
| Income Bracket | Owner-occupied | Renter-occupied |
| Less than $5,000 | 49 (1.1%) | 45 (2.6%) |
| $5,000 to $9,999 | 46 (1.0%) | 84 (4.9%) |
| $10,000 to $14,999 | 61 (1.3%) | 106 (6.2%) |
| $15,000 to $19,999 | 82 (1.8%) | 44 (2.6%) |
| $20,000 to $24,999 | 155 (3.4%) | 0 (0.0%) |
| $25,000 to $34,999 | 392 (8.6%) | 154 (9.0%) |
| $35,000 to $49,999 | 466 (10.3%) | 321 (18.9%) |
| $50,000 to $74,999 | 656 (14.5%) | 364 (21.4%) |
| $75,000 to $99,999 | 592 (13.1%) | 193 (11.3%) |
| $100,000 to $149,999 | 1,113 (24.5%) | 221 (13.0%) |
| $150,000 or more | 923 (20.3%) | 171 (10.0%) |
| Total | 4,535 (100.0%) | 1,703 (100.0%) |
Monthly Housing Cost Tiers in Grand County
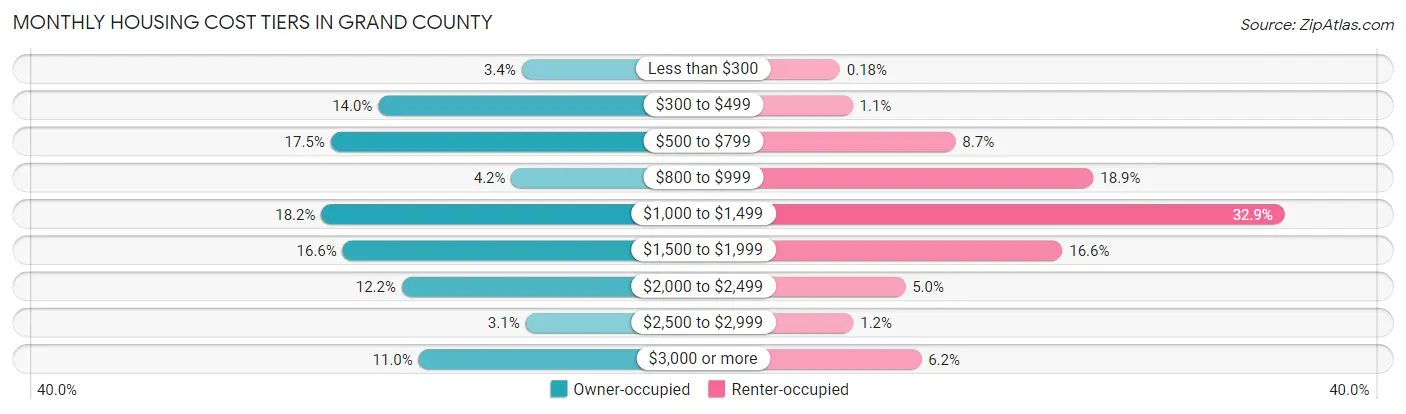
| Monthly Cost | Owner-occupied | Renter-occupied |
| Less than $300 | 154 (3.4%) | 3 (0.2%) |
| $300 to $499 | 633 (14.0%) | 19 (1.1%) |
| $500 to $799 | 792 (17.5%) | 148 (8.7%) |
| $800 to $999 | 188 (4.2%) | 321 (18.9%) |
| $1,000 to $1,499 | 823 (18.1%) | 561 (32.9%) |
| $1,500 to $1,999 | 752 (16.6%) | 282 (16.6%) |
| $2,000 to $2,499 | 554 (12.2%) | 85 (5.0%) |
| $2,500 to $2,999 | 141 (3.1%) | 20 (1.2%) |
| $3,000 or more | 498 (11.0%) | 105 (6.2%) |
| Total | 4,535 (100.0%) | 1,703 (100.0%) |
Physical Housing Characteristics in Grand County
Housing Structures in Grand County
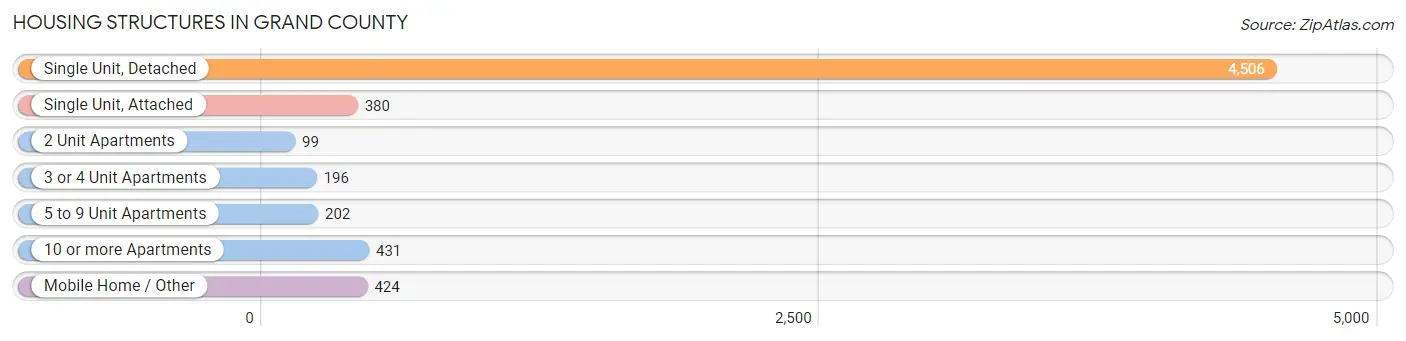
| Structure Type | # Housing Units | % Housing Units |
| Single Unit, Detached | 4,506 | 72.2% |
| Single Unit, Attached | 380 | 6.1% |
| 2 Unit Apartments | 99 | 1.6% |
| 3 or 4 Unit Apartments | 196 | 3.1% |
| 5 to 9 Unit Apartments | 202 | 3.2% |
| 10 or more Apartments | 431 | 6.9% |
| Mobile Home / Other | 424 | 6.8% |
| Total | 6,238 | 100.0% |
Housing Structures by Occupancy in Grand County
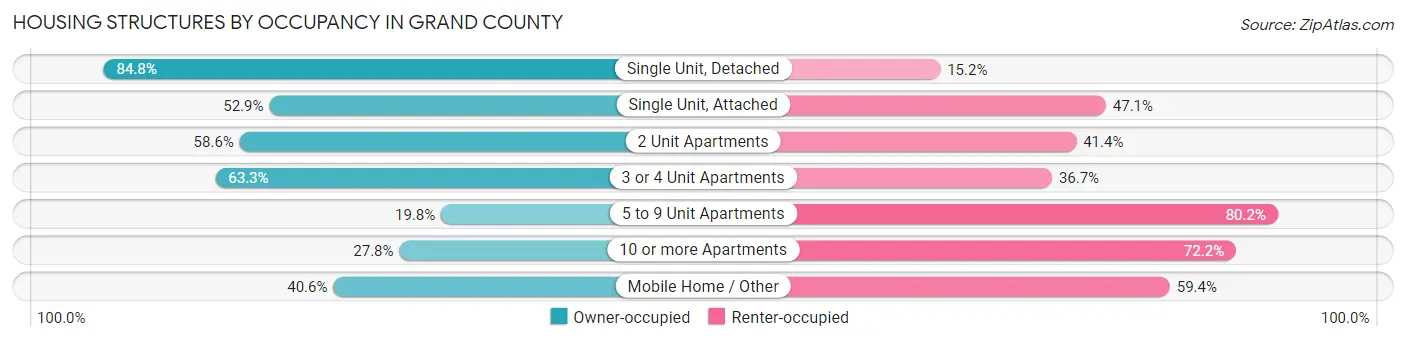
| Structure Type | Owner-occupied | Renter-occupied |
| Single Unit, Detached | 3,820 (84.8%) | 686 (15.2%) |
| Single Unit, Attached | 201 (52.9%) | 179 (47.1%) |
| 2 Unit Apartments | 58 (58.6%) | 41 (41.4%) |
| 3 or 4 Unit Apartments | 124 (63.3%) | 72 (36.7%) |
| 5 to 9 Unit Apartments | 40 (19.8%) | 162 (80.2%) |
| 10 or more Apartments | 120 (27.8%) | 311 (72.2%) |
| Mobile Home / Other | 172 (40.6%) | 252 (59.4%) |
| Total | 4,535 (72.7%) | 1,703 (27.3%) |
Housing Structures by Number of Rooms in Grand County
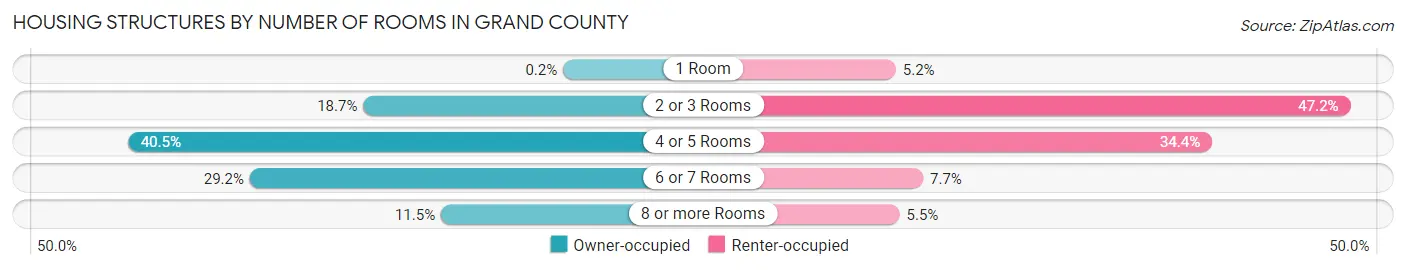
| Number of Rooms | Owner-occupied | Renter-occupied |
| 1 Room | 9 (0.2%) | 88 (5.2%) |
| 2 or 3 Rooms | 847 (18.7%) | 804 (47.2%) |
| 4 or 5 Rooms | 1,835 (40.5%) | 586 (34.4%) |
| 6 or 7 Rooms | 1,323 (29.2%) | 131 (7.7%) |
| 8 or more Rooms | 521 (11.5%) | 94 (5.5%) |
| Total | 4,535 (100.0%) | 1,703 (100.0%) |
Housing Structure by Heating Type in Grand County
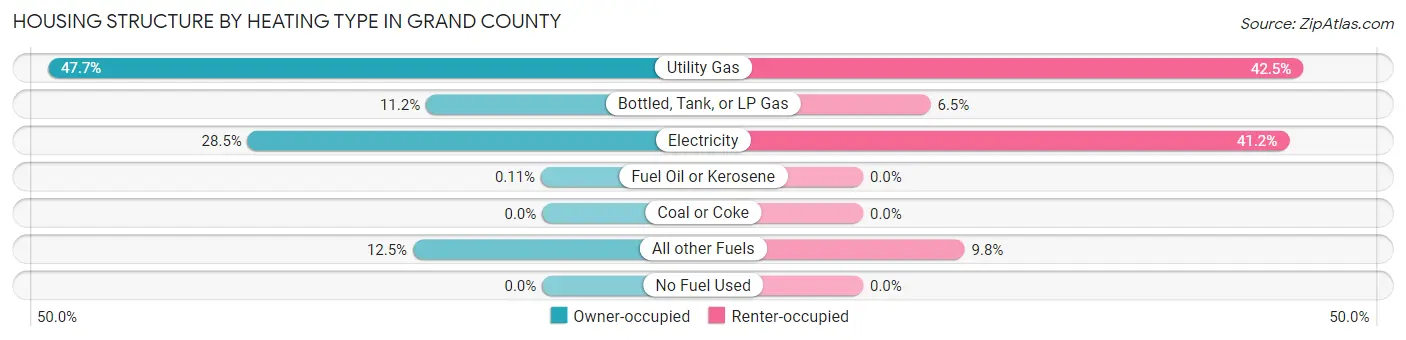
| Heating Type | Owner-occupied | Renter-occupied |
| Utility Gas | 2,165 (47.7%) | 724 (42.5%) |
| Bottled, Tank, or LP Gas | 509 (11.2%) | 111 (6.5%) |
| Electricity | 1,290 (28.4%) | 701 (41.2%) |
| Fuel Oil or Kerosene | 5 (0.1%) | 0 (0.0%) |
| Coal or Coke | 0 (0.0%) | 0 (0.0%) |
| All other Fuels | 566 (12.5%) | 167 (9.8%) |
| No Fuel Used | 0 (0.0%) | 0 (0.0%) |
| Total | 4,535 (100.0%) | 1,703 (100.0%) |
Household Vehicle Usage in Grand County
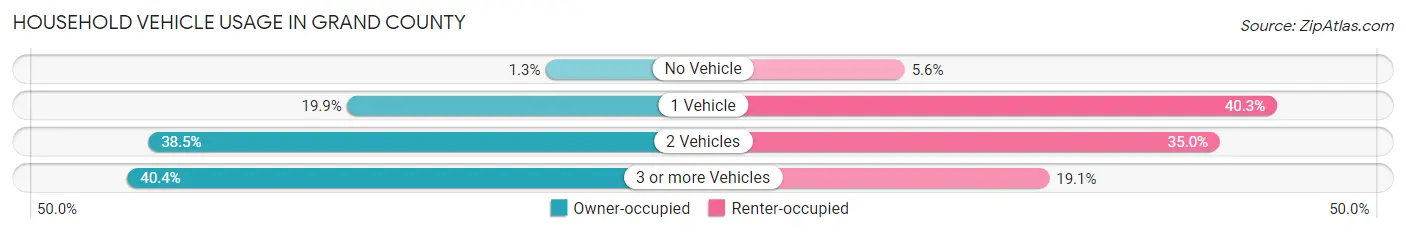
| Vehicles per Household | Owner-occupied | Renter-occupied |
| No Vehicle | 59 (1.3%) | 95 (5.6%) |
| 1 Vehicle | 900 (19.9%) | 687 (40.3%) |
| 2 Vehicles | 1,744 (38.5%) | 596 (35.0%) |
| 3 or more Vehicles | 1,832 (40.4%) | 325 (19.1%) |
| Total | 4,535 (100.0%) | 1,703 (100.0%) |
Real Estate & Mortgages in Grand County
Real Estate and Mortgage Overview in Grand County
| Characteristic | Without Mortgage | With Mortgage |
| Housing Units | 1,917 | 2,618 |
| Median Property Value | $427,900 | $495,200 |
| Median Household Income | $54,857 | $756 |
| Monthly Housing Costs | $570 | $498 |
| Real Estate Taxes | $1,695 | $6 |
Property Value by Mortgage Status in Grand County
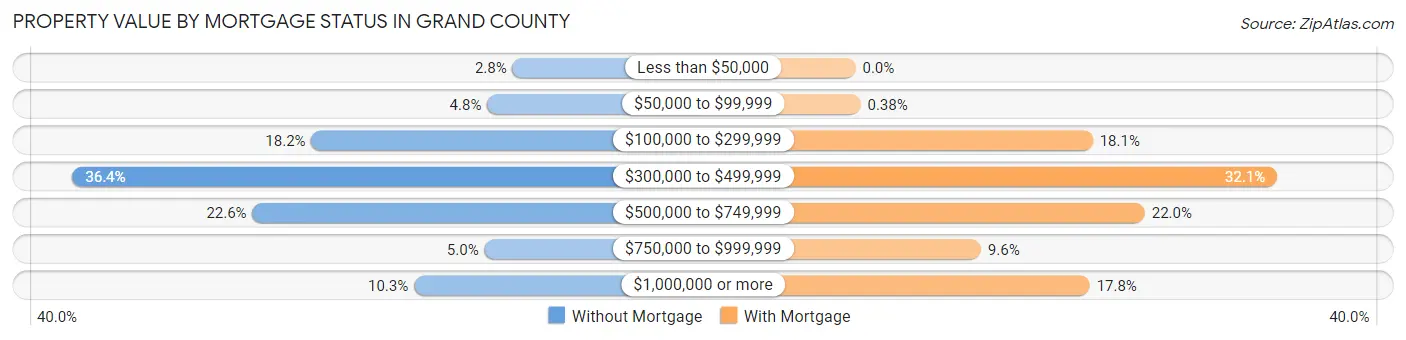
| Property Value | Without Mortgage | With Mortgage |
| Less than $50,000 | 54 (2.8%) | 0 (0.0%) |
| $50,000 to $99,999 | 91 (4.8%) | 10 (0.4%) |
| $100,000 to $299,999 | 348 (18.1%) | 473 (18.1%) |
| $300,000 to $499,999 | 697 (36.4%) | 841 (32.1%) |
| $500,000 to $749,999 | 434 (22.6%) | 577 (22.0%) |
| $750,000 to $999,999 | 95 (5.0%) | 250 (9.6%) |
| $1,000,000 or more | 198 (10.3%) | 467 (17.8%) |
| Total | 1,917 (100.0%) | 2,618 (100.0%) |
Household Income by Mortgage Status in Grand County
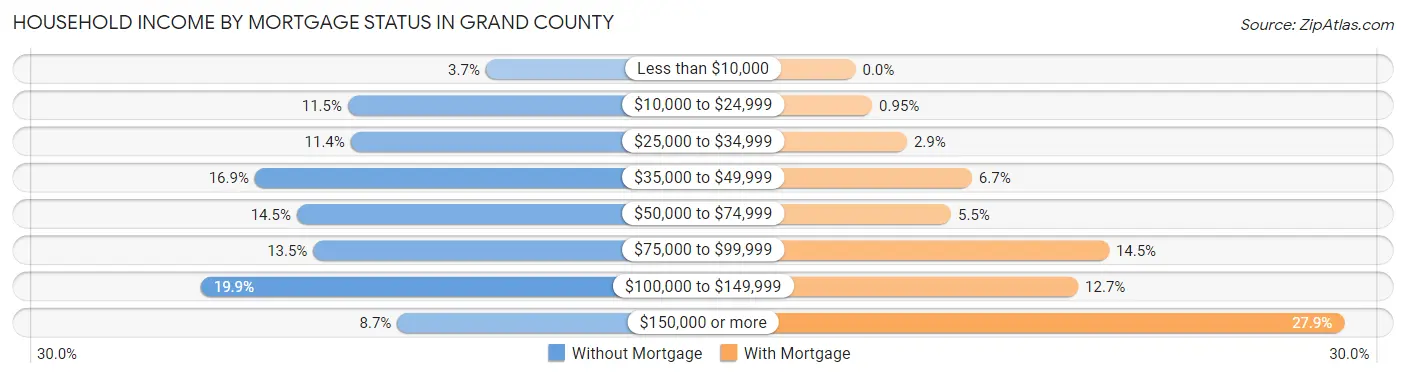
| Household Income | Without Mortgage | With Mortgage |
| Less than $10,000 | 70 (3.6%) | 0 (0.0%) |
| $10,000 to $24,999 | 221 (11.5%) | 25 (0.9%) |
| $25,000 to $34,999 | 218 (11.4%) | 77 (2.9%) |
| $35,000 to $49,999 | 323 (16.9%) | 174 (6.7%) |
| $50,000 to $74,999 | 277 (14.4%) | 143 (5.5%) |
| $75,000 to $99,999 | 259 (13.5%) | 379 (14.5%) |
| $100,000 to $149,999 | 382 (19.9%) | 333 (12.7%) |
| $150,000 or more | 167 (8.7%) | 731 (27.9%) |
| Total | 1,917 (100.0%) | 2,618 (100.0%) |
Property Value to Household Income Ratio in Grand County
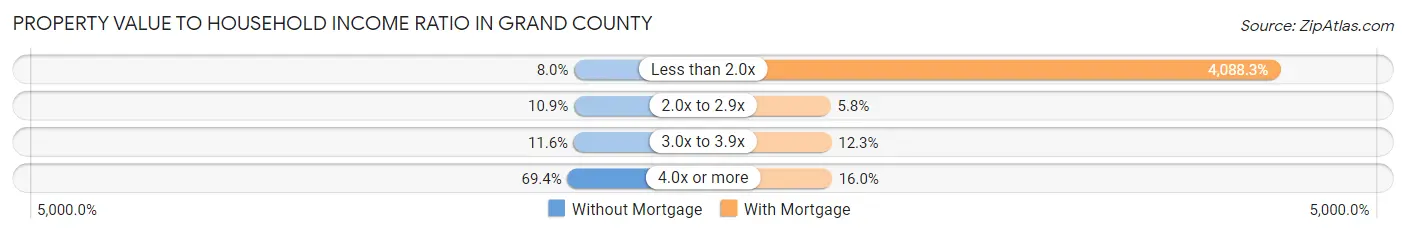
| Value-to-Income Ratio | Without Mortgage | With Mortgage |
| Less than 2.0x | 154 (8.0%) | 107,031 (4,088.3%) |
| 2.0x to 2.9x | 209 (10.9%) | 152 (5.8%) |
| 3.0x to 3.9x | 223 (11.6%) | 322 (12.3%) |
| 4.0x or more | 1,331 (69.4%) | 420 (16.0%) |
| Total | 1,917 (100.0%) | 2,618 (100.0%) |
Real Estate Taxes by Mortgage Status in Grand County
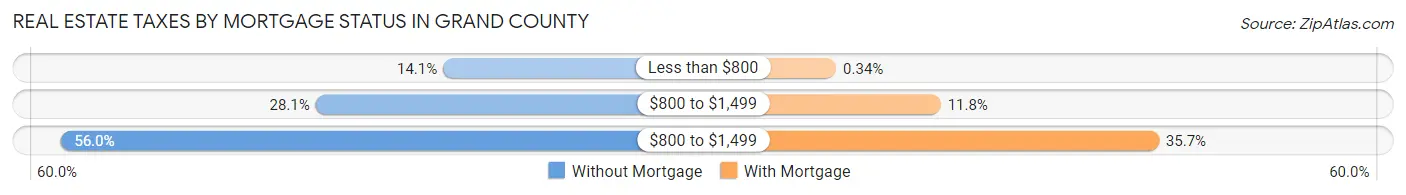
| Property Taxes | Without Mortgage | With Mortgage |
| Less than $800 | 271 (14.1%) | 9 (0.3%) |
| $800 to $1,499 | 539 (28.1%) | 309 (11.8%) |
| $800 to $1,499 | 1,073 (56.0%) | 935 (35.7%) |
| Total | 1,917 (100.0%) | 2,618 (100.0%) |
Health & Disability in Grand County
Health Insurance Coverage by Age in Grand County
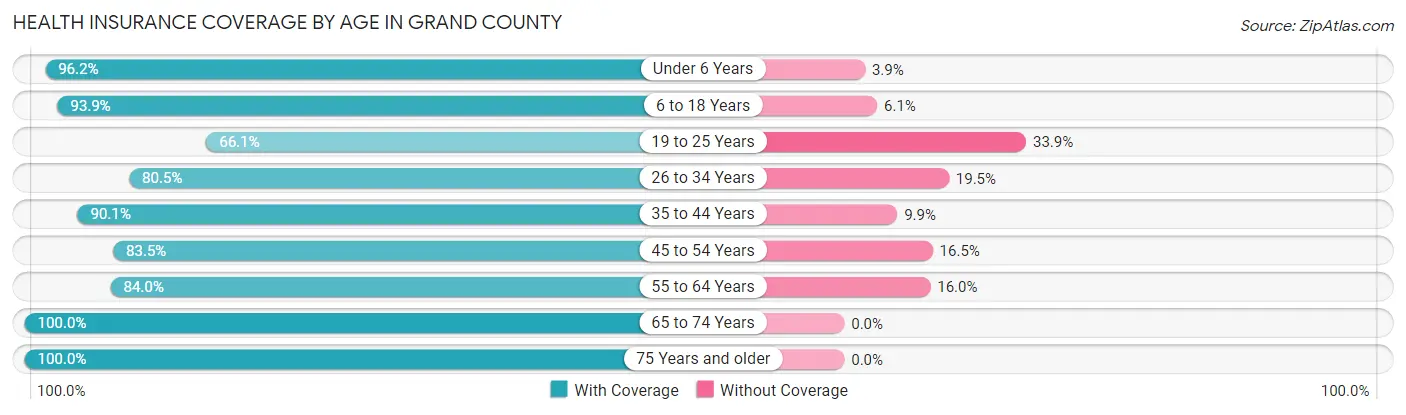
| Age Bracket | With Coverage | Without Coverage |
| Under 6 Years | 674 (96.2%) | 27 (3.8%) |
| 6 to 18 Years | 2,055 (93.9%) | 134 (6.1%) |
| 19 to 25 Years | 911 (66.1%) | 467 (33.9%) |
| 26 to 34 Years | 1,346 (80.5%) | 326 (19.5%) |
| 35 to 44 Years | 1,717 (90.1%) | 188 (9.9%) |
| 45 to 54 Years | 1,738 (83.5%) | 343 (16.5%) |
| 55 to 64 Years | 2,284 (84.0%) | 436 (16.0%) |
| 65 to 74 Years | 2,114 (100.0%) | 0 (0.0%) |
| 75 Years and older | 919 (100.0%) | 0 (0.0%) |
| Total | 13,758 (87.7%) | 1,921 (12.2%) |
Health Insurance Coverage by Citizenship Status in Grand County
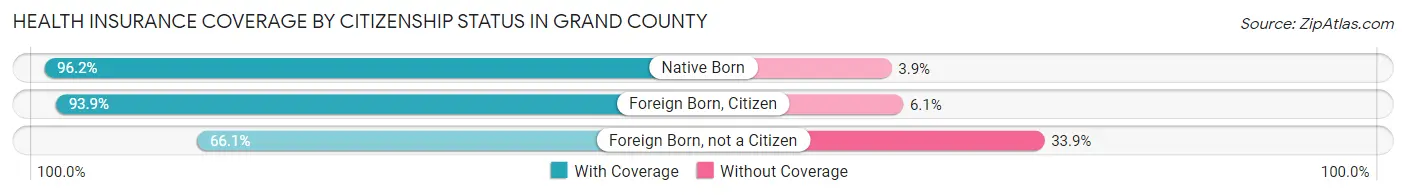
| Citizenship Status | With Coverage | Without Coverage |
| Native Born | 674 (96.2%) | 27 (3.8%) |
| Foreign Born, Citizen | 2,055 (93.9%) | 134 (6.1%) |
| Foreign Born, not a Citizen | 911 (66.1%) | 467 (33.9%) |
Health Insurance Coverage by Household Income in Grand County
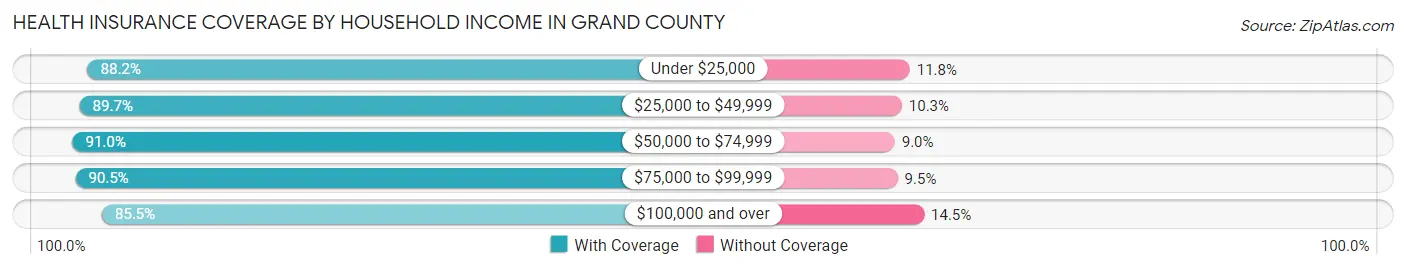
| Household Income | With Coverage | Without Coverage |
| Under $25,000 | 732 (88.2%) | 98 (11.8%) |
| $25,000 to $49,999 | 1,990 (89.7%) | 229 (10.3%) |
| $50,000 to $74,999 | 1,994 (91.0%) | 197 (9.0%) |
| $75,000 to $99,999 | 2,231 (90.5%) | 235 (9.5%) |
| $100,000 and over | 6,570 (85.5%) | 1,112 (14.5%) |
Public vs Private Health Insurance Coverage by Age in Grand County
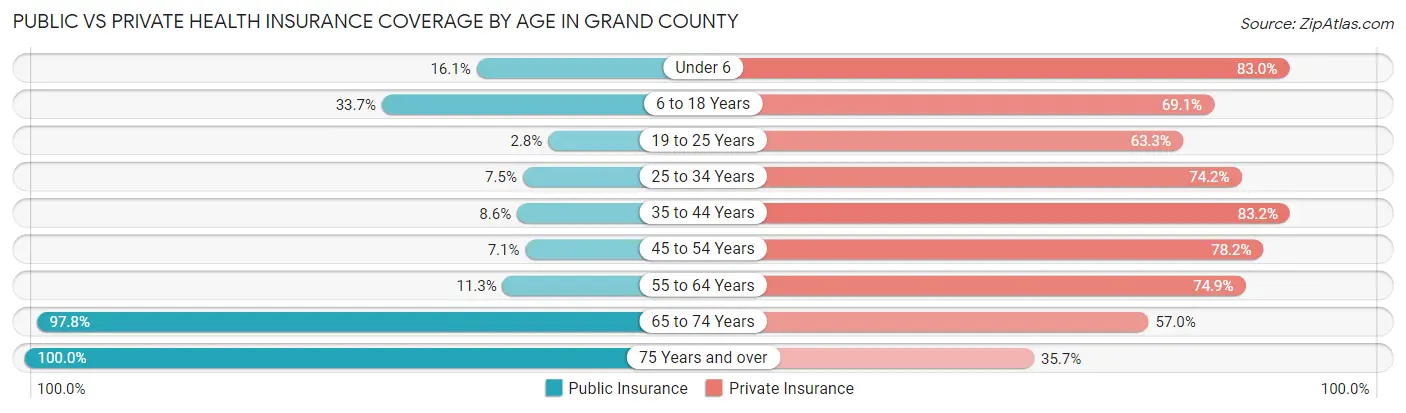
| Age Bracket | Public Insurance | Private Insurance |
| Under 6 | 113 (16.1%) | 582 (83.0%) |
| 6 to 18 Years | 738 (33.7%) | 1,512 (69.1%) |
| 19 to 25 Years | 39 (2.8%) | 872 (63.3%) |
| 25 to 34 Years | 126 (7.5%) | 1,240 (74.2%) |
| 35 to 44 Years | 164 (8.6%) | 1,584 (83.2%) |
| 45 to 54 Years | 147 (7.1%) | 1,628 (78.2%) |
| 55 to 64 Years | 307 (11.3%) | 2,037 (74.9%) |
| 65 to 74 Years | 2,067 (97.8%) | 1,204 (57.0%) |
| 75 Years and over | 919 (100.0%) | 328 (35.7%) |
| Total | 4,620 (29.5%) | 10,987 (70.1%) |
Disability Status by Sex by Age in Grand County
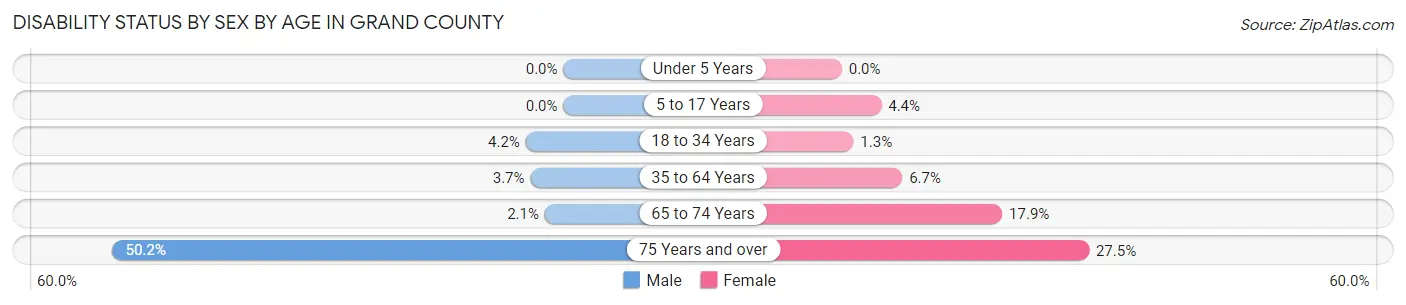
| Age Bracket | Male | Female |
| Under 5 Years | 0 (0.0%) | 0 (0.0%) |
| 5 to 17 Years | 0 (0.0%) | 48 (4.4%) |
| 18 to 34 Years | 78 (4.2%) | 18 (1.3%) |
| 35 to 64 Years | 126 (3.7%) | 220 (6.7%) |
| 65 to 74 Years | 24 (2.1%) | 170 (17.9%) |
| 75 Years and over | 248 (50.2%) | 117 (27.5%) |
Disability Class by Sex by Age in Grand County
Disability Class: Hearing Difficulty
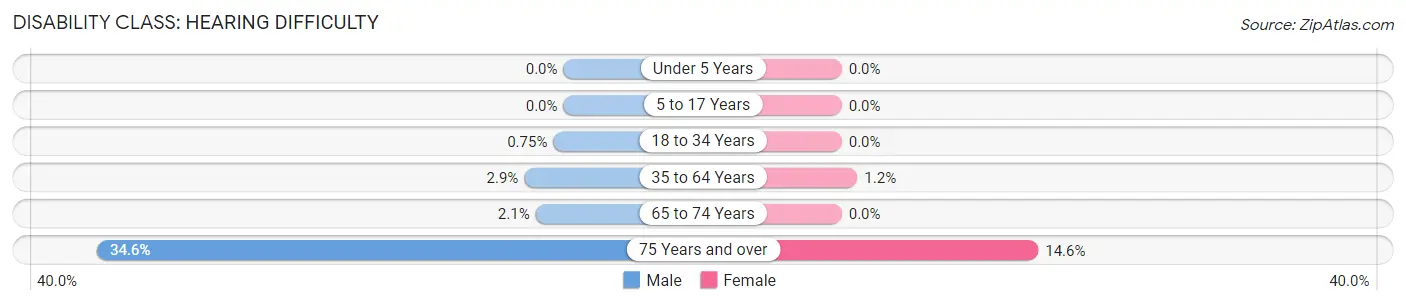
| Age Bracket | Male | Female |
| Under 5 Years | 0 (0.0%) | 0 (0.0%) |
| 5 to 17 Years | 0 (0.0%) | 0 (0.0%) |
| 18 to 34 Years | 14 (0.7%) | 0 (0.0%) |
| 35 to 64 Years | 100 (2.9%) | 38 (1.2%) |
| 65 to 74 Years | 24 (2.1%) | 0 (0.0%) |
| 75 Years and over | 171 (34.6%) | 62 (14.6%) |
Disability Class: Vision Difficulty
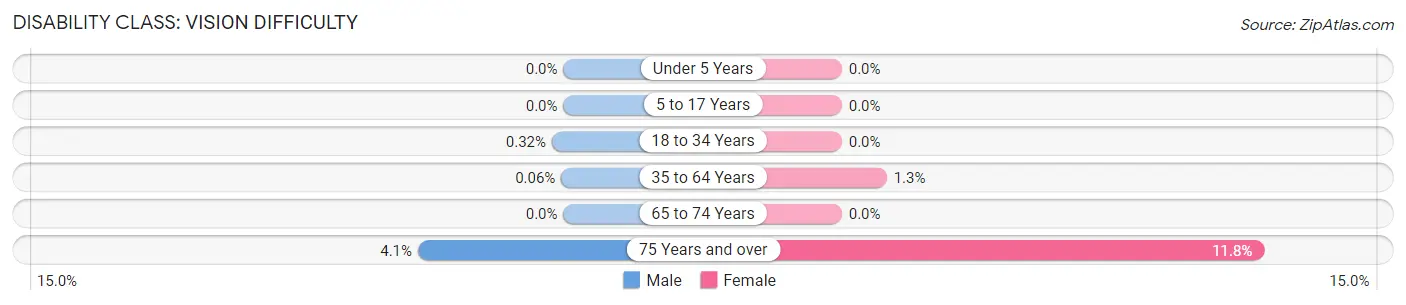
| Age Bracket | Male | Female |
| Under 5 Years | 0 (0.0%) | 0 (0.0%) |
| 5 to 17 Years | 0 (0.0%) | 0 (0.0%) |
| 18 to 34 Years | 6 (0.3%) | 0 (0.0%) |
| 35 to 64 Years | 2 (0.1%) | 41 (1.3%) |
| 65 to 74 Years | 0 (0.0%) | 0 (0.0%) |
| 75 Years and over | 20 (4.1%) | 50 (11.8%) |
Disability Class: Cognitive Difficulty
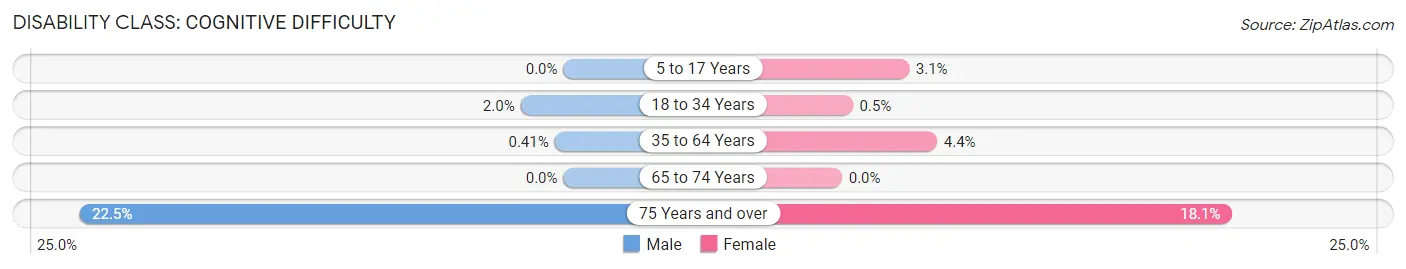
| Age Bracket | Male | Female |
| 5 to 17 Years | 0 (0.0%) | 34 (3.1%) |
| 18 to 34 Years | 37 (2.0%) | 7 (0.5%) |
| 35 to 64 Years | 14 (0.4%) | 144 (4.4%) |
| 65 to 74 Years | 0 (0.0%) | 0 (0.0%) |
| 75 Years and over | 111 (22.5%) | 77 (18.1%) |
Disability Class: Ambulatory Difficulty
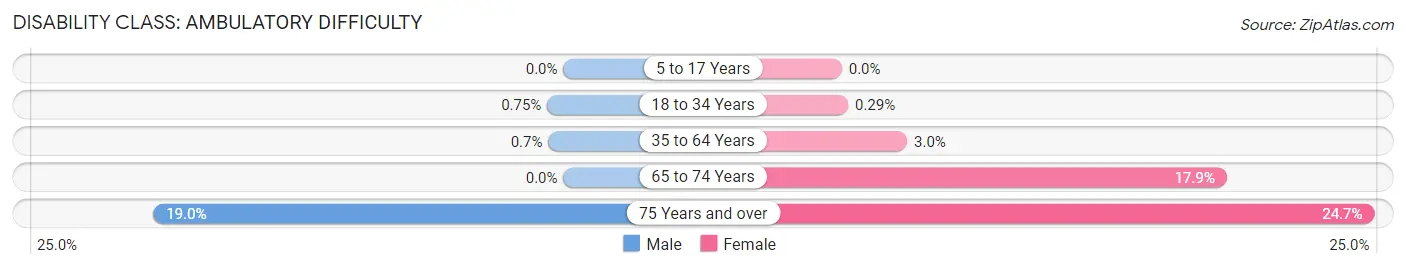
| Age Bracket | Male | Female |
| 5 to 17 Years | 0 (0.0%) | 0 (0.0%) |
| 18 to 34 Years | 14 (0.7%) | 4 (0.3%) |
| 35 to 64 Years | 24 (0.7%) | 99 (3.0%) |
| 65 to 74 Years | 0 (0.0%) | 170 (17.9%) |
| 75 Years and over | 94 (19.0%) | 105 (24.7%) |
Disability Class: Self-Care Difficulty
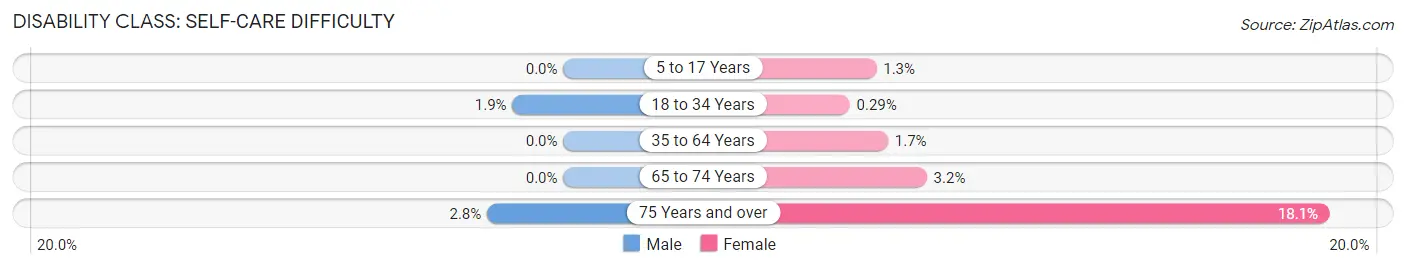
| Age Bracket | Male | Female |
| 5 to 17 Years | 0 (0.0%) | 14 (1.3%) |
| 18 to 34 Years | 35 (1.9%) | 4 (0.3%) |
| 35 to 64 Years | 0 (0.0%) | 56 (1.7%) |
| 65 to 74 Years | 0 (0.0%) | 30 (3.2%) |
| 75 Years and over | 14 (2.8%) | 77 (18.1%) |
Technology Access in Grand County
Computing Device Access in Grand County
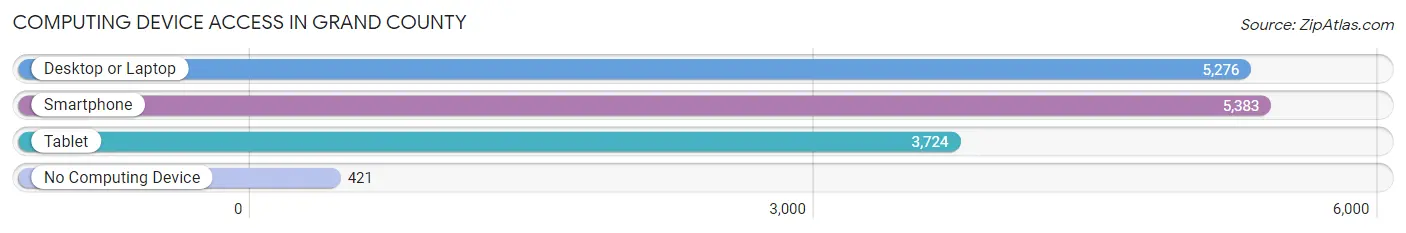
| Device Type | # Households | % Households |
| Desktop or Laptop | 5,276 | 84.6% |
| Smartphone | 5,383 | 86.3% |
| Tablet | 3,724 | 59.7% |
| No Computing Device | 421 | 6.8% |
| Total | 6,238 | 100.0% |
Internet Access in Grand County
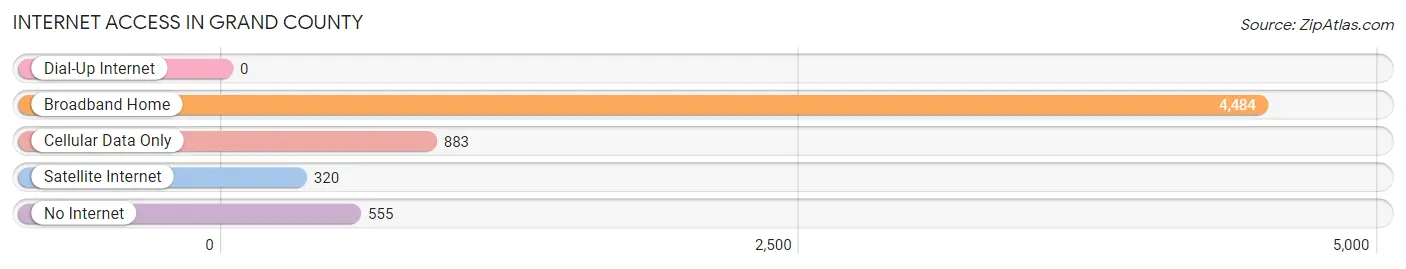
| Internet Type | # Households | % Households |
| Dial-Up Internet | 0 | 0.0% |
| Broadband Home | 4,484 | 71.9% |
| Cellular Data Only | 883 | 14.2% |
| Satellite Internet | 320 | 5.1% |
| No Internet | 555 | 8.9% |
| Total | 6,238 | 100.0% |
Grand County Summary
Geography
Grand County is located in the north-central region of Colorado, and is bordered by Jackson, Larimer, Boulder, and Summit counties. The county is home to the headwaters of the Colorado River, which originates in Grand Lake, the largest natural body of water in Colorado. The county is also home to Rocky Mountain National Park, which covers a large portion of the county. The county is mostly mountainous, with elevations ranging from 8,000 to 12,000 feet. The county is home to several mountain ranges, including the Gore Range, the Never Summer Range, and the Indian Peaks.
History
Grand County was established in 1874, and was named after Grand Lake, which was named after the Grand River, which was named by French fur traders. The county was originally inhabited by the Ute and Arapaho tribes, who were later displaced by settlers. The county was originally part of Summit County, but was split off in 1874. The county was home to several mining towns, including Hot Sulphur Springs, Kremmling, and Granby. The county was also home to several ranches, and was an important part of the cattle industry in Colorado.
Economy
Grand County is largely rural, and the economy is largely based on tourism and agriculture. The county is home to several ski resorts, including Winter Park, which is the largest ski resort in Colorado. The county is also home to several national parks and forests, which attract tourists from all over the world. The county is also home to several ranches, which are important to the local economy. The county is also home to several mining operations, which are important to the local economy.
Demographics
As of the 2010 census, Grand County had a population of 14,843. The population is largely white (90.2%), with small percentages of Hispanic (4.2%), African American (1.2%), and Native American (1.1%) populations. The median household income is $50,867, and the median age is 41. The county is largely rural, with only 8.3% of the population living in urban areas. The county is also home to several small towns, including Granby, Hot Sulphur Springs, and Kremmling.
Grand County is a beautiful and diverse county in Colorado, with a rich history and a vibrant economy. The county is home to several ski resorts, national parks, and ranches, and is an important part of the Colorado economy. The county is largely rural, and the population is largely white, with small percentages of Hispanic, African American, and Native American populations. The county is an important part of the Colorado economy, and is a great place to live and work.
Common Questions
What is Per Capita Income in Grand County?
Per Capita income in Grand County is $43,553.
What is the Median Family Income in Grand County?
Median Family Income in Grand County is $104,579.
What is the Median Household income in Grand County?
Median Household Income in Grand County is $79,367.
What is Income or Wage Gap in Grand County?
Income or Wage Gap in Grand County is 22.7%.
Women in Grand County earn 77.3 cents for every dollar earned by a man.
What is Family Income Deficit in Grand County?
Family Income Deficit in Grand County is $10,116.
Families that are below poverty line in Grand County earn $10,116 less on average than the poverty threshold level.
What is Inequality or Gini Index in Grand County?
Inequality or Gini Index in Grand County is 0.42.
What is the Total Population of Grand County?
Total Population of Grand County is 15,724.
What is the Total Male Population of Grand County?
Total Male Population of Grand County is 8,211.
What is the Total Female Population of Grand County?
Total Female Population of Grand County is 7,513.
What is the Ratio of Males per 100 Females in Grand County?
There are 109.29 Males per 100 Females in Grand County.
What is the Ratio of Females per 100 Males in Grand County?
There are 91.50 Females per 100 Males in Grand County.
What is the Median Population Age in Grand County?
Median Population Age in Grand County is 44.6 Years.
What is the Average Family Size in Grand County
Average Family Size in Grand County is 3.1 People.
What is the Average Household Size in Grand County
Average Household Size in Grand County is 2.5 People.
How Large is the Labor Force in Grand County?
There are 9,211 People in the Labor Forcein in Grand County.
What is the Percentage of People in the Labor Force in Grand County?
68.5% of People are in the Labor Force in Grand County.
What is the Unemployment Rate in Grand County?
Unemployment Rate in Grand County is 4.6%.