Gilpin County, CO Map & Demographics
Gilpin County Map
Gilpin County Overview
$57,593
PER CAPITA INCOME
$116,235
AVG FAMILY INCOME
$95,902
AVG HOUSEHOLD INCOME
49.9%
WAGE / INCOME GAP [ % ]
50.1¢/ $1
WAGE / INCOME GAP [ $ ]
0.46
INEQUALITY / GINI INDEX
5,856
TOTAL POPULATION
3,103
MALE POPULATION
2,753
FEMALE POPULATION
112.71
MALES / 100 FEMALES
88.72
FEMALES / 100 MALES
47.4
MEDIAN AGE
2.6
AVG FAMILY SIZE
2.0
AVG HOUSEHOLD SIZE
3,653
LABOR FORCE [ PEOPLE ]
73.2%
PERCENT IN LABOR FORCE
2.1%
UNEMPLOYMENT RATE
Income in Gilpin County
Income Overview in Gilpin County
Per Capita Income in Gilpin County is $57,593, while median incomes of families and households are $116,235 and $95,902 respectively.
| Characteristic | Number | Measure |
| Per Capita Income | 5,856 | $57,593 |
| Median Family Income | 1,588 | $116,235 |
| Mean Family Income | 1,588 | $156,826 |
| Median Household Income | 2,853 | $95,902 |
| Mean Household Income | 2,853 | $125,373 |
| Income Deficit | 1,588 | $0 |
| Wage / Income Gap (%) | 5,856 | 49.95% |
| Wage / Income Gap ($) | 5,856 | 50.05¢ per $1 |
| Gini / Inequality Index | 5,856 | 0.46 |
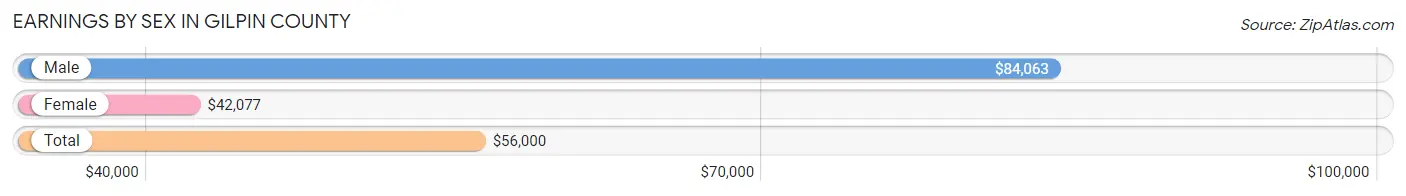
Earnings by Sex in Gilpin County
Average Earnings in Gilpin County are $56,000, $84,063 for men and $42,077 for women, a difference of 49.9%.
| Sex | Number | Average Earnings |
| Male | 2,030 (54.0%) | $84,063 |
| Female | 1,726 (46.0%) | $42,077 |
| Total | 3,756 (100.0%) | $56,000 |
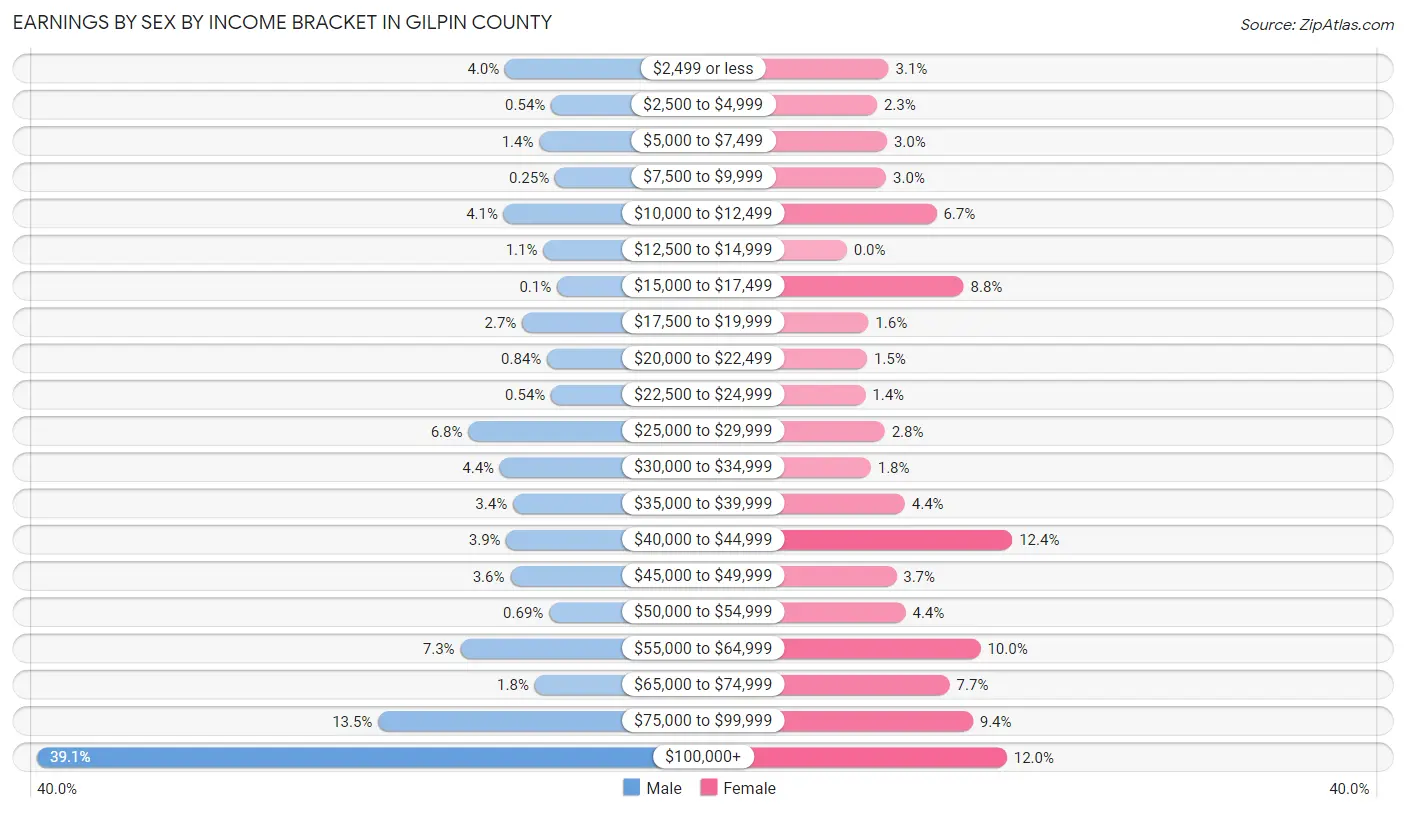
Earnings by Sex by Income Bracket in Gilpin County
The most common earnings brackets in Gilpin County are $100,000+ for men (793 | 39.1%) and $40,000 to $44,999 for women (214 | 12.4%).
| Income | Male | Female |
| $2,499 or less | 81 (4.0%) | 54 (3.1%) |
| $2,500 to $4,999 | 11 (0.5%) | 39 (2.3%) |
| $5,000 to $7,499 | 29 (1.4%) | 52 (3.0%) |
| $7,500 to $9,999 | 5 (0.3%) | 51 (2.9%) |
| $10,000 to $12,499 | 83 (4.1%) | 116 (6.7%) |
| $12,500 to $14,999 | 23 (1.1%) | 0 (0.0%) |
| $15,000 to $17,499 | 2 (0.1%) | 151 (8.7%) |
| $17,500 to $19,999 | 55 (2.7%) | 28 (1.6%) |
| $20,000 to $22,499 | 17 (0.8%) | 26 (1.5%) |
| $22,500 to $24,999 | 11 (0.5%) | 24 (1.4%) |
| $25,000 to $29,999 | 137 (6.8%) | 49 (2.8%) |
| $30,000 to $34,999 | 89 (4.4%) | 31 (1.8%) |
| $35,000 to $39,999 | 69 (3.4%) | 75 (4.3%) |
| $40,000 to $44,999 | 79 (3.9%) | 214 (12.4%) |
| $45,000 to $49,999 | 73 (3.6%) | 64 (3.7%) |
| $50,000 to $54,999 | 14 (0.7%) | 76 (4.4%) |
| $55,000 to $64,999 | 149 (7.3%) | 173 (10.0%) |
| $65,000 to $74,999 | 36 (1.8%) | 133 (7.7%) |
| $75,000 to $99,999 | 274 (13.5%) | 163 (9.4%) |
| $100,000+ | 793 (39.1%) | 207 (12.0%) |
| Total | 2,030 (100.0%) | 1,726 (100.0%) |
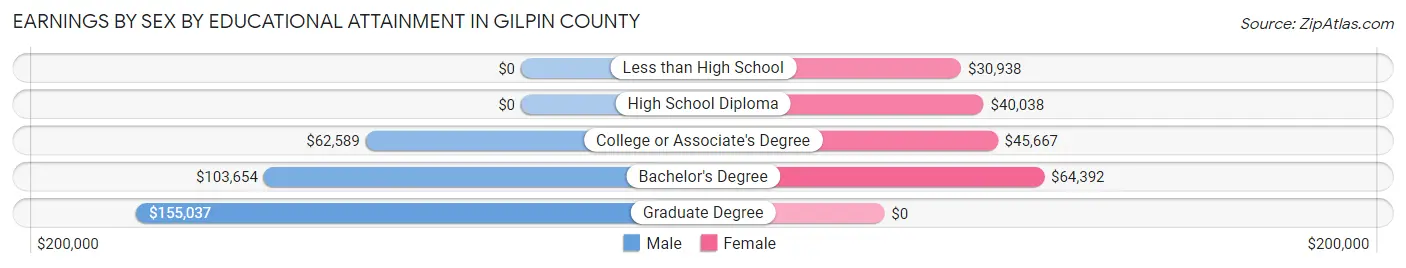
Earnings by Sex by Educational Attainment in Gilpin County
Average earnings in Gilpin County are $87,384 for men and $45,091 for women, a difference of 48.4%. Men with an educational attainment of graduate degree enjoy the highest average annual earnings of $155,037, while those with college or associate's degree education earn the least with $62,589. Women with an educational attainment of bachelor's degree earn the most with the average annual earnings of $64,392, while those with less than high school education have the smallest earnings of $30,938.
| Educational Attainment | Male Income | Female Income |
| Less than High School | - | - |
| High School Diploma | - | - |
| College or Associate's Degree | $62,589 | $45,667 |
| Bachelor's Degree | $103,654 | $64,392 |
| Graduate Degree | $155,037 | $0 |
| Total | $87,384 | $45,091 |
Family Income in Gilpin County
Family Income Brackets in Gilpin County
According to the Gilpin County family income data, there are 410 families falling into the $100,000 to $149,999 income range, which is the most common income bracket and makes up 25.8% of all families. Conversely, the $15,000 to $24,999 income bracket is the least frequent group with only 8 families (0.5%) belonging to this category.
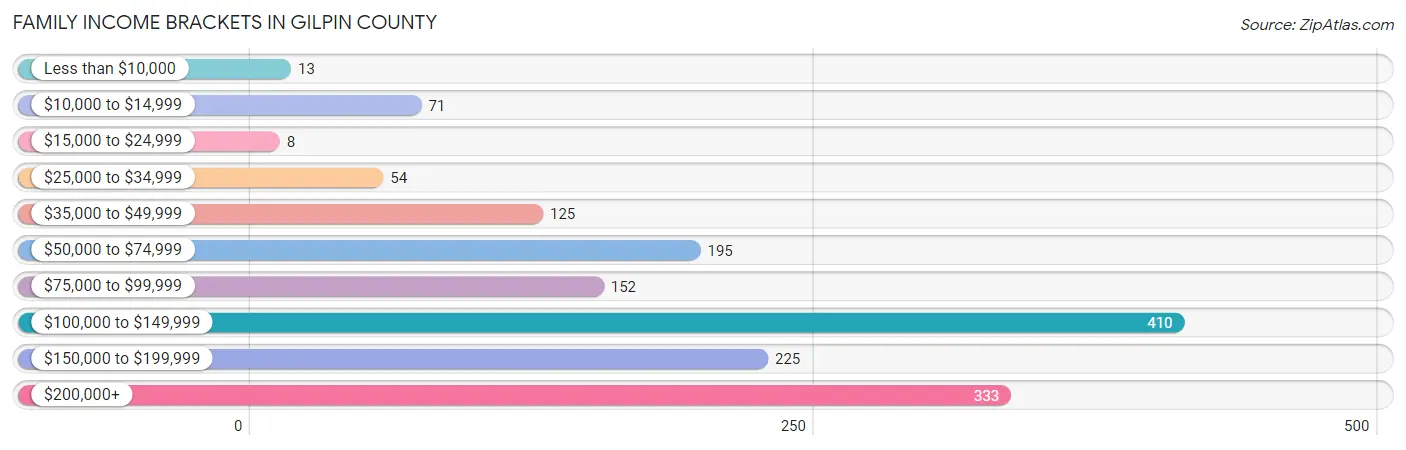
| Income Bracket | # Families | % Families |
| Less than $10,000 | 13 | 0.8% |
| $10,000 to $14,999 | 71 | 4.5% |
| $15,000 to $24,999 | 8 | 0.5% |
| $25,000 to $34,999 | 54 | 3.4% |
| $35,000 to $49,999 | 125 | 7.9% |
| $50,000 to $74,999 | 195 | 12.3% |
| $75,000 to $99,999 | 152 | 9.6% |
| $100,000 to $149,999 | 410 | 25.8% |
| $150,000 to $199,999 | 225 | 14.2% |
| $200,000+ | 333 | 21.0% |
Family Income by Famaliy Size in Gilpin County
4-person families (163 | 10.3%) account for the highest median family income in Gilpin County with $139,821 per family, while 2-person families (795 | 50.1%) have the highest median income of $52,224 per family member.
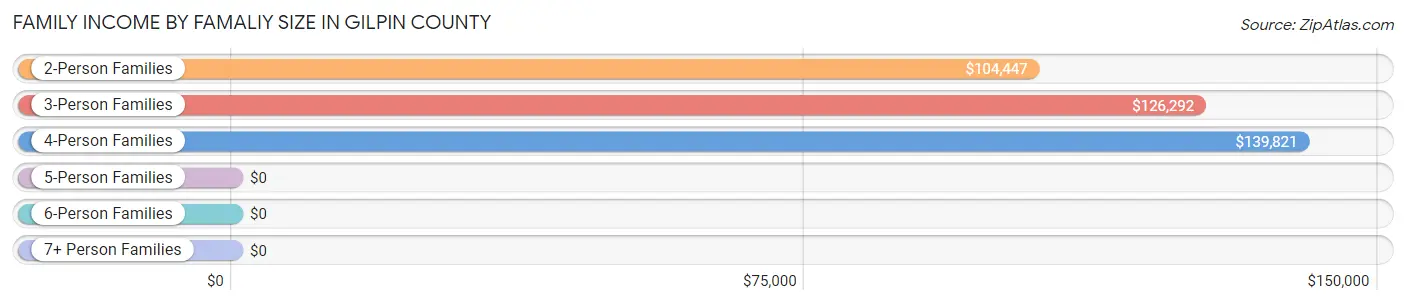
| Income Bracket | # Families | Median Income |
| 2-Person Families | 795 (50.1%) | $104,447 |
| 3-Person Families | 555 (34.9%) | $126,292 |
| 4-Person Families | 163 (10.3%) | $139,821 |
| 5-Person Families | 67 (4.2%) | $0 |
| 6-Person Families | 0 (0.0%) | $0 |
| 7+ Person Families | 8 (0.5%) | $0 |
| Total | 1,588 (100.0%) | $116,235 |
Family Income by Number of Earners in Gilpin County
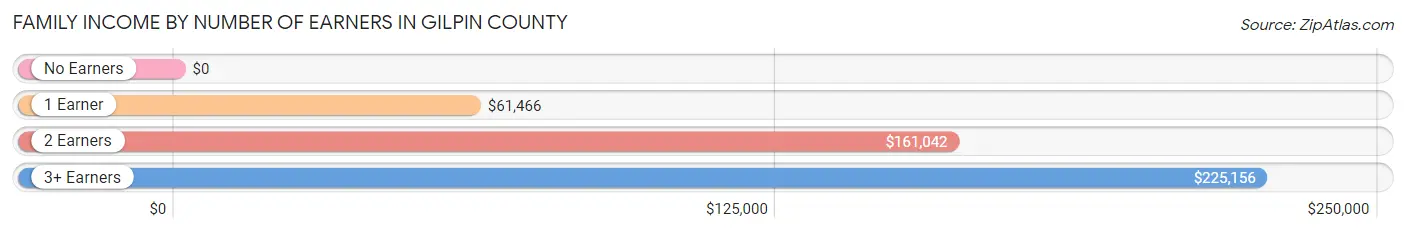
| Number of Earners | # Families | Median Income |
| No Earners | 96 (6.0%) | $0 |
| 1 Earner | 516 (32.5%) | $61,466 |
| 2 Earners | 859 (54.1%) | $161,042 |
| 3+ Earners | 117 (7.4%) | $225,156 |
| Total | 1,588 (100.0%) | $116,235 |
Household Income in Gilpin County
Household Income Brackets in Gilpin County
With 559 households falling in the category, the $100,000 to $149,999 income range is the most frequent in Gilpin County, accounting for 19.6% of all households. In contrast, only 68 households (2.4%) fall into the less than $10,000 income bracket, making it the least populous group.
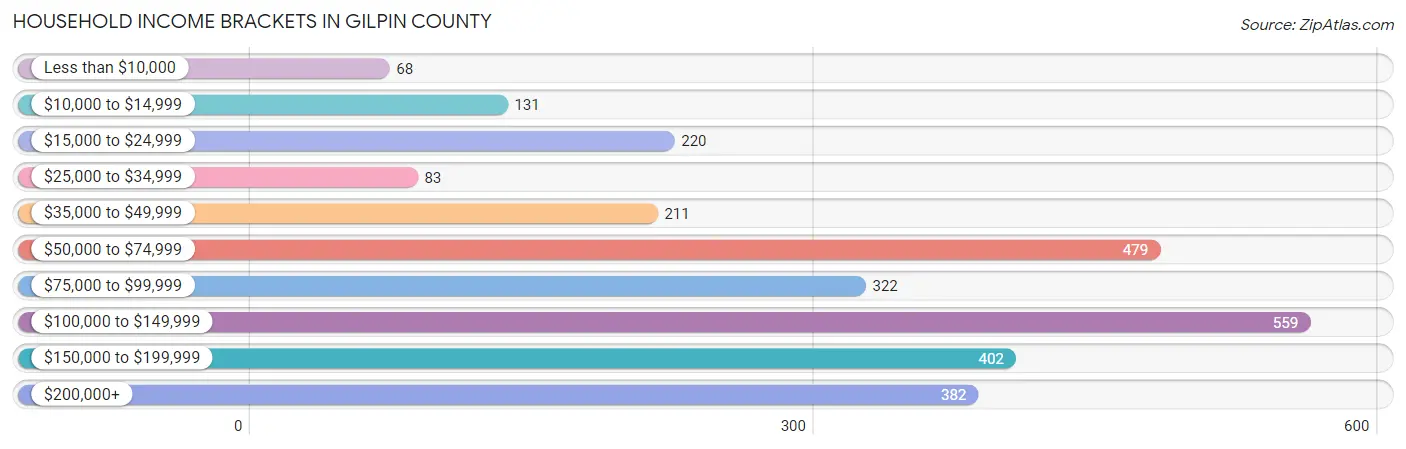
| Income Bracket | # Households | % Households |
| Less than $10,000 | 68 | 2.4% |
| $10,000 to $14,999 | 131 | 4.6% |
| $15,000 to $24,999 | 220 | 7.7% |
| $25,000 to $34,999 | 83 | 2.9% |
| $35,000 to $49,999 | 211 | 7.4% |
| $50,000 to $74,999 | 479 | 16.8% |
| $75,000 to $99,999 | 322 | 11.3% |
| $100,000 to $149,999 | 559 | 19.6% |
| $150,000 to $199,999 | 402 | 14.1% |
| $200,000+ | 382 | 13.4% |
Household Income by Householder Age in Gilpin County
The median household income in Gilpin County is $95,902, with the highest median household income of $107,404 found in the 45 to 64 years age bracket for the primary householder. A total of 1,495 households (52.4%) fall into this category. Meanwhile, the 15 to 24 years age bracket for the primary householder has the lowest median household income of $0, with 11 households (0.4%) in this group.
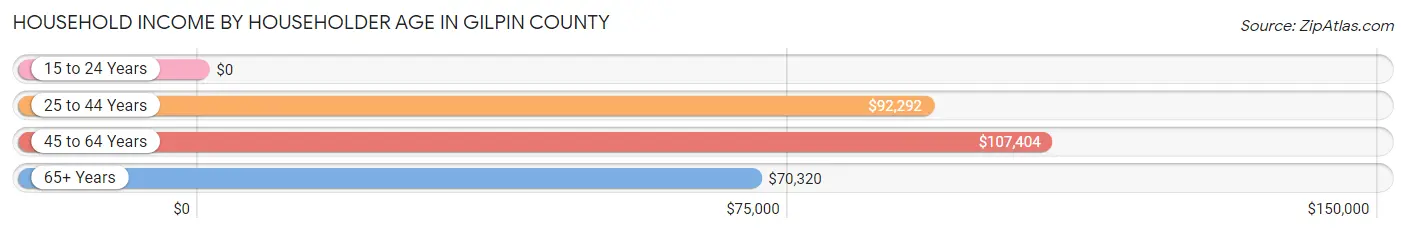
| Income Bracket | # Households | Median Income |
| 15 to 24 Years | 11 (0.4%) | $0 |
| 25 to 44 Years | 694 (24.3%) | $92,292 |
| 45 to 64 Years | 1,495 (52.4%) | $107,404 |
| 65+ Years | 653 (22.9%) | $70,320 |
| Total | 2,853 (100.0%) | $95,902 |
Poverty in Gilpin County
Income Below Poverty by Sex and Age in Gilpin County
With 6.0% poverty level for males and 13.0% for females among the residents of Gilpin County, 6 to 11 year old males and 6 to 11 year old females are the most vulnerable to poverty, with 66 males (26.0%) and 84 females (50.3%) in their respective age groups living below the poverty level.
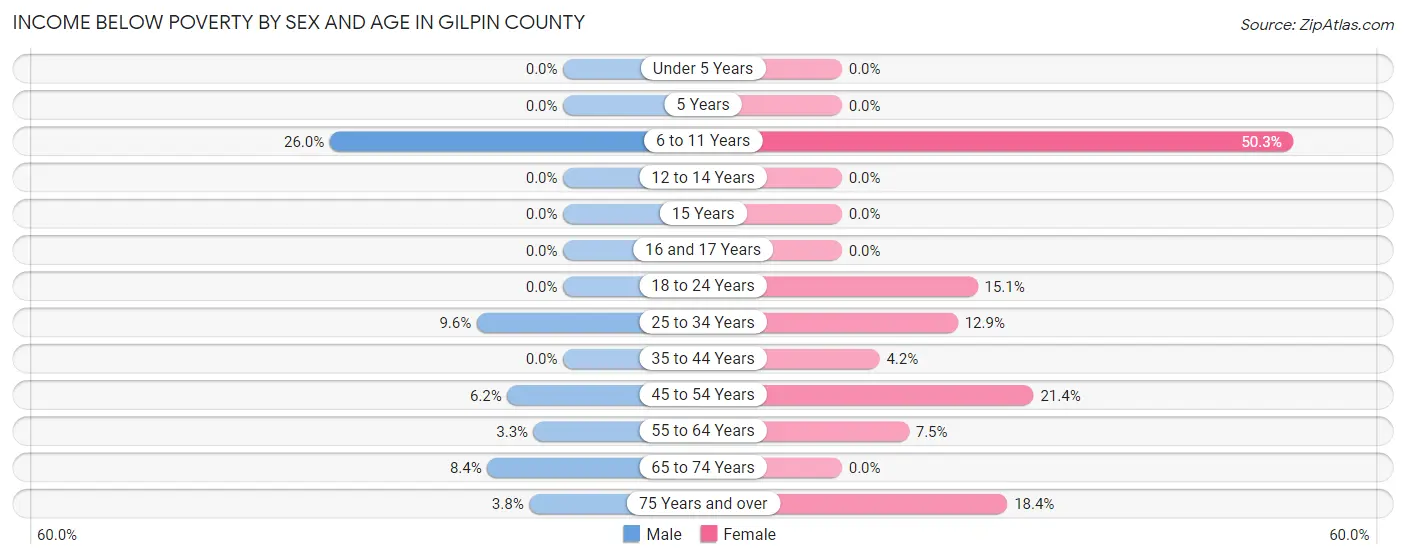
| Age Bracket | Male | Female |
| Under 5 Years | 0 (0.0%) | 0 (0.0%) |
| 5 Years | 0 (0.0%) | 0 (0.0%) |
| 6 to 11 Years | 66 (26.0%) | 84 (50.3%) |
| 12 to 14 Years | 0 (0.0%) | 0 (0.0%) |
| 15 Years | 0 (0.0%) | 0 (0.0%) |
| 16 and 17 Years | 0 (0.0%) | 0 (0.0%) |
| 18 to 24 Years | 0 (0.0%) | 13 (15.1%) |
| 25 to 34 Years | 27 (9.6%) | 39 (12.9%) |
| 35 to 44 Years | 0 (0.0%) | 17 (4.2%) |
| 45 to 54 Years | 30 (6.2%) | 120 (21.3%) |
| 55 to 64 Years | 26 (3.3%) | 34 (7.5%) |
| 65 to 74 Years | 27 (8.4%) | 0 (0.0%) |
| 75 Years and over | 6 (3.8%) | 49 (18.4%) |
| Total | 182 (6.0%) | 356 (13.0%) |
Income Above Poverty by Sex and Age in Gilpin County
According to the poverty statistics in Gilpin County, males aged under 5 years and females aged under 5 years are the age groups that are most secure financially, with 100.0% of males and 100.0% of females in these age groups living above the poverty line.
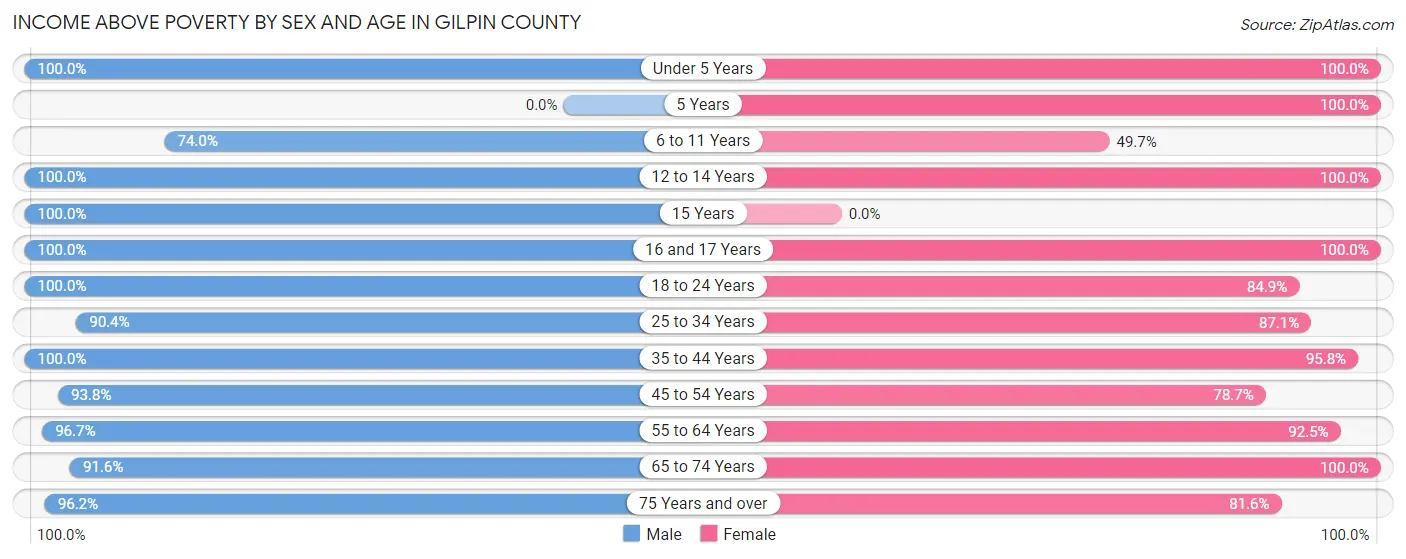
| Age Bracket | Male | Female |
| Under 5 Years | 100 (100.0%) | 78 (100.0%) |
| 5 Years | 0 (0.0%) | 44 (100.0%) |
| 6 to 11 Years | 188 (74.0%) | 83 (49.7%) |
| 12 to 14 Years | 108 (100.0%) | 70 (100.0%) |
| 15 Years | 18 (100.0%) | 0 (0.0%) |
| 16 and 17 Years | 70 (100.0%) | 111 (100.0%) |
| 18 to 24 Years | 56 (100.0%) | 73 (84.9%) |
| 25 to 34 Years | 254 (90.4%) | 263 (87.1%) |
| 35 to 44 Years | 403 (100.0%) | 388 (95.8%) |
| 45 to 54 Years | 453 (93.8%) | 442 (78.6%) |
| 55 to 64 Years | 766 (96.7%) | 422 (92.5%) |
| 65 to 74 Years | 293 (91.6%) | 189 (100.0%) |
| 75 Years and over | 153 (96.2%) | 217 (81.6%) |
| Total | 2,862 (94.0%) | 2,380 (87.0%) |
Income Below Poverty Among Married-Couple Families in Gilpin County
The poverty statistics for married-couple families in Gilpin County show that 1.5% or 18 of the total 1,218 families live below the poverty line. Families with no children have the highest poverty rate of 2.3%, comprising of 18 families. On the other hand, families with 1 or 2 children have the lowest poverty rate of 0.0%, which includes 0 families.
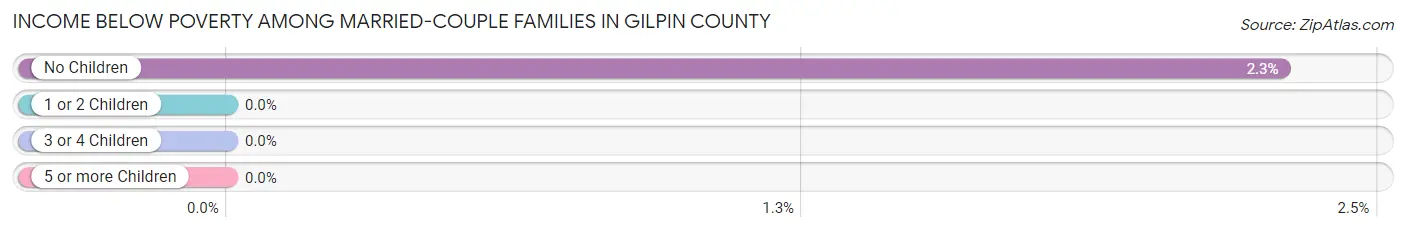
| Children | Above Poverty | Below Poverty |
| No Children | 769 (97.7%) | 18 (2.3%) |
| 1 or 2 Children | 379 (100.0%) | 0 (0.0%) |
| 3 or 4 Children | 52 (100.0%) | 0 (0.0%) |
| 5 or more Children | 0 (0.0%) | 0 (0.0%) |
| Total | 1,200 (98.5%) | 18 (1.5%) |
Income Below Poverty Among Single-Parent Households in Gilpin County
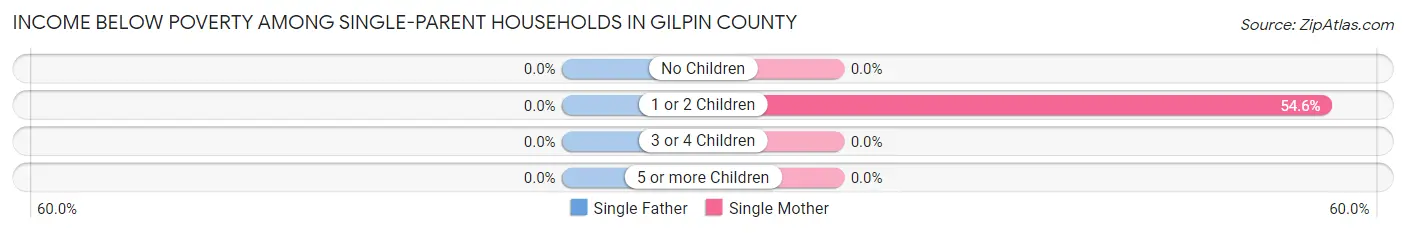
| Children | Single Father | Single Mother |
| No Children | 0 (0.0%) | 0 (0.0%) |
| 1 or 2 Children | 0 (0.0%) | 65 (54.6%) |
| 3 or 4 Children | 0 (0.0%) | 0 (0.0%) |
| 5 or more Children | 0 (0.0%) | 0 (0.0%) |
| Total | 0 (0.0%) | 65 (26.8%) |
Income Below Poverty Among Married-Couple vs Single-Parent Households in Gilpin County
The poverty data for Gilpin County shows that 18 of the married-couple family households (1.5%) and 65 of the single-parent households (17.6%) are living below the poverty level. Within the married-couple family households, those with no children have the highest poverty rate, with 18 households (2.3%) falling below the poverty line. Among the single-parent households, those with 1 or 2 children have the highest poverty rate, with 65 household (33.3%) living below poverty.
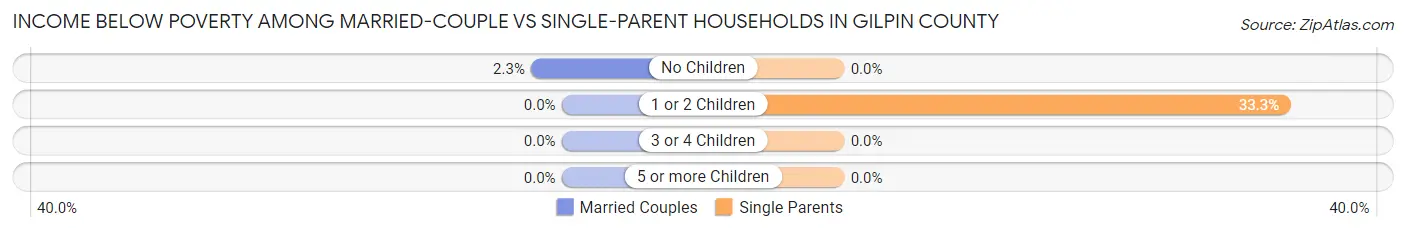
| Children | Married-Couple Families | Single-Parent Households |
| No Children | 18 (2.3%) | 0 (0.0%) |
| 1 or 2 Children | 0 (0.0%) | 65 (33.3%) |
| 3 or 4 Children | 0 (0.0%) | 0 (0.0%) |
| 5 or more Children | 0 (0.0%) | 0 (0.0%) |
| Total | 18 (1.5%) | 65 (17.6%) |
Race in Gilpin County
The most populous races in Gilpin County are White / Caucasian (5,255 | 89.7%), Hispanic or Latino (561 | 9.6%), and Two or more Races (485 | 8.3%).
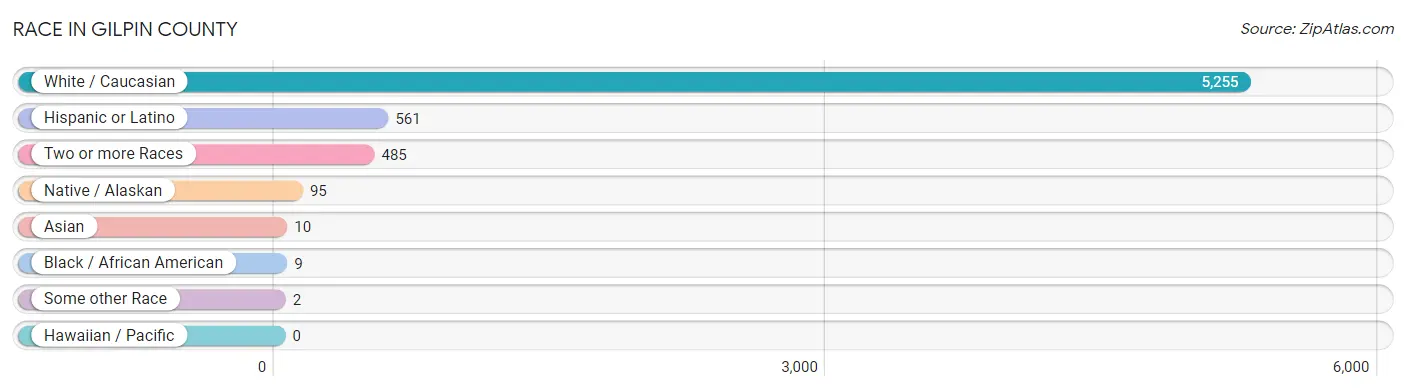
| Race | # Population | % Population |
| Asian | 10 | 0.2% |
| Black / African American | 9 | 0.2% |
| Hawaiian / Pacific | 0 | 0.0% |
| Hispanic or Latino | 561 | 9.6% |
| Native / Alaskan | 95 | 1.6% |
| White / Caucasian | 5,255 | 89.7% |
| Two or more Races | 485 | 8.3% |
| Some other Race | 2 | 0.0% |
| Total | 5,856 | 100.0% |
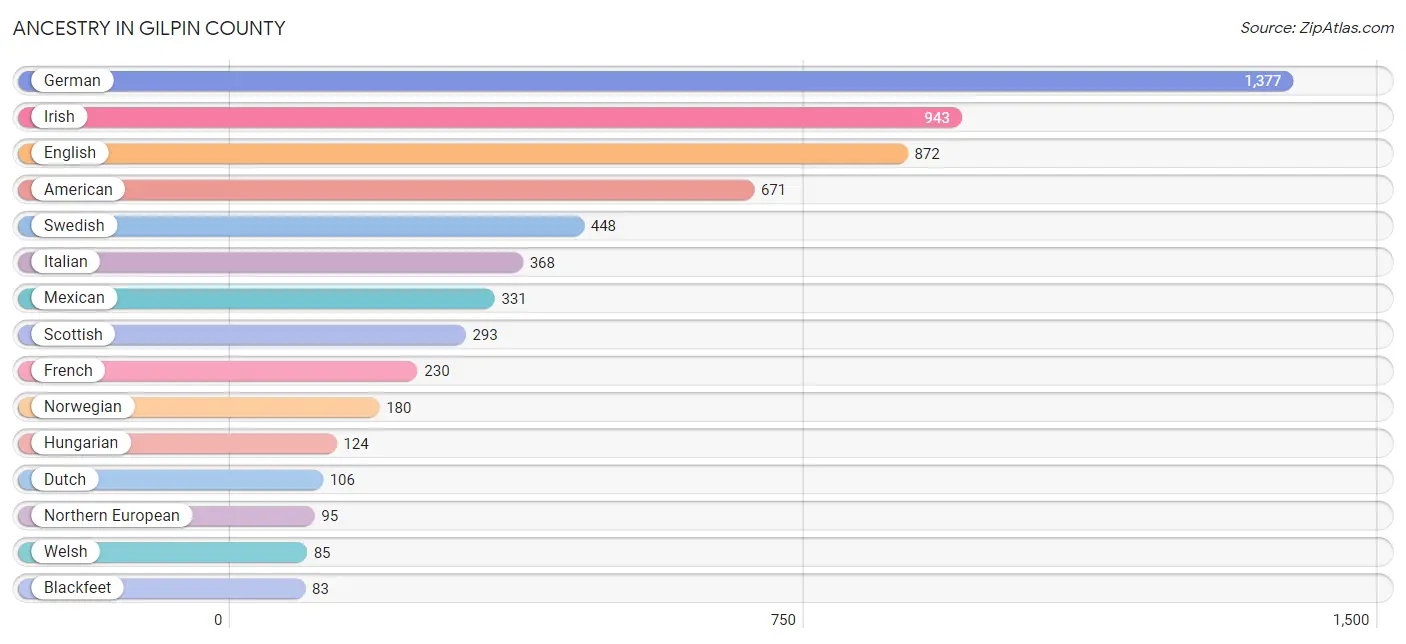
Ancestry in Gilpin County
The most populous ancestries reported in Gilpin County are German (1,377 | 23.5%), Irish (943 | 16.1%), English (872 | 14.9%), American (671 | 11.5%), and Swedish (448 | 7.6%), together accounting for 73.6% of all Gilpin County residents.
| Ancestry | # Population | % Population |
| African | 7 | 0.1% |
| American | 671 | 11.5% |
| Austrian | 14 | 0.2% |
| Bhutanese | 17 | 0.3% |
| Blackfeet | 83 | 1.4% |
| British | 35 | 0.6% |
| Burmese | 13 | 0.2% |
| Canadian | 14 | 0.2% |
| Central American | 68 | 1.2% |
| Cherokee | 45 | 0.8% |
| Colombian | 37 | 0.6% |
| Czechoslovakian | 3 | 0.1% |
| Danish | 32 | 0.5% |
| Dutch | 106 | 1.8% |
| Eastern European | 10 | 0.2% |
| English | 872 | 14.9% |
| Estonian | 79 | 1.3% |
| European | 49 | 0.8% |
| French | 230 | 3.9% |
| French Canadian | 81 | 1.4% |
| German | 1,377 | 23.5% |
| Greek | 19 | 0.3% |
| Hungarian | 124 | 2.1% |
| Indian (Asian) | 14 | 0.2% |
| Irish | 943 | 16.1% |
| Italian | 368 | 6.3% |
| Korean | 23 | 0.4% |
| Lithuanian | 6 | 0.1% |
| Mexican | 331 | 5.7% |
| Navajo | 18 | 0.3% |
| Northern European | 95 | 1.6% |
| Norwegian | 180 | 3.1% |
| Polish | 67 | 1.1% |
| Pueblo | 20 | 0.3% |
| Puerto Rican | 66 | 1.1% |
| Romanian | 3 | 0.1% |
| Russian | 33 | 0.6% |
| Salvadoran | 68 | 1.2% |
| Scandinavian | 60 | 1.0% |
| Scotch-Irish | 50 | 0.9% |
| Scottish | 293 | 5.0% |
| Sioux | 1 | 0.0% |
| Slovak | 13 | 0.2% |
| Slovene | 7 | 0.1% |
| South American | 37 | 0.6% |
| Spaniard | 12 | 0.2% |
| Spanish | 47 | 0.8% |
| Subsaharan African | 7 | 0.1% |
| Swedish | 448 | 7.6% |
| Swiss | 2 | 0.0% |
| Ukrainian | 15 | 0.3% |
| Welsh | 85 | 1.5% |
| Yugoslavian | 7 | 0.1% | View All 53 Rows |
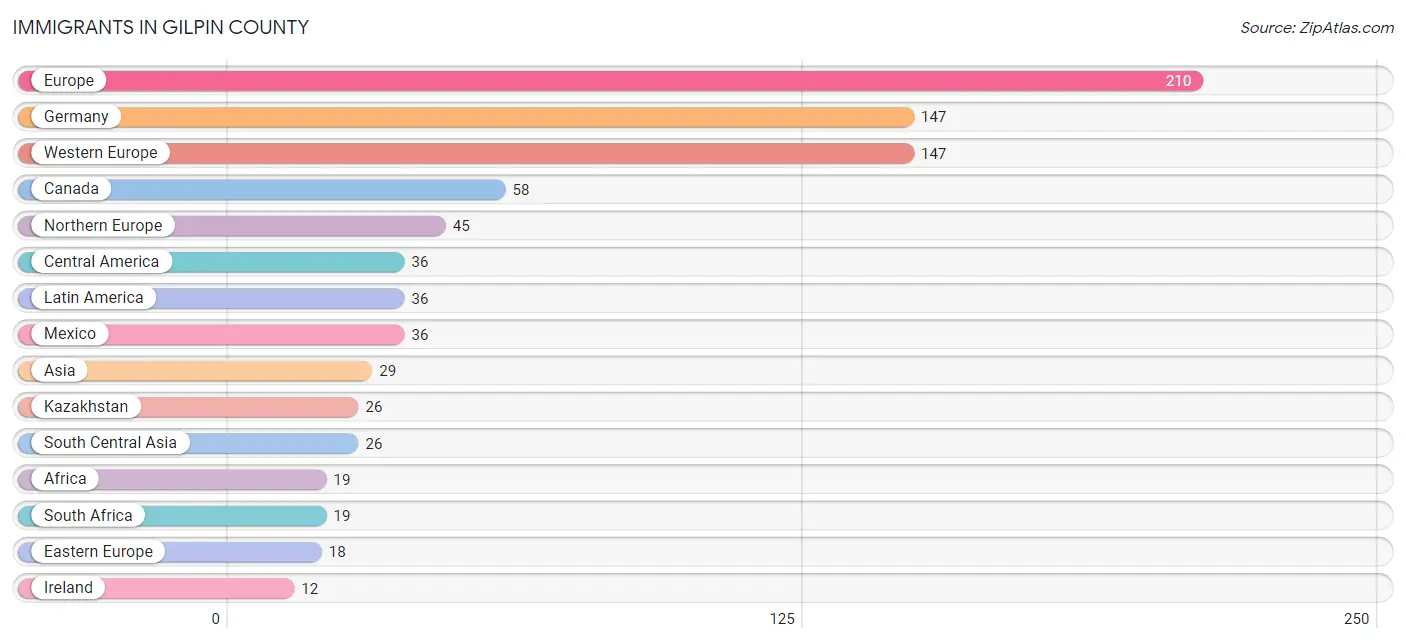
Immigrants in Gilpin County
The most numerous immigrant groups reported in Gilpin County came from Europe (210 | 3.6%), Germany (147 | 2.5%), Western Europe (147 | 2.5%), Canada (58 | 1.0%), and Northern Europe (45 | 0.8%), together accounting for 10.4% of all Gilpin County residents.
| Immigration Origin | # Population | % Population |
| Africa | 19 | 0.3% |
| Asia | 29 | 0.5% |
| Canada | 58 | 1.0% |
| Central America | 36 | 0.6% |
| China | 3 | 0.1% |
| Eastern Asia | 3 | 0.1% |
| Eastern Europe | 18 | 0.3% |
| Europe | 210 | 3.6% |
| Germany | 147 | 2.5% |
| Ireland | 12 | 0.2% |
| Kazakhstan | 26 | 0.4% |
| Latin America | 36 | 0.6% |
| Lithuania | 6 | 0.1% |
| Mexico | 36 | 0.6% |
| Northern Europe | 45 | 0.8% |
| South Africa | 19 | 0.3% |
| South Central Asia | 26 | 0.4% |
| Western Europe | 147 | 2.5% | View All 18 Rows |
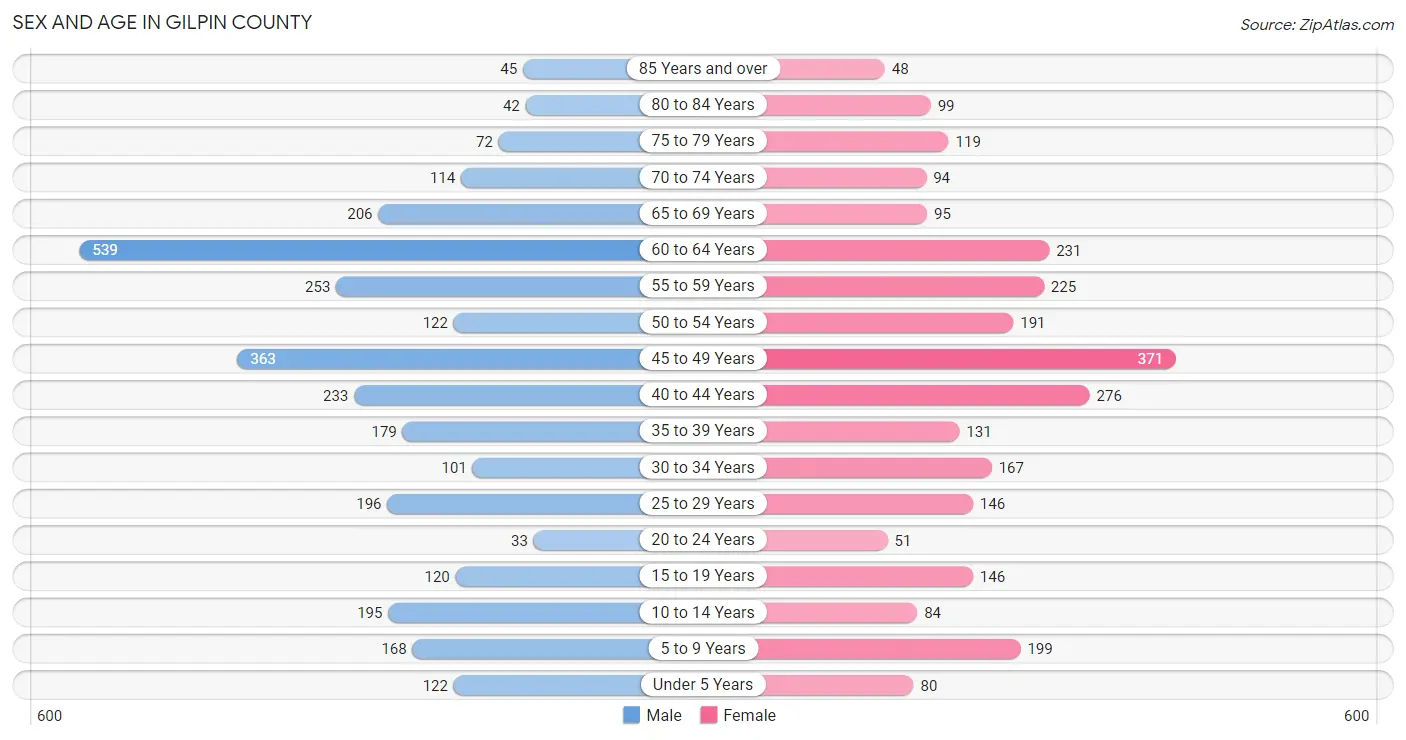
Sex and Age in Gilpin County
Sex and Age in Gilpin County
The most populous age groups in Gilpin County are 60 to 64 Years (539 | 17.4%) for men and 45 to 49 Years (371 | 13.5%) for women.
| Age Bracket | Male | Female |
| Under 5 Years | 122 (3.9%) | 80 (2.9%) |
| 5 to 9 Years | 168 (5.4%) | 199 (7.2%) |
| 10 to 14 Years | 195 (6.3%) | 84 (3.0%) |
| 15 to 19 Years | 120 (3.9%) | 146 (5.3%) |
| 20 to 24 Years | 33 (1.1%) | 51 (1.8%) |
| 25 to 29 Years | 196 (6.3%) | 146 (5.3%) |
| 30 to 34 Years | 101 (3.3%) | 167 (6.1%) |
| 35 to 39 Years | 179 (5.8%) | 131 (4.8%) |
| 40 to 44 Years | 233 (7.5%) | 276 (10.0%) |
| 45 to 49 Years | 363 (11.7%) | 371 (13.5%) |
| 50 to 54 Years | 122 (3.9%) | 191 (6.9%) |
| 55 to 59 Years | 253 (8.2%) | 225 (8.2%) |
| 60 to 64 Years | 539 (17.4%) | 231 (8.4%) |
| 65 to 69 Years | 206 (6.6%) | 95 (3.5%) |
| 70 to 74 Years | 114 (3.7%) | 94 (3.4%) |
| 75 to 79 Years | 72 (2.3%) | 119 (4.3%) |
| 80 to 84 Years | 42 (1.3%) | 99 (3.6%) |
| 85 Years and over | 45 (1.5%) | 48 (1.7%) |
| Total | 3,103 (100.0%) | 2,753 (100.0%) |
Families and Households in Gilpin County
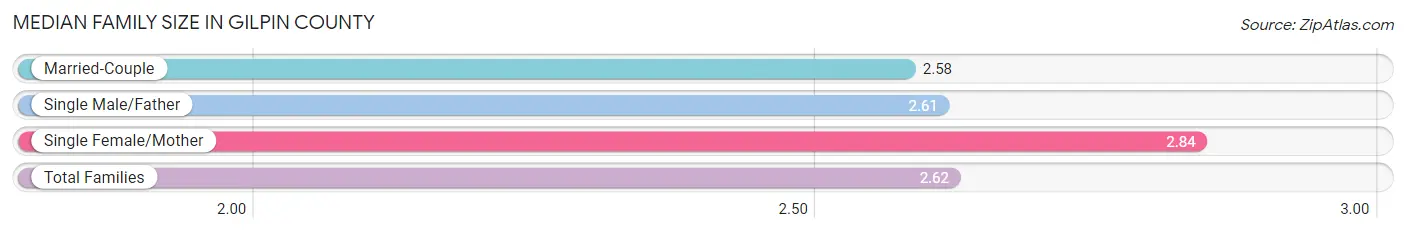
Median Family Size in Gilpin County
The median family size in Gilpin County is 2.62 persons per family, with single female/mother families (243 | 15.3%) accounting for the largest median family size of 2.84 persons per family. On the other hand, married-couple families (1,218 | 76.7%) represent the smallest median family size with 2.58 persons per family.
| Family Type | # Families | Family Size |
| Married-Couple | 1,218 (76.7%) | 2.58 |
| Single Male/Father | 127 (8.0%) | 2.61 |
| Single Female/Mother | 243 (15.3%) | 2.84 |
| Total Families | 1,588 (100.0%) | 2.62 |
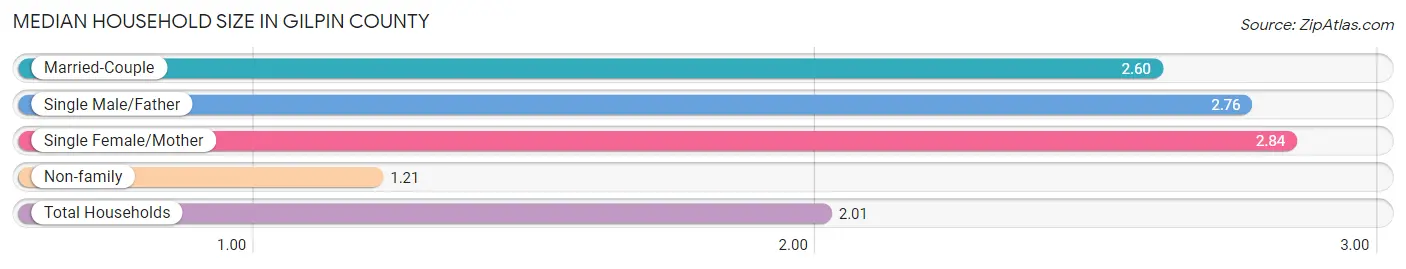
Median Household Size in Gilpin County
The median household size in Gilpin County is 2.01 persons per household, with single female/mother households (243 | 8.5%) accounting for the largest median household size of 2.84 persons per household. non-family households (1,265 | 44.3%) represent the smallest median household size with 1.21 persons per household.
| Household Type | # Households | Household Size |
| Married-Couple | 1,218 (42.7%) | 2.60 |
| Single Male/Father | 127 (4.4%) | 2.76 |
| Single Female/Mother | 243 (8.5%) | 2.84 |
| Non-family | 1,265 (44.3%) | 1.21 |
| Total Households | 2,853 (100.0%) | 2.01 |
Household Size by Marriage Status in Gilpin County
Out of a total of 2,853 households in Gilpin County, 1,588 (55.7%) are family households, while 1,265 (44.3%) are nonfamily households. The most numerous type of family households are 2-person households, comprising 774, and the most common type of nonfamily households are 1-person households, comprising 1,005.
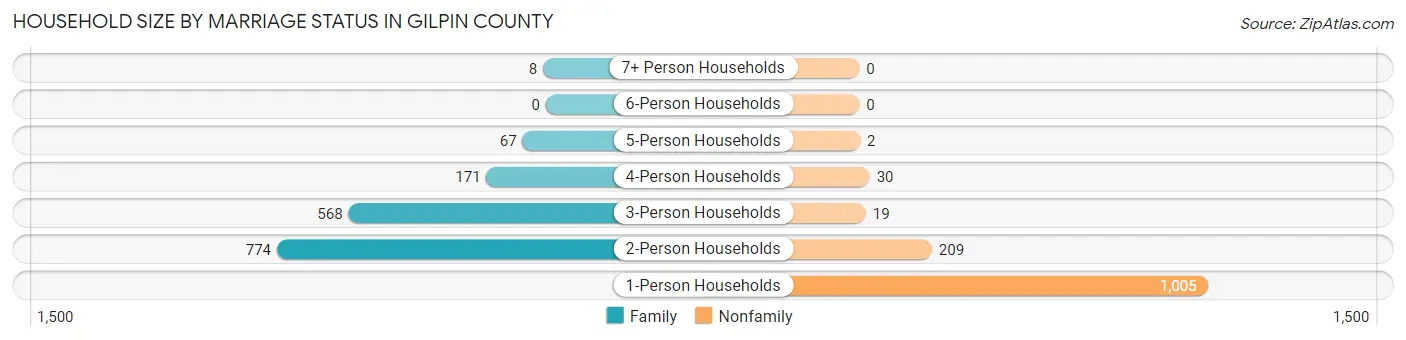
| Household Size | Family Households | Nonfamily Households |
| 1-Person Households | - | 1,005 (35.2%) |
| 2-Person Households | 774 (27.1%) | 209 (7.3%) |
| 3-Person Households | 568 (19.9%) | 19 (0.7%) |
| 4-Person Households | 171 (6.0%) | 30 (1.1%) |
| 5-Person Households | 67 (2.4%) | 2 (0.1%) |
| 6-Person Households | 0 (0.0%) | 0 (0.0%) |
| 7+ Person Households | 8 (0.3%) | 0 (0.0%) |
| Total | 1,588 (55.7%) | 1,265 (44.3%) |
Female Fertility in Gilpin County
Fertility by Age in Gilpin County
Average fertility rate in Gilpin County is 63.0 births per 1,000 women. Women in the age bracket of 20 to 34 years have the highest fertility rate with 121.0 births per 1,000 women. Women in the age bracket of 20 to 34 years acount for 54.3% of all women with births.
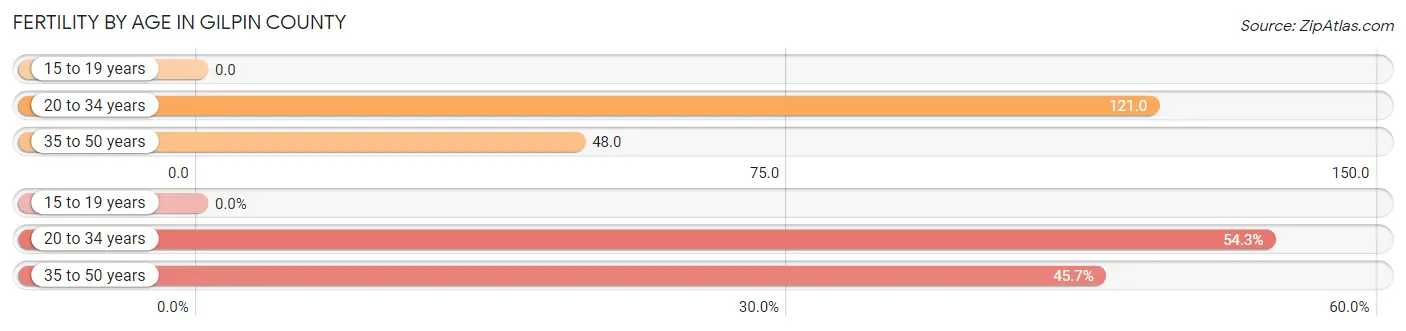
| Age Bracket | Women with Births | Births / 1,000 Women |
| 15 to 19 years | 0 (0.0%) | 0.0 |
| 20 to 34 years | 44 (54.3%) | 121.0 |
| 35 to 50 years | 37 (45.7%) | 48.0 |
| Total | 81 (100.0%) | 63.0 |
Fertility by Age by Marriage Status in Gilpin County
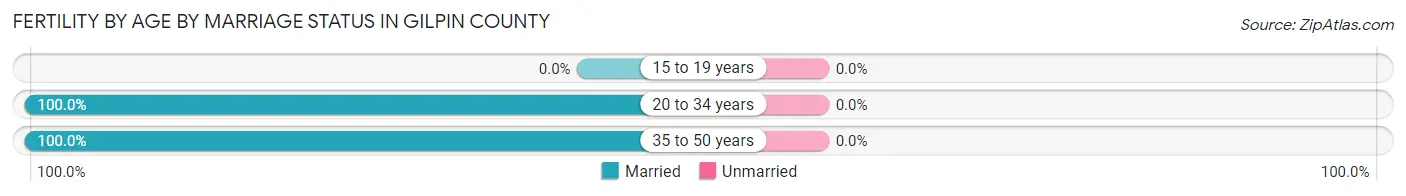
| Age Bracket | Married | Unmarried |
| 15 to 19 years | 0 (0.0%) | 0 (0.0%) |
| 20 to 34 years | 44 (100.0%) | 0 (0.0%) |
| 35 to 50 years | 37 (100.0%) | 0 (0.0%) |
| Total | 81 (100.0%) | 0 (0.0%) |
Fertility by Education in Gilpin County
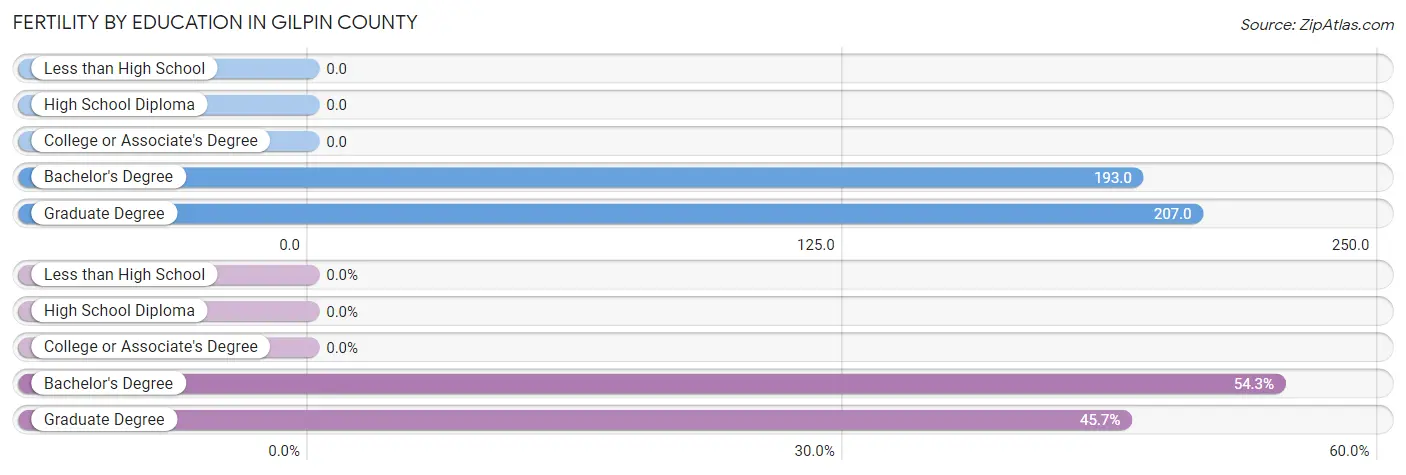
| Educational Attainment | Women with Births | Births / 1,000 Women |
| Less than High School | 0 (0.0%) | 0.0 |
| High School Diploma | 0 (0.0%) | 0.0 |
| College or Associate's Degree | 0 (0.0%) | 0.0 |
| Bachelor's Degree | 44 (54.3%) | 193.0 |
| Graduate Degree | 37 (45.7%) | 207.0 |
| Total | 81 (100.0%) | 63.0 |
Fertility by Education by Marriage Status in Gilpin County
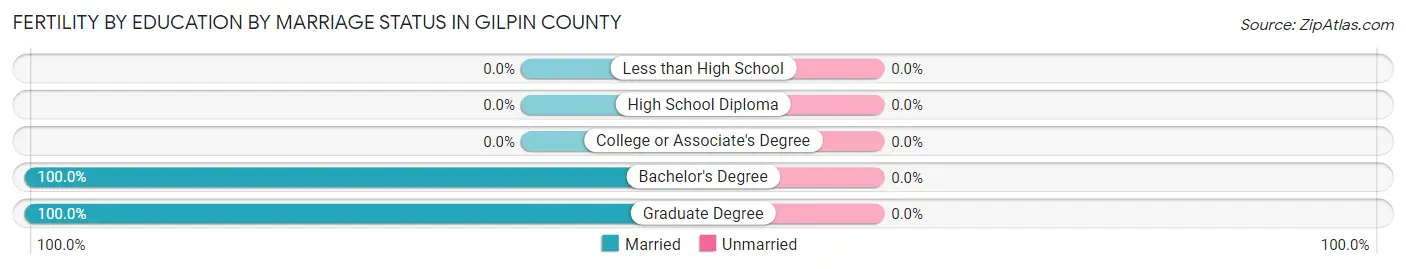
| Educational Attainment | Married | Unmarried |
| Less than High School | 0 (0.0%) | 0 (0.0%) |
| High School Diploma | 0 (0.0%) | 0 (0.0%) |
| College or Associate's Degree | 0 (0.0%) | 0 (0.0%) |
| Bachelor's Degree | 44 (100.0%) | 0 (0.0%) |
| Graduate Degree | 37 (100.0%) | 0 (0.0%) |
| Total | 81 (100.0%) | 0 (0.0%) |
Employment Characteristics in Gilpin County
Employment by Class of Employer in Gilpin County
Among the 3,557 employed individuals in Gilpin County, private company employees (2,120 | 59.6%), local government employees (594 | 16.7%), and self-employed (incorporated) (239 | 6.7%) make up the most common classes of employment.
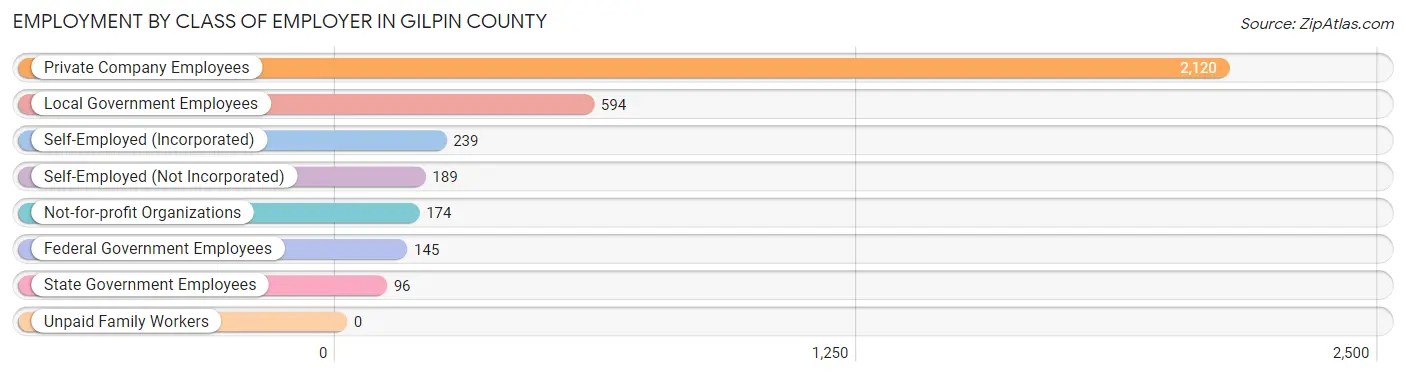
| Employer Class | # Employees | % Employees |
| Private Company Employees | 2,120 | 59.6% |
| Self-Employed (Incorporated) | 239 | 6.7% |
| Self-Employed (Not Incorporated) | 189 | 5.3% |
| Not-for-profit Organizations | 174 | 4.9% |
| Local Government Employees | 594 | 16.7% |
| State Government Employees | 96 | 2.7% |
| Federal Government Employees | 145 | 4.1% |
| Unpaid Family Workers | 0 | 0.0% |
| Total | 3,557 | 100.0% |
Employment Status by Age in Gilpin County
According to the labor force statistics for Gilpin County, out of the total population over 16 years of age (4,990), 73.2% or 3,653 individuals are in the labor force, with 2.1% or 77 of them unemployed. The age group with the highest labor force participation rate is 35 to 44 years, with 95.8% or 785 individuals in the labor force. Within the labor force, the 25 to 29 years age range has the highest percentage of unemployed individuals, with 14.1% or 37 of them being unemployed.
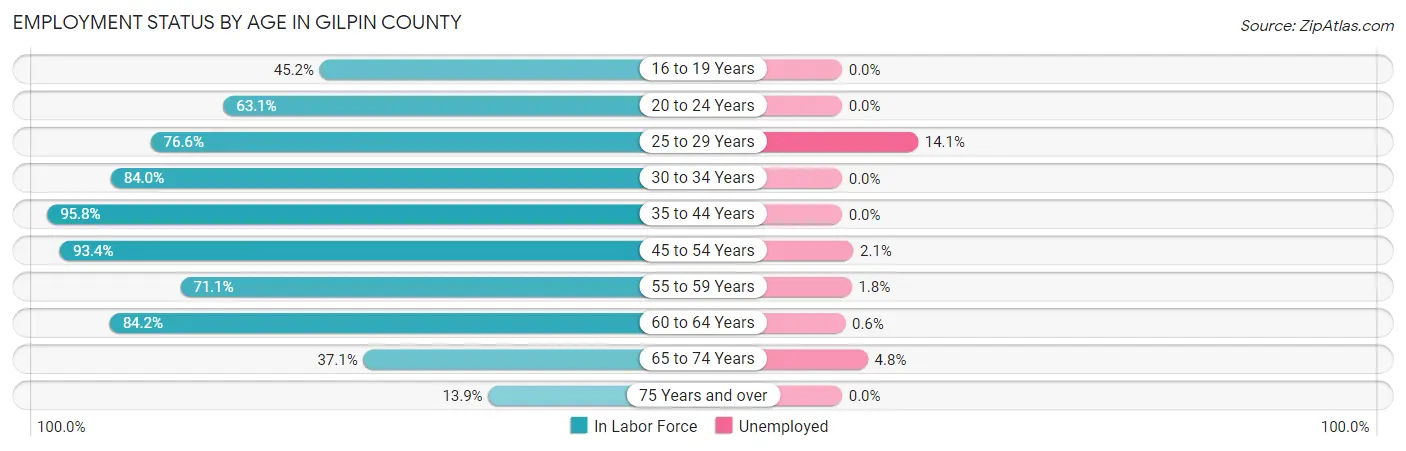
| Age Bracket | In Labor Force | Unemployed |
| 16 to 19 Years | 112 (45.2%) | 0 (0.0%) |
| 20 to 24 Years | 53 (63.1%) | 0 (0.0%) |
| 25 to 29 Years | 262 (76.6%) | 37 (14.1%) |
| 30 to 34 Years | 225 (84.0%) | 0 (0.0%) |
| 35 to 44 Years | 785 (95.8%) | 0 (0.0%) |
| 45 to 54 Years | 978 (93.4%) | 21 (2.1%) |
| 55 to 59 Years | 340 (71.1%) | 6 (1.8%) |
| 60 to 64 Years | 648 (84.2%) | 4 (0.6%) |
| 65 to 74 Years | 189 (37.1%) | 9 (4.8%) |
| 75 Years and over | 59 (13.9%) | 0 (0.0%) |
| Total | 3,653 (73.2%) | 77 (2.1%) |
Employment Status by Educational Attainment in Gilpin County
According to labor force statistics for Gilpin County, 86.9% of individuals (3,236) out of the total population between 25 and 64 years of age (3,724) are in the labor force, with 2.1% or 68 of them being unemployed. The group with the highest labor force participation rate are those with the educational attainment of bachelor's degree or higher, with 93.3% or 1,481 individuals in the labor force. Within the labor force, individuals with less than high school education have the highest percentage of unemployment, with 52.9% or 37 of them being unemployed.
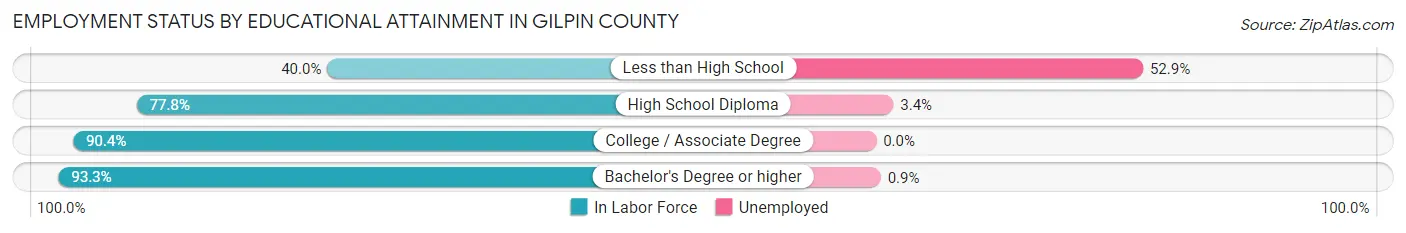
| Educational Attainment | In Labor Force | Unemployed |
| Less than High School | 70 (40.0%) | 93 (52.9%) |
| High School Diploma | 525 (77.8%) | 23 (3.4%) |
| College / Associate Degree | 1,163 (90.4%) | 0 (0.0%) |
| Bachelor's Degree or higher | 1,481 (93.3%) | 14 (0.9%) |
| Total | 3,236 (86.9%) | 78 (2.1%) |
Employment Occupations by Sex in Gilpin County
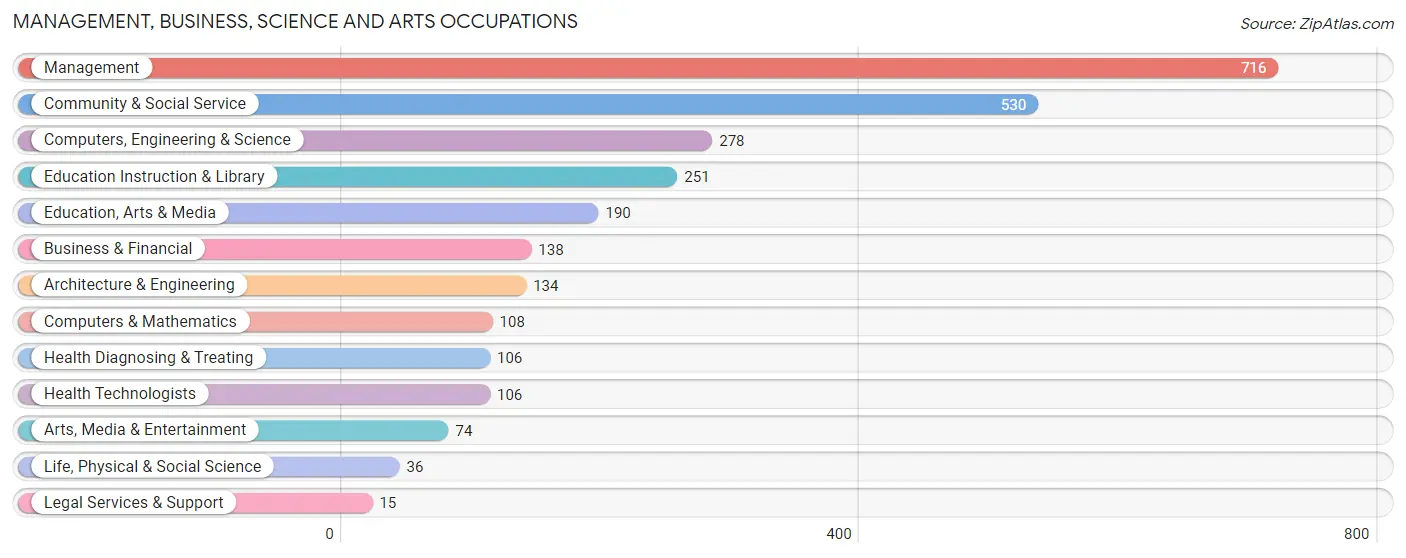
Management, Business, Science and Arts Occupations
The most common Management, Business, Science and Arts occupations in Gilpin County are Management (716 | 20.0%), Community & Social Service (530 | 14.8%), Computers, Engineering & Science (278 | 7.8%), Education Instruction & Library (251 | 7.0%), and Education, Arts & Media (190 | 5.3%).
Management, Business, Science and Arts Occupations by Sex
Within the Management, Business, Science and Arts occupations in Gilpin County, the most male-oriented occupations are Architecture & Engineering (100.0%), Computers & Mathematics (88.0%), and Computers, Engineering & Science (86.3%), while the most female-oriented occupations are Education, Arts & Media (80.5%), Business & Financial (71.7%), and Community & Social Service (70.8%).

| Occupation | Male | Female |
| Management | 467 (65.2%) | 249 (34.8%) |
| Business & Financial | 39 (28.3%) | 99 (71.7%) |
| Computers, Engineering & Science | 240 (86.3%) | 38 (13.7%) |
| Computers & Mathematics | 95 (88.0%) | 13 (12.0%) |
| Architecture & Engineering | 134 (100.0%) | 0 (0.0%) |
| Life, Physical & Social Science | 11 (30.6%) | 25 (69.4%) |
| Community & Social Service | 155 (29.2%) | 375 (70.8%) |
| Education, Arts & Media | 37 (19.5%) | 153 (80.5%) |
| Legal Services & Support | 6 (40.0%) | 9 (60.0%) |
| Education Instruction & Library | 90 (35.9%) | 161 (64.1%) |
| Arts, Media & Entertainment | 22 (29.7%) | 52 (70.3%) |
| Health Diagnosing & Treating | 44 (41.5%) | 62 (58.5%) |
| Health Technologists | 44 (41.5%) | 62 (58.5%) |
| Total (Category) | 945 (53.4%) | 823 (46.6%) |
| Total (Overall) | 1,880 (52.6%) | 1,694 (47.4%) |
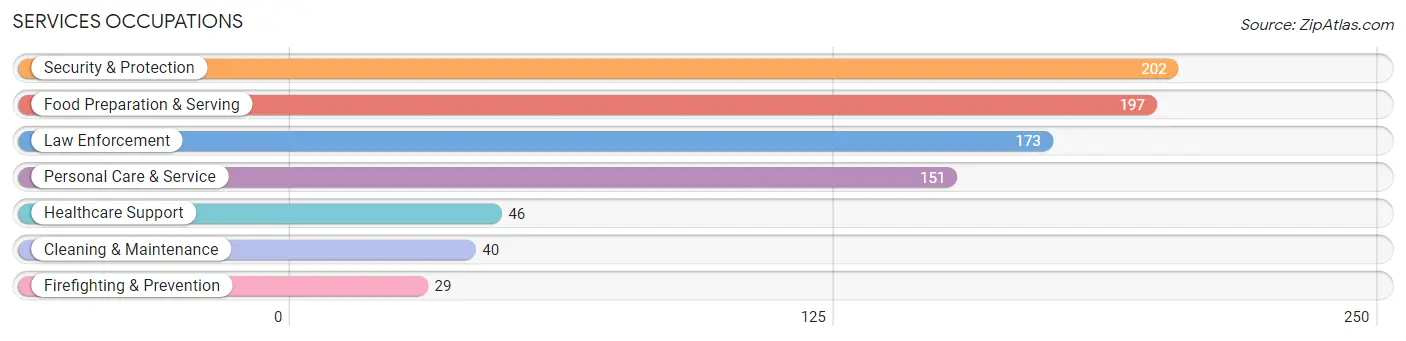
Services Occupations
The most common Services occupations in Gilpin County are Security & Protection (202 | 5.7%), Food Preparation & Serving (197 | 5.5%), Law Enforcement (173 | 4.8%), Personal Care & Service (151 | 4.2%), and Healthcare Support (46 | 1.3%).
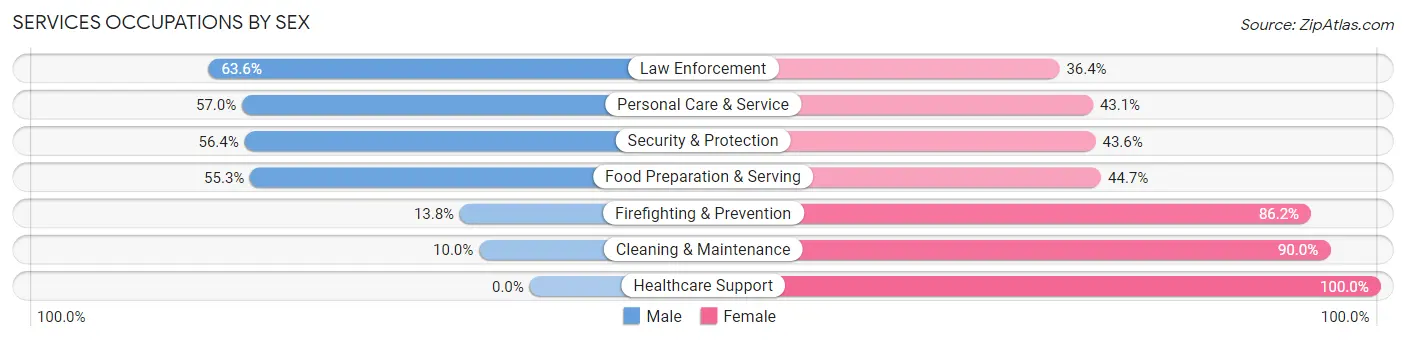
Services Occupations by Sex
Within the Services occupations in Gilpin County, the most male-oriented occupations are Law Enforcement (63.6%), Personal Care & Service (57.0%), and Security & Protection (56.4%), while the most female-oriented occupations are Healthcare Support (100.0%), Cleaning & Maintenance (90.0%), and Firefighting & Prevention (86.2%).
| Occupation | Male | Female |
| Healthcare Support | 0 (0.0%) | 46 (100.0%) |
| Security & Protection | 114 (56.4%) | 88 (43.6%) |
| Firefighting & Prevention | 4 (13.8%) | 25 (86.2%) |
| Law Enforcement | 110 (63.6%) | 63 (36.4%) |
| Food Preparation & Serving | 109 (55.3%) | 88 (44.7%) |
| Cleaning & Maintenance | 4 (10.0%) | 36 (90.0%) |
| Personal Care & Service | 86 (57.0%) | 65 (43.0%) |
| Total (Category) | 313 (49.2%) | 323 (50.8%) |
| Total (Overall) | 1,880 (52.6%) | 1,694 (47.4%) |
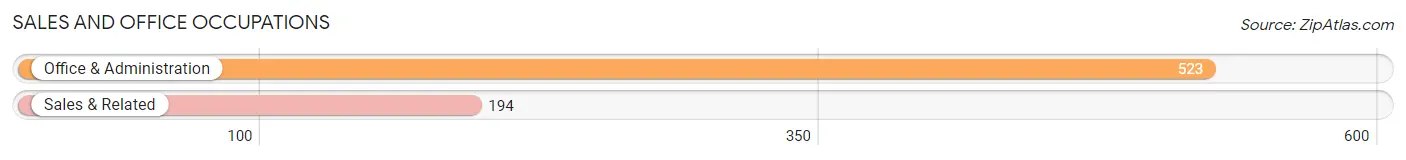
Sales and Office Occupations
The most common Sales and Office occupations in Gilpin County are Office & Administration (523 | 14.6%), and Sales & Related (194 | 5.4%).
Sales and Office Occupations by Sex
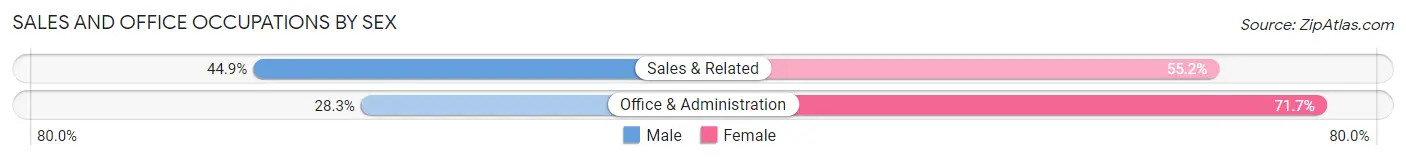
| Occupation | Male | Female |
| Sales & Related | 87 (44.9%) | 107 (55.1%) |
| Office & Administration | 148 (28.3%) | 375 (71.7%) |
| Total (Category) | 235 (32.8%) | 482 (67.2%) |
| Total (Overall) | 1,880 (52.6%) | 1,694 (47.4%) |
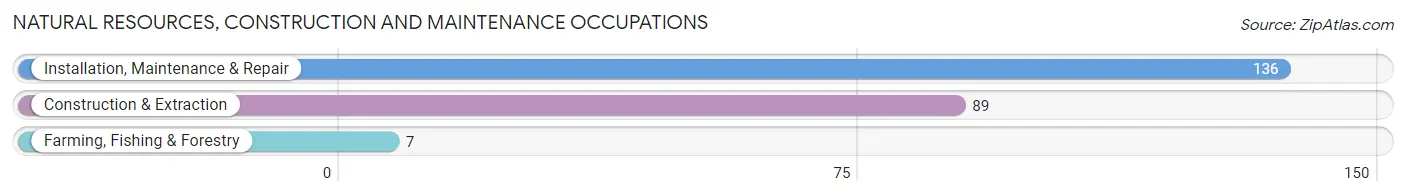
Natural Resources, Construction and Maintenance Occupations
The most common Natural Resources, Construction and Maintenance occupations in Gilpin County are Installation, Maintenance & Repair (136 | 3.8%), Construction & Extraction (89 | 2.5%), and Farming, Fishing & Forestry (7 | 0.2%).
Natural Resources, Construction and Maintenance Occupations by Sex
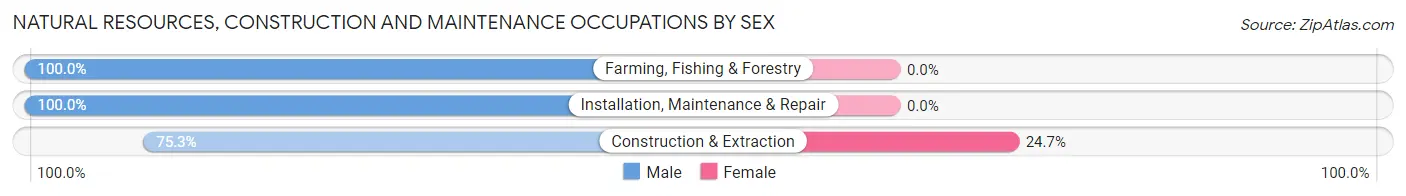
| Occupation | Male | Female |
| Farming, Fishing & Forestry | 7 (100.0%) | 0 (0.0%) |
| Construction & Extraction | 67 (75.3%) | 22 (24.7%) |
| Installation, Maintenance & Repair | 136 (100.0%) | 0 (0.0%) |
| Total (Category) | 210 (90.5%) | 22 (9.5%) |
| Total (Overall) | 1,880 (52.6%) | 1,694 (47.4%) |
Production, Transportation and Moving Occupations
The most common Production, Transportation and Moving occupations in Gilpin County are Production (90 | 2.5%), Transportation (70 | 2.0%), and Material Moving (61 | 1.7%).
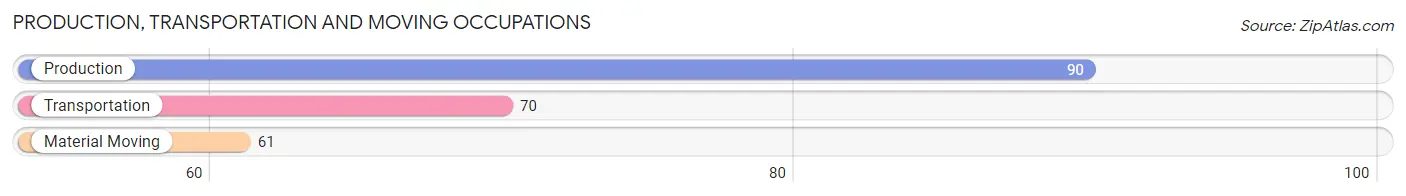
Production, Transportation and Moving Occupations by Sex
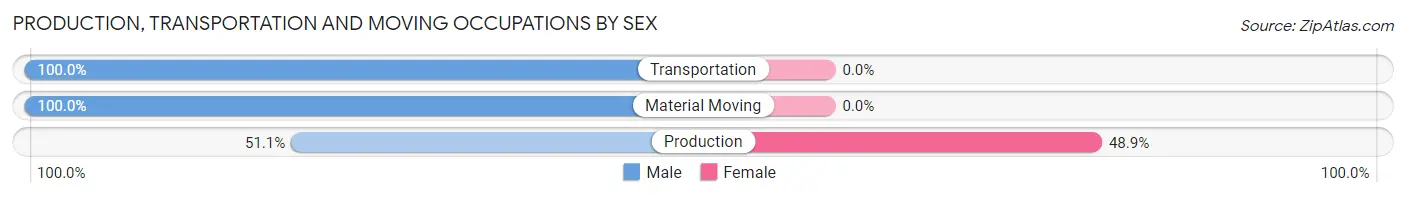
| Occupation | Male | Female |
| Production | 46 (51.1%) | 44 (48.9%) |
| Transportation | 70 (100.0%) | 0 (0.0%) |
| Material Moving | 61 (100.0%) | 0 (0.0%) |
| Total (Category) | 177 (80.1%) | 44 (19.9%) |
| Total (Overall) | 1,880 (52.6%) | 1,694 (47.4%) |
Employment Industries by Sex in Gilpin County
Employment Industries in Gilpin County
The major employment industries in Gilpin County include Arts, Entertainment & Recreation (627 | 17.5%), Educational Services (457 | 12.8%), Health Care & Social Assistance (381 | 10.7%), Professional & Scientific (369 | 10.3%), and Public Administration (350 | 9.8%).

Employment Industries by Sex in Gilpin County
The Gilpin County industries that see more men than women are Agriculture, Fishing & Hunting (100.0%), Utilities (100.0%), and Administrative & Support (100.0%), whereas the industries that tend to have a higher number of women are Real Estate, Rental & Leasing (100.0%), Health Care & Social Assistance (81.4%), and Arts, Entertainment & Recreation (63.6%).
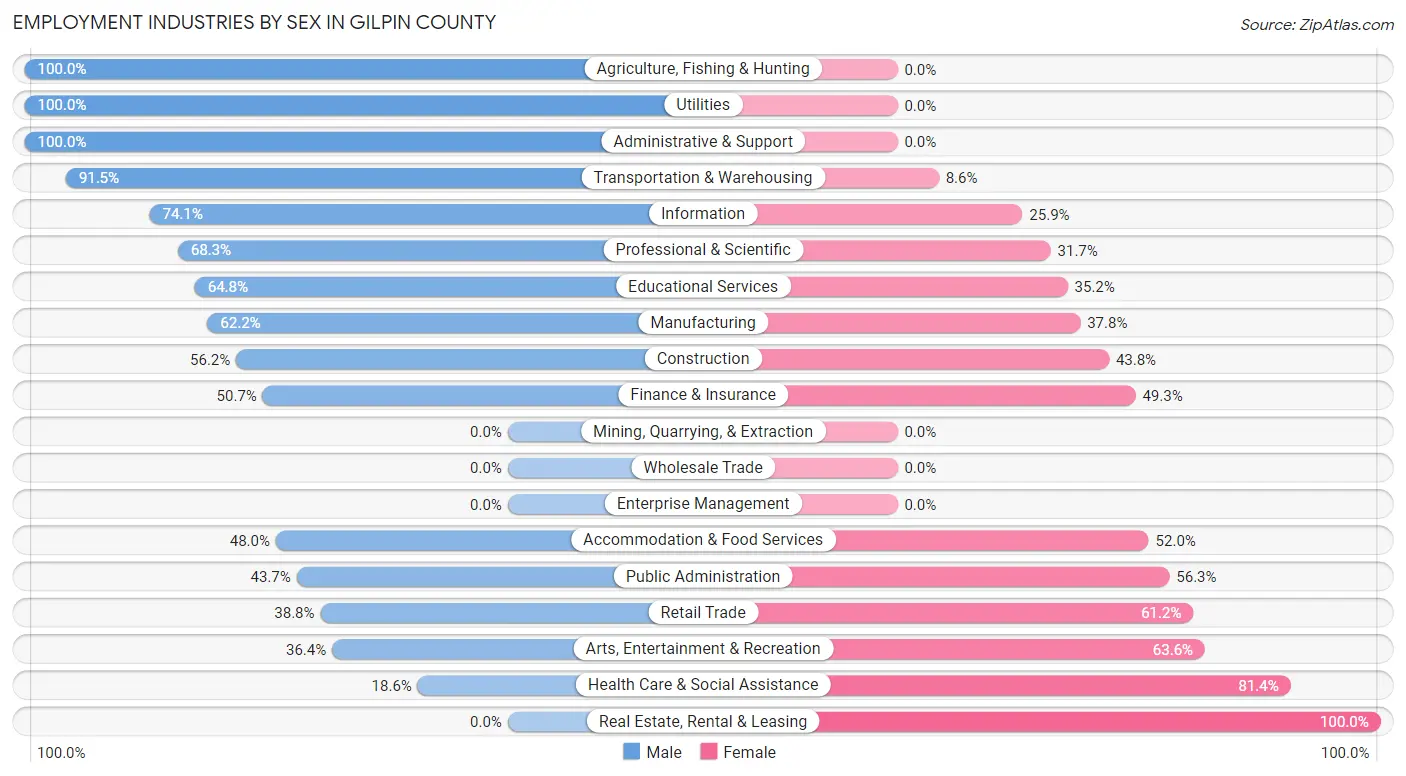
| Industry | Male | Female |
| Agriculture, Fishing & Hunting | 7 (100.0%) | 0 (0.0%) |
| Mining, Quarrying, & Extraction | 0 (0.0%) | 0 (0.0%) |
| Construction | 104 (56.2%) | 81 (43.8%) |
| Manufacturing | 115 (62.2%) | 70 (37.8%) |
| Wholesale Trade | 0 (0.0%) | 0 (0.0%) |
| Retail Trade | 76 (38.8%) | 120 (61.2%) |
| Transportation & Warehousing | 139 (91.4%) | 13 (8.6%) |
| Utilities | 2 (100.0%) | 0 (0.0%) |
| Information | 192 (74.1%) | 67 (25.9%) |
| Finance & Insurance | 35 (50.7%) | 34 (49.3%) |
| Real Estate, Rental & Leasing | 0 (0.0%) | 18 (100.0%) |
| Professional & Scientific | 252 (68.3%) | 117 (31.7%) |
| Enterprise Management | 0 (0.0%) | 0 (0.0%) |
| Administrative & Support | 40 (100.0%) | 0 (0.0%) |
| Educational Services | 296 (64.8%) | 161 (35.2%) |
| Health Care & Social Assistance | 71 (18.6%) | 310 (81.4%) |
| Arts, Entertainment & Recreation | 228 (36.4%) | 399 (63.6%) |
| Accommodation & Food Services | 72 (48.0%) | 78 (52.0%) |
| Public Administration | 153 (43.7%) | 197 (56.3%) |
| Total | 1,880 (52.6%) | 1,694 (47.4%) |
Education in Gilpin County
School Enrollment in Gilpin County
The most common levels of schooling among the 1,033 students in Gilpin County are elementary school (342 | 33.1%), high school (233 | 22.6%), and middle school (192 | 18.6%).
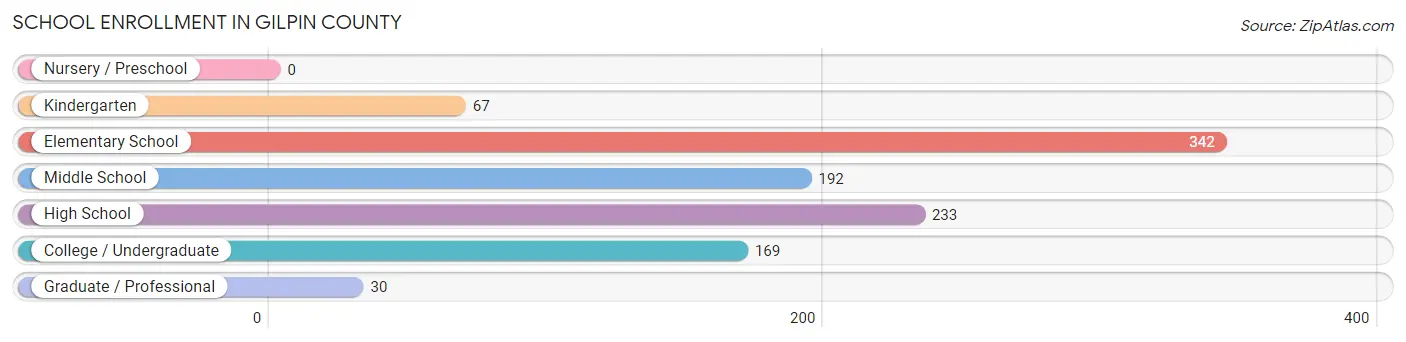
| School Level | # Students | % Students |
| Nursery / Preschool | 0 | 0.0% |
| Kindergarten | 67 | 6.5% |
| Elementary School | 342 | 33.1% |
| Middle School | 192 | 18.6% |
| High School | 233 | 22.6% |
| College / Undergraduate | 169 | 16.4% |
| Graduate / Professional | 30 | 2.9% |
| Total | 1,033 | 100.0% |
School Enrollment by Age by Funding Source in Gilpin County
Out of a total of 1,033 students who are enrolled in schools in Gilpin County, 46 (4.5%) attend a private institution, while the remaining 987 (95.5%) are enrolled in public schools. The age group of 25 to 34 year olds has the highest likelihood of being enrolled in private schools, with 8 (30.8% in the age bracket) enrolled. Conversely, the age group of 5 to 9 year old has the lowest likelihood of being enrolled in a private school, with 343 (100.0% in the age bracket) attending a public institution.
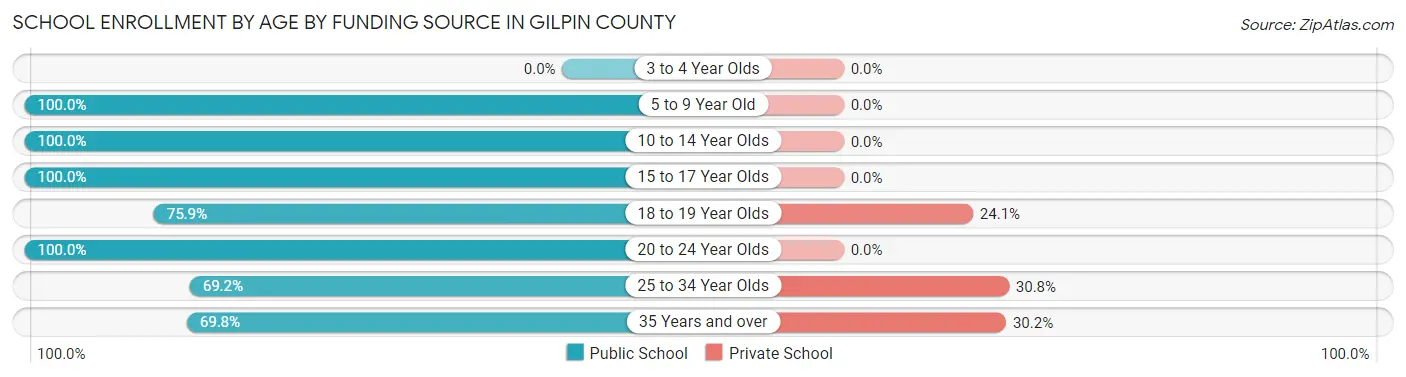
| Age Bracket | Public School | Private School |
| 3 to 4 Year Olds | 0 (0.0%) | 0 (0.0%) |
| 5 to 9 Year Old | 343 (100.0%) | 0 (0.0%) |
| 10 to 14 Year Olds | 279 (100.0%) | 0 (0.0%) |
| 15 to 17 Year Olds | 199 (100.0%) | 0 (0.0%) |
| 18 to 19 Year Olds | 41 (75.9%) | 13 (24.1%) |
| 20 to 24 Year Olds | 46 (100.0%) | 0 (0.0%) |
| 25 to 34 Year Olds | 18 (69.2%) | 8 (30.8%) |
| 35 Years and over | 60 (69.8%) | 26 (30.2%) |
| Total | 987 (95.5%) | 46 (4.5%) |
Educational Attainment by Field of Study in Gilpin County
Education (392 | 17.2%), social sciences (283 | 12.5%), business (282 | 12.4%), visual & performing arts (204 | 9.0%), and engineering (191 | 8.4%) are the most common fields of study among 2,272 individuals in Gilpin County who have obtained a bachelor's degree or higher.
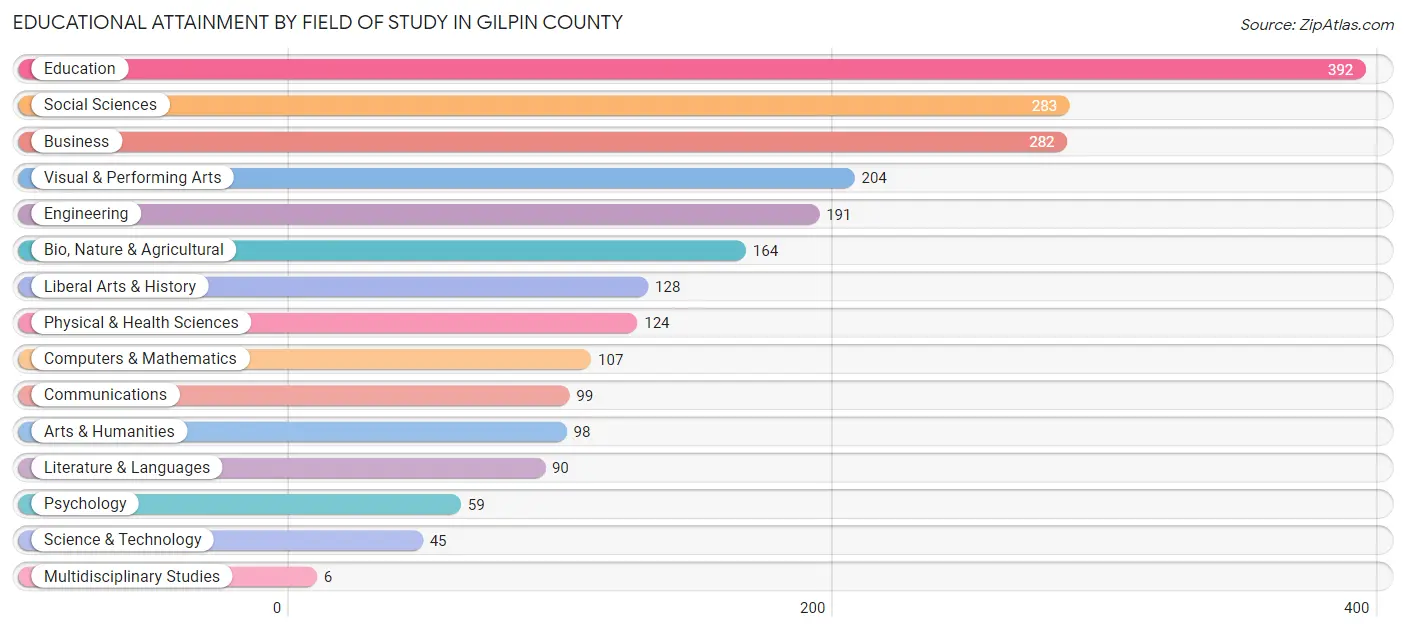
| Field of Study | # Graduates | % Graduates |
| Computers & Mathematics | 107 | 4.7% |
| Bio, Nature & Agricultural | 164 | 7.2% |
| Physical & Health Sciences | 124 | 5.5% |
| Psychology | 59 | 2.6% |
| Social Sciences | 283 | 12.5% |
| Engineering | 191 | 8.4% |
| Multidisciplinary Studies | 6 | 0.3% |
| Science & Technology | 45 | 2.0% |
| Business | 282 | 12.4% |
| Education | 392 | 17.2% |
| Literature & Languages | 90 | 4.0% |
| Liberal Arts & History | 128 | 5.6% |
| Visual & Performing Arts | 204 | 9.0% |
| Communications | 99 | 4.4% |
| Arts & Humanities | 98 | 4.3% |
| Total | 2,272 | 100.0% |
Transportation & Commute in Gilpin County
Vehicle Availability by Sex in Gilpin County
The most prevalent vehicle ownership categories in Gilpin County are males with 2 vehicles (611, accounting for 32.8%) and females with 2 vehicles (607, making up 36.3%).
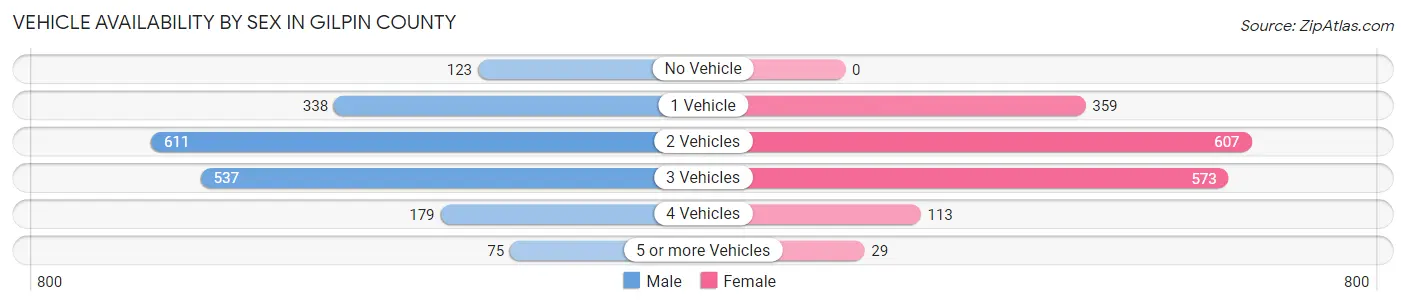
| Vehicles Available | Male | Female |
| No Vehicle | 123 (6.6%) | 0 (0.0%) |
| 1 Vehicle | 338 (18.1%) | 359 (21.4%) |
| 2 Vehicles | 611 (32.8%) | 607 (36.1%) |
| 3 Vehicles | 537 (28.8%) | 573 (34.1%) |
| 4 Vehicles | 179 (9.6%) | 113 (6.7%) |
| 5 or more Vehicles | 75 (4.0%) | 29 (1.7%) |
| Total | 1,863 (100.0%) | 1,681 (100.0%) |
Commute Time in Gilpin County
The most frequently occuring commute durations in Gilpin County are 45 to 59 minutes (609 commuters, 19.4%), 10 to 14 minutes (455 commuters, 14.5%), and 15 to 19 minutes (436 commuters, 13.9%).
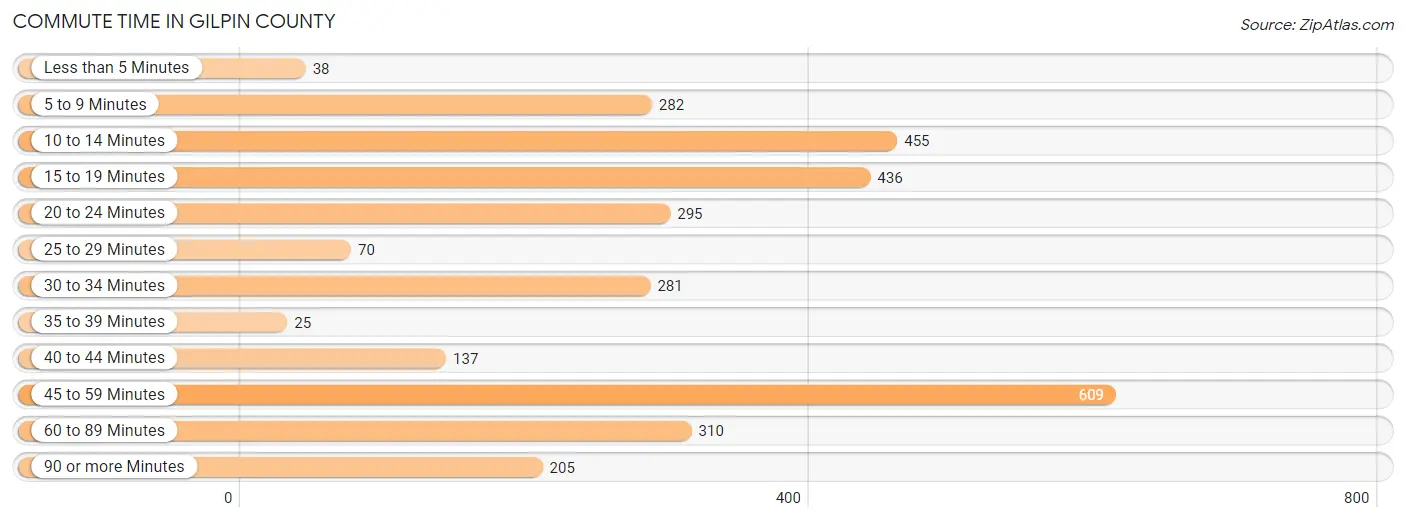
| Commute Time | # Commuters | % Commuters |
| Less than 5 Minutes | 38 | 1.2% |
| 5 to 9 Minutes | 282 | 9.0% |
| 10 to 14 Minutes | 455 | 14.5% |
| 15 to 19 Minutes | 436 | 13.9% |
| 20 to 24 Minutes | 295 | 9.4% |
| 25 to 29 Minutes | 70 | 2.2% |
| 30 to 34 Minutes | 281 | 8.9% |
| 35 to 39 Minutes | 25 | 0.8% |
| 40 to 44 Minutes | 137 | 4.4% |
| 45 to 59 Minutes | 609 | 19.4% |
| 60 to 89 Minutes | 310 | 9.9% |
| 90 or more Minutes | 205 | 6.5% |
Commute Time by Sex in Gilpin County
The most common commute times in Gilpin County are 45 to 59 minutes (359 commuters, 21.9%) for males and 45 to 59 minutes (250 commuters, 16.6%) for females.
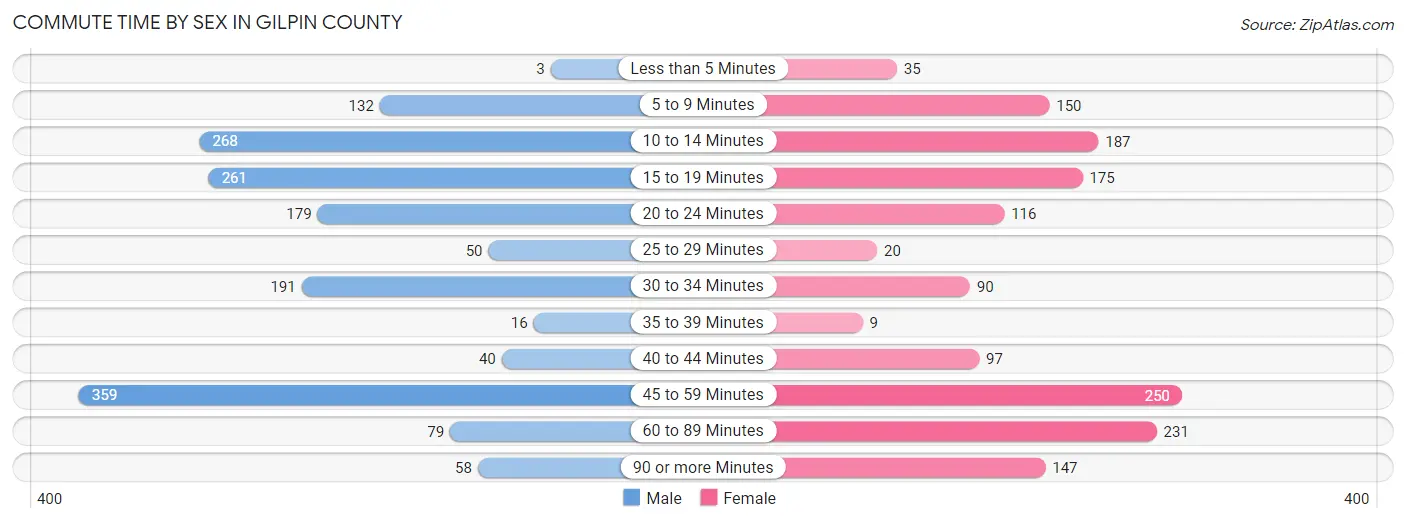
| Commute Time | Male | Female |
| Less than 5 Minutes | 3 (0.2%) | 35 (2.3%) |
| 5 to 9 Minutes | 132 (8.1%) | 150 (10.0%) |
| 10 to 14 Minutes | 268 (16.4%) | 187 (12.4%) |
| 15 to 19 Minutes | 261 (16.0%) | 175 (11.6%) |
| 20 to 24 Minutes | 179 (10.9%) | 116 (7.7%) |
| 25 to 29 Minutes | 50 (3.1%) | 20 (1.3%) |
| 30 to 34 Minutes | 191 (11.7%) | 90 (6.0%) |
| 35 to 39 Minutes | 16 (1.0%) | 9 (0.6%) |
| 40 to 44 Minutes | 40 (2.4%) | 97 (6.4%) |
| 45 to 59 Minutes | 359 (21.9%) | 250 (16.6%) |
| 60 to 89 Minutes | 79 (4.8%) | 231 (15.3%) |
| 90 or more Minutes | 58 (3.5%) | 147 (9.8%) |
Time of Departure to Work by Sex in Gilpin County
The most frequent times of departure to work in Gilpin County are 7:00 AM to 7:29 AM (342, 20.9%) for males and 7:00 AM to 7:29 AM (241, 16.0%) for females.
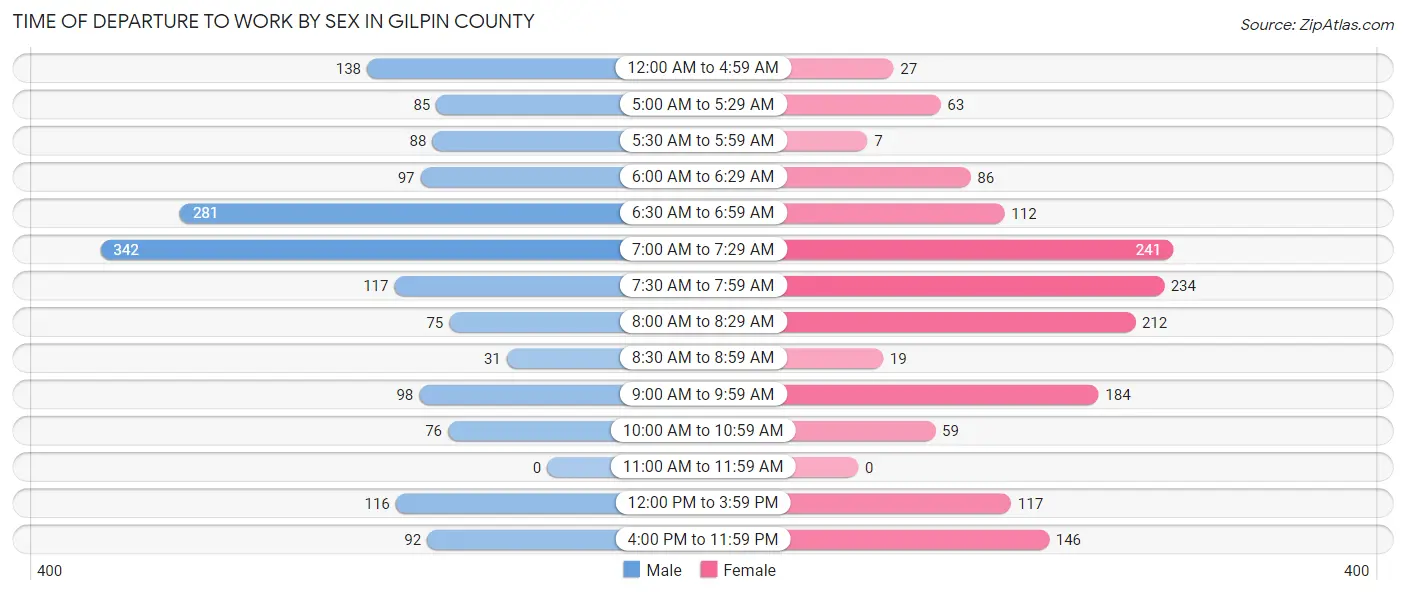
| Time of Departure | Male | Female |
| 12:00 AM to 4:59 AM | 138 (8.4%) | 27 (1.8%) |
| 5:00 AM to 5:29 AM | 85 (5.2%) | 63 (4.2%) |
| 5:30 AM to 5:59 AM | 88 (5.4%) | 7 (0.5%) |
| 6:00 AM to 6:29 AM | 97 (5.9%) | 86 (5.7%) |
| 6:30 AM to 6:59 AM | 281 (17.2%) | 112 (7.4%) |
| 7:00 AM to 7:29 AM | 342 (20.9%) | 241 (16.0%) |
| 7:30 AM to 7:59 AM | 117 (7.1%) | 234 (15.5%) |
| 8:00 AM to 8:29 AM | 75 (4.6%) | 212 (14.1%) |
| 8:30 AM to 8:59 AM | 31 (1.9%) | 19 (1.3%) |
| 9:00 AM to 9:59 AM | 98 (6.0%) | 184 (12.2%) |
| 10:00 AM to 10:59 AM | 76 (4.6%) | 59 (3.9%) |
| 11:00 AM to 11:59 AM | 0 (0.0%) | 0 (0.0%) |
| 12:00 PM to 3:59 PM | 116 (7.1%) | 117 (7.8%) |
| 4:00 PM to 11:59 PM | 92 (5.6%) | 146 (9.7%) |
| Total | 1,636 (100.0%) | 1,507 (100.0%) |
Housing Occupancy in Gilpin County
Occupancy by Ownership in Gilpin County
Of the total 2,853 dwellings in Gilpin County, owner-occupied units account for 2,243 (78.6%), while renter-occupied units make up 610 (21.4%).
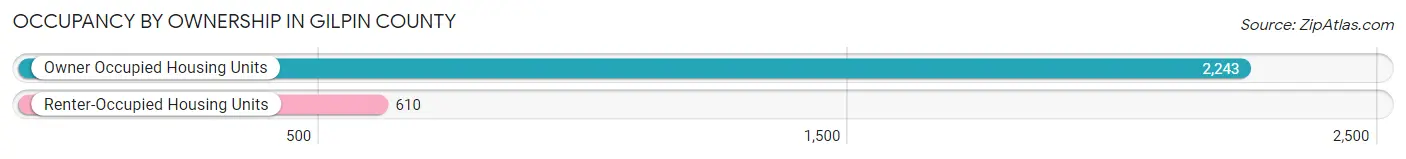
| Occupancy | # Housing Units | % Housing Units |
| Owner Occupied Housing Units | 2,243 | 78.6% |
| Renter-Occupied Housing Units | 610 | 21.4% |
| Total Occupied Housing Units | 2,853 | 100.0% |
Occupancy by Household Size in Gilpin County
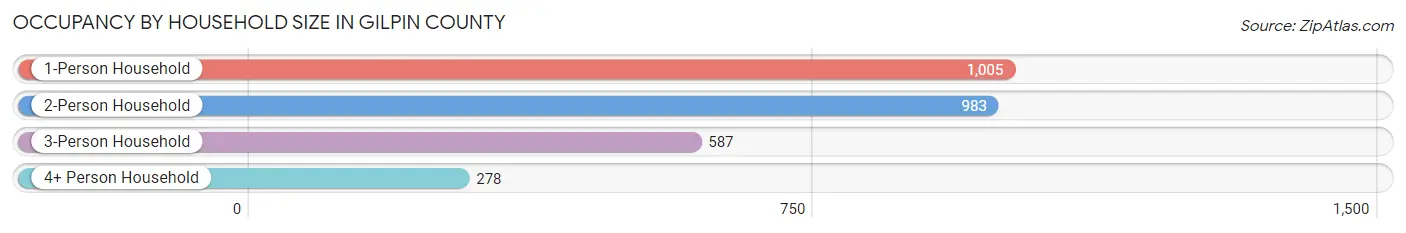
| Household Size | # Housing Units | % Housing Units |
| 1-Person Household | 1,005 | 35.2% |
| 2-Person Household | 983 | 34.4% |
| 3-Person Household | 587 | 20.6% |
| 4+ Person Household | 278 | 9.7% |
| Total Housing Units | 2,853 | 100.0% |
Occupancy by Ownership by Household Size in Gilpin County
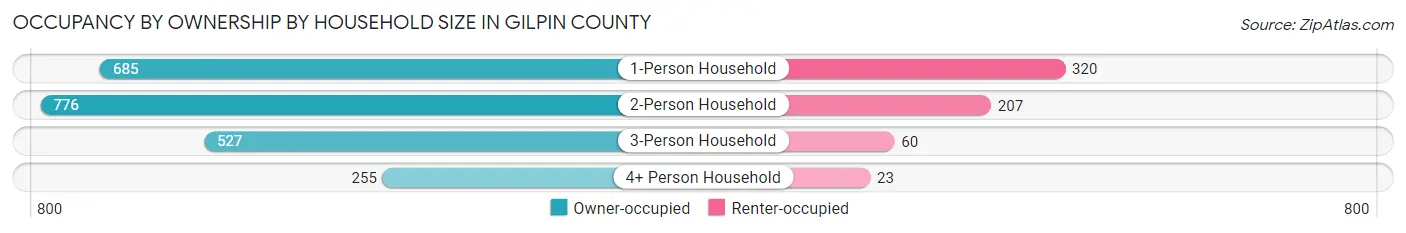
| Household Size | Owner-occupied | Renter-occupied |
| 1-Person Household | 685 (68.2%) | 320 (31.8%) |
| 2-Person Household | 776 (78.9%) | 207 (21.1%) |
| 3-Person Household | 527 (89.8%) | 60 (10.2%) |
| 4+ Person Household | 255 (91.7%) | 23 (8.3%) |
| Total Housing Units | 2,243 (78.6%) | 610 (21.4%) |
Occupancy by Educational Attainment in Gilpin County
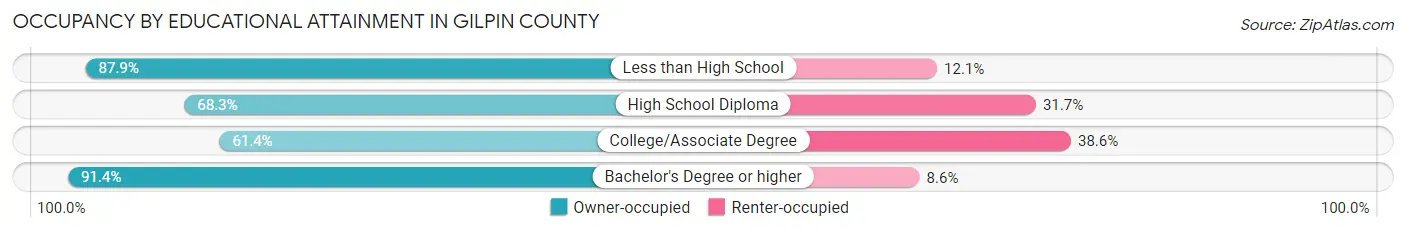
| Household Size | Owner-occupied | Renter-occupied |
| Less than High School | 80 (87.9%) | 11 (12.1%) |
| High School Diploma | 220 (68.3%) | 102 (31.7%) |
| College/Associate Degree | 586 (61.4%) | 369 (38.6%) |
| Bachelor's Degree or higher | 1,357 (91.4%) | 128 (8.6%) |
Occupancy by Age of Householder in Gilpin County
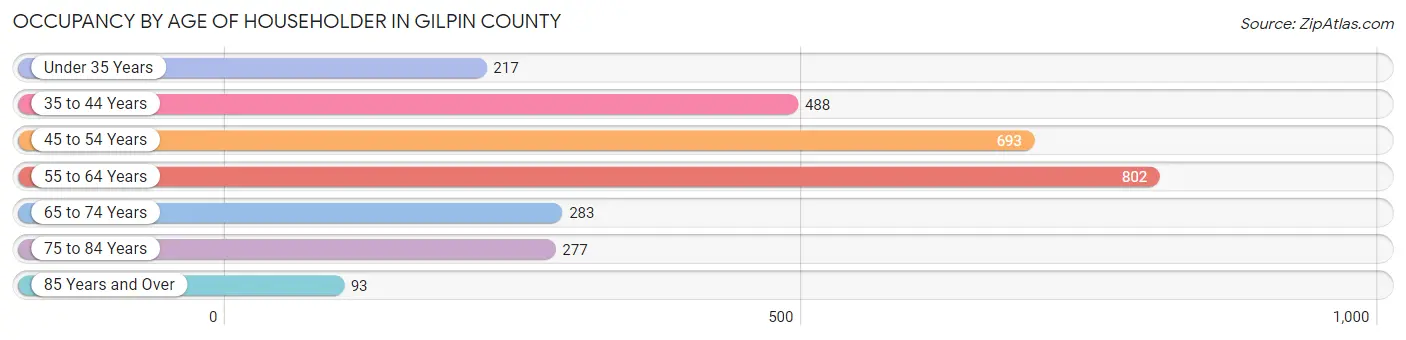
| Age Bracket | # Households | % Households |
| Under 35 Years | 217 | 7.6% |
| 35 to 44 Years | 488 | 17.1% |
| 45 to 54 Years | 693 | 24.3% |
| 55 to 64 Years | 802 | 28.1% |
| 65 to 74 Years | 283 | 9.9% |
| 75 to 84 Years | 277 | 9.7% |
| 85 Years and Over | 93 | 3.3% |
| Total | 2,853 | 100.0% |
Housing Finances in Gilpin County
Median Income by Occupancy in Gilpin County
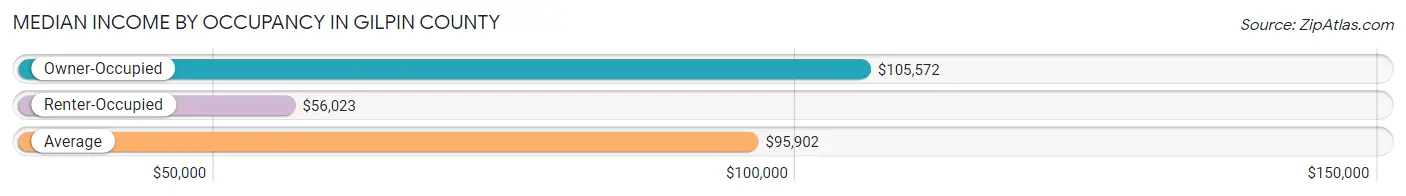
| Occupancy Type | # Households | Median Income |
| Owner-Occupied | 2,243 (78.6%) | $105,572 |
| Renter-Occupied | 610 (21.4%) | $56,023 |
| Average | 2,853 (100.0%) | $95,902 |
Occupancy by Householder Income Bracket in Gilpin County
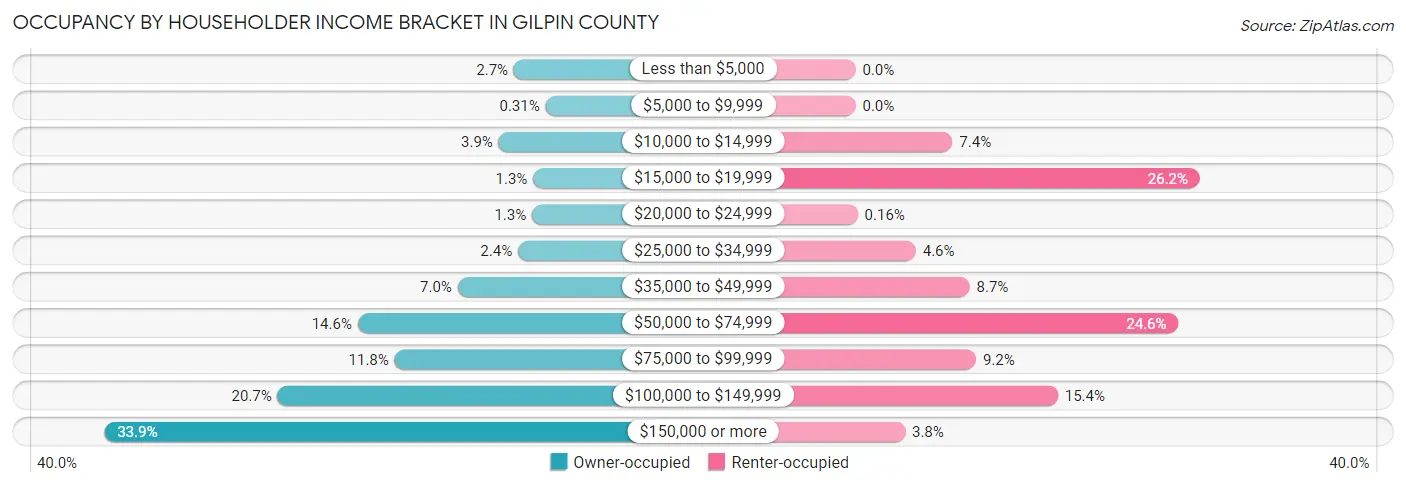
| Income Bracket | Owner-occupied | Renter-occupied |
| Less than $5,000 | 61 (2.7%) | 0 (0.0%) |
| $5,000 to $9,999 | 7 (0.3%) | 0 (0.0%) |
| $10,000 to $14,999 | 87 (3.9%) | 45 (7.4%) |
| $15,000 to $19,999 | 28 (1.3%) | 160 (26.2%) |
| $20,000 to $24,999 | 30 (1.3%) | 1 (0.2%) |
| $25,000 to $34,999 | 54 (2.4%) | 28 (4.6%) |
| $35,000 to $49,999 | 157 (7.0%) | 53 (8.7%) |
| $50,000 to $74,999 | 328 (14.6%) | 150 (24.6%) |
| $75,000 to $99,999 | 265 (11.8%) | 56 (9.2%) |
| $100,000 to $149,999 | 465 (20.7%) | 94 (15.4%) |
| $150,000 or more | 761 (33.9%) | 23 (3.8%) |
| Total | 2,243 (100.0%) | 610 (100.0%) |
Monthly Housing Cost Tiers in Gilpin County
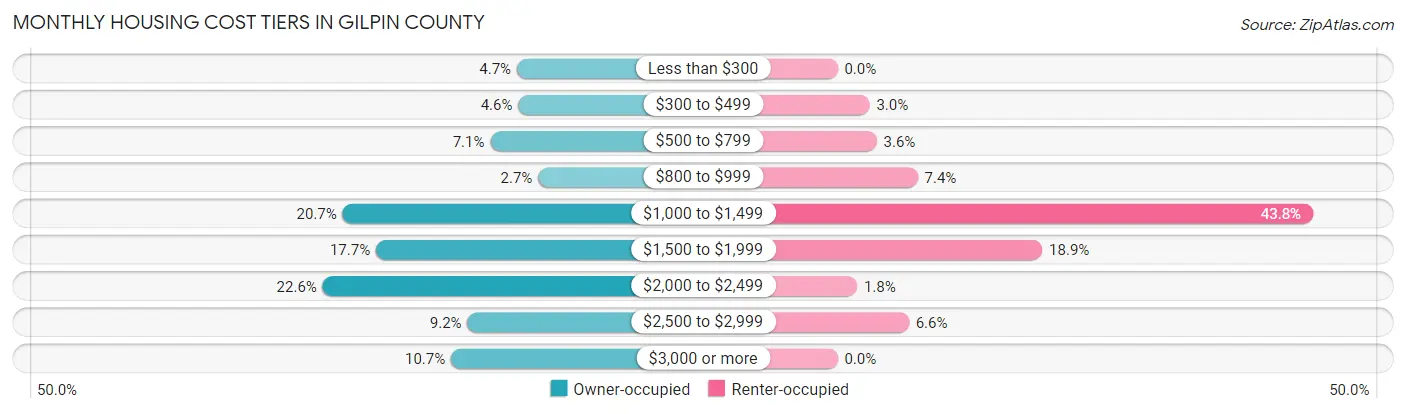
| Monthly Cost | Owner-occupied | Renter-occupied |
| Less than $300 | 105 (4.7%) | 0 (0.0%) |
| $300 to $499 | 102 (4.5%) | 18 (2.9%) |
| $500 to $799 | 160 (7.1%) | 22 (3.6%) |
| $800 to $999 | 61 (2.7%) | 45 (7.4%) |
| $1,000 to $1,499 | 465 (20.7%) | 267 (43.8%) |
| $1,500 to $1,999 | 396 (17.6%) | 115 (18.9%) |
| $2,000 to $2,499 | 506 (22.6%) | 11 (1.8%) |
| $2,500 to $2,999 | 207 (9.2%) | 40 (6.6%) |
| $3,000 or more | 241 (10.7%) | 0 (0.0%) |
| Total | 2,243 (100.0%) | 610 (100.0%) |
Physical Housing Characteristics in Gilpin County
Housing Structures in Gilpin County
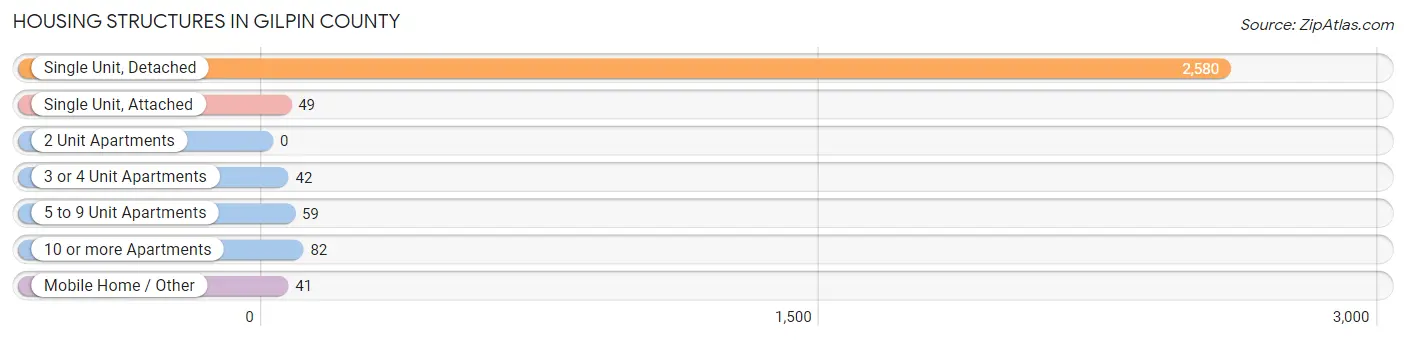
| Structure Type | # Housing Units | % Housing Units |
| Single Unit, Detached | 2,580 | 90.4% |
| Single Unit, Attached | 49 | 1.7% |
| 2 Unit Apartments | 0 | 0.0% |
| 3 or 4 Unit Apartments | 42 | 1.5% |
| 5 to 9 Unit Apartments | 59 | 2.1% |
| 10 or more Apartments | 82 | 2.9% |
| Mobile Home / Other | 41 | 1.4% |
| Total | 2,853 | 100.0% |
Housing Structures by Occupancy in Gilpin County
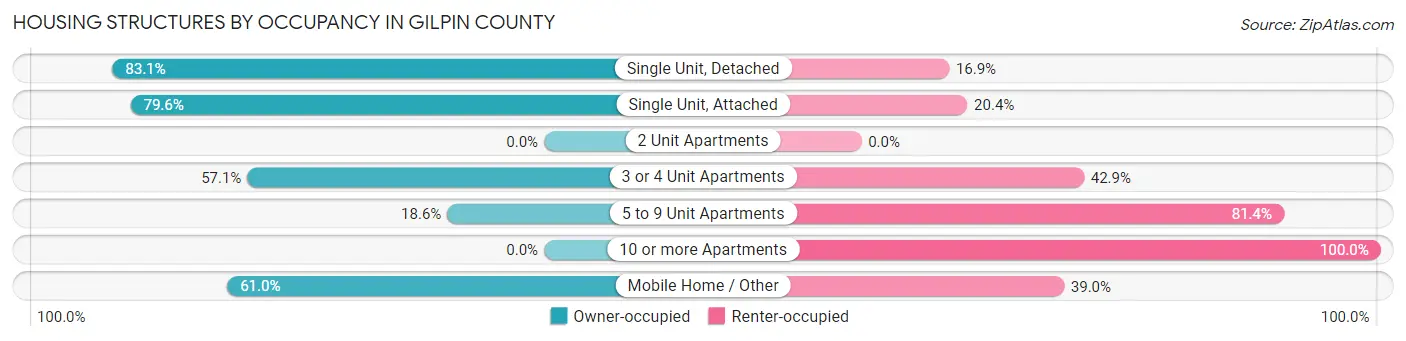
| Structure Type | Owner-occupied | Renter-occupied |
| Single Unit, Detached | 2,144 (83.1%) | 436 (16.9%) |
| Single Unit, Attached | 39 (79.6%) | 10 (20.4%) |
| 2 Unit Apartments | 0 (0.0%) | 0 (0.0%) |
| 3 or 4 Unit Apartments | 24 (57.1%) | 18 (42.9%) |
| 5 to 9 Unit Apartments | 11 (18.6%) | 48 (81.4%) |
| 10 or more Apartments | 0 (0.0%) | 82 (100.0%) |
| Mobile Home / Other | 25 (61.0%) | 16 (39.0%) |
| Total | 2,243 (78.6%) | 610 (21.4%) |
Housing Structures by Number of Rooms in Gilpin County
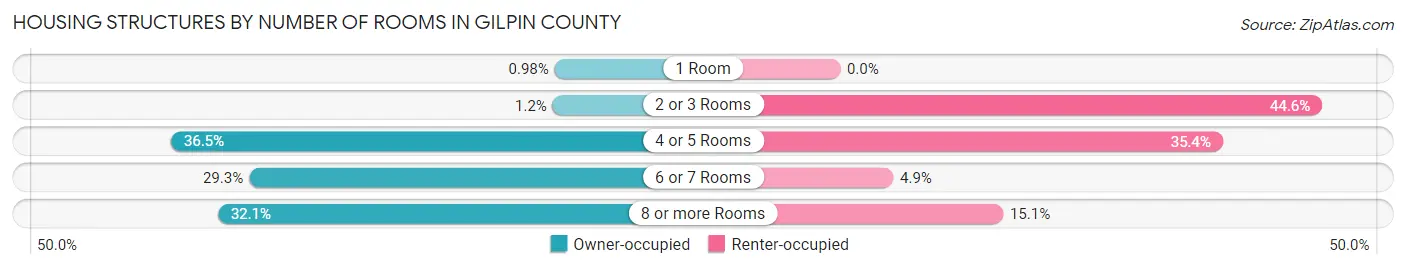
| Number of Rooms | Owner-occupied | Renter-occupied |
| 1 Room | 22 (1.0%) | 0 (0.0%) |
| 2 or 3 Rooms | 26 (1.2%) | 272 (44.6%) |
| 4 or 5 Rooms | 818 (36.5%) | 216 (35.4%) |
| 6 or 7 Rooms | 656 (29.2%) | 30 (4.9%) |
| 8 or more Rooms | 721 (32.1%) | 92 (15.1%) |
| Total | 2,243 (100.0%) | 610 (100.0%) |
Housing Structure by Heating Type in Gilpin County
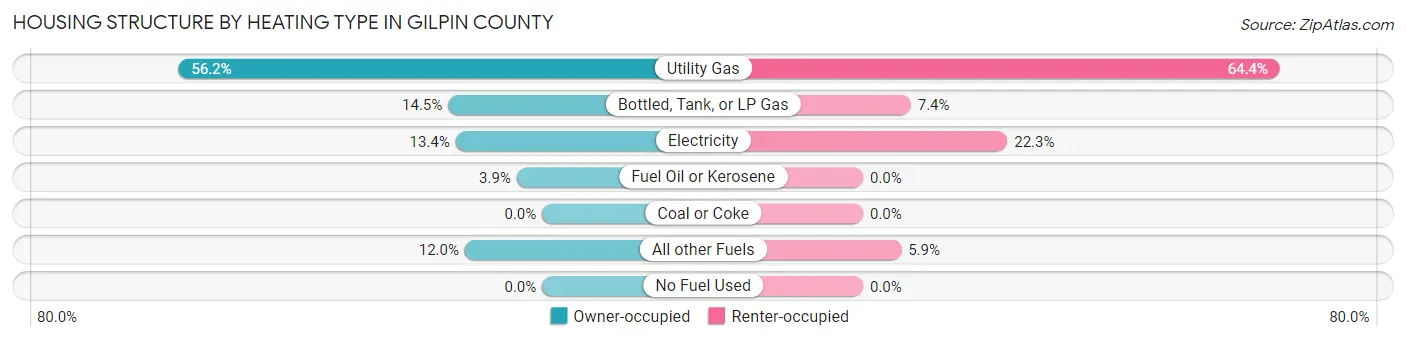
| Heating Type | Owner-occupied | Renter-occupied |
| Utility Gas | 1,261 (56.2%) | 393 (64.4%) |
| Bottled, Tank, or LP Gas | 326 (14.5%) | 45 (7.4%) |
| Electricity | 300 (13.4%) | 136 (22.3%) |
| Fuel Oil or Kerosene | 88 (3.9%) | 0 (0.0%) |
| Coal or Coke | 0 (0.0%) | 0 (0.0%) |
| All other Fuels | 268 (11.9%) | 36 (5.9%) |
| No Fuel Used | 0 (0.0%) | 0 (0.0%) |
| Total | 2,243 (100.0%) | 610 (100.0%) |
Household Vehicle Usage in Gilpin County
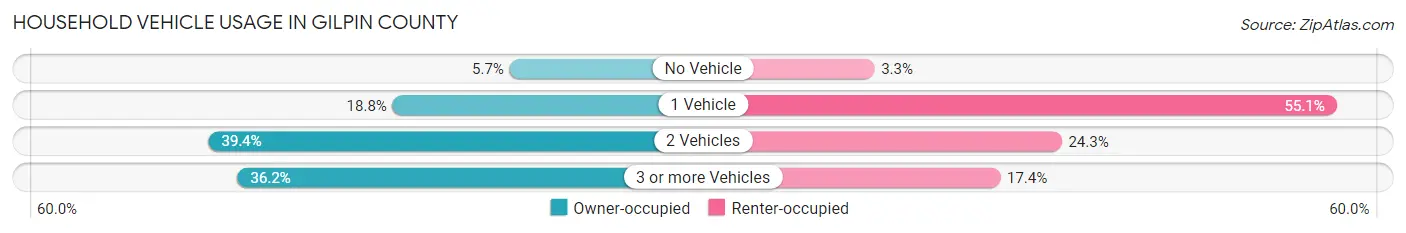
| Vehicles per Household | Owner-occupied | Renter-occupied |
| No Vehicle | 127 (5.7%) | 20 (3.3%) |
| 1 Vehicle | 421 (18.8%) | 336 (55.1%) |
| 2 Vehicles | 884 (39.4%) | 148 (24.3%) |
| 3 or more Vehicles | 811 (36.2%) | 106 (17.4%) |
| Total | 2,243 (100.0%) | 610 (100.0%) |
Real Estate & Mortgages in Gilpin County
Real Estate and Mortgage Overview in Gilpin County
| Characteristic | Without Mortgage | With Mortgage |
| Housing Units | 428 | 1,815 |
| Median Property Value | $432,400 | $474,400 |
| Median Household Income | $76,711 | $719 |
| Monthly Housing Costs | $507 | $241 |
| Real Estate Taxes | $756 | $8 |
Property Value by Mortgage Status in Gilpin County
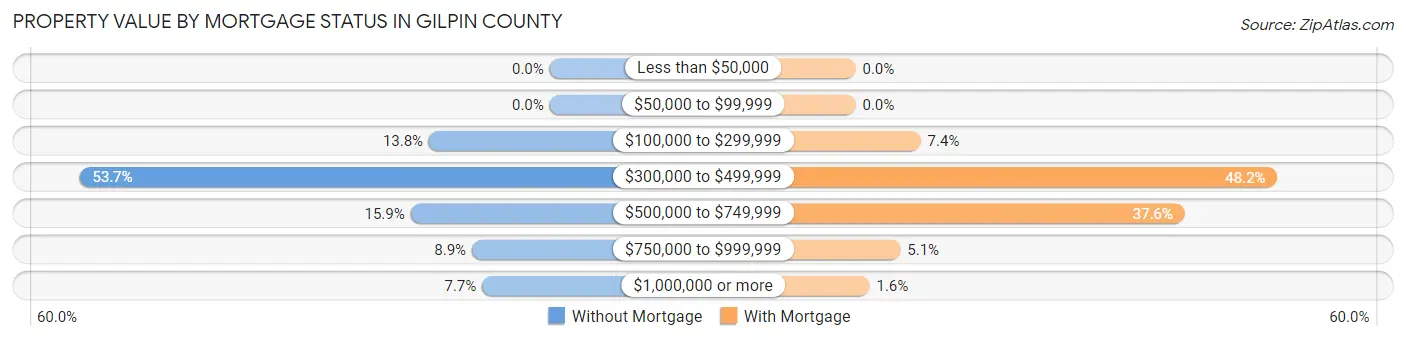
| Property Value | Without Mortgage | With Mortgage |
| Less than $50,000 | 0 (0.0%) | 0 (0.0%) |
| $50,000 to $99,999 | 0 (0.0%) | 0 (0.0%) |
| $100,000 to $299,999 | 59 (13.8%) | 135 (7.4%) |
| $300,000 to $499,999 | 230 (53.7%) | 875 (48.2%) |
| $500,000 to $749,999 | 68 (15.9%) | 683 (37.6%) |
| $750,000 to $999,999 | 38 (8.9%) | 93 (5.1%) |
| $1,000,000 or more | 33 (7.7%) | 29 (1.6%) |
| Total | 428 (100.0%) | 1,815 (100.0%) |
Household Income by Mortgage Status in Gilpin County
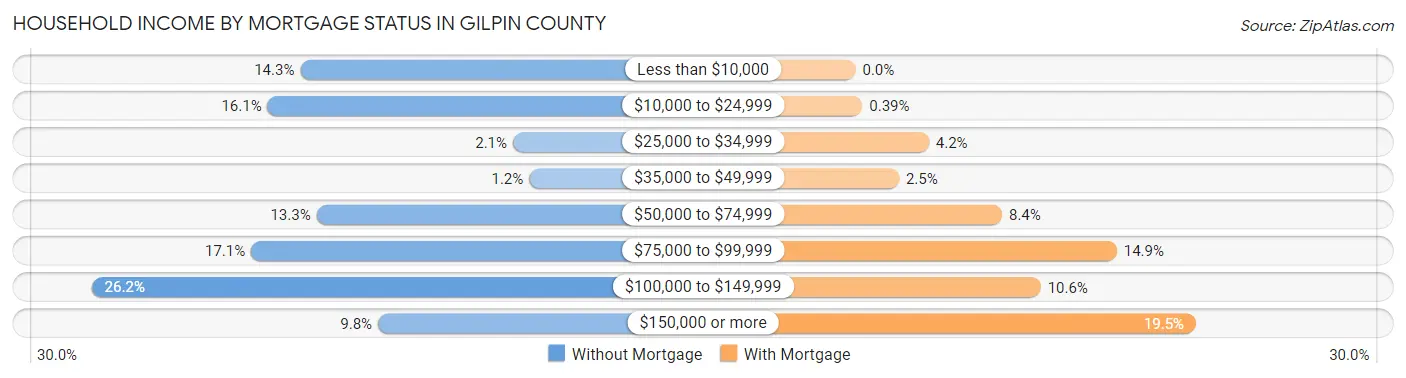
| Household Income | Without Mortgage | With Mortgage |
| Less than $10,000 | 61 (14.2%) | 0 (0.0%) |
| $10,000 to $24,999 | 69 (16.1%) | 7 (0.4%) |
| $25,000 to $34,999 | 9 (2.1%) | 76 (4.2%) |
| $35,000 to $49,999 | 5 (1.2%) | 45 (2.5%) |
| $50,000 to $74,999 | 57 (13.3%) | 152 (8.4%) |
| $75,000 to $99,999 | 73 (17.1%) | 271 (14.9%) |
| $100,000 to $149,999 | 112 (26.2%) | 192 (10.6%) |
| $150,000 or more | 42 (9.8%) | 353 (19.5%) |
| Total | 428 (100.0%) | 1,815 (100.0%) |
Property Value to Household Income Ratio in Gilpin County
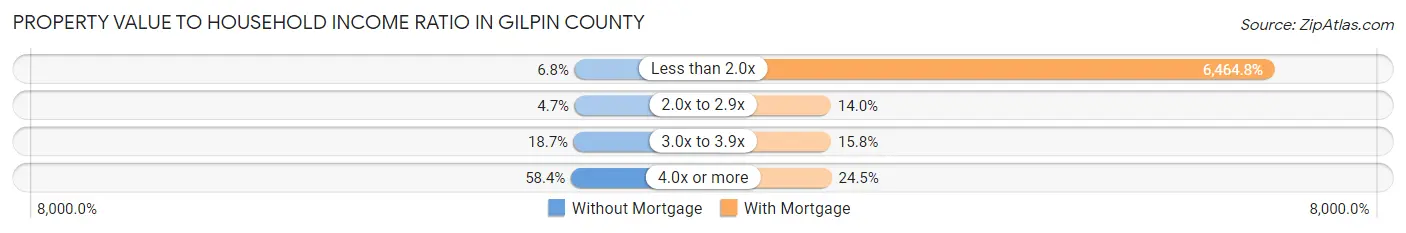
| Value-to-Income Ratio | Without Mortgage | With Mortgage |
| Less than 2.0x | 29 (6.8%) | 117,336 (6,464.8%) |
| 2.0x to 2.9x | 20 (4.7%) | 254 (14.0%) |
| 3.0x to 3.9x | 80 (18.7%) | 286 (15.8%) |
| 4.0x or more | 250 (58.4%) | 445 (24.5%) |
| Total | 428 (100.0%) | 1,815 (100.0%) |
Real Estate Taxes by Mortgage Status in Gilpin County
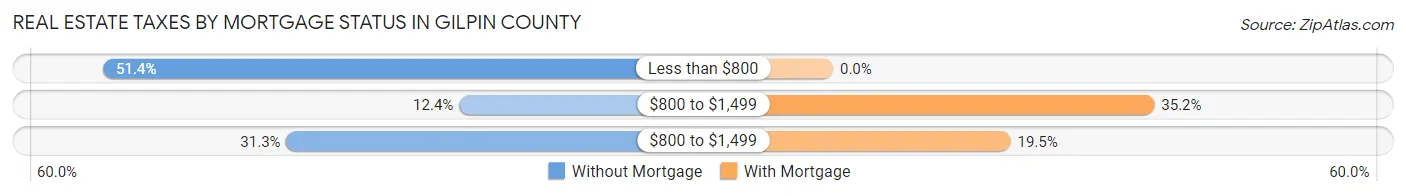
| Property Taxes | Without Mortgage | With Mortgage |
| Less than $800 | 220 (51.4%) | 0 (0.0%) |
| $800 to $1,499 | 53 (12.4%) | 639 (35.2%) |
| $800 to $1,499 | 134 (31.3%) | 353 (19.5%) |
| Total | 428 (100.0%) | 1,815 (100.0%) |
Health & Disability in Gilpin County
Health Insurance Coverage by Age in Gilpin County
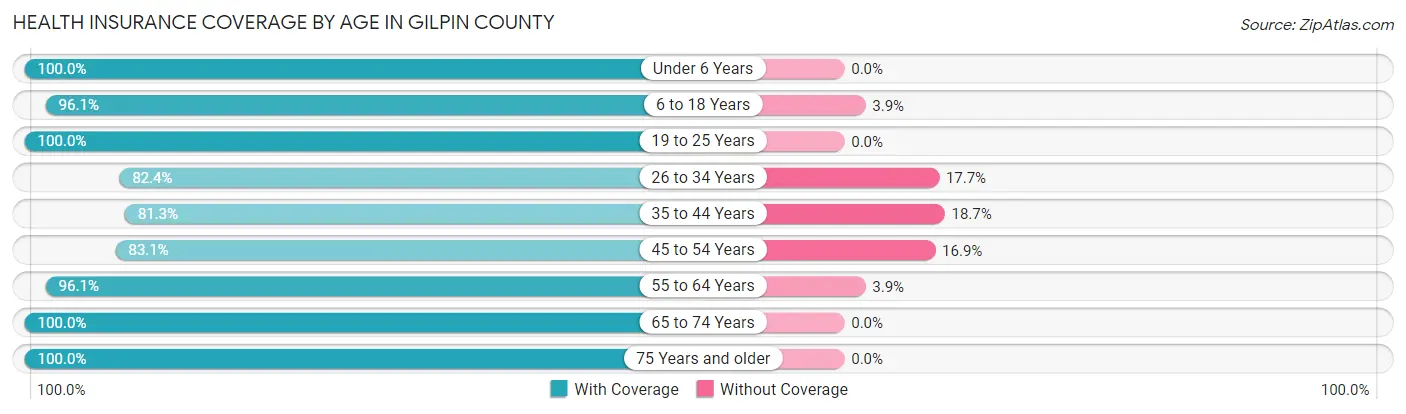
| Age Bracket | With Coverage | Without Coverage |
| Under 6 Years | 248 (100.0%) | 0 (0.0%) |
| 6 to 18 Years | 807 (96.1%) | 33 (3.9%) |
| 19 to 25 Years | 140 (100.0%) | 0 (0.0%) |
| 26 to 34 Years | 448 (82.4%) | 96 (17.6%) |
| 35 to 44 Years | 657 (81.3%) | 151 (18.7%) |
| 45 to 54 Years | 868 (83.1%) | 177 (16.9%) |
| 55 to 64 Years | 1,199 (96.1%) | 49 (3.9%) |
| 65 to 74 Years | 509 (100.0%) | 0 (0.0%) |
| 75 Years and older | 425 (100.0%) | 0 (0.0%) |
| Total | 5,301 (91.3%) | 506 (8.7%) |
Health Insurance Coverage by Citizenship Status in Gilpin County
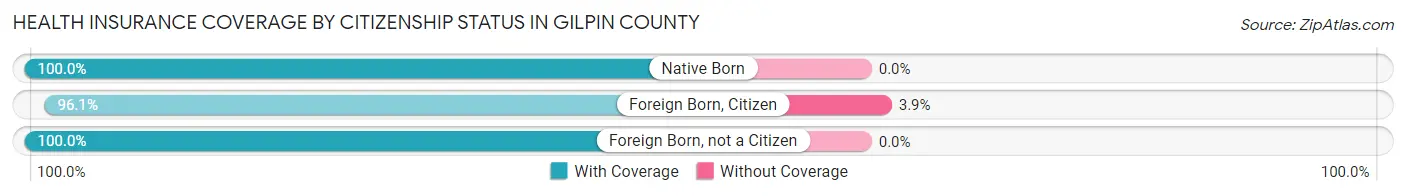
| Citizenship Status | With Coverage | Without Coverage |
| Native Born | 248 (100.0%) | 0 (0.0%) |
| Foreign Born, Citizen | 807 (96.1%) | 33 (3.9%) |
| Foreign Born, not a Citizen | 140 (100.0%) | 0 (0.0%) |
Health Insurance Coverage by Household Income in Gilpin County
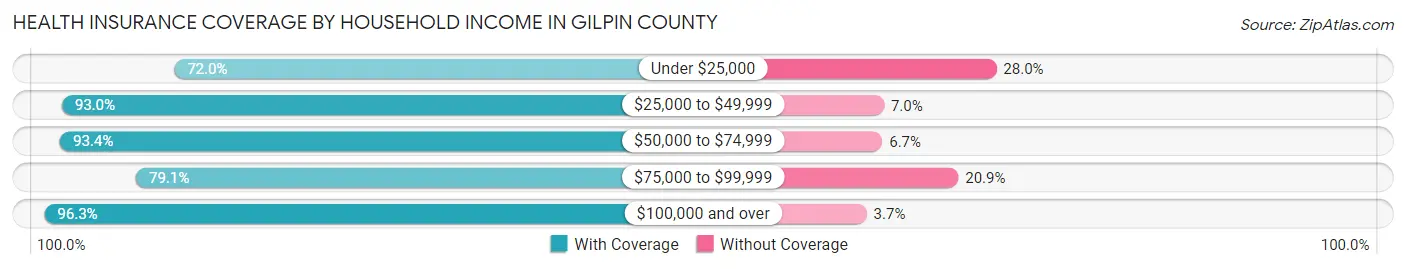
| Household Income | With Coverage | Without Coverage |
| Under $25,000 | 457 (72.0%) | 178 (28.0%) |
| $25,000 to $49,999 | 561 (93.0%) | 42 (7.0%) |
| $50,000 to $74,999 | 716 (93.3%) | 51 (6.7%) |
| $75,000 to $99,999 | 443 (79.1%) | 117 (20.9%) |
| $100,000 and over | 3,050 (96.3%) | 118 (3.7%) |
Public vs Private Health Insurance Coverage by Age in Gilpin County
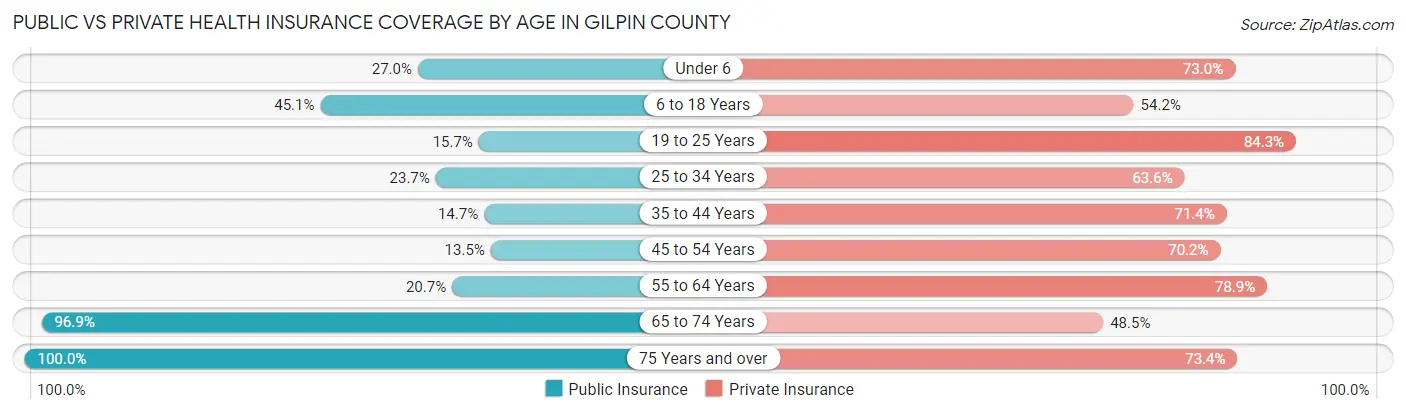
| Age Bracket | Public Insurance | Private Insurance |
| Under 6 | 67 (27.0%) | 181 (73.0%) |
| 6 to 18 Years | 379 (45.1%) | 455 (54.2%) |
| 19 to 25 Years | 22 (15.7%) | 118 (84.3%) |
| 25 to 34 Years | 129 (23.7%) | 346 (63.6%) |
| 35 to 44 Years | 119 (14.7%) | 577 (71.4%) |
| 45 to 54 Years | 141 (13.5%) | 734 (70.2%) |
| 55 to 64 Years | 258 (20.7%) | 985 (78.9%) |
| 65 to 74 Years | 493 (96.9%) | 247 (48.5%) |
| 75 Years and over | 425 (100.0%) | 312 (73.4%) |
| Total | 2,033 (35.0%) | 3,955 (68.1%) |
Disability Status by Sex by Age in Gilpin County
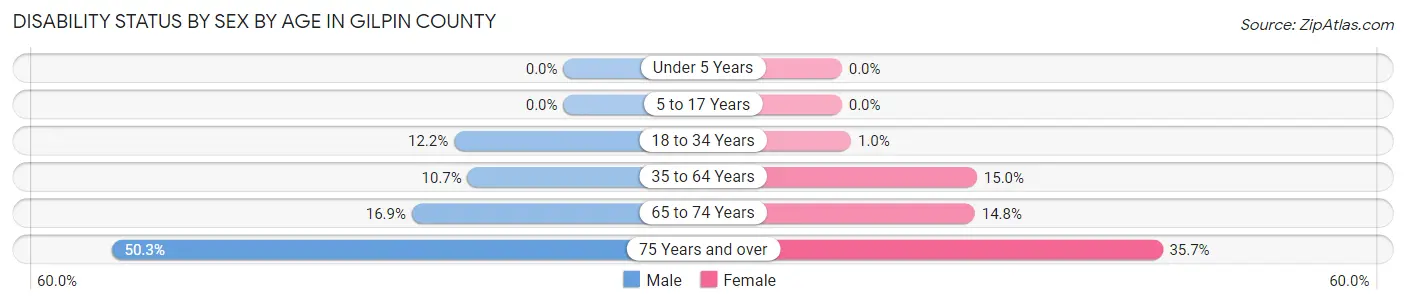
| Age Bracket | Male | Female |
| Under 5 Years | 0 (0.0%) | 0 (0.0%) |
| 5 to 17 Years | 0 (0.0%) | 0 (0.0%) |
| 18 to 34 Years | 41 (12.2%) | 4 (1.0%) |
| 35 to 64 Years | 179 (10.7%) | 214 (15.0%) |
| 65 to 74 Years | 54 (16.9%) | 28 (14.8%) |
| 75 Years and over | 80 (50.3%) | 95 (35.7%) |
Disability Class by Sex by Age in Gilpin County
Disability Class: Hearing Difficulty
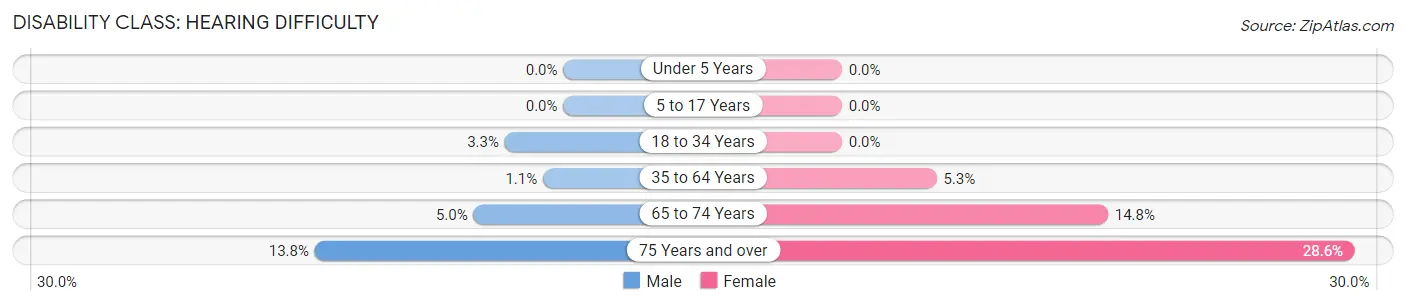
| Age Bracket | Male | Female |
| Under 5 Years | 0 (0.0%) | 0 (0.0%) |
| 5 to 17 Years | 0 (0.0%) | 0 (0.0%) |
| 18 to 34 Years | 11 (3.3%) | 0 (0.0%) |
| 35 to 64 Years | 19 (1.1%) | 75 (5.3%) |
| 65 to 74 Years | 16 (5.0%) | 28 (14.8%) |
| 75 Years and over | 22 (13.8%) | 76 (28.6%) |
Disability Class: Vision Difficulty
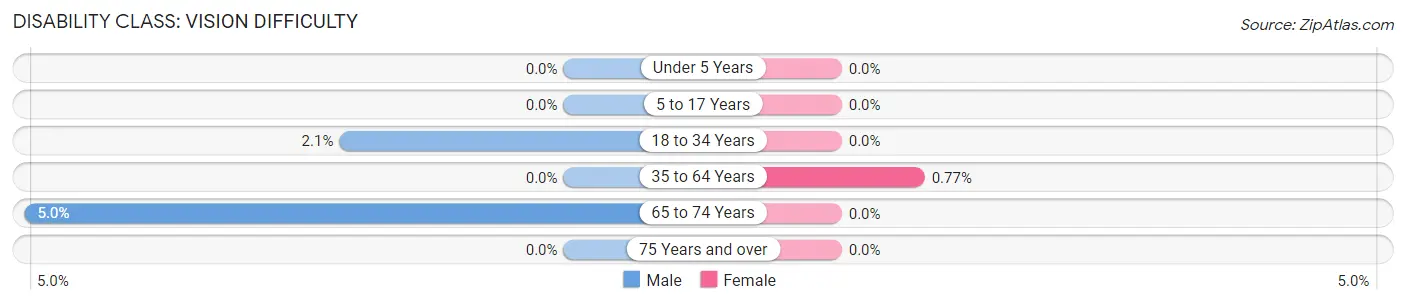
| Age Bracket | Male | Female |
| Under 5 Years | 0 (0.0%) | 0 (0.0%) |
| 5 to 17 Years | 0 (0.0%) | 0 (0.0%) |
| 18 to 34 Years | 7 (2.1%) | 0 (0.0%) |
| 35 to 64 Years | 0 (0.0%) | 11 (0.8%) |
| 65 to 74 Years | 16 (5.0%) | 0 (0.0%) |
| 75 Years and over | 0 (0.0%) | 0 (0.0%) |
Disability Class: Cognitive Difficulty
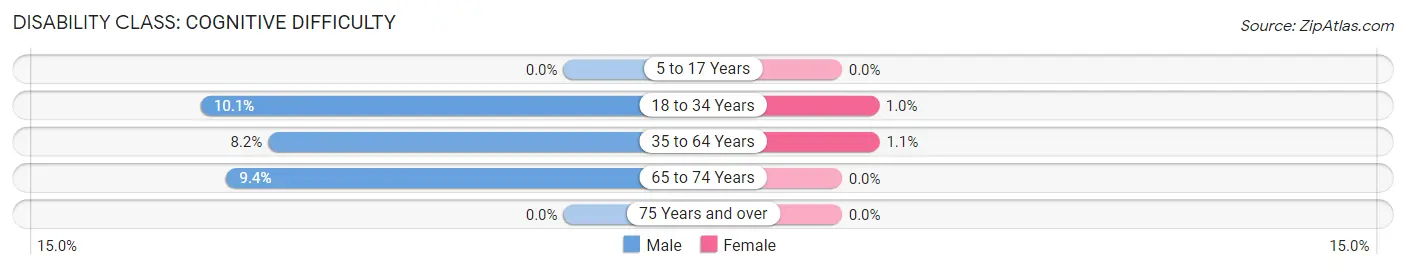
| Age Bracket | Male | Female |
| 5 to 17 Years | 0 (0.0%) | 0 (0.0%) |
| 18 to 34 Years | 34 (10.1%) | 4 (1.0%) |
| 35 to 64 Years | 138 (8.2%) | 15 (1.1%) |
| 65 to 74 Years | 30 (9.4%) | 0 (0.0%) |
| 75 Years and over | 0 (0.0%) | 0 (0.0%) |
Disability Class: Ambulatory Difficulty

| Age Bracket | Male | Female |
| 5 to 17 Years | 0 (0.0%) | 0 (0.0%) |
| 18 to 34 Years | 0 (0.0%) | 0 (0.0%) |
| 35 to 64 Years | 105 (6.3%) | 102 (7.2%) |
| 65 to 74 Years | 49 (15.3%) | 0 (0.0%) |
| 75 Years and over | 64 (40.3%) | 42 (15.8%) |
Disability Class: Self-Care Difficulty
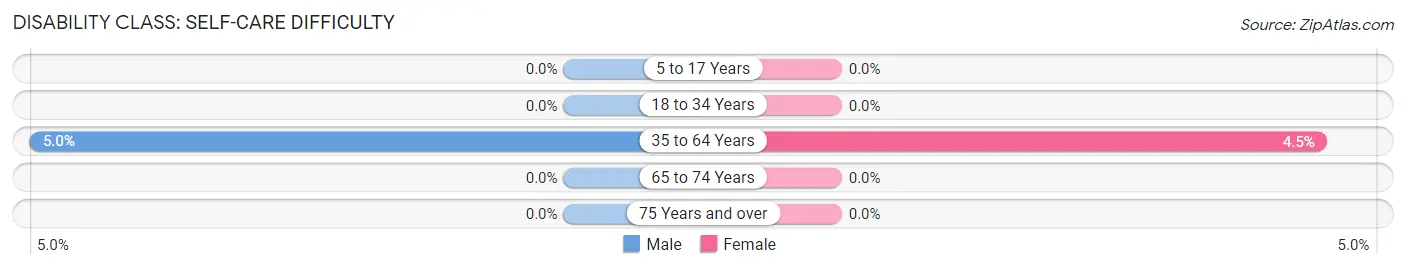
| Age Bracket | Male | Female |
| 5 to 17 Years | 0 (0.0%) | 0 (0.0%) |
| 18 to 34 Years | 0 (0.0%) | 0 (0.0%) |
| 35 to 64 Years | 83 (5.0%) | 64 (4.5%) |
| 65 to 74 Years | 0 (0.0%) | 0 (0.0%) |
| 75 Years and over | 0 (0.0%) | 0 (0.0%) |
Technology Access in Gilpin County
Computing Device Access in Gilpin County
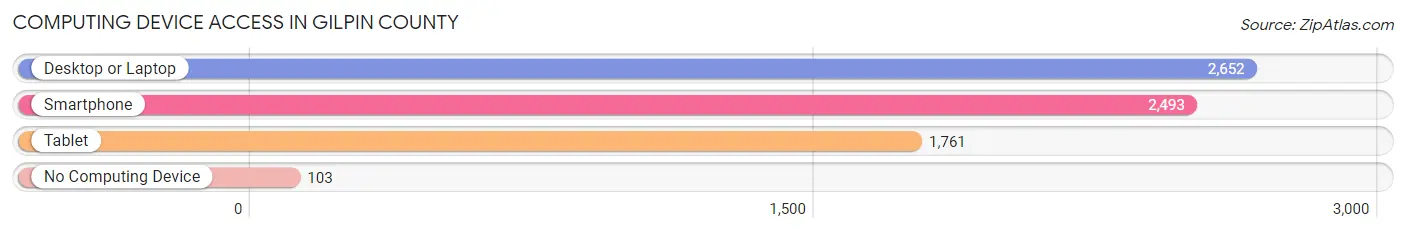
| Device Type | # Households | % Households |
| Desktop or Laptop | 2,652 | 92.9% |
| Smartphone | 2,493 | 87.4% |
| Tablet | 1,761 | 61.7% |
| No Computing Device | 103 | 3.6% |
| Total | 2,853 | 100.0% |
Internet Access in Gilpin County
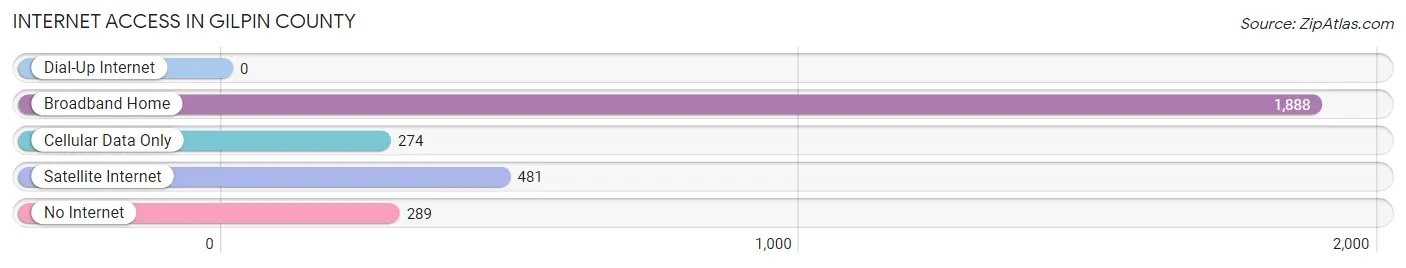
| Internet Type | # Households | % Households |
| Dial-Up Internet | 0 | 0.0% |
| Broadband Home | 1,888 | 66.2% |
| Cellular Data Only | 274 | 9.6% |
| Satellite Internet | 481 | 16.9% |
| No Internet | 289 | 10.1% |
| Total | 2,853 | 100.0% |
Gilpin County Summary
Introduction
Gilpin County is located in the north central part of Colorado, and is one of the 64 counties in the state. It is bordered by Boulder, Clear Creek, Grand, and Jefferson counties. Gilpin County is known for its beautiful mountain scenery, and is home to many popular ski resorts and outdoor recreation areas. The county has a population of approximately 5,400 people, and is one of the least populated counties in the state.
History
The area that is now Gilpin County was originally inhabited by the Ute and Arapaho Native American tribes. The first European settlers arrived in the area in the mid-1800s, and the county was officially established in 1861. The county was named after Colonel William Gilpin, who was the first territorial governor of Colorado.
The county was initially a mining area, and gold was discovered in the area in 1859. The gold rush brought many people to the area, and the population of the county grew rapidly. The mining industry continued to be an important part of the economy until the early 1900s, when the gold mines began to decline.
Geography
Gilpin County is located in the north central part of Colorado, and is bordered by Boulder, Clear Creek, Grand, and Jefferson counties. The county covers an area of approximately 441 square miles, and is located at an elevation of 8,000 feet. The county is located in the Rocky Mountains, and is home to many popular ski resorts and outdoor recreation areas.
The county is divided into two distinct regions: the Front Range and the High Country. The Front Range is located in the eastern part of the county, and is characterized by rolling hills and grassy meadows. The High Country is located in the western part of the county, and is characterized by rugged mountains and dense forests.
Economy
The economy of Gilpin County is largely based on tourism and recreation. The county is home to many popular ski resorts and outdoor recreation areas, and these attract visitors from all over the world. The county also has a thriving arts and culture scene, and is home to many galleries, museums, and theaters.
The county also has a strong agricultural sector, and is home to many farms and ranches. The county is also home to several small businesses, and is a popular destination for entrepreneurs.
Demographics
As of the 2010 census, the population of Gilpin County was 5,441. The population is predominantly white (93.3%), with small percentages of Hispanic (2.7%), African American (1.2%), and Native American (0.7%) residents. The median household income in the county is $60,000, and the median home value is $400,000.
Conclusion
Gilpin County is a beautiful and unique county located in the north central part of Colorado. The county is known for its stunning mountain scenery, and is home to many popular ski resorts and outdoor recreation areas. The economy of the county is largely based on tourism and recreation, and the county also has a thriving agricultural sector. The population of the county is predominantly white, and the median household income is $60,000.
Common Questions
What is Per Capita Income in Gilpin County?
Per Capita income in Gilpin County is $57,593.
What is the Median Family Income in Gilpin County?
Median Family Income in Gilpin County is $116,235.
What is the Median Household income in Gilpin County?
Median Household Income in Gilpin County is $95,902.
What is Income or Wage Gap in Gilpin County?
Income or Wage Gap in Gilpin County is 49.9%.
Women in Gilpin County earn 50.1 cents for every dollar earned by a man.
What is Inequality or Gini Index in Gilpin County?
Inequality or Gini Index in Gilpin County is 0.46.
What is the Total Population of Gilpin County?
Total Population of Gilpin County is 5,856.
What is the Total Male Population of Gilpin County?
Total Male Population of Gilpin County is 3,103.
What is the Total Female Population of Gilpin County?
Total Female Population of Gilpin County is 2,753.
What is the Ratio of Males per 100 Females in Gilpin County?
There are 112.71 Males per 100 Females in Gilpin County.
What is the Ratio of Females per 100 Males in Gilpin County?
There are 88.72 Females per 100 Males in Gilpin County.
What is the Median Population Age in Gilpin County?
Median Population Age in Gilpin County is 47.4 Years.
What is the Average Family Size in Gilpin County
Average Family Size in Gilpin County is 2.6 People.
What is the Average Household Size in Gilpin County
Average Household Size in Gilpin County is 2.0 People.
How Large is the Labor Force in Gilpin County?
There are 3,653 People in the Labor Forcein in Gilpin County.
What is the Percentage of People in the Labor Force in Gilpin County?
73.2% of People are in the Labor Force in Gilpin County.
What is the Unemployment Rate in Gilpin County?
Unemployment Rate in Gilpin County is 2.1%.