Dolores County, CO Map & Demographics
Dolores County Overview
$38,098
PER CAPITA INCOME
$91,985
AVG FAMILY INCOME
$64,708
AVG HOUSEHOLD INCOME
2.2%
WAGE / INCOME GAP [ % ]
97.8¢/ $1
WAGE / INCOME GAP [ $ ]
0.44
INEQUALITY / GINI INDEX
2,329
TOTAL POPULATION
1,297
MALE POPULATION
1,032
FEMALE POPULATION
125.68
MALES / 100 FEMALES
79.57
FEMALES / 100 MALES
59.2
MEDIAN AGE
2.4
AVG FAMILY SIZE
2.0
AVG HOUSEHOLD SIZE
1,107
LABOR FORCE [ PEOPLE ]
53.2%
PERCENT IN LABOR FORCE
3.1%
UNEMPLOYMENT RATE
Dolores County Area Codes
Income in Dolores County
Income Overview in Dolores County
Per Capita Income in Dolores County is $38,098, while median incomes of families and households are $91,985 and $64,708 respectively.
| Characteristic | Number | Measure |
| Per Capita Income | 2,329 | $38,098 |
| Median Family Income | 807 | $91,985 |
| Mean Family Income | 807 | $98,708 |
| Median Household Income | 1,185 | $64,708 |
| Mean Household Income | 1,185 | $81,392 |
| Income Deficit | 807 | $0 |
| Wage / Income Gap (%) | 2,329 | 2.22% |
| Wage / Income Gap ($) | 2,329 | 97.78¢ per $1 |
| Gini / Inequality Index | 2,329 | 0.44 |
Earnings by Sex in Dolores County
Average Earnings in Dolores County are $47,155, $46,597 for men and $47,656 for women, a difference of 2.2%.
| Sex | Number | Average Earnings |
| Male | 518 (46.2%) | $46,597 |
| Female | 603 (53.8%) | $47,656 |
| Total | 1,121 (100.0%) | $47,155 |
Earnings by Sex by Income Bracket in Dolores County
The most common earnings brackets in Dolores County are $100,000+ for men (102 | 19.7%) and $55,000 to $64,999 for women (193 | 32.0%).
| Income | Male | Female |
| $2,499 or less | 2 (0.4%) | 0 (0.0%) |
| $2,500 to $4,999 | 9 (1.7%) | 64 (10.6%) |
| $5,000 to $7,499 | 0 (0.0%) | 37 (6.1%) |
| $7,500 to $9,999 | 11 (2.1%) | 0 (0.0%) |
| $10,000 to $12,499 | 24 (4.6%) | 61 (10.1%) |
| $12,500 to $14,999 | 21 (4.1%) | 16 (2.6%) |
| $15,000 to $17,499 | 6 (1.2%) | 0 (0.0%) |
| $17,500 to $19,999 | 0 (0.0%) | 10 (1.7%) |
| $20,000 to $22,499 | 0 (0.0%) | 15 (2.5%) |
| $22,500 to $24,999 | 15 (2.9%) | 35 (5.8%) |
| $25,000 to $29,999 | 0 (0.0%) | 0 (0.0%) |
| $30,000 to $34,999 | 30 (5.8%) | 6 (1.0%) |
| $35,000 to $39,999 | 61 (11.8%) | 8 (1.3%) |
| $40,000 to $44,999 | 57 (11.0%) | 7 (1.2%) |
| $45,000 to $49,999 | 44 (8.5%) | 80 (13.3%) |
| $50,000 to $54,999 | 27 (5.2%) | 33 (5.5%) |
| $55,000 to $64,999 | 16 (3.1%) | 193 (32.0%) |
| $65,000 to $74,999 | 45 (8.7%) | 3 (0.5%) |
| $75,000 to $99,999 | 48 (9.3%) | 18 (3.0%) |
| $100,000+ | 102 (19.7%) | 17 (2.8%) |
| Total | 518 (100.0%) | 603 (100.0%) |
Earnings by Sex by Educational Attainment in Dolores County
Average earnings in Dolores County are $47,188 for men and $49,406 for women, a difference of 4.5%. Men with an educational attainment of bachelor's degree enjoy the highest average annual earnings of $69,231, while those with high school diploma education earn the least with $42,258. Women with an educational attainment of high school diploma earn the most with the average annual earnings of $58,198, while those with college or associate's degree education have the smallest earnings of $24,321.
| Educational Attainment | Male Income | Female Income |
| Less than High School | - | - |
| High School Diploma | $42,258 | $58,198 |
| College or Associate's Degree | $45,769 | $24,321 |
| Bachelor's Degree | $69,231 | $0 |
| Graduate Degree | $54,306 | $0 |
| Total | $47,188 | $49,406 |
Family Income in Dolores County
Family Income Brackets in Dolores County
According to the Dolores County family income data, there are 245 families falling into the $100,000 to $149,999 income range, which is the most common income bracket and makes up 30.4% of all families. Conversely, the $15,000 to $24,999 income bracket is the least frequent group with only 15 families (1.9%) belonging to this category.
| Income Bracket | # Families | % Families |
| Less than $10,000 | 19 | 2.4% |
| $10,000 to $14,999 | 25 | 3.1% |
| $15,000 to $24,999 | 15 | 1.9% |
| $25,000 to $34,999 | 71 | 8.8% |
| $35,000 to $49,999 | 60 | 7.4% |
| $50,000 to $74,999 | 143 | 17.7% |
| $75,000 to $99,999 | 77 | 9.5% |
| $100,000 to $149,999 | 245 | 30.4% |
| $150,000 to $199,999 | 103 | 12.8% |
| $200,000+ | 49 | 6.1% |
Family Income by Famaliy Size in Dolores County
2-person families (521 | 64.6%) account for the highest median family income in Dolores County with $105,729 per family, while 2-person families (521 | 64.6%) have the highest median income of $52,864 per family member.
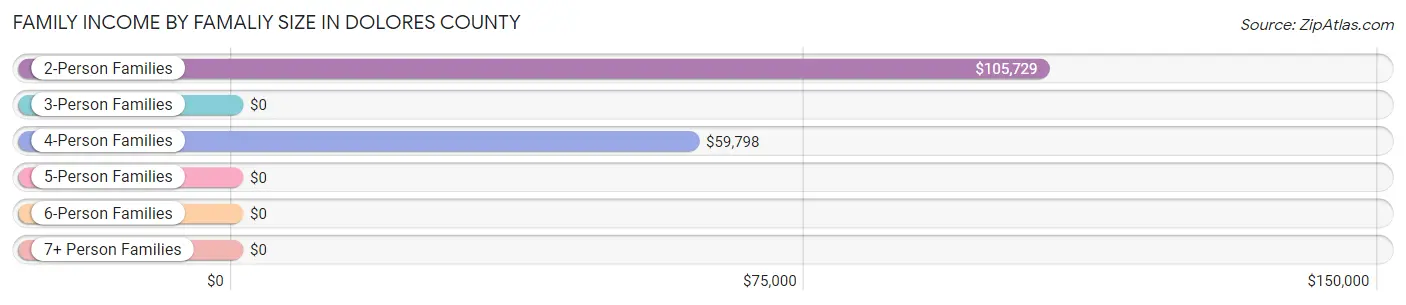
| Income Bracket | # Families | Median Income |
| 2-Person Families | 521 (64.6%) | $105,729 |
| 3-Person Families | 164 (20.3%) | $0 |
| 4-Person Families | 111 (13.8%) | $59,798 |
| 5-Person Families | 0 (0.0%) | $0 |
| 6-Person Families | 11 (1.4%) | $0 |
| 7+ Person Families | 0 (0.0%) | $0 |
| Total | 807 (100.0%) | $91,985 |
Family Income by Number of Earners in Dolores County

| Number of Earners | # Families | Median Income |
| No Earners | 161 (20.0%) | $38,973 |
| 1 Earner | 377 (46.7%) | $110,141 |
| 2 Earners | 245 (30.4%) | $123,750 |
| 3+ Earners | 24 (3.0%) | $0 |
| Total | 807 (100.0%) | $91,985 |
Household Income in Dolores County
Household Income Brackets in Dolores County
With 264 households falling in the category, the $100,000 to $149,999 income range is the most frequent in Dolores County, accounting for 22.3% of all households. In contrast, only 41 households (3.5%) fall into the $15,000 to $24,999 income bracket, making it the least populous group.
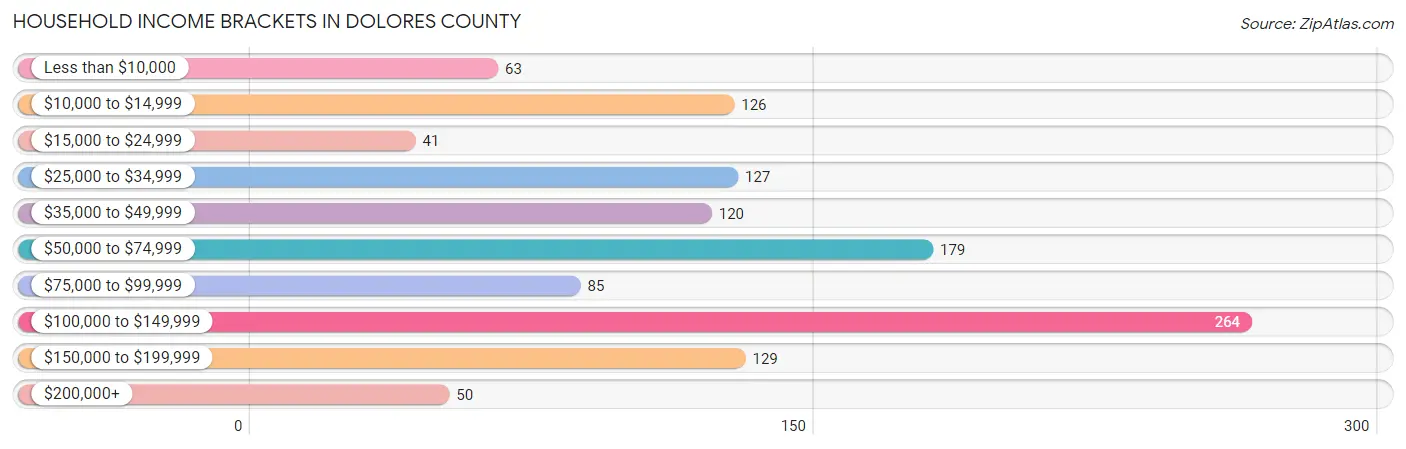
| Income Bracket | # Households | % Households |
| Less than $10,000 | 63 | 5.3% |
| $10,000 to $14,999 | 126 | 10.6% |
| $15,000 to $24,999 | 41 | 3.5% |
| $25,000 to $34,999 | 127 | 10.7% |
| $35,000 to $49,999 | 120 | 10.1% |
| $50,000 to $74,999 | 179 | 15.1% |
| $75,000 to $99,999 | 85 | 7.2% |
| $100,000 to $149,999 | 264 | 22.3% |
| $150,000 to $199,999 | 129 | 10.9% |
| $200,000+ | 50 | 4.2% |
Household Income by Householder Age in Dolores County
The median household income in Dolores County is $64,708, with the highest median household income of $74,107 found in the 65+ years age bracket for the primary householder. A total of 573 households (48.3%) fall into this category. Meanwhile, the 15 to 24 years age bracket for the primary householder has the lowest median household income of $0, with 16 households (1.3%) in this group.
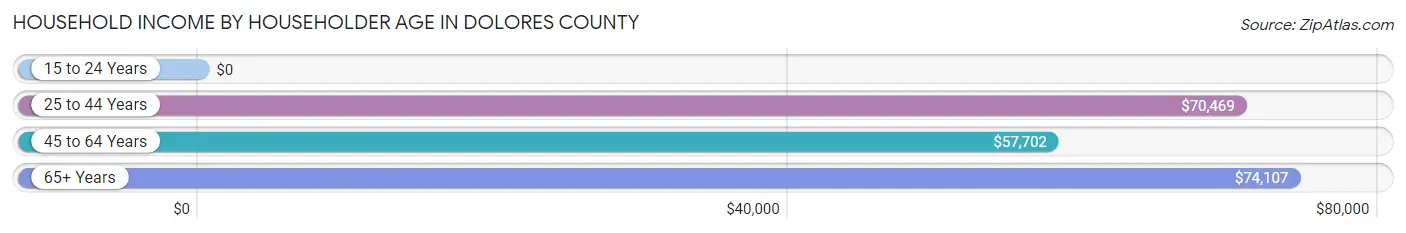
| Income Bracket | # Households | Median Income |
| 15 to 24 Years | 16 (1.3%) | $0 |
| 25 to 44 Years | 235 (19.8%) | $70,469 |
| 45 to 64 Years | 361 (30.5%) | $57,702 |
| 65+ Years | 573 (48.3%) | $74,107 |
| Total | 1,185 (100.0%) | $64,708 |
Poverty in Dolores County
Income Below Poverty by Sex and Age in Dolores County
With 16.5% poverty level for males and 17.0% for females among the residents of Dolores County, 18 to 24 year old males and 16 and 17 year old females are the most vulnerable to poverty, with 23 males (57.5%) and 20 females (62.5%) in their respective age groups living below the poverty level.
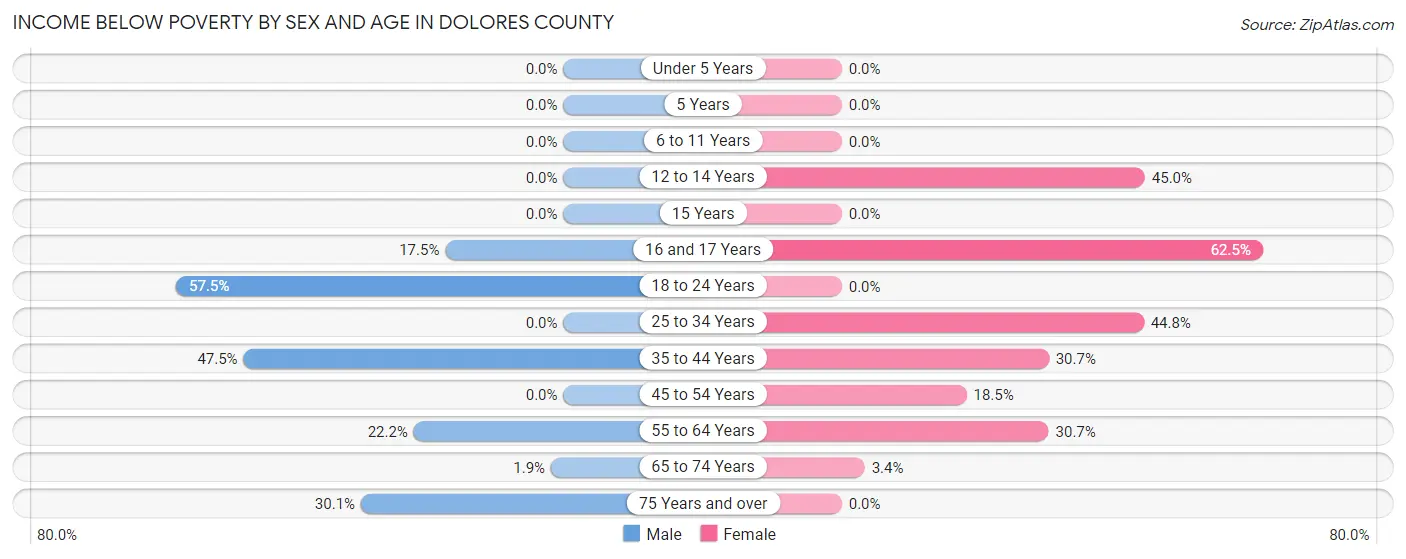
| Age Bracket | Male | Female |
| Under 5 Years | 0 (0.0%) | 0 (0.0%) |
| 5 Years | 0 (0.0%) | 0 (0.0%) |
| 6 to 11 Years | 0 (0.0%) | 0 (0.0%) |
| 12 to 14 Years | 0 (0.0%) | 9 (45.0%) |
| 15 Years | 0 (0.0%) | 0 (0.0%) |
| 16 and 17 Years | 10 (17.5%) | 20 (62.5%) |
| 18 to 24 Years | 23 (57.5%) | 0 (0.0%) |
| 25 to 34 Years | 0 (0.0%) | 13 (44.8%) |
| 35 to 44 Years | 57 (47.5%) | 63 (30.7%) |
| 45 to 54 Years | 0 (0.0%) | 15 (18.5%) |
| 55 to 64 Years | 68 (22.2%) | 43 (30.7%) |
| 65 to 74 Years | 4 (1.8%) | 12 (3.4%) |
| 75 Years and over | 52 (30.1%) | 0 (0.0%) |
| Total | 214 (16.5%) | 175 (17.0%) |
Income Above Poverty by Sex and Age in Dolores County
According to the poverty statistics in Dolores County, males aged under 5 years and females aged 6 to 11 years are the age groups that are most secure financially, with 100.0% of males and 100.0% of females in these age groups living above the poverty line.
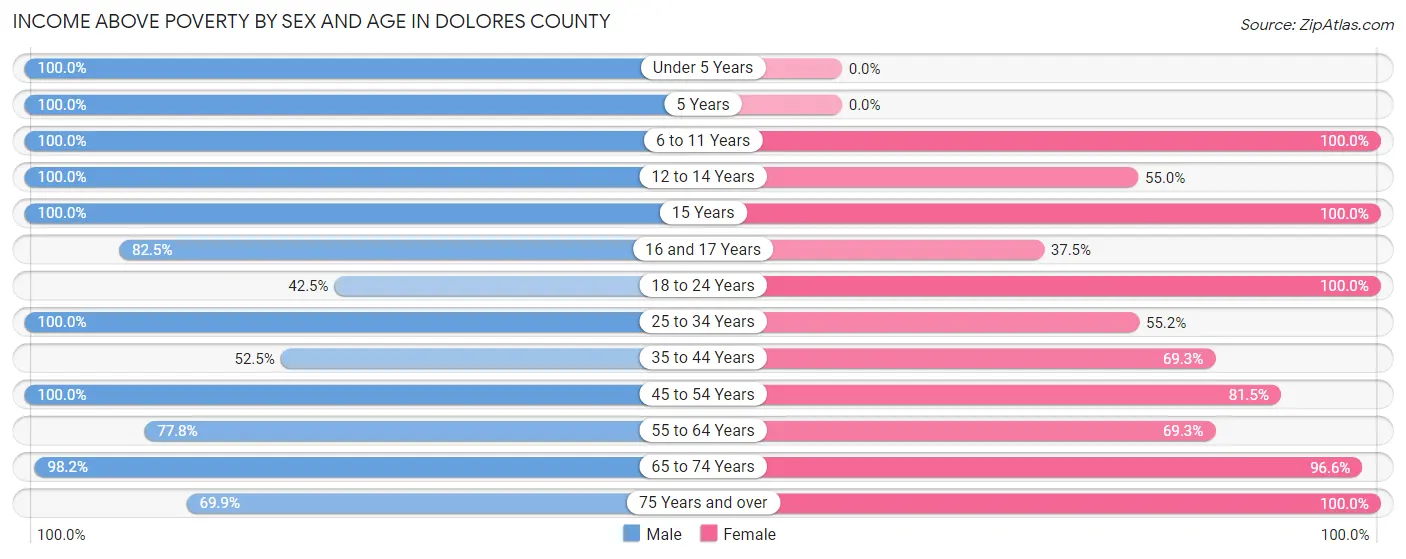
| Age Bracket | Male | Female |
| Under 5 Years | 64 (100.0%) | 0 (0.0%) |
| 5 Years | 17 (100.0%) | 0 (0.0%) |
| 6 to 11 Years | 52 (100.0%) | 31 (100.0%) |
| 12 to 14 Years | 50 (100.0%) | 11 (55.0%) |
| 15 Years | 8 (100.0%) | 7 (100.0%) |
| 16 and 17 Years | 47 (82.5%) | 12 (37.5%) |
| 18 to 24 Years | 17 (42.5%) | 44 (100.0%) |
| 25 to 34 Years | 90 (100.0%) | 16 (55.2%) |
| 35 to 44 Years | 63 (52.5%) | 142 (69.3%) |
| 45 to 54 Years | 104 (100.0%) | 66 (81.5%) |
| 55 to 64 Years | 238 (77.8%) | 97 (69.3%) |
| 65 to 74 Years | 212 (98.2%) | 340 (96.6%) |
| 75 Years and over | 121 (69.9%) | 91 (100.0%) |
| Total | 1,083 (83.5%) | 857 (83.0%) |
Income Below Poverty Among Married-Couple Families in Dolores County
The poverty statistics for married-couple families in Dolores County show that 6.0% or 40 of the total 661 families live below the poverty line. Families with 1 or 2 children have the highest poverty rate of 10.9%, comprising of 15 families. On the other hand, families with no children have the lowest poverty rate of 4.8%, which includes 25 families.
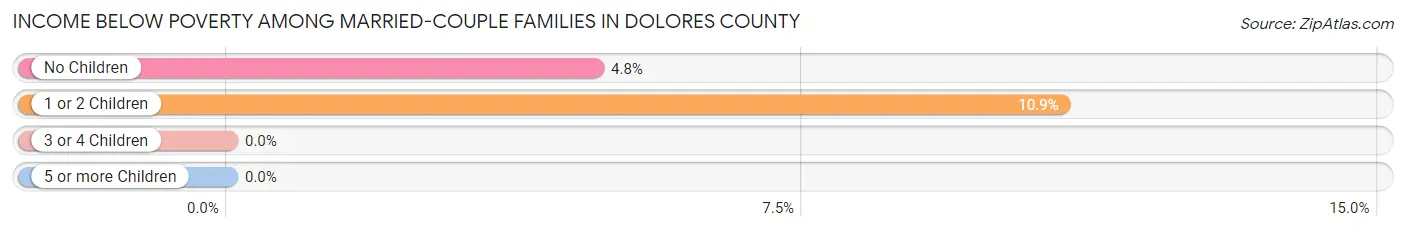
| Children | Above Poverty | Below Poverty |
| No Children | 498 (95.2%) | 25 (4.8%) |
| 1 or 2 Children | 123 (89.1%) | 15 (10.9%) |
| 3 or 4 Children | 0 (0.0%) | 0 (0.0%) |
| 5 or more Children | 0 (0.0%) | 0 (0.0%) |
| Total | 621 (94.0%) | 40 (6.0%) |
Income Below Poverty Among Single-Parent Households in Dolores County
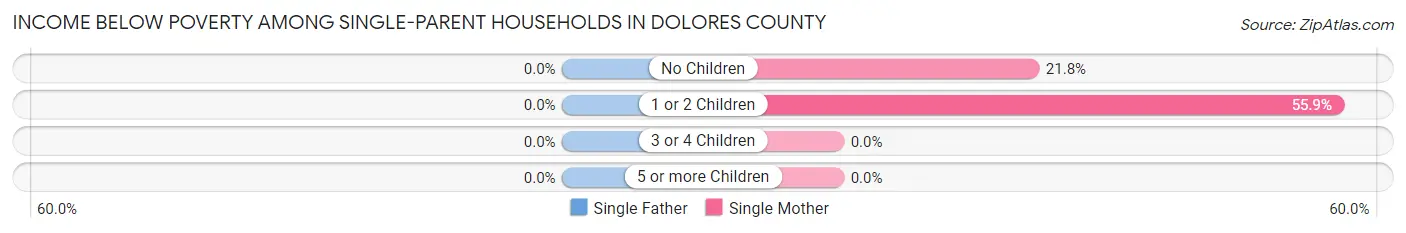
| Children | Single Father | Single Mother |
| No Children | 0 (0.0%) | 12 (21.8%) |
| 1 or 2 Children | 0 (0.0%) | 19 (55.9%) |
| 3 or 4 Children | 0 (0.0%) | 0 (0.0%) |
| 5 or more Children | 0 (0.0%) | 0 (0.0%) |
| Total | 0 (0.0%) | 31 (34.8%) |
Income Below Poverty Among Married-Couple vs Single-Parent Households in Dolores County
The poverty data for Dolores County shows that 40 of the married-couple family households (6.0%) and 31 of the single-parent households (21.2%) are living below the poverty level. Within the married-couple family households, those with 1 or 2 children have the highest poverty rate, with 15 households (10.9%) falling below the poverty line. Among the single-parent households, those with 1 or 2 children have the highest poverty rate, with 19 household (31.7%) living below poverty.
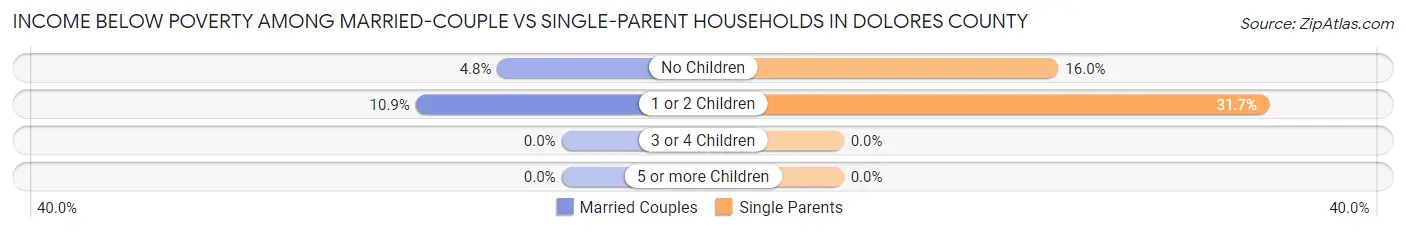
| Children | Married-Couple Families | Single-Parent Households |
| No Children | 25 (4.8%) | 12 (16.0%) |
| 1 or 2 Children | 15 (10.9%) | 19 (31.7%) |
| 3 or 4 Children | 0 (0.0%) | 0 (0.0%) |
| 5 or more Children | 0 (0.0%) | 0 (0.0%) |
| Total | 40 (6.0%) | 31 (21.2%) |
Race in Dolores County
The most populous races in Dolores County are White / Caucasian (1,929 | 82.8%), Hispanic or Latino (319 | 13.7%), and Some other Race (175 | 7.5%).

| Race | # Population | % Population |
| Asian | 0 | 0.0% |
| Black / African American | 0 | 0.0% |
| Hawaiian / Pacific | 0 | 0.0% |
| Hispanic or Latino | 319 | 13.7% |
| Native / Alaskan | 136 | 5.8% |
| White / Caucasian | 1,929 | 82.8% |
| Two or more Races | 89 | 3.8% |
| Some other Race | 175 | 7.5% |
| Total | 2,329 | 100.0% |
Ancestry in Dolores County
The most populous ancestries reported in Dolores County are German (465 | 20.0%), Mexican (294 | 12.6%), American (283 | 12.1%), Irish (245 | 10.5%), and English (198 | 8.5%), together accounting for 63.8% of all Dolores County residents.
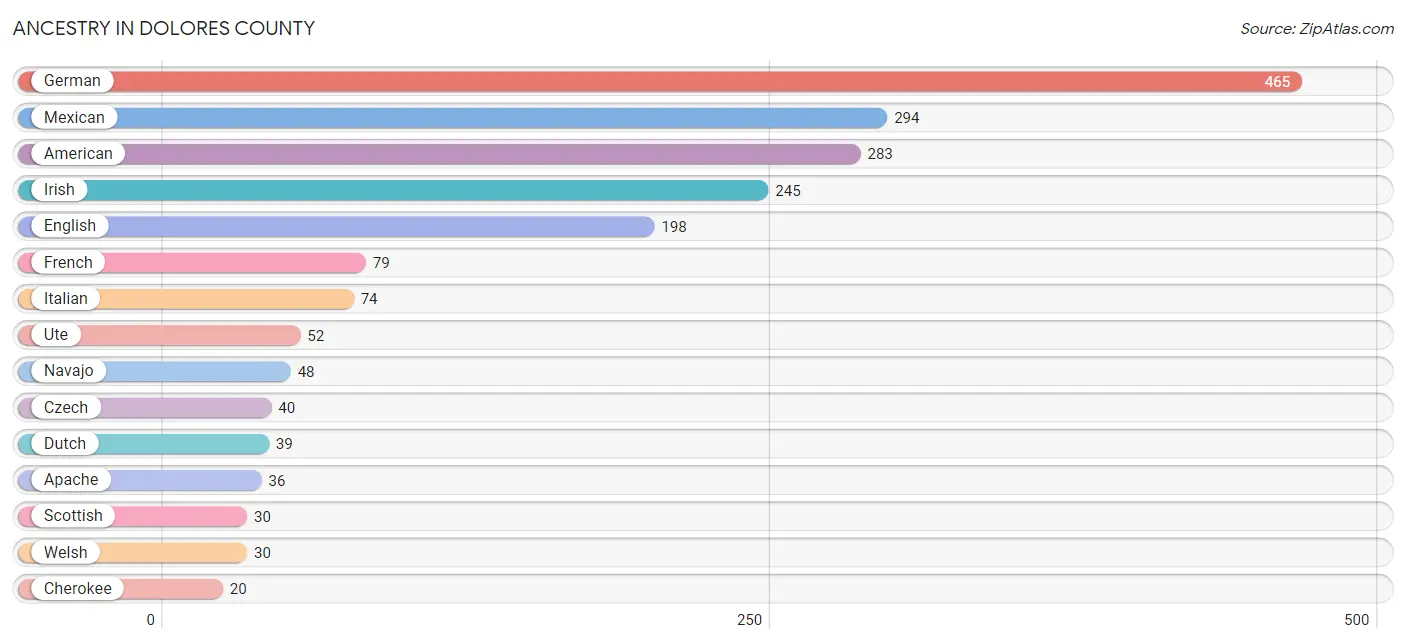
| Ancestry | # Population | % Population |
| American | 283 | 12.1% |
| Apache | 36 | 1.5% |
| Central American | 17 | 0.7% |
| Cherokee | 20 | 0.9% |
| Croatian | 3 | 0.1% |
| Czech | 40 | 1.7% |
| Dutch | 39 | 1.7% |
| Eastern European | 3 | 0.1% |
| English | 198 | 8.5% |
| French | 79 | 3.4% |
| German | 465 | 20.0% |
| Greek | 3 | 0.1% |
| Hungarian | 1 | 0.0% |
| Irish | 245 | 10.5% |
| Italian | 74 | 3.2% |
| Luxembourger | 9 | 0.4% |
| Mexican | 294 | 12.6% |
| Navajo | 48 | 2.1% |
| Norwegian | 7 | 0.3% |
| Polish | 8 | 0.3% |
| Portuguese | 9 | 0.4% |
| Salvadoran | 17 | 0.7% |
| Samoan | 15 | 0.6% |
| Scandinavian | 20 | 0.9% |
| Scottish | 30 | 1.3% |
| South African | 8 | 0.3% |
| Spaniard | 8 | 0.3% |
| Subsaharan African | 8 | 0.3% |
| Ute | 52 | 2.2% |
| Welsh | 30 | 1.3% | View All 30 Rows |
Immigrants in Dolores County
The most numerous immigrant groups reported in Dolores County came from Central America (17 | 0.7%), El Salvador (17 | 0.7%), Latin America (17 | 0.7%), England (7 | 0.3%), and Europe (7 | 0.3%), together accounting for 2.8% of all Dolores County residents.

| Immigration Origin | # Population | % Population |
| Africa | 6 | 0.3% |
| Central America | 17 | 0.7% |
| El Salvador | 17 | 0.7% |
| England | 7 | 0.3% |
| Europe | 7 | 0.3% |
| Latin America | 17 | 0.7% |
| Northern Europe | 7 | 0.3% |
| South Africa | 6 | 0.3% | View All 8 Rows |
Sex and Age in Dolores County
Sex and Age in Dolores County
The most populous age groups in Dolores County are 60 to 64 Years (164 | 12.6%) for men and 65 to 69 Years (288 | 27.9%) for women.
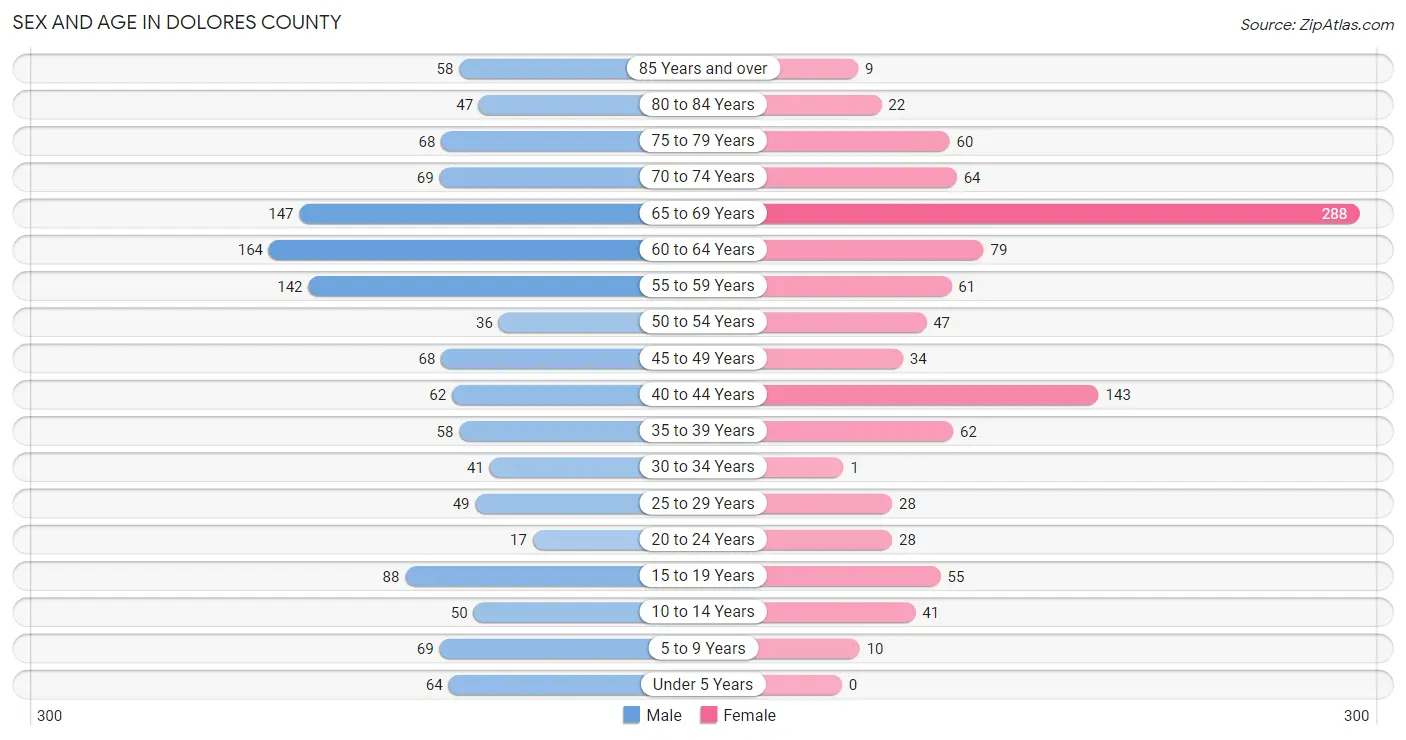
| Age Bracket | Male | Female |
| Under 5 Years | 64 (4.9%) | 0 (0.0%) |
| 5 to 9 Years | 69 (5.3%) | 10 (1.0%) |
| 10 to 14 Years | 50 (3.9%) | 41 (4.0%) |
| 15 to 19 Years | 88 (6.8%) | 55 (5.3%) |
| 20 to 24 Years | 17 (1.3%) | 28 (2.7%) |
| 25 to 29 Years | 49 (3.8%) | 28 (2.7%) |
| 30 to 34 Years | 41 (3.2%) | 1 (0.1%) |
| 35 to 39 Years | 58 (4.5%) | 62 (6.0%) |
| 40 to 44 Years | 62 (4.8%) | 143 (13.9%) |
| 45 to 49 Years | 68 (5.2%) | 34 (3.3%) |
| 50 to 54 Years | 36 (2.8%) | 47 (4.5%) |
| 55 to 59 Years | 142 (11.0%) | 61 (5.9%) |
| 60 to 64 Years | 164 (12.6%) | 79 (7.7%) |
| 65 to 69 Years | 147 (11.3%) | 288 (27.9%) |
| 70 to 74 Years | 69 (5.3%) | 64 (6.2%) |
| 75 to 79 Years | 68 (5.2%) | 60 (5.8%) |
| 80 to 84 Years | 47 (3.6%) | 22 (2.1%) |
| 85 Years and over | 58 (4.5%) | 9 (0.9%) |
| Total | 1,297 (100.0%) | 1,032 (100.0%) |
Families and Households in Dolores County
Median Family Size in Dolores County
The median family size in Dolores County is 2.35 persons per family, with single male/father families (57 | 7.1%) accounting for the largest median family size of 3.91 persons per family. On the other hand, married-couple families (661 | 81.9%) represent the smallest median family size with 2.23 persons per family.

| Family Type | # Families | Family Size |
| Married-Couple | 661 (81.9%) | 2.23 |
| Single Male/Father | 57 (7.1%) | 3.91 |
| Single Female/Mother | 89 (11.0%) | 2.27 |
| Total Families | 807 (100.0%) | 2.35 |
Median Household Size in Dolores County
The median household size in Dolores County is 1.97 persons per household, with single male/father households (57 | 4.8%) accounting for the largest median household size of 4.4 persons per household. non-family households (378 | 31.9%) represent the smallest median household size with 1.06 persons per household.

| Household Type | # Households | Household Size |
| Married-Couple | 661 (55.8%) | 2.23 |
| Single Male/Father | 57 (4.8%) | 4.40 |
| Single Female/Mother | 89 (7.5%) | 2.27 |
| Non-family | 378 (31.9%) | 1.06 |
| Total Households | 1,185 (100.0%) | 1.97 |
Household Size by Marriage Status in Dolores County
Out of a total of 1,185 households in Dolores County, 807 (68.1%) are family households, while 378 (31.9%) are nonfamily households. The most numerous type of family households are 2-person households, comprising 520, and the most common type of nonfamily households are 1-person households, comprising 359.

| Household Size | Family Households | Nonfamily Households |
| 1-Person Households | - | 359 (30.3%) |
| 2-Person Households | 520 (43.9%) | 11 (0.9%) |
| 3-Person Households | 139 (11.7%) | 0 (0.0%) |
| 4-Person Households | 137 (11.6%) | 8 (0.7%) |
| 5-Person Households | 0 (0.0%) | 0 (0.0%) |
| 6-Person Households | 0 (0.0%) | 0 (0.0%) |
| 7+ Person Households | 11 (0.9%) | 0 (0.0%) |
| Total | 807 (68.1%) | 378 (31.9%) |
Female Fertility in Dolores County
Fertility by Age in Dolores County
Average fertility rate in Dolores County is 37.0 births per 1,000 women. Women in the age bracket of 20 to 34 years have the highest fertility rate with 228.0 births per 1,000 women. Women in the age bracket of 20 to 34 years acount for 100.0% of all women with births.
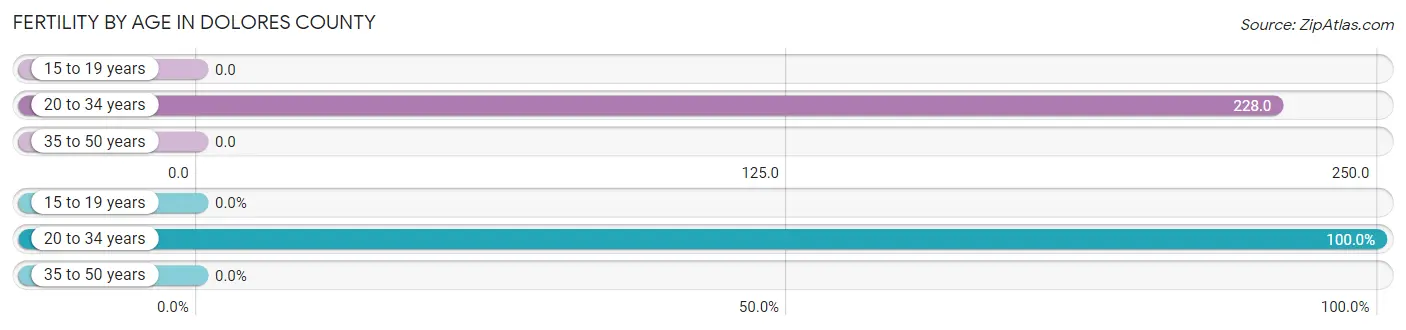
| Age Bracket | Women with Births | Births / 1,000 Women |
| 15 to 19 years | 0 (0.0%) | 0.0 |
| 20 to 34 years | 13 (100.0%) | 228.0 |
| 35 to 50 years | 0 (0.0%) | 0.0 |
| Total | 13 (100.0%) | 37.0 |
Fertility by Age by Marriage Status in Dolores County
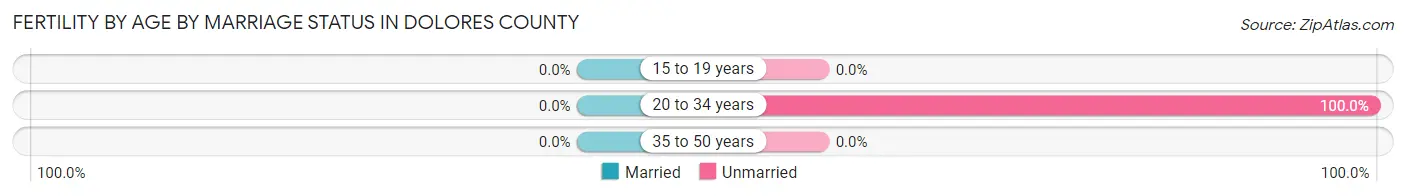
| Age Bracket | Married | Unmarried |
| 15 to 19 years | 0 (0.0%) | 0 (0.0%) |
| 20 to 34 years | 0 (0.0%) | 13 (100.0%) |
| 35 to 50 years | 0 (0.0%) | 0 (0.0%) |
| Total | 0 (0.0%) | 13 (100.0%) |
Fertility by Education in Dolores County
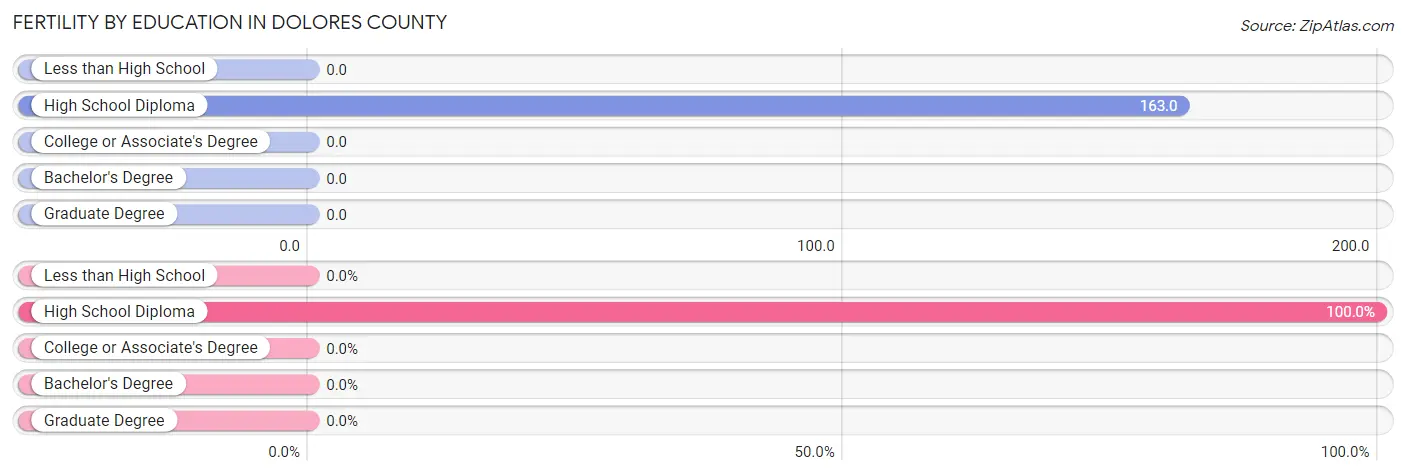
| Educational Attainment | Women with Births | Births / 1,000 Women |
| Less than High School | 0 (0.0%) | 0.0 |
| High School Diploma | 13 (100.0%) | 163.0 |
| College or Associate's Degree | 0 (0.0%) | 0.0 |
| Bachelor's Degree | 0 (0.0%) | 0.0 |
| Graduate Degree | 0 (0.0%) | 0.0 |
| Total | 13 (100.0%) | 37.0 |
Fertility by Education by Marriage Status in Dolores County
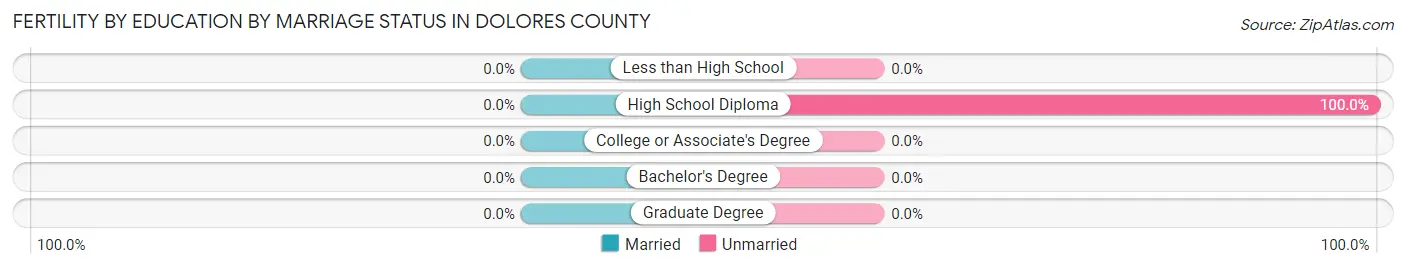
| Educational Attainment | Married | Unmarried |
| Less than High School | 0 (0.0%) | 0 (0.0%) |
| High School Diploma | 0 (0.0%) | 13 (100.0%) |
| College or Associate's Degree | 0 (0.0%) | 0 (0.0%) |
| Bachelor's Degree | 0 (0.0%) | 0 (0.0%) |
| Graduate Degree | 0 (0.0%) | 0 (0.0%) |
| Total | 0 (0.0%) | 13 (100.0%) |
Employment Characteristics in Dolores County
Employment by Class of Employer in Dolores County
Among the 1,043 employed individuals in Dolores County, local government employees (411 | 39.4%), private company employees (387 | 37.1%), and self-employed (not incorporated) (114 | 10.9%) make up the most common classes of employment.
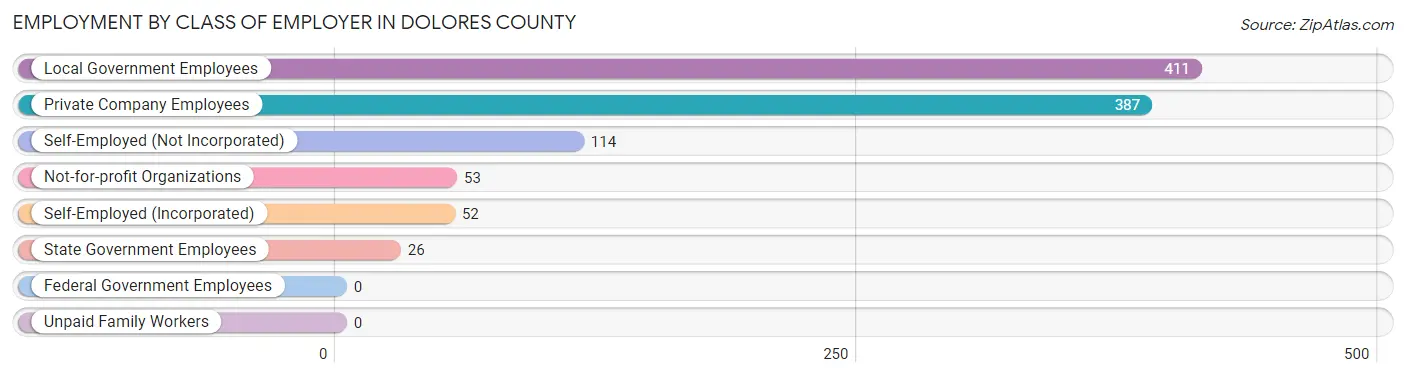
| Employer Class | # Employees | % Employees |
| Private Company Employees | 387 | 37.1% |
| Self-Employed (Incorporated) | 52 | 5.0% |
| Self-Employed (Not Incorporated) | 114 | 10.9% |
| Not-for-profit Organizations | 53 | 5.1% |
| Local Government Employees | 411 | 39.4% |
| State Government Employees | 26 | 2.5% |
| Federal Government Employees | 0 | 0.0% |
| Unpaid Family Workers | 0 | 0.0% |
| Total | 1,043 | 100.0% |
Employment Status by Age in Dolores County
According to the labor force statistics for Dolores County, out of the total population over 16 years of age (2,080), 53.2% or 1,107 individuals are in the labor force, with 3.1% or 34 of them unemployed. The age group with the highest labor force participation rate is 30 to 34 years, with 100.0% or 42 individuals in the labor force. Within the labor force, the 16 to 19 years age range has the highest percentage of unemployed individuals, with 57.1% or 16 of them being unemployed.
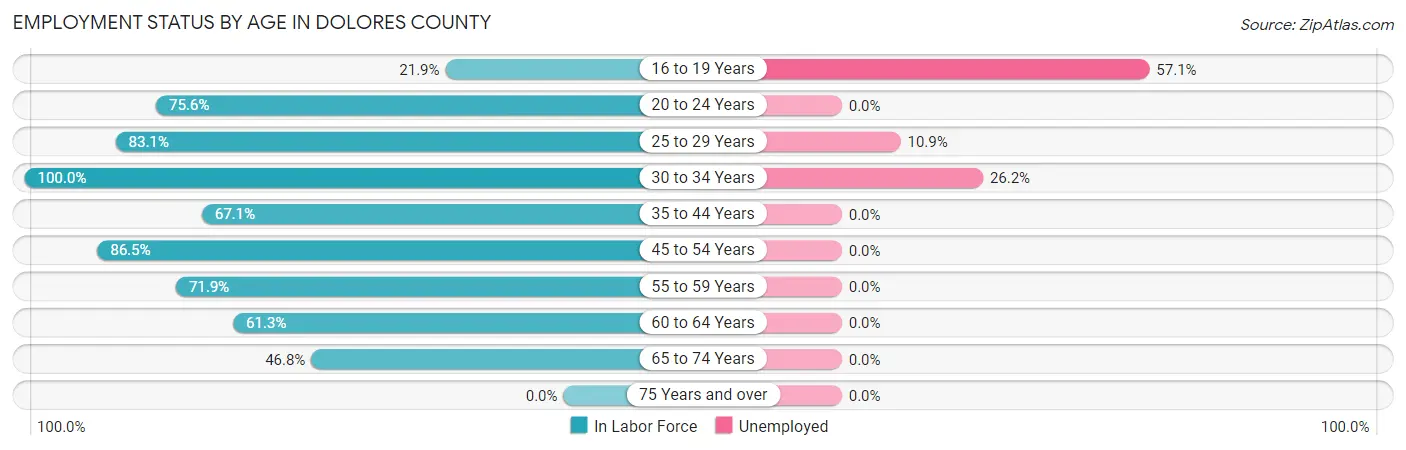
| Age Bracket | In Labor Force | Unemployed |
| 16 to 19 Years | 28 (21.9%) | 16 (57.1%) |
| 20 to 24 Years | 34 (75.6%) | 0 (0.0%) |
| 25 to 29 Years | 64 (83.1%) | 7 (10.9%) |
| 30 to 34 Years | 42 (100.0%) | 11 (26.2%) |
| 35 to 44 Years | 218 (67.1%) | 0 (0.0%) |
| 45 to 54 Years | 160 (86.5%) | 0 (0.0%) |
| 55 to 59 Years | 146 (71.9%) | 0 (0.0%) |
| 60 to 64 Years | 149 (61.3%) | 0 (0.0%) |
| 65 to 74 Years | 266 (46.8%) | 0 (0.0%) |
| 75 Years and over | 0 (0.0%) | 0 (0.0%) |
| Total | 1,107 (53.2%) | 34 (3.1%) |
Employment Status by Educational Attainment in Dolores County
According to labor force statistics for Dolores County, 72.5% of individuals (779) out of the total population between 25 and 64 years of age (1,075) are in the labor force, with 2.3% or 18 of them being unemployed. The group with the highest labor force participation rate are those with the educational attainment of less than high school, with 100.0% or 19 individuals in the labor force. Within the labor force, individuals with high school diploma education have the highest percentage of unemployment, with 4.6% or 11 of them being unemployed.
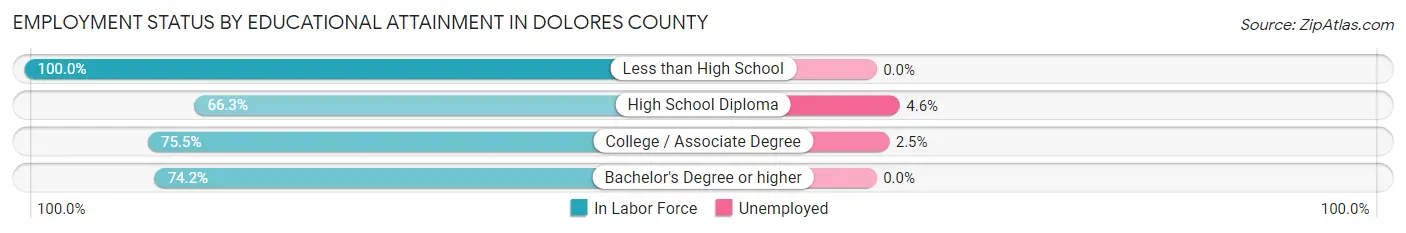
| Educational Attainment | In Labor Force | Unemployed |
| Less than High School | 19 (100.0%) | 0 (0.0%) |
| High School Diploma | 240 (66.3%) | 17 (4.6%) |
| College / Associate Degree | 281 (75.5%) | 9 (2.5%) |
| Bachelor's Degree or higher | 239 (74.2%) | 0 (0.0%) |
| Total | 779 (72.5%) | 25 (2.3%) |
Employment Occupations by Sex in Dolores County
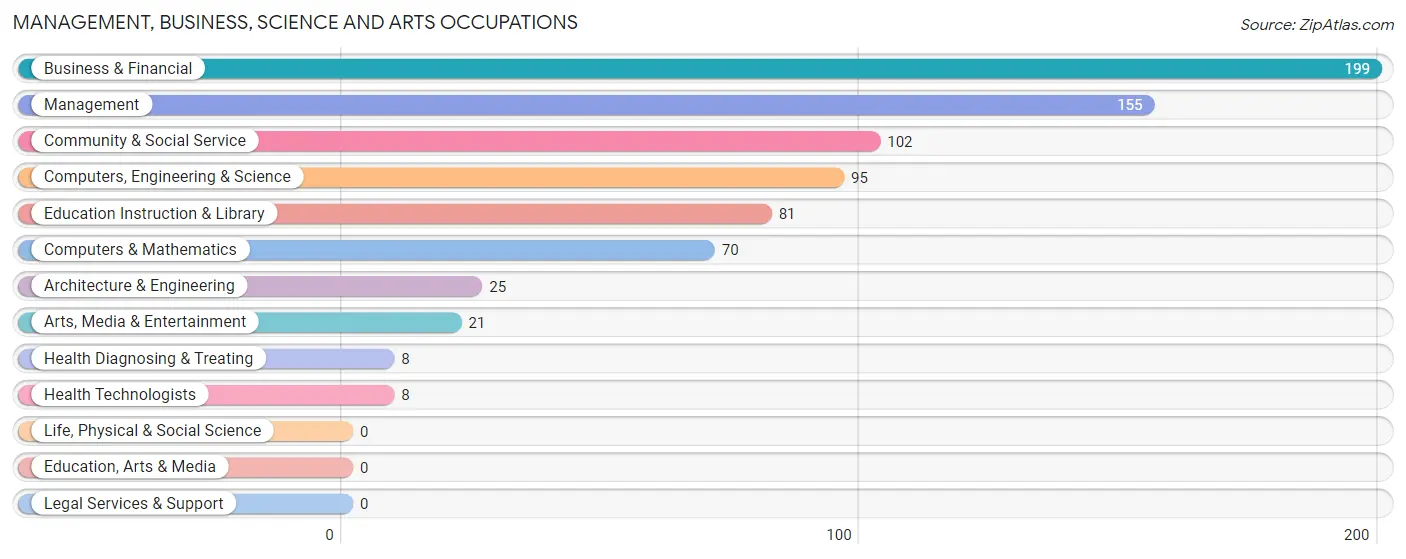
Management, Business, Science and Arts Occupations
The most common Management, Business, Science and Arts occupations in Dolores County are Business & Financial (199 | 18.5%), Management (155 | 14.4%), Community & Social Service (102 | 9.5%), Computers, Engineering & Science (95 | 8.8%), and Education Instruction & Library (81 | 7.5%).
Management, Business, Science and Arts Occupations by Sex
Within the Management, Business, Science and Arts occupations in Dolores County, the most male-oriented occupations are Architecture & Engineering (100.0%), Computers, Engineering & Science (65.3%), and Computers & Mathematics (52.9%), while the most female-oriented occupations are Health Diagnosing & Treating (100.0%), Health Technologists (100.0%), and Management (93.5%).
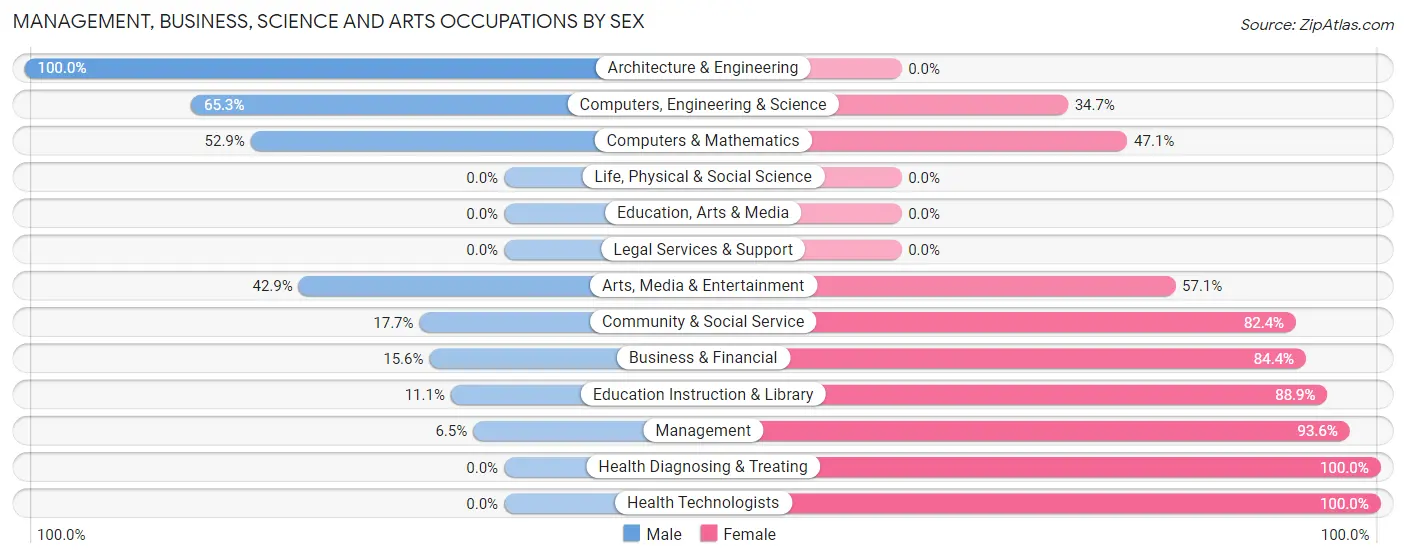
| Occupation | Male | Female |
| Management | 10 (6.5%) | 145 (93.5%) |
| Business & Financial | 31 (15.6%) | 168 (84.4%) |
| Computers, Engineering & Science | 62 (65.3%) | 33 (34.7%) |
| Computers & Mathematics | 37 (52.9%) | 33 (47.1%) |
| Architecture & Engineering | 25 (100.0%) | 0 (0.0%) |
| Life, Physical & Social Science | 0 (0.0%) | 0 (0.0%) |
| Community & Social Service | 18 (17.6%) | 84 (82.4%) |
| Education, Arts & Media | 0 (0.0%) | 0 (0.0%) |
| Legal Services & Support | 0 (0.0%) | 0 (0.0%) |
| Education Instruction & Library | 9 (11.1%) | 72 (88.9%) |
| Arts, Media & Entertainment | 9 (42.9%) | 12 (57.1%) |
| Health Diagnosing & Treating | 0 (0.0%) | 8 (100.0%) |
| Health Technologists | 0 (0.0%) | 8 (100.0%) |
| Total (Category) | 121 (21.6%) | 438 (78.3%) |
| Total (Overall) | 496 (46.2%) | 577 (53.8%) |
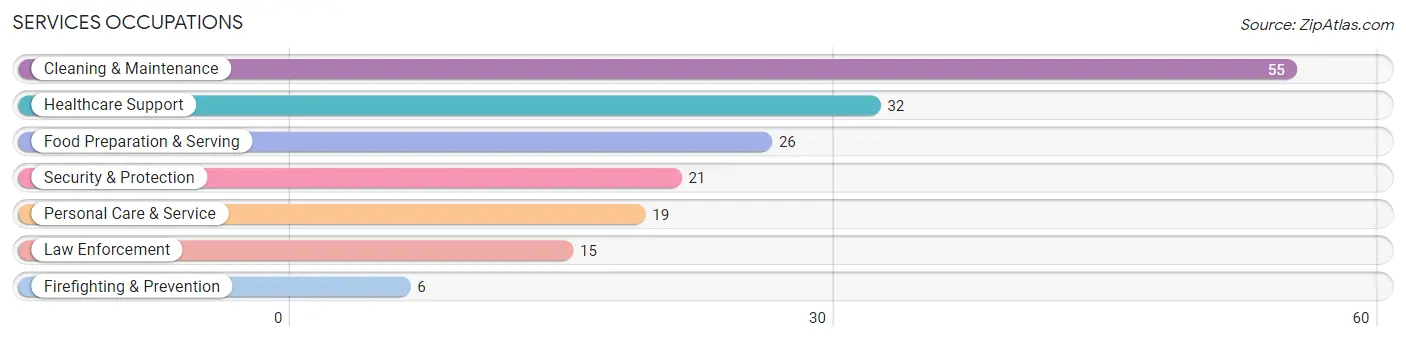
Services Occupations
The most common Services occupations in Dolores County are Cleaning & Maintenance (55 | 5.1%), Healthcare Support (32 | 3.0%), Food Preparation & Serving (26 | 2.4%), Security & Protection (21 | 2.0%), and Personal Care & Service (19 | 1.8%).
Services Occupations by Sex
Within the Services occupations in Dolores County, the most male-oriented occupations are Security & Protection (100.0%), Firefighting & Prevention (100.0%), and Law Enforcement (100.0%), while the most female-oriented occupations are Cleaning & Maintenance (43.6%), Personal Care & Service (42.1%), and Food Preparation & Serving (30.8%).
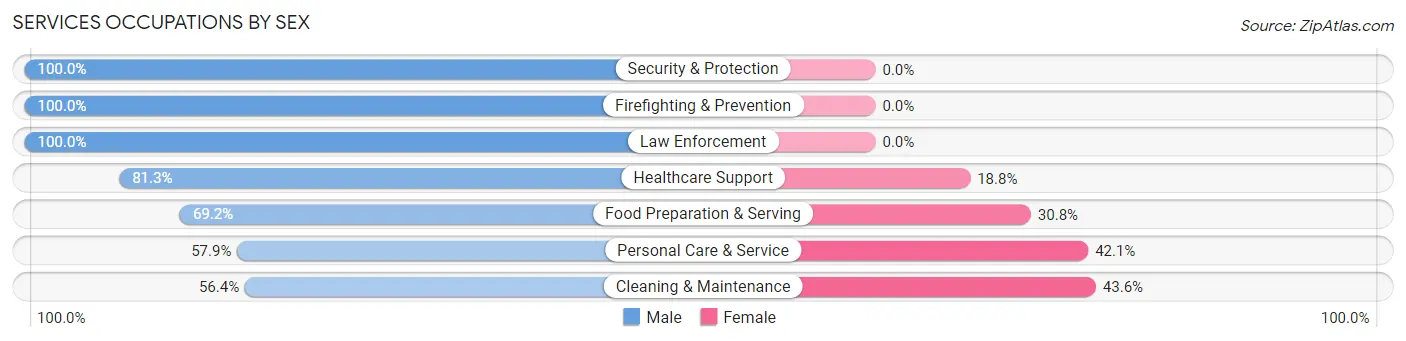
| Occupation | Male | Female |
| Healthcare Support | 26 (81.2%) | 6 (18.8%) |
| Security & Protection | 21 (100.0%) | 0 (0.0%) |
| Firefighting & Prevention | 6 (100.0%) | 0 (0.0%) |
| Law Enforcement | 15 (100.0%) | 0 (0.0%) |
| Food Preparation & Serving | 18 (69.2%) | 8 (30.8%) |
| Cleaning & Maintenance | 31 (56.4%) | 24 (43.6%) |
| Personal Care & Service | 11 (57.9%) | 8 (42.1%) |
| Total (Category) | 107 (69.9%) | 46 (30.1%) |
| Total (Overall) | 496 (46.2%) | 577 (53.8%) |
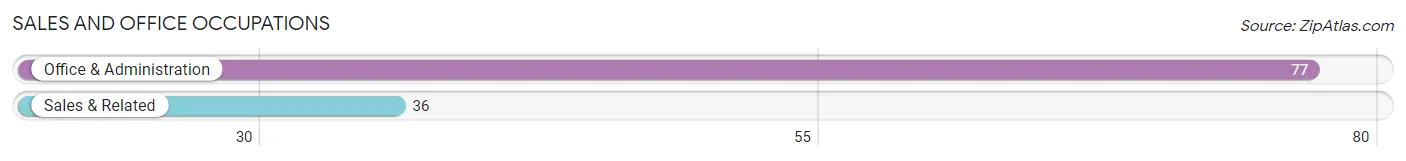
Sales and Office Occupations
The most common Sales and Office occupations in Dolores County are Office & Administration (77 | 7.2%), and Sales & Related (36 | 3.4%).
Sales and Office Occupations by Sex
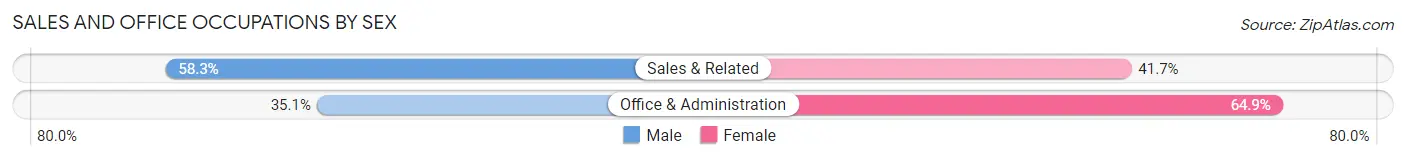
| Occupation | Male | Female |
| Sales & Related | 21 (58.3%) | 15 (41.7%) |
| Office & Administration | 27 (35.1%) | 50 (64.9%) |
| Total (Category) | 48 (42.5%) | 65 (57.5%) |
| Total (Overall) | 496 (46.2%) | 577 (53.8%) |
Natural Resources, Construction and Maintenance Occupations
The most common Natural Resources, Construction and Maintenance occupations in Dolores County are Construction & Extraction (114 | 10.6%), Installation, Maintenance & Repair (47 | 4.4%), and Farming, Fishing & Forestry (7 | 0.6%).
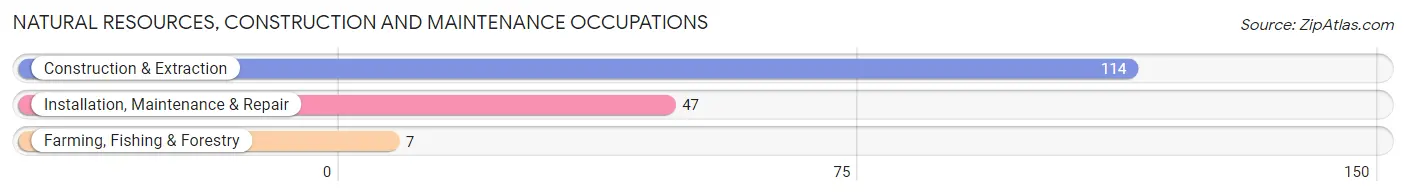
Natural Resources, Construction and Maintenance Occupations by Sex
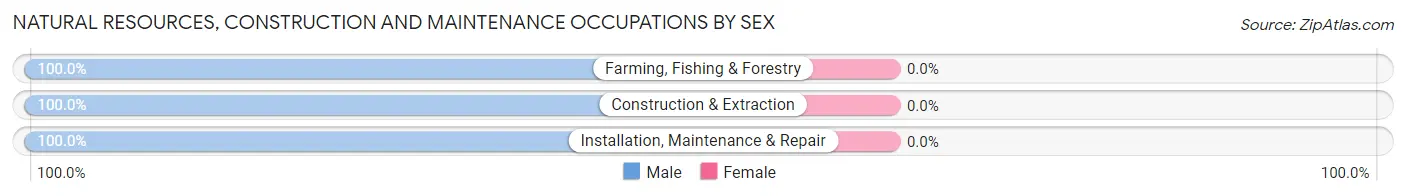
| Occupation | Male | Female |
| Farming, Fishing & Forestry | 7 (100.0%) | 0 (0.0%) |
| Construction & Extraction | 114 (100.0%) | 0 (0.0%) |
| Installation, Maintenance & Repair | 47 (100.0%) | 0 (0.0%) |
| Total (Category) | 168 (100.0%) | 0 (0.0%) |
| Total (Overall) | 496 (46.2%) | 577 (53.8%) |
Production, Transportation and Moving Occupations
The most common Production, Transportation and Moving occupations in Dolores County are Production (58 | 5.4%), and Transportation (22 | 2.1%).
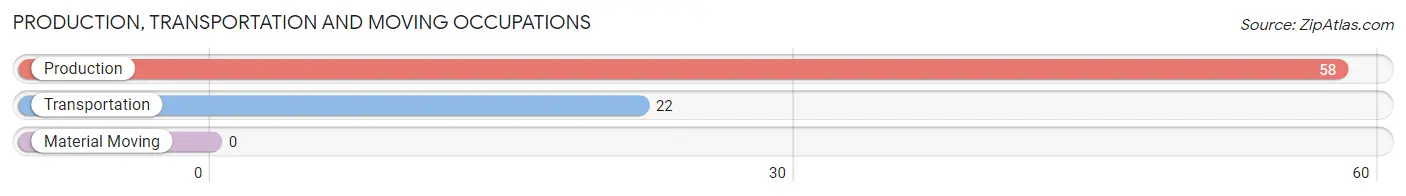
Production, Transportation and Moving Occupations by Sex
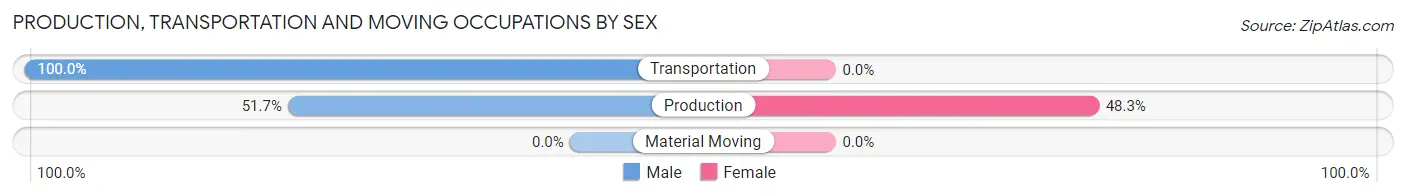
| Occupation | Male | Female |
| Production | 30 (51.7%) | 28 (48.3%) |
| Transportation | 22 (100.0%) | 0 (0.0%) |
| Material Moving | 0 (0.0%) | 0 (0.0%) |
| Total (Category) | 52 (65.0%) | 28 (35.0%) |
| Total (Overall) | 496 (46.2%) | 577 (53.8%) |
Employment Industries by Sex in Dolores County
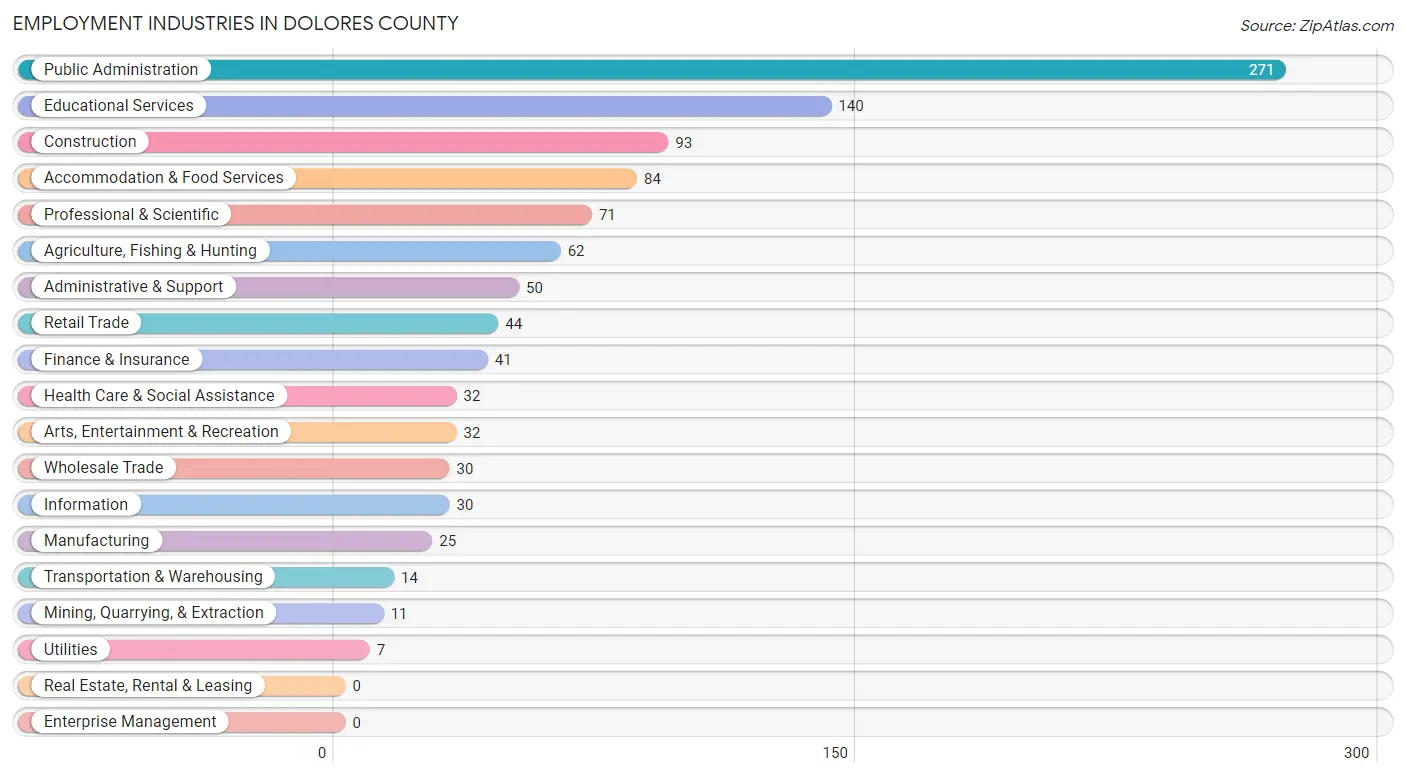
Employment Industries in Dolores County
The major employment industries in Dolores County include Public Administration (271 | 25.3%), Educational Services (140 | 13.1%), Construction (93 | 8.7%), Accommodation & Food Services (84 | 7.8%), and Professional & Scientific (71 | 6.6%).
Employment Industries by Sex in Dolores County
The Dolores County industries that see more men than women are Mining, Quarrying, & Extraction (100.0%), Construction (100.0%), and Wholesale Trade (100.0%), whereas the industries that tend to have a higher number of women are Finance & Insurance (100.0%), Agriculture, Fishing & Hunting (88.7%), and Educational Services (85.0%).
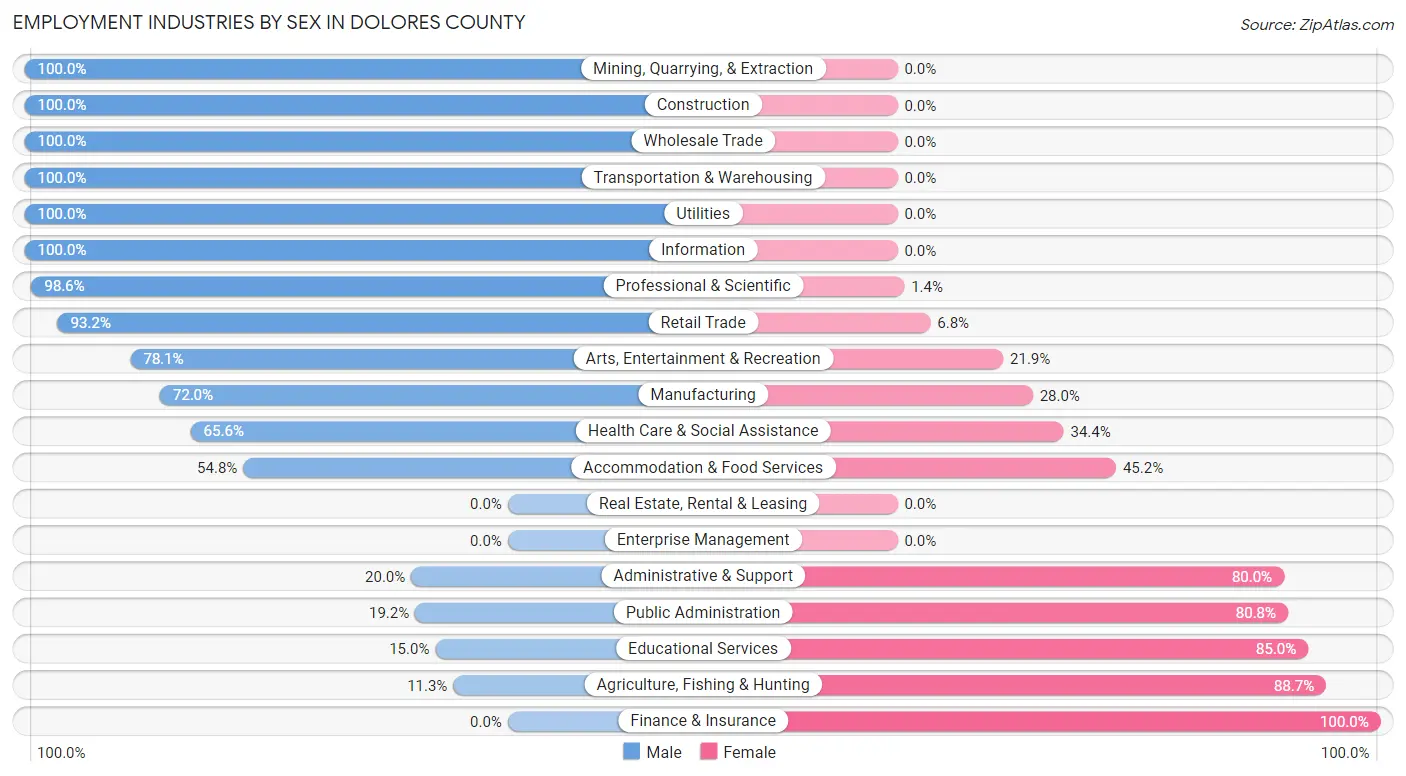
| Industry | Male | Female |
| Agriculture, Fishing & Hunting | 7 (11.3%) | 55 (88.7%) |
| Mining, Quarrying, & Extraction | 11 (100.0%) | 0 (0.0%) |
| Construction | 93 (100.0%) | 0 (0.0%) |
| Manufacturing | 18 (72.0%) | 7 (28.0%) |
| Wholesale Trade | 30 (100.0%) | 0 (0.0%) |
| Retail Trade | 41 (93.2%) | 3 (6.8%) |
| Transportation & Warehousing | 14 (100.0%) | 0 (0.0%) |
| Utilities | 7 (100.0%) | 0 (0.0%) |
| Information | 30 (100.0%) | 0 (0.0%) |
| Finance & Insurance | 0 (0.0%) | 41 (100.0%) |
| Real Estate, Rental & Leasing | 0 (0.0%) | 0 (0.0%) |
| Professional & Scientific | 70 (98.6%) | 1 (1.4%) |
| Enterprise Management | 0 (0.0%) | 0 (0.0%) |
| Administrative & Support | 10 (20.0%) | 40 (80.0%) |
| Educational Services | 21 (15.0%) | 119 (85.0%) |
| Health Care & Social Assistance | 21 (65.6%) | 11 (34.4%) |
| Arts, Entertainment & Recreation | 25 (78.1%) | 7 (21.9%) |
| Accommodation & Food Services | 46 (54.8%) | 38 (45.2%) |
| Public Administration | 52 (19.2%) | 219 (80.8%) |
| Total | 496 (46.2%) | 577 (53.8%) |
Education in Dolores County
School Enrollment in Dolores County
The most common levels of schooling among the 365 students in Dolores County are high school (152 | 41.6%), elementary school (79 | 21.6%), and middle school (66 | 18.1%).
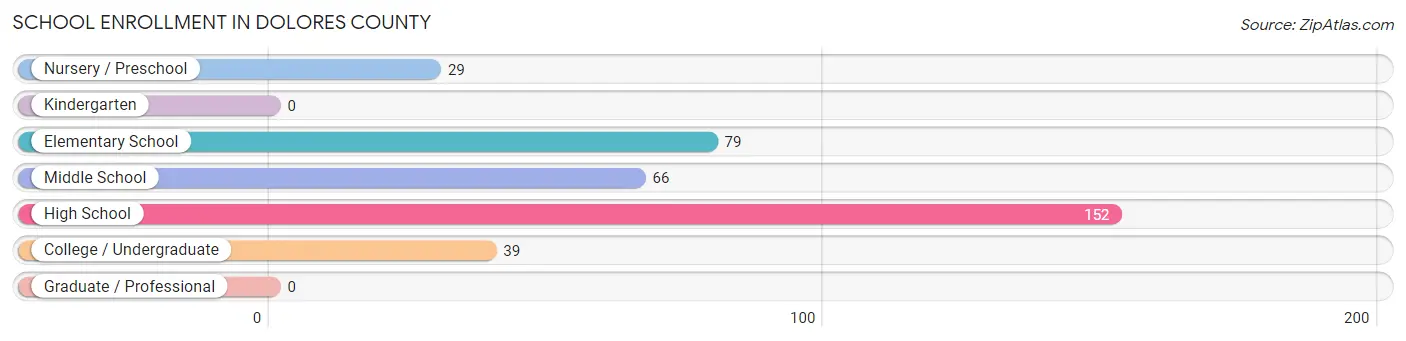
| School Level | # Students | % Students |
| Nursery / Preschool | 29 | 8.0% |
| Kindergarten | 0 | 0.0% |
| Elementary School | 79 | 21.6% |
| Middle School | 66 | 18.1% |
| High School | 152 | 41.6% |
| College / Undergraduate | 39 | 10.7% |
| Graduate / Professional | 0 | 0.0% |
| Total | 365 | 100.0% |
School Enrollment by Age by Funding Source in Dolores County
Out of a total of 365 students who are enrolled in schools in Dolores County, 57 (15.6%) attend a private institution, while the remaining 308 (84.4%) are enrolled in public schools. The age group of 5 to 9 year old has the highest likelihood of being enrolled in private schools, with 26 (32.9% in the age bracket) enrolled. Conversely, the age group of 3 to 4 year olds has the lowest likelihood of being enrolled in a private school, with 29 (100.0% in the age bracket) attending a public institution.
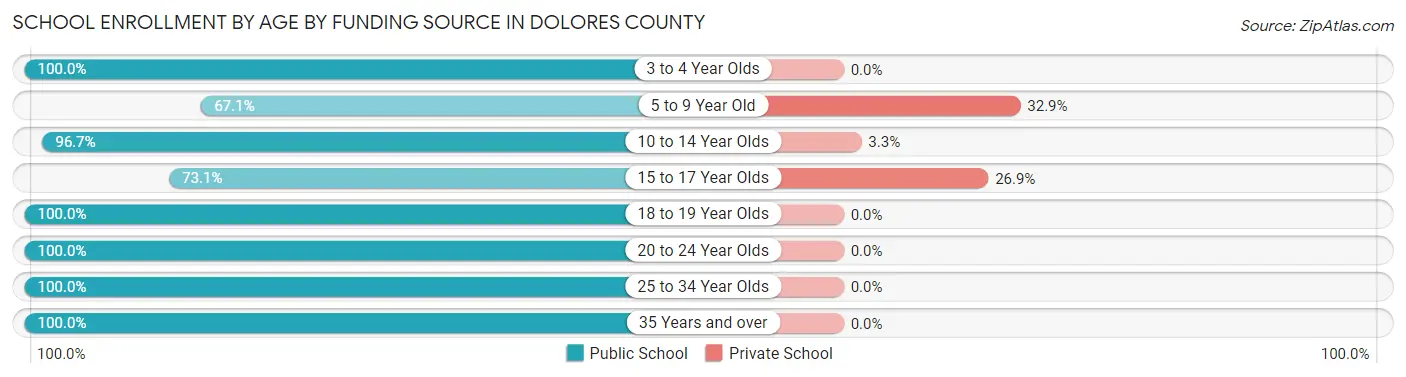
| Age Bracket | Public School | Private School |
| 3 to 4 Year Olds | 29 (100.0%) | 0 (0.0%) |
| 5 to 9 Year Old | 53 (67.1%) | 26 (32.9%) |
| 10 to 14 Year Olds | 88 (96.7%) | 3 (3.3%) |
| 15 to 17 Year Olds | 76 (73.1%) | 28 (26.9%) |
| 18 to 19 Year Olds | 23 (100.0%) | 0 (0.0%) |
| 20 to 24 Year Olds | 6 (100.0%) | 0 (0.0%) |
| 25 to 34 Year Olds | 7 (100.0%) | 0 (0.0%) |
| 35 Years and over | 26 (100.0%) | 0 (0.0%) |
| Total | 308 (84.4%) | 57 (15.6%) |
Educational Attainment by Field of Study in Dolores County
Education (113 | 21.4%), business (66 | 12.5%), bio, nature & agricultural (62 | 11.7%), social sciences (54 | 10.2%), and engineering (47 | 8.9%) are the most common fields of study among 528 individuals in Dolores County who have obtained a bachelor's degree or higher.
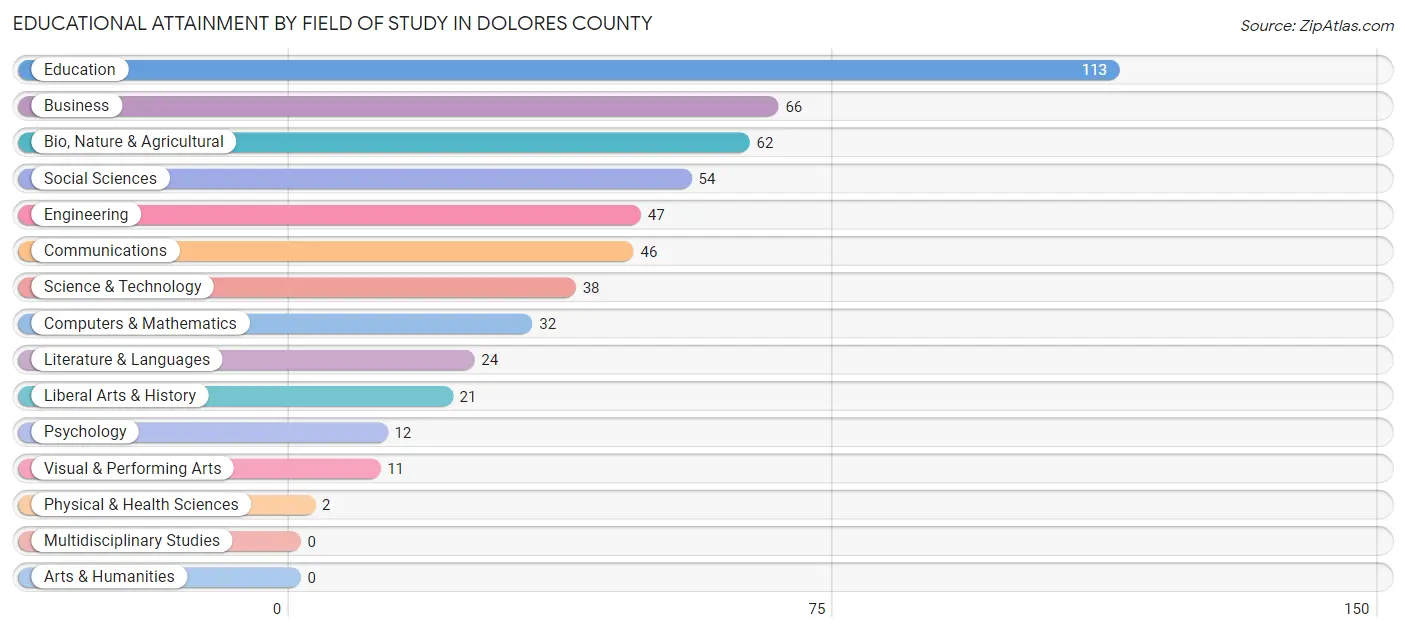
| Field of Study | # Graduates | % Graduates |
| Computers & Mathematics | 32 | 6.1% |
| Bio, Nature & Agricultural | 62 | 11.7% |
| Physical & Health Sciences | 2 | 0.4% |
| Psychology | 12 | 2.3% |
| Social Sciences | 54 | 10.2% |
| Engineering | 47 | 8.9% |
| Multidisciplinary Studies | 0 | 0.0% |
| Science & Technology | 38 | 7.2% |
| Business | 66 | 12.5% |
| Education | 113 | 21.4% |
| Literature & Languages | 24 | 4.5% |
| Liberal Arts & History | 21 | 4.0% |
| Visual & Performing Arts | 11 | 2.1% |
| Communications | 46 | 8.7% |
| Arts & Humanities | 0 | 0.0% |
| Total | 528 | 100.0% |
Transportation & Commute in Dolores County
Vehicle Availability by Sex in Dolores County
The most prevalent vehicle ownership categories in Dolores County are males with 2 vehicles (223, accounting for 46.7%) and females with 2 vehicles (170, making up 39.5%).
| Vehicles Available | Male | Female |
| No Vehicle | 0 (0.0%) | 0 (0.0%) |
| 1 Vehicle | 68 (14.2%) | 56 (9.9%) |
| 2 Vehicles | 223 (46.7%) | 170 (30.1%) |
| 3 Vehicles | 76 (15.9%) | 78 (13.8%) |
| 4 Vehicles | 31 (6.5%) | 219 (38.8%) |
| 5 or more Vehicles | 80 (16.7%) | 42 (7.4%) |
| Total | 478 (100.0%) | 565 (100.0%) |
Commute Time in Dolores County
The most frequently occuring commute durations in Dolores County are less than 5 minutes (195 commuters, 21.4%), 5 to 9 minutes (176 commuters, 19.3%), and 10 to 14 minutes (140 commuters, 15.3%).
| Commute Time | # Commuters | % Commuters |
| Less than 5 Minutes | 195 | 21.4% |
| 5 to 9 Minutes | 176 | 19.3% |
| 10 to 14 Minutes | 140 | 15.3% |
| 15 to 19 Minutes | 97 | 10.6% |
| 20 to 24 Minutes | 5 | 0.5% |
| 25 to 29 Minutes | 0 | 0.0% |
| 30 to 34 Minutes | 119 | 13.0% |
| 35 to 39 Minutes | 32 | 3.5% |
| 40 to 44 Minutes | 46 | 5.0% |
| 45 to 59 Minutes | 58 | 6.4% |
| 60 to 89 Minutes | 37 | 4.1% |
| 90 or more Minutes | 8 | 0.9% |
Commute Time by Sex in Dolores County
The most common commute times in Dolores County are 5 to 9 minutes (109 commuters, 28.0%) for males and less than 5 minutes (195 commuters, 37.2%) for females.
| Commute Time | Male | Female |
| Less than 5 Minutes | 0 (0.0%) | 195 (37.2%) |
| 5 to 9 Minutes | 109 (28.0%) | 67 (12.8%) |
| 10 to 14 Minutes | 37 (9.5%) | 103 (19.7%) |
| 15 to 19 Minutes | 55 (14.1%) | 42 (8.0%) |
| 20 to 24 Minutes | 5 (1.3%) | 0 (0.0%) |
| 25 to 29 Minutes | 0 (0.0%) | 0 (0.0%) |
| 30 to 34 Minutes | 77 (19.8%) | 42 (8.0%) |
| 35 to 39 Minutes | 18 (4.6%) | 14 (2.7%) |
| 40 to 44 Minutes | 23 (5.9%) | 23 (4.4%) |
| 45 to 59 Minutes | 28 (7.2%) | 30 (5.7%) |
| 60 to 89 Minutes | 37 (9.5%) | 0 (0.0%) |
| 90 or more Minutes | 0 (0.0%) | 8 (1.5%) |
Time of Departure to Work by Sex in Dolores County
The most frequent times of departure to work in Dolores County are 7:30 AM to 7:59 AM (122, 31.4%) for males and 8:30 AM to 8:59 AM (172, 32.8%) for females.
| Time of Departure | Male | Female |
| 12:00 AM to 4:59 AM | 28 (7.2%) | 7 (1.3%) |
| 5:00 AM to 5:29 AM | 0 (0.0%) | 45 (8.6%) |
| 5:30 AM to 5:59 AM | 46 (11.8%) | 17 (3.2%) |
| 6:00 AM to 6:29 AM | 8 (2.1%) | 0 (0.0%) |
| 6:30 AM to 6:59 AM | 43 (11.1%) | 47 (9.0%) |
| 7:00 AM to 7:29 AM | 63 (16.2%) | 38 (7.2%) |
| 7:30 AM to 7:59 AM | 122 (31.4%) | 40 (7.6%) |
| 8:00 AM to 8:29 AM | 39 (10.0%) | 98 (18.7%) |
| 8:30 AM to 8:59 AM | 0 (0.0%) | 172 (32.8%) |
| 9:00 AM to 9:59 AM | 0 (0.0%) | 0 (0.0%) |
| 10:00 AM to 10:59 AM | 0 (0.0%) | 36 (6.9%) |
| 11:00 AM to 11:59 AM | 0 (0.0%) | 0 (0.0%) |
| 12:00 PM to 3:59 PM | 36 (9.2%) | 0 (0.0%) |
| 4:00 PM to 11:59 PM | 4 (1.0%) | 24 (4.6%) |
| Total | 389 (100.0%) | 524 (100.0%) |
Housing Occupancy in Dolores County
Occupancy by Ownership in Dolores County
Of the total 1,185 dwellings in Dolores County, owner-occupied units account for 1,020 (86.1%), while renter-occupied units make up 165 (13.9%).
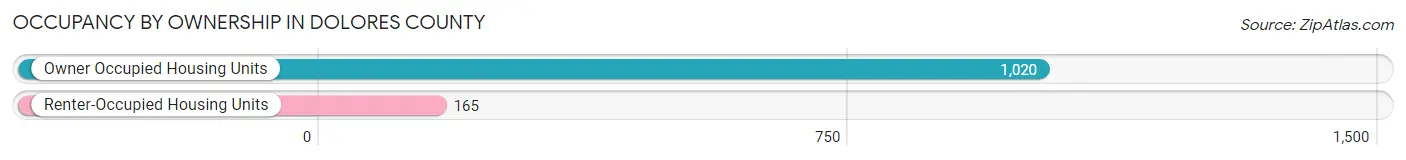
| Occupancy | # Housing Units | % Housing Units |
| Owner Occupied Housing Units | 1,020 | 86.1% |
| Renter-Occupied Housing Units | 165 | 13.9% |
| Total Occupied Housing Units | 1,185 | 100.0% |
Occupancy by Household Size in Dolores County
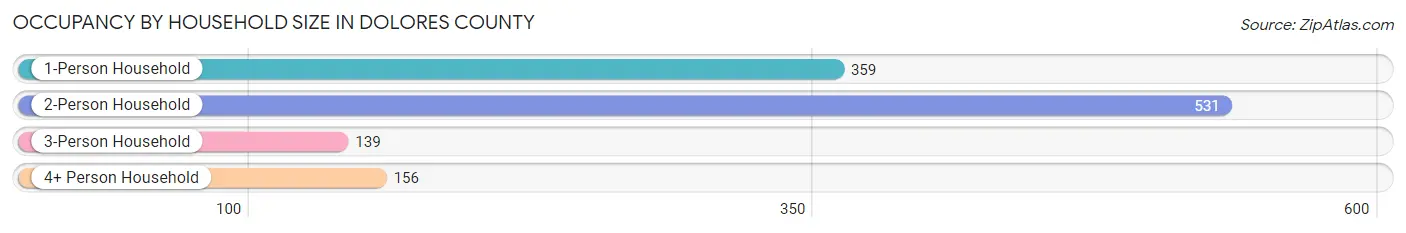
| Household Size | # Housing Units | % Housing Units |
| 1-Person Household | 359 | 30.3% |
| 2-Person Household | 531 | 44.8% |
| 3-Person Household | 139 | 11.7% |
| 4+ Person Household | 156 | 13.2% |
| Total Housing Units | 1,185 | 100.0% |
Occupancy by Ownership by Household Size in Dolores County
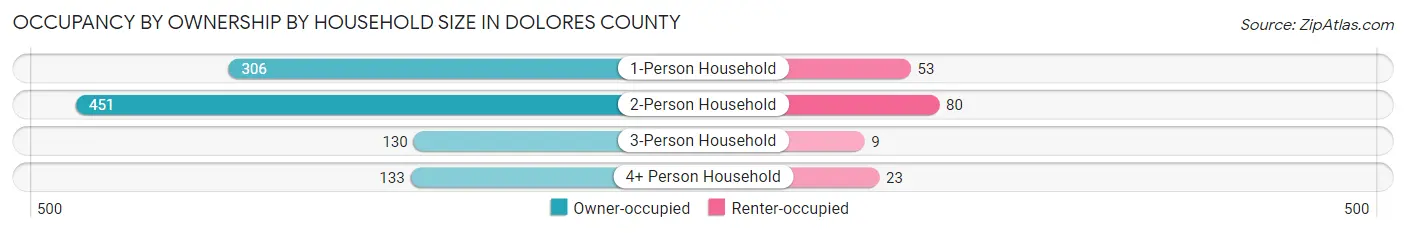
| Household Size | Owner-occupied | Renter-occupied |
| 1-Person Household | 306 (85.2%) | 53 (14.8%) |
| 2-Person Household | 451 (84.9%) | 80 (15.1%) |
| 3-Person Household | 130 (93.5%) | 9 (6.5%) |
| 4+ Person Household | 133 (85.3%) | 23 (14.7%) |
| Total Housing Units | 1,020 (86.1%) | 165 (13.9%) |
Occupancy by Educational Attainment in Dolores County
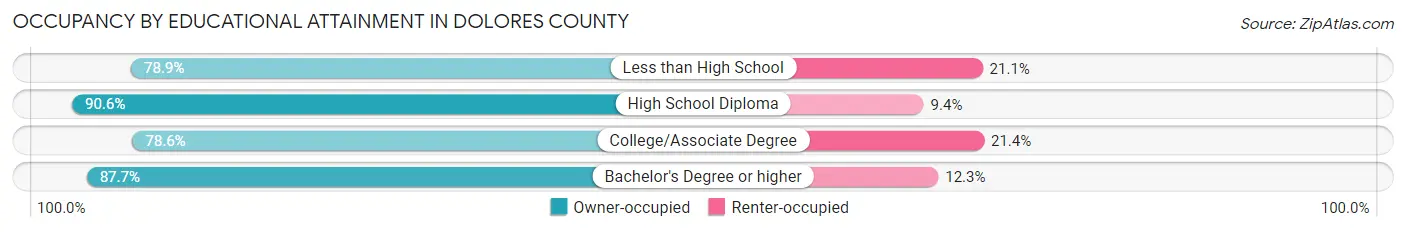
| Household Size | Owner-occupied | Renter-occupied |
| Less than High School | 71 (78.9%) | 19 (21.1%) |
| High School Diploma | 433 (90.6%) | 45 (9.4%) |
| College/Associate Degree | 217 (78.6%) | 59 (21.4%) |
| Bachelor's Degree or higher | 299 (87.7%) | 42 (12.3%) |
Occupancy by Age of Householder in Dolores County
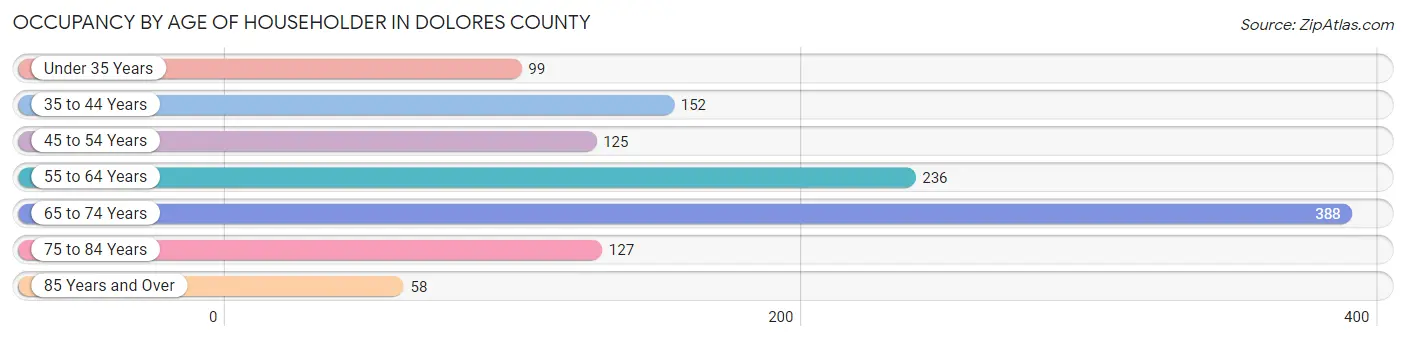
| Age Bracket | # Households | % Households |
| Under 35 Years | 99 | 8.4% |
| 35 to 44 Years | 152 | 12.8% |
| 45 to 54 Years | 125 | 10.5% |
| 55 to 64 Years | 236 | 19.9% |
| 65 to 74 Years | 388 | 32.7% |
| 75 to 84 Years | 127 | 10.7% |
| 85 Years and Over | 58 | 4.9% |
| Total | 1,185 | 100.0% |
Housing Finances in Dolores County
Median Income by Occupancy in Dolores County
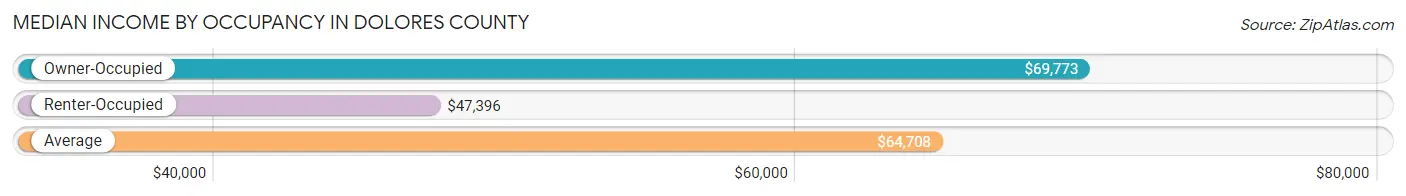
| Occupancy Type | # Households | Median Income |
| Owner-Occupied | 1,020 (86.1%) | $69,773 |
| Renter-Occupied | 165 (13.9%) | $47,396 |
| Average | 1,185 (100.0%) | $64,708 |
Occupancy by Householder Income Bracket in Dolores County

| Income Bracket | Owner-occupied | Renter-occupied |
| Less than $5,000 | 36 (3.5%) | 22 (13.3%) |
| $5,000 to $9,999 | 5 (0.5%) | 0 (0.0%) |
| $10,000 to $14,999 | 126 (12.3%) | 0 (0.0%) |
| $15,000 to $19,999 | 14 (1.4%) | 9 (5.4%) |
| $20,000 to $24,999 | 4 (0.4%) | 15 (9.1%) |
| $25,000 to $34,999 | 120 (11.8%) | 7 (4.2%) |
| $35,000 to $49,999 | 90 (8.8%) | 30 (18.2%) |
| $50,000 to $74,999 | 148 (14.5%) | 31 (18.8%) |
| $75,000 to $99,999 | 76 (7.4%) | 9 (5.4%) |
| $100,000 to $149,999 | 249 (24.4%) | 15 (9.1%) |
| $150,000 or more | 152 (14.9%) | 27 (16.4%) |
| Total | 1,020 (100.0%) | 165 (100.0%) |
Monthly Housing Cost Tiers in Dolores County
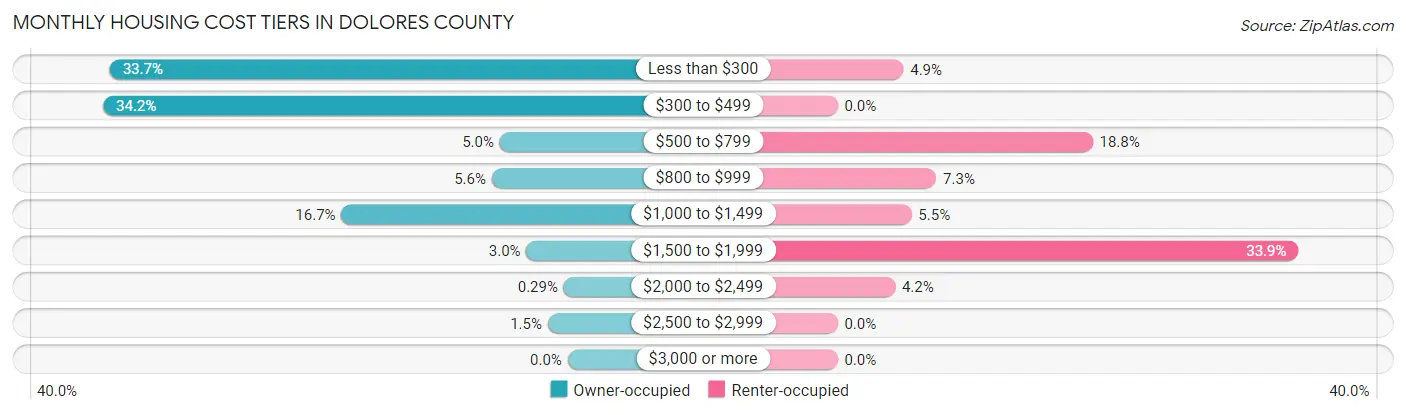
| Monthly Cost | Owner-occupied | Renter-occupied |
| Less than $300 | 344 (33.7%) | 8 (4.9%) |
| $300 to $499 | 349 (34.2%) | 0 (0.0%) |
| $500 to $799 | 51 (5.0%) | 31 (18.8%) |
| $800 to $999 | 57 (5.6%) | 12 (7.3%) |
| $1,000 to $1,499 | 170 (16.7%) | 9 (5.4%) |
| $1,500 to $1,999 | 31 (3.0%) | 56 (33.9%) |
| $2,000 to $2,499 | 3 (0.3%) | 7 (4.2%) |
| $2,500 to $2,999 | 15 (1.5%) | 0 (0.0%) |
| $3,000 or more | 0 (0.0%) | 0 (0.0%) |
| Total | 1,020 (100.0%) | 165 (100.0%) |
Physical Housing Characteristics in Dolores County
Housing Structures in Dolores County
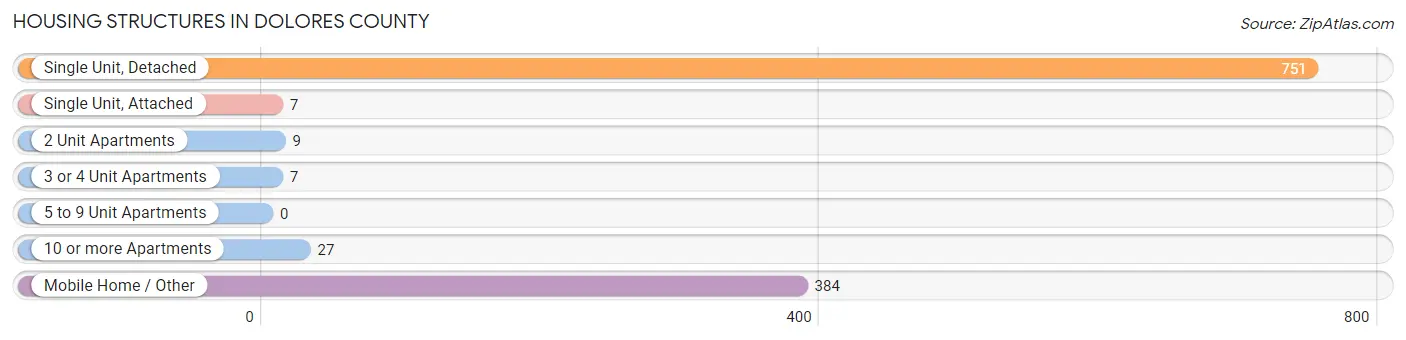
| Structure Type | # Housing Units | % Housing Units |
| Single Unit, Detached | 751 | 63.4% |
| Single Unit, Attached | 7 | 0.6% |
| 2 Unit Apartments | 9 | 0.8% |
| 3 or 4 Unit Apartments | 7 | 0.6% |
| 5 to 9 Unit Apartments | 0 | 0.0% |
| 10 or more Apartments | 27 | 2.3% |
| Mobile Home / Other | 384 | 32.4% |
| Total | 1,185 | 100.0% |
Housing Structures by Occupancy in Dolores County
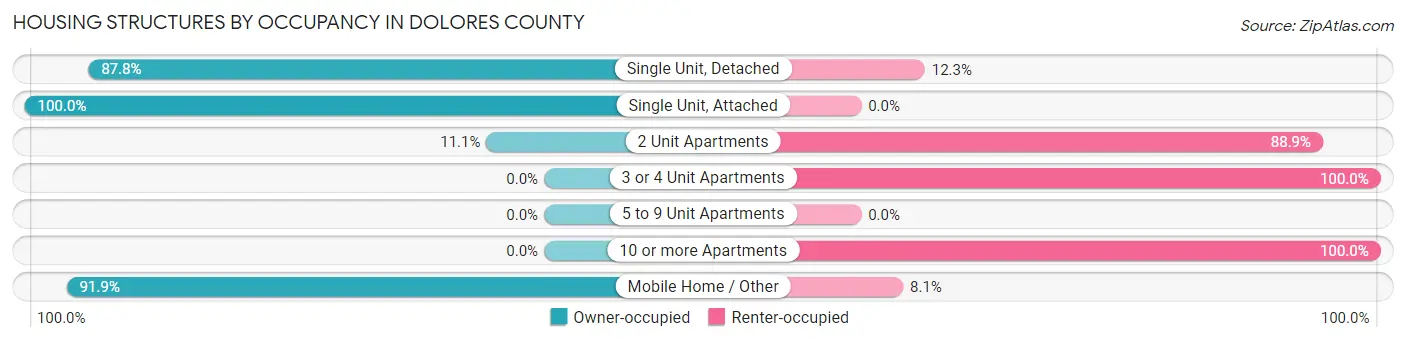
| Structure Type | Owner-occupied | Renter-occupied |
| Single Unit, Detached | 659 (87.7%) | 92 (12.2%) |
| Single Unit, Attached | 7 (100.0%) | 0 (0.0%) |
| 2 Unit Apartments | 1 (11.1%) | 8 (88.9%) |
| 3 or 4 Unit Apartments | 0 (0.0%) | 7 (100.0%) |
| 5 to 9 Unit Apartments | 0 (0.0%) | 0 (0.0%) |
| 10 or more Apartments | 0 (0.0%) | 27 (100.0%) |
| Mobile Home / Other | 353 (91.9%) | 31 (8.1%) |
| Total | 1,020 (86.1%) | 165 (13.9%) |
Housing Structures by Number of Rooms in Dolores County
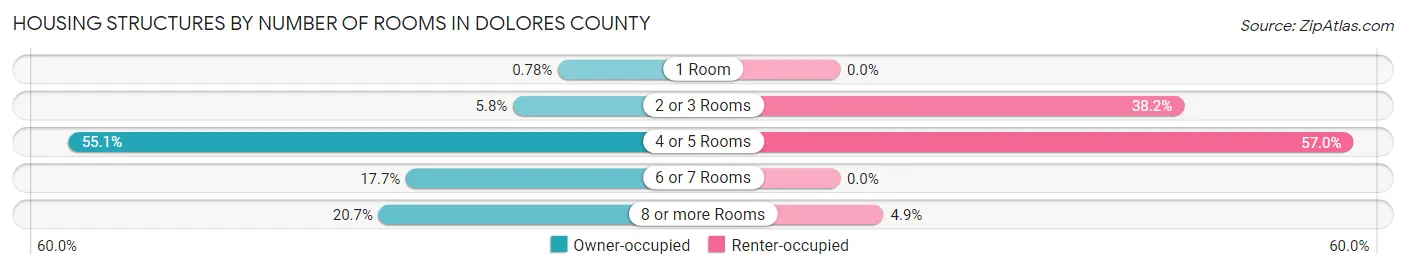
| Number of Rooms | Owner-occupied | Renter-occupied |
| 1 Room | 8 (0.8%) | 0 (0.0%) |
| 2 or 3 Rooms | 59 (5.8%) | 63 (38.2%) |
| 4 or 5 Rooms | 562 (55.1%) | 94 (57.0%) |
| 6 or 7 Rooms | 180 (17.6%) | 0 (0.0%) |
| 8 or more Rooms | 211 (20.7%) | 8 (4.9%) |
| Total | 1,020 (100.0%) | 165 (100.0%) |
Housing Structure by Heating Type in Dolores County
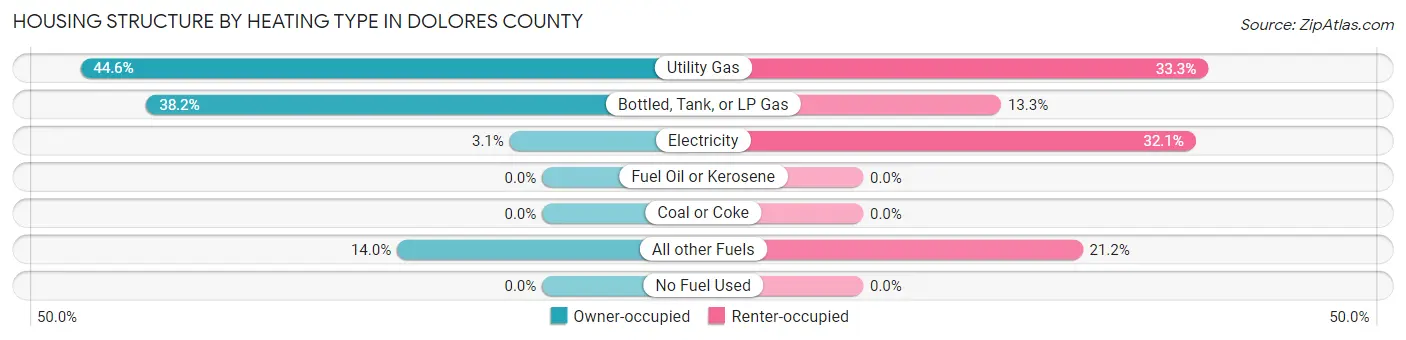
| Heating Type | Owner-occupied | Renter-occupied |
| Utility Gas | 455 (44.6%) | 55 (33.3%) |
| Bottled, Tank, or LP Gas | 390 (38.2%) | 22 (13.3%) |
| Electricity | 32 (3.1%) | 53 (32.1%) |
| Fuel Oil or Kerosene | 0 (0.0%) | 0 (0.0%) |
| Coal or Coke | 0 (0.0%) | 0 (0.0%) |
| All other Fuels | 143 (14.0%) | 35 (21.2%) |
| No Fuel Used | 0 (0.0%) | 0 (0.0%) |
| Total | 1,020 (100.0%) | 165 (100.0%) |
Household Vehicle Usage in Dolores County
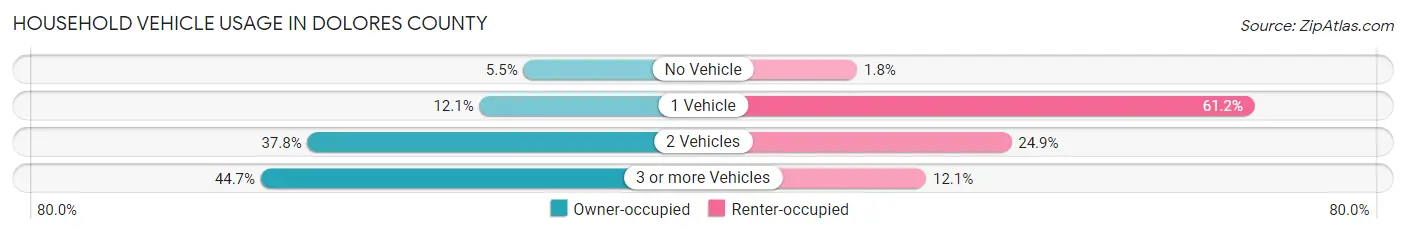
| Vehicles per Household | Owner-occupied | Renter-occupied |
| No Vehicle | 56 (5.5%) | 3 (1.8%) |
| 1 Vehicle | 123 (12.1%) | 101 (61.2%) |
| 2 Vehicles | 385 (37.8%) | 41 (24.8%) |
| 3 or more Vehicles | 456 (44.7%) | 20 (12.1%) |
| Total | 1,020 (100.0%) | 165 (100.0%) |
Real Estate & Mortgages in Dolores County
Real Estate and Mortgage Overview in Dolores County
| Characteristic | Without Mortgage | With Mortgage |
| Housing Units | 755 | 265 |
| Median Property Value | $214,300 | $190,600 |
| Median Household Income | $47,083 | $78 |
| Monthly Housing Costs | $345 | $0 |
| Real Estate Taxes | $373 | $0 |
Property Value by Mortgage Status in Dolores County
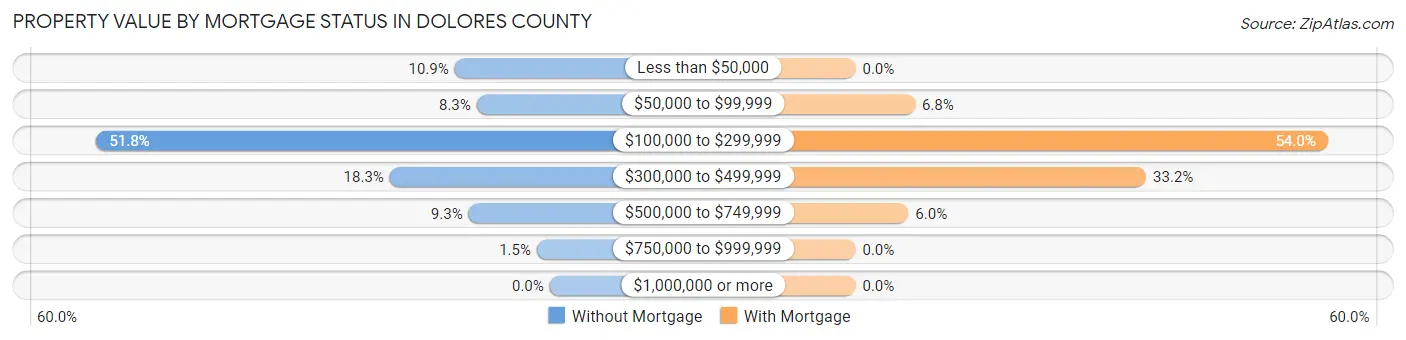
| Property Value | Without Mortgage | With Mortgage |
| Less than $50,000 | 82 (10.9%) | 0 (0.0%) |
| $50,000 to $99,999 | 63 (8.3%) | 18 (6.8%) |
| $100,000 to $299,999 | 391 (51.8%) | 143 (54.0%) |
| $300,000 to $499,999 | 138 (18.3%) | 88 (33.2%) |
| $500,000 to $749,999 | 70 (9.3%) | 16 (6.0%) |
| $750,000 to $999,999 | 11 (1.5%) | 0 (0.0%) |
| $1,000,000 or more | 0 (0.0%) | 0 (0.0%) |
| Total | 755 (100.0%) | 265 (100.0%) |
Household Income by Mortgage Status in Dolores County
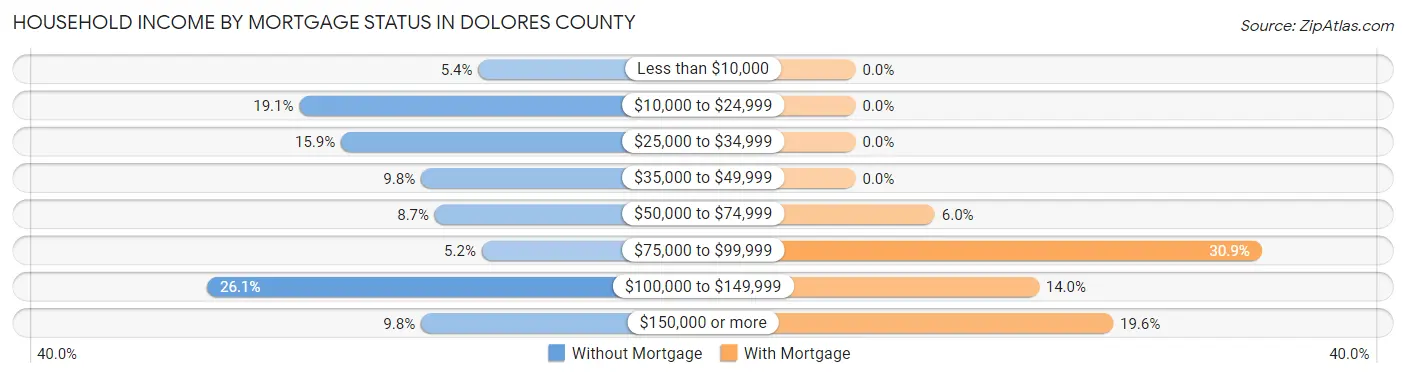
| Household Income | Without Mortgage | With Mortgage |
| Less than $10,000 | 41 (5.4%) | 0 (0.0%) |
| $10,000 to $24,999 | 144 (19.1%) | 0 (0.0%) |
| $25,000 to $34,999 | 120 (15.9%) | 0 (0.0%) |
| $35,000 to $49,999 | 74 (9.8%) | 0 (0.0%) |
| $50,000 to $74,999 | 66 (8.7%) | 16 (6.0%) |
| $75,000 to $99,999 | 39 (5.2%) | 82 (30.9%) |
| $100,000 to $149,999 | 197 (26.1%) | 37 (14.0%) |
| $150,000 or more | 74 (9.8%) | 52 (19.6%) |
| Total | 755 (100.0%) | 265 (100.0%) |
Property Value to Household Income Ratio in Dolores County
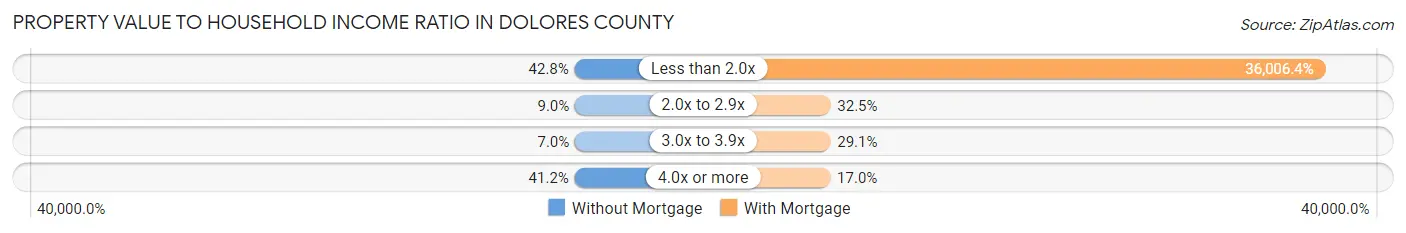
| Value-to-Income Ratio | Without Mortgage | With Mortgage |
| Less than 2.0x | 323 (42.8%) | 95,417 (36,006.4%) |
| 2.0x to 2.9x | 68 (9.0%) | 86 (32.5%) |
| 3.0x to 3.9x | 53 (7.0%) | 77 (29.1%) |
| 4.0x or more | 311 (41.2%) | 45 (17.0%) |
| Total | 755 (100.0%) | 265 (100.0%) |
Real Estate Taxes by Mortgage Status in Dolores County
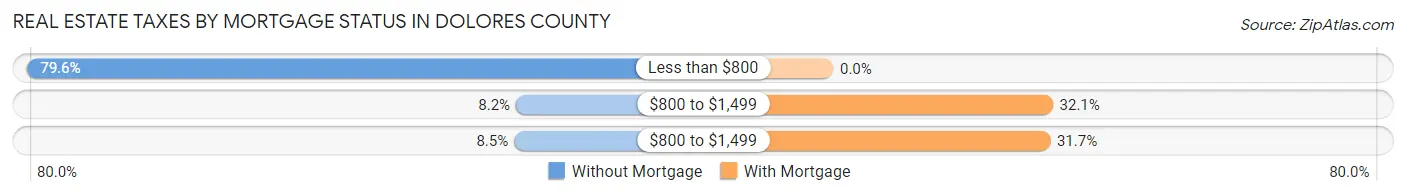
| Property Taxes | Without Mortgage | With Mortgage |
| Less than $800 | 601 (79.6%) | 0 (0.0%) |
| $800 to $1,499 | 62 (8.2%) | 85 (32.1%) |
| $800 to $1,499 | 64 (8.5%) | 84 (31.7%) |
| Total | 755 (100.0%) | 265 (100.0%) |
Health & Disability in Dolores County
Health Insurance Coverage by Age in Dolores County
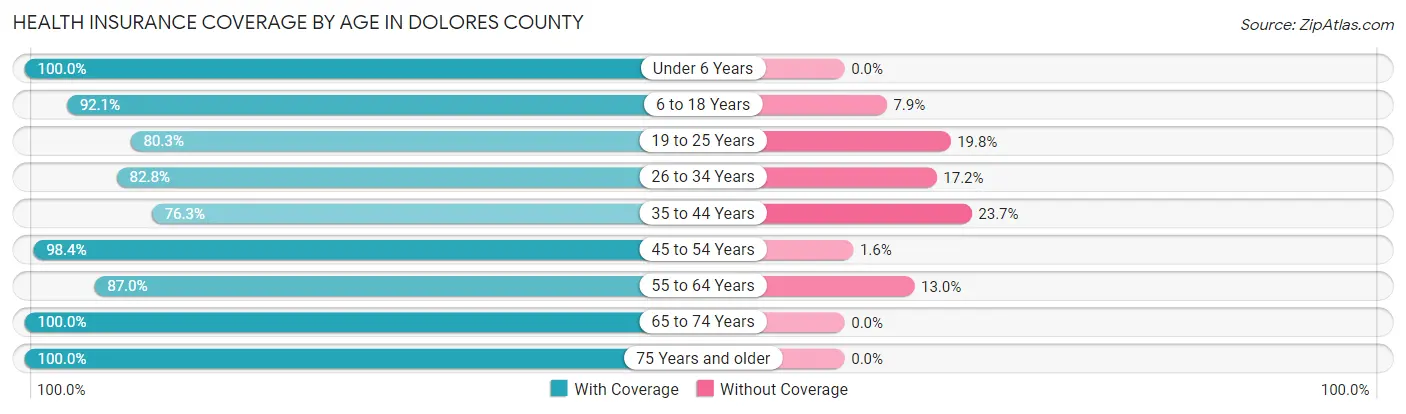
| Age Bracket | With Coverage | Without Coverage |
| Under 6 Years | 81 (100.0%) | 0 (0.0%) |
| 6 to 18 Years | 258 (92.1%) | 22 (7.9%) |
| 19 to 25 Years | 65 (80.2%) | 16 (19.8%) |
| 26 to 34 Years | 82 (82.8%) | 17 (17.2%) |
| 35 to 44 Years | 248 (76.3%) | 77 (23.7%) |
| 45 to 54 Years | 182 (98.4%) | 3 (1.6%) |
| 55 to 64 Years | 388 (87.0%) | 58 (13.0%) |
| 65 to 74 Years | 568 (100.0%) | 0 (0.0%) |
| 75 Years and older | 264 (100.0%) | 0 (0.0%) |
| Total | 2,136 (91.7%) | 193 (8.3%) |
Health Insurance Coverage by Citizenship Status in Dolores County
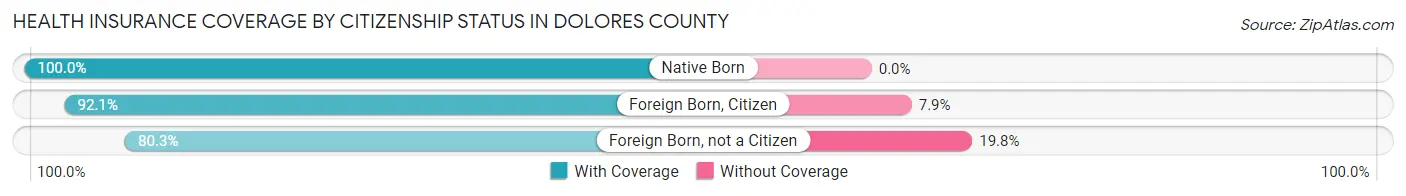
| Citizenship Status | With Coverage | Without Coverage |
| Native Born | 81 (100.0%) | 0 (0.0%) |
| Foreign Born, Citizen | 258 (92.1%) | 22 (7.9%) |
| Foreign Born, not a Citizen | 65 (80.2%) | 16 (19.8%) |
Health Insurance Coverage by Household Income in Dolores County
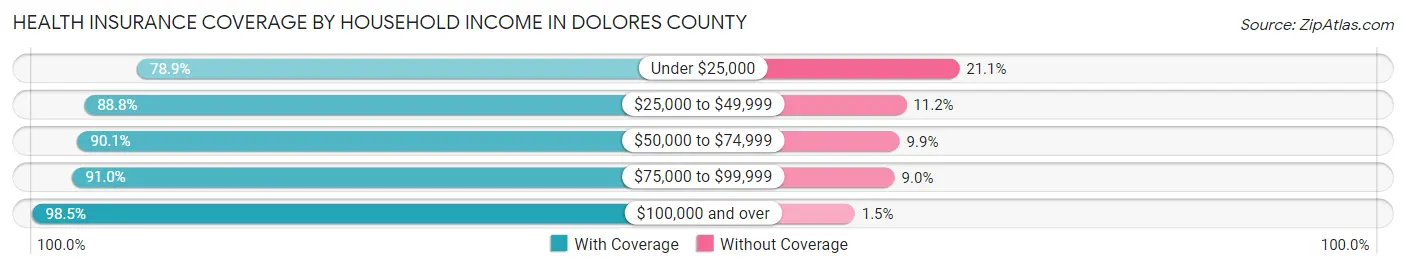
| Household Income | With Coverage | Without Coverage |
| Under $25,000 | 266 (78.9%) | 71 (21.1%) |
| $25,000 to $49,999 | 366 (88.8%) | 46 (11.2%) |
| $50,000 to $74,999 | 373 (90.1%) | 41 (9.9%) |
| $75,000 to $99,999 | 213 (91.0%) | 21 (9.0%) |
| $100,000 and over | 918 (98.5%) | 14 (1.5%) |
Public vs Private Health Insurance Coverage by Age in Dolores County
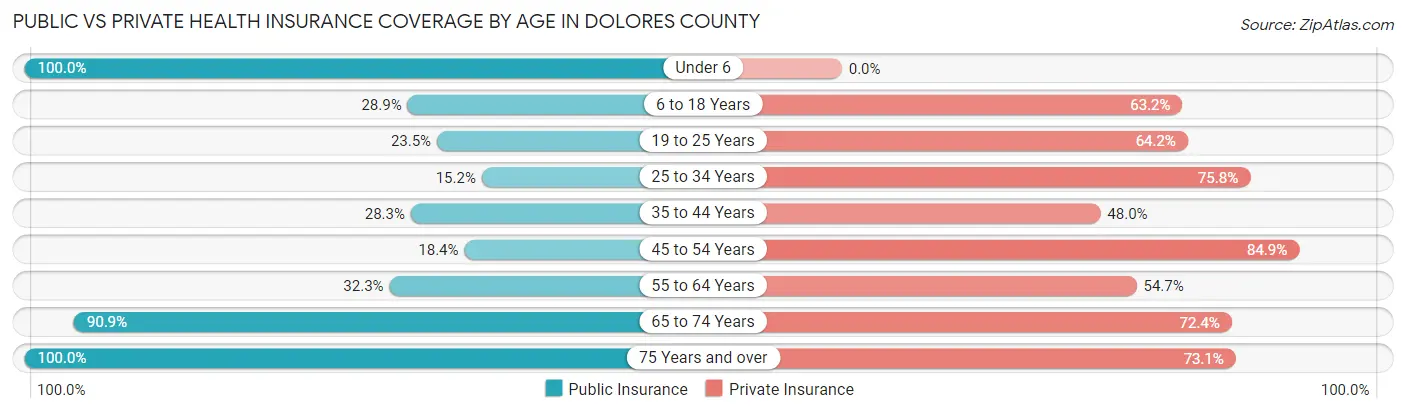
| Age Bracket | Public Insurance | Private Insurance |
| Under 6 | 81 (100.0%) | 0 (0.0%) |
| 6 to 18 Years | 81 (28.9%) | 177 (63.2%) |
| 19 to 25 Years | 19 (23.5%) | 52 (64.2%) |
| 25 to 34 Years | 15 (15.1%) | 75 (75.8%) |
| 35 to 44 Years | 92 (28.3%) | 156 (48.0%) |
| 45 to 54 Years | 34 (18.4%) | 157 (84.9%) |
| 55 to 64 Years | 144 (32.3%) | 244 (54.7%) |
| 65 to 74 Years | 516 (90.8%) | 411 (72.4%) |
| 75 Years and over | 264 (100.0%) | 193 (73.1%) |
| Total | 1,246 (53.5%) | 1,465 (62.9%) |
Disability Status by Sex by Age in Dolores County
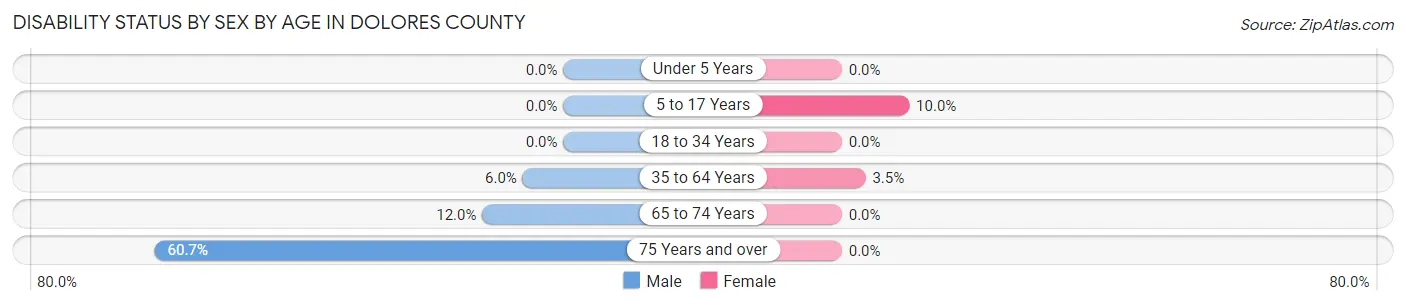
| Age Bracket | Male | Female |
| Under 5 Years | 0 (0.0%) | 0 (0.0%) |
| 5 to 17 Years | 0 (0.0%) | 9 (10.0%) |
| 18 to 34 Years | 0 (0.0%) | 0 (0.0%) |
| 35 to 64 Years | 32 (6.0%) | 15 (3.5%) |
| 65 to 74 Years | 26 (12.0%) | 0 (0.0%) |
| 75 Years and over | 105 (60.7%) | 0 (0.0%) |
Disability Class by Sex by Age in Dolores County
Disability Class: Hearing Difficulty
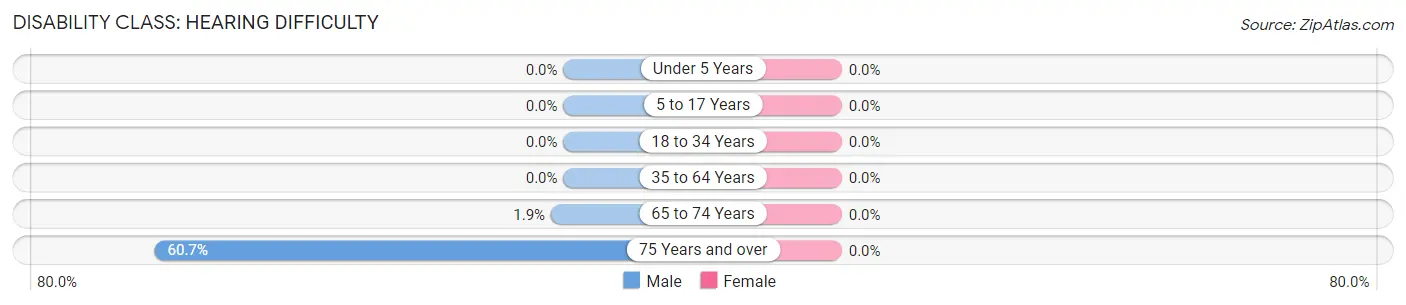
| Age Bracket | Male | Female |
| Under 5 Years | 0 (0.0%) | 0 (0.0%) |
| 5 to 17 Years | 0 (0.0%) | 0 (0.0%) |
| 18 to 34 Years | 0 (0.0%) | 0 (0.0%) |
| 35 to 64 Years | 0 (0.0%) | 0 (0.0%) |
| 65 to 74 Years | 4 (1.8%) | 0 (0.0%) |
| 75 Years and over | 105 (60.7%) | 0 (0.0%) |
Disability Class: Vision Difficulty
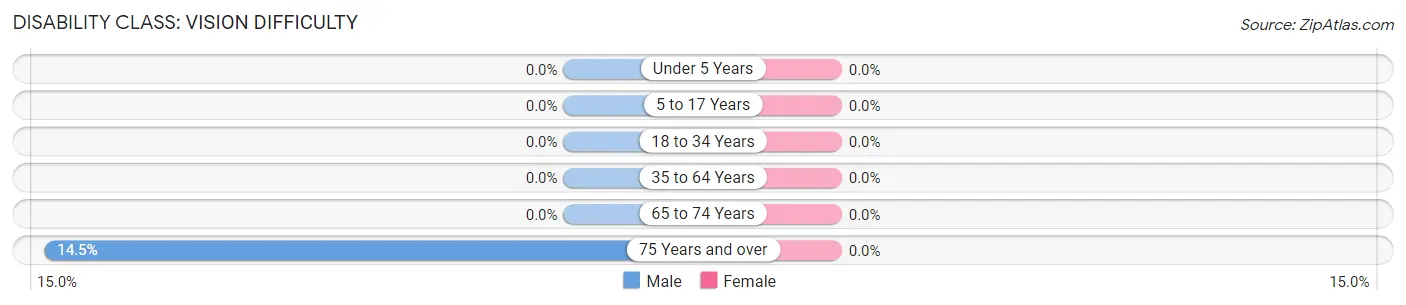
| Age Bracket | Male | Female |
| Under 5 Years | 0 (0.0%) | 0 (0.0%) |
| 5 to 17 Years | 0 (0.0%) | 0 (0.0%) |
| 18 to 34 Years | 0 (0.0%) | 0 (0.0%) |
| 35 to 64 Years | 0 (0.0%) | 0 (0.0%) |
| 65 to 74 Years | 0 (0.0%) | 0 (0.0%) |
| 75 Years and over | 25 (14.4%) | 0 (0.0%) |
Disability Class: Cognitive Difficulty
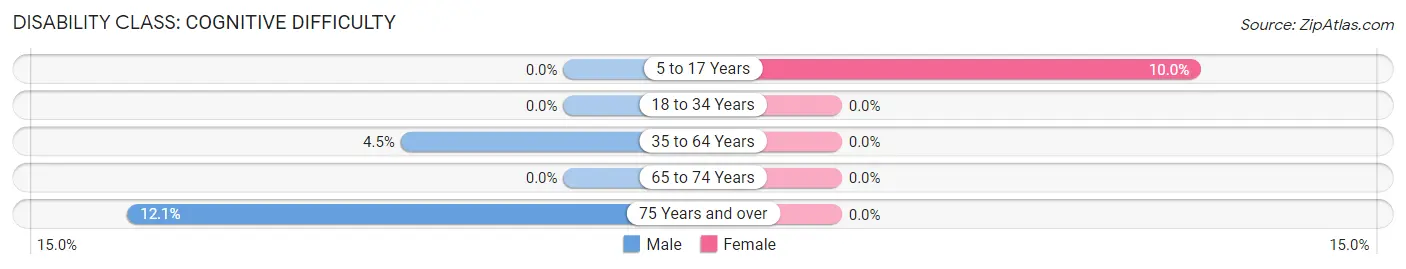
| Age Bracket | Male | Female |
| 5 to 17 Years | 0 (0.0%) | 9 (10.0%) |
| 18 to 34 Years | 0 (0.0%) | 0 (0.0%) |
| 35 to 64 Years | 24 (4.5%) | 0 (0.0%) |
| 65 to 74 Years | 0 (0.0%) | 0 (0.0%) |
| 75 Years and over | 21 (12.1%) | 0 (0.0%) |
Disability Class: Ambulatory Difficulty
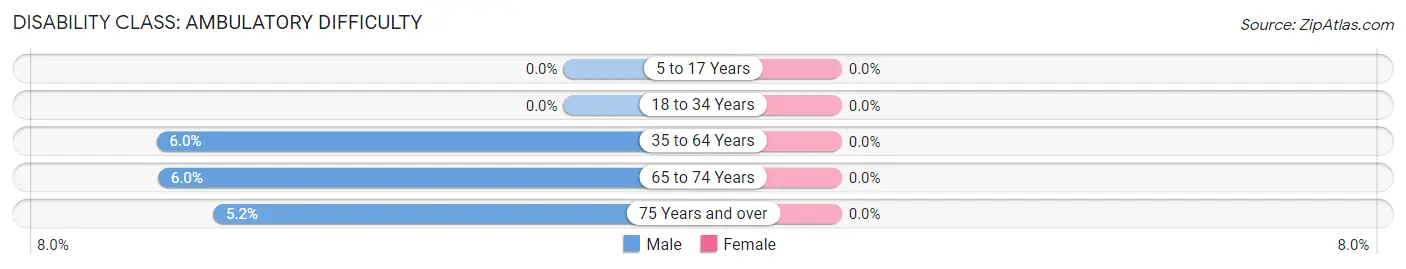
| Age Bracket | Male | Female |
| 5 to 17 Years | 0 (0.0%) | 0 (0.0%) |
| 18 to 34 Years | 0 (0.0%) | 0 (0.0%) |
| 35 to 64 Years | 32 (6.0%) | 0 (0.0%) |
| 65 to 74 Years | 13 (6.0%) | 0 (0.0%) |
| 75 Years and over | 9 (5.2%) | 0 (0.0%) |
Disability Class: Self-Care Difficulty
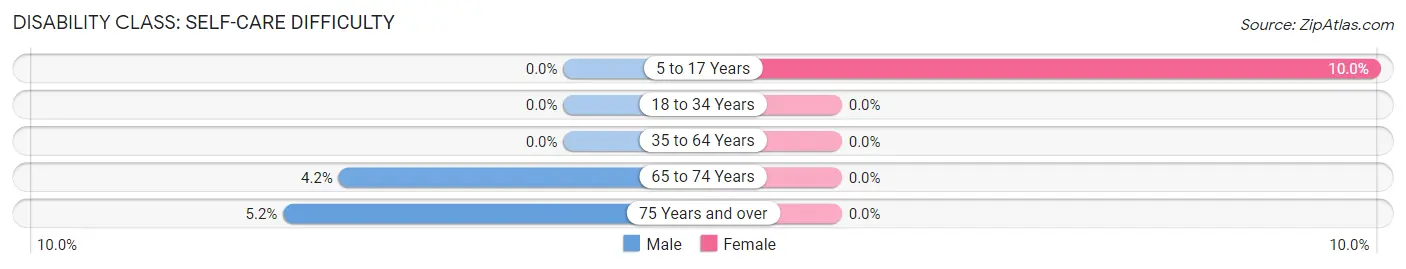
| Age Bracket | Male | Female |
| 5 to 17 Years | 0 (0.0%) | 9 (10.0%) |
| 18 to 34 Years | 0 (0.0%) | 0 (0.0%) |
| 35 to 64 Years | 0 (0.0%) | 0 (0.0%) |
| 65 to 74 Years | 9 (4.2%) | 0 (0.0%) |
| 75 Years and over | 9 (5.2%) | 0 (0.0%) |
Technology Access in Dolores County
Computing Device Access in Dolores County
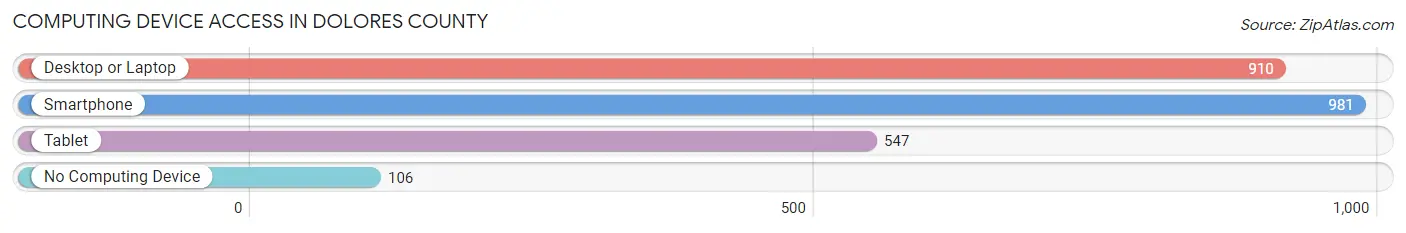
| Device Type | # Households | % Households |
| Desktop or Laptop | 910 | 76.8% |
| Smartphone | 981 | 82.8% |
| Tablet | 547 | 46.2% |
| No Computing Device | 106 | 8.9% |
| Total | 1,185 | 100.0% |
Internet Access in Dolores County
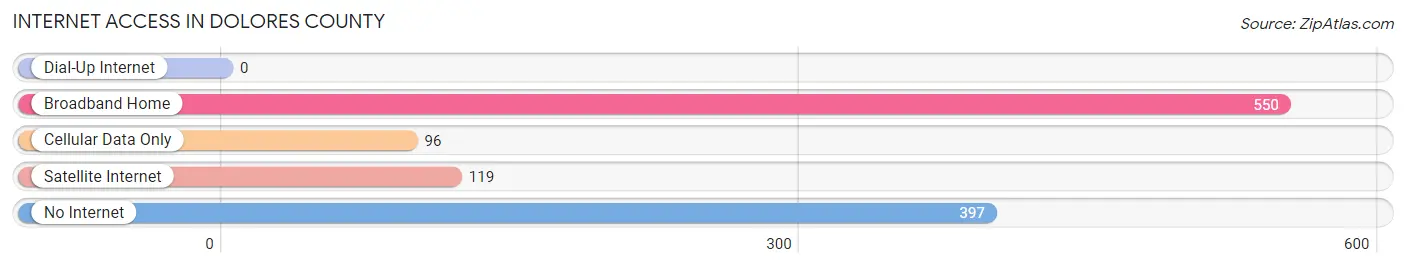
| Internet Type | # Households | % Households |
| Dial-Up Internet | 0 | 0.0% |
| Broadband Home | 550 | 46.4% |
| Cellular Data Only | 96 | 8.1% |
| Satellite Internet | 119 | 10.0% |
| No Internet | 397 | 33.5% |
| Total | 1,185 | 100.0% |
Dolores County Summary
Dolores County is located in the southwestern corner of Colorado, and is bordered by Montezuma County to the north, San Juan County to the east, La Plata County to the south, and San Miguel County to the west. The county seat is Dove Creek, and the county has a total area of 1,068 square miles. As of the 2010 census, the population was 2,064, making it the least populous county in Colorado.
History
The area that is now Dolores County was originally inhabited by the Ute and Navajo tribes. The first Europeans to explore the area were Spanish explorers in the late 1700s. The area was part of the Ute Reservation until 1881, when it was opened up to homesteaders. The county was officially established in 1887, and was named after the Dolores River, which runs through the county.
Geography
Dolores County is located in the southwestern corner of Colorado, and is bordered by Montezuma County to the north, San Juan County to the east, La Plata County to the south, and San Miguel County to the west. The county has a total area of 1,068 square miles, of which 1,065 square miles is land and 3 square miles is water. The county is mostly mountainous, with the highest point being the summit of Mount Wilson at 11,890 feet. The county is home to several rivers, including the Dolores River, the San Miguel River, and the Mancos River.
Economy
The economy of Dolores County is largely based on agriculture and tourism. The county is home to several farms and ranches, which produce hay, corn, wheat, and other crops. The county is also home to several tourist attractions, including the Anasazi Heritage Center, the Canyons of the Ancients National Monument, and the McPhee Reservoir.
Demographics
As of the 2010 census, the population of Dolores County was 2,064, making it the least populous county in Colorado. The population density was 2 people per square mile. The racial makeup of the county was 94.3% White, 0.3% African American, 1.2% Native American, 0.2% Asian, 0.1% Pacific Islander, 2.2% from other races, and 1.8% from two or more races. Hispanic or Latino of any race were 8.2% of the population.
The median income for a household in the county was $35,938, and the median income for a family was $41,250. The per capita income for the county was $17,845. About 11.2% of families and 14.2% of the population were below the poverty line, including 17.2% of those under age 18 and 8.3% of those age 65 or over.
Common Questions
What is Per Capita Income in Dolores County?
Per Capita income in Dolores County is $38,098.
What is the Median Family Income in Dolores County?
Median Family Income in Dolores County is $91,985.
What is the Median Household income in Dolores County?
Median Household Income in Dolores County is $64,708.
What is Income or Wage Gap in Dolores County?
Income or Wage Gap in Dolores County is 2.2%.
Women in Dolores County earn 97.8 cents for every dollar earned by a man.
What is Inequality or Gini Index in Dolores County?
Inequality or Gini Index in Dolores County is 0.44.
What is the Total Population of Dolores County?
Total Population of Dolores County is 2,329.
What is the Total Male Population of Dolores County?
Total Male Population of Dolores County is 1,297.
What is the Total Female Population of Dolores County?
Total Female Population of Dolores County is 1,032.
What is the Ratio of Males per 100 Females in Dolores County?
There are 125.68 Males per 100 Females in Dolores County.
What is the Ratio of Females per 100 Males in Dolores County?
There are 79.57 Females per 100 Males in Dolores County.
What is the Median Population Age in Dolores County?
Median Population Age in Dolores County is 59.2 Years.
What is the Average Family Size in Dolores County
Average Family Size in Dolores County is 2.4 People.
What is the Average Household Size in Dolores County
Average Household Size in Dolores County is 2.0 People.
How Large is the Labor Force in Dolores County?
There are 1,107 People in the Labor Forcein in Dolores County.
What is the Percentage of People in the Labor Force in Dolores County?
53.2% of People are in the Labor Force in Dolores County.
What is the Unemployment Rate in Dolores County?
Unemployment Rate in Dolores County is 3.1%.