Crowley County, CO Map & Demographics
Crowley County Map
Crowley County Overview
$20,909
PER CAPITA INCOME
$62,143
AVG FAMILY INCOME
$40,685
AVG HOUSEHOLD INCOME
39.2%
WAGE / INCOME GAP [ % ]
60.8¢/ $1
WAGE / INCOME GAP [ $ ]
$12,294
FAMILY INCOME DEFICIT
0.48
INEQUALITY / GINI INDEX
5,782
TOTAL POPULATION
3,922
MALE POPULATION
1,860
FEMALE POPULATION
210.86
MALES / 100 FEMALES
47.42
FEMALES / 100 MALES
41.3
MEDIAN AGE
4.7
AVG FAMILY SIZE
3.4
AVG HOUSEHOLD SIZE
1,711
LABOR FORCE [ PEOPLE ]
34.2%
PERCENT IN LABOR FORCE
7.2%
UNEMPLOYMENT RATE
Crowley County Area Codes
Income in Crowley County
Income Overview in Crowley County
Per Capita Income in Crowley County is $20,909, while median incomes of families and households are $62,143 and $40,685 respectively.
| Characteristic | Number | Measure |
| Per Capita Income | 5,782 | $20,909 |
| Median Family Income | 752 | $62,143 |
| Mean Family Income | 752 | $72,917 |
| Median Household Income | 1,315 | $40,685 |
| Mean Household Income | 1,315 | $54,258 |
| Income Deficit | 752 | $12,294 |
| Wage / Income Gap (%) | 5,782 | 39.18% |
| Wage / Income Gap ($) | 5,782 | 60.82¢ per $1 |
| Gini / Inequality Index | 5,782 | 0.48 |
Earnings by Sex in Crowley County
Average Earnings in Crowley County are $22,182, $20,361 for men and $33,480 for women, a difference of 39.2%.
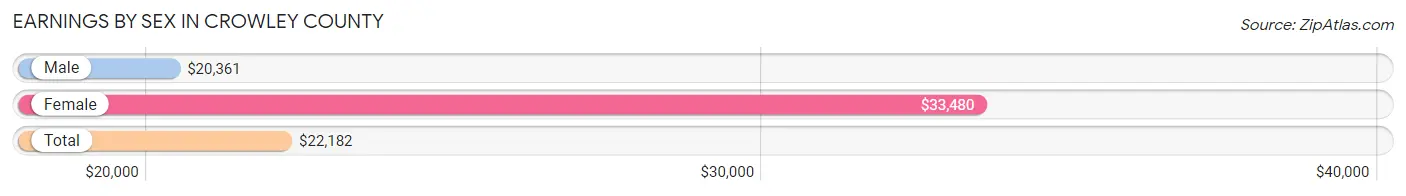
| Sex | Number | Average Earnings |
| Male | 1,154 (60.8%) | $20,361 |
| Female | 745 (39.2%) | $33,480 |
| Total | 1,899 (100.0%) | $22,182 |
Earnings by Sex by Income Bracket in Crowley County
The most common earnings brackets in Crowley County are $2,499 or less for men (259 | 22.4%) and $100,000+ for women (112 | 15.0%).
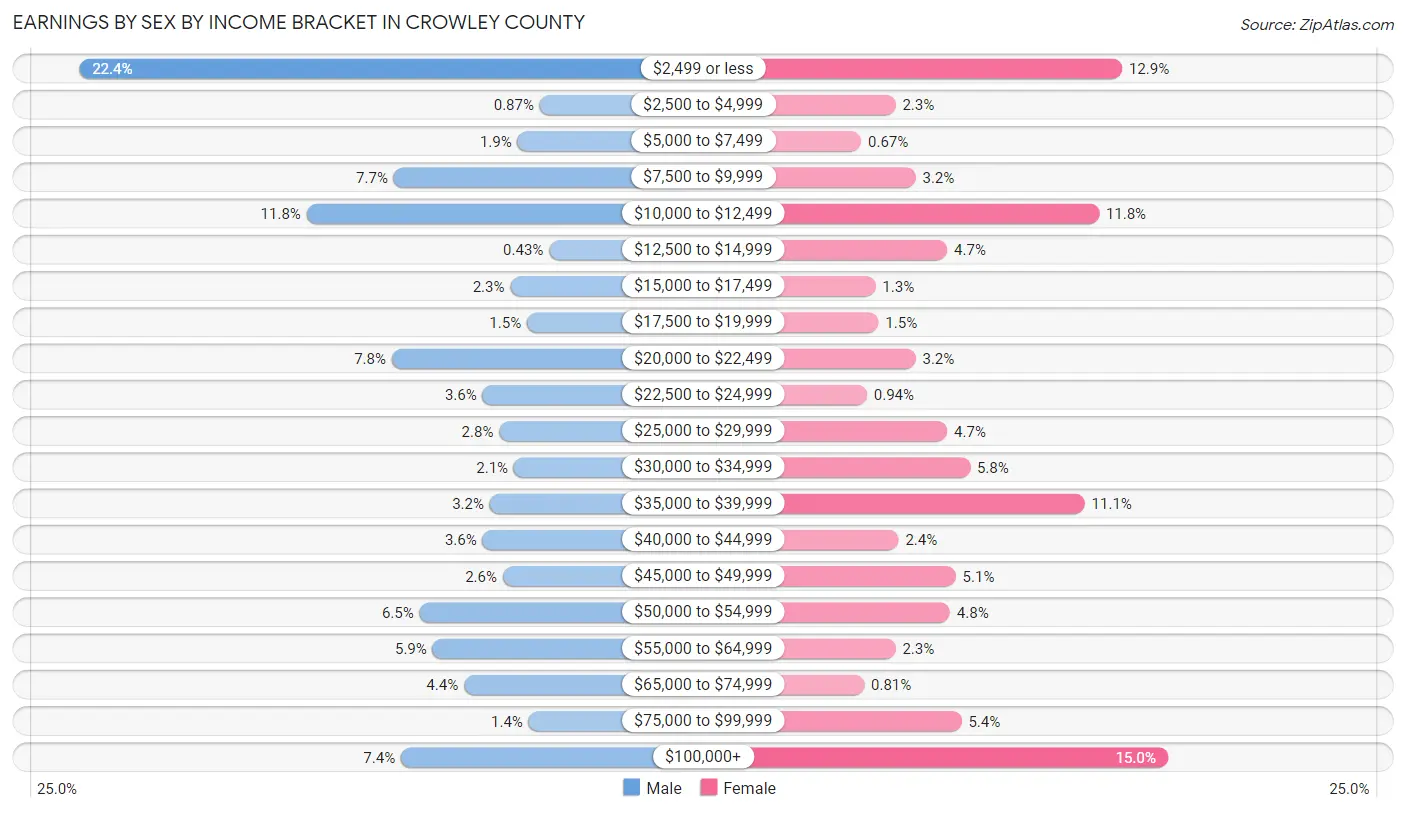
| Income | Male | Female |
| $2,499 or less | 259 (22.4%) | 96 (12.9%) |
| $2,500 to $4,999 | 10 (0.9%) | 17 (2.3%) |
| $5,000 to $7,499 | 22 (1.9%) | 5 (0.7%) |
| $7,500 to $9,999 | 89 (7.7%) | 24 (3.2%) |
| $10,000 to $12,499 | 136 (11.8%) | 88 (11.8%) |
| $12,500 to $14,999 | 5 (0.4%) | 35 (4.7%) |
| $15,000 to $17,499 | 26 (2.2%) | 10 (1.3%) |
| $17,500 to $19,999 | 17 (1.5%) | 11 (1.5%) |
| $20,000 to $22,499 | 90 (7.8%) | 24 (3.2%) |
| $22,500 to $24,999 | 41 (3.5%) | 7 (0.9%) |
| $25,000 to $29,999 | 32 (2.8%) | 35 (4.7%) |
| $30,000 to $34,999 | 24 (2.1%) | 43 (5.8%) |
| $35,000 to $39,999 | 37 (3.2%) | 83 (11.1%) |
| $40,000 to $44,999 | 41 (3.5%) | 18 (2.4%) |
| $45,000 to $49,999 | 30 (2.6%) | 38 (5.1%) |
| $50,000 to $54,999 | 75 (6.5%) | 36 (4.8%) |
| $55,000 to $64,999 | 68 (5.9%) | 17 (2.3%) |
| $65,000 to $74,999 | 51 (4.4%) | 6 (0.8%) |
| $75,000 to $99,999 | 16 (1.4%) | 40 (5.4%) |
| $100,000+ | 85 (7.4%) | 112 (15.0%) |
| Total | 1,154 (100.0%) | 745 (100.0%) |
Earnings by Sex by Educational Attainment in Crowley County
Average earnings in Crowley County are $28,000 for men and $35,903 for women, a difference of 22.0%. Men with an educational attainment of graduate degree enjoy the highest average annual earnings of $110,163, while those with college or associate's degree education earn the least with $22,097. Women with an educational attainment of college or associate's degree earn the most with the average annual earnings of $29,600, while those with graduate degree education have the smallest earnings of $2,499.
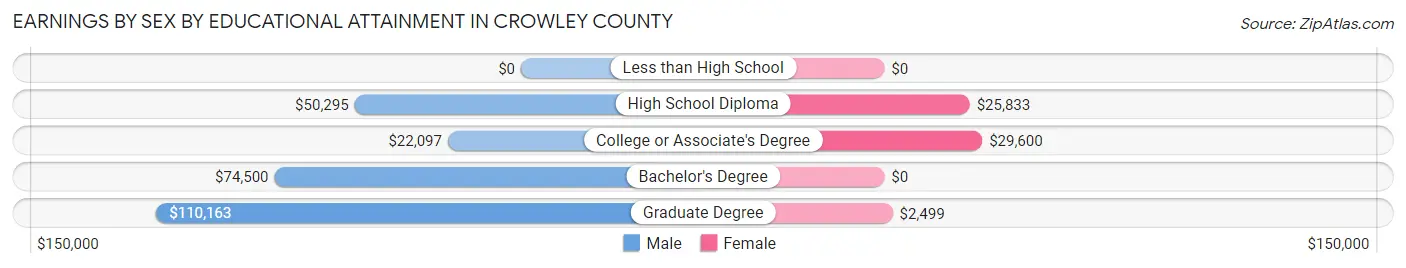
| Educational Attainment | Male Income | Female Income |
| Less than High School | - | - |
| High School Diploma | $50,295 | $25,833 |
| College or Associate's Degree | $22,097 | $29,600 |
| Bachelor's Degree | $74,500 | $0 |
| Graduate Degree | $110,163 | $2,499 |
| Total | $28,000 | $35,903 |
Family Income in Crowley County
Family Income Brackets in Crowley County
According to the Crowley County family income data, there are 207 families falling into the $50,000 to $74,999 income range, which is the most common income bracket and makes up 27.5% of all families. Conversely, the $200,000+ income bracket is the least frequent group with only 28 families (3.7%) belonging to this category.
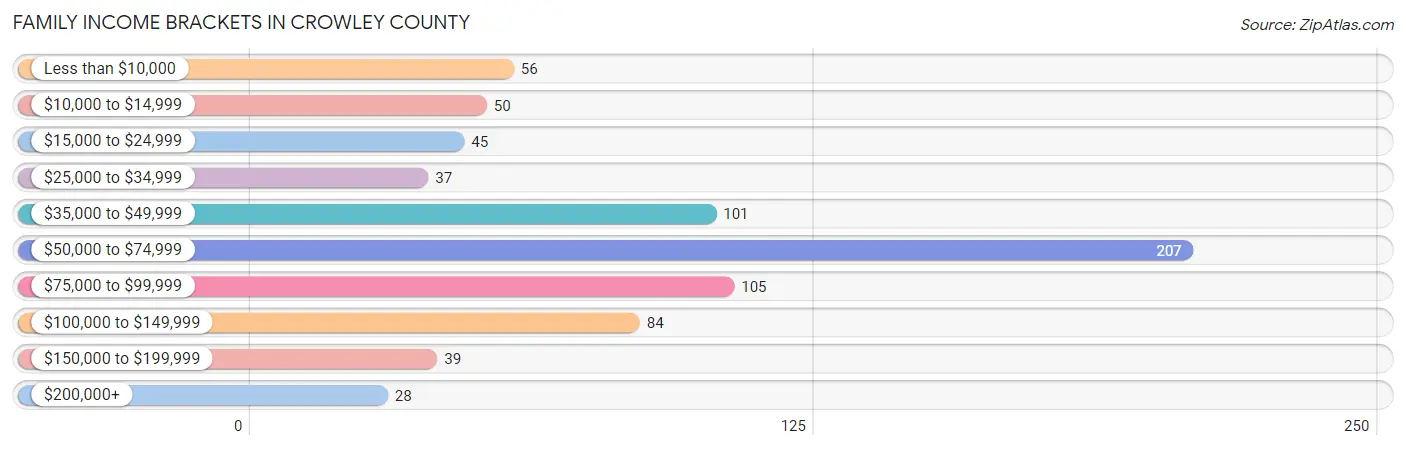
| Income Bracket | # Families | % Families |
| Less than $10,000 | 56 | 7.4% |
| $10,000 to $14,999 | 50 | 6.6% |
| $15,000 to $24,999 | 45 | 6.0% |
| $25,000 to $34,999 | 37 | 4.9% |
| $35,000 to $49,999 | 101 | 13.4% |
| $50,000 to $74,999 | 207 | 27.5% |
| $75,000 to $99,999 | 105 | 14.0% |
| $100,000 to $149,999 | 84 | 11.2% |
| $150,000 to $199,999 | 39 | 5.2% |
| $200,000+ | 28 | 3.7% |
Family Income by Famaliy Size in Crowley County
4-person families (138 | 18.3%) account for the highest median family income in Crowley County with $72,857 per family, while 2-person families (323 | 42.9%) have the highest median income of $30,312 per family member.
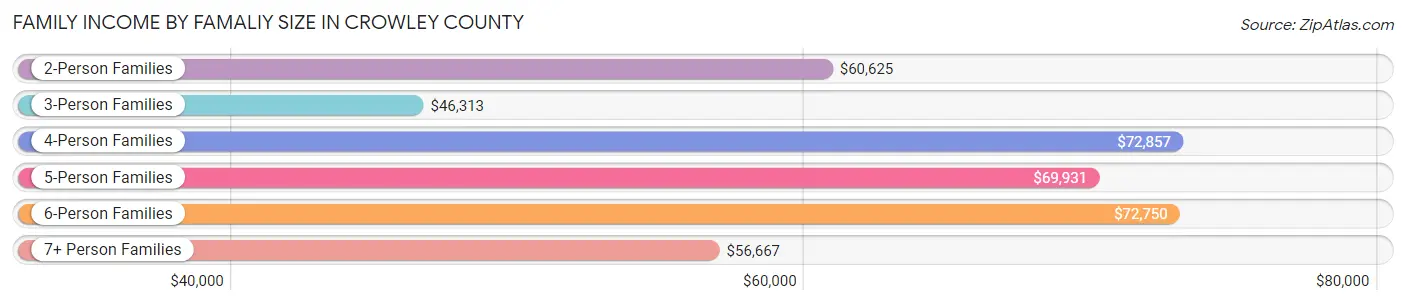
| Income Bracket | # Families | Median Income |
| 2-Person Families | 323 (42.9%) | $60,625 |
| 3-Person Families | 149 (19.8%) | $46,313 |
| 4-Person Families | 138 (18.3%) | $72,857 |
| 5-Person Families | 111 (14.8%) | $69,931 |
| 6-Person Families | 15 (2.0%) | $72,750 |
| 7+ Person Families | 16 (2.1%) | $56,667 |
| Total | 752 (100.0%) | $62,143 |
Family Income by Number of Earners in Crowley County
The median family income in Crowley County is $62,143, with families comprising 3+ earners (30) having the highest median family income of $116,667, while families with no earners (160) have the lowest median family income of $37,500, accounting for 4.0% and 21.3% of families, respectively.
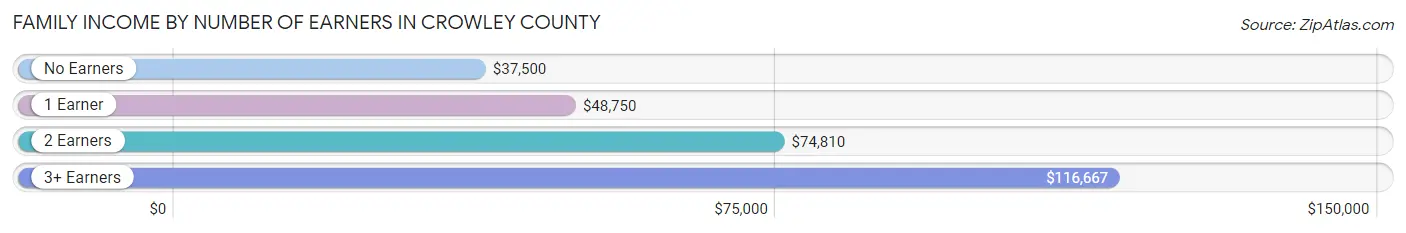
| Number of Earners | # Families | Median Income |
| No Earners | 160 (21.3%) | $37,500 |
| 1 Earner | 283 (37.6%) | $48,750 |
| 2 Earners | 279 (37.1%) | $74,810 |
| 3+ Earners | 30 (4.0%) | $116,667 |
| Total | 752 (100.0%) | $62,143 |
Household Income in Crowley County
Household Income Brackets in Crowley County
With 239 households falling in the category, the $50,000 to $74,999 income range is the most frequent in Crowley County, accounting for 18.2% of all households. In contrast, only 28 households (2.1%) fall into the $200,000+ income bracket, making it the least populous group.
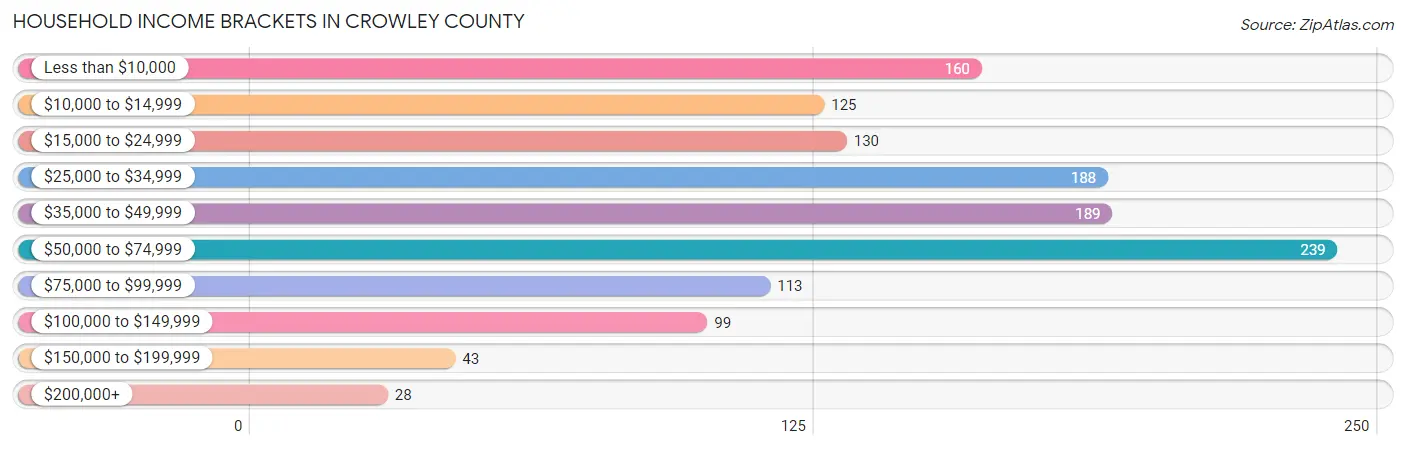
| Income Bracket | # Households | % Households |
| Less than $10,000 | 160 | 12.2% |
| $10,000 to $14,999 | 125 | 9.5% |
| $15,000 to $24,999 | 130 | 9.9% |
| $25,000 to $34,999 | 188 | 14.3% |
| $35,000 to $49,999 | 189 | 14.4% |
| $50,000 to $74,999 | 239 | 18.2% |
| $75,000 to $99,999 | 113 | 8.6% |
| $100,000 to $149,999 | 99 | 7.5% |
| $150,000 to $199,999 | 43 | 3.3% |
| $200,000+ | 28 | 2.1% |
Household Income by Householder Age in Crowley County
The median household income in Crowley County is $40,685, with the highest median household income of $60,568 found in the 25 to 44 years age bracket for the primary householder. A total of 307 households (23.4%) fall into this category. Meanwhile, the 15 to 24 years age bracket for the primary householder has the lowest median household income of $2,499, with 33 households (2.5%) in this group.
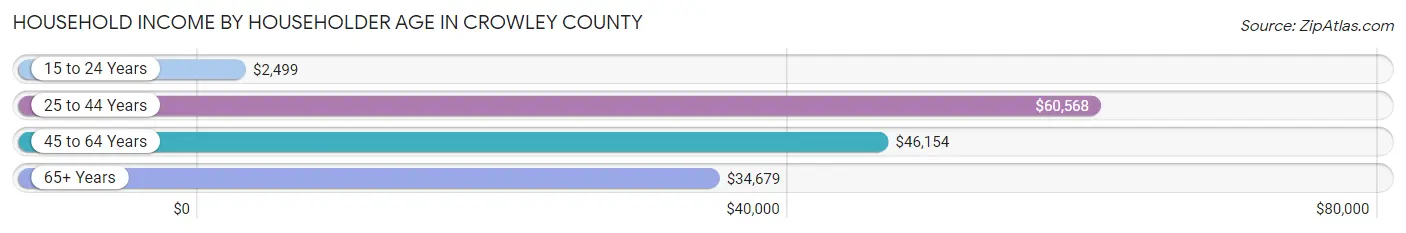
| Income Bracket | # Households | Median Income |
| 15 to 24 Years | 33 (2.5%) | $2,499 |
| 25 to 44 Years | 307 (23.4%) | $60,568 |
| 45 to 64 Years | 512 (38.9%) | $46,154 |
| 65+ Years | 463 (35.2%) | $34,679 |
| Total | 1,315 (100.0%) | $40,685 |
Poverty in Crowley County
Income Below Poverty by Sex and Age in Crowley County
With 30.2% poverty level for males and 15.6% for females among the residents of Crowley County, 35 to 44 year old males and 5 year old females are the most vulnerable to poverty, with 191 males (60.8%) and 2 females (50.0%) in their respective age groups living below the poverty level.
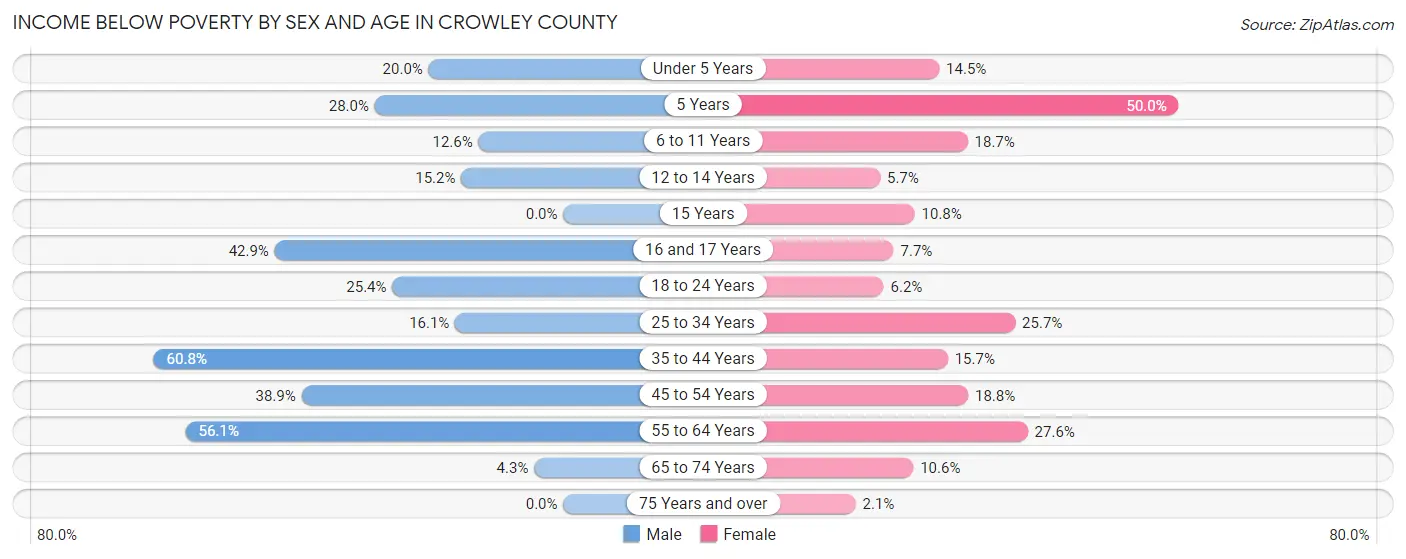
| Age Bracket | Male | Female |
| Under 5 Years | 18 (20.0%) | 12 (14.5%) |
| 5 Years | 7 (28.0%) | 2 (50.0%) |
| 6 to 11 Years | 18 (12.6%) | 34 (18.7%) |
| 12 to 14 Years | 15 (15.1%) | 5 (5.7%) |
| 15 Years | 0 (0.0%) | 4 (10.8%) |
| 16 and 17 Years | 15 (42.9%) | 2 (7.7%) |
| 18 to 24 Years | 147 (25.4%) | 9 (6.2%) |
| 25 to 34 Years | 40 (16.1%) | 35 (25.7%) |
| 35 to 44 Years | 191 (60.8%) | 45 (15.7%) |
| 45 to 54 Years | 194 (38.9%) | 30 (18.8%) |
| 55 to 64 Years | 138 (56.1%) | 77 (27.6%) |
| 65 to 74 Years | 7 (4.3%) | 28 (10.6%) |
| 75 Years and over | 0 (0.0%) | 3 (2.1%) |
| Total | 790 (30.2%) | 286 (15.6%) |
Income Above Poverty by Sex and Age in Crowley County
According to the poverty statistics in Crowley County, males aged 15 years and females aged 75 years and over are the age groups that are most secure financially, with 100.0% of males and 98.0% of females in these age groups living above the poverty line.
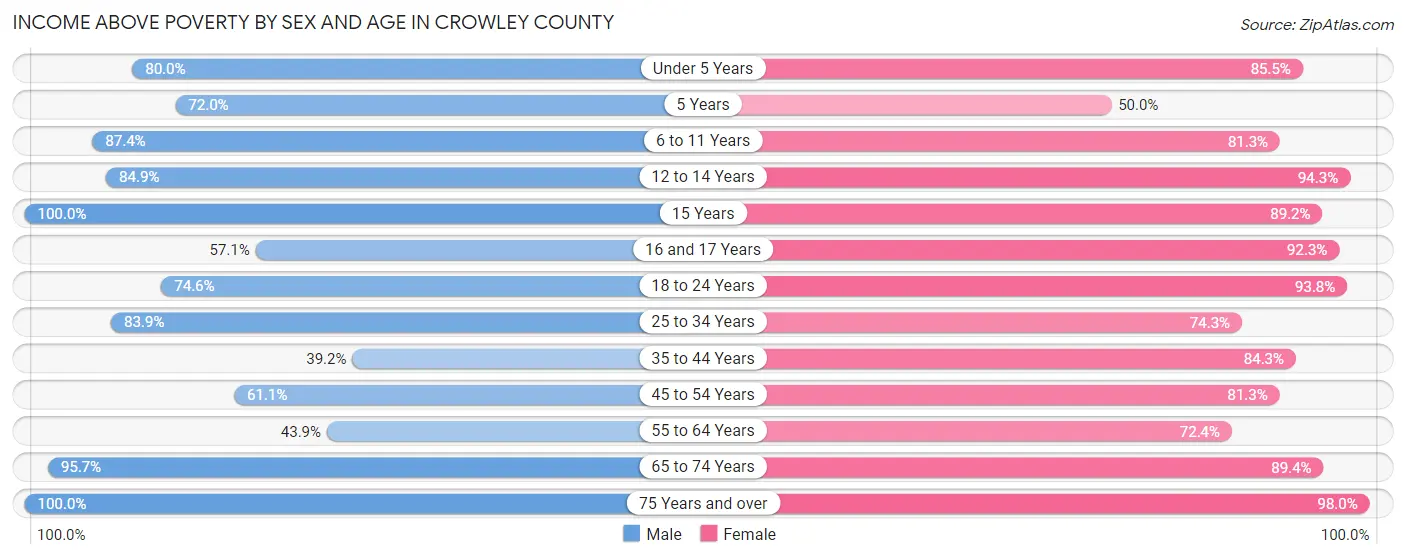
| Age Bracket | Male | Female |
| Under 5 Years | 72 (80.0%) | 71 (85.5%) |
| 5 Years | 18 (72.0%) | 2 (50.0%) |
| 6 to 11 Years | 125 (87.4%) | 148 (81.3%) |
| 12 to 14 Years | 84 (84.9%) | 83 (94.3%) |
| 15 Years | 28 (100.0%) | 33 (89.2%) |
| 16 and 17 Years | 20 (57.1%) | 24 (92.3%) |
| 18 to 24 Years | 432 (74.6%) | 136 (93.8%) |
| 25 to 34 Years | 209 (83.9%) | 101 (74.3%) |
| 35 to 44 Years | 123 (39.2%) | 241 (84.3%) |
| 45 to 54 Years | 305 (61.1%) | 130 (81.2%) |
| 55 to 64 Years | 108 (43.9%) | 202 (72.4%) |
| 65 to 74 Years | 155 (95.7%) | 236 (89.4%) |
| 75 Years and over | 144 (100.0%) | 143 (98.0%) |
| Total | 1,823 (69.8%) | 1,550 (84.4%) |
Income Below Poverty Among Married-Couple Families in Crowley County
The poverty statistics for married-couple families in Crowley County show that 12.7% or 65 of the total 512 families live below the poverty line. Families with 1 or 2 children have the highest poverty rate of 24.8%, comprising of 34 families. On the other hand, families with 5 or more children have the lowest poverty rate of 0.0%, which includes 0 families.
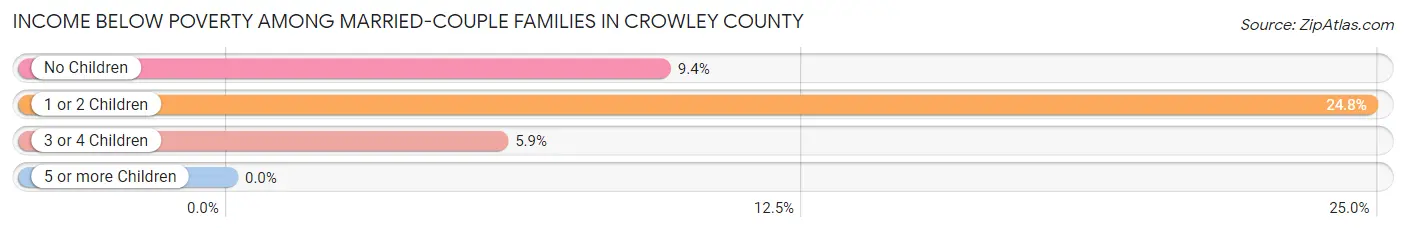
| Children | Above Poverty | Below Poverty |
| No Children | 250 (90.6%) | 26 (9.4%) |
| 1 or 2 Children | 103 (75.2%) | 34 (24.8%) |
| 3 or 4 Children | 80 (94.1%) | 5 (5.9%) |
| 5 or more Children | 14 (100.0%) | 0 (0.0%) |
| Total | 447 (87.3%) | 65 (12.7%) |
Income Below Poverty Among Single-Parent Households in Crowley County
According to the poverty data in Crowley County, 18.0% or 18 single-father households and 40.0% or 56 single-mother households are living below the poverty line. Among single-father households, those with 1 or 2 children have the highest poverty rate, with 16 households (50.0%) experiencing poverty. Likewise, among single-mother households, those with 3 or 4 children have the highest poverty rate, with 25 households (80.6%) falling below the poverty line.
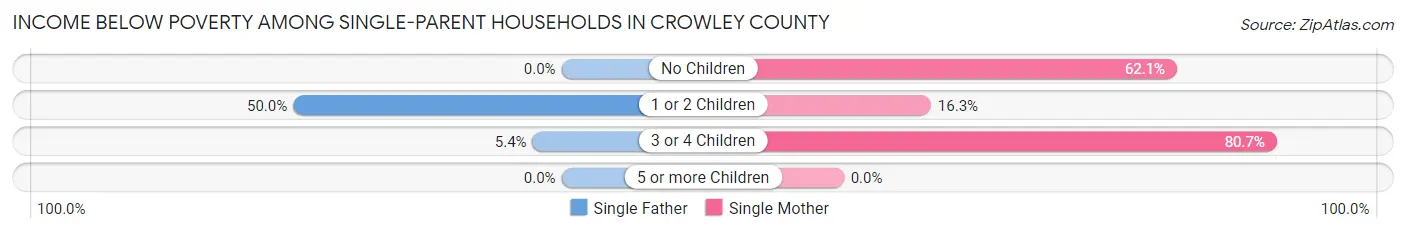
| Children | Single Father | Single Mother |
| No Children | 0 (0.0%) | 18 (62.1%) |
| 1 or 2 Children | 16 (50.0%) | 13 (16.3%) |
| 3 or 4 Children | 2 (5.4%) | 25 (80.6%) |
| 5 or more Children | 0 (0.0%) | 0 (0.0%) |
| Total | 18 (18.0%) | 56 (40.0%) |
Income Below Poverty Among Married-Couple vs Single-Parent Households in Crowley County
The poverty data for Crowley County shows that 65 of the married-couple family households (12.7%) and 74 of the single-parent households (30.8%) are living below the poverty level. Within the married-couple family households, those with 1 or 2 children have the highest poverty rate, with 34 households (24.8%) falling below the poverty line. Among the single-parent households, those with 3 or 4 children have the highest poverty rate, with 27 household (39.7%) living below poverty.
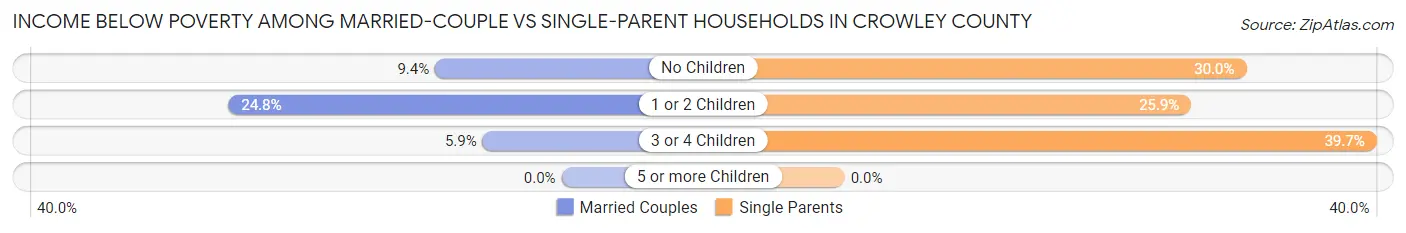
| Children | Married-Couple Families | Single-Parent Households |
| No Children | 26 (9.4%) | 18 (30.0%) |
| 1 or 2 Children | 34 (24.8%) | 29 (25.9%) |
| 3 or 4 Children | 5 (5.9%) | 27 (39.7%) |
| 5 or more Children | 0 (0.0%) | 0 (0.0%) |
| Total | 65 (12.7%) | 74 (30.8%) |
Race in Crowley County
The most populous races in Crowley County are White / Caucasian (3,875 | 67.0%), Hispanic or Latino (1,897 | 32.8%), and Two or more Races (939 | 16.2%).
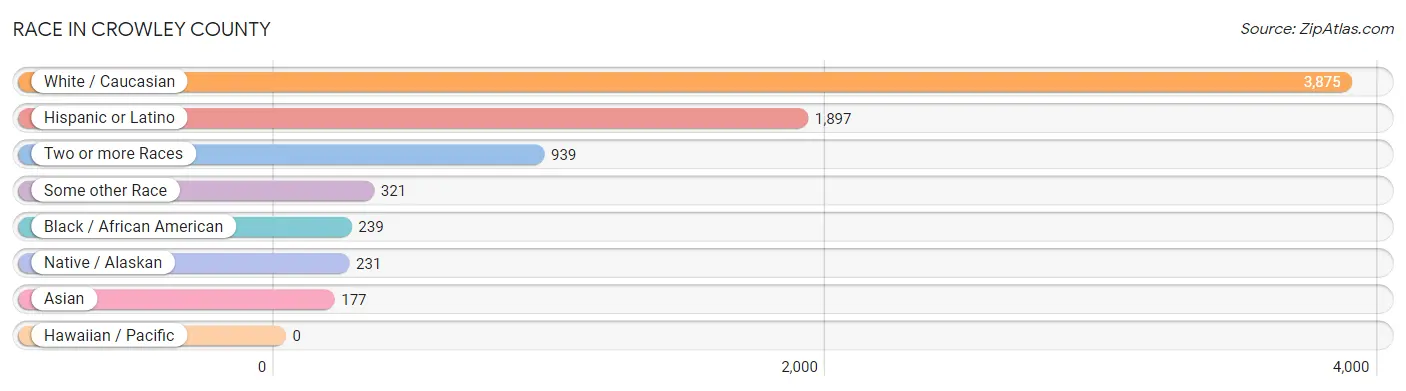
| Race | # Population | % Population |
| Asian | 177 | 3.1% |
| Black / African American | 239 | 4.1% |
| Hawaiian / Pacific | 0 | 0.0% |
| Hispanic or Latino | 1,897 | 32.8% |
| Native / Alaskan | 231 | 4.0% |
| White / Caucasian | 3,875 | 67.0% |
| Two or more Races | 939 | 16.2% |
| Some other Race | 321 | 5.6% |
| Total | 5,782 | 100.0% |
Ancestry in Crowley County
The most populous ancestries reported in Crowley County are Mexican (1,008 | 17.4%), German (1,003 | 17.3%), English (430 | 7.4%), Irish (400 | 6.9%), and American (244 | 4.2%), together accounting for 53.4% of all Crowley County residents.
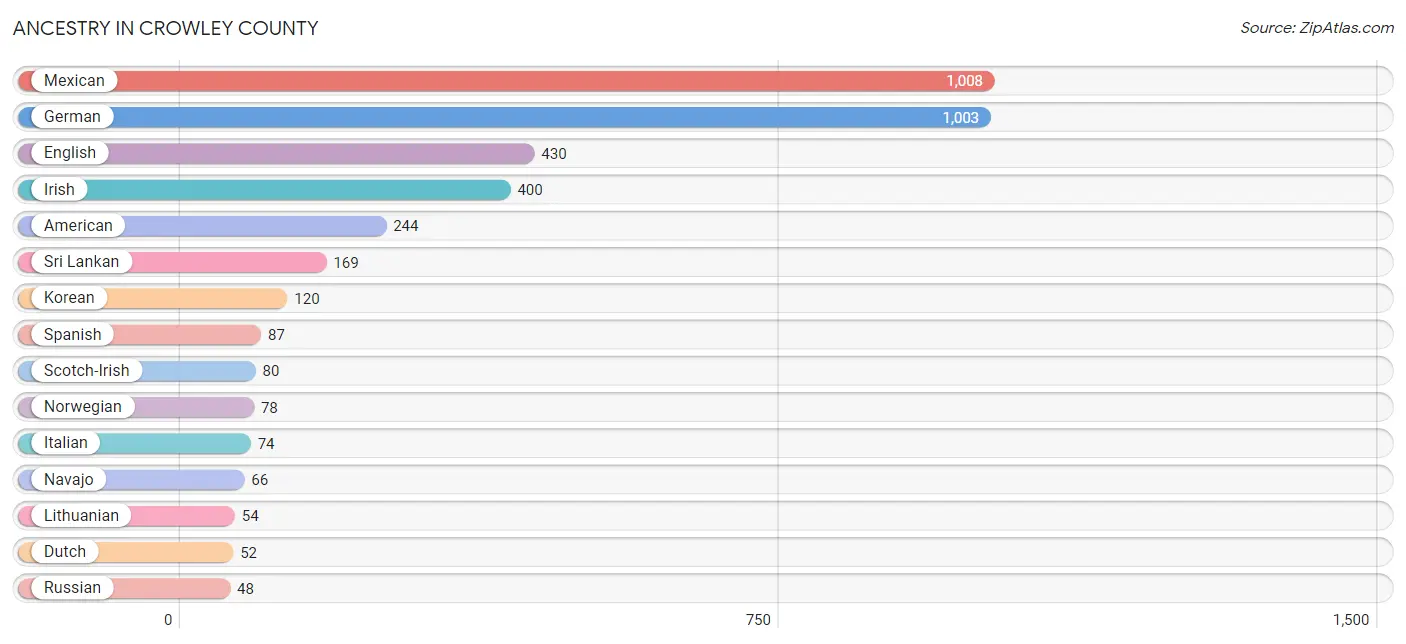
| Ancestry | # Population | % Population |
| American | 244 | 4.2% |
| Apache | 4 | 0.1% |
| Arab | 1 | 0.0% |
| Austrian | 9 | 0.2% |
| Bhutanese | 5 | 0.1% |
| British | 24 | 0.4% |
| Burmese | 20 | 0.4% |
| Central American | 17 | 0.3% |
| Cherokee | 41 | 0.7% |
| Cheyenne | 24 | 0.4% |
| Cuban | 26 | 0.4% |
| Dutch | 52 | 0.9% |
| Eastern European | 2 | 0.0% |
| English | 430 | 7.4% |
| European | 7 | 0.1% |
| Finnish | 2 | 0.0% |
| French | 34 | 0.6% |
| French American Indian | 2 | 0.0% |
| French Canadian | 1 | 0.0% |
| German | 1,003 | 17.3% |
| Greek | 3 | 0.1% |
| Guatemalan | 5 | 0.1% |
| Honduran | 4 | 0.1% |
| Hungarian | 1 | 0.0% |
| Irish | 400 | 6.9% |
| Italian | 74 | 1.3% |
| Jamaican | 4 | 0.1% |
| Korean | 120 | 2.1% |
| Lebanese | 1 | 0.0% |
| Lithuanian | 54 | 0.9% |
| Mexican | 1,008 | 17.4% |
| Mexican American Indian | 7 | 0.1% |
| Navajo | 66 | 1.1% |
| Northern European | 7 | 0.1% |
| Norwegian | 78 | 1.3% |
| Ottawa | 8 | 0.1% |
| Peruvian | 25 | 0.4% |
| Polish | 26 | 0.4% |
| Portuguese | 13 | 0.2% |
| Potawatomi | 2 | 0.0% |
| Puerto Rican | 39 | 0.7% |
| Russian | 48 | 0.8% |
| Salvadoran | 8 | 0.1% |
| Scandinavian | 5 | 0.1% |
| Scotch-Irish | 80 | 1.4% |
| Scottish | 27 | 0.5% |
| South American | 25 | 0.4% |
| Spaniard | 35 | 0.6% |
| Spanish | 87 | 1.5% |
| Sri Lankan | 169 | 2.9% |
| Swedish | 36 | 0.6% |
| Swiss | 28 | 0.5% |
| Ukrainian | 5 | 0.1% |
| Welsh | 34 | 0.6% | View All 54 Rows |
Immigrants in Crowley County
The most numerous immigrant groups reported in Crowley County came from Asia (57 | 1.0%), South Eastern Asia (34 | 0.6%), Vietnam (31 | 0.5%), Eastern Asia (23 | 0.4%), and Central America (20 | 0.4%), together accounting for 2.9% of all Crowley County residents.
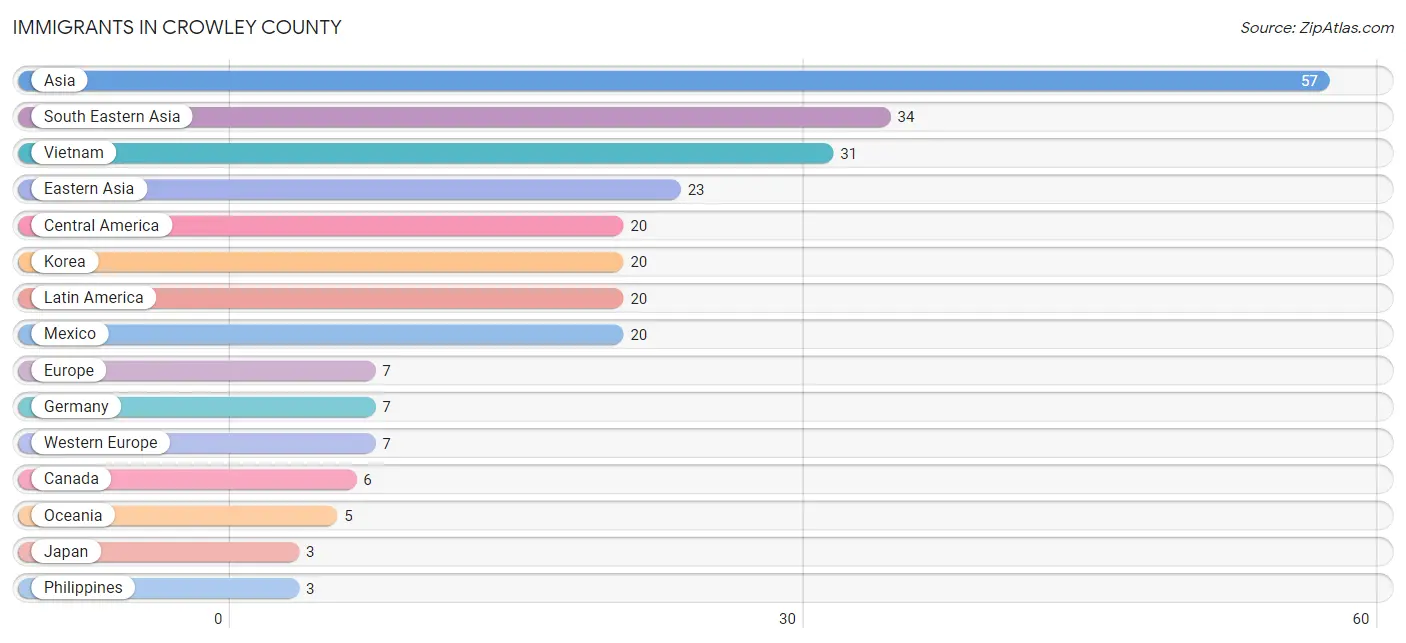
| Immigration Origin | # Population | % Population |
| Asia | 57 | 1.0% |
| Canada | 6 | 0.1% |
| Central America | 20 | 0.4% |
| Eastern Asia | 23 | 0.4% |
| Europe | 7 | 0.1% |
| Germany | 7 | 0.1% |
| Japan | 3 | 0.1% |
| Korea | 20 | 0.4% |
| Latin America | 20 | 0.4% |
| Mexico | 20 | 0.4% |
| Oceania | 5 | 0.1% |
| Philippines | 3 | 0.1% |
| South Eastern Asia | 34 | 0.6% |
| Vietnam | 31 | 0.5% |
| Western Europe | 7 | 0.1% | View All 15 Rows |
Sex and Age in Crowley County
Sex and Age in Crowley County
The most populous age groups in Crowley County are 45 to 49 Years (518 | 13.2%) for men and 40 to 44 Years (199 | 10.7%) for women.
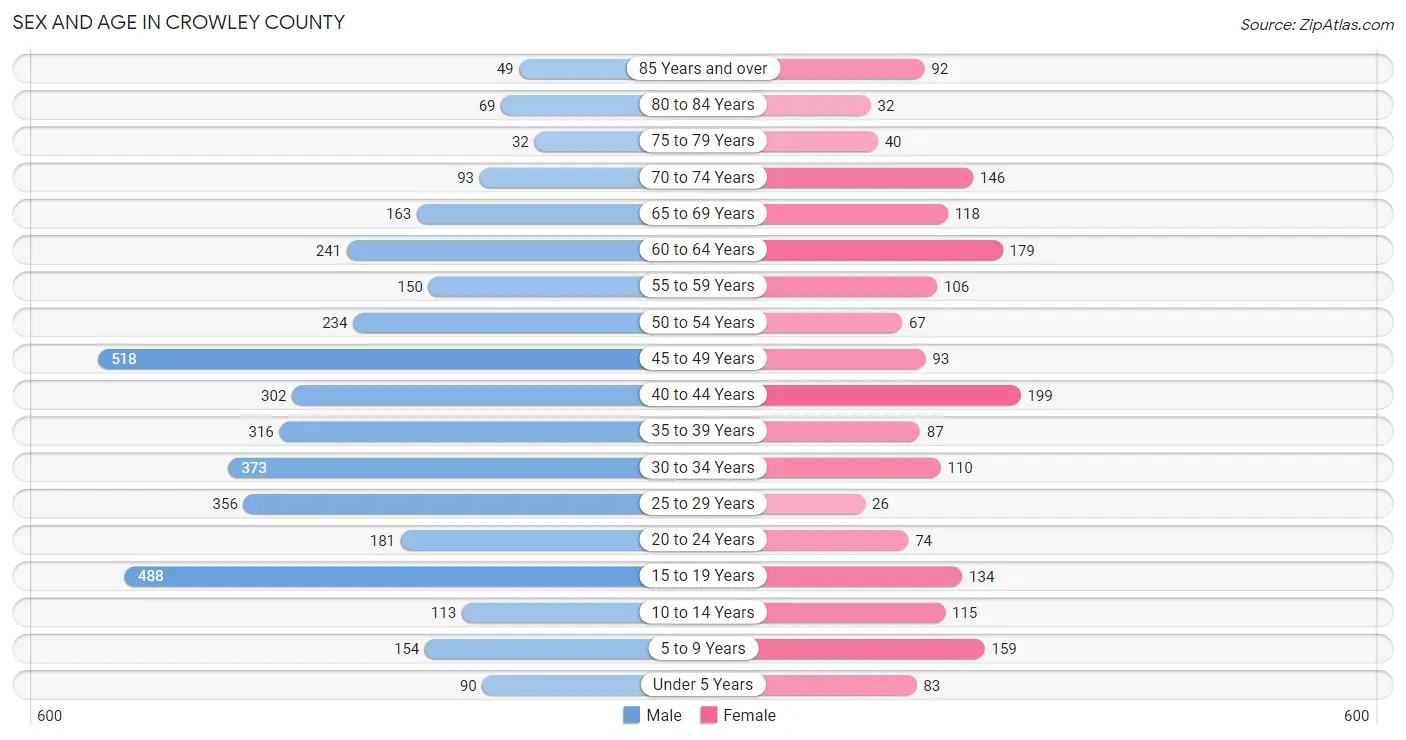
| Age Bracket | Male | Female |
| Under 5 Years | 90 (2.3%) | 83 (4.5%) |
| 5 to 9 Years | 154 (3.9%) | 159 (8.6%) |
| 10 to 14 Years | 113 (2.9%) | 115 (6.2%) |
| 15 to 19 Years | 488 (12.4%) | 134 (7.2%) |
| 20 to 24 Years | 181 (4.6%) | 74 (4.0%) |
| 25 to 29 Years | 356 (9.1%) | 26 (1.4%) |
| 30 to 34 Years | 373 (9.5%) | 110 (5.9%) |
| 35 to 39 Years | 316 (8.1%) | 87 (4.7%) |
| 40 to 44 Years | 302 (7.7%) | 199 (10.7%) |
| 45 to 49 Years | 518 (13.2%) | 93 (5.0%) |
| 50 to 54 Years | 234 (6.0%) | 67 (3.6%) |
| 55 to 59 Years | 150 (3.8%) | 106 (5.7%) |
| 60 to 64 Years | 241 (6.1%) | 179 (9.6%) |
| 65 to 69 Years | 163 (4.2%) | 118 (6.3%) |
| 70 to 74 Years | 93 (2.4%) | 146 (7.9%) |
| 75 to 79 Years | 32 (0.8%) | 40 (2.1%) |
| 80 to 84 Years | 69 (1.8%) | 32 (1.7%) |
| 85 Years and over | 49 (1.3%) | 92 (5.0%) |
| Total | 3,922 (100.0%) | 1,860 (100.0%) |
Families and Households in Crowley County
Median Family Size in Crowley County
The median family size in Crowley County is 4.67 persons per family, with single female/mother families (140 | 18.6%) accounting for the largest median family size of 7.59 persons per family. On the other hand, married-couple families (512 | 68.1%) represent the smallest median family size with 3.83 persons per family.
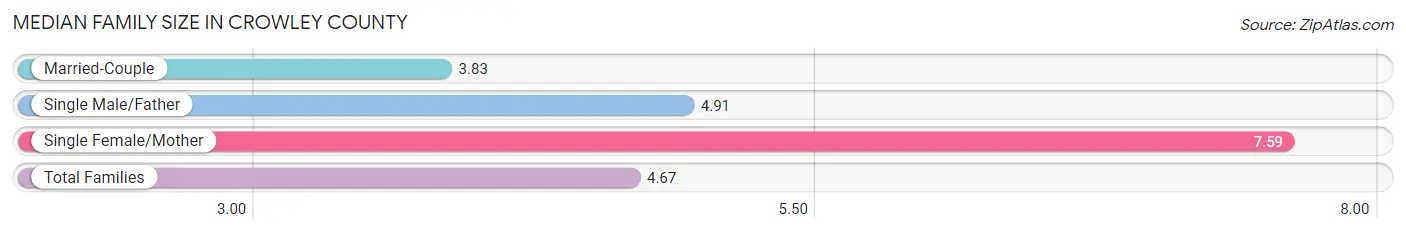
| Family Type | # Families | Family Size |
| Married-Couple | 512 (68.1%) | 3.83 |
| Single Male/Father | 100 (13.3%) | 4.91 |
| Single Female/Mother | 140 (18.6%) | 7.59 |
| Total Families | 752 (100.0%) | 4.67 |
Median Household Size in Crowley County
The median household size in Crowley County is 3.38 persons per household, with single female/mother households (140 | 10.6%) accounting for the largest median household size of 8.06 persons per household. non-family households (563 | 42.8%) represent the smallest median household size with 1.32 persons per household.
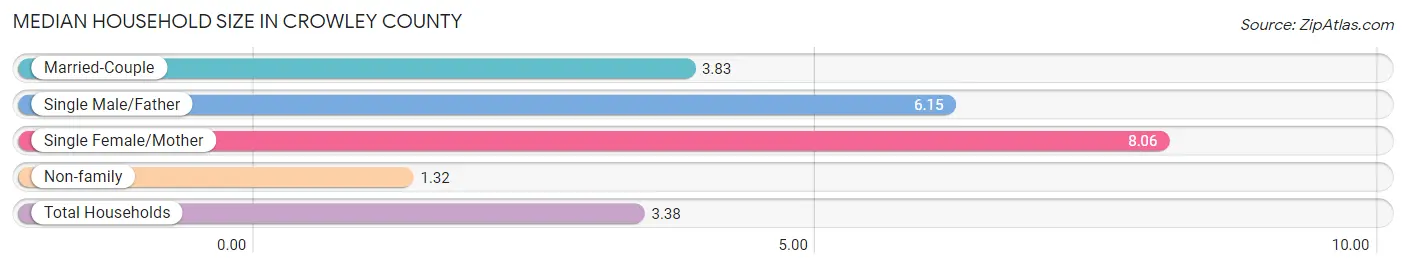
| Household Type | # Households | Household Size |
| Married-Couple | 512 (38.9%) | 3.83 |
| Single Male/Father | 100 (7.6%) | 6.15 |
| Single Female/Mother | 140 (10.6%) | 8.06 |
| Non-family | 563 (42.8%) | 1.32 |
| Total Households | 1,315 (100.0%) | 3.38 |
Household Size by Marriage Status in Crowley County
Out of a total of 1,315 households in Crowley County, 752 (57.2%) are family households, while 563 (42.8%) are nonfamily households. The most numerous type of family households are 2-person households, comprising 310, and the most common type of nonfamily households are 1-person households, comprising 521.
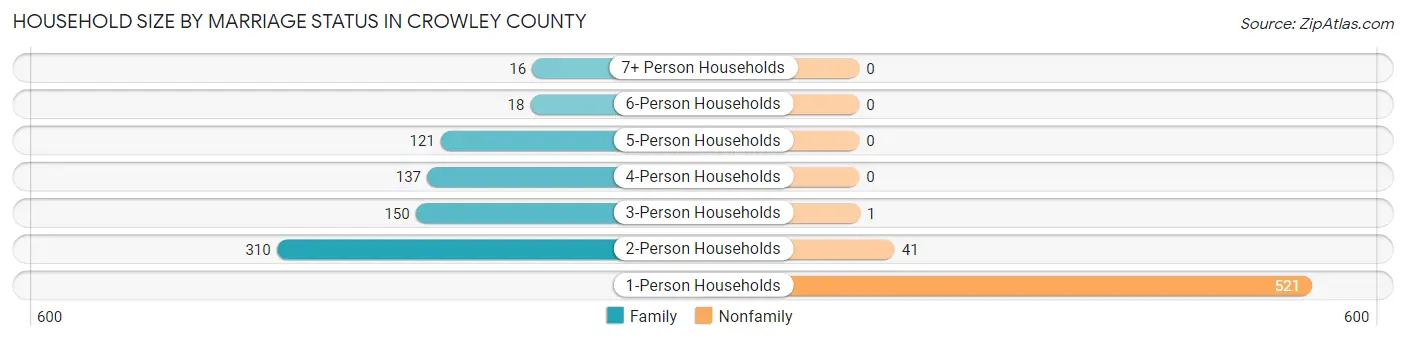
| Household Size | Family Households | Nonfamily Households |
| 1-Person Households | - | 521 (39.6%) |
| 2-Person Households | 310 (23.6%) | 41 (3.1%) |
| 3-Person Households | 150 (11.4%) | 1 (0.1%) |
| 4-Person Households | 137 (10.4%) | 0 (0.0%) |
| 5-Person Households | 121 (9.2%) | 0 (0.0%) |
| 6-Person Households | 18 (1.4%) | 0 (0.0%) |
| 7+ Person Households | 16 (1.2%) | 0 (0.0%) |
| Total | 752 (57.2%) | 563 (42.8%) |
Female Fertility in Crowley County
Fertility by Age in Crowley County
Average fertility rate in Crowley County is 48.0 births per 1,000 women. Women in the age bracket of 20 to 34 years have the highest fertility rate with 138.0 births per 1,000 women. Women in the age bracket of 20 to 34 years acount for 82.9% of all women with births.
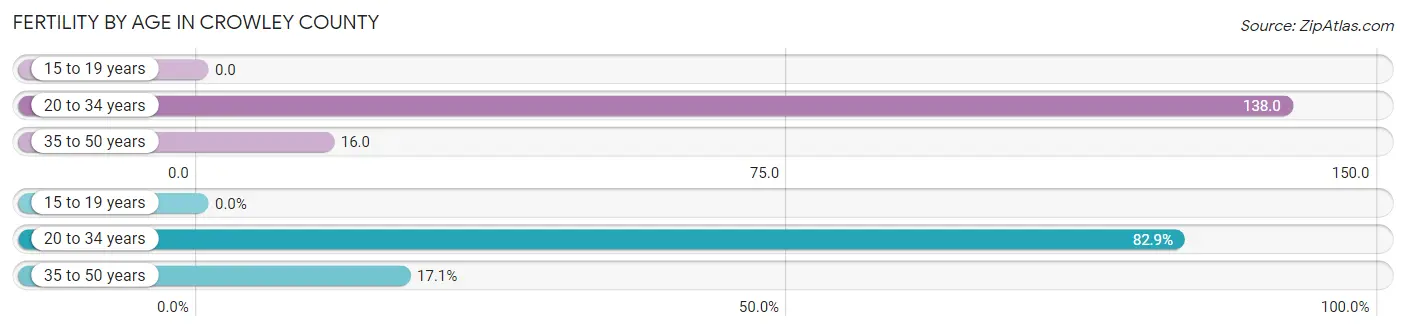
| Age Bracket | Women with Births | Births / 1,000 Women |
| 15 to 19 years | 0 (0.0%) | 0.0 |
| 20 to 34 years | 29 (82.9%) | 138.0 |
| 35 to 50 years | 6 (17.1%) | 16.0 |
| Total | 35 (100.0%) | 48.0 |
Fertility by Age by Marriage Status in Crowley County
57.1% of women with births (35) in Crowley County are married. The highest percentage of unmarried women with births falls into 35 to 50 years age bracket with 100.0% of them unmarried at the time of birth, while the lowest percentage of unmarried women with births belong to 20 to 34 years age bracket with 31.0% of them unmarried.
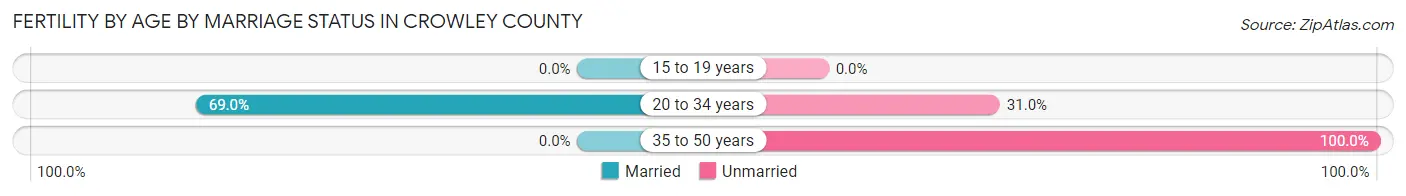
| Age Bracket | Married | Unmarried |
| 15 to 19 years | 0 (0.0%) | 0 (0.0%) |
| 20 to 34 years | 20 (69.0%) | 9 (31.0%) |
| 35 to 50 years | 0 (0.0%) | 6 (100.0%) |
| Total | 20 (57.1%) | 15 (42.9%) |
Fertility by Education in Crowley County
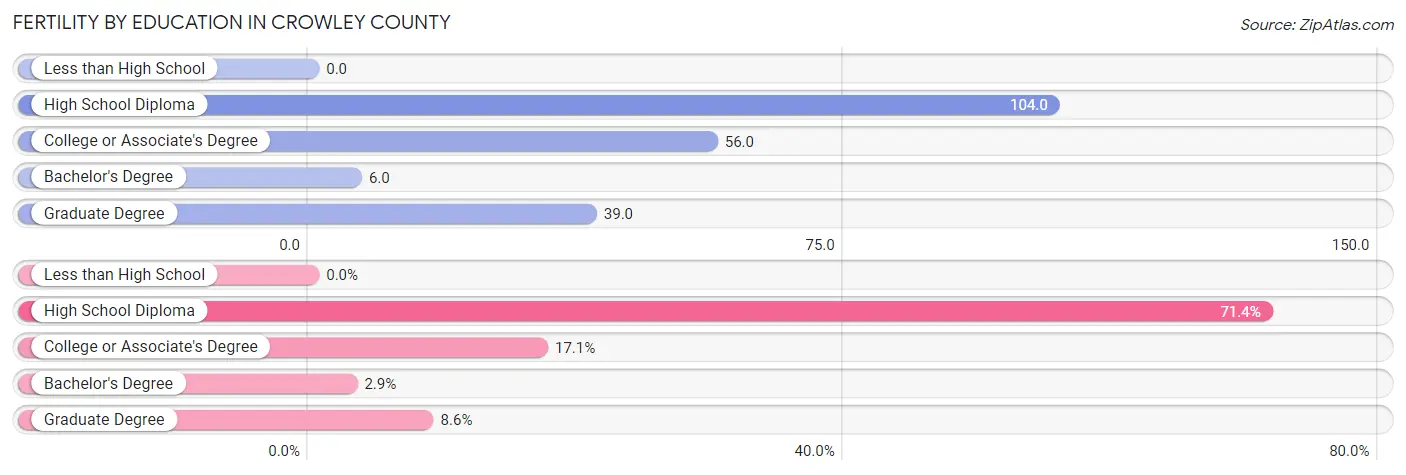
| Educational Attainment | Women with Births | Births / 1,000 Women |
| Less than High School | 0 (0.0%) | 0.0 |
| High School Diploma | 25 (71.4%) | 104.0 |
| College or Associate's Degree | 6 (17.1%) | 56.0 |
| Bachelor's Degree | 1 (2.9%) | 6.0 |
| Graduate Degree | 3 (8.6%) | 39.0 |
| Total | 35 (100.0%) | 48.0 |
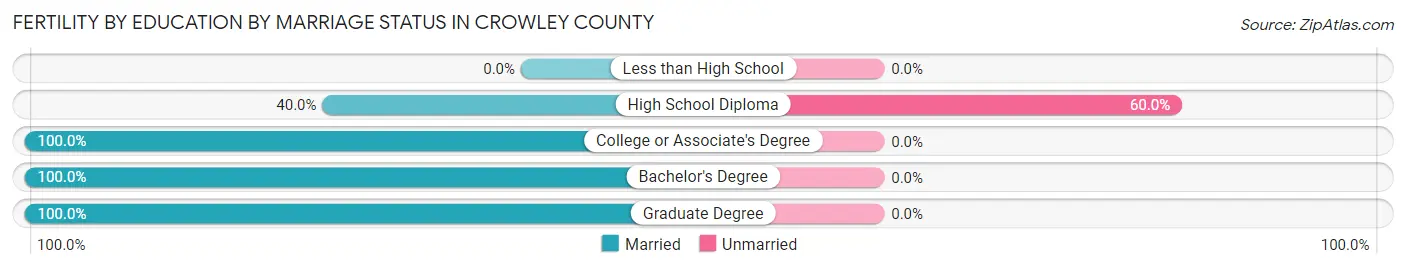
Fertility by Education by Marriage Status in Crowley County
42.9% of women with births in Crowley County are unmarried. Women with the educational attainment of college or associate's degree are most likely to be married with 100.0% of them married at childbirth, while women with the educational attainment of high school diploma are least likely to be married with 60.0% of them unmarried at childbirth.
| Educational Attainment | Married | Unmarried |
| Less than High School | 0 (0.0%) | 0 (0.0%) |
| High School Diploma | 10 (40.0%) | 15 (60.0%) |
| College or Associate's Degree | 6 (100.0%) | 0 (0.0%) |
| Bachelor's Degree | 1 (100.0%) | 0 (0.0%) |
| Graduate Degree | 3 (100.0%) | 0 (0.0%) |
| Total | 20 (57.1%) | 15 (42.9%) |
Employment Characteristics in Crowley County
Employment by Class of Employer in Crowley County
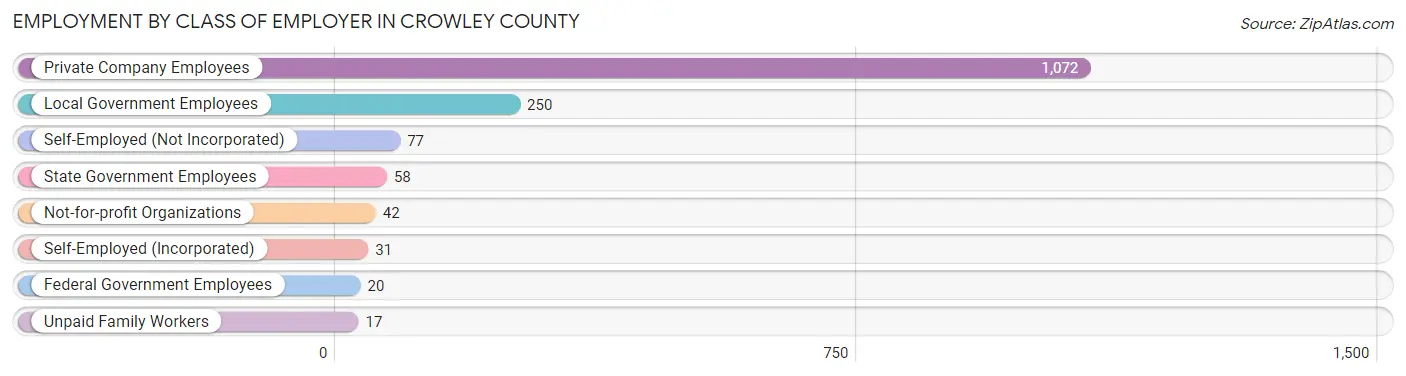
Among the 1,567 employed individuals in Crowley County, private company employees (1,072 | 68.4%), local government employees (250 | 16.0%), and self-employed (not incorporated) (77 | 4.9%) make up the most common classes of employment.
| Employer Class | # Employees | % Employees |
| Private Company Employees | 1,072 | 68.4% |
| Self-Employed (Incorporated) | 31 | 2.0% |
| Self-Employed (Not Incorporated) | 77 | 4.9% |
| Not-for-profit Organizations | 42 | 2.7% |
| Local Government Employees | 250 | 16.0% |
| State Government Employees | 58 | 3.7% |
| Federal Government Employees | 20 | 1.3% |
| Unpaid Family Workers | 17 | 1.1% |
| Total | 1,567 | 100.0% |
Employment Status by Age in Crowley County
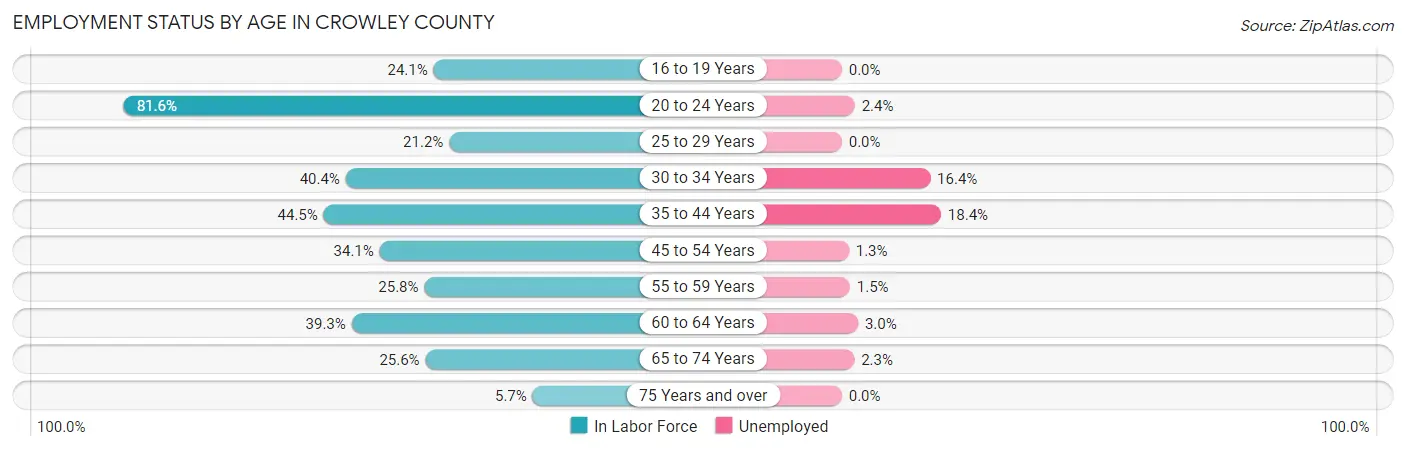
According to the labor force statistics for Crowley County, out of the total population over 16 years of age (5,003), 34.2% or 1,711 individuals are in the labor force, with 7.2% or 123 of them unemployed. The age group with the highest labor force participation rate is 20 to 24 years, with 81.6% or 208 individuals in the labor force. Within the labor force, the 35 to 44 years age range has the highest percentage of unemployed individuals, with 18.4% or 74 of them being unemployed.
| Age Bracket | In Labor Force | Unemployed |
| 16 to 19 Years | 134 (24.1%) | 0 (0.0%) |
| 20 to 24 Years | 208 (81.6%) | 5 (2.4%) |
| 25 to 29 Years | 81 (21.2%) | 0 (0.0%) |
| 30 to 34 Years | 195 (40.4%) | 32 (16.4%) |
| 35 to 44 Years | 402 (44.5%) | 74 (18.4%) |
| 45 to 54 Years | 311 (34.1%) | 4 (1.3%) |
| 55 to 59 Years | 66 (25.8%) | 1 (1.5%) |
| 60 to 64 Years | 165 (39.3%) | 5 (3.0%) |
| 65 to 74 Years | 133 (25.6%) | 3 (2.3%) |
| 75 Years and over | 18 (5.7%) | 0 (0.0%) |
| Total | 1,711 (34.2%) | 123 (7.2%) |
Employment Status by Educational Attainment in Crowley County
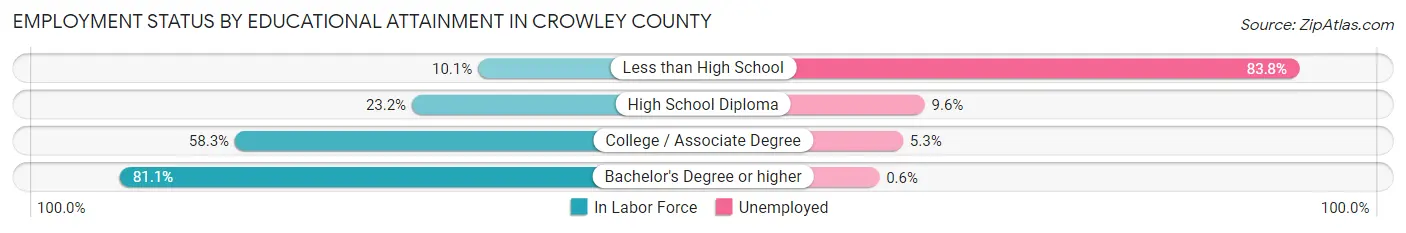
According to labor force statistics for Crowley County, 36.3% of individuals (1,219) out of the total population between 25 and 64 years of age (3,357) are in the labor force, with 9.5% or 116 of them being unemployed. The group with the highest labor force participation rate are those with the educational attainment of bachelor's degree or higher, with 81.1% or 344 individuals in the labor force. Within the labor force, individuals with less than high school education have the highest percentage of unemployment, with 83.8% or 57 of them being unemployed.
| Educational Attainment | In Labor Force | Unemployed |
| Less than High School | 68 (10.1%) | 566 (83.8%) |
| High School Diploma | 335 (23.2%) | 139 (9.6%) |
| College / Associate Degree | 473 (58.3%) | 43 (5.3%) |
| Bachelor's Degree or higher | 344 (81.1%) | 3 (0.6%) |
| Total | 1,219 (36.3%) | 319 (9.5%) |
Employment Occupations by Sex in Crowley County
Management, Business, Science and Arts Occupations
The most common Management, Business, Science and Arts occupations in Crowley County are Community & Social Service (221 | 13.9%), Education Instruction & Library (145 | 9.1%), Management (131 | 8.2%), Health Diagnosing & Treating (90 | 5.7%), and Health Technologists (71 | 4.5%).
Management, Business, Science and Arts Occupations by Sex
Within the Management, Business, Science and Arts occupations in Crowley County, the most male-oriented occupations are Computers, Engineering & Science (90.9%), Computers & Mathematics (90.9%), and Management (78.6%), while the most female-oriented occupations are Legal Services & Support (100.0%), Education, Arts & Media (95.2%), and Community & Social Service (70.6%).
| Occupation | Male | Female |
| Management | 103 (78.6%) | 28 (21.4%) |
| Business & Financial | 21 (63.6%) | 12 (36.4%) |
| Computers, Engineering & Science | 10 (90.9%) | 1 (9.1%) |
| Computers & Mathematics | 10 (90.9%) | 1 (9.1%) |
| Architecture & Engineering | 0 (0.0%) | 0 (0.0%) |
| Life, Physical & Social Science | 0 (0.0%) | 0 (0.0%) |
| Community & Social Service | 65 (29.4%) | 156 (70.6%) |
| Education, Arts & Media | 2 (4.8%) | 40 (95.2%) |
| Legal Services & Support | 0 (0.0%) | 1 (100.0%) |
| Education Instruction & Library | 49 (33.8%) | 96 (66.2%) |
| Arts, Media & Entertainment | 14 (42.4%) | 19 (57.6%) |
| Health Diagnosing & Treating | 40 (44.4%) | 50 (55.6%) |
| Health Technologists | 40 (56.3%) | 31 (43.7%) |
| Total (Category) | 239 (49.2%) | 247 (50.8%) |
| Total (Overall) | 942 (59.3%) | 647 (40.7%) |
Services Occupations
The most common Services occupations in Crowley County are Healthcare Support (190 | 12.0%), Security & Protection (80 | 5.0%), Cleaning & Maintenance (69 | 4.3%), Firefighting & Prevention (40 | 2.5%), and Law Enforcement (40 | 2.5%).
Services Occupations by Sex
Within the Services occupations in Crowley County, the most male-oriented occupations are Food Preparation & Serving (80.9%), Firefighting & Prevention (77.5%), and Cleaning & Maintenance (75.4%), while the most female-oriented occupations are Personal Care & Service (80.0%), Law Enforcement (50.0%), and Healthcare Support (42.1%).
| Occupation | Male | Female |
| Healthcare Support | 110 (57.9%) | 80 (42.1%) |
| Security & Protection | 51 (63.7%) | 29 (36.2%) |
| Firefighting & Prevention | 31 (77.5%) | 9 (22.5%) |
| Law Enforcement | 20 (50.0%) | 20 (50.0%) |
| Food Preparation & Serving | 17 (80.9%) | 4 (19.1%) |
| Cleaning & Maintenance | 52 (75.4%) | 17 (24.6%) |
| Personal Care & Service | 2 (20.0%) | 8 (80.0%) |
| Total (Category) | 232 (62.7%) | 138 (37.3%) |
| Total (Overall) | 942 (59.3%) | 647 (40.7%) |
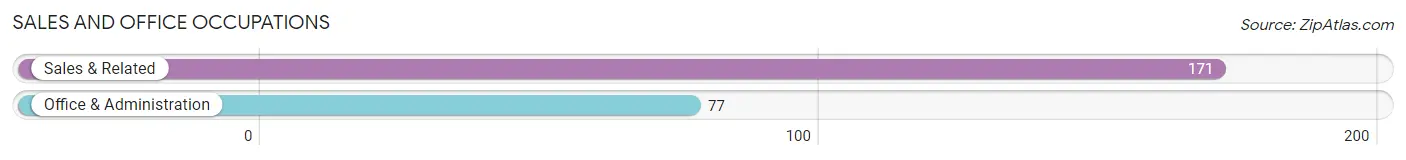
Sales and Office Occupations
The most common Sales and Office occupations in Crowley County are Sales & Related (171 | 10.8%), and Office & Administration (77 | 4.9%).
Sales and Office Occupations by Sex
| Occupation | Male | Female |
| Sales & Related | 46 (26.9%) | 125 (73.1%) |
| Office & Administration | 3 (3.9%) | 74 (96.1%) |
| Total (Category) | 49 (19.8%) | 199 (80.2%) |
| Total (Overall) | 942 (59.3%) | 647 (40.7%) |
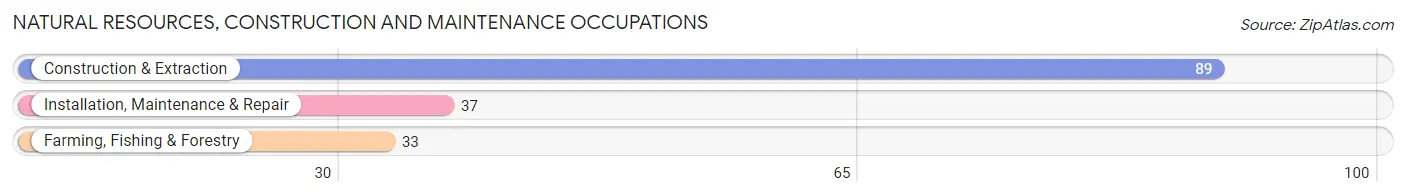
Natural Resources, Construction and Maintenance Occupations
The most common Natural Resources, Construction and Maintenance occupations in Crowley County are Construction & Extraction (89 | 5.6%), Installation, Maintenance & Repair (37 | 2.3%), and Farming, Fishing & Forestry (33 | 2.1%).
Natural Resources, Construction and Maintenance Occupations by Sex
| Occupation | Male | Female |
| Farming, Fishing & Forestry | 20 (60.6%) | 13 (39.4%) |
| Construction & Extraction | 89 (100.0%) | 0 (0.0%) |
| Installation, Maintenance & Repair | 37 (100.0%) | 0 (0.0%) |
| Total (Category) | 146 (91.8%) | 13 (8.2%) |
| Total (Overall) | 942 (59.3%) | 647 (40.7%) |
Production, Transportation and Moving Occupations
The most common Production, Transportation and Moving occupations in Crowley County are Material Moving (144 | 9.1%), Transportation (132 | 8.3%), and Production (50 | 3.2%).
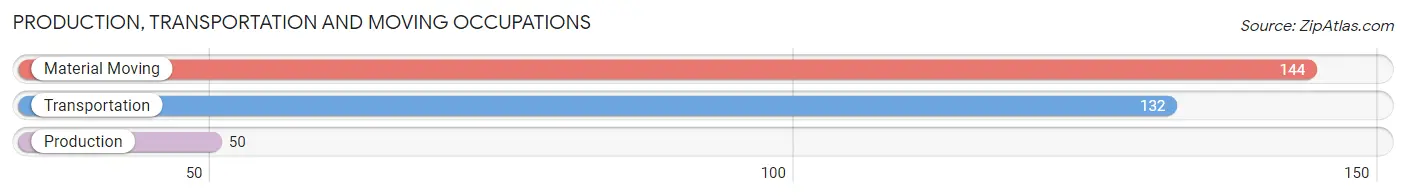
Production, Transportation and Moving Occupations by Sex
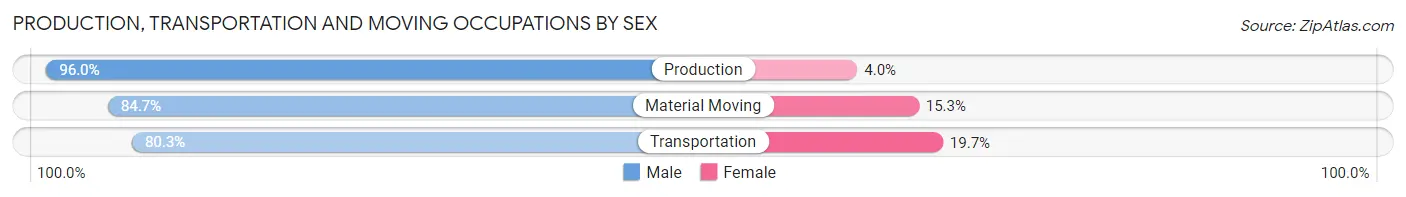
| Occupation | Male | Female |
| Production | 48 (96.0%) | 2 (4.0%) |
| Transportation | 106 (80.3%) | 26 (19.7%) |
| Material Moving | 122 (84.7%) | 22 (15.3%) |
| Total (Category) | 276 (84.7%) | 50 (15.3%) |
| Total (Overall) | 942 (59.3%) | 647 (40.7%) |
Employment Industries by Sex in Crowley County
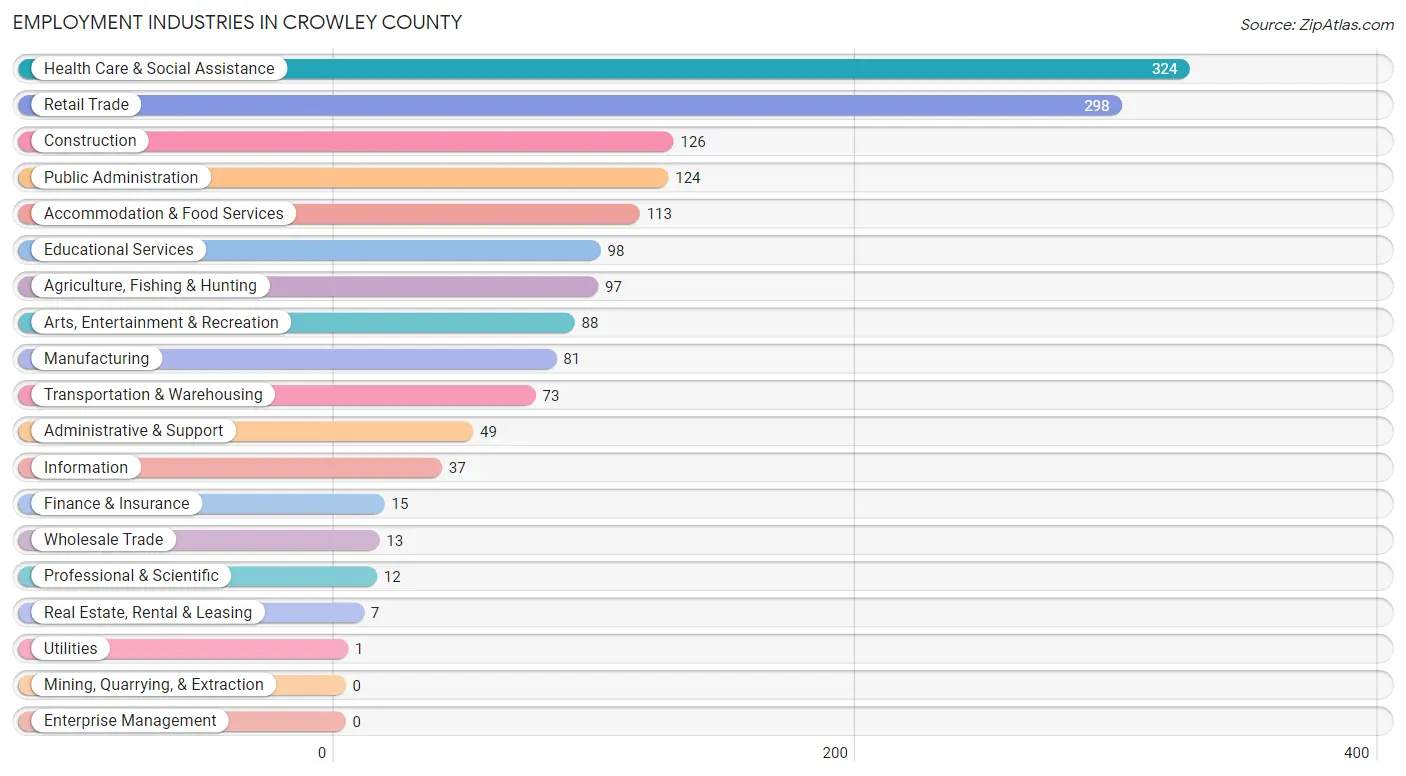
Employment Industries in Crowley County
The major employment industries in Crowley County include Health Care & Social Assistance (324 | 20.4%), Retail Trade (298 | 18.8%), Construction (126 | 7.9%), Public Administration (124 | 7.8%), and Accommodation & Food Services (113 | 7.1%).
Employment Industries by Sex in Crowley County
The Crowley County industries that see more men than women are Construction (100.0%), Wholesale Trade (100.0%), and Utilities (100.0%), whereas the industries that tend to have a higher number of women are Information (91.9%), Public Administration (64.5%), and Educational Services (64.3%).
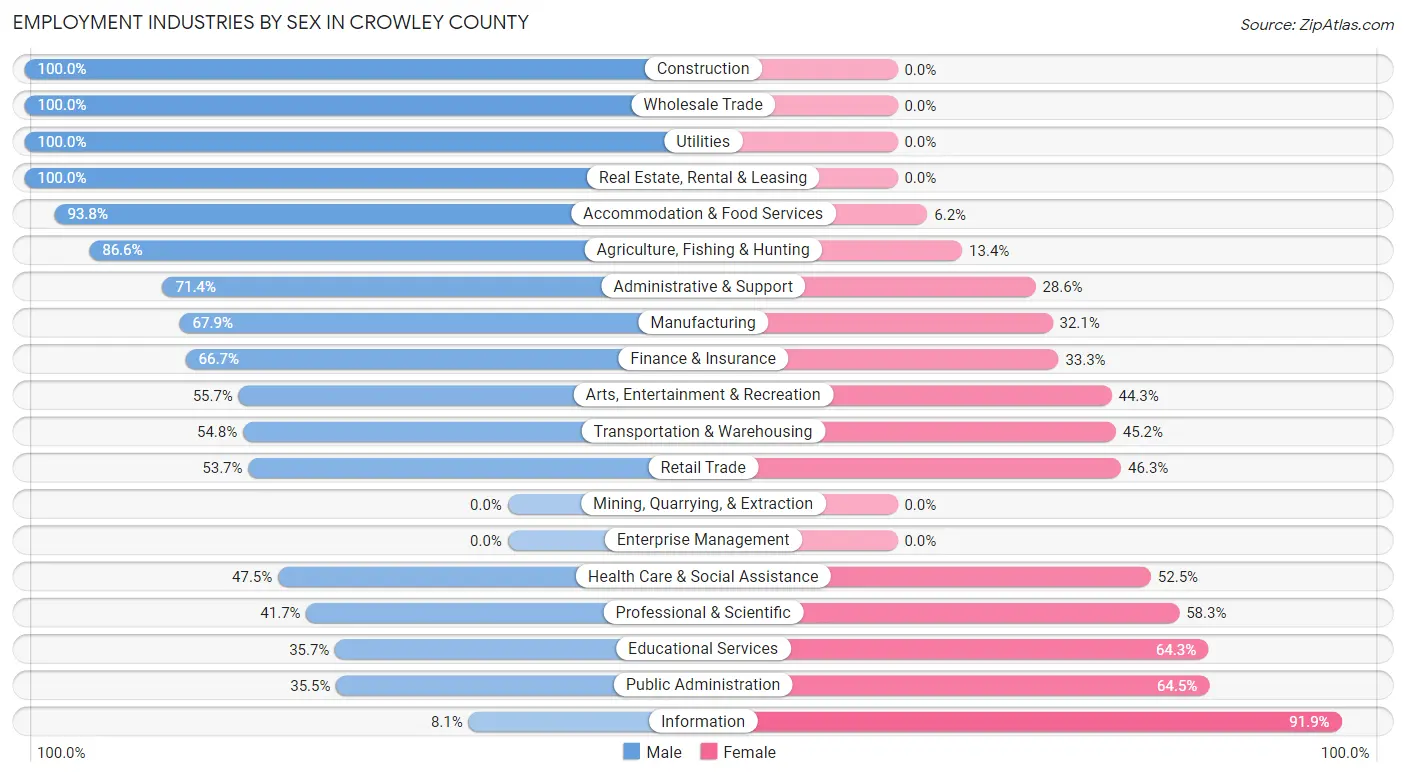
| Industry | Male | Female |
| Agriculture, Fishing & Hunting | 84 (86.6%) | 13 (13.4%) |
| Mining, Quarrying, & Extraction | 0 (0.0%) | 0 (0.0%) |
| Construction | 126 (100.0%) | 0 (0.0%) |
| Manufacturing | 55 (67.9%) | 26 (32.1%) |
| Wholesale Trade | 13 (100.0%) | 0 (0.0%) |
| Retail Trade | 160 (53.7%) | 138 (46.3%) |
| Transportation & Warehousing | 40 (54.8%) | 33 (45.2%) |
| Utilities | 1 (100.0%) | 0 (0.0%) |
| Information | 3 (8.1%) | 34 (91.9%) |
| Finance & Insurance | 10 (66.7%) | 5 (33.3%) |
| Real Estate, Rental & Leasing | 7 (100.0%) | 0 (0.0%) |
| Professional & Scientific | 5 (41.7%) | 7 (58.3%) |
| Enterprise Management | 0 (0.0%) | 0 (0.0%) |
| Administrative & Support | 35 (71.4%) | 14 (28.6%) |
| Educational Services | 35 (35.7%) | 63 (64.3%) |
| Health Care & Social Assistance | 154 (47.5%) | 170 (52.5%) |
| Arts, Entertainment & Recreation | 49 (55.7%) | 39 (44.3%) |
| Accommodation & Food Services | 106 (93.8%) | 7 (6.2%) |
| Public Administration | 44 (35.5%) | 80 (64.5%) |
| Total | 942 (59.3%) | 647 (40.7%) |
Education in Crowley County
School Enrollment in Crowley County
The most common levels of schooling among the 1,204 students in Crowley County are high school (495 | 41.1%), elementary school (223 | 18.5%), and college / undergraduate (173 | 14.4%).
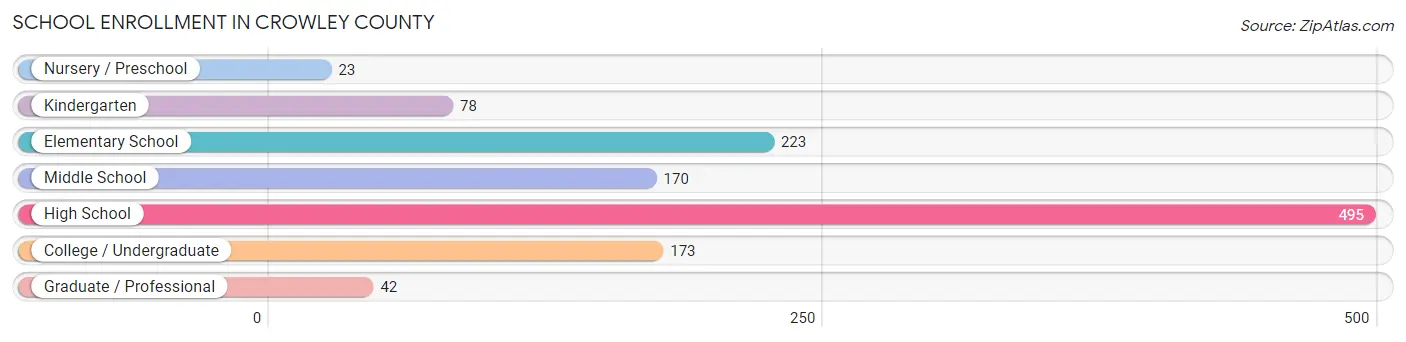
| School Level | # Students | % Students |
| Nursery / Preschool | 23 | 1.9% |
| Kindergarten | 78 | 6.5% |
| Elementary School | 223 | 18.5% |
| Middle School | 170 | 14.1% |
| High School | 495 | 41.1% |
| College / Undergraduate | 173 | 14.4% |
| Graduate / Professional | 42 | 3.5% |
| Total | 1,204 | 100.0% |
School Enrollment by Age by Funding Source in Crowley County
Out of a total of 1,204 students who are enrolled in schools in Crowley County, 150 (12.5%) attend a private institution, while the remaining 1,054 (87.5%) are enrolled in public schools. The age group of 15 to 17 year olds has the highest likelihood of being enrolled in private schools, with 46 (38.0% in the age bracket) enrolled. Conversely, the age group of 3 to 4 year olds has the lowest likelihood of being enrolled in a private school, with 17 (100.0% in the age bracket) attending a public institution.
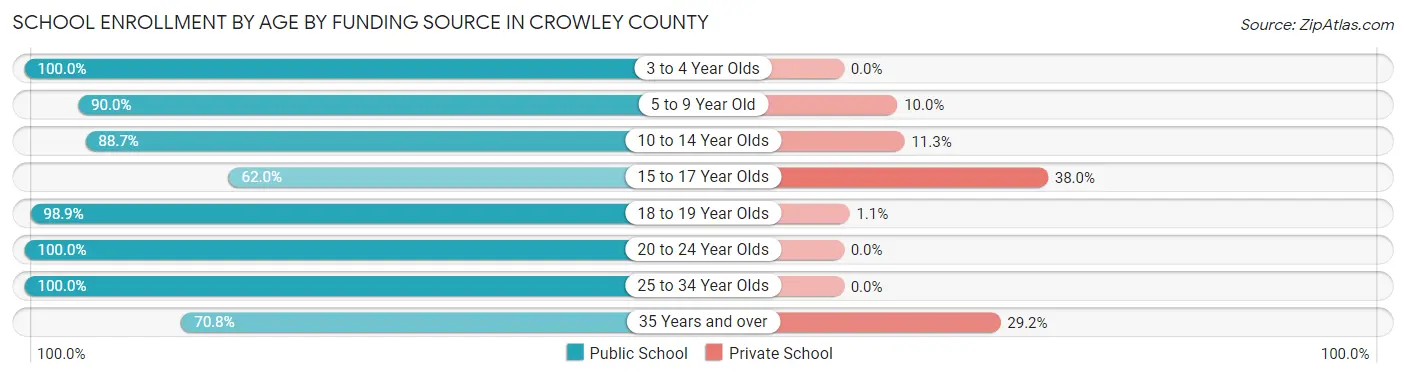
| Age Bracket | Public School | Private School |
| 3 to 4 Year Olds | 17 (100.0%) | 0 (0.0%) |
| 5 to 9 Year Old | 271 (90.0%) | 30 (10.0%) |
| 10 to 14 Year Olds | 180 (88.7%) | 23 (11.3%) |
| 15 to 17 Year Olds | 75 (62.0%) | 46 (38.0%) |
| 18 to 19 Year Olds | 368 (98.9%) | 4 (1.1%) |
| 20 to 24 Year Olds | 26 (100.0%) | 0 (0.0%) |
| 25 to 34 Year Olds | 3 (100.0%) | 0 (0.0%) |
| 35 Years and over | 114 (70.8%) | 47 (29.2%) |
| Total | 1,054 (87.5%) | 150 (12.5%) |
Educational Attainment by Field of Study in Crowley County
Business (120 | 21.3%), education (89 | 15.8%), science & technology (76 | 13.5%), engineering (52 | 9.2%), and communications (49 | 8.7%) are the most common fields of study among 562 individuals in Crowley County who have obtained a bachelor's degree or higher.
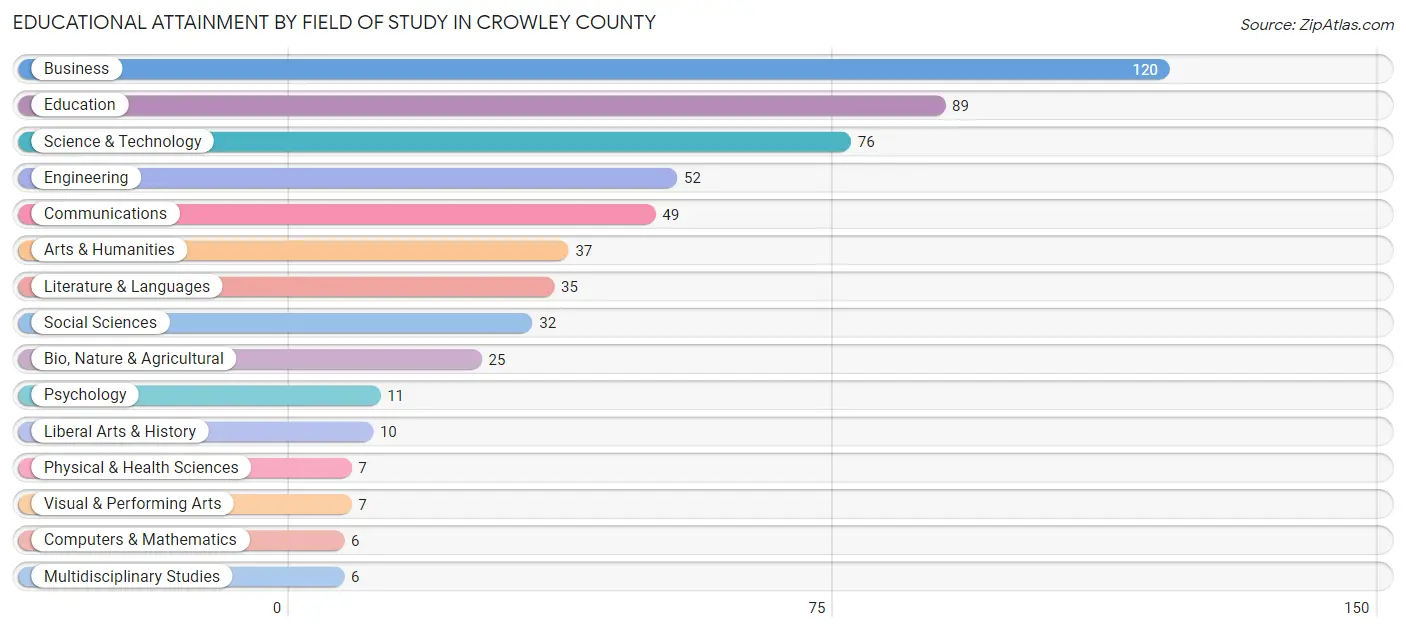
| Field of Study | # Graduates | % Graduates |
| Computers & Mathematics | 6 | 1.1% |
| Bio, Nature & Agricultural | 25 | 4.4% |
| Physical & Health Sciences | 7 | 1.3% |
| Psychology | 11 | 2.0% |
| Social Sciences | 32 | 5.7% |
| Engineering | 52 | 9.2% |
| Multidisciplinary Studies | 6 | 1.1% |
| Science & Technology | 76 | 13.5% |
| Business | 120 | 21.3% |
| Education | 89 | 15.8% |
| Literature & Languages | 35 | 6.2% |
| Liberal Arts & History | 10 | 1.8% |
| Visual & Performing Arts | 7 | 1.3% |
| Communications | 49 | 8.7% |
| Arts & Humanities | 37 | 6.6% |
| Total | 562 | 100.0% |
Transportation & Commute in Crowley County
Vehicle Availability by Sex in Crowley County
The most prevalent vehicle ownership categories in Crowley County are males with 2 vehicles (295, accounting for 31.8%) and females with 2 vehicles (186, making up 46.2%).
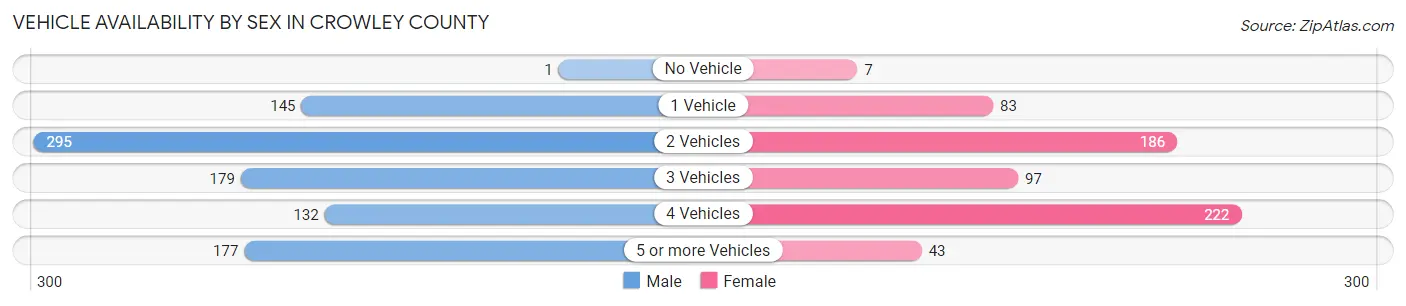
| Vehicles Available | Male | Female |
| No Vehicle | 1 (0.1%) | 7 (1.1%) |
| 1 Vehicle | 145 (15.6%) | 83 (13.0%) |
| 2 Vehicles | 295 (31.8%) | 186 (29.1%) |
| 3 Vehicles | 179 (19.3%) | 97 (15.2%) |
| 4 Vehicles | 132 (14.2%) | 222 (34.8%) |
| 5 or more Vehicles | 177 (19.1%) | 43 (6.7%) |
| Total | 929 (100.0%) | 638 (100.0%) |
Commute Time in Crowley County
The most frequently occuring commute durations in Crowley County are 5 to 9 minutes (272 commuters, 19.1%), 60 to 89 minutes (201 commuters, 14.1%), and 10 to 14 minutes (187 commuters, 13.2%).
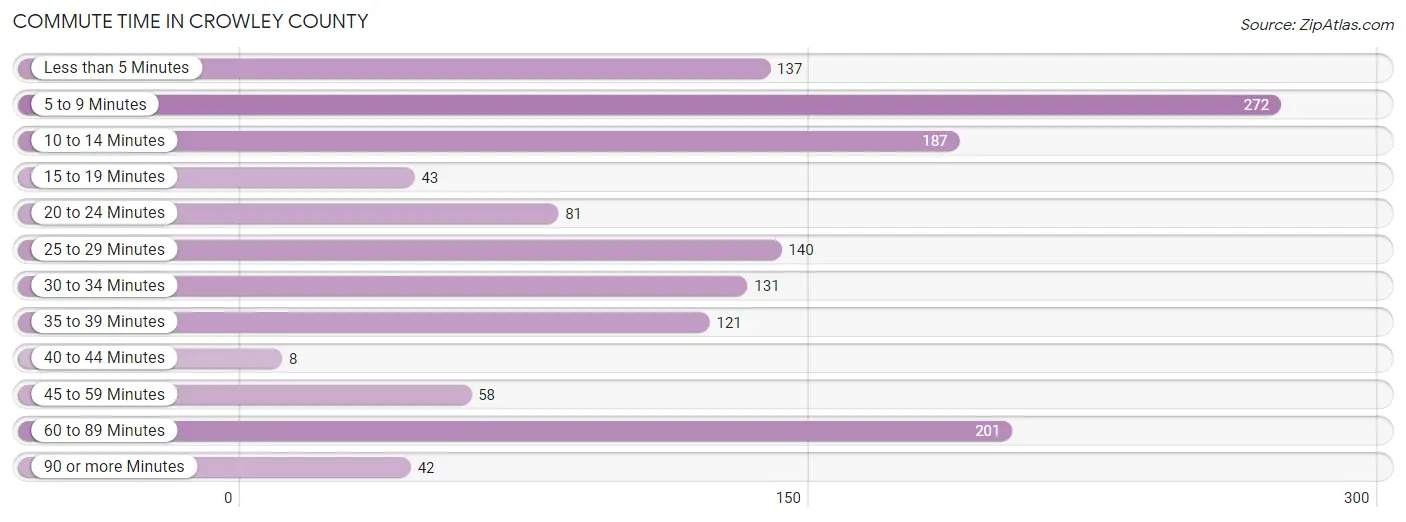
| Commute Time | # Commuters | % Commuters |
| Less than 5 Minutes | 137 | 9.6% |
| 5 to 9 Minutes | 272 | 19.1% |
| 10 to 14 Minutes | 187 | 13.2% |
| 15 to 19 Minutes | 43 | 3.0% |
| 20 to 24 Minutes | 81 | 5.7% |
| 25 to 29 Minutes | 140 | 9.9% |
| 30 to 34 Minutes | 131 | 9.2% |
| 35 to 39 Minutes | 121 | 8.5% |
| 40 to 44 Minutes | 8 | 0.6% |
| 45 to 59 Minutes | 58 | 4.1% |
| 60 to 89 Minutes | 201 | 14.1% |
| 90 or more Minutes | 42 | 3.0% |
Commute Time by Sex in Crowley County
The most common commute times in Crowley County are 5 to 9 minutes (197 commuters, 23.9%) for males and 35 to 39 minutes (102 commuters, 17.1%) for females.
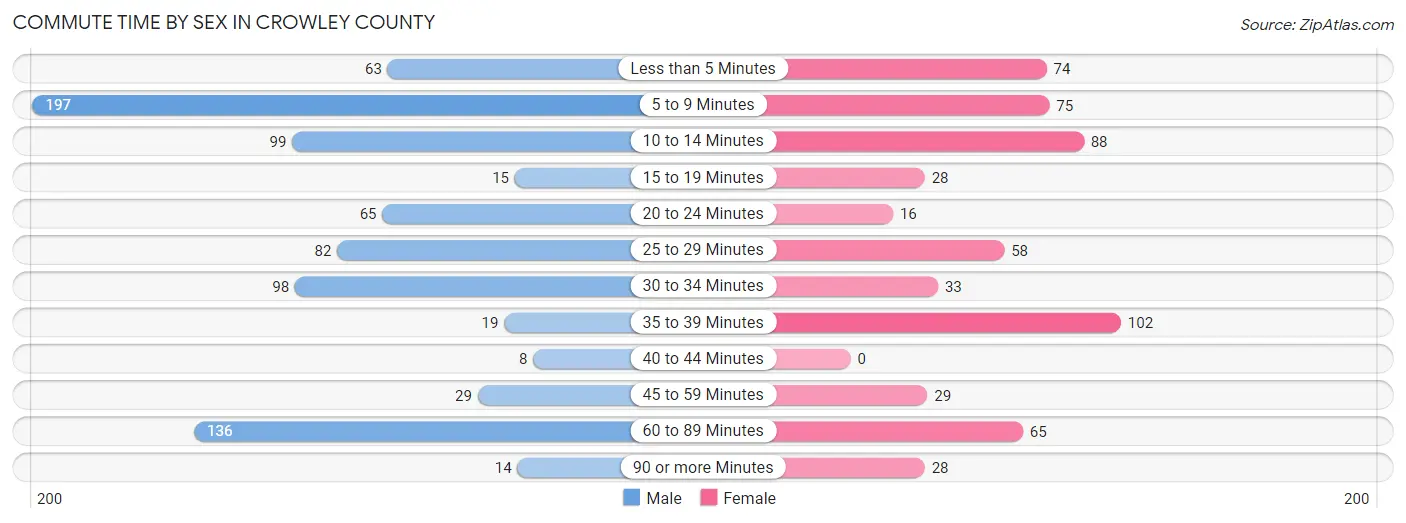
| Commute Time | Male | Female |
| Less than 5 Minutes | 63 (7.6%) | 74 (12.4%) |
| 5 to 9 Minutes | 197 (23.9%) | 75 (12.6%) |
| 10 to 14 Minutes | 99 (12.0%) | 88 (14.8%) |
| 15 to 19 Minutes | 15 (1.8%) | 28 (4.7%) |
| 20 to 24 Minutes | 65 (7.9%) | 16 (2.7%) |
| 25 to 29 Minutes | 82 (9.9%) | 58 (9.7%) |
| 30 to 34 Minutes | 98 (11.9%) | 33 (5.5%) |
| 35 to 39 Minutes | 19 (2.3%) | 102 (17.1%) |
| 40 to 44 Minutes | 8 (1.0%) | 0 (0.0%) |
| 45 to 59 Minutes | 29 (3.5%) | 29 (4.9%) |
| 60 to 89 Minutes | 136 (16.5%) | 65 (10.9%) |
| 90 or more Minutes | 14 (1.7%) | 28 (4.7%) |
Time of Departure to Work by Sex in Crowley County
The most frequent times of departure to work in Crowley County are 12:00 PM to 3:59 PM (181, 21.9%) for males and 7:00 AM to 7:29 AM (149, 25.0%) for females.
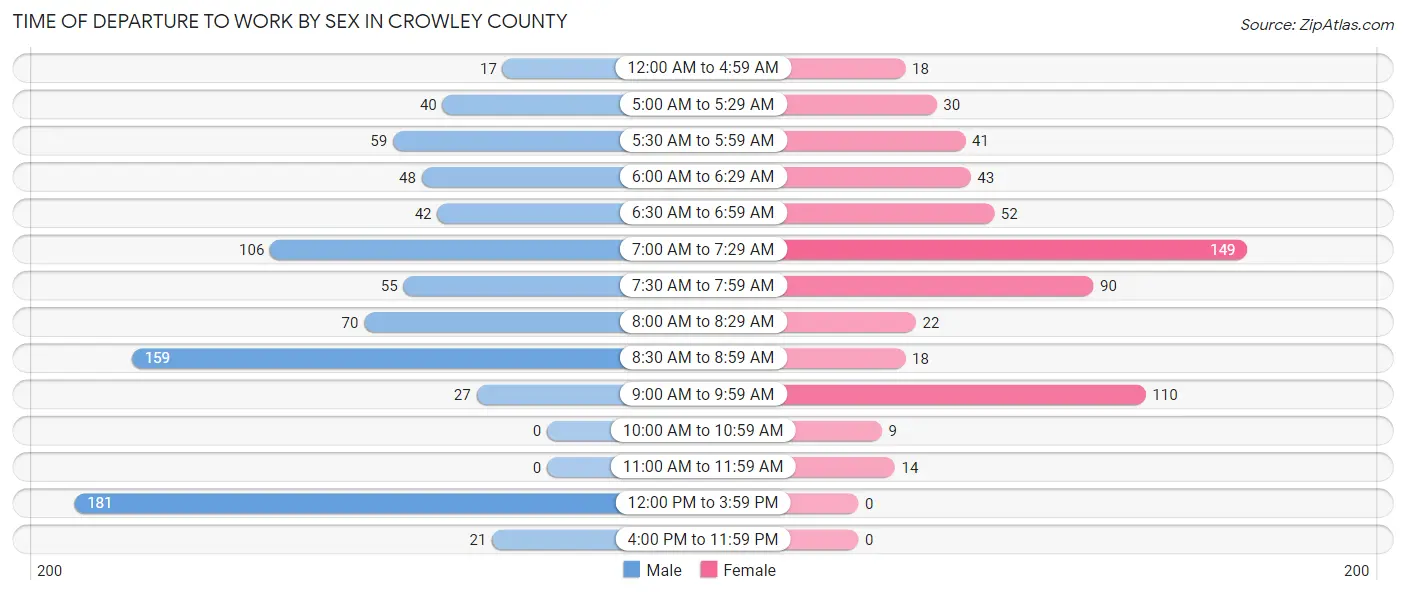
| Time of Departure | Male | Female |
| 12:00 AM to 4:59 AM | 17 (2.1%) | 18 (3.0%) |
| 5:00 AM to 5:29 AM | 40 (4.9%) | 30 (5.0%) |
| 5:30 AM to 5:59 AM | 59 (7.1%) | 41 (6.9%) |
| 6:00 AM to 6:29 AM | 48 (5.8%) | 43 (7.2%) |
| 6:30 AM to 6:59 AM | 42 (5.1%) | 52 (8.7%) |
| 7:00 AM to 7:29 AM | 106 (12.9%) | 149 (25.0%) |
| 7:30 AM to 7:59 AM | 55 (6.7%) | 90 (15.1%) |
| 8:00 AM to 8:29 AM | 70 (8.5%) | 22 (3.7%) |
| 8:30 AM to 8:59 AM | 159 (19.3%) | 18 (3.0%) |
| 9:00 AM to 9:59 AM | 27 (3.3%) | 110 (18.5%) |
| 10:00 AM to 10:59 AM | 0 (0.0%) | 9 (1.5%) |
| 11:00 AM to 11:59 AM | 0 (0.0%) | 14 (2.4%) |
| 12:00 PM to 3:59 PM | 181 (21.9%) | 0 (0.0%) |
| 4:00 PM to 11:59 PM | 21 (2.5%) | 0 (0.0%) |
| Total | 825 (100.0%) | 596 (100.0%) |
Housing Occupancy in Crowley County
Occupancy by Ownership in Crowley County
Of the total 1,315 dwellings in Crowley County, owner-occupied units account for 936 (71.2%), while renter-occupied units make up 379 (28.8%).
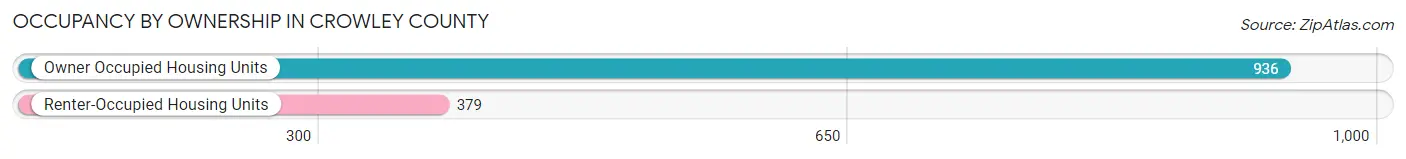
| Occupancy | # Housing Units | % Housing Units |
| Owner Occupied Housing Units | 936 | 71.2% |
| Renter-Occupied Housing Units | 379 | 28.8% |
| Total Occupied Housing Units | 1,315 | 100.0% |
Occupancy by Household Size in Crowley County
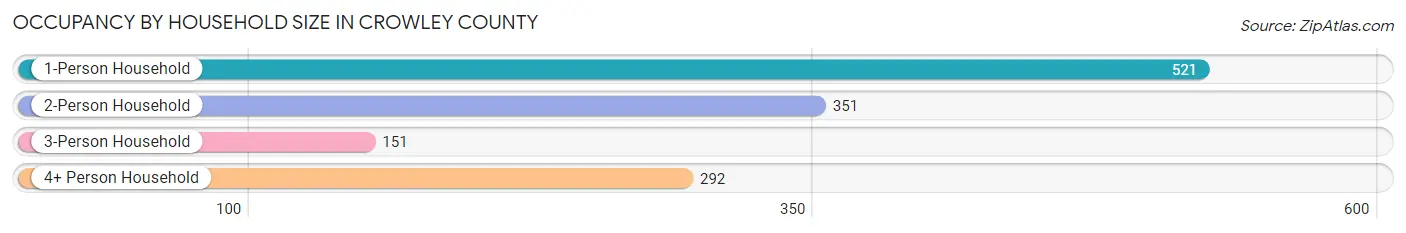
| Household Size | # Housing Units | % Housing Units |
| 1-Person Household | 521 | 39.6% |
| 2-Person Household | 351 | 26.7% |
| 3-Person Household | 151 | 11.5% |
| 4+ Person Household | 292 | 22.2% |
| Total Housing Units | 1,315 | 100.0% |
Occupancy by Ownership by Household Size in Crowley County
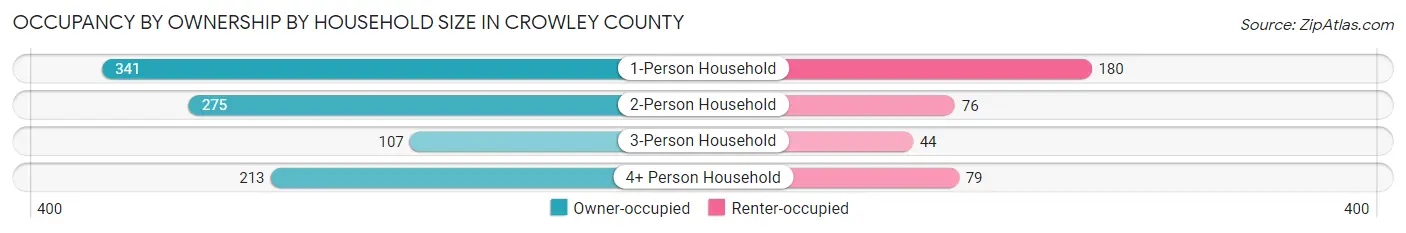
| Household Size | Owner-occupied | Renter-occupied |
| 1-Person Household | 341 (65.4%) | 180 (34.5%) |
| 2-Person Household | 275 (78.3%) | 76 (21.6%) |
| 3-Person Household | 107 (70.9%) | 44 (29.1%) |
| 4+ Person Household | 213 (73.0%) | 79 (27.1%) |
| Total Housing Units | 936 (71.2%) | 379 (28.8%) |
Occupancy by Educational Attainment in Crowley County
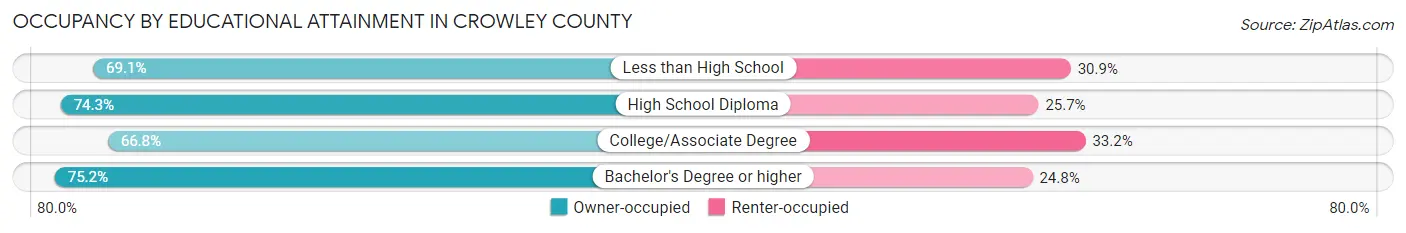
| Household Size | Owner-occupied | Renter-occupied |
| Less than High School | 56 (69.1%) | 25 (30.9%) |
| High School Diploma | 352 (74.3%) | 122 (25.7%) |
| College/Associate Degree | 346 (66.8%) | 172 (33.2%) |
| Bachelor's Degree or higher | 182 (75.2%) | 60 (24.8%) |
Occupancy by Age of Householder in Crowley County
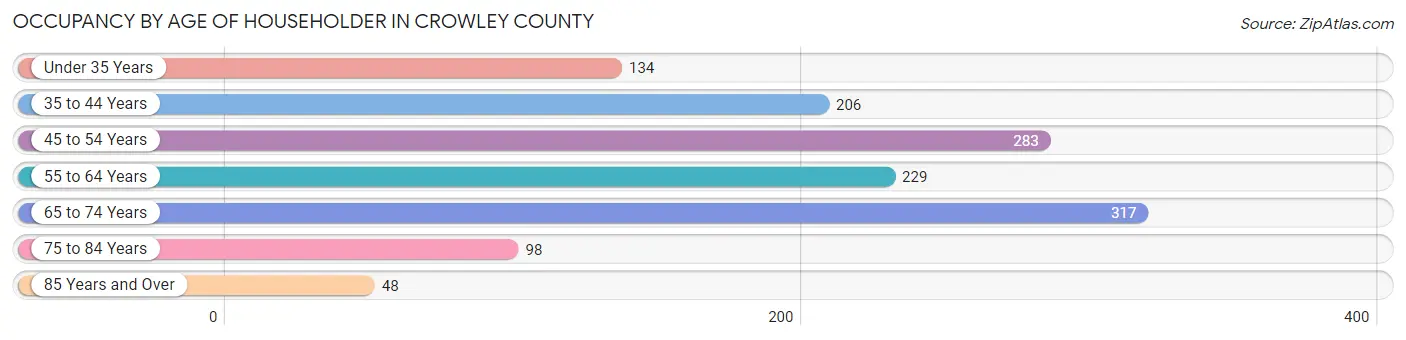
| Age Bracket | # Households | % Households |
| Under 35 Years | 134 | 10.2% |
| 35 to 44 Years | 206 | 15.7% |
| 45 to 54 Years | 283 | 21.5% |
| 55 to 64 Years | 229 | 17.4% |
| 65 to 74 Years | 317 | 24.1% |
| 75 to 84 Years | 98 | 7.4% |
| 85 Years and Over | 48 | 3.6% |
| Total | 1,315 | 100.0% |
Housing Finances in Crowley County
Median Income by Occupancy in Crowley County
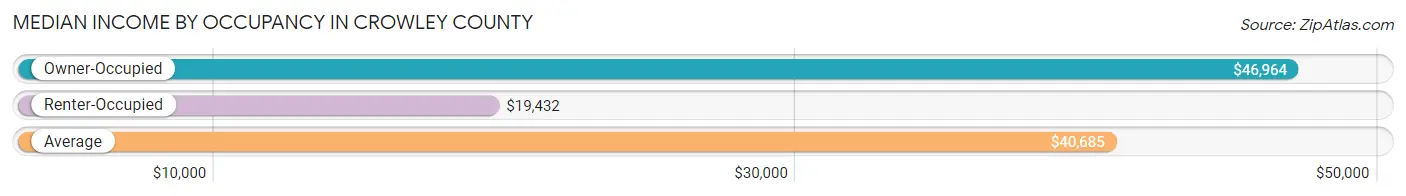
| Occupancy Type | # Households | Median Income |
| Owner-Occupied | 936 (71.2%) | $46,964 |
| Renter-Occupied | 379 (28.8%) | $19,432 |
| Average | 1,315 (100.0%) | $40,685 |
Occupancy by Householder Income Bracket in Crowley County
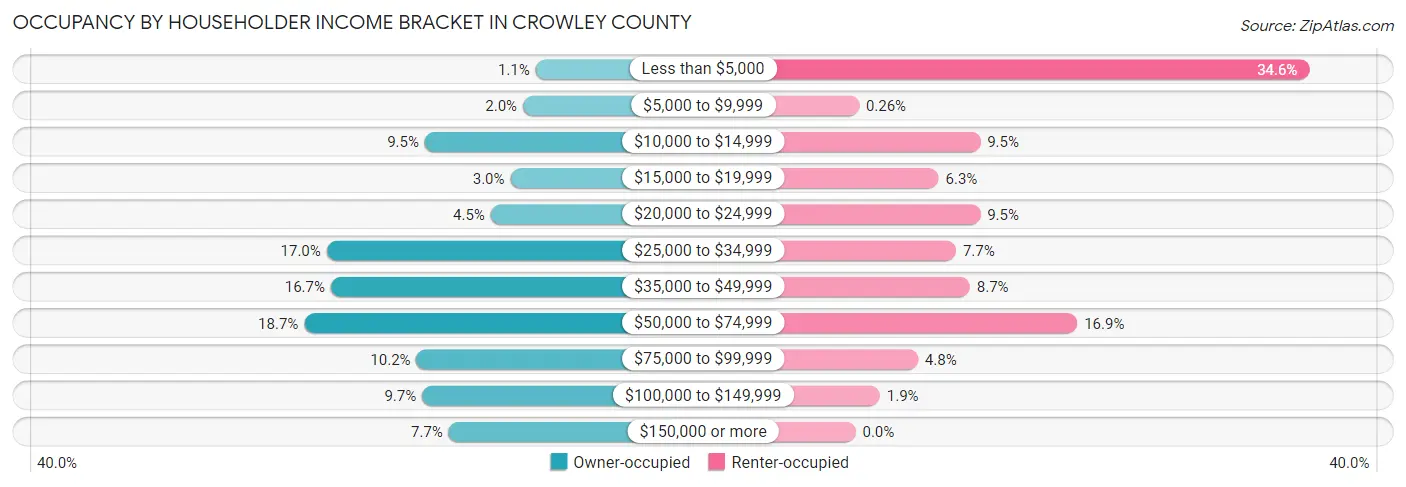
| Income Bracket | Owner-occupied | Renter-occupied |
| Less than $5,000 | 10 (1.1%) | 131 (34.6%) |
| $5,000 to $9,999 | 19 (2.0%) | 1 (0.3%) |
| $10,000 to $14,999 | 89 (9.5%) | 36 (9.5%) |
| $15,000 to $19,999 | 28 (3.0%) | 24 (6.3%) |
| $20,000 to $24,999 | 42 (4.5%) | 36 (9.5%) |
| $25,000 to $34,999 | 159 (17.0%) | 29 (7.6%) |
| $35,000 to $49,999 | 156 (16.7%) | 33 (8.7%) |
| $50,000 to $74,999 | 175 (18.7%) | 64 (16.9%) |
| $75,000 to $99,999 | 95 (10.2%) | 18 (4.8%) |
| $100,000 to $149,999 | 91 (9.7%) | 7 (1.8%) |
| $150,000 or more | 72 (7.7%) | 0 (0.0%) |
| Total | 936 (100.0%) | 379 (100.0%) |
Monthly Housing Cost Tiers in Crowley County
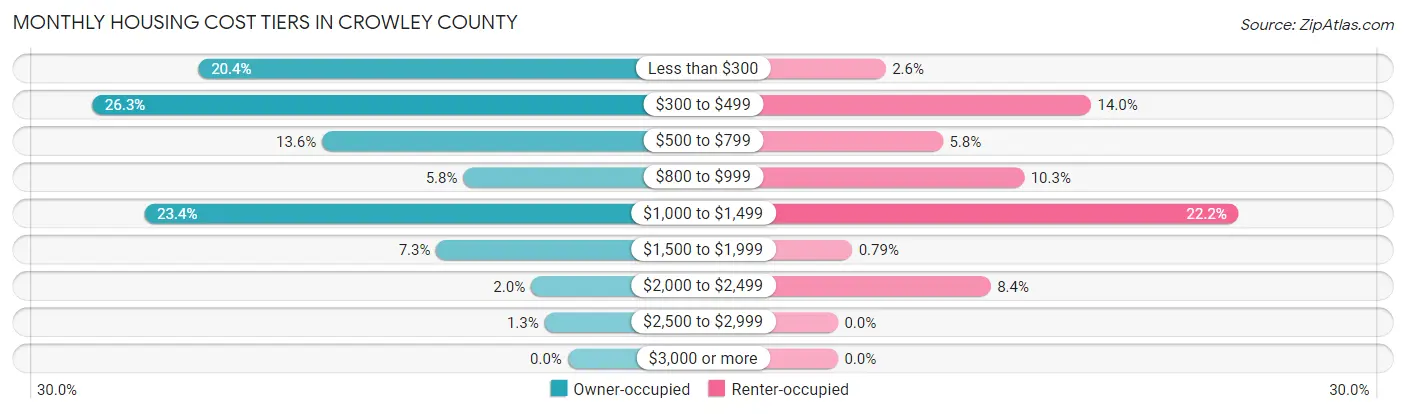
| Monthly Cost | Owner-occupied | Renter-occupied |
| Less than $300 | 191 (20.4%) | 10 (2.6%) |
| $300 to $499 | 246 (26.3%) | 53 (14.0%) |
| $500 to $799 | 127 (13.6%) | 22 (5.8%) |
| $800 to $999 | 54 (5.8%) | 39 (10.3%) |
| $1,000 to $1,499 | 219 (23.4%) | 84 (22.2%) |
| $1,500 to $1,999 | 68 (7.3%) | 3 (0.8%) |
| $2,000 to $2,499 | 19 (2.0%) | 32 (8.4%) |
| $2,500 to $2,999 | 12 (1.3%) | 0 (0.0%) |
| $3,000 or more | 0 (0.0%) | 0 (0.0%) |
| Total | 936 (100.0%) | 379 (100.0%) |
Physical Housing Characteristics in Crowley County
Housing Structures in Crowley County
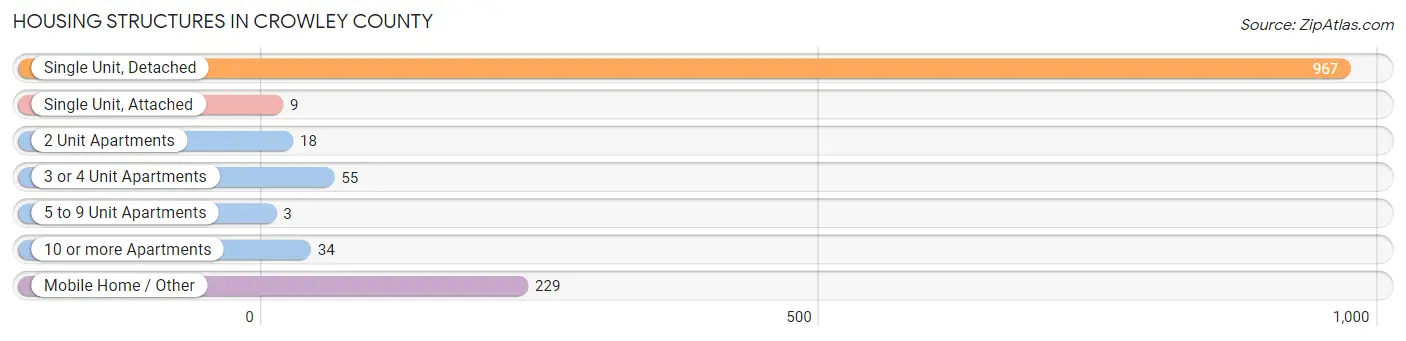
| Structure Type | # Housing Units | % Housing Units |
| Single Unit, Detached | 967 | 73.5% |
| Single Unit, Attached | 9 | 0.7% |
| 2 Unit Apartments | 18 | 1.4% |
| 3 or 4 Unit Apartments | 55 | 4.2% |
| 5 to 9 Unit Apartments | 3 | 0.2% |
| 10 or more Apartments | 34 | 2.6% |
| Mobile Home / Other | 229 | 17.4% |
| Total | 1,315 | 100.0% |
Housing Structures by Occupancy in Crowley County
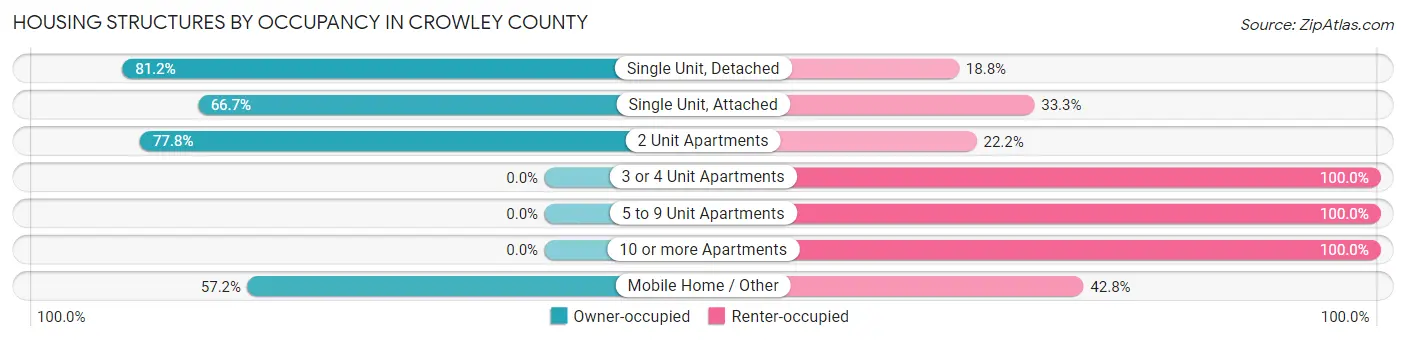
| Structure Type | Owner-occupied | Renter-occupied |
| Single Unit, Detached | 785 (81.2%) | 182 (18.8%) |
| Single Unit, Attached | 6 (66.7%) | 3 (33.3%) |
| 2 Unit Apartments | 14 (77.8%) | 4 (22.2%) |
| 3 or 4 Unit Apartments | 0 (0.0%) | 55 (100.0%) |
| 5 to 9 Unit Apartments | 0 (0.0%) | 3 (100.0%) |
| 10 or more Apartments | 0 (0.0%) | 34 (100.0%) |
| Mobile Home / Other | 131 (57.2%) | 98 (42.8%) |
| Total | 936 (71.2%) | 379 (28.8%) |
Housing Structures by Number of Rooms in Crowley County
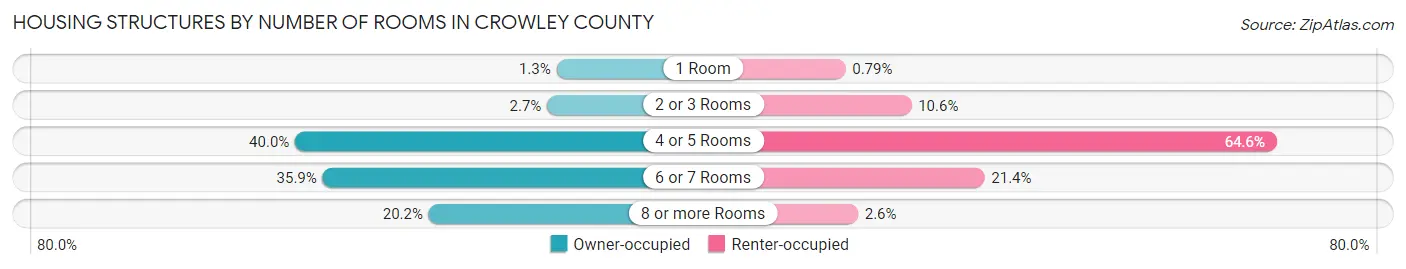
| Number of Rooms | Owner-occupied | Renter-occupied |
| 1 Room | 12 (1.3%) | 3 (0.8%) |
| 2 or 3 Rooms | 25 (2.7%) | 40 (10.5%) |
| 4 or 5 Rooms | 374 (40.0%) | 245 (64.6%) |
| 6 or 7 Rooms | 336 (35.9%) | 81 (21.4%) |
| 8 or more Rooms | 189 (20.2%) | 10 (2.6%) |
| Total | 936 (100.0%) | 379 (100.0%) |
Housing Structure by Heating Type in Crowley County
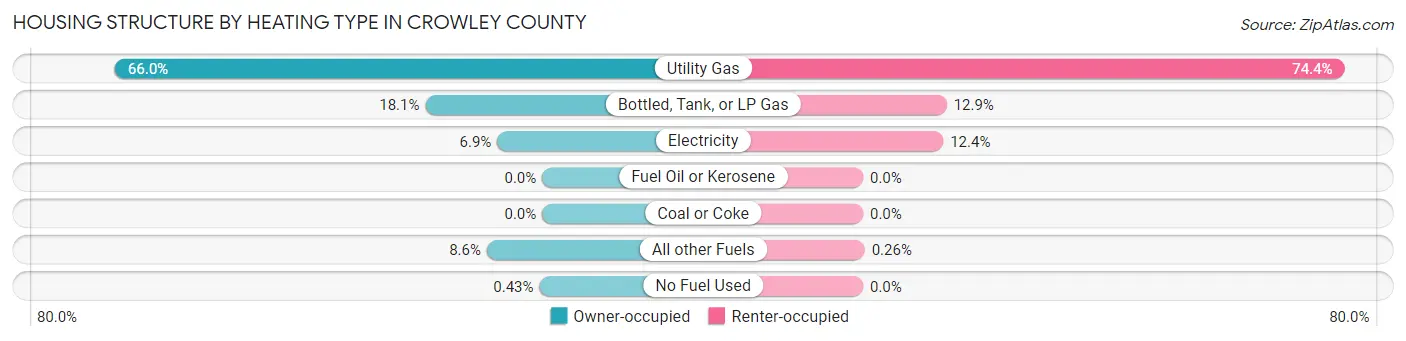
| Heating Type | Owner-occupied | Renter-occupied |
| Utility Gas | 618 (66.0%) | 282 (74.4%) |
| Bottled, Tank, or LP Gas | 169 (18.1%) | 49 (12.9%) |
| Electricity | 65 (6.9%) | 47 (12.4%) |
| Fuel Oil or Kerosene | 0 (0.0%) | 0 (0.0%) |
| Coal or Coke | 0 (0.0%) | 0 (0.0%) |
| All other Fuels | 80 (8.6%) | 1 (0.3%) |
| No Fuel Used | 4 (0.4%) | 0 (0.0%) |
| Total | 936 (100.0%) | 379 (100.0%) |
Household Vehicle Usage in Crowley County
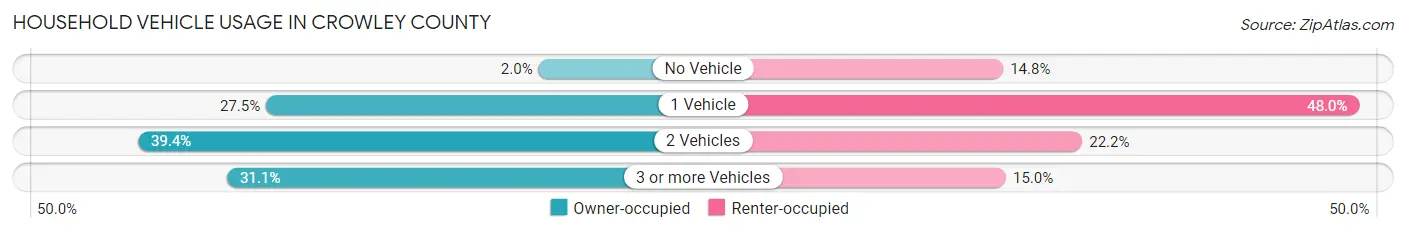
| Vehicles per Household | Owner-occupied | Renter-occupied |
| No Vehicle | 19 (2.0%) | 56 (14.8%) |
| 1 Vehicle | 257 (27.5%) | 182 (48.0%) |
| 2 Vehicles | 369 (39.4%) | 84 (22.2%) |
| 3 or more Vehicles | 291 (31.1%) | 57 (15.0%) |
| Total | 936 (100.0%) | 379 (100.0%) |
Real Estate & Mortgages in Crowley County
Real Estate and Mortgage Overview in Crowley County
| Characteristic | Without Mortgage | With Mortgage |
| Housing Units | 515 | 421 |
| Median Property Value | $68,500 | $126,000 |
| Median Household Income | $33,641 | $42 |
| Monthly Housing Costs | $343 | $0 |
| Real Estate Taxes | $435 | $2 |
Property Value by Mortgage Status in Crowley County
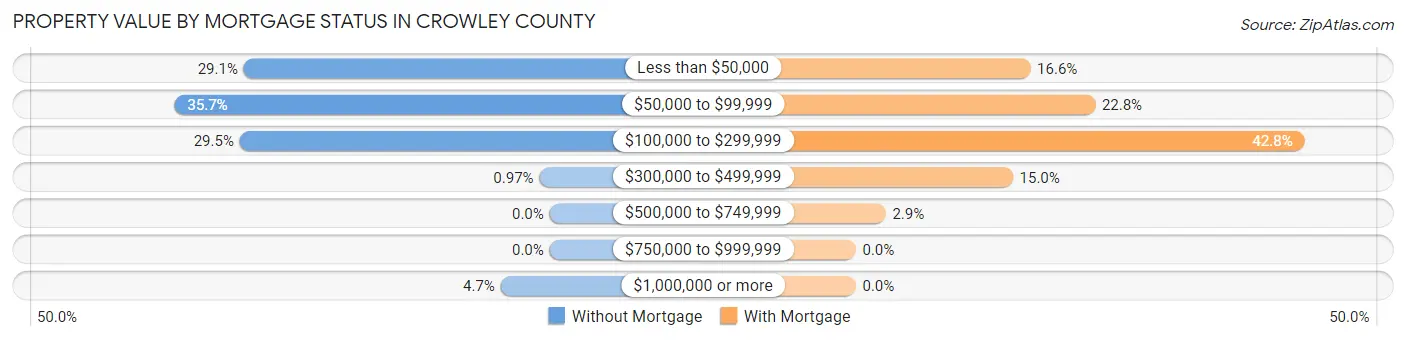
| Property Value | Without Mortgage | With Mortgage |
| Less than $50,000 | 150 (29.1%) | 70 (16.6%) |
| $50,000 to $99,999 | 184 (35.7%) | 96 (22.8%) |
| $100,000 to $299,999 | 152 (29.5%) | 180 (42.8%) |
| $300,000 to $499,999 | 5 (1.0%) | 63 (15.0%) |
| $500,000 to $749,999 | 0 (0.0%) | 12 (2.9%) |
| $750,000 to $999,999 | 0 (0.0%) | 0 (0.0%) |
| $1,000,000 or more | 24 (4.7%) | 0 (0.0%) |
| Total | 515 (100.0%) | 421 (100.0%) |
Household Income by Mortgage Status in Crowley County
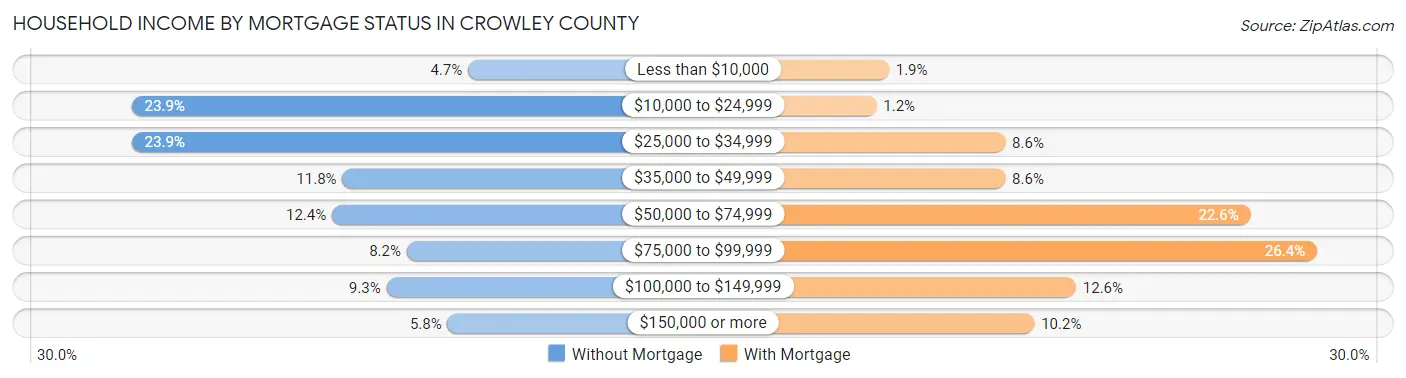
| Household Income | Without Mortgage | With Mortgage |
| Less than $10,000 | 24 (4.7%) | 8 (1.9%) |
| $10,000 to $24,999 | 123 (23.9%) | 5 (1.2%) |
| $25,000 to $34,999 | 123 (23.9%) | 36 (8.6%) |
| $35,000 to $49,999 | 61 (11.8%) | 36 (8.6%) |
| $50,000 to $74,999 | 64 (12.4%) | 95 (22.6%) |
| $75,000 to $99,999 | 42 (8.2%) | 111 (26.4%) |
| $100,000 to $149,999 | 48 (9.3%) | 53 (12.6%) |
| $150,000 or more | 30 (5.8%) | 43 (10.2%) |
| Total | 515 (100.0%) | 421 (100.0%) |
Property Value to Household Income Ratio in Crowley County
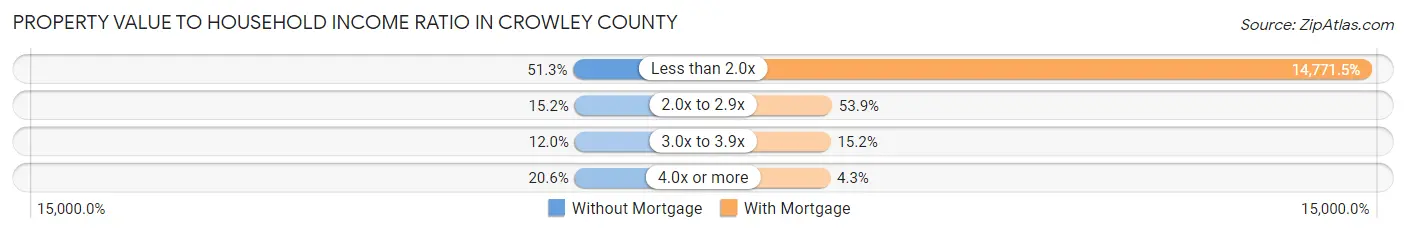
| Value-to-Income Ratio | Without Mortgage | With Mortgage |
| Less than 2.0x | 264 (51.3%) | 62,188 (14,771.5%) |
| 2.0x to 2.9x | 78 (15.1%) | 227 (53.9%) |
| 3.0x to 3.9x | 62 (12.0%) | 64 (15.2%) |
| 4.0x or more | 106 (20.6%) | 18 (4.3%) |
| Total | 515 (100.0%) | 421 (100.0%) |
Real Estate Taxes by Mortgage Status in Crowley County
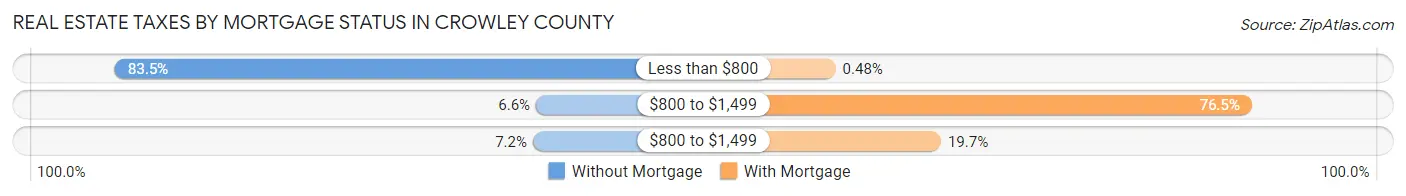
| Property Taxes | Without Mortgage | With Mortgage |
| Less than $800 | 430 (83.5%) | 2 (0.5%) |
| $800 to $1,499 | 34 (6.6%) | 322 (76.5%) |
| $800 to $1,499 | 37 (7.2%) | 83 (19.7%) |
| Total | 515 (100.0%) | 421 (100.0%) |
Health & Disability in Crowley County
Health Insurance Coverage by Age in Crowley County
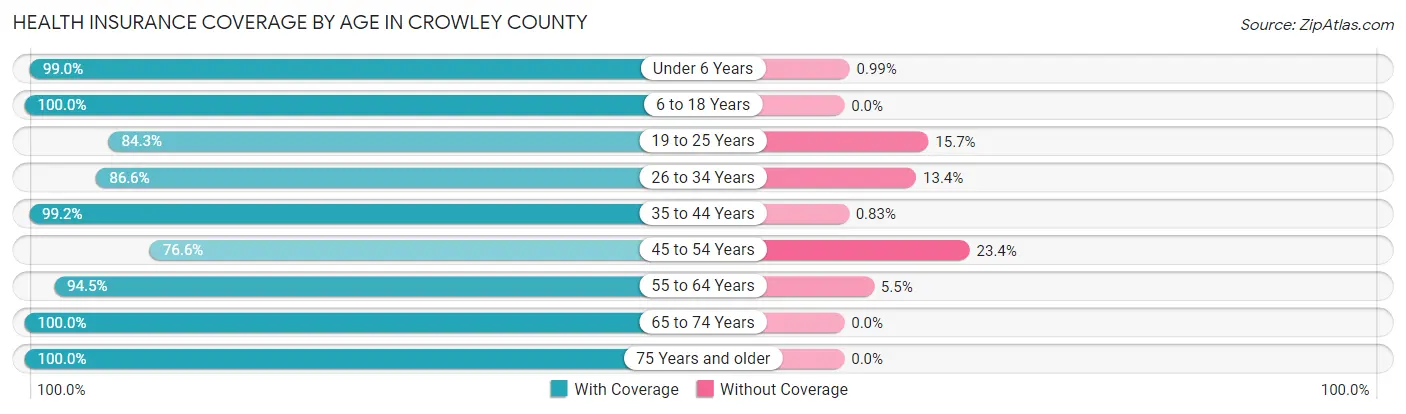
| Age Bracket | With Coverage | Without Coverage |
| Under 6 Years | 200 (99.0%) | 2 (1.0%) |
| 6 to 18 Years | 1,043 (100.0%) | 0 (0.0%) |
| 19 to 25 Years | 285 (84.3%) | 53 (15.7%) |
| 26 to 34 Years | 317 (86.6%) | 49 (13.4%) |
| 35 to 44 Years | 595 (99.2%) | 5 (0.8%) |
| 45 to 54 Years | 505 (76.6%) | 154 (23.4%) |
| 55 to 64 Years | 496 (94.5%) | 29 (5.5%) |
| 65 to 74 Years | 426 (100.0%) | 0 (0.0%) |
| 75 Years and older | 290 (100.0%) | 0 (0.0%) |
| Total | 4,157 (93.4%) | 292 (6.6%) |
Health Insurance Coverage by Citizenship Status in Crowley County
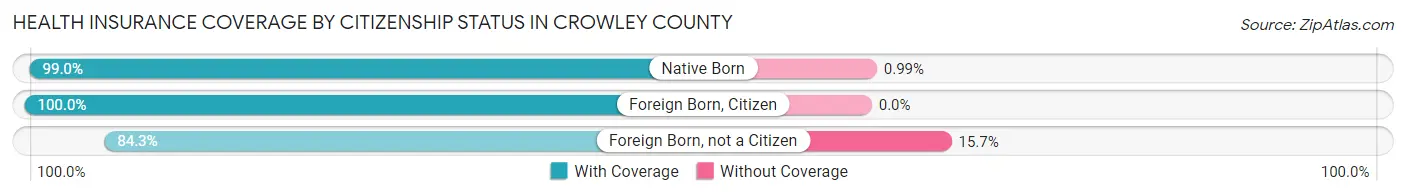
| Citizenship Status | With Coverage | Without Coverage |
| Native Born | 200 (99.0%) | 2 (1.0%) |
| Foreign Born, Citizen | 1,043 (100.0%) | 0 (0.0%) |
| Foreign Born, not a Citizen | 285 (84.3%) | 53 (15.7%) |
Health Insurance Coverage by Household Income in Crowley County
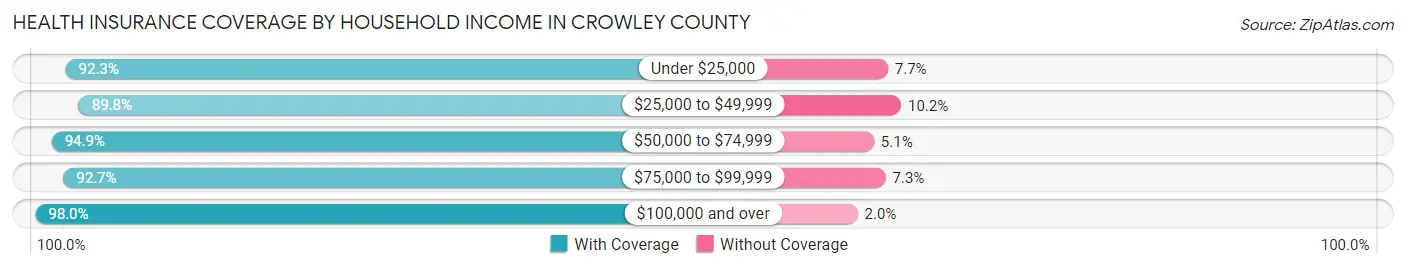
| Household Income | With Coverage | Without Coverage |
| Under $25,000 | 828 (92.3%) | 69 (7.7%) |
| $25,000 to $49,999 | 1,043 (89.8%) | 118 (10.2%) |
| $50,000 to $74,999 | 953 (94.9%) | 51 (5.1%) |
| $75,000 to $99,999 | 459 (92.7%) | 36 (7.3%) |
| $100,000 and over | 874 (98.0%) | 18 (2.0%) |
Public vs Private Health Insurance Coverage by Age in Crowley County
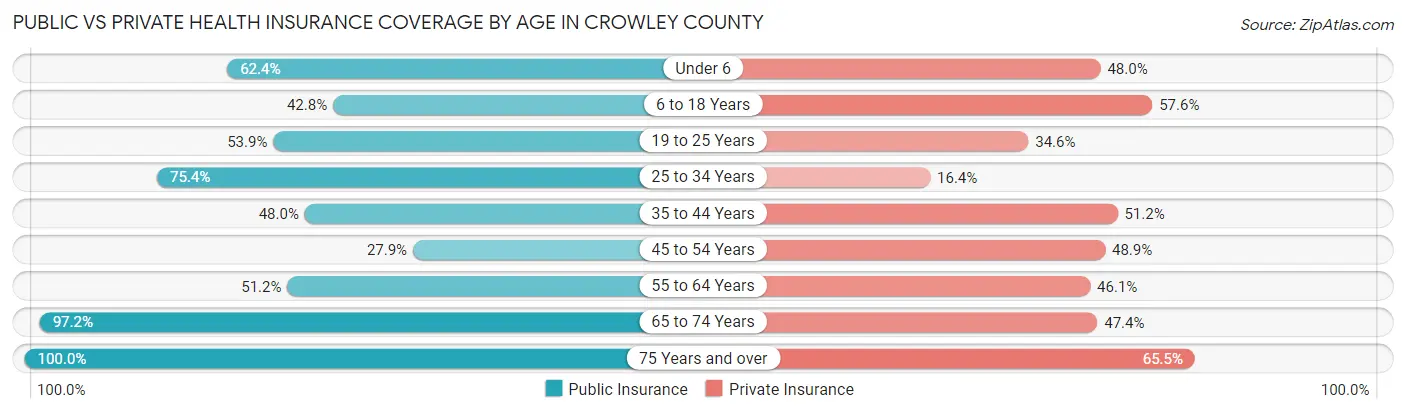
| Age Bracket | Public Insurance | Private Insurance |
| Under 6 | 126 (62.4%) | 97 (48.0%) |
| 6 to 18 Years | 446 (42.8%) | 601 (57.6%) |
| 19 to 25 Years | 182 (53.8%) | 117 (34.6%) |
| 25 to 34 Years | 276 (75.4%) | 60 (16.4%) |
| 35 to 44 Years | 288 (48.0%) | 307 (51.2%) |
| 45 to 54 Years | 184 (27.9%) | 322 (48.9%) |
| 55 to 64 Years | 269 (51.2%) | 242 (46.1%) |
| 65 to 74 Years | 414 (97.2%) | 202 (47.4%) |
| 75 Years and over | 290 (100.0%) | 190 (65.5%) |
| Total | 2,475 (55.6%) | 2,138 (48.1%) |
Disability Status by Sex by Age in Crowley County
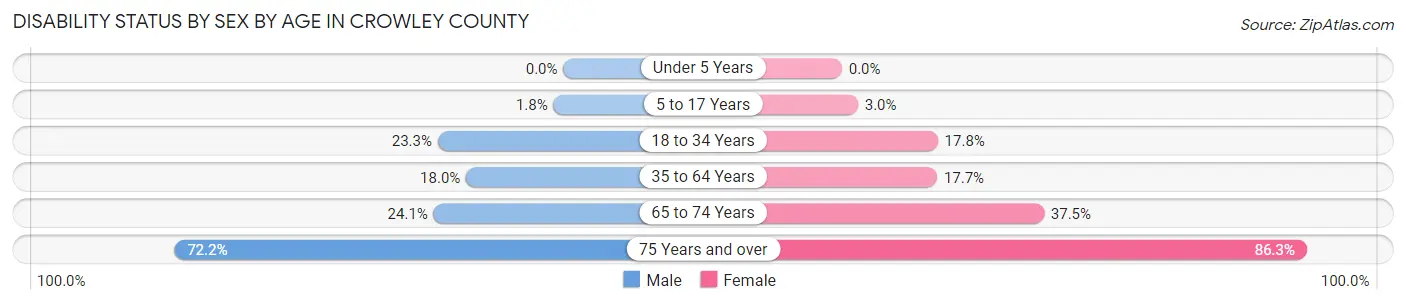
| Age Bracket | Male | Female |
| Under 5 Years | 0 (0.0%) | 0 (0.0%) |
| 5 to 17 Years | 6 (1.8%) | 10 (3.0%) |
| 18 to 34 Years | 193 (23.3%) | 50 (17.8%) |
| 35 to 64 Years | 191 (18.0%) | 128 (17.7%) |
| 65 to 74 Years | 39 (24.1%) | 99 (37.5%) |
| 75 Years and over | 104 (72.2%) | 126 (86.3%) |
Disability Class by Sex by Age in Crowley County
Disability Class: Hearing Difficulty
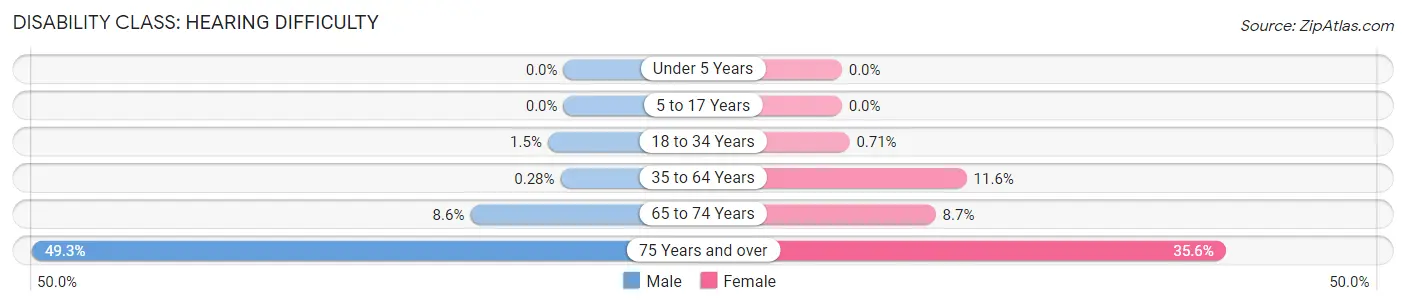
| Age Bracket | Male | Female |
| Under 5 Years | 0 (0.0%) | 0 (0.0%) |
| 5 to 17 Years | 0 (0.0%) | 0 (0.0%) |
| 18 to 34 Years | 12 (1.5%) | 2 (0.7%) |
| 35 to 64 Years | 3 (0.3%) | 84 (11.6%) |
| 65 to 74 Years | 14 (8.6%) | 23 (8.7%) |
| 75 Years and over | 71 (49.3%) | 52 (35.6%) |
Disability Class: Vision Difficulty
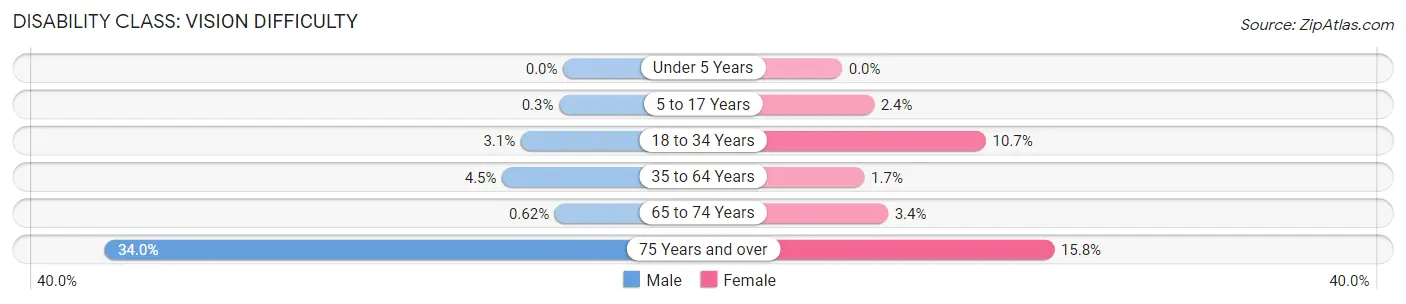
| Age Bracket | Male | Female |
| Under 5 Years | 0 (0.0%) | 0 (0.0%) |
| 5 to 17 Years | 1 (0.3%) | 8 (2.4%) |
| 18 to 34 Years | 26 (3.1%) | 30 (10.7%) |
| 35 to 64 Years | 48 (4.5%) | 12 (1.7%) |
| 65 to 74 Years | 1 (0.6%) | 9 (3.4%) |
| 75 Years and over | 49 (34.0%) | 23 (15.8%) |
Disability Class: Cognitive Difficulty
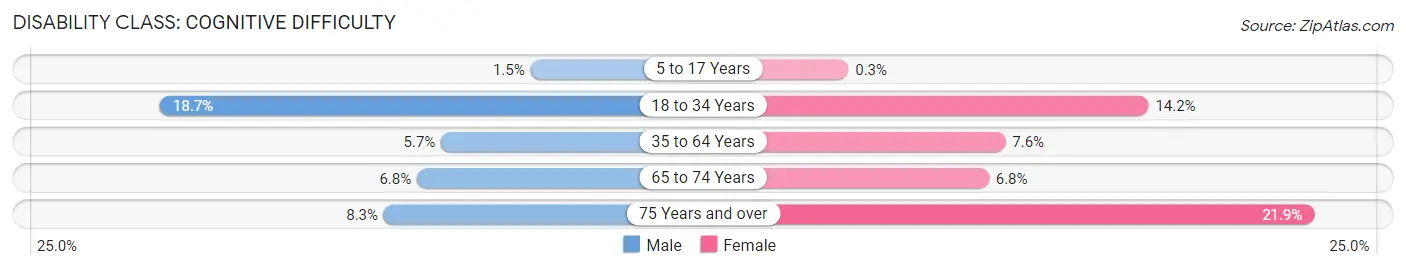
| Age Bracket | Male | Female |
| 5 to 17 Years | 5 (1.5%) | 1 (0.3%) |
| 18 to 34 Years | 155 (18.7%) | 40 (14.2%) |
| 35 to 64 Years | 60 (5.7%) | 55 (7.6%) |
| 65 to 74 Years | 11 (6.8%) | 18 (6.8%) |
| 75 Years and over | 12 (8.3%) | 32 (21.9%) |
Disability Class: Ambulatory Difficulty
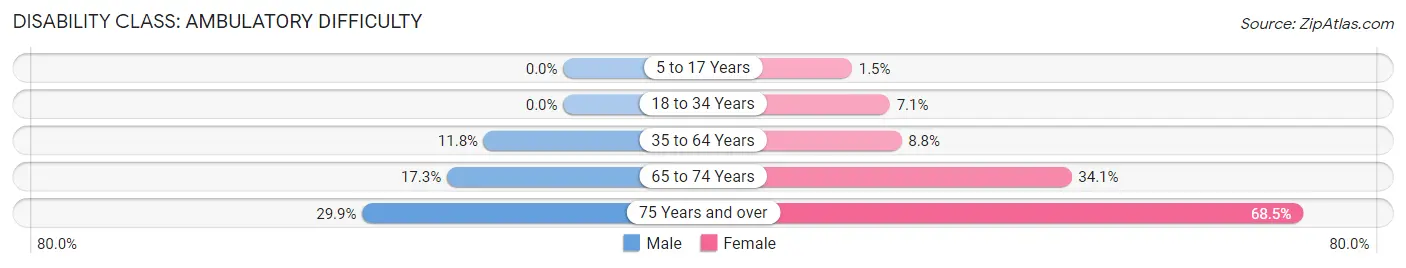
| Age Bracket | Male | Female |
| 5 to 17 Years | 0 (0.0%) | 5 (1.5%) |
| 18 to 34 Years | 0 (0.0%) | 20 (7.1%) |
| 35 to 64 Years | 125 (11.8%) | 64 (8.8%) |
| 65 to 74 Years | 28 (17.3%) | 90 (34.1%) |
| 75 Years and over | 43 (29.9%) | 100 (68.5%) |
Disability Class: Self-Care Difficulty
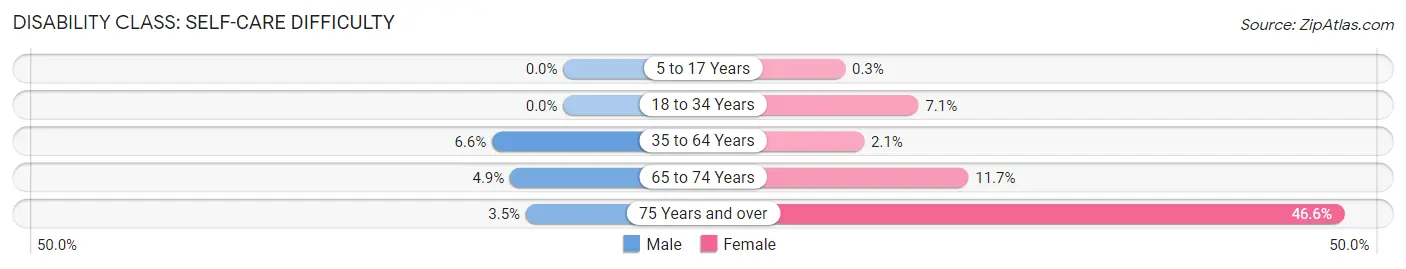
| Age Bracket | Male | Female |
| 5 to 17 Years | 0 (0.0%) | 1 (0.3%) |
| 18 to 34 Years | 0 (0.0%) | 20 (7.1%) |
| 35 to 64 Years | 70 (6.6%) | 15 (2.1%) |
| 65 to 74 Years | 8 (4.9%) | 31 (11.7%) |
| 75 Years and over | 5 (3.5%) | 68 (46.6%) |
Technology Access in Crowley County
Computing Device Access in Crowley County
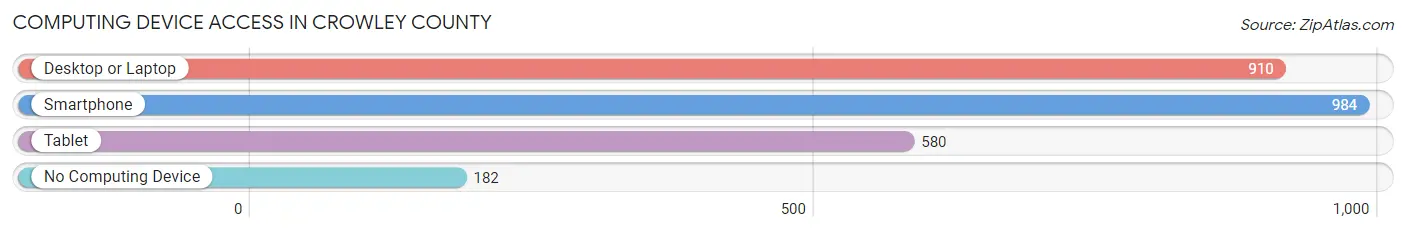
| Device Type | # Households | % Households |
| Desktop or Laptop | 910 | 69.2% |
| Smartphone | 984 | 74.8% |
| Tablet | 580 | 44.1% |
| No Computing Device | 182 | 13.8% |
| Total | 1,315 | 100.0% |
Internet Access in Crowley County
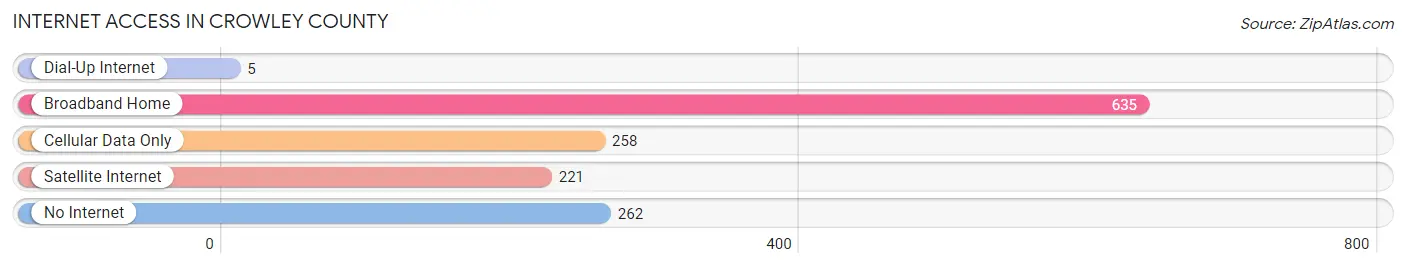
| Internet Type | # Households | % Households |
| Dial-Up Internet | 5 | 0.4% |
| Broadband Home | 635 | 48.3% |
| Cellular Data Only | 258 | 19.6% |
| Satellite Internet | 221 | 16.8% |
| No Internet | 262 | 19.9% |
| Total | 1,315 | 100.0% |
Crowley County Summary
Crowley County is located in the southeastern corner of Colorado, and is bordered by Otero County to the north, Bent County to the east, and Kiowa County to the south. The county seat is Ordway, and the county is named after John H. Crowley, a prominent early settler. Crowley County covers an area of 1,541 square miles, and has a population of 5,839 as of the 2020 census.
Geography
Crowley County is located in the High Plains region of Colorado, and is characterized by flat to rolling terrain. The county is drained by the Arkansas River, which flows through the northern part of the county. The county is also home to several small lakes, including Lake Henry, Lake Meredith, and Lake Meredith State Park. The county is mostly covered in grassland, with some areas of shrubland and riparian vegetation.
The climate of Crowley County is semi-arid, with hot summers and cold winters. The average annual precipitation is around 15 inches, with most of it falling in the spring and summer months.
History
Crowley County was established in 1889, and was named after John H. Crowley, a prominent early settler. The county was originally inhabited by the Ute and Arapaho tribes, and was later settled by ranchers and farmers. The county was largely agricultural until the 1950s, when oil and gas production began to take off.
Economy
Crowley County’s economy is largely based on agriculture and oil and gas production. The county is home to several large farms, and is a major producer of wheat, corn, and other grains. Oil and gas production is also a major industry in the county, and the county is home to several large oil and gas fields.
The county is also home to several small businesses, including restaurants, retail stores, and other services. The county is also home to several small manufacturing companies, including a plastics factory and a metal fabrication plant.
Demographics
As of the 2020 census, Crowley County had a population of 5,839. The racial makeup of the county was 94.3% White, 0.7% Black or African American, 0.7% Native American, 0.3% Asian, 0.1% Pacific Islander, 2.2% from other races, and 1.9% from two or more races. Hispanic or Latino of any race were 5.3% of the population.
The median household income in Crowley County was $45,945, and the median family income was $51,917. The per capita income was $20,945. About 11.3% of the population was below the poverty line.
Common Questions
What is Per Capita Income in Crowley County?
Per Capita income in Crowley County is $20,909.
What is the Median Family Income in Crowley County?
Median Family Income in Crowley County is $62,143.
What is the Median Household income in Crowley County?
Median Household Income in Crowley County is $40,685.
What is Income or Wage Gap in Crowley County?
Income or Wage Gap in Crowley County is 39.2%.
Women in Crowley County earn 60.8 cents for every dollar earned by a man.
What is Family Income Deficit in Crowley County?
Family Income Deficit in Crowley County is $12,294.
Families that are below poverty line in Crowley County earn $12,294 less on average than the poverty threshold level.
What is Inequality or Gini Index in Crowley County?
Inequality or Gini Index in Crowley County is 0.48.
What is the Total Population of Crowley County?
Total Population of Crowley County is 5,782.
What is the Total Male Population of Crowley County?
Total Male Population of Crowley County is 3,922.
What is the Total Female Population of Crowley County?
Total Female Population of Crowley County is 1,860.
What is the Ratio of Males per 100 Females in Crowley County?
There are 210.86 Males per 100 Females in Crowley County.
What is the Ratio of Females per 100 Males in Crowley County?
There are 47.42 Females per 100 Males in Crowley County.
What is the Median Population Age in Crowley County?
Median Population Age in Crowley County is 41.3 Years.
What is the Average Family Size in Crowley County
Average Family Size in Crowley County is 4.7 People.
What is the Average Household Size in Crowley County
Average Household Size in Crowley County is 3.4 People.
How Large is the Labor Force in Crowley County?
There are 1,711 People in the Labor Forcein in Crowley County.
What is the Percentage of People in the Labor Force in Crowley County?
34.2% of People are in the Labor Force in Crowley County.
What is the Unemployment Rate in Crowley County?
Unemployment Rate in Crowley County is 7.2%.