Costilla County, CO Map & Demographics
Costilla County Map
Costilla County Overview
$24,318
PER CAPITA INCOME
$49,120
AVG FAMILY INCOME
$34,578
AVG HOUSEHOLD INCOME
34.8%
WAGE / INCOME GAP [ % ]
65.2¢/ $1
WAGE / INCOME GAP [ $ ]
0.50
INEQUALITY / GINI INDEX
3,534
TOTAL POPULATION
1,775
MALE POPULATION
1,759
FEMALE POPULATION
100.91
MALES / 100 FEMALES
99.10
FEMALES / 100 MALES
52.8
MEDIAN AGE
2.9
AVG FAMILY SIZE
2.3
AVG HOUSEHOLD SIZE
1,315
LABOR FORCE [ PEOPLE ]
43.7%
PERCENT IN LABOR FORCE
6.6%
UNEMPLOYMENT RATE
Costilla County Area Codes
Income in Costilla County
Income Overview in Costilla County
Per Capita Income in Costilla County is $24,318, while median incomes of families and households are $49,120 and $34,578 respectively.
| Characteristic | Number | Measure |
| Per Capita Income | 3,534 | $24,318 |
| Median Family Income | 978 | $49,120 |
| Mean Family Income | 978 | $62,484 |
| Median Household Income | 1,530 | $34,578 |
| Mean Household Income | 1,530 | $51,216 |
| Income Deficit | 978 | $0 |
| Wage / Income Gap (%) | 3,534 | 34.75% |
| Wage / Income Gap ($) | 3,534 | 65.25¢ per $1 |
| Gini / Inequality Index | 3,534 | 0.50 |
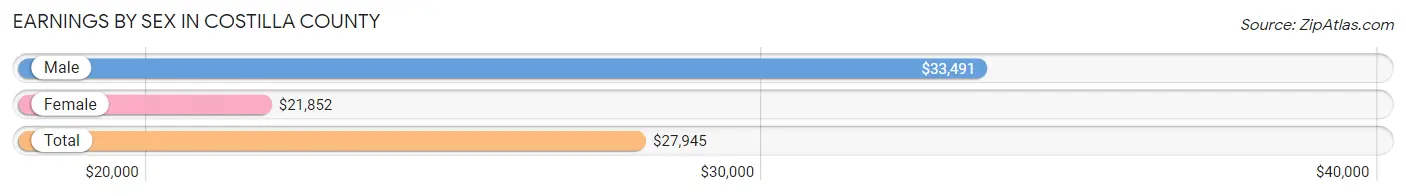
Earnings by Sex in Costilla County
Average Earnings in Costilla County are $27,945, $33,491 for men and $21,852 for women, a difference of 34.7%.
| Sex | Number | Average Earnings |
| Male | 875 (57.8%) | $33,491 |
| Female | 640 (42.2%) | $21,852 |
| Total | 1,515 (100.0%) | $27,945 |
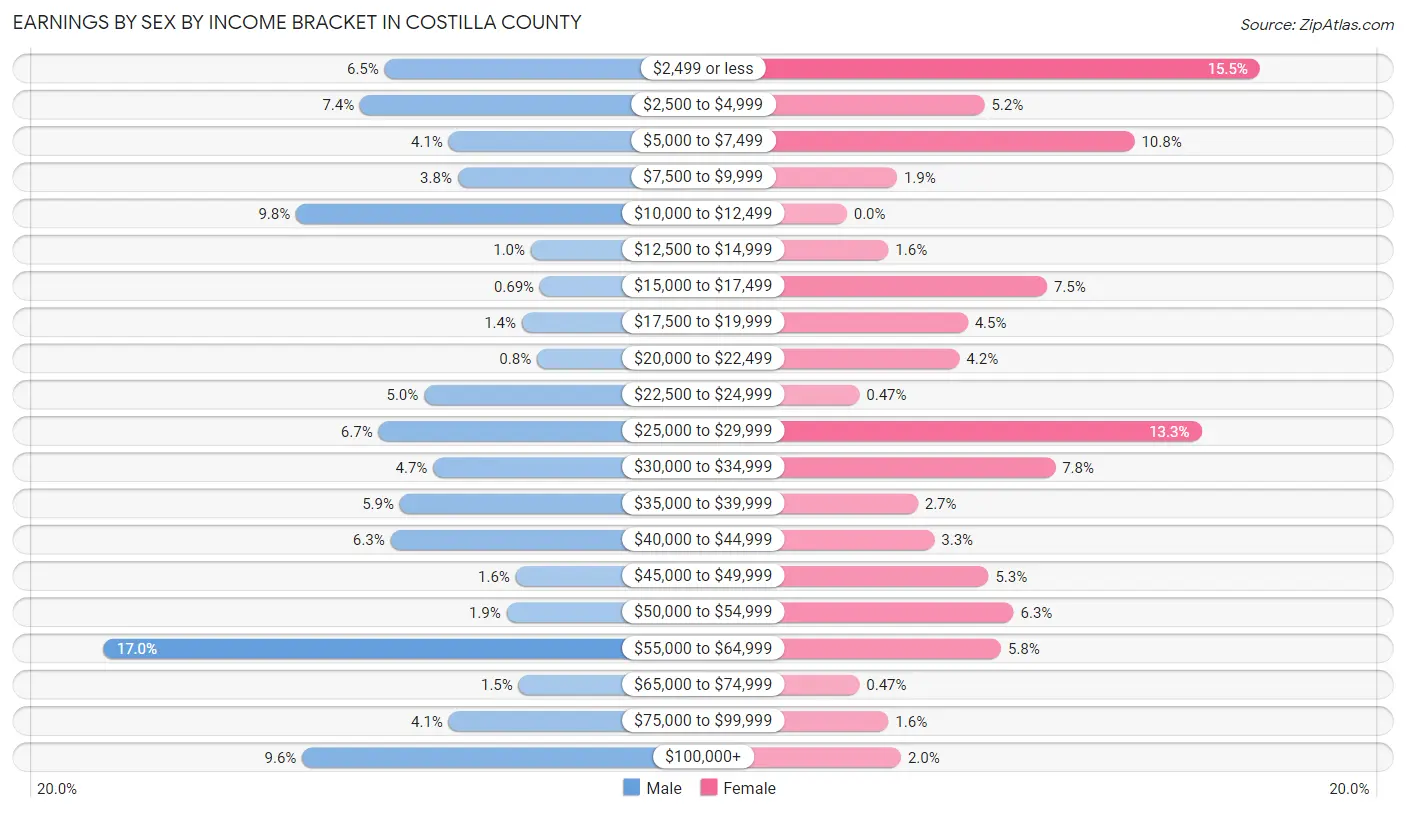
Earnings by Sex by Income Bracket in Costilla County
The most common earnings brackets in Costilla County are $55,000 to $64,999 for men (149 | 17.0%) and $2,499 or less for women (99 | 15.5%).
| Income | Male | Female |
| $2,499 or less | 57 (6.5%) | 99 (15.5%) |
| $2,500 to $4,999 | 65 (7.4%) | 33 (5.2%) |
| $5,000 to $7,499 | 36 (4.1%) | 69 (10.8%) |
| $7,500 to $9,999 | 33 (3.8%) | 12 (1.9%) |
| $10,000 to $12,499 | 86 (9.8%) | 0 (0.0%) |
| $12,500 to $14,999 | 9 (1.0%) | 10 (1.6%) |
| $15,000 to $17,499 | 6 (0.7%) | 48 (7.5%) |
| $17,500 to $19,999 | 12 (1.4%) | 29 (4.5%) |
| $20,000 to $22,499 | 7 (0.8%) | 27 (4.2%) |
| $22,500 to $24,999 | 44 (5.0%) | 3 (0.5%) |
| $25,000 to $29,999 | 59 (6.7%) | 85 (13.3%) |
| $30,000 to $34,999 | 41 (4.7%) | 50 (7.8%) |
| $35,000 to $39,999 | 52 (5.9%) | 17 (2.7%) |
| $40,000 to $44,999 | 55 (6.3%) | 21 (3.3%) |
| $45,000 to $49,999 | 14 (1.6%) | 34 (5.3%) |
| $50,000 to $54,999 | 17 (1.9%) | 40 (6.2%) |
| $55,000 to $64,999 | 149 (17.0%) | 37 (5.8%) |
| $65,000 to $74,999 | 13 (1.5%) | 3 (0.5%) |
| $75,000 to $99,999 | 36 (4.1%) | 10 (1.6%) |
| $100,000+ | 84 (9.6%) | 13 (2.0%) |
| Total | 875 (100.0%) | 640 (100.0%) |
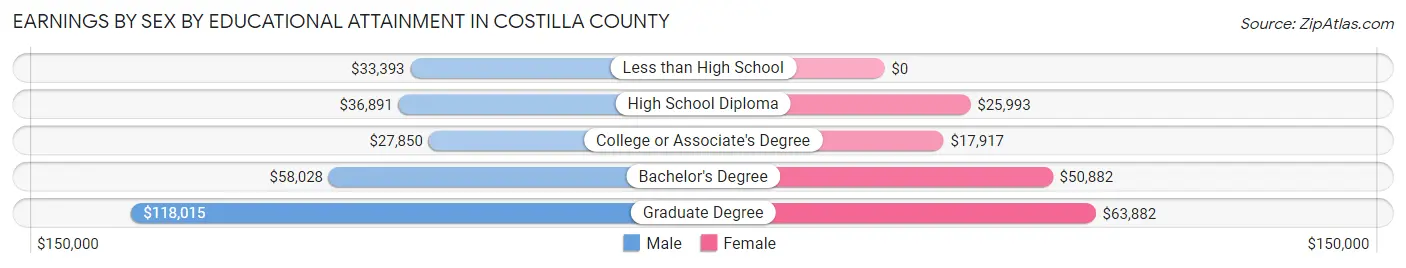
Earnings by Sex by Educational Attainment in Costilla County
Average earnings in Costilla County are $37,440 for men and $25,714 for women, a difference of 31.3%. Men with an educational attainment of graduate degree enjoy the highest average annual earnings of $118,015, while those with college or associate's degree education earn the least with $27,850. Women with an educational attainment of graduate degree earn the most with the average annual earnings of $63,882, while those with college or associate's degree education have the smallest earnings of $17,917.
| Educational Attainment | Male Income | Female Income |
| Less than High School | $33,393 | $0 |
| High School Diploma | $36,891 | $25,993 |
| College or Associate's Degree | $27,850 | $17,917 |
| Bachelor's Degree | $58,028 | $50,882 |
| Graduate Degree | $118,015 | $63,882 |
| Total | $37,440 | $25,714 |
Family Income in Costilla County
Family Income Brackets in Costilla County
According to the Costilla County family income data, there are 187 families falling into the $50,000 to $74,999 income range, which is the most common income bracket and makes up 19.1% of all families. Conversely, the $150,000 to $199,999 income bracket is the least frequent group with only 18 families (1.8%) belonging to this category.
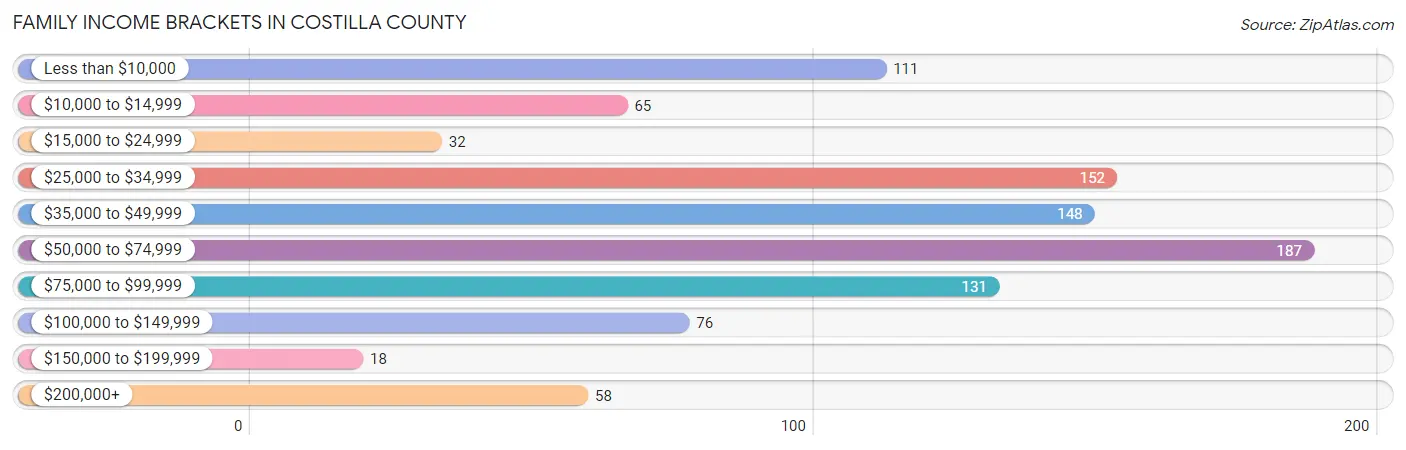
| Income Bracket | # Families | % Families |
| Less than $10,000 | 111 | 11.3% |
| $10,000 to $14,999 | 65 | 6.6% |
| $15,000 to $24,999 | 32 | 3.3% |
| $25,000 to $34,999 | 152 | 15.5% |
| $35,000 to $49,999 | 148 | 15.1% |
| $50,000 to $74,999 | 187 | 19.1% |
| $75,000 to $99,999 | 131 | 13.4% |
| $100,000 to $149,999 | 76 | 7.8% |
| $150,000 to $199,999 | 18 | 1.8% |
| $200,000+ | 58 | 5.9% |
Family Income by Famaliy Size in Costilla County
4-person families (47 | 4.8%) account for the highest median family income in Costilla County with $80,521 per family, while 2-person families (586 | 59.9%) have the highest median income of $24,213 per family member.
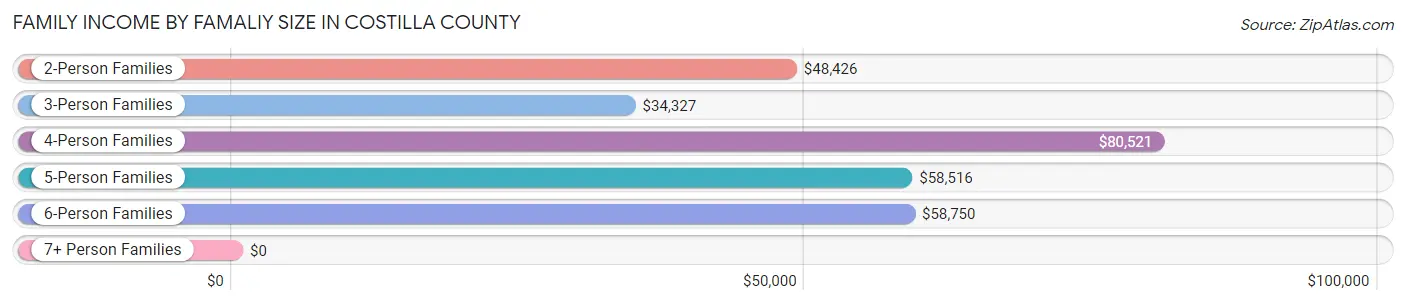
| Income Bracket | # Families | Median Income |
| 2-Person Families | 586 (59.9%) | $48,426 |
| 3-Person Families | 221 (22.6%) | $34,327 |
| 4-Person Families | 47 (4.8%) | $80,521 |
| 5-Person Families | 63 (6.4%) | $58,516 |
| 6-Person Families | 24 (2.5%) | $58,750 |
| 7+ Person Families | 37 (3.8%) | $0 |
| Total | 978 (100.0%) | $49,120 |
Family Income by Number of Earners in Costilla County

| Number of Earners | # Families | Median Income |
| No Earners | 336 (34.4%) | $35,588 |
| 1 Earner | 308 (31.5%) | $37,375 |
| 2 Earners | 246 (25.2%) | $78,400 |
| 3+ Earners | 88 (9.0%) | $0 |
| Total | 978 (100.0%) | $49,120 |
Household Income in Costilla County
Household Income Brackets in Costilla County
With 248 households falling in the category, the $50,000 to $74,999 income range is the most frequent in Costilla County, accounting for 16.2% of all households. In contrast, only 18 households (1.2%) fall into the $150,000 to $199,999 income bracket, making it the least populous group.
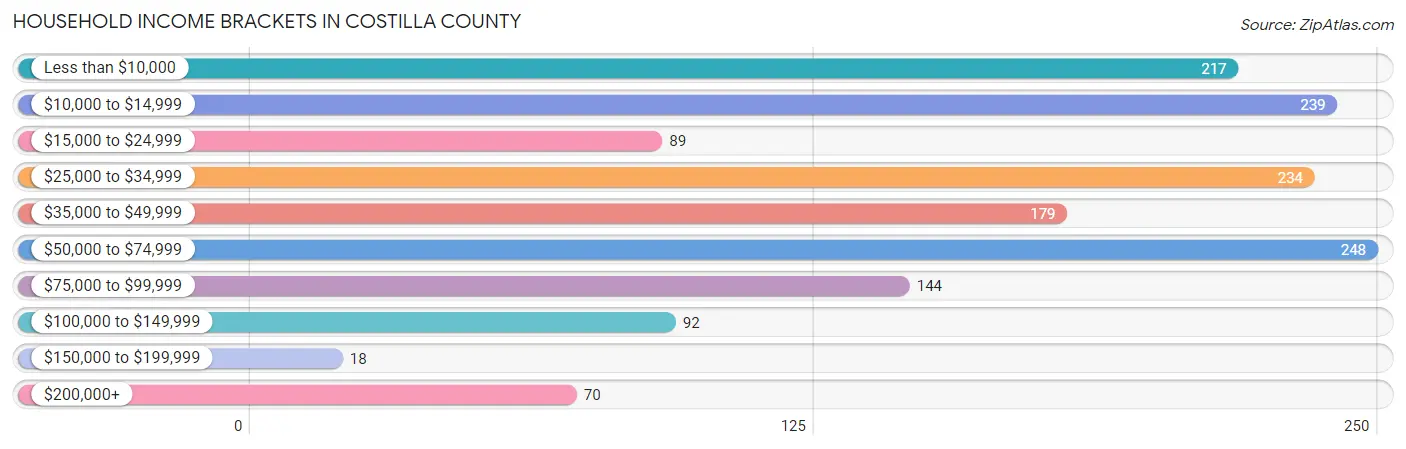
| Income Bracket | # Households | % Households |
| Less than $10,000 | 217 | 14.2% |
| $10,000 to $14,999 | 239 | 15.6% |
| $15,000 to $24,999 | 89 | 5.8% |
| $25,000 to $34,999 | 234 | 15.3% |
| $35,000 to $49,999 | 179 | 11.7% |
| $50,000 to $74,999 | 248 | 16.2% |
| $75,000 to $99,999 | 144 | 9.4% |
| $100,000 to $149,999 | 92 | 6.0% |
| $150,000 to $199,999 | 18 | 1.2% |
| $200,000+ | 70 | 4.6% |
Household Income by Householder Age in Costilla County
The median household income in Costilla County is $34,578, with the highest median household income of $48,125 found in the 45 to 64 years age bracket for the primary householder. A total of 534 households (34.9%) fall into this category. Meanwhile, the 15 to 24 years age bracket for the primary householder has the lowest median household income of $0, with 45 households (2.9%) in this group.
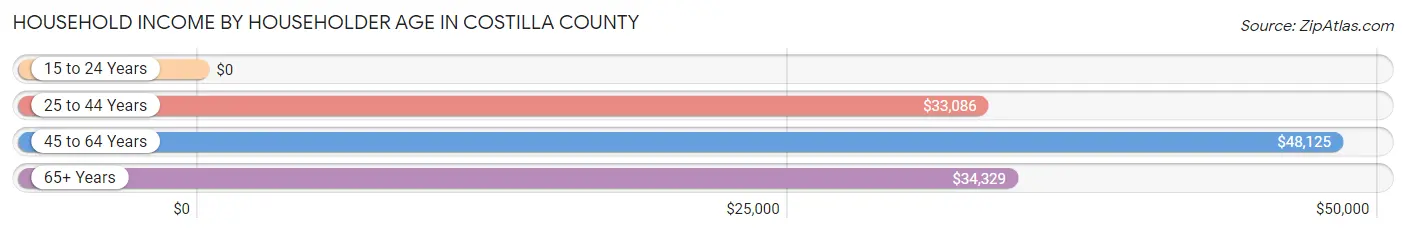
| Income Bracket | # Households | Median Income |
| 15 to 24 Years | 45 (2.9%) | $0 |
| 25 to 44 Years | 265 (17.3%) | $33,086 |
| 45 to 64 Years | 534 (34.9%) | $48,125 |
| 65+ Years | 686 (44.8%) | $34,329 |
| Total | 1,530 (100.0%) | $34,578 |
Poverty in Costilla County
Income Below Poverty by Sex and Age in Costilla County
With 24.5% poverty level for males and 20.6% for females among the residents of Costilla County, 12 to 14 year old males and 5 year old females are the most vulnerable to poverty, with 18 males (69.2%) and 10 females (100.0%) in their respective age groups living below the poverty level.
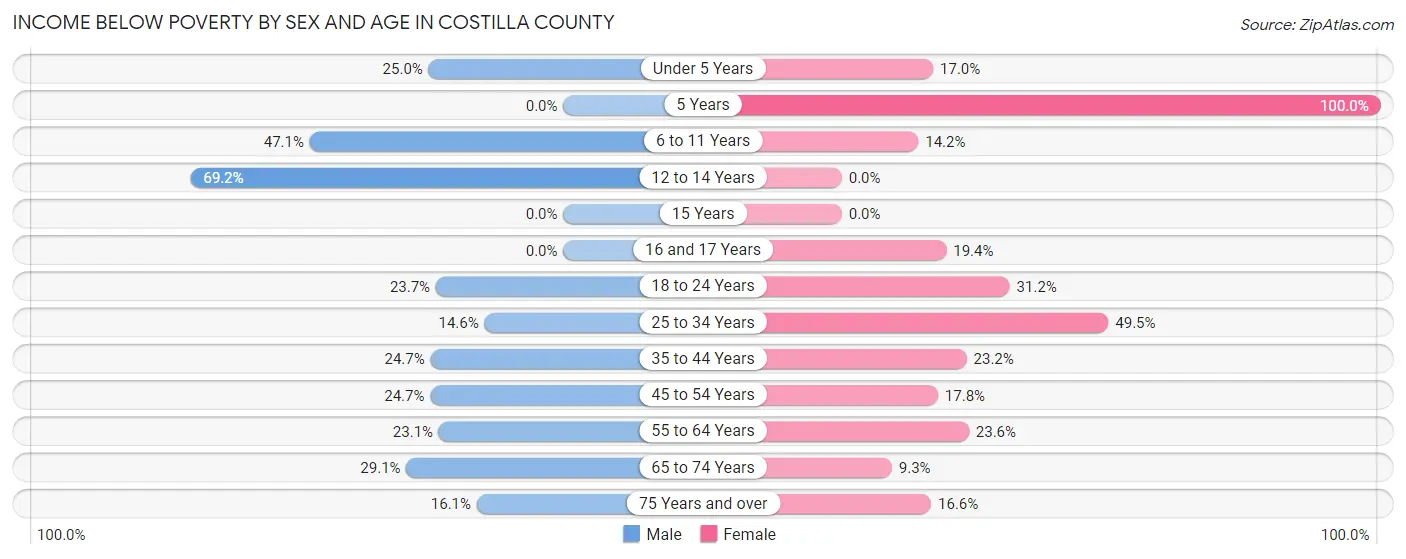
| Age Bracket | Male | Female |
| Under 5 Years | 12 (25.0%) | 20 (17.0%) |
| 5 Years | 0 (0.0%) | 10 (100.0%) |
| 6 to 11 Years | 56 (47.1%) | 23 (14.2%) |
| 12 to 14 Years | 18 (69.2%) | 0 (0.0%) |
| 15 Years | 0 (0.0%) | 0 (0.0%) |
| 16 and 17 Years | 0 (0.0%) | 13 (19.4%) |
| 18 to 24 Years | 35 (23.6%) | 43 (31.2%) |
| 25 to 34 Years | 36 (14.6%) | 48 (49.5%) |
| 35 to 44 Years | 35 (24.6%) | 38 (23.2%) |
| 45 to 54 Years | 40 (24.7%) | 33 (17.8%) |
| 55 to 64 Years | 70 (23.1%) | 75 (23.6%) |
| 65 to 74 Years | 104 (29.1%) | 25 (9.3%) |
| 75 Years and over | 26 (16.1%) | 32 (16.6%) |
| Total | 432 (24.5%) | 360 (20.6%) |
Income Above Poverty by Sex and Age in Costilla County
According to the poverty statistics in Costilla County, males aged 5 years and females aged 12 to 14 years are the age groups that are most secure financially, with 100.0% of males and 100.0% of females in these age groups living above the poverty line.
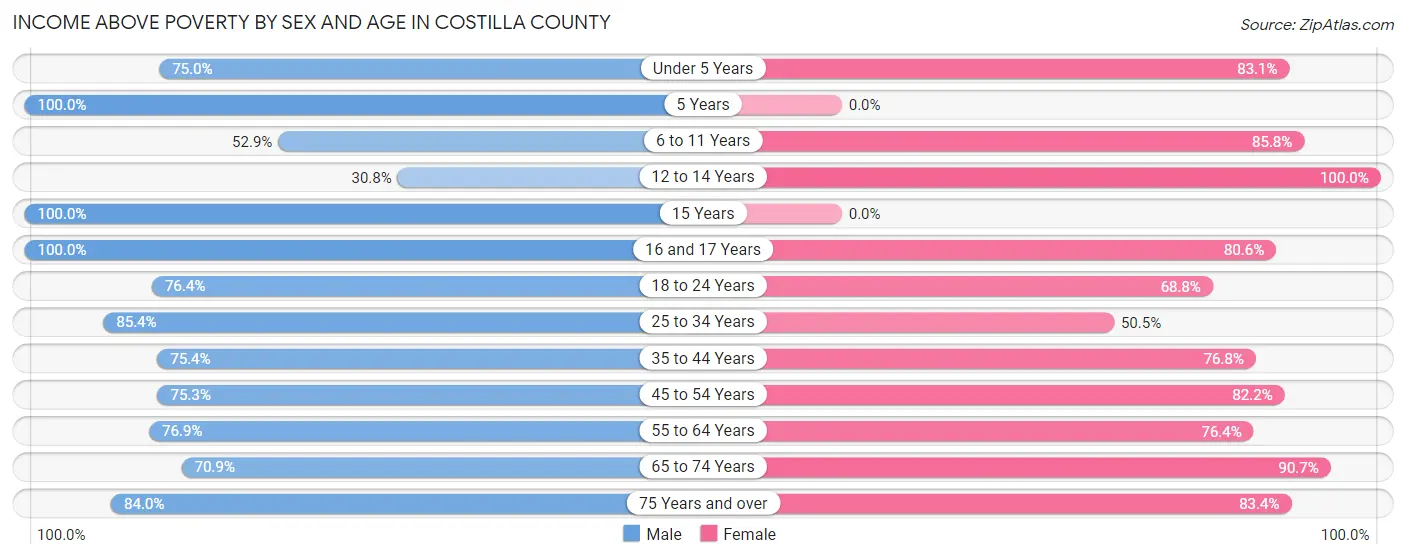
| Age Bracket | Male | Female |
| Under 5 Years | 36 (75.0%) | 98 (83.1%) |
| 5 Years | 8 (100.0%) | 0 (0.0%) |
| 6 to 11 Years | 63 (52.9%) | 139 (85.8%) |
| 12 to 14 Years | 8 (30.8%) | 29 (100.0%) |
| 15 Years | 5 (100.0%) | 0 (0.0%) |
| 16 and 17 Years | 39 (100.0%) | 54 (80.6%) |
| 18 to 24 Years | 113 (76.3%) | 95 (68.8%) |
| 25 to 34 Years | 210 (85.4%) | 49 (50.5%) |
| 35 to 44 Years | 107 (75.3%) | 126 (76.8%) |
| 45 to 54 Years | 122 (75.3%) | 152 (82.2%) |
| 55 to 64 Years | 233 (76.9%) | 243 (76.4%) |
| 65 to 74 Years | 253 (70.9%) | 244 (90.7%) |
| 75 Years and over | 136 (84.0%) | 161 (83.4%) |
| Total | 1,333 (75.5%) | 1,390 (79.4%) |
Income Below Poverty Among Married-Couple Families in Costilla County
The poverty statistics for married-couple families in Costilla County show that 10.5% or 72 of the total 688 families live below the poverty line. Families with 3 or 4 children have the highest poverty rate of 17.5%, comprising of 10 families. On the other hand, families with 1 or 2 children have the lowest poverty rate of 0.0%, which includes 0 families.
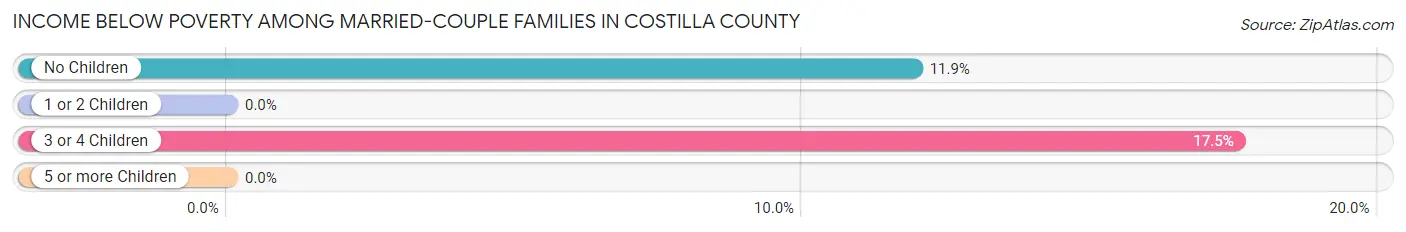
| Children | Above Poverty | Below Poverty |
| No Children | 458 (88.1%) | 62 (11.9%) |
| 1 or 2 Children | 104 (100.0%) | 0 (0.0%) |
| 3 or 4 Children | 47 (82.5%) | 10 (17.5%) |
| 5 or more Children | 7 (100.0%) | 0 (0.0%) |
| Total | 616 (89.5%) | 72 (10.5%) |
Income Below Poverty Among Single-Parent Households in Costilla County
According to the poverty data in Costilla County, 21.1% or 15 single-father households and 50.7% or 111 single-mother households are living below the poverty line. Among single-father households, those with 1 or 2 children have the highest poverty rate, with 7 households (22.6%) experiencing poverty. Likewise, among single-mother households, those with 1 or 2 children have the highest poverty rate, with 92 households (62.2%) falling below the poverty line.
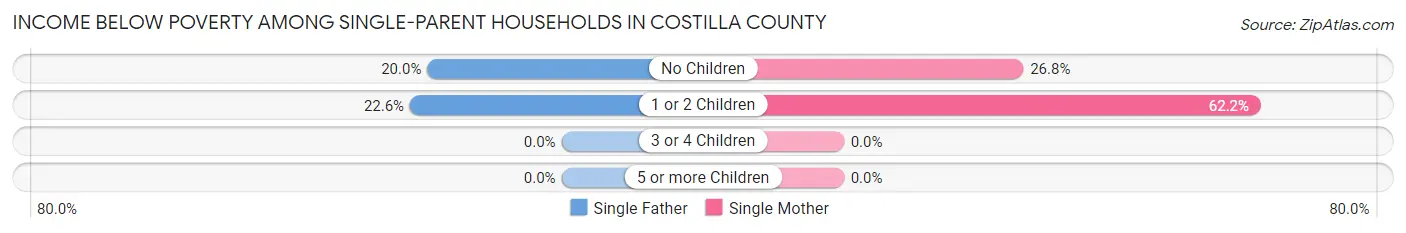
| Children | Single Father | Single Mother |
| No Children | 8 (20.0%) | 19 (26.8%) |
| 1 or 2 Children | 7 (22.6%) | 92 (62.2%) |
| 3 or 4 Children | 0 (0.0%) | 0 (0.0%) |
| 5 or more Children | 0 (0.0%) | 0 (0.0%) |
| Total | 15 (21.1%) | 111 (50.7%) |
Income Below Poverty Among Married-Couple vs Single-Parent Households in Costilla County
The poverty data for Costilla County shows that 72 of the married-couple family households (10.5%) and 126 of the single-parent households (43.4%) are living below the poverty level. Within the married-couple family households, those with 3 or 4 children have the highest poverty rate, with 10 households (17.5%) falling below the poverty line. Among the single-parent households, those with 1 or 2 children have the highest poverty rate, with 99 household (55.3%) living below poverty.
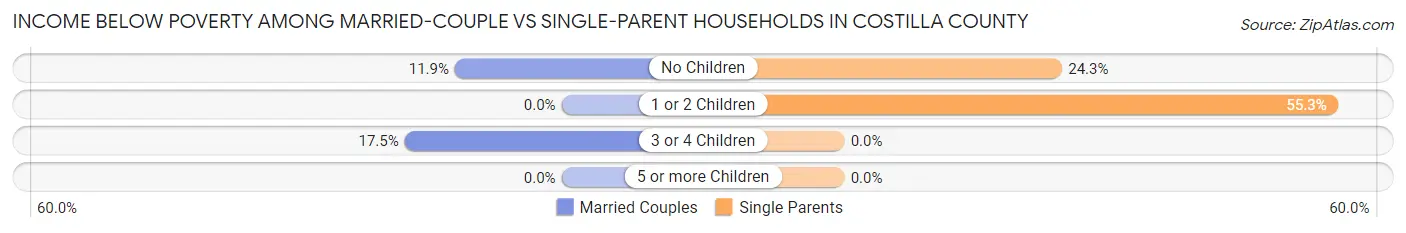
| Children | Married-Couple Families | Single-Parent Households |
| No Children | 62 (11.9%) | 27 (24.3%) |
| 1 or 2 Children | 0 (0.0%) | 99 (55.3%) |
| 3 or 4 Children | 10 (17.5%) | 0 (0.0%) |
| 5 or more Children | 0 (0.0%) | 0 (0.0%) |
| Total | 72 (10.5%) | 126 (43.4%) |
Race in Costilla County
The most populous races in Costilla County are White / Caucasian (2,263 | 64.0%), Hispanic or Latino (2,116 | 59.9%), and Two or more Races (853 | 24.1%).

| Race | # Population | % Population |
| Asian | 56 | 1.6% |
| Black / African American | 38 | 1.1% |
| Hawaiian / Pacific | 0 | 0.0% |
| Hispanic or Latino | 2,116 | 59.9% |
| Native / Alaskan | 120 | 3.4% |
| White / Caucasian | 2,263 | 64.0% |
| Two or more Races | 853 | 24.1% |
| Some other Race | 204 | 5.8% |
| Total | 3,534 | 100.0% |
Ancestry in Costilla County
The most populous ancestries reported in Costilla County are Mexican (1,141 | 32.3%), German (427 | 12.1%), Spaniard (384 | 10.9%), Spanish (338 | 9.6%), and Irish (263 | 7.4%), together accounting for 72.2% of all Costilla County residents.

| Ancestry | # Population | % Population |
| American | 114 | 3.2% |
| Apache | 108 | 3.1% |
| Austrian | 7 | 0.2% |
| Bhutanese | 57 | 1.6% |
| Burmese | 2 | 0.1% |
| Canadian | 6 | 0.2% |
| Cherokee | 111 | 3.1% |
| Choctaw | 35 | 1.0% |
| Danish | 3 | 0.1% |
| Dutch | 17 | 0.5% |
| Eastern European | 6 | 0.2% |
| English | 244 | 6.9% |
| European | 70 | 2.0% |
| French | 107 | 3.0% |
| French Canadian | 8 | 0.2% |
| German | 427 | 12.1% |
| Greek | 10 | 0.3% |
| Hopi | 3 | 0.1% |
| Hungarian | 17 | 0.5% |
| Irish | 263 | 7.4% |
| Italian | 36 | 1.0% |
| Korean | 1 | 0.0% |
| Mexican | 1,141 | 32.3% |
| Navajo | 68 | 1.9% |
| Norwegian | 37 | 1.1% |
| Pakistani | 7 | 0.2% |
| Polish | 22 | 0.6% |
| Portuguese | 91 | 2.6% |
| Pueblo | 6 | 0.2% |
| Puerto Rican | 16 | 0.4% |
| Russian | 2 | 0.1% |
| Scandinavian | 17 | 0.5% |
| Scotch-Irish | 73 | 2.1% |
| Scottish | 60 | 1.7% |
| Sioux | 8 | 0.2% |
| South African | 8 | 0.2% |
| Spaniard | 384 | 10.9% |
| Spanish | 338 | 9.6% |
| Subsaharan African | 8 | 0.2% |
| Swedish | 27 | 0.8% |
| Ukrainian | 9 | 0.3% |
| Ute | 8 | 0.2% |
| Welsh | 11 | 0.3% | View All 43 Rows |
Immigrants in Costilla County
The most numerous immigrant groups reported in Costilla County came from Central America (178 | 5.0%), Latin America (178 | 5.0%), Mexico (178 | 5.0%), Europe (15 | 0.4%), and Greece (10 | 0.3%), together accounting for 15.8% of all Costilla County residents.

| Immigration Origin | # Population | % Population |
| Africa | 8 | 0.2% |
| Asia | 9 | 0.3% |
| Central America | 178 | 5.0% |
| Eastern Asia | 2 | 0.1% |
| Europe | 15 | 0.4% |
| Germany | 4 | 0.1% |
| Greece | 10 | 0.3% |
| Ireland | 1 | 0.0% |
| Korea | 2 | 0.1% |
| Latin America | 178 | 5.0% |
| Mexico | 178 | 5.0% |
| Northern Europe | 1 | 0.0% |
| South Eastern Asia | 7 | 0.2% |
| Southern Europe | 10 | 0.3% |
| Thailand | 7 | 0.2% |
| Western Europe | 4 | 0.1% | View All 16 Rows |
Sex and Age in Costilla County
Sex and Age in Costilla County
The most populous age groups in Costilla County are 65 to 69 Years (239 | 13.5%) for men and 60 to 64 Years (191 | 10.9%) for women.
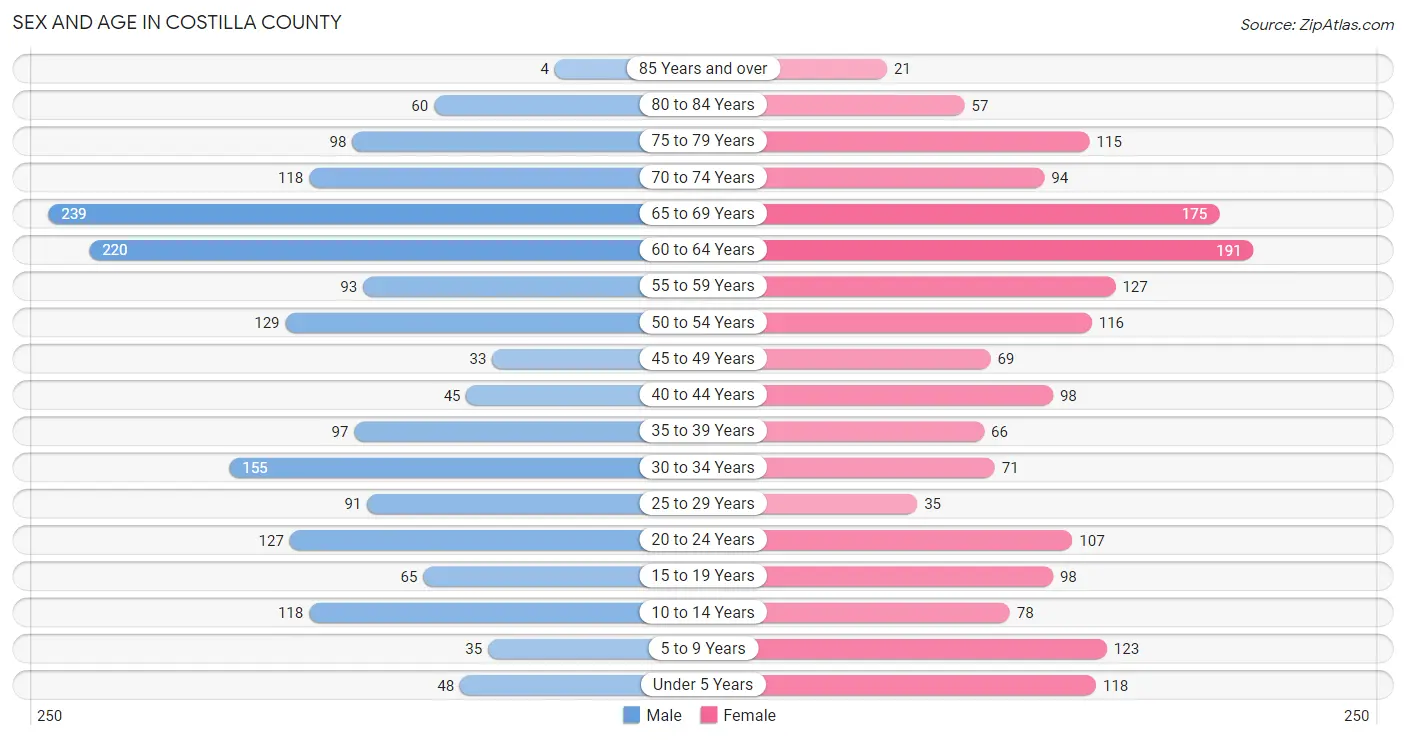
| Age Bracket | Male | Female |
| Under 5 Years | 48 (2.7%) | 118 (6.7%) |
| 5 to 9 Years | 35 (2.0%) | 123 (7.0%) |
| 10 to 14 Years | 118 (6.7%) | 78 (4.4%) |
| 15 to 19 Years | 65 (3.7%) | 98 (5.6%) |
| 20 to 24 Years | 127 (7.1%) | 107 (6.1%) |
| 25 to 29 Years | 91 (5.1%) | 35 (2.0%) |
| 30 to 34 Years | 155 (8.7%) | 71 (4.0%) |
| 35 to 39 Years | 97 (5.5%) | 66 (3.7%) |
| 40 to 44 Years | 45 (2.5%) | 98 (5.6%) |
| 45 to 49 Years | 33 (1.9%) | 69 (3.9%) |
| 50 to 54 Years | 129 (7.3%) | 116 (6.6%) |
| 55 to 59 Years | 93 (5.2%) | 127 (7.2%) |
| 60 to 64 Years | 220 (12.4%) | 191 (10.9%) |
| 65 to 69 Years | 239 (13.5%) | 175 (10.0%) |
| 70 to 74 Years | 118 (6.7%) | 94 (5.3%) |
| 75 to 79 Years | 98 (5.5%) | 115 (6.5%) |
| 80 to 84 Years | 60 (3.4%) | 57 (3.2%) |
| 85 Years and over | 4 (0.2%) | 21 (1.2%) |
| Total | 1,775 (100.0%) | 1,759 (100.0%) |
Families and Households in Costilla County
Median Family Size in Costilla County
The median family size in Costilla County is 2.90 persons per family, with married-couple families (688 | 70.4%) accounting for the largest median family size of 3.09 persons per family. On the other hand, single male/father families (71 | 7.3%) represent the smallest median family size with 2.39 persons per family.
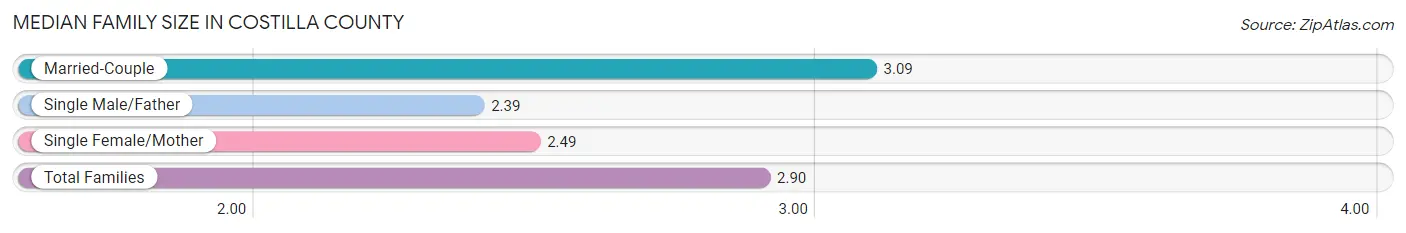
| Family Type | # Families | Family Size |
| Married-Couple | 688 (70.4%) | 3.09 |
| Single Male/Father | 71 (7.3%) | 2.39 |
| Single Female/Mother | 219 (22.4%) | 2.49 |
| Total Families | 978 (100.0%) | 2.90 |
Median Household Size in Costilla County
The median household size in Costilla County is 2.30 persons per household, with married-couple households (688 | 45.0%) accounting for the largest median household size of 3.1 persons per household. non-family households (552 | 36.1%) represent the smallest median household size with 1.14 persons per household.
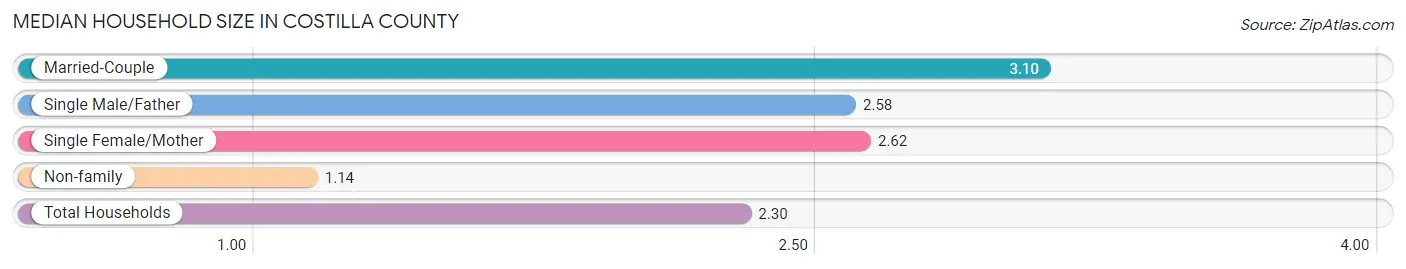
| Household Type | # Households | Household Size |
| Married-Couple | 688 (45.0%) | 3.10 |
| Single Male/Father | 71 (4.6%) | 2.58 |
| Single Female/Mother | 219 (14.3%) | 2.62 |
| Non-family | 552 (36.1%) | 1.14 |
| Total Households | 1,530 (100.0%) | 2.30 |
Household Size by Marriage Status in Costilla County
Out of a total of 1,530 households in Costilla County, 978 (63.9%) are family households, while 552 (36.1%) are nonfamily households. The most numerous type of family households are 2-person households, comprising 567, and the most common type of nonfamily households are 1-person households, comprising 481.

| Household Size | Family Households | Nonfamily Households |
| 1-Person Households | - | 481 (31.4%) |
| 2-Person Households | 567 (37.1%) | 71 (4.6%) |
| 3-Person Households | 232 (15.2%) | 0 (0.0%) |
| 4-Person Households | 52 (3.4%) | 0 (0.0%) |
| 5-Person Households | 50 (3.3%) | 0 (0.0%) |
| 6-Person Households | 40 (2.6%) | 0 (0.0%) |
| 7+ Person Households | 37 (2.4%) | 0 (0.0%) |
| Total | 978 (63.9%) | 552 (36.1%) |
Female Fertility in Costilla County
Fertility by Age in Costilla County
Average fertility rate in Costilla County is 75.0 births per 1,000 women. Women in the age bracket of 20 to 34 years have the highest fertility rate with 155.0 births per 1,000 women. Women in the age bracket of 20 to 34 years acount for 80.5% of all women with births.
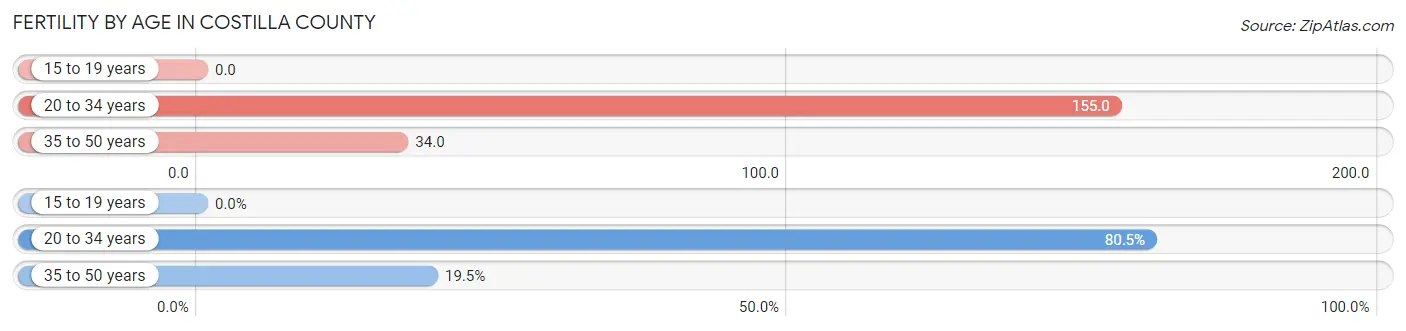
| Age Bracket | Women with Births | Births / 1,000 Women |
| 15 to 19 years | 0 (0.0%) | 0.0 |
| 20 to 34 years | 33 (80.5%) | 155.0 |
| 35 to 50 years | 8 (19.5%) | 34.0 |
| Total | 41 (100.0%) | 75.0 |
Fertility by Age by Marriage Status in Costilla County
56.1% of women with births (41) in Costilla County are married. The highest percentage of unmarried women with births falls into 20 to 34 years age bracket with 45.5% of them unmarried at the time of birth, while the lowest percentage of unmarried women with births belong to 35 to 50 years age bracket with 37.5% of them unmarried.
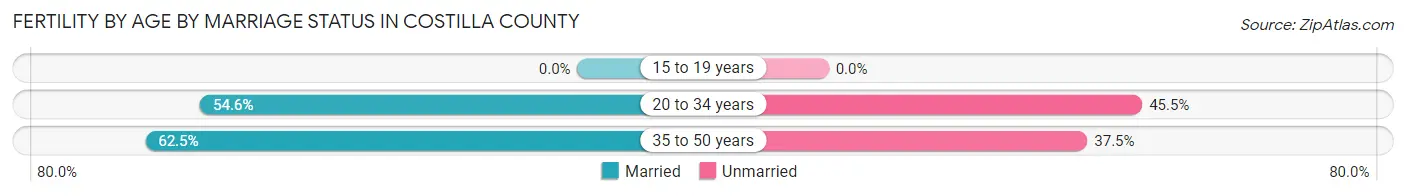
| Age Bracket | Married | Unmarried |
| 15 to 19 years | 0 (0.0%) | 0 (0.0%) |
| 20 to 34 years | 18 (54.5%) | 15 (45.5%) |
| 35 to 50 years | 5 (62.5%) | 3 (37.5%) |
| Total | 23 (56.1%) | 18 (43.9%) |
Fertility by Education in Costilla County
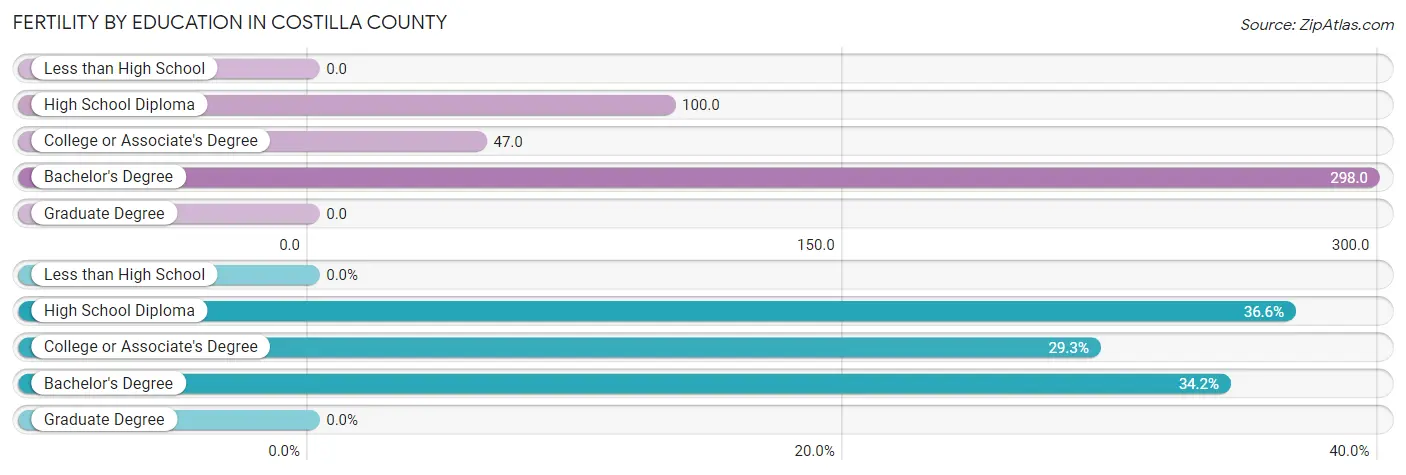
| Educational Attainment | Women with Births | Births / 1,000 Women |
| Less than High School | 0 (0.0%) | 0.0 |
| High School Diploma | 15 (36.6%) | 100.0 |
| College or Associate's Degree | 12 (29.3%) | 47.0 |
| Bachelor's Degree | 14 (34.2%) | 298.0 |
| Graduate Degree | 0 (0.0%) | 0.0 |
| Total | 41 (100.0%) | 75.0 |
Fertility by Education by Marriage Status in Costilla County
43.9% of women with births in Costilla County are unmarried. Women with the educational attainment of high school diploma are most likely to be married with 100.0% of them married at childbirth, while women with the educational attainment of college or associate's degree are least likely to be married with 75.0% of them unmarried at childbirth.

| Educational Attainment | Married | Unmarried |
| Less than High School | 0 (0.0%) | 0 (0.0%) |
| High School Diploma | 15 (100.0%) | 0 (0.0%) |
| College or Associate's Degree | 3 (25.0%) | 9 (75.0%) |
| Bachelor's Degree | 5 (35.7%) | 9 (64.3%) |
| Graduate Degree | 0 (0.0%) | 0 (0.0%) |
| Total | 23 (56.1%) | 18 (43.9%) |
Employment Characteristics in Costilla County
Employment by Class of Employer in Costilla County
Among the 1,129 employed individuals in Costilla County, private company employees (581 | 51.5%), local government employees (161 | 14.3%), and self-employed (not incorporated) (107 | 9.5%) make up the most common classes of employment.
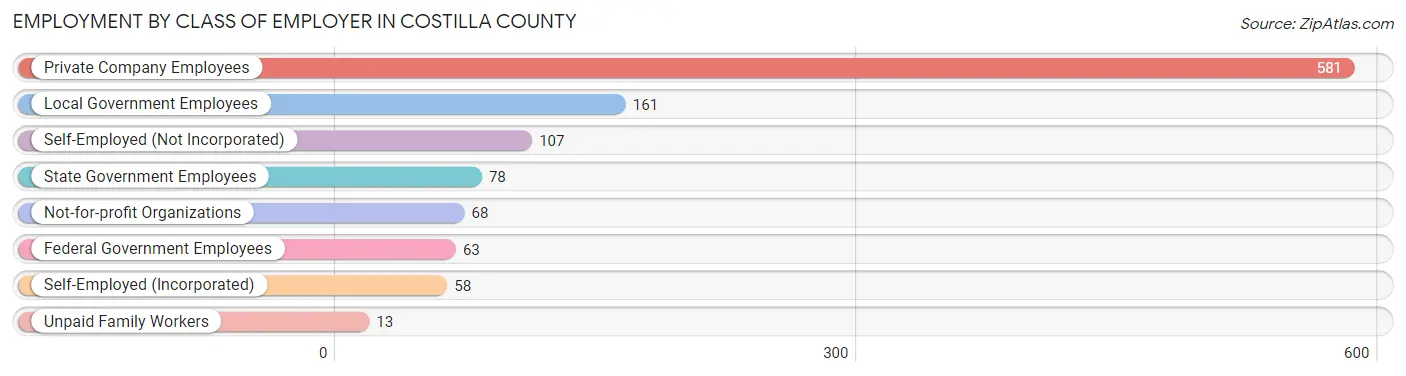
| Employer Class | # Employees | % Employees |
| Private Company Employees | 581 | 51.5% |
| Self-Employed (Incorporated) | 58 | 5.1% |
| Self-Employed (Not Incorporated) | 107 | 9.5% |
| Not-for-profit Organizations | 68 | 6.0% |
| Local Government Employees | 161 | 14.3% |
| State Government Employees | 78 | 6.9% |
| Federal Government Employees | 63 | 5.6% |
| Unpaid Family Workers | 13 | 1.1% |
| Total | 1,129 | 100.0% |
Employment Status by Age in Costilla County
According to the labor force statistics for Costilla County, out of the total population over 16 years of age (3,009), 43.7% or 1,315 individuals are in the labor force, with 6.6% or 87 of them unemployed. The age group with the highest labor force participation rate is 30 to 34 years, with 71.7% or 162 individuals in the labor force. Within the labor force, the 16 to 19 years age range has the highest percentage of unemployed individuals, with 16.3% or 8 of them being unemployed.
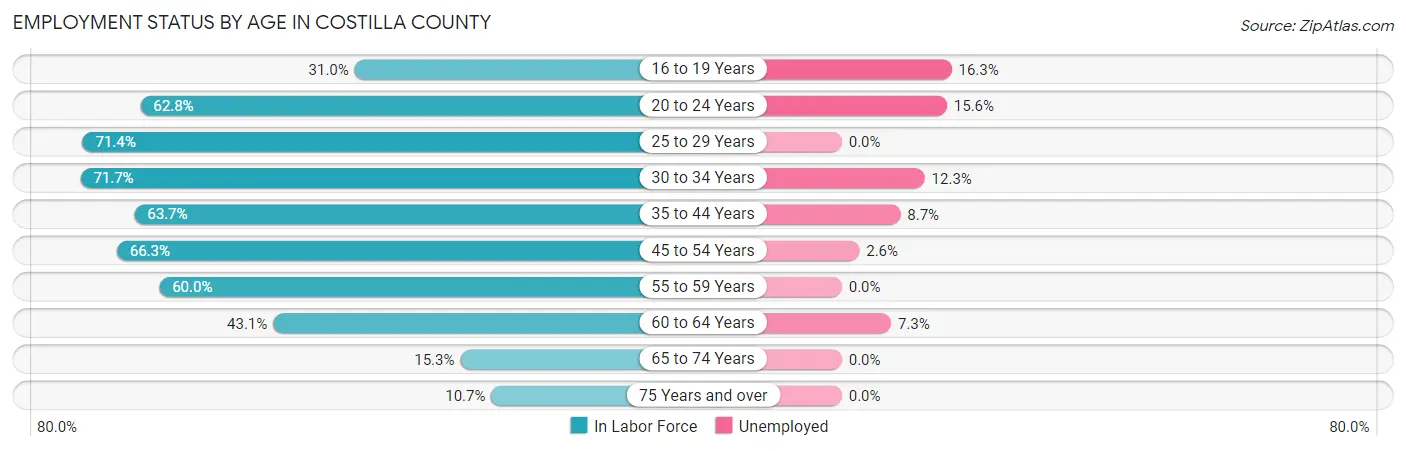
| Age Bracket | In Labor Force | Unemployed |
| 16 to 19 Years | 49 (31.0%) | 8 (16.3%) |
| 20 to 24 Years | 147 (62.8%) | 23 (15.6%) |
| 25 to 29 Years | 90 (71.4%) | 0 (0.0%) |
| 30 to 34 Years | 162 (71.7%) | 20 (12.3%) |
| 35 to 44 Years | 195 (63.7%) | 17 (8.7%) |
| 45 to 54 Years | 230 (66.3%) | 6 (2.6%) |
| 55 to 59 Years | 132 (60.0%) | 0 (0.0%) |
| 60 to 64 Years | 177 (43.1%) | 13 (7.3%) |
| 65 to 74 Years | 96 (15.3%) | 0 (0.0%) |
| 75 Years and over | 38 (10.7%) | 0 (0.0%) |
| Total | 1,315 (43.7%) | 87 (6.6%) |
Employment Status by Educational Attainment in Costilla County
According to labor force statistics for Costilla County, 60.3% of individuals (987) out of the total population between 25 and 64 years of age (1,636) are in the labor force, with 5.7% or 56 of them being unemployed. The group with the highest labor force participation rate are those with the educational attainment of bachelor's degree or higher, with 80.7% or 317 individuals in the labor force. Within the labor force, individuals with high school diploma education have the highest percentage of unemployment, with 10.2% or 31 of them being unemployed.
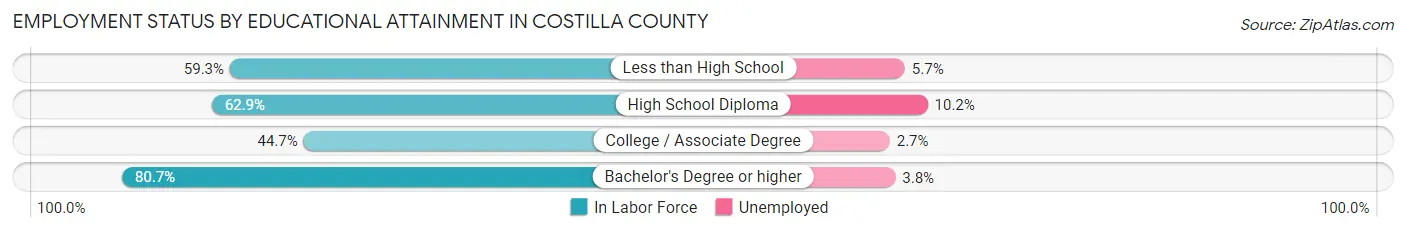
| Educational Attainment | In Labor Force | Unemployed |
| Less than High School | 105 (59.3%) | 10 (5.7%) |
| High School Diploma | 303 (62.9%) | 49 (10.2%) |
| College / Associate Degree | 261 (44.7%) | 16 (2.7%) |
| Bachelor's Degree or higher | 317 (80.7%) | 15 (3.8%) |
| Total | 987 (60.3%) | 93 (5.7%) |
Employment Occupations by Sex in Costilla County
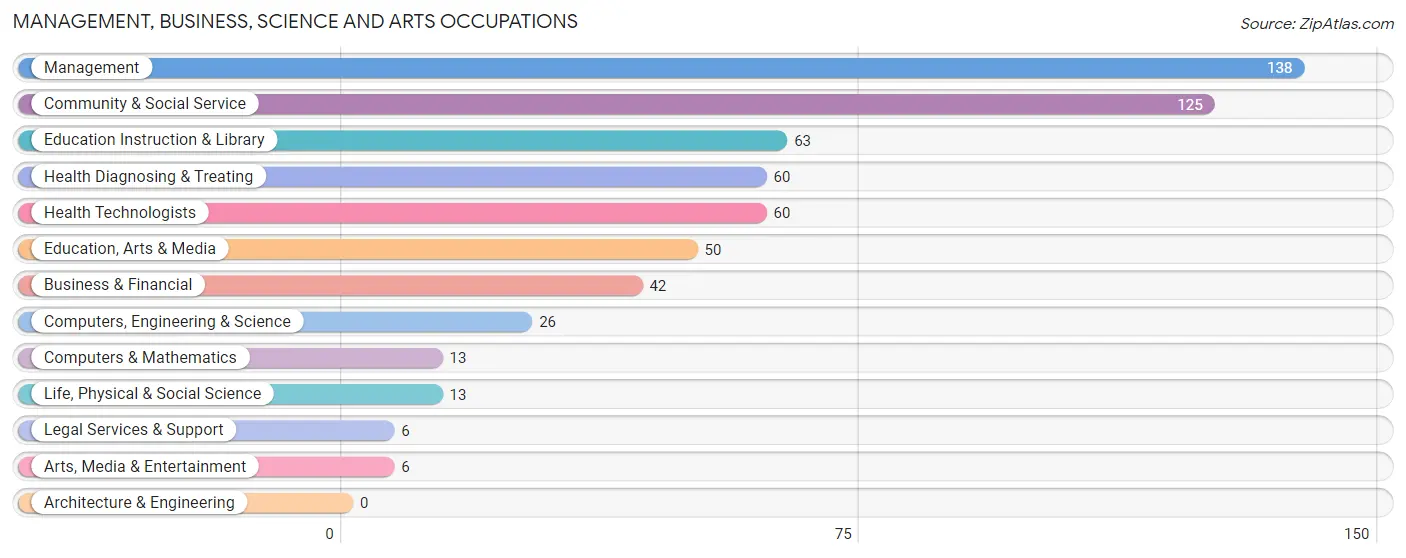
Management, Business, Science and Arts Occupations
The most common Management, Business, Science and Arts occupations in Costilla County are Management (138 | 11.2%), Community & Social Service (125 | 10.2%), Education Instruction & Library (63 | 5.1%), Health Diagnosing & Treating (60 | 4.9%), and Health Technologists (60 | 4.9%).
Management, Business, Science and Arts Occupations by Sex
Within the Management, Business, Science and Arts occupations in Costilla County, the most male-oriented occupations are Legal Services & Support (100.0%), Education, Arts & Media (98.0%), and Computers & Mathematics (92.3%), while the most female-oriented occupations are Life, Physical & Social Science (100.0%), Arts, Media & Entertainment (100.0%), and Education Instruction & Library (79.4%).
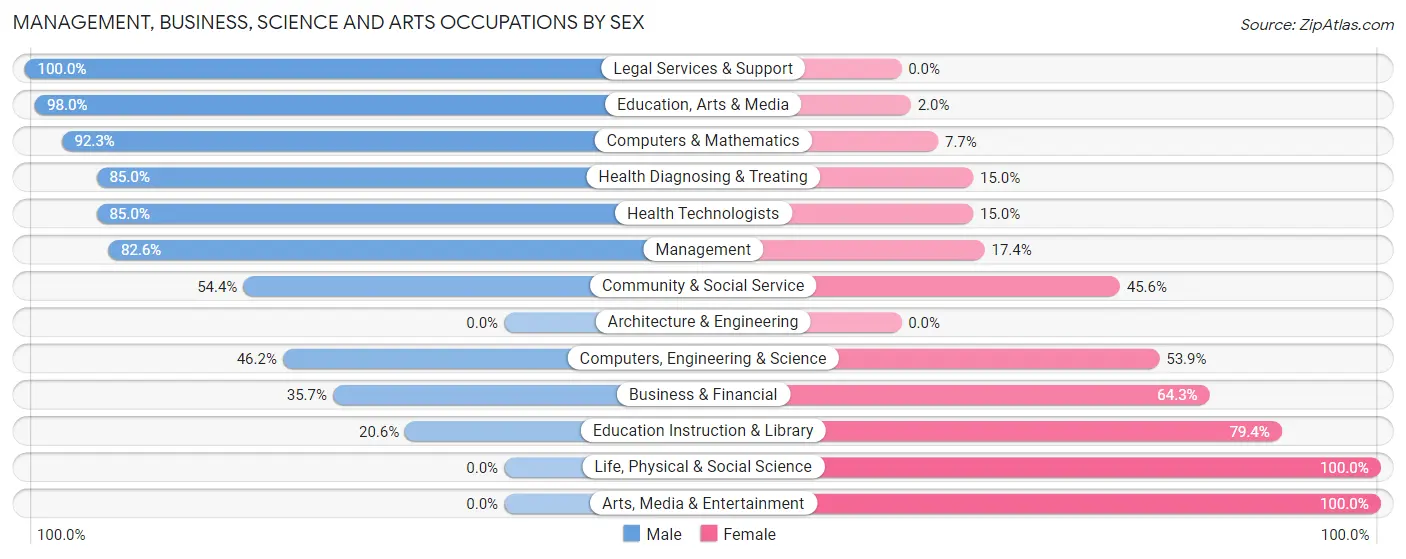
| Occupation | Male | Female |
| Management | 114 (82.6%) | 24 (17.4%) |
| Business & Financial | 15 (35.7%) | 27 (64.3%) |
| Computers, Engineering & Science | 12 (46.2%) | 14 (53.8%) |
| Computers & Mathematics | 12 (92.3%) | 1 (7.7%) |
| Architecture & Engineering | 0 (0.0%) | 0 (0.0%) |
| Life, Physical & Social Science | 0 (0.0%) | 13 (100.0%) |
| Community & Social Service | 68 (54.4%) | 57 (45.6%) |
| Education, Arts & Media | 49 (98.0%) | 1 (2.0%) |
| Legal Services & Support | 6 (100.0%) | 0 (0.0%) |
| Education Instruction & Library | 13 (20.6%) | 50 (79.4%) |
| Arts, Media & Entertainment | 0 (0.0%) | 6 (100.0%) |
| Health Diagnosing & Treating | 51 (85.0%) | 9 (15.0%) |
| Health Technologists | 51 (85.0%) | 9 (15.0%) |
| Total (Category) | 260 (66.5%) | 131 (33.5%) |
| Total (Overall) | 708 (57.6%) | 521 (42.4%) |
Services Occupations
The most common Services occupations in Costilla County are Healthcare Support (50 | 4.1%), Food Preparation & Serving (41 | 3.3%), Cleaning & Maintenance (28 | 2.3%), Personal Care & Service (6 | 0.5%), and Security & Protection (3 | 0.2%).

Services Occupations by Sex
Within the Services occupations in Costilla County, the most male-oriented occupations are Security & Protection (100.0%), Law Enforcement (100.0%), and Cleaning & Maintenance (67.9%), while the most female-oriented occupations are Personal Care & Service (100.0%), Healthcare Support (92.0%), and Food Preparation & Serving (68.3%).
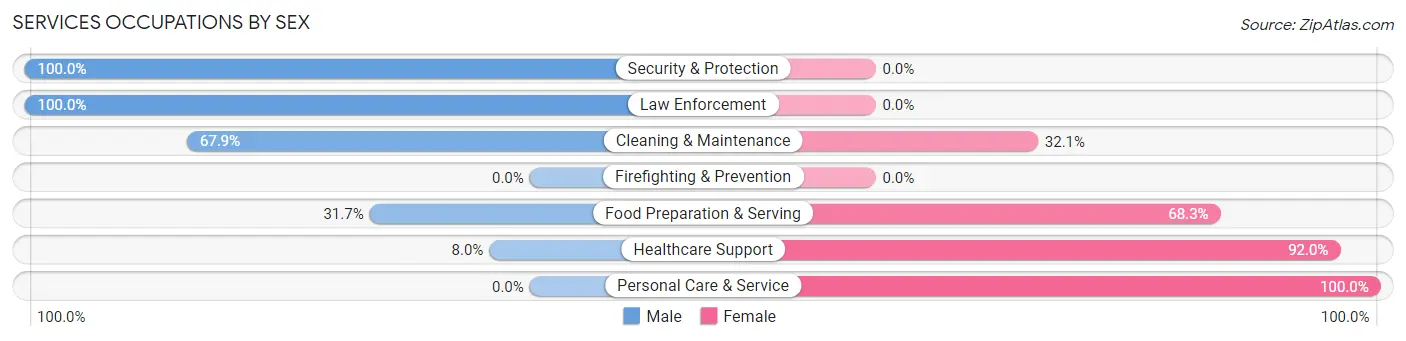
| Occupation | Male | Female |
| Healthcare Support | 4 (8.0%) | 46 (92.0%) |
| Security & Protection | 3 (100.0%) | 0 (0.0%) |
| Firefighting & Prevention | 0 (0.0%) | 0 (0.0%) |
| Law Enforcement | 3 (100.0%) | 0 (0.0%) |
| Food Preparation & Serving | 13 (31.7%) | 28 (68.3%) |
| Cleaning & Maintenance | 19 (67.9%) | 9 (32.1%) |
| Personal Care & Service | 0 (0.0%) | 6 (100.0%) |
| Total (Category) | 39 (30.5%) | 89 (69.5%) |
| Total (Overall) | 708 (57.6%) | 521 (42.4%) |
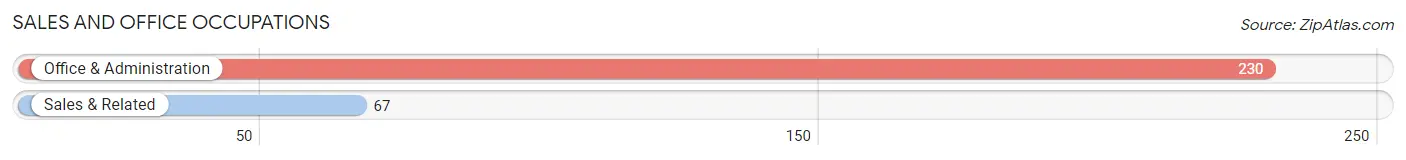
Sales and Office Occupations
The most common Sales and Office occupations in Costilla County are Office & Administration (230 | 18.7%), and Sales & Related (67 | 5.4%).
Sales and Office Occupations by Sex
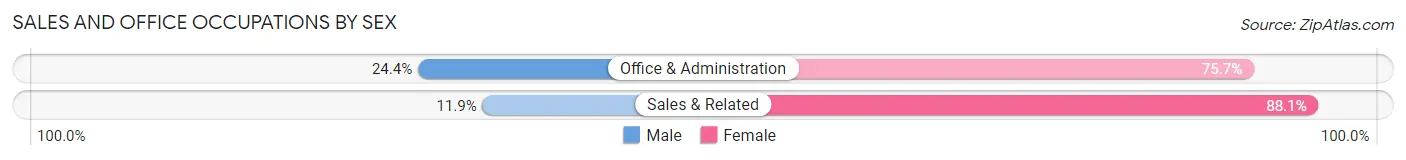
| Occupation | Male | Female |
| Sales & Related | 8 (11.9%) | 59 (88.1%) |
| Office & Administration | 56 (24.3%) | 174 (75.6%) |
| Total (Category) | 64 (21.5%) | 233 (78.4%) |
| Total (Overall) | 708 (57.6%) | 521 (42.4%) |
Natural Resources, Construction and Maintenance Occupations
The most common Natural Resources, Construction and Maintenance occupations in Costilla County are Construction & Extraction (116 | 9.4%), Farming, Fishing & Forestry (85 | 6.9%), and Installation, Maintenance & Repair (33 | 2.7%).
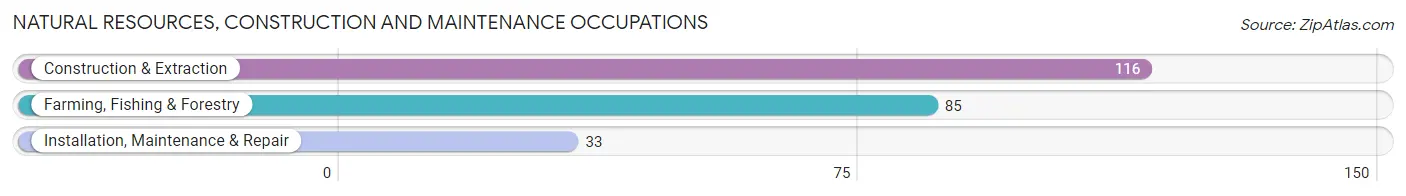
Natural Resources, Construction and Maintenance Occupations by Sex
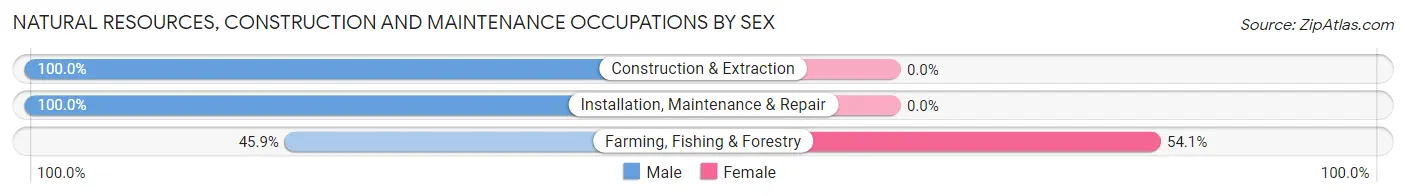
| Occupation | Male | Female |
| Farming, Fishing & Forestry | 39 (45.9%) | 46 (54.1%) |
| Construction & Extraction | 116 (100.0%) | 0 (0.0%) |
| Installation, Maintenance & Repair | 33 (100.0%) | 0 (0.0%) |
| Total (Category) | 188 (80.3%) | 46 (19.7%) |
| Total (Overall) | 708 (57.6%) | 521 (42.4%) |
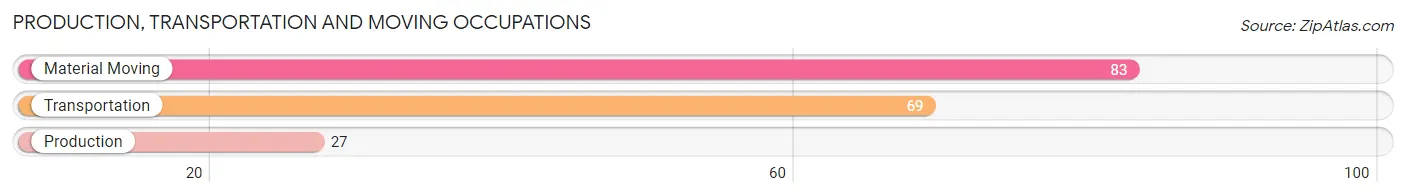
Production, Transportation and Moving Occupations
The most common Production, Transportation and Moving occupations in Costilla County are Material Moving (83 | 6.8%), Transportation (69 | 5.6%), and Production (27 | 2.2%).
Production, Transportation and Moving Occupations by Sex
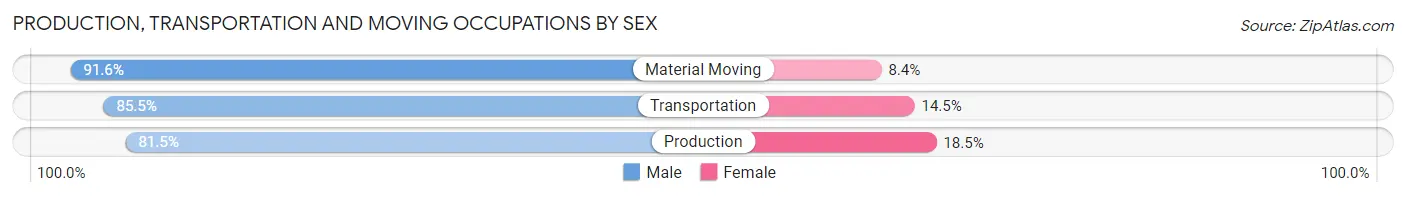
| Occupation | Male | Female |
| Production | 22 (81.5%) | 5 (18.5%) |
| Transportation | 59 (85.5%) | 10 (14.5%) |
| Material Moving | 76 (91.6%) | 7 (8.4%) |
| Total (Category) | 157 (87.7%) | 22 (12.3%) |
| Total (Overall) | 708 (57.6%) | 521 (42.4%) |
Employment Industries by Sex in Costilla County
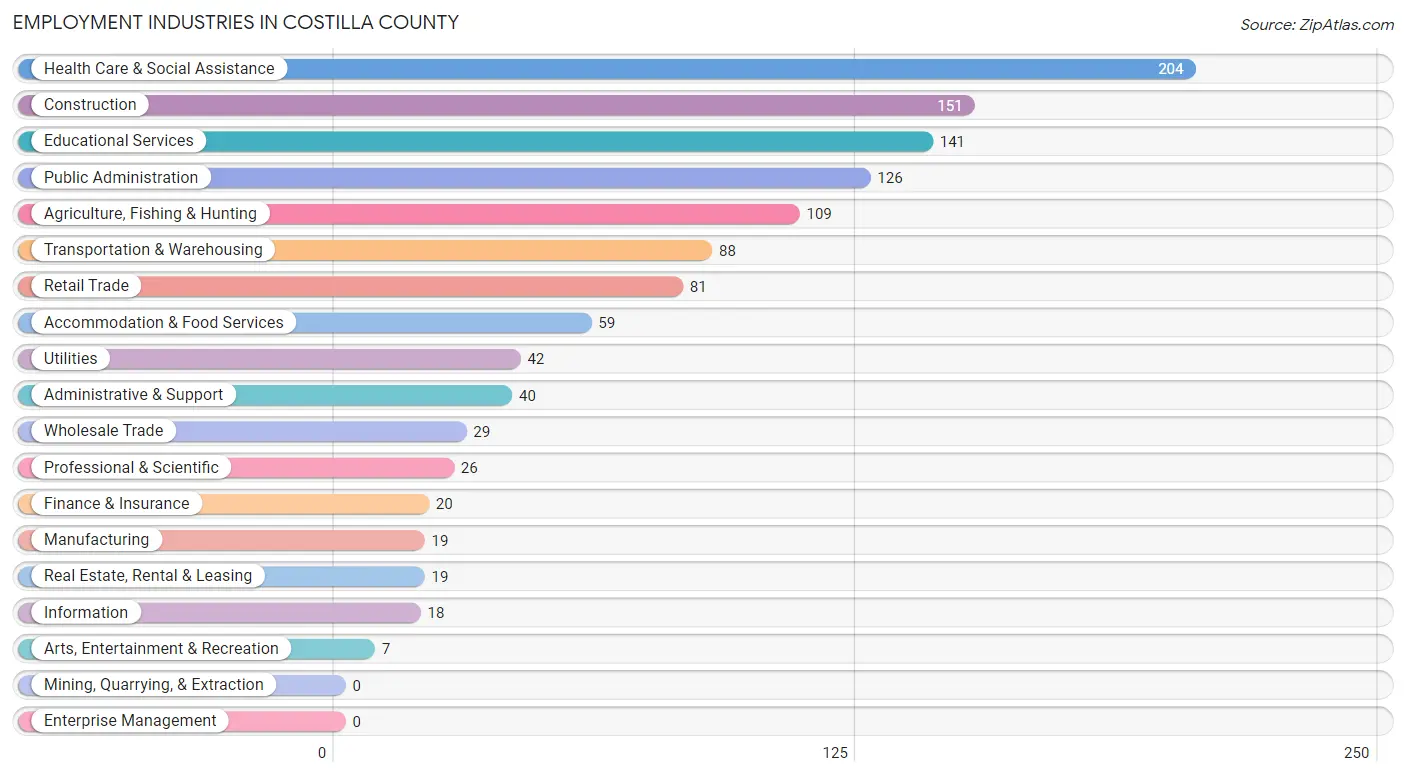
Employment Industries in Costilla County
The major employment industries in Costilla County include Health Care & Social Assistance (204 | 16.6%), Construction (151 | 12.3%), Educational Services (141 | 11.5%), Public Administration (126 | 10.2%), and Agriculture, Fishing & Hunting (109 | 8.9%).
Employment Industries by Sex in Costilla County
The Costilla County industries that see more men than women are Manufacturing (100.0%), Transportation & Warehousing (94.3%), and Construction (86.8%), whereas the industries that tend to have a higher number of women are Arts, Entertainment & Recreation (100.0%), Real Estate, Rental & Leasing (78.9%), and Utilities (76.2%).
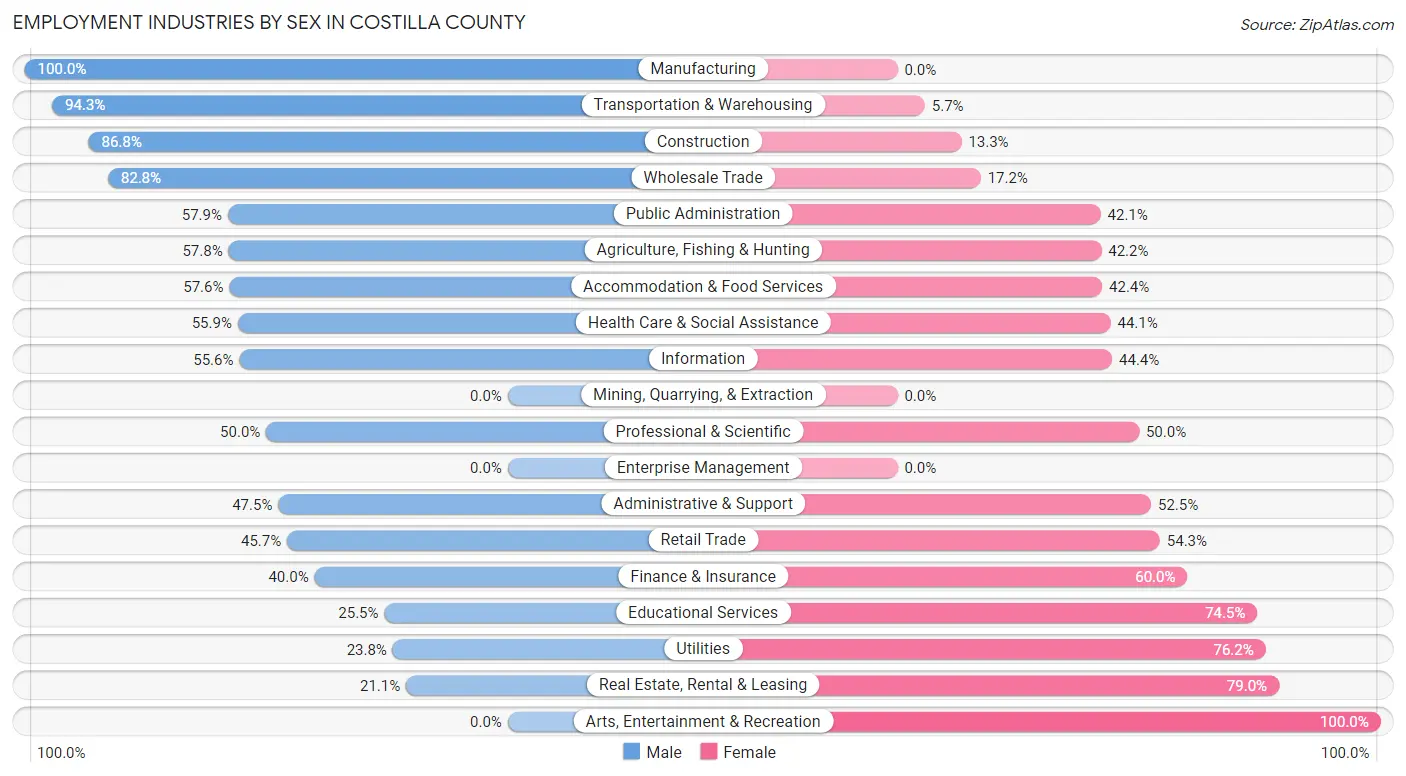
| Industry | Male | Female |
| Agriculture, Fishing & Hunting | 63 (57.8%) | 46 (42.2%) |
| Mining, Quarrying, & Extraction | 0 (0.0%) | 0 (0.0%) |
| Construction | 131 (86.8%) | 20 (13.3%) |
| Manufacturing | 19 (100.0%) | 0 (0.0%) |
| Wholesale Trade | 24 (82.8%) | 5 (17.2%) |
| Retail Trade | 37 (45.7%) | 44 (54.3%) |
| Transportation & Warehousing | 83 (94.3%) | 5 (5.7%) |
| Utilities | 10 (23.8%) | 32 (76.2%) |
| Information | 10 (55.6%) | 8 (44.4%) |
| Finance & Insurance | 8 (40.0%) | 12 (60.0%) |
| Real Estate, Rental & Leasing | 4 (21.0%) | 15 (78.9%) |
| Professional & Scientific | 13 (50.0%) | 13 (50.0%) |
| Enterprise Management | 0 (0.0%) | 0 (0.0%) |
| Administrative & Support | 19 (47.5%) | 21 (52.5%) |
| Educational Services | 36 (25.5%) | 105 (74.5%) |
| Health Care & Social Assistance | 114 (55.9%) | 90 (44.1%) |
| Arts, Entertainment & Recreation | 0 (0.0%) | 7 (100.0%) |
| Accommodation & Food Services | 34 (57.6%) | 25 (42.4%) |
| Public Administration | 73 (57.9%) | 53 (42.1%) |
| Total | 708 (57.6%) | 521 (42.4%) |
Education in Costilla County
School Enrollment in Costilla County
The most common levels of schooling among the 581 students in Costilla County are middle school (162 | 27.9%), high school (132 | 22.7%), and elementary school (130 | 22.4%).
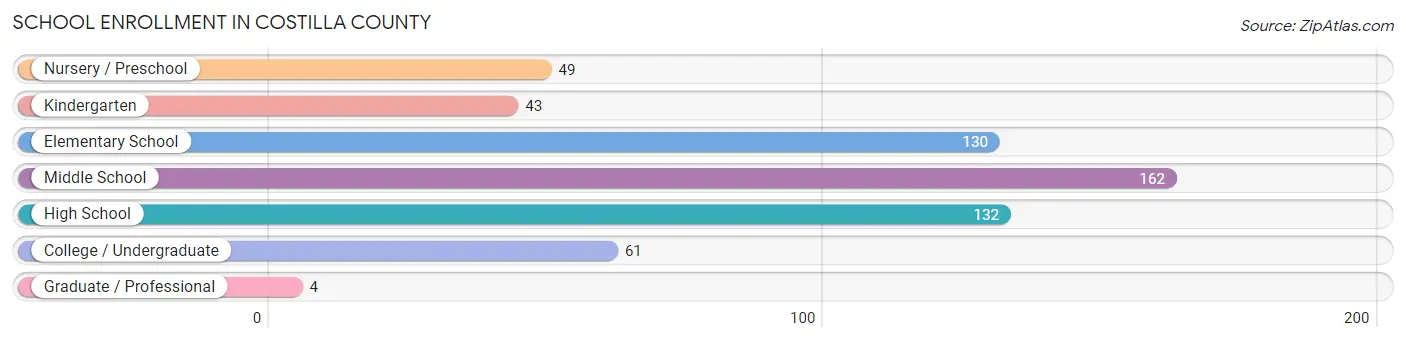
| School Level | # Students | % Students |
| Nursery / Preschool | 49 | 8.4% |
| Kindergarten | 43 | 7.4% |
| Elementary School | 130 | 22.4% |
| Middle School | 162 | 27.9% |
| High School | 132 | 22.7% |
| College / Undergraduate | 61 | 10.5% |
| Graduate / Professional | 4 | 0.7% |
| Total | 581 | 100.0% |
School Enrollment by Age by Funding Source in Costilla County
Out of a total of 581 students who are enrolled in schools in Costilla County, 98 (16.9%) attend a private institution, while the remaining 483 (83.1%) are enrolled in public schools. The age group of 20 to 24 year olds has the highest likelihood of being enrolled in private schools, with 17 (44.7% in the age bracket) enrolled. Conversely, the age group of 5 to 9 year old has the lowest likelihood of being enrolled in a private school, with 157 (100.0% in the age bracket) attending a public institution.

| Age Bracket | Public School | Private School |
| 3 to 4 Year Olds | 26 (61.9%) | 16 (38.1%) |
| 5 to 9 Year Old | 157 (100.0%) | 0 (0.0%) |
| 10 to 14 Year Olds | 166 (93.3%) | 12 (6.7%) |
| 15 to 17 Year Olds | 80 (72.1%) | 31 (27.9%) |
| 18 to 19 Year Olds | 29 (56.9%) | 22 (43.1%) |
| 20 to 24 Year Olds | 21 (55.3%) | 17 (44.7%) |
| 25 to 34 Year Olds | 0 (0.0%) | 0 (0.0%) |
| 35 Years and over | 4 (100.0%) | 0 (0.0%) |
| Total | 483 (83.1%) | 98 (16.9%) |
Educational Attainment by Field of Study in Costilla County
Business (186 | 26.7%), education (78 | 11.2%), psychology (66 | 9.5%), arts & humanities (66 | 9.5%), and science & technology (63 | 9.0%) are the most common fields of study among 698 individuals in Costilla County who have obtained a bachelor's degree or higher.
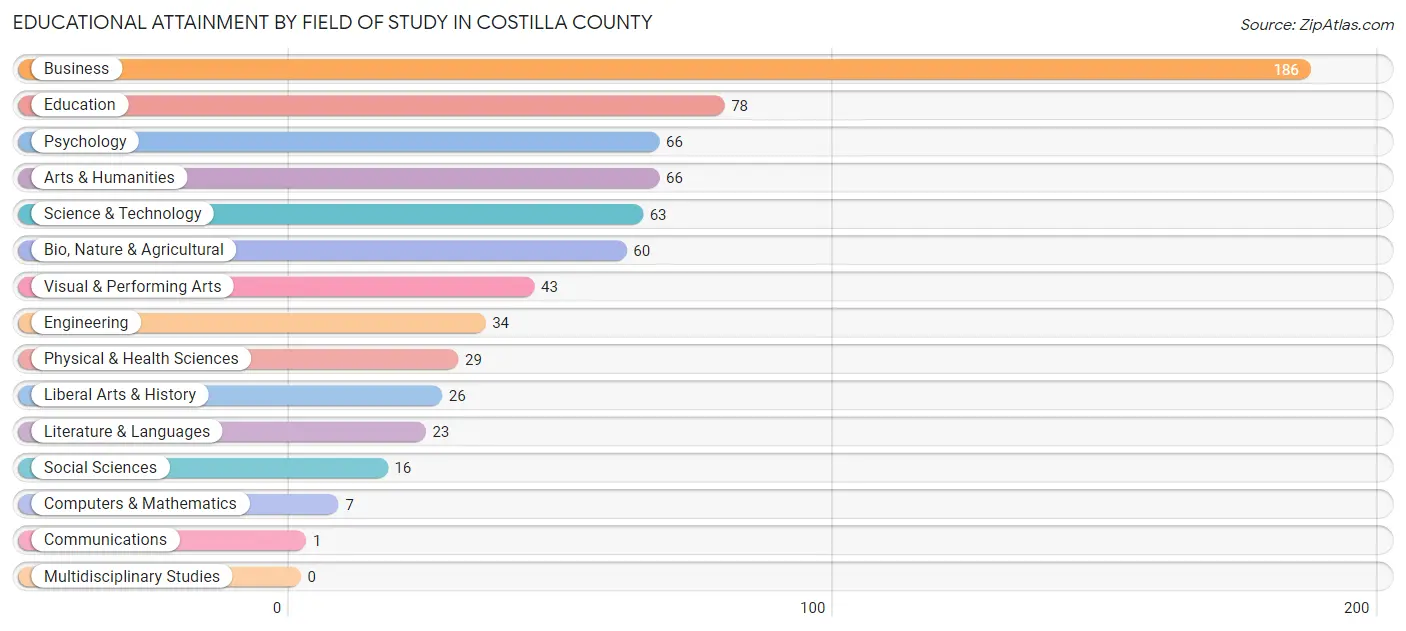
| Field of Study | # Graduates | % Graduates |
| Computers & Mathematics | 7 | 1.0% |
| Bio, Nature & Agricultural | 60 | 8.6% |
| Physical & Health Sciences | 29 | 4.2% |
| Psychology | 66 | 9.5% |
| Social Sciences | 16 | 2.3% |
| Engineering | 34 | 4.9% |
| Multidisciplinary Studies | 0 | 0.0% |
| Science & Technology | 63 | 9.0% |
| Business | 186 | 26.7% |
| Education | 78 | 11.2% |
| Literature & Languages | 23 | 3.3% |
| Liberal Arts & History | 26 | 3.7% |
| Visual & Performing Arts | 43 | 6.2% |
| Communications | 1 | 0.1% |
| Arts & Humanities | 66 | 9.5% |
| Total | 698 | 100.0% |
Transportation & Commute in Costilla County
Vehicle Availability by Sex in Costilla County
The most prevalent vehicle ownership categories in Costilla County are males with 2 vehicles (202, accounting for 29.8%) and females with 2 vehicles (137, making up 44.7%).
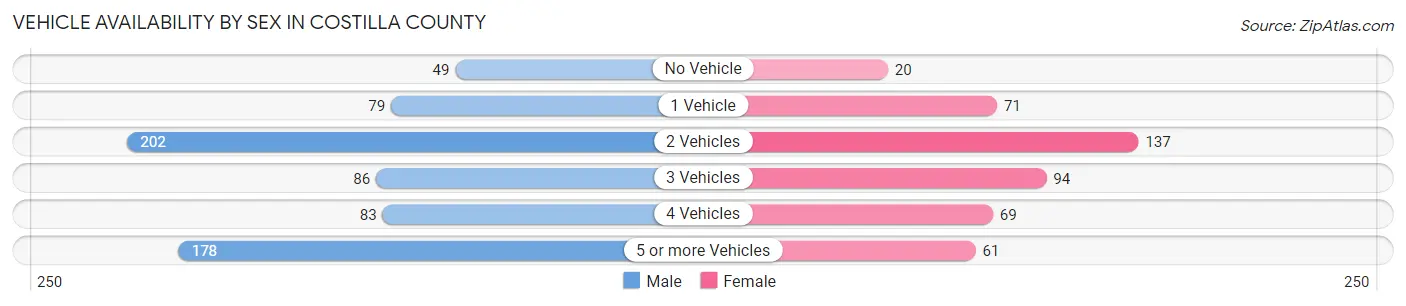
| Vehicles Available | Male | Female |
| No Vehicle | 49 (7.2%) | 20 (4.4%) |
| 1 Vehicle | 79 (11.7%) | 71 (15.7%) |
| 2 Vehicles | 202 (29.8%) | 137 (30.3%) |
| 3 Vehicles | 86 (12.7%) | 94 (20.8%) |
| 4 Vehicles | 83 (12.3%) | 69 (15.3%) |
| 5 or more Vehicles | 178 (26.3%) | 61 (13.5%) |
| Total | 677 (100.0%) | 452 (100.0%) |
Commute Time in Costilla County
The most frequently occuring commute durations in Costilla County are 45 to 59 minutes (220 commuters, 21.4%), 5 to 9 minutes (208 commuters, 20.3%), and less than 5 minutes (132 commuters, 12.9%).
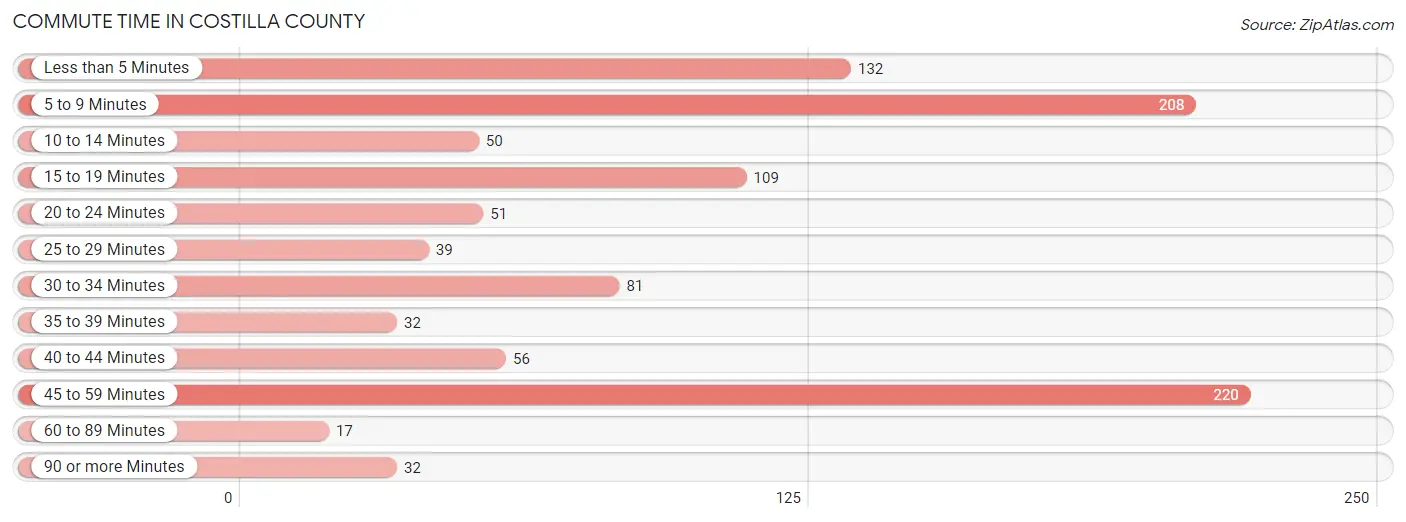
| Commute Time | # Commuters | % Commuters |
| Less than 5 Minutes | 132 | 12.9% |
| 5 to 9 Minutes | 208 | 20.3% |
| 10 to 14 Minutes | 50 | 4.9% |
| 15 to 19 Minutes | 109 | 10.6% |
| 20 to 24 Minutes | 51 | 5.0% |
| 25 to 29 Minutes | 39 | 3.8% |
| 30 to 34 Minutes | 81 | 7.9% |
| 35 to 39 Minutes | 32 | 3.1% |
| 40 to 44 Minutes | 56 | 5.4% |
| 45 to 59 Minutes | 220 | 21.4% |
| 60 to 89 Minutes | 17 | 1.7% |
| 90 or more Minutes | 32 | 3.1% |
Commute Time by Sex in Costilla County
The most common commute times in Costilla County are 45 to 59 minutes (165 commuters, 26.3%) for males and 5 to 9 minutes (110 commuters, 27.6%) for females.
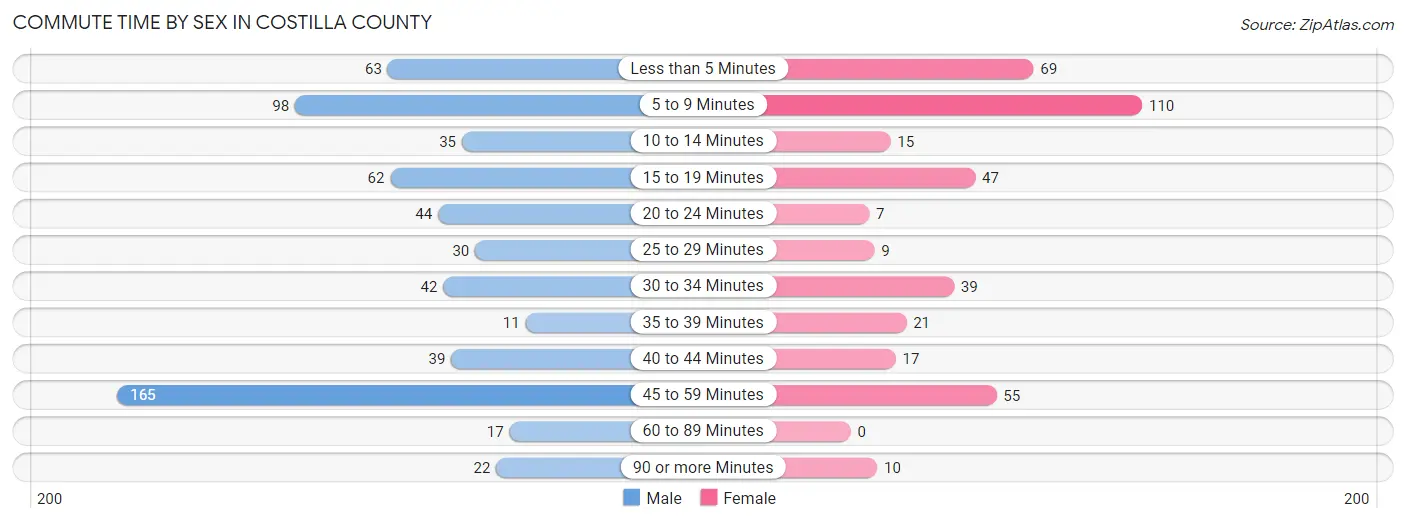
| Commute Time | Male | Female |
| Less than 5 Minutes | 63 (10.0%) | 69 (17.3%) |
| 5 to 9 Minutes | 98 (15.6%) | 110 (27.6%) |
| 10 to 14 Minutes | 35 (5.6%) | 15 (3.8%) |
| 15 to 19 Minutes | 62 (9.9%) | 47 (11.8%) |
| 20 to 24 Minutes | 44 (7.0%) | 7 (1.8%) |
| 25 to 29 Minutes | 30 (4.8%) | 9 (2.3%) |
| 30 to 34 Minutes | 42 (6.7%) | 39 (9.8%) |
| 35 to 39 Minutes | 11 (1.8%) | 21 (5.3%) |
| 40 to 44 Minutes | 39 (6.2%) | 17 (4.3%) |
| 45 to 59 Minutes | 165 (26.3%) | 55 (13.8%) |
| 60 to 89 Minutes | 17 (2.7%) | 0 (0.0%) |
| 90 or more Minutes | 22 (3.5%) | 10 (2.5%) |
Time of Departure to Work by Sex in Costilla County
The most frequent times of departure to work in Costilla County are 7:00 AM to 7:29 AM (146, 23.3%) for males and 7:00 AM to 7:29 AM (112, 28.1%) for females.
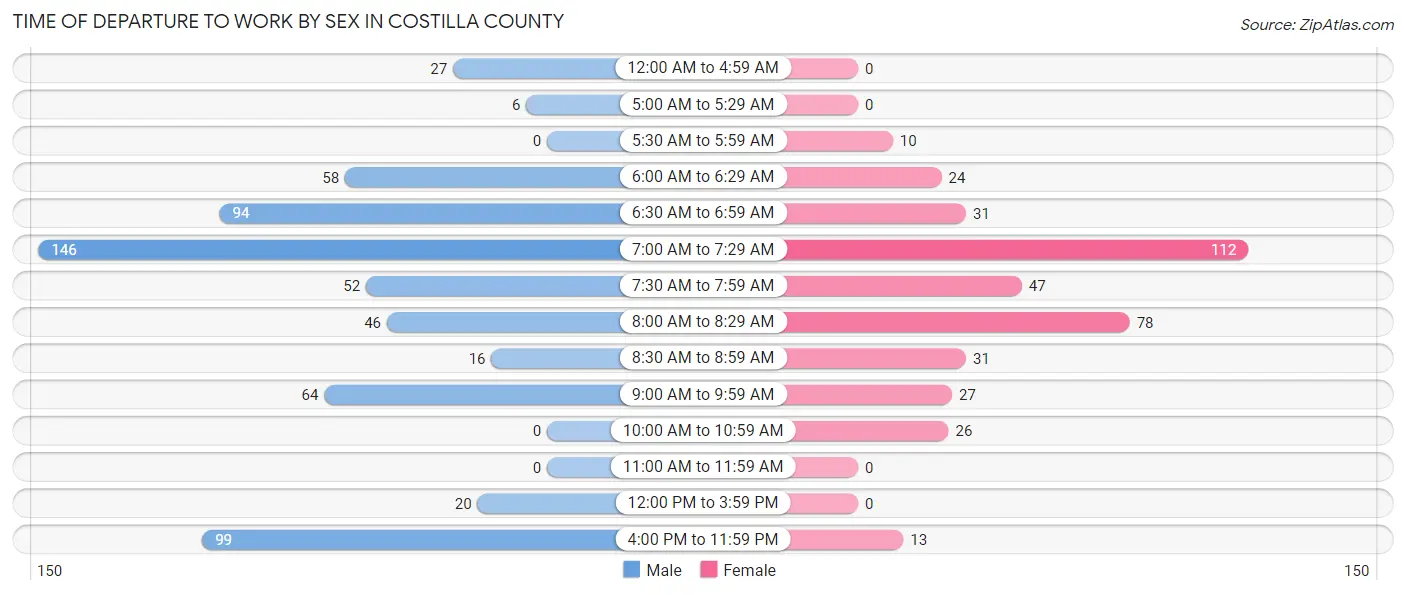
| Time of Departure | Male | Female |
| 12:00 AM to 4:59 AM | 27 (4.3%) | 0 (0.0%) |
| 5:00 AM to 5:29 AM | 6 (1.0%) | 0 (0.0%) |
| 5:30 AM to 5:59 AM | 0 (0.0%) | 10 (2.5%) |
| 6:00 AM to 6:29 AM | 58 (9.2%) | 24 (6.0%) |
| 6:30 AM to 6:59 AM | 94 (15.0%) | 31 (7.8%) |
| 7:00 AM to 7:29 AM | 146 (23.3%) | 112 (28.1%) |
| 7:30 AM to 7:59 AM | 52 (8.3%) | 47 (11.8%) |
| 8:00 AM to 8:29 AM | 46 (7.3%) | 78 (19.6%) |
| 8:30 AM to 8:59 AM | 16 (2.5%) | 31 (7.8%) |
| 9:00 AM to 9:59 AM | 64 (10.2%) | 27 (6.8%) |
| 10:00 AM to 10:59 AM | 0 (0.0%) | 26 (6.5%) |
| 11:00 AM to 11:59 AM | 0 (0.0%) | 0 (0.0%) |
| 12:00 PM to 3:59 PM | 20 (3.2%) | 0 (0.0%) |
| 4:00 PM to 11:59 PM | 99 (15.8%) | 13 (3.3%) |
| Total | 628 (100.0%) | 399 (100.0%) |
Housing Occupancy in Costilla County
Occupancy by Ownership in Costilla County
Of the total 1,530 dwellings in Costilla County, owner-occupied units account for 1,167 (76.3%), while renter-occupied units make up 363 (23.7%).
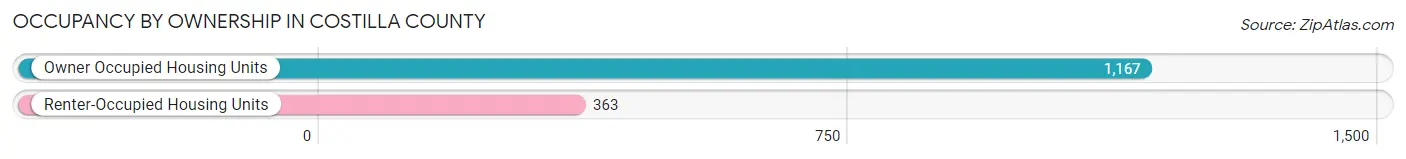
| Occupancy | # Housing Units | % Housing Units |
| Owner Occupied Housing Units | 1,167 | 76.3% |
| Renter-Occupied Housing Units | 363 | 23.7% |
| Total Occupied Housing Units | 1,530 | 100.0% |
Occupancy by Household Size in Costilla County
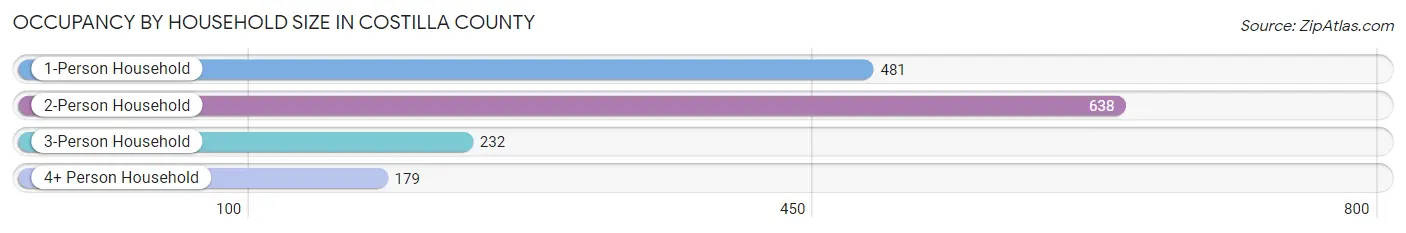
| Household Size | # Housing Units | % Housing Units |
| 1-Person Household | 481 | 31.4% |
| 2-Person Household | 638 | 41.7% |
| 3-Person Household | 232 | 15.2% |
| 4+ Person Household | 179 | 11.7% |
| Total Housing Units | 1,530 | 100.0% |
Occupancy by Ownership by Household Size in Costilla County
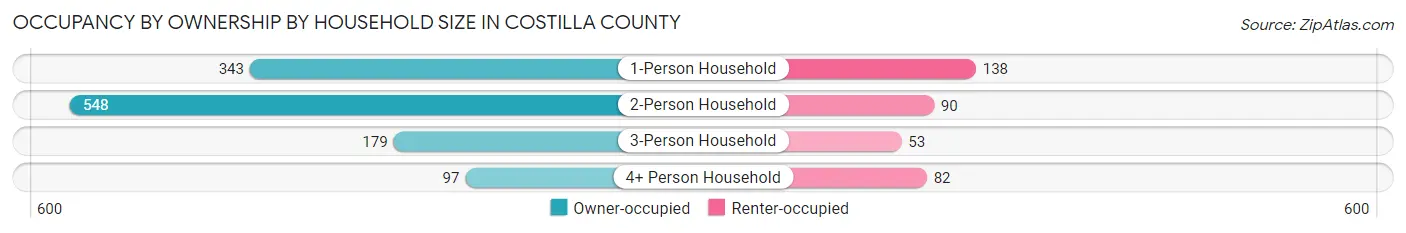
| Household Size | Owner-occupied | Renter-occupied |
| 1-Person Household | 343 (71.3%) | 138 (28.7%) |
| 2-Person Household | 548 (85.9%) | 90 (14.1%) |
| 3-Person Household | 179 (77.2%) | 53 (22.8%) |
| 4+ Person Household | 97 (54.2%) | 82 (45.8%) |
| Total Housing Units | 1,167 (76.3%) | 363 (23.7%) |
Occupancy by Educational Attainment in Costilla County
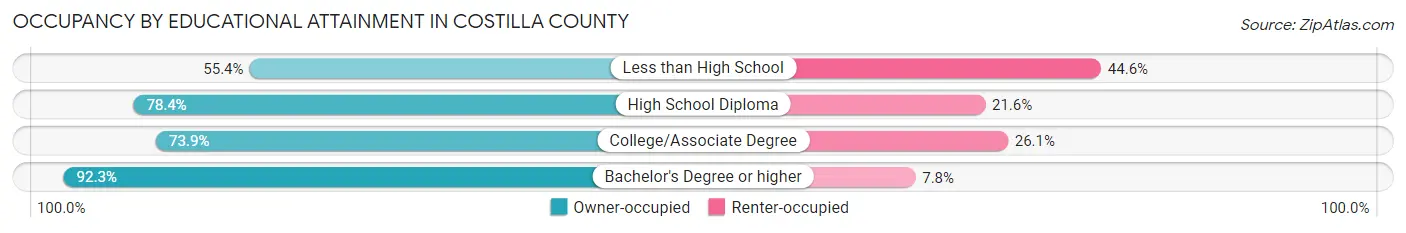
| Household Size | Owner-occupied | Renter-occupied |
| Less than High School | 107 (55.4%) | 86 (44.6%) |
| High School Diploma | 385 (78.4%) | 106 (21.6%) |
| College/Associate Degree | 425 (73.9%) | 150 (26.1%) |
| Bachelor's Degree or higher | 250 (92.2%) | 21 (7.7%) |
Occupancy by Age of Householder in Costilla County
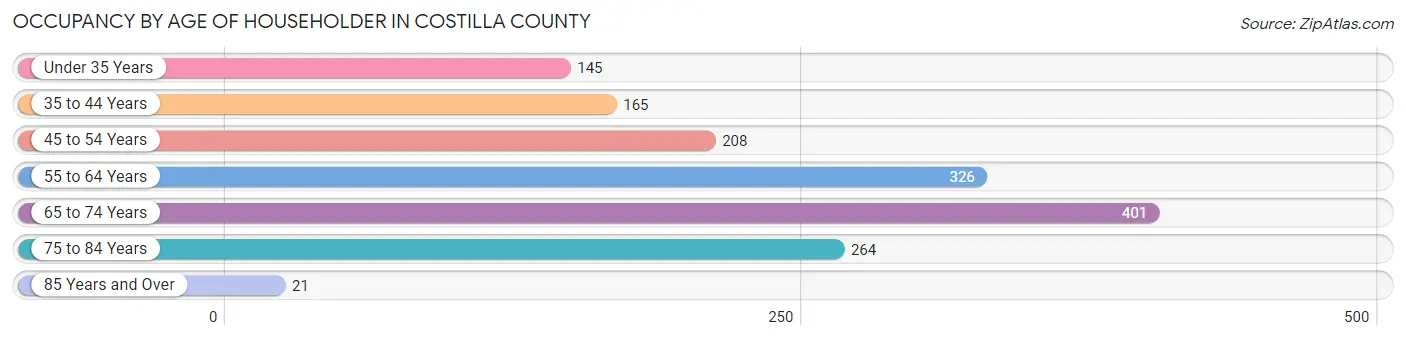
| Age Bracket | # Households | % Households |
| Under 35 Years | 145 | 9.5% |
| 35 to 44 Years | 165 | 10.8% |
| 45 to 54 Years | 208 | 13.6% |
| 55 to 64 Years | 326 | 21.3% |
| 65 to 74 Years | 401 | 26.2% |
| 75 to 84 Years | 264 | 17.2% |
| 85 Years and Over | 21 | 1.4% |
| Total | 1,530 | 100.0% |
Housing Finances in Costilla County
Median Income by Occupancy in Costilla County
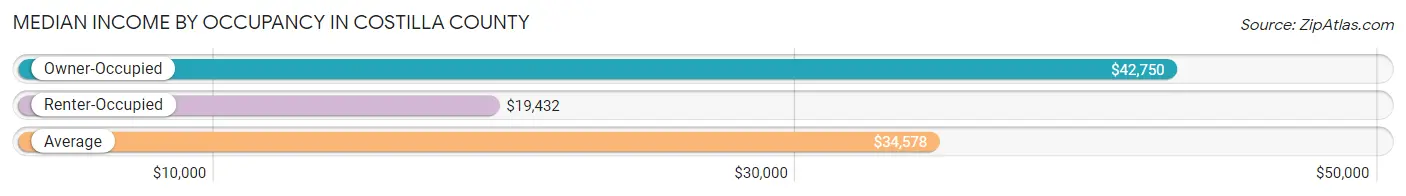
| Occupancy Type | # Households | Median Income |
| Owner-Occupied | 1,167 (76.3%) | $42,750 |
| Renter-Occupied | 363 (23.7%) | $19,432 |
| Average | 1,530 (100.0%) | $34,578 |
Occupancy by Householder Income Bracket in Costilla County
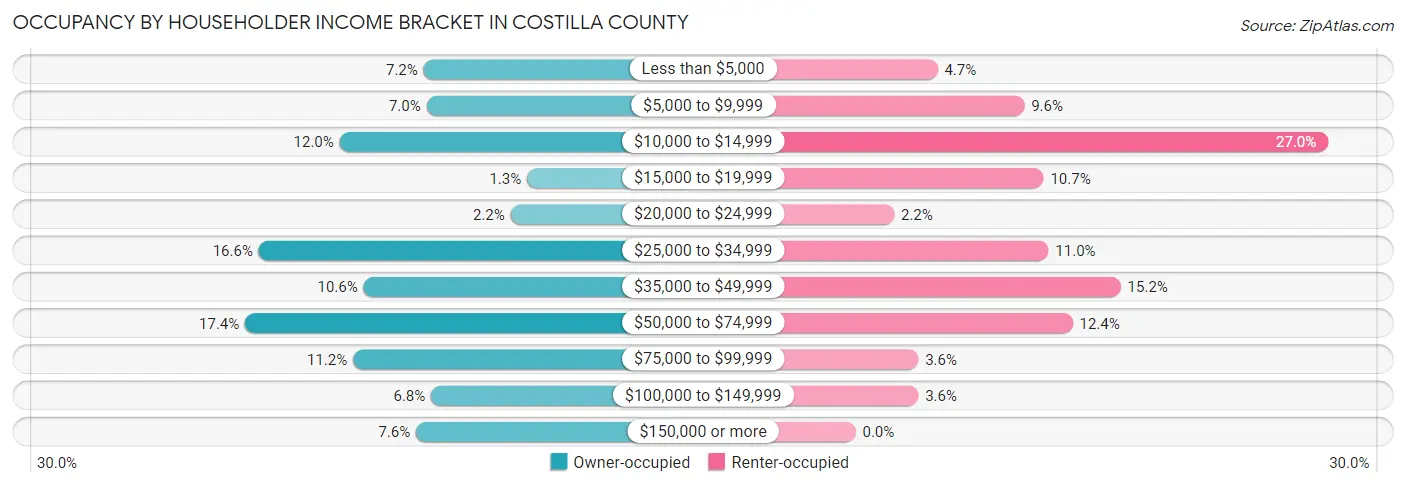
| Income Bracket | Owner-occupied | Renter-occupied |
| Less than $5,000 | 84 (7.2%) | 17 (4.7%) |
| $5,000 to $9,999 | 82 (7.0%) | 35 (9.6%) |
| $10,000 to $14,999 | 140 (12.0%) | 98 (27.0%) |
| $15,000 to $19,999 | 15 (1.3%) | 39 (10.7%) |
| $20,000 to $24,999 | 26 (2.2%) | 8 (2.2%) |
| $25,000 to $34,999 | 194 (16.6%) | 40 (11.0%) |
| $35,000 to $49,999 | 124 (10.6%) | 55 (15.1%) |
| $50,000 to $74,999 | 203 (17.4%) | 45 (12.4%) |
| $75,000 to $99,999 | 131 (11.2%) | 13 (3.6%) |
| $100,000 to $149,999 | 79 (6.8%) | 13 (3.6%) |
| $150,000 or more | 89 (7.6%) | 0 (0.0%) |
| Total | 1,167 (100.0%) | 363 (100.0%) |
Monthly Housing Cost Tiers in Costilla County
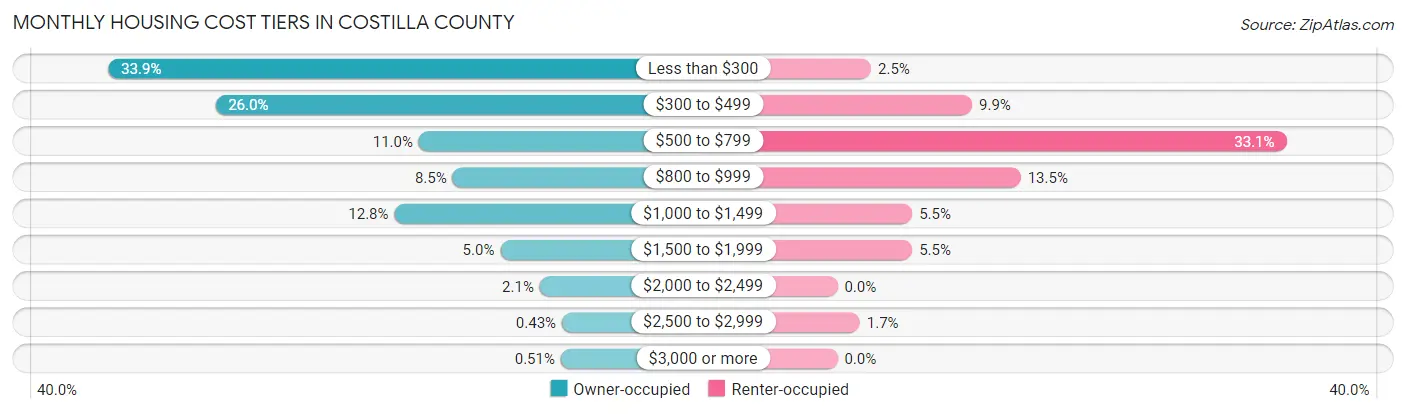
| Monthly Cost | Owner-occupied | Renter-occupied |
| Less than $300 | 395 (33.9%) | 9 (2.5%) |
| $300 to $499 | 303 (26.0%) | 36 (9.9%) |
| $500 to $799 | 128 (11.0%) | 120 (33.1%) |
| $800 to $999 | 99 (8.5%) | 49 (13.5%) |
| $1,000 to $1,499 | 149 (12.8%) | 20 (5.5%) |
| $1,500 to $1,999 | 58 (5.0%) | 20 (5.5%) |
| $2,000 to $2,499 | 24 (2.1%) | 0 (0.0%) |
| $2,500 to $2,999 | 5 (0.4%) | 6 (1.7%) |
| $3,000 or more | 6 (0.5%) | 0 (0.0%) |
| Total | 1,167 (100.0%) | 363 (100.0%) |
Physical Housing Characteristics in Costilla County
Housing Structures in Costilla County
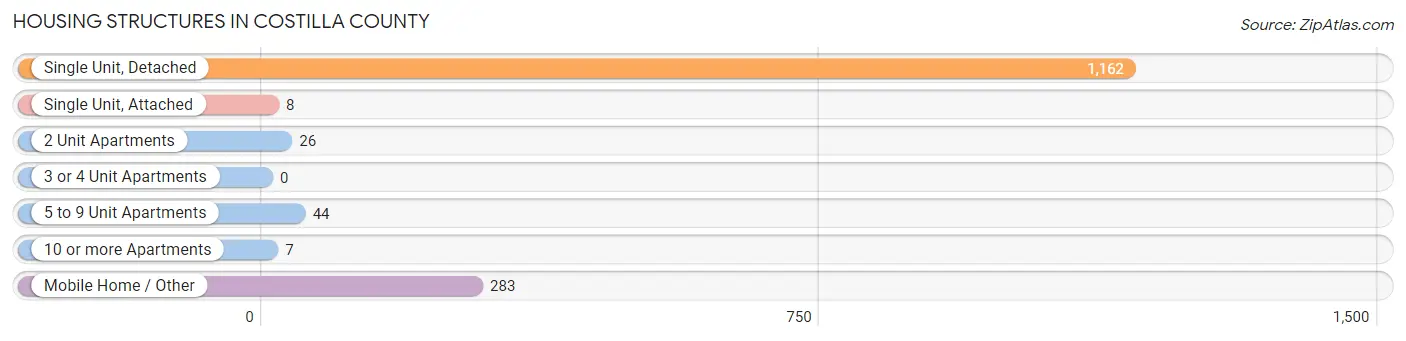
| Structure Type | # Housing Units | % Housing Units |
| Single Unit, Detached | 1,162 | 75.9% |
| Single Unit, Attached | 8 | 0.5% |
| 2 Unit Apartments | 26 | 1.7% |
| 3 or 4 Unit Apartments | 0 | 0.0% |
| 5 to 9 Unit Apartments | 44 | 2.9% |
| 10 or more Apartments | 7 | 0.5% |
| Mobile Home / Other | 283 | 18.5% |
| Total | 1,530 | 100.0% |
Housing Structures by Occupancy in Costilla County
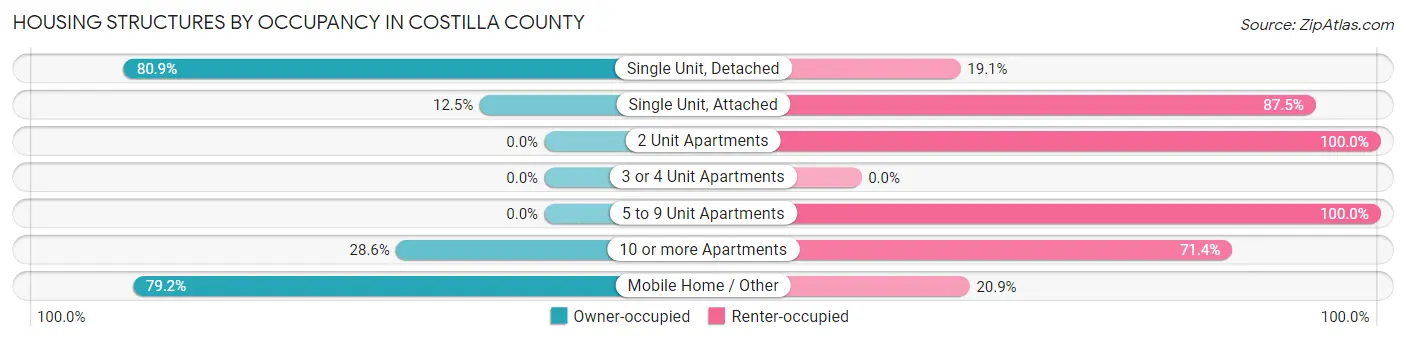
| Structure Type | Owner-occupied | Renter-occupied |
| Single Unit, Detached | 940 (80.9%) | 222 (19.1%) |
| Single Unit, Attached | 1 (12.5%) | 7 (87.5%) |
| 2 Unit Apartments | 0 (0.0%) | 26 (100.0%) |
| 3 or 4 Unit Apartments | 0 (0.0%) | 0 (0.0%) |
| 5 to 9 Unit Apartments | 0 (0.0%) | 44 (100.0%) |
| 10 or more Apartments | 2 (28.6%) | 5 (71.4%) |
| Mobile Home / Other | 224 (79.1%) | 59 (20.8%) |
| Total | 1,167 (76.3%) | 363 (23.7%) |
Housing Structures by Number of Rooms in Costilla County
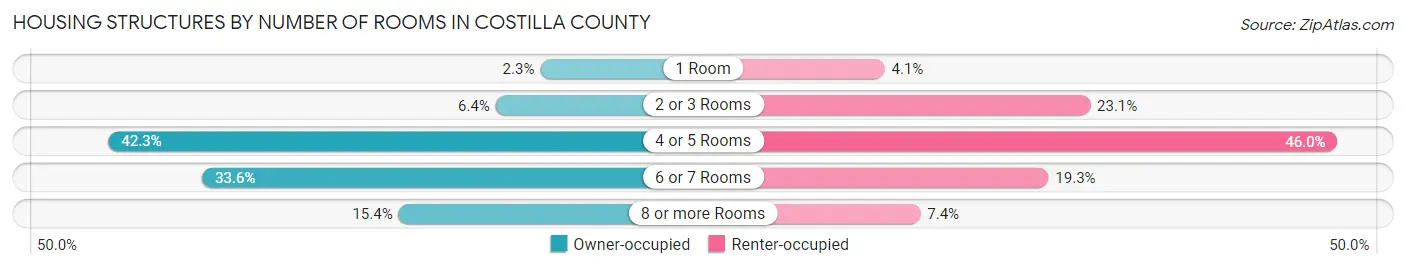
| Number of Rooms | Owner-occupied | Renter-occupied |
| 1 Room | 27 (2.3%) | 15 (4.1%) |
| 2 or 3 Rooms | 75 (6.4%) | 84 (23.1%) |
| 4 or 5 Rooms | 493 (42.2%) | 167 (46.0%) |
| 6 or 7 Rooms | 392 (33.6%) | 70 (19.3%) |
| 8 or more Rooms | 180 (15.4%) | 27 (7.4%) |
| Total | 1,167 (100.0%) | 363 (100.0%) |
Housing Structure by Heating Type in Costilla County
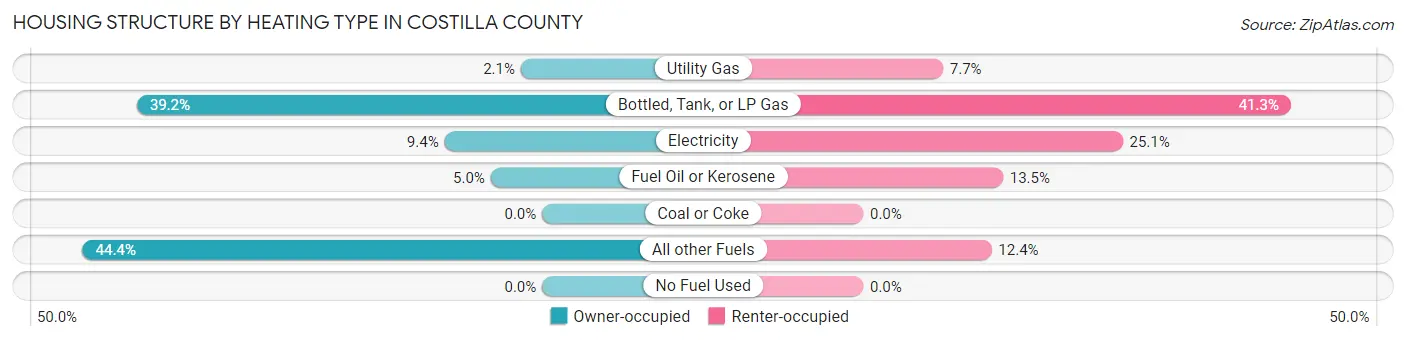
| Heating Type | Owner-occupied | Renter-occupied |
| Utility Gas | 24 (2.1%) | 28 (7.7%) |
| Bottled, Tank, or LP Gas | 457 (39.2%) | 150 (41.3%) |
| Electricity | 110 (9.4%) | 91 (25.1%) |
| Fuel Oil or Kerosene | 58 (5.0%) | 49 (13.5%) |
| Coal or Coke | 0 (0.0%) | 0 (0.0%) |
| All other Fuels | 518 (44.4%) | 45 (12.4%) |
| No Fuel Used | 0 (0.0%) | 0 (0.0%) |
| Total | 1,167 (100.0%) | 363 (100.0%) |
Household Vehicle Usage in Costilla County
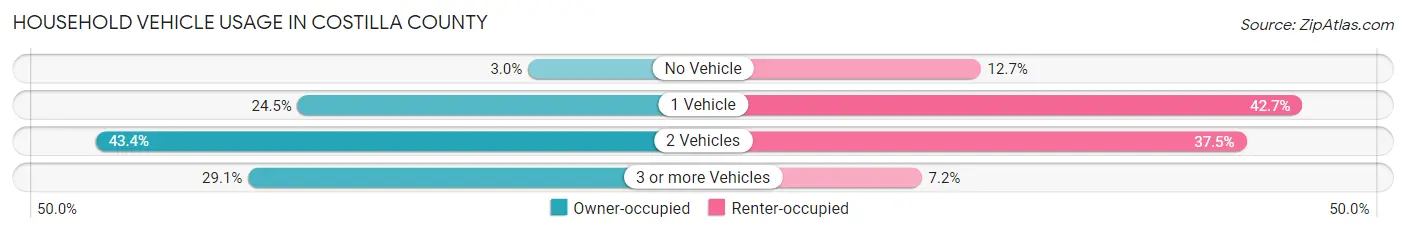
| Vehicles per Household | Owner-occupied | Renter-occupied |
| No Vehicle | 35 (3.0%) | 46 (12.7%) |
| 1 Vehicle | 286 (24.5%) | 155 (42.7%) |
| 2 Vehicles | 506 (43.4%) | 136 (37.5%) |
| 3 or more Vehicles | 340 (29.1%) | 26 (7.2%) |
| Total | 1,167 (100.0%) | 363 (100.0%) |
Real Estate & Mortgages in Costilla County
Real Estate and Mortgage Overview in Costilla County
| Characteristic | Without Mortgage | With Mortgage |
| Housing Units | 802 | 365 |
| Median Property Value | $121,800 | $210,900 |
| Median Household Income | $33,354 | $50 |
| Monthly Housing Costs | $305 | $6 |
| Real Estate Taxes | $445 | $0 |
Property Value by Mortgage Status in Costilla County
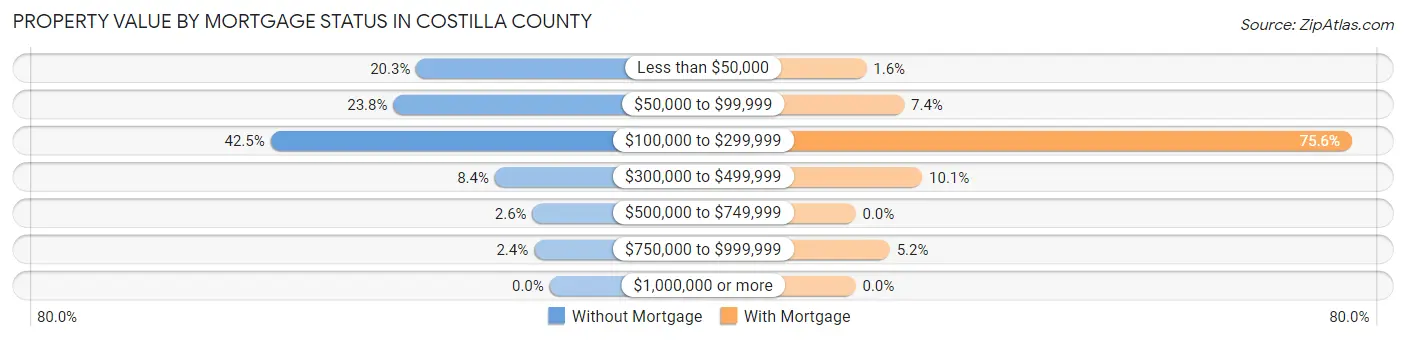
| Property Value | Without Mortgage | With Mortgage |
| Less than $50,000 | 163 (20.3%) | 6 (1.6%) |
| $50,000 to $99,999 | 191 (23.8%) | 27 (7.4%) |
| $100,000 to $299,999 | 341 (42.5%) | 276 (75.6%) |
| $300,000 to $499,999 | 67 (8.4%) | 37 (10.1%) |
| $500,000 to $749,999 | 21 (2.6%) | 0 (0.0%) |
| $750,000 to $999,999 | 19 (2.4%) | 19 (5.2%) |
| $1,000,000 or more | 0 (0.0%) | 0 (0.0%) |
| Total | 802 (100.0%) | 365 (100.0%) |
Household Income by Mortgage Status in Costilla County
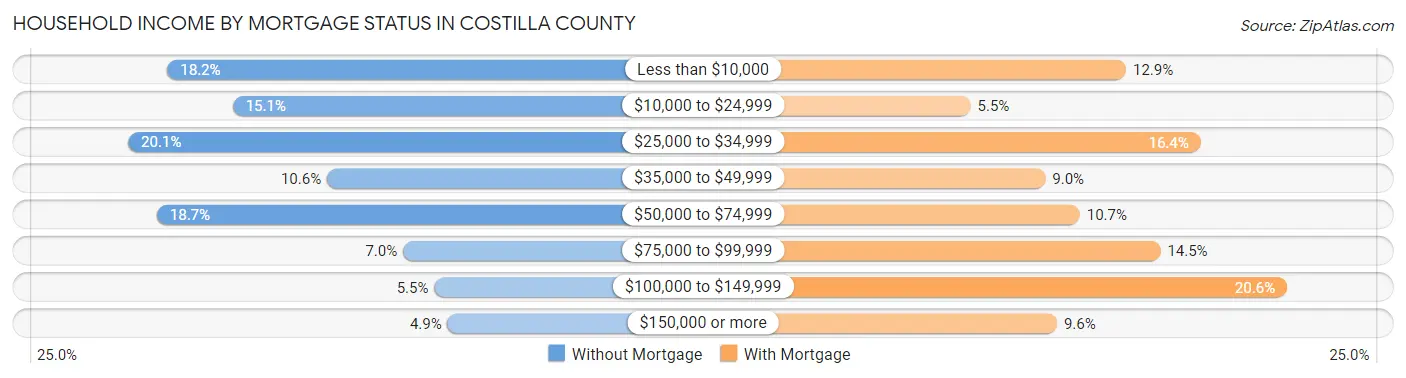
| Household Income | Without Mortgage | With Mortgage |
| Less than $10,000 | 146 (18.2%) | 47 (12.9%) |
| $10,000 to $24,999 | 121 (15.1%) | 20 (5.5%) |
| $25,000 to $34,999 | 161 (20.1%) | 60 (16.4%) |
| $35,000 to $49,999 | 85 (10.6%) | 33 (9.0%) |
| $50,000 to $74,999 | 150 (18.7%) | 39 (10.7%) |
| $75,000 to $99,999 | 56 (7.0%) | 53 (14.5%) |
| $100,000 to $149,999 | 44 (5.5%) | 75 (20.5%) |
| $150,000 or more | 39 (4.9%) | 35 (9.6%) |
| Total | 802 (100.0%) | 365 (100.0%) |
Property Value to Household Income Ratio in Costilla County
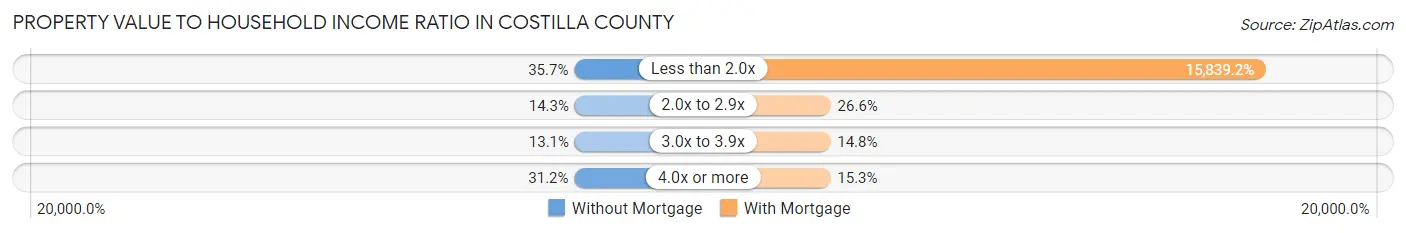
| Value-to-Income Ratio | Without Mortgage | With Mortgage |
| Less than 2.0x | 286 (35.7%) | 57,813 (15,839.2%) |
| 2.0x to 2.9x | 115 (14.3%) | 97 (26.6%) |
| 3.0x to 3.9x | 105 (13.1%) | 54 (14.8%) |
| 4.0x or more | 250 (31.2%) | 56 (15.3%) |
| Total | 802 (100.0%) | 365 (100.0%) |
Real Estate Taxes by Mortgage Status in Costilla County
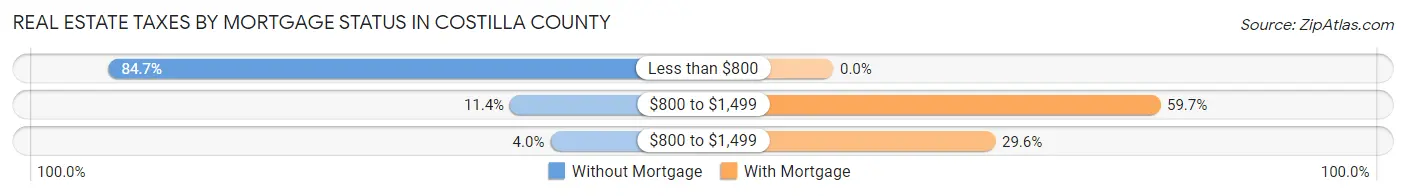
| Property Taxes | Without Mortgage | With Mortgage |
| Less than $800 | 679 (84.7%) | 0 (0.0%) |
| $800 to $1,499 | 91 (11.4%) | 218 (59.7%) |
| $800 to $1,499 | 32 (4.0%) | 108 (29.6%) |
| Total | 802 (100.0%) | 365 (100.0%) |
Health & Disability in Costilla County
Health Insurance Coverage by Age in Costilla County
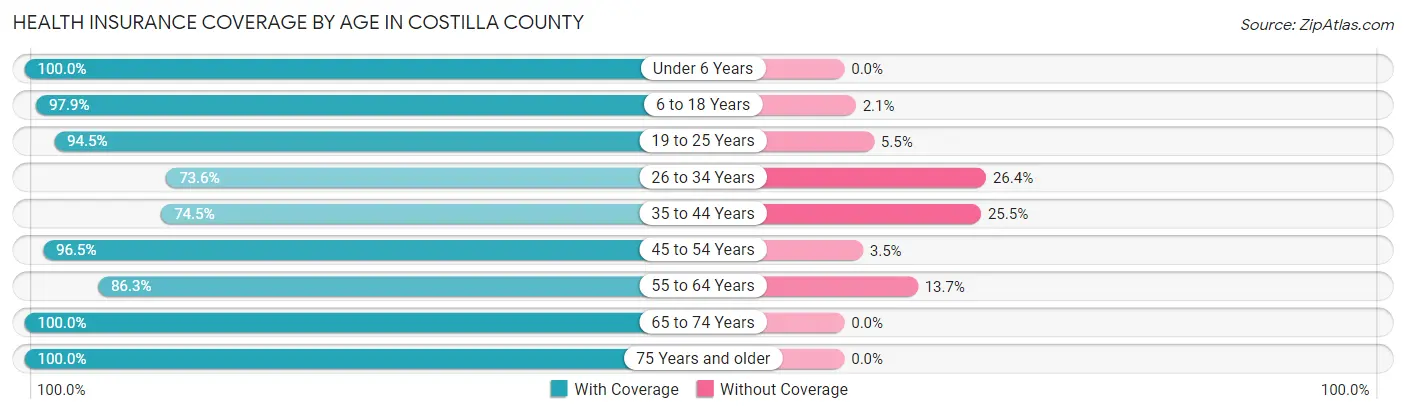
| Age Bracket | With Coverage | Without Coverage |
| Under 6 Years | 184 (100.0%) | 0 (0.0%) |
| 6 to 18 Years | 459 (97.9%) | 10 (2.1%) |
| 19 to 25 Years | 291 (94.5%) | 17 (5.5%) |
| 26 to 34 Years | 220 (73.6%) | 79 (26.4%) |
| 35 to 44 Years | 228 (74.5%) | 78 (25.5%) |
| 45 to 54 Years | 335 (96.5%) | 12 (3.5%) |
| 55 to 64 Years | 536 (86.3%) | 85 (13.7%) |
| 65 to 74 Years | 626 (100.0%) | 0 (0.0%) |
| 75 Years and older | 355 (100.0%) | 0 (0.0%) |
| Total | 3,234 (92.0%) | 281 (8.0%) |
Health Insurance Coverage by Citizenship Status in Costilla County
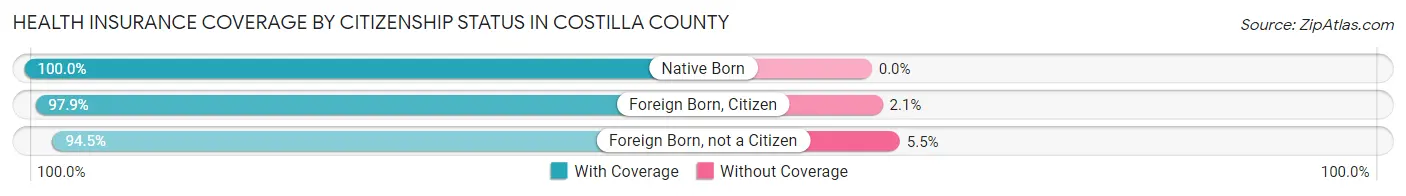
| Citizenship Status | With Coverage | Without Coverage |
| Native Born | 184 (100.0%) | 0 (0.0%) |
| Foreign Born, Citizen | 459 (97.9%) | 10 (2.1%) |
| Foreign Born, not a Citizen | 291 (94.5%) | 17 (5.5%) |
Health Insurance Coverage by Household Income in Costilla County

| Household Income | With Coverage | Without Coverage |
| Under $25,000 | 757 (91.8%) | 68 (8.2%) |
| $25,000 to $49,999 | 877 (92.4%) | 72 (7.6%) |
| $50,000 to $74,999 | 513 (89.1%) | 63 (10.9%) |
| $75,000 to $99,999 | 450 (98.5%) | 7 (1.5%) |
| $100,000 and over | 637 (90.0%) | 71 (10.0%) |
Public vs Private Health Insurance Coverage by Age in Costilla County
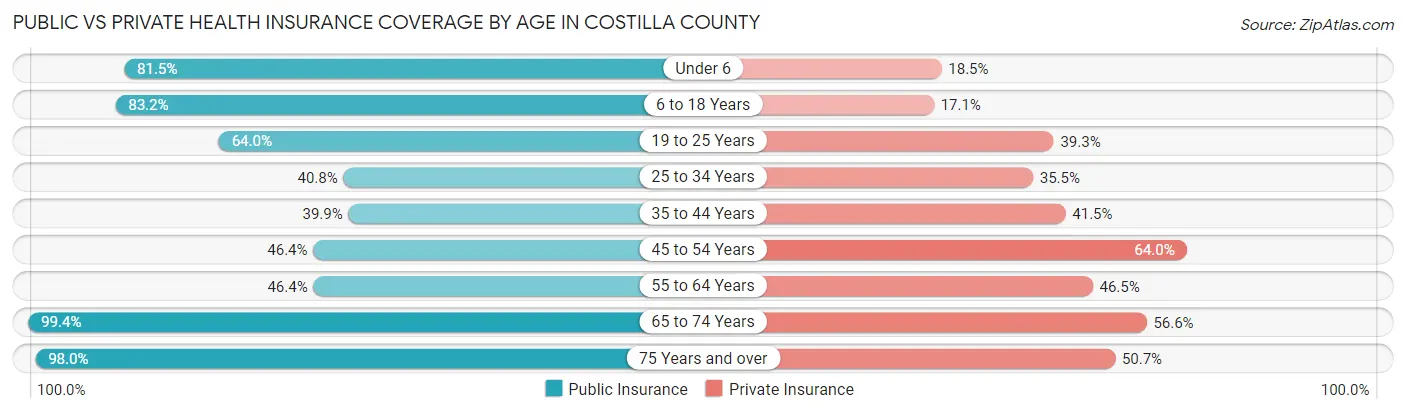
| Age Bracket | Public Insurance | Private Insurance |
| Under 6 | 150 (81.5%) | 34 (18.5%) |
| 6 to 18 Years | 390 (83.2%) | 80 (17.1%) |
| 19 to 25 Years | 197 (64.0%) | 121 (39.3%) |
| 25 to 34 Years | 122 (40.8%) | 106 (35.4%) |
| 35 to 44 Years | 122 (39.9%) | 127 (41.5%) |
| 45 to 54 Years | 161 (46.4%) | 222 (64.0%) |
| 55 to 64 Years | 288 (46.4%) | 289 (46.5%) |
| 65 to 74 Years | 622 (99.4%) | 354 (56.6%) |
| 75 Years and over | 348 (98.0%) | 180 (50.7%) |
| Total | 2,400 (68.3%) | 1,513 (43.0%) |
Disability Status by Sex by Age in Costilla County
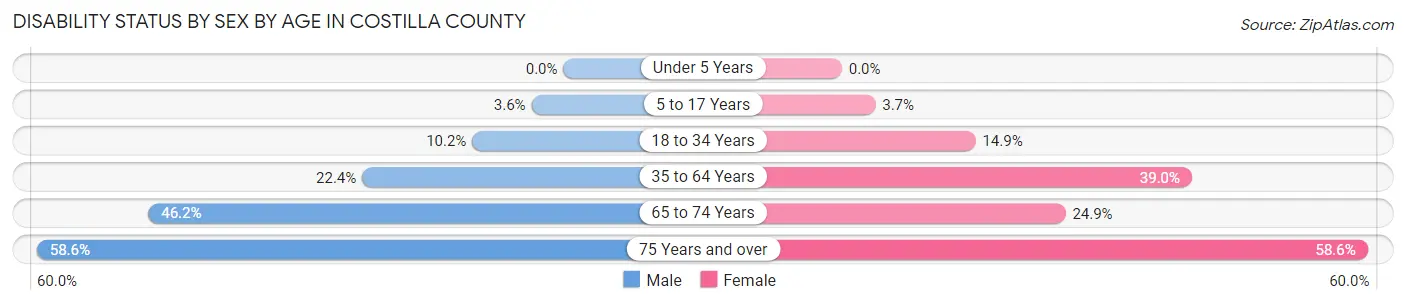
| Age Bracket | Male | Female |
| Under 5 Years | 0 (0.0%) | 0 (0.0%) |
| 5 to 17 Years | 7 (3.5%) | 10 (3.7%) |
| 18 to 34 Years | 40 (10.2%) | 35 (14.9%) |
| 35 to 64 Years | 136 (22.4%) | 260 (39.0%) |
| 65 to 74 Years | 165 (46.2%) | 67 (24.9%) |
| 75 Years and over | 95 (58.6%) | 113 (58.6%) |
Disability Class by Sex by Age in Costilla County
Disability Class: Hearing Difficulty

| Age Bracket | Male | Female |
| Under 5 Years | 0 (0.0%) | 0 (0.0%) |
| 5 to 17 Years | 7 (3.5%) | 0 (0.0%) |
| 18 to 34 Years | 8 (2.0%) | 26 (11.1%) |
| 35 to 64 Years | 55 (9.1%) | 13 (1.9%) |
| 65 to 74 Years | 103 (28.8%) | 46 (17.1%) |
| 75 Years and over | 70 (43.2%) | 57 (29.5%) |
Disability Class: Vision Difficulty

| Age Bracket | Male | Female |
| Under 5 Years | 0 (0.0%) | 0 (0.0%) |
| 5 to 17 Years | 7 (3.5%) | 0 (0.0%) |
| 18 to 34 Years | 0 (0.0%) | 5 (2.1%) |
| 35 to 64 Years | 21 (3.5%) | 46 (6.9%) |
| 65 to 74 Years | 75 (21.0%) | 0 (0.0%) |
| 75 Years and over | 22 (13.6%) | 5 (2.6%) |
Disability Class: Cognitive Difficulty
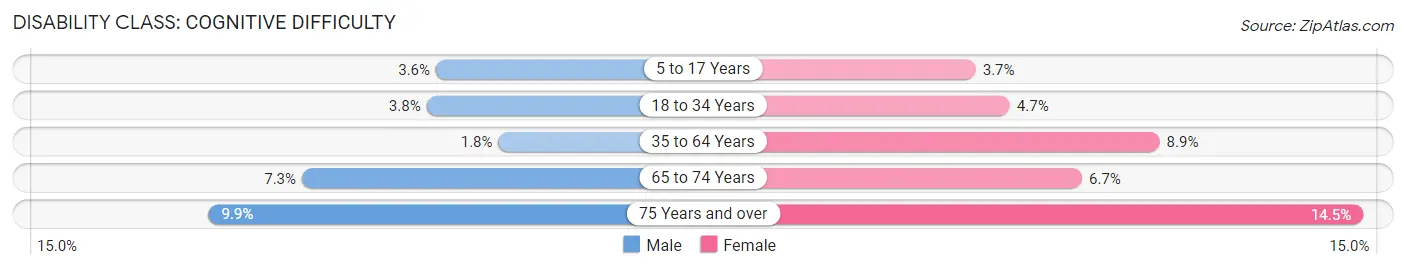
| Age Bracket | Male | Female |
| 5 to 17 Years | 7 (3.5%) | 10 (3.7%) |
| 18 to 34 Years | 15 (3.8%) | 11 (4.7%) |
| 35 to 64 Years | 11 (1.8%) | 59 (8.8%) |
| 65 to 74 Years | 26 (7.3%) | 18 (6.7%) |
| 75 Years and over | 16 (9.9%) | 28 (14.5%) |
Disability Class: Ambulatory Difficulty
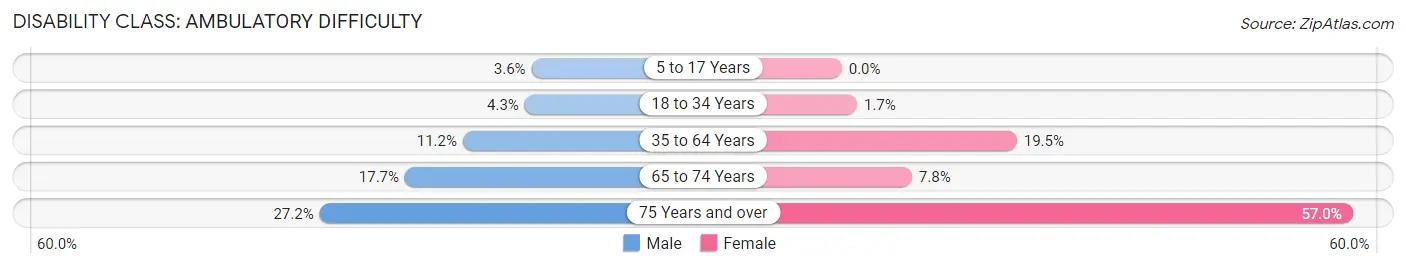
| Age Bracket | Male | Female |
| 5 to 17 Years | 7 (3.5%) | 0 (0.0%) |
| 18 to 34 Years | 17 (4.3%) | 4 (1.7%) |
| 35 to 64 Years | 68 (11.2%) | 130 (19.5%) |
| 65 to 74 Years | 63 (17.6%) | 21 (7.8%) |
| 75 Years and over | 44 (27.2%) | 110 (57.0%) |
Disability Class: Self-Care Difficulty
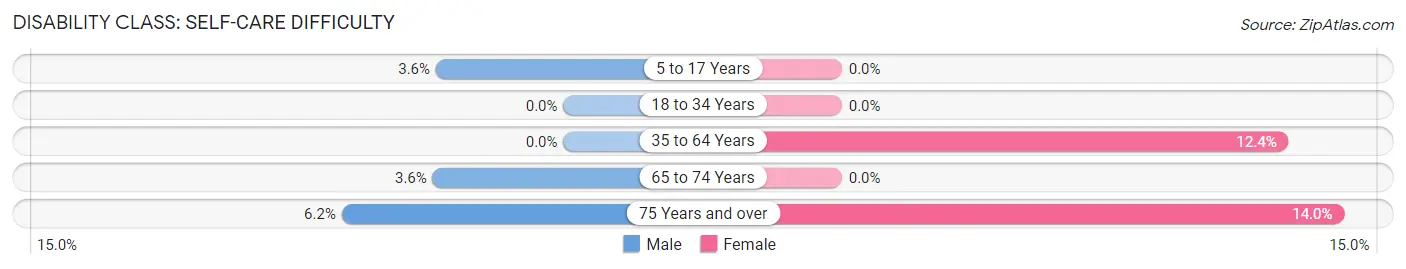
| Age Bracket | Male | Female |
| 5 to 17 Years | 7 (3.5%) | 0 (0.0%) |
| 18 to 34 Years | 0 (0.0%) | 0 (0.0%) |
| 35 to 64 Years | 0 (0.0%) | 83 (12.4%) |
| 65 to 74 Years | 13 (3.6%) | 0 (0.0%) |
| 75 Years and over | 10 (6.2%) | 27 (14.0%) |
Technology Access in Costilla County
Computing Device Access in Costilla County
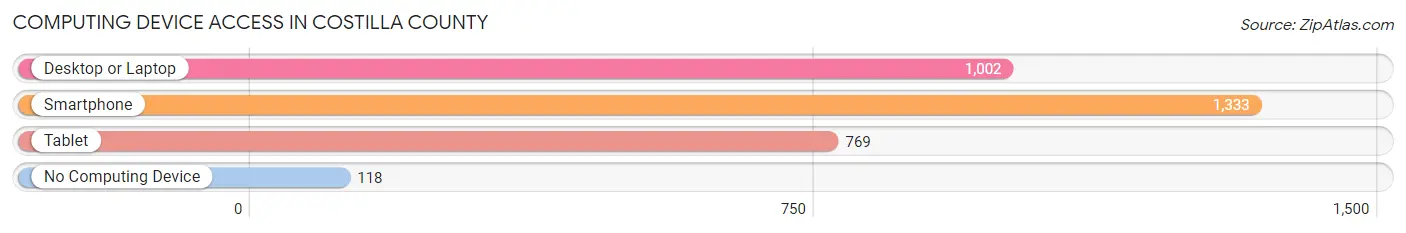
| Device Type | # Households | % Households |
| Desktop or Laptop | 1,002 | 65.5% |
| Smartphone | 1,333 | 87.1% |
| Tablet | 769 | 50.3% |
| No Computing Device | 118 | 7.7% |
| Total | 1,530 | 100.0% |
Internet Access in Costilla County
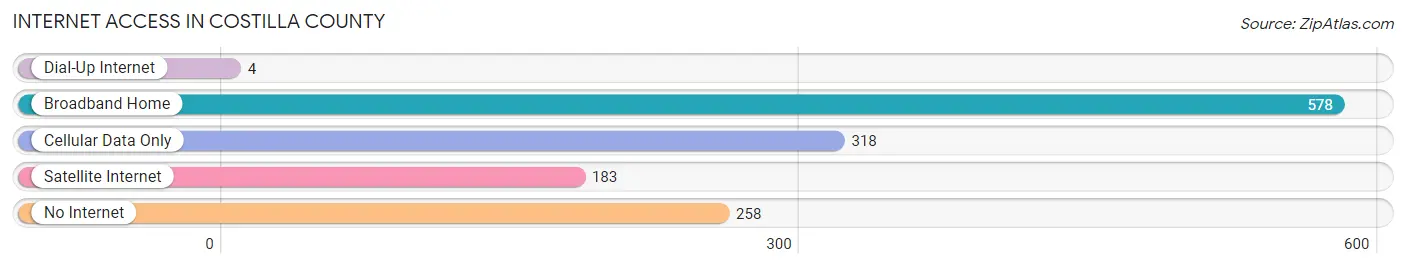
| Internet Type | # Households | % Households |
| Dial-Up Internet | 4 | 0.3% |
| Broadband Home | 578 | 37.8% |
| Cellular Data Only | 318 | 20.8% |
| Satellite Internet | 183 | 12.0% |
| No Internet | 258 | 16.9% |
| Total | 1,530 | 100.0% |
Costilla County Summary
Introduction
Costilla County is located in the San Luis Valley of south-central Colorado. It is the oldest county in the state, having been established in 1861. Costilla County is bordered by Alamosa County to the north, Conejos County to the east, and Rio Grande County to the south. The county seat is San Luis, which is the oldest continuously inhabited town in Colorado. Costilla County is home to a diverse population of approximately 3,500 people, with a majority of the population being Hispanic or Latino.
Geography
Costilla County is located in the San Luis Valley, which is a large intermountain basin located in south-central Colorado. The valley is surrounded by the Sangre de Cristo Mountains to the east and the San Juan Mountains to the west. The valley is approximately 8,000 feet above sea level and is the highest intermountain valley in the United States. The county covers an area of 1,230 square miles, with the majority of the land being used for agricultural purposes. The county is home to several mountain peaks, including Mount Blanca, which is the fourth highest peak in Colorado.
Climate
Costilla County has a semi-arid climate, with hot summers and cold winters. The average annual temperature is approximately 50 degrees Fahrenheit, with temperatures ranging from the low 20s in the winter to the high 80s in the summer. The average annual precipitation is approximately 12 inches, with most of the precipitation occurring in the spring and summer months.
Demographics
As of the 2010 census, Costilla County had a population of 3,524 people. The population is predominantly Hispanic or Latino, with approximately 87.3% of the population identifying as such. The median household income is approximately $30,000, and the median age is 37. The unemployment rate is approximately 8.2%, and the poverty rate is approximately 28.3%.
Economy
Costilla County’s economy is largely based on agriculture, with the majority of the land being used for farming and ranching. The county is home to several large farms, including the San Luis Valley Potato Farm, which is the largest potato farm in Colorado. Other major crops grown in the county include alfalfa, wheat, and corn. The county is also home to several small businesses, including restaurants, retail stores, and tourist attractions.
Conclusion
Costilla County is a unique and diverse county located in south-central Colorado. The county is home to a predominantly Hispanic or Latino population, and the economy is largely based on agriculture. The county is home to several mountain peaks, and the climate is semi-arid with hot summers and cold winters. Costilla County is an important part of Colorado’s history and culture, and it is a great place to visit and explore.
Common Questions
What is Per Capita Income in Costilla County?
Per Capita income in Costilla County is $24,318.
What is the Median Family Income in Costilla County?
Median Family Income in Costilla County is $49,120.
What is the Median Household income in Costilla County?
Median Household Income in Costilla County is $34,578.
What is Income or Wage Gap in Costilla County?
Income or Wage Gap in Costilla County is 34.8%.
Women in Costilla County earn 65.2 cents for every dollar earned by a man.
What is Inequality or Gini Index in Costilla County?
Inequality or Gini Index in Costilla County is 0.50.
What is the Total Population of Costilla County?
Total Population of Costilla County is 3,534.
What is the Total Male Population of Costilla County?
Total Male Population of Costilla County is 1,775.
What is the Total Female Population of Costilla County?
Total Female Population of Costilla County is 1,759.
What is the Ratio of Males per 100 Females in Costilla County?
There are 100.91 Males per 100 Females in Costilla County.
What is the Ratio of Females per 100 Males in Costilla County?
There are 99.10 Females per 100 Males in Costilla County.
What is the Median Population Age in Costilla County?
Median Population Age in Costilla County is 52.8 Years.
What is the Average Family Size in Costilla County
Average Family Size in Costilla County is 2.9 People.
What is the Average Household Size in Costilla County
Average Household Size in Costilla County is 2.3 People.
How Large is the Labor Force in Costilla County?
There are 1,315 People in the Labor Forcein in Costilla County.
What is the Percentage of People in the Labor Force in Costilla County?
43.7% of People are in the Labor Force in Costilla County.
What is the Unemployment Rate in Costilla County?
Unemployment Rate in Costilla County is 6.6%.