Conejos County, CO Map & Demographics
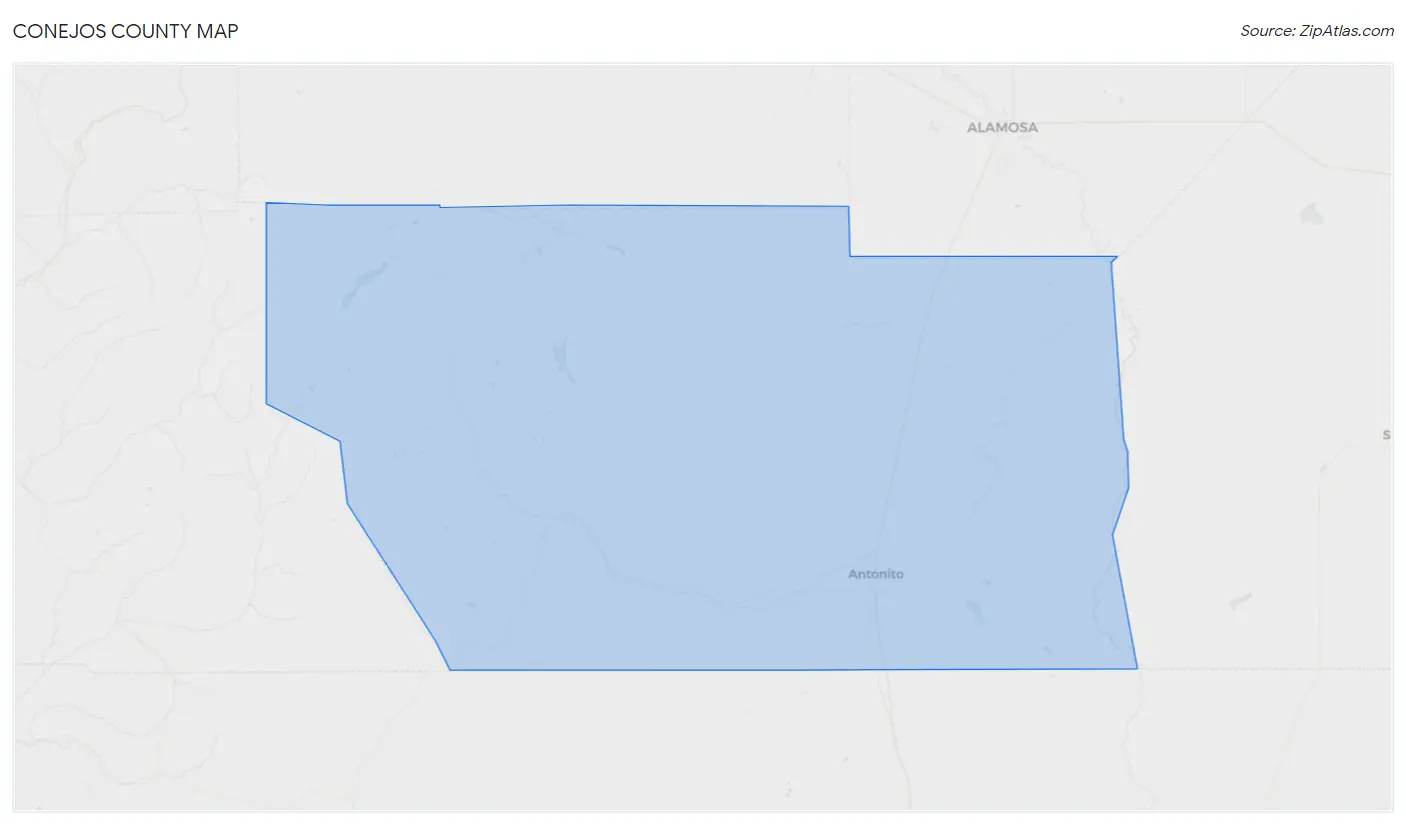
Conejos County Map
Conejos County Overview
$25,240
PER CAPITA INCOME
$62,375
AVG FAMILY INCOME
$44,093
AVG HOUSEHOLD INCOME
30.6%
WAGE / INCOME GAP [ % ]
69.4¢/ $1
WAGE / INCOME GAP [ $ ]
$9,777
FAMILY INCOME DEFICIT
0.44
INEQUALITY / GINI INDEX
7,553
TOTAL POPULATION
3,827
MALE POPULATION
3,726
FEMALE POPULATION
102.71
MALES / 100 FEMALES
97.36
FEMALES / 100 MALES
39.1
MEDIAN AGE
3.3
AVG FAMILY SIZE
2.4
AVG HOUSEHOLD SIZE
3,306
LABOR FORCE [ PEOPLE ]
56.5%
PERCENT IN LABOR FORCE
7.2%
UNEMPLOYMENT RATE
Conejos County Area Codes
Income in Conejos County
Income Overview in Conejos County
Per Capita Income in Conejos County is $25,240, while median incomes of families and households are $62,375 and $44,093 respectively.
| Characteristic | Number | Measure |
| Per Capita Income | 7,553 | $25,240 |
| Median Family Income | 1,780 | $62,375 |
| Mean Family Income | 1,780 | $74,263 |
| Median Household Income | 3,087 | $44,093 |
| Mean Household Income | 3,087 | $60,460 |
| Income Deficit | 1,780 | $9,777 |
| Wage / Income Gap (%) | 7,553 | 30.62% |
| Wage / Income Gap ($) | 7,553 | 69.38¢ per $1 |
| Gini / Inequality Index | 7,553 | 0.44 |
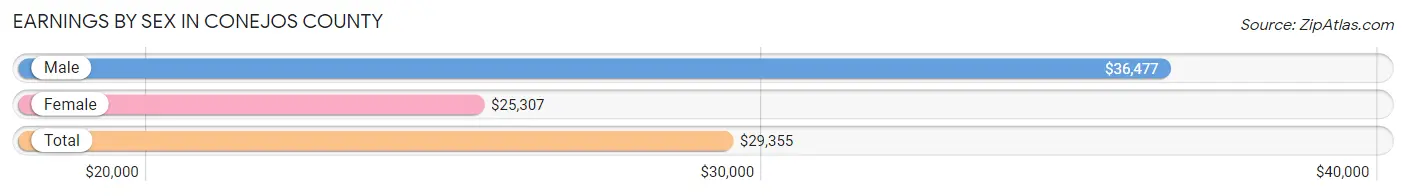
Earnings by Sex in Conejos County
Average Earnings in Conejos County are $29,355, $36,477 for men and $25,307 for women, a difference of 30.6%.
| Sex | Number | Average Earnings |
| Male | 1,947 (55.1%) | $36,477 |
| Female | 1,585 (44.9%) | $25,307 |
| Total | 3,532 (100.0%) | $29,355 |
Earnings by Sex by Income Bracket in Conejos County
The most common earnings brackets in Conejos County are $55,000 to $64,999 for men (230 | 11.8%) and $25,000 to $29,999 for women (256 | 16.2%).
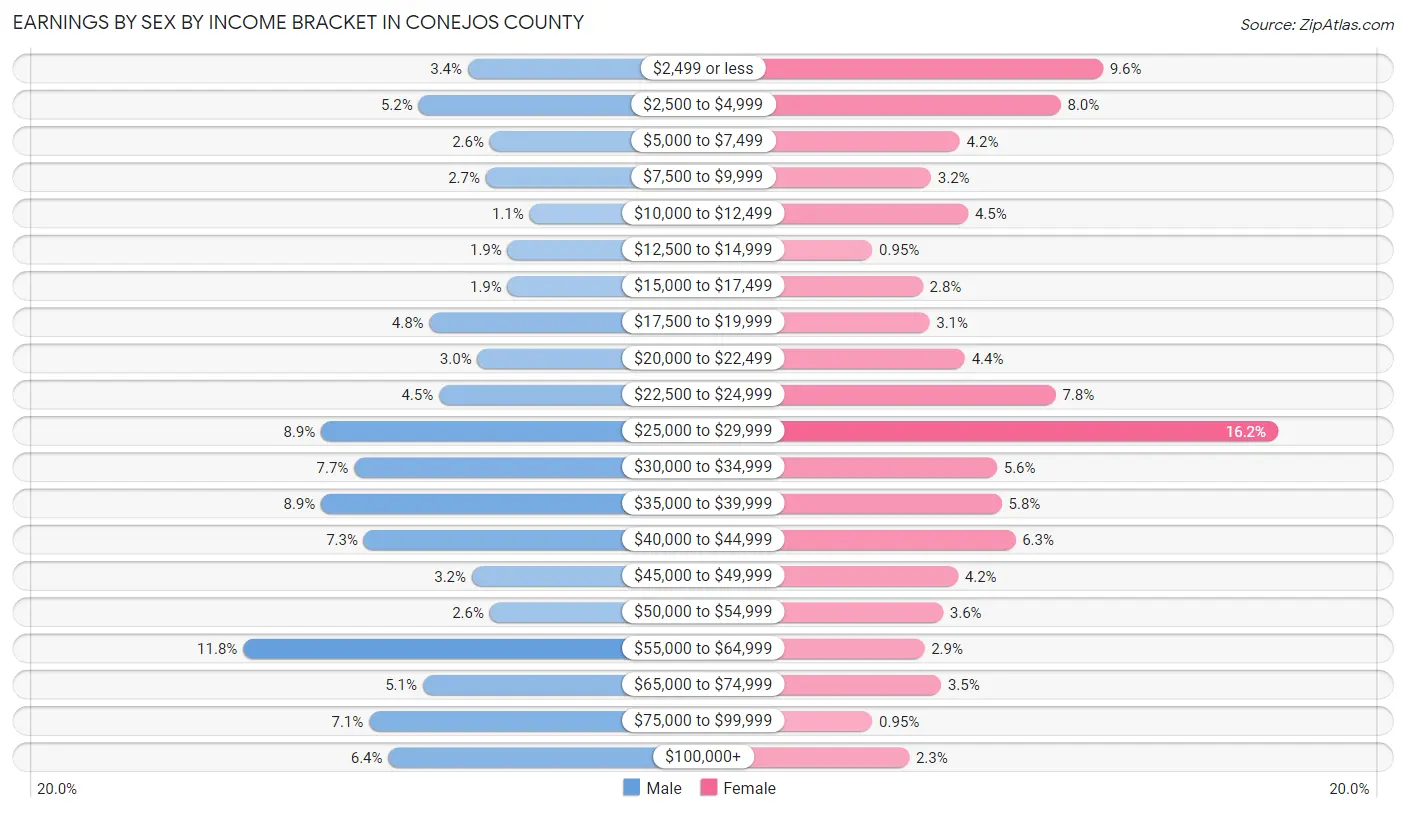
| Income | Male | Female |
| $2,499 or less | 66 (3.4%) | 152 (9.6%) |
| $2,500 to $4,999 | 102 (5.2%) | 127 (8.0%) |
| $5,000 to $7,499 | 50 (2.6%) | 67 (4.2%) |
| $7,500 to $9,999 | 53 (2.7%) | 50 (3.2%) |
| $10,000 to $12,499 | 21 (1.1%) | 72 (4.5%) |
| $12,500 to $14,999 | 37 (1.9%) | 15 (0.9%) |
| $15,000 to $17,499 | 37 (1.9%) | 45 (2.8%) |
| $17,500 to $19,999 | 94 (4.8%) | 49 (3.1%) |
| $20,000 to $22,499 | 59 (3.0%) | 70 (4.4%) |
| $22,500 to $24,999 | 87 (4.5%) | 124 (7.8%) |
| $25,000 to $29,999 | 173 (8.9%) | 256 (16.2%) |
| $30,000 to $34,999 | 149 (7.6%) | 89 (5.6%) |
| $35,000 to $39,999 | 173 (8.9%) | 92 (5.8%) |
| $40,000 to $44,999 | 142 (7.3%) | 100 (6.3%) |
| $45,000 to $49,999 | 63 (3.2%) | 66 (4.2%) |
| $50,000 to $54,999 | 50 (2.6%) | 57 (3.6%) |
| $55,000 to $64,999 | 230 (11.8%) | 46 (2.9%) |
| $65,000 to $74,999 | 99 (5.1%) | 56 (3.5%) |
| $75,000 to $99,999 | 138 (7.1%) | 15 (0.9%) |
| $100,000+ | 124 (6.4%) | 37 (2.3%) |
| Total | 1,947 (100.0%) | 1,585 (100.0%) |
Earnings by Sex by Educational Attainment in Conejos County
Average earnings in Conejos County are $39,640 for men and $26,060 for women, a difference of 34.3%. Men with an educational attainment of graduate degree enjoy the highest average annual earnings of $58,333, while those with college or associate's degree education earn the least with $35,250. Women with an educational attainment of graduate degree earn the most with the average annual earnings of $51,538, while those with less than high school education have the smallest earnings of $19,583.
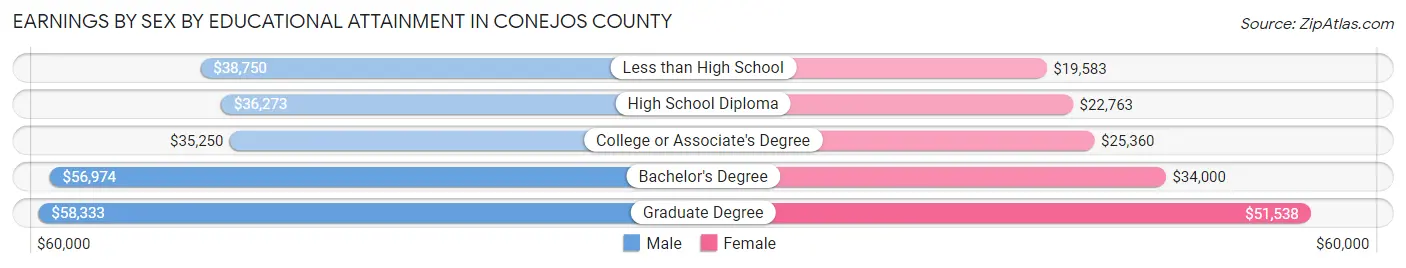
| Educational Attainment | Male Income | Female Income |
| Less than High School | $38,750 | $19,583 |
| High School Diploma | $36,273 | $22,763 |
| College or Associate's Degree | $35,250 | $25,360 |
| Bachelor's Degree | $56,974 | $34,000 |
| Graduate Degree | $58,333 | $51,538 |
| Total | $39,640 | $26,060 |
Family Income in Conejos County
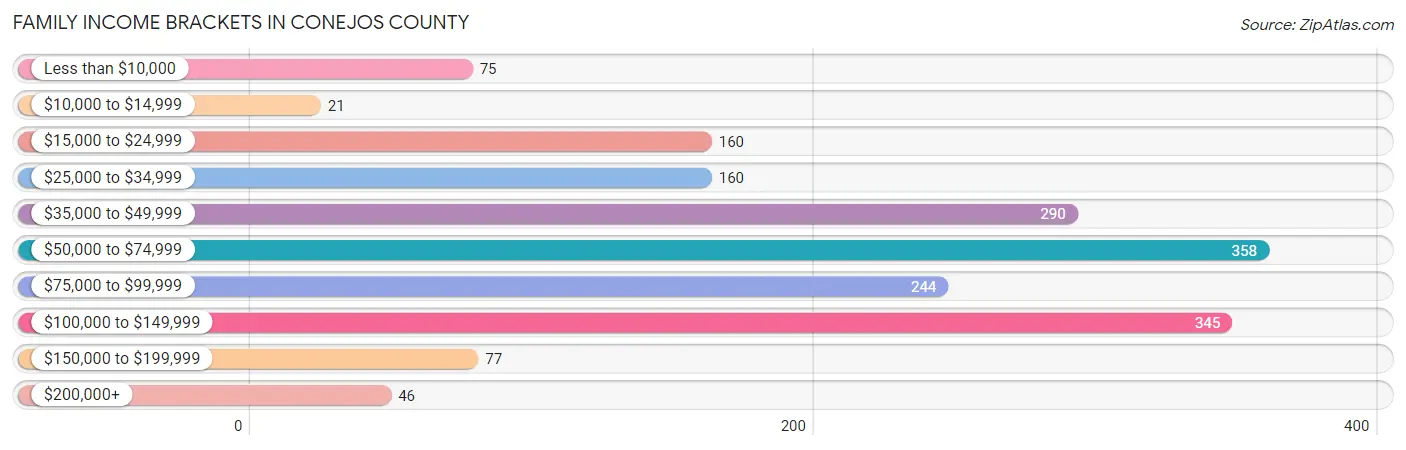
Family Income Brackets in Conejos County
According to the Conejos County family income data, there are 358 families falling into the $50,000 to $74,999 income range, which is the most common income bracket and makes up 20.1% of all families. Conversely, the $10,000 to $14,999 income bracket is the least frequent group with only 21 families (1.2%) belonging to this category.
| Income Bracket | # Families | % Families |
| Less than $10,000 | 75 | 4.2% |
| $10,000 to $14,999 | 21 | 1.2% |
| $15,000 to $24,999 | 160 | 9.0% |
| $25,000 to $34,999 | 160 | 9.0% |
| $35,000 to $49,999 | 290 | 16.3% |
| $50,000 to $74,999 | 358 | 20.1% |
| $75,000 to $99,999 | 244 | 13.7% |
| $100,000 to $149,999 | 345 | 19.4% |
| $150,000 to $199,999 | 77 | 4.3% |
| $200,000+ | 46 | 2.6% |
Family Income by Famaliy Size in Conejos County
7+ person families (141 | 7.9%) account for the highest median family income in Conejos County with $80,331 per family, while 2-person families (830 | 46.6%) have the highest median income of $25,938 per family member.
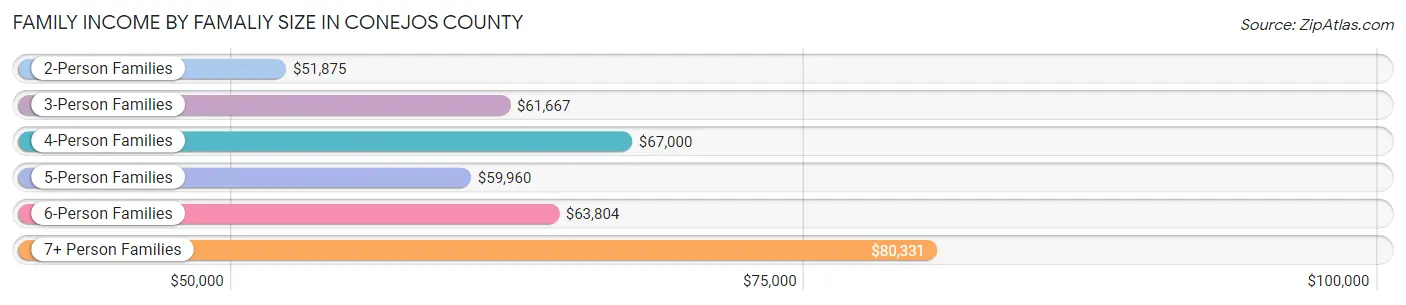
| Income Bracket | # Families | Median Income |
| 2-Person Families | 830 (46.6%) | $51,875 |
| 3-Person Families | 324 (18.2%) | $61,667 |
| 4-Person Families | 238 (13.4%) | $67,000 |
| 5-Person Families | 179 (10.1%) | $59,960 |
| 6-Person Families | 68 (3.8%) | $63,804 |
| 7+ Person Families | 141 (7.9%) | $80,331 |
| Total | 1,780 (100.0%) | $62,375 |
Family Income by Number of Earners in Conejos County
The median family income in Conejos County is $62,375, with families comprising 3+ earners (268) having the highest median family income of $86,023, while families with no earners (358) have the lowest median family income of $37,045, accounting for 15.1% and 20.1% of families, respectively.
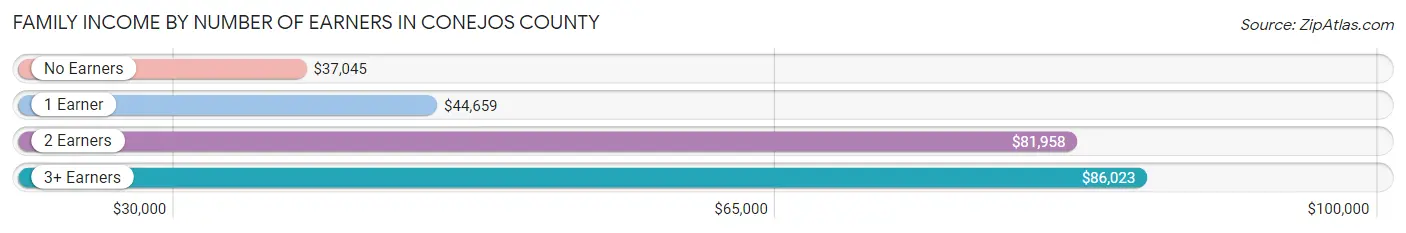
| Number of Earners | # Families | Median Income |
| No Earners | 358 (20.1%) | $37,045 |
| 1 Earner | 561 (31.5%) | $44,659 |
| 2 Earners | 593 (33.3%) | $81,958 |
| 3+ Earners | 268 (15.1%) | $86,023 |
| Total | 1,780 (100.0%) | $62,375 |
Household Income in Conejos County
Household Income Brackets in Conejos County
With 599 households falling in the category, the $35,000 to $49,999 income range is the most frequent in Conejos County, accounting for 19.4% of all households. In contrast, only 65 households (2.1%) fall into the $200,000+ income bracket, making it the least populous group.

| Income Bracket | # Households | % Households |
| Less than $10,000 | 232 | 7.5% |
| $10,000 to $14,999 | 133 | 4.3% |
| $15,000 to $24,999 | 392 | 12.7% |
| $25,000 to $34,999 | 392 | 12.7% |
| $35,000 to $49,999 | 599 | 19.4% |
| $50,000 to $74,999 | 448 | 14.5% |
| $75,000 to $99,999 | 306 | 9.9% |
| $100,000 to $149,999 | 411 | 13.3% |
| $150,000 to $199,999 | 108 | 3.5% |
| $200,000+ | 65 | 2.1% |
Household Income by Householder Age in Conejos County
The median household income in Conejos County is $44,093, with the highest median household income of $50,278 found in the 15 to 24 years age bracket for the primary householder. A total of 110 households (3.6%) fall into this category. Meanwhile, the 65+ years age bracket for the primary householder has the lowest median household income of $36,503, with 1,017 households (32.9%) in this group.
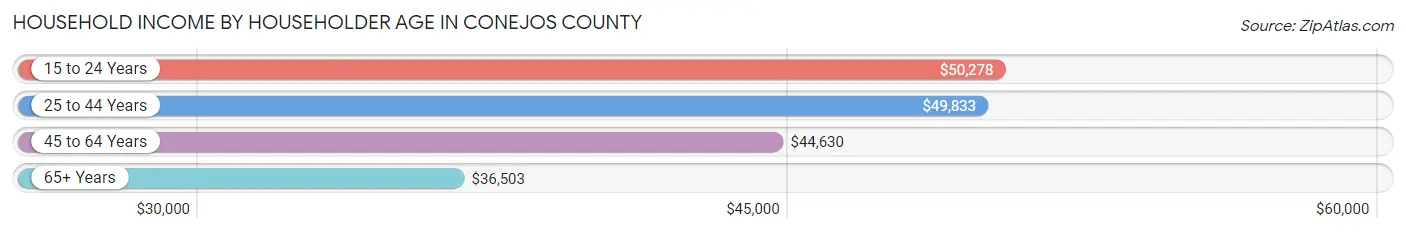
| Income Bracket | # Households | Median Income |
| 15 to 24 Years | 110 (3.6%) | $50,278 |
| 25 to 44 Years | 850 (27.5%) | $49,833 |
| 45 to 64 Years | 1,110 (36.0%) | $44,630 |
| 65+ Years | 1,017 (32.9%) | $36,503 |
| Total | 3,087 (100.0%) | $44,093 |
Poverty in Conejos County
Income Below Poverty by Sex and Age in Conejos County
With 15.8% poverty level for males and 15.5% for females among the residents of Conejos County, 6 to 11 year old males and 5 year old females are the most vulnerable to poverty, with 106 males (26.6%) and 17 females (26.2%) in their respective age groups living below the poverty level.
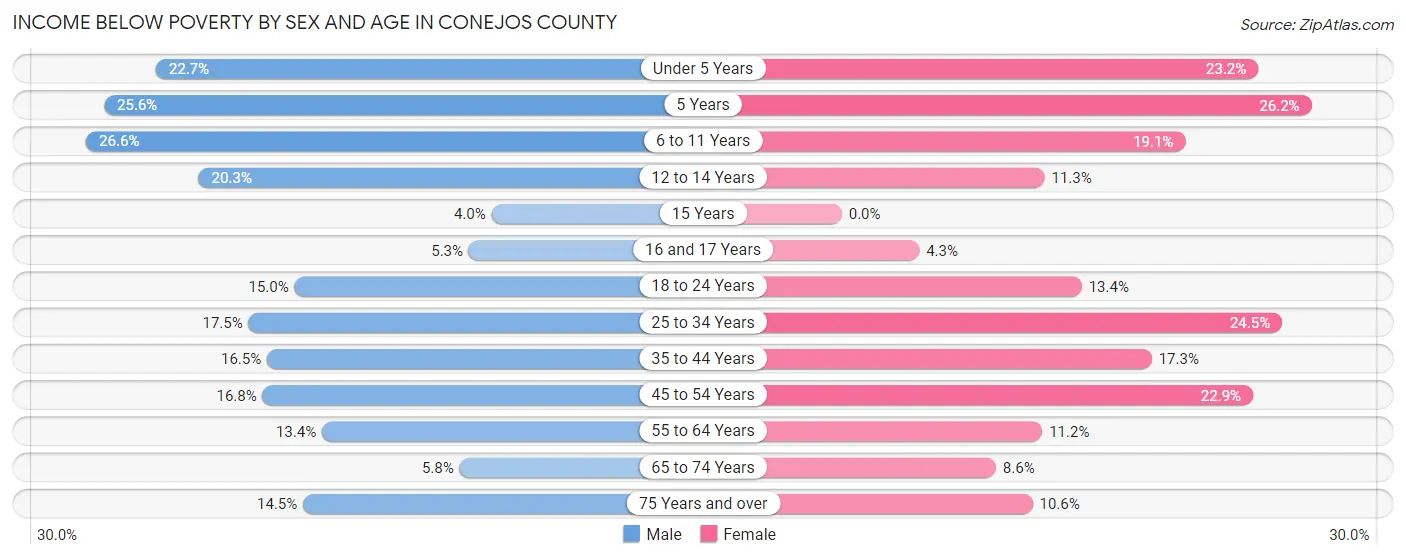
| Age Bracket | Male | Female |
| Under 5 Years | 54 (22.7%) | 54 (23.2%) |
| 5 Years | 11 (25.6%) | 17 (26.2%) |
| 6 to 11 Years | 106 (26.6%) | 48 (19.1%) |
| 12 to 14 Years | 26 (20.3%) | 28 (11.3%) |
| 15 Years | 2 (4.0%) | 0 (0.0%) |
| 16 and 17 Years | 6 (5.3%) | 5 (4.3%) |
| 18 to 24 Years | 50 (15.0%) | 41 (13.4%) |
| 25 to 34 Years | 61 (17.5%) | 100 (24.5%) |
| 35 to 44 Years | 82 (16.5%) | 73 (17.3%) |
| 45 to 54 Years | 65 (16.8%) | 87 (22.9%) |
| 55 to 64 Years | 70 (13.4%) | 56 (11.2%) |
| 65 to 74 Years | 26 (5.8%) | 40 (8.6%) |
| 75 Years and over | 40 (14.5%) | 29 (10.6%) |
| Total | 599 (15.8%) | 578 (15.5%) |
Income Above Poverty by Sex and Age in Conejos County
According to the poverty statistics in Conejos County, males aged 15 years and females aged 15 years are the age groups that are most secure financially, with 96.0% of males and 100.0% of females in these age groups living above the poverty line.
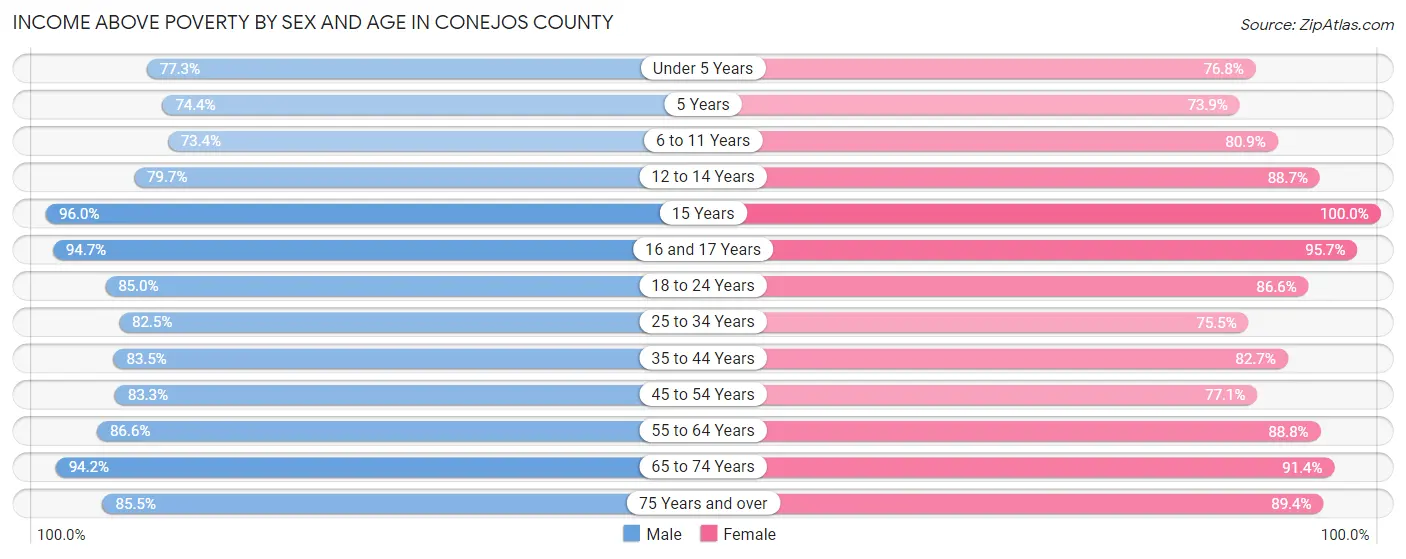
| Age Bracket | Male | Female |
| Under 5 Years | 184 (77.3%) | 179 (76.8%) |
| 5 Years | 32 (74.4%) | 48 (73.9%) |
| 6 to 11 Years | 293 (73.4%) | 203 (80.9%) |
| 12 to 14 Years | 102 (79.7%) | 220 (88.7%) |
| 15 Years | 48 (96.0%) | 47 (100.0%) |
| 16 and 17 Years | 108 (94.7%) | 111 (95.7%) |
| 18 to 24 Years | 284 (85.0%) | 266 (86.6%) |
| 25 to 34 Years | 287 (82.5%) | 308 (75.5%) |
| 35 to 44 Years | 415 (83.5%) | 350 (82.7%) |
| 45 to 54 Years | 323 (83.3%) | 293 (77.1%) |
| 55 to 64 Years | 451 (86.6%) | 446 (88.8%) |
| 65 to 74 Years | 424 (94.2%) | 426 (91.4%) |
| 75 Years and over | 236 (85.5%) | 244 (89.4%) |
| Total | 3,187 (84.2%) | 3,141 (84.5%) |
Income Below Poverty Among Married-Couple Families in Conejos County
The poverty statistics for married-couple families in Conejos County show that 10.0% or 141 of the total 1,415 families live below the poverty line. Families with 3 or 4 children have the highest poverty rate of 21.1%, comprising of 48 families. On the other hand, families with 1 or 2 children have the lowest poverty rate of 4.1%, which includes 13 families.
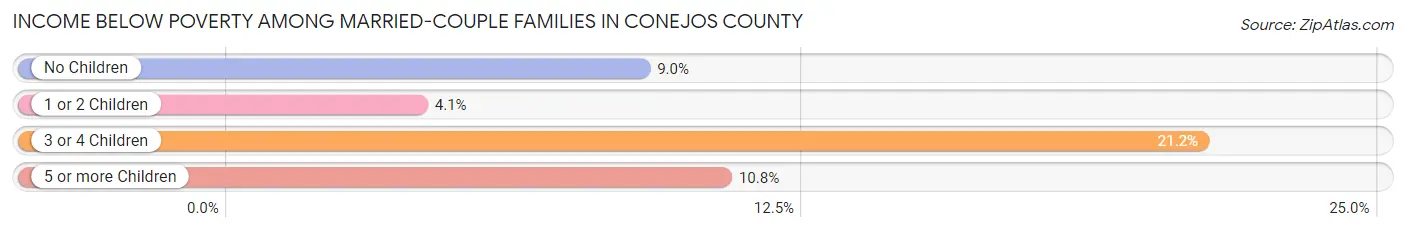
| Children | Above Poverty | Below Poverty |
| No Children | 710 (91.0%) | 70 (9.0%) |
| 1 or 2 Children | 302 (95.9%) | 13 (4.1%) |
| 3 or 4 Children | 179 (78.8%) | 48 (21.1%) |
| 5 or more Children | 83 (89.2%) | 10 (10.7%) |
| Total | 1,274 (90.0%) | 141 (10.0%) |
Income Below Poverty Among Single-Parent Households in Conejos County
According to the poverty data in Conejos County, 15.8% or 18 single-father households and 28.3% or 71 single-mother households are living below the poverty line. Among single-father households, those with 1 or 2 children have the highest poverty rate, with 11 households (22.9%) experiencing poverty. Likewise, among single-mother households, those with 3 or 4 children have the highest poverty rate, with 24 households (80.0%) falling below the poverty line.
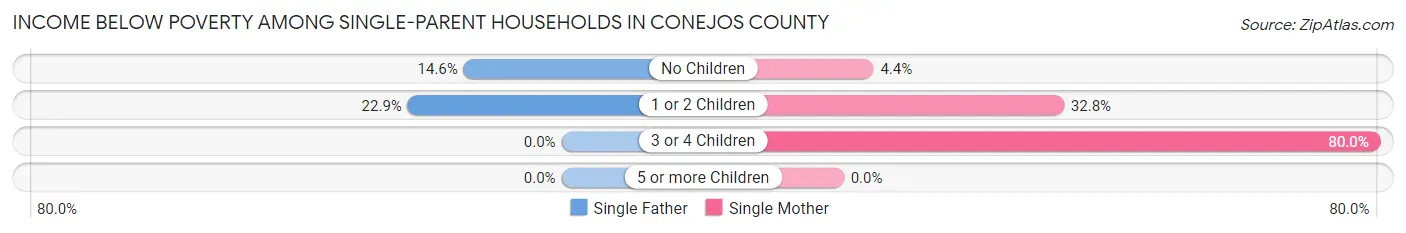
| Children | Single Father | Single Mother |
| No Children | 7 (14.6%) | 4 (4.4%) |
| 1 or 2 Children | 11 (22.9%) | 43 (32.8%) |
| 3 or 4 Children | 0 (0.0%) | 24 (80.0%) |
| 5 or more Children | 0 (0.0%) | 0 (0.0%) |
| Total | 18 (15.8%) | 71 (28.3%) |
Income Below Poverty Among Married-Couple vs Single-Parent Households in Conejos County
The poverty data for Conejos County shows that 141 of the married-couple family households (10.0%) and 89 of the single-parent households (24.4%) are living below the poverty level. Within the married-couple family households, those with 3 or 4 children have the highest poverty rate, with 48 households (21.1%) falling below the poverty line. Among the single-parent households, those with 3 or 4 children have the highest poverty rate, with 24 household (50.0%) living below poverty.
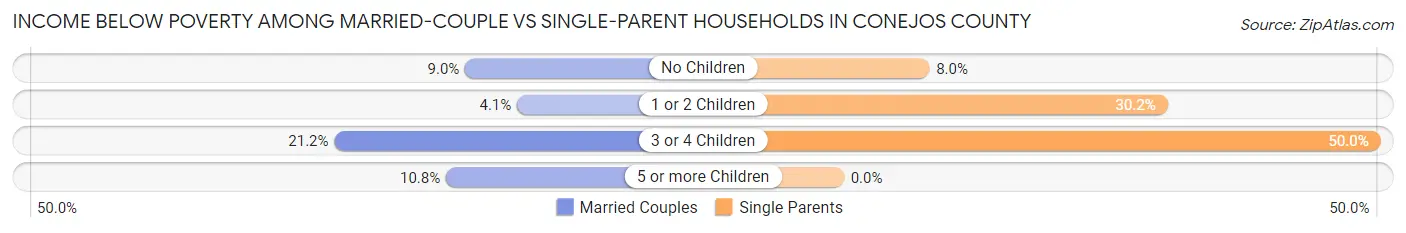
| Children | Married-Couple Families | Single-Parent Households |
| No Children | 70 (9.0%) | 11 (8.0%) |
| 1 or 2 Children | 13 (4.1%) | 54 (30.2%) |
| 3 or 4 Children | 48 (21.1%) | 24 (50.0%) |
| 5 or more Children | 10 (10.7%) | 0 (0.0%) |
| Total | 141 (10.0%) | 89 (24.4%) |
Race in Conejos County
The most populous races in Conejos County are White / Caucasian (5,146 | 68.1%), Hispanic or Latino (3,870 | 51.2%), and Two or more Races (1,528 | 20.2%).
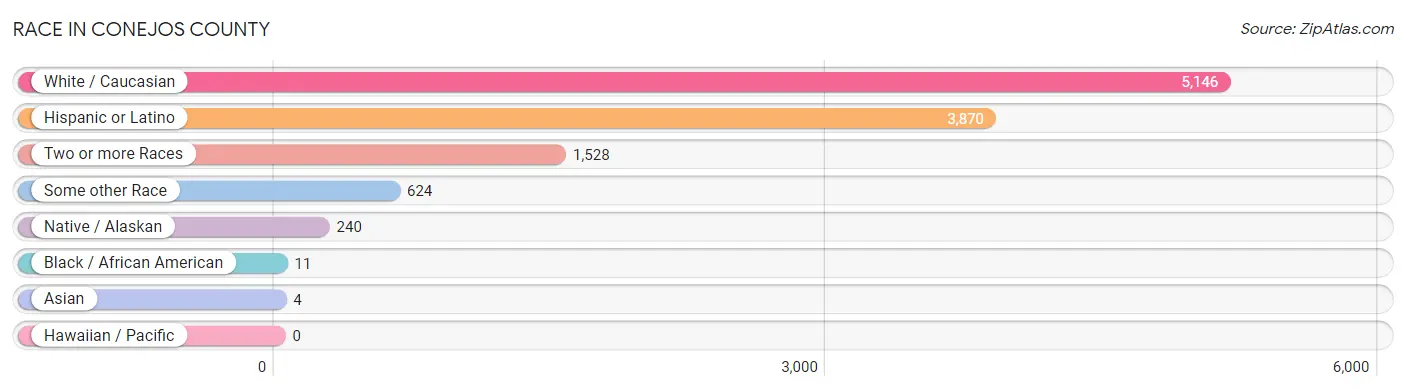
| Race | # Population | % Population |
| Asian | 4 | 0.1% |
| Black / African American | 11 | 0.2% |
| Hawaiian / Pacific | 0 | 0.0% |
| Hispanic or Latino | 3,870 | 51.2% |
| Native / Alaskan | 240 | 3.2% |
| White / Caucasian | 5,146 | 68.1% |
| Two or more Races | 1,528 | 20.2% |
| Some other Race | 624 | 8.3% |
| Total | 7,553 | 100.0% |
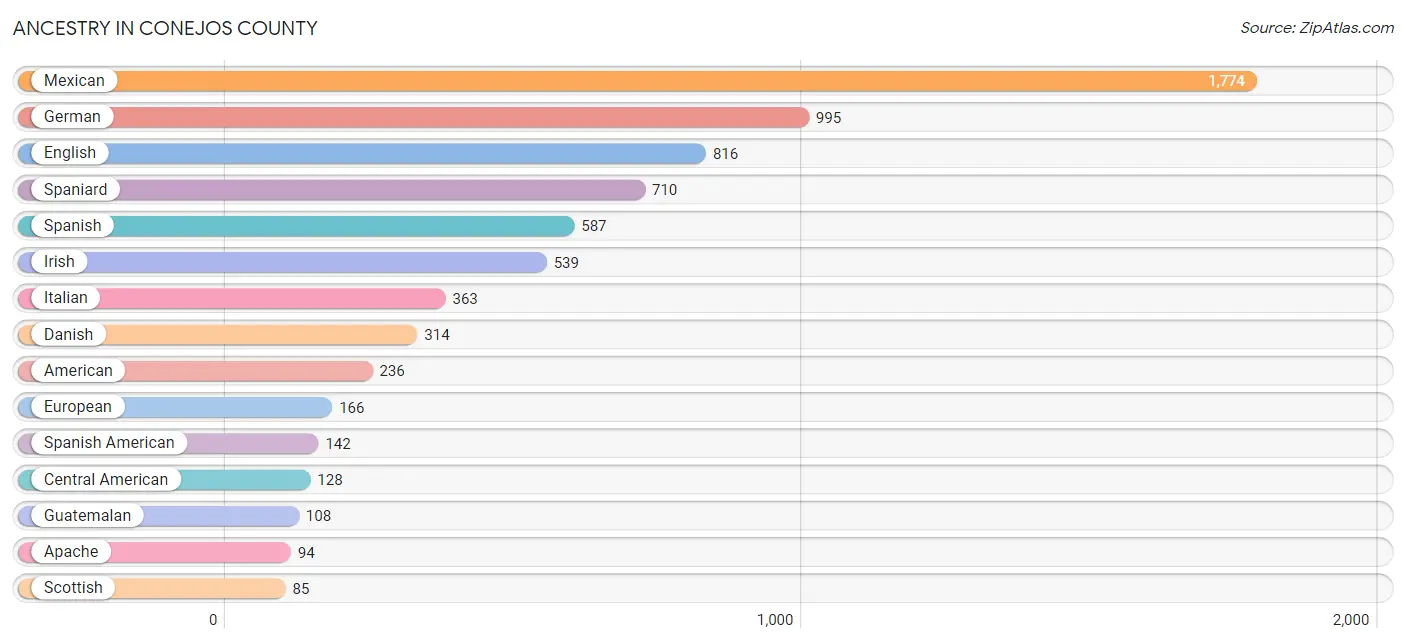
Ancestry in Conejos County
The most populous ancestries reported in Conejos County are Mexican (1,774 | 23.5%), German (995 | 13.2%), English (816 | 10.8%), Spaniard (710 | 9.4%), and Spanish (587 | 7.8%), together accounting for 64.6% of all Conejos County residents.
| Ancestry | # Population | % Population |
| American | 236 | 3.1% |
| Apache | 94 | 1.2% |
| Arab | 32 | 0.4% |
| Austrian | 2 | 0.0% |
| Basque | 19 | 0.3% |
| Belgian | 15 | 0.2% |
| Bhutanese | 6 | 0.1% |
| Blackfeet | 41 | 0.5% |
| British | 2 | 0.0% |
| Burmese | 16 | 0.2% |
| Canadian | 11 | 0.2% |
| Central American | 128 | 1.7% |
| Central American Indian | 20 | 0.3% |
| Cherokee | 45 | 0.6% |
| Cheyenne | 9 | 0.1% |
| Chilean | 1 | 0.0% |
| Chippewa | 7 | 0.1% |
| Colombian | 30 | 0.4% |
| Cuban | 1 | 0.0% |
| Danish | 314 | 4.2% |
| Dominican | 5 | 0.1% |
| Dutch | 84 | 1.1% |
| Eastern European | 51 | 0.7% |
| English | 816 | 10.8% |
| European | 166 | 2.2% |
| Finnish | 39 | 0.5% |
| French | 70 | 0.9% |
| French Canadian | 18 | 0.2% |
| German | 995 | 13.2% |
| Guatemalan | 108 | 1.4% |
| Honduran | 20 | 0.3% |
| Hungarian | 11 | 0.2% |
| Irish | 539 | 7.1% |
| Iroquois | 16 | 0.2% |
| Italian | 363 | 4.8% |
| Korean | 2 | 0.0% |
| Lebanese | 32 | 0.4% |
| Mexican | 1,774 | 23.5% |
| Navajo | 56 | 0.7% |
| Northern European | 24 | 0.3% |
| Norwegian | 32 | 0.4% |
| Pennsylvania German | 2 | 0.0% |
| Polish | 52 | 0.7% |
| Portuguese | 17 | 0.2% |
| Pueblo | 25 | 0.3% |
| Puerto Rican | 32 | 0.4% |
| Russian | 11 | 0.2% |
| Scandinavian | 23 | 0.3% |
| Scotch-Irish | 50 | 0.7% |
| Scottish | 85 | 1.1% |
| Sioux | 36 | 0.5% |
| South American | 31 | 0.4% |
| Spaniard | 710 | 9.4% |
| Spanish | 587 | 7.8% |
| Spanish American | 142 | 1.9% |
| Swedish | 39 | 0.5% |
| Swiss | 26 | 0.3% |
| Ukrainian | 7 | 0.1% |
| Ute | 21 | 0.3% |
| Welsh | 17 | 0.2% |
| Yakama | 13 | 0.2% | View All 61 Rows |
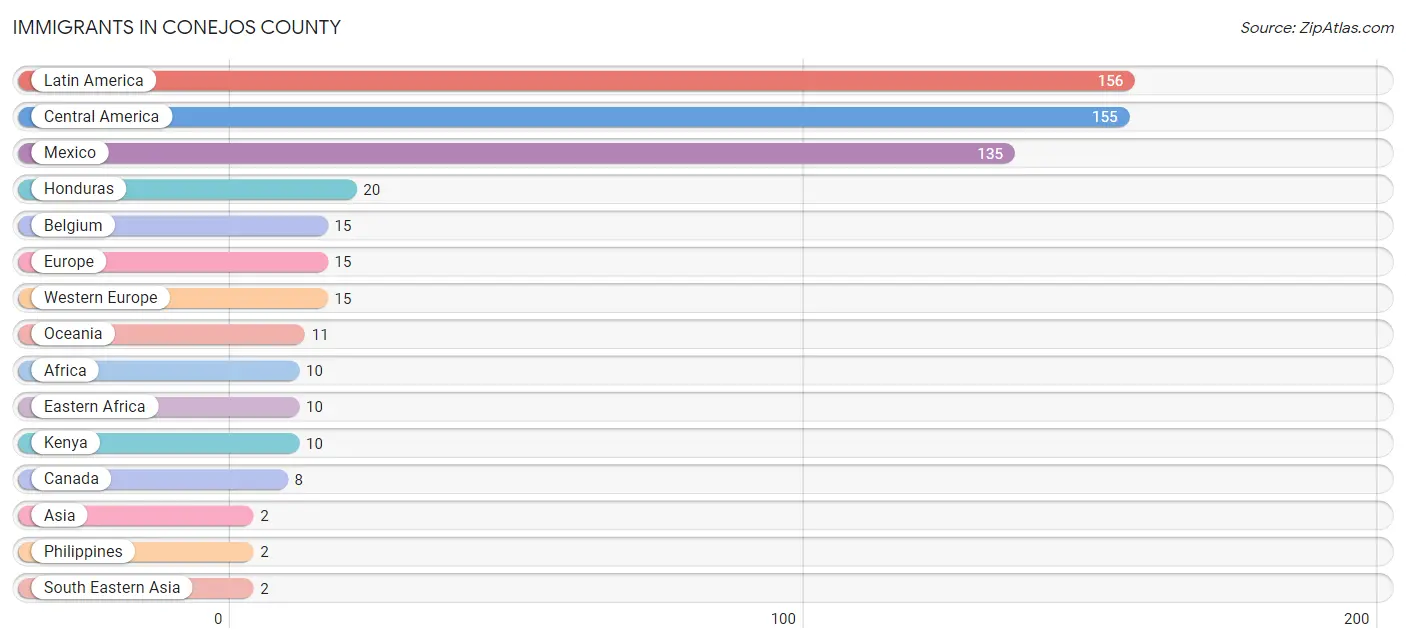
Immigrants in Conejos County
The most numerous immigrant groups reported in Conejos County came from Latin America (156 | 2.1%), Central America (155 | 2.1%), Mexico (135 | 1.8%), Honduras (20 | 0.3%), and Belgium (15 | 0.2%), together accounting for 6.4% of all Conejos County residents.
| Immigration Origin | # Population | % Population |
| Africa | 10 | 0.1% |
| Asia | 2 | 0.0% |
| Belgium | 15 | 0.2% |
| Canada | 8 | 0.1% |
| Central America | 155 | 2.1% |
| Chile | 1 | 0.0% |
| Eastern Africa | 10 | 0.1% |
| Europe | 15 | 0.2% |
| Honduras | 20 | 0.3% |
| Kenya | 10 | 0.1% |
| Latin America | 156 | 2.1% |
| Mexico | 135 | 1.8% |
| Oceania | 11 | 0.2% |
| Philippines | 2 | 0.0% |
| South America | 1 | 0.0% |
| South Eastern Asia | 2 | 0.0% |
| Western Europe | 15 | 0.2% | View All 17 Rows |
Sex and Age in Conejos County
Sex and Age in Conejos County
The most populous age groups in Conejos County are 5 to 9 Years (297 | 7.8%) for men and 10 to 14 Years (360 | 9.7%) for women.
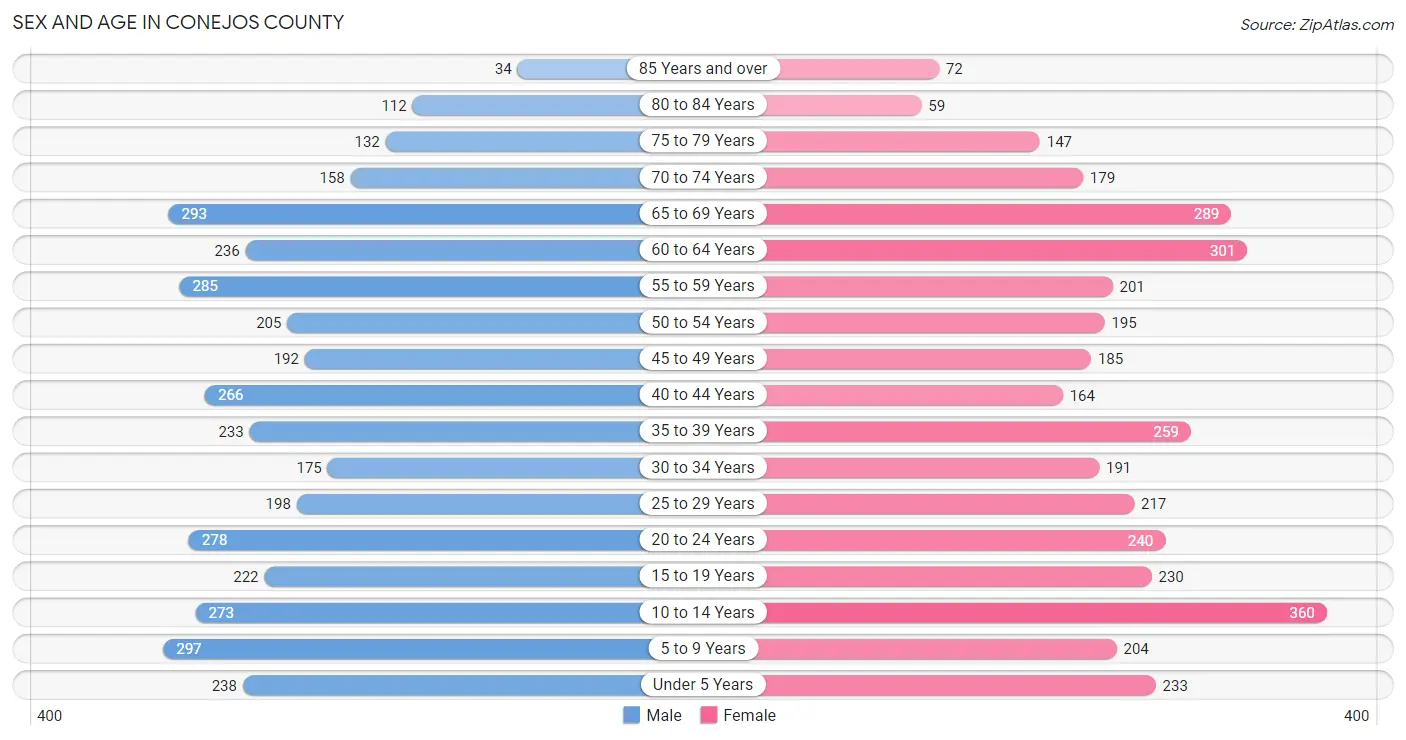
| Age Bracket | Male | Female |
| Under 5 Years | 238 (6.2%) | 233 (6.2%) |
| 5 to 9 Years | 297 (7.8%) | 204 (5.5%) |
| 10 to 14 Years | 273 (7.1%) | 360 (9.7%) |
| 15 to 19 Years | 222 (5.8%) | 230 (6.2%) |
| 20 to 24 Years | 278 (7.3%) | 240 (6.4%) |
| 25 to 29 Years | 198 (5.2%) | 217 (5.8%) |
| 30 to 34 Years | 175 (4.6%) | 191 (5.1%) |
| 35 to 39 Years | 233 (6.1%) | 259 (7.0%) |
| 40 to 44 Years | 266 (7.0%) | 164 (4.4%) |
| 45 to 49 Years | 192 (5.0%) | 185 (5.0%) |
| 50 to 54 Years | 205 (5.4%) | 195 (5.2%) |
| 55 to 59 Years | 285 (7.4%) | 201 (5.4%) |
| 60 to 64 Years | 236 (6.2%) | 301 (8.1%) |
| 65 to 69 Years | 293 (7.7%) | 289 (7.8%) |
| 70 to 74 Years | 158 (4.1%) | 179 (4.8%) |
| 75 to 79 Years | 132 (3.5%) | 147 (4.0%) |
| 80 to 84 Years | 112 (2.9%) | 59 (1.6%) |
| 85 Years and over | 34 (0.9%) | 72 (1.9%) |
| Total | 3,827 (100.0%) | 3,726 (100.0%) |
Families and Households in Conejos County
Median Family Size in Conejos County
The median family size in Conejos County is 3.34 persons per family, with married-couple families (1,415 | 79.5%) accounting for the largest median family size of 3.56 persons per family. On the other hand, single male/father families (114 | 6.4%) represent the smallest median family size with 2.12 persons per family.
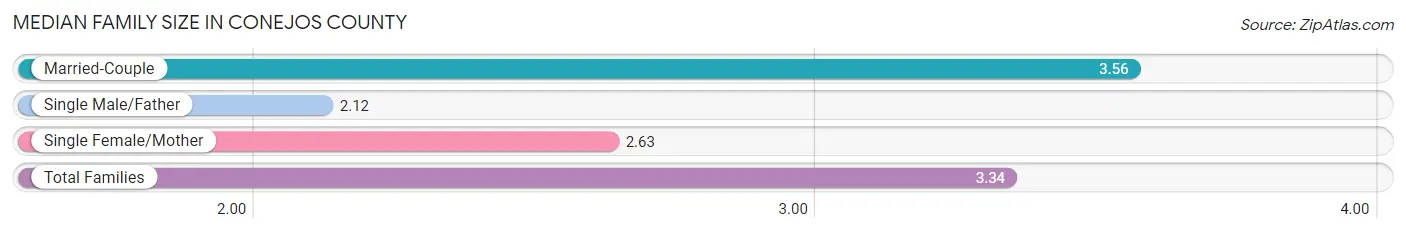
| Family Type | # Families | Family Size |
| Married-Couple | 1,415 (79.5%) | 3.56 |
| Single Male/Father | 114 (6.4%) | 2.12 |
| Single Female/Mother | 251 (14.1%) | 2.63 |
| Total Families | 1,780 (100.0%) | 3.34 |
Median Household Size in Conejos County
The median household size in Conejos County is 2.42 persons per household, with married-couple households (1,415 | 45.8%) accounting for the largest median household size of 3.62 persons per household. non-family households (1,307 | 42.3%) represent the smallest median household size with 1.03 persons per household.
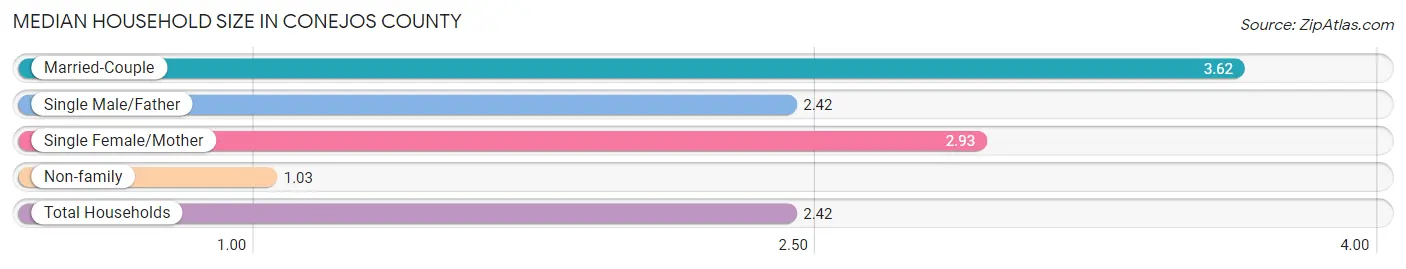
| Household Type | # Households | Household Size |
| Married-Couple | 1,415 (45.8%) | 3.62 |
| Single Male/Father | 114 (3.7%) | 2.42 |
| Single Female/Mother | 251 (8.1%) | 2.93 |
| Non-family | 1,307 (42.3%) | 1.03 |
| Total Households | 3,087 (100.0%) | 2.42 |
Household Size by Marriage Status in Conejos County
Out of a total of 3,087 households in Conejos County, 1,780 (57.7%) are family households, while 1,307 (42.3%) are nonfamily households. The most numerous type of family households are 2-person households, comprising 793, and the most common type of nonfamily households are 1-person households, comprising 1,262.
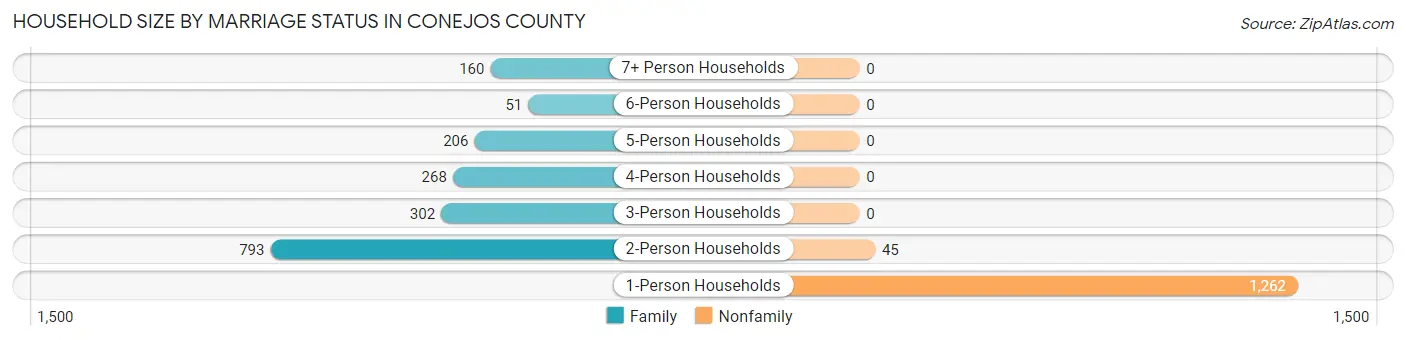
| Household Size | Family Households | Nonfamily Households |
| 1-Person Households | - | 1,262 (40.9%) |
| 2-Person Households | 793 (25.7%) | 45 (1.5%) |
| 3-Person Households | 302 (9.8%) | 0 (0.0%) |
| 4-Person Households | 268 (8.7%) | 0 (0.0%) |
| 5-Person Households | 206 (6.7%) | 0 (0.0%) |
| 6-Person Households | 51 (1.7%) | 0 (0.0%) |
| 7+ Person Households | 160 (5.2%) | 0 (0.0%) |
| Total | 1,780 (57.7%) | 1,307 (42.3%) |
Female Fertility in Conejos County
Fertility by Age in Conejos County
Average fertility rate in Conejos County is 59.0 births per 1,000 women. Women in the age bracket of 20 to 34 years have the highest fertility rate with 97.0 births per 1,000 women. Women in the age bracket of 20 to 34 years acount for 70.0% of all women with births.
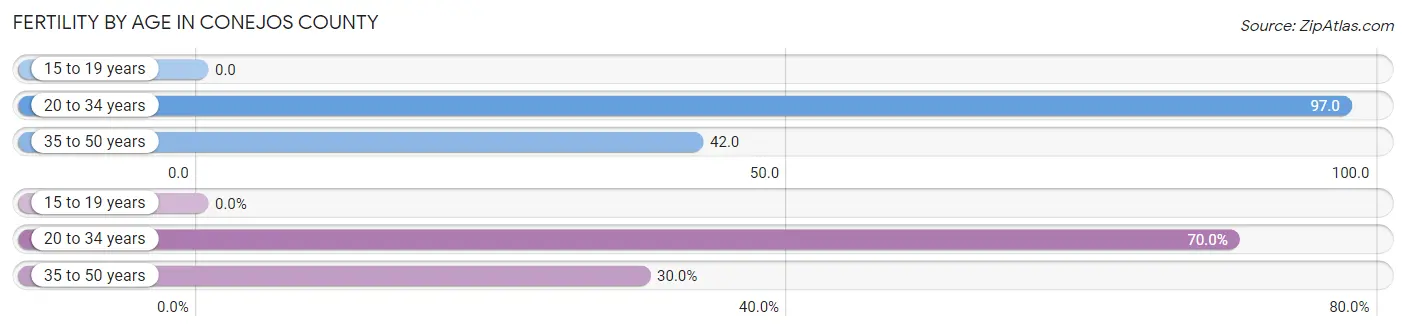
| Age Bracket | Women with Births | Births / 1,000 Women |
| 15 to 19 years | 0 (0.0%) | 0.0 |
| 20 to 34 years | 63 (70.0%) | 97.0 |
| 35 to 50 years | 27 (30.0%) | 42.0 |
| Total | 90 (100.0%) | 59.0 |
Fertility by Age by Marriage Status in Conejos County
86.7% of women with births (90) in Conejos County are married. The highest percentage of unmarried women with births falls into 20 to 34 years age bracket with 19.1% of them unmarried at the time of birth, while the lowest percentage of unmarried women with births belong to 35 to 50 years age bracket with 0.0% of them unmarried.
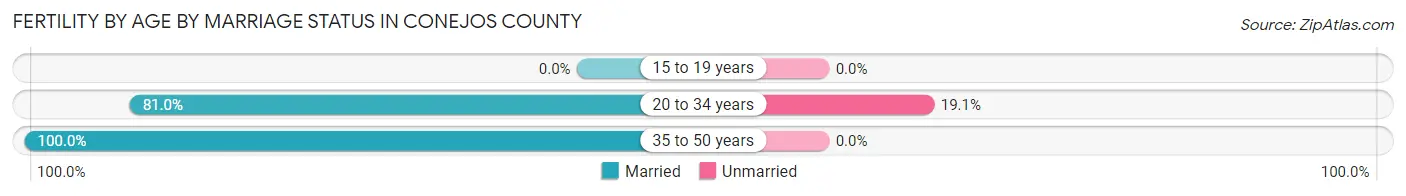
| Age Bracket | Married | Unmarried |
| 15 to 19 years | 0 (0.0%) | 0 (0.0%) |
| 20 to 34 years | 51 (80.9%) | 12 (19.1%) |
| 35 to 50 years | 27 (100.0%) | 0 (0.0%) |
| Total | 78 (86.7%) | 12 (13.3%) |
Fertility by Education in Conejos County
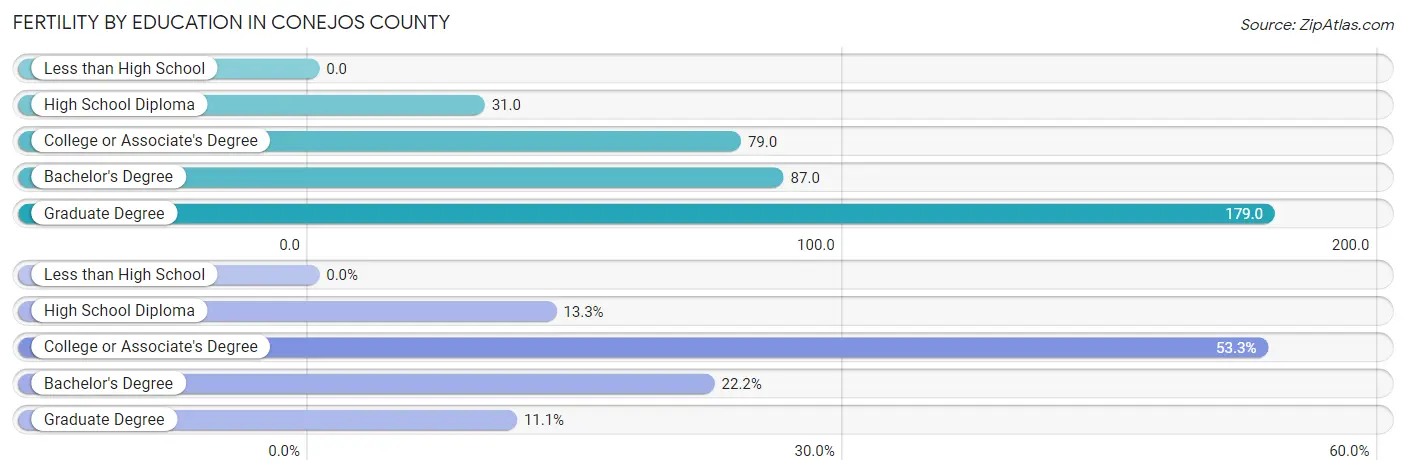
| Educational Attainment | Women with Births | Births / 1,000 Women |
| Less than High School | 0 (0.0%) | 0.0 |
| High School Diploma | 12 (13.3%) | 31.0 |
| College or Associate's Degree | 48 (53.3%) | 79.0 |
| Bachelor's Degree | 20 (22.2%) | 87.0 |
| Graduate Degree | 10 (11.1%) | 179.0 |
| Total | 90 (100.0%) | 59.0 |
Fertility by Education by Marriage Status in Conejos County
13.3% of women with births in Conejos County are unmarried. Women with the educational attainment of high school diploma are most likely to be married with 100.0% of them married at childbirth, while women with the educational attainment of bachelor's degree are least likely to be married with 20.0% of them unmarried at childbirth.
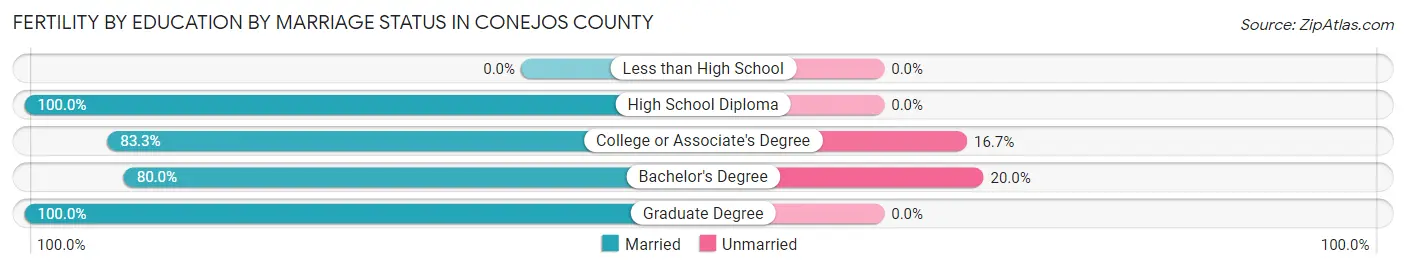
| Educational Attainment | Married | Unmarried |
| Less than High School | 0 (0.0%) | 0 (0.0%) |
| High School Diploma | 12 (100.0%) | 0 (0.0%) |
| College or Associate's Degree | 40 (83.3%) | 8 (16.7%) |
| Bachelor's Degree | 16 (80.0%) | 4 (20.0%) |
| Graduate Degree | 10 (100.0%) | 0 (0.0%) |
| Total | 78 (86.7%) | 12 (13.3%) |
Employment Characteristics in Conejos County
Employment by Class of Employer in Conejos County
Among the 2,946 employed individuals in Conejos County, private company employees (1,615 | 54.8%), local government employees (341 | 11.6%), and self-employed (not incorporated) (273 | 9.3%) make up the most common classes of employment.
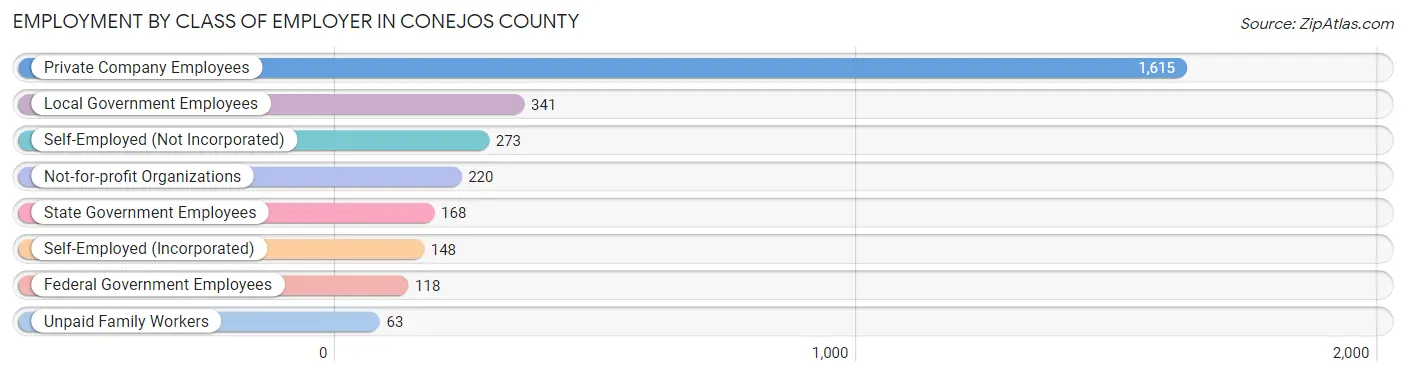
| Employer Class | # Employees | % Employees |
| Private Company Employees | 1,615 | 54.8% |
| Self-Employed (Incorporated) | 148 | 5.0% |
| Self-Employed (Not Incorporated) | 273 | 9.3% |
| Not-for-profit Organizations | 220 | 7.5% |
| Local Government Employees | 341 | 11.6% |
| State Government Employees | 168 | 5.7% |
| Federal Government Employees | 118 | 4.0% |
| Unpaid Family Workers | 63 | 2.1% |
| Total | 2,946 | 100.0% |
Employment Status by Age in Conejos County
According to the labor force statistics for Conejos County, out of the total population over 16 years of age (5,851), 56.5% or 3,306 individuals are in the labor force, with 7.2% or 238 of them unemployed. The age group with the highest labor force participation rate is 35 to 44 years, with 80.7% or 744 individuals in the labor force. Within the labor force, the 16 to 19 years age range has the highest percentage of unemployed individuals, with 20.6% or 33 of them being unemployed.
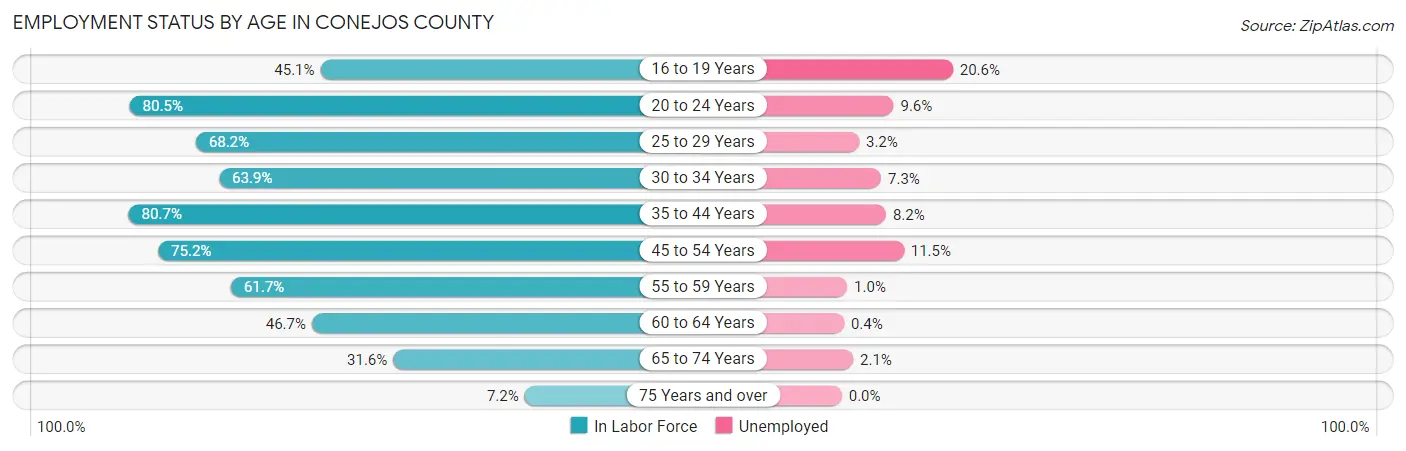
| Age Bracket | In Labor Force | Unemployed |
| 16 to 19 Years | 160 (45.1%) | 33 (20.6%) |
| 20 to 24 Years | 417 (80.5%) | 40 (9.6%) |
| 25 to 29 Years | 283 (68.2%) | 9 (3.2%) |
| 30 to 34 Years | 234 (63.9%) | 17 (7.3%) |
| 35 to 44 Years | 744 (80.7%) | 61 (8.2%) |
| 45 to 54 Years | 584 (75.2%) | 67 (11.5%) |
| 55 to 59 Years | 300 (61.7%) | 3 (1.0%) |
| 60 to 64 Years | 251 (46.7%) | 1 (0.4%) |
| 65 to 74 Years | 290 (31.6%) | 6 (2.1%) |
| 75 Years and over | 40 (7.2%) | 0 (0.0%) |
| Total | 3,306 (56.5%) | 238 (7.2%) |
Employment Status by Educational Attainment in Conejos County
According to labor force statistics for Conejos County, 68.4% of individuals (2,396) out of the total population between 25 and 64 years of age (3,503) are in the labor force, with 6.6% or 158 of them being unemployed. The group with the highest labor force participation rate are those with the educational attainment of college / associate degree, with 76.6% or 932 individuals in the labor force. Within the labor force, individuals with less than high school education have the highest percentage of unemployment, with 12.3% or 19 of them being unemployed.
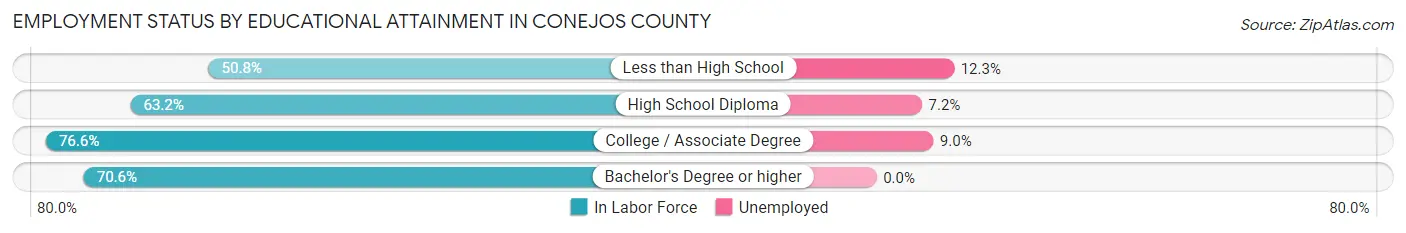
| Educational Attainment | In Labor Force | Unemployed |
| Less than High School | 154 (50.8%) | 37 (12.3%) |
| High School Diploma | 767 (63.2%) | 87 (7.2%) |
| College / Associate Degree | 932 (76.6%) | 110 (9.0%) |
| Bachelor's Degree or higher | 543 (70.6%) | 0 (0.0%) |
| Total | 2,396 (68.4%) | 231 (6.6%) |
Employment Occupations by Sex in Conejos County
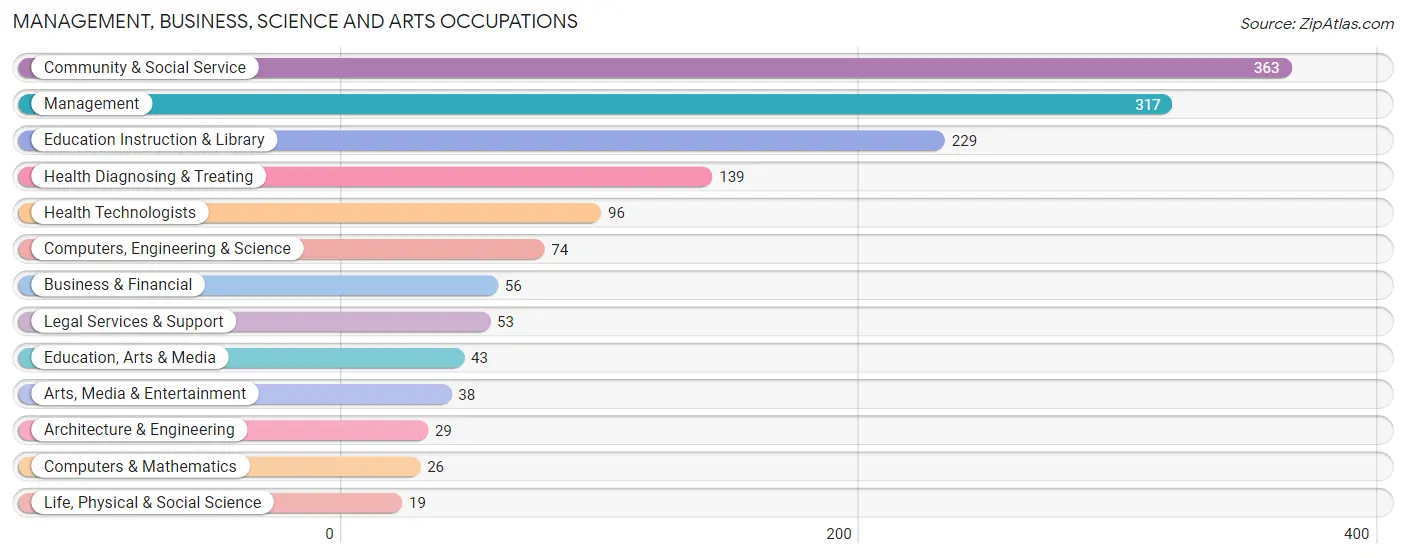
Management, Business, Science and Arts Occupations
The most common Management, Business, Science and Arts occupations in Conejos County are Community & Social Service (363 | 11.8%), Management (317 | 10.3%), Education Instruction & Library (229 | 7.5%), Health Diagnosing & Treating (139 | 4.5%), and Health Technologists (96 | 3.1%).
Management, Business, Science and Arts Occupations by Sex
Within the Management, Business, Science and Arts occupations in Conejos County, the most male-oriented occupations are Computers & Mathematics (100.0%), Architecture & Engineering (100.0%), and Computers, Engineering & Science (85.1%), while the most female-oriented occupations are Education, Arts & Media (83.7%), Arts, Media & Entertainment (81.6%), and Education Instruction & Library (79.9%).
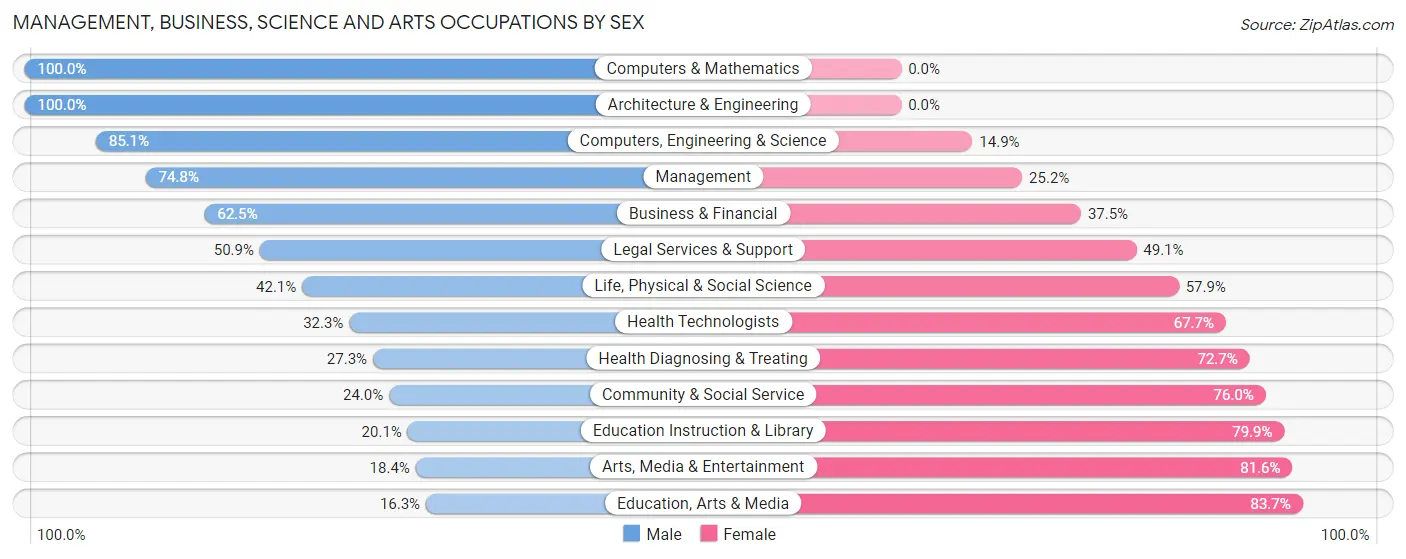
| Occupation | Male | Female |
| Management | 237 (74.8%) | 80 (25.2%) |
| Business & Financial | 35 (62.5%) | 21 (37.5%) |
| Computers, Engineering & Science | 63 (85.1%) | 11 (14.9%) |
| Computers & Mathematics | 26 (100.0%) | 0 (0.0%) |
| Architecture & Engineering | 29 (100.0%) | 0 (0.0%) |
| Life, Physical & Social Science | 8 (42.1%) | 11 (57.9%) |
| Community & Social Service | 87 (24.0%) | 276 (76.0%) |
| Education, Arts & Media | 7 (16.3%) | 36 (83.7%) |
| Legal Services & Support | 27 (50.9%) | 26 (49.1%) |
| Education Instruction & Library | 46 (20.1%) | 183 (79.9%) |
| Arts, Media & Entertainment | 7 (18.4%) | 31 (81.6%) |
| Health Diagnosing & Treating | 38 (27.3%) | 101 (72.7%) |
| Health Technologists | 31 (32.3%) | 65 (67.7%) |
| Total (Category) | 460 (48.5%) | 489 (51.5%) |
| Total (Overall) | 1,721 (56.1%) | 1,345 (43.9%) |
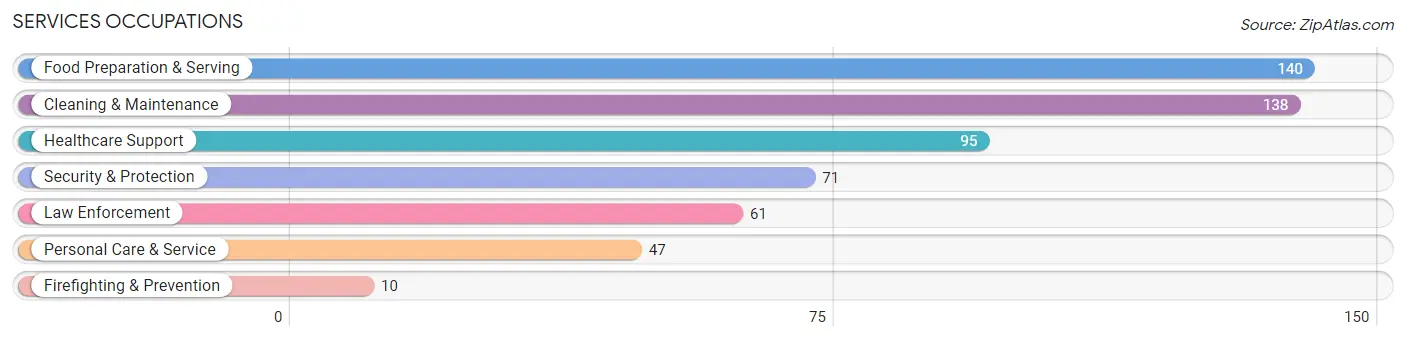
Services Occupations
The most common Services occupations in Conejos County are Food Preparation & Serving (140 | 4.6%), Cleaning & Maintenance (138 | 4.5%), Healthcare Support (95 | 3.1%), Security & Protection (71 | 2.3%), and Law Enforcement (61 | 2.0%).
Services Occupations by Sex
Within the Services occupations in Conejos County, the most male-oriented occupations are Firefighting & Prevention (100.0%), Security & Protection (88.7%), and Law Enforcement (86.9%), while the most female-oriented occupations are Healthcare Support (73.7%), Personal Care & Service (68.1%), and Cleaning & Maintenance (51.4%).
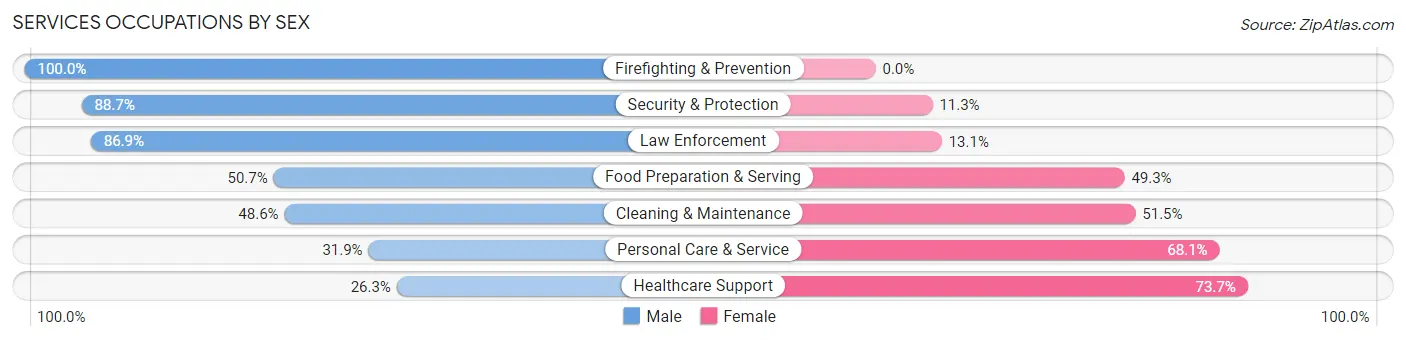
| Occupation | Male | Female |
| Healthcare Support | 25 (26.3%) | 70 (73.7%) |
| Security & Protection | 63 (88.7%) | 8 (11.3%) |
| Firefighting & Prevention | 10 (100.0%) | 0 (0.0%) |
| Law Enforcement | 53 (86.9%) | 8 (13.1%) |
| Food Preparation & Serving | 71 (50.7%) | 69 (49.3%) |
| Cleaning & Maintenance | 67 (48.5%) | 71 (51.4%) |
| Personal Care & Service | 15 (31.9%) | 32 (68.1%) |
| Total (Category) | 241 (49.1%) | 250 (50.9%) |
| Total (Overall) | 1,721 (56.1%) | 1,345 (43.9%) |
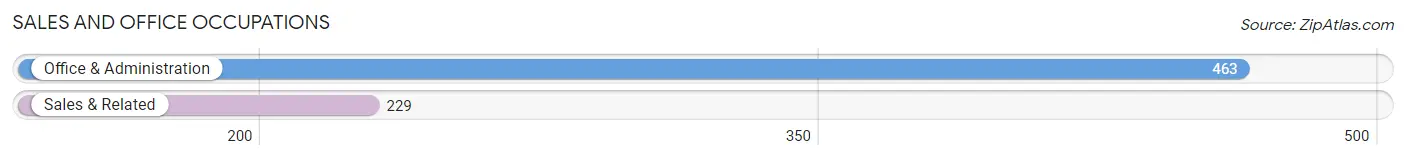
Sales and Office Occupations
The most common Sales and Office occupations in Conejos County are Office & Administration (463 | 15.1%), and Sales & Related (229 | 7.5%).
Sales and Office Occupations by Sex
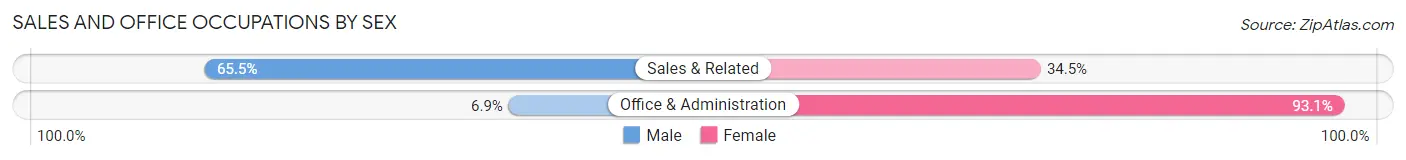
| Occupation | Male | Female |
| Sales & Related | 150 (65.5%) | 79 (34.5%) |
| Office & Administration | 32 (6.9%) | 431 (93.1%) |
| Total (Category) | 182 (26.3%) | 510 (73.7%) |
| Total (Overall) | 1,721 (56.1%) | 1,345 (43.9%) |
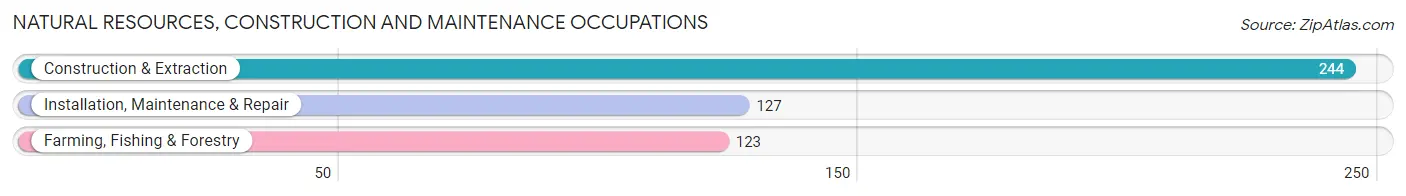
Natural Resources, Construction and Maintenance Occupations
The most common Natural Resources, Construction and Maintenance occupations in Conejos County are Construction & Extraction (244 | 8.0%), Installation, Maintenance & Repair (127 | 4.1%), and Farming, Fishing & Forestry (123 | 4.0%).
Natural Resources, Construction and Maintenance Occupations by Sex
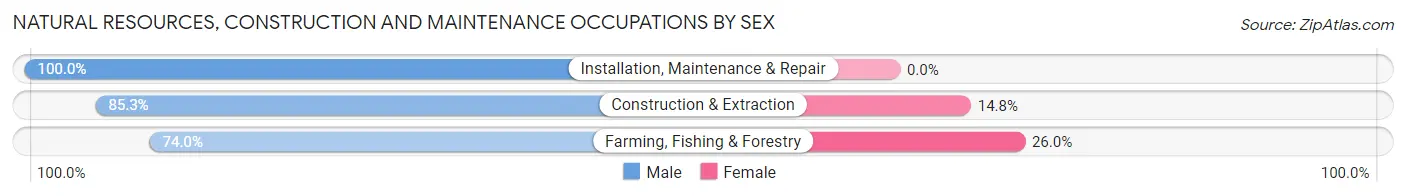
| Occupation | Male | Female |
| Farming, Fishing & Forestry | 91 (74.0%) | 32 (26.0%) |
| Construction & Extraction | 208 (85.3%) | 36 (14.7%) |
| Installation, Maintenance & Repair | 127 (100.0%) | 0 (0.0%) |
| Total (Category) | 426 (86.2%) | 68 (13.8%) |
| Total (Overall) | 1,721 (56.1%) | 1,345 (43.9%) |
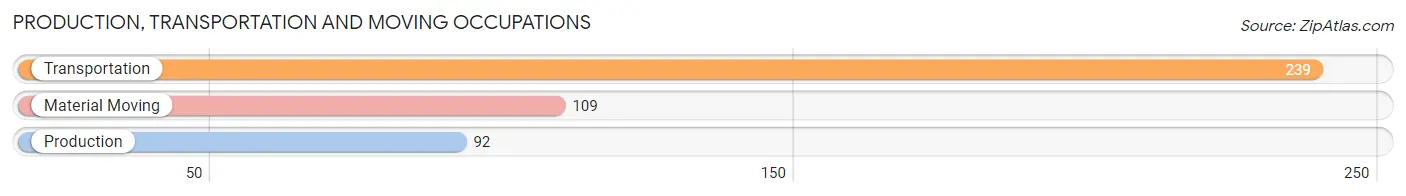
Production, Transportation and Moving Occupations
The most common Production, Transportation and Moving occupations in Conejos County are Transportation (239 | 7.8%), Material Moving (109 | 3.6%), and Production (92 | 3.0%).
Production, Transportation and Moving Occupations by Sex
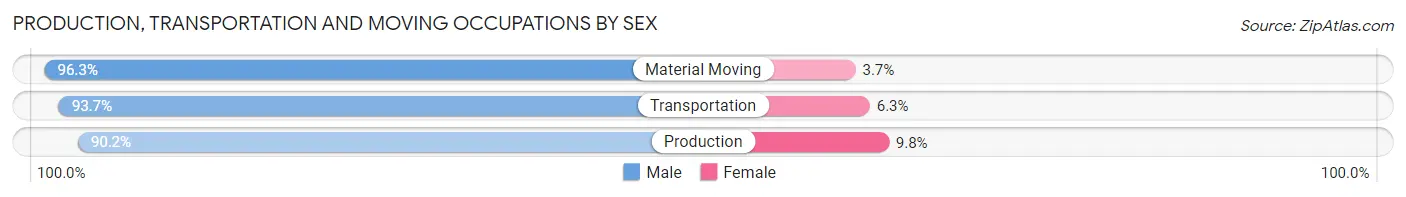
| Occupation | Male | Female |
| Production | 83 (90.2%) | 9 (9.8%) |
| Transportation | 224 (93.7%) | 15 (6.3%) |
| Material Moving | 105 (96.3%) | 4 (3.7%) |
| Total (Category) | 412 (93.6%) | 28 (6.4%) |
| Total (Overall) | 1,721 (56.1%) | 1,345 (43.9%) |
Employment Industries by Sex in Conejos County
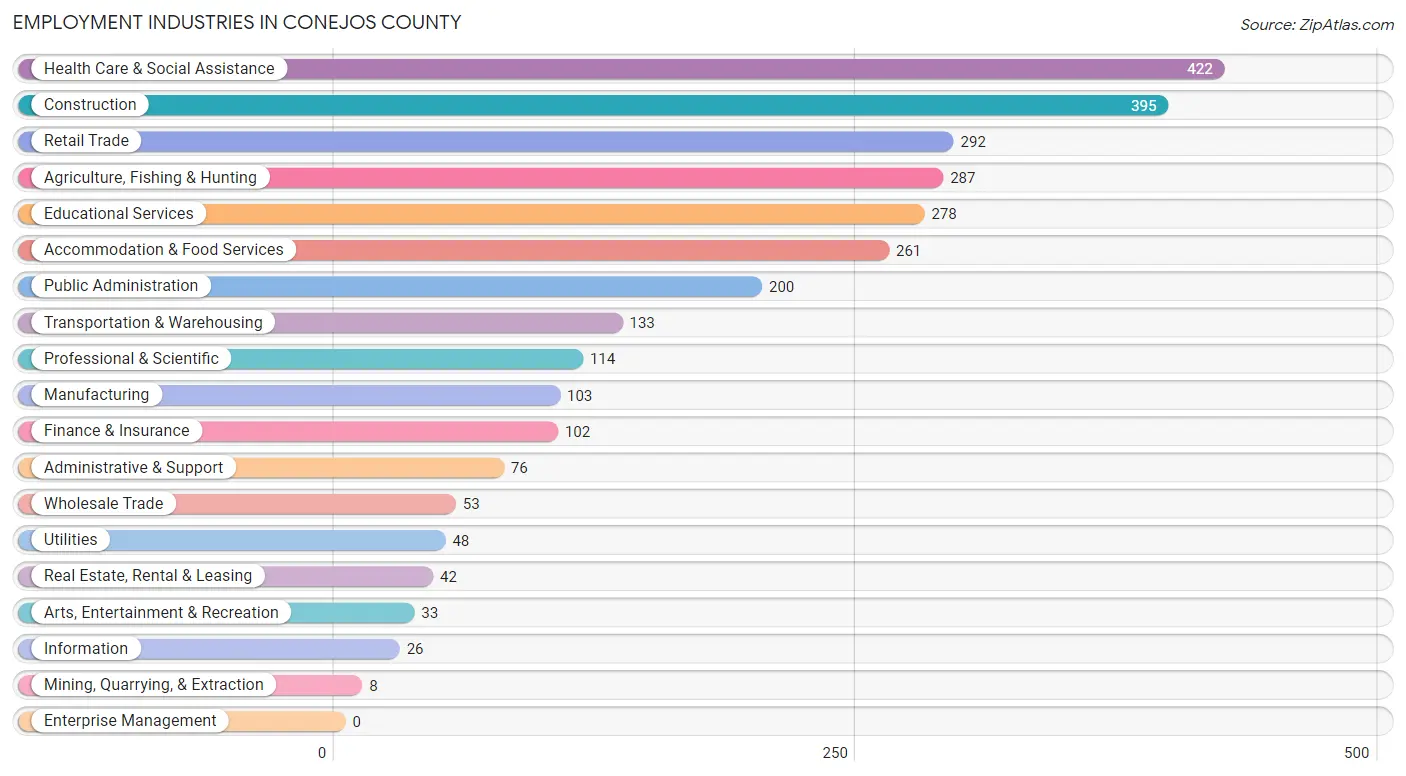
Employment Industries in Conejos County
The major employment industries in Conejos County include Health Care & Social Assistance (422 | 13.8%), Construction (395 | 12.9%), Retail Trade (292 | 9.5%), Agriculture, Fishing & Hunting (287 | 9.4%), and Educational Services (278 | 9.1%).
Employment Industries by Sex in Conejos County
The Conejos County industries that see more men than women are Mining, Quarrying, & Extraction (100.0%), Utilities (93.8%), and Wholesale Trade (90.6%), whereas the industries that tend to have a higher number of women are Finance & Insurance (83.3%), Arts, Entertainment & Recreation (81.8%), and Health Care & Social Assistance (79.1%).
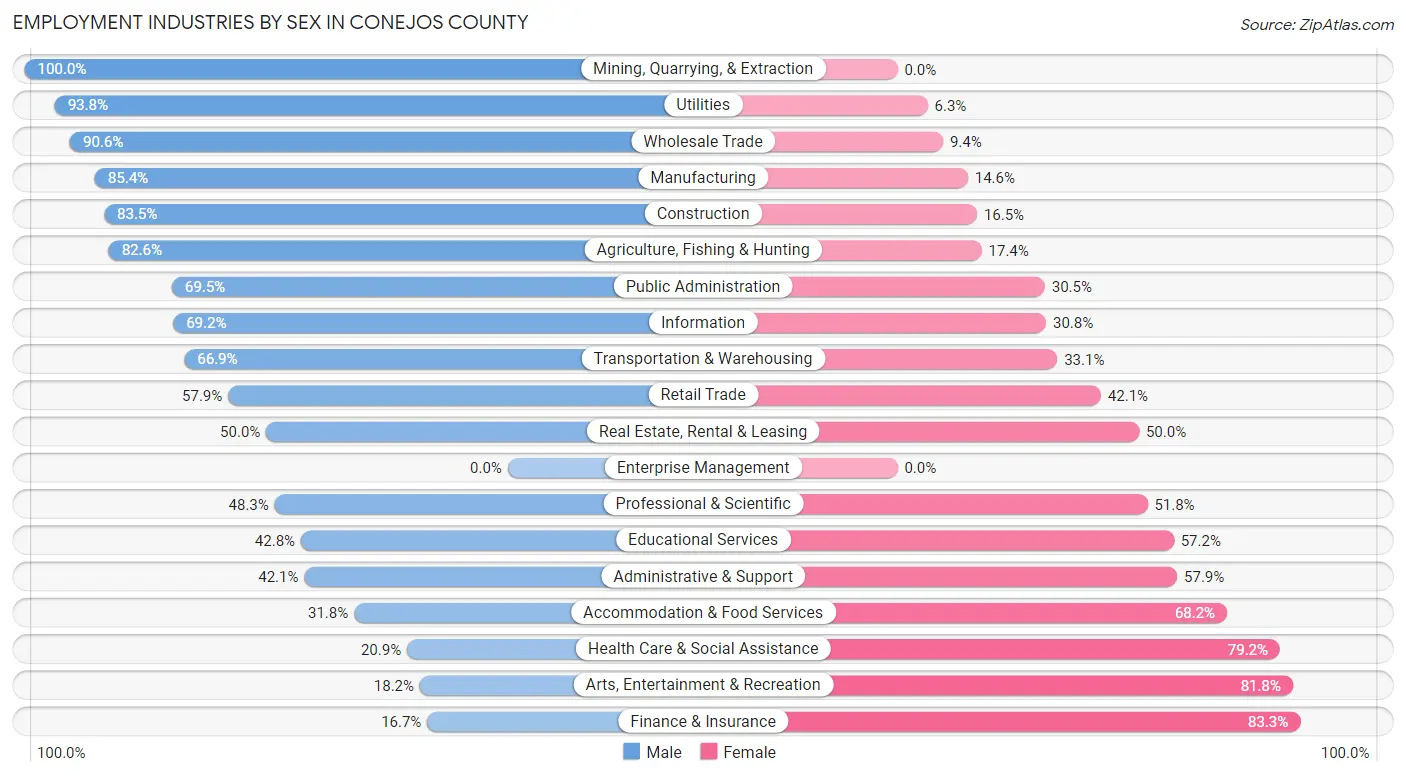
| Industry | Male | Female |
| Agriculture, Fishing & Hunting | 237 (82.6%) | 50 (17.4%) |
| Mining, Quarrying, & Extraction | 8 (100.0%) | 0 (0.0%) |
| Construction | 330 (83.5%) | 65 (16.5%) |
| Manufacturing | 88 (85.4%) | 15 (14.6%) |
| Wholesale Trade | 48 (90.6%) | 5 (9.4%) |
| Retail Trade | 169 (57.9%) | 123 (42.1%) |
| Transportation & Warehousing | 89 (66.9%) | 44 (33.1%) |
| Utilities | 45 (93.8%) | 3 (6.2%) |
| Information | 18 (69.2%) | 8 (30.8%) |
| Finance & Insurance | 17 (16.7%) | 85 (83.3%) |
| Real Estate, Rental & Leasing | 21 (50.0%) | 21 (50.0%) |
| Professional & Scientific | 55 (48.2%) | 59 (51.7%) |
| Enterprise Management | 0 (0.0%) | 0 (0.0%) |
| Administrative & Support | 32 (42.1%) | 44 (57.9%) |
| Educational Services | 119 (42.8%) | 159 (57.2%) |
| Health Care & Social Assistance | 88 (20.8%) | 334 (79.1%) |
| Arts, Entertainment & Recreation | 6 (18.2%) | 27 (81.8%) |
| Accommodation & Food Services | 83 (31.8%) | 178 (68.2%) |
| Public Administration | 139 (69.5%) | 61 (30.5%) |
| Total | 1,721 (56.1%) | 1,345 (43.9%) |
Education in Conejos County
School Enrollment in Conejos County
The most common levels of schooling among the 1,694 students in Conejos County are middle school (484 | 28.6%), high school (386 | 22.8%), and elementary school (377 | 22.3%).
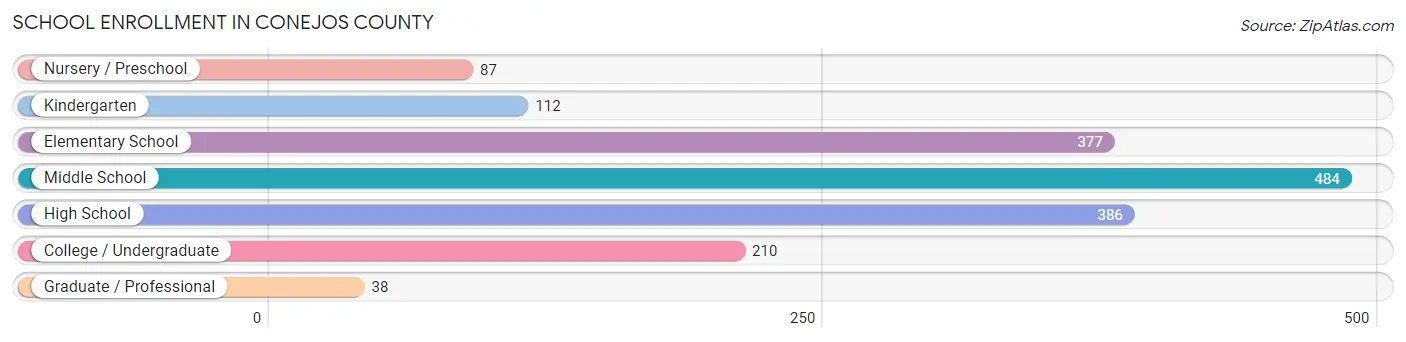
| School Level | # Students | % Students |
| Nursery / Preschool | 87 | 5.1% |
| Kindergarten | 112 | 6.6% |
| Elementary School | 377 | 22.3% |
| Middle School | 484 | 28.6% |
| High School | 386 | 22.8% |
| College / Undergraduate | 210 | 12.4% |
| Graduate / Professional | 38 | 2.2% |
| Total | 1,694 | 100.0% |
School Enrollment by Age by Funding Source in Conejos County
Out of a total of 1,694 students who are enrolled in schools in Conejos County, 186 (11.0%) attend a private institution, while the remaining 1,508 (89.0%) are enrolled in public schools. The age group of 3 to 4 year olds has the highest likelihood of being enrolled in private schools, with 21 (42.9% in the age bracket) enrolled. Conversely, the age group of 18 to 19 year olds has the lowest likelihood of being enrolled in a private school, with 61 (100.0% in the age bracket) attending a public institution.
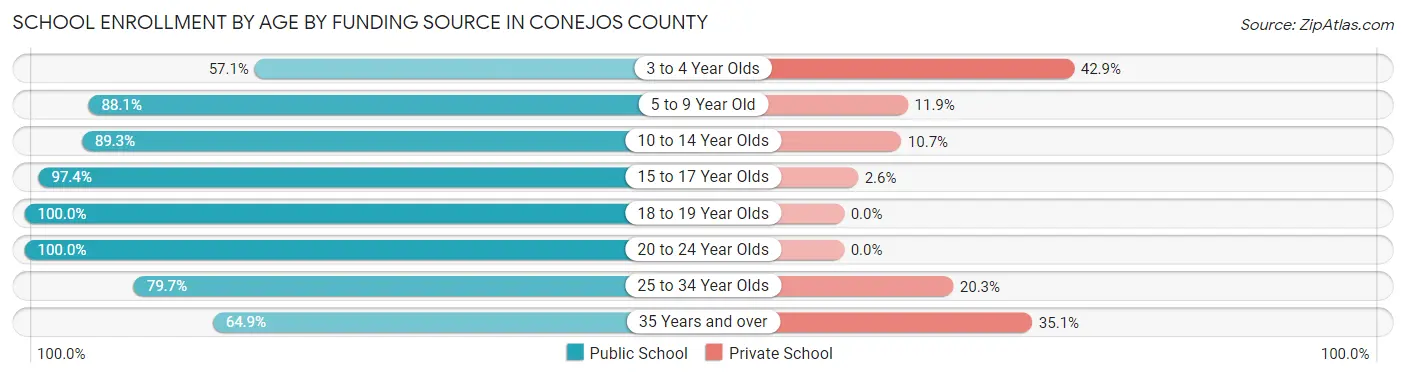
| Age Bracket | Public School | Private School |
| 3 to 4 Year Olds | 28 (57.1%) | 21 (42.9%) |
| 5 to 9 Year Old | 392 (88.1%) | 53 (11.9%) |
| 10 to 14 Year Olds | 545 (89.3%) | 65 (10.7%) |
| 15 to 17 Year Olds | 299 (97.4%) | 8 (2.6%) |
| 18 to 19 Year Olds | 61 (100.0%) | 0 (0.0%) |
| 20 to 24 Year Olds | 86 (100.0%) | 0 (0.0%) |
| 25 to 34 Year Olds | 47 (79.7%) | 12 (20.3%) |
| 35 Years and over | 50 (64.9%) | 27 (35.1%) |
| Total | 1,508 (89.0%) | 186 (11.0%) |
Educational Attainment by Field of Study in Conejos County
Education (326 | 23.8%), business (241 | 17.6%), arts & humanities (138 | 10.1%), social sciences (124 | 9.0%), and science & technology (102 | 7.4%) are the most common fields of study among 1,370 individuals in Conejos County who have obtained a bachelor's degree or higher.
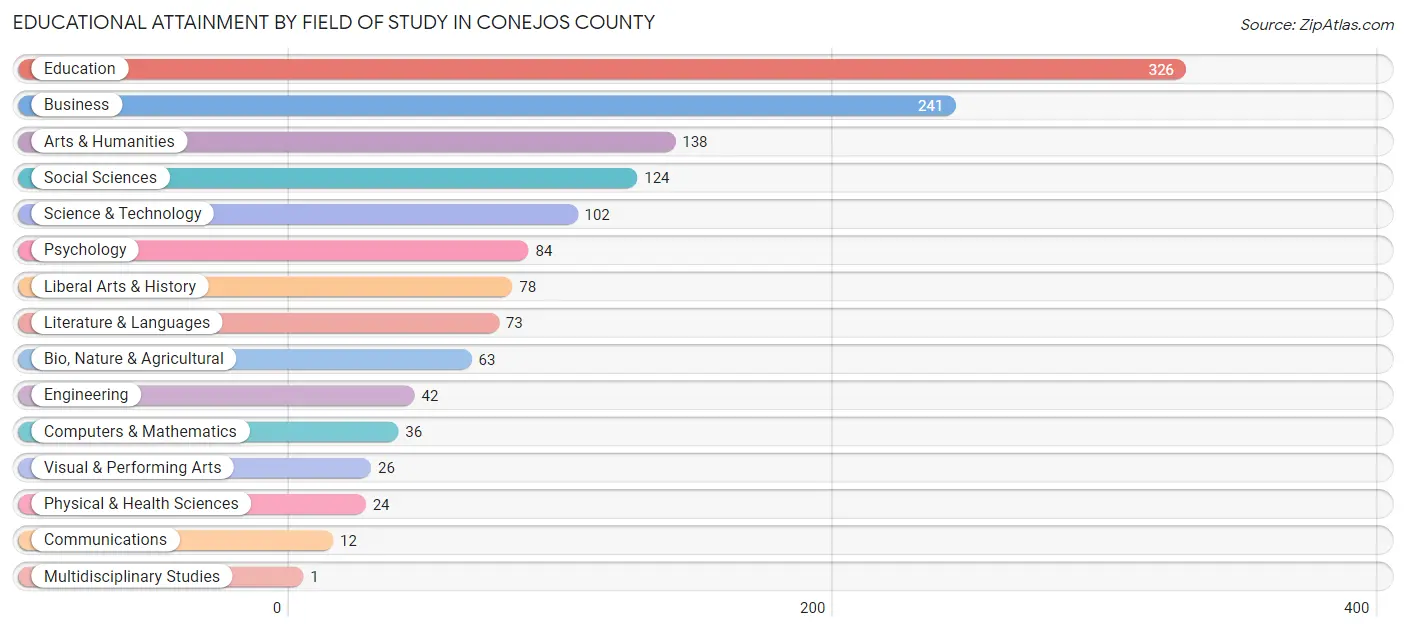
| Field of Study | # Graduates | % Graduates |
| Computers & Mathematics | 36 | 2.6% |
| Bio, Nature & Agricultural | 63 | 4.6% |
| Physical & Health Sciences | 24 | 1.8% |
| Psychology | 84 | 6.1% |
| Social Sciences | 124 | 9.0% |
| Engineering | 42 | 3.1% |
| Multidisciplinary Studies | 1 | 0.1% |
| Science & Technology | 102 | 7.4% |
| Business | 241 | 17.6% |
| Education | 326 | 23.8% |
| Literature & Languages | 73 | 5.3% |
| Liberal Arts & History | 78 | 5.7% |
| Visual & Performing Arts | 26 | 1.9% |
| Communications | 12 | 0.9% |
| Arts & Humanities | 138 | 10.1% |
| Total | 1,370 | 100.0% |
Transportation & Commute in Conejos County
Vehicle Availability by Sex in Conejos County
The most prevalent vehicle ownership categories in Conejos County are males with 2 vehicles (527, accounting for 31.9%) and females with 2 vehicles (285, making up 40.8%).
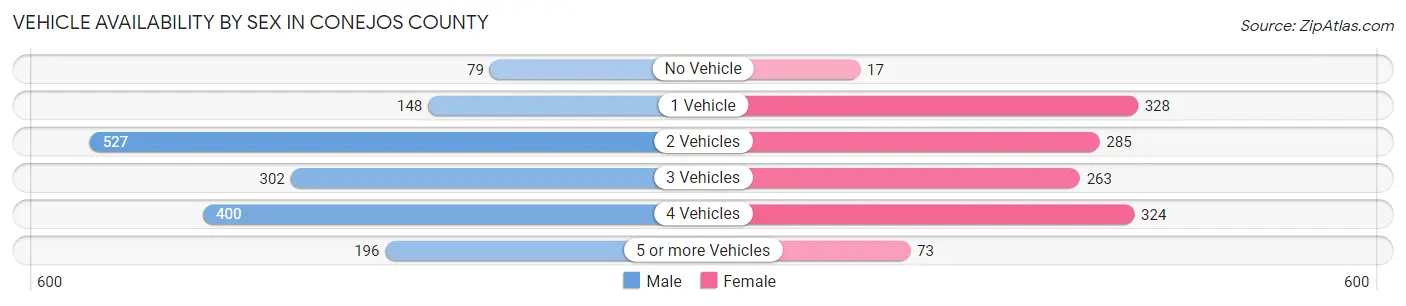
| Vehicles Available | Male | Female |
| No Vehicle | 79 (4.8%) | 17 (1.3%) |
| 1 Vehicle | 148 (9.0%) | 328 (25.4%) |
| 2 Vehicles | 527 (31.9%) | 285 (22.1%) |
| 3 Vehicles | 302 (18.3%) | 263 (20.4%) |
| 4 Vehicles | 400 (24.2%) | 324 (25.1%) |
| 5 or more Vehicles | 196 (11.9%) | 73 (5.7%) |
| Total | 1,652 (100.0%) | 1,290 (100.0%) |
Commute Time in Conejos County
The most frequently occuring commute durations in Conejos County are 30 to 34 minutes (466 commuters, 18.2%), 5 to 9 minutes (311 commuters, 12.2%), and 25 to 29 minutes (304 commuters, 11.9%).
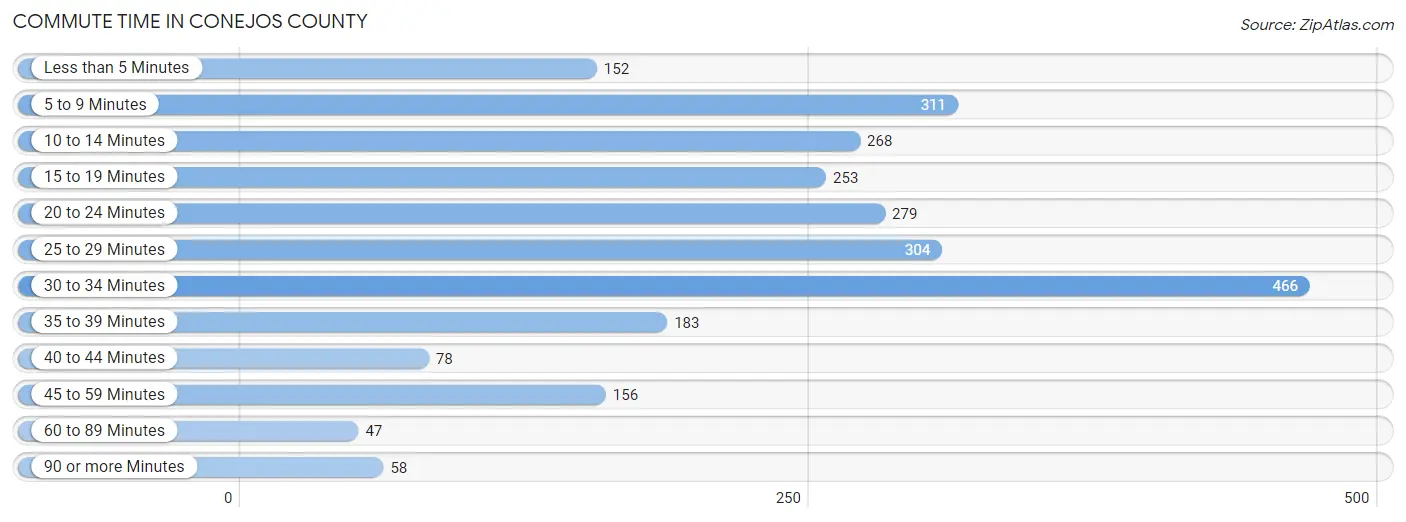
| Commute Time | # Commuters | % Commuters |
| Less than 5 Minutes | 152 | 5.9% |
| 5 to 9 Minutes | 311 | 12.2% |
| 10 to 14 Minutes | 268 | 10.5% |
| 15 to 19 Minutes | 253 | 9.9% |
| 20 to 24 Minutes | 279 | 10.9% |
| 25 to 29 Minutes | 304 | 11.9% |
| 30 to 34 Minutes | 466 | 18.2% |
| 35 to 39 Minutes | 183 | 7.2% |
| 40 to 44 Minutes | 78 | 3.0% |
| 45 to 59 Minutes | 156 | 6.1% |
| 60 to 89 Minutes | 47 | 1.8% |
| 90 or more Minutes | 58 | 2.3% |
Commute Time by Sex in Conejos County
The most common commute times in Conejos County are 30 to 34 minutes (211 commuters, 14.5%) for males and 30 to 34 minutes (255 commuters, 23.1%) for females.
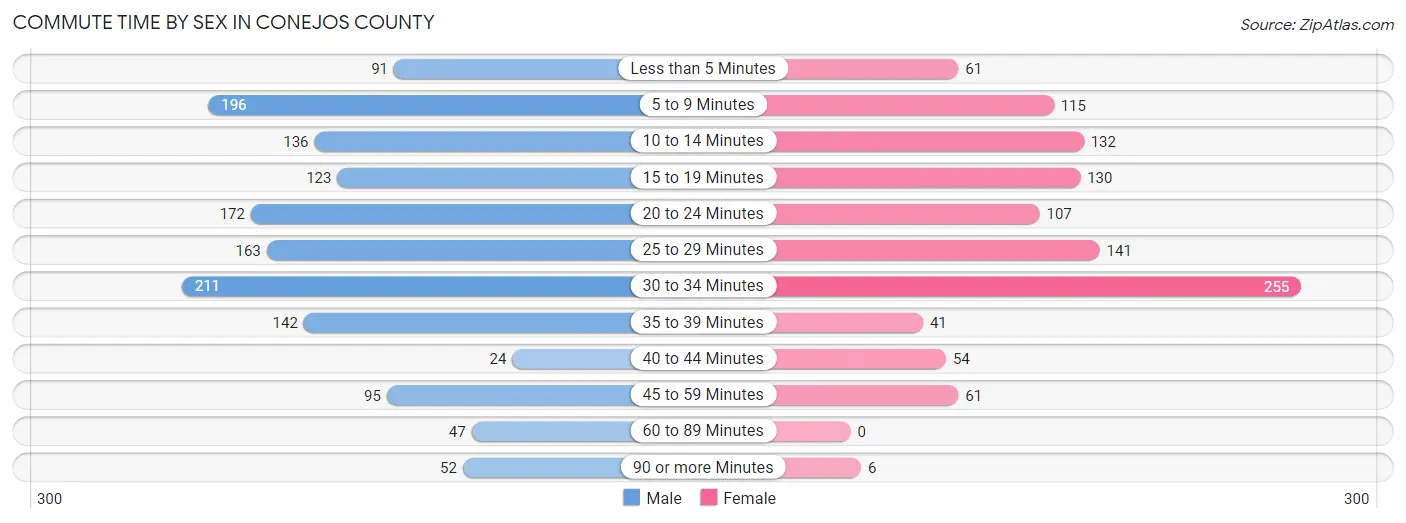
| Commute Time | Male | Female |
| Less than 5 Minutes | 91 (6.3%) | 61 (5.5%) |
| 5 to 9 Minutes | 196 (13.5%) | 115 (10.4%) |
| 10 to 14 Minutes | 136 (9.4%) | 132 (12.0%) |
| 15 to 19 Minutes | 123 (8.5%) | 130 (11.8%) |
| 20 to 24 Minutes | 172 (11.8%) | 107 (9.7%) |
| 25 to 29 Minutes | 163 (11.2%) | 141 (12.8%) |
| 30 to 34 Minutes | 211 (14.5%) | 255 (23.1%) |
| 35 to 39 Minutes | 142 (9.8%) | 41 (3.7%) |
| 40 to 44 Minutes | 24 (1.7%) | 54 (4.9%) |
| 45 to 59 Minutes | 95 (6.5%) | 61 (5.5%) |
| 60 to 89 Minutes | 47 (3.2%) | 0 (0.0%) |
| 90 or more Minutes | 52 (3.6%) | 6 (0.5%) |
Time of Departure to Work by Sex in Conejos County
The most frequent times of departure to work in Conejos County are 7:00 AM to 7:29 AM (298, 20.5%) for males and 7:00 AM to 7:29 AM (317, 28.7%) for females.
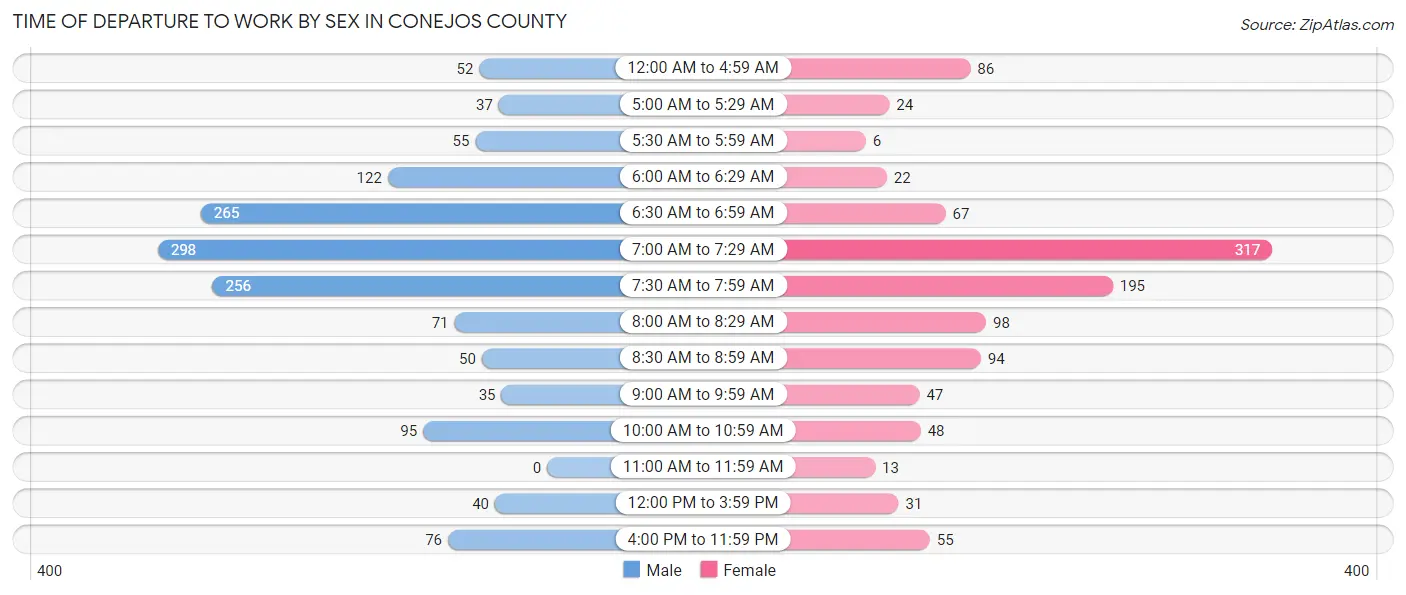
| Time of Departure | Male | Female |
| 12:00 AM to 4:59 AM | 52 (3.6%) | 86 (7.8%) |
| 5:00 AM to 5:29 AM | 37 (2.5%) | 24 (2.2%) |
| 5:30 AM to 5:59 AM | 55 (3.8%) | 6 (0.5%) |
| 6:00 AM to 6:29 AM | 122 (8.4%) | 22 (2.0%) |
| 6:30 AM to 6:59 AM | 265 (18.2%) | 67 (6.1%) |
| 7:00 AM to 7:29 AM | 298 (20.5%) | 317 (28.7%) |
| 7:30 AM to 7:59 AM | 256 (17.6%) | 195 (17.7%) |
| 8:00 AM to 8:29 AM | 71 (4.9%) | 98 (8.9%) |
| 8:30 AM to 8:59 AM | 50 (3.4%) | 94 (8.5%) |
| 9:00 AM to 9:59 AM | 35 (2.4%) | 47 (4.3%) |
| 10:00 AM to 10:59 AM | 95 (6.5%) | 48 (4.3%) |
| 11:00 AM to 11:59 AM | 0 (0.0%) | 13 (1.2%) |
| 12:00 PM to 3:59 PM | 40 (2.8%) | 31 (2.8%) |
| 4:00 PM to 11:59 PM | 76 (5.2%) | 55 (5.0%) |
| Total | 1,452 (100.0%) | 1,103 (100.0%) |
Housing Occupancy in Conejos County
Occupancy by Ownership in Conejos County
Of the total 3,087 dwellings in Conejos County, owner-occupied units account for 2,438 (79.0%), while renter-occupied units make up 649 (21.0%).
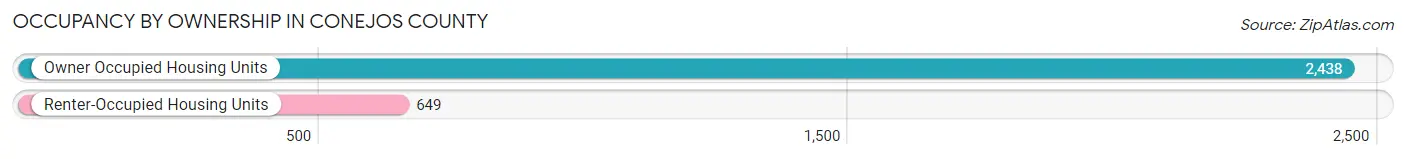
| Occupancy | # Housing Units | % Housing Units |
| Owner Occupied Housing Units | 2,438 | 79.0% |
| Renter-Occupied Housing Units | 649 | 21.0% |
| Total Occupied Housing Units | 3,087 | 100.0% |
Occupancy by Household Size in Conejos County
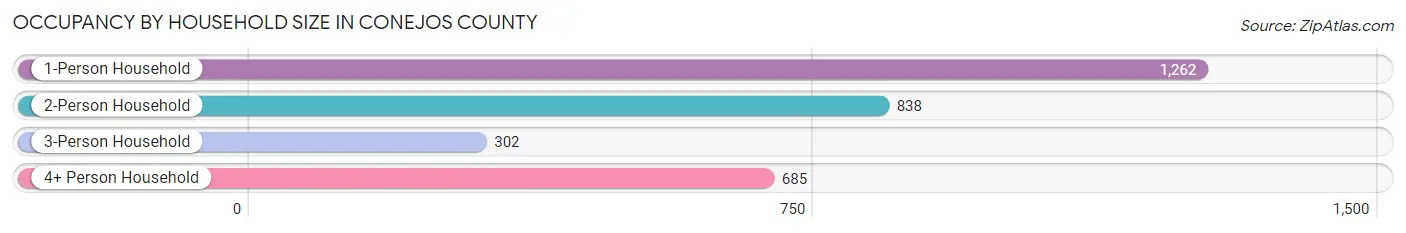
| Household Size | # Housing Units | % Housing Units |
| 1-Person Household | 1,262 | 40.9% |
| 2-Person Household | 838 | 27.2% |
| 3-Person Household | 302 | 9.8% |
| 4+ Person Household | 685 | 22.2% |
| Total Housing Units | 3,087 | 100.0% |
Occupancy by Ownership by Household Size in Conejos County
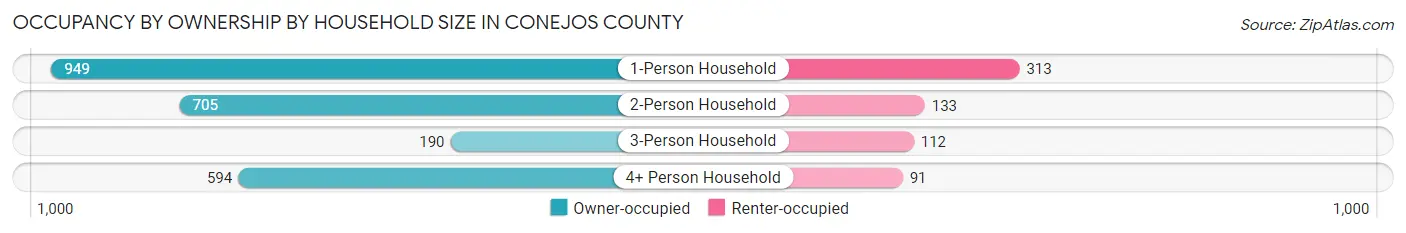
| Household Size | Owner-occupied | Renter-occupied |
| 1-Person Household | 949 (75.2%) | 313 (24.8%) |
| 2-Person Household | 705 (84.1%) | 133 (15.9%) |
| 3-Person Household | 190 (62.9%) | 112 (37.1%) |
| 4+ Person Household | 594 (86.7%) | 91 (13.3%) |
| Total Housing Units | 2,438 (79.0%) | 649 (21.0%) |
Occupancy by Educational Attainment in Conejos County
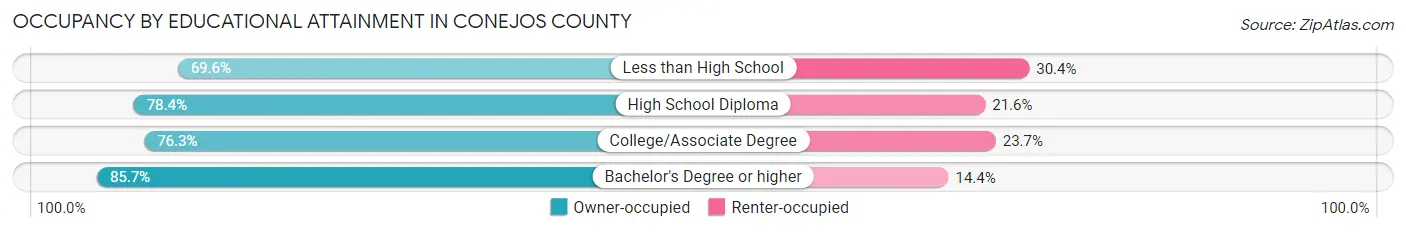
| Household Size | Owner-occupied | Renter-occupied |
| Less than High School | 195 (69.6%) | 85 (30.4%) |
| High School Diploma | 688 (78.4%) | 190 (21.6%) |
| College/Associate Degree | 791 (76.3%) | 246 (23.7%) |
| Bachelor's Degree or higher | 764 (85.7%) | 128 (14.3%) |
Occupancy by Age of Householder in Conejos County
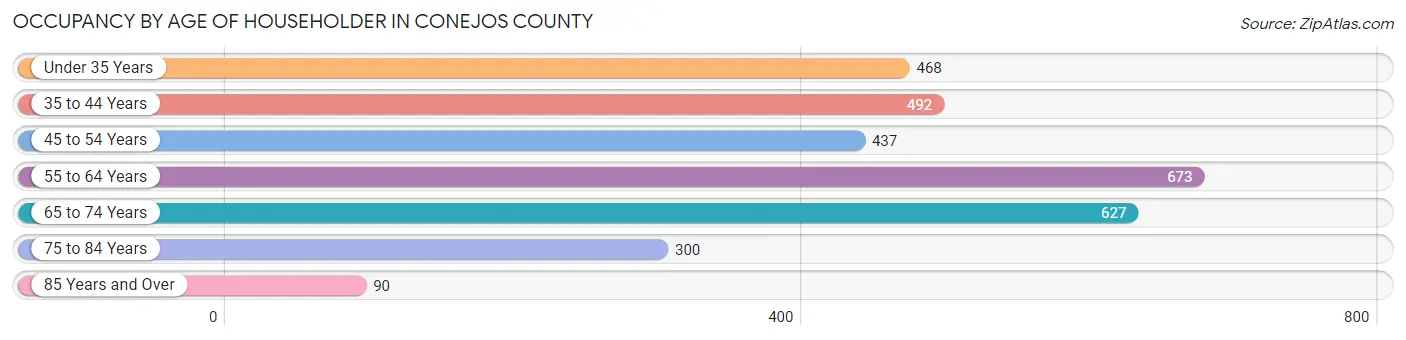
| Age Bracket | # Households | % Households |
| Under 35 Years | 468 | 15.2% |
| 35 to 44 Years | 492 | 15.9% |
| 45 to 54 Years | 437 | 14.2% |
| 55 to 64 Years | 673 | 21.8% |
| 65 to 74 Years | 627 | 20.3% |
| 75 to 84 Years | 300 | 9.7% |
| 85 Years and Over | 90 | 2.9% |
| Total | 3,087 | 100.0% |
Housing Finances in Conejos County
Median Income by Occupancy in Conejos County
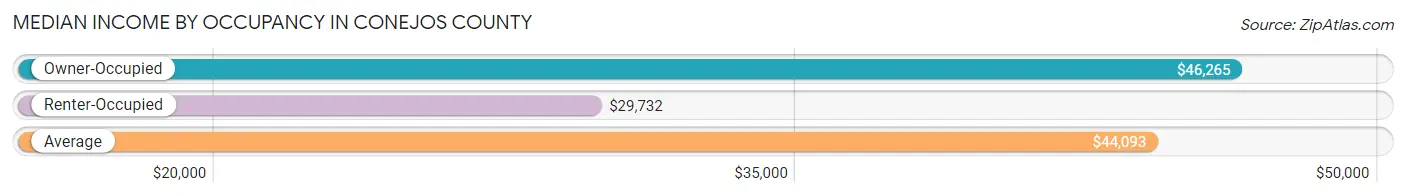
| Occupancy Type | # Households | Median Income |
| Owner-Occupied | 2,438 (79.0%) | $46,265 |
| Renter-Occupied | 649 (21.0%) | $29,732 |
| Average | 3,087 (100.0%) | $44,093 |
Occupancy by Householder Income Bracket in Conejos County
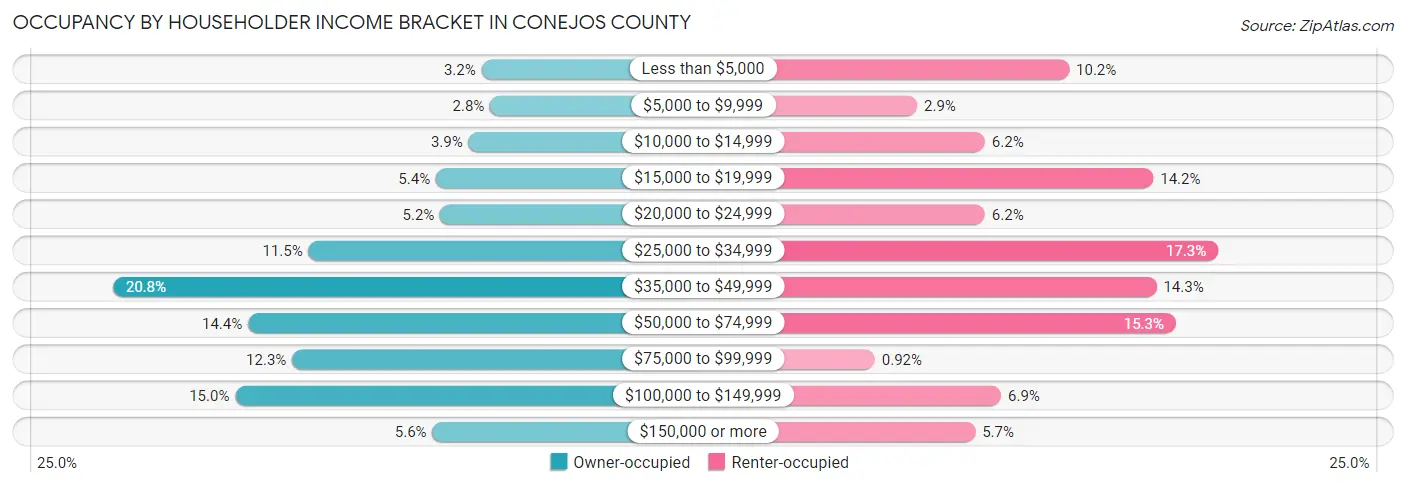
| Income Bracket | Owner-occupied | Renter-occupied |
| Less than $5,000 | 79 (3.2%) | 66 (10.2%) |
| $5,000 to $9,999 | 69 (2.8%) | 19 (2.9%) |
| $10,000 to $14,999 | 94 (3.9%) | 40 (6.2%) |
| $15,000 to $19,999 | 132 (5.4%) | 92 (14.2%) |
| $20,000 to $24,999 | 127 (5.2%) | 40 (6.2%) |
| $25,000 to $34,999 | 280 (11.5%) | 112 (17.3%) |
| $35,000 to $49,999 | 507 (20.8%) | 93 (14.3%) |
| $50,000 to $74,999 | 350 (14.4%) | 99 (15.2%) |
| $75,000 to $99,999 | 299 (12.3%) | 6 (0.9%) |
| $100,000 to $149,999 | 365 (15.0%) | 45 (6.9%) |
| $150,000 or more | 136 (5.6%) | 37 (5.7%) |
| Total | 2,438 (100.0%) | 649 (100.0%) |
Monthly Housing Cost Tiers in Conejos County
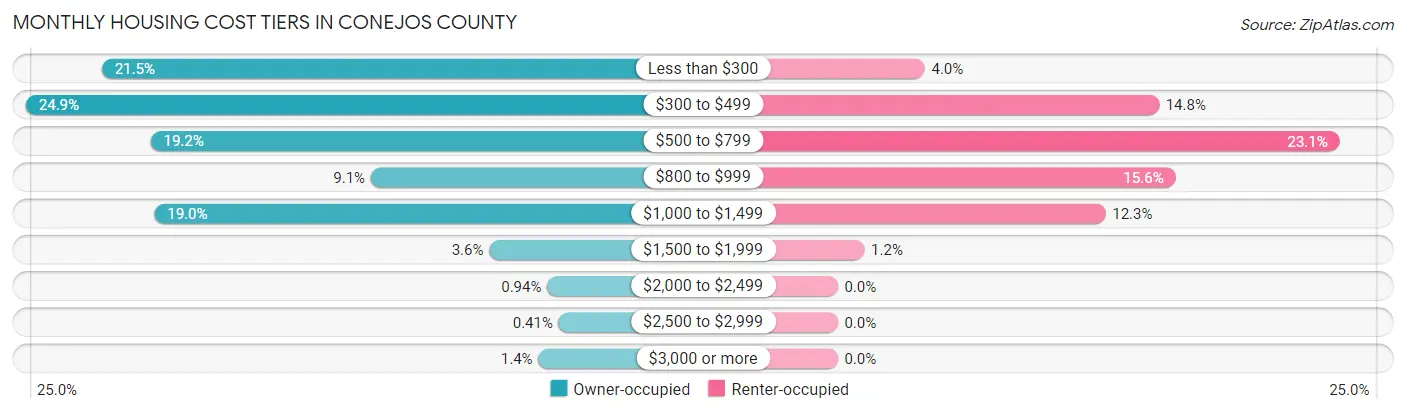
| Monthly Cost | Owner-occupied | Renter-occupied |
| Less than $300 | 523 (21.4%) | 26 (4.0%) |
| $300 to $499 | 608 (24.9%) | 96 (14.8%) |
| $500 to $799 | 468 (19.2%) | 150 (23.1%) |
| $800 to $999 | 221 (9.1%) | 101 (15.6%) |
| $1,000 to $1,499 | 464 (19.0%) | 80 (12.3%) |
| $1,500 to $1,999 | 88 (3.6%) | 8 (1.2%) |
| $2,000 to $2,499 | 23 (0.9%) | 0 (0.0%) |
| $2,500 to $2,999 | 10 (0.4%) | 0 (0.0%) |
| $3,000 or more | 33 (1.3%) | 0 (0.0%) |
| Total | 2,438 (100.0%) | 649 (100.0%) |
Physical Housing Characteristics in Conejos County
Housing Structures in Conejos County
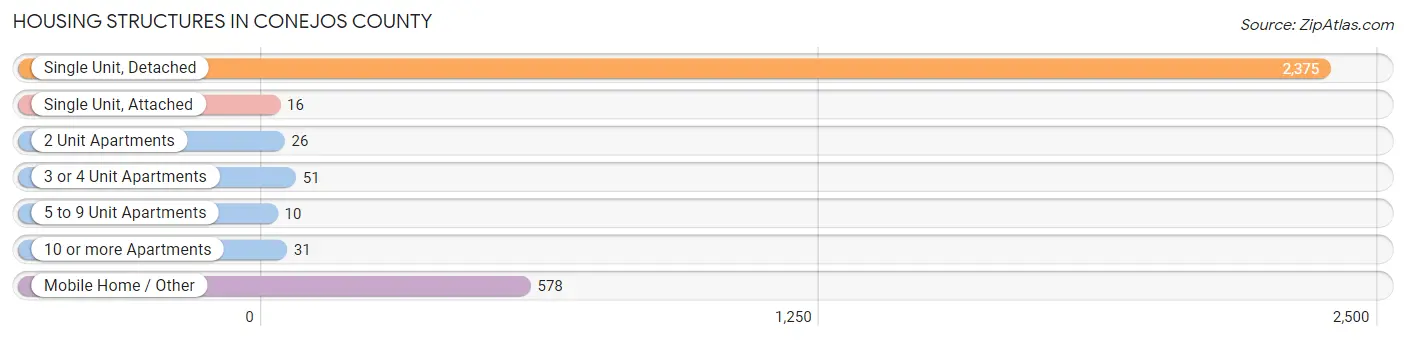
| Structure Type | # Housing Units | % Housing Units |
| Single Unit, Detached | 2,375 | 76.9% |
| Single Unit, Attached | 16 | 0.5% |
| 2 Unit Apartments | 26 | 0.8% |
| 3 or 4 Unit Apartments | 51 | 1.7% |
| 5 to 9 Unit Apartments | 10 | 0.3% |
| 10 or more Apartments | 31 | 1.0% |
| Mobile Home / Other | 578 | 18.7% |
| Total | 3,087 | 100.0% |
Housing Structures by Occupancy in Conejos County
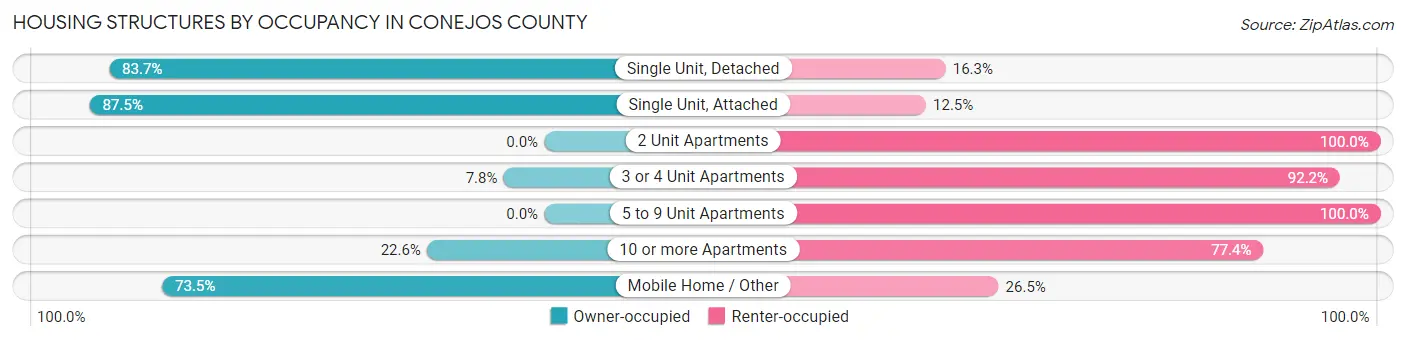
| Structure Type | Owner-occupied | Renter-occupied |
| Single Unit, Detached | 1,988 (83.7%) | 387 (16.3%) |
| Single Unit, Attached | 14 (87.5%) | 2 (12.5%) |
| 2 Unit Apartments | 0 (0.0%) | 26 (100.0%) |
| 3 or 4 Unit Apartments | 4 (7.8%) | 47 (92.2%) |
| 5 to 9 Unit Apartments | 0 (0.0%) | 10 (100.0%) |
| 10 or more Apartments | 7 (22.6%) | 24 (77.4%) |
| Mobile Home / Other | 425 (73.5%) | 153 (26.5%) |
| Total | 2,438 (79.0%) | 649 (21.0%) |
Housing Structures by Number of Rooms in Conejos County
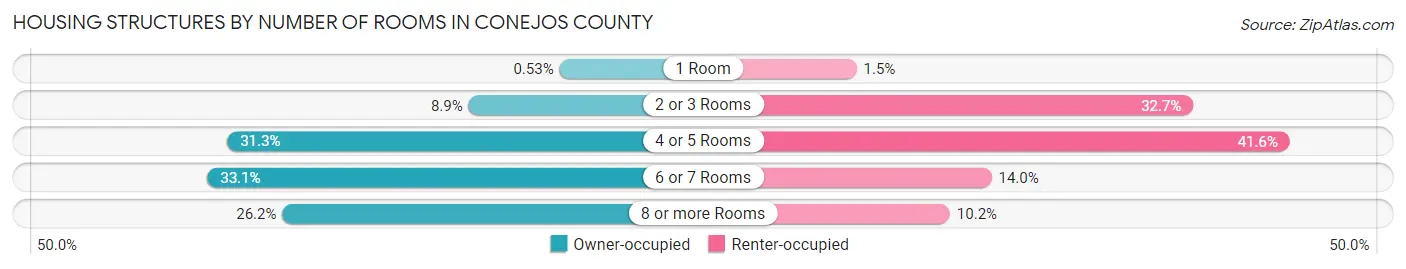
| Number of Rooms | Owner-occupied | Renter-occupied |
| 1 Room | 13 (0.5%) | 10 (1.5%) |
| 2 or 3 Rooms | 218 (8.9%) | 212 (32.7%) |
| 4 or 5 Rooms | 762 (31.3%) | 270 (41.6%) |
| 6 or 7 Rooms | 807 (33.1%) | 91 (14.0%) |
| 8 or more Rooms | 638 (26.2%) | 66 (10.2%) |
| Total | 2,438 (100.0%) | 649 (100.0%) |
Housing Structure by Heating Type in Conejos County
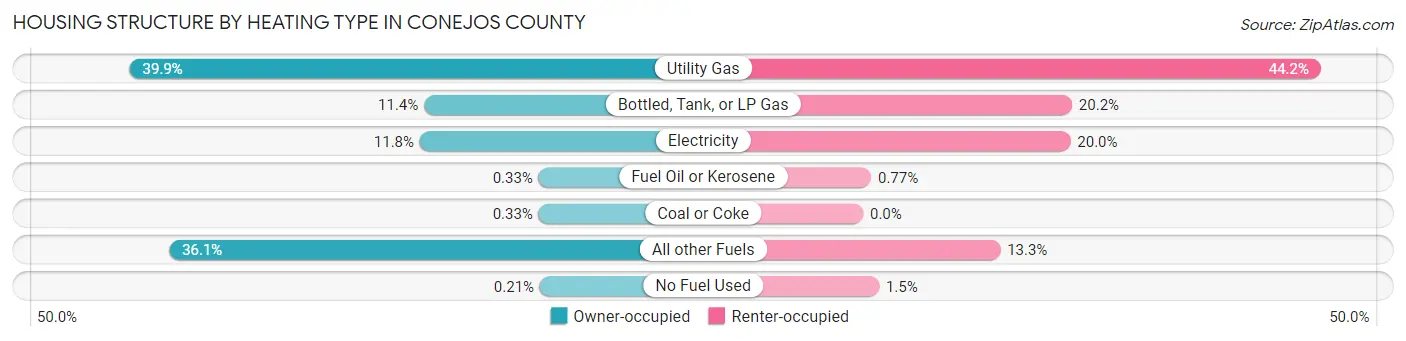
| Heating Type | Owner-occupied | Renter-occupied |
| Utility Gas | 972 (39.9%) | 287 (44.2%) |
| Bottled, Tank, or LP Gas | 278 (11.4%) | 131 (20.2%) |
| Electricity | 288 (11.8%) | 130 (20.0%) |
| Fuel Oil or Kerosene | 8 (0.3%) | 5 (0.8%) |
| Coal or Coke | 8 (0.3%) | 0 (0.0%) |
| All other Fuels | 879 (36.0%) | 86 (13.3%) |
| No Fuel Used | 5 (0.2%) | 10 (1.5%) |
| Total | 2,438 (100.0%) | 649 (100.0%) |
Household Vehicle Usage in Conejos County
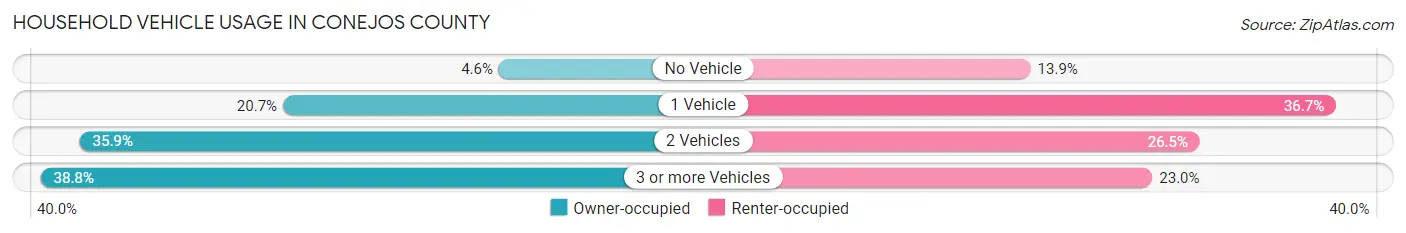
| Vehicles per Household | Owner-occupied | Renter-occupied |
| No Vehicle | 112 (4.6%) | 90 (13.9%) |
| 1 Vehicle | 505 (20.7%) | 238 (36.7%) |
| 2 Vehicles | 875 (35.9%) | 172 (26.5%) |
| 3 or more Vehicles | 946 (38.8%) | 149 (23.0%) |
| Total | 2,438 (100.0%) | 649 (100.0%) |
Real Estate & Mortgages in Conejos County
Real Estate and Mortgage Overview in Conejos County
| Characteristic | Without Mortgage | With Mortgage |
| Housing Units | 1,450 | 988 |
| Median Property Value | $135,200 | $172,800 |
| Median Household Income | $43,075 | $58 |
| Monthly Housing Costs | $339 | $33 |
| Real Estate Taxes | $511 | $0 |
Property Value by Mortgage Status in Conejos County
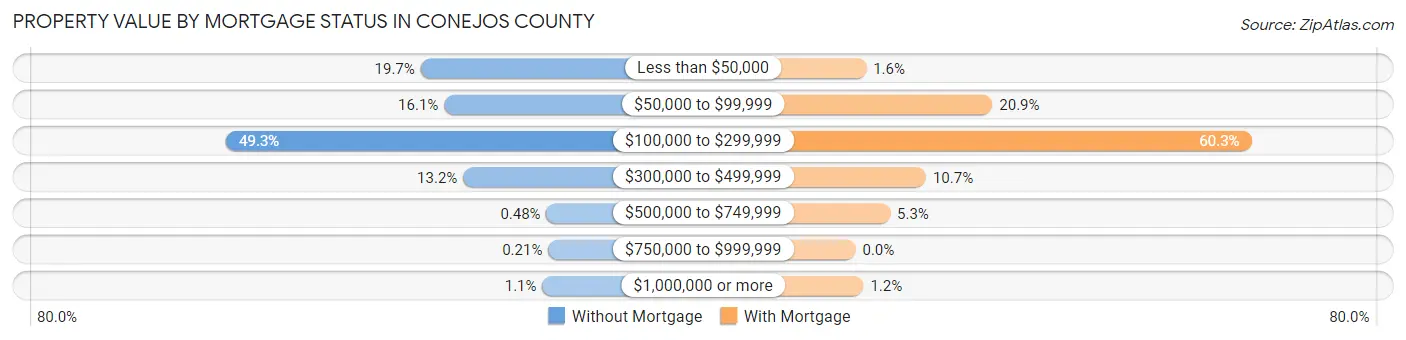
| Property Value | Without Mortgage | With Mortgage |
| Less than $50,000 | 285 (19.7%) | 16 (1.6%) |
| $50,000 to $99,999 | 233 (16.1%) | 206 (20.8%) |
| $100,000 to $299,999 | 715 (49.3%) | 596 (60.3%) |
| $300,000 to $499,999 | 191 (13.2%) | 106 (10.7%) |
| $500,000 to $749,999 | 7 (0.5%) | 52 (5.3%) |
| $750,000 to $999,999 | 3 (0.2%) | 0 (0.0%) |
| $1,000,000 or more | 16 (1.1%) | 12 (1.2%) |
| Total | 1,450 (100.0%) | 988 (100.0%) |
Household Income by Mortgage Status in Conejos County
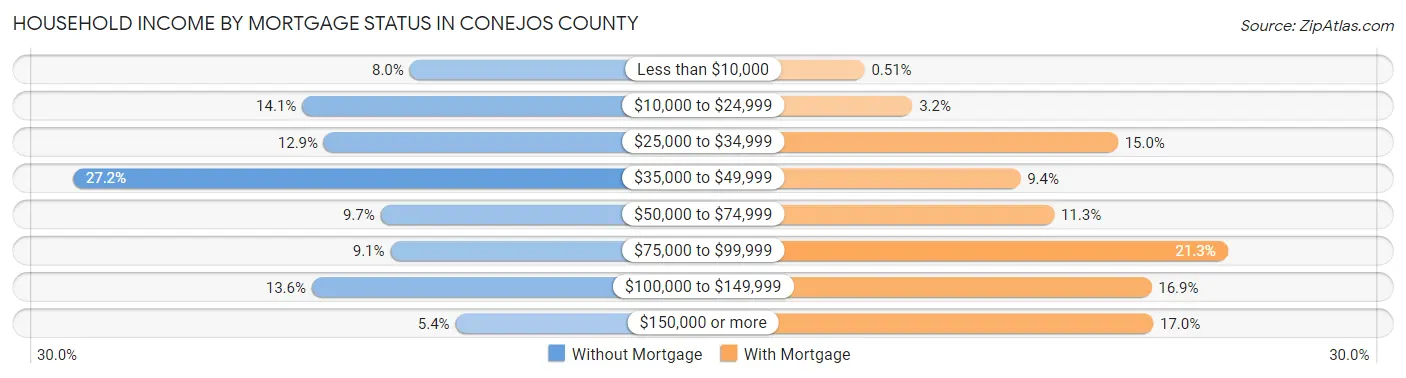
| Household Income | Without Mortgage | With Mortgage |
| Less than $10,000 | 116 (8.0%) | 5 (0.5%) |
| $10,000 to $24,999 | 205 (14.1%) | 32 (3.2%) |
| $25,000 to $34,999 | 187 (12.9%) | 148 (15.0%) |
| $35,000 to $49,999 | 395 (27.2%) | 93 (9.4%) |
| $50,000 to $74,999 | 140 (9.7%) | 112 (11.3%) |
| $75,000 to $99,999 | 132 (9.1%) | 210 (21.3%) |
| $100,000 to $149,999 | 197 (13.6%) | 167 (16.9%) |
| $150,000 or more | 78 (5.4%) | 168 (17.0%) |
| Total | 1,450 (100.0%) | 988 (100.0%) |
Property Value to Household Income Ratio in Conejos County
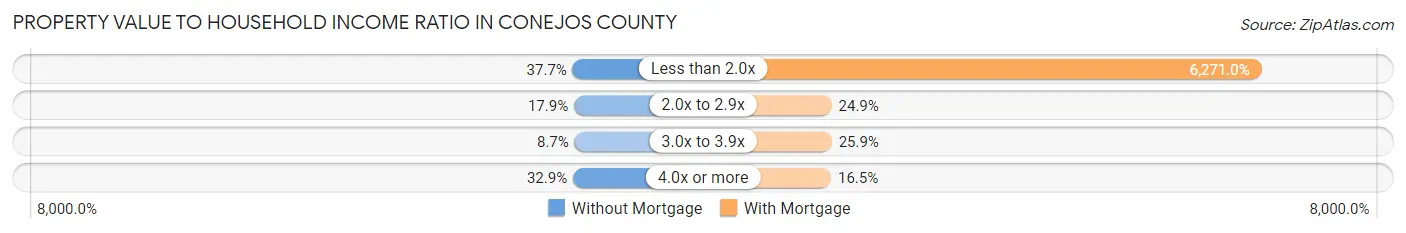
| Value-to-Income Ratio | Without Mortgage | With Mortgage |
| Less than 2.0x | 547 (37.7%) | 61,957 (6,270.9%) |
| 2.0x to 2.9x | 259 (17.9%) | 246 (24.9%) |
| 3.0x to 3.9x | 126 (8.7%) | 256 (25.9%) |
| 4.0x or more | 477 (32.9%) | 163 (16.5%) |
| Total | 1,450 (100.0%) | 988 (100.0%) |
Real Estate Taxes by Mortgage Status in Conejos County
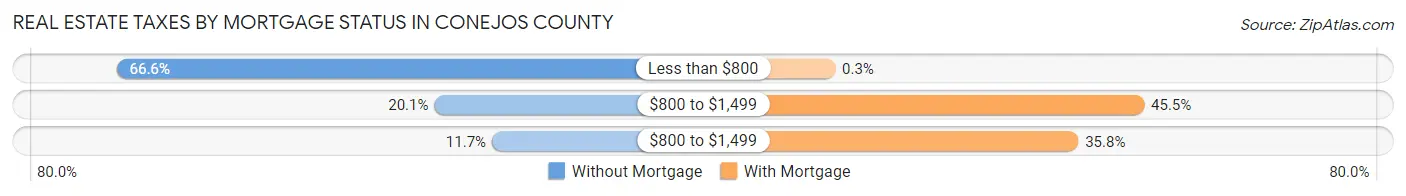
| Property Taxes | Without Mortgage | With Mortgage |
| Less than $800 | 965 (66.5%) | 3 (0.3%) |
| $800 to $1,499 | 292 (20.1%) | 449 (45.5%) |
| $800 to $1,499 | 170 (11.7%) | 354 (35.8%) |
| Total | 1,450 (100.0%) | 988 (100.0%) |
Health & Disability in Conejos County
Health Insurance Coverage by Age in Conejos County
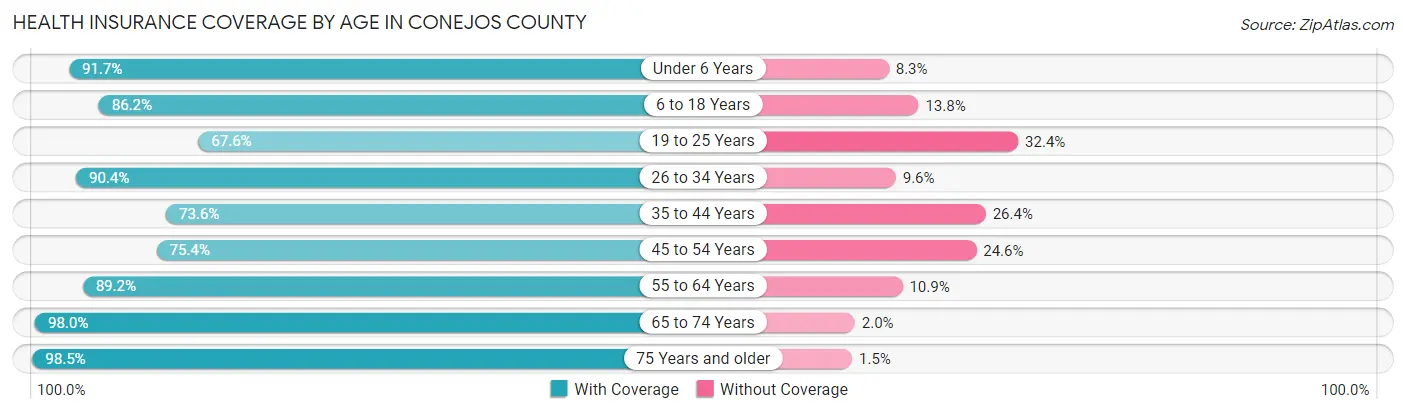
| Age Bracket | With Coverage | Without Coverage |
| Under 6 Years | 531 (91.7%) | 48 (8.3%) |
| 6 to 18 Years | 1,233 (86.2%) | 198 (13.8%) |
| 19 to 25 Years | 421 (67.6%) | 202 (32.4%) |
| 26 to 34 Years | 631 (90.4%) | 67 (9.6%) |
| 35 to 44 Years | 678 (73.6%) | 243 (26.4%) |
| 45 to 54 Years | 579 (75.4%) | 189 (24.6%) |
| 55 to 64 Years | 912 (89.1%) | 111 (10.8%) |
| 65 to 74 Years | 899 (98.0%) | 18 (2.0%) |
| 75 Years and older | 541 (98.5%) | 8 (1.5%) |
| Total | 6,425 (85.6%) | 1,084 (14.4%) |
Health Insurance Coverage by Citizenship Status in Conejos County
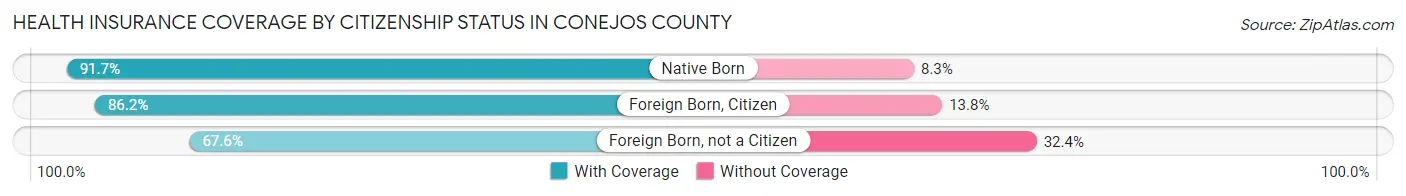
| Citizenship Status | With Coverage | Without Coverage |
| Native Born | 531 (91.7%) | 48 (8.3%) |
| Foreign Born, Citizen | 1,233 (86.2%) | 198 (13.8%) |
| Foreign Born, not a Citizen | 421 (67.6%) | 202 (32.4%) |
Health Insurance Coverage by Household Income in Conejos County
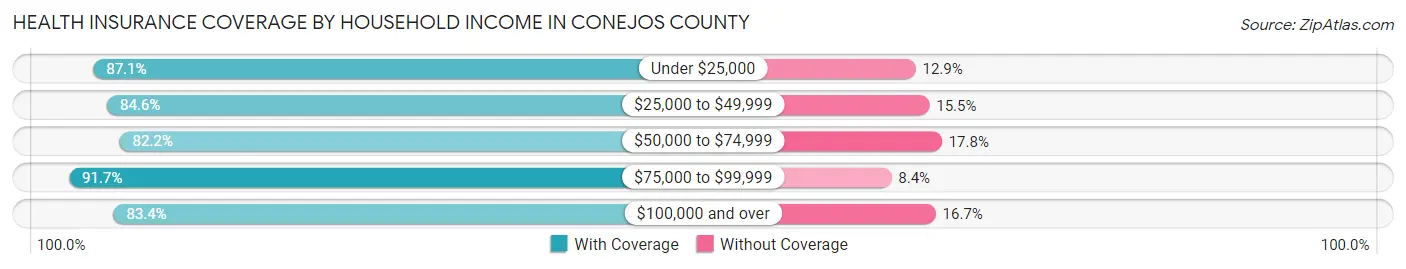
| Household Income | With Coverage | Without Coverage |
| Under $25,000 | 1,103 (87.1%) | 163 (12.9%) |
| $25,000 to $49,999 | 1,581 (84.6%) | 289 (15.4%) |
| $50,000 to $74,999 | 989 (82.2%) | 214 (17.8%) |
| $75,000 to $99,999 | 1,152 (91.6%) | 105 (8.4%) |
| $100,000 and over | 1,562 (83.4%) | 312 (16.7%) |
Public vs Private Health Insurance Coverage by Age in Conejos County
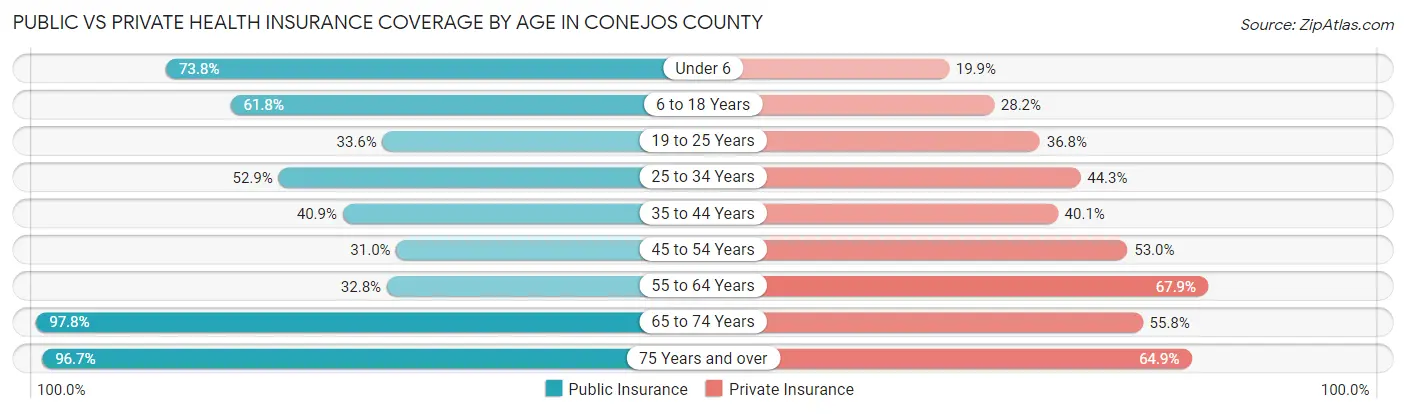
| Age Bracket | Public Insurance | Private Insurance |
| Under 6 | 427 (73.8%) | 115 (19.9%) |
| 6 to 18 Years | 884 (61.8%) | 404 (28.2%) |
| 19 to 25 Years | 209 (33.6%) | 229 (36.8%) |
| 25 to 34 Years | 369 (52.9%) | 309 (44.3%) |
| 35 to 44 Years | 377 (40.9%) | 369 (40.1%) |
| 45 to 54 Years | 238 (31.0%) | 407 (53.0%) |
| 55 to 64 Years | 335 (32.8%) | 695 (67.9%) |
| 65 to 74 Years | 897 (97.8%) | 512 (55.8%) |
| 75 Years and over | 531 (96.7%) | 356 (64.8%) |
| Total | 4,267 (56.8%) | 3,396 (45.2%) |
Disability Status by Sex by Age in Conejos County
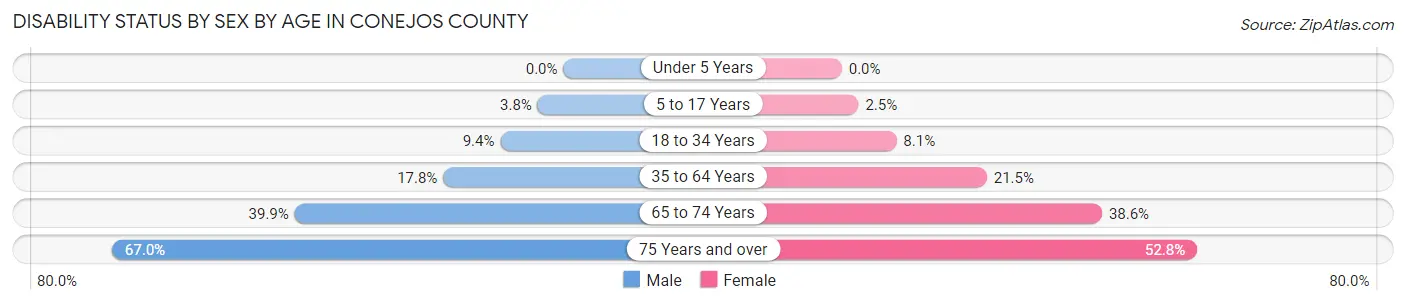
| Age Bracket | Male | Female |
| Under 5 Years | 0 (0.0%) | 0 (0.0%) |
| 5 to 17 Years | 28 (3.8%) | 18 (2.5%) |
| 18 to 34 Years | 64 (9.4%) | 58 (8.1%) |
| 35 to 64 Years | 251 (17.8%) | 281 (21.5%) |
| 65 to 74 Years | 180 (39.9%) | 180 (38.6%) |
| 75 Years and over | 185 (67.0%) | 144 (52.7%) |
Disability Class by Sex by Age in Conejos County
Disability Class: Hearing Difficulty
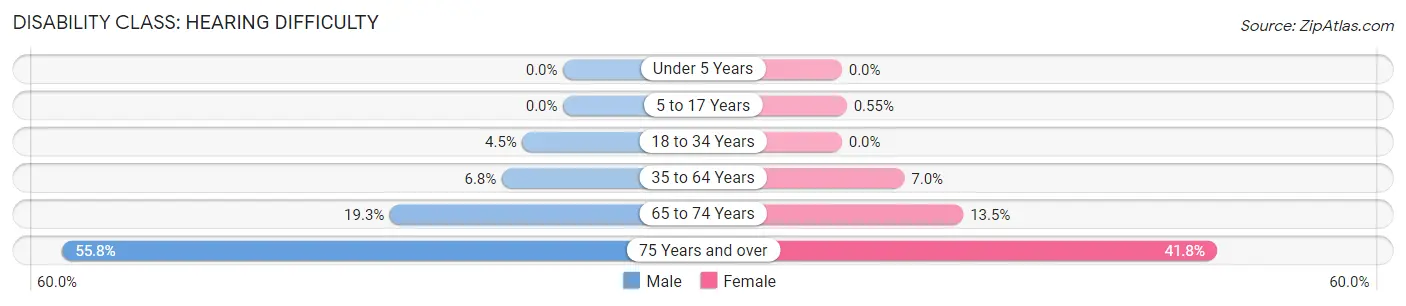
| Age Bracket | Male | Female |
| Under 5 Years | 0 (0.0%) | 0 (0.0%) |
| 5 to 17 Years | 0 (0.0%) | 4 (0.5%) |
| 18 to 34 Years | 31 (4.5%) | 0 (0.0%) |
| 35 to 64 Years | 96 (6.8%) | 91 (7.0%) |
| 65 to 74 Years | 87 (19.3%) | 63 (13.5%) |
| 75 Years and over | 154 (55.8%) | 114 (41.8%) |
Disability Class: Vision Difficulty
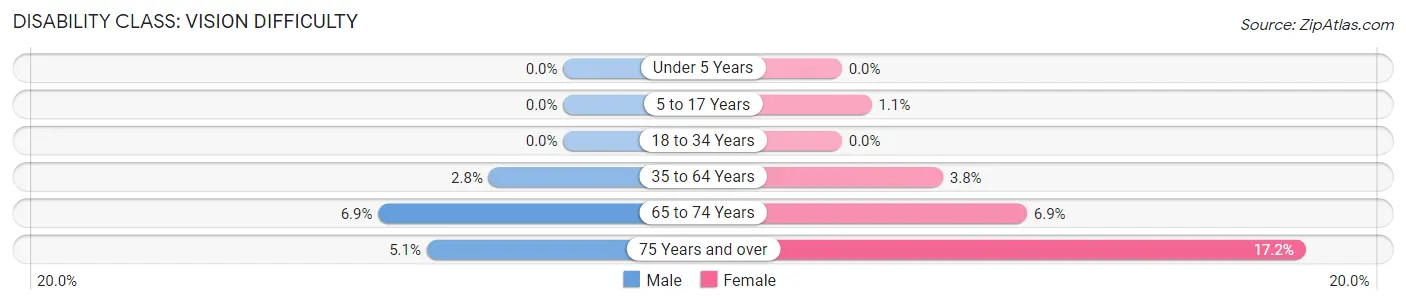
| Age Bracket | Male | Female |
| Under 5 Years | 0 (0.0%) | 0 (0.0%) |
| 5 to 17 Years | 0 (0.0%) | 8 (1.1%) |
| 18 to 34 Years | 0 (0.0%) | 0 (0.0%) |
| 35 to 64 Years | 39 (2.8%) | 49 (3.7%) |
| 65 to 74 Years | 31 (6.9%) | 32 (6.9%) |
| 75 Years and over | 14 (5.1%) | 47 (17.2%) |
Disability Class: Cognitive Difficulty
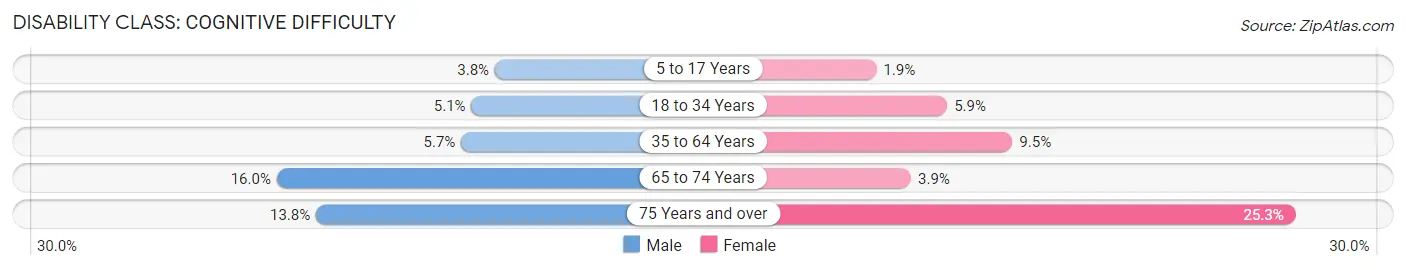
| Age Bracket | Male | Female |
| 5 to 17 Years | 28 (3.8%) | 14 (1.9%) |
| 18 to 34 Years | 35 (5.1%) | 42 (5.9%) |
| 35 to 64 Years | 80 (5.7%) | 124 (9.5%) |
| 65 to 74 Years | 72 (16.0%) | 18 (3.9%) |
| 75 Years and over | 38 (13.8%) | 69 (25.3%) |
Disability Class: Ambulatory Difficulty
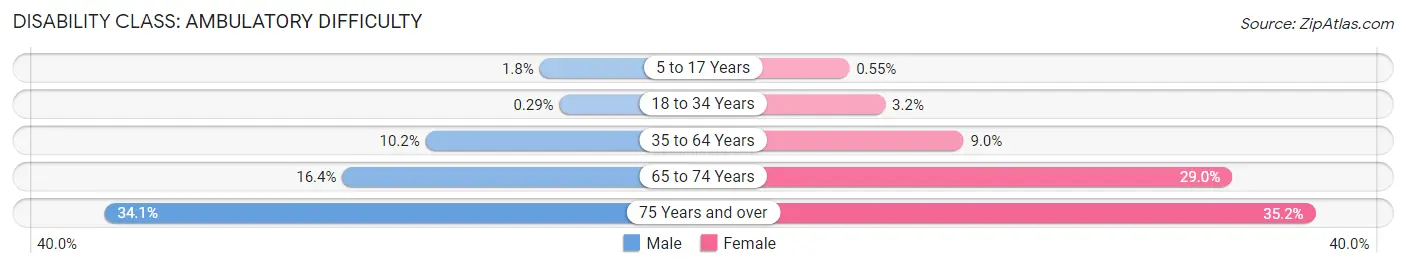
| Age Bracket | Male | Female |
| 5 to 17 Years | 13 (1.8%) | 4 (0.5%) |
| 18 to 34 Years | 2 (0.3%) | 23 (3.2%) |
| 35 to 64 Years | 144 (10.2%) | 118 (9.0%) |
| 65 to 74 Years | 74 (16.4%) | 135 (29.0%) |
| 75 Years and over | 94 (34.1%) | 96 (35.2%) |
Disability Class: Self-Care Difficulty
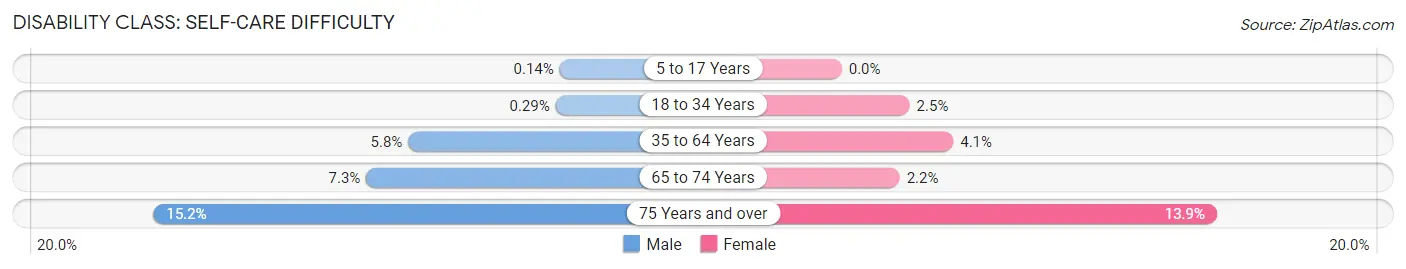
| Age Bracket | Male | Female |
| 5 to 17 Years | 1 (0.1%) | 0 (0.0%) |
| 18 to 34 Years | 2 (0.3%) | 18 (2.5%) |
| 35 to 64 Years | 81 (5.8%) | 54 (4.1%) |
| 65 to 74 Years | 33 (7.3%) | 10 (2.1%) |
| 75 Years and over | 42 (15.2%) | 38 (13.9%) |
Technology Access in Conejos County
Computing Device Access in Conejos County
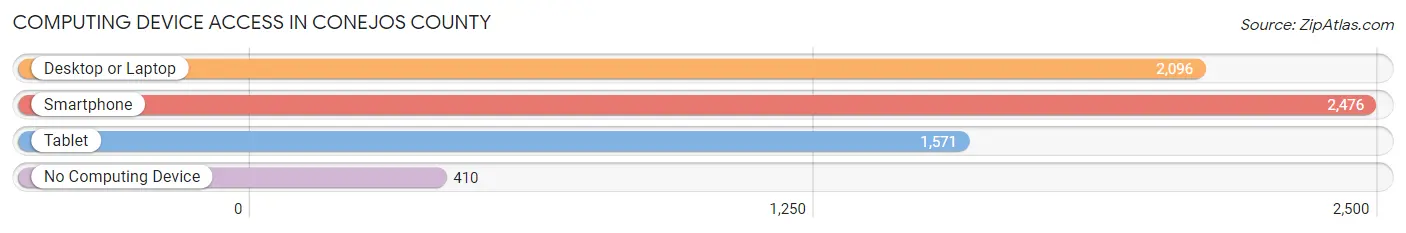
| Device Type | # Households | % Households |
| Desktop or Laptop | 2,096 | 67.9% |
| Smartphone | 2,476 | 80.2% |
| Tablet | 1,571 | 50.9% |
| No Computing Device | 410 | 13.3% |
| Total | 3,087 | 100.0% |
Internet Access in Conejos County
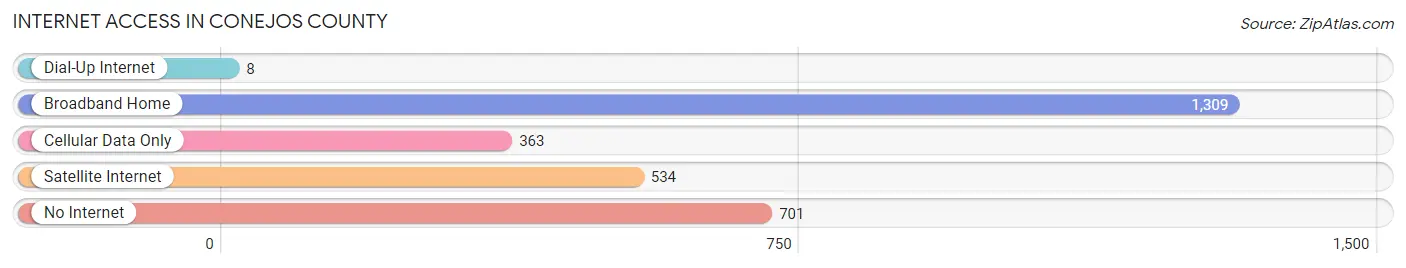
| Internet Type | # Households | % Households |
| Dial-Up Internet | 8 | 0.3% |
| Broadband Home | 1,309 | 42.4% |
| Cellular Data Only | 363 | 11.8% |
| Satellite Internet | 534 | 17.3% |
| No Internet | 701 | 22.7% |
| Total | 3,087 | 100.0% |
Conejos County Summary
Conejos County is located in the San Luis Valley of south-central Colorado. It is bordered by Rio Grande County to the north, Alamosa County to the east, Costilla County to the south, and Archuleta County to the west. The county seat is the town of Conejos, which is located in the center of the county. The county was established in 1861 and is named after the Spanish word for “rabbits”, which were abundant in the area.
Geography
Conejos County covers an area of 1,286 square miles and is located at an elevation of 7,500 feet. The county is located in the San Luis Valley, which is a large intermontane basin located between the Sangre de Cristo Mountains to the east and the San Juan Mountains to the west. The county is mostly flat, with some rolling hills in the northern part of the county. The Rio Grande River flows through the county from north to south, and the Conejos River flows through the county from east to west.
The climate of Conejos County is semi-arid, with hot summers and cold winters. The average annual precipitation is 12.5 inches, with most of the precipitation occurring in the spring and summer months. The average annual temperature is 48°F.
Demographics
As of the 2010 census, there were 8,256 people, 2,845 households, and 2,072 families residing in Conejos County. The population density was 6.4 people per square mile. The racial makeup of the county was 68.3% White, 0.7% African American, 1.2% Native American, 0.3% Asian, 0.1% Pacific Islander, 27.2% from other races, and 2.3% from two or more races. Hispanic or Latino of any race were 64.2% of the population.
The median income for a household in the county was $27,917, and the median income for a family was $31,964. The per capita income for the county was $13,845. About 22.2% of families and 27.2% of the population were below the poverty line, including 36.2% of those under age 18 and 16.2% of those age 65 or over.
Economy
The economy of Conejos County is largely based on agriculture. The county is home to a large number of farms and ranches, which produce a variety of crops, including potatoes, alfalfa, wheat, corn, and hay. Cattle and sheep are also raised in the county.
The county is also home to several small businesses, including restaurants, retail stores, and service providers. The county is also home to a number of tourist attractions, including the Great Sand Dunes National Park and Preserve, the Cumbres & Toltec Scenic Railroad, and the San Luis Valley Museum.
Conclusion
Conejos County is a rural county located in the San Luis Valley of south-central Colorado. The county is home to a variety of agricultural operations, as well as a number of small businesses and tourist attractions. The population of the county is largely Hispanic or Latino, and the median income is lower than the state average. Despite its rural nature, Conejos County is an important part of the Colorado economy.
Common Questions
What is Per Capita Income in Conejos County?
Per Capita income in Conejos County is $25,240.
What is the Median Family Income in Conejos County?
Median Family Income in Conejos County is $62,375.
What is the Median Household income in Conejos County?
Median Household Income in Conejos County is $44,093.
What is Income or Wage Gap in Conejos County?
Income or Wage Gap in Conejos County is 30.6%.
Women in Conejos County earn 69.4 cents for every dollar earned by a man.
What is Family Income Deficit in Conejos County?
Family Income Deficit in Conejos County is $9,777.
Families that are below poverty line in Conejos County earn $9,777 less on average than the poverty threshold level.
What is Inequality or Gini Index in Conejos County?
Inequality or Gini Index in Conejos County is 0.44.
What is the Total Population of Conejos County?
Total Population of Conejos County is 7,553.
What is the Total Male Population of Conejos County?
Total Male Population of Conejos County is 3,827.
What is the Total Female Population of Conejos County?
Total Female Population of Conejos County is 3,726.
What is the Ratio of Males per 100 Females in Conejos County?
There are 102.71 Males per 100 Females in Conejos County.
What is the Ratio of Females per 100 Males in Conejos County?
There are 97.36 Females per 100 Males in Conejos County.
What is the Median Population Age in Conejos County?
Median Population Age in Conejos County is 39.1 Years.
What is the Average Family Size in Conejos County
Average Family Size in Conejos County is 3.3 People.
What is the Average Household Size in Conejos County
Average Household Size in Conejos County is 2.4 People.
How Large is the Labor Force in Conejos County?
There are 3,306 People in the Labor Forcein in Conejos County.
What is the Percentage of People in the Labor Force in Conejos County?
56.5% of People are in the Labor Force in Conejos County.
What is the Unemployment Rate in Conejos County?
Unemployment Rate in Conejos County is 7.2%.