Clear Creek County, CO Map & Demographics
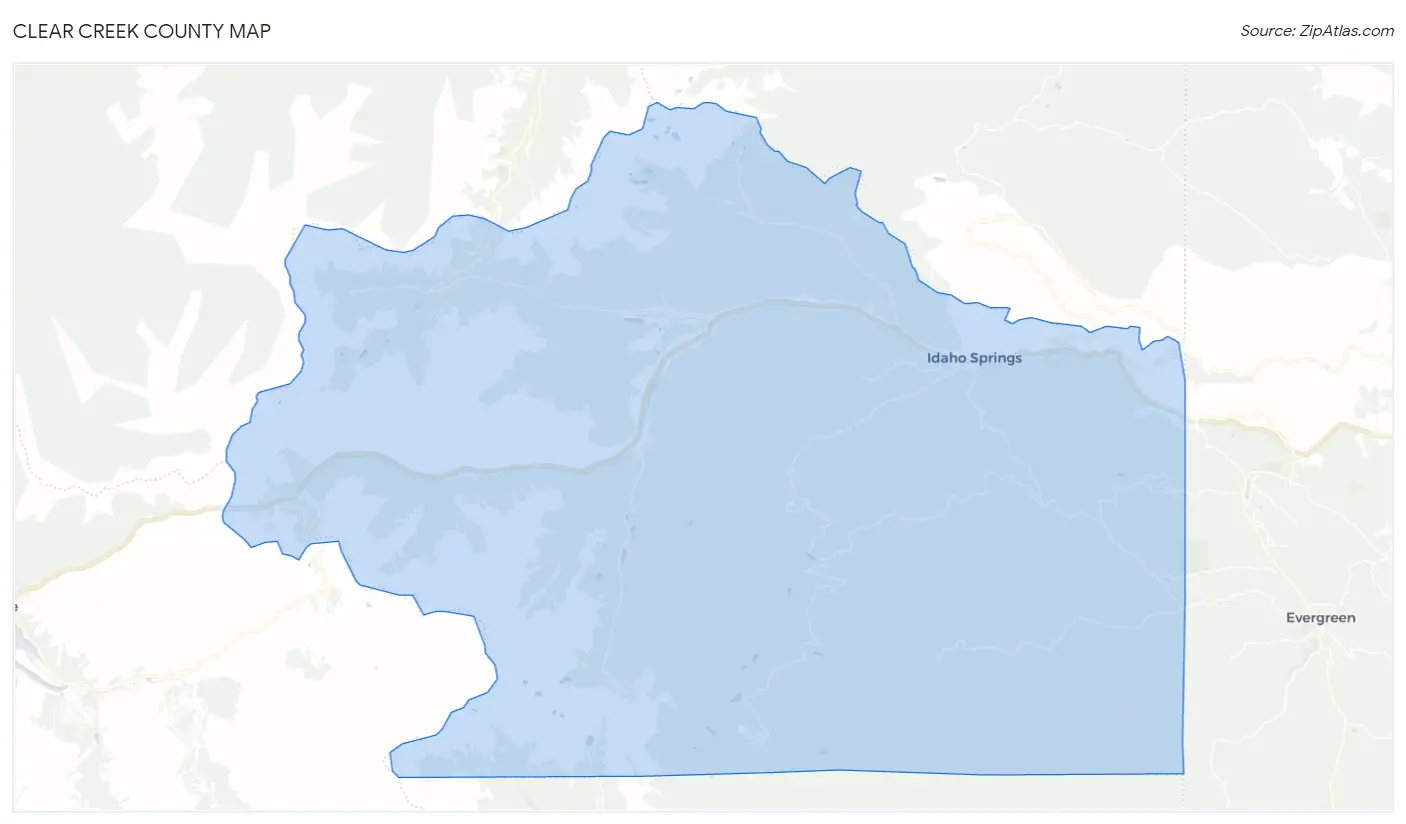
Clear Creek County Map
Clear Creek County Overview
$59,550
PER CAPITA INCOME
$123,354
AVG FAMILY INCOME
$87,169
AVG HOUSEHOLD INCOME
7.2%
WAGE / INCOME GAP [ % ]
92.8¢/ $1
WAGE / INCOME GAP [ $ ]
0.44
INEQUALITY / GINI INDEX
9,403
TOTAL POPULATION
4,773
MALE POPULATION
4,630
FEMALE POPULATION
103.09
MALES / 100 FEMALES
97.00
FEMALES / 100 MALES
49.5
MEDIAN AGE
2.6
AVG FAMILY SIZE
2.0
AVG HOUSEHOLD SIZE
5,879
LABOR FORCE [ PEOPLE ]
69.3%
PERCENT IN LABOR FORCE
4.7%
UNEMPLOYMENT RATE
Income in Clear Creek County
Income Overview in Clear Creek County
Per Capita Income in Clear Creek County is $59,550, while median incomes of families and households are $123,354 and $87,169 respectively.
| Characteristic | Number | Measure |
| Per Capita Income | 9,403 | $59,550 |
| Median Family Income | 2,556 | $123,354 |
| Mean Family Income | 2,556 | $151,701 |
| Median Household Income | 4,589 | $87,169 |
| Mean Household Income | 4,589 | $121,173 |
| Income Deficit | 2,556 | $0 |
| Wage / Income Gap (%) | 9,403 | 7.21% |
| Wage / Income Gap ($) | 9,403 | 92.79¢ per $1 |
| Gini / Inequality Index | 9,403 | 0.44 |
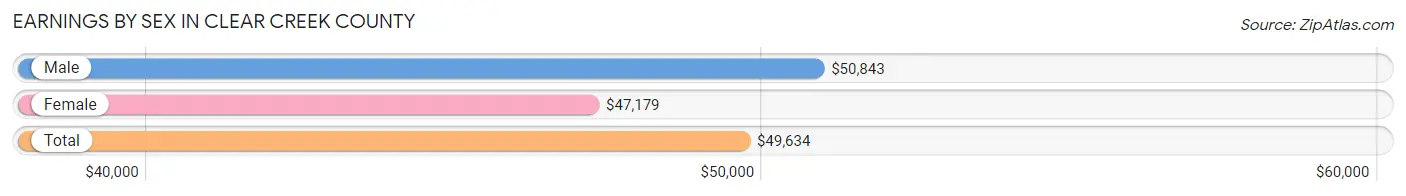
Earnings by Sex in Clear Creek County
Average Earnings in Clear Creek County are $49,634, $50,843 for men and $47,179 for women, a difference of 7.2%.
| Sex | Number | Average Earnings |
| Male | 3,346 (54.1%) | $50,843 |
| Female | 2,840 (45.9%) | $47,179 |
| Total | 6,186 (100.0%) | $49,634 |
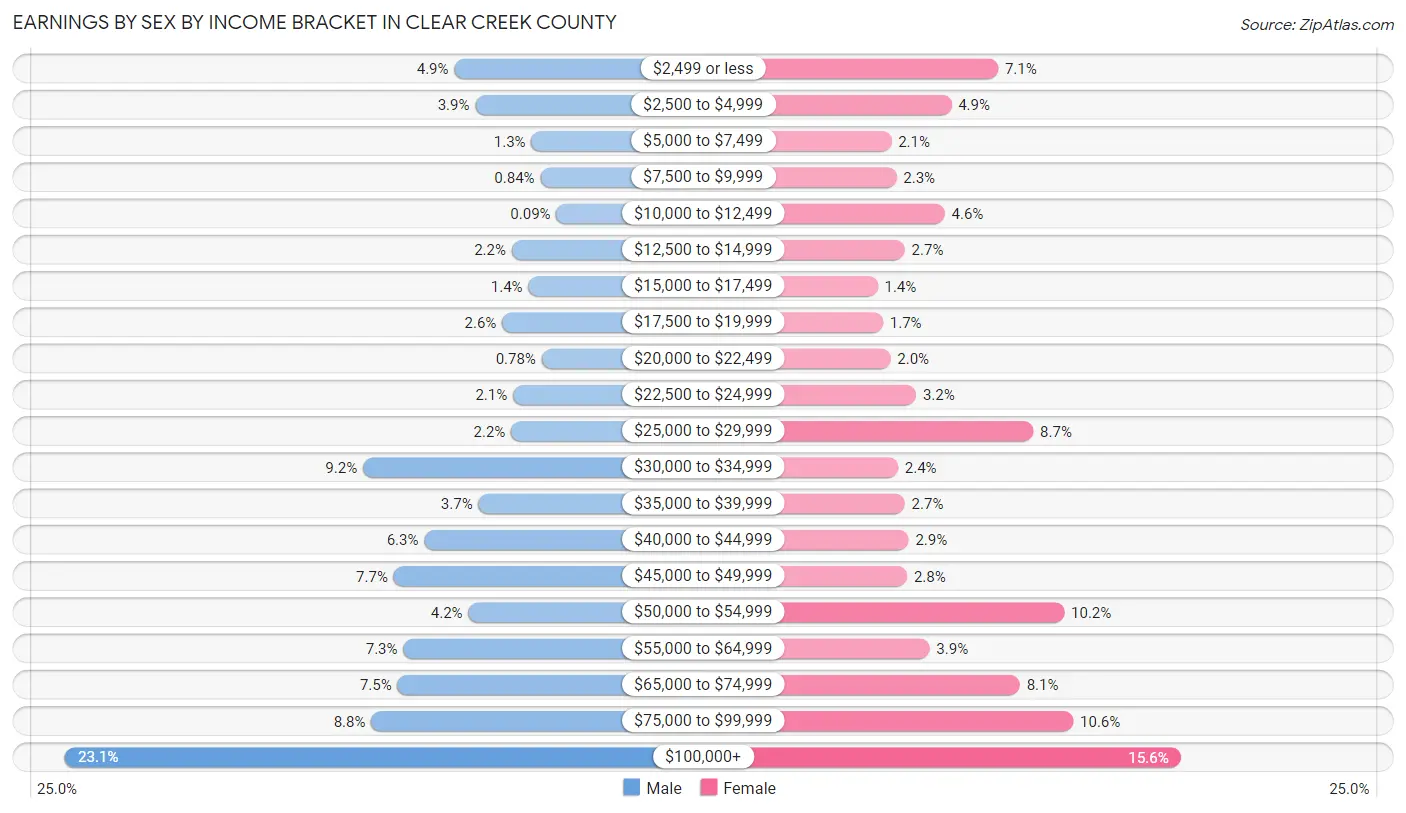
Earnings by Sex by Income Bracket in Clear Creek County
The most common earnings brackets in Clear Creek County are $100,000+ for men (773 | 23.1%) and $100,000+ for women (444 | 15.6%).
| Income | Male | Female |
| $2,499 or less | 163 (4.9%) | 201 (7.1%) |
| $2,500 to $4,999 | 130 (3.9%) | 139 (4.9%) |
| $5,000 to $7,499 | 42 (1.3%) | 59 (2.1%) |
| $7,500 to $9,999 | 28 (0.8%) | 66 (2.3%) |
| $10,000 to $12,499 | 3 (0.1%) | 130 (4.6%) |
| $12,500 to $14,999 | 73 (2.2%) | 77 (2.7%) |
| $15,000 to $17,499 | 47 (1.4%) | 41 (1.4%) |
| $17,500 to $19,999 | 88 (2.6%) | 48 (1.7%) |
| $20,000 to $22,499 | 26 (0.8%) | 58 (2.0%) |
| $22,500 to $24,999 | 71 (2.1%) | 92 (3.2%) |
| $25,000 to $29,999 | 74 (2.2%) | 248 (8.7%) |
| $30,000 to $34,999 | 306 (9.1%) | 68 (2.4%) |
| $35,000 to $39,999 | 125 (3.7%) | 77 (2.7%) |
| $40,000 to $44,999 | 210 (6.3%) | 82 (2.9%) |
| $45,000 to $49,999 | 258 (7.7%) | 80 (2.8%) |
| $50,000 to $54,999 | 141 (4.2%) | 289 (10.2%) |
| $55,000 to $64,999 | 243 (7.3%) | 110 (3.9%) |
| $65,000 to $74,999 | 252 (7.5%) | 230 (8.1%) |
| $75,000 to $99,999 | 293 (8.8%) | 301 (10.6%) |
| $100,000+ | 773 (23.1%) | 444 (15.6%) |
| Total | 3,346 (100.0%) | 2,840 (100.0%) |
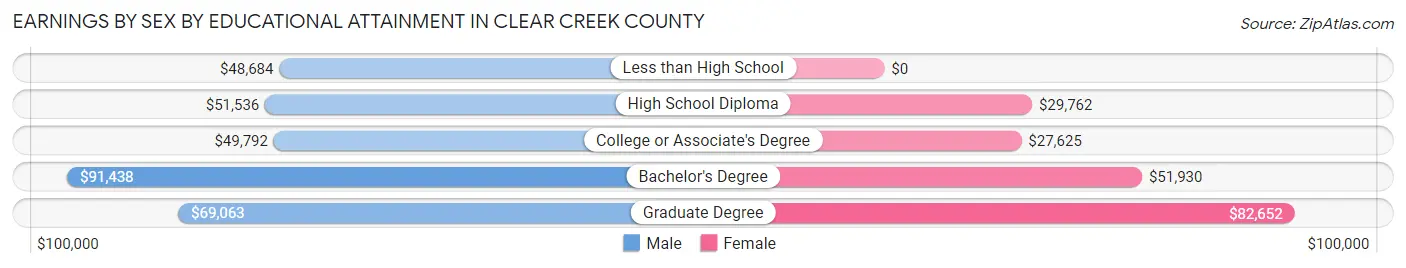
Earnings by Sex by Educational Attainment in Clear Creek County
Average earnings in Clear Creek County are $57,547 for men and $50,875 for women, a difference of 11.6%. Men with an educational attainment of bachelor's degree enjoy the highest average annual earnings of $91,438, while those with less than high school education earn the least with $48,684. Women with an educational attainment of graduate degree earn the most with the average annual earnings of $82,652, while those with college or associate's degree education have the smallest earnings of $27,625.
| Educational Attainment | Male Income | Female Income |
| Less than High School | $48,684 | $0 |
| High School Diploma | $51,536 | $29,762 |
| College or Associate's Degree | $49,792 | $27,625 |
| Bachelor's Degree | $91,438 | $51,930 |
| Graduate Degree | $69,063 | $82,652 |
| Total | $57,547 | $50,875 |
Family Income in Clear Creek County
Family Income Brackets in Clear Creek County
According to the Clear Creek County family income data, there are 680 families falling into the $200,000+ income range, which is the most common income bracket and makes up 26.6% of all families. Conversely, the less than $10,000 income bracket is the least frequent group with only 13 families (0.5%) belonging to this category.

| Income Bracket | # Families | % Families |
| Less than $10,000 | 13 | 0.5% |
| $10,000 to $14,999 | 36 | 1.4% |
| $15,000 to $24,999 | 46 | 1.8% |
| $25,000 to $34,999 | 115 | 4.5% |
| $35,000 to $49,999 | 240 | 9.4% |
| $50,000 to $74,999 | 309 | 12.1% |
| $75,000 to $99,999 | 225 | 8.8% |
| $100,000 to $149,999 | 616 | 24.1% |
| $150,000 to $199,999 | 273 | 10.7% |
| $200,000+ | 680 | 26.6% |
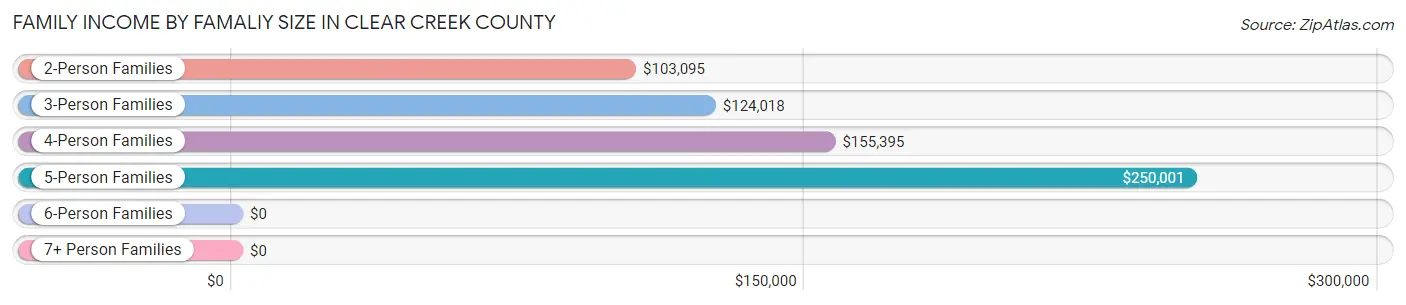
Family Income by Famaliy Size in Clear Creek County
5-person families (89 | 3.5%) account for the highest median family income in Clear Creek County with $250,001 per family, while 2-person families (1,498 | 58.6%) have the highest median income of $51,548 per family member.
| Income Bracket | # Families | Median Income |
| 2-Person Families | 1,498 (58.6%) | $103,095 |
| 3-Person Families | 554 (21.7%) | $124,018 |
| 4-Person Families | 386 (15.1%) | $155,395 |
| 5-Person Families | 89 (3.5%) | $250,001 |
| 6-Person Families | 29 (1.1%) | $0 |
| 7+ Person Families | 0 (0.0%) | $0 |
| Total | 2,556 (100.0%) | $123,354 |
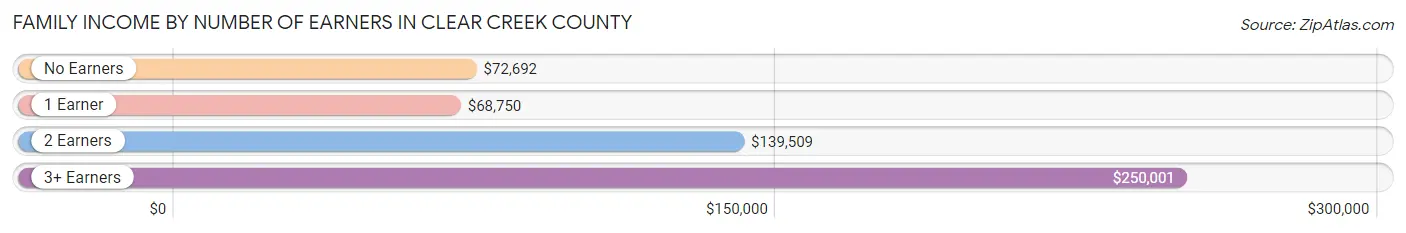
Family Income by Number of Earners in Clear Creek County
The median family income in Clear Creek County is $123,354, with families comprising 3+ earners (195) having the highest median family income of $250,001, while families with 1 earner (678) have the lowest median family income of $68,750, accounting for 7.6% and 26.5% of families, respectively.
| Number of Earners | # Families | Median Income |
| No Earners | 358 (14.0%) | $72,692 |
| 1 Earner | 678 (26.5%) | $68,750 |
| 2 Earners | 1,325 (51.8%) | $139,509 |
| 3+ Earners | 195 (7.6%) | $250,001 |
| Total | 2,556 (100.0%) | $123,354 |
Household Income in Clear Creek County
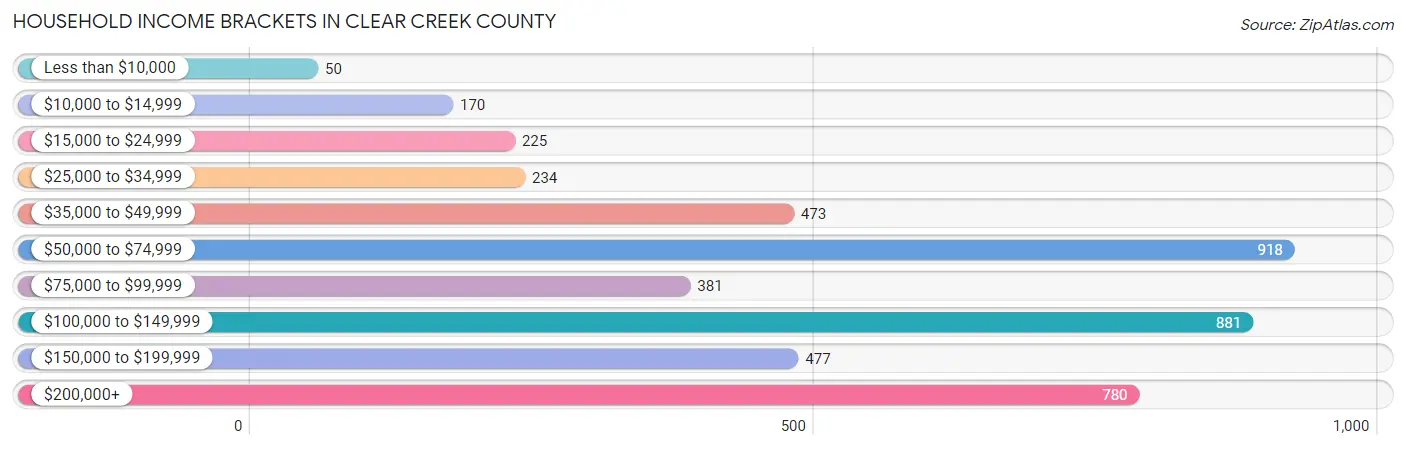
Household Income Brackets in Clear Creek County
With 918 households falling in the category, the $50,000 to $74,999 income range is the most frequent in Clear Creek County, accounting for 20.0% of all households. In contrast, only 50 households (1.1%) fall into the less than $10,000 income bracket, making it the least populous group.
| Income Bracket | # Households | % Households |
| Less than $10,000 | 50 | 1.1% |
| $10,000 to $14,999 | 170 | 3.7% |
| $15,000 to $24,999 | 225 | 4.9% |
| $25,000 to $34,999 | 234 | 5.1% |
| $35,000 to $49,999 | 473 | 10.3% |
| $50,000 to $74,999 | 918 | 20.0% |
| $75,000 to $99,999 | 381 | 8.3% |
| $100,000 to $149,999 | 881 | 19.2% |
| $150,000 to $199,999 | 477 | 10.4% |
| $200,000+ | 780 | 17.0% |
Household Income by Householder Age in Clear Creek County
The median household income in Clear Creek County is $87,169, with the highest median household income of $124,911 found in the 45 to 64 years age bracket for the primary householder. A total of 1,849 households (40.3%) fall into this category. Meanwhile, the 15 to 24 years age bracket for the primary householder has the lowest median household income of $59,755, with 120 households (2.6%) in this group.

| Income Bracket | # Households | Median Income |
| 15 to 24 Years | 120 (2.6%) | $59,755 |
| 25 to 44 Years | 1,248 (27.2%) | $90,735 |
| 45 to 64 Years | 1,849 (40.3%) | $124,911 |
| 65+ Years | 1,372 (29.9%) | $62,065 |
| Total | 4,589 (100.0%) | $87,169 |
Poverty in Clear Creek County
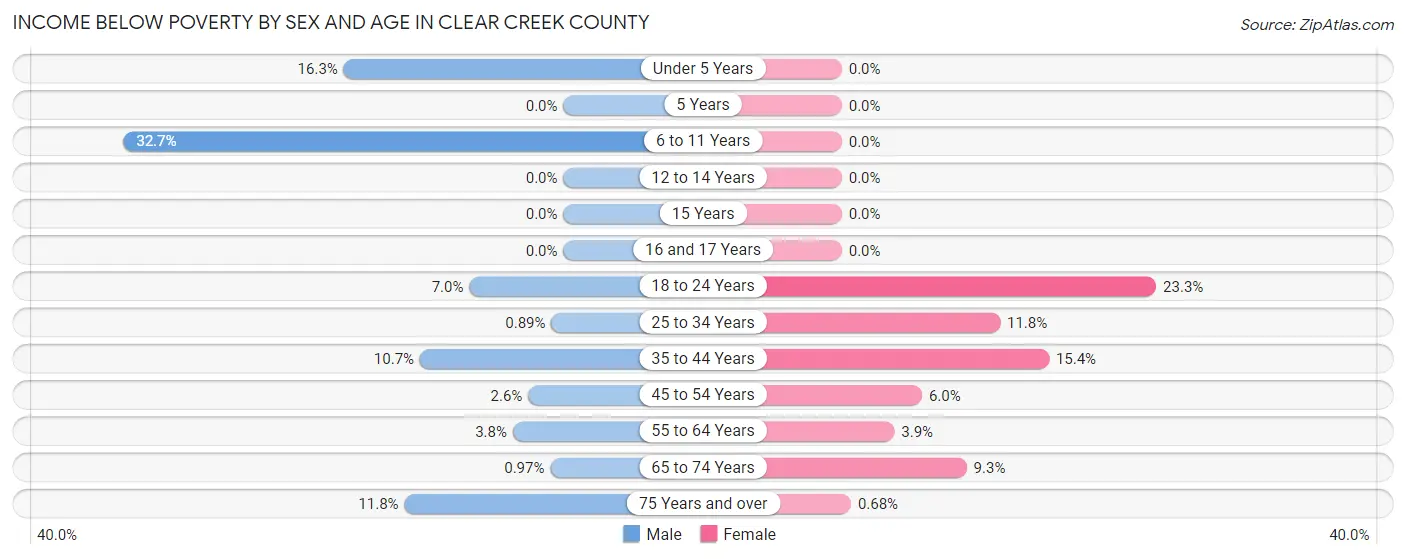
Income Below Poverty by Sex and Age in Clear Creek County
With 5.2% poverty level for males and 8.1% for females among the residents of Clear Creek County, 6 to 11 year old males and 18 to 24 year old females are the most vulnerable to poverty, with 33 males (32.7%) and 74 females (23.3%) in their respective age groups living below the poverty level.
| Age Bracket | Male | Female |
| Under 5 Years | 23 (16.3%) | 0 (0.0%) |
| 5 Years | 0 (0.0%) | 0 (0.0%) |
| 6 to 11 Years | 33 (32.7%) | 0 (0.0%) |
| 12 to 14 Years | 0 (0.0%) | 0 (0.0%) |
| 15 Years | 0 (0.0%) | 0 (0.0%) |
| 16 and 17 Years | 0 (0.0%) | 0 (0.0%) |
| 18 to 24 Years | 22 (7.0%) | 74 (23.3%) |
| 25 to 34 Years | 5 (0.9%) | 55 (11.7%) |
| 35 to 44 Years | 70 (10.6%) | 94 (15.4%) |
| 45 to 54 Years | 18 (2.6%) | 48 (5.9%) |
| 55 to 64 Years | 32 (3.7%) | 37 (3.9%) |
| 65 to 74 Years | 7 (1.0%) | 61 (9.3%) |
| 75 Years and over | 36 (11.8%) | 2 (0.7%) |
| Total | 246 (5.2%) | 371 (8.1%) |
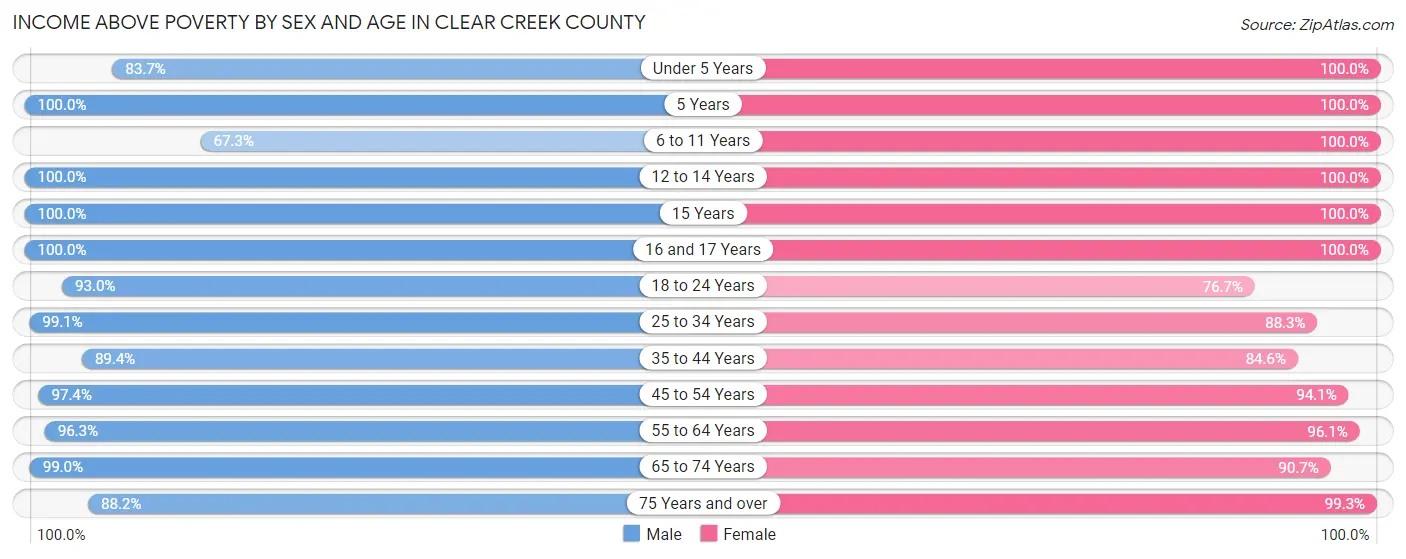
Income Above Poverty by Sex and Age in Clear Creek County
According to the poverty statistics in Clear Creek County, males aged 5 years and females aged under 5 years are the age groups that are most secure financially, with 100.0% of males and 100.0% of females in these age groups living above the poverty line.
| Age Bracket | Male | Female |
| Under 5 Years | 118 (83.7%) | 130 (100.0%) |
| 5 Years | 15 (100.0%) | 5 (100.0%) |
| 6 to 11 Years | 68 (67.3%) | 193 (100.0%) |
| 12 to 14 Years | 210 (100.0%) | 79 (100.0%) |
| 15 Years | 11 (100.0%) | 33 (100.0%) |
| 16 and 17 Years | 123 (100.0%) | 65 (100.0%) |
| 18 to 24 Years | 293 (93.0%) | 243 (76.7%) |
| 25 to 34 Years | 557 (99.1%) | 413 (88.2%) |
| 35 to 44 Years | 587 (89.3%) | 517 (84.6%) |
| 45 to 54 Years | 672 (97.4%) | 759 (94.1%) |
| 55 to 64 Years | 821 (96.3%) | 911 (96.1%) |
| 65 to 74 Years | 716 (99.0%) | 597 (90.7%) |
| 75 Years and over | 269 (88.2%) | 293 (99.3%) |
| Total | 4,460 (94.8%) | 4,238 (91.9%) |
Income Below Poverty Among Married-Couple Families in Clear Creek County
The poverty statistics for married-couple families in Clear Creek County show that 1.4% or 29 of the total 2,087 families live below the poverty line. Families with no children have the highest poverty rate of 2.1%, comprising of 29 families. On the other hand, families with 1 or 2 children have the lowest poverty rate of 0.0%, which includes 0 families.

| Children | Above Poverty | Below Poverty |
| No Children | 1,343 (97.9%) | 29 (2.1%) |
| 1 or 2 Children | 689 (100.0%) | 0 (0.0%) |
| 3 or 4 Children | 26 (100.0%) | 0 (0.0%) |
| 5 or more Children | 0 (0.0%) | 0 (0.0%) |
| Total | 2,058 (98.6%) | 29 (1.4%) |
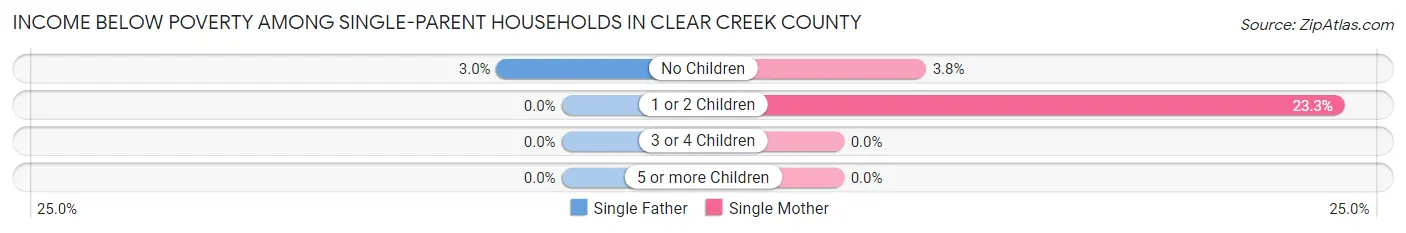
Income Below Poverty Among Single-Parent Households in Clear Creek County
According to the poverty data in Clear Creek County, 1.8% or 4 single-father households and 13.2% or 33 single-mother households are living below the poverty line. Among single-father households, those with no children have the highest poverty rate, with 4 households (3.0%) experiencing poverty. Likewise, among single-mother households, those with 1 or 2 children have the highest poverty rate, with 28 households (23.3%) falling below the poverty line.
| Children | Single Father | Single Mother |
| No Children | 4 (3.0%) | 5 (3.8%) |
| 1 or 2 Children | 0 (0.0%) | 28 (23.3%) |
| 3 or 4 Children | 0 (0.0%) | 0 (0.0%) |
| 5 or more Children | 0 (0.0%) | 0 (0.0%) |
| Total | 4 (1.8%) | 33 (13.2%) |
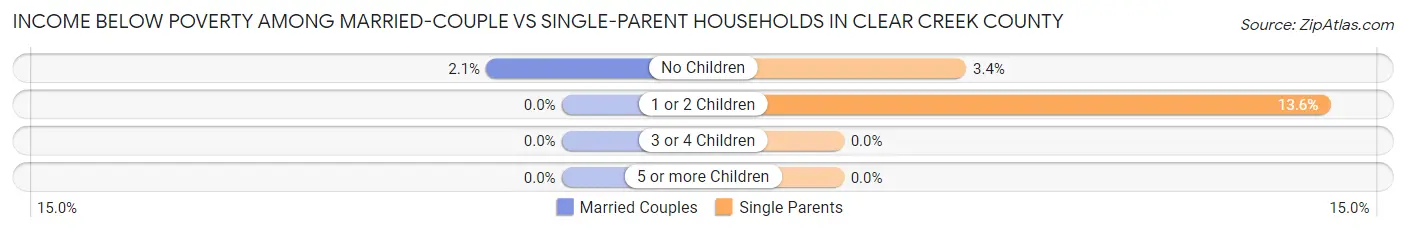
Income Below Poverty Among Married-Couple vs Single-Parent Households in Clear Creek County
The poverty data for Clear Creek County shows that 29 of the married-couple family households (1.4%) and 37 of the single-parent households (7.9%) are living below the poverty level. Within the married-couple family households, those with no children have the highest poverty rate, with 29 households (2.1%) falling below the poverty line. Among the single-parent households, those with 1 or 2 children have the highest poverty rate, with 28 household (13.6%) living below poverty.
| Children | Married-Couple Families | Single-Parent Households |
| No Children | 29 (2.1%) | 9 (3.4%) |
| 1 or 2 Children | 0 (0.0%) | 28 (13.6%) |
| 3 or 4 Children | 0 (0.0%) | 0 (0.0%) |
| 5 or more Children | 0 (0.0%) | 0 (0.0%) |
| Total | 29 (1.4%) | 37 (7.9%) |
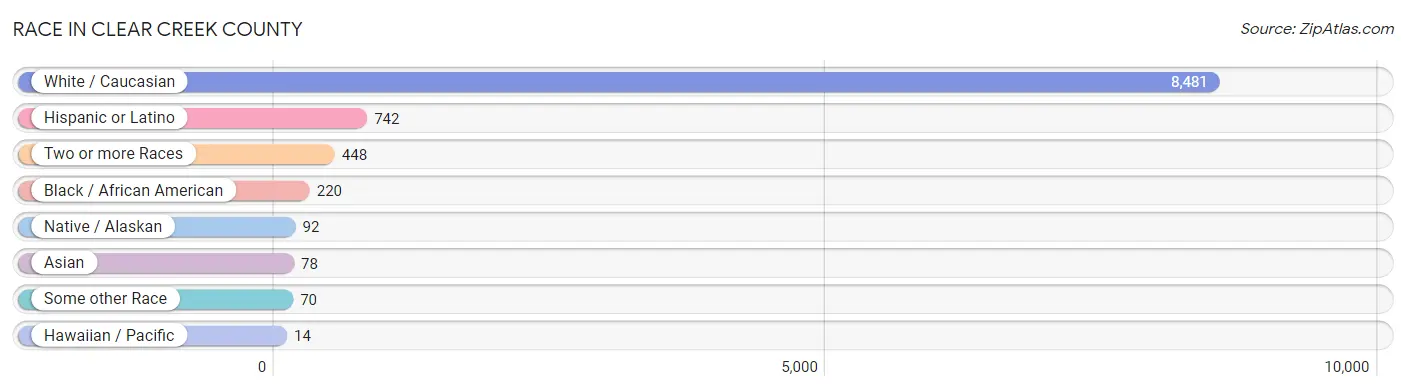
Race in Clear Creek County
The most populous races in Clear Creek County are White / Caucasian (8,481 | 90.2%), Hispanic or Latino (742 | 7.9%), and Two or more Races (448 | 4.8%).
| Race | # Population | % Population |
| Asian | 78 | 0.8% |
| Black / African American | 220 | 2.3% |
| Hawaiian / Pacific | 14 | 0.2% |
| Hispanic or Latino | 742 | 7.9% |
| Native / Alaskan | 92 | 1.0% |
| White / Caucasian | 8,481 | 90.2% |
| Two or more Races | 448 | 4.8% |
| Some other Race | 70 | 0.7% |
| Total | 9,403 | 100.0% |
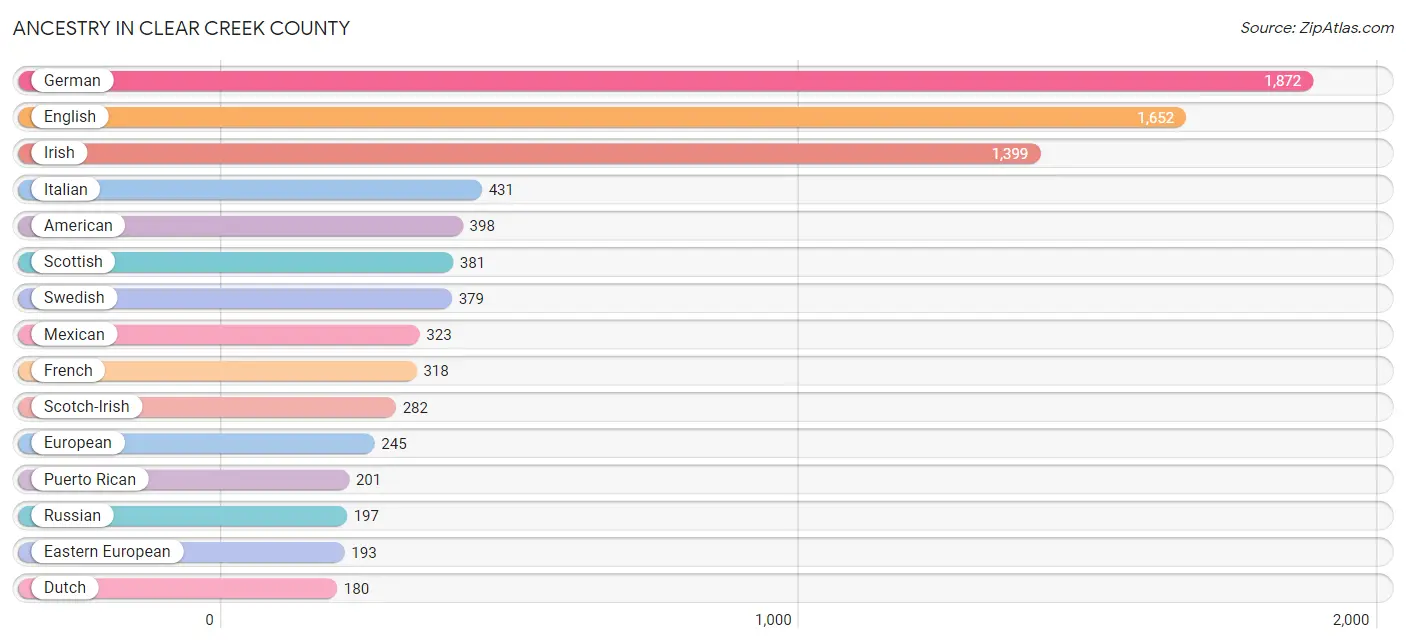
Ancestry in Clear Creek County
The most populous ancestries reported in Clear Creek County are German (1,872 | 19.9%), English (1,652 | 17.6%), Irish (1,399 | 14.9%), Italian (431 | 4.6%), and American (398 | 4.2%), together accounting for 61.2% of all Clear Creek County residents.
| Ancestry | # Population | % Population |
| African | 47 | 0.5% |
| American | 398 | 4.2% |
| Apache | 4 | 0.0% |
| Arab | 20 | 0.2% |
| Argentinean | 10 | 0.1% |
| Austrian | 146 | 1.5% |
| Belgian | 53 | 0.6% |
| Blackfeet | 1 | 0.0% |
| British | 121 | 1.3% |
| Burmese | 58 | 0.6% |
| Cherokee | 9 | 0.1% |
| Cheyenne | 9 | 0.1% |
| Chippewa | 10 | 0.1% |
| Creek | 12 | 0.1% |
| Croatian | 18 | 0.2% |
| Cuban | 1 | 0.0% |
| Czech | 47 | 0.5% |
| Czechoslovakian | 24 | 0.3% |
| Danish | 125 | 1.3% |
| Dominican | 2 | 0.0% |
| Dutch | 180 | 1.9% |
| Eastern European | 193 | 2.1% |
| English | 1,652 | 17.6% |
| Ethiopian | 48 | 0.5% |
| European | 245 | 2.6% |
| Finnish | 72 | 0.8% |
| French | 318 | 3.4% |
| French Canadian | 48 | 0.5% |
| German | 1,872 | 19.9% |
| Greek | 2 | 0.0% |
| Hungarian | 24 | 0.3% |
| Icelander | 15 | 0.2% |
| Indian (Asian) | 18 | 0.2% |
| Irish | 1,399 | 14.9% |
| Italian | 431 | 4.6% |
| Korean | 3 | 0.0% |
| Lebanese | 4 | 0.0% |
| Lithuanian | 24 | 0.3% |
| Mexican | 323 | 3.4% |
| Mexican American Indian | 39 | 0.4% |
| Native Hawaiian | 14 | 0.2% |
| Nigerian | 9 | 0.1% |
| Northern European | 35 | 0.4% |
| Norwegian | 111 | 1.2% |
| Pakistani | 25 | 0.3% |
| Peruvian | 53 | 0.6% |
| Polish | 128 | 1.4% |
| Portuguese | 58 | 0.6% |
| Puerto Rican | 201 | 2.1% |
| Romanian | 14 | 0.2% |
| Russian | 197 | 2.1% |
| Scandinavian | 28 | 0.3% |
| Scotch-Irish | 282 | 3.0% |
| Scottish | 381 | 4.1% |
| Sioux | 26 | 0.3% |
| Slovak | 7 | 0.1% |
| Slovene | 51 | 0.5% |
| South American | 65 | 0.7% |
| Spaniard | 138 | 1.5% |
| Spanish | 12 | 0.1% |
| Sri Lankan | 2 | 0.0% |
| Subsaharan African | 104 | 1.1% |
| Swedish | 379 | 4.0% |
| Swiss | 44 | 0.5% |
| Turkish | 16 | 0.2% |
| Ute | 3 | 0.0% |
| Venezuelan | 2 | 0.0% |
| Welsh | 54 | 0.6% |
| West Indian | 15 | 0.2% |
| Yaqui | 3 | 0.0% |
| Yugoslavian | 10 | 0.1% | View All 71 Rows |
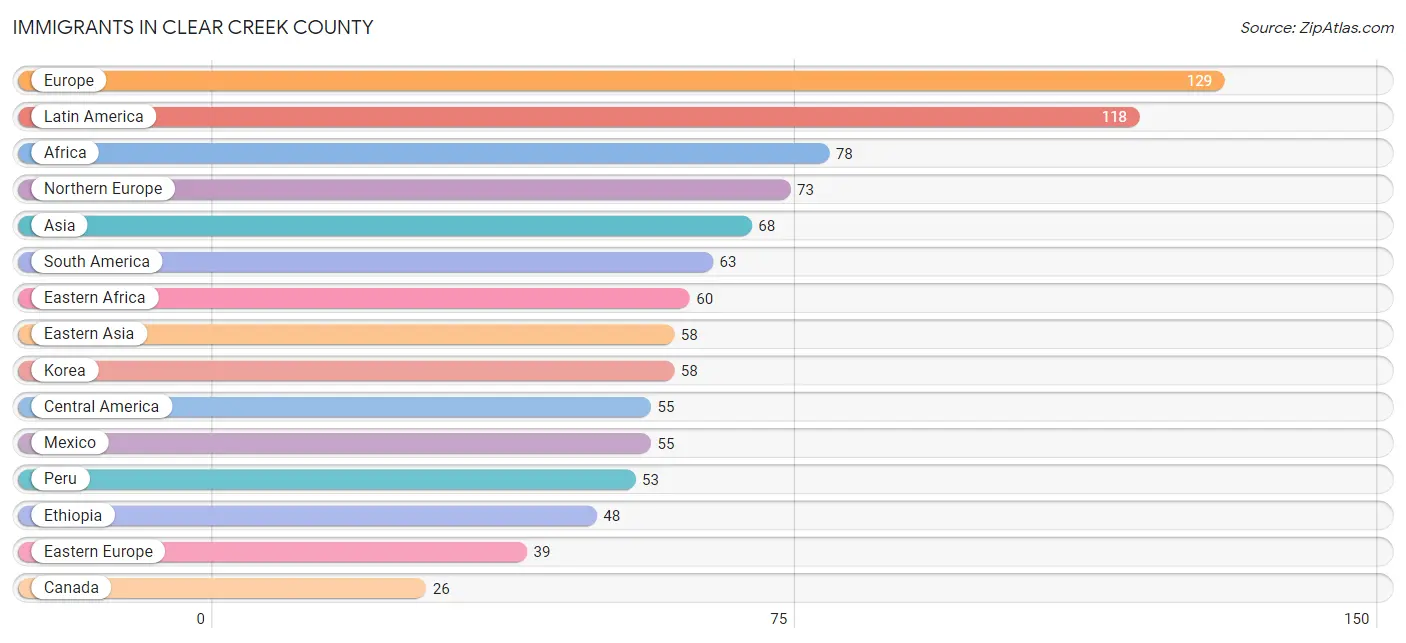
Immigrants in Clear Creek County
The most numerous immigrant groups reported in Clear Creek County came from Europe (129 | 1.4%), Latin America (118 | 1.3%), Africa (78 | 0.8%), Northern Europe (73 | 0.8%), and Asia (68 | 0.7%), together accounting for 5.0% of all Clear Creek County residents.
| Immigration Origin | # Population | % Population |
| Africa | 78 | 0.8% |
| Argentina | 10 | 0.1% |
| Asia | 68 | 0.7% |
| Canada | 26 | 0.3% |
| Central America | 55 | 0.6% |
| Eastern Africa | 60 | 0.6% |
| Eastern Asia | 58 | 0.6% |
| Eastern Europe | 39 | 0.4% |
| England | 25 | 0.3% |
| Ethiopia | 48 | 0.5% |
| Europe | 129 | 1.4% |
| France | 10 | 0.1% |
| Italy | 2 | 0.0% |
| Korea | 58 | 0.6% |
| Latin America | 118 | 1.3% |
| Mexico | 55 | 0.6% |
| Nigeria | 18 | 0.2% |
| Northern Europe | 73 | 0.8% |
| Peru | 53 | 0.6% |
| South America | 63 | 0.7% |
| Southern Europe | 7 | 0.1% |
| Spain | 5 | 0.1% |
| Ukraine | 15 | 0.2% |
| Western Africa | 18 | 0.2% |
| Western Asia | 10 | 0.1% |
| Western Europe | 10 | 0.1% |
| Zimbabwe | 12 | 0.1% | View All 27 Rows |
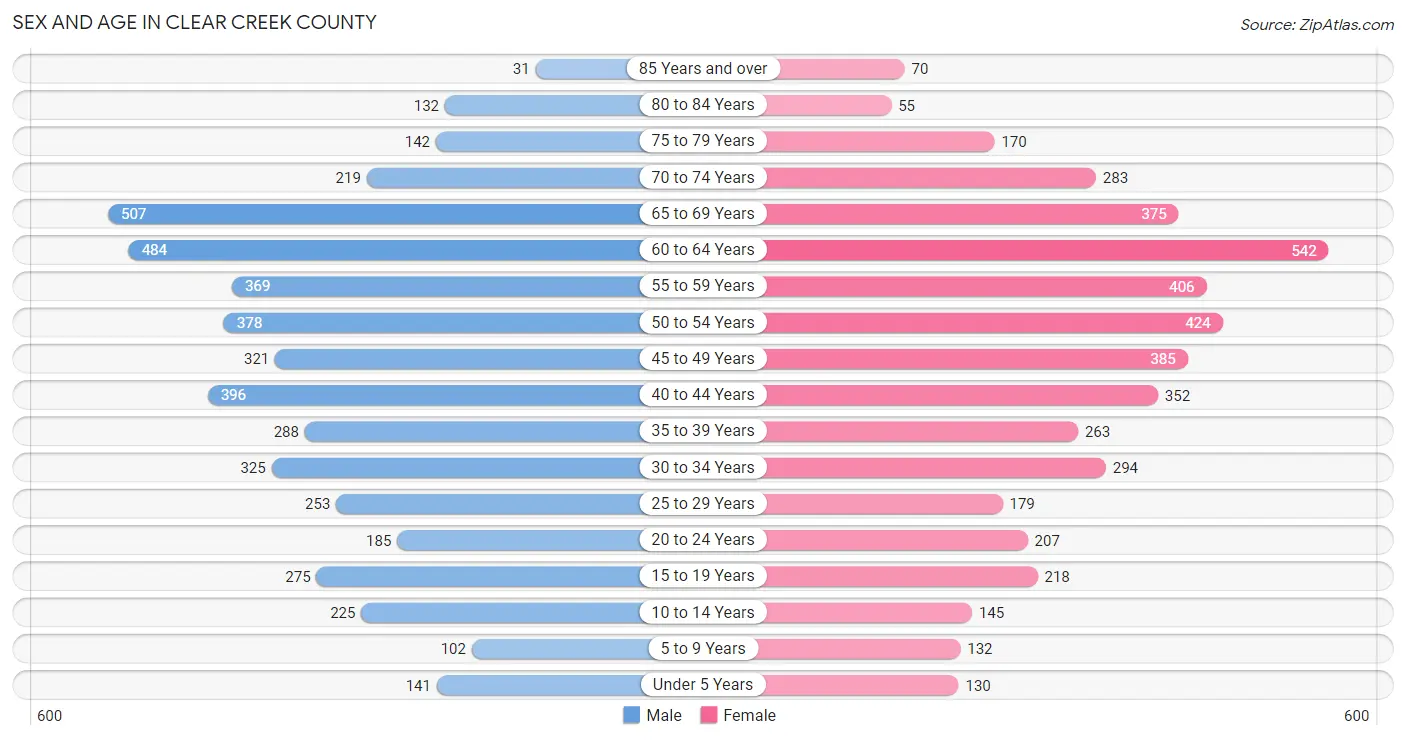
Sex and Age in Clear Creek County
Sex and Age in Clear Creek County
The most populous age groups in Clear Creek County are 65 to 69 Years (507 | 10.6%) for men and 60 to 64 Years (542 | 11.7%) for women.
| Age Bracket | Male | Female |
| Under 5 Years | 141 (2.9%) | 130 (2.8%) |
| 5 to 9 Years | 102 (2.1%) | 132 (2.9%) |
| 10 to 14 Years | 225 (4.7%) | 145 (3.1%) |
| 15 to 19 Years | 275 (5.8%) | 218 (4.7%) |
| 20 to 24 Years | 185 (3.9%) | 207 (4.5%) |
| 25 to 29 Years | 253 (5.3%) | 179 (3.9%) |
| 30 to 34 Years | 325 (6.8%) | 294 (6.4%) |
| 35 to 39 Years | 288 (6.0%) | 263 (5.7%) |
| 40 to 44 Years | 396 (8.3%) | 352 (7.6%) |
| 45 to 49 Years | 321 (6.7%) | 385 (8.3%) |
| 50 to 54 Years | 378 (7.9%) | 424 (9.2%) |
| 55 to 59 Years | 369 (7.7%) | 406 (8.8%) |
| 60 to 64 Years | 484 (10.1%) | 542 (11.7%) |
| 65 to 69 Years | 507 (10.6%) | 375 (8.1%) |
| 70 to 74 Years | 219 (4.6%) | 283 (6.1%) |
| 75 to 79 Years | 142 (3.0%) | 170 (3.7%) |
| 80 to 84 Years | 132 (2.8%) | 55 (1.2%) |
| 85 Years and over | 31 (0.6%) | 70 (1.5%) |
| Total | 4,773 (100.0%) | 4,630 (100.0%) |
Families and Households in Clear Creek County
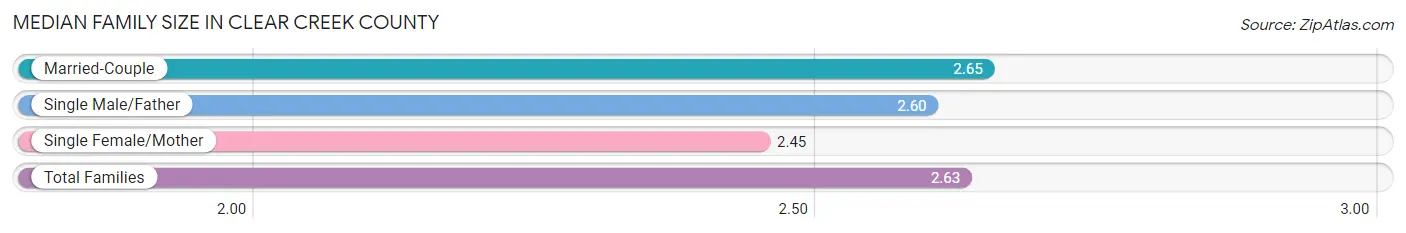
Median Family Size in Clear Creek County
The median family size in Clear Creek County is 2.63 persons per family, with married-couple families (2,087 | 81.7%) accounting for the largest median family size of 2.65 persons per family. On the other hand, single female/mother families (251 | 9.8%) represent the smallest median family size with 2.45 persons per family.
| Family Type | # Families | Family Size |
| Married-Couple | 2,087 (81.7%) | 2.65 |
| Single Male/Father | 218 (8.5%) | 2.60 |
| Single Female/Mother | 251 (9.8%) | 2.45 |
| Total Families | 2,556 (100.0%) | 2.63 |
Median Household Size in Clear Creek County
The median household size in Clear Creek County is 2.03 persons per household, with single male/father households (218 | 4.8%) accounting for the largest median household size of 2.69 persons per household. non-family households (2,033 | 44.3%) represent the smallest median household size with 1.24 persons per household.
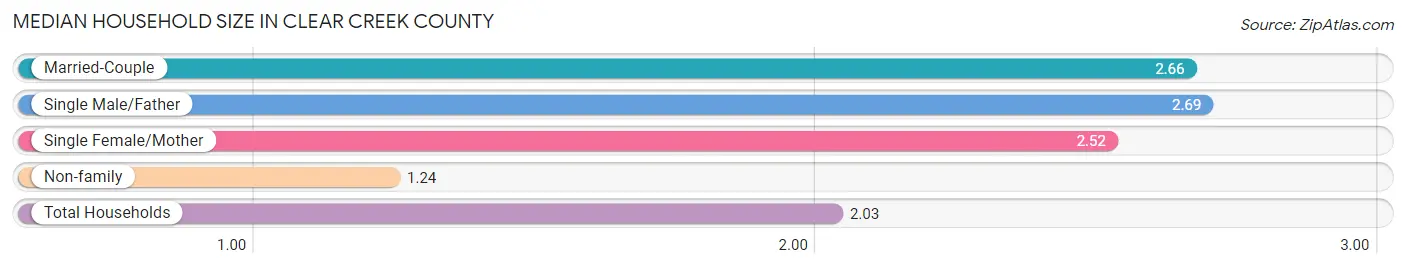
| Household Type | # Households | Household Size |
| Married-Couple | 2,087 (45.5%) | 2.66 |
| Single Male/Father | 218 (4.8%) | 2.69 |
| Single Female/Mother | 251 (5.5%) | 2.52 |
| Non-family | 2,033 (44.3%) | 1.24 |
| Total Households | 4,589 (100.0%) | 2.03 |
Household Size by Marriage Status in Clear Creek County
Out of a total of 4,589 households in Clear Creek County, 2,556 (55.7%) are family households, while 2,033 (44.3%) are nonfamily households. The most numerous type of family households are 2-person households, comprising 1,410, and the most common type of nonfamily households are 1-person households, comprising 1,657.
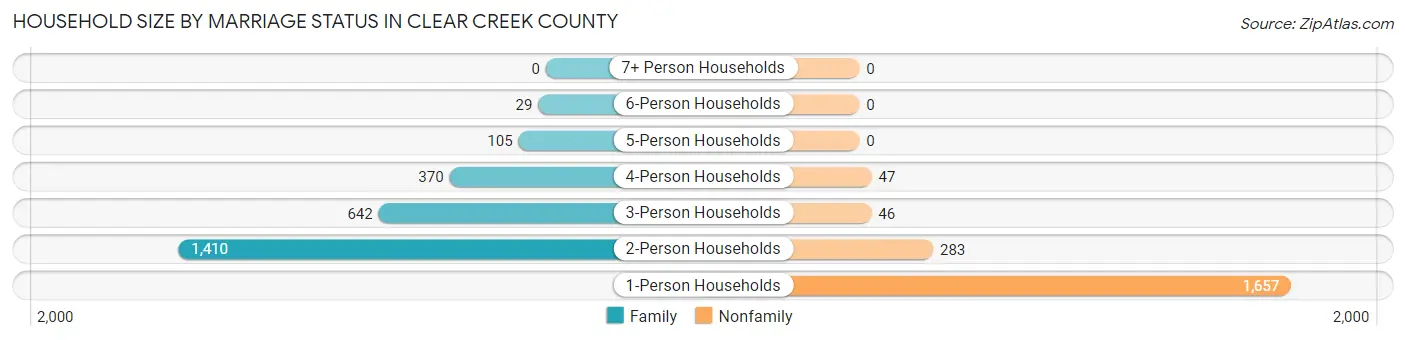
| Household Size | Family Households | Nonfamily Households |
| 1-Person Households | - | 1,657 (36.1%) |
| 2-Person Households | 1,410 (30.7%) | 283 (6.2%) |
| 3-Person Households | 642 (14.0%) | 46 (1.0%) |
| 4-Person Households | 370 (8.1%) | 47 (1.0%) |
| 5-Person Households | 105 (2.3%) | 0 (0.0%) |
| 6-Person Households | 29 (0.6%) | 0 (0.0%) |
| 7+ Person Households | 0 (0.0%) | 0 (0.0%) |
| Total | 2,556 (55.7%) | 2,033 (44.3%) |
Female Fertility in Clear Creek County
Fertility by Age in Clear Creek County
Average fertility rate in Clear Creek County is 20.0 births per 1,000 women. Women in the age bracket of 20 to 34 years have the highest fertility rate with 57.0 births per 1,000 women. Women in the age bracket of 20 to 34 years acount for 100.0% of all women with births.
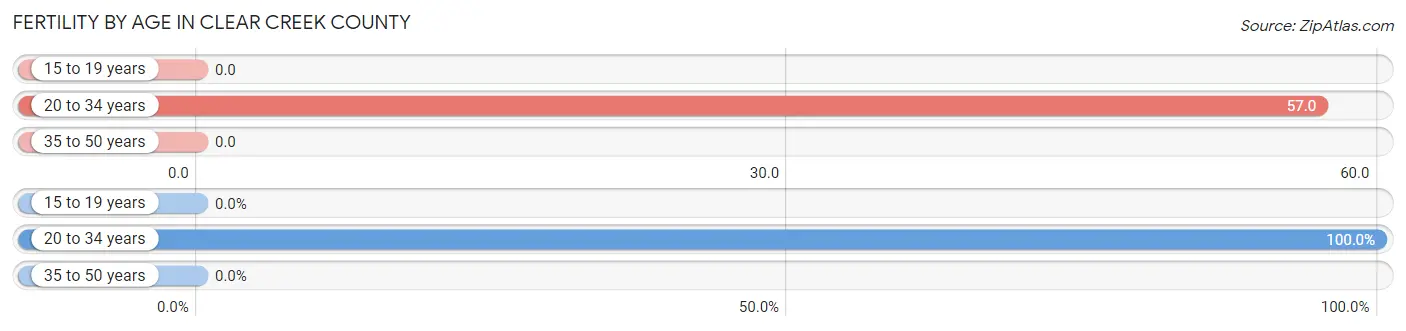
| Age Bracket | Women with Births | Births / 1,000 Women |
| 15 to 19 years | 0 (0.0%) | 0.0 |
| 20 to 34 years | 39 (100.0%) | 57.0 |
| 35 to 50 years | 0 (0.0%) | 0.0 |
| Total | 39 (100.0%) | 20.0 |
Fertility by Age by Marriage Status in Clear Creek County
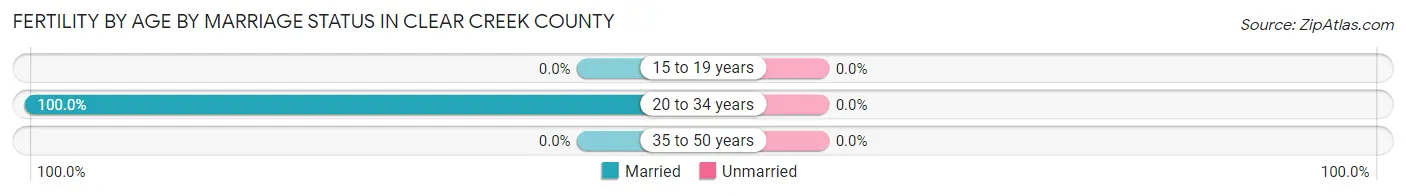
| Age Bracket | Married | Unmarried |
| 15 to 19 years | 0 (0.0%) | 0 (0.0%) |
| 20 to 34 years | 39 (100.0%) | 0 (0.0%) |
| 35 to 50 years | 0 (0.0%) | 0 (0.0%) |
| Total | 39 (100.0%) | 0 (0.0%) |
Fertility by Education in Clear Creek County
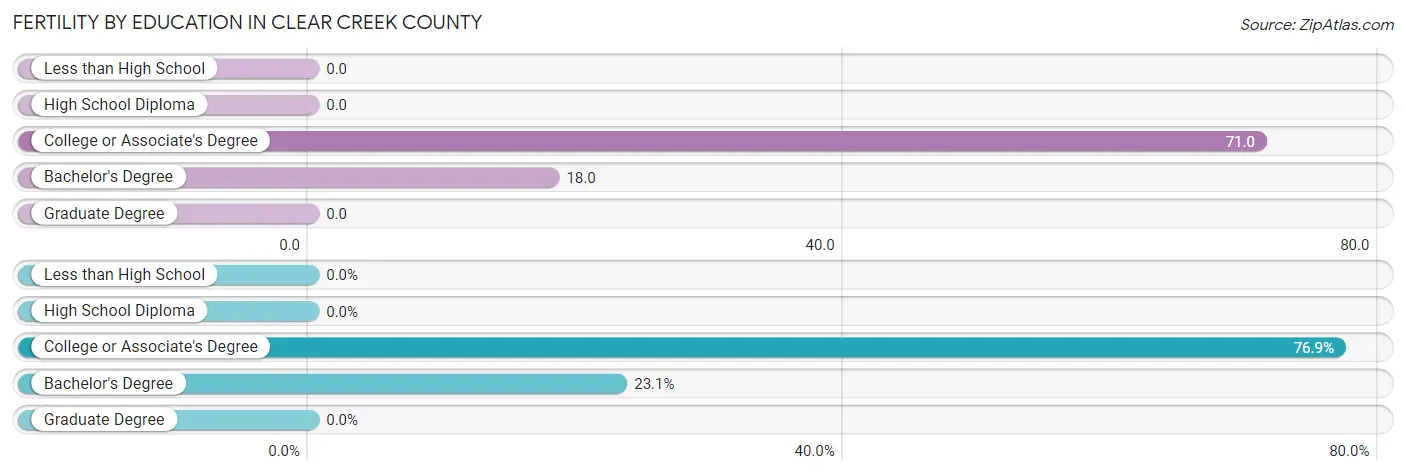
| Educational Attainment | Women with Births | Births / 1,000 Women |
| Less than High School | 0 (0.0%) | 0.0 |
| High School Diploma | 0 (0.0%) | 0.0 |
| College or Associate's Degree | 30 (76.9%) | 71.0 |
| Bachelor's Degree | 9 (23.1%) | 18.0 |
| Graduate Degree | 0 (0.0%) | 0.0 |
| Total | 39 (100.0%) | 20.0 |
Fertility by Education by Marriage Status in Clear Creek County
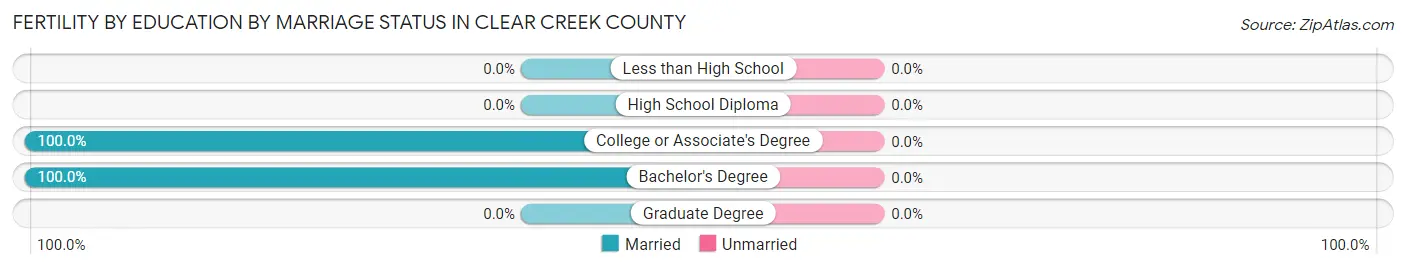
| Educational Attainment | Married | Unmarried |
| Less than High School | 0 (0.0%) | 0 (0.0%) |
| High School Diploma | 0 (0.0%) | 0 (0.0%) |
| College or Associate's Degree | 30 (100.0%) | 0 (0.0%) |
| Bachelor's Degree | 9 (100.0%) | 0 (0.0%) |
| Graduate Degree | 0 (0.0%) | 0 (0.0%) |
| Total | 39 (100.0%) | 0 (0.0%) |
Employment Characteristics in Clear Creek County
Employment by Class of Employer in Clear Creek County
Among the 5,360 employed individuals in Clear Creek County, private company employees (3,324 | 62.0%), not-for-profit organizations (498 | 9.3%), and local government employees (463 | 8.6%) make up the most common classes of employment.
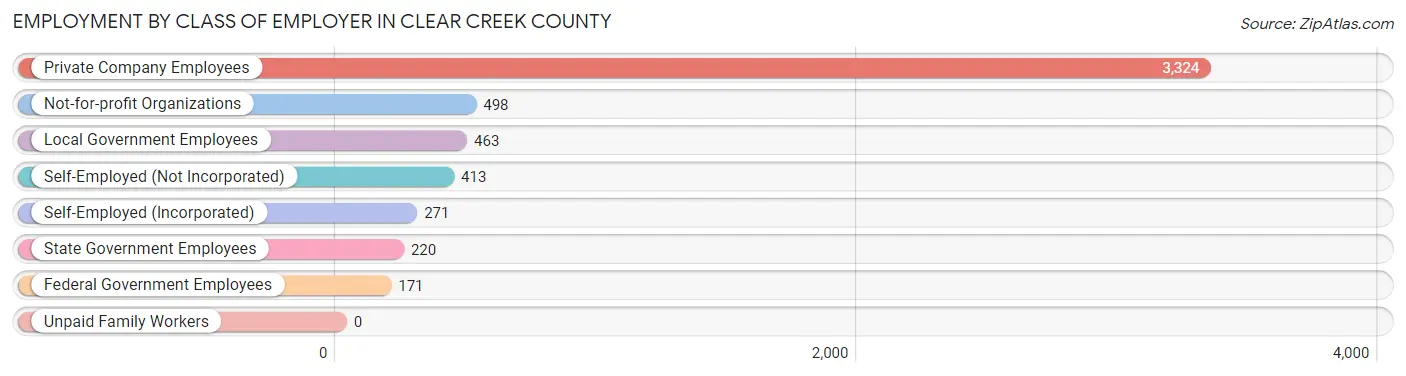
| Employer Class | # Employees | % Employees |
| Private Company Employees | 3,324 | 62.0% |
| Self-Employed (Incorporated) | 271 | 5.1% |
| Self-Employed (Not Incorporated) | 413 | 7.7% |
| Not-for-profit Organizations | 498 | 9.3% |
| Local Government Employees | 463 | 8.6% |
| State Government Employees | 220 | 4.1% |
| Federal Government Employees | 171 | 3.2% |
| Unpaid Family Workers | 0 | 0.0% |
| Total | 5,360 | 100.0% |
Employment Status by Age in Clear Creek County
According to the labor force statistics for Clear Creek County, out of the total population over 16 years of age (8,484), 69.3% or 5,879 individuals are in the labor force, with 4.7% or 276 of them unemployed. The age group with the highest labor force participation rate is 30 to 34 years, with 95.6% or 592 individuals in the labor force. Within the labor force, the 16 to 19 years age range has the highest percentage of unemployed individuals, with 13.7% or 39 of them being unemployed.
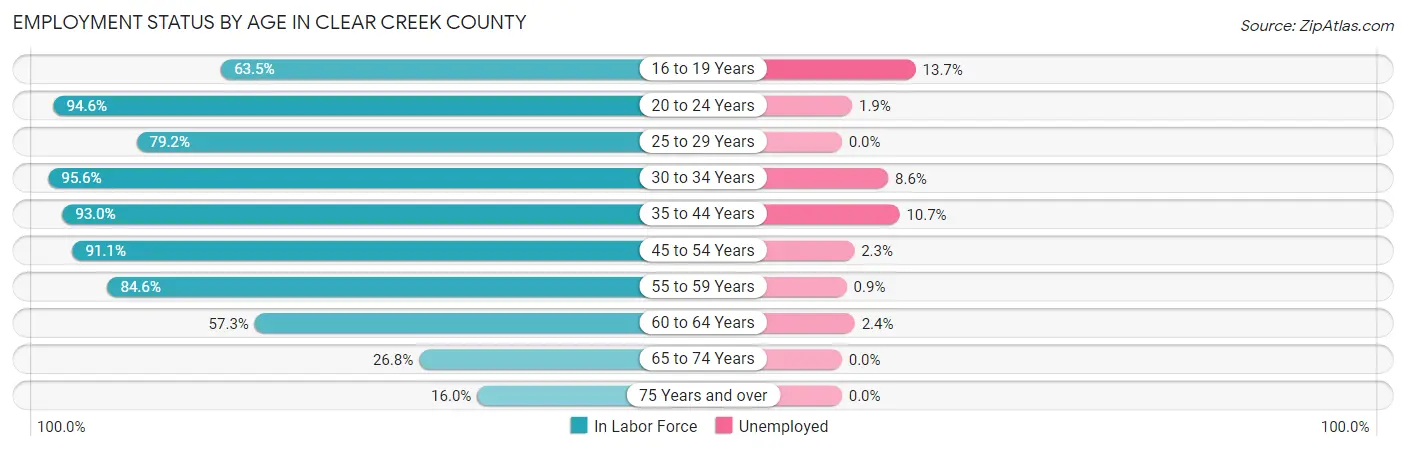
| Age Bracket | In Labor Force | Unemployed |
| 16 to 19 Years | 285 (63.5%) | 39 (13.7%) |
| 20 to 24 Years | 371 (94.6%) | 7 (1.9%) |
| 25 to 29 Years | 342 (79.2%) | 0 (0.0%) |
| 30 to 34 Years | 592 (95.6%) | 51 (8.6%) |
| 35 to 44 Years | 1,208 (93.0%) | 129 (10.7%) |
| 45 to 54 Years | 1,374 (91.1%) | 32 (2.3%) |
| 55 to 59 Years | 656 (84.6%) | 6 (0.9%) |
| 60 to 64 Years | 588 (57.3%) | 14 (2.4%) |
| 65 to 74 Years | 371 (26.8%) | 0 (0.0%) |
| 75 Years and over | 96 (16.0%) | 0 (0.0%) |
| Total | 5,879 (69.3%) | 276 (4.7%) |
Employment Status by Educational Attainment in Clear Creek County
According to labor force statistics for Clear Creek County, 84.1% of individuals (4,759) out of the total population between 25 and 64 years of age (5,659) are in the labor force, with 4.9% or 233 of them being unemployed. The group with the highest labor force participation rate are those with the educational attainment of less than high school, with 91.5% or 194 individuals in the labor force. Within the labor force, individuals with less than high school education have the highest percentage of unemployment, with 23.2% or 45 of them being unemployed.
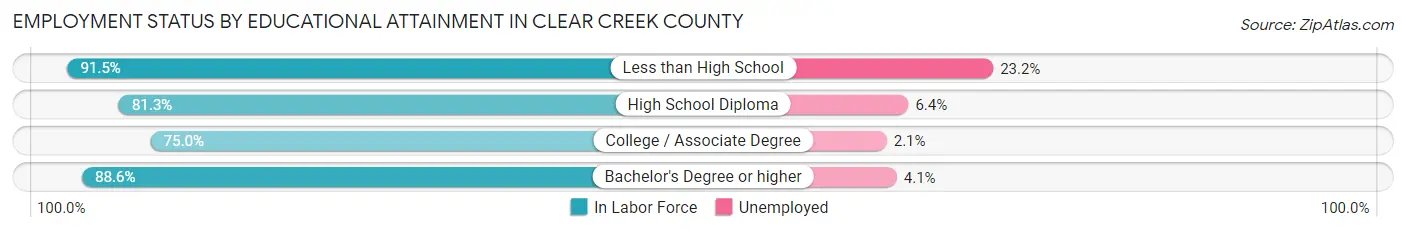
| Educational Attainment | In Labor Force | Unemployed |
| Less than High School | 194 (91.5%) | 49 (23.2%) |
| High School Diploma | 840 (81.3%) | 66 (6.4%) |
| College / Associate Degree | 1,024 (75.0%) | 29 (2.1%) |
| Bachelor's Degree or higher | 2,701 (88.6%) | 125 (4.1%) |
| Total | 4,759 (84.1%) | 277 (4.9%) |
Employment Occupations by Sex in Clear Creek County
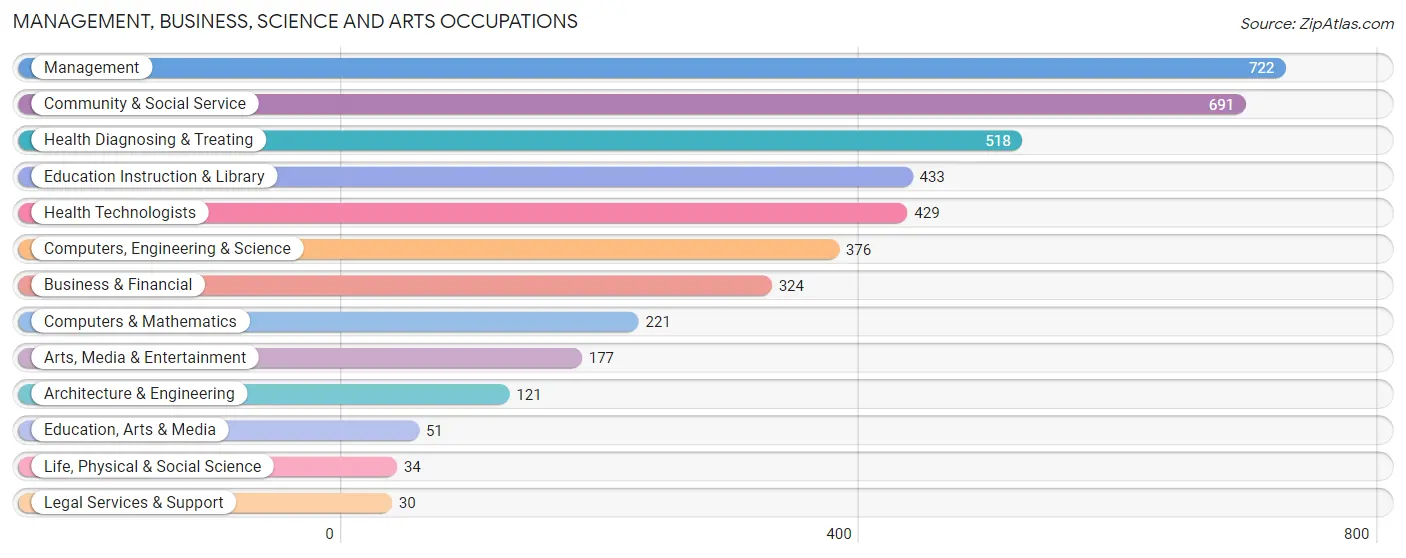
Management, Business, Science and Arts Occupations
The most common Management, Business, Science and Arts occupations in Clear Creek County are Management (722 | 12.9%), Community & Social Service (691 | 12.4%), Health Diagnosing & Treating (518 | 9.3%), Education Instruction & Library (433 | 7.7%), and Health Technologists (429 | 7.7%).
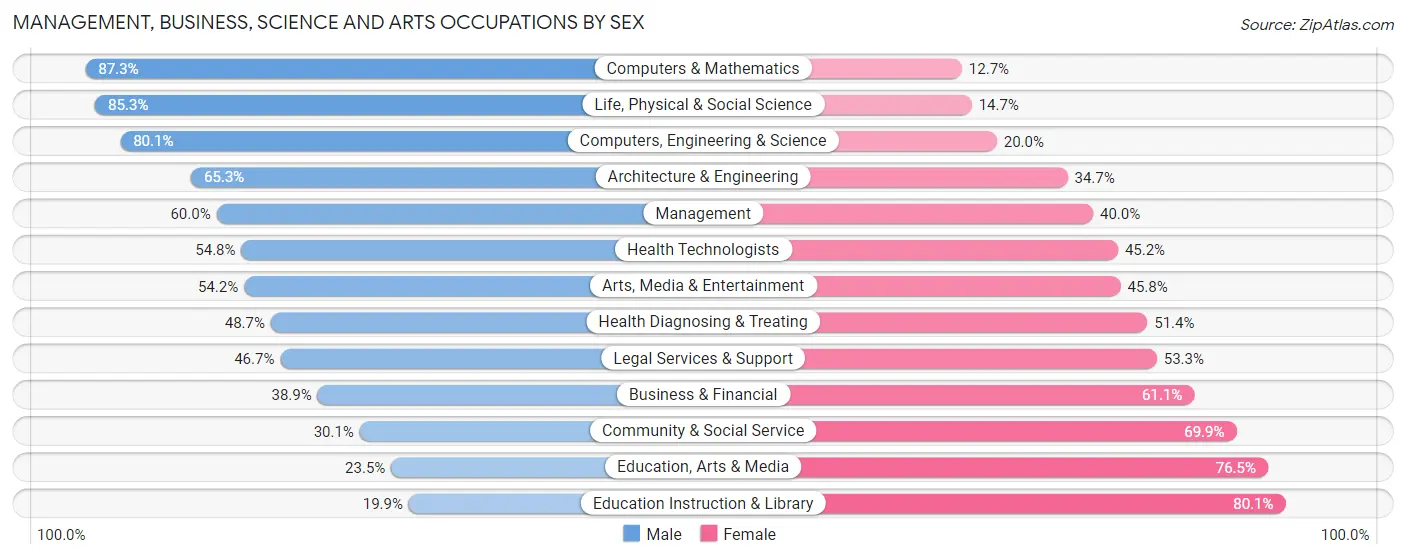
Management, Business, Science and Arts Occupations by Sex
Within the Management, Business, Science and Arts occupations in Clear Creek County, the most male-oriented occupations are Computers & Mathematics (87.3%), Life, Physical & Social Science (85.3%), and Computers, Engineering & Science (80.0%), while the most female-oriented occupations are Education Instruction & Library (80.1%), Education, Arts & Media (76.5%), and Community & Social Service (69.9%).
| Occupation | Male | Female |
| Management | 433 (60.0%) | 289 (40.0%) |
| Business & Financial | 126 (38.9%) | 198 (61.1%) |
| Computers, Engineering & Science | 301 (80.0%) | 75 (20.0%) |
| Computers & Mathematics | 193 (87.3%) | 28 (12.7%) |
| Architecture & Engineering | 79 (65.3%) | 42 (34.7%) |
| Life, Physical & Social Science | 29 (85.3%) | 5 (14.7%) |
| Community & Social Service | 208 (30.1%) | 483 (69.9%) |
| Education, Arts & Media | 12 (23.5%) | 39 (76.5%) |
| Legal Services & Support | 14 (46.7%) | 16 (53.3%) |
| Education Instruction & Library | 86 (19.9%) | 347 (80.1%) |
| Arts, Media & Entertainment | 96 (54.2%) | 81 (45.8%) |
| Health Diagnosing & Treating | 252 (48.6%) | 266 (51.3%) |
| Health Technologists | 235 (54.8%) | 194 (45.2%) |
| Total (Category) | 1,320 (50.2%) | 1,311 (49.8%) |
| Total (Overall) | 3,075 (55.0%) | 2,515 (45.0%) |
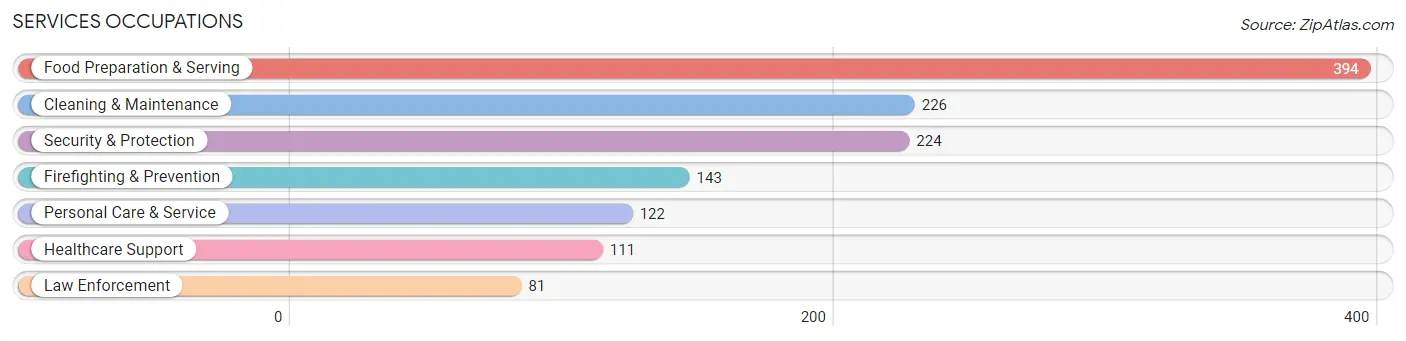
Services Occupations
The most common Services occupations in Clear Creek County are Food Preparation & Serving (394 | 7.0%), Cleaning & Maintenance (226 | 4.0%), Security & Protection (224 | 4.0%), Firefighting & Prevention (143 | 2.6%), and Personal Care & Service (122 | 2.2%).
Services Occupations by Sex
Within the Services occupations in Clear Creek County, the most male-oriented occupations are Law Enforcement (77.8%), Cleaning & Maintenance (77.0%), and Security & Protection (67.9%), while the most female-oriented occupations are Healthcare Support (100.0%), Personal Care & Service (59.0%), and Food Preparation & Serving (54.1%).
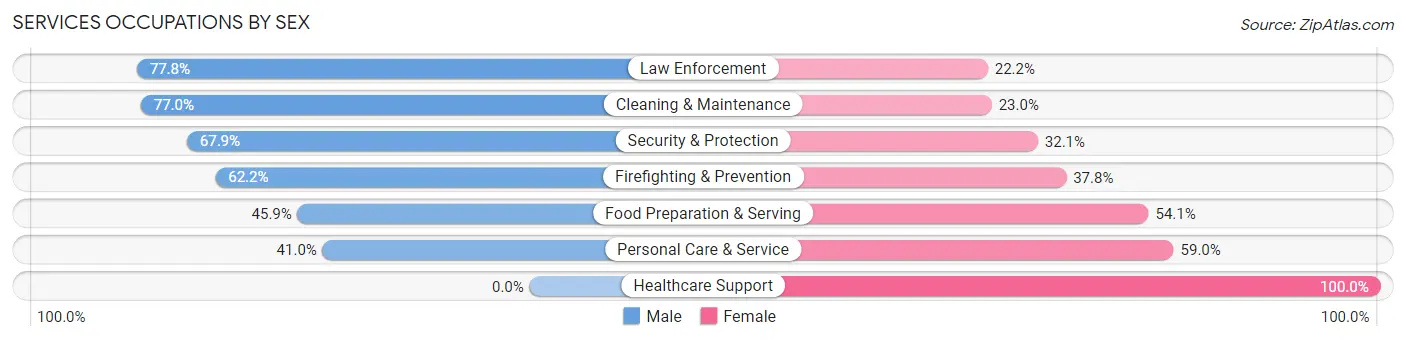
| Occupation | Male | Female |
| Healthcare Support | 0 (0.0%) | 111 (100.0%) |
| Security & Protection | 152 (67.9%) | 72 (32.1%) |
| Firefighting & Prevention | 89 (62.2%) | 54 (37.8%) |
| Law Enforcement | 63 (77.8%) | 18 (22.2%) |
| Food Preparation & Serving | 181 (45.9%) | 213 (54.1%) |
| Cleaning & Maintenance | 174 (77.0%) | 52 (23.0%) |
| Personal Care & Service | 50 (41.0%) | 72 (59.0%) |
| Total (Category) | 557 (51.7%) | 520 (48.3%) |
| Total (Overall) | 3,075 (55.0%) | 2,515 (45.0%) |
Sales and Office Occupations
The most common Sales and Office occupations in Clear Creek County are Sales & Related (672 | 12.0%), and Office & Administration (357 | 6.4%).
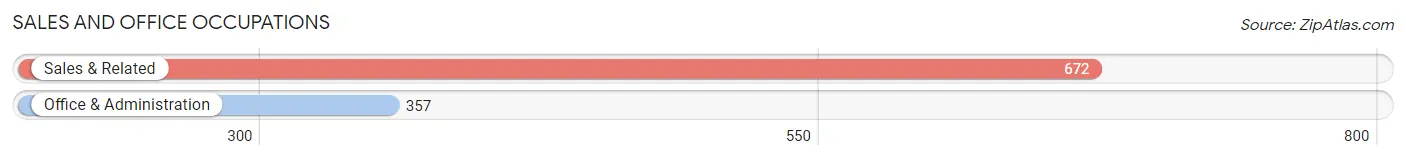
Sales and Office Occupations by Sex

| Occupation | Male | Female |
| Sales & Related | 381 (56.7%) | 291 (43.3%) |
| Office & Administration | 50 (14.0%) | 307 (86.0%) |
| Total (Category) | 431 (41.9%) | 598 (58.1%) |
| Total (Overall) | 3,075 (55.0%) | 2,515 (45.0%) |
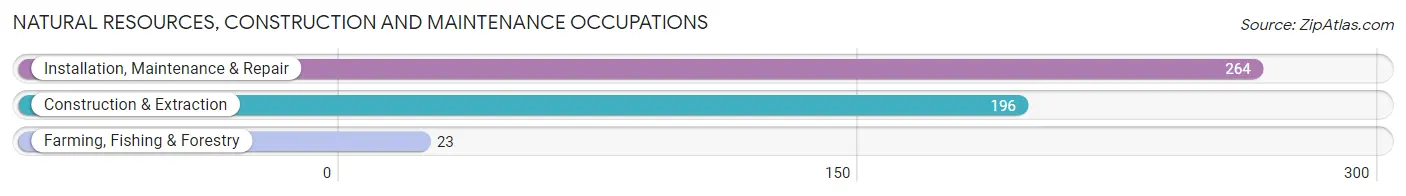
Natural Resources, Construction and Maintenance Occupations
The most common Natural Resources, Construction and Maintenance occupations in Clear Creek County are Installation, Maintenance & Repair (264 | 4.7%), Construction & Extraction (196 | 3.5%), and Farming, Fishing & Forestry (23 | 0.4%).
Natural Resources, Construction and Maintenance Occupations by Sex
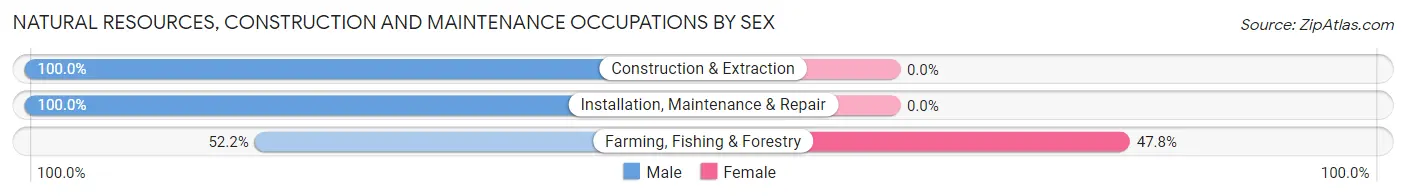
| Occupation | Male | Female |
| Farming, Fishing & Forestry | 12 (52.2%) | 11 (47.8%) |
| Construction & Extraction | 196 (100.0%) | 0 (0.0%) |
| Installation, Maintenance & Repair | 264 (100.0%) | 0 (0.0%) |
| Total (Category) | 472 (97.7%) | 11 (2.3%) |
| Total (Overall) | 3,075 (55.0%) | 2,515 (45.0%) |
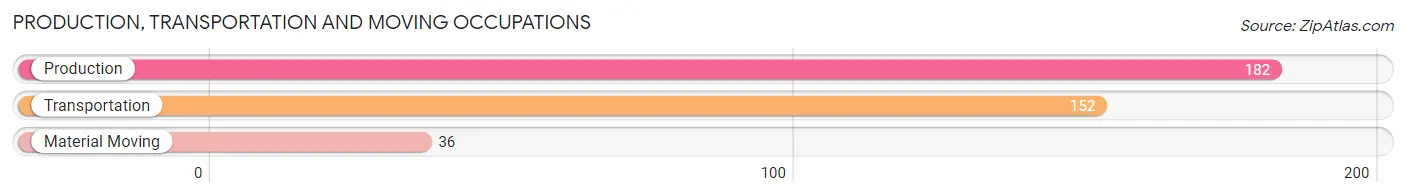
Production, Transportation and Moving Occupations
The most common Production, Transportation and Moving occupations in Clear Creek County are Production (182 | 3.3%), Transportation (152 | 2.7%), and Material Moving (36 | 0.6%).
Production, Transportation and Moving Occupations by Sex
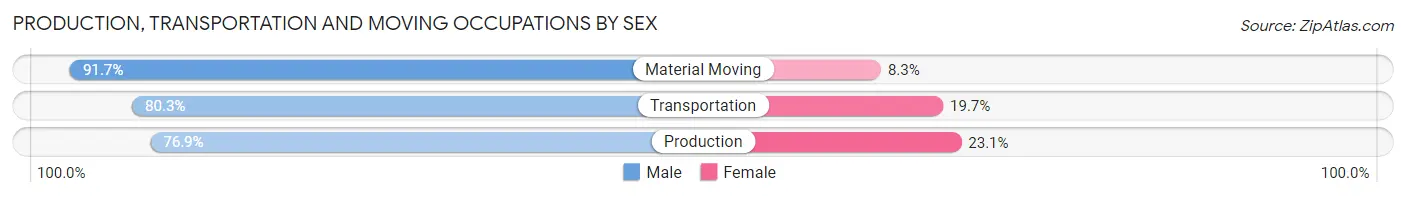
| Occupation | Male | Female |
| Production | 140 (76.9%) | 42 (23.1%) |
| Transportation | 122 (80.3%) | 30 (19.7%) |
| Material Moving | 33 (91.7%) | 3 (8.3%) |
| Total (Category) | 295 (79.7%) | 75 (20.3%) |
| Total (Overall) | 3,075 (55.0%) | 2,515 (45.0%) |
Employment Industries by Sex in Clear Creek County
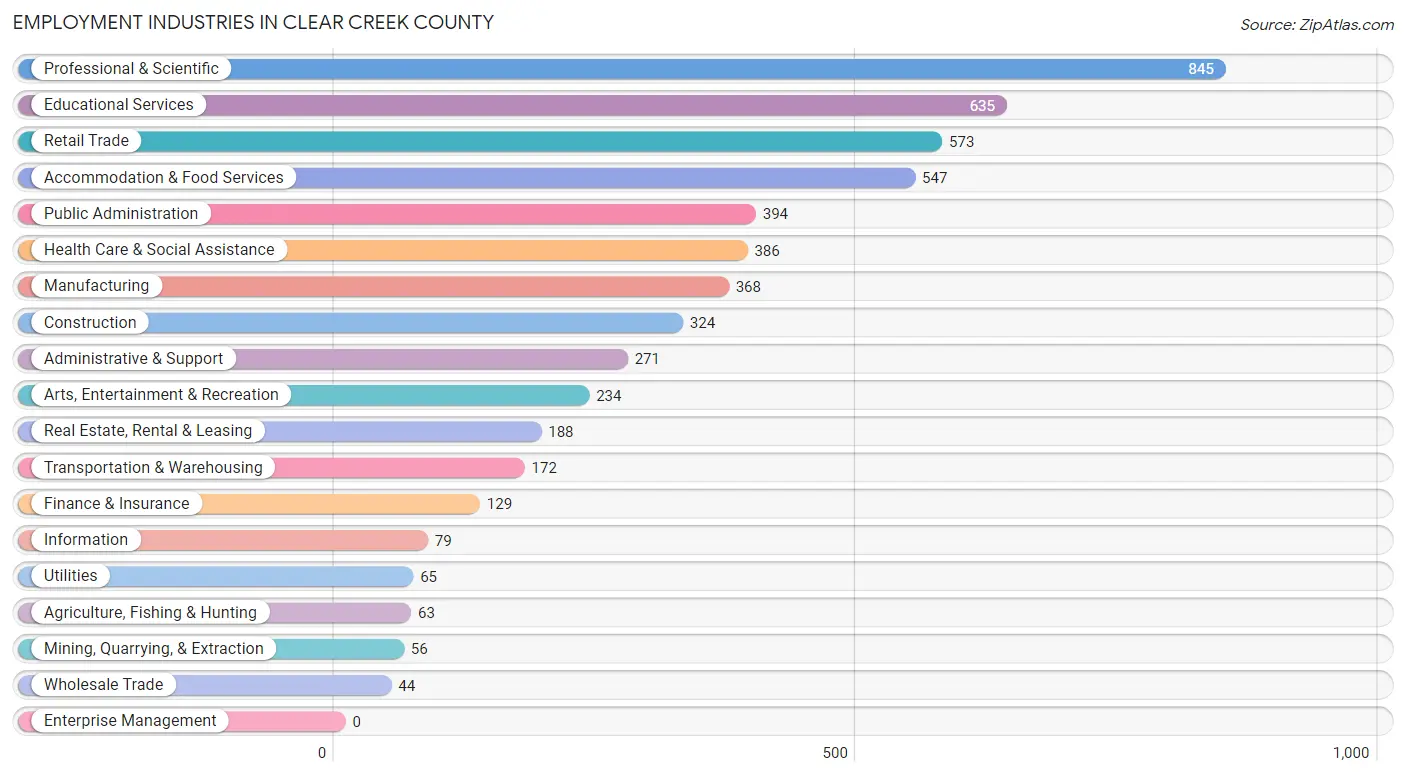
Employment Industries in Clear Creek County
The major employment industries in Clear Creek County include Professional & Scientific (845 | 15.1%), Educational Services (635 | 11.4%), Retail Trade (573 | 10.2%), Accommodation & Food Services (547 | 9.8%), and Public Administration (394 | 7.0%).
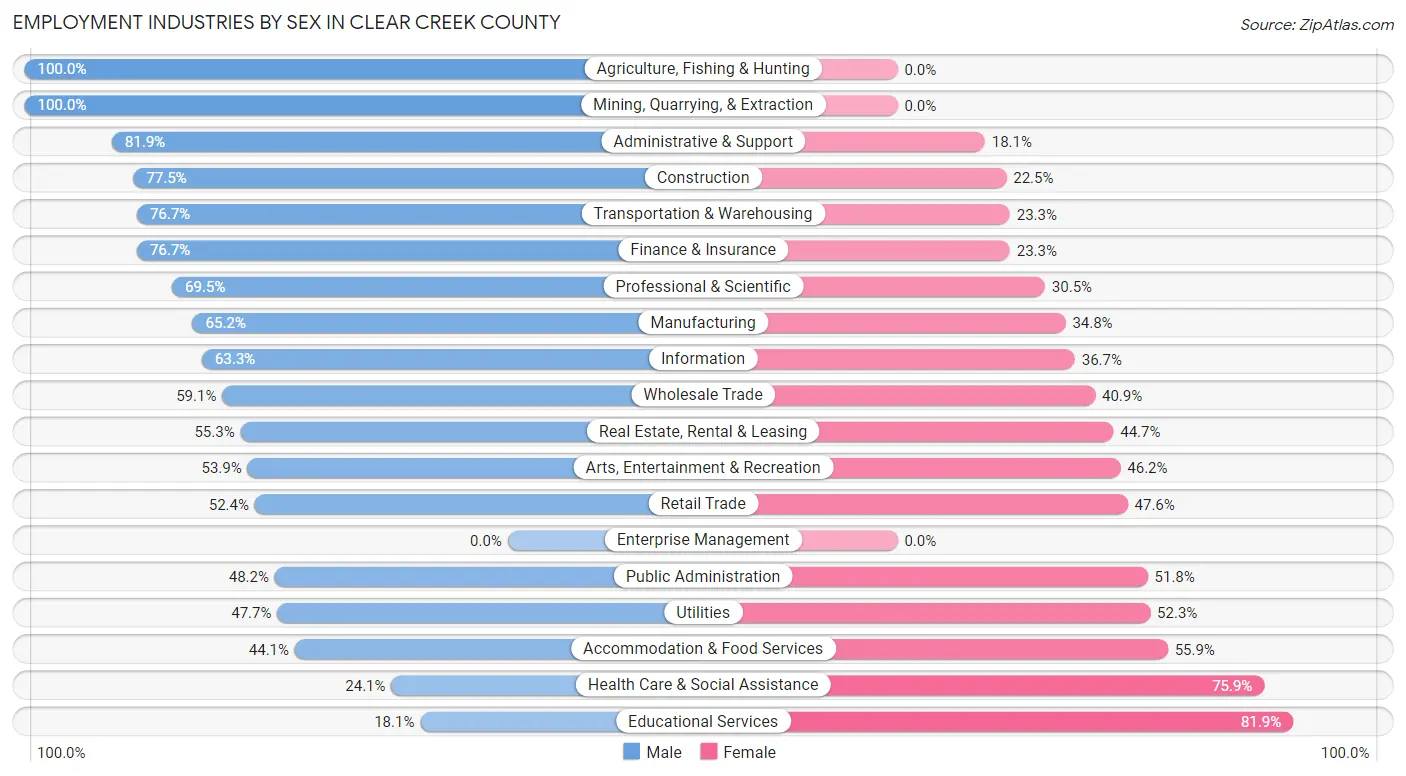
Employment Industries by Sex in Clear Creek County
The Clear Creek County industries that see more men than women are Agriculture, Fishing & Hunting (100.0%), Mining, Quarrying, & Extraction (100.0%), and Administrative & Support (81.9%), whereas the industries that tend to have a higher number of women are Educational Services (81.9%), Health Care & Social Assistance (75.9%), and Accommodation & Food Services (55.9%).
| Industry | Male | Female |
| Agriculture, Fishing & Hunting | 63 (100.0%) | 0 (0.0%) |
| Mining, Quarrying, & Extraction | 56 (100.0%) | 0 (0.0%) |
| Construction | 251 (77.5%) | 73 (22.5%) |
| Manufacturing | 240 (65.2%) | 128 (34.8%) |
| Wholesale Trade | 26 (59.1%) | 18 (40.9%) |
| Retail Trade | 300 (52.4%) | 273 (47.6%) |
| Transportation & Warehousing | 132 (76.7%) | 40 (23.3%) |
| Utilities | 31 (47.7%) | 34 (52.3%) |
| Information | 50 (63.3%) | 29 (36.7%) |
| Finance & Insurance | 99 (76.7%) | 30 (23.3%) |
| Real Estate, Rental & Leasing | 104 (55.3%) | 84 (44.7%) |
| Professional & Scientific | 587 (69.5%) | 258 (30.5%) |
| Enterprise Management | 0 (0.0%) | 0 (0.0%) |
| Administrative & Support | 222 (81.9%) | 49 (18.1%) |
| Educational Services | 115 (18.1%) | 520 (81.9%) |
| Health Care & Social Assistance | 93 (24.1%) | 293 (75.9%) |
| Arts, Entertainment & Recreation | 126 (53.8%) | 108 (46.2%) |
| Accommodation & Food Services | 241 (44.1%) | 306 (55.9%) |
| Public Administration | 190 (48.2%) | 204 (51.8%) |
| Total | 3,075 (55.0%) | 2,515 (45.0%) |
Education in Clear Creek County
School Enrollment in Clear Creek County
The most common levels of schooling among the 1,295 students in Clear Creek County are high school (388 | 30.0%), middle school (280 | 21.6%), and college / undergraduate (188 | 14.5%).
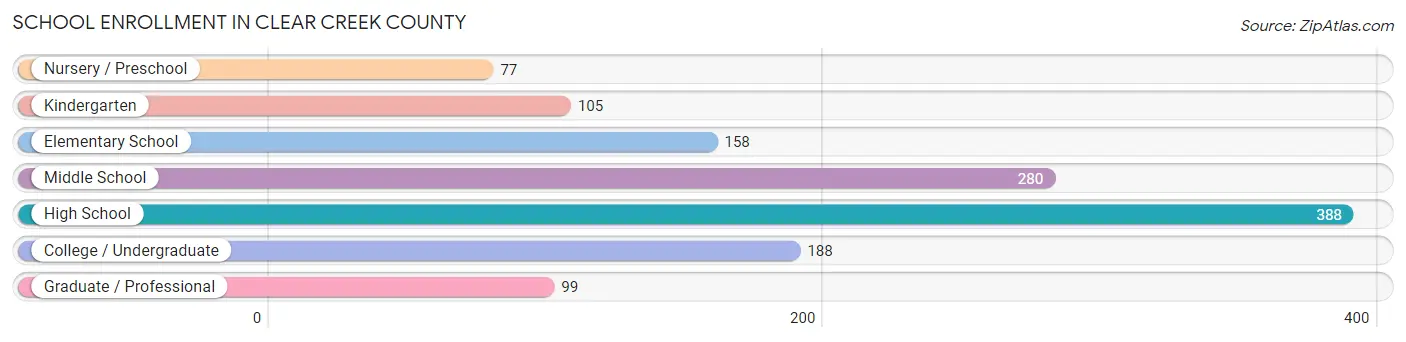
| School Level | # Students | % Students |
| Nursery / Preschool | 77 | 5.9% |
| Kindergarten | 105 | 8.1% |
| Elementary School | 158 | 12.2% |
| Middle School | 280 | 21.6% |
| High School | 388 | 30.0% |
| College / Undergraduate | 188 | 14.5% |
| Graduate / Professional | 99 | 7.6% |
| Total | 1,295 | 100.0% |
School Enrollment by Age by Funding Source in Clear Creek County
Out of a total of 1,295 students who are enrolled in schools in Clear Creek County, 221 (17.1%) attend a private institution, while the remaining 1,074 (82.9%) are enrolled in public schools. The age group of 20 to 24 year olds has the highest likelihood of being enrolled in private schools, with 6 (50.0% in the age bracket) enrolled. Conversely, the age group of 15 to 17 year olds has the lowest likelihood of being enrolled in a private school, with 235 (100.0% in the age bracket) attending a public institution.
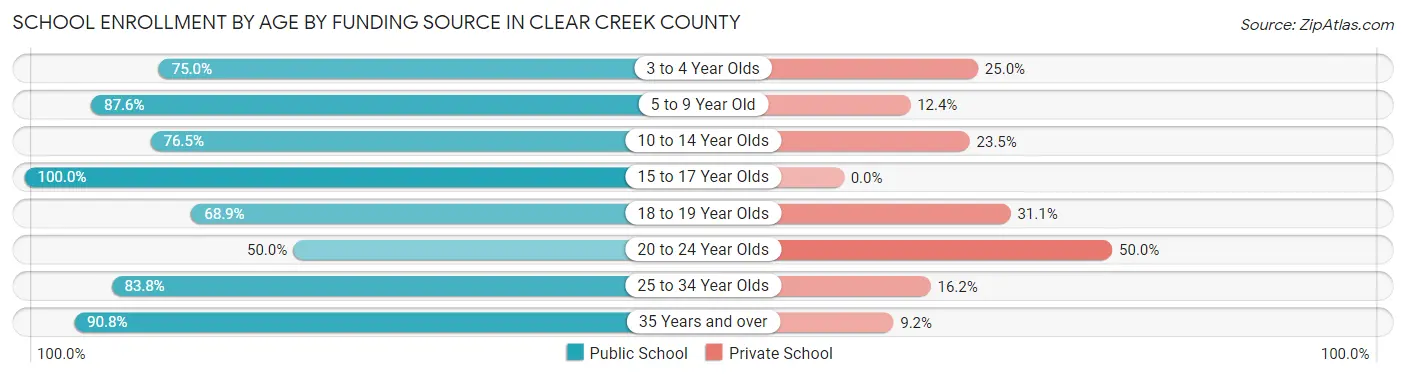
| Age Bracket | Public School | Private School |
| 3 to 4 Year Olds | 60 (75.0%) | 20 (25.0%) |
| 5 to 9 Year Old | 205 (87.6%) | 29 (12.4%) |
| 10 to 14 Year Olds | 261 (76.5%) | 80 (23.5%) |
| 15 to 17 Year Olds | 235 (100.0%) | 0 (0.0%) |
| 18 to 19 Year Olds | 142 (68.9%) | 64 (31.1%) |
| 20 to 24 Year Olds | 6 (50.0%) | 6 (50.0%) |
| 25 to 34 Year Olds | 57 (83.8%) | 11 (16.2%) |
| 35 Years and over | 108 (90.8%) | 11 (9.2%) |
| Total | 1,074 (82.9%) | 221 (17.1%) |
Educational Attainment by Field of Study in Clear Creek County
Business (979 | 21.4%), education (520 | 11.4%), science & technology (417 | 9.1%), social sciences (371 | 8.1%), and bio, nature & agricultural (347 | 7.6%) are the most common fields of study among 4,567 individuals in Clear Creek County who have obtained a bachelor's degree or higher.
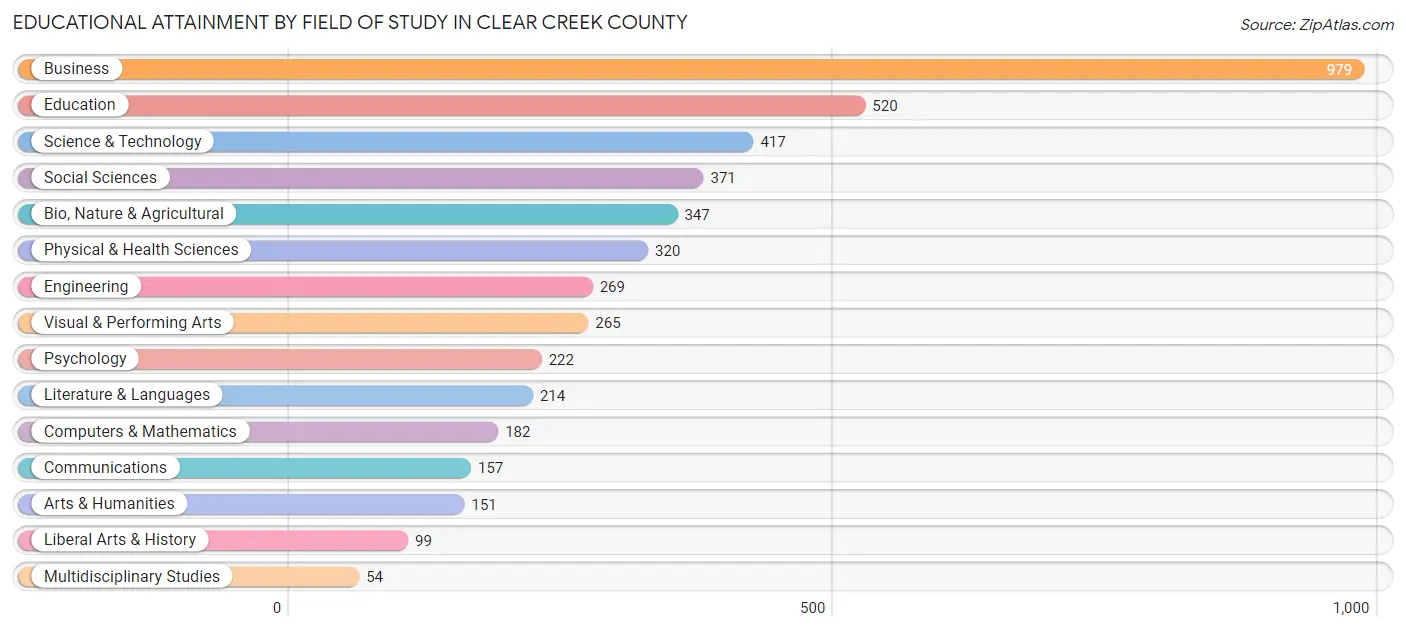
| Field of Study | # Graduates | % Graduates |
| Computers & Mathematics | 182 | 4.0% |
| Bio, Nature & Agricultural | 347 | 7.6% |
| Physical & Health Sciences | 320 | 7.0% |
| Psychology | 222 | 4.9% |
| Social Sciences | 371 | 8.1% |
| Engineering | 269 | 5.9% |
| Multidisciplinary Studies | 54 | 1.2% |
| Science & Technology | 417 | 9.1% |
| Business | 979 | 21.4% |
| Education | 520 | 11.4% |
| Literature & Languages | 214 | 4.7% |
| Liberal Arts & History | 99 | 2.2% |
| Visual & Performing Arts | 265 | 5.8% |
| Communications | 157 | 3.4% |
| Arts & Humanities | 151 | 3.3% |
| Total | 4,567 | 100.0% |
Transportation & Commute in Clear Creek County
Vehicle Availability by Sex in Clear Creek County
The most prevalent vehicle ownership categories in Clear Creek County are males with 2 vehicles (1,421, accounting for 46.6%) and females with 2 vehicles (916, making up 61.5%).
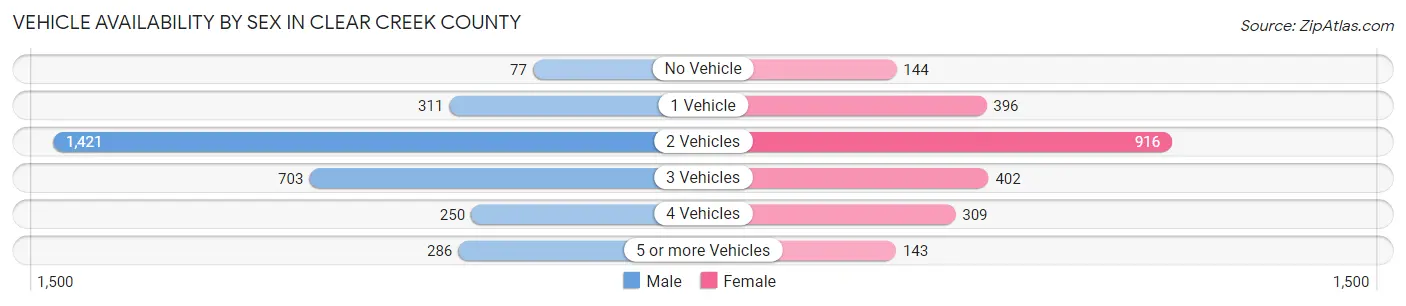
| Vehicles Available | Male | Female |
| No Vehicle | 77 (2.5%) | 144 (6.2%) |
| 1 Vehicle | 311 (10.2%) | 396 (17.1%) |
| 2 Vehicles | 1,421 (46.6%) | 916 (39.7%) |
| 3 Vehicles | 703 (23.1%) | 402 (17.4%) |
| 4 Vehicles | 250 (8.2%) | 309 (13.4%) |
| 5 or more Vehicles | 286 (9.4%) | 143 (6.2%) |
| Total | 3,048 (100.0%) | 2,310 (100.0%) |
Commute Time in Clear Creek County
The most frequently occuring commute durations in Clear Creek County are 5 to 9 minutes (616 commuters, 14.5%), 30 to 34 minutes (530 commuters, 12.5%), and 45 to 59 minutes (484 commuters, 11.4%).
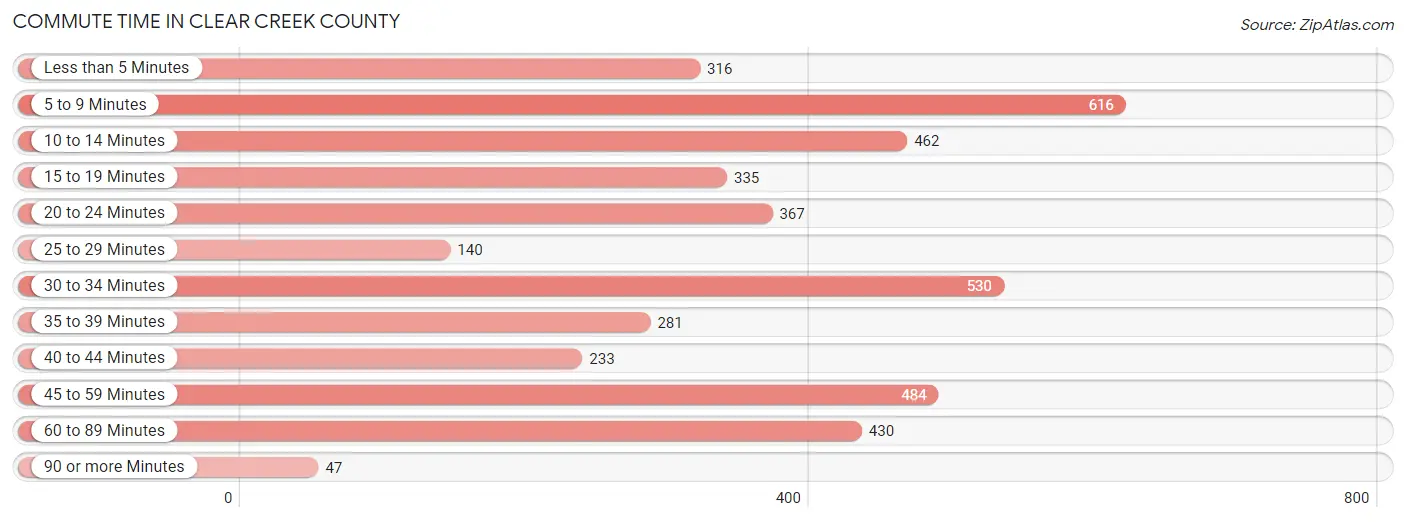
| Commute Time | # Commuters | % Commuters |
| Less than 5 Minutes | 316 | 7.4% |
| 5 to 9 Minutes | 616 | 14.5% |
| 10 to 14 Minutes | 462 | 10.9% |
| 15 to 19 Minutes | 335 | 7.9% |
| 20 to 24 Minutes | 367 | 8.6% |
| 25 to 29 Minutes | 140 | 3.3% |
| 30 to 34 Minutes | 530 | 12.5% |
| 35 to 39 Minutes | 281 | 6.6% |
| 40 to 44 Minutes | 233 | 5.5% |
| 45 to 59 Minutes | 484 | 11.4% |
| 60 to 89 Minutes | 430 | 10.1% |
| 90 or more Minutes | 47 | 1.1% |
Commute Time by Sex in Clear Creek County
The most common commute times in Clear Creek County are 5 to 9 minutes (384 commuters, 15.6%) for males and 10 to 14 minutes (274 commuters, 15.4%) for females.
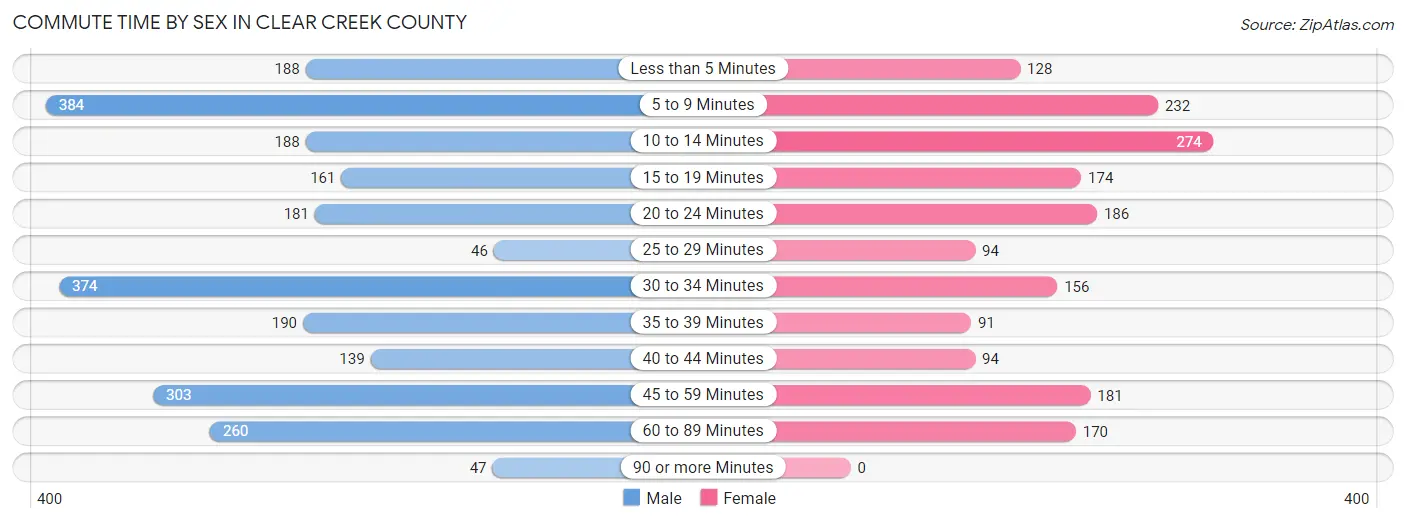
| Commute Time | Male | Female |
| Less than 5 Minutes | 188 (7.6%) | 128 (7.2%) |
| 5 to 9 Minutes | 384 (15.6%) | 232 (13.0%) |
| 10 to 14 Minutes | 188 (7.6%) | 274 (15.4%) |
| 15 to 19 Minutes | 161 (6.5%) | 174 (9.8%) |
| 20 to 24 Minutes | 181 (7.3%) | 186 (10.4%) |
| 25 to 29 Minutes | 46 (1.9%) | 94 (5.3%) |
| 30 to 34 Minutes | 374 (15.2%) | 156 (8.8%) |
| 35 to 39 Minutes | 190 (7.7%) | 91 (5.1%) |
| 40 to 44 Minutes | 139 (5.7%) | 94 (5.3%) |
| 45 to 59 Minutes | 303 (12.3%) | 181 (10.2%) |
| 60 to 89 Minutes | 260 (10.6%) | 170 (9.6%) |
| 90 or more Minutes | 47 (1.9%) | 0 (0.0%) |
Time of Departure to Work by Sex in Clear Creek County
The most frequent times of departure to work in Clear Creek County are 6:00 AM to 6:29 AM (370, 15.0%) for males and 9:00 AM to 9:59 AM (283, 15.9%) for females.
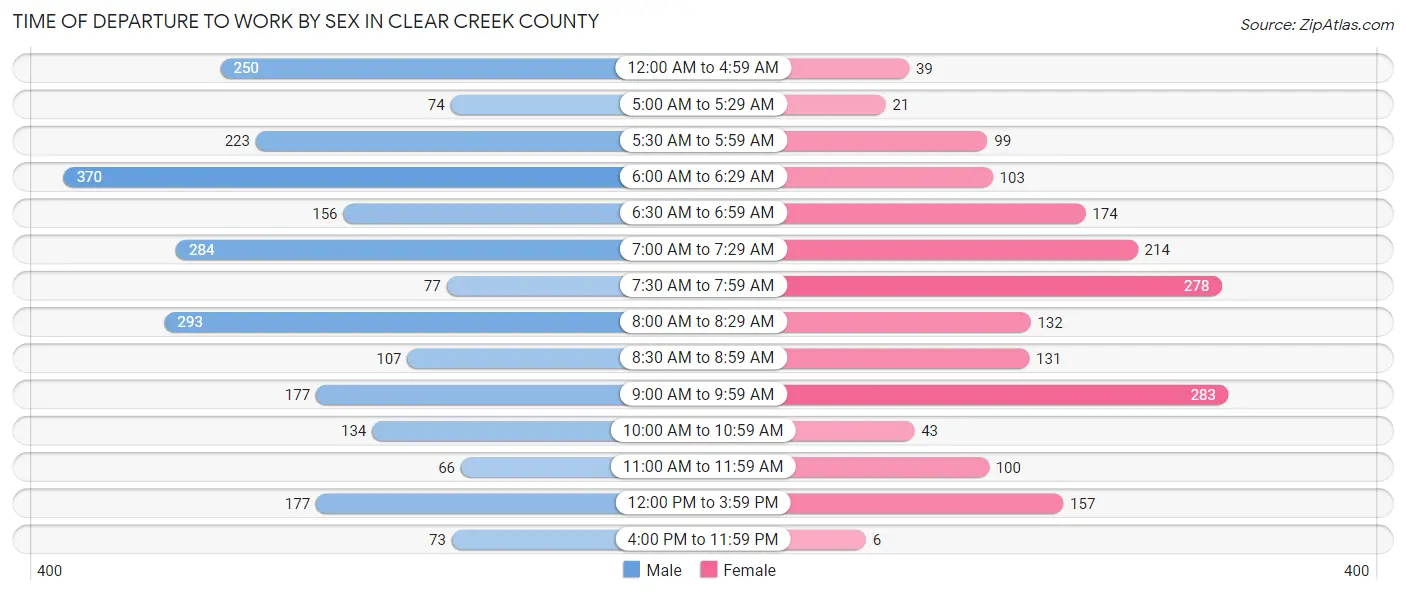
| Time of Departure | Male | Female |
| 12:00 AM to 4:59 AM | 250 (10.2%) | 39 (2.2%) |
| 5:00 AM to 5:29 AM | 74 (3.0%) | 21 (1.2%) |
| 5:30 AM to 5:59 AM | 223 (9.1%) | 99 (5.6%) |
| 6:00 AM to 6:29 AM | 370 (15.0%) | 103 (5.8%) |
| 6:30 AM to 6:59 AM | 156 (6.3%) | 174 (9.8%) |
| 7:00 AM to 7:29 AM | 284 (11.5%) | 214 (12.0%) |
| 7:30 AM to 7:59 AM | 77 (3.1%) | 278 (15.6%) |
| 8:00 AM to 8:29 AM | 293 (11.9%) | 132 (7.4%) |
| 8:30 AM to 8:59 AM | 107 (4.3%) | 131 (7.4%) |
| 9:00 AM to 9:59 AM | 177 (7.2%) | 283 (15.9%) |
| 10:00 AM to 10:59 AM | 134 (5.4%) | 43 (2.4%) |
| 11:00 AM to 11:59 AM | 66 (2.7%) | 100 (5.6%) |
| 12:00 PM to 3:59 PM | 177 (7.2%) | 157 (8.8%) |
| 4:00 PM to 11:59 PM | 73 (3.0%) | 6 (0.3%) |
| Total | 2,461 (100.0%) | 1,780 (100.0%) |
Housing Occupancy in Clear Creek County
Occupancy by Ownership in Clear Creek County
Of the total 4,589 dwellings in Clear Creek County, owner-occupied units account for 3,672 (80.0%), while renter-occupied units make up 917 (20.0%).
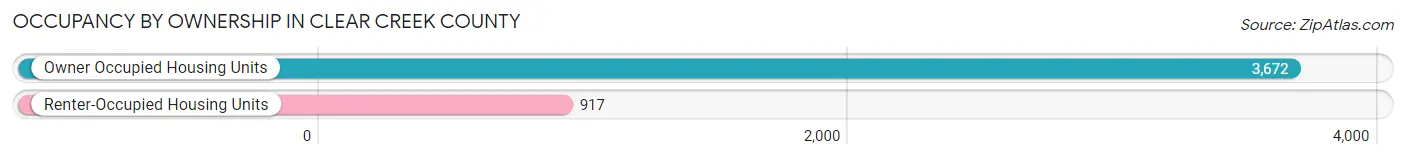
| Occupancy | # Housing Units | % Housing Units |
| Owner Occupied Housing Units | 3,672 | 80.0% |
| Renter-Occupied Housing Units | 917 | 20.0% |
| Total Occupied Housing Units | 4,589 | 100.0% |
Occupancy by Household Size in Clear Creek County
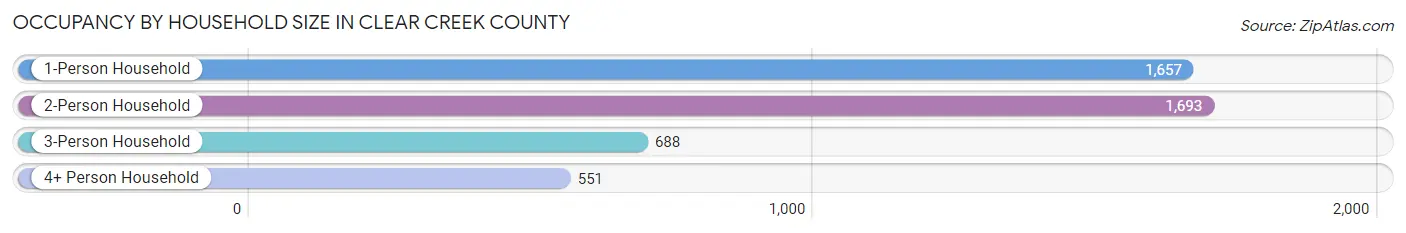
| Household Size | # Housing Units | % Housing Units |
| 1-Person Household | 1,657 | 36.1% |
| 2-Person Household | 1,693 | 36.9% |
| 3-Person Household | 688 | 15.0% |
| 4+ Person Household | 551 | 12.0% |
| Total Housing Units | 4,589 | 100.0% |
Occupancy by Ownership by Household Size in Clear Creek County
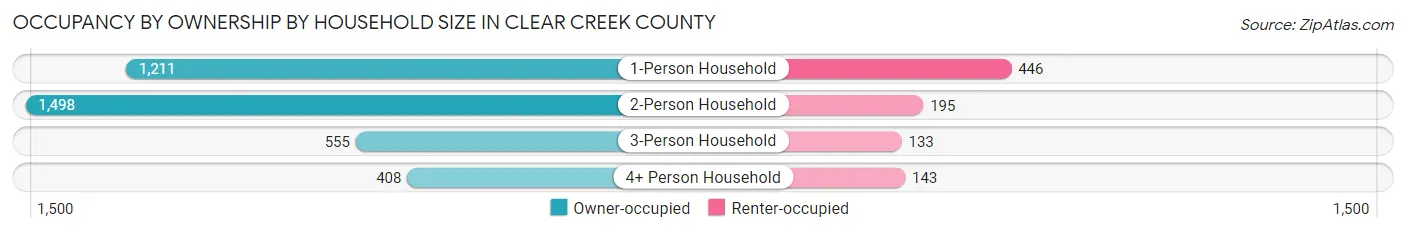
| Household Size | Owner-occupied | Renter-occupied |
| 1-Person Household | 1,211 (73.1%) | 446 (26.9%) |
| 2-Person Household | 1,498 (88.5%) | 195 (11.5%) |
| 3-Person Household | 555 (80.7%) | 133 (19.3%) |
| 4+ Person Household | 408 (74.1%) | 143 (26.0%) |
| Total Housing Units | 3,672 (80.0%) | 917 (20.0%) |
Occupancy by Educational Attainment in Clear Creek County
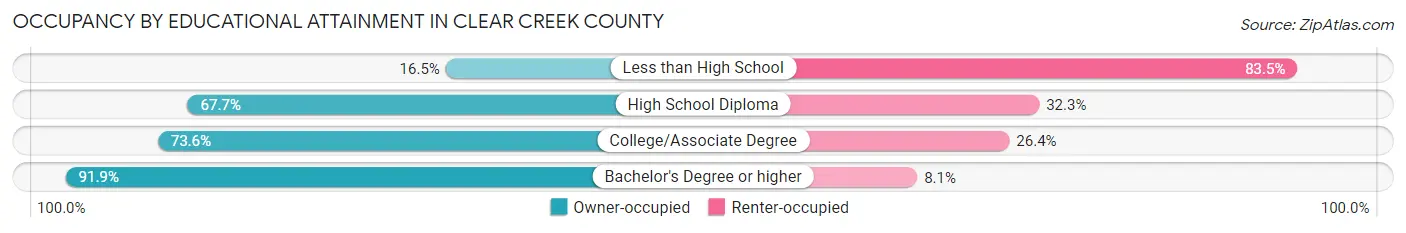
| Household Size | Owner-occupied | Renter-occupied |
| Less than High School | 37 (16.5%) | 187 (83.5%) |
| High School Diploma | 473 (67.7%) | 226 (32.3%) |
| College/Associate Degree | 827 (73.6%) | 297 (26.4%) |
| Bachelor's Degree or higher | 2,335 (91.9%) | 207 (8.1%) |
Occupancy by Age of Householder in Clear Creek County
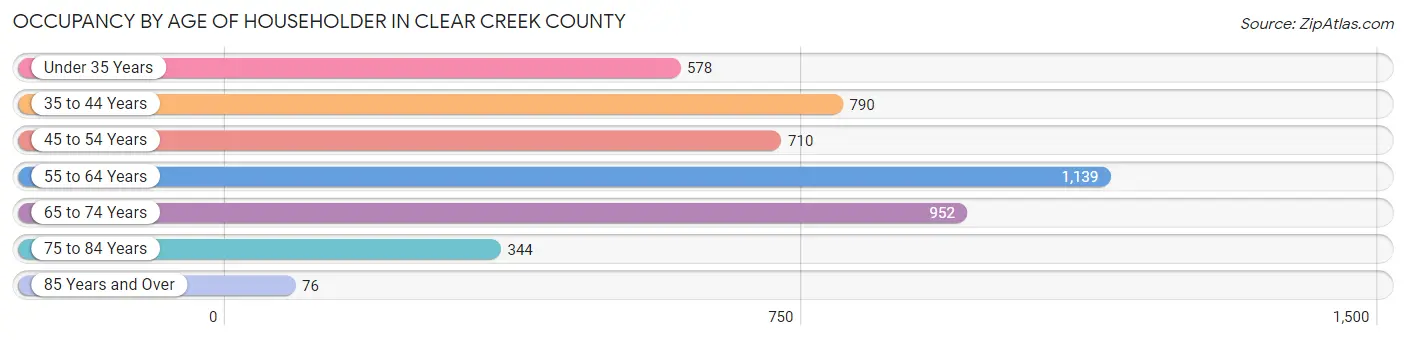
| Age Bracket | # Households | % Households |
| Under 35 Years | 578 | 12.6% |
| 35 to 44 Years | 790 | 17.2% |
| 45 to 54 Years | 710 | 15.5% |
| 55 to 64 Years | 1,139 | 24.8% |
| 65 to 74 Years | 952 | 20.7% |
| 75 to 84 Years | 344 | 7.5% |
| 85 Years and Over | 76 | 1.7% |
| Total | 4,589 | 100.0% |
Housing Finances in Clear Creek County
Median Income by Occupancy in Clear Creek County
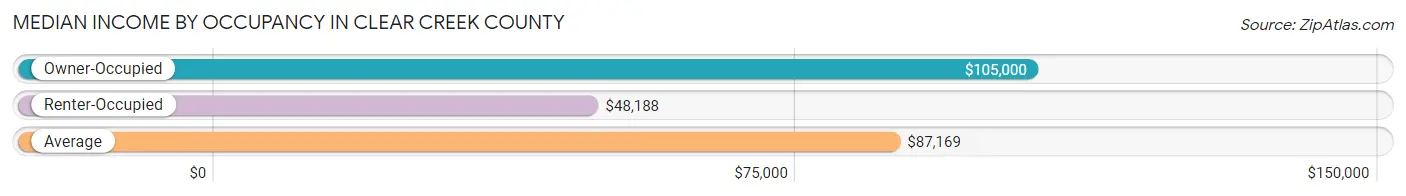
| Occupancy Type | # Households | Median Income |
| Owner-Occupied | 3,672 (80.0%) | $105,000 |
| Renter-Occupied | 917 (20.0%) | $48,188 |
| Average | 4,589 (100.0%) | $87,169 |
Occupancy by Householder Income Bracket in Clear Creek County
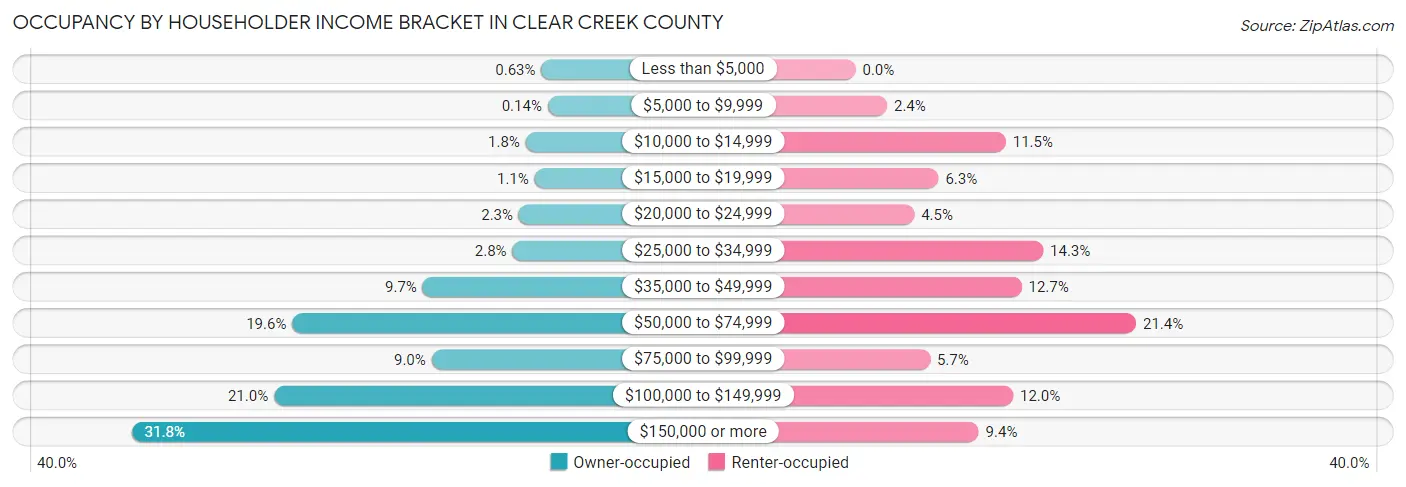
| Income Bracket | Owner-occupied | Renter-occupied |
| Less than $5,000 | 23 (0.6%) | 0 (0.0%) |
| $5,000 to $9,999 | 5 (0.1%) | 22 (2.4%) |
| $10,000 to $14,999 | 67 (1.8%) | 105 (11.5%) |
| $15,000 to $19,999 | 42 (1.1%) | 58 (6.3%) |
| $20,000 to $24,999 | 86 (2.3%) | 41 (4.5%) |
| $25,000 to $34,999 | 104 (2.8%) | 131 (14.3%) |
| $35,000 to $49,999 | 355 (9.7%) | 116 (12.7%) |
| $50,000 to $74,999 | 720 (19.6%) | 196 (21.4%) |
| $75,000 to $99,999 | 330 (9.0%) | 52 (5.7%) |
| $100,000 to $149,999 | 771 (21.0%) | 110 (12.0%) |
| $150,000 or more | 1,169 (31.8%) | 86 (9.4%) |
| Total | 3,672 (100.0%) | 917 (100.0%) |
Monthly Housing Cost Tiers in Clear Creek County
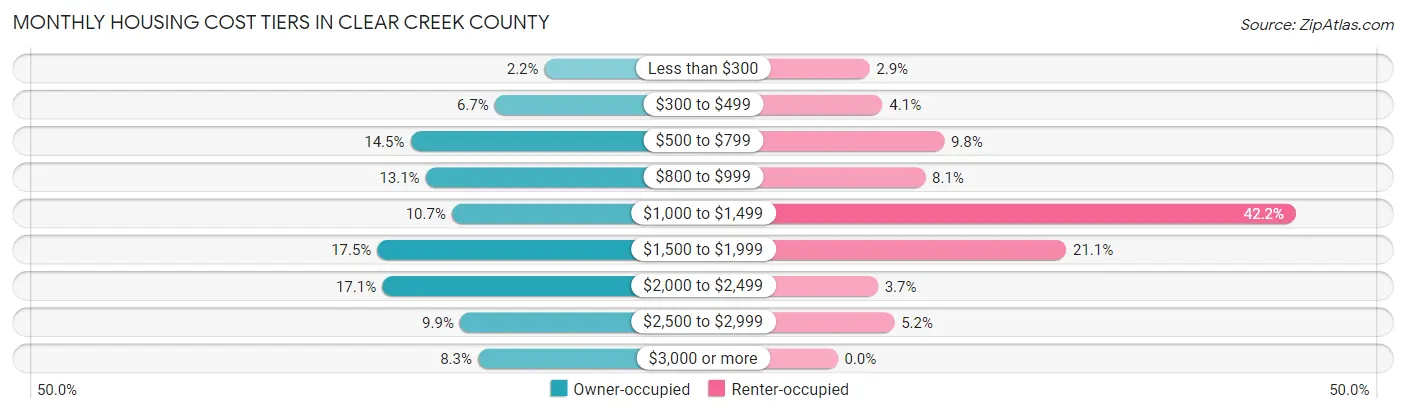
| Monthly Cost | Owner-occupied | Renter-occupied |
| Less than $300 | 79 (2.1%) | 27 (2.9%) |
| $300 to $499 | 247 (6.7%) | 38 (4.1%) |
| $500 to $799 | 532 (14.5%) | 90 (9.8%) |
| $800 to $999 | 481 (13.1%) | 74 (8.1%) |
| $1,000 to $1,499 | 392 (10.7%) | 387 (42.2%) |
| $1,500 to $1,999 | 644 (17.5%) | 193 (21.0%) |
| $2,000 to $2,499 | 628 (17.1%) | 34 (3.7%) |
| $2,500 to $2,999 | 365 (9.9%) | 48 (5.2%) |
| $3,000 or more | 304 (8.3%) | 0 (0.0%) |
| Total | 3,672 (100.0%) | 917 (100.0%) |
Physical Housing Characteristics in Clear Creek County
Housing Structures in Clear Creek County
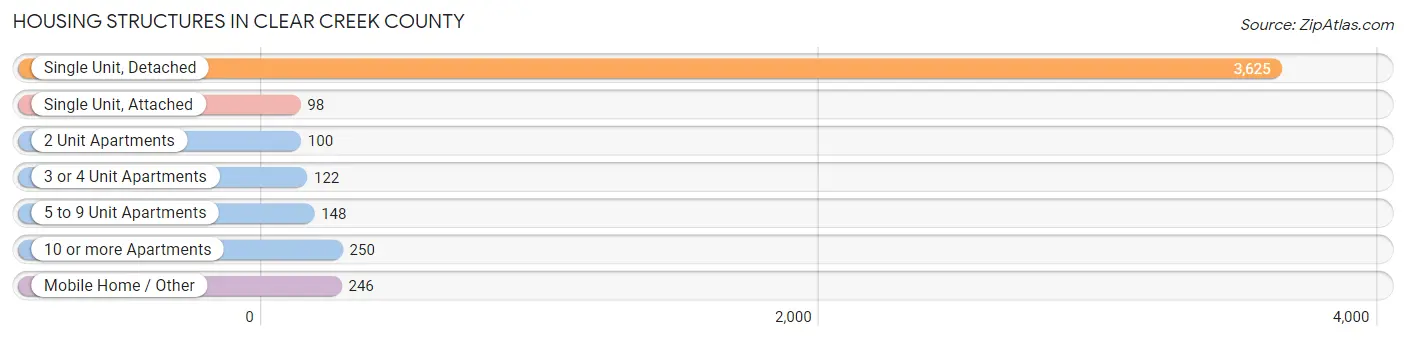
| Structure Type | # Housing Units | % Housing Units |
| Single Unit, Detached | 3,625 | 79.0% |
| Single Unit, Attached | 98 | 2.1% |
| 2 Unit Apartments | 100 | 2.2% |
| 3 or 4 Unit Apartments | 122 | 2.7% |
| 5 to 9 Unit Apartments | 148 | 3.2% |
| 10 or more Apartments | 250 | 5.4% |
| Mobile Home / Other | 246 | 5.4% |
| Total | 4,589 | 100.0% |
Housing Structures by Occupancy in Clear Creek County
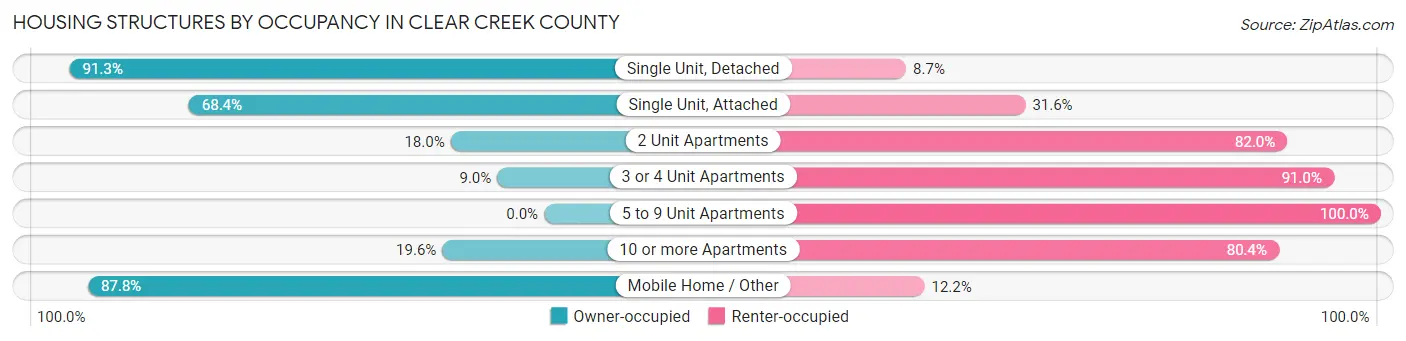
| Structure Type | Owner-occupied | Renter-occupied |
| Single Unit, Detached | 3,311 (91.3%) | 314 (8.7%) |
| Single Unit, Attached | 67 (68.4%) | 31 (31.6%) |
| 2 Unit Apartments | 18 (18.0%) | 82 (82.0%) |
| 3 or 4 Unit Apartments | 11 (9.0%) | 111 (91.0%) |
| 5 to 9 Unit Apartments | 0 (0.0%) | 148 (100.0%) |
| 10 or more Apartments | 49 (19.6%) | 201 (80.4%) |
| Mobile Home / Other | 216 (87.8%) | 30 (12.2%) |
| Total | 3,672 (80.0%) | 917 (20.0%) |
Housing Structures by Number of Rooms in Clear Creek County
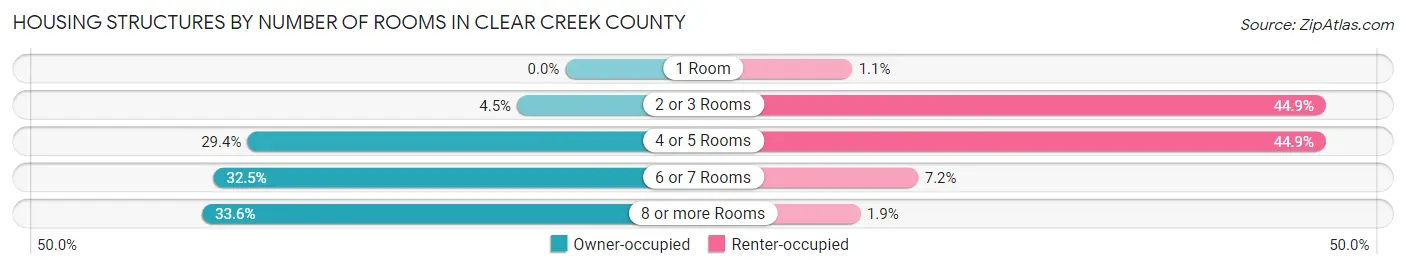
| Number of Rooms | Owner-occupied | Renter-occupied |
| 1 Room | 0 (0.0%) | 10 (1.1%) |
| 2 or 3 Rooms | 164 (4.5%) | 412 (44.9%) |
| 4 or 5 Rooms | 1,080 (29.4%) | 412 (44.9%) |
| 6 or 7 Rooms | 1,195 (32.5%) | 66 (7.2%) |
| 8 or more Rooms | 1,233 (33.6%) | 17 (1.8%) |
| Total | 3,672 (100.0%) | 917 (100.0%) |
Housing Structure by Heating Type in Clear Creek County
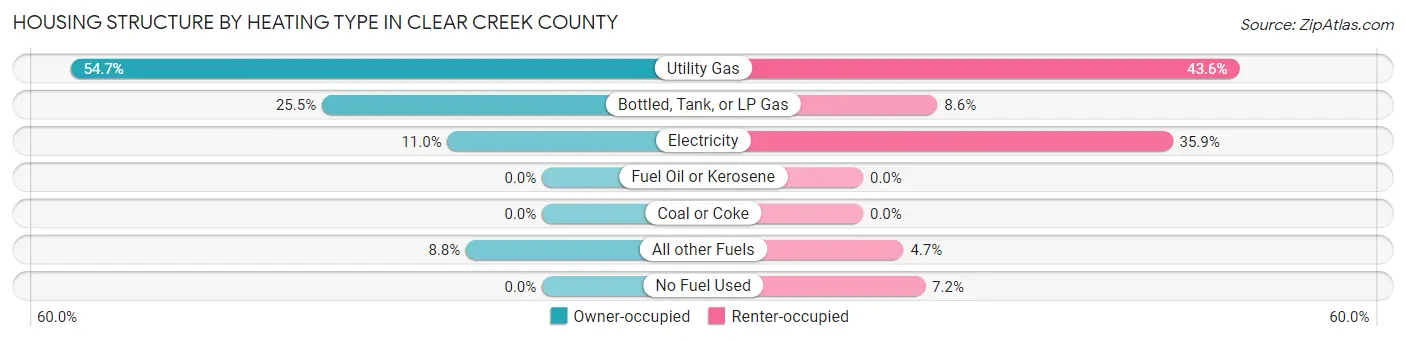
| Heating Type | Owner-occupied | Renter-occupied |
| Utility Gas | 2,008 (54.7%) | 400 (43.6%) |
| Bottled, Tank, or LP Gas | 937 (25.5%) | 79 (8.6%) |
| Electricity | 403 (11.0%) | 329 (35.9%) |
| Fuel Oil or Kerosene | 0 (0.0%) | 0 (0.0%) |
| Coal or Coke | 0 (0.0%) | 0 (0.0%) |
| All other Fuels | 324 (8.8%) | 43 (4.7%) |
| No Fuel Used | 0 (0.0%) | 66 (7.2%) |
| Total | 3,672 (100.0%) | 917 (100.0%) |
Household Vehicle Usage in Clear Creek County
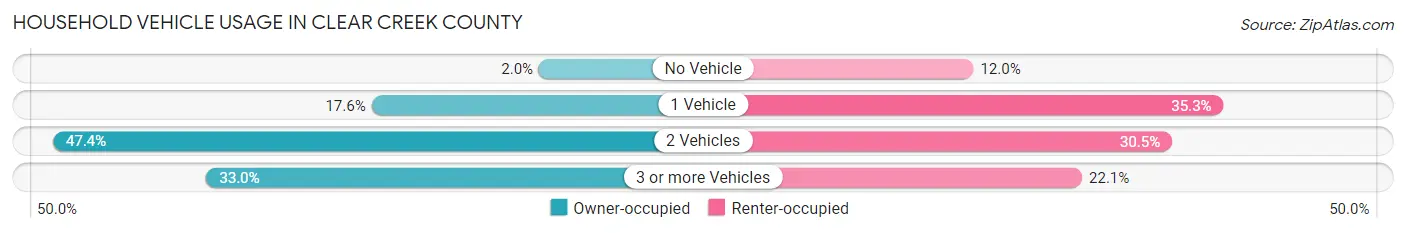
| Vehicles per Household | Owner-occupied | Renter-occupied |
| No Vehicle | 73 (2.0%) | 110 (12.0%) |
| 1 Vehicle | 647 (17.6%) | 324 (35.3%) |
| 2 Vehicles | 1,739 (47.4%) | 280 (30.5%) |
| 3 or more Vehicles | 1,213 (33.0%) | 203 (22.1%) |
| Total | 3,672 (100.0%) | 917 (100.0%) |
Real Estate & Mortgages in Clear Creek County
Real Estate and Mortgage Overview in Clear Creek County
| Characteristic | Without Mortgage | With Mortgage |
| Housing Units | 1,397 | 2,275 |
| Median Property Value | $590,400 | $484,800 |
| Median Household Income | $83,750 | $801 |
| Monthly Housing Costs | $706 | $285 |
| Real Estate Taxes | $1,943 | $16 |
Property Value by Mortgage Status in Clear Creek County
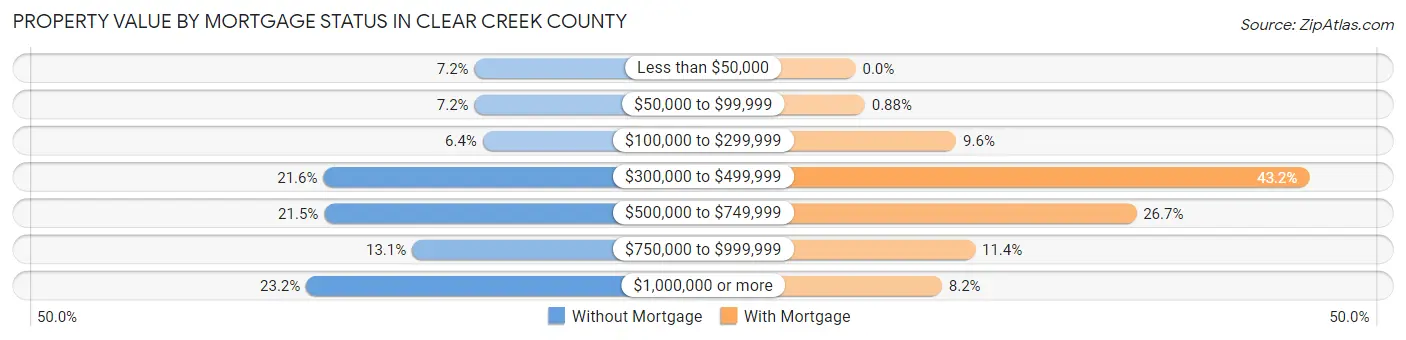
| Property Value | Without Mortgage | With Mortgage |
| Less than $50,000 | 100 (7.2%) | 0 (0.0%) |
| $50,000 to $99,999 | 100 (7.2%) | 20 (0.9%) |
| $100,000 to $299,999 | 89 (6.4%) | 218 (9.6%) |
| $300,000 to $499,999 | 301 (21.5%) | 983 (43.2%) |
| $500,000 to $749,999 | 300 (21.5%) | 608 (26.7%) |
| $750,000 to $999,999 | 183 (13.1%) | 259 (11.4%) |
| $1,000,000 or more | 324 (23.2%) | 187 (8.2%) |
| Total | 1,397 (100.0%) | 2,275 (100.0%) |
Household Income by Mortgage Status in Clear Creek County
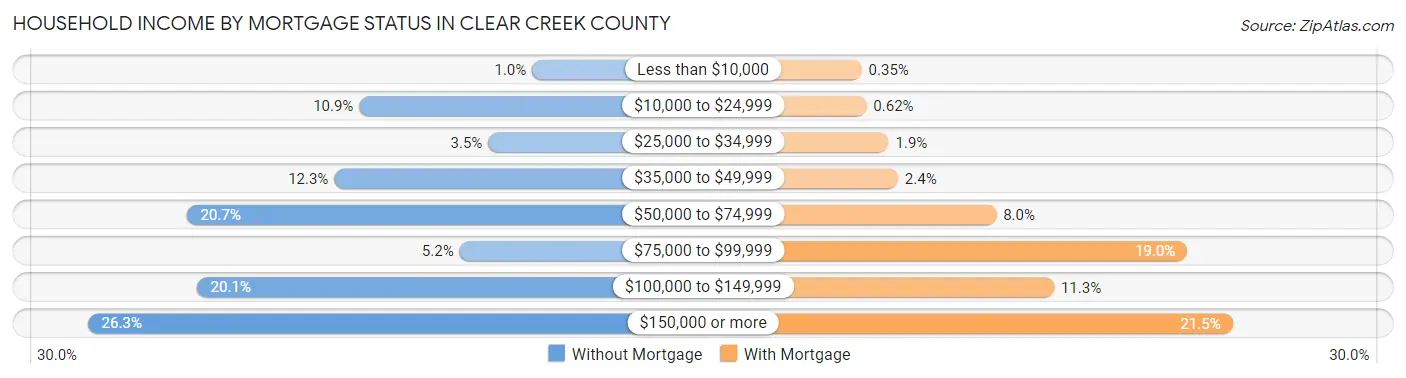
| Household Income | Without Mortgage | With Mortgage |
| Less than $10,000 | 14 (1.0%) | 8 (0.4%) |
| $10,000 to $24,999 | 152 (10.9%) | 14 (0.6%) |
| $25,000 to $34,999 | 49 (3.5%) | 43 (1.9%) |
| $35,000 to $49,999 | 172 (12.3%) | 55 (2.4%) |
| $50,000 to $74,999 | 289 (20.7%) | 183 (8.0%) |
| $75,000 to $99,999 | 72 (5.1%) | 431 (19.0%) |
| $100,000 to $149,999 | 281 (20.1%) | 258 (11.3%) |
| $150,000 or more | 368 (26.3%) | 490 (21.5%) |
| Total | 1,397 (100.0%) | 2,275 (100.0%) |
Property Value to Household Income Ratio in Clear Creek County
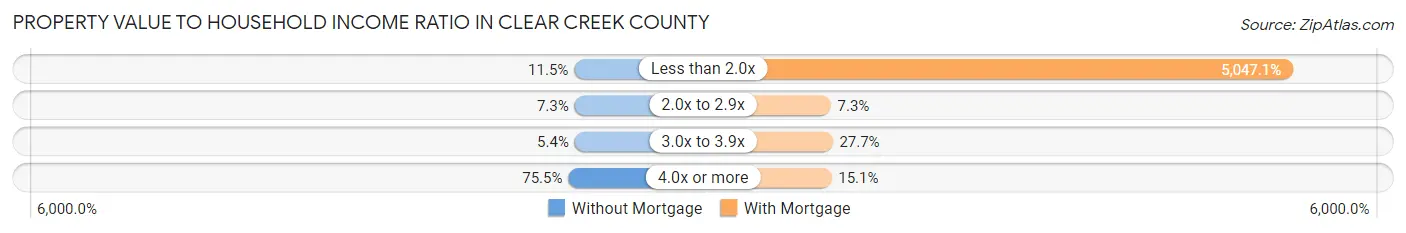
| Value-to-Income Ratio | Without Mortgage | With Mortgage |
| Less than 2.0x | 161 (11.5%) | 114,821 (5,047.1%) |
| 2.0x to 2.9x | 102 (7.3%) | 167 (7.3%) |
| 3.0x to 3.9x | 75 (5.4%) | 629 (27.7%) |
| 4.0x or more | 1,054 (75.4%) | 344 (15.1%) |
| Total | 1,397 (100.0%) | 2,275 (100.0%) |
Real Estate Taxes by Mortgage Status in Clear Creek County
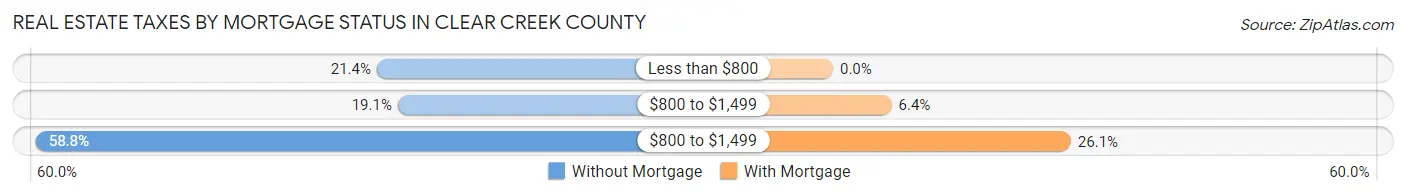
| Property Taxes | Without Mortgage | With Mortgage |
| Less than $800 | 299 (21.4%) | 0 (0.0%) |
| $800 to $1,499 | 267 (19.1%) | 146 (6.4%) |
| $800 to $1,499 | 821 (58.8%) | 593 (26.1%) |
| Total | 1,397 (100.0%) | 2,275 (100.0%) |
Health & Disability in Clear Creek County
Health Insurance Coverage by Age in Clear Creek County
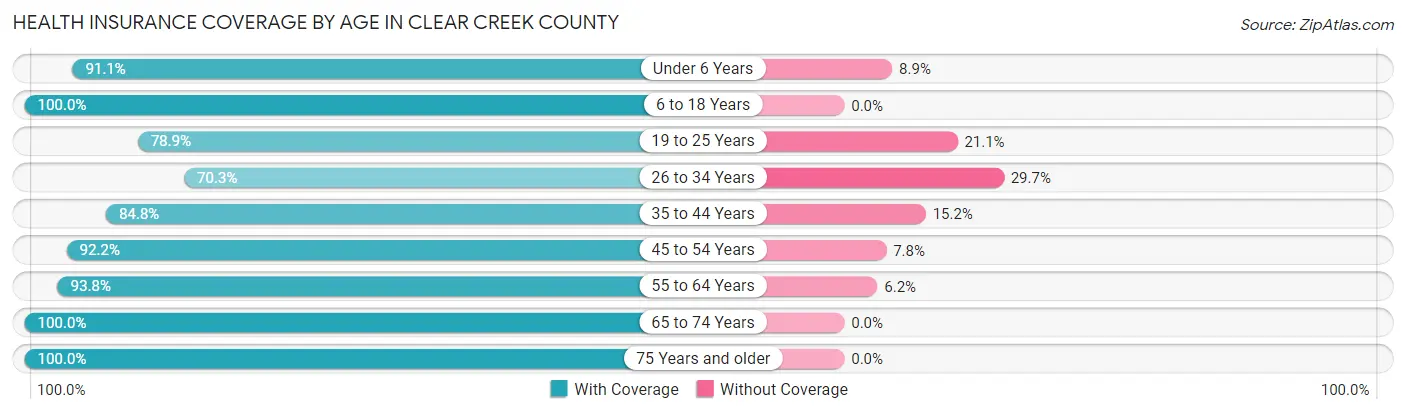
| Age Bracket | With Coverage | Without Coverage |
| Under 6 Years | 265 (91.1%) | 26 (8.9%) |
| 6 to 18 Years | 918 (100.0%) | 0 (0.0%) |
| 19 to 25 Years | 460 (78.9%) | 123 (21.1%) |
| 26 to 34 Years | 695 (70.3%) | 294 (29.7%) |
| 35 to 44 Years | 1,062 (84.8%) | 190 (15.2%) |
| 45 to 54 Years | 1,380 (92.2%) | 117 (7.8%) |
| 55 to 64 Years | 1,690 (93.8%) | 111 (6.2%) |
| 65 to 74 Years | 1,381 (100.0%) | 0 (0.0%) |
| 75 Years and older | 600 (100.0%) | 0 (0.0%) |
| Total | 8,451 (90.7%) | 861 (9.2%) |
Health Insurance Coverage by Citizenship Status in Clear Creek County
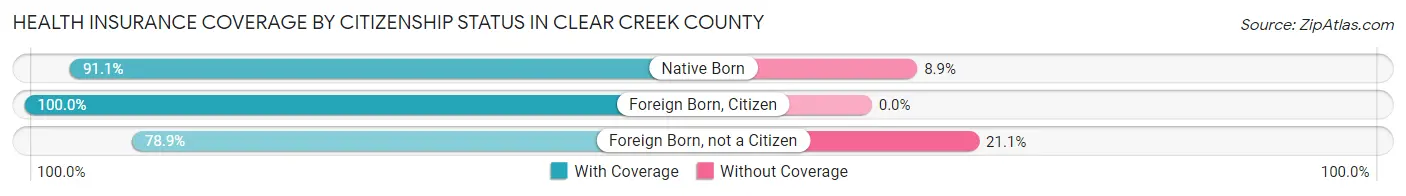
| Citizenship Status | With Coverage | Without Coverage |
| Native Born | 265 (91.1%) | 26 (8.9%) |
| Foreign Born, Citizen | 918 (100.0%) | 0 (0.0%) |
| Foreign Born, not a Citizen | 460 (78.9%) | 123 (21.1%) |
Health Insurance Coverage by Household Income in Clear Creek County
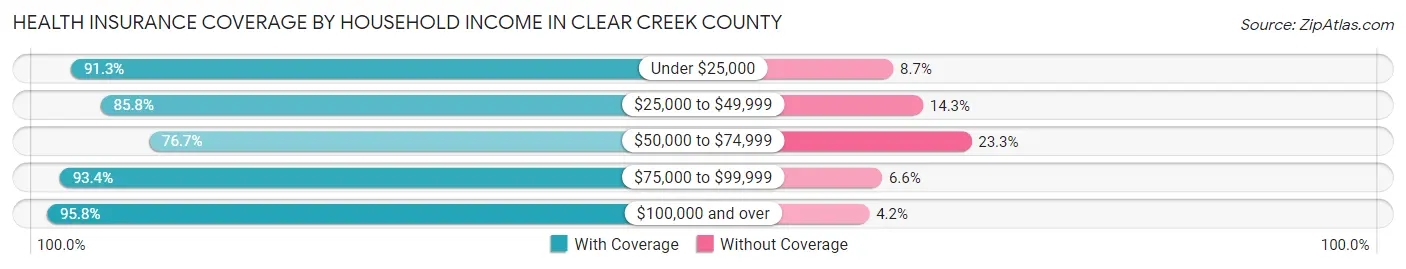
| Household Income | With Coverage | Without Coverage |
| Under $25,000 | 536 (91.3%) | 51 (8.7%) |
| $25,000 to $49,999 | 1,131 (85.8%) | 188 (14.2%) |
| $50,000 to $74,999 | 1,177 (76.7%) | 358 (23.3%) |
| $75,000 to $99,999 | 723 (93.4%) | 51 (6.6%) |
| $100,000 and over | 4,860 (95.8%) | 213 (4.2%) |
Public vs Private Health Insurance Coverage by Age in Clear Creek County
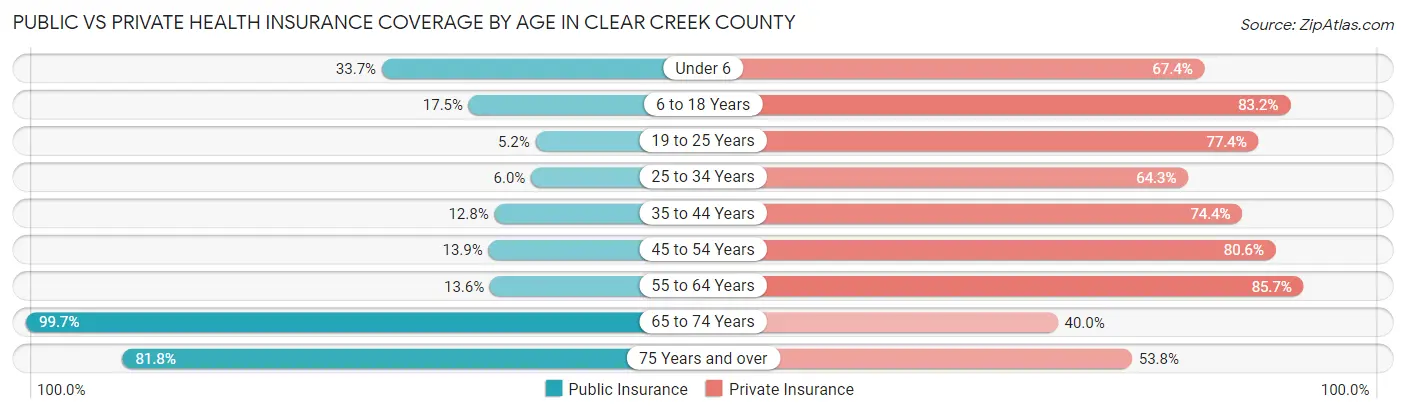
| Age Bracket | Public Insurance | Private Insurance |
| Under 6 | 98 (33.7%) | 196 (67.3%) |
| 6 to 18 Years | 161 (17.5%) | 764 (83.2%) |
| 19 to 25 Years | 30 (5.1%) | 451 (77.4%) |
| 25 to 34 Years | 59 (6.0%) | 636 (64.3%) |
| 35 to 44 Years | 160 (12.8%) | 931 (74.4%) |
| 45 to 54 Years | 208 (13.9%) | 1,206 (80.6%) |
| 55 to 64 Years | 245 (13.6%) | 1,544 (85.7%) |
| 65 to 74 Years | 1,377 (99.7%) | 553 (40.0%) |
| 75 Years and over | 491 (81.8%) | 323 (53.8%) |
| Total | 2,829 (30.4%) | 6,604 (70.9%) |
Disability Status by Sex by Age in Clear Creek County
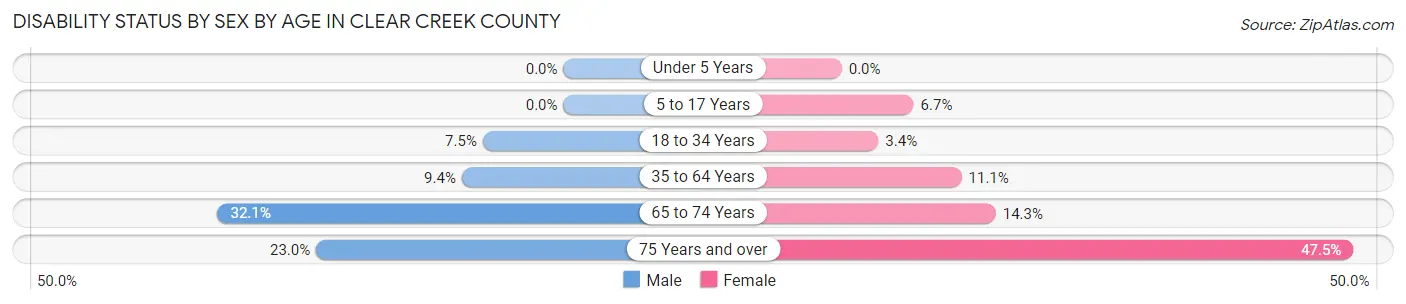
| Age Bracket | Male | Female |
| Under 5 Years | 0 (0.0%) | 0 (0.0%) |
| 5 to 17 Years | 0 (0.0%) | 25 (6.7%) |
| 18 to 34 Years | 66 (7.5%) | 27 (3.4%) |
| 35 to 64 Years | 206 (9.4%) | 263 (11.1%) |
| 65 to 74 Years | 232 (32.1%) | 94 (14.3%) |
| 75 Years and over | 70 (23.0%) | 140 (47.5%) |
Disability Class by Sex by Age in Clear Creek County
Disability Class: Hearing Difficulty
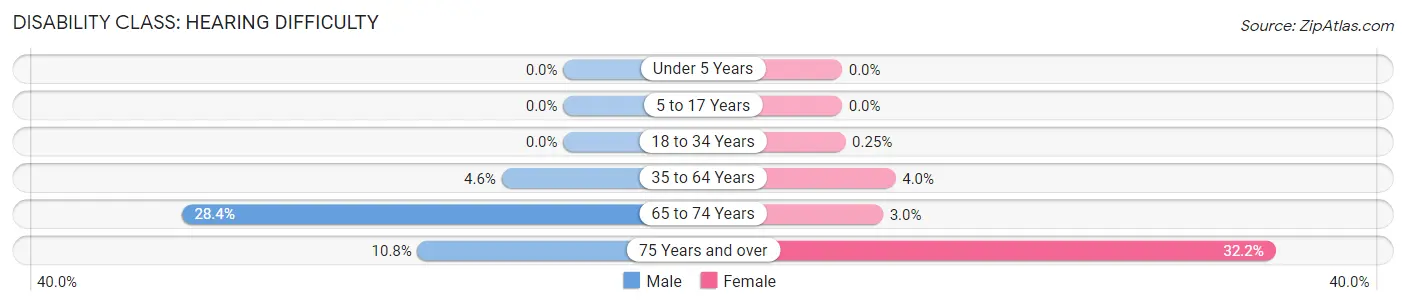
| Age Bracket | Male | Female |
| Under 5 Years | 0 (0.0%) | 0 (0.0%) |
| 5 to 17 Years | 0 (0.0%) | 0 (0.0%) |
| 18 to 34 Years | 0 (0.0%) | 2 (0.3%) |
| 35 to 64 Years | 100 (4.6%) | 94 (4.0%) |
| 65 to 74 Years | 205 (28.3%) | 20 (3.0%) |
| 75 Years and over | 33 (10.8%) | 95 (32.2%) |
Disability Class: Vision Difficulty
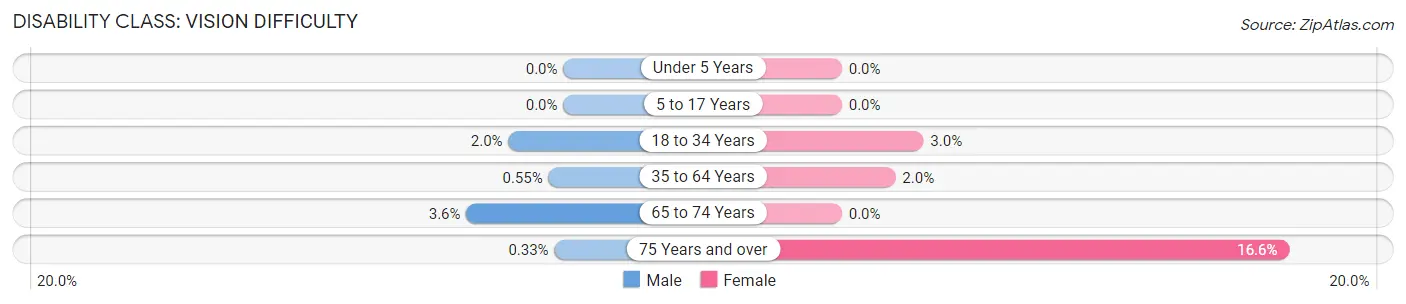
| Age Bracket | Male | Female |
| Under 5 Years | 0 (0.0%) | 0 (0.0%) |
| 5 to 17 Years | 0 (0.0%) | 0 (0.0%) |
| 18 to 34 Years | 18 (2.0%) | 24 (3.0%) |
| 35 to 64 Years | 12 (0.5%) | 47 (2.0%) |
| 65 to 74 Years | 26 (3.6%) | 0 (0.0%) |
| 75 Years and over | 1 (0.3%) | 49 (16.6%) |
Disability Class: Cognitive Difficulty
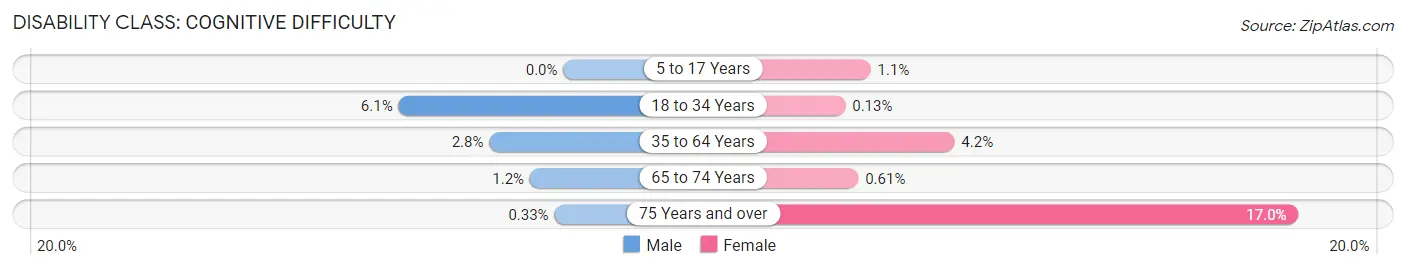
| Age Bracket | Male | Female |
| 5 to 17 Years | 0 (0.0%) | 4 (1.1%) |
| 18 to 34 Years | 54 (6.1%) | 1 (0.1%) |
| 35 to 64 Years | 60 (2.8%) | 99 (4.2%) |
| 65 to 74 Years | 9 (1.2%) | 4 (0.6%) |
| 75 Years and over | 1 (0.3%) | 50 (17.0%) |
Disability Class: Ambulatory Difficulty
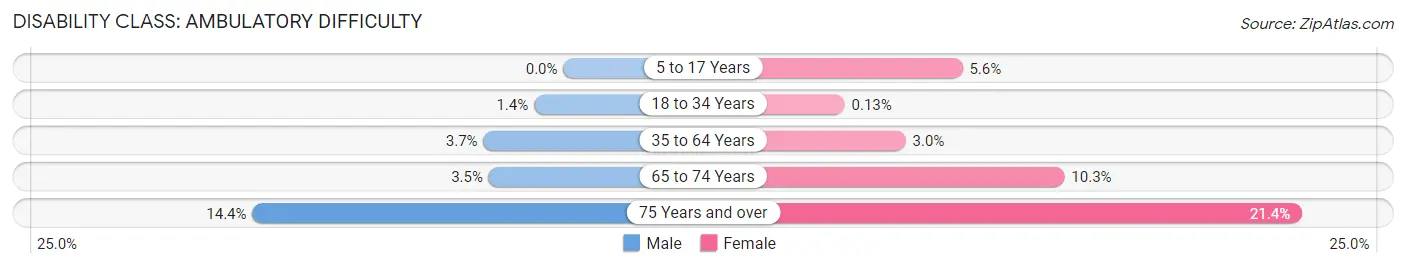
| Age Bracket | Male | Female |
| 5 to 17 Years | 0 (0.0%) | 21 (5.6%) |
| 18 to 34 Years | 12 (1.4%) | 1 (0.1%) |
| 35 to 64 Years | 81 (3.7%) | 70 (3.0%) |
| 65 to 74 Years | 25 (3.5%) | 68 (10.3%) |
| 75 Years and over | 44 (14.4%) | 63 (21.4%) |
Disability Class: Self-Care Difficulty
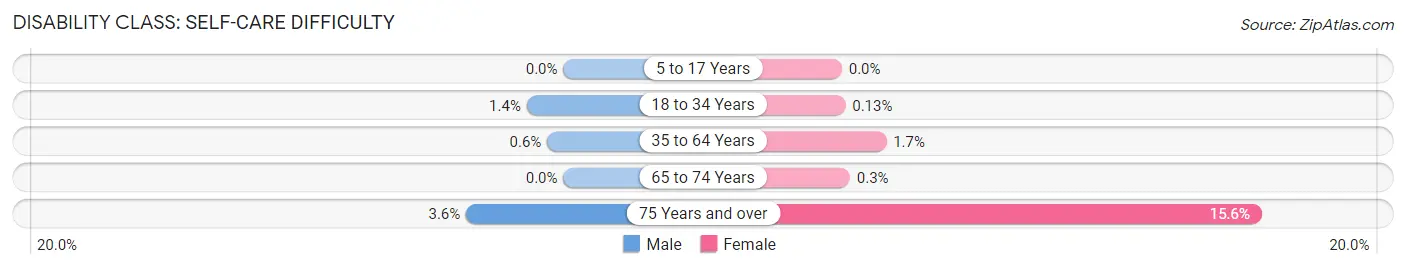
| Age Bracket | Male | Female |
| 5 to 17 Years | 0 (0.0%) | 0 (0.0%) |
| 18 to 34 Years | 12 (1.4%) | 1 (0.1%) |
| 35 to 64 Years | 13 (0.6%) | 39 (1.7%) |
| 65 to 74 Years | 0 (0.0%) | 2 (0.3%) |
| 75 Years and over | 11 (3.6%) | 46 (15.6%) |
Technology Access in Clear Creek County
Computing Device Access in Clear Creek County
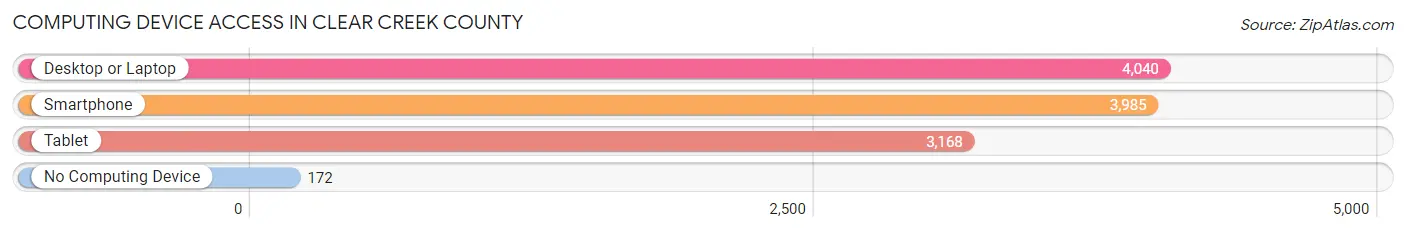
| Device Type | # Households | % Households |
| Desktop or Laptop | 4,040 | 88.0% |
| Smartphone | 3,985 | 86.8% |
| Tablet | 3,168 | 69.0% |
| No Computing Device | 172 | 3.7% |
| Total | 4,589 | 100.0% |
Internet Access in Clear Creek County
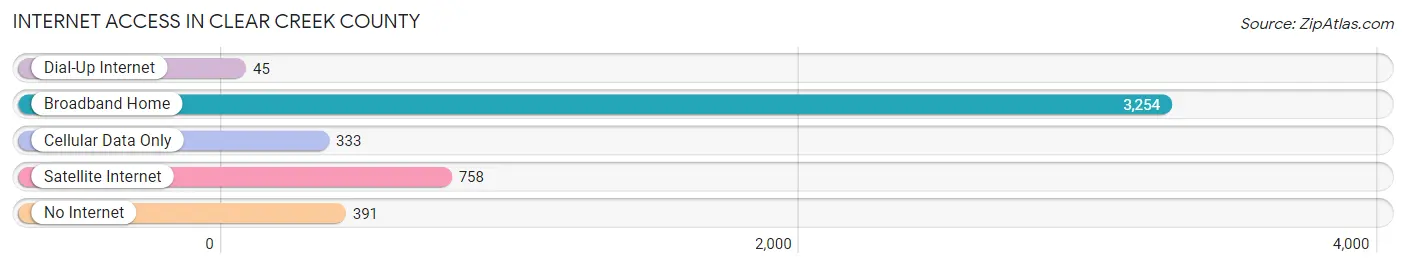
| Internet Type | # Households | % Households |
| Dial-Up Internet | 45 | 1.0% |
| Broadband Home | 3,254 | 70.9% |
| Cellular Data Only | 333 | 7.3% |
| Satellite Internet | 758 | 16.5% |
| No Internet | 391 | 8.5% |
| Total | 4,589 | 100.0% |
Clear Creek County Summary
Introduction
Clear Creek County is located in the central Rocky Mountains of Colorado, just west of Denver. It is bordered by Gilpin County to the north, Jefferson County to the east, Park County to the south, and Summit County to the west. The county seat is Georgetown, and the largest city is Idaho Springs. Clear Creek County is known for its rugged mountain terrain, its abundance of outdoor recreational opportunities, and its rich mining history.
History
Clear Creek County was established in 1861 as one of the original 17 counties of the Colorado Territory. The county was named for Clear Creek, a tributary of the South Platte River that runs through the county. The county was originally inhabited by the Ute and Arapaho tribes, who were later displaced by settlers in the late 19th century.
The first settlers in the area were miners, drawn to the area by the discovery of gold in 1859. The gold rush brought thousands of prospectors to the area, and the population of the county quickly grew. The town of Georgetown was established in 1859, and the town of Idaho Springs was established in 1859.
The mining industry continued to be the main economic driver of the county until the late 20th century. In the 1970s, the county began to diversify its economy, and tourism and recreation became increasingly important. The county is now home to several ski resorts, including Loveland Ski Area and Arapahoe Basin Ski Area.
Geography
Clear Creek County is located in the central Rocky Mountains of Colorado. The county is bordered by Gilpin County to the north, Jefferson County to the east, Park County to the south, and Summit County to the west. The county covers an area of 845 square miles, and is home to several mountain peaks, including Mount Evans, Grays Peak, and Torreys Peak.
The county is home to several rivers and streams, including Clear Creek, which runs through the county from north to south. The county is also home to several reservoirs, including Lake Dillon, Green Mountain Reservoir, and Williams Fork Reservoir.
Economy
Clear Creek County’s economy is largely driven by tourism and recreation. The county is home to several ski resorts, including Loveland Ski Area and Arapahoe Basin Ski Area. The county is also home to several popular hiking and camping areas, including Mount Evans Wilderness Area and Golden Gate Canyon State Park.
The county is also home to several mining operations, including the Henderson Mine, the Climax Mine, and the Empire Mine. The county is also home to several manufacturing companies, including the Coors Brewing Company and the Rocky Mountain Chocolate Factory.
Demographics
As of the 2010 census, the population of Clear Creek County was 9,088. The population is largely white (93.3%), with small percentages of Hispanic (2.7%), African American (1.2%), and Native American (0.7%) populations. The median household income in the county is $60,945, and the median home value is $310,000.
Conclusion
Clear Creek County is located in the central Rocky Mountains of Colorado, just west of Denver. The county is known for its rugged mountain terrain, its abundance of outdoor recreational opportunities, and its rich mining history. The county’s economy is largely driven by tourism and recreation, and the county is home to several ski resorts, mining operations, and manufacturing companies. The population of the county is largely white, with small percentages of Hispanic, African American, and Native American populations.
Common Questions
What is Per Capita Income in Clear Creek County?
Per Capita income in Clear Creek County is $59,550.
What is the Median Family Income in Clear Creek County?
Median Family Income in Clear Creek County is $123,354.
What is the Median Household income in Clear Creek County?
Median Household Income in Clear Creek County is $87,169.
What is Income or Wage Gap in Clear Creek County?
Income or Wage Gap in Clear Creek County is 7.2%.
Women in Clear Creek County earn 92.8 cents for every dollar earned by a man.
What is Inequality or Gini Index in Clear Creek County?
Inequality or Gini Index in Clear Creek County is 0.44.
What is the Total Population of Clear Creek County?
Total Population of Clear Creek County is 9,403.
What is the Total Male Population of Clear Creek County?
Total Male Population of Clear Creek County is 4,773.
What is the Total Female Population of Clear Creek County?
Total Female Population of Clear Creek County is 4,630.
What is the Ratio of Males per 100 Females in Clear Creek County?
There are 103.09 Males per 100 Females in Clear Creek County.
What is the Ratio of Females per 100 Males in Clear Creek County?
There are 97.00 Females per 100 Males in Clear Creek County.
What is the Median Population Age in Clear Creek County?
Median Population Age in Clear Creek County is 49.5 Years.
What is the Average Family Size in Clear Creek County
Average Family Size in Clear Creek County is 2.6 People.
What is the Average Household Size in Clear Creek County
Average Household Size in Clear Creek County is 2.0 People.
How Large is the Labor Force in Clear Creek County?
There are 5,879 People in the Labor Forcein in Clear Creek County.
What is the Percentage of People in the Labor Force in Clear Creek County?
69.3% of People are in the Labor Force in Clear Creek County.
What is the Unemployment Rate in Clear Creek County?
Unemployment Rate in Clear Creek County is 4.7%.