Cheyenne County, CO Map & Demographics
Cheyenne County Map
Cheyenne County Overview
$38,791
PER CAPITA INCOME
$88,125
AVG FAMILY INCOME
$65,577
AVG HOUSEHOLD INCOME
45.8%
WAGE / INCOME GAP [ % ]
54.2¢/ $1
WAGE / INCOME GAP [ $ ]
0.43
INEQUALITY / GINI INDEX
1,726
TOTAL POPULATION
859
MALE POPULATION
867
FEMALE POPULATION
99.08
MALES / 100 FEMALES
100.93
FEMALES / 100 MALES
43.2
MEDIAN AGE
3.0
AVG FAMILY SIZE
2.3
AVG HOUSEHOLD SIZE
905
LABOR FORCE [ PEOPLE ]
67.7%
PERCENT IN LABOR FORCE
2.1%
UNEMPLOYMENT RATE
Cheyenne County Area Codes
Income in Cheyenne County
Income Overview in Cheyenne County
Per Capita Income in Cheyenne County is $38,791, while median incomes of families and households are $88,125 and $65,577 respectively.
| Characteristic | Number | Measure |
| Per Capita Income | 1,726 | $38,791 |
| Median Family Income | 471 | $88,125 |
| Mean Family Income | 471 | $99,614 |
| Median Household Income | 740 | $65,577 |
| Mean Household Income | 740 | $84,245 |
| Income Deficit | 471 | $0 |
| Wage / Income Gap (%) | 1,726 | 45.85% |
| Wage / Income Gap ($) | 1,726 | 54.15¢ per $1 |
| Gini / Inequality Index | 1,726 | 0.43 |
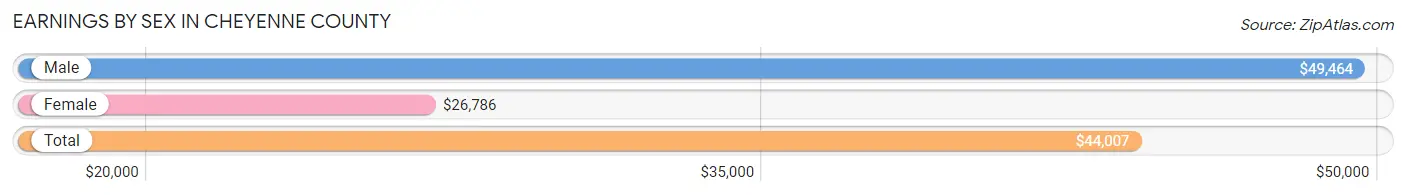
Earnings by Sex in Cheyenne County
Average Earnings in Cheyenne County are $44,007, $49,464 for men and $26,786 for women, a difference of 45.9%.
| Sex | Number | Average Earnings |
| Male | 549 (57.6%) | $49,464 |
| Female | 404 (42.4%) | $26,786 |
| Total | 953 (100.0%) | $44,007 |
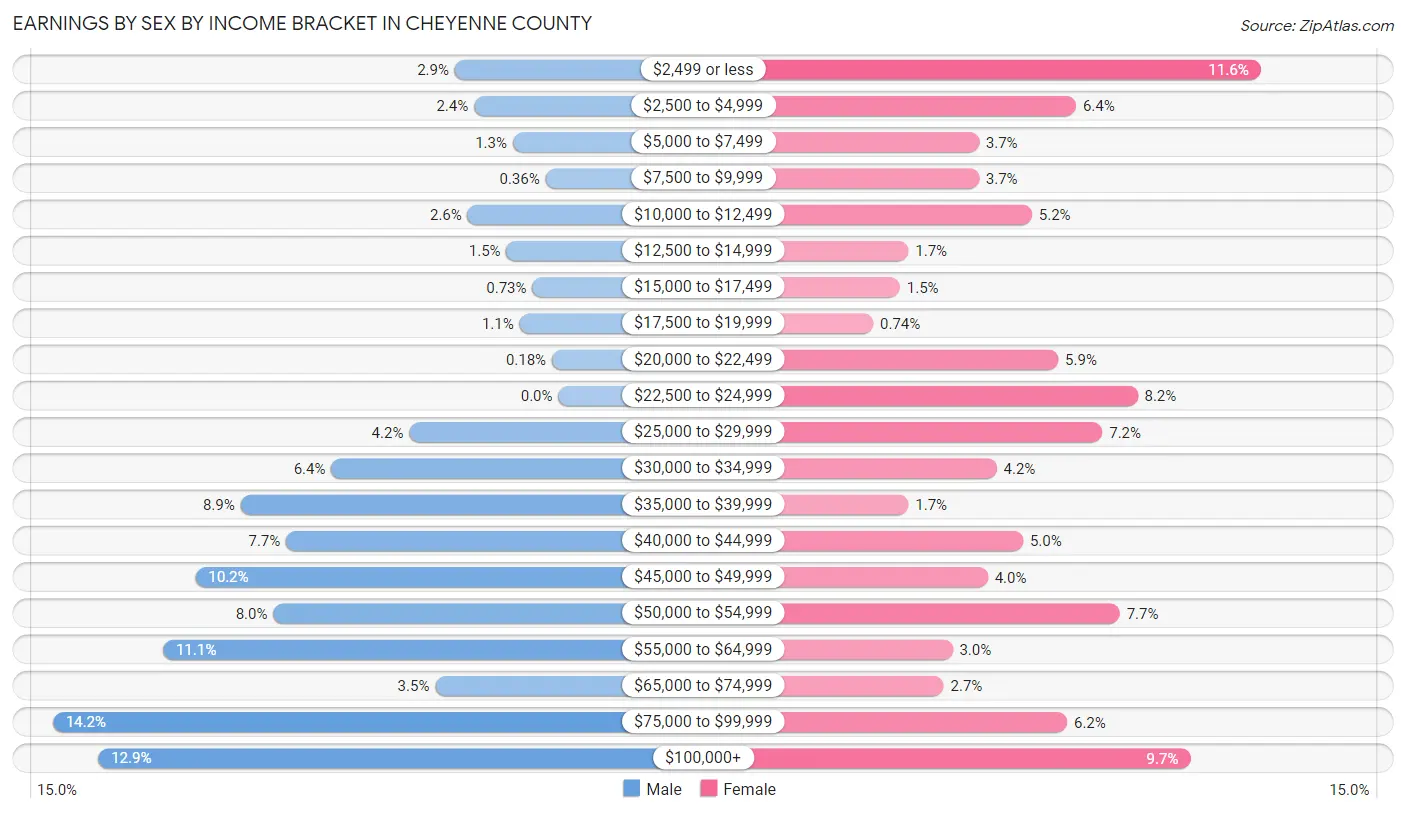
Earnings by Sex by Income Bracket in Cheyenne County
The most common earnings brackets in Cheyenne County are $75,000 to $99,999 for men (78 | 14.2%) and $2,499 or less for women (47 | 11.6%).
| Income | Male | Female |
| $2,499 or less | 16 (2.9%) | 47 (11.6%) |
| $2,500 to $4,999 | 13 (2.4%) | 26 (6.4%) |
| $5,000 to $7,499 | 7 (1.3%) | 15 (3.7%) |
| $7,500 to $9,999 | 2 (0.4%) | 15 (3.7%) |
| $10,000 to $12,499 | 14 (2.5%) | 21 (5.2%) |
| $12,500 to $14,999 | 8 (1.5%) | 7 (1.7%) |
| $15,000 to $17,499 | 4 (0.7%) | 6 (1.5%) |
| $17,500 to $19,999 | 6 (1.1%) | 3 (0.7%) |
| $20,000 to $22,499 | 1 (0.2%) | 24 (5.9%) |
| $22,500 to $24,999 | 0 (0.0%) | 33 (8.2%) |
| $25,000 to $29,999 | 23 (4.2%) | 29 (7.2%) |
| $30,000 to $34,999 | 35 (6.4%) | 17 (4.2%) |
| $35,000 to $39,999 | 49 (8.9%) | 7 (1.7%) |
| $40,000 to $44,999 | 42 (7.6%) | 20 (5.0%) |
| $45,000 to $49,999 | 56 (10.2%) | 16 (4.0%) |
| $50,000 to $54,999 | 44 (8.0%) | 31 (7.7%) |
| $55,000 to $64,999 | 61 (11.1%) | 12 (3.0%) |
| $65,000 to $74,999 | 19 (3.5%) | 11 (2.7%) |
| $75,000 to $99,999 | 78 (14.2%) | 25 (6.2%) |
| $100,000+ | 71 (12.9%) | 39 (9.7%) |
| Total | 549 (100.0%) | 404 (100.0%) |
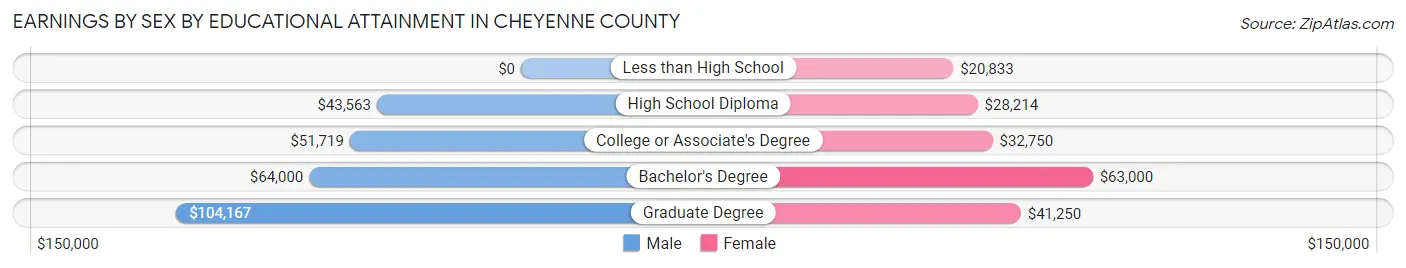
Earnings by Sex by Educational Attainment in Cheyenne County
Average earnings in Cheyenne County are $51,548 for men and $33,229 for women, a difference of 35.5%. Men with an educational attainment of graduate degree enjoy the highest average annual earnings of $104,167, while those with high school diploma education earn the least with $43,563. Women with an educational attainment of bachelor's degree earn the most with the average annual earnings of $63,000, while those with less than high school education have the smallest earnings of $20,833.
| Educational Attainment | Male Income | Female Income |
| Less than High School | - | - |
| High School Diploma | $43,563 | $28,214 |
| College or Associate's Degree | $51,719 | $32,750 |
| Bachelor's Degree | $64,000 | $63,000 |
| Graduate Degree | $104,167 | $41,250 |
| Total | $51,548 | $33,229 |
Family Income in Cheyenne County
Family Income Brackets in Cheyenne County
According to the Cheyenne County family income data, there are 124 families falling into the $75,000 to $99,999 income range, which is the most common income bracket and makes up 26.3% of all families. Conversely, the $10,000 to $14,999 income bracket is the least frequent group with only 13 families (2.8%) belonging to this category.
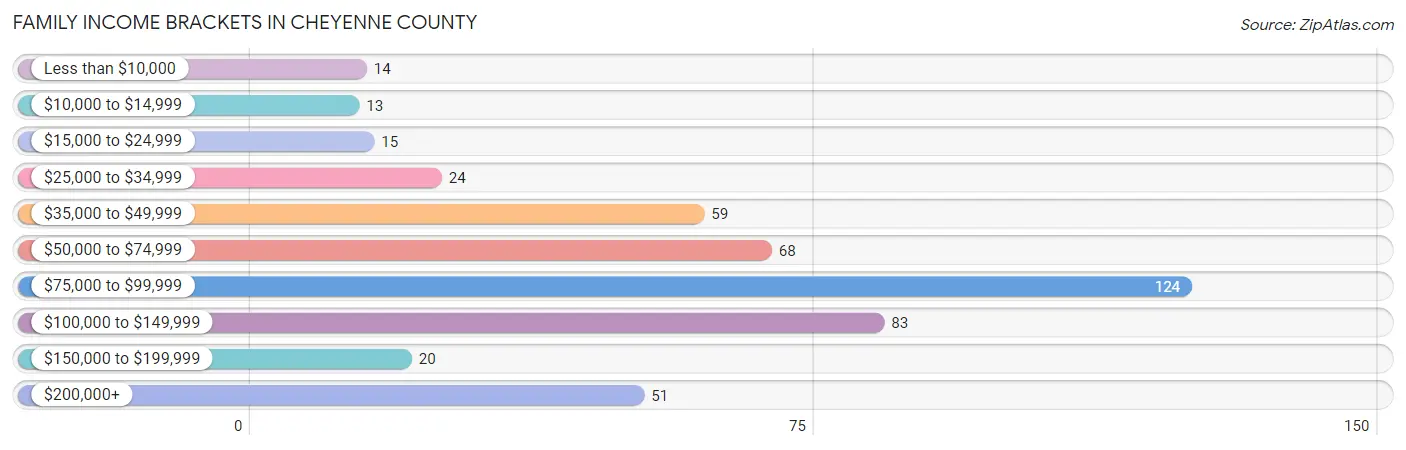
| Income Bracket | # Families | % Families |
| Less than $10,000 | 14 | 3.0% |
| $10,000 to $14,999 | 13 | 2.8% |
| $15,000 to $24,999 | 15 | 3.2% |
| $25,000 to $34,999 | 24 | 5.1% |
| $35,000 to $49,999 | 59 | 12.5% |
| $50,000 to $74,999 | 68 | 14.4% |
| $75,000 to $99,999 | 124 | 26.3% |
| $100,000 to $149,999 | 83 | 17.6% |
| $150,000 to $199,999 | 20 | 4.2% |
| $200,000+ | 51 | 10.8% |
Family Income by Famaliy Size in Cheyenne County
5-person families (58 | 12.3%) account for the highest median family income in Cheyenne County with $104,375 per family, while 2-person families (301 | 63.9%) have the highest median income of $46,658 per family member.
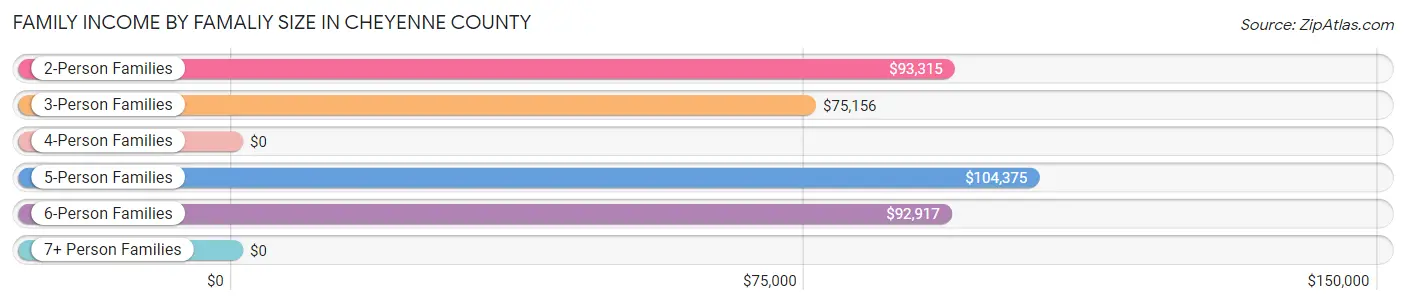
| Income Bracket | # Families | Median Income |
| 2-Person Families | 301 (63.9%) | $93,315 |
| 3-Person Families | 62 (13.2%) | $75,156 |
| 4-Person Families | 37 (7.9%) | $0 |
| 5-Person Families | 58 (12.3%) | $104,375 |
| 6-Person Families | 11 (2.3%) | $92,917 |
| 7+ Person Families | 2 (0.4%) | $0 |
| Total | 471 (100.0%) | $88,125 |
Family Income by Number of Earners in Cheyenne County
The median family income in Cheyenne County is $88,125, with families comprising 3+ earners (31) having the highest median family income of $108,281, while families with no earners (46) have the lowest median family income of $27,500, accounting for 6.6% and 9.8% of families, respectively.
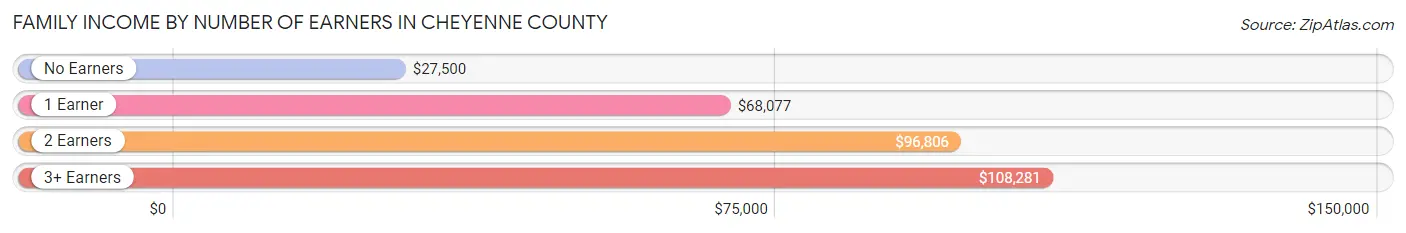
| Number of Earners | # Families | Median Income |
| No Earners | 46 (9.8%) | $27,500 |
| 1 Earner | 164 (34.8%) | $68,077 |
| 2 Earners | 230 (48.8%) | $96,806 |
| 3+ Earners | 31 (6.6%) | $108,281 |
| Total | 471 (100.0%) | $88,125 |
Household Income in Cheyenne County
Household Income Brackets in Cheyenne County
With 129 households falling in the category, the $50,000 to $74,999 income range is the most frequent in Cheyenne County, accounting for 17.4% of all households. In contrast, only 27 households (3.6%) fall into the $10,000 to $14,999 income bracket, making it the least populous group.
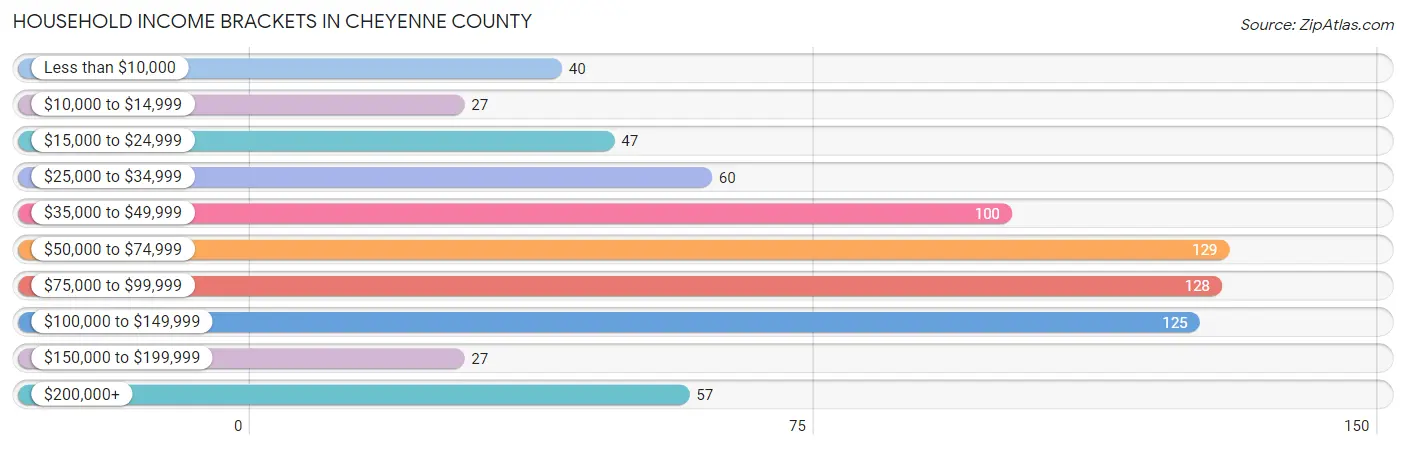
| Income Bracket | # Households | % Households |
| Less than $10,000 | 40 | 5.4% |
| $10,000 to $14,999 | 27 | 3.6% |
| $15,000 to $24,999 | 47 | 6.4% |
| $25,000 to $34,999 | 60 | 8.1% |
| $35,000 to $49,999 | 100 | 13.5% |
| $50,000 to $74,999 | 129 | 17.4% |
| $75,000 to $99,999 | 128 | 17.3% |
| $100,000 to $149,999 | 125 | 16.9% |
| $150,000 to $199,999 | 27 | 3.6% |
| $200,000+ | 57 | 7.7% |
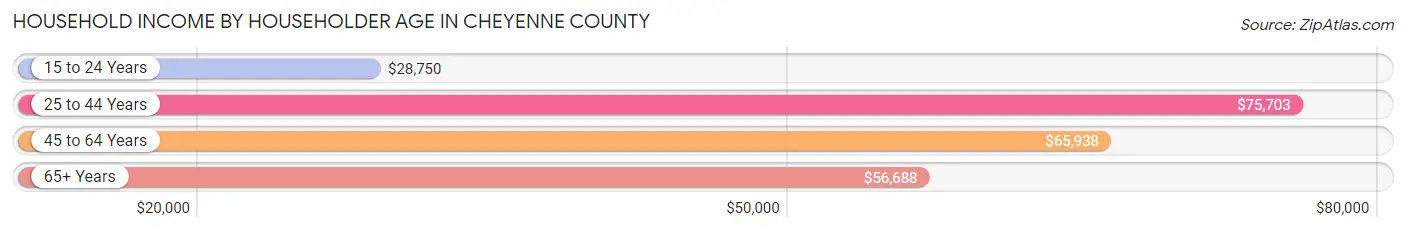
Household Income by Householder Age in Cheyenne County
The median household income in Cheyenne County is $65,577, with the highest median household income of $75,703 found in the 25 to 44 years age bracket for the primary householder. A total of 211 households (28.5%) fall into this category. Meanwhile, the 15 to 24 years age bracket for the primary householder has the lowest median household income of $28,750, with 14 households (1.9%) in this group.
| Income Bracket | # Households | Median Income |
| 15 to 24 Years | 14 (1.9%) | $28,750 |
| 25 to 44 Years | 211 (28.5%) | $75,703 |
| 45 to 64 Years | 274 (37.0%) | $65,938 |
| 65+ Years | 241 (32.6%) | $56,688 |
| Total | 740 (100.0%) | $65,577 |
Poverty in Cheyenne County
Income Below Poverty by Sex and Age in Cheyenne County
With 12.8% poverty level for males and 9.0% for females among the residents of Cheyenne County, 6 to 11 year old males and 12 to 14 year old females are the most vulnerable to poverty, with 20 males (27.4%) and 15 females (30.0%) in their respective age groups living below the poverty level.
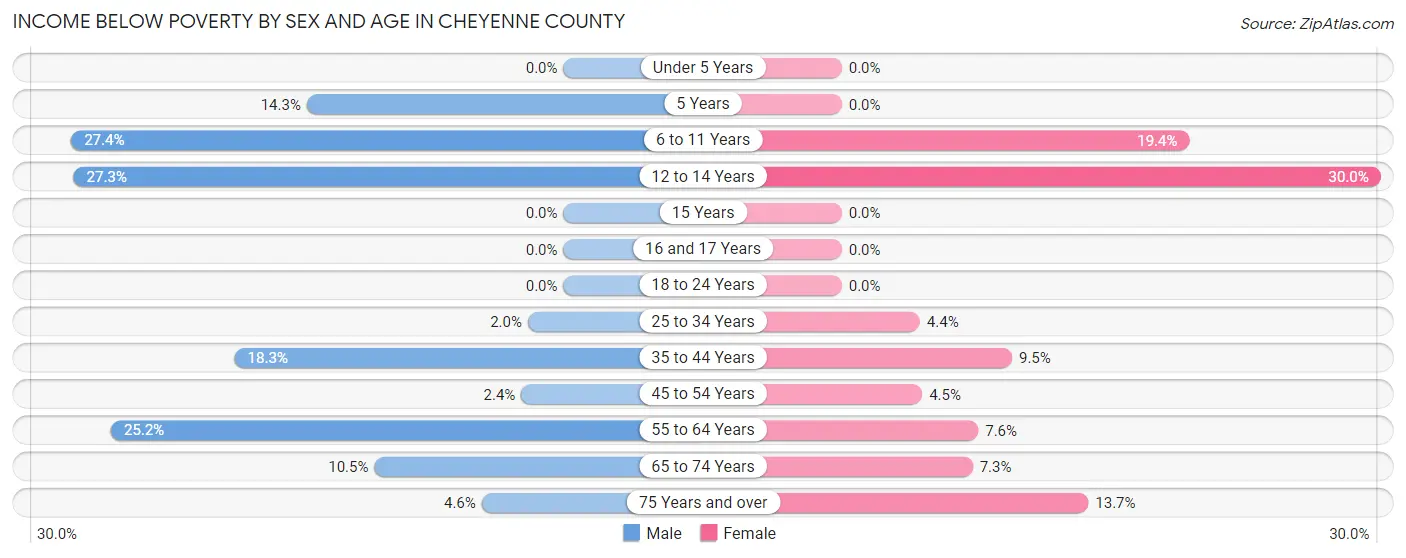
| Age Bracket | Male | Female |
| Under 5 Years | 0 (0.0%) | 0 (0.0%) |
| 5 Years | 3 (14.3%) | 0 (0.0%) |
| 6 to 11 Years | 20 (27.4%) | 18 (19.4%) |
| 12 to 14 Years | 3 (27.3%) | 15 (30.0%) |
| 15 Years | 0 (0.0%) | 0 (0.0%) |
| 16 and 17 Years | 0 (0.0%) | 0 (0.0%) |
| 18 to 24 Years | 0 (0.0%) | 0 (0.0%) |
| 25 to 34 Years | 2 (2.0%) | 2 (4.3%) |
| 35 to 44 Years | 28 (18.3%) | 11 (9.5%) |
| 45 to 54 Years | 2 (2.4%) | 3 (4.5%) |
| 55 to 64 Years | 33 (25.2%) | 13 (7.6%) |
| 65 to 74 Years | 14 (10.5%) | 7 (7.3%) |
| 75 Years and over | 2 (4.5%) | 7 (13.7%) |
| Total | 107 (12.8%) | 76 (9.0%) |
Income Above Poverty by Sex and Age in Cheyenne County
According to the poverty statistics in Cheyenne County, males aged under 5 years and females aged under 5 years are the age groups that are most secure financially, with 100.0% of males and 100.0% of females in these age groups living above the poverty line.
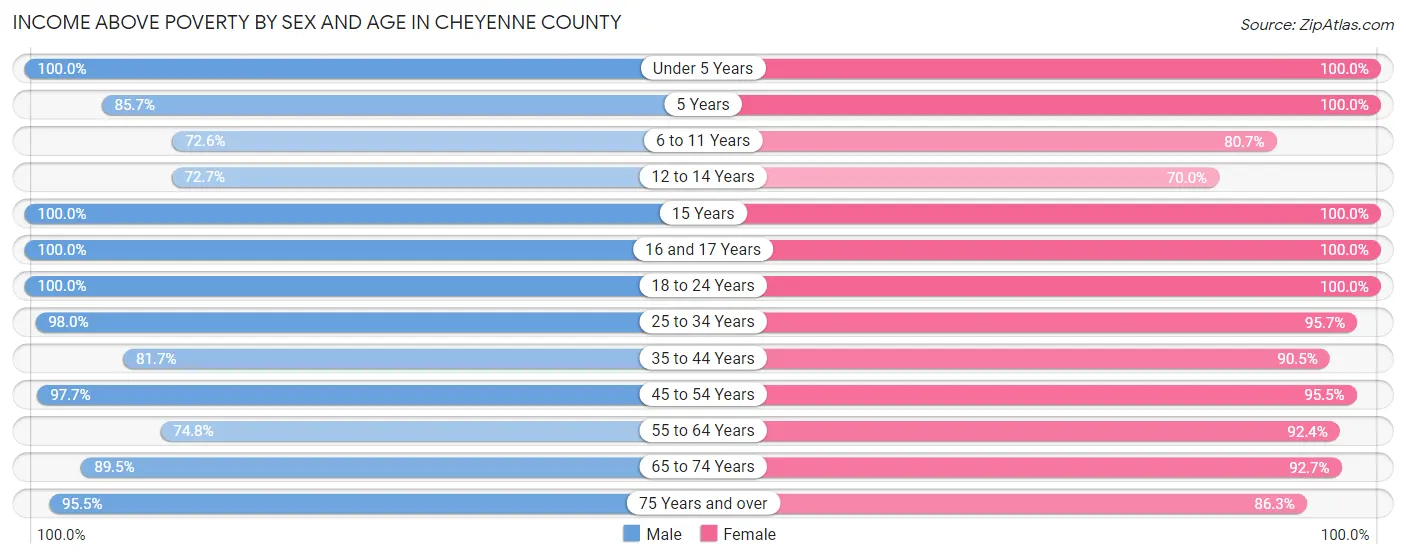
| Age Bracket | Male | Female |
| Under 5 Years | 33 (100.0%) | 85 (100.0%) |
| 5 Years | 18 (85.7%) | 6 (100.0%) |
| 6 to 11 Years | 53 (72.6%) | 75 (80.6%) |
| 12 to 14 Years | 8 (72.7%) | 35 (70.0%) |
| 15 Years | 14 (100.0%) | 2 (100.0%) |
| 16 and 17 Years | 10 (100.0%) | 26 (100.0%) |
| 18 to 24 Years | 28 (100.0%) | 37 (100.0%) |
| 25 to 34 Years | 99 (98.0%) | 44 (95.7%) |
| 35 to 44 Years | 125 (81.7%) | 105 (90.5%) |
| 45 to 54 Years | 83 (97.7%) | 64 (95.5%) |
| 55 to 64 Years | 98 (74.8%) | 158 (92.4%) |
| 65 to 74 Years | 119 (89.5%) | 89 (92.7%) |
| 75 Years and over | 42 (95.5%) | 44 (86.3%) |
| Total | 730 (87.2%) | 770 (91.0%) |
Income Below Poverty Among Married-Couple Families in Cheyenne County
The poverty statistics for married-couple families in Cheyenne County show that 9.6% or 38 of the total 397 families live below the poverty line. Families with 5 or more children have the highest poverty rate of 100.0%, comprising of 2 families. On the other hand, families with 1 or 2 children have the lowest poverty rate of 2.8%, which includes 3 families.
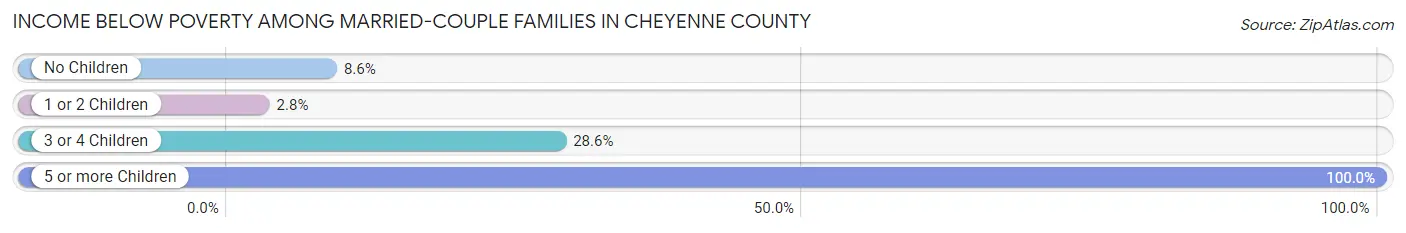
| Children | Above Poverty | Below Poverty |
| No Children | 223 (91.4%) | 21 (8.6%) |
| 1 or 2 Children | 106 (97.3%) | 3 (2.8%) |
| 3 or 4 Children | 30 (71.4%) | 12 (28.6%) |
| 5 or more Children | 0 (0.0%) | 2 (100.0%) |
| Total | 359 (90.4%) | 38 (9.6%) |
Income Below Poverty Among Single-Parent Households in Cheyenne County
According to the poverty data in Cheyenne County, 8.6% or 3 single-father households and 7.7% or 3 single-mother households are living below the poverty line. Among single-father households, those with no children have the highest poverty rate, with 3 households (17.6%) experiencing poverty. Likewise, among single-mother households, those with no children have the highest poverty rate, with 3 households (15.8%) falling below the poverty line.
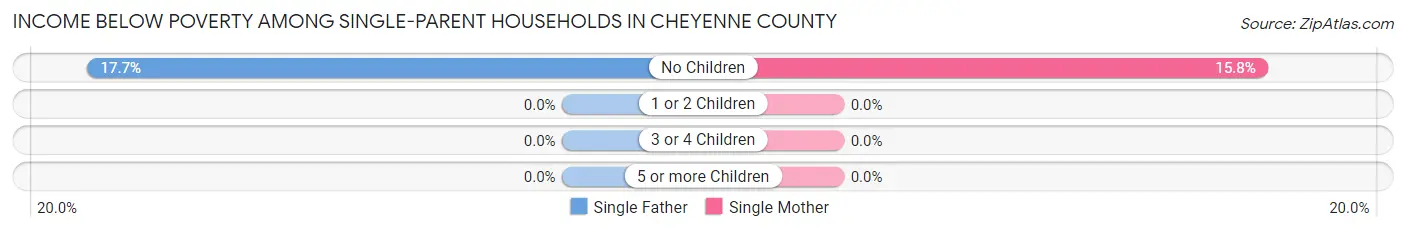
| Children | Single Father | Single Mother |
| No Children | 3 (17.6%) | 3 (15.8%) |
| 1 or 2 Children | 0 (0.0%) | 0 (0.0%) |
| 3 or 4 Children | 0 (0.0%) | 0 (0.0%) |
| 5 or more Children | 0 (0.0%) | 0 (0.0%) |
| Total | 3 (8.6%) | 3 (7.7%) |
Income Below Poverty Among Married-Couple vs Single-Parent Households in Cheyenne County
The poverty data for Cheyenne County shows that 38 of the married-couple family households (9.6%) and 6 of the single-parent households (8.1%) are living below the poverty level. Within the married-couple family households, those with 5 or more children have the highest poverty rate, with 2 households (100.0%) falling below the poverty line. Among the single-parent households, those with no children have the highest poverty rate, with 6 household (16.7%) living below poverty.
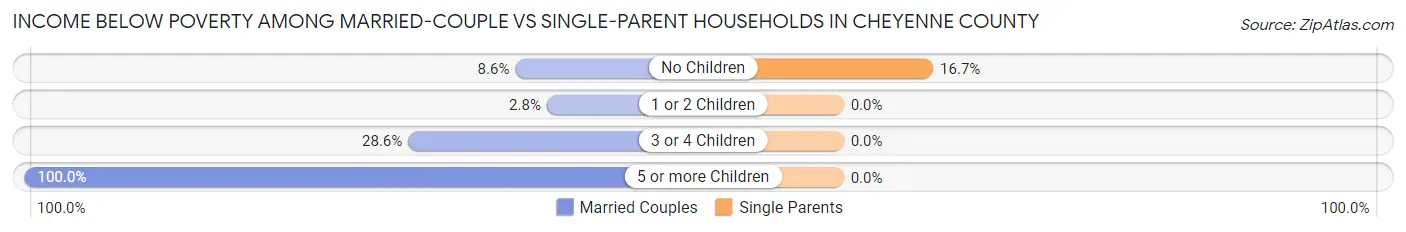
| Children | Married-Couple Families | Single-Parent Households |
| No Children | 21 (8.6%) | 6 (16.7%) |
| 1 or 2 Children | 3 (2.8%) | 0 (0.0%) |
| 3 or 4 Children | 12 (28.6%) | 0 (0.0%) |
| 5 or more Children | 2 (100.0%) | 0 (0.0%) |
| Total | 38 (9.6%) | 6 (8.1%) |
Race in Cheyenne County
The most populous races in Cheyenne County are White / Caucasian (1,475 | 85.5%), Hispanic or Latino (206 | 11.9%), and Two or more Races (197 | 11.4%).
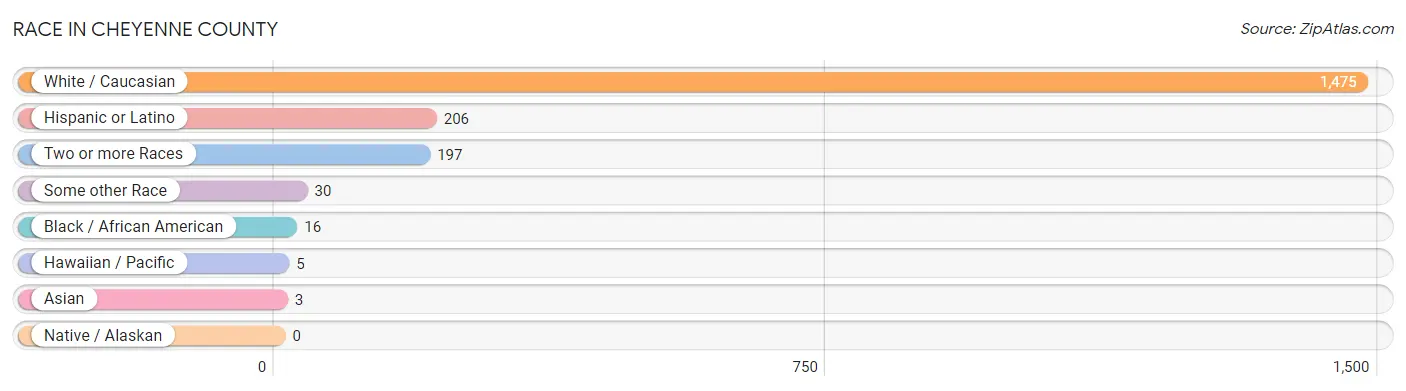
| Race | # Population | % Population |
| Asian | 3 | 0.2% |
| Black / African American | 16 | 0.9% |
| Hawaiian / Pacific | 5 | 0.3% |
| Hispanic or Latino | 206 | 11.9% |
| Native / Alaskan | 0 | 0.0% |
| White / Caucasian | 1,475 | 85.5% |
| Two or more Races | 197 | 11.4% |
| Some other Race | 30 | 1.7% |
| Total | 1,726 | 100.0% |
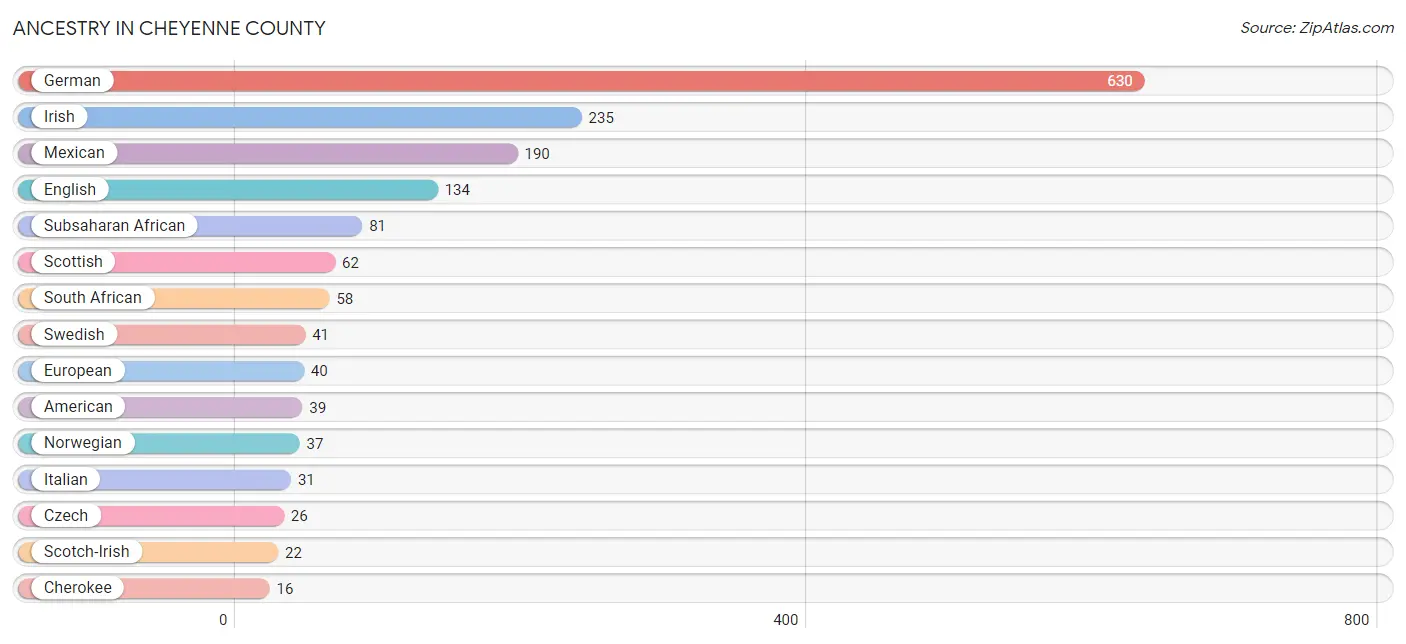
Ancestry in Cheyenne County
The most populous ancestries reported in Cheyenne County are German (630 | 36.5%), Irish (235 | 13.6%), Mexican (190 | 11.0%), English (134 | 7.8%), and Subsaharan African (81 | 4.7%), together accounting for 73.6% of all Cheyenne County residents.
| Ancestry | # Population | % Population |
| African | 10 | 0.6% |
| American | 39 | 2.3% |
| Austrian | 2 | 0.1% |
| Belgian | 2 | 0.1% |
| Blackfeet | 2 | 0.1% |
| Burmese | 3 | 0.2% |
| Central American | 4 | 0.2% |
| Cherokee | 16 | 0.9% |
| Czech | 26 | 1.5% |
| Czechoslovakian | 4 | 0.2% |
| Danish | 10 | 0.6% |
| Dutch | 13 | 0.7% |
| English | 134 | 7.8% |
| European | 40 | 2.3% |
| Finnish | 8 | 0.5% |
| French | 15 | 0.9% |
| French Canadian | 2 | 0.1% |
| German | 630 | 36.5% |
| Irish | 235 | 13.6% |
| Italian | 31 | 1.8% |
| Mexican | 190 | 11.0% |
| Native Hawaiian | 5 | 0.3% |
| Navajo | 1 | 0.1% |
| Nigerian | 13 | 0.7% |
| Norwegian | 37 | 2.1% |
| Panamanian | 1 | 0.1% |
| Polish | 13 | 0.7% |
| Portuguese | 1 | 0.1% |
| Russian | 4 | 0.2% |
| Salvadoran | 3 | 0.2% |
| Scandinavian | 11 | 0.6% |
| Scotch-Irish | 22 | 1.3% |
| Scottish | 62 | 3.6% |
| Sioux | 12 | 0.7% |
| South African | 58 | 3.4% |
| Spanish | 1 | 0.1% |
| Subsaharan African | 81 | 4.7% |
| Swedish | 41 | 2.4% |
| Swiss | 13 | 0.7% |
| Ukrainian | 2 | 0.1% |
| Welsh | 11 | 0.6% | View All 41 Rows |
Immigrants in Cheyenne County
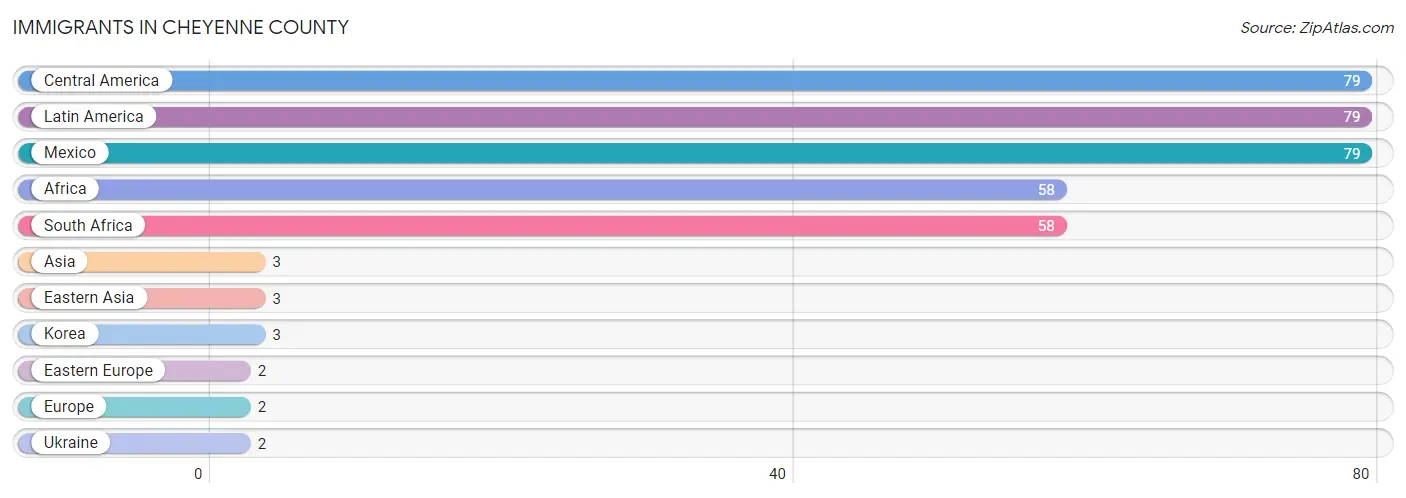
The most numerous immigrant groups reported in Cheyenne County came from Central America (79 | 4.6%), Latin America (79 | 4.6%), Mexico (79 | 4.6%), Africa (58 | 3.4%), and South Africa (58 | 3.4%), together accounting for 20.5% of all Cheyenne County residents.
| Immigration Origin | # Population | % Population |
| Africa | 58 | 3.4% |
| Asia | 3 | 0.2% |
| Central America | 79 | 4.6% |
| Eastern Asia | 3 | 0.2% |
| Eastern Europe | 2 | 0.1% |
| Europe | 2 | 0.1% |
| Korea | 3 | 0.2% |
| Latin America | 79 | 4.6% |
| Mexico | 79 | 4.6% |
| South Africa | 58 | 3.4% |
| Ukraine | 2 | 0.1% | View All 11 Rows |
Sex and Age in Cheyenne County
Sex and Age in Cheyenne County
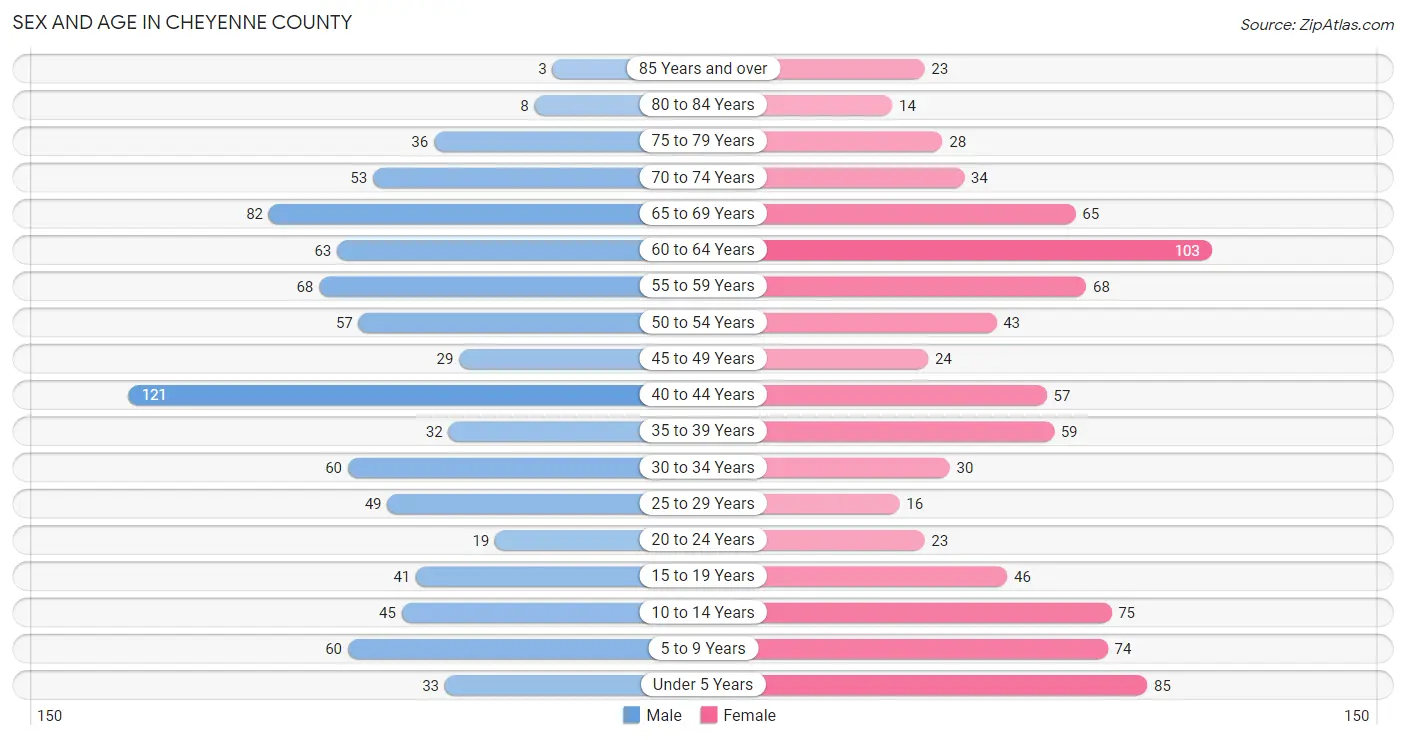
The most populous age groups in Cheyenne County are 40 to 44 Years (121 | 14.1%) for men and 60 to 64 Years (103 | 11.9%) for women.
| Age Bracket | Male | Female |
| Under 5 Years | 33 (3.8%) | 85 (9.8%) |
| 5 to 9 Years | 60 (7.0%) | 74 (8.5%) |
| 10 to 14 Years | 45 (5.2%) | 75 (8.6%) |
| 15 to 19 Years | 41 (4.8%) | 46 (5.3%) |
| 20 to 24 Years | 19 (2.2%) | 23 (2.6%) |
| 25 to 29 Years | 49 (5.7%) | 16 (1.8%) |
| 30 to 34 Years | 60 (7.0%) | 30 (3.5%) |
| 35 to 39 Years | 32 (3.7%) | 59 (6.8%) |
| 40 to 44 Years | 121 (14.1%) | 57 (6.6%) |
| 45 to 49 Years | 29 (3.4%) | 24 (2.8%) |
| 50 to 54 Years | 57 (6.6%) | 43 (5.0%) |
| 55 to 59 Years | 68 (7.9%) | 68 (7.8%) |
| 60 to 64 Years | 63 (7.3%) | 103 (11.9%) |
| 65 to 69 Years | 82 (9.6%) | 65 (7.5%) |
| 70 to 74 Years | 53 (6.2%) | 34 (3.9%) |
| 75 to 79 Years | 36 (4.2%) | 28 (3.2%) |
| 80 to 84 Years | 8 (0.9%) | 14 (1.6%) |
| 85 Years and over | 3 (0.4%) | 23 (2.6%) |
| Total | 859 (100.0%) | 867 (100.0%) |
Families and Households in Cheyenne County
Median Family Size in Cheyenne County
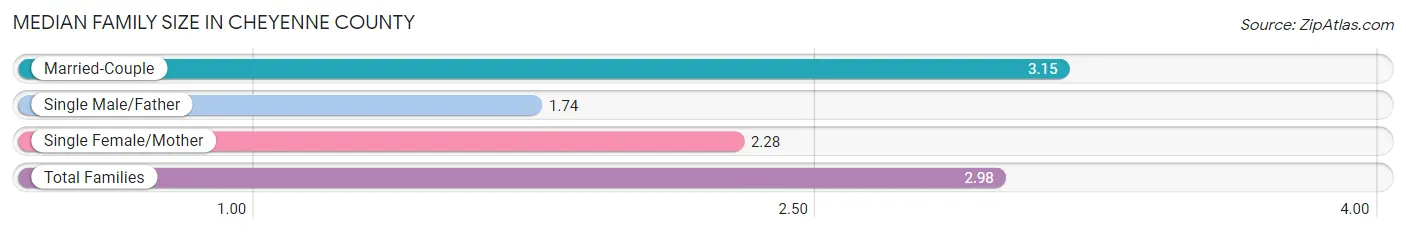
The median family size in Cheyenne County is 2.98 persons per family, with married-couple families (397 | 84.3%) accounting for the largest median family size of 3.15 persons per family. On the other hand, single male/father families (35 | 7.4%) represent the smallest median family size with 1.74 persons per family.
| Family Type | # Families | Family Size |
| Married-Couple | 397 (84.3%) | 3.15 |
| Single Male/Father | 35 (7.4%) | 1.74 |
| Single Female/Mother | 39 (8.3%) | 2.28 |
| Total Families | 471 (100.0%) | 2.98 |
Median Household Size in Cheyenne County
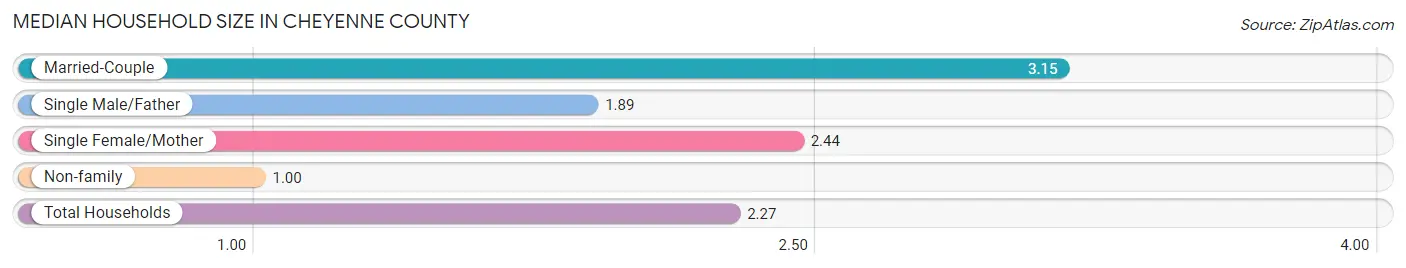
The median household size in Cheyenne County is 2.27 persons per household, with married-couple households (397 | 53.6%) accounting for the largest median household size of 3.15 persons per household. non-family households (269 | 36.3%) represent the smallest median household size with 1.00 persons per household.
| Household Type | # Households | Household Size |
| Married-Couple | 397 (53.6%) | 3.15 |
| Single Male/Father | 35 (4.7%) | 1.89 |
| Single Female/Mother | 39 (5.3%) | 2.44 |
| Non-family | 269 (36.3%) | 1.00 |
| Total Households | 740 (100.0%) | 2.27 |
Household Size by Marriage Status in Cheyenne County
Out of a total of 740 households in Cheyenne County, 471 (63.6%) are family households, while 269 (36.3%) are nonfamily households. The most numerous type of family households are 2-person households, comprising 279, and the most common type of nonfamily households are 1-person households, comprising 249.
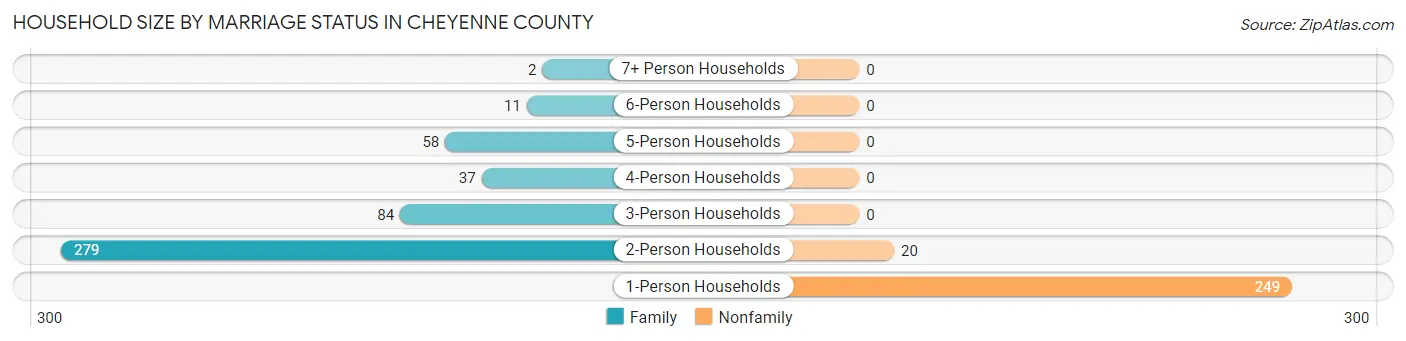
| Household Size | Family Households | Nonfamily Households |
| 1-Person Households | - | 249 (33.7%) |
| 2-Person Households | 279 (37.7%) | 20 (2.7%) |
| 3-Person Households | 84 (11.4%) | 0 (0.0%) |
| 4-Person Households | 37 (5.0%) | 0 (0.0%) |
| 5-Person Households | 58 (7.8%) | 0 (0.0%) |
| 6-Person Households | 11 (1.5%) | 0 (0.0%) |
| 7+ Person Households | 2 (0.3%) | 0 (0.0%) |
| Total | 471 (63.6%) | 269 (36.3%) |
Female Fertility in Cheyenne County
Fertility by Age in Cheyenne County
Average fertility rate in Cheyenne County is 27.0 births per 1,000 women. Women in the age bracket of 20 to 34 years have the highest fertility rate with 58.0 births per 1,000 women. Women in the age bracket of 20 to 34 years acount for 57.1% of all women with births.
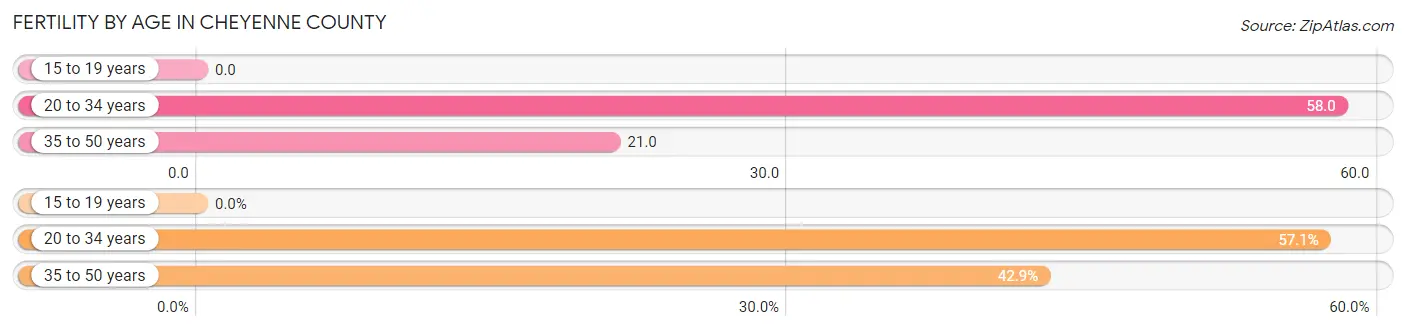
| Age Bracket | Women with Births | Births / 1,000 Women |
| 15 to 19 years | 0 (0.0%) | 0.0 |
| 20 to 34 years | 4 (57.1%) | 58.0 |
| 35 to 50 years | 3 (42.9%) | 21.0 |
| Total | 7 (100.0%) | 27.0 |
Fertility by Age by Marriage Status in Cheyenne County
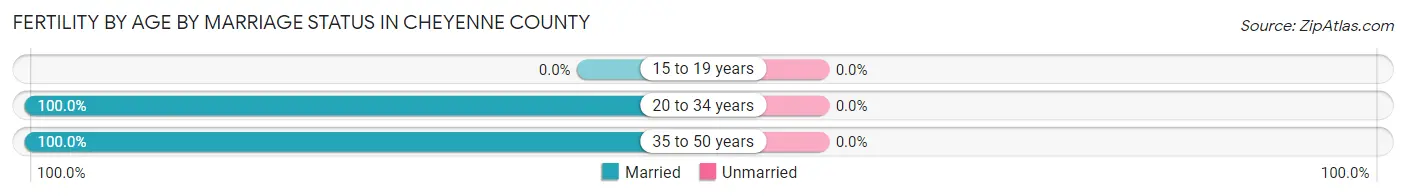
| Age Bracket | Married | Unmarried |
| 15 to 19 years | 0 (0.0%) | 0 (0.0%) |
| 20 to 34 years | 4 (100.0%) | 0 (0.0%) |
| 35 to 50 years | 3 (100.0%) | 0 (0.0%) |
| Total | 7 (100.0%) | 0 (0.0%) |
Fertility by Education in Cheyenne County
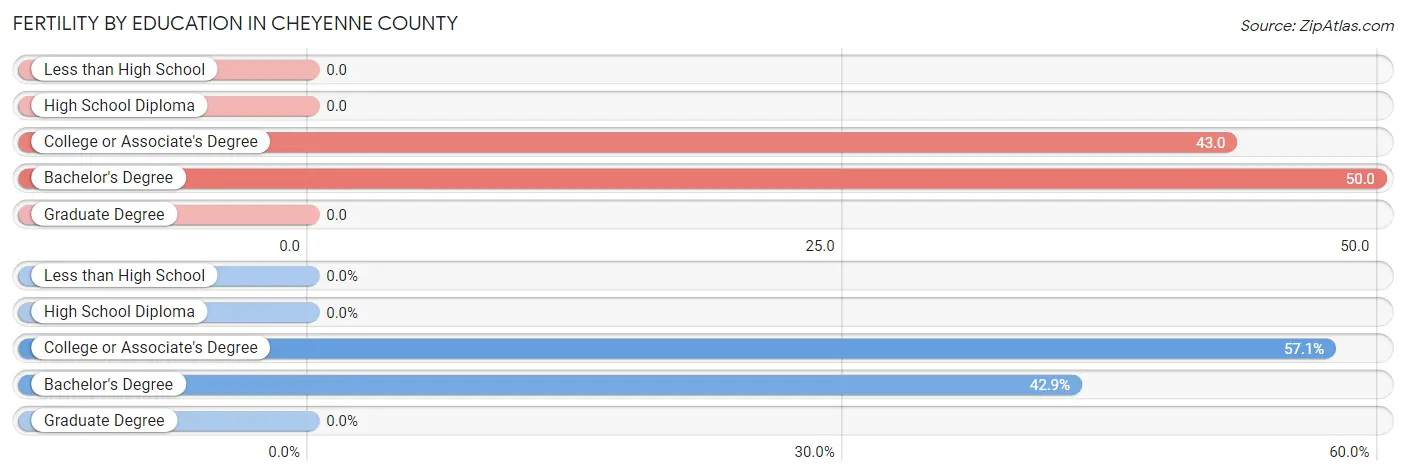
| Educational Attainment | Women with Births | Births / 1,000 Women |
| Less than High School | 0 (0.0%) | 0.0 |
| High School Diploma | 0 (0.0%) | 0.0 |
| College or Associate's Degree | 4 (57.1%) | 43.0 |
| Bachelor's Degree | 3 (42.9%) | 50.0 |
| Graduate Degree | 0 (0.0%) | 0.0 |
| Total | 7 (100.0%) | 27.0 |
Fertility by Education by Marriage Status in Cheyenne County
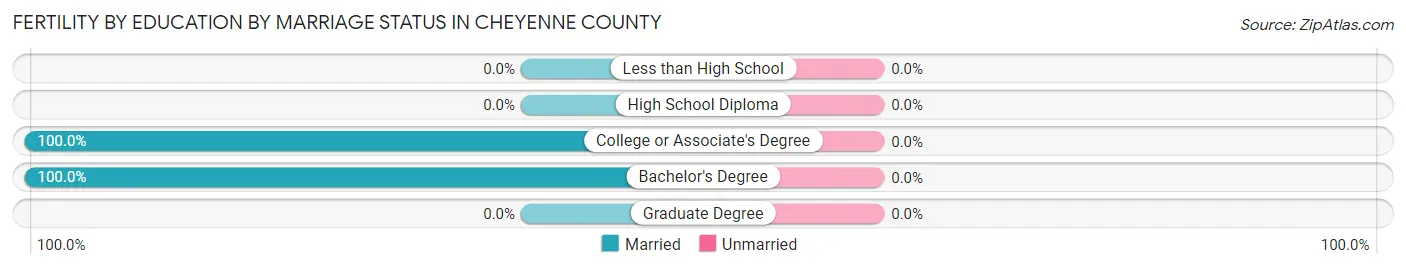
| Educational Attainment | Married | Unmarried |
| Less than High School | 0 (0.0%) | 0 (0.0%) |
| High School Diploma | 0 (0.0%) | 0 (0.0%) |
| College or Associate's Degree | 4 (100.0%) | 0 (0.0%) |
| Bachelor's Degree | 3 (100.0%) | 0 (0.0%) |
| Graduate Degree | 0 (0.0%) | 0 (0.0%) |
| Total | 7 (100.0%) | 0 (0.0%) |
Employment Characteristics in Cheyenne County
Employment by Class of Employer in Cheyenne County
Among the 878 employed individuals in Cheyenne County, private company employees (451 | 51.4%), self-employed (not incorporated) (148 | 16.9%), and local government employees (114 | 13.0%) make up the most common classes of employment.
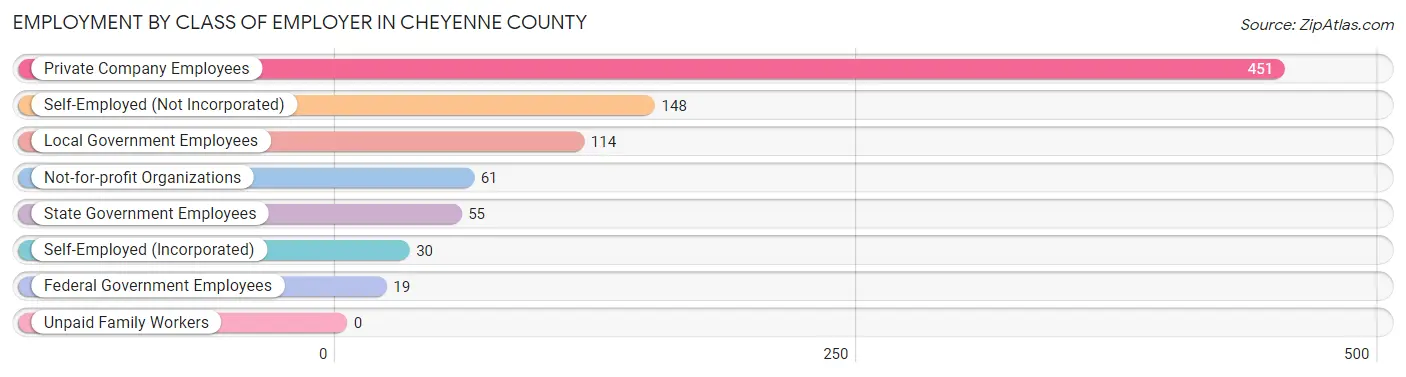
| Employer Class | # Employees | % Employees |
| Private Company Employees | 451 | 51.4% |
| Self-Employed (Incorporated) | 30 | 3.4% |
| Self-Employed (Not Incorporated) | 148 | 16.9% |
| Not-for-profit Organizations | 61 | 7.0% |
| Local Government Employees | 114 | 13.0% |
| State Government Employees | 55 | 6.3% |
| Federal Government Employees | 19 | 2.2% |
| Unpaid Family Workers | 0 | 0.0% |
| Total | 878 | 100.0% |
Employment Status by Age in Cheyenne County
According to the labor force statistics for Cheyenne County, out of the total population over 16 years of age (1,337), 67.7% or 905 individuals are in the labor force, with 2.1% or 19 of them unemployed. The age group with the highest labor force participation rate is 25 to 29 years, with 95.4% or 62 individuals in the labor force. Within the labor force, the 35 to 44 years age range has the highest percentage of unemployed individuals, with 6.6% or 16 of them being unemployed.
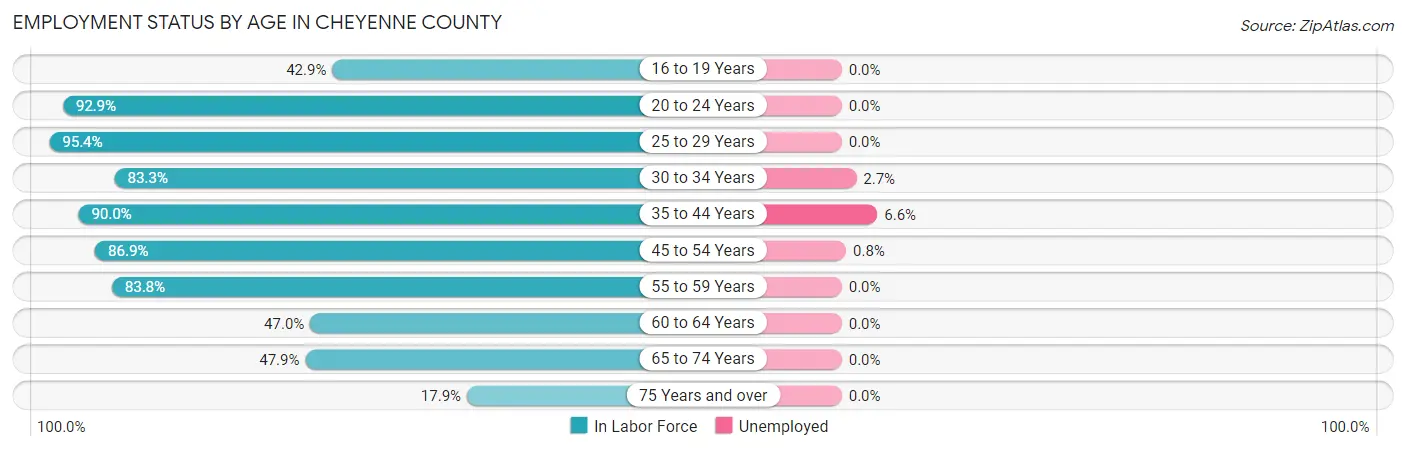
| Age Bracket | In Labor Force | Unemployed |
| 16 to 19 Years | 30 (42.9%) | 0 (0.0%) |
| 20 to 24 Years | 39 (92.9%) | 0 (0.0%) |
| 25 to 29 Years | 62 (95.4%) | 0 (0.0%) |
| 30 to 34 Years | 75 (83.3%) | 2 (2.7%) |
| 35 to 44 Years | 242 (90.0%) | 16 (6.6%) |
| 45 to 54 Years | 133 (86.9%) | 1 (0.8%) |
| 55 to 59 Years | 114 (83.8%) | 0 (0.0%) |
| 60 to 64 Years | 78 (47.0%) | 0 (0.0%) |
| 65 to 74 Years | 112 (47.9%) | 0 (0.0%) |
| 75 Years and over | 20 (17.9%) | 0 (0.0%) |
| Total | 905 (67.7%) | 19 (2.1%) |
Employment Status by Educational Attainment in Cheyenne County
According to labor force statistics for Cheyenne County, 80.1% of individuals (704) out of the total population between 25 and 64 years of age (879) are in the labor force, with 2.7% or 19 of them being unemployed. The group with the highest labor force participation rate are those with the educational attainment of bachelor's degree or higher, with 95.4% or 208 individuals in the labor force. Within the labor force, individuals with bachelor's degree or higher education have the highest percentage of unemployment, with 5.3% or 11 of them being unemployed.
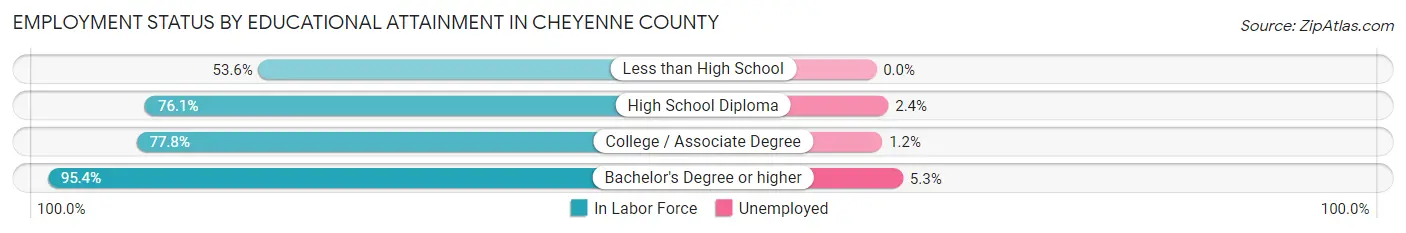
| Educational Attainment | In Labor Force | Unemployed |
| Less than High School | 30 (53.6%) | 0 (0.0%) |
| High School Diploma | 210 (76.1%) | 7 (2.4%) |
| College / Associate Degree | 256 (77.8%) | 4 (1.2%) |
| Bachelor's Degree or higher | 208 (95.4%) | 12 (5.3%) |
| Total | 704 (80.1%) | 24 (2.7%) |
Employment Occupations by Sex in Cheyenne County
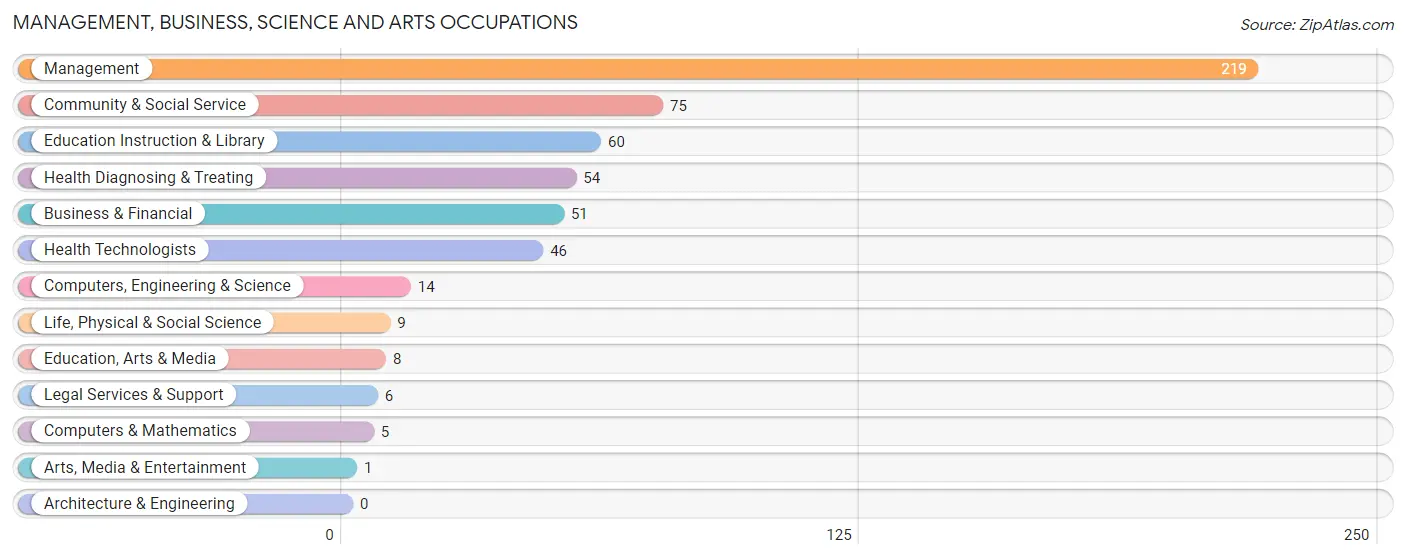
Management, Business, Science and Arts Occupations
The most common Management, Business, Science and Arts occupations in Cheyenne County are Management (219 | 24.7%), Community & Social Service (75 | 8.5%), Education Instruction & Library (60 | 6.8%), Health Diagnosing & Treating (54 | 6.1%), and Business & Financial (51 | 5.8%).
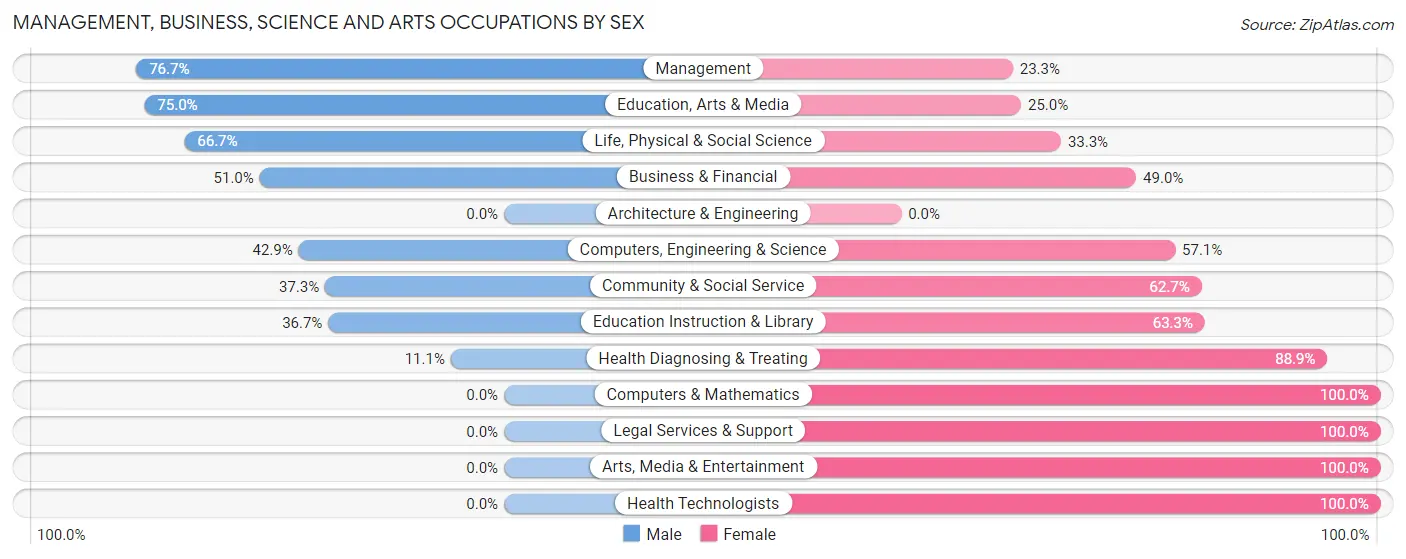
Management, Business, Science and Arts Occupations by Sex
Within the Management, Business, Science and Arts occupations in Cheyenne County, the most male-oriented occupations are Management (76.7%), Education, Arts & Media (75.0%), and Life, Physical & Social Science (66.7%), while the most female-oriented occupations are Computers & Mathematics (100.0%), Legal Services & Support (100.0%), and Arts, Media & Entertainment (100.0%).
| Occupation | Male | Female |
| Management | 168 (76.7%) | 51 (23.3%) |
| Business & Financial | 26 (51.0%) | 25 (49.0%) |
| Computers, Engineering & Science | 6 (42.9%) | 8 (57.1%) |
| Computers & Mathematics | 0 (0.0%) | 5 (100.0%) |
| Architecture & Engineering | 0 (0.0%) | 0 (0.0%) |
| Life, Physical & Social Science | 6 (66.7%) | 3 (33.3%) |
| Community & Social Service | 28 (37.3%) | 47 (62.7%) |
| Education, Arts & Media | 6 (75.0%) | 2 (25.0%) |
| Legal Services & Support | 0 (0.0%) | 6 (100.0%) |
| Education Instruction & Library | 22 (36.7%) | 38 (63.3%) |
| Arts, Media & Entertainment | 0 (0.0%) | 1 (100.0%) |
| Health Diagnosing & Treating | 6 (11.1%) | 48 (88.9%) |
| Health Technologists | 0 (0.0%) | 46 (100.0%) |
| Total (Category) | 234 (56.7%) | 179 (43.3%) |
| Total (Overall) | 522 (58.9%) | 364 (41.1%) |
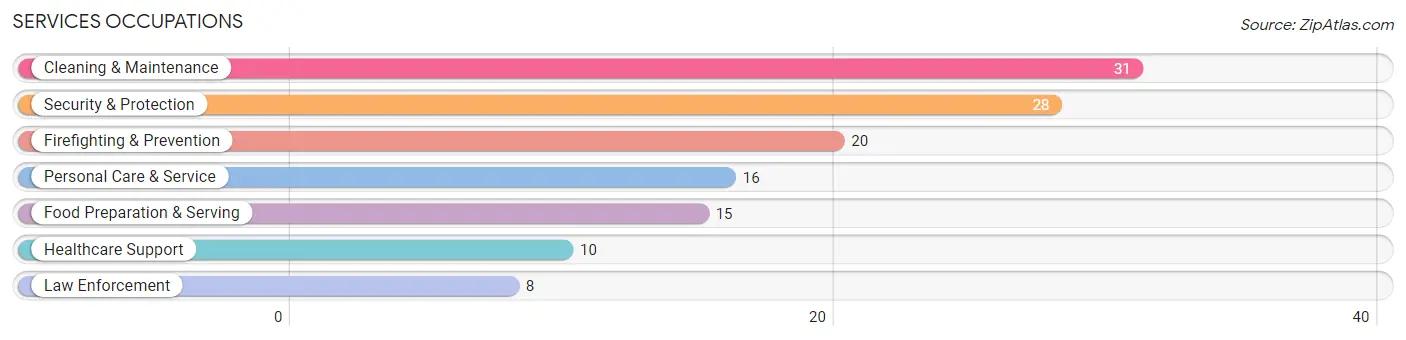
Services Occupations
The most common Services occupations in Cheyenne County are Cleaning & Maintenance (31 | 3.5%), Security & Protection (28 | 3.2%), Firefighting & Prevention (20 | 2.3%), Personal Care & Service (16 | 1.8%), and Food Preparation & Serving (15 | 1.7%).
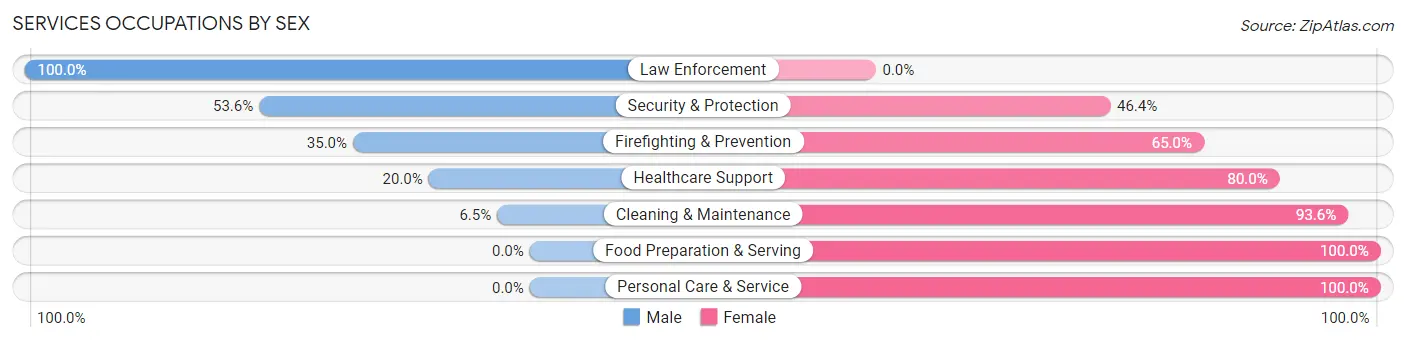
Services Occupations by Sex
Within the Services occupations in Cheyenne County, the most male-oriented occupations are Law Enforcement (100.0%), Security & Protection (53.6%), and Firefighting & Prevention (35.0%), while the most female-oriented occupations are Food Preparation & Serving (100.0%), Personal Care & Service (100.0%), and Cleaning & Maintenance (93.5%).
| Occupation | Male | Female |
| Healthcare Support | 2 (20.0%) | 8 (80.0%) |
| Security & Protection | 15 (53.6%) | 13 (46.4%) |
| Firefighting & Prevention | 7 (35.0%) | 13 (65.0%) |
| Law Enforcement | 8 (100.0%) | 0 (0.0%) |
| Food Preparation & Serving | 0 (0.0%) | 15 (100.0%) |
| Cleaning & Maintenance | 2 (6.5%) | 29 (93.5%) |
| Personal Care & Service | 0 (0.0%) | 16 (100.0%) |
| Total (Category) | 19 (19.0%) | 81 (81.0%) |
| Total (Overall) | 522 (58.9%) | 364 (41.1%) |
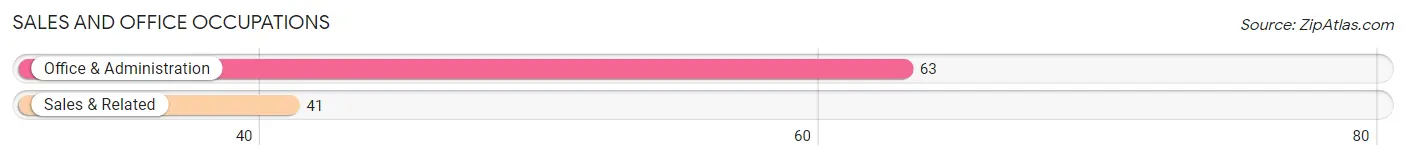
Sales and Office Occupations
The most common Sales and Office occupations in Cheyenne County are Office & Administration (63 | 7.1%), and Sales & Related (41 | 4.6%).
Sales and Office Occupations by Sex
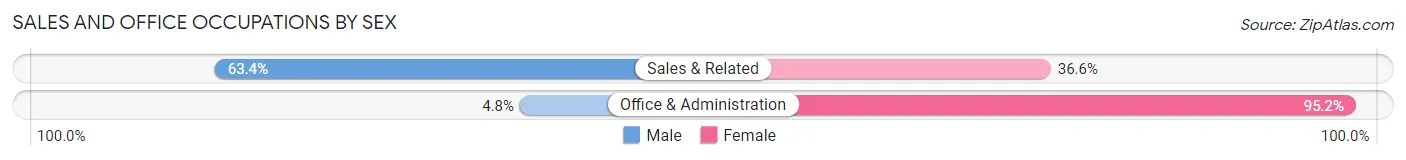
| Occupation | Male | Female |
| Sales & Related | 26 (63.4%) | 15 (36.6%) |
| Office & Administration | 3 (4.8%) | 60 (95.2%) |
| Total (Category) | 29 (27.9%) | 75 (72.1%) |
| Total (Overall) | 522 (58.9%) | 364 (41.1%) |
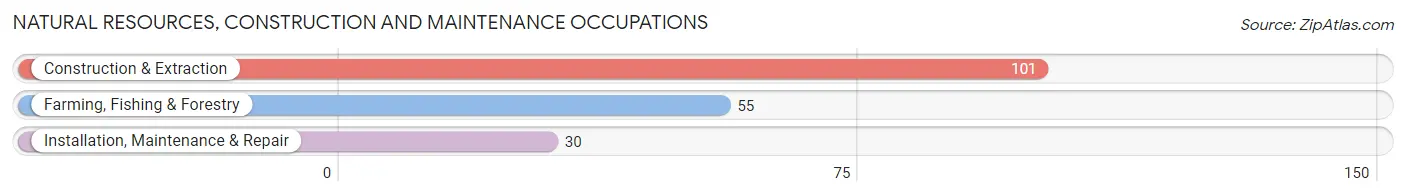
Natural Resources, Construction and Maintenance Occupations
The most common Natural Resources, Construction and Maintenance occupations in Cheyenne County are Construction & Extraction (101 | 11.4%), Farming, Fishing & Forestry (55 | 6.2%), and Installation, Maintenance & Repair (30 | 3.4%).
Natural Resources, Construction and Maintenance Occupations by Sex
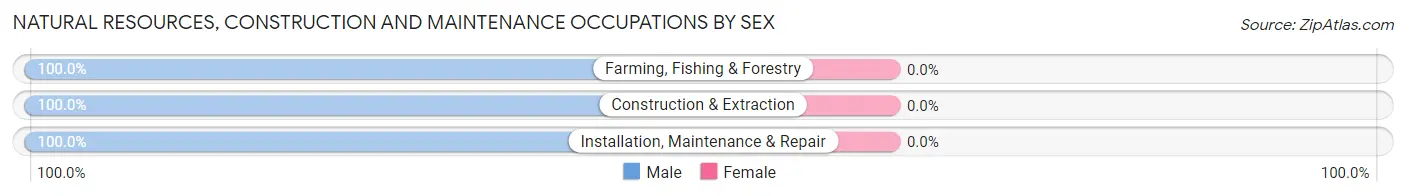
| Occupation | Male | Female |
| Farming, Fishing & Forestry | 55 (100.0%) | 0 (0.0%) |
| Construction & Extraction | 101 (100.0%) | 0 (0.0%) |
| Installation, Maintenance & Repair | 30 (100.0%) | 0 (0.0%) |
| Total (Category) | 186 (100.0%) | 0 (0.0%) |
| Total (Overall) | 522 (58.9%) | 364 (41.1%) |
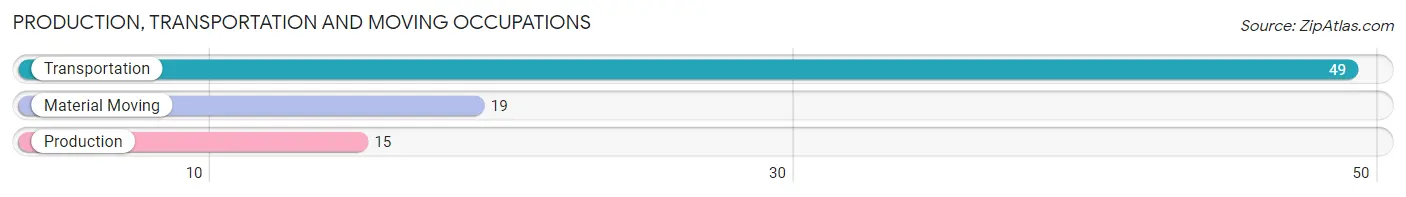
Production, Transportation and Moving Occupations
The most common Production, Transportation and Moving occupations in Cheyenne County are Transportation (49 | 5.5%), Material Moving (19 | 2.1%), and Production (15 | 1.7%).
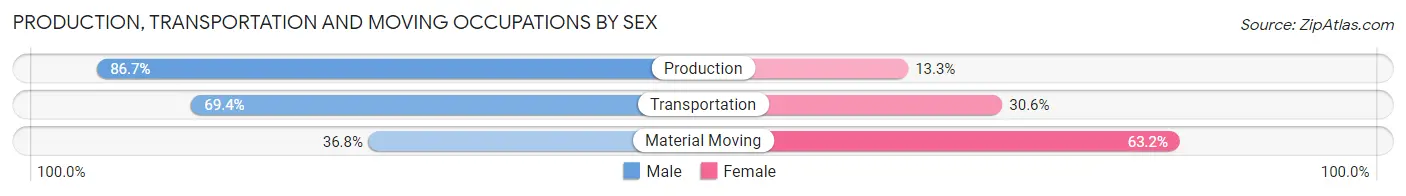
Production, Transportation and Moving Occupations by Sex
| Occupation | Male | Female |
| Production | 13 (86.7%) | 2 (13.3%) |
| Transportation | 34 (69.4%) | 15 (30.6%) |
| Material Moving | 7 (36.8%) | 12 (63.2%) |
| Total (Category) | 54 (65.1%) | 29 (34.9%) |
| Total (Overall) | 522 (58.9%) | 364 (41.1%) |
Employment Industries by Sex in Cheyenne County
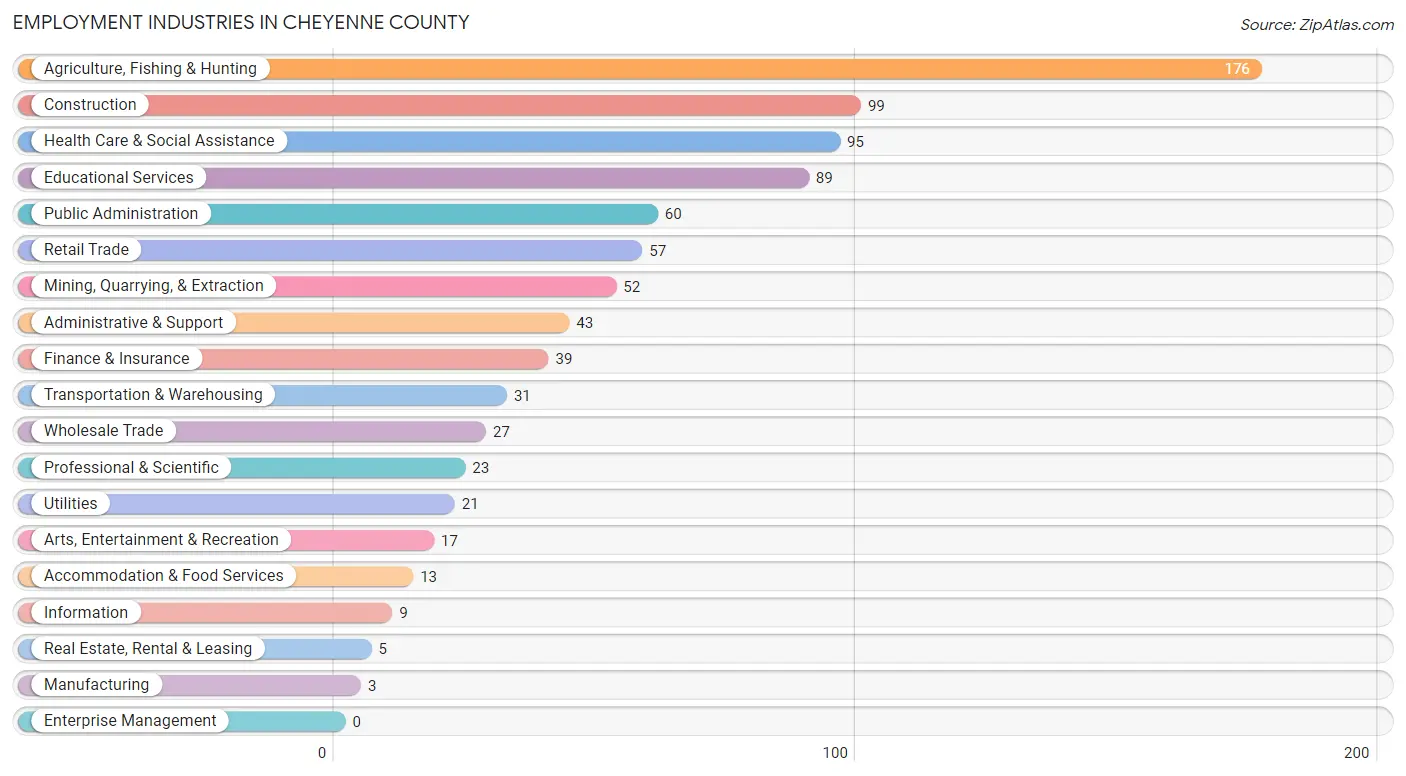
Employment Industries in Cheyenne County
The major employment industries in Cheyenne County include Agriculture, Fishing & Hunting (176 | 19.9%), Construction (99 | 11.2%), Health Care & Social Assistance (95 | 10.7%), Educational Services (89 | 10.1%), and Public Administration (60 | 6.8%).
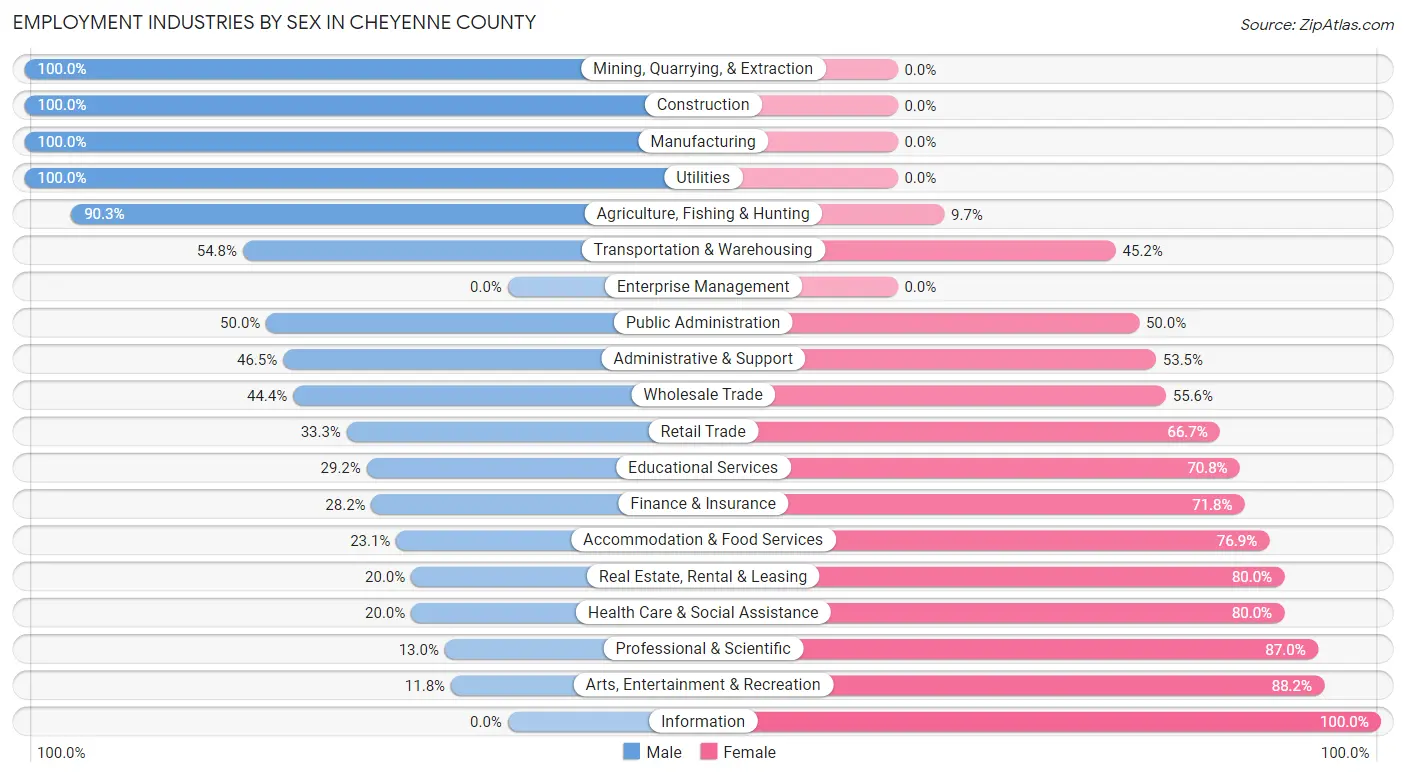
Employment Industries by Sex in Cheyenne County
The Cheyenne County industries that see more men than women are Mining, Quarrying, & Extraction (100.0%), Construction (100.0%), and Manufacturing (100.0%), whereas the industries that tend to have a higher number of women are Information (100.0%), Arts, Entertainment & Recreation (88.2%), and Professional & Scientific (87.0%).
| Industry | Male | Female |
| Agriculture, Fishing & Hunting | 159 (90.3%) | 17 (9.7%) |
| Mining, Quarrying, & Extraction | 52 (100.0%) | 0 (0.0%) |
| Construction | 99 (100.0%) | 0 (0.0%) |
| Manufacturing | 3 (100.0%) | 0 (0.0%) |
| Wholesale Trade | 12 (44.4%) | 15 (55.6%) |
| Retail Trade | 19 (33.3%) | 38 (66.7%) |
| Transportation & Warehousing | 17 (54.8%) | 14 (45.2%) |
| Utilities | 21 (100.0%) | 0 (0.0%) |
| Information | 0 (0.0%) | 9 (100.0%) |
| Finance & Insurance | 11 (28.2%) | 28 (71.8%) |
| Real Estate, Rental & Leasing | 1 (20.0%) | 4 (80.0%) |
| Professional & Scientific | 3 (13.0%) | 20 (87.0%) |
| Enterprise Management | 0 (0.0%) | 0 (0.0%) |
| Administrative & Support | 20 (46.5%) | 23 (53.5%) |
| Educational Services | 26 (29.2%) | 63 (70.8%) |
| Health Care & Social Assistance | 19 (20.0%) | 76 (80.0%) |
| Arts, Entertainment & Recreation | 2 (11.8%) | 15 (88.2%) |
| Accommodation & Food Services | 3 (23.1%) | 10 (76.9%) |
| Public Administration | 30 (50.0%) | 30 (50.0%) |
| Total | 522 (58.9%) | 364 (41.1%) |
Education in Cheyenne County
School Enrollment in Cheyenne County
The most common levels of schooling among the 395 students in Cheyenne County are middle school (106 | 26.8%), elementary school (95 | 24.0%), and high school (81 | 20.5%).
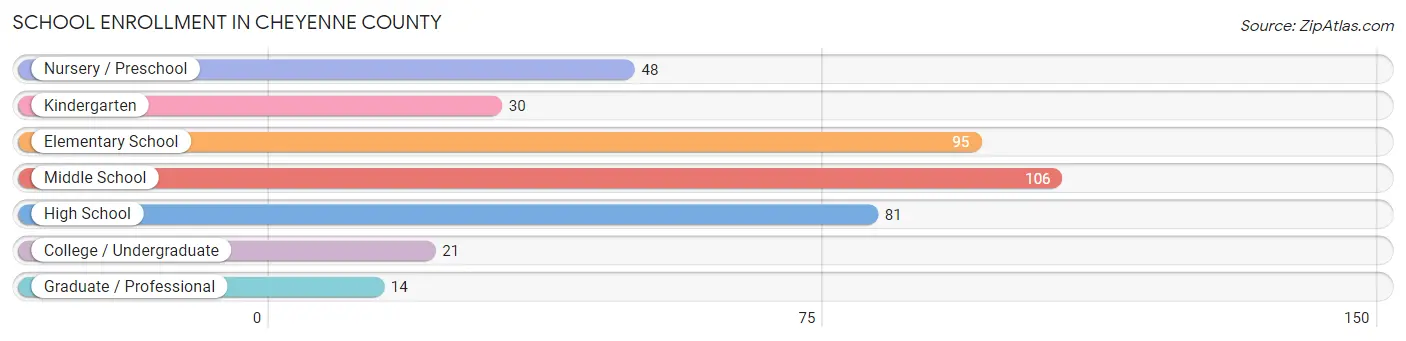
| School Level | # Students | % Students |
| Nursery / Preschool | 48 | 12.1% |
| Kindergarten | 30 | 7.6% |
| Elementary School | 95 | 24.0% |
| Middle School | 106 | 26.8% |
| High School | 81 | 20.5% |
| College / Undergraduate | 21 | 5.3% |
| Graduate / Professional | 14 | 3.5% |
| Total | 395 | 100.0% |
School Enrollment by Age by Funding Source in Cheyenne County
Out of a total of 395 students who are enrolled in schools in Cheyenne County, 39 (9.9%) attend a private institution, while the remaining 356 (90.1%) are enrolled in public schools. The age group of 35 years and over has the highest likelihood of being enrolled in private schools, with 13 (52.0% in the age bracket) enrolled. Conversely, the age group of 3 to 4 year olds has the lowest likelihood of being enrolled in a private school, with 33 (100.0% in the age bracket) attending a public institution.
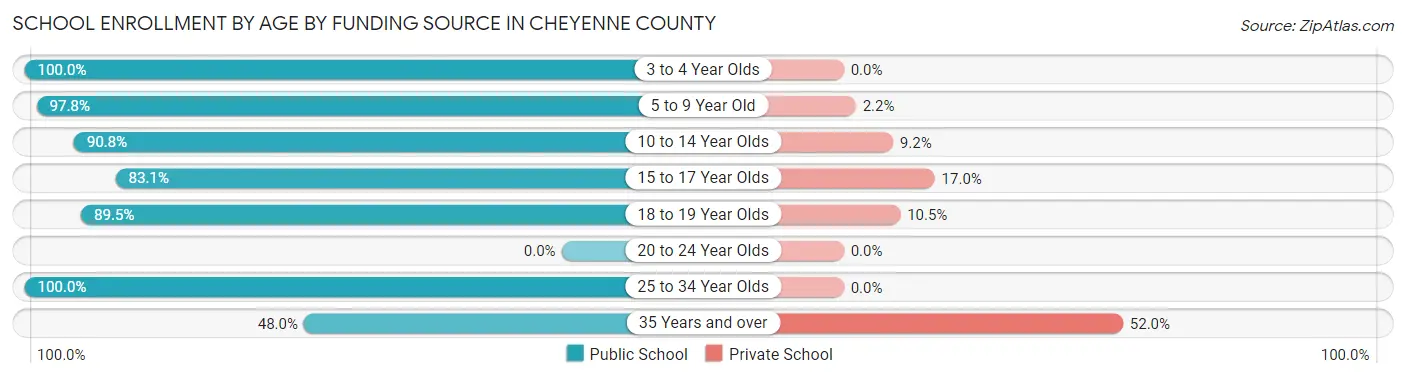
| Age Bracket | Public School | Private School |
| 3 to 4 Year Olds | 33 (100.0%) | 0 (0.0%) |
| 5 to 9 Year Old | 131 (97.8%) | 3 (2.2%) |
| 10 to 14 Year Olds | 109 (90.8%) | 11 (9.2%) |
| 15 to 17 Year Olds | 49 (83.1%) | 10 (17.0%) |
| 18 to 19 Year Olds | 17 (89.5%) | 2 (10.5%) |
| 20 to 24 Year Olds | 0 (0.0%) | 0 (0.0%) |
| 25 to 34 Year Olds | 5 (100.0%) | 0 (0.0%) |
| 35 Years and over | 12 (48.0%) | 13 (52.0%) |
| Total | 356 (90.1%) | 39 (9.9%) |
Educational Attainment by Field of Study in Cheyenne County
Education (60 | 19.6%), business (43 | 14.1%), social sciences (37 | 12.1%), bio, nature & agricultural (32 | 10.5%), and engineering (30 | 9.8%) are the most common fields of study among 306 individuals in Cheyenne County who have obtained a bachelor's degree or higher.
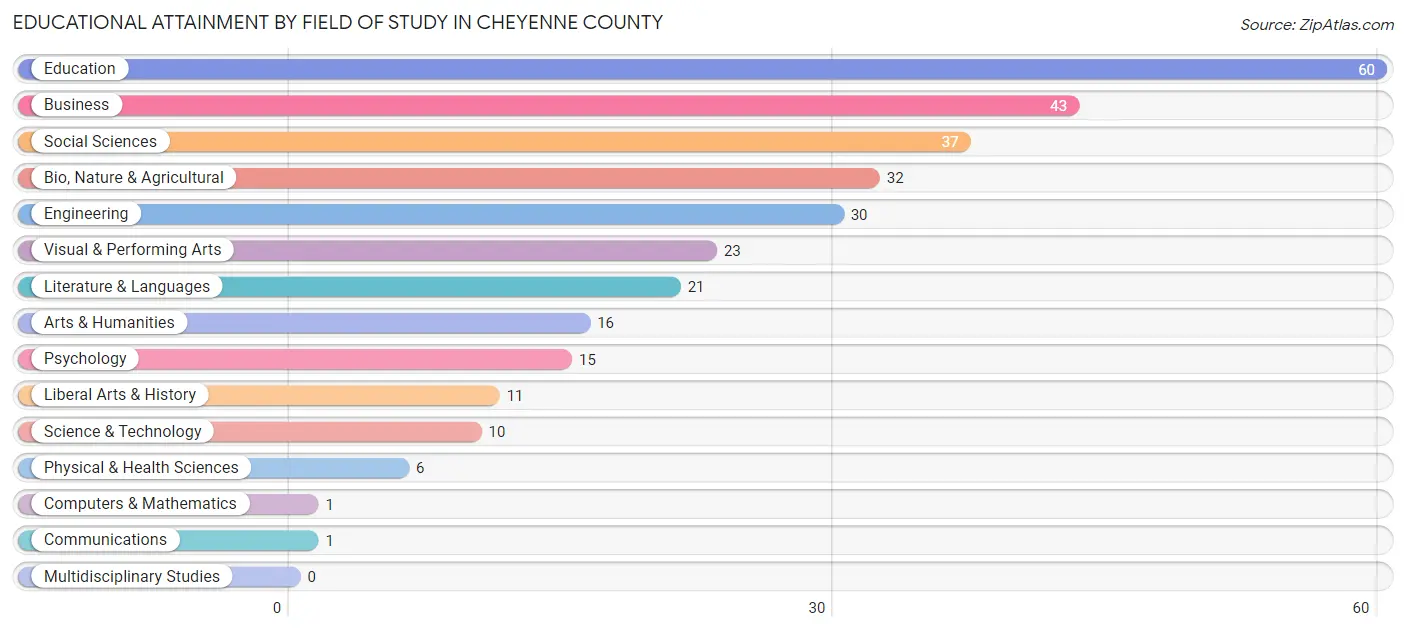
| Field of Study | # Graduates | % Graduates |
| Computers & Mathematics | 1 | 0.3% |
| Bio, Nature & Agricultural | 32 | 10.5% |
| Physical & Health Sciences | 6 | 2.0% |
| Psychology | 15 | 4.9% |
| Social Sciences | 37 | 12.1% |
| Engineering | 30 | 9.8% |
| Multidisciplinary Studies | 0 | 0.0% |
| Science & Technology | 10 | 3.3% |
| Business | 43 | 14.1% |
| Education | 60 | 19.6% |
| Literature & Languages | 21 | 6.9% |
| Liberal Arts & History | 11 | 3.6% |
| Visual & Performing Arts | 23 | 7.5% |
| Communications | 1 | 0.3% |
| Arts & Humanities | 16 | 5.2% |
| Total | 306 | 100.0% |
Transportation & Commute in Cheyenne County
Vehicle Availability by Sex in Cheyenne County
The most prevalent vehicle ownership categories in Cheyenne County are males with 2 vehicles (256, accounting for 49.6%) and females with 2 vehicles (145, making up 70.7%).
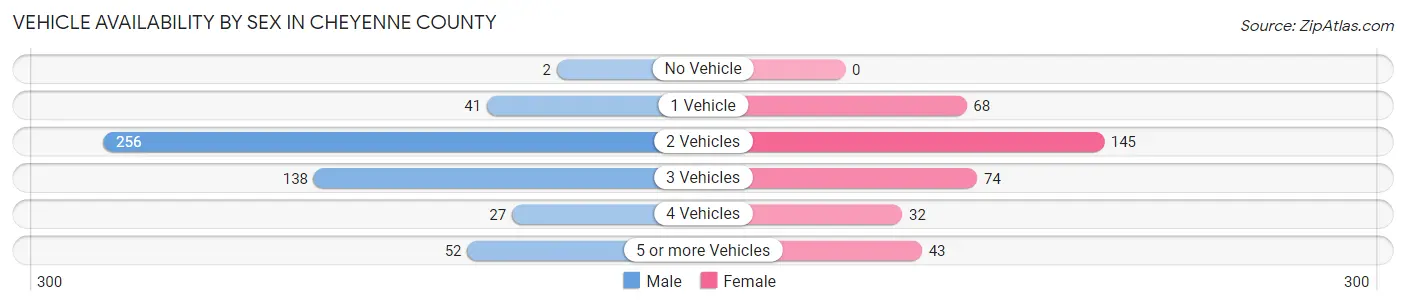
| Vehicles Available | Male | Female |
| No Vehicle | 2 (0.4%) | 0 (0.0%) |
| 1 Vehicle | 41 (8.0%) | 68 (18.8%) |
| 2 Vehicles | 256 (49.6%) | 145 (40.1%) |
| 3 Vehicles | 138 (26.7%) | 74 (20.4%) |
| 4 Vehicles | 27 (5.2%) | 32 (8.8%) |
| 5 or more Vehicles | 52 (10.1%) | 43 (11.9%) |
| Total | 516 (100.0%) | 362 (100.0%) |
Commute Time in Cheyenne County
The most frequently occuring commute durations in Cheyenne County are 5 to 9 minutes (206 commuters, 26.3%), less than 5 minutes (198 commuters, 25.3%), and 10 to 14 minutes (87 commuters, 11.1%).
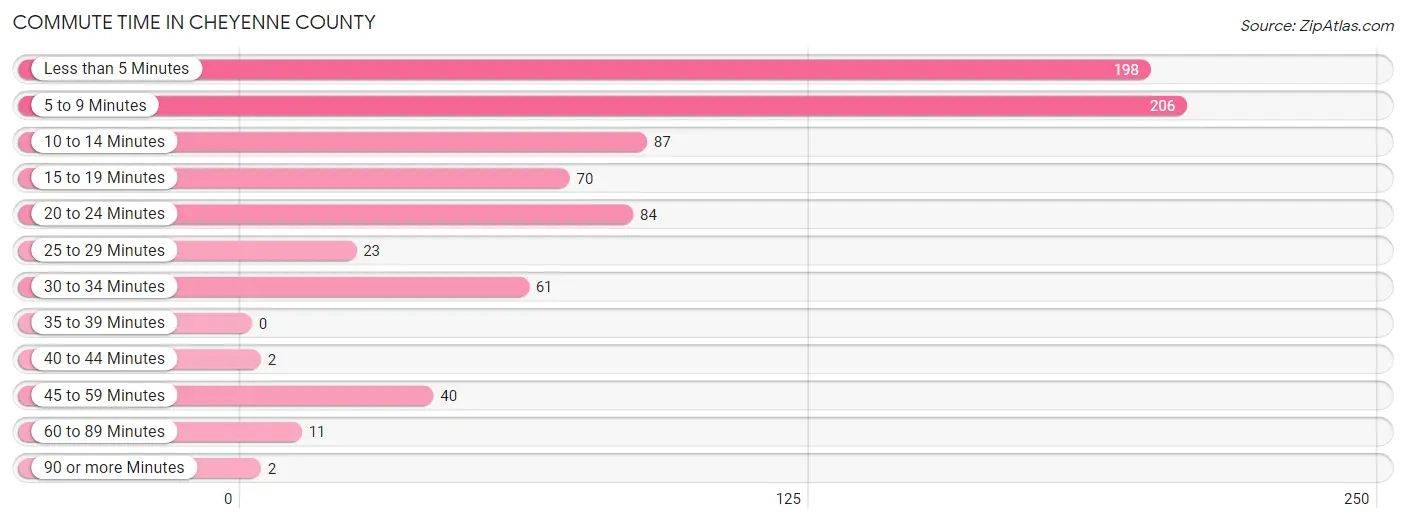
| Commute Time | # Commuters | % Commuters |
| Less than 5 Minutes | 198 | 25.3% |
| 5 to 9 Minutes | 206 | 26.3% |
| 10 to 14 Minutes | 87 | 11.1% |
| 15 to 19 Minutes | 70 | 8.9% |
| 20 to 24 Minutes | 84 | 10.7% |
| 25 to 29 Minutes | 23 | 2.9% |
| 30 to 34 Minutes | 61 | 7.8% |
| 35 to 39 Minutes | 0 | 0.0% |
| 40 to 44 Minutes | 2 | 0.3% |
| 45 to 59 Minutes | 40 | 5.1% |
| 60 to 89 Minutes | 11 | 1.4% |
| 90 or more Minutes | 2 | 0.3% |
Commute Time by Sex in Cheyenne County
The most common commute times in Cheyenne County are 5 to 9 minutes (126 commuters, 27.8%) for males and less than 5 minutes (125 commuters, 37.8%) for females.
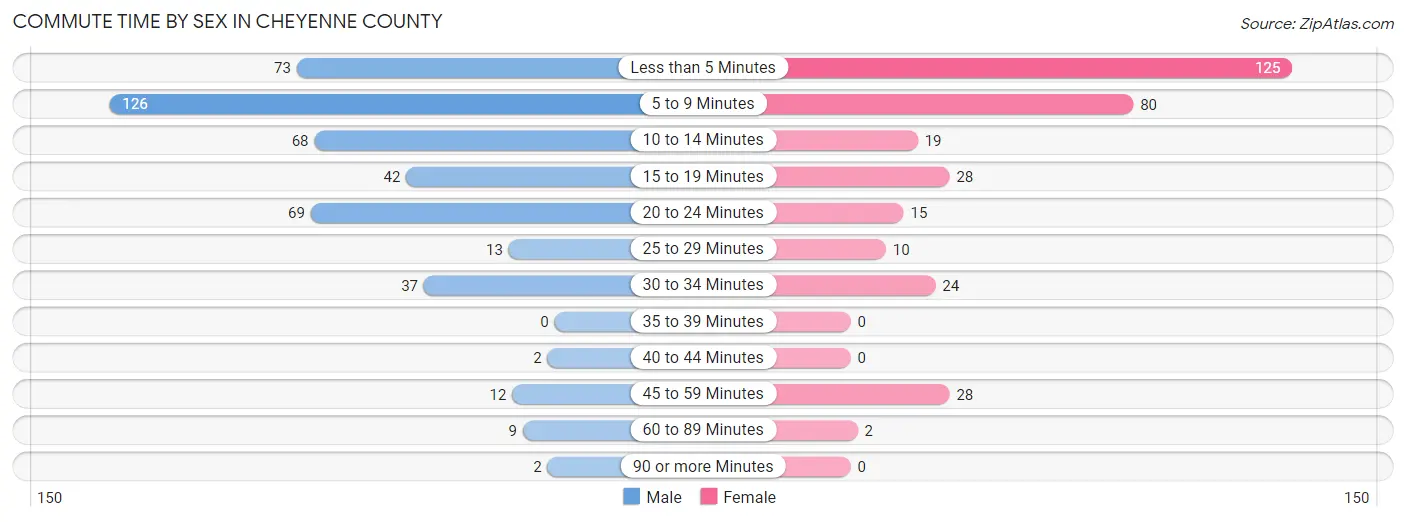
| Commute Time | Male | Female |
| Less than 5 Minutes | 73 (16.1%) | 125 (37.8%) |
| 5 to 9 Minutes | 126 (27.8%) | 80 (24.2%) |
| 10 to 14 Minutes | 68 (15.0%) | 19 (5.7%) |
| 15 to 19 Minutes | 42 (9.3%) | 28 (8.5%) |
| 20 to 24 Minutes | 69 (15.2%) | 15 (4.5%) |
| 25 to 29 Minutes | 13 (2.9%) | 10 (3.0%) |
| 30 to 34 Minutes | 37 (8.2%) | 24 (7.2%) |
| 35 to 39 Minutes | 0 (0.0%) | 0 (0.0%) |
| 40 to 44 Minutes | 2 (0.4%) | 0 (0.0%) |
| 45 to 59 Minutes | 12 (2.6%) | 28 (8.5%) |
| 60 to 89 Minutes | 9 (2.0%) | 2 (0.6%) |
| 90 or more Minutes | 2 (0.4%) | 0 (0.0%) |
Time of Departure to Work by Sex in Cheyenne County
The most frequent times of departure to work in Cheyenne County are 7:00 AM to 7:29 AM (154, 34.0%) for males and 7:30 AM to 7:59 AM (65, 19.6%) for females.
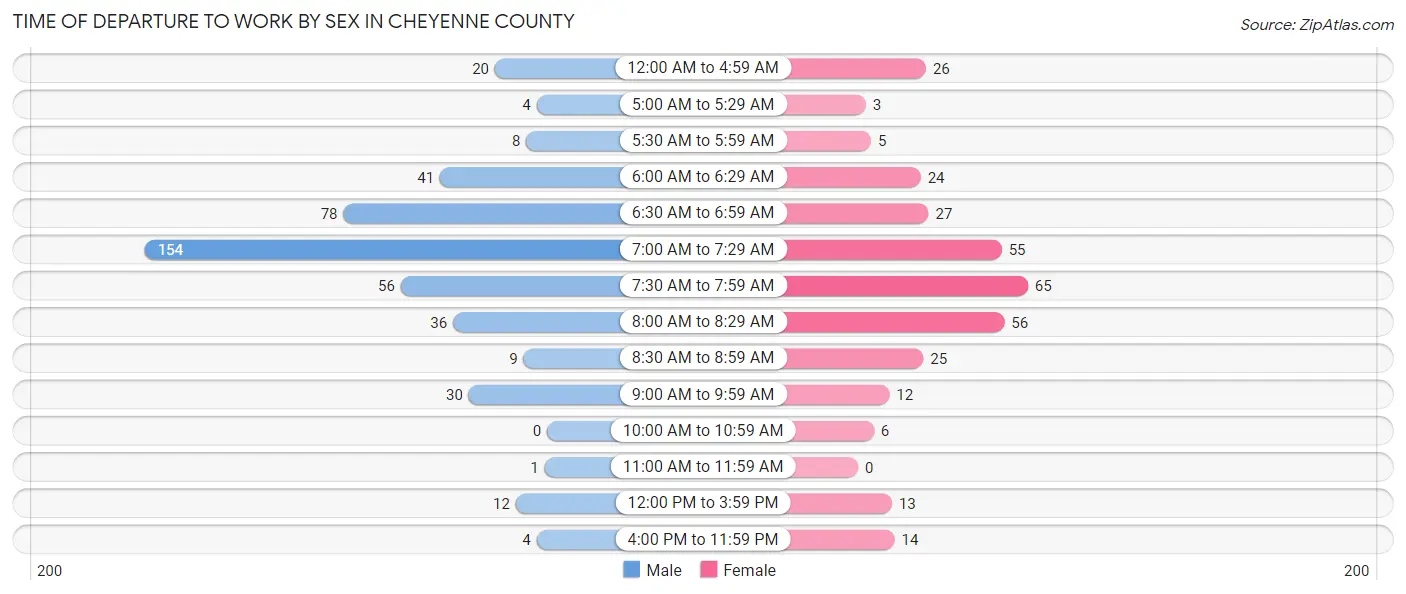
| Time of Departure | Male | Female |
| 12:00 AM to 4:59 AM | 20 (4.4%) | 26 (7.9%) |
| 5:00 AM to 5:29 AM | 4 (0.9%) | 3 (0.9%) |
| 5:30 AM to 5:59 AM | 8 (1.8%) | 5 (1.5%) |
| 6:00 AM to 6:29 AM | 41 (9.0%) | 24 (7.2%) |
| 6:30 AM to 6:59 AM | 78 (17.2%) | 27 (8.2%) |
| 7:00 AM to 7:29 AM | 154 (34.0%) | 55 (16.6%) |
| 7:30 AM to 7:59 AM | 56 (12.4%) | 65 (19.6%) |
| 8:00 AM to 8:29 AM | 36 (8.0%) | 56 (16.9%) |
| 8:30 AM to 8:59 AM | 9 (2.0%) | 25 (7.5%) |
| 9:00 AM to 9:59 AM | 30 (6.6%) | 12 (3.6%) |
| 10:00 AM to 10:59 AM | 0 (0.0%) | 6 (1.8%) |
| 11:00 AM to 11:59 AM | 1 (0.2%) | 0 (0.0%) |
| 12:00 PM to 3:59 PM | 12 (2.6%) | 13 (3.9%) |
| 4:00 PM to 11:59 PM | 4 (0.9%) | 14 (4.2%) |
| Total | 453 (100.0%) | 331 (100.0%) |
Housing Occupancy in Cheyenne County
Occupancy by Ownership in Cheyenne County
Of the total 740 dwellings in Cheyenne County, owner-occupied units account for 584 (78.9%), while renter-occupied units make up 156 (21.1%).
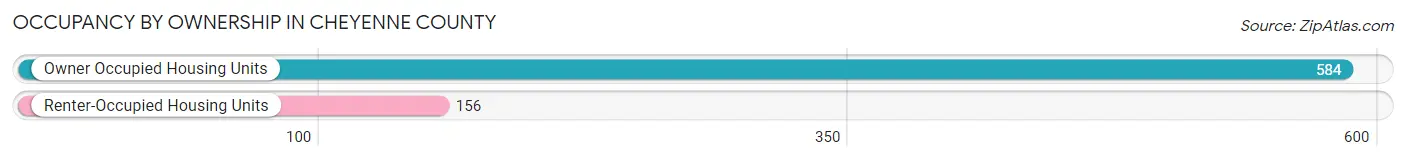
| Occupancy | # Housing Units | % Housing Units |
| Owner Occupied Housing Units | 584 | 78.9% |
| Renter-Occupied Housing Units | 156 | 21.1% |
| Total Occupied Housing Units | 740 | 100.0% |
Occupancy by Household Size in Cheyenne County
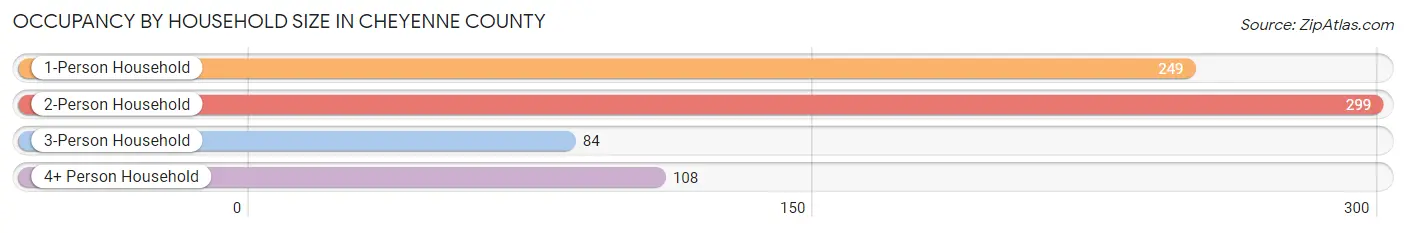
| Household Size | # Housing Units | % Housing Units |
| 1-Person Household | 249 | 33.7% |
| 2-Person Household | 299 | 40.4% |
| 3-Person Household | 84 | 11.4% |
| 4+ Person Household | 108 | 14.6% |
| Total Housing Units | 740 | 100.0% |
Occupancy by Ownership by Household Size in Cheyenne County
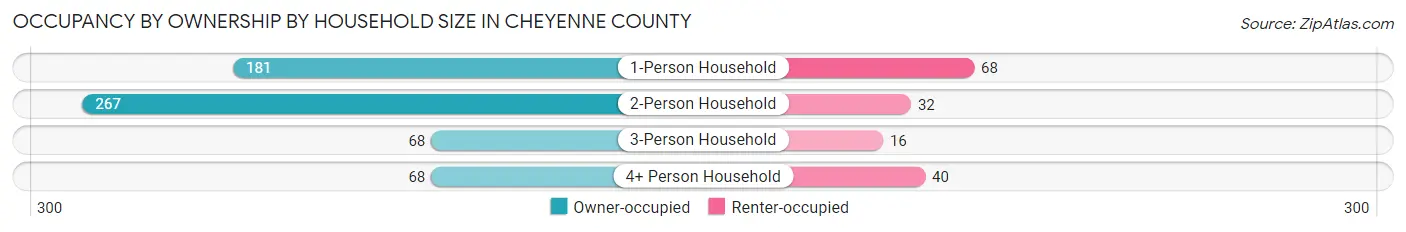
| Household Size | Owner-occupied | Renter-occupied |
| 1-Person Household | 181 (72.7%) | 68 (27.3%) |
| 2-Person Household | 267 (89.3%) | 32 (10.7%) |
| 3-Person Household | 68 (80.9%) | 16 (19.1%) |
| 4+ Person Household | 68 (63.0%) | 40 (37.0%) |
| Total Housing Units | 584 (78.9%) | 156 (21.1%) |
Occupancy by Educational Attainment in Cheyenne County
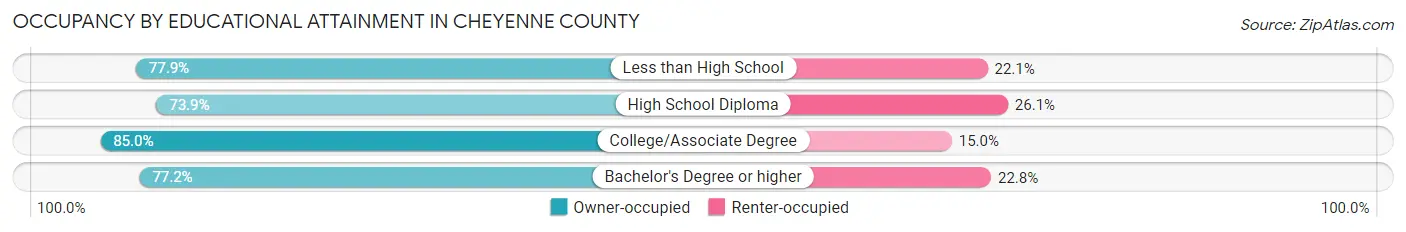
| Household Size | Owner-occupied | Renter-occupied |
| Less than High School | 60 (77.9%) | 17 (22.1%) |
| High School Diploma | 181 (73.9%) | 64 (26.1%) |
| College/Associate Degree | 221 (85.0%) | 39 (15.0%) |
| Bachelor's Degree or higher | 122 (77.2%) | 36 (22.8%) |
Occupancy by Age of Householder in Cheyenne County
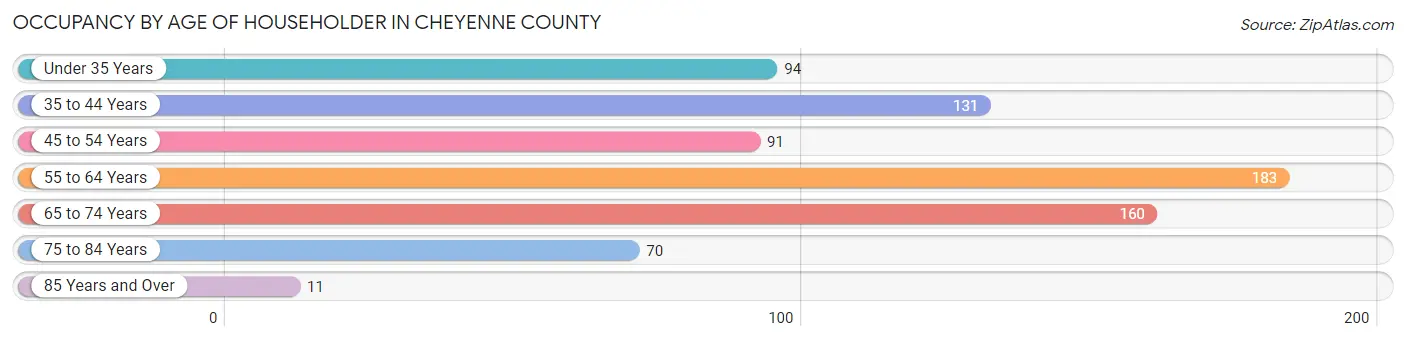
| Age Bracket | # Households | % Households |
| Under 35 Years | 94 | 12.7% |
| 35 to 44 Years | 131 | 17.7% |
| 45 to 54 Years | 91 | 12.3% |
| 55 to 64 Years | 183 | 24.7% |
| 65 to 74 Years | 160 | 21.6% |
| 75 to 84 Years | 70 | 9.5% |
| 85 Years and Over | 11 | 1.5% |
| Total | 740 | 100.0% |
Housing Finances in Cheyenne County
Median Income by Occupancy in Cheyenne County
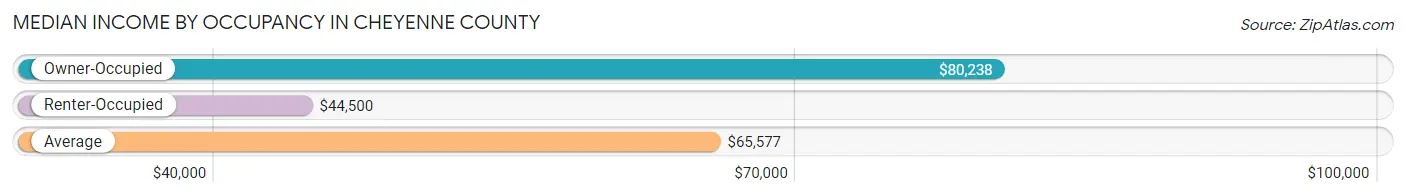
| Occupancy Type | # Households | Median Income |
| Owner-Occupied | 584 (78.9%) | $80,238 |
| Renter-Occupied | 156 (21.1%) | $44,500 |
| Average | 740 (100.0%) | $65,577 |
Occupancy by Householder Income Bracket in Cheyenne County
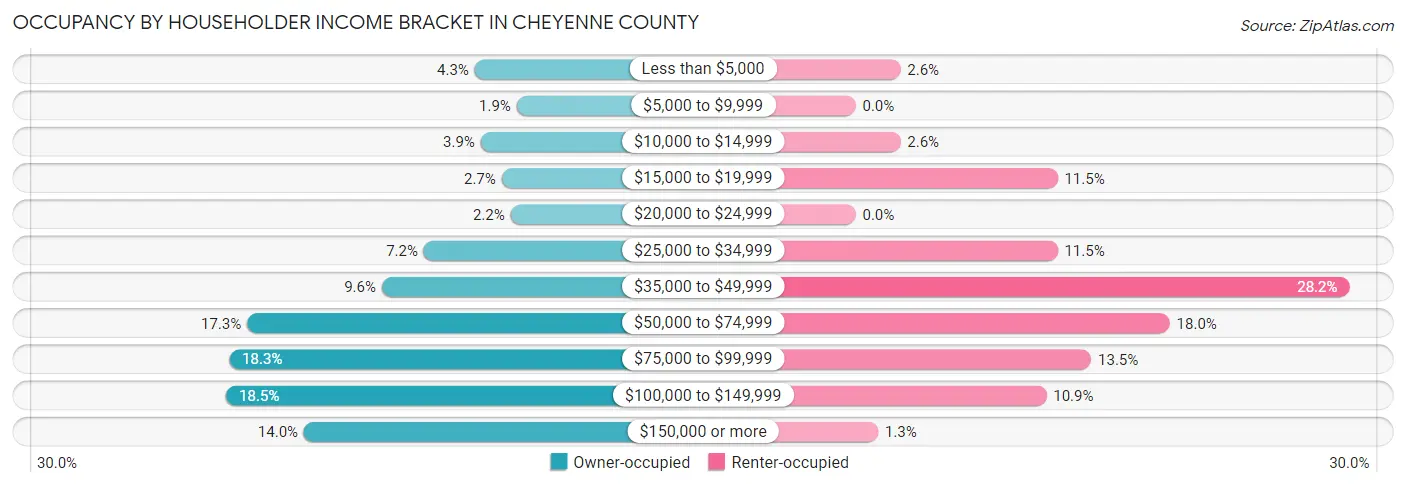
| Income Bracket | Owner-occupied | Renter-occupied |
| Less than $5,000 | 25 (4.3%) | 4 (2.6%) |
| $5,000 to $9,999 | 11 (1.9%) | 0 (0.0%) |
| $10,000 to $14,999 | 23 (3.9%) | 4 (2.6%) |
| $15,000 to $19,999 | 16 (2.7%) | 18 (11.5%) |
| $20,000 to $24,999 | 13 (2.2%) | 0 (0.0%) |
| $25,000 to $34,999 | 42 (7.2%) | 18 (11.5%) |
| $35,000 to $49,999 | 56 (9.6%) | 44 (28.2%) |
| $50,000 to $74,999 | 101 (17.3%) | 28 (17.9%) |
| $75,000 to $99,999 | 107 (18.3%) | 21 (13.5%) |
| $100,000 to $149,999 | 108 (18.5%) | 17 (10.9%) |
| $150,000 or more | 82 (14.0%) | 2 (1.3%) |
| Total | 584 (100.0%) | 156 (100.0%) |
Monthly Housing Cost Tiers in Cheyenne County
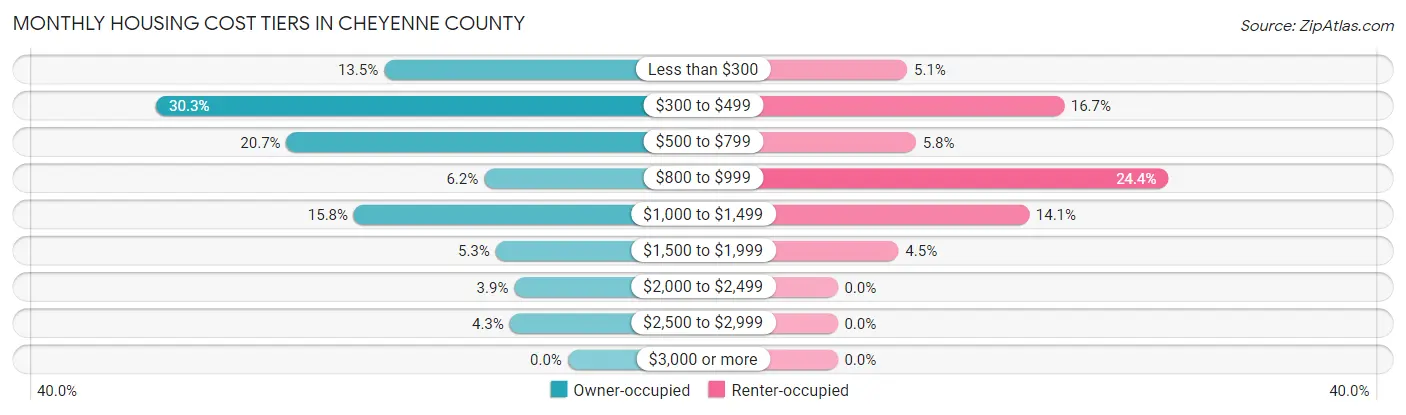
| Monthly Cost | Owner-occupied | Renter-occupied |
| Less than $300 | 79 (13.5%) | 8 (5.1%) |
| $300 to $499 | 177 (30.3%) | 26 (16.7%) |
| $500 to $799 | 121 (20.7%) | 9 (5.8%) |
| $800 to $999 | 36 (6.2%) | 38 (24.4%) |
| $1,000 to $1,499 | 92 (15.8%) | 22 (14.1%) |
| $1,500 to $1,999 | 31 (5.3%) | 7 (4.5%) |
| $2,000 to $2,499 | 23 (3.9%) | 0 (0.0%) |
| $2,500 to $2,999 | 25 (4.3%) | 0 (0.0%) |
| $3,000 or more | 0 (0.0%) | 0 (0.0%) |
| Total | 584 (100.0%) | 156 (100.0%) |
Physical Housing Characteristics in Cheyenne County
Housing Structures in Cheyenne County
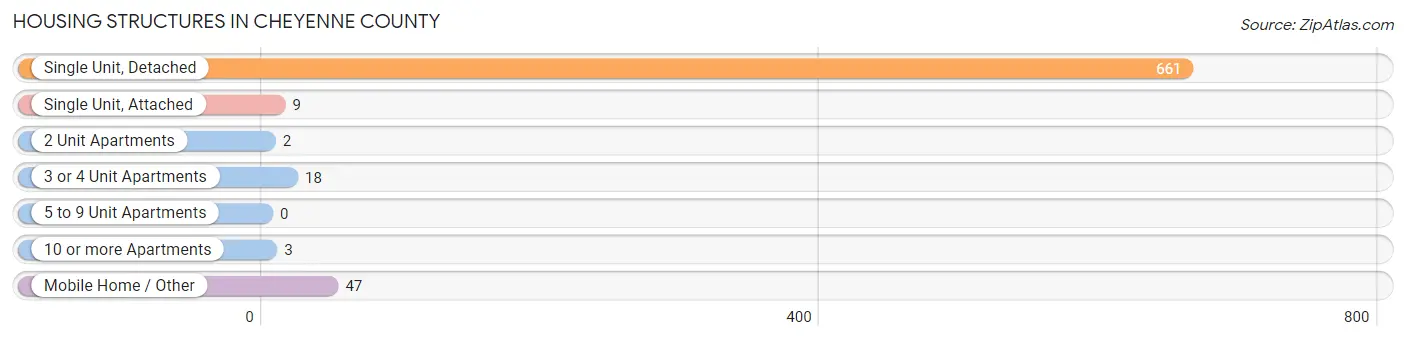
| Structure Type | # Housing Units | % Housing Units |
| Single Unit, Detached | 661 | 89.3% |
| Single Unit, Attached | 9 | 1.2% |
| 2 Unit Apartments | 2 | 0.3% |
| 3 or 4 Unit Apartments | 18 | 2.4% |
| 5 to 9 Unit Apartments | 0 | 0.0% |
| 10 or more Apartments | 3 | 0.4% |
| Mobile Home / Other | 47 | 6.4% |
| Total | 740 | 100.0% |
Housing Structures by Occupancy in Cheyenne County
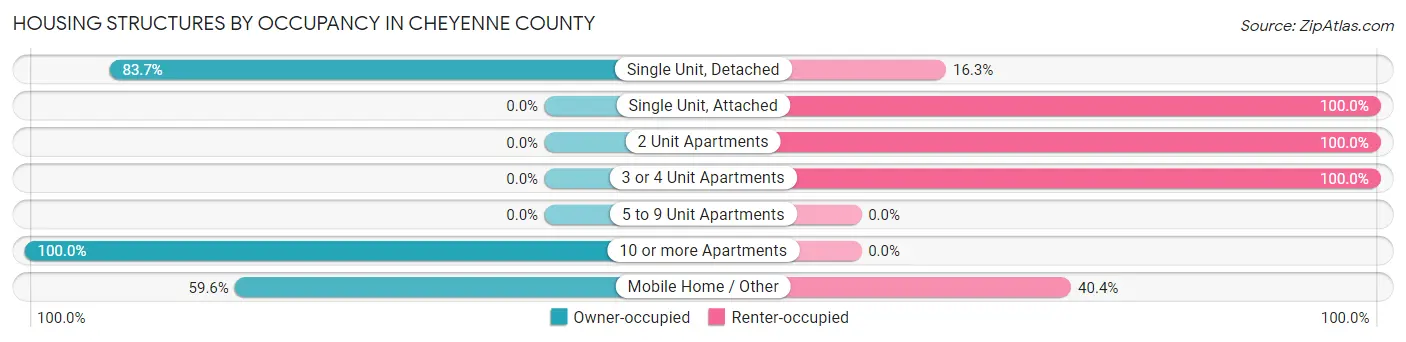
| Structure Type | Owner-occupied | Renter-occupied |
| Single Unit, Detached | 553 (83.7%) | 108 (16.3%) |
| Single Unit, Attached | 0 (0.0%) | 9 (100.0%) |
| 2 Unit Apartments | 0 (0.0%) | 2 (100.0%) |
| 3 or 4 Unit Apartments | 0 (0.0%) | 18 (100.0%) |
| 5 to 9 Unit Apartments | 0 (0.0%) | 0 (0.0%) |
| 10 or more Apartments | 3 (100.0%) | 0 (0.0%) |
| Mobile Home / Other | 28 (59.6%) | 19 (40.4%) |
| Total | 584 (78.9%) | 156 (21.1%) |
Housing Structures by Number of Rooms in Cheyenne County
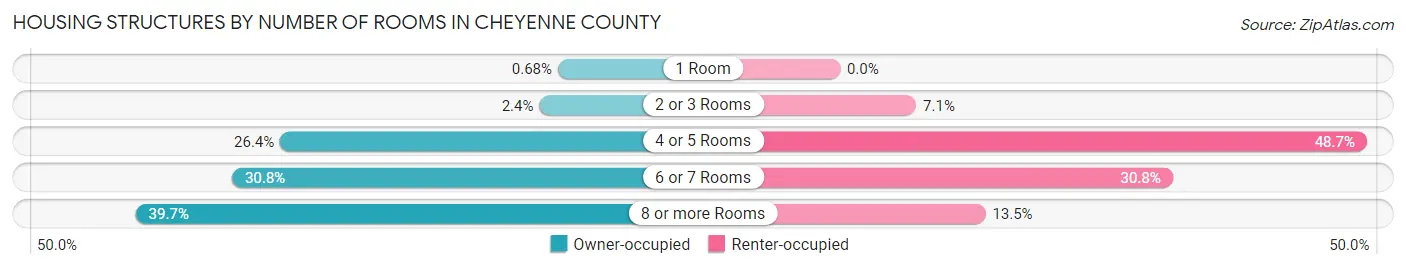
| Number of Rooms | Owner-occupied | Renter-occupied |
| 1 Room | 4 (0.7%) | 0 (0.0%) |
| 2 or 3 Rooms | 14 (2.4%) | 11 (7.0%) |
| 4 or 5 Rooms | 154 (26.4%) | 76 (48.7%) |
| 6 or 7 Rooms | 180 (30.8%) | 48 (30.8%) |
| 8 or more Rooms | 232 (39.7%) | 21 (13.5%) |
| Total | 584 (100.0%) | 156 (100.0%) |
Housing Structure by Heating Type in Cheyenne County
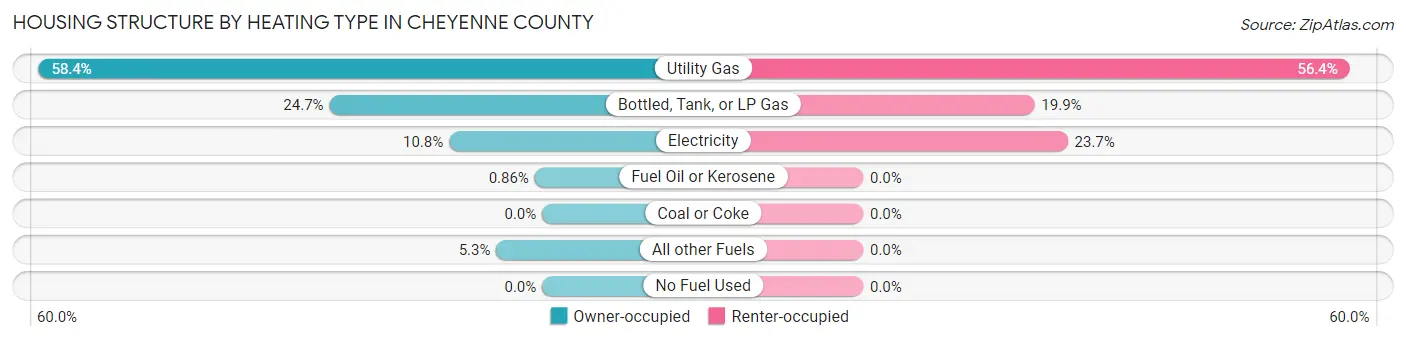
| Heating Type | Owner-occupied | Renter-occupied |
| Utility Gas | 341 (58.4%) | 88 (56.4%) |
| Bottled, Tank, or LP Gas | 144 (24.7%) | 31 (19.9%) |
| Electricity | 63 (10.8%) | 37 (23.7%) |
| Fuel Oil or Kerosene | 5 (0.9%) | 0 (0.0%) |
| Coal or Coke | 0 (0.0%) | 0 (0.0%) |
| All other Fuels | 31 (5.3%) | 0 (0.0%) |
| No Fuel Used | 0 (0.0%) | 0 (0.0%) |
| Total | 584 (100.0%) | 156 (100.0%) |
Household Vehicle Usage in Cheyenne County
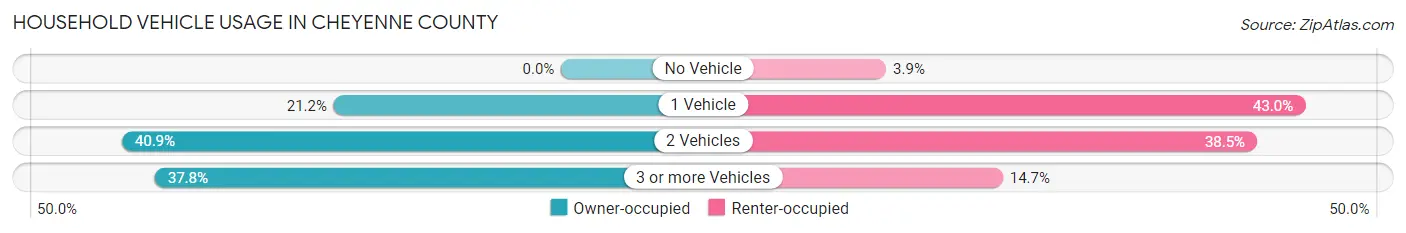
| Vehicles per Household | Owner-occupied | Renter-occupied |
| No Vehicle | 0 (0.0%) | 6 (3.8%) |
| 1 Vehicle | 124 (21.2%) | 67 (42.9%) |
| 2 Vehicles | 239 (40.9%) | 60 (38.5%) |
| 3 or more Vehicles | 221 (37.8%) | 23 (14.7%) |
| Total | 584 (100.0%) | 156 (100.0%) |
Real Estate & Mortgages in Cheyenne County
Real Estate and Mortgage Overview in Cheyenne County
| Characteristic | Without Mortgage | With Mortgage |
| Housing Units | 352 | 232 |
| Median Property Value | $154,200 | $200,000 |
| Median Household Income | $63,750 | $30 |
| Monthly Housing Costs | $411 | $0 |
| Real Estate Taxes | $547 | $6 |
Property Value by Mortgage Status in Cheyenne County
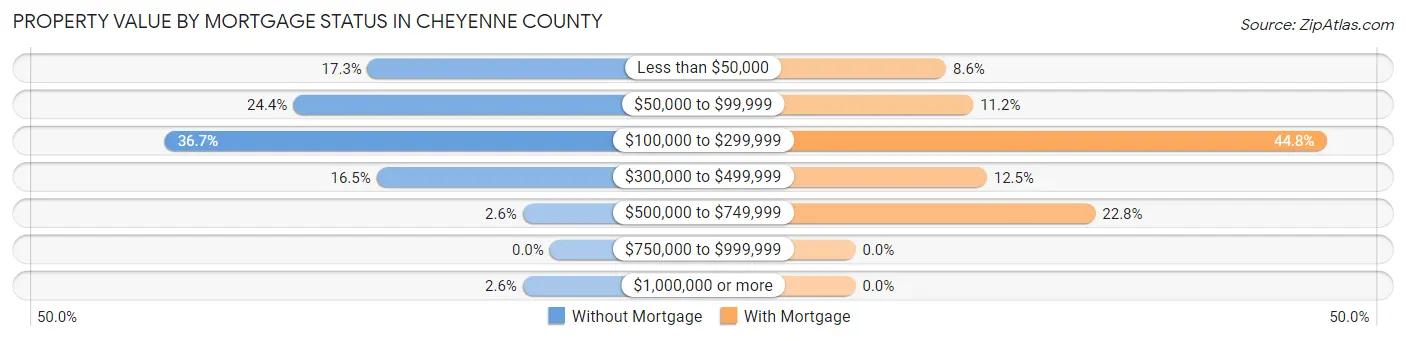
| Property Value | Without Mortgage | With Mortgage |
| Less than $50,000 | 61 (17.3%) | 20 (8.6%) |
| $50,000 to $99,999 | 86 (24.4%) | 26 (11.2%) |
| $100,000 to $299,999 | 129 (36.6%) | 104 (44.8%) |
| $300,000 to $499,999 | 58 (16.5%) | 29 (12.5%) |
| $500,000 to $749,999 | 9 (2.6%) | 53 (22.8%) |
| $750,000 to $999,999 | 0 (0.0%) | 0 (0.0%) |
| $1,000,000 or more | 9 (2.6%) | 0 (0.0%) |
| Total | 352 (100.0%) | 232 (100.0%) |
Household Income by Mortgage Status in Cheyenne County
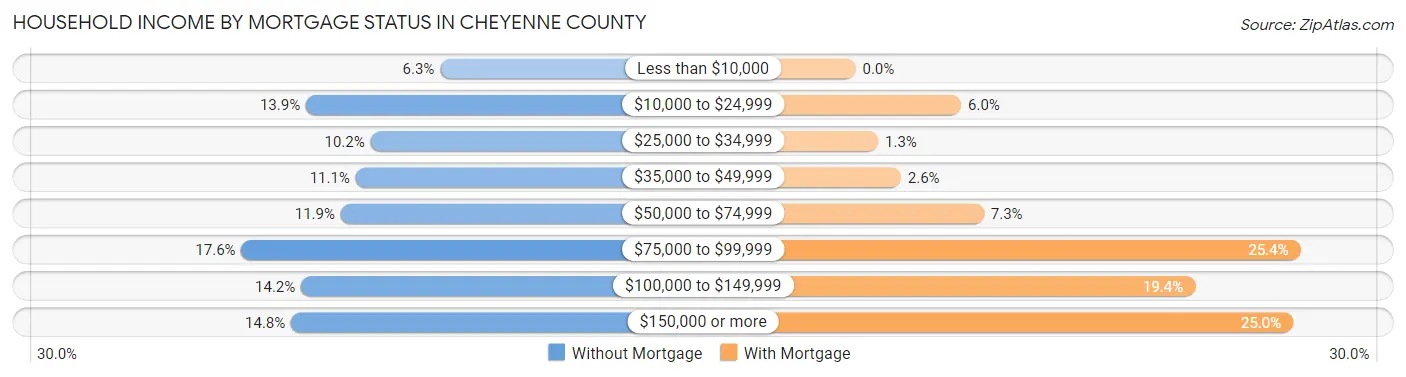
| Household Income | Without Mortgage | With Mortgage |
| Less than $10,000 | 22 (6.2%) | 0 (0.0%) |
| $10,000 to $24,999 | 49 (13.9%) | 14 (6.0%) |
| $25,000 to $34,999 | 36 (10.2%) | 3 (1.3%) |
| $35,000 to $49,999 | 39 (11.1%) | 6 (2.6%) |
| $50,000 to $74,999 | 42 (11.9%) | 17 (7.3%) |
| $75,000 to $99,999 | 62 (17.6%) | 59 (25.4%) |
| $100,000 to $149,999 | 50 (14.2%) | 45 (19.4%) |
| $150,000 or more | 52 (14.8%) | 58 (25.0%) |
| Total | 352 (100.0%) | 232 (100.0%) |
Property Value to Household Income Ratio in Cheyenne County
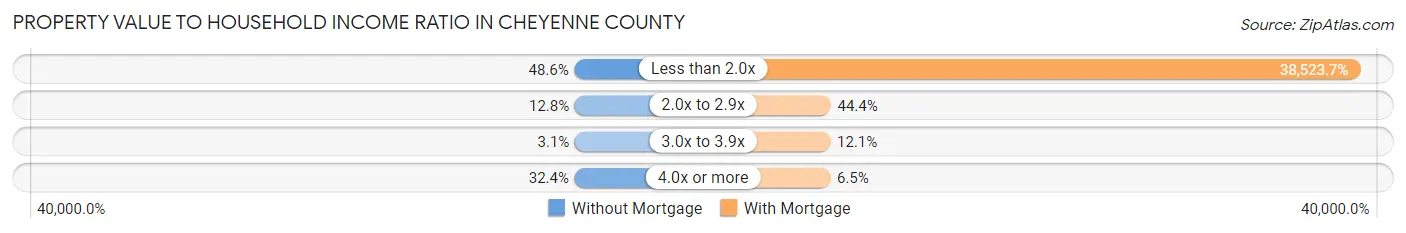
| Value-to-Income Ratio | Without Mortgage | With Mortgage |
| Less than 2.0x | 171 (48.6%) | 89,375 (38,523.7%) |
| 2.0x to 2.9x | 45 (12.8%) | 103 (44.4%) |
| 3.0x to 3.9x | 11 (3.1%) | 28 (12.1%) |
| 4.0x or more | 114 (32.4%) | 15 (6.5%) |
| Total | 352 (100.0%) | 232 (100.0%) |
Real Estate Taxes by Mortgage Status in Cheyenne County
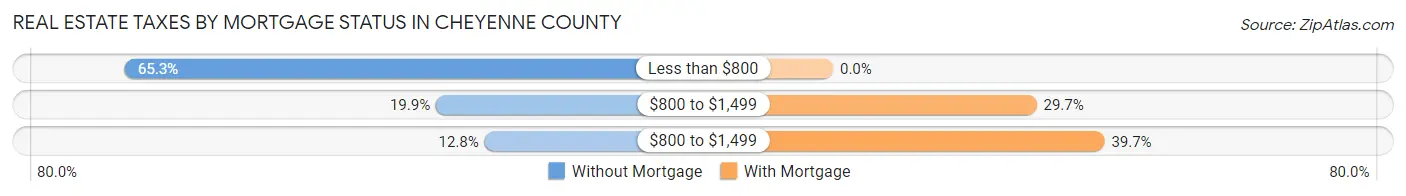
| Property Taxes | Without Mortgage | With Mortgage |
| Less than $800 | 230 (65.3%) | 0 (0.0%) |
| $800 to $1,499 | 70 (19.9%) | 69 (29.7%) |
| $800 to $1,499 | 45 (12.8%) | 92 (39.7%) |
| Total | 352 (100.0%) | 232 (100.0%) |
Health & Disability in Cheyenne County
Health Insurance Coverage by Age in Cheyenne County
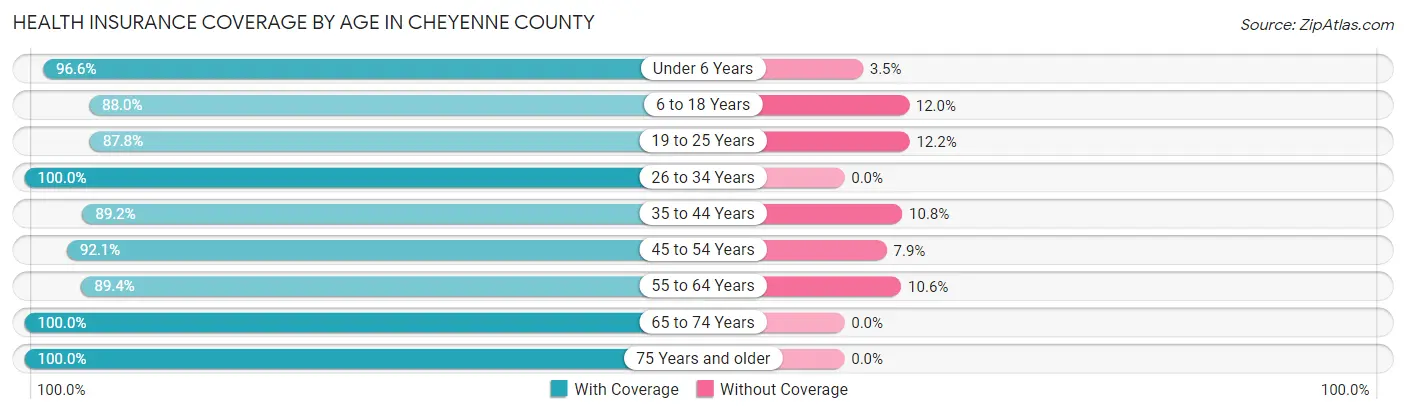
| Age Bracket | With Coverage | Without Coverage |
| Under 6 Years | 140 (96.6%) | 5 (3.5%) |
| 6 to 18 Years | 256 (88.0%) | 35 (12.0%) |
| 19 to 25 Years | 65 (87.8%) | 9 (12.2%) |
| 26 to 34 Years | 126 (100.0%) | 0 (0.0%) |
| 35 to 44 Years | 240 (89.2%) | 29 (10.8%) |
| 45 to 54 Years | 140 (92.1%) | 12 (7.9%) |
| 55 to 64 Years | 270 (89.4%) | 32 (10.6%) |
| 65 to 74 Years | 229 (100.0%) | 0 (0.0%) |
| 75 Years and older | 95 (100.0%) | 0 (0.0%) |
| Total | 1,561 (92.7%) | 122 (7.2%) |
Health Insurance Coverage by Citizenship Status in Cheyenne County
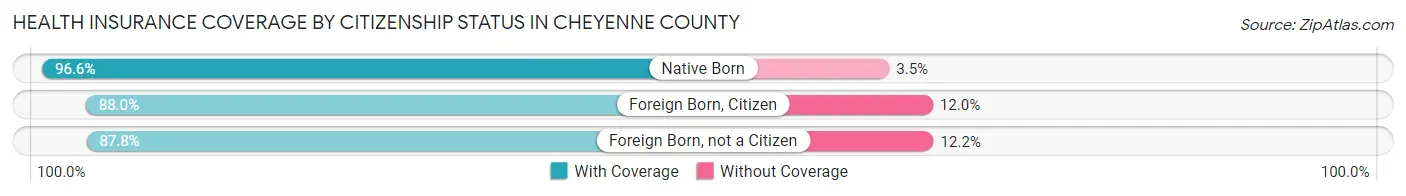
| Citizenship Status | With Coverage | Without Coverage |
| Native Born | 140 (96.6%) | 5 (3.5%) |
| Foreign Born, Citizen | 256 (88.0%) | 35 (12.0%) |
| Foreign Born, not a Citizen | 65 (87.8%) | 9 (12.2%) |
Health Insurance Coverage by Household Income in Cheyenne County
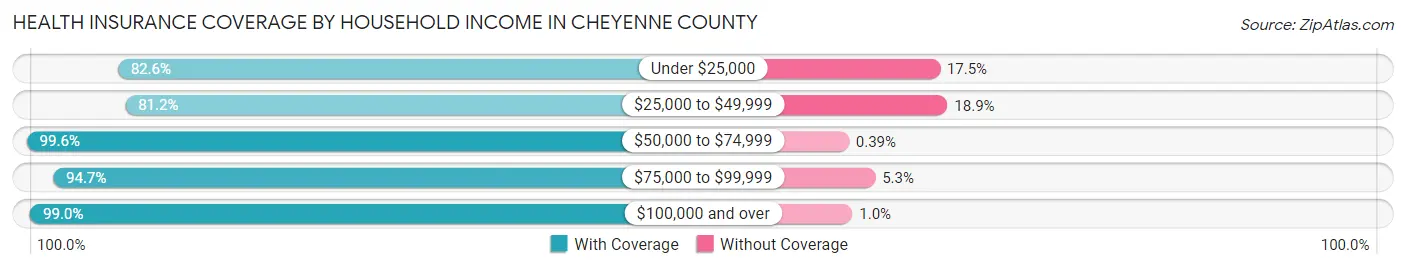
| Household Income | With Coverage | Without Coverage |
| Under $25,000 | 123 (82.6%) | 26 (17.4%) |
| $25,000 to $49,999 | 310 (81.1%) | 72 (18.9%) |
| $50,000 to $74,999 | 257 (99.6%) | 1 (0.4%) |
| $75,000 to $99,999 | 302 (94.7%) | 17 (5.3%) |
| $100,000 and over | 569 (99.0%) | 6 (1.0%) |
Public vs Private Health Insurance Coverage by Age in Cheyenne County
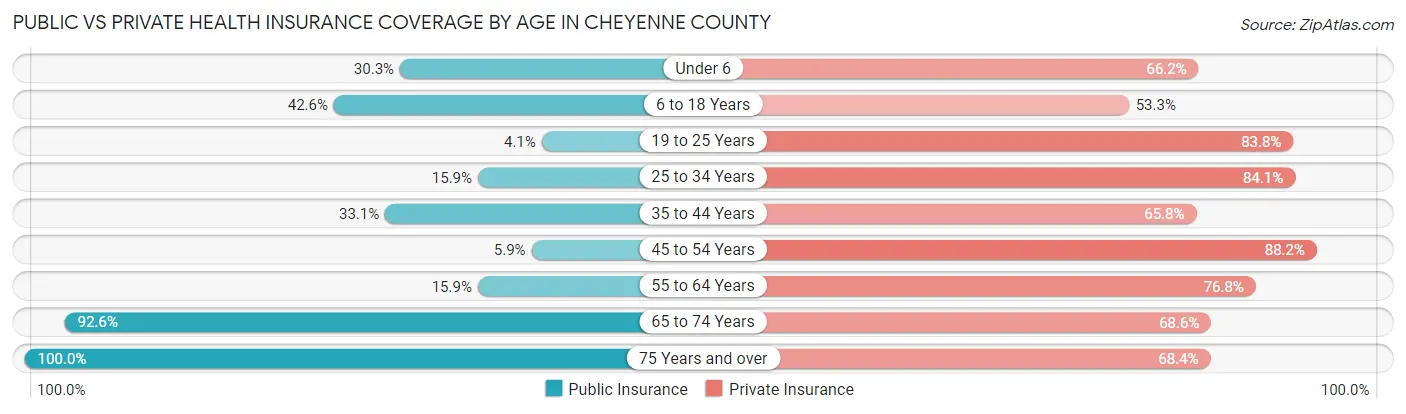
| Age Bracket | Public Insurance | Private Insurance |
| Under 6 | 44 (30.3%) | 96 (66.2%) |
| 6 to 18 Years | 124 (42.6%) | 155 (53.3%) |
| 19 to 25 Years | 3 (4.1%) | 62 (83.8%) |
| 25 to 34 Years | 20 (15.9%) | 106 (84.1%) |
| 35 to 44 Years | 89 (33.1%) | 177 (65.8%) |
| 45 to 54 Years | 9 (5.9%) | 134 (88.2%) |
| 55 to 64 Years | 48 (15.9%) | 232 (76.8%) |
| 65 to 74 Years | 212 (92.6%) | 157 (68.6%) |
| 75 Years and over | 95 (100.0%) | 65 (68.4%) |
| Total | 644 (38.3%) | 1,184 (70.4%) |
Disability Status by Sex by Age in Cheyenne County
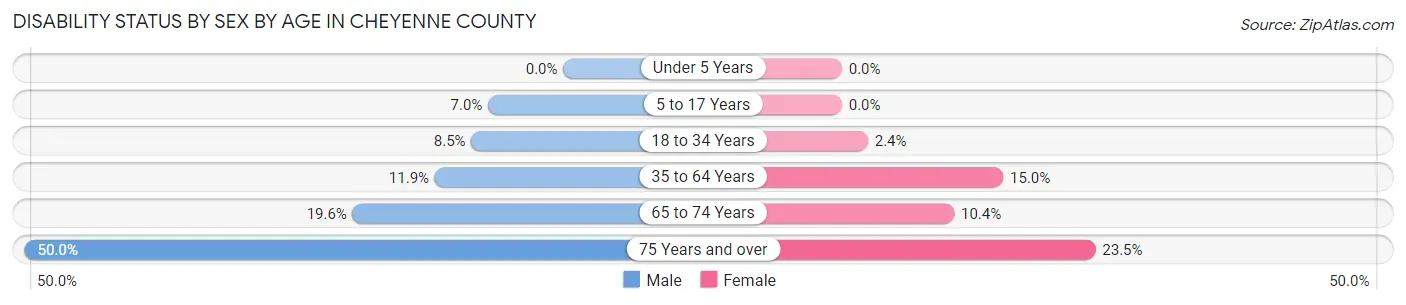
| Age Bracket | Male | Female |
| Under 5 Years | 0 (0.0%) | 0 (0.0%) |
| 5 to 17 Years | 9 (7.0%) | 0 (0.0%) |
| 18 to 34 Years | 11 (8.5%) | 2 (2.4%) |
| 35 to 64 Years | 44 (11.9%) | 53 (15.0%) |
| 65 to 74 Years | 26 (19.6%) | 10 (10.4%) |
| 75 Years and over | 22 (50.0%) | 12 (23.5%) |
Disability Class by Sex by Age in Cheyenne County
Disability Class: Hearing Difficulty
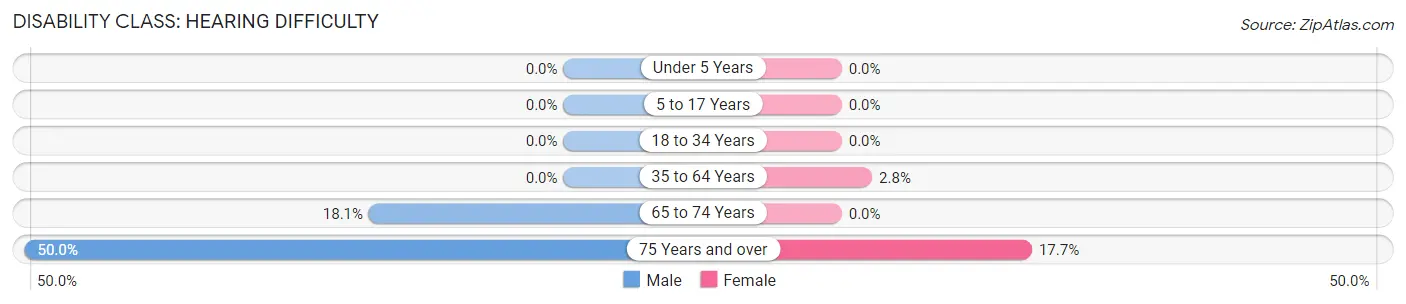
| Age Bracket | Male | Female |
| Under 5 Years | 0 (0.0%) | 0 (0.0%) |
| 5 to 17 Years | 0 (0.0%) | 0 (0.0%) |
| 18 to 34 Years | 0 (0.0%) | 0 (0.0%) |
| 35 to 64 Years | 0 (0.0%) | 10 (2.8%) |
| 65 to 74 Years | 24 (18.0%) | 0 (0.0%) |
| 75 Years and over | 22 (50.0%) | 9 (17.6%) |
Disability Class: Vision Difficulty
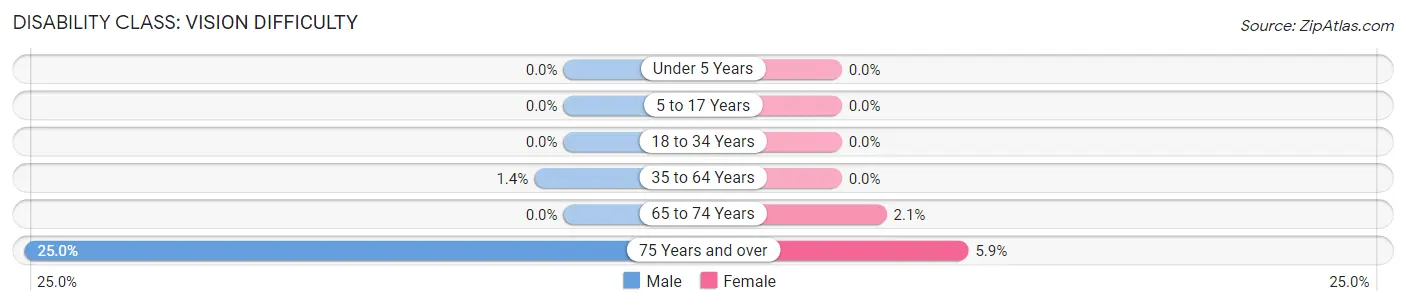
| Age Bracket | Male | Female |
| Under 5 Years | 0 (0.0%) | 0 (0.0%) |
| 5 to 17 Years | 0 (0.0%) | 0 (0.0%) |
| 18 to 34 Years | 0 (0.0%) | 0 (0.0%) |
| 35 to 64 Years | 5 (1.4%) | 0 (0.0%) |
| 65 to 74 Years | 0 (0.0%) | 2 (2.1%) |
| 75 Years and over | 11 (25.0%) | 3 (5.9%) |
Disability Class: Cognitive Difficulty
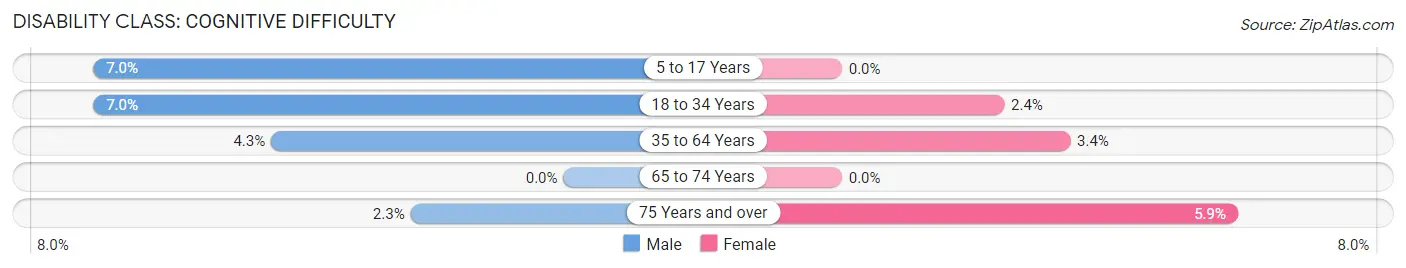
| Age Bracket | Male | Female |
| 5 to 17 Years | 9 (7.0%) | 0 (0.0%) |
| 18 to 34 Years | 9 (7.0%) | 2 (2.4%) |
| 35 to 64 Years | 16 (4.3%) | 12 (3.4%) |
| 65 to 74 Years | 0 (0.0%) | 0 (0.0%) |
| 75 Years and over | 1 (2.3%) | 3 (5.9%) |
Disability Class: Ambulatory Difficulty
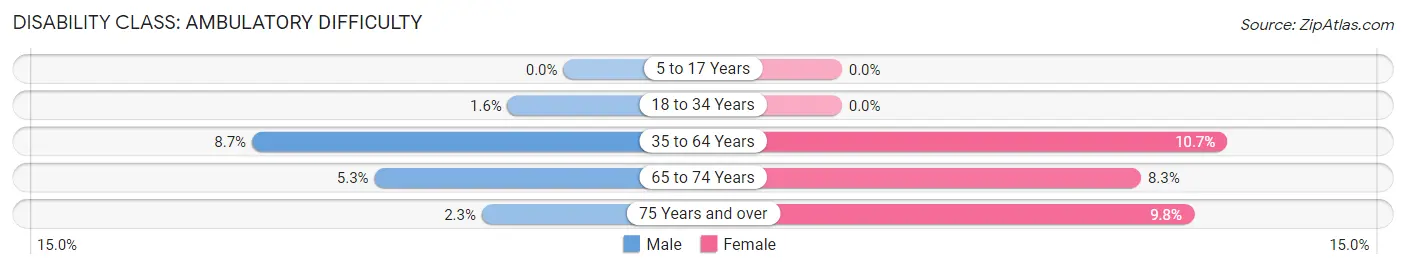
| Age Bracket | Male | Female |
| 5 to 17 Years | 0 (0.0%) | 0 (0.0%) |
| 18 to 34 Years | 2 (1.5%) | 0 (0.0%) |
| 35 to 64 Years | 32 (8.7%) | 38 (10.7%) |
| 65 to 74 Years | 7 (5.3%) | 8 (8.3%) |
| 75 Years and over | 1 (2.3%) | 5 (9.8%) |
Disability Class: Self-Care Difficulty
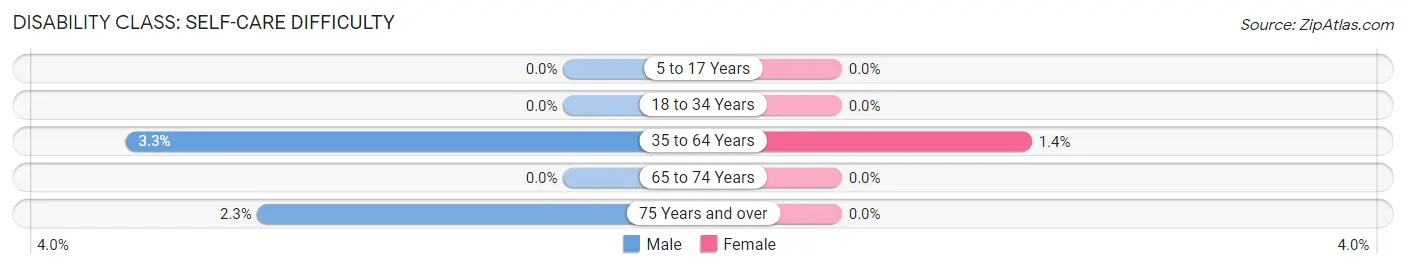
| Age Bracket | Male | Female |
| 5 to 17 Years | 0 (0.0%) | 0 (0.0%) |
| 18 to 34 Years | 0 (0.0%) | 0 (0.0%) |
| 35 to 64 Years | 12 (3.3%) | 5 (1.4%) |
| 65 to 74 Years | 0 (0.0%) | 0 (0.0%) |
| 75 Years and over | 1 (2.3%) | 0 (0.0%) |
Technology Access in Cheyenne County
Computing Device Access in Cheyenne County
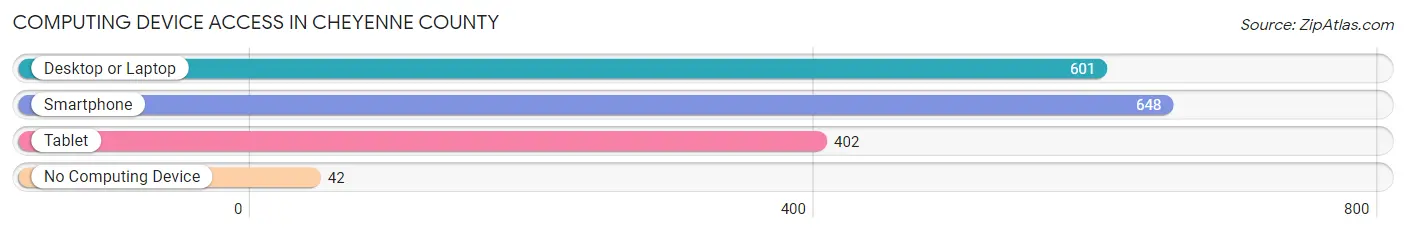
| Device Type | # Households | % Households |
| Desktop or Laptop | 601 | 81.2% |
| Smartphone | 648 | 87.6% |
| Tablet | 402 | 54.3% |
| No Computing Device | 42 | 5.7% |
| Total | 740 | 100.0% |
Internet Access in Cheyenne County
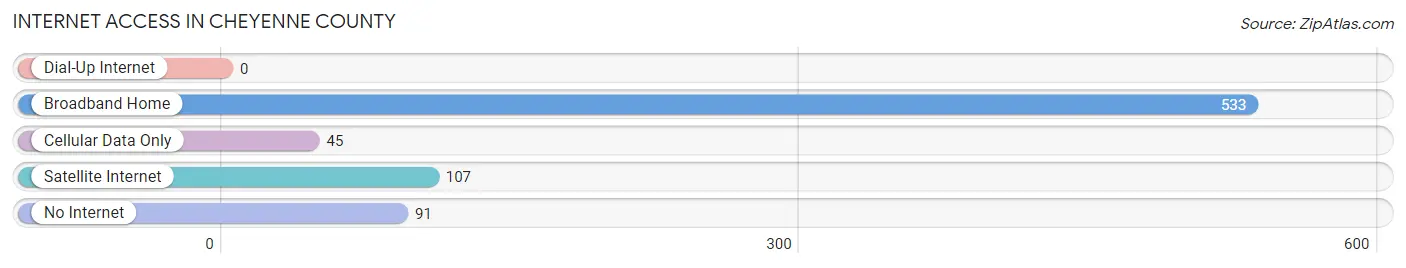
| Internet Type | # Households | % Households |
| Dial-Up Internet | 0 | 0.0% |
| Broadband Home | 533 | 72.0% |
| Cellular Data Only | 45 | 6.1% |
| Satellite Internet | 107 | 14.5% |
| No Internet | 91 | 12.3% |
| Total | 740 | 100.0% |
Cheyenne County Summary
Cheyenne County is located in the eastern part of Colorado, and is part of the High Plains region. It is bordered by Kit Carson County to the north, Lincoln County to the east, Kiowa County to the south, and Washington County to the west. The county seat is Cheyenne Wells, and the county has a total area of 1,890 square miles.
History
Cheyenne County was established in 1889, and was named after the Cheyenne Native American tribe. The county was originally part of Elbert County, and was created to provide better access to the county seat of Elbert. The county was originally populated by ranchers and farmers, and the first settlers arrived in the area in the late 1800s.
The county was home to several Native American tribes, including the Cheyenne, Arapaho, and Kiowa. The area was also home to the Comanche and Apache tribes, who were driven out of the area by the U.S. Army in the late 1800s.
Geography
Cheyenne County is located in the eastern part of Colorado, and is part of the High Plains region. The county is bordered by Kit Carson County to the north, Lincoln County to the east, Kiowa County to the south, and Washington County to the west. The county has a total area of 1,890 square miles, and is mostly flat with some rolling hills. The county is home to several small lakes, including Lake Meredith, Lake McConaughy, and Lake Minnequa.
The county is home to several small towns, including Cheyenne Wells, Kit Carson, and Arapahoe. The county is also home to several unincorporated communities, including Wild Horse, Flagler, and Bethune.
Economy
Cheyenne County has a largely agricultural economy, with the majority of the population employed in farming and ranching. The county is home to several large farms, including the Cheyenne County Cattle Company, which is one of the largest cattle operations in the state. The county is also home to several oil and gas companies, and is a major producer of oil and natural gas.
The county is also home to several small businesses, including restaurants, retail stores, and service providers. The county is home to several tourist attractions, including the Cheyenne County Museum and the Cheyenne County Fairgrounds.
Demographics
As of the 2010 census, Cheyenne County had a population of 2,231. The population was spread out, with 48.3% male and 51.7% female. The median age was 43.7 years, and the median household income was $41,944. The county is predominantly white, with 91.2% of the population identifying as white. The county is also home to a small Hispanic population, with 6.2% of the population identifying as Hispanic or Latino.
Cheyenne County is a rural county, with a population density of 1.2 people per square mile. The county is home to several small towns, including Cheyenne Wells, Kit Carson, and Arapahoe. The county is also home to several unincorporated communities, including Wild Horse, Flagler, and Bethune.
Common Questions
What is Per Capita Income in Cheyenne County?
Per Capita income in Cheyenne County is $38,791.
What is the Median Family Income in Cheyenne County?
Median Family Income in Cheyenne County is $88,125.
What is the Median Household income in Cheyenne County?
Median Household Income in Cheyenne County is $65,577.
What is Income or Wage Gap in Cheyenne County?
Income or Wage Gap in Cheyenne County is 45.8%.
Women in Cheyenne County earn 54.2 cents for every dollar earned by a man.
What is Inequality or Gini Index in Cheyenne County?
Inequality or Gini Index in Cheyenne County is 0.43.
What is the Total Population of Cheyenne County?
Total Population of Cheyenne County is 1,726.
What is the Total Male Population of Cheyenne County?
Total Male Population of Cheyenne County is 859.
What is the Total Female Population of Cheyenne County?
Total Female Population of Cheyenne County is 867.
What is the Ratio of Males per 100 Females in Cheyenne County?
There are 99.08 Males per 100 Females in Cheyenne County.
What is the Ratio of Females per 100 Males in Cheyenne County?
There are 100.93 Females per 100 Males in Cheyenne County.
What is the Median Population Age in Cheyenne County?
Median Population Age in Cheyenne County is 43.2 Years.
What is the Average Family Size in Cheyenne County
Average Family Size in Cheyenne County is 3.0 People.
What is the Average Household Size in Cheyenne County
Average Household Size in Cheyenne County is 2.3 People.
How Large is the Labor Force in Cheyenne County?
There are 905 People in the Labor Forcein in Cheyenne County.
What is the Percentage of People in the Labor Force in Cheyenne County?
67.7% of People are in the Labor Force in Cheyenne County.
What is the Unemployment Rate in Cheyenne County?
Unemployment Rate in Cheyenne County is 2.1%.