Bent County, CO Map & Demographics
Bent County Map
Bent County Overview
$19,041
PER CAPITA INCOME
$53,500
AVG FAMILY INCOME
$45,776
AVG HOUSEHOLD INCOME
15.4%
WAGE / INCOME GAP [ % ]
84.6¢/ $1
WAGE / INCOME GAP [ $ ]
$10,022
FAMILY INCOME DEFICIT
0.43
INEQUALITY / GINI INDEX
5,561
TOTAL POPULATION
3,453
MALE POPULATION
2,108
FEMALE POPULATION
163.80
MALES / 100 FEMALES
61.05
FEMALES / 100 MALES
40.7
MEDIAN AGE
3.0
AVG FAMILY SIZE
2.3
AVG HOUSEHOLD SIZE
1,782
LABOR FORCE [ PEOPLE ]
37.5%
PERCENT IN LABOR FORCE
5.5%
UNEMPLOYMENT RATE
Bent County Area Codes
Income in Bent County
Income Overview in Bent County
Per Capita Income in Bent County is $19,041, while median incomes of families and households are $53,500 and $45,776 respectively.
| Characteristic | Number | Measure |
| Per Capita Income | 5,561 | $19,041 |
| Median Family Income | 1,064 | $53,500 |
| Mean Family Income | 1,064 | $67,437 |
| Median Household Income | 1,808 | $45,776 |
| Mean Household Income | 1,808 | $56,392 |
| Income Deficit | 1,064 | $10,022 |
| Wage / Income Gap (%) | 5,561 | 15.42% |
| Wage / Income Gap ($) | 5,561 | 84.58¢ per $1 |
| Gini / Inequality Index | 5,561 | 0.43 |
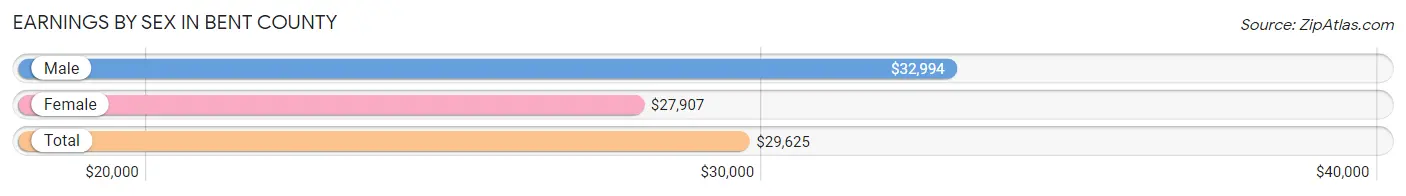
Earnings by Sex in Bent County
Average Earnings in Bent County are $29,625, $32,994 for men and $27,907 for women, a difference of 15.4%.
| Sex | Number | Average Earnings |
| Male | 1,050 (55.1%) | $32,994 |
| Female | 854 (44.9%) | $27,907 |
| Total | 1,904 (100.0%) | $29,625 |
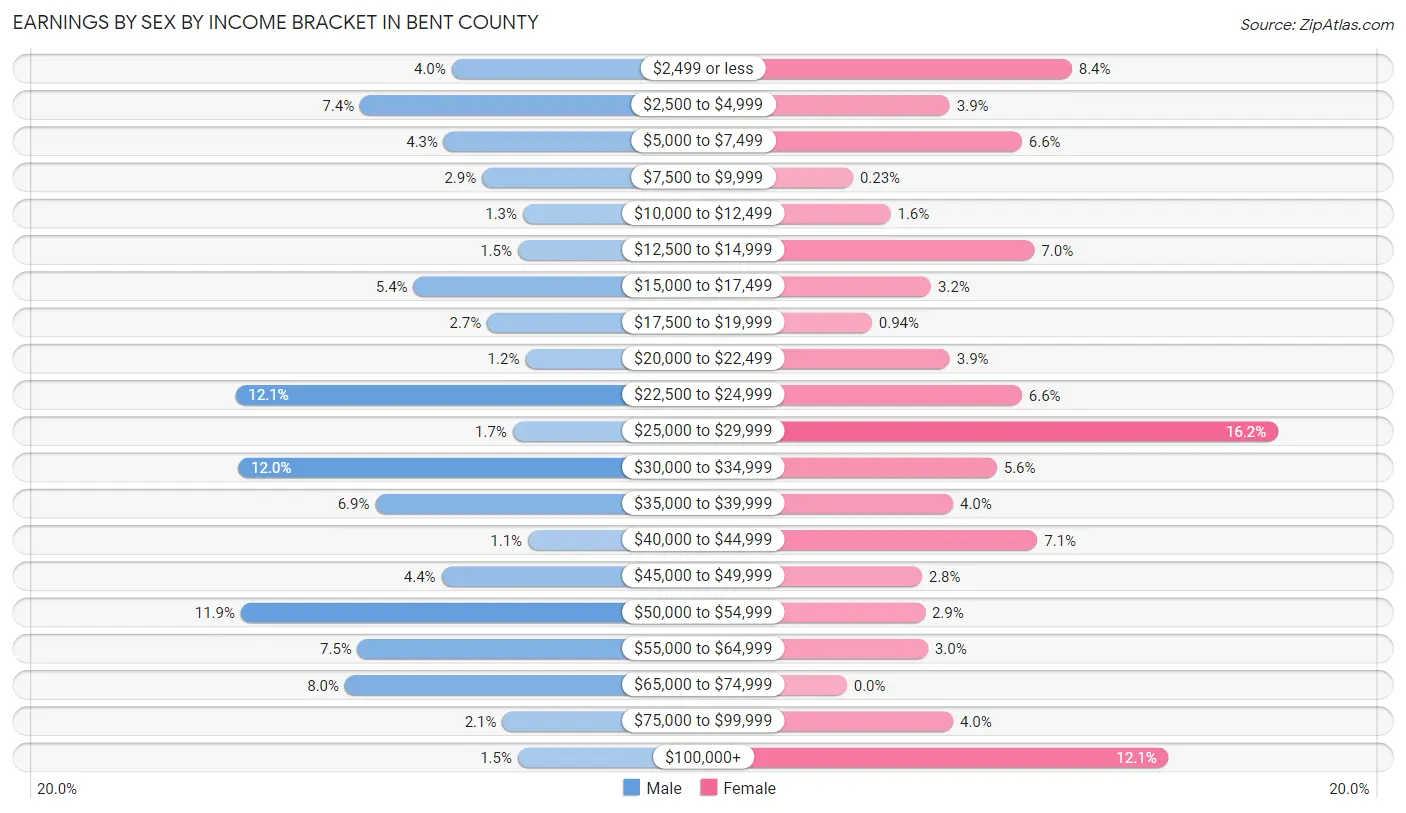
Earnings by Sex by Income Bracket in Bent County
The most common earnings brackets in Bent County are $22,500 to $24,999 for men (127 | 12.1%) and $25,000 to $29,999 for women (138 | 16.2%).
| Income | Male | Female |
| $2,499 or less | 42 (4.0%) | 72 (8.4%) |
| $2,500 to $4,999 | 78 (7.4%) | 33 (3.9%) |
| $5,000 to $7,499 | 45 (4.3%) | 56 (6.6%) |
| $7,500 to $9,999 | 30 (2.9%) | 2 (0.2%) |
| $10,000 to $12,499 | 14 (1.3%) | 14 (1.6%) |
| $12,500 to $14,999 | 16 (1.5%) | 60 (7.0%) |
| $15,000 to $17,499 | 57 (5.4%) | 27 (3.2%) |
| $17,500 to $19,999 | 28 (2.7%) | 8 (0.9%) |
| $20,000 to $22,499 | 13 (1.2%) | 33 (3.9%) |
| $22,500 to $24,999 | 127 (12.1%) | 56 (6.6%) |
| $25,000 to $29,999 | 18 (1.7%) | 138 (16.2%) |
| $30,000 to $34,999 | 126 (12.0%) | 48 (5.6%) |
| $35,000 to $39,999 | 72 (6.9%) | 34 (4.0%) |
| $40,000 to $44,999 | 12 (1.1%) | 61 (7.1%) |
| $45,000 to $49,999 | 46 (4.4%) | 24 (2.8%) |
| $50,000 to $54,999 | 125 (11.9%) | 25 (2.9%) |
| $55,000 to $64,999 | 79 (7.5%) | 26 (3.0%) |
| $65,000 to $74,999 | 84 (8.0%) | 0 (0.0%) |
| $75,000 to $99,999 | 22 (2.1%) | 34 (4.0%) |
| $100,000+ | 16 (1.5%) | 103 (12.1%) |
| Total | 1,050 (100.0%) | 854 (100.0%) |
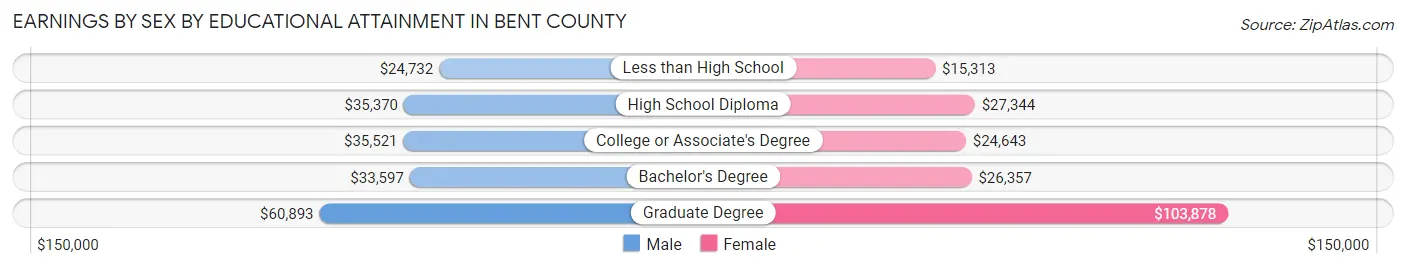
Earnings by Sex by Educational Attainment in Bent County
Average earnings in Bent County are $33,895 for men and $28,214 for women, a difference of 16.8%. Men with an educational attainment of graduate degree enjoy the highest average annual earnings of $60,893, while those with less than high school education earn the least with $24,732. Women with an educational attainment of graduate degree earn the most with the average annual earnings of $103,878, while those with less than high school education have the smallest earnings of $15,313.
| Educational Attainment | Male Income | Female Income |
| Less than High School | $24,732 | $15,313 |
| High School Diploma | $35,370 | $27,344 |
| College or Associate's Degree | $35,521 | $24,643 |
| Bachelor's Degree | $33,597 | $26,357 |
| Graduate Degree | $60,893 | $103,878 |
| Total | $33,895 | $28,214 |
Family Income in Bent County
Family Income Brackets in Bent County
According to the Bent County family income data, there are 211 families falling into the $50,000 to $74,999 income range, which is the most common income bracket and makes up 19.8% of all families. Conversely, the $200,000+ income bracket is the least frequent group with only 23 families (2.2%) belonging to this category.
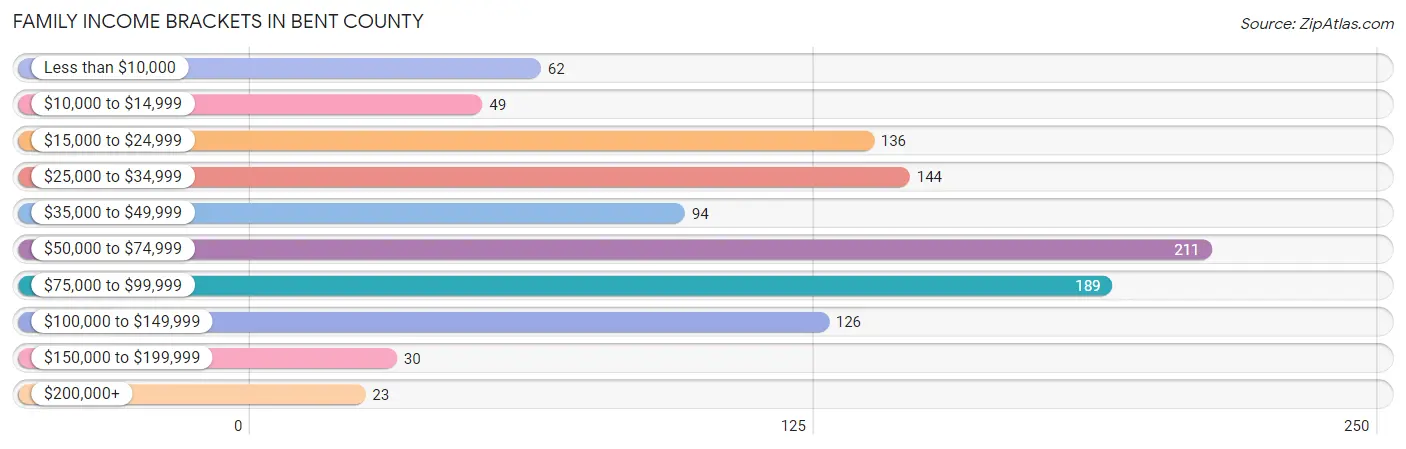
| Income Bracket | # Families | % Families |
| Less than $10,000 | 62 | 5.8% |
| $10,000 to $14,999 | 49 | 4.6% |
| $15,000 to $24,999 | 136 | 12.8% |
| $25,000 to $34,999 | 144 | 13.5% |
| $35,000 to $49,999 | 94 | 8.8% |
| $50,000 to $74,999 | 211 | 19.8% |
| $75,000 to $99,999 | 189 | 17.8% |
| $100,000 to $149,999 | 126 | 11.8% |
| $150,000 to $199,999 | 30 | 2.8% |
| $200,000+ | 23 | 2.2% |
Family Income by Famaliy Size in Bent County
4-person families (190 | 17.9%) account for the highest median family income in Bent County with $68,529 per family, while 2-person families (476 | 44.7%) have the highest median income of $25,655 per family member.
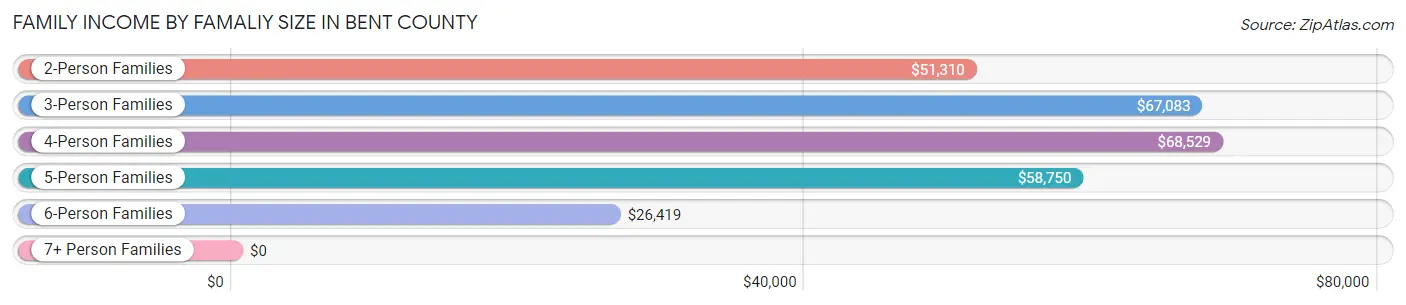
| Income Bracket | # Families | Median Income |
| 2-Person Families | 476 (44.7%) | $51,310 |
| 3-Person Families | 230 (21.6%) | $67,083 |
| 4-Person Families | 190 (17.9%) | $68,529 |
| 5-Person Families | 118 (11.1%) | $58,750 |
| 6-Person Families | 44 (4.1%) | $26,419 |
| 7+ Person Families | 6 (0.6%) | $0 |
| Total | 1,064 (100.0%) | $53,500 |
Family Income by Number of Earners in Bent County
The median family income in Bent County is $53,500, with families comprising 3+ earners (81) having the highest median family income of $105,417, while families with no earners (272) have the lowest median family income of $27,432, accounting for 7.6% and 25.6% of families, respectively.
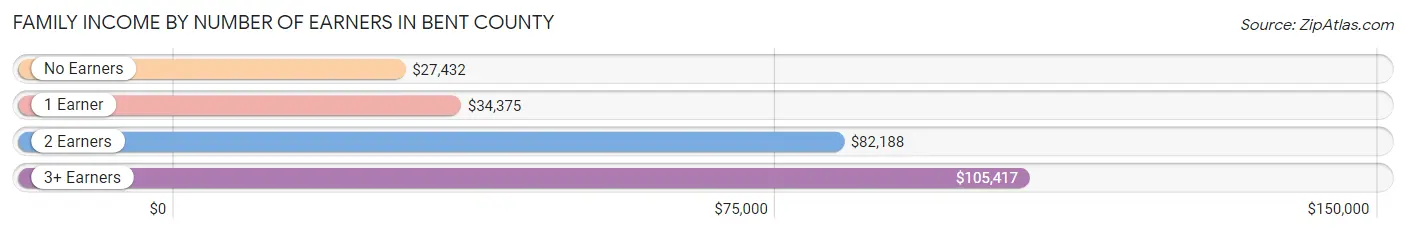
| Number of Earners | # Families | Median Income |
| No Earners | 272 (25.6%) | $27,432 |
| 1 Earner | 344 (32.3%) | $34,375 |
| 2 Earners | 367 (34.5%) | $82,188 |
| 3+ Earners | 81 (7.6%) | $105,417 |
| Total | 1,064 (100.0%) | $53,500 |
Household Income in Bent County
Household Income Brackets in Bent County
With 392 households falling in the category, the $50,000 to $74,999 income range is the most frequent in Bent County, accounting for 21.7% of all households. In contrast, only 24 households (1.3%) fall into the $200,000+ income bracket, making it the least populous group.
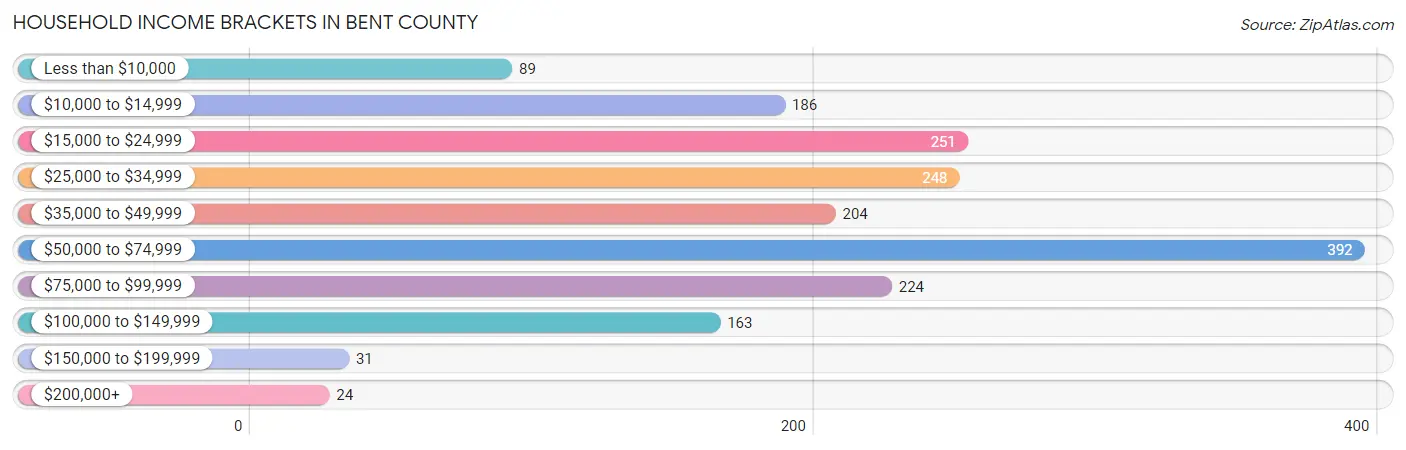
| Income Bracket | # Households | % Households |
| Less than $10,000 | 89 | 4.9% |
| $10,000 to $14,999 | 186 | 10.3% |
| $15,000 to $24,999 | 251 | 13.9% |
| $25,000 to $34,999 | 248 | 13.7% |
| $35,000 to $49,999 | 204 | 11.3% |
| $50,000 to $74,999 | 392 | 21.7% |
| $75,000 to $99,999 | 224 | 12.4% |
| $100,000 to $149,999 | 163 | 9.0% |
| $150,000 to $199,999 | 31 | 1.7% |
| $200,000+ | 24 | 1.3% |
Household Income by Householder Age in Bent County
The median household income in Bent County is $45,776, with the highest median household income of $53,704 found in the 45 to 64 years age bracket for the primary householder. A total of 608 households (33.6%) fall into this category. Meanwhile, the 25 to 44 years age bracket for the primary householder has the lowest median household income of $37,021, with 500 households (27.7%) in this group.
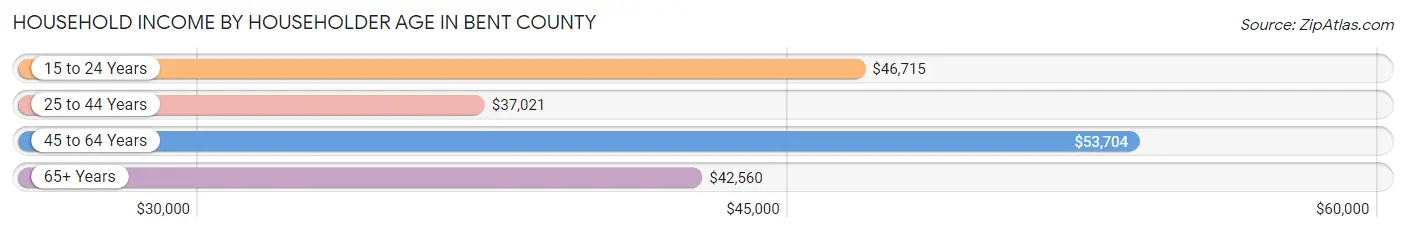
| Income Bracket | # Households | Median Income |
| 15 to 24 Years | 91 (5.0%) | $46,715 |
| 25 to 44 Years | 500 (27.7%) | $37,021 |
| 45 to 64 Years | 608 (33.6%) | $53,704 |
| 65+ Years | 609 (33.7%) | $42,560 |
| Total | 1,808 (100.0%) | $45,776 |
Poverty in Bent County
Income Below Poverty by Sex and Age in Bent County
With 27.6% poverty level for males and 26.5% for females among the residents of Bent County, 5 year old males and 5 year old females are the most vulnerable to poverty, with 9 males (100.0%) and 17 females (77.3%) in their respective age groups living below the poverty level.
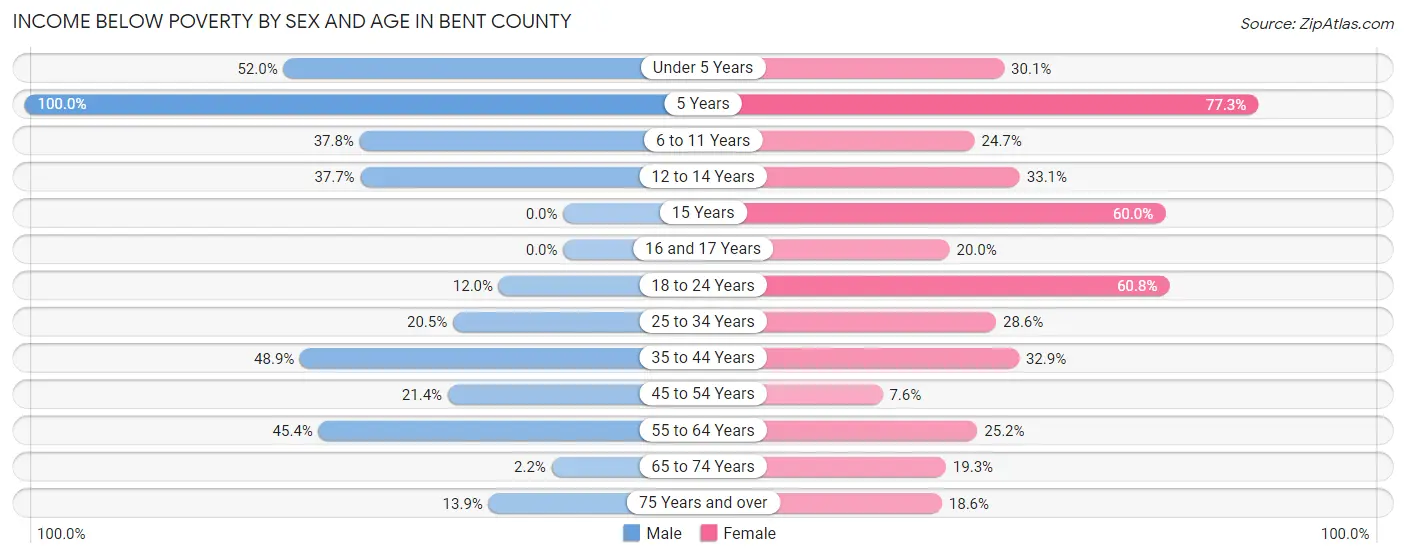
| Age Bracket | Male | Female |
| Under 5 Years | 80 (51.9%) | 22 (30.1%) |
| 5 Years | 9 (100.0%) | 17 (77.3%) |
| 6 to 11 Years | 62 (37.8%) | 35 (24.6%) |
| 12 to 14 Years | 29 (37.7%) | 39 (33.1%) |
| 15 Years | 0 (0.0%) | 21 (60.0%) |
| 16 and 17 Years | 0 (0.0%) | 11 (20.0%) |
| 18 to 24 Years | 17 (12.0%) | 79 (60.8%) |
| 25 to 34 Years | 70 (20.5%) | 63 (28.6%) |
| 35 to 44 Years | 128 (48.8%) | 75 (32.9%) |
| 45 to 54 Years | 42 (21.4%) | 20 (7.5%) |
| 55 to 64 Years | 129 (45.4%) | 78 (25.2%) |
| 65 to 74 Years | 6 (2.2%) | 52 (19.3%) |
| 75 Years and over | 23 (13.9%) | 39 (18.6%) |
| Total | 595 (27.6%) | 551 (26.5%) |
Income Above Poverty by Sex and Age in Bent County
According to the poverty statistics in Bent County, males aged 15 years and females aged 45 to 54 years are the age groups that are most secure financially, with 100.0% of males and 92.4% of females in these age groups living above the poverty line.
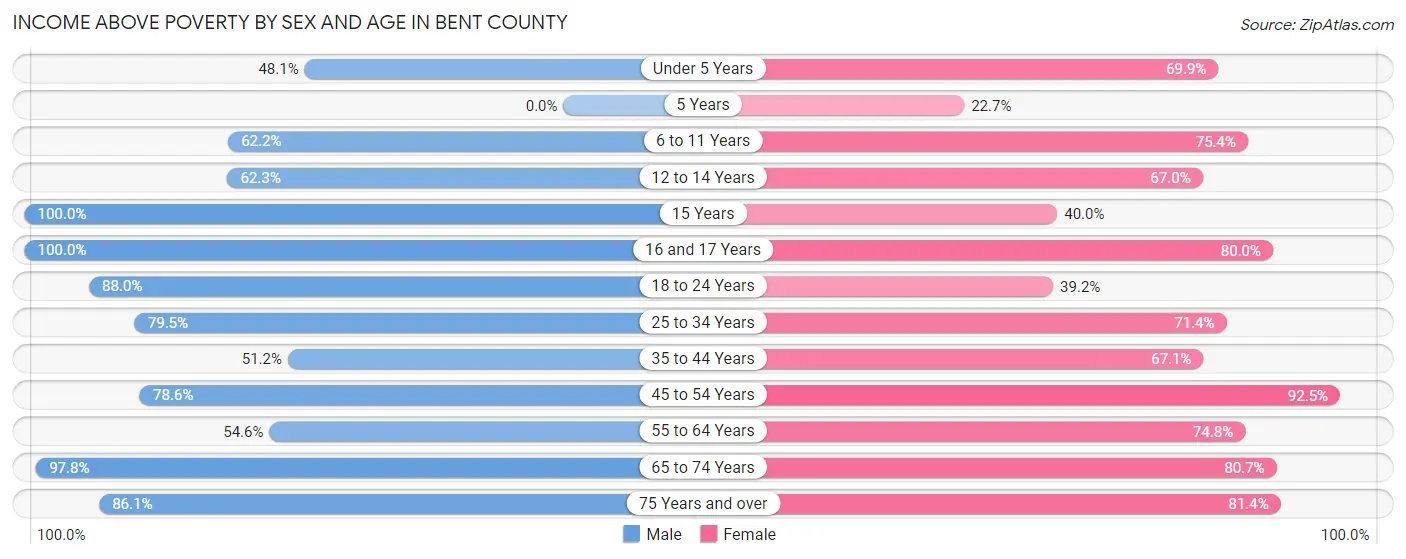
| Age Bracket | Male | Female |
| Under 5 Years | 74 (48.0%) | 51 (69.9%) |
| 5 Years | 0 (0.0%) | 5 (22.7%) |
| 6 to 11 Years | 102 (62.2%) | 107 (75.3%) |
| 12 to 14 Years | 48 (62.3%) | 79 (66.9%) |
| 15 Years | 15 (100.0%) | 14 (40.0%) |
| 16 and 17 Years | 69 (100.0%) | 44 (80.0%) |
| 18 to 24 Years | 125 (88.0%) | 51 (39.2%) |
| 25 to 34 Years | 272 (79.5%) | 157 (71.4%) |
| 35 to 44 Years | 134 (51.1%) | 153 (67.1%) |
| 45 to 54 Years | 154 (78.6%) | 245 (92.4%) |
| 55 to 64 Years | 155 (54.6%) | 232 (74.8%) |
| 65 to 74 Years | 271 (97.8%) | 217 (80.7%) |
| 75 Years and over | 143 (86.1%) | 171 (81.4%) |
| Total | 1,562 (72.4%) | 1,526 (73.5%) |
Income Below Poverty Among Married-Couple Families in Bent County
The poverty statistics for married-couple families in Bent County show that 13.4% or 109 of the total 815 families live below the poverty line. Families with 3 or 4 children have the highest poverty rate of 66.3%, comprising of 59 families. On the other hand, families with no children have the lowest poverty rate of 4.7%, which includes 21 families.
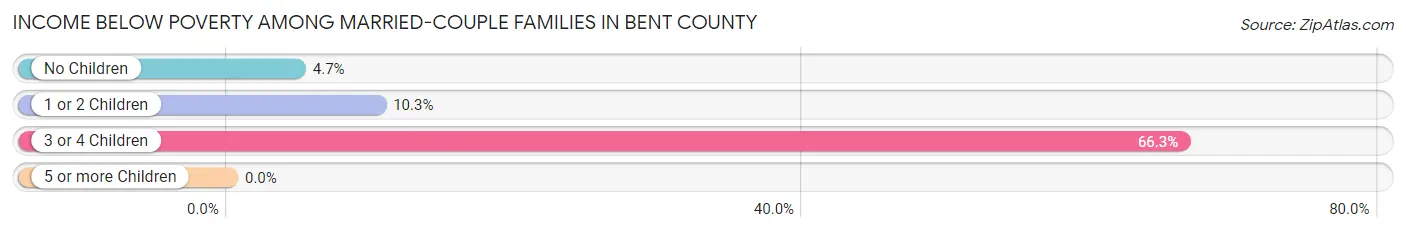
| Children | Above Poverty | Below Poverty |
| No Children | 424 (95.3%) | 21 (4.7%) |
| 1 or 2 Children | 252 (89.7%) | 29 (10.3%) |
| 3 or 4 Children | 30 (33.7%) | 59 (66.3%) |
| 5 or more Children | 0 (0.0%) | 0 (0.0%) |
| Total | 706 (86.6%) | 109 (13.4%) |
Income Below Poverty Among Single-Parent Households in Bent County
According to the poverty data in Bent County, 42.0% or 21 single-father households and 63.8% or 127 single-mother households are living below the poverty line. Among single-father households, those with 3 or 4 children have the highest poverty rate, with 3 households (100.0%) experiencing poverty. Likewise, among single-mother households, those with 3 or 4 children have the highest poverty rate, with 34 households (100.0%) falling below the poverty line.
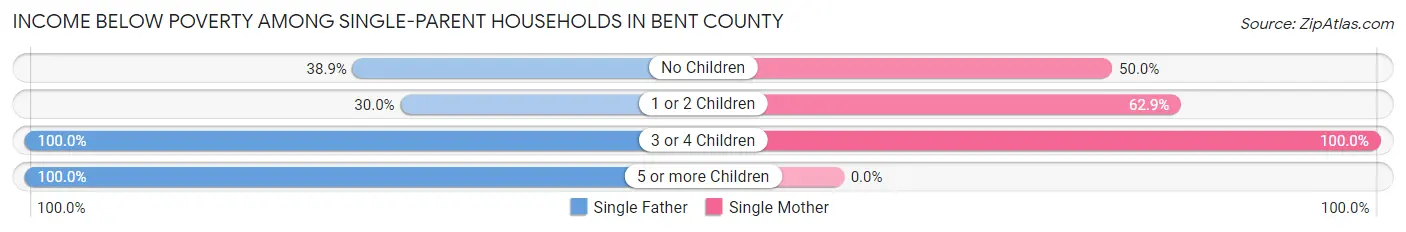
| Children | Single Father | Single Mother |
| No Children | 14 (38.9%) | 27 (50.0%) |
| 1 or 2 Children | 3 (30.0%) | 66 (62.9%) |
| 3 or 4 Children | 3 (100.0%) | 34 (100.0%) |
| 5 or more Children | 1 (100.0%) | 0 (0.0%) |
| Total | 21 (42.0%) | 127 (63.8%) |
Income Below Poverty Among Married-Couple vs Single-Parent Households in Bent County
The poverty data for Bent County shows that 109 of the married-couple family households (13.4%) and 148 of the single-parent households (59.4%) are living below the poverty level. Within the married-couple family households, those with 3 or 4 children have the highest poverty rate, with 59 households (66.3%) falling below the poverty line. Among the single-parent households, those with 3 or 4 children have the highest poverty rate, with 37 household (100.0%) living below poverty.
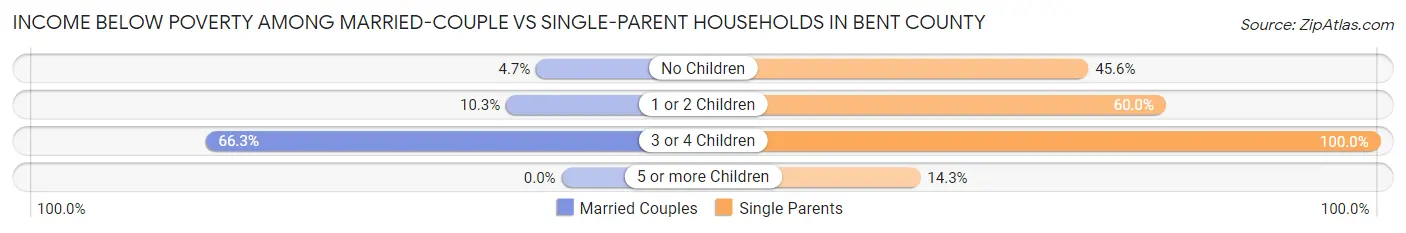
| Children | Married-Couple Families | Single-Parent Households |
| No Children | 21 (4.7%) | 41 (45.6%) |
| 1 or 2 Children | 29 (10.3%) | 69 (60.0%) |
| 3 or 4 Children | 59 (66.3%) | 37 (100.0%) |
| 5 or more Children | 0 (0.0%) | 1 (14.3%) |
| Total | 109 (13.4%) | 148 (59.4%) |
Race in Bent County
The most populous races in Bent County are White / Caucasian (3,960 | 71.2%), Hispanic or Latino (1,822 | 32.8%), and Two or more Races (734 | 13.2%).
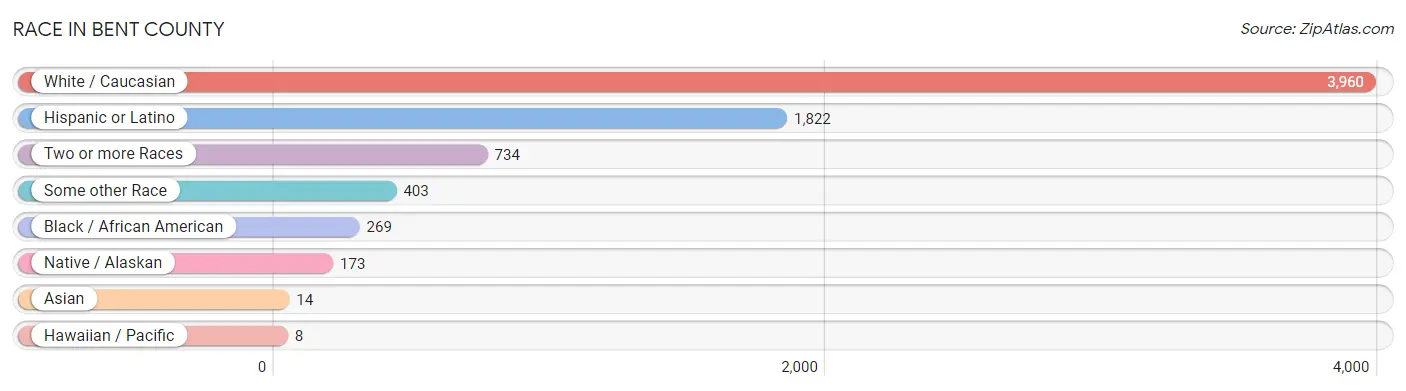
| Race | # Population | % Population |
| Asian | 14 | 0.3% |
| Black / African American | 269 | 4.8% |
| Hawaiian / Pacific | 8 | 0.1% |
| Hispanic or Latino | 1,822 | 32.8% |
| Native / Alaskan | 173 | 3.1% |
| White / Caucasian | 3,960 | 71.2% |
| Two or more Races | 734 | 13.2% |
| Some other Race | 403 | 7.2% |
| Total | 5,561 | 100.0% |
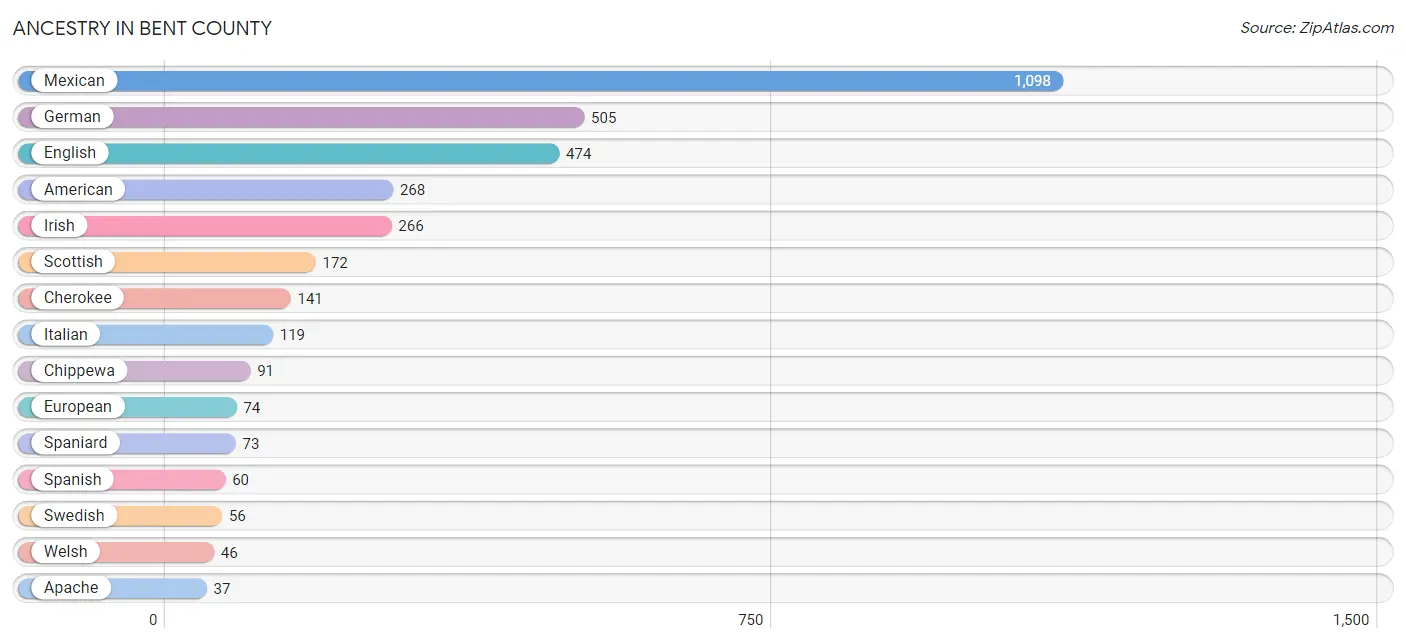
Ancestry in Bent County
The most populous ancestries reported in Bent County are Mexican (1,098 | 19.7%), German (505 | 9.1%), English (474 | 8.5%), American (268 | 4.8%), and Irish (266 | 4.8%), together accounting for 46.9% of all Bent County residents.
| Ancestry | # Population | % Population |
| American | 268 | 4.8% |
| Apache | 37 | 0.7% |
| Arab | 33 | 0.6% |
| Austrian | 4 | 0.1% |
| Bhutanese | 8 | 0.1% |
| Blackfeet | 8 | 0.1% |
| British | 4 | 0.1% |
| Cherokee | 141 | 2.5% |
| Chippewa | 91 | 1.6% |
| Comanche | 11 | 0.2% |
| Croatian | 3 | 0.1% |
| Czech | 4 | 0.1% |
| Danish | 7 | 0.1% |
| Dutch | 6 | 0.1% |
| English | 474 | 8.5% |
| European | 74 | 1.3% |
| French | 37 | 0.7% |
| French Canadian | 4 | 0.1% |
| German | 505 | 9.1% |
| Hopi | 3 | 0.1% |
| Hungarian | 7 | 0.1% |
| Irish | 266 | 4.8% |
| Italian | 119 | 2.1% |
| Korean | 7 | 0.1% |
| Malaysian | 3 | 0.1% |
| Mexican | 1,098 | 19.7% |
| Mexican American Indian | 4 | 0.1% |
| Navajo | 6 | 0.1% |
| Norwegian | 16 | 0.3% |
| Polish | 9 | 0.2% |
| Pueblo | 11 | 0.2% |
| Russian | 29 | 0.5% |
| Scandinavian | 6 | 0.1% |
| Scotch-Irish | 36 | 0.6% |
| Scottish | 172 | 3.1% |
| Sioux | 13 | 0.2% |
| Slovak | 2 | 0.0% |
| Spaniard | 73 | 1.3% |
| Spanish | 60 | 1.1% |
| Sri Lankan | 4 | 0.1% |
| Swedish | 56 | 1.0% |
| Tongan | 8 | 0.1% |
| Welsh | 46 | 0.8% | View All 43 Rows |
Immigrants in Bent County
The most numerous immigrant groups reported in Bent County came from Central America (105 | 1.9%), Latin America (105 | 1.9%), Mexico (96 | 1.7%), Canada (83 | 1.5%), and Asia (10 | 0.2%), together accounting for 7.2% of all Bent County residents.
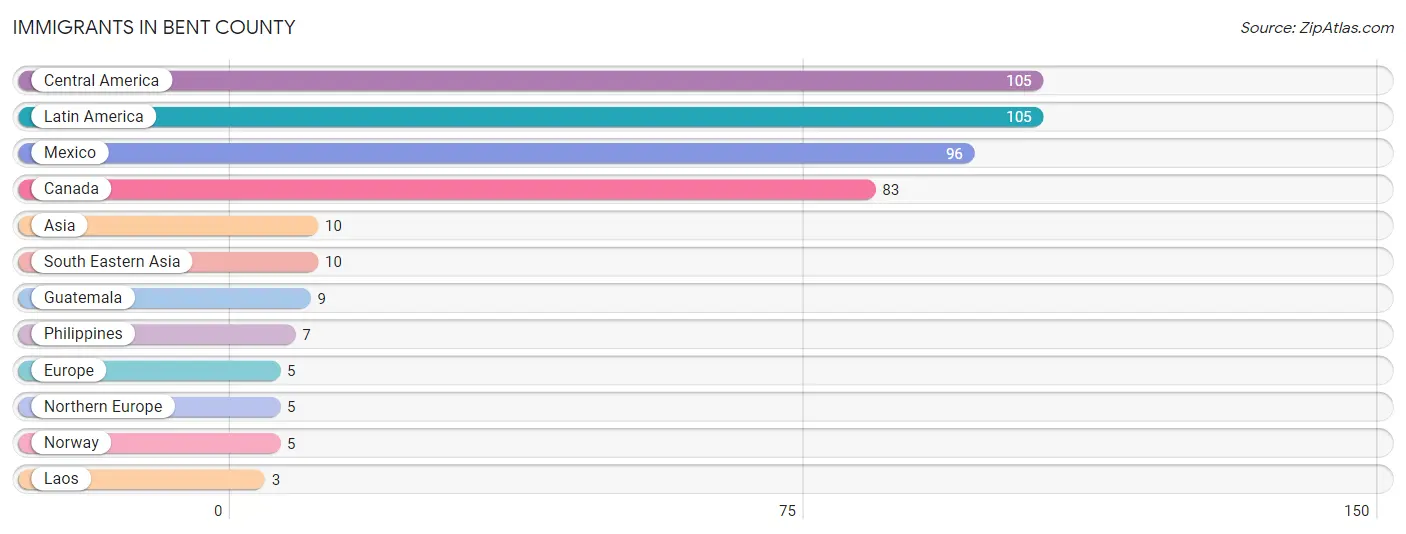
| Immigration Origin | # Population | % Population |
| Asia | 10 | 0.2% |
| Canada | 83 | 1.5% |
| Central America | 105 | 1.9% |
| Europe | 5 | 0.1% |
| Guatemala | 9 | 0.2% |
| Laos | 3 | 0.1% |
| Latin America | 105 | 1.9% |
| Mexico | 96 | 1.7% |
| Northern Europe | 5 | 0.1% |
| Norway | 5 | 0.1% |
| Philippines | 7 | 0.1% |
| South Eastern Asia | 10 | 0.2% | View All 12 Rows |
Sex and Age in Bent County
Sex and Age in Bent County
The most populous age groups in Bent County are 30 to 34 Years (397 | 11.5%) for men and 45 to 49 Years (186 | 8.8%) for women.
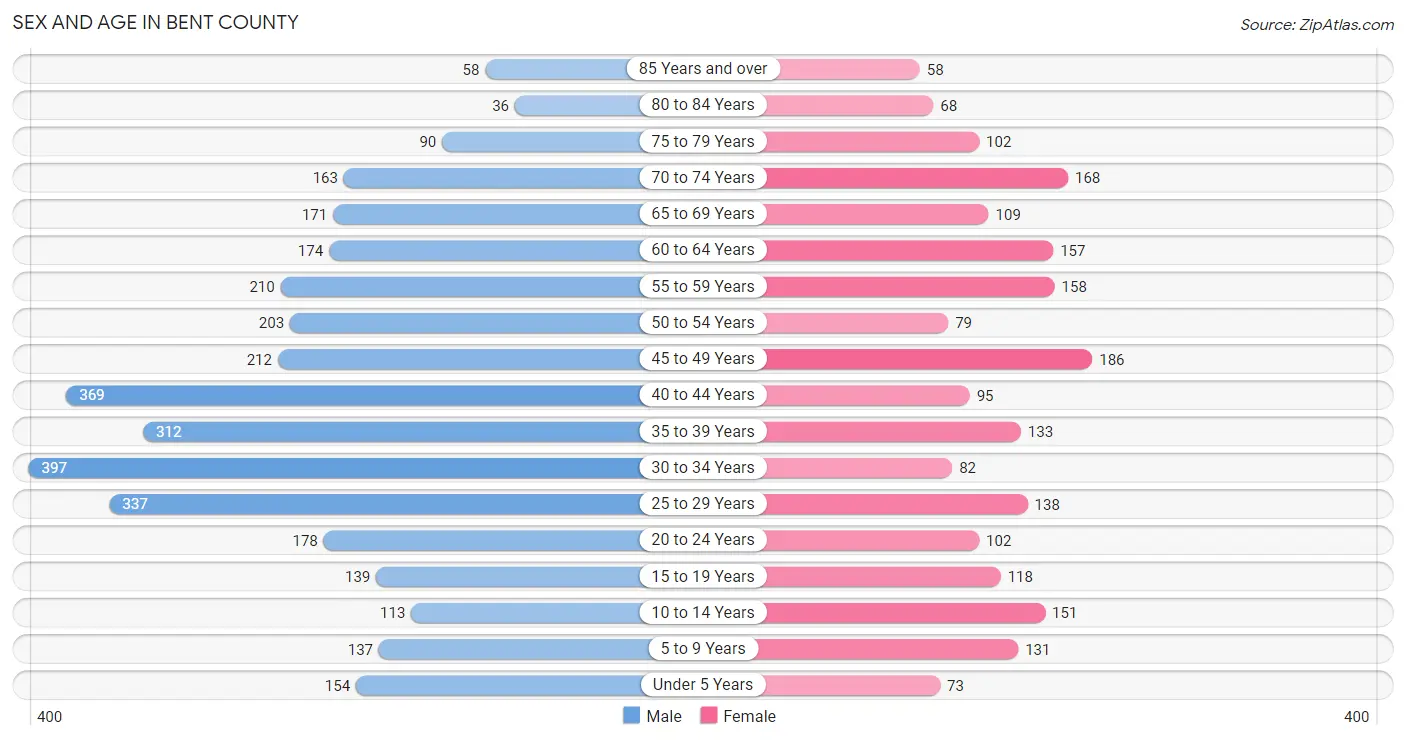
| Age Bracket | Male | Female |
| Under 5 Years | 154 (4.5%) | 73 (3.5%) |
| 5 to 9 Years | 137 (4.0%) | 131 (6.2%) |
| 10 to 14 Years | 113 (3.3%) | 151 (7.2%) |
| 15 to 19 Years | 139 (4.0%) | 118 (5.6%) |
| 20 to 24 Years | 178 (5.1%) | 102 (4.8%) |
| 25 to 29 Years | 337 (9.8%) | 138 (6.6%) |
| 30 to 34 Years | 397 (11.5%) | 82 (3.9%) |
| 35 to 39 Years | 312 (9.0%) | 133 (6.3%) |
| 40 to 44 Years | 369 (10.7%) | 95 (4.5%) |
| 45 to 49 Years | 212 (6.1%) | 186 (8.8%) |
| 50 to 54 Years | 203 (5.9%) | 79 (3.7%) |
| 55 to 59 Years | 210 (6.1%) | 158 (7.5%) |
| 60 to 64 Years | 174 (5.0%) | 157 (7.4%) |
| 65 to 69 Years | 171 (5.0%) | 109 (5.2%) |
| 70 to 74 Years | 163 (4.7%) | 168 (8.0%) |
| 75 to 79 Years | 90 (2.6%) | 102 (4.8%) |
| 80 to 84 Years | 36 (1.0%) | 68 (3.2%) |
| 85 Years and over | 58 (1.7%) | 58 (2.8%) |
| Total | 3,453 (100.0%) | 2,108 (100.0%) |
Families and Households in Bent County
Median Family Size in Bent County
The median family size in Bent County is 3.00 persons per family, with married-couple families (815 | 76.6%) accounting for the largest median family size of 3.16 persons per family. On the other hand, single female/mother families (199 | 18.7%) represent the smallest median family size with 2.37 persons per family.
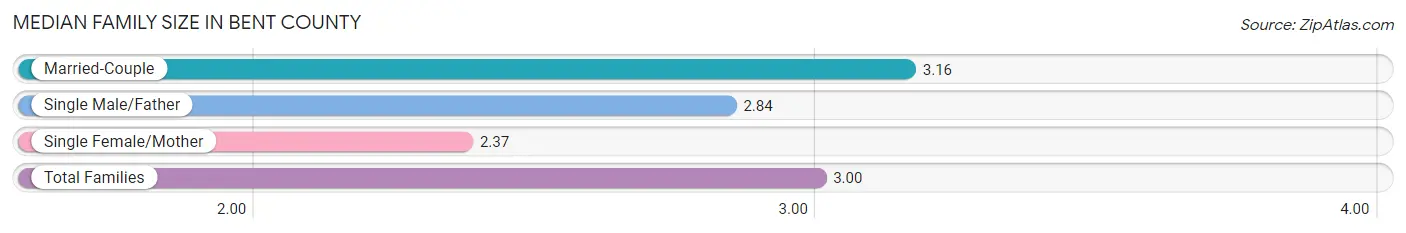
| Family Type | # Families | Family Size |
| Married-Couple | 815 (76.6%) | 3.16 |
| Single Male/Father | 50 (4.7%) | 2.84 |
| Single Female/Mother | 199 (18.7%) | 2.37 |
| Total Families | 1,064 (100.0%) | 3.00 |
Median Household Size in Bent County
The median household size in Bent County is 2.30 persons per household, with married-couple households (815 | 45.1%) accounting for the largest median household size of 3.17 persons per household. non-family households (744 | 41.1%) represent the smallest median household size with 1.22 persons per household.
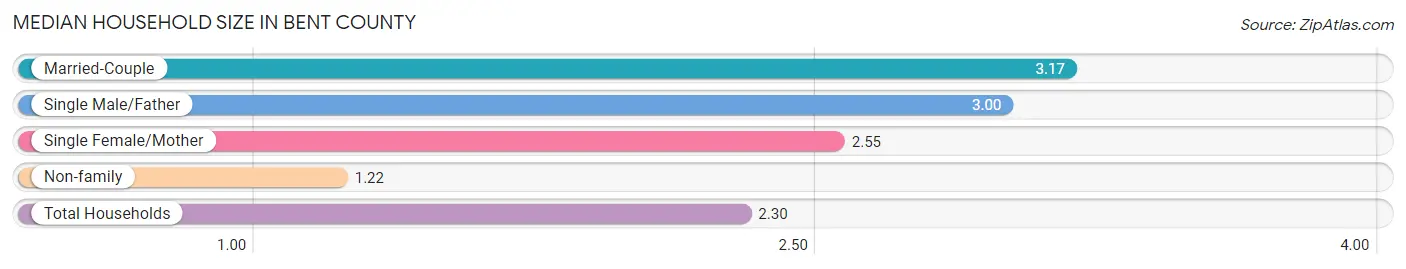
| Household Type | # Households | Household Size |
| Married-Couple | 815 (45.1%) | 3.17 |
| Single Male/Father | 50 (2.8%) | 3.00 |
| Single Female/Mother | 199 (11.0%) | 2.55 |
| Non-family | 744 (41.1%) | 1.22 |
| Total Households | 1,808 (100.0%) | 2.30 |
Household Size by Marriage Status in Bent County
Out of a total of 1,808 households in Bent County, 1,064 (58.9%) are family households, while 744 (41.1%) are nonfamily households. The most numerous type of family households are 2-person households, comprising 433, and the most common type of nonfamily households are 1-person households, comprising 606.
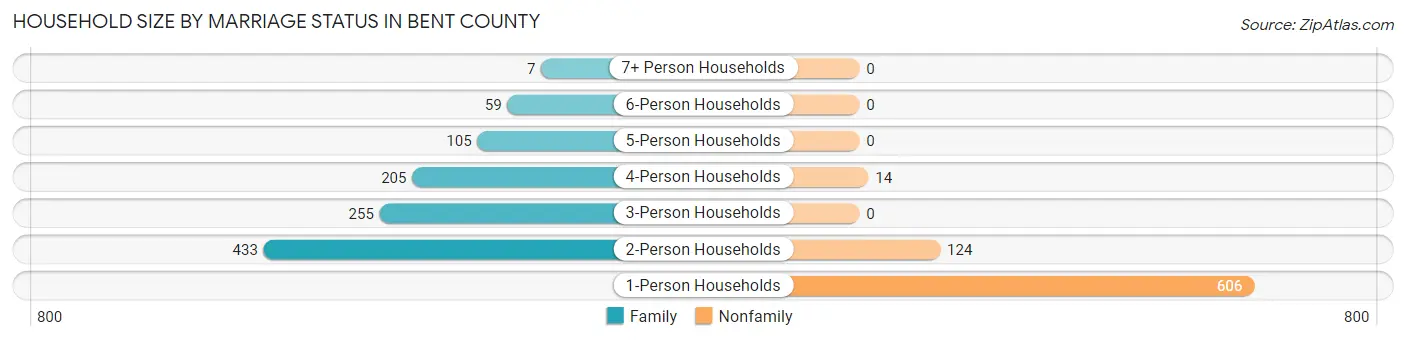
| Household Size | Family Households | Nonfamily Households |
| 1-Person Households | - | 606 (33.5%) |
| 2-Person Households | 433 (23.9%) | 124 (6.9%) |
| 3-Person Households | 255 (14.1%) | 0 (0.0%) |
| 4-Person Households | 205 (11.3%) | 14 (0.8%) |
| 5-Person Households | 105 (5.8%) | 0 (0.0%) |
| 6-Person Households | 59 (3.3%) | 0 (0.0%) |
| 7+ Person Households | 7 (0.4%) | 0 (0.0%) |
| Total | 1,064 (58.9%) | 744 (41.1%) |
Female Fertility in Bent County
Fertility by Age in Bent County
Average fertility rate in Bent County is 27.0 births per 1,000 women. Women in the age bracket of 20 to 34 years have the highest fertility rate with 71.0 births per 1,000 women. Women in the age bracket of 20 to 34 years acount for 100.0% of all women with births.
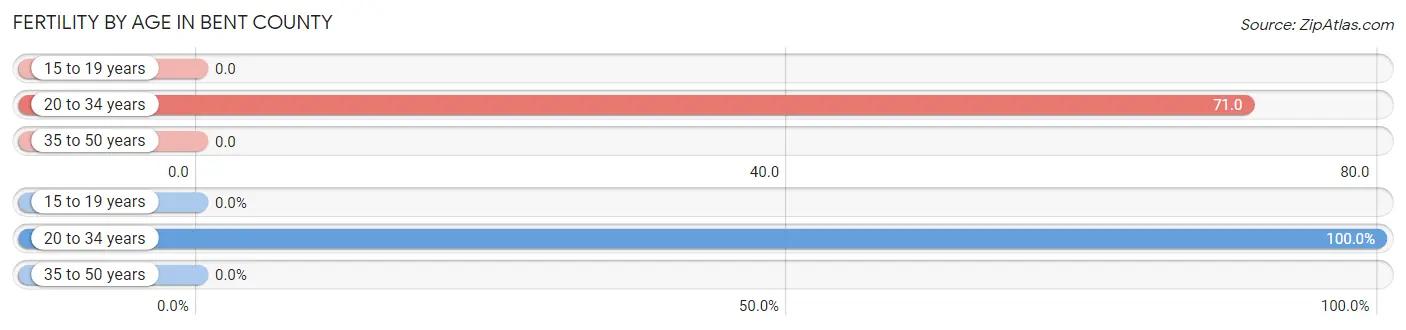
| Age Bracket | Women with Births | Births / 1,000 Women |
| 15 to 19 years | 0 (0.0%) | 0.0 |
| 20 to 34 years | 23 (100.0%) | 71.0 |
| 35 to 50 years | 0 (0.0%) | 0.0 |
| Total | 23 (100.0%) | 27.0 |
Fertility by Age by Marriage Status in Bent County
30.4% of women with births (23) in Bent County are married. The highest percentage of unmarried women with births falls into 20 to 34 years age bracket with 69.6% of them unmarried at the time of birth, while the lowest percentage of unmarried women with births belong to 20 to 34 years age bracket with 69.6% of them unmarried.
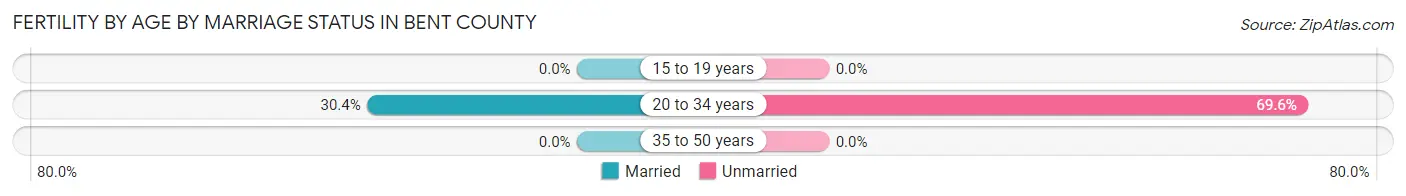
| Age Bracket | Married | Unmarried |
| 15 to 19 years | 0 (0.0%) | 0 (0.0%) |
| 20 to 34 years | 7 (30.4%) | 16 (69.6%) |
| 35 to 50 years | 0 (0.0%) | 0 (0.0%) |
| Total | 7 (30.4%) | 16 (69.6%) |
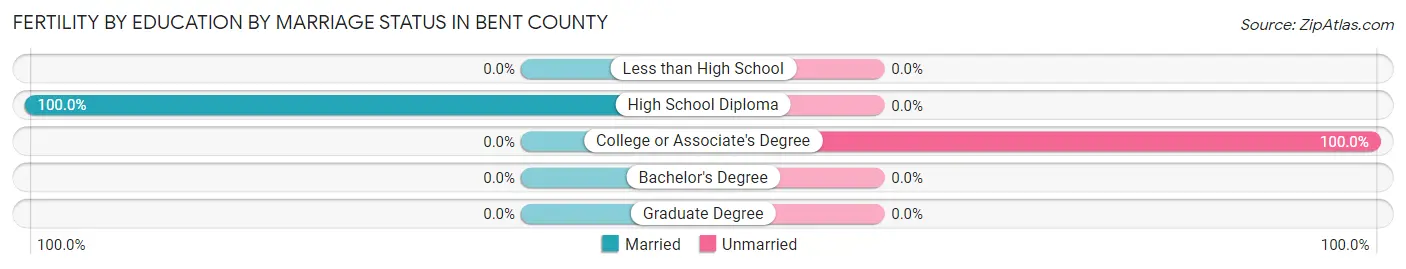
Fertility by Education in Bent County
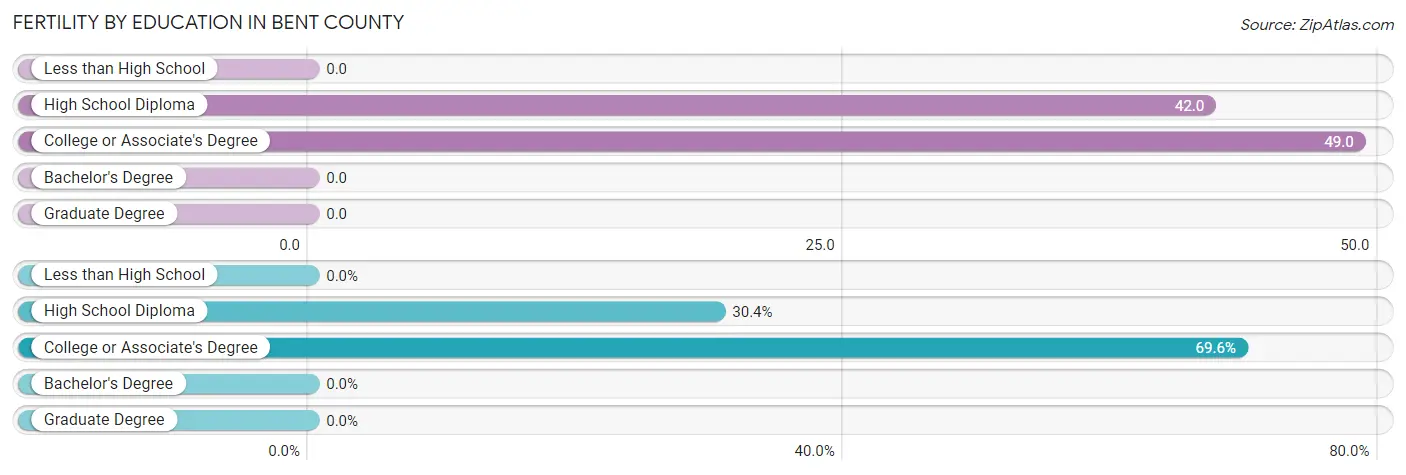
| Educational Attainment | Women with Births | Births / 1,000 Women |
| Less than High School | 0 (0.0%) | 0.0 |
| High School Diploma | 7 (30.4%) | 42.0 |
| College or Associate's Degree | 16 (69.6%) | 49.0 |
| Bachelor's Degree | 0 (0.0%) | 0.0 |
| Graduate Degree | 0 (0.0%) | 0.0 |
| Total | 23 (100.0%) | 27.0 |
Fertility by Education by Marriage Status in Bent County
69.6% of women with births in Bent County are unmarried. Women with the educational attainment of high school diploma are most likely to be married with 100.0% of them married at childbirth, while women with the educational attainment of college or associate's degree are least likely to be married with 100.0% of them unmarried at childbirth.
| Educational Attainment | Married | Unmarried |
| Less than High School | 0 (0.0%) | 0 (0.0%) |
| High School Diploma | 7 (100.0%) | 0 (0.0%) |
| College or Associate's Degree | 0 (0.0%) | 16 (100.0%) |
| Bachelor's Degree | 0 (0.0%) | 0 (0.0%) |
| Graduate Degree | 0 (0.0%) | 0 (0.0%) |
| Total | 7 (30.4%) | 16 (69.6%) |
Employment Characteristics in Bent County
Employment by Class of Employer in Bent County
Among the 1,674 employed individuals in Bent County, private company employees (772 | 46.1%), local government employees (288 | 17.2%), and not-for-profit organizations (238 | 14.2%) make up the most common classes of employment.
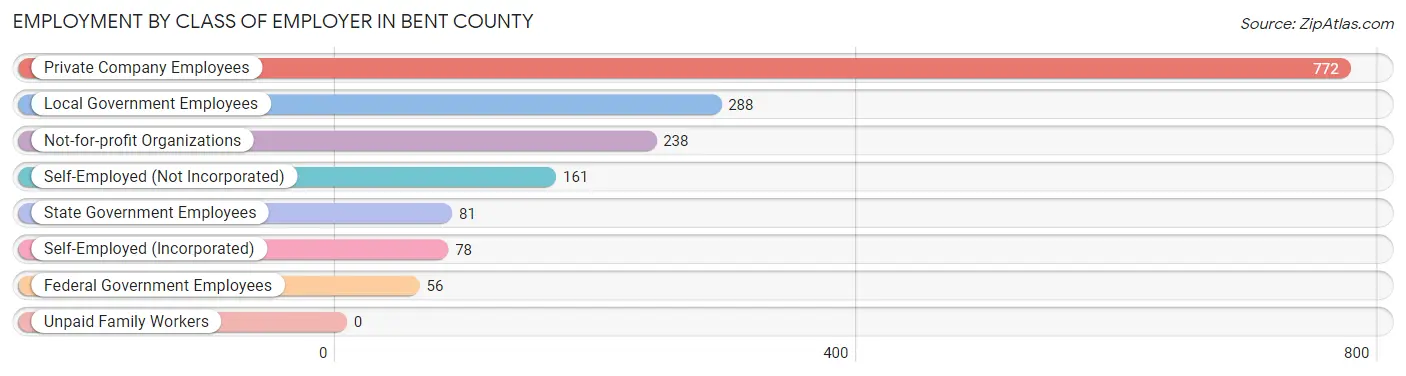
| Employer Class | # Employees | % Employees |
| Private Company Employees | 772 | 46.1% |
| Self-Employed (Incorporated) | 78 | 4.7% |
| Self-Employed (Not Incorporated) | 161 | 9.6% |
| Not-for-profit Organizations | 238 | 14.2% |
| Local Government Employees | 288 | 17.2% |
| State Government Employees | 81 | 4.8% |
| Federal Government Employees | 56 | 3.4% |
| Unpaid Family Workers | 0 | 0.0% |
| Total | 1,674 | 100.0% |
Employment Status by Age in Bent County
According to the labor force statistics for Bent County, out of the total population over 16 years of age (4,752), 37.5% or 1,782 individuals are in the labor force, with 5.5% or 98 of them unemployed. The age group with the highest labor force participation rate is 30 to 34 years, with 47.4% or 227 individuals in the labor force. Within the labor force, the 25 to 29 years age range has the highest percentage of unemployed individuals, with 19.0% or 40 of them being unemployed.
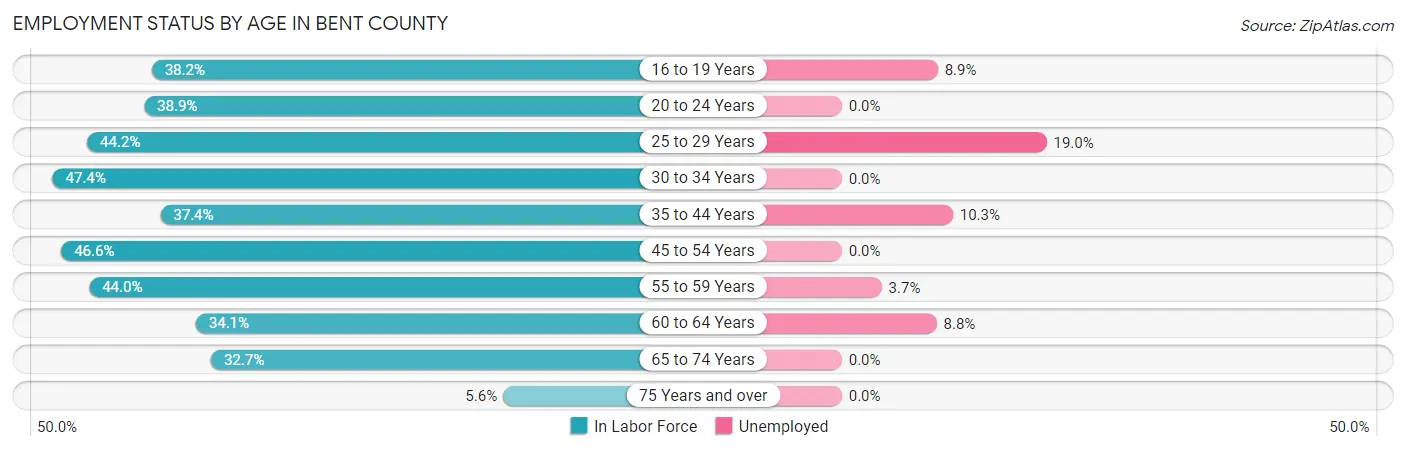
| Age Bracket | In Labor Force | Unemployed |
| 16 to 19 Years | 79 (38.2%) | 7 (8.9%) |
| 20 to 24 Years | 109 (38.9%) | 0 (0.0%) |
| 25 to 29 Years | 210 (44.2%) | 40 (19.0%) |
| 30 to 34 Years | 227 (47.4%) | 0 (0.0%) |
| 35 to 44 Years | 340 (37.4%) | 35 (10.3%) |
| 45 to 54 Years | 317 (46.6%) | 0 (0.0%) |
| 55 to 59 Years | 162 (44.0%) | 6 (3.7%) |
| 60 to 64 Years | 113 (34.1%) | 10 (8.8%) |
| 65 to 74 Years | 200 (32.7%) | 0 (0.0%) |
| 75 Years and over | 23 (5.6%) | 0 (0.0%) |
| Total | 1,782 (37.5%) | 98 (5.5%) |
Employment Status by Educational Attainment in Bent County
According to labor force statistics for Bent County, 42.2% of individuals (1,368) out of the total population between 25 and 64 years of age (3,242) are in the labor force, with 6.6% or 90 of them being unemployed. The group with the highest labor force participation rate are those with the educational attainment of bachelor's degree or higher, with 80.6% or 353 individuals in the labor force. Within the labor force, individuals with less than high school education have the highest percentage of unemployment, with 12.6% or 14 of them being unemployed.
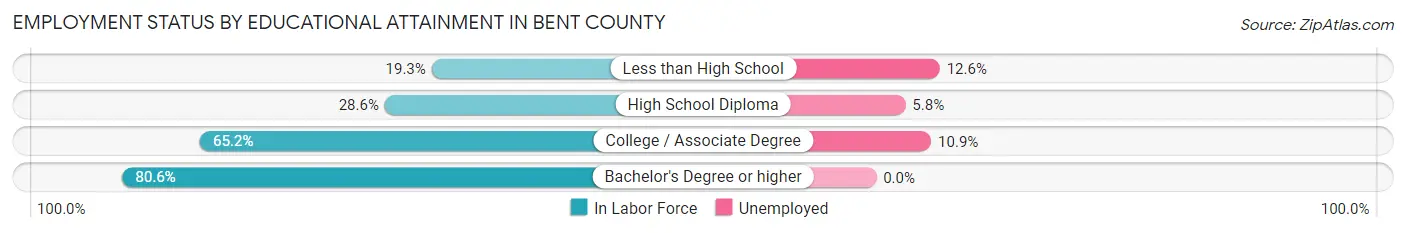
| Educational Attainment | In Labor Force | Unemployed |
| Less than High School | 111 (19.3%) | 72 (12.6%) |
| High School Diploma | 430 (28.6%) | 87 (5.8%) |
| College / Associate Degree | 475 (65.2%) | 79 (10.9%) |
| Bachelor's Degree or higher | 353 (80.6%) | 0 (0.0%) |
| Total | 1,368 (42.2%) | 214 (6.6%) |
Employment Occupations by Sex in Bent County
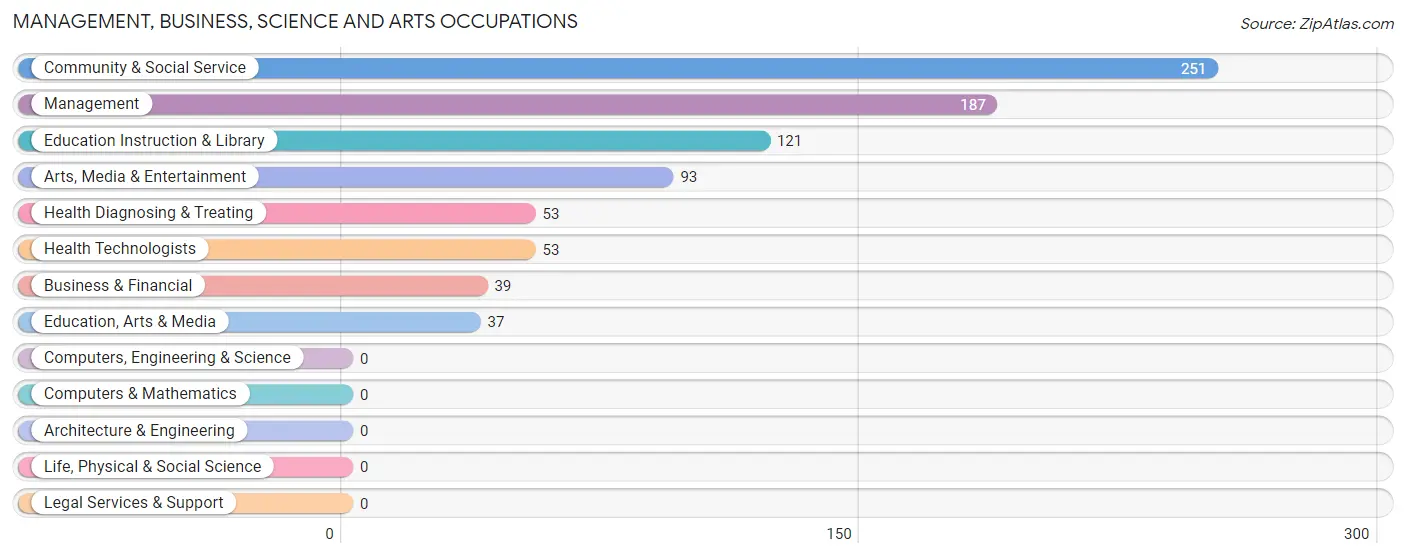
Management, Business, Science and Arts Occupations
The most common Management, Business, Science and Arts occupations in Bent County are Community & Social Service (251 | 14.9%), Management (187 | 11.1%), Education Instruction & Library (121 | 7.2%), Arts, Media & Entertainment (93 | 5.5%), and Health Diagnosing & Treating (53 | 3.2%).
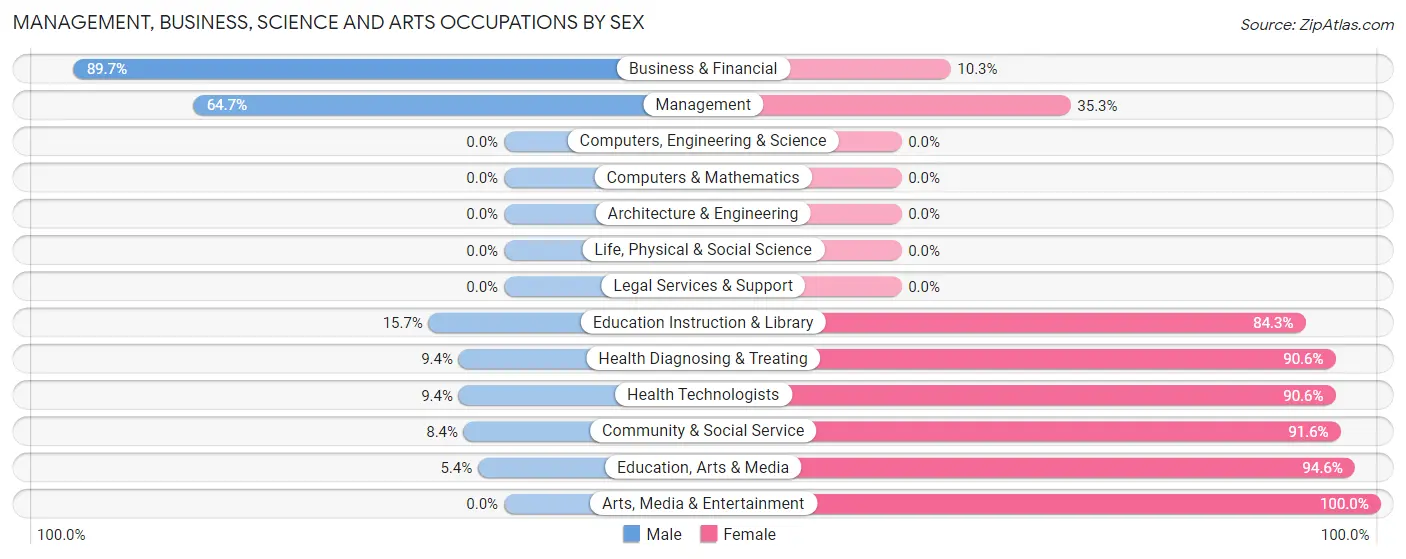
Management, Business, Science and Arts Occupations by Sex
Within the Management, Business, Science and Arts occupations in Bent County, the most male-oriented occupations are Business & Financial (89.7%), Management (64.7%), and Education Instruction & Library (15.7%), while the most female-oriented occupations are Arts, Media & Entertainment (100.0%), Education, Arts & Media (94.6%), and Community & Social Service (91.6%).
| Occupation | Male | Female |
| Management | 121 (64.7%) | 66 (35.3%) |
| Business & Financial | 35 (89.7%) | 4 (10.3%) |
| Computers, Engineering & Science | 0 (0.0%) | 0 (0.0%) |
| Computers & Mathematics | 0 (0.0%) | 0 (0.0%) |
| Architecture & Engineering | 0 (0.0%) | 0 (0.0%) |
| Life, Physical & Social Science | 0 (0.0%) | 0 (0.0%) |
| Community & Social Service | 21 (8.4%) | 230 (91.6%) |
| Education, Arts & Media | 2 (5.4%) | 35 (94.6%) |
| Legal Services & Support | 0 (0.0%) | 0 (0.0%) |
| Education Instruction & Library | 19 (15.7%) | 102 (84.3%) |
| Arts, Media & Entertainment | 0 (0.0%) | 93 (100.0%) |
| Health Diagnosing & Treating | 5 (9.4%) | 48 (90.6%) |
| Health Technologists | 5 (9.4%) | 48 (90.6%) |
| Total (Category) | 182 (34.3%) | 348 (65.7%) |
| Total (Overall) | 959 (57.0%) | 723 (43.0%) |
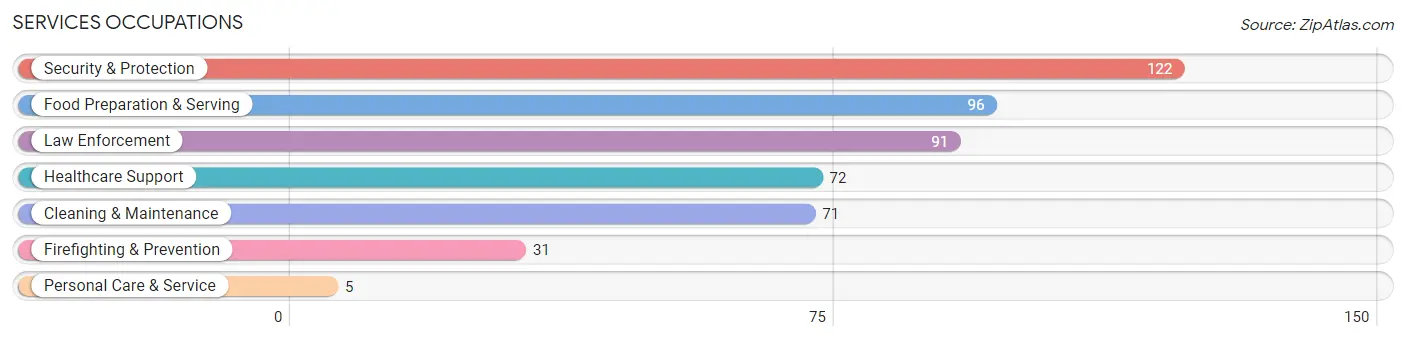
Services Occupations
The most common Services occupations in Bent County are Security & Protection (122 | 7.2%), Food Preparation & Serving (96 | 5.7%), Law Enforcement (91 | 5.4%), Healthcare Support (72 | 4.3%), and Cleaning & Maintenance (71 | 4.2%).
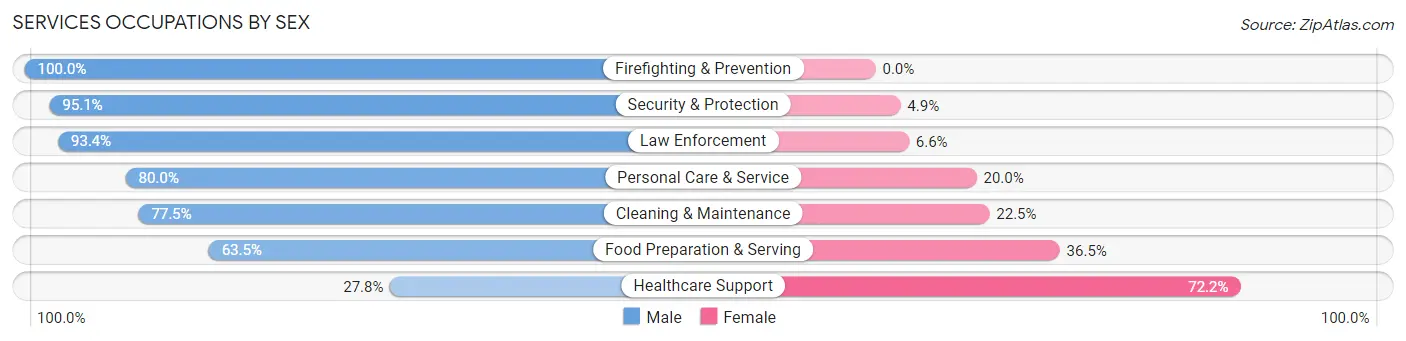
Services Occupations by Sex
Within the Services occupations in Bent County, the most male-oriented occupations are Firefighting & Prevention (100.0%), Security & Protection (95.1%), and Law Enforcement (93.4%), while the most female-oriented occupations are Healthcare Support (72.2%), Food Preparation & Serving (36.5%), and Cleaning & Maintenance (22.5%).
| Occupation | Male | Female |
| Healthcare Support | 20 (27.8%) | 52 (72.2%) |
| Security & Protection | 116 (95.1%) | 6 (4.9%) |
| Firefighting & Prevention | 31 (100.0%) | 0 (0.0%) |
| Law Enforcement | 85 (93.4%) | 6 (6.6%) |
| Food Preparation & Serving | 61 (63.5%) | 35 (36.5%) |
| Cleaning & Maintenance | 55 (77.5%) | 16 (22.5%) |
| Personal Care & Service | 4 (80.0%) | 1 (20.0%) |
| Total (Category) | 256 (70.0%) | 110 (30.0%) |
| Total (Overall) | 959 (57.0%) | 723 (43.0%) |
Sales and Office Occupations
The most common Sales and Office occupations in Bent County are Office & Administration (163 | 9.7%), and Sales & Related (117 | 7.0%).
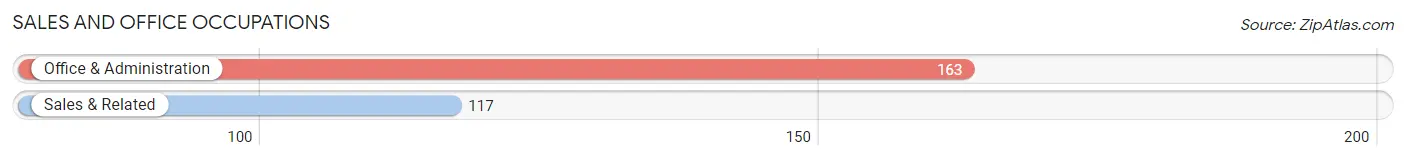
Sales and Office Occupations by Sex
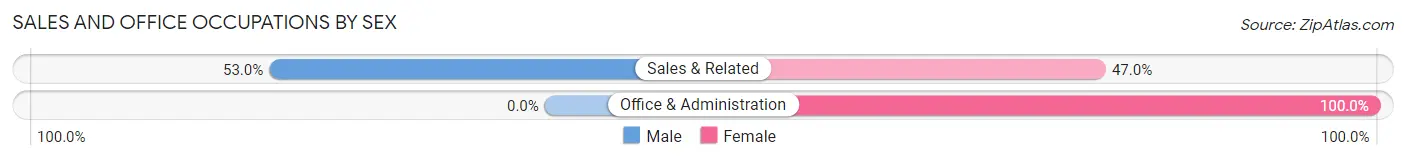
| Occupation | Male | Female |
| Sales & Related | 62 (53.0%) | 55 (47.0%) |
| Office & Administration | 0 (0.0%) | 163 (100.0%) |
| Total (Category) | 62 (22.1%) | 218 (77.9%) |
| Total (Overall) | 959 (57.0%) | 723 (43.0%) |
Natural Resources, Construction and Maintenance Occupations
The most common Natural Resources, Construction and Maintenance occupations in Bent County are Farming, Fishing & Forestry (163 | 9.7%), Construction & Extraction (47 | 2.8%), and Installation, Maintenance & Repair (42 | 2.5%).
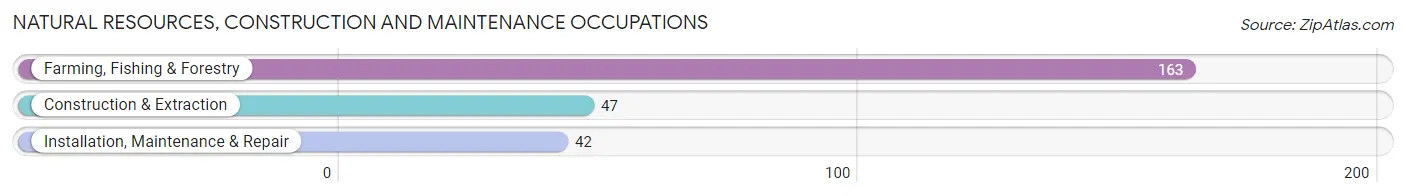
Natural Resources, Construction and Maintenance Occupations by Sex
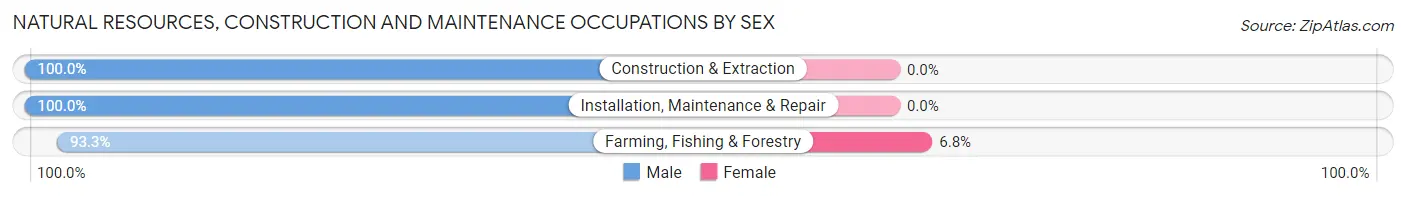
| Occupation | Male | Female |
| Farming, Fishing & Forestry | 152 (93.2%) | 11 (6.8%) |
| Construction & Extraction | 47 (100.0%) | 0 (0.0%) |
| Installation, Maintenance & Repair | 42 (100.0%) | 0 (0.0%) |
| Total (Category) | 241 (95.6%) | 11 (4.4%) |
| Total (Overall) | 959 (57.0%) | 723 (43.0%) |
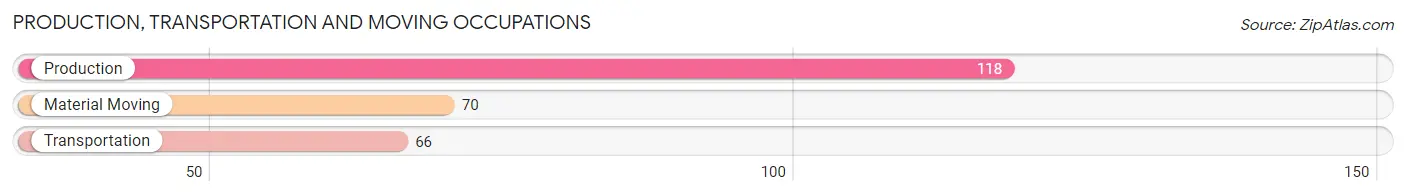
Production, Transportation and Moving Occupations
The most common Production, Transportation and Moving occupations in Bent County are Production (118 | 7.0%), Material Moving (70 | 4.2%), and Transportation (66 | 3.9%).
Production, Transportation and Moving Occupations by Sex
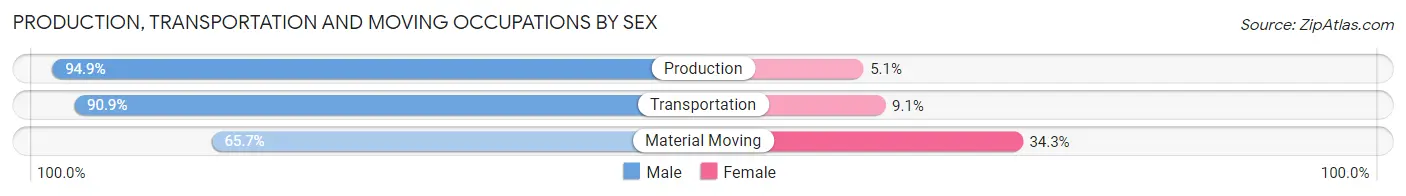
| Occupation | Male | Female |
| Production | 112 (94.9%) | 6 (5.1%) |
| Transportation | 60 (90.9%) | 6 (9.1%) |
| Material Moving | 46 (65.7%) | 24 (34.3%) |
| Total (Category) | 218 (85.8%) | 36 (14.2%) |
| Total (Overall) | 959 (57.0%) | 723 (43.0%) |
Employment Industries by Sex in Bent County
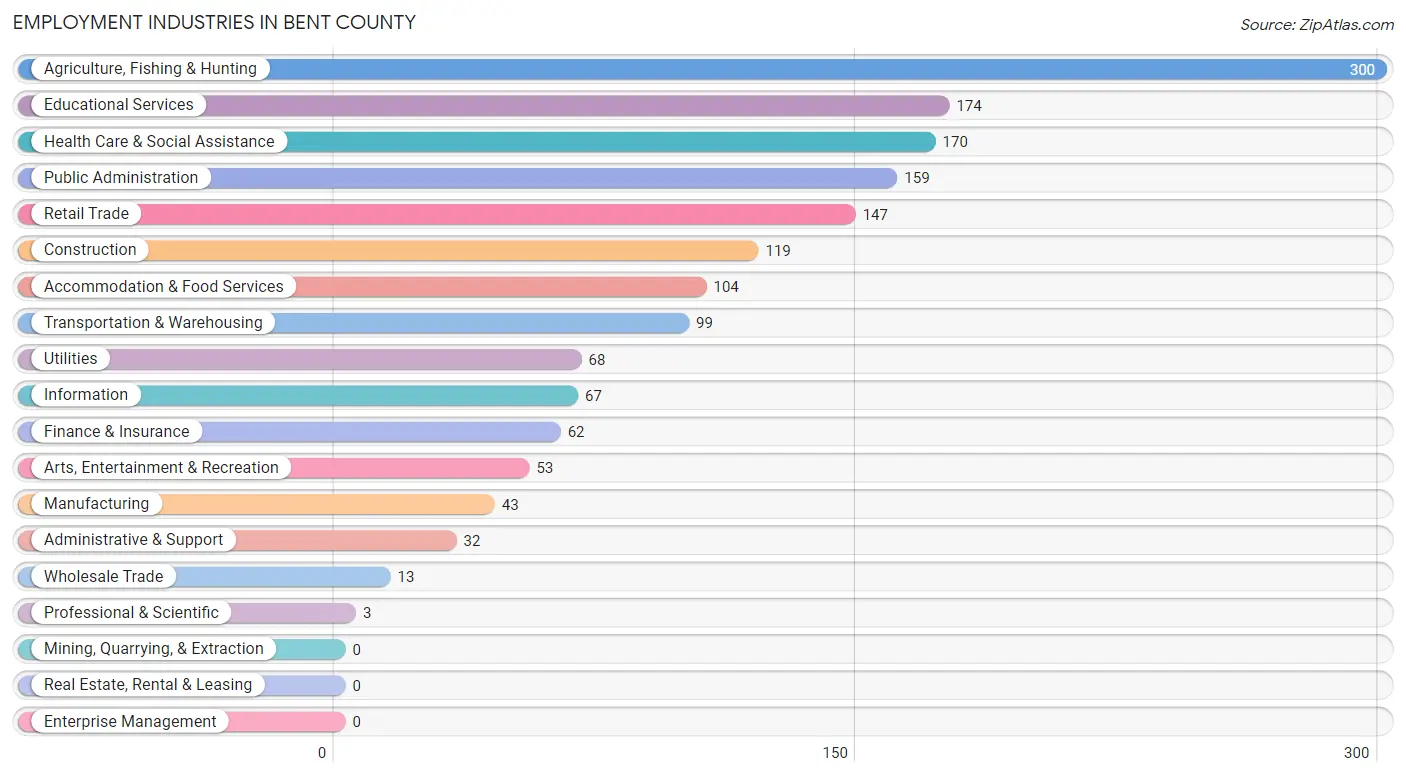
Employment Industries in Bent County
The major employment industries in Bent County include Agriculture, Fishing & Hunting (300 | 17.8%), Educational Services (174 | 10.3%), Health Care & Social Assistance (170 | 10.1%), Public Administration (159 | 9.5%), and Retail Trade (147 | 8.7%).
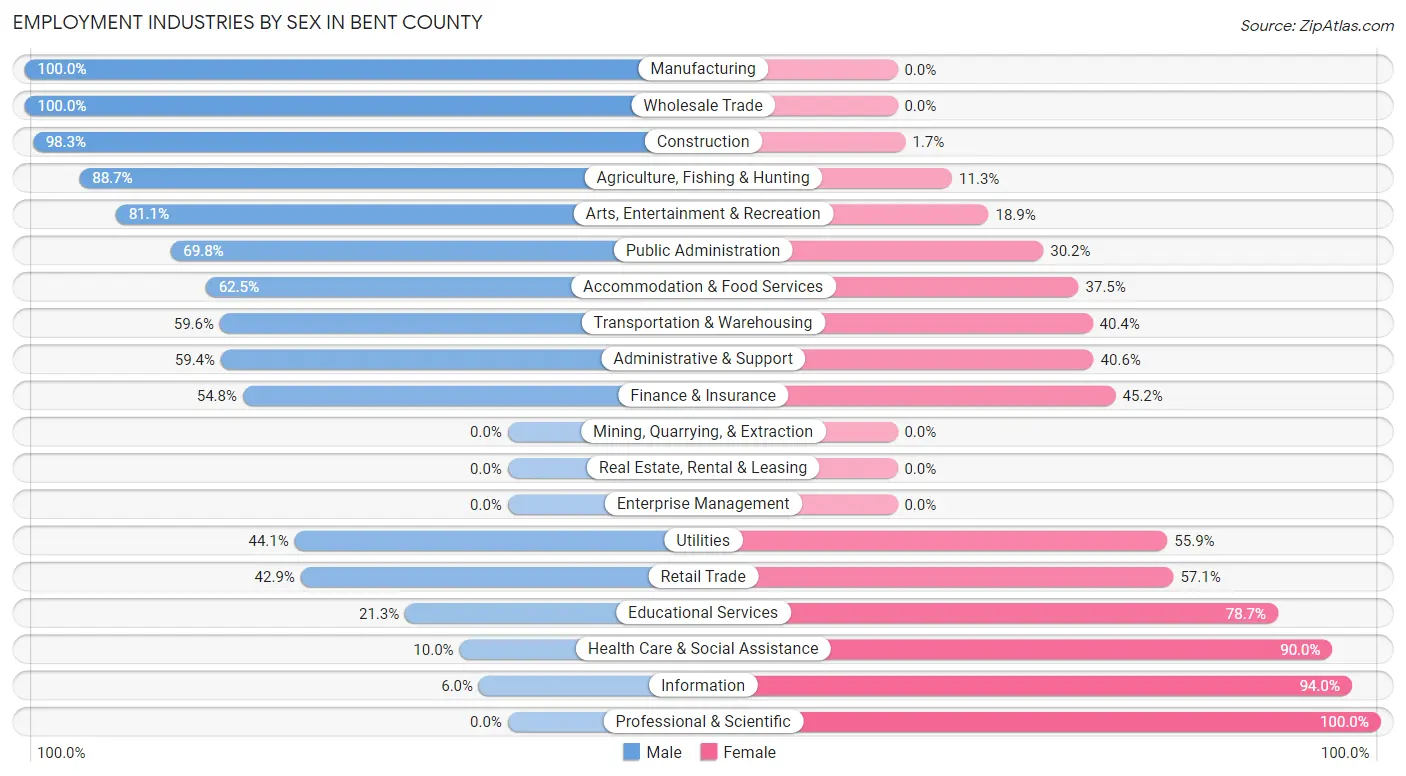
Employment Industries by Sex in Bent County
The Bent County industries that see more men than women are Manufacturing (100.0%), Wholesale Trade (100.0%), and Construction (98.3%), whereas the industries that tend to have a higher number of women are Professional & Scientific (100.0%), Information (94.0%), and Health Care & Social Assistance (90.0%).
| Industry | Male | Female |
| Agriculture, Fishing & Hunting | 266 (88.7%) | 34 (11.3%) |
| Mining, Quarrying, & Extraction | 0 (0.0%) | 0 (0.0%) |
| Construction | 117 (98.3%) | 2 (1.7%) |
| Manufacturing | 43 (100.0%) | 0 (0.0%) |
| Wholesale Trade | 13 (100.0%) | 0 (0.0%) |
| Retail Trade | 63 (42.9%) | 84 (57.1%) |
| Transportation & Warehousing | 59 (59.6%) | 40 (40.4%) |
| Utilities | 30 (44.1%) | 38 (55.9%) |
| Information | 4 (6.0%) | 63 (94.0%) |
| Finance & Insurance | 34 (54.8%) | 28 (45.2%) |
| Real Estate, Rental & Leasing | 0 (0.0%) | 0 (0.0%) |
| Professional & Scientific | 0 (0.0%) | 3 (100.0%) |
| Enterprise Management | 0 (0.0%) | 0 (0.0%) |
| Administrative & Support | 19 (59.4%) | 13 (40.6%) |
| Educational Services | 37 (21.3%) | 137 (78.7%) |
| Health Care & Social Assistance | 17 (10.0%) | 153 (90.0%) |
| Arts, Entertainment & Recreation | 43 (81.1%) | 10 (18.9%) |
| Accommodation & Food Services | 65 (62.5%) | 39 (37.5%) |
| Public Administration | 111 (69.8%) | 48 (30.2%) |
| Total | 959 (57.0%) | 723 (43.0%) |
Education in Bent County
School Enrollment in Bent County
The most common levels of schooling among the 956 students in Bent County are high school (223 | 23.3%), elementary school (199 | 20.8%), and middle school (193 | 20.2%).
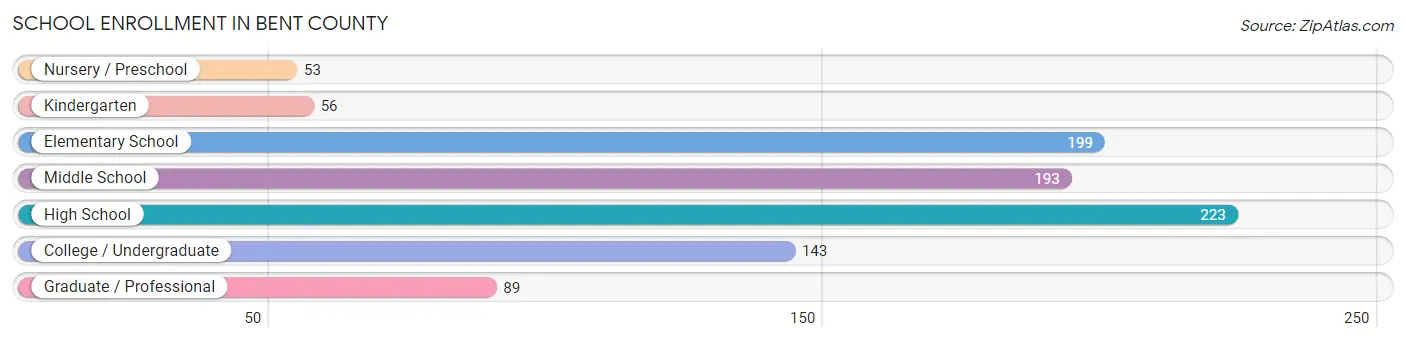
| School Level | # Students | % Students |
| Nursery / Preschool | 53 | 5.5% |
| Kindergarten | 56 | 5.9% |
| Elementary School | 199 | 20.8% |
| Middle School | 193 | 20.2% |
| High School | 223 | 23.3% |
| College / Undergraduate | 143 | 15.0% |
| Graduate / Professional | 89 | 9.3% |
| Total | 956 | 100.0% |
School Enrollment by Age by Funding Source in Bent County
Out of a total of 956 students who are enrolled in schools in Bent County, 235 (24.6%) attend a private institution, while the remaining 721 (75.4%) are enrolled in public schools. The age group of 25 to 34 year olds has the highest likelihood of being enrolled in private schools, with 52 (83.9% in the age bracket) enrolled. Conversely, the age group of 3 to 4 year olds has the lowest likelihood of being enrolled in a private school, with 30 (100.0% in the age bracket) attending a public institution.
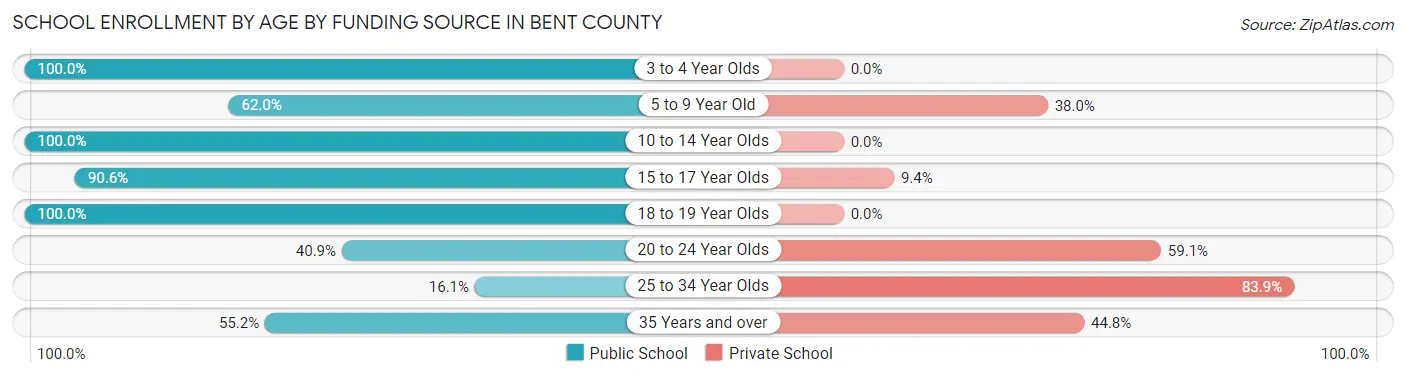
| Age Bracket | Public School | Private School |
| 3 to 4 Year Olds | 30 (100.0%) | 0 (0.0%) |
| 5 to 9 Year Old | 155 (62.0%) | 95 (38.0%) |
| 10 to 14 Year Olds | 256 (100.0%) | 0 (0.0%) |
| 15 to 17 Year Olds | 145 (90.6%) | 15 (9.4%) |
| 18 to 19 Year Olds | 42 (100.0%) | 0 (0.0%) |
| 20 to 24 Year Olds | 9 (40.9%) | 13 (59.1%) |
| 25 to 34 Year Olds | 10 (16.1%) | 52 (83.9%) |
| 35 Years and over | 74 (55.2%) | 60 (44.8%) |
| Total | 721 (75.4%) | 235 (24.6%) |
Educational Attainment by Field of Study in Bent County
Education (195 | 27.6%), science & technology (130 | 18.4%), bio, nature & agricultural (127 | 18.0%), communications (65 | 9.2%), and business (56 | 7.9%) are the most common fields of study among 707 individuals in Bent County who have obtained a bachelor's degree or higher.
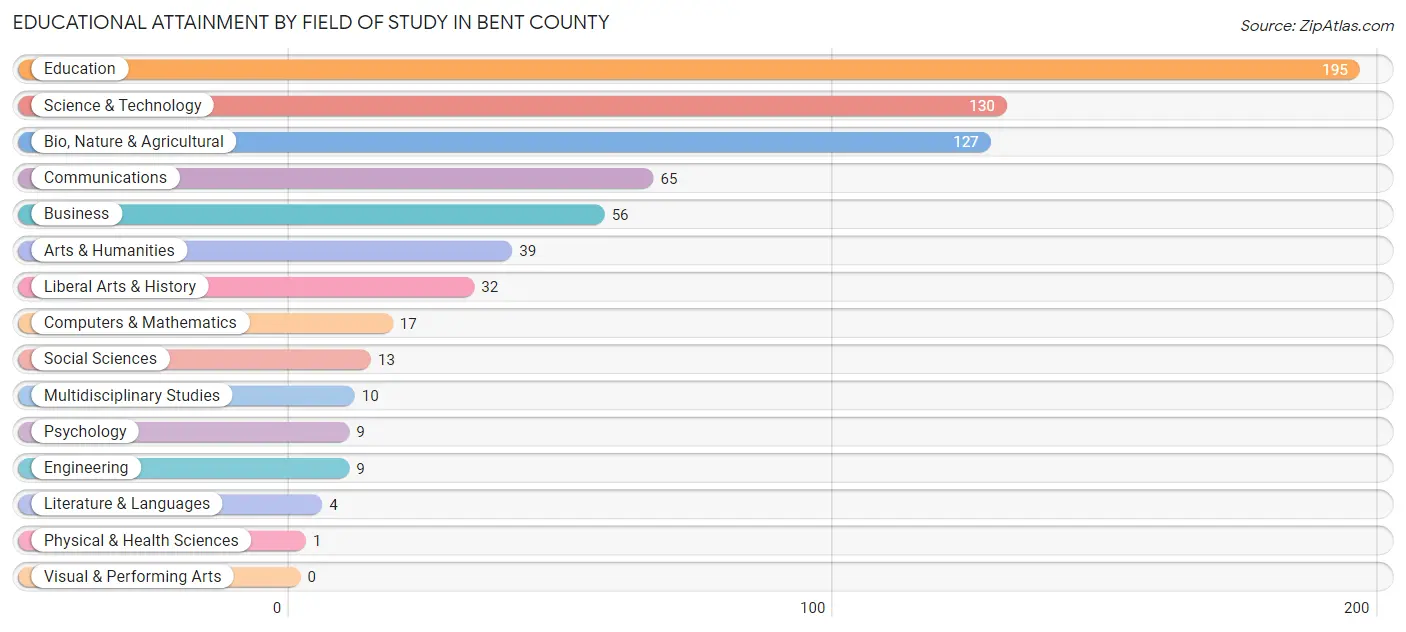
| Field of Study | # Graduates | % Graduates |
| Computers & Mathematics | 17 | 2.4% |
| Bio, Nature & Agricultural | 127 | 18.0% |
| Physical & Health Sciences | 1 | 0.1% |
| Psychology | 9 | 1.3% |
| Social Sciences | 13 | 1.8% |
| Engineering | 9 | 1.3% |
| Multidisciplinary Studies | 10 | 1.4% |
| Science & Technology | 130 | 18.4% |
| Business | 56 | 7.9% |
| Education | 195 | 27.6% |
| Literature & Languages | 4 | 0.6% |
| Liberal Arts & History | 32 | 4.5% |
| Visual & Performing Arts | 0 | 0.0% |
| Communications | 65 | 9.2% |
| Arts & Humanities | 39 | 5.5% |
| Total | 707 | 100.0% |
Transportation & Commute in Bent County
Vehicle Availability by Sex in Bent County
The most prevalent vehicle ownership categories in Bent County are males with 2 vehicles (443, accounting for 46.6%) and females with 2 vehicles (256, making up 61.3%).
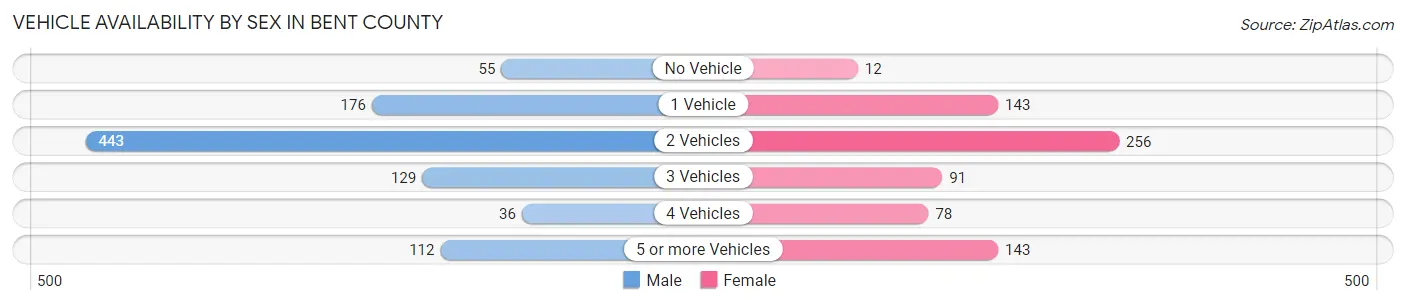
| Vehicles Available | Male | Female |
| No Vehicle | 55 (5.8%) | 12 (1.7%) |
| 1 Vehicle | 176 (18.5%) | 143 (19.8%) |
| 2 Vehicles | 443 (46.6%) | 256 (35.4%) |
| 3 Vehicles | 129 (13.6%) | 91 (12.6%) |
| 4 Vehicles | 36 (3.8%) | 78 (10.8%) |
| 5 or more Vehicles | 112 (11.8%) | 143 (19.8%) |
| Total | 951 (100.0%) | 723 (100.0%) |
Commute Time in Bent County
The most frequently occuring commute durations in Bent County are less than 5 minutes (315 commuters, 20.0%), 10 to 14 minutes (310 commuters, 19.7%), and 5 to 9 minutes (224 commuters, 14.2%).
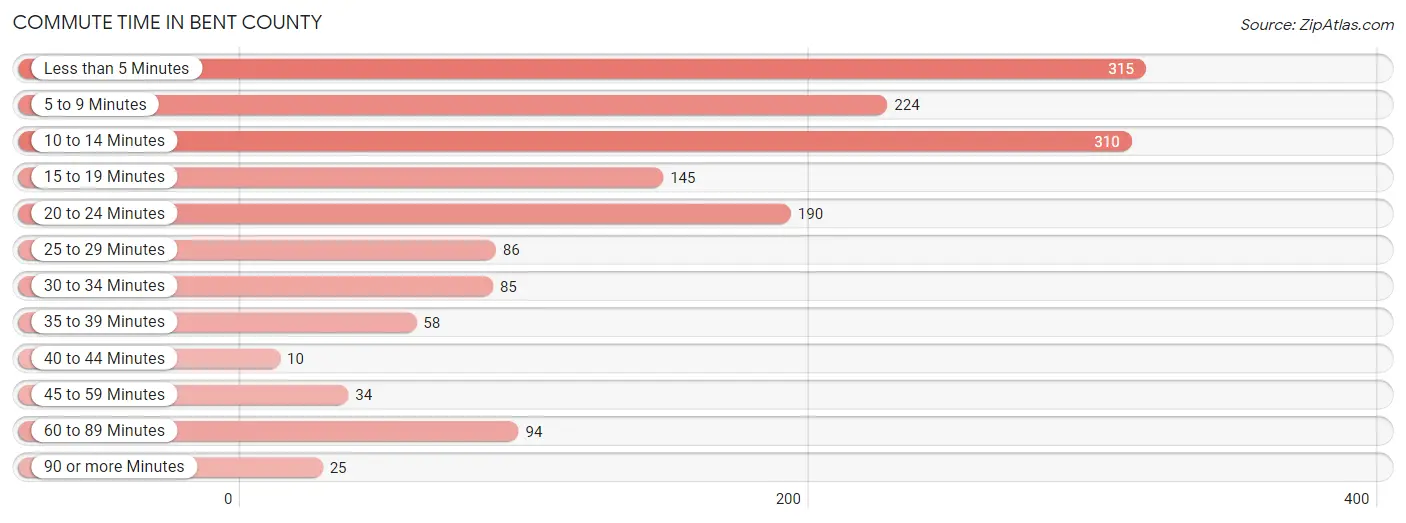
| Commute Time | # Commuters | % Commuters |
| Less than 5 Minutes | 315 | 20.0% |
| 5 to 9 Minutes | 224 | 14.2% |
| 10 to 14 Minutes | 310 | 19.7% |
| 15 to 19 Minutes | 145 | 9.2% |
| 20 to 24 Minutes | 190 | 12.1% |
| 25 to 29 Minutes | 86 | 5.5% |
| 30 to 34 Minutes | 85 | 5.4% |
| 35 to 39 Minutes | 58 | 3.7% |
| 40 to 44 Minutes | 10 | 0.6% |
| 45 to 59 Minutes | 34 | 2.2% |
| 60 to 89 Minutes | 94 | 6.0% |
| 90 or more Minutes | 25 | 1.6% |
Commute Time by Sex in Bent County
The most common commute times in Bent County are less than 5 minutes (227 commuters, 24.3%) for males and 10 to 14 minutes (122 commuters, 19.0%) for females.
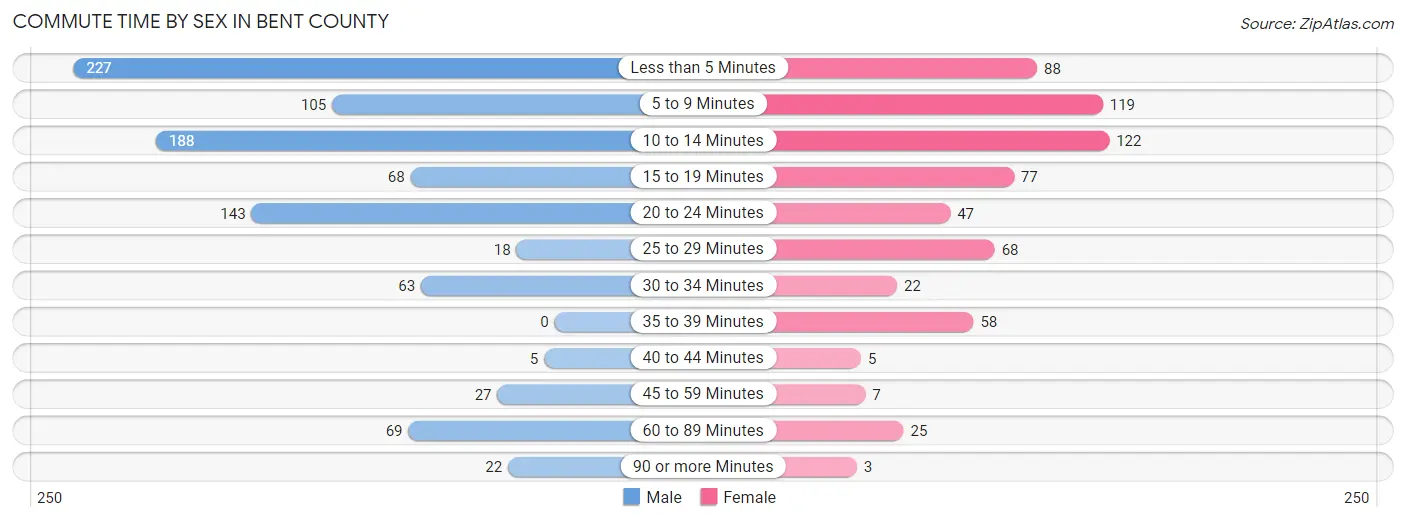
| Commute Time | Male | Female |
| Less than 5 Minutes | 227 (24.3%) | 88 (13.7%) |
| 5 to 9 Minutes | 105 (11.2%) | 119 (18.6%) |
| 10 to 14 Minutes | 188 (20.1%) | 122 (19.0%) |
| 15 to 19 Minutes | 68 (7.3%) | 77 (12.0%) |
| 20 to 24 Minutes | 143 (15.3%) | 47 (7.3%) |
| 25 to 29 Minutes | 18 (1.9%) | 68 (10.6%) |
| 30 to 34 Minutes | 63 (6.7%) | 22 (3.4%) |
| 35 to 39 Minutes | 0 (0.0%) | 58 (9.0%) |
| 40 to 44 Minutes | 5 (0.5%) | 5 (0.8%) |
| 45 to 59 Minutes | 27 (2.9%) | 7 (1.1%) |
| 60 to 89 Minutes | 69 (7.4%) | 25 (3.9%) |
| 90 or more Minutes | 22 (2.4%) | 3 (0.5%) |
Time of Departure to Work by Sex in Bent County
The most frequent times of departure to work in Bent County are 7:00 AM to 7:29 AM (199, 21.3%) for males and 7:00 AM to 7:29 AM (183, 28.5%) for females.
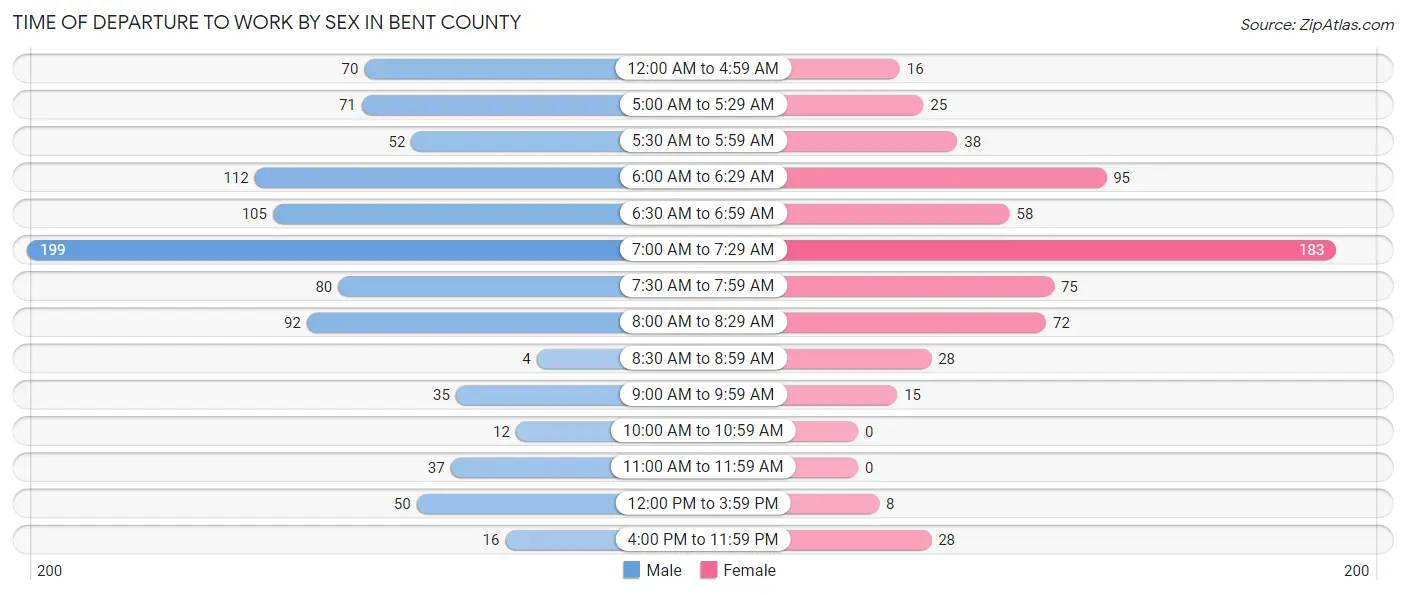
| Time of Departure | Male | Female |
| 12:00 AM to 4:59 AM | 70 (7.5%) | 16 (2.5%) |
| 5:00 AM to 5:29 AM | 71 (7.6%) | 25 (3.9%) |
| 5:30 AM to 5:59 AM | 52 (5.6%) | 38 (5.9%) |
| 6:00 AM to 6:29 AM | 112 (12.0%) | 95 (14.8%) |
| 6:30 AM to 6:59 AM | 105 (11.2%) | 58 (9.0%) |
| 7:00 AM to 7:29 AM | 199 (21.3%) | 183 (28.5%) |
| 7:30 AM to 7:59 AM | 80 (8.6%) | 75 (11.7%) |
| 8:00 AM to 8:29 AM | 92 (9.8%) | 72 (11.2%) |
| 8:30 AM to 8:59 AM | 4 (0.4%) | 28 (4.4%) |
| 9:00 AM to 9:59 AM | 35 (3.7%) | 15 (2.3%) |
| 10:00 AM to 10:59 AM | 12 (1.3%) | 0 (0.0%) |
| 11:00 AM to 11:59 AM | 37 (4.0%) | 0 (0.0%) |
| 12:00 PM to 3:59 PM | 50 (5.3%) | 8 (1.3%) |
| 4:00 PM to 11:59 PM | 16 (1.7%) | 28 (4.4%) |
| Total | 935 (100.0%) | 641 (100.0%) |
Housing Occupancy in Bent County
Occupancy by Ownership in Bent County
Of the total 1,808 dwellings in Bent County, owner-occupied units account for 1,114 (61.6%), while renter-occupied units make up 694 (38.4%).
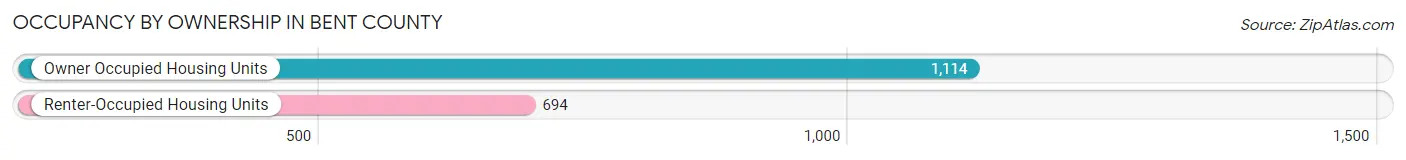
| Occupancy | # Housing Units | % Housing Units |
| Owner Occupied Housing Units | 1,114 | 61.6% |
| Renter-Occupied Housing Units | 694 | 38.4% |
| Total Occupied Housing Units | 1,808 | 100.0% |
Occupancy by Household Size in Bent County
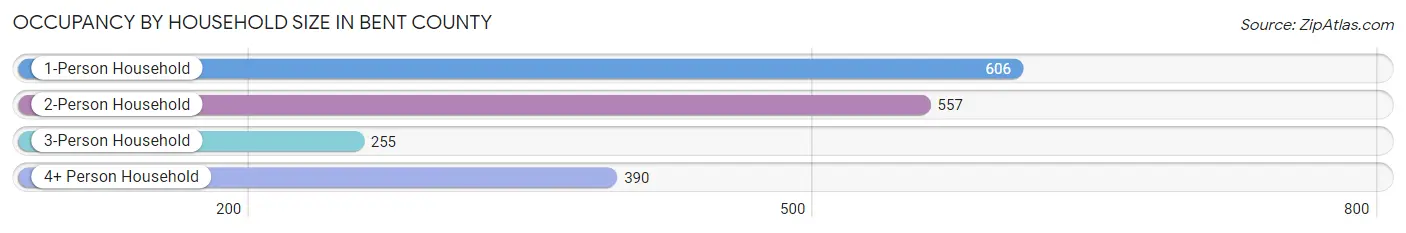
| Household Size | # Housing Units | % Housing Units |
| 1-Person Household | 606 | 33.5% |
| 2-Person Household | 557 | 30.8% |
| 3-Person Household | 255 | 14.1% |
| 4+ Person Household | 390 | 21.6% |
| Total Housing Units | 1,808 | 100.0% |
Occupancy by Ownership by Household Size in Bent County
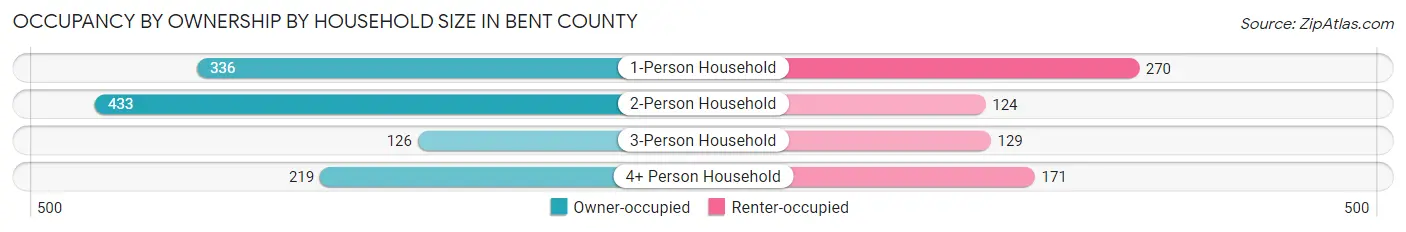
| Household Size | Owner-occupied | Renter-occupied |
| 1-Person Household | 336 (55.4%) | 270 (44.6%) |
| 2-Person Household | 433 (77.7%) | 124 (22.3%) |
| 3-Person Household | 126 (49.4%) | 129 (50.6%) |
| 4+ Person Household | 219 (56.1%) | 171 (43.9%) |
| Total Housing Units | 1,114 (61.6%) | 694 (38.4%) |
Occupancy by Educational Attainment in Bent County
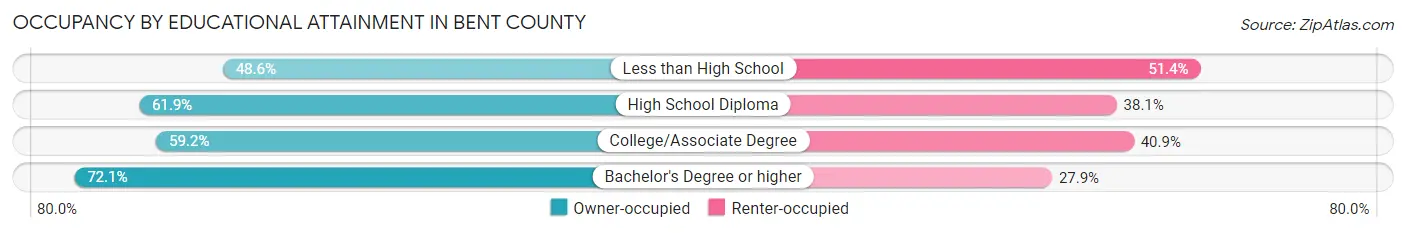
| Household Size | Owner-occupied | Renter-occupied |
| Less than High School | 102 (48.6%) | 108 (51.4%) |
| High School Diploma | 240 (61.9%) | 148 (38.1%) |
| College/Associate Degree | 459 (59.2%) | 317 (40.8%) |
| Bachelor's Degree or higher | 313 (72.1%) | 121 (27.9%) |
Occupancy by Age of Householder in Bent County
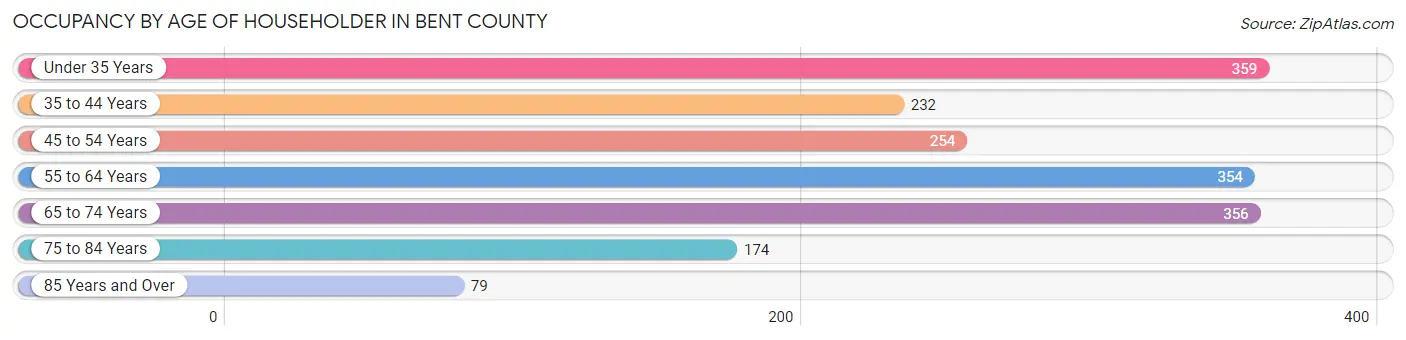
| Age Bracket | # Households | % Households |
| Under 35 Years | 359 | 19.9% |
| 35 to 44 Years | 232 | 12.8% |
| 45 to 54 Years | 254 | 14.1% |
| 55 to 64 Years | 354 | 19.6% |
| 65 to 74 Years | 356 | 19.7% |
| 75 to 84 Years | 174 | 9.6% |
| 85 Years and Over | 79 | 4.4% |
| Total | 1,808 | 100.0% |
Housing Finances in Bent County
Median Income by Occupancy in Bent County
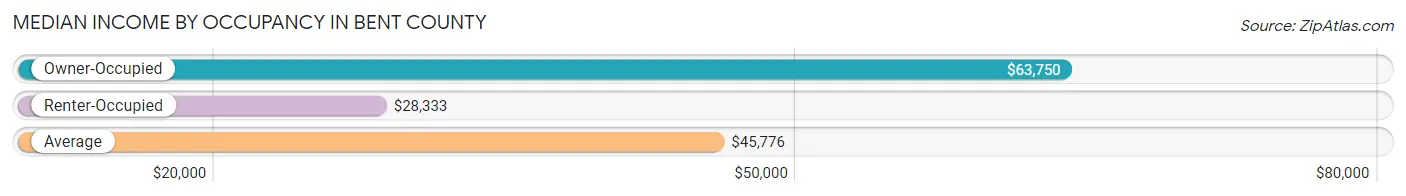
| Occupancy Type | # Households | Median Income |
| Owner-Occupied | 1,114 (61.6%) | $63,750 |
| Renter-Occupied | 694 (38.4%) | $28,333 |
| Average | 1,808 (100.0%) | $45,776 |
Occupancy by Householder Income Bracket in Bent County
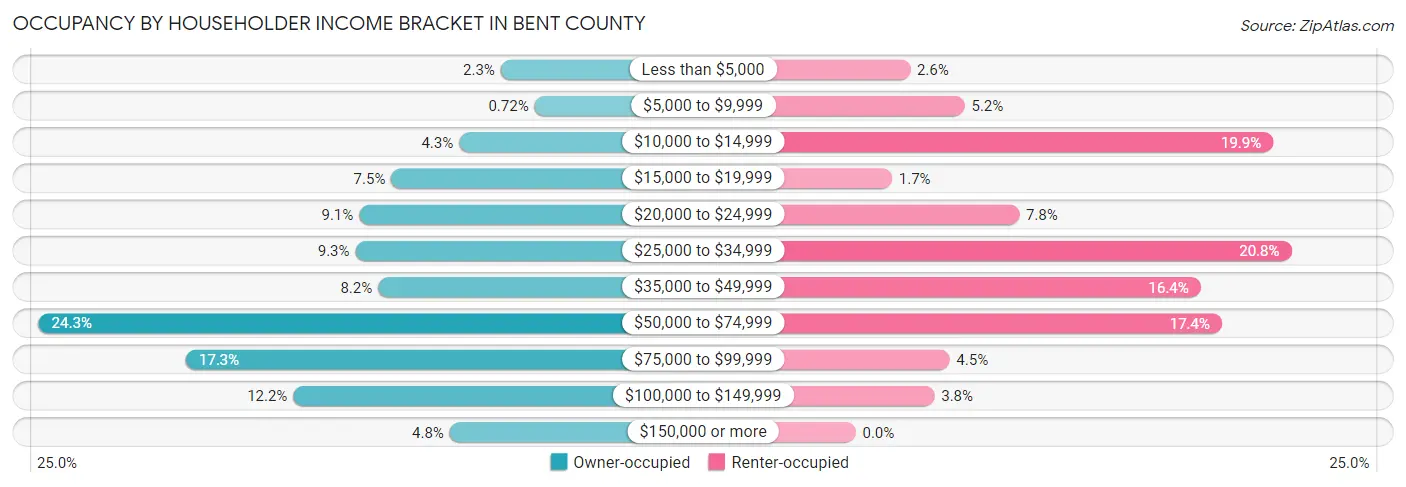
| Income Bracket | Owner-occupied | Renter-occupied |
| Less than $5,000 | 26 (2.3%) | 18 (2.6%) |
| $5,000 to $9,999 | 8 (0.7%) | 36 (5.2%) |
| $10,000 to $14,999 | 48 (4.3%) | 138 (19.9%) |
| $15,000 to $19,999 | 84 (7.5%) | 12 (1.7%) |
| $20,000 to $24,999 | 101 (9.1%) | 54 (7.8%) |
| $25,000 to $34,999 | 103 (9.2%) | 144 (20.7%) |
| $35,000 to $49,999 | 91 (8.2%) | 114 (16.4%) |
| $50,000 to $74,999 | 271 (24.3%) | 121 (17.4%) |
| $75,000 to $99,999 | 193 (17.3%) | 31 (4.5%) |
| $100,000 to $149,999 | 136 (12.2%) | 26 (3.7%) |
| $150,000 or more | 53 (4.8%) | 0 (0.0%) |
| Total | 1,114 (100.0%) | 694 (100.0%) |
Monthly Housing Cost Tiers in Bent County
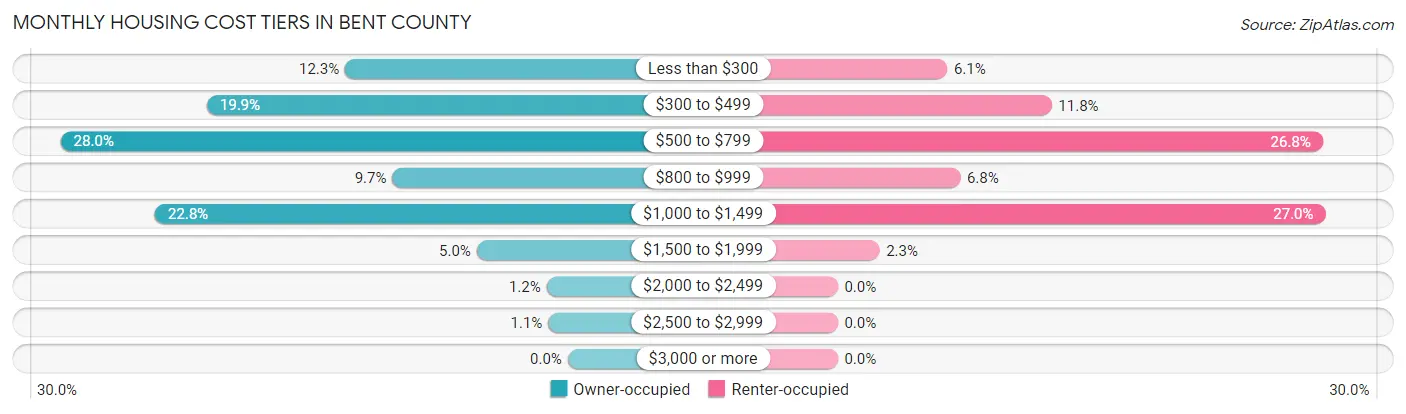
| Monthly Cost | Owner-occupied | Renter-occupied |
| Less than $300 | 137 (12.3%) | 42 (6.0%) |
| $300 to $499 | 222 (19.9%) | 82 (11.8%) |
| $500 to $799 | 312 (28.0%) | 186 (26.8%) |
| $800 to $999 | 108 (9.7%) | 47 (6.8%) |
| $1,000 to $1,499 | 254 (22.8%) | 187 (27.0%) |
| $1,500 to $1,999 | 56 (5.0%) | 16 (2.3%) |
| $2,000 to $2,499 | 13 (1.2%) | 0 (0.0%) |
| $2,500 to $2,999 | 12 (1.1%) | 0 (0.0%) |
| $3,000 or more | 0 (0.0%) | 0 (0.0%) |
| Total | 1,114 (100.0%) | 694 (100.0%) |
Physical Housing Characteristics in Bent County
Housing Structures in Bent County
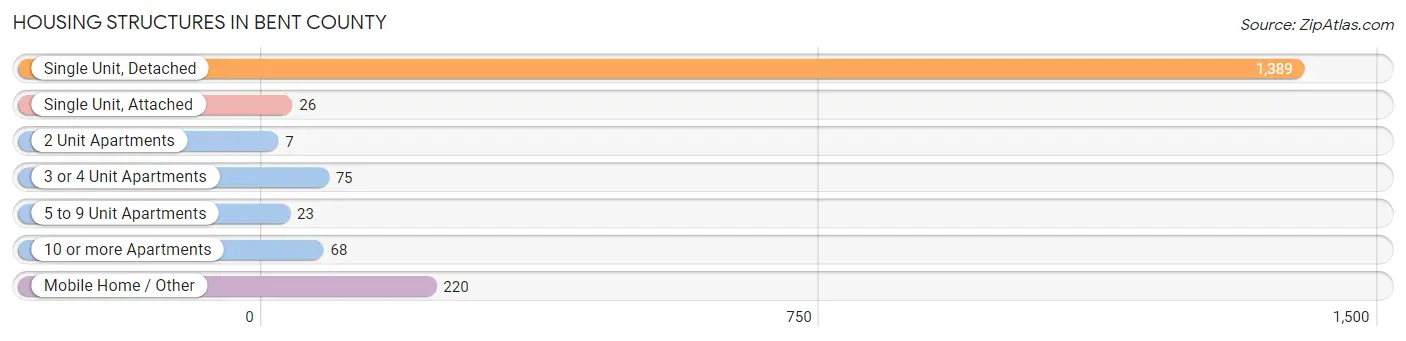
| Structure Type | # Housing Units | % Housing Units |
| Single Unit, Detached | 1,389 | 76.8% |
| Single Unit, Attached | 26 | 1.4% |
| 2 Unit Apartments | 7 | 0.4% |
| 3 or 4 Unit Apartments | 75 | 4.2% |
| 5 to 9 Unit Apartments | 23 | 1.3% |
| 10 or more Apartments | 68 | 3.8% |
| Mobile Home / Other | 220 | 12.2% |
| Total | 1,808 | 100.0% |
Housing Structures by Occupancy in Bent County
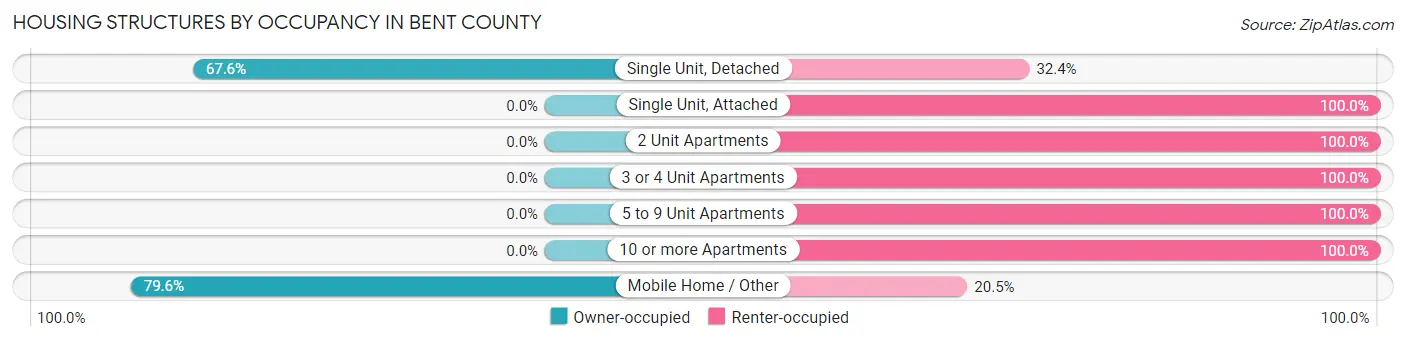
| Structure Type | Owner-occupied | Renter-occupied |
| Single Unit, Detached | 939 (67.6%) | 450 (32.4%) |
| Single Unit, Attached | 0 (0.0%) | 26 (100.0%) |
| 2 Unit Apartments | 0 (0.0%) | 7 (100.0%) |
| 3 or 4 Unit Apartments | 0 (0.0%) | 75 (100.0%) |
| 5 to 9 Unit Apartments | 0 (0.0%) | 23 (100.0%) |
| 10 or more Apartments | 0 (0.0%) | 68 (100.0%) |
| Mobile Home / Other | 175 (79.5%) | 45 (20.4%) |
| Total | 1,114 (61.6%) | 694 (38.4%) |
Housing Structures by Number of Rooms in Bent County
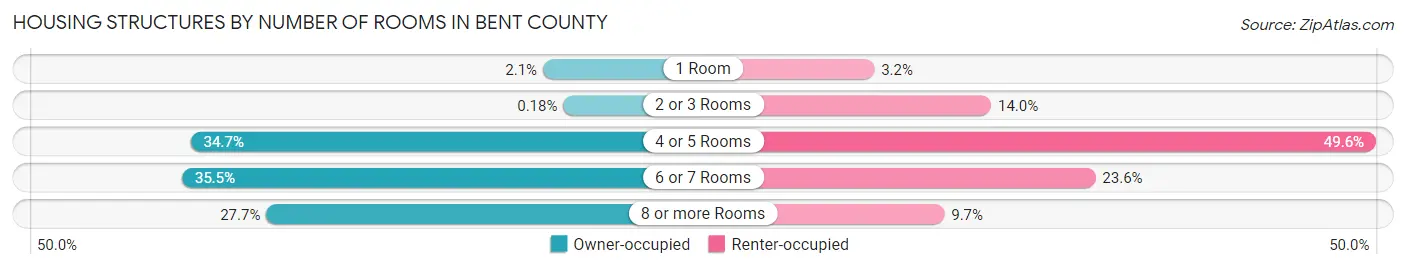
| Number of Rooms | Owner-occupied | Renter-occupied |
| 1 Room | 23 (2.1%) | 22 (3.2%) |
| 2 or 3 Rooms | 2 (0.2%) | 97 (14.0%) |
| 4 or 5 Rooms | 386 (34.6%) | 344 (49.6%) |
| 6 or 7 Rooms | 395 (35.5%) | 164 (23.6%) |
| 8 or more Rooms | 308 (27.7%) | 67 (9.7%) |
| Total | 1,114 (100.0%) | 694 (100.0%) |
Housing Structure by Heating Type in Bent County
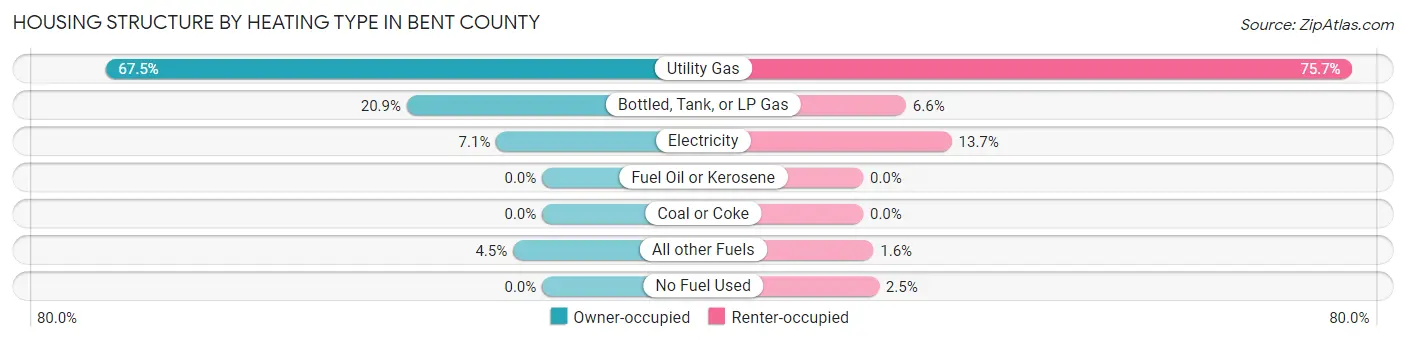
| Heating Type | Owner-occupied | Renter-occupied |
| Utility Gas | 752 (67.5%) | 525 (75.6%) |
| Bottled, Tank, or LP Gas | 233 (20.9%) | 46 (6.6%) |
| Electricity | 79 (7.1%) | 95 (13.7%) |
| Fuel Oil or Kerosene | 0 (0.0%) | 0 (0.0%) |
| Coal or Coke | 0 (0.0%) | 0 (0.0%) |
| All other Fuels | 50 (4.5%) | 11 (1.6%) |
| No Fuel Used | 0 (0.0%) | 17 (2.5%) |
| Total | 1,114 (100.0%) | 694 (100.0%) |
Household Vehicle Usage in Bent County
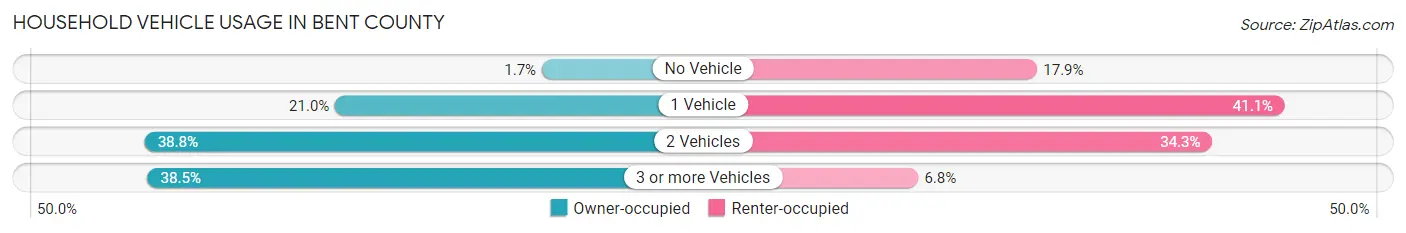
| Vehicles per Household | Owner-occupied | Renter-occupied |
| No Vehicle | 19 (1.7%) | 124 (17.9%) |
| 1 Vehicle | 234 (21.0%) | 285 (41.1%) |
| 2 Vehicles | 432 (38.8%) | 238 (34.3%) |
| 3 or more Vehicles | 429 (38.5%) | 47 (6.8%) |
| Total | 1,114 (100.0%) | 694 (100.0%) |
Real Estate & Mortgages in Bent County
Real Estate and Mortgage Overview in Bent County
| Characteristic | Without Mortgage | With Mortgage |
| Housing Units | 621 | 493 |
| Median Property Value | $107,200 | $112,400 |
| Median Household Income | $52,898 | $21 |
| Monthly Housing Costs | $470 | $0 |
| Real Estate Taxes | $501 | $44 |
Property Value by Mortgage Status in Bent County
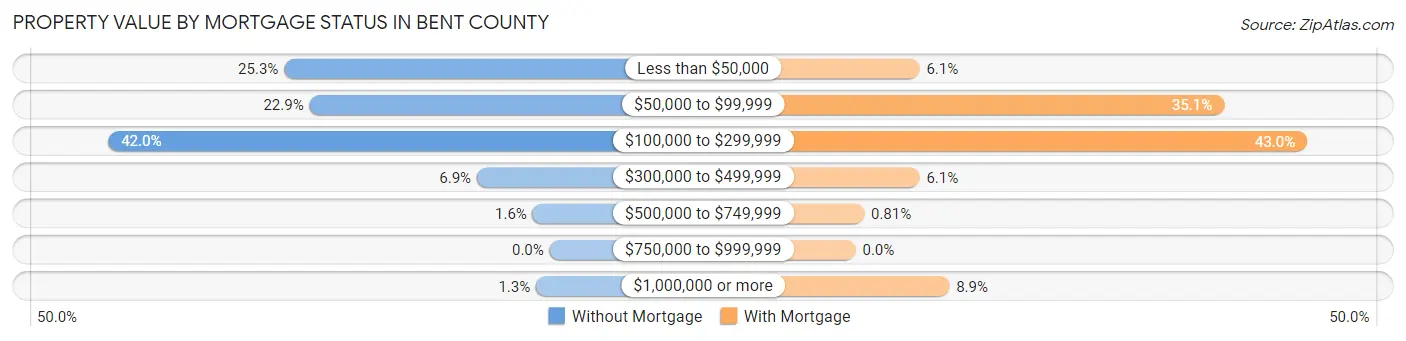
| Property Value | Without Mortgage | With Mortgage |
| Less than $50,000 | 157 (25.3%) | 30 (6.1%) |
| $50,000 to $99,999 | 142 (22.9%) | 173 (35.1%) |
| $100,000 to $299,999 | 261 (42.0%) | 212 (43.0%) |
| $300,000 to $499,999 | 43 (6.9%) | 30 (6.1%) |
| $500,000 to $749,999 | 10 (1.6%) | 4 (0.8%) |
| $750,000 to $999,999 | 0 (0.0%) | 0 (0.0%) |
| $1,000,000 or more | 8 (1.3%) | 44 (8.9%) |
| Total | 621 (100.0%) | 493 (100.0%) |
Household Income by Mortgage Status in Bent County
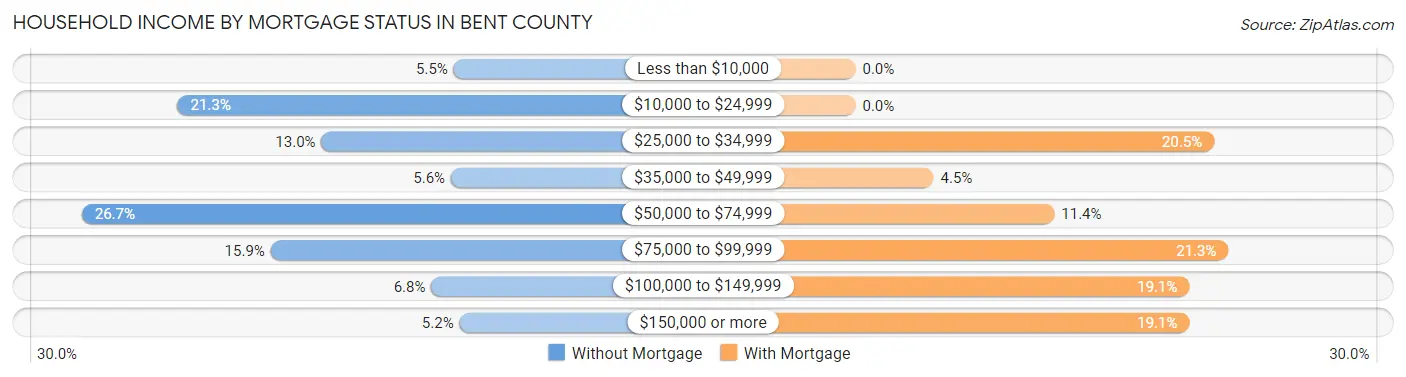
| Household Income | Without Mortgage | With Mortgage |
| Less than $10,000 | 34 (5.5%) | 0 (0.0%) |
| $10,000 to $24,999 | 132 (21.3%) | 0 (0.0%) |
| $25,000 to $34,999 | 81 (13.0%) | 101 (20.5%) |
| $35,000 to $49,999 | 35 (5.6%) | 22 (4.5%) |
| $50,000 to $74,999 | 166 (26.7%) | 56 (11.4%) |
| $75,000 to $99,999 | 99 (15.9%) | 105 (21.3%) |
| $100,000 to $149,999 | 42 (6.8%) | 94 (19.1%) |
| $150,000 or more | 32 (5.1%) | 94 (19.1%) |
| Total | 621 (100.0%) | 493 (100.0%) |
Property Value to Household Income Ratio in Bent County
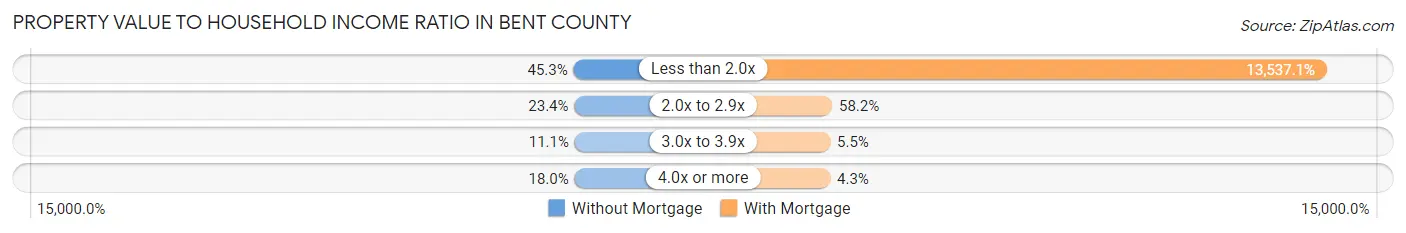
| Value-to-Income Ratio | Without Mortgage | With Mortgage |
| Less than 2.0x | 281 (45.3%) | 66,738 (13,537.1%) |
| 2.0x to 2.9x | 145 (23.4%) | 287 (58.2%) |
| 3.0x to 3.9x | 69 (11.1%) | 27 (5.5%) |
| 4.0x or more | 112 (18.0%) | 21 (4.3%) |
| Total | 621 (100.0%) | 493 (100.0%) |
Real Estate Taxes by Mortgage Status in Bent County
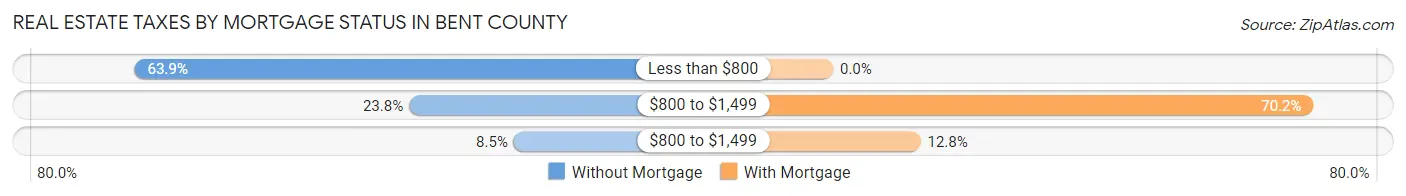
| Property Taxes | Without Mortgage | With Mortgage |
| Less than $800 | 397 (63.9%) | 0 (0.0%) |
| $800 to $1,499 | 148 (23.8%) | 346 (70.2%) |
| $800 to $1,499 | 53 (8.5%) | 63 (12.8%) |
| Total | 621 (100.0%) | 493 (100.0%) |
Health & Disability in Bent County
Health Insurance Coverage by Age in Bent County
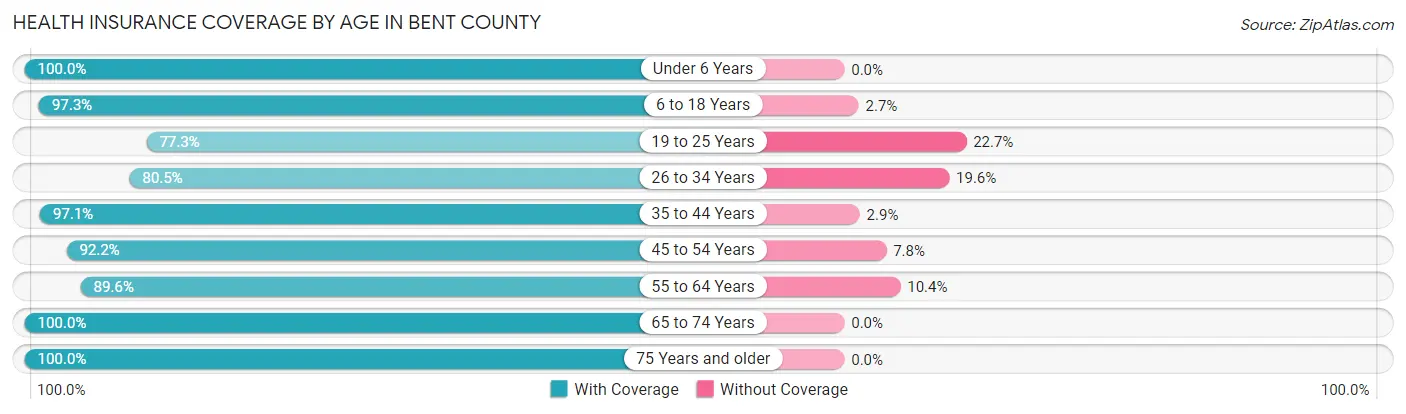
| Age Bracket | With Coverage | Without Coverage |
| Under 6 Years | 258 (100.0%) | 0 (0.0%) |
| 6 to 18 Years | 693 (97.3%) | 19 (2.7%) |
| 19 to 25 Years | 272 (77.3%) | 80 (22.7%) |
| 26 to 34 Years | 358 (80.4%) | 87 (19.6%) |
| 35 to 44 Years | 476 (97.1%) | 14 (2.9%) |
| 45 to 54 Years | 425 (92.2%) | 36 (7.8%) |
| 55 to 64 Years | 532 (89.6%) | 62 (10.4%) |
| 65 to 74 Years | 546 (100.0%) | 0 (0.0%) |
| 75 Years and older | 376 (100.0%) | 0 (0.0%) |
| Total | 3,936 (93.0%) | 298 (7.0%) |
Health Insurance Coverage by Citizenship Status in Bent County
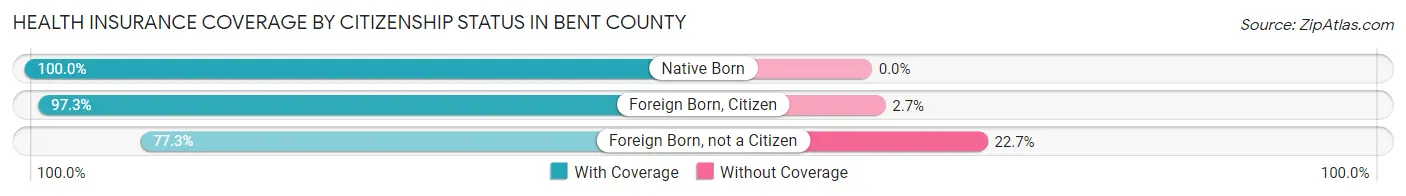
| Citizenship Status | With Coverage | Without Coverage |
| Native Born | 258 (100.0%) | 0 (0.0%) |
| Foreign Born, Citizen | 693 (97.3%) | 19 (2.7%) |
| Foreign Born, not a Citizen | 272 (77.3%) | 80 (22.7%) |
Health Insurance Coverage by Household Income in Bent County
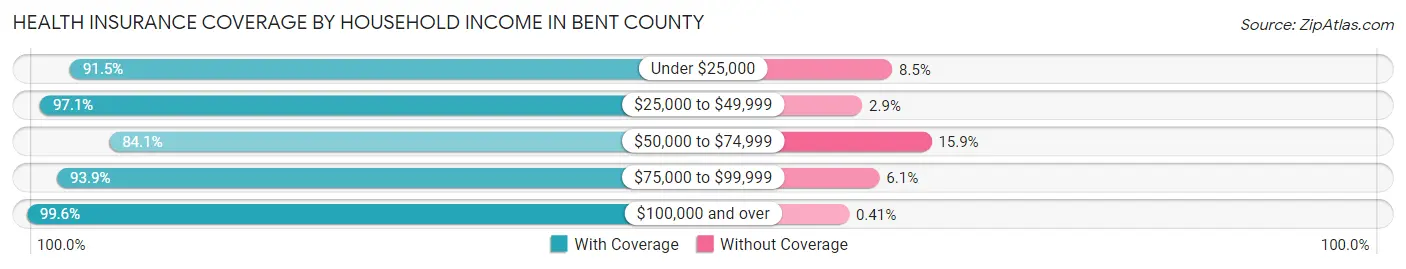
| Household Income | With Coverage | Without Coverage |
| Under $25,000 | 852 (91.5%) | 79 (8.5%) |
| $25,000 to $49,999 | 878 (97.1%) | 26 (2.9%) |
| $50,000 to $74,999 | 801 (84.1%) | 151 (15.9%) |
| $75,000 to $99,999 | 599 (93.9%) | 39 (6.1%) |
| $100,000 and over | 722 (99.6%) | 3 (0.4%) |
Public vs Private Health Insurance Coverage by Age in Bent County
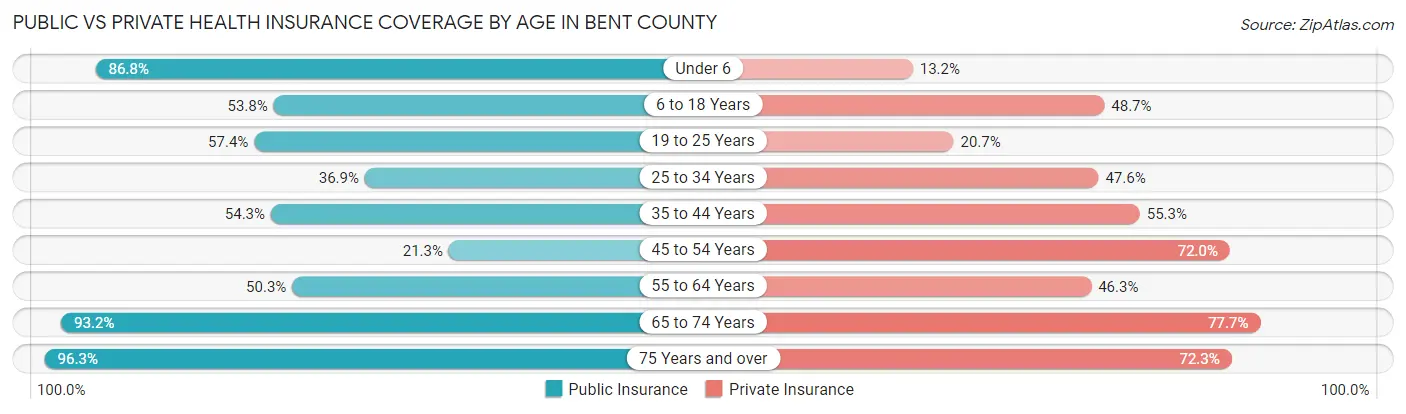
| Age Bracket | Public Insurance | Private Insurance |
| Under 6 | 224 (86.8%) | 34 (13.2%) |
| 6 to 18 Years | 383 (53.8%) | 347 (48.7%) |
| 19 to 25 Years | 202 (57.4%) | 73 (20.7%) |
| 25 to 34 Years | 164 (36.8%) | 212 (47.6%) |
| 35 to 44 Years | 266 (54.3%) | 271 (55.3%) |
| 45 to 54 Years | 98 (21.3%) | 332 (72.0%) |
| 55 to 64 Years | 299 (50.3%) | 275 (46.3%) |
| 65 to 74 Years | 509 (93.2%) | 424 (77.7%) |
| 75 Years and over | 362 (96.3%) | 272 (72.3%) |
| Total | 2,507 (59.2%) | 2,240 (52.9%) |
Disability Status by Sex by Age in Bent County
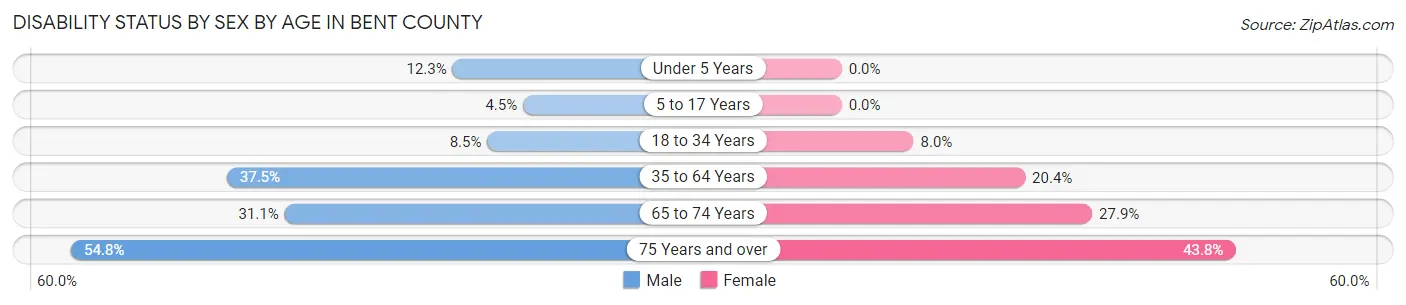
| Age Bracket | Male | Female |
| Under 5 Years | 19 (12.3%) | 0 (0.0%) |
| 5 to 17 Years | 15 (4.5%) | 0 (0.0%) |
| 18 to 34 Years | 41 (8.5%) | 28 (8.0%) |
| 35 to 64 Years | 278 (37.5%) | 164 (20.4%) |
| 65 to 74 Years | 86 (31.0%) | 75 (27.9%) |
| 75 Years and over | 91 (54.8%) | 92 (43.8%) |
Disability Class by Sex by Age in Bent County
Disability Class: Hearing Difficulty
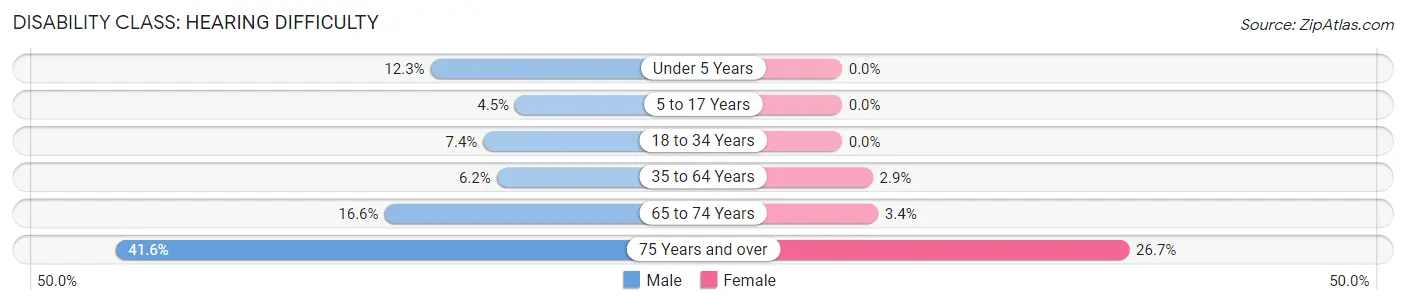
| Age Bracket | Male | Female |
| Under 5 Years | 19 (12.3%) | 0 (0.0%) |
| 5 to 17 Years | 15 (4.5%) | 0 (0.0%) |
| 18 to 34 Years | 36 (7.4%) | 0 (0.0%) |
| 35 to 64 Years | 46 (6.2%) | 23 (2.9%) |
| 65 to 74 Years | 46 (16.6%) | 9 (3.4%) |
| 75 Years and over | 69 (41.6%) | 56 (26.7%) |
Disability Class: Vision Difficulty
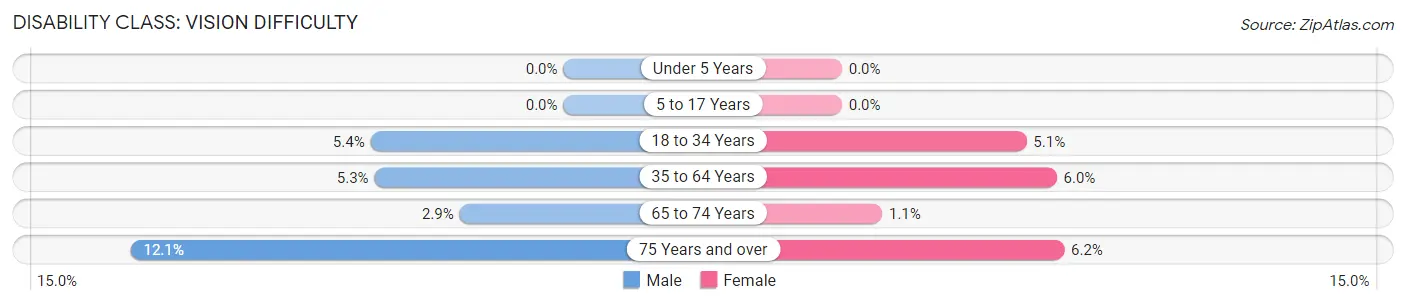
| Age Bracket | Male | Female |
| Under 5 Years | 0 (0.0%) | 0 (0.0%) |
| 5 to 17 Years | 0 (0.0%) | 0 (0.0%) |
| 18 to 34 Years | 26 (5.4%) | 18 (5.1%) |
| 35 to 64 Years | 39 (5.3%) | 48 (6.0%) |
| 65 to 74 Years | 8 (2.9%) | 3 (1.1%) |
| 75 Years and over | 20 (12.0%) | 13 (6.2%) |
Disability Class: Cognitive Difficulty
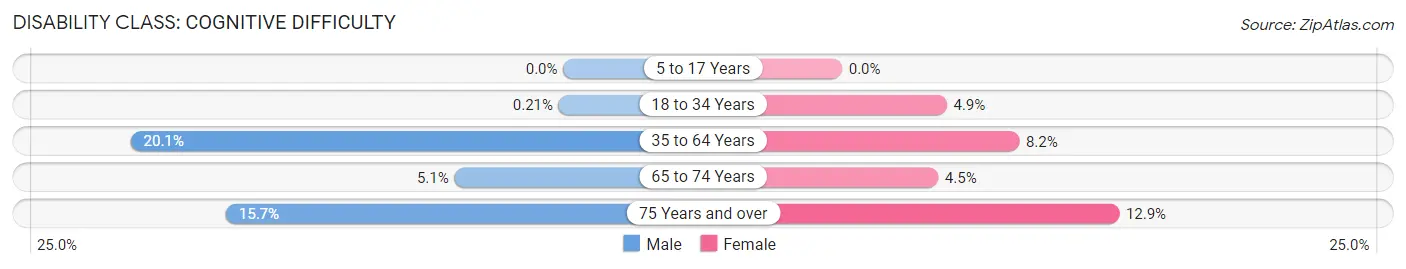
| Age Bracket | Male | Female |
| 5 to 17 Years | 0 (0.0%) | 0 (0.0%) |
| 18 to 34 Years | 1 (0.2%) | 17 (4.9%) |
| 35 to 64 Years | 149 (20.1%) | 66 (8.2%) |
| 65 to 74 Years | 14 (5.1%) | 12 (4.5%) |
| 75 Years and over | 26 (15.7%) | 27 (12.9%) |
Disability Class: Ambulatory Difficulty
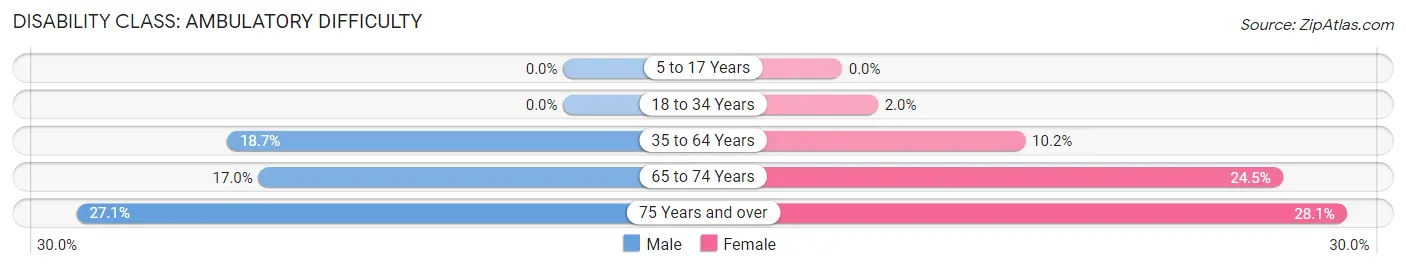
| Age Bracket | Male | Female |
| 5 to 17 Years | 0 (0.0%) | 0 (0.0%) |
| 18 to 34 Years | 0 (0.0%) | 7 (2.0%) |
| 35 to 64 Years | 139 (18.7%) | 82 (10.2%) |
| 65 to 74 Years | 47 (17.0%) | 66 (24.5%) |
| 75 Years and over | 45 (27.1%) | 59 (28.1%) |
Disability Class: Self-Care Difficulty
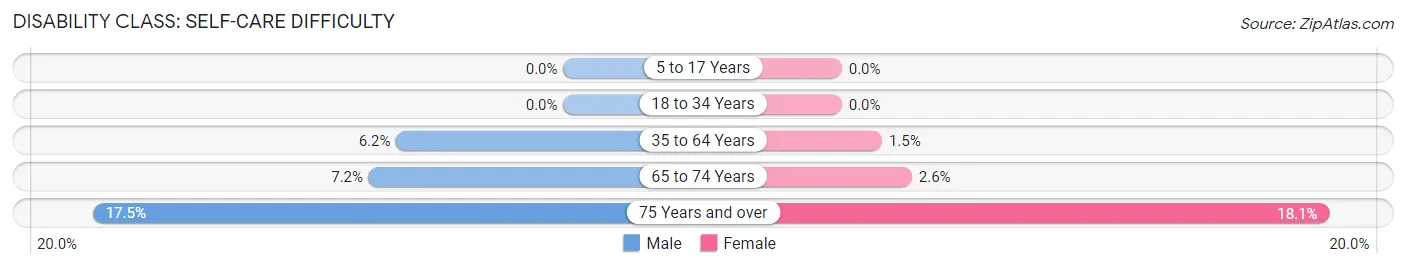
| Age Bracket | Male | Female |
| 5 to 17 Years | 0 (0.0%) | 0 (0.0%) |
| 18 to 34 Years | 0 (0.0%) | 0 (0.0%) |
| 35 to 64 Years | 46 (6.2%) | 12 (1.5%) |
| 65 to 74 Years | 20 (7.2%) | 7 (2.6%) |
| 75 Years and over | 29 (17.5%) | 38 (18.1%) |
Technology Access in Bent County
Computing Device Access in Bent County
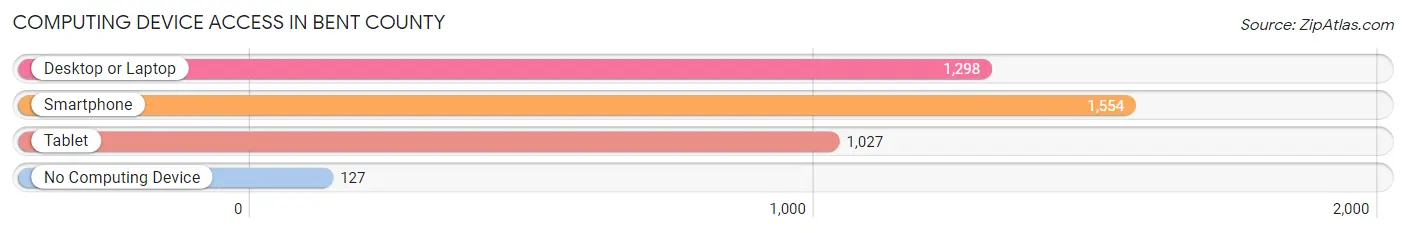
| Device Type | # Households | % Households |
| Desktop or Laptop | 1,298 | 71.8% |
| Smartphone | 1,554 | 86.0% |
| Tablet | 1,027 | 56.8% |
| No Computing Device | 127 | 7.0% |
| Total | 1,808 | 100.0% |
Internet Access in Bent County
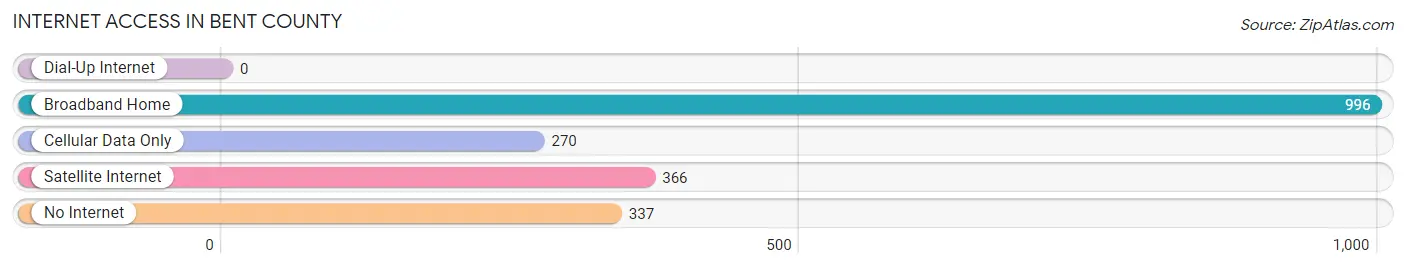
| Internet Type | # Households | % Households |
| Dial-Up Internet | 0 | 0.0% |
| Broadband Home | 996 | 55.1% |
| Cellular Data Only | 270 | 14.9% |
| Satellite Internet | 366 | 20.2% |
| No Internet | 337 | 18.6% |
| Total | 1,808 | 100.0% |
Bent County Summary
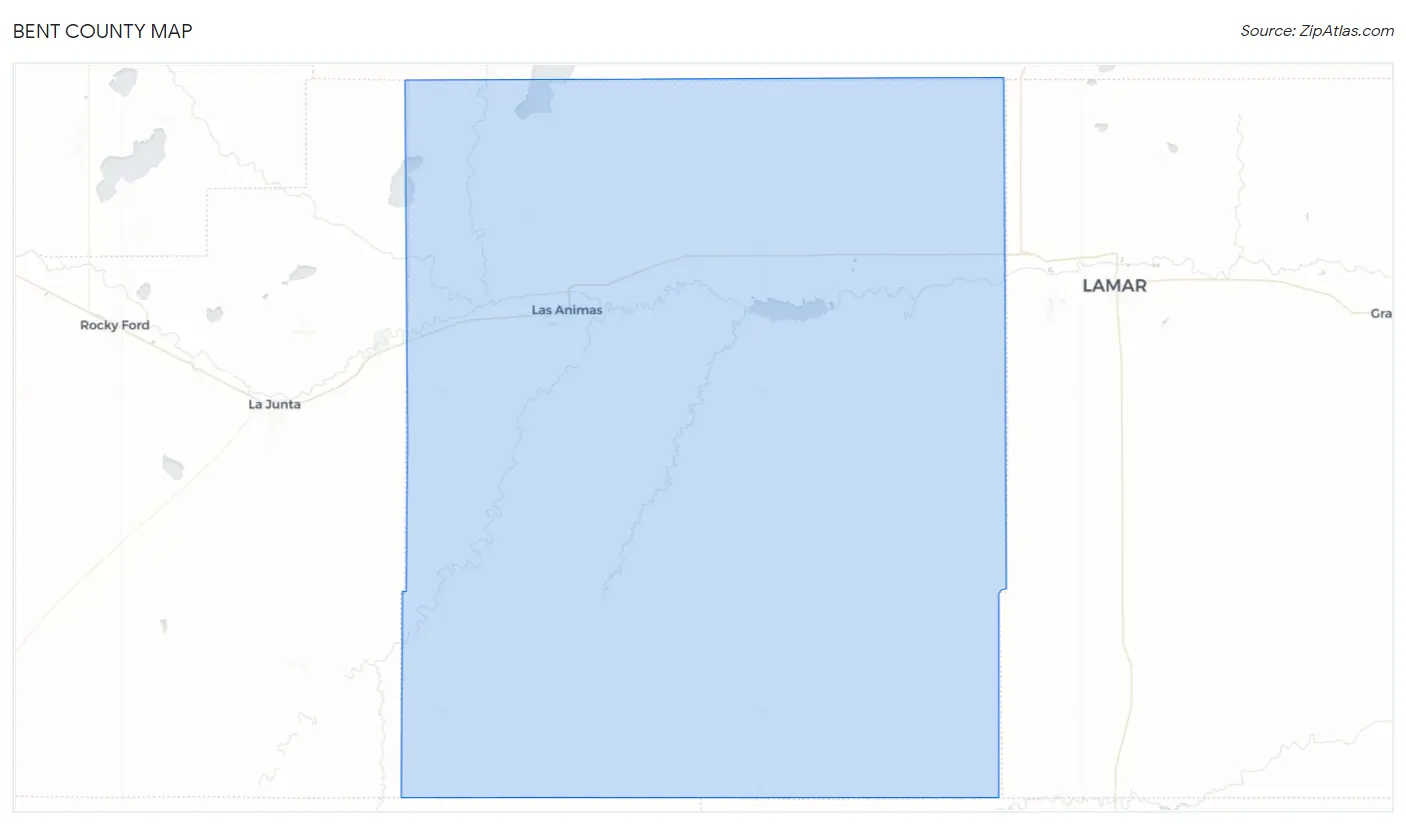
Bent County is located in the southeastern corner of Colorado, and is bordered by Kansas to the east, Oklahoma to the south, and New Mexico to the west. The county seat is Las Animas, and the county is named after William Bent, a prominent trader and trapper in the area. Bent County covers an area of 1,541 square miles, and has a population of 6,499 as of the 2010 census.
History
The area that is now Bent County was originally inhabited by the Cheyenne and Arapaho tribes. In 1803, the United States acquired the area as part of the Louisiana Purchase. In 1806, Zebulon Pike explored the area, and in 1819, the United States established the Bent’s Fort trading post. The fort was named after William Bent, a prominent trader and trapper in the area.
In 1861, Bent County was established as one of the original 17 counties of the Colorado Territory. The county was named after William Bent, and the county seat was established in Las Animas. The county was initially populated by settlers from the east, and the economy was based on agriculture and ranching.
In the late 19th century, the Santa Fe Railroad was built through the county, connecting it to the rest of the country. This led to an influx of new settlers and businesses, and the county’s population and economy began to grow.
In the early 20th century, the county’s economy shifted from agriculture to oil and gas production. This led to an economic boom in the county, and the population grew rapidly.
Geography
Bent County is located in the southeastern corner of Colorado, and is bordered by Kansas to the east, Oklahoma to the south, and New Mexico to the west. The county covers an area of 1,541 square miles, and has an average elevation of 4,000 feet.
The county is mostly flat, with some rolling hills in the western part of the county. The Arkansas River runs through the county, and there are several small lakes and reservoirs in the area. The county is mostly covered in grasslands, with some areas of scrubland and desert.
Economy
The economy of Bent County is largely based on agriculture and ranching. The county is home to several large farms and ranches, and the main crops grown in the area are wheat, corn, and hay.
The county is also home to several oil and gas production companies, and the county’s economy is heavily reliant on the oil and gas industry. The county is also home to several manufacturing companies, and the county’s economy is also supported by tourism.
Demographics
As of the 2010 census, Bent County had a population of 6,499. The racial makeup of the county was 79.2% White, 0.7% African American, 0.9% Native American, 0.3% Asian, 0.1% Pacific Islander, 16.2% from other races, and 2.7% from two or more races. Hispanic or Latino of any race were 33.2% of the population.
The median income for a household in the county was $35,938, and the median income for a family was $41,944. The per capita income for the county was $17,845. About 16.2% of families and 20.2% of the population were below the poverty line, including 28.2% of those under age 18 and 11.2% of those age 65 or over.
Bent County is a rural county with a diverse economy and population. The county is home to several large farms and ranches, and the oil and gas industry is a major contributor to the county’s economy. The county is also home to several manufacturing companies, and tourism is an important part of the county’s economy. The county’s population is diverse, with a mix of races and ethnicities.
Common Questions
What is Per Capita Income in Bent County?
Per Capita income in Bent County is $19,041.
What is the Median Family Income in Bent County?
Median Family Income in Bent County is $53,500.
What is the Median Household income in Bent County?
Median Household Income in Bent County is $45,776.
What is Income or Wage Gap in Bent County?
Income or Wage Gap in Bent County is 15.4%.
Women in Bent County earn 84.6 cents for every dollar earned by a man.
What is Family Income Deficit in Bent County?
Family Income Deficit in Bent County is $10,022.
Families that are below poverty line in Bent County earn $10,022 less on average than the poverty threshold level.
What is Inequality or Gini Index in Bent County?
Inequality or Gini Index in Bent County is 0.43.
What is the Total Population of Bent County?
Total Population of Bent County is 5,561.
What is the Total Male Population of Bent County?
Total Male Population of Bent County is 3,453.
What is the Total Female Population of Bent County?
Total Female Population of Bent County is 2,108.
What is the Ratio of Males per 100 Females in Bent County?
There are 163.80 Males per 100 Females in Bent County.
What is the Ratio of Females per 100 Males in Bent County?
There are 61.05 Females per 100 Males in Bent County.
What is the Median Population Age in Bent County?
Median Population Age in Bent County is 40.7 Years.
What is the Average Family Size in Bent County
Average Family Size in Bent County is 3.0 People.
What is the Average Household Size in Bent County
Average Household Size in Bent County is 2.3 People.
How Large is the Labor Force in Bent County?
There are 1,782 People in the Labor Forcein in Bent County.
What is the Percentage of People in the Labor Force in Bent County?
37.5% of People are in the Labor Force in Bent County.
What is the Unemployment Rate in Bent County?
Unemployment Rate in Bent County is 5.5%.