Baca County, CO Map & Demographics
Baca County Map
Baca County Overview
$28,115
PER CAPITA INCOME
$65,735
AVG FAMILY INCOME
$42,115
AVG HOUSEHOLD INCOME
28.9%
WAGE / INCOME GAP [ % ]
71.1¢/ $1
WAGE / INCOME GAP [ $ ]
$6,955
FAMILY INCOME DEFICIT
0.49
INEQUALITY / GINI INDEX
3,496
TOTAL POPULATION
1,731
MALE POPULATION
1,765
FEMALE POPULATION
98.07
MALES / 100 FEMALES
101.96
FEMALES / 100 MALES
42.0
MEDIAN AGE
2.9
AVG FAMILY SIZE
2.1
AVG HOUSEHOLD SIZE
1,519
LABOR FORCE [ PEOPLE ]
54.6%
PERCENT IN LABOR FORCE
1.7%
UNEMPLOYMENT RATE
Baca County Area Codes
Income in Baca County
Income Overview in Baca County
Per Capita Income in Baca County is $28,115, while median incomes of families and households are $65,735 and $42,115 respectively.
| Characteristic | Number | Measure |
| Per Capita Income | 3,496 | $28,115 |
| Median Family Income | 910 | $65,735 |
| Mean Family Income | 910 | $86,463 |
| Median Household Income | 1,586 | $42,115 |
| Mean Household Income | 1,586 | $63,674 |
| Income Deficit | 910 | $6,955 |
| Wage / Income Gap (%) | 3,496 | 28.86% |
| Wage / Income Gap ($) | 3,496 | 71.14¢ per $1 |
| Gini / Inequality Index | 3,496 | 0.49 |
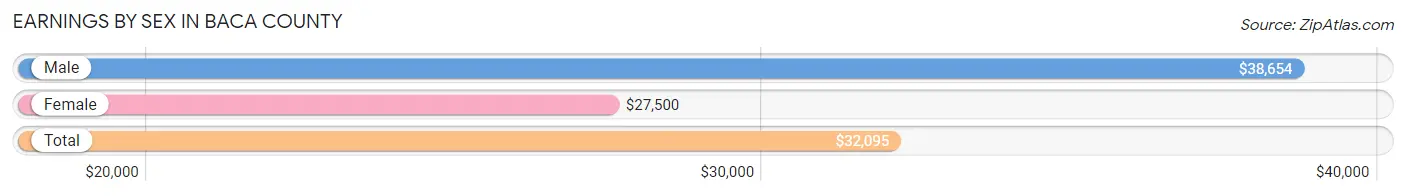
Earnings by Sex in Baca County
Average Earnings in Baca County are $32,095, $38,654 for men and $27,500 for women, a difference of 28.9%.
| Sex | Number | Average Earnings |
| Male | 878 (52.8%) | $38,654 |
| Female | 786 (47.2%) | $27,500 |
| Total | 1,664 (100.0%) | $32,095 |
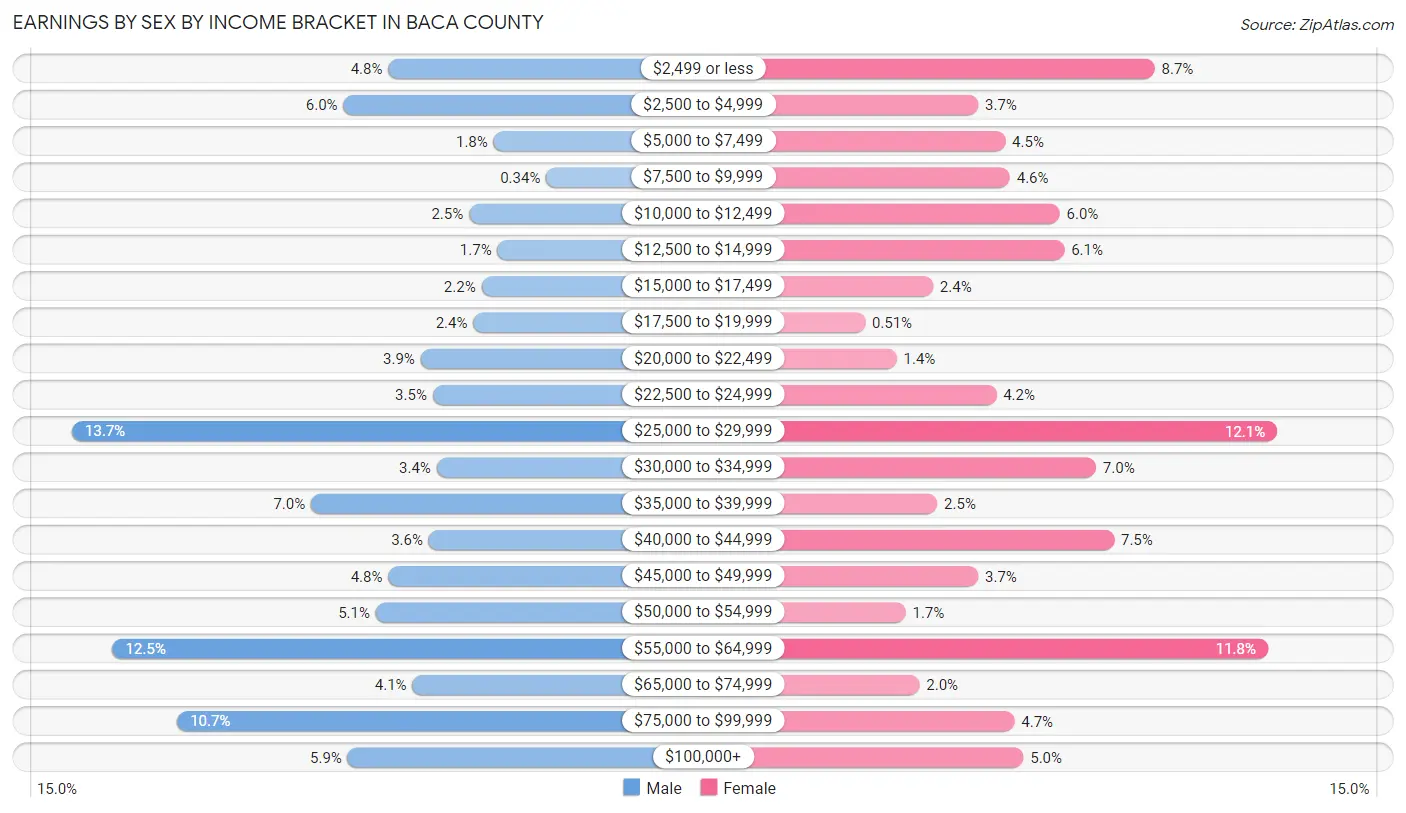
Earnings by Sex by Income Bracket in Baca County
The most common earnings brackets in Baca County are $25,000 to $29,999 for men (120 | 13.7%) and $25,000 to $29,999 for women (95 | 12.1%).
| Income | Male | Female |
| $2,499 or less | 42 (4.8%) | 68 (8.6%) |
| $2,500 to $4,999 | 53 (6.0%) | 29 (3.7%) |
| $5,000 to $7,499 | 16 (1.8%) | 35 (4.4%) |
| $7,500 to $9,999 | 3 (0.3%) | 36 (4.6%) |
| $10,000 to $12,499 | 22 (2.5%) | 47 (6.0%) |
| $12,500 to $14,999 | 15 (1.7%) | 48 (6.1%) |
| $15,000 to $17,499 | 19 (2.2%) | 19 (2.4%) |
| $17,500 to $19,999 | 21 (2.4%) | 4 (0.5%) |
| $20,000 to $22,499 | 34 (3.9%) | 11 (1.4%) |
| $22,500 to $24,999 | 31 (3.5%) | 33 (4.2%) |
| $25,000 to $29,999 | 120 (13.7%) | 95 (12.1%) |
| $30,000 to $34,999 | 30 (3.4%) | 55 (7.0%) |
| $35,000 to $39,999 | 61 (7.0%) | 20 (2.5%) |
| $40,000 to $44,999 | 32 (3.6%) | 59 (7.5%) |
| $45,000 to $49,999 | 42 (4.8%) | 29 (3.7%) |
| $50,000 to $54,999 | 45 (5.1%) | 13 (1.7%) |
| $55,000 to $64,999 | 110 (12.5%) | 93 (11.8%) |
| $65,000 to $74,999 | 36 (4.1%) | 16 (2.0%) |
| $75,000 to $99,999 | 94 (10.7%) | 37 (4.7%) |
| $100,000+ | 52 (5.9%) | 39 (5.0%) |
| Total | 878 (100.0%) | 786 (100.0%) |
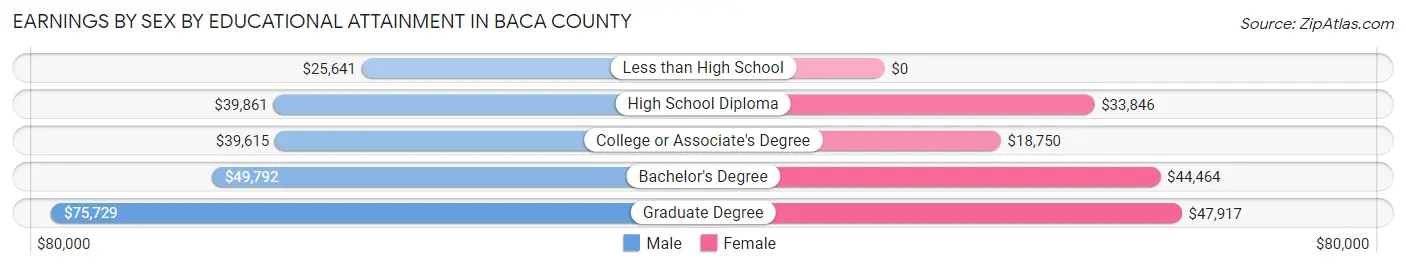
Earnings by Sex by Educational Attainment in Baca County
Average earnings in Baca County are $39,889 for men and $29,844 for women, a difference of 25.2%. Men with an educational attainment of graduate degree enjoy the highest average annual earnings of $75,729, while those with less than high school education earn the least with $25,641. Women with an educational attainment of graduate degree earn the most with the average annual earnings of $47,917, while those with college or associate's degree education have the smallest earnings of $18,750.
| Educational Attainment | Male Income | Female Income |
| Less than High School | $25,641 | $0 |
| High School Diploma | $39,861 | $33,846 |
| College or Associate's Degree | $39,615 | $18,750 |
| Bachelor's Degree | $49,792 | $44,464 |
| Graduate Degree | $75,729 | $47,917 |
| Total | $39,889 | $29,844 |
Family Income in Baca County
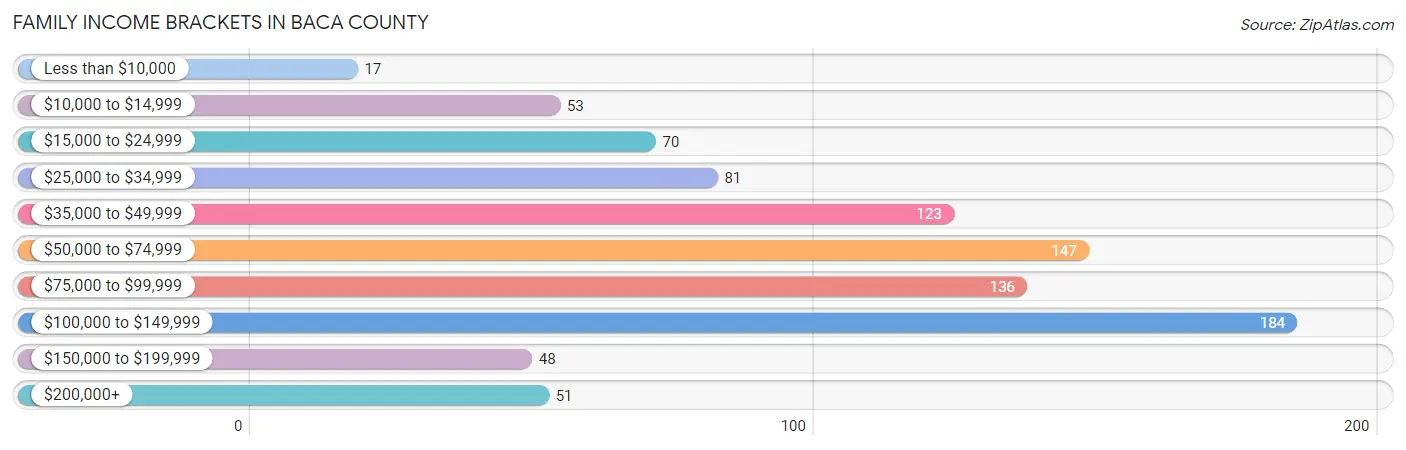
Family Income Brackets in Baca County
According to the Baca County family income data, there are 184 families falling into the $100,000 to $149,999 income range, which is the most common income bracket and makes up 20.2% of all families. Conversely, the less than $10,000 income bracket is the least frequent group with only 17 families (1.9%) belonging to this category.
| Income Bracket | # Families | % Families |
| Less than $10,000 | 17 | 1.9% |
| $10,000 to $14,999 | 53 | 5.8% |
| $15,000 to $24,999 | 70 | 7.7% |
| $25,000 to $34,999 | 81 | 8.9% |
| $35,000 to $49,999 | 123 | 13.5% |
| $50,000 to $74,999 | 147 | 16.2% |
| $75,000 to $99,999 | 136 | 14.9% |
| $100,000 to $149,999 | 184 | 20.2% |
| $150,000 to $199,999 | 48 | 5.3% |
| $200,000+ | 51 | 5.6% |
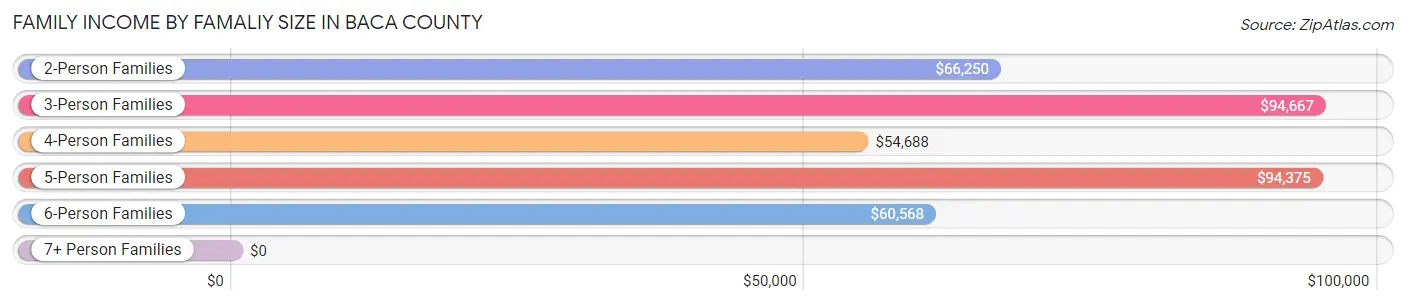
Family Income by Famaliy Size in Baca County
3-person families (172 | 18.9%) account for the highest median family income in Baca County with $94,667 per family, while 2-person families (468 | 51.4%) have the highest median income of $33,125 per family member.
| Income Bracket | # Families | Median Income |
| 2-Person Families | 468 (51.4%) | $66,250 |
| 3-Person Families | 172 (18.9%) | $94,667 |
| 4-Person Families | 140 (15.4%) | $54,688 |
| 5-Person Families | 83 (9.1%) | $94,375 |
| 6-Person Families | 23 (2.5%) | $60,568 |
| 7+ Person Families | 24 (2.6%) | $0 |
| Total | 910 (100.0%) | $65,735 |
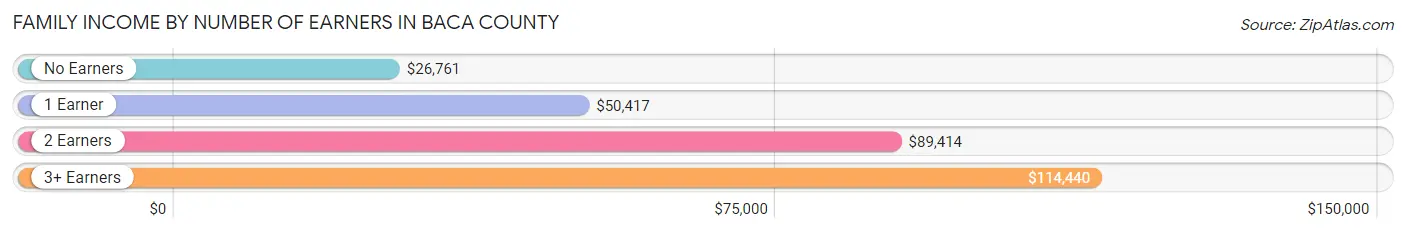
Family Income by Number of Earners in Baca County
The median family income in Baca County is $65,735, with families comprising 3+ earners (81) having the highest median family income of $114,440, while families with no earners (161) have the lowest median family income of $26,761, accounting for 8.9% and 17.7% of families, respectively.
| Number of Earners | # Families | Median Income |
| No Earners | 161 (17.7%) | $26,761 |
| 1 Earner | 271 (29.8%) | $50,417 |
| 2 Earners | 397 (43.6%) | $89,414 |
| 3+ Earners | 81 (8.9%) | $114,440 |
| Total | 910 (100.0%) | $65,735 |
Household Income in Baca County
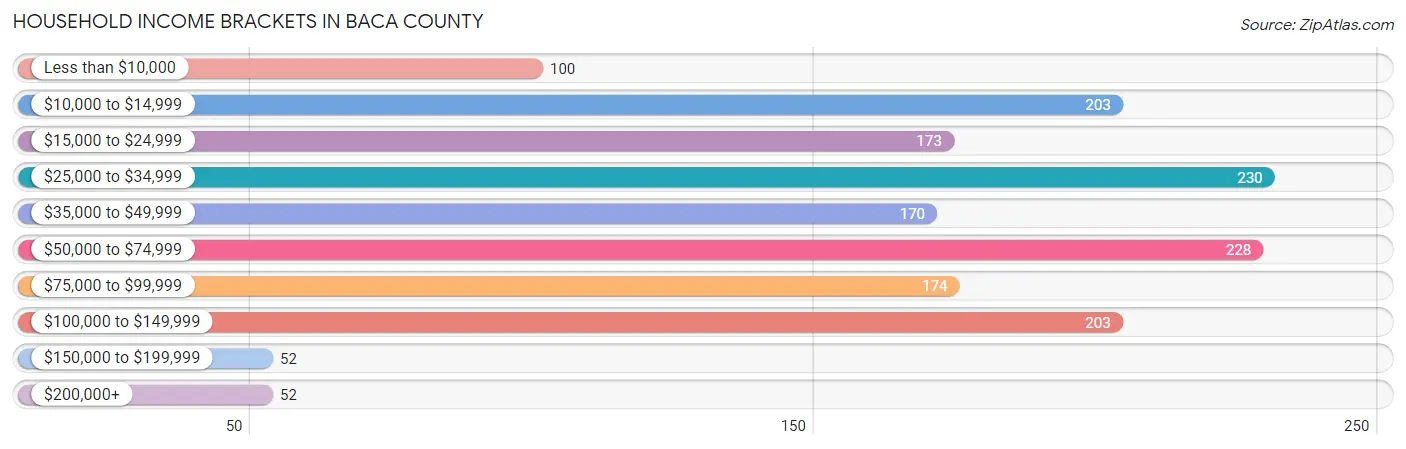
Household Income Brackets in Baca County
With 230 households falling in the category, the $25,000 to $34,999 income range is the most frequent in Baca County, accounting for 14.5% of all households. In contrast, only 52 households (3.3%) fall into the $150,000 to $199,999 income bracket, making it the least populous group.
| Income Bracket | # Households | % Households |
| Less than $10,000 | 100 | 6.3% |
| $10,000 to $14,999 | 203 | 12.8% |
| $15,000 to $24,999 | 173 | 10.9% |
| $25,000 to $34,999 | 230 | 14.5% |
| $35,000 to $49,999 | 170 | 10.7% |
| $50,000 to $74,999 | 228 | 14.4% |
| $75,000 to $99,999 | 174 | 11.0% |
| $100,000 to $149,999 | 203 | 12.8% |
| $150,000 to $199,999 | 52 | 3.3% |
| $200,000+ | 52 | 3.3% |
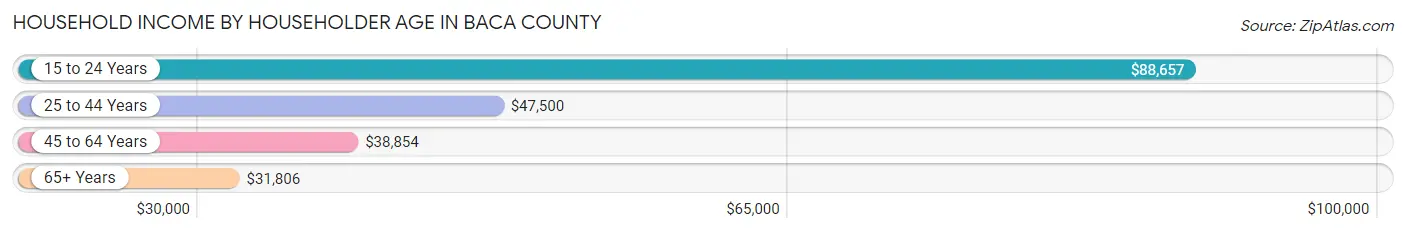
Household Income by Householder Age in Baca County
The median household income in Baca County is $42,115, with the highest median household income of $88,657 found in the 15 to 24 years age bracket for the primary householder. A total of 59 households (3.7%) fall into this category. Meanwhile, the 65+ years age bracket for the primary householder has the lowest median household income of $31,806, with 556 households (35.1%) in this group.
| Income Bracket | # Households | Median Income |
| 15 to 24 Years | 59 (3.7%) | $88,657 |
| 25 to 44 Years | 504 (31.8%) | $47,500 |
| 45 to 64 Years | 467 (29.4%) | $38,854 |
| 65+ Years | 556 (35.1%) | $31,806 |
| Total | 1,586 (100.0%) | $42,115 |
Poverty in Baca County
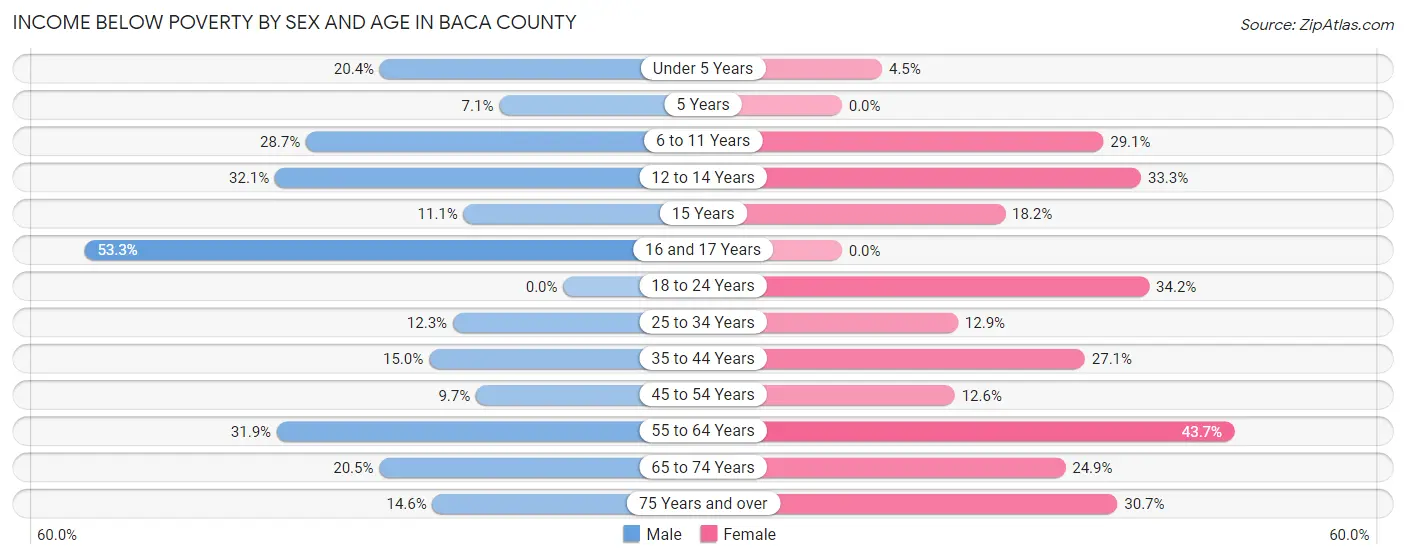
Income Below Poverty by Sex and Age in Baca County
With 19.4% poverty level for males and 26.6% for females among the residents of Baca County, 16 and 17 year old males and 55 to 64 year old females are the most vulnerable to poverty, with 24 males (53.3%) and 117 females (43.7%) in their respective age groups living below the poverty level.
| Age Bracket | Male | Female |
| Under 5 Years | 19 (20.4%) | 3 (4.5%) |
| 5 Years | 1 (7.1%) | 0 (0.0%) |
| 6 to 11 Years | 45 (28.7%) | 53 (29.1%) |
| 12 to 14 Years | 26 (32.1%) | 16 (33.3%) |
| 15 Years | 3 (11.1%) | 2 (18.2%) |
| 16 and 17 Years | 24 (53.3%) | 0 (0.0%) |
| 18 to 24 Years | 0 (0.0%) | 38 (34.2%) |
| 25 to 34 Years | 23 (12.3%) | 19 (12.9%) |
| 35 to 44 Years | 38 (15.0%) | 72 (27.1%) |
| 45 to 54 Years | 14 (9.7%) | 20 (12.6%) |
| 55 to 64 Years | 67 (31.9%) | 117 (43.7%) |
| 65 to 74 Years | 41 (20.5%) | 56 (24.9%) |
| 75 Years and over | 22 (14.6%) | 62 (30.7%) |
| Total | 323 (19.4%) | 458 (26.6%) |
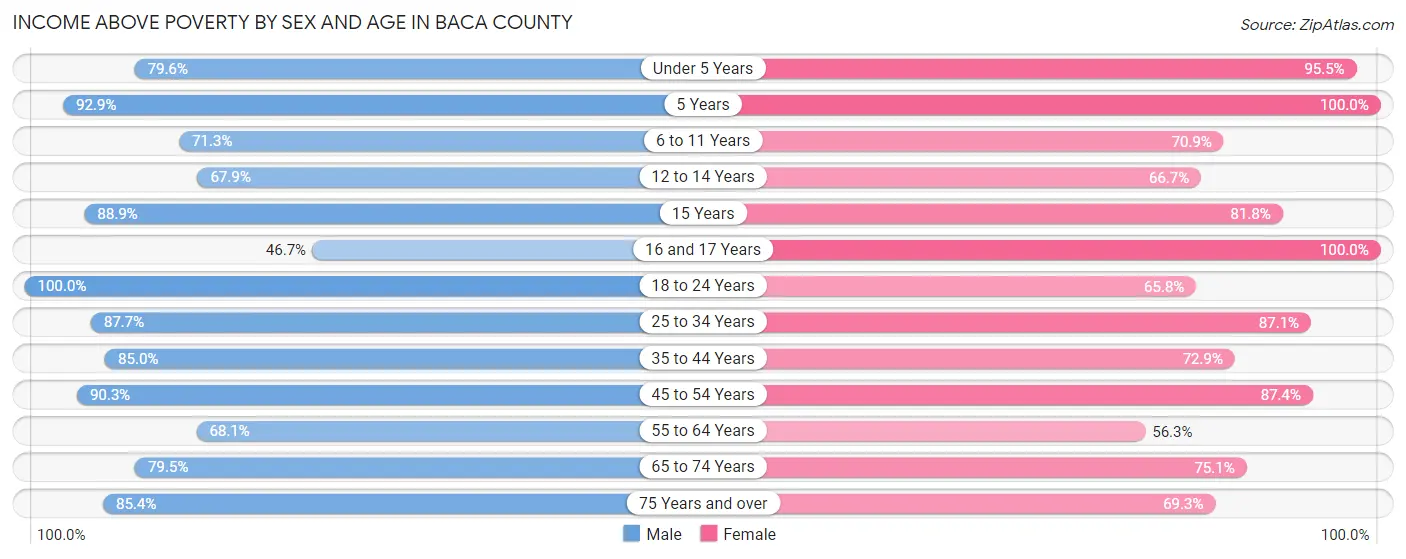
Income Above Poverty by Sex and Age in Baca County
According to the poverty statistics in Baca County, males aged 18 to 24 years and females aged 5 years are the age groups that are most secure financially, with 100.0% of males and 100.0% of females in these age groups living above the poverty line.
| Age Bracket | Male | Female |
| Under 5 Years | 74 (79.6%) | 64 (95.5%) |
| 5 Years | 13 (92.9%) | 21 (100.0%) |
| 6 to 11 Years | 112 (71.3%) | 129 (70.9%) |
| 12 to 14 Years | 55 (67.9%) | 32 (66.7%) |
| 15 Years | 24 (88.9%) | 9 (81.8%) |
| 16 and 17 Years | 21 (46.7%) | 18 (100.0%) |
| 18 to 24 Years | 103 (100.0%) | 73 (65.8%) |
| 25 to 34 Years | 164 (87.7%) | 128 (87.1%) |
| 35 to 44 Years | 216 (85.0%) | 194 (72.9%) |
| 45 to 54 Years | 130 (90.3%) | 139 (87.4%) |
| 55 to 64 Years | 143 (68.1%) | 151 (56.3%) |
| 65 to 74 Years | 159 (79.5%) | 169 (75.1%) |
| 75 Years and over | 129 (85.4%) | 140 (69.3%) |
| Total | 1,343 (80.6%) | 1,267 (73.5%) |
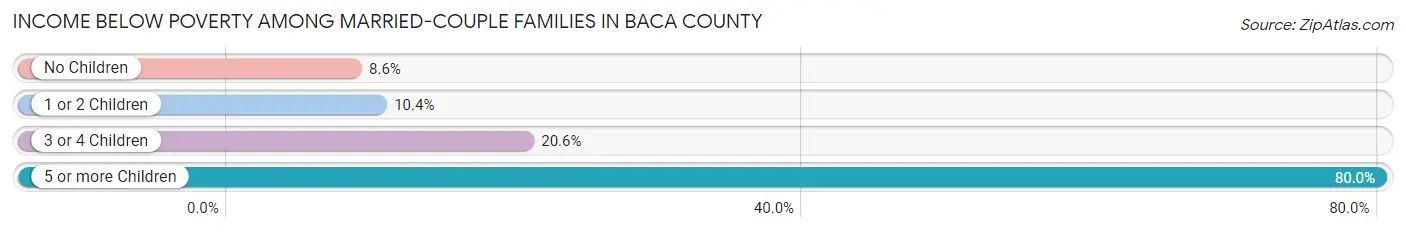
Income Below Poverty Among Married-Couple Families in Baca County
The poverty statistics for married-couple families in Baca County show that 12.1% or 90 of the total 742 families live below the poverty line. Families with 5 or more children have the highest poverty rate of 80.0%, comprising of 16 families. On the other hand, families with no children have the lowest poverty rate of 8.6%, which includes 37 families.
| Children | Above Poverty | Below Poverty |
| No Children | 391 (91.4%) | 37 (8.6%) |
| 1 or 2 Children | 207 (89.6%) | 24 (10.4%) |
| 3 or 4 Children | 50 (79.4%) | 13 (20.6%) |
| 5 or more Children | 4 (20.0%) | 16 (80.0%) |
| Total | 652 (87.9%) | 90 (12.1%) |
Income Below Poverty Among Single-Parent Households in Baca County
According to the poverty data in Baca County, 20.3% or 14 single-father households and 35.3% or 35 single-mother households are living below the poverty line. Among single-father households, those with no children have the highest poverty rate, with 12 households (25.0%) experiencing poverty. Likewise, among single-mother households, those with 1 or 2 children have the highest poverty rate, with 35 households (57.4%) falling below the poverty line.
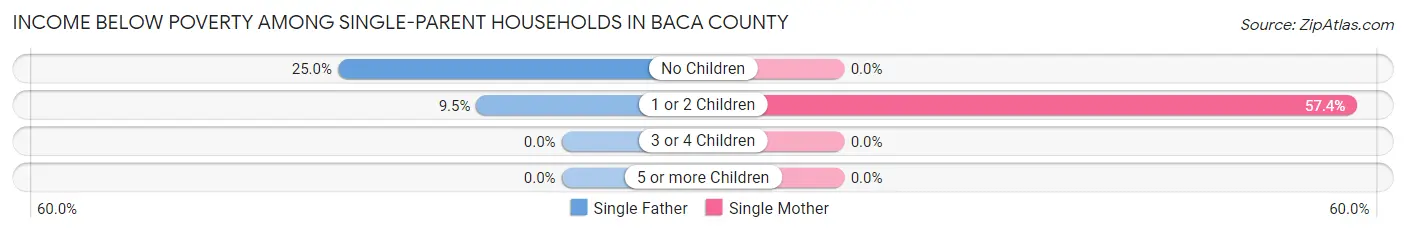
| Children | Single Father | Single Mother |
| No Children | 12 (25.0%) | 0 (0.0%) |
| 1 or 2 Children | 2 (9.5%) | 35 (57.4%) |
| 3 or 4 Children | 0 (0.0%) | 0 (0.0%) |
| 5 or more Children | 0 (0.0%) | 0 (0.0%) |
| Total | 14 (20.3%) | 35 (35.3%) |
Income Below Poverty Among Married-Couple vs Single-Parent Households in Baca County
The poverty data for Baca County shows that 90 of the married-couple family households (12.1%) and 49 of the single-parent households (29.2%) are living below the poverty level. Within the married-couple family households, those with 5 or more children have the highest poverty rate, with 16 households (80.0%) falling below the poverty line. Among the single-parent households, those with 1 or 2 children have the highest poverty rate, with 37 household (45.1%) living below poverty.
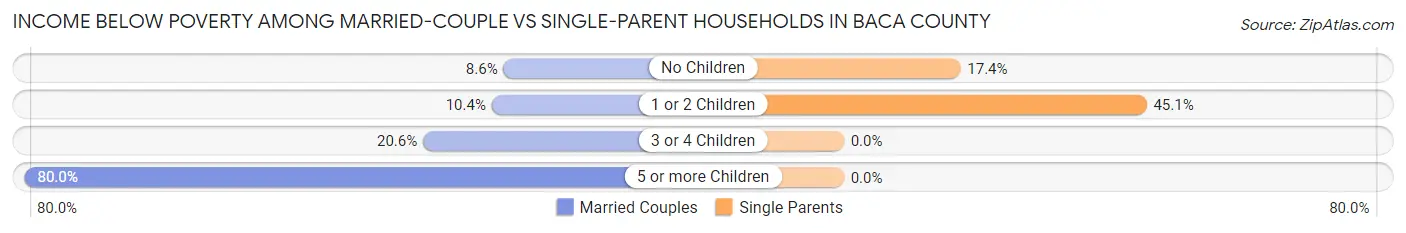
| Children | Married-Couple Families | Single-Parent Households |
| No Children | 37 (8.6%) | 12 (17.4%) |
| 1 or 2 Children | 24 (10.4%) | 37 (45.1%) |
| 3 or 4 Children | 13 (20.6%) | 0 (0.0%) |
| 5 or more Children | 16 (80.0%) | 0 (0.0%) |
| Total | 90 (12.1%) | 49 (29.2%) |
Race in Baca County
The most populous races in Baca County are White / Caucasian (3,159 | 90.4%), Hispanic or Latino (422 | 12.1%), and Two or more Races (130 | 3.7%).
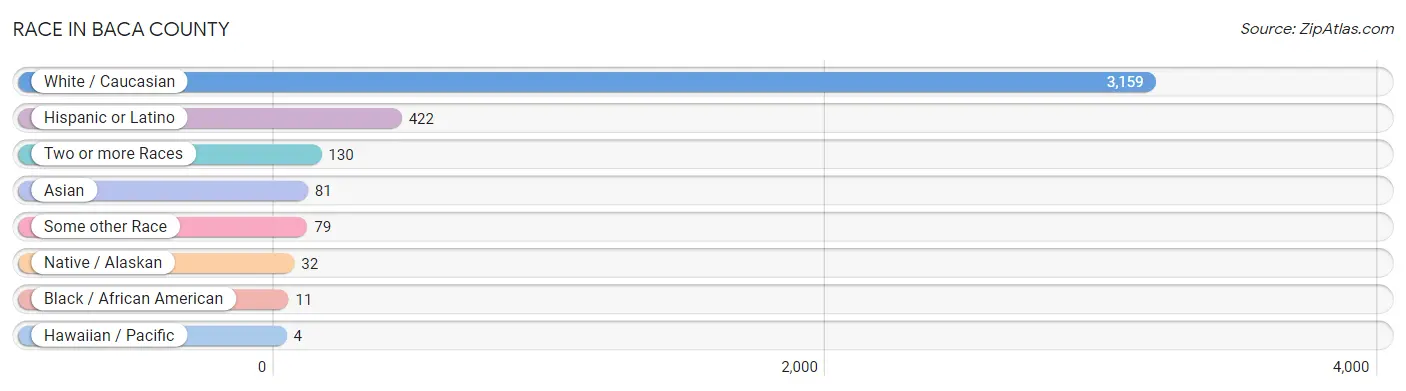
| Race | # Population | % Population |
| Asian | 81 | 2.3% |
| Black / African American | 11 | 0.3% |
| Hawaiian / Pacific | 4 | 0.1% |
| Hispanic or Latino | 422 | 12.1% |
| Native / Alaskan | 32 | 0.9% |
| White / Caucasian | 3,159 | 90.4% |
| Two or more Races | 130 | 3.7% |
| Some other Race | 79 | 2.3% |
| Total | 3,496 | 100.0% |
Ancestry in Baca County
The most populous ancestries reported in Baca County are German (545 | 15.6%), English (453 | 13.0%), Mexican (387 | 11.1%), Irish (320 | 9.1%), and American (206 | 5.9%), together accounting for 54.7% of all Baca County residents.
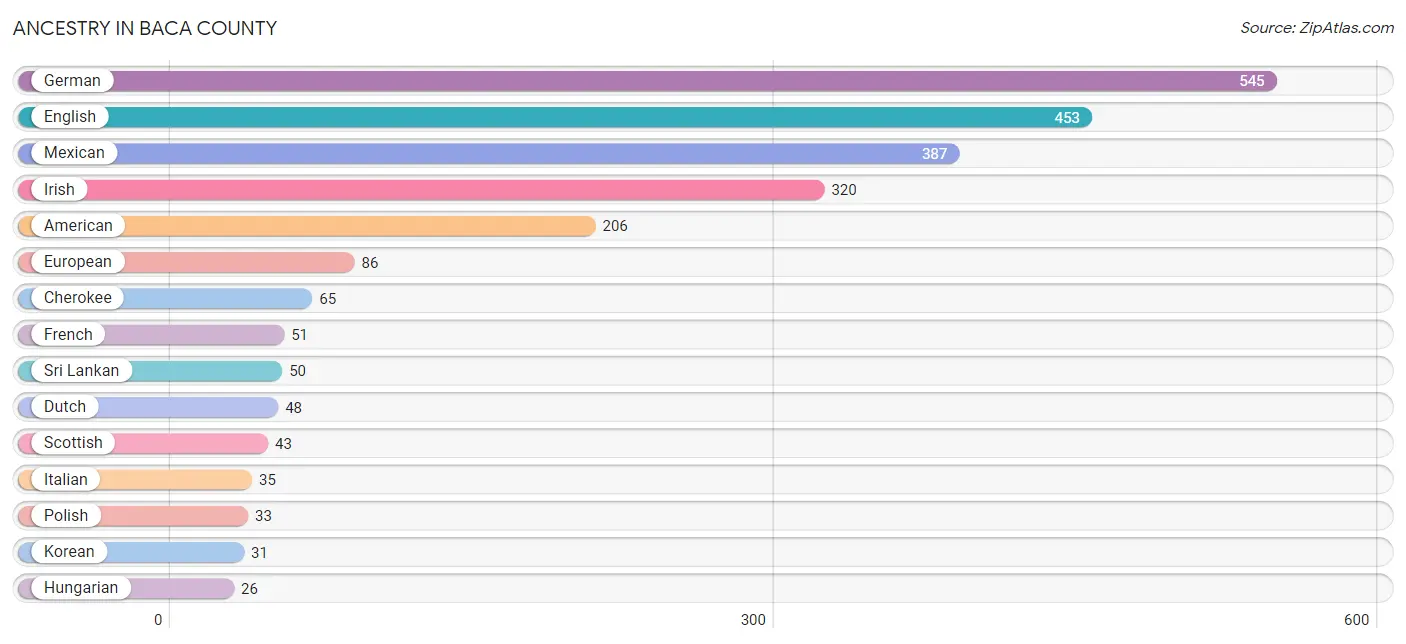
| Ancestry | # Population | % Population |
| American | 206 | 5.9% |
| Apache | 18 | 0.5% |
| Australian | 17 | 0.5% |
| British | 4 | 0.1% |
| Celtic | 3 | 0.1% |
| Cherokee | 65 | 1.9% |
| Choctaw | 1 | 0.0% |
| Danish | 5 | 0.1% |
| Dutch | 48 | 1.4% |
| Dutch West Indian | 3 | 0.1% |
| English | 453 | 13.0% |
| European | 86 | 2.5% |
| French | 51 | 1.5% |
| French Canadian | 3 | 0.1% |
| German | 545 | 15.6% |
| Hungarian | 26 | 0.7% |
| Irish | 320 | 9.1% |
| Italian | 35 | 1.0% |
| Korean | 31 | 0.9% |
| Mexican | 387 | 11.1% |
| Native Hawaiian | 4 | 0.1% |
| Navajo | 2 | 0.1% |
| Norwegian | 26 | 0.7% |
| Osage | 12 | 0.3% |
| Pennsylvania German | 9 | 0.3% |
| Polish | 33 | 0.9% |
| Potawatomi | 18 | 0.5% |
| Russian | 11 | 0.3% |
| Scandinavian | 23 | 0.7% |
| Scotch-Irish | 9 | 0.3% |
| Scottish | 43 | 1.2% |
| Spaniard | 9 | 0.3% |
| Spanish | 7 | 0.2% |
| Sri Lankan | 50 | 1.4% |
| Swedish | 25 | 0.7% |
| Ukrainian | 4 | 0.1% |
| Welsh | 8 | 0.2% | View All 37 Rows |
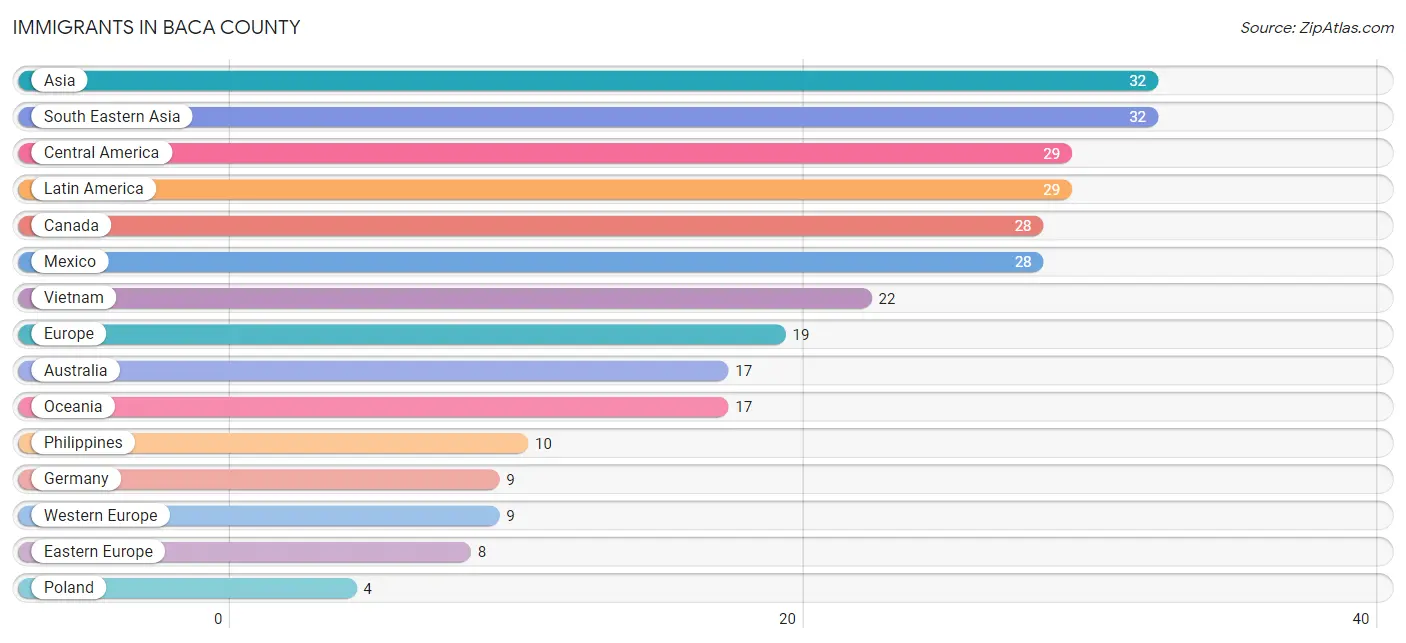
Immigrants in Baca County
The most numerous immigrant groups reported in Baca County came from Asia (32 | 0.9%), South Eastern Asia (32 | 0.9%), Central America (29 | 0.8%), Latin America (29 | 0.8%), and Canada (28 | 0.8%), together accounting for 4.3% of all Baca County residents.
| Immigration Origin | # Population | % Population |
| Asia | 32 | 0.9% |
| Australia | 17 | 0.5% |
| Canada | 28 | 0.8% |
| Central America | 29 | 0.8% |
| Eastern Europe | 8 | 0.2% |
| El Salvador | 1 | 0.0% |
| England | 2 | 0.1% |
| Europe | 19 | 0.5% |
| Germany | 9 | 0.3% |
| Latin America | 29 | 0.8% |
| Mexico | 28 | 0.8% |
| Northern Europe | 2 | 0.1% |
| Oceania | 17 | 0.5% |
| Philippines | 10 | 0.3% |
| Poland | 4 | 0.1% |
| South Eastern Asia | 32 | 0.9% |
| Ukraine | 4 | 0.1% |
| Vietnam | 22 | 0.6% |
| Western Europe | 9 | 0.3% | View All 19 Rows |
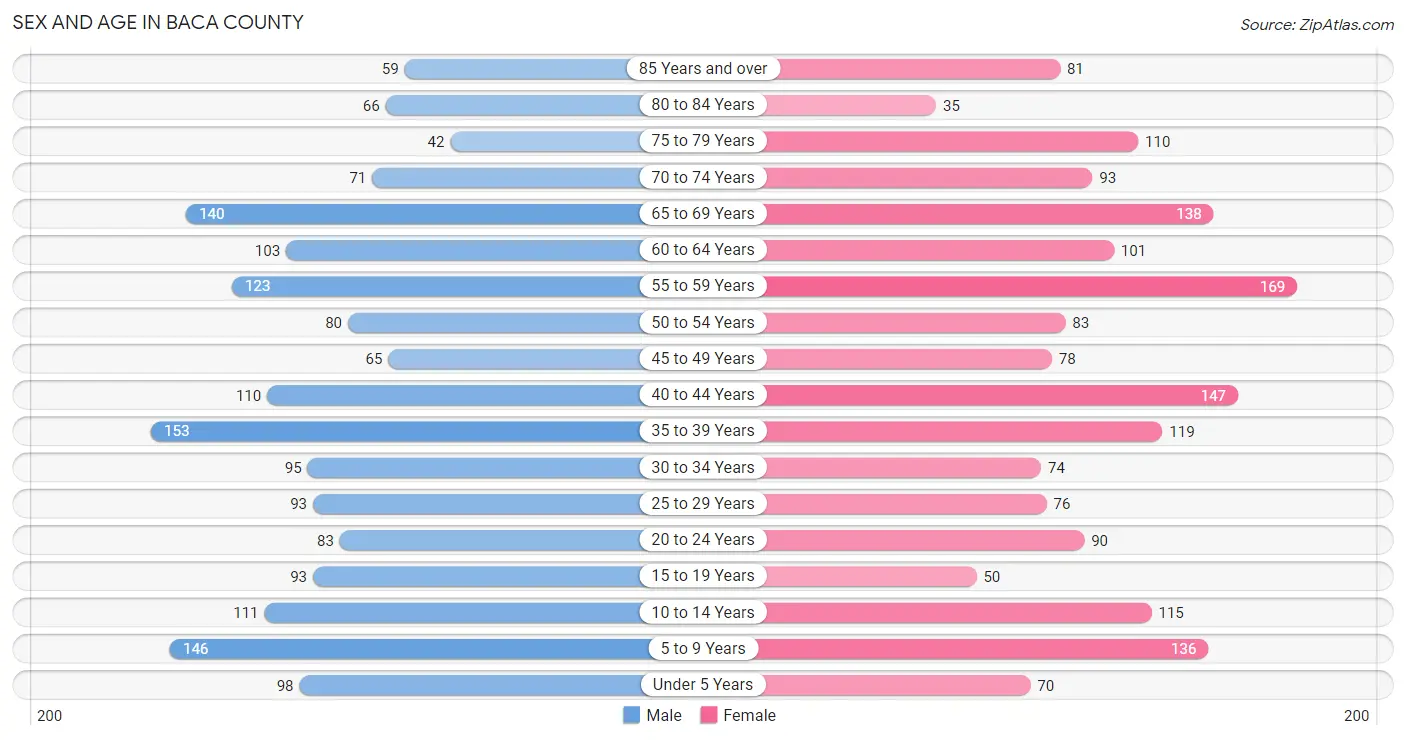
Sex and Age in Baca County
Sex and Age in Baca County
The most populous age groups in Baca County are 35 to 39 Years (153 | 8.8%) for men and 55 to 59 Years (169 | 9.6%) for women.
| Age Bracket | Male | Female |
| Under 5 Years | 98 (5.7%) | 70 (4.0%) |
| 5 to 9 Years | 146 (8.4%) | 136 (7.7%) |
| 10 to 14 Years | 111 (6.4%) | 115 (6.5%) |
| 15 to 19 Years | 93 (5.4%) | 50 (2.8%) |
| 20 to 24 Years | 83 (4.8%) | 90 (5.1%) |
| 25 to 29 Years | 93 (5.4%) | 76 (4.3%) |
| 30 to 34 Years | 95 (5.5%) | 74 (4.2%) |
| 35 to 39 Years | 153 (8.8%) | 119 (6.7%) |
| 40 to 44 Years | 110 (6.4%) | 147 (8.3%) |
| 45 to 49 Years | 65 (3.8%) | 78 (4.4%) |
| 50 to 54 Years | 80 (4.6%) | 83 (4.7%) |
| 55 to 59 Years | 123 (7.1%) | 169 (9.6%) |
| 60 to 64 Years | 103 (5.9%) | 101 (5.7%) |
| 65 to 69 Years | 140 (8.1%) | 138 (7.8%) |
| 70 to 74 Years | 71 (4.1%) | 93 (5.3%) |
| 75 to 79 Years | 42 (2.4%) | 110 (6.2%) |
| 80 to 84 Years | 66 (3.8%) | 35 (2.0%) |
| 85 Years and over | 59 (3.4%) | 81 (4.6%) |
| Total | 1,731 (100.0%) | 1,765 (100.0%) |
Families and Households in Baca County
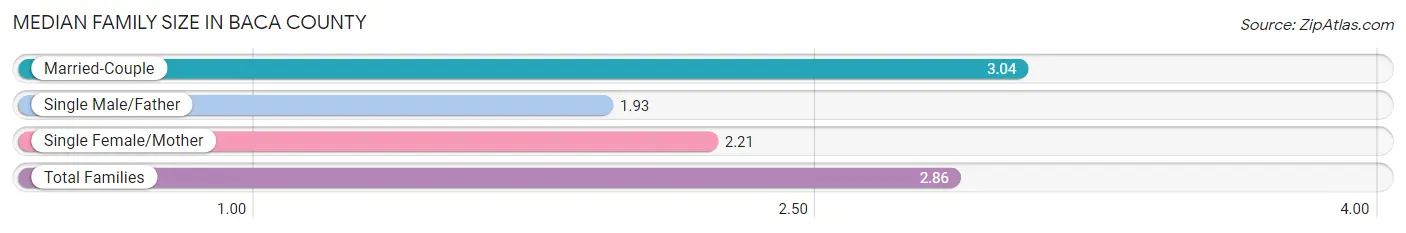
Median Family Size in Baca County
The median family size in Baca County is 2.86 persons per family, with married-couple families (742 | 81.5%) accounting for the largest median family size of 3.04 persons per family. On the other hand, single male/father families (69 | 7.6%) represent the smallest median family size with 1.93 persons per family.
| Family Type | # Families | Family Size |
| Married-Couple | 742 (81.5%) | 3.04 |
| Single Male/Father | 69 (7.6%) | 1.93 |
| Single Female/Mother | 99 (10.9%) | 2.21 |
| Total Families | 910 (100.0%) | 2.86 |
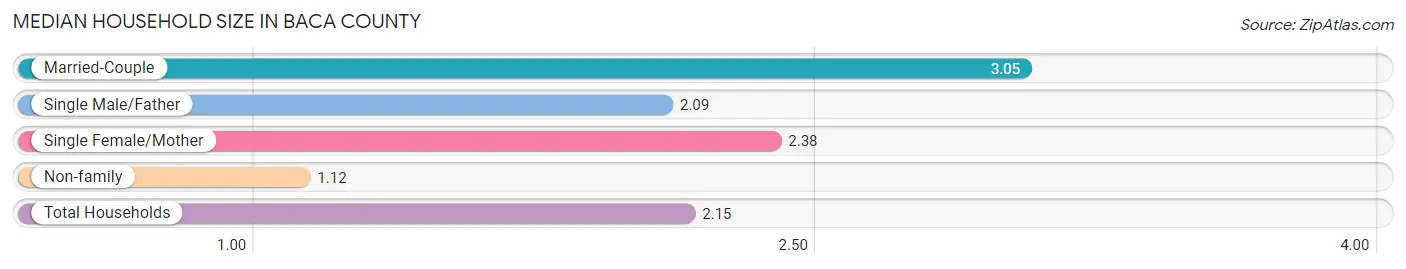
Median Household Size in Baca County
The median household size in Baca County is 2.15 persons per household, with married-couple households (742 | 46.8%) accounting for the largest median household size of 3.05 persons per household. non-family households (676 | 42.6%) represent the smallest median household size with 1.12 persons per household.
| Household Type | # Households | Household Size |
| Married-Couple | 742 (46.8%) | 3.05 |
| Single Male/Father | 69 (4.3%) | 2.09 |
| Single Female/Mother | 99 (6.2%) | 2.38 |
| Non-family | 676 (42.6%) | 1.12 |
| Total Households | 1,586 (100.0%) | 2.15 |
Household Size by Marriage Status in Baca County
Out of a total of 1,586 households in Baca County, 910 (57.4%) are family households, while 676 (42.6%) are nonfamily households. The most numerous type of family households are 2-person households, comprising 439, and the most common type of nonfamily households are 1-person households, comprising 608.
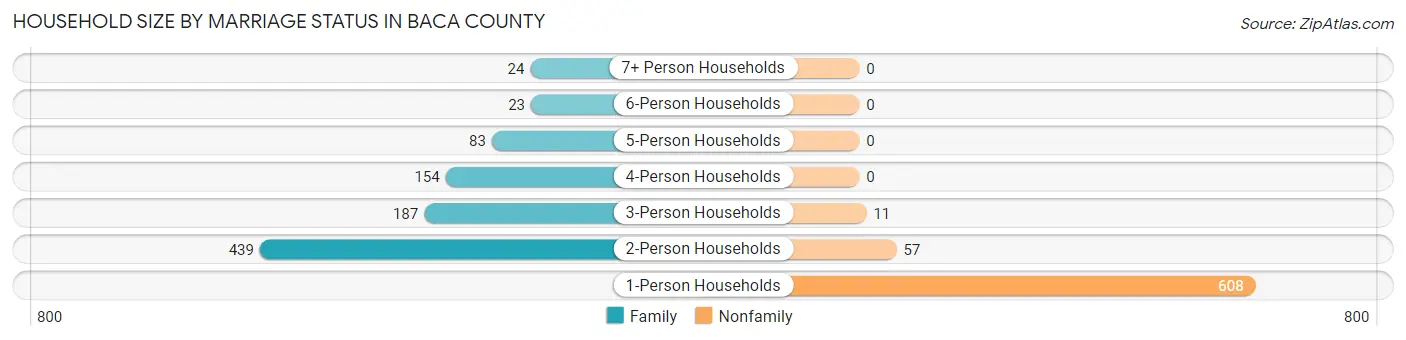
| Household Size | Family Households | Nonfamily Households |
| 1-Person Households | - | 608 (38.3%) |
| 2-Person Households | 439 (27.7%) | 57 (3.6%) |
| 3-Person Households | 187 (11.8%) | 11 (0.7%) |
| 4-Person Households | 154 (9.7%) | 0 (0.0%) |
| 5-Person Households | 83 (5.2%) | 0 (0.0%) |
| 6-Person Households | 23 (1.5%) | 0 (0.0%) |
| 7+ Person Households | 24 (1.5%) | 0 (0.0%) |
| Total | 910 (57.4%) | 676 (42.6%) |
Female Fertility in Baca County
Fertility by Age in Baca County
Average fertility rate in Baca County is 60.0 births per 1,000 women. Women in the age bracket of 20 to 34 years have the highest fertility rate with 113.0 births per 1,000 women. Women in the age bracket of 20 to 34 years acount for 69.2% of all women with births.
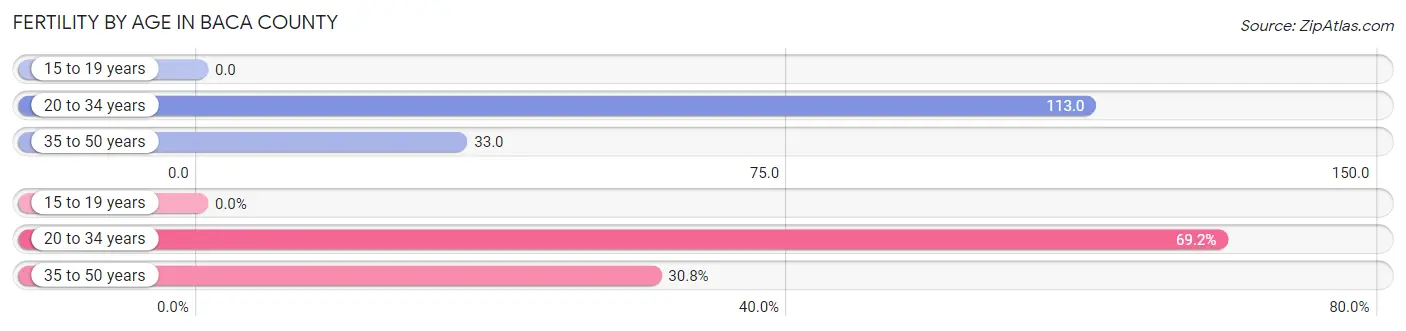
| Age Bracket | Women with Births | Births / 1,000 Women |
| 15 to 19 years | 0 (0.0%) | 0.0 |
| 20 to 34 years | 27 (69.2%) | 113.0 |
| 35 to 50 years | 12 (30.8%) | 33.0 |
| Total | 39 (100.0%) | 60.0 |
Fertility by Age by Marriage Status in Baca County
92.3% of women with births (39) in Baca County are married. The highest percentage of unmarried women with births falls into 20 to 34 years age bracket with 11.1% of them unmarried at the time of birth, while the lowest percentage of unmarried women with births belong to 35 to 50 years age bracket with 0.0% of them unmarried.
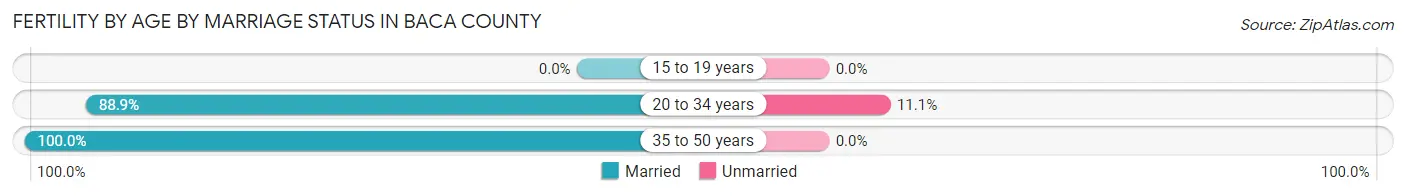
| Age Bracket | Married | Unmarried |
| 15 to 19 years | 0 (0.0%) | 0 (0.0%) |
| 20 to 34 years | 24 (88.9%) | 3 (11.1%) |
| 35 to 50 years | 12 (100.0%) | 0 (0.0%) |
| Total | 36 (92.3%) | 3 (7.7%) |
Fertility by Education in Baca County
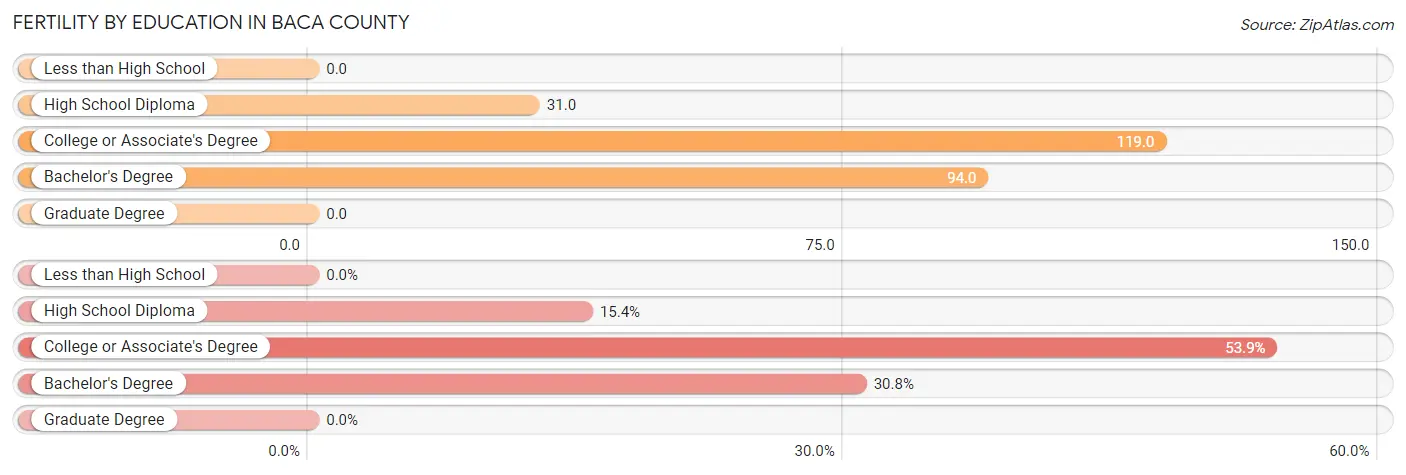
| Educational Attainment | Women with Births | Births / 1,000 Women |
| Less than High School | 0 (0.0%) | 0.0 |
| High School Diploma | 6 (15.4%) | 31.0 |
| College or Associate's Degree | 21 (53.8%) | 119.0 |
| Bachelor's Degree | 12 (30.8%) | 94.0 |
| Graduate Degree | 0 (0.0%) | 0.0 |
| Total | 39 (100.0%) | 60.0 |
Fertility by Education by Marriage Status in Baca County
7.7% of women with births in Baca County are unmarried. Women with the educational attainment of high school diploma are most likely to be married with 100.0% of them married at childbirth, while women with the educational attainment of college or associate's degree are least likely to be married with 14.3% of them unmarried at childbirth.

| Educational Attainment | Married | Unmarried |
| Less than High School | 0 (0.0%) | 0 (0.0%) |
| High School Diploma | 6 (100.0%) | 0 (0.0%) |
| College or Associate's Degree | 18 (85.7%) | 3 (14.3%) |
| Bachelor's Degree | 12 (100.0%) | 0 (0.0%) |
| Graduate Degree | 0 (0.0%) | 0 (0.0%) |
| Total | 36 (92.3%) | 3 (7.7%) |
Employment Characteristics in Baca County
Employment by Class of Employer in Baca County
Among the 1,468 employed individuals in Baca County, private company employees (679 | 46.3%), self-employed (not incorporated) (279 | 19.0%), and local government employees (239 | 16.3%) make up the most common classes of employment.
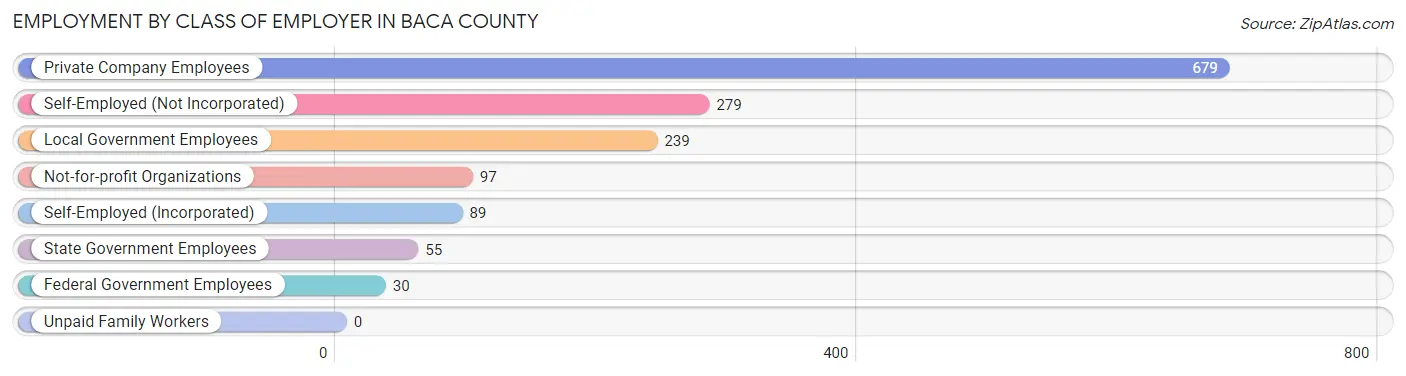
| Employer Class | # Employees | % Employees |
| Private Company Employees | 679 | 46.3% |
| Self-Employed (Incorporated) | 89 | 6.1% |
| Self-Employed (Not Incorporated) | 279 | 19.0% |
| Not-for-profit Organizations | 97 | 6.6% |
| Local Government Employees | 239 | 16.3% |
| State Government Employees | 55 | 3.7% |
| Federal Government Employees | 30 | 2.0% |
| Unpaid Family Workers | 0 | 0.0% |
| Total | 1,468 | 100.0% |
Employment Status by Age in Baca County
According to the labor force statistics for Baca County, out of the total population over 16 years of age (2,782), 54.6% or 1,519 individuals are in the labor force, with 1.7% or 26 of them unemployed. The age group with the highest labor force participation rate is 20 to 24 years, with 81.5% or 141 individuals in the labor force. Within the labor force, the 30 to 34 years age range has the highest percentage of unemployed individuals, with 8.5% or 11 of them being unemployed.
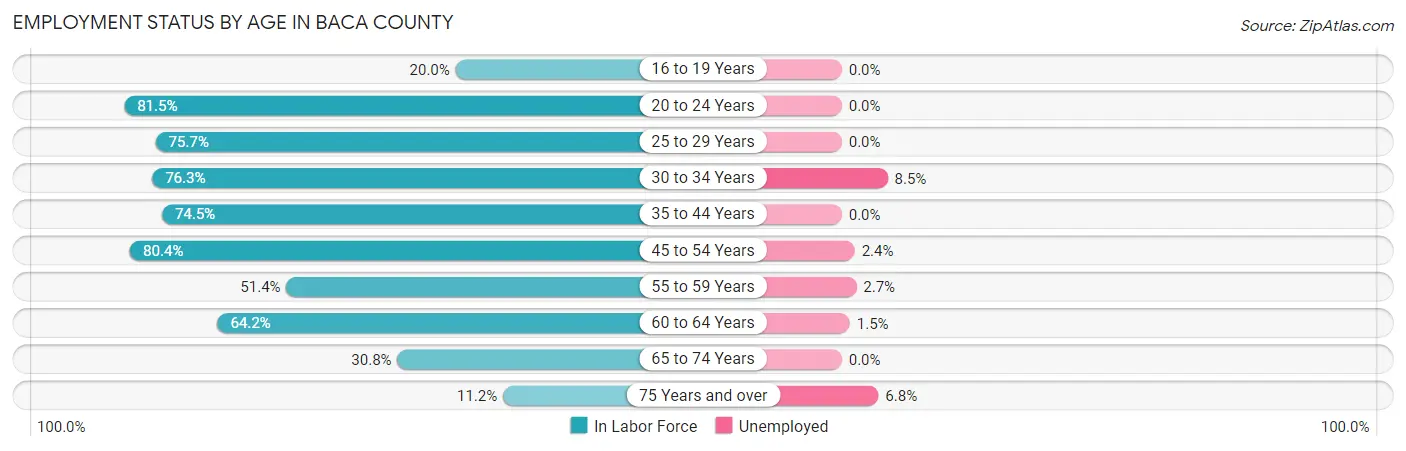
| Age Bracket | In Labor Force | Unemployed |
| 16 to 19 Years | 21 (20.0%) | 0 (0.0%) |
| 20 to 24 Years | 141 (81.5%) | 0 (0.0%) |
| 25 to 29 Years | 128 (75.7%) | 0 (0.0%) |
| 30 to 34 Years | 129 (76.3%) | 11 (8.5%) |
| 35 to 44 Years | 394 (74.5%) | 0 (0.0%) |
| 45 to 54 Years | 246 (80.4%) | 6 (2.4%) |
| 55 to 59 Years | 150 (51.4%) | 4 (2.7%) |
| 60 to 64 Years | 131 (64.2%) | 2 (1.5%) |
| 65 to 74 Years | 136 (30.8%) | 0 (0.0%) |
| 75 Years and over | 44 (11.2%) | 3 (6.8%) |
| Total | 1,519 (54.6%) | 26 (1.7%) |
Employment Status by Educational Attainment in Baca County
According to labor force statistics for Baca County, 70.6% of individuals (1,178) out of the total population between 25 and 64 years of age (1,669) are in the labor force, with 2.0% or 24 of them being unemployed. The group with the highest labor force participation rate are those with the educational attainment of bachelor's degree or higher, with 88.8% or 372 individuals in the labor force. Within the labor force, individuals with less than high school education have the highest percentage of unemployment, with 3.3% or 4 of them being unemployed.
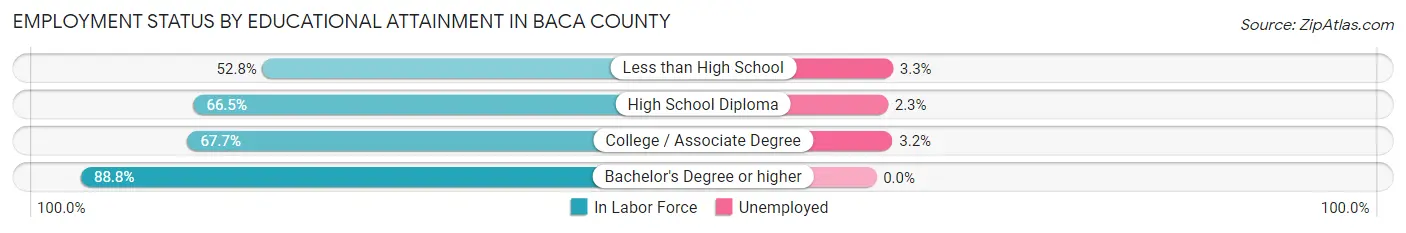
| Educational Attainment | In Labor Force | Unemployed |
| Less than High School | 122 (52.8%) | 8 (3.3%) |
| High School Diploma | 311 (66.5%) | 11 (2.3%) |
| College / Associate Degree | 373 (67.7%) | 18 (3.2%) |
| Bachelor's Degree or higher | 372 (88.8%) | 0 (0.0%) |
| Total | 1,178 (70.6%) | 33 (2.0%) |
Employment Occupations by Sex in Baca County
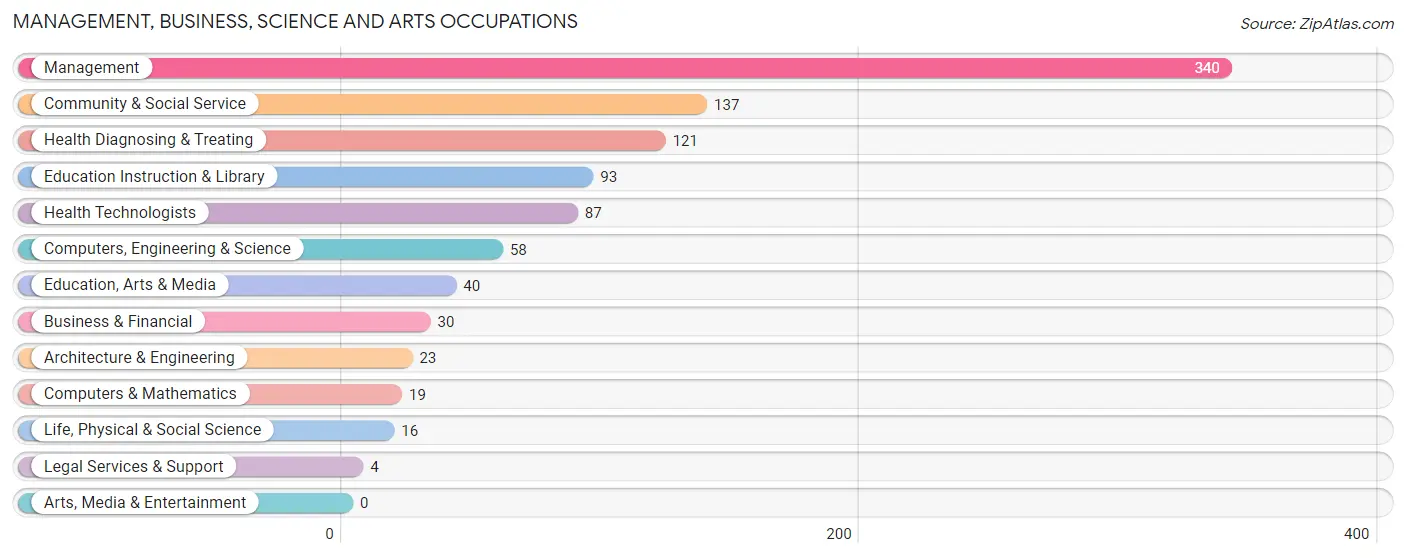
Management, Business, Science and Arts Occupations
The most common Management, Business, Science and Arts occupations in Baca County are Management (340 | 22.8%), Community & Social Service (137 | 9.2%), Health Diagnosing & Treating (121 | 8.1%), Education Instruction & Library (93 | 6.2%), and Health Technologists (87 | 5.8%).
Management, Business, Science and Arts Occupations by Sex
Within the Management, Business, Science and Arts occupations in Baca County, the most male-oriented occupations are Architecture & Engineering (100.0%), Life, Physical & Social Science (81.2%), and Computers, Engineering & Science (81.0%), while the most female-oriented occupations are Legal Services & Support (100.0%), Business & Financial (66.7%), and Health Diagnosing & Treating (63.6%).
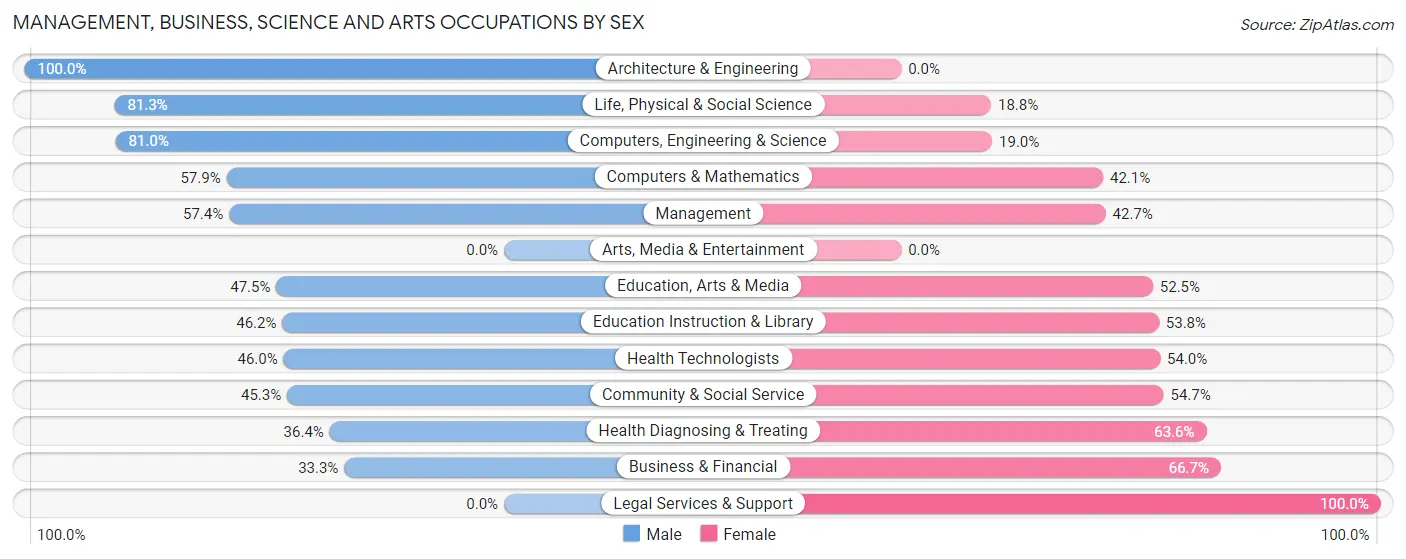
| Occupation | Male | Female |
| Management | 195 (57.4%) | 145 (42.6%) |
| Business & Financial | 10 (33.3%) | 20 (66.7%) |
| Computers, Engineering & Science | 47 (81.0%) | 11 (19.0%) |
| Computers & Mathematics | 11 (57.9%) | 8 (42.1%) |
| Architecture & Engineering | 23 (100.0%) | 0 (0.0%) |
| Life, Physical & Social Science | 13 (81.2%) | 3 (18.8%) |
| Community & Social Service | 62 (45.3%) | 75 (54.7%) |
| Education, Arts & Media | 19 (47.5%) | 21 (52.5%) |
| Legal Services & Support | 0 (0.0%) | 4 (100.0%) |
| Education Instruction & Library | 43 (46.2%) | 50 (53.8%) |
| Arts, Media & Entertainment | 0 (0.0%) | 0 (0.0%) |
| Health Diagnosing & Treating | 44 (36.4%) | 77 (63.6%) |
| Health Technologists | 40 (46.0%) | 47 (54.0%) |
| Total (Category) | 358 (52.2%) | 328 (47.8%) |
| Total (Overall) | 806 (53.9%) | 688 (46.1%) |
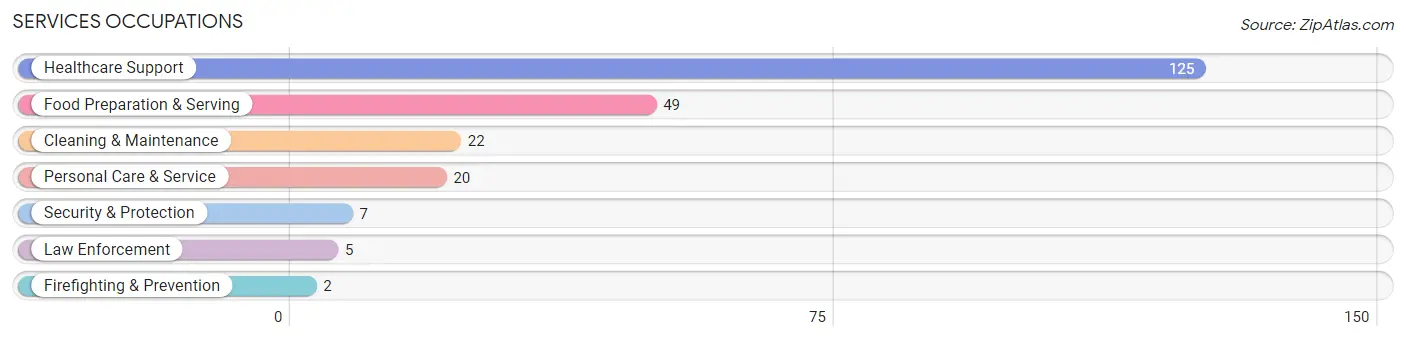
Services Occupations
The most common Services occupations in Baca County are Healthcare Support (125 | 8.4%), Food Preparation & Serving (49 | 3.3%), Cleaning & Maintenance (22 | 1.5%), Personal Care & Service (20 | 1.3%), and Security & Protection (7 | 0.5%).
Services Occupations by Sex
Within the Services occupations in Baca County, the most male-oriented occupations are Law Enforcement (100.0%), Security & Protection (71.4%), and Cleaning & Maintenance (63.6%), while the most female-oriented occupations are Firefighting & Prevention (100.0%), Personal Care & Service (100.0%), and Healthcare Support (81.6%).
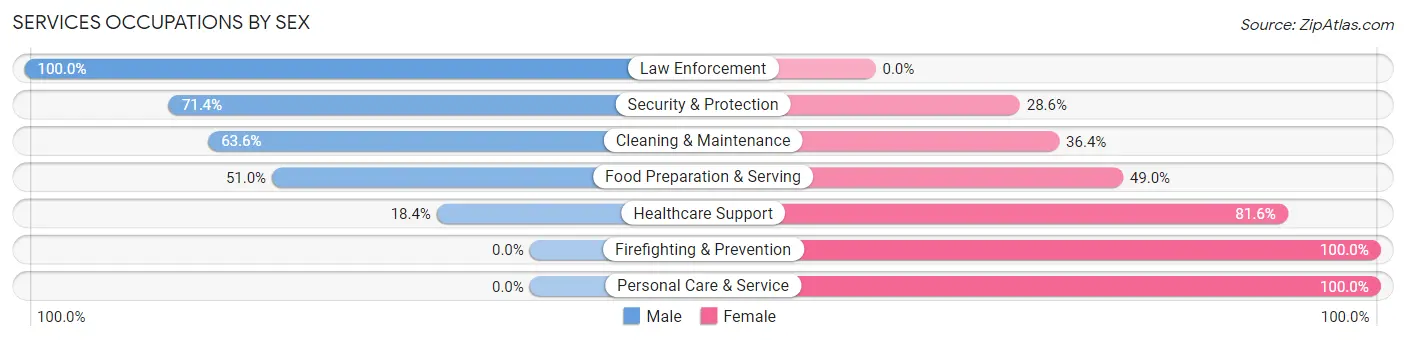
| Occupation | Male | Female |
| Healthcare Support | 23 (18.4%) | 102 (81.6%) |
| Security & Protection | 5 (71.4%) | 2 (28.6%) |
| Firefighting & Prevention | 0 (0.0%) | 2 (100.0%) |
| Law Enforcement | 5 (100.0%) | 0 (0.0%) |
| Food Preparation & Serving | 25 (51.0%) | 24 (49.0%) |
| Cleaning & Maintenance | 14 (63.6%) | 8 (36.4%) |
| Personal Care & Service | 0 (0.0%) | 20 (100.0%) |
| Total (Category) | 67 (30.0%) | 156 (70.0%) |
| Total (Overall) | 806 (53.9%) | 688 (46.1%) |
Sales and Office Occupations
The most common Sales and Office occupations in Baca County are Office & Administration (108 | 7.2%), and Sales & Related (66 | 4.4%).

Sales and Office Occupations by Sex

| Occupation | Male | Female |
| Sales & Related | 45 (68.2%) | 21 (31.8%) |
| Office & Administration | 8 (7.4%) | 100 (92.6%) |
| Total (Category) | 53 (30.5%) | 121 (69.5%) |
| Total (Overall) | 806 (53.9%) | 688 (46.1%) |
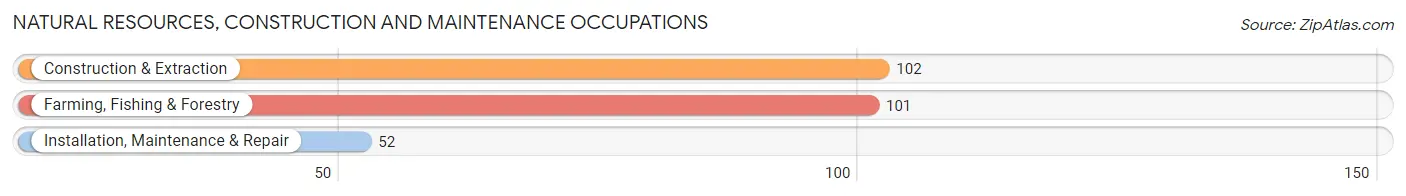
Natural Resources, Construction and Maintenance Occupations
The most common Natural Resources, Construction and Maintenance occupations in Baca County are Construction & Extraction (102 | 6.8%), Farming, Fishing & Forestry (101 | 6.8%), and Installation, Maintenance & Repair (52 | 3.5%).
Natural Resources, Construction and Maintenance Occupations by Sex
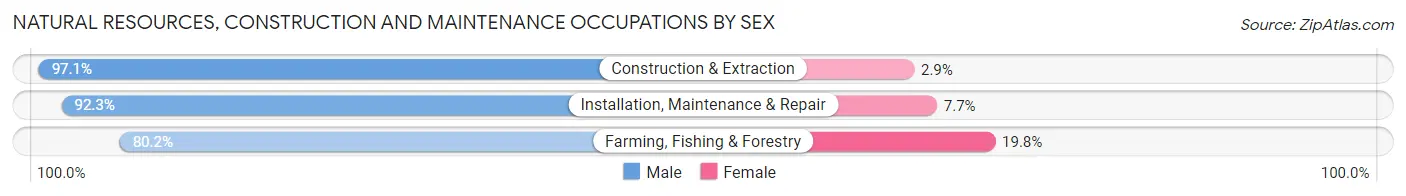
| Occupation | Male | Female |
| Farming, Fishing & Forestry | 81 (80.2%) | 20 (19.8%) |
| Construction & Extraction | 99 (97.1%) | 3 (2.9%) |
| Installation, Maintenance & Repair | 48 (92.3%) | 4 (7.7%) |
| Total (Category) | 228 (89.4%) | 27 (10.6%) |
| Total (Overall) | 806 (53.9%) | 688 (46.1%) |
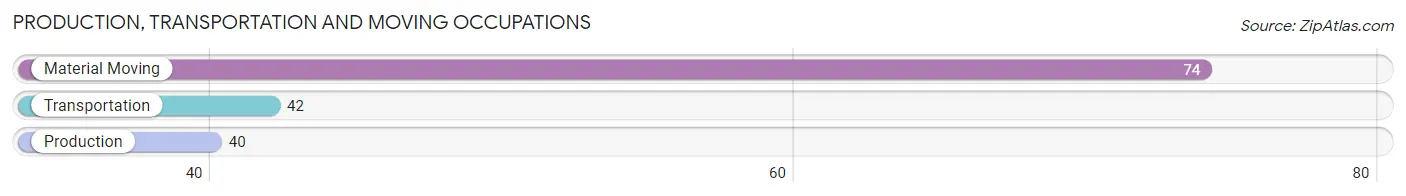
Production, Transportation and Moving Occupations
The most common Production, Transportation and Moving occupations in Baca County are Material Moving (74 | 5.0%), Transportation (42 | 2.8%), and Production (40 | 2.7%).
Production, Transportation and Moving Occupations by Sex
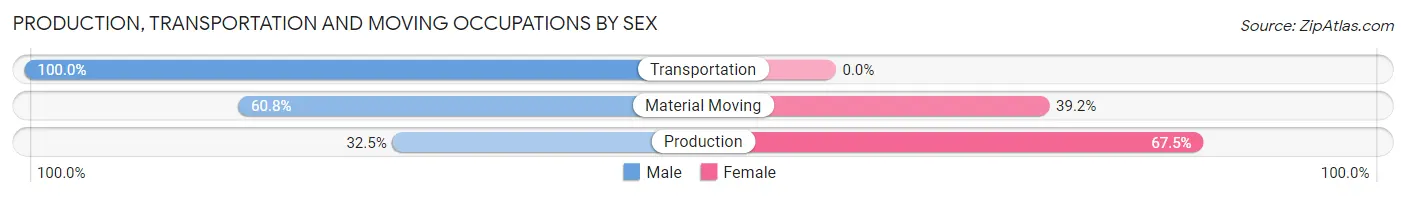
| Occupation | Male | Female |
| Production | 13 (32.5%) | 27 (67.5%) |
| Transportation | 42 (100.0%) | 0 (0.0%) |
| Material Moving | 45 (60.8%) | 29 (39.2%) |
| Total (Category) | 100 (64.1%) | 56 (35.9%) |
| Total (Overall) | 806 (53.9%) | 688 (46.1%) |
Employment Industries by Sex in Baca County
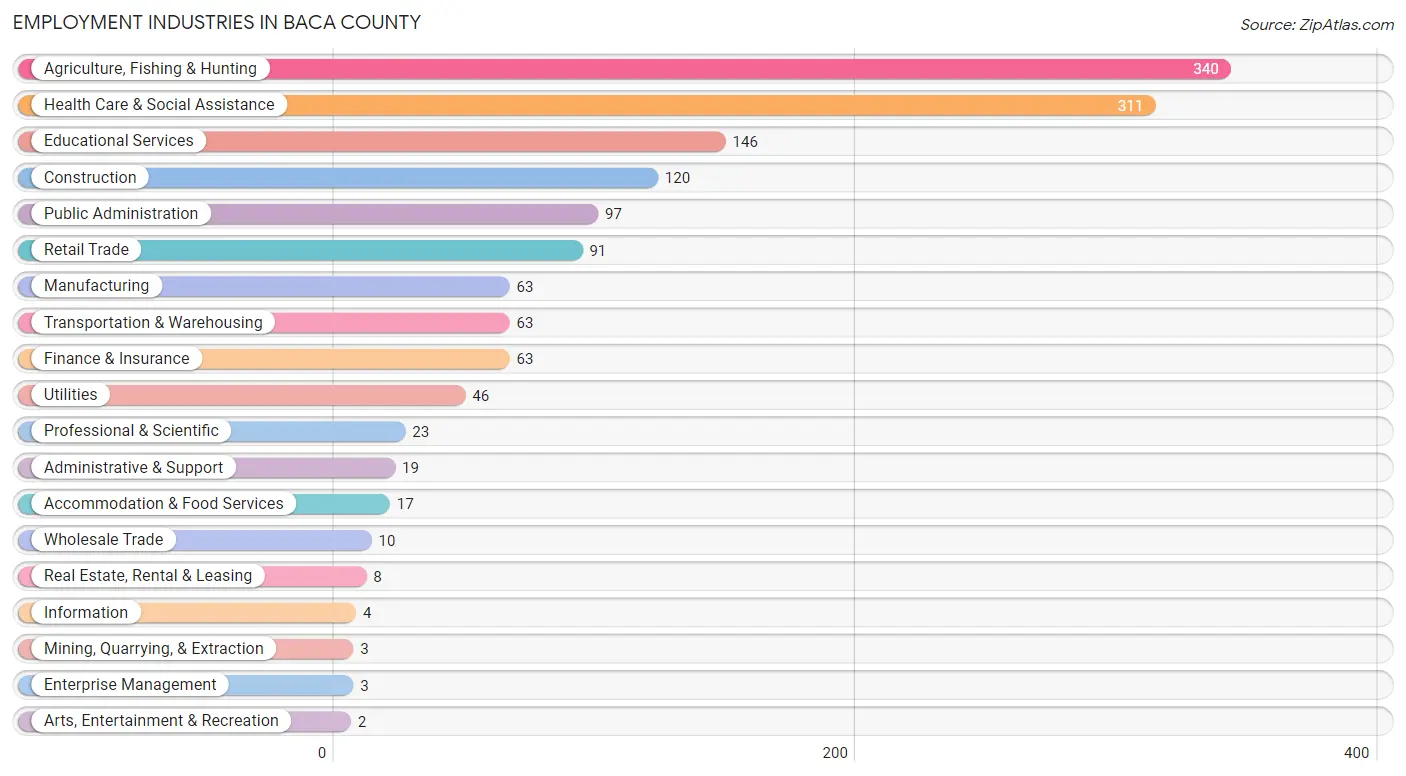
Employment Industries in Baca County
The major employment industries in Baca County include Agriculture, Fishing & Hunting (340 | 22.8%), Health Care & Social Assistance (311 | 20.8%), Educational Services (146 | 9.8%), Construction (120 | 8.0%), and Public Administration (97 | 6.5%).
Employment Industries by Sex in Baca County
The Baca County industries that see more men than women are Mining, Quarrying, & Extraction (100.0%), Utilities (100.0%), and Construction (97.5%), whereas the industries that tend to have a higher number of women are Information (100.0%), Enterprise Management (100.0%), and Arts, Entertainment & Recreation (100.0%).
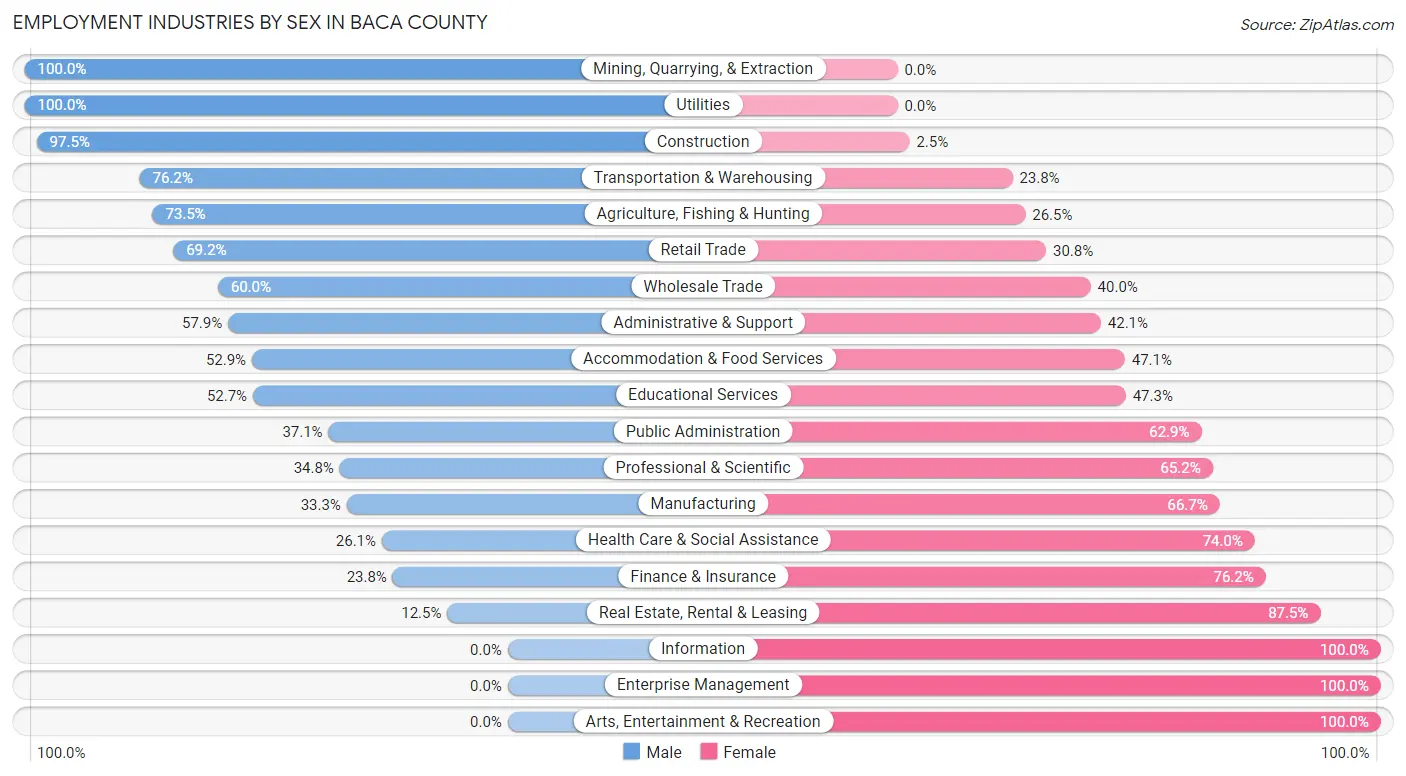
| Industry | Male | Female |
| Agriculture, Fishing & Hunting | 250 (73.5%) | 90 (26.5%) |
| Mining, Quarrying, & Extraction | 3 (100.0%) | 0 (0.0%) |
| Construction | 117 (97.5%) | 3 (2.5%) |
| Manufacturing | 21 (33.3%) | 42 (66.7%) |
| Wholesale Trade | 6 (60.0%) | 4 (40.0%) |
| Retail Trade | 63 (69.2%) | 28 (30.8%) |
| Transportation & Warehousing | 48 (76.2%) | 15 (23.8%) |
| Utilities | 46 (100.0%) | 0 (0.0%) |
| Information | 0 (0.0%) | 4 (100.0%) |
| Finance & Insurance | 15 (23.8%) | 48 (76.2%) |
| Real Estate, Rental & Leasing | 1 (12.5%) | 7 (87.5%) |
| Professional & Scientific | 8 (34.8%) | 15 (65.2%) |
| Enterprise Management | 0 (0.0%) | 3 (100.0%) |
| Administrative & Support | 11 (57.9%) | 8 (42.1%) |
| Educational Services | 77 (52.7%) | 69 (47.3%) |
| Health Care & Social Assistance | 81 (26.1%) | 230 (74.0%) |
| Arts, Entertainment & Recreation | 0 (0.0%) | 2 (100.0%) |
| Accommodation & Food Services | 9 (52.9%) | 8 (47.1%) |
| Public Administration | 36 (37.1%) | 61 (62.9%) |
| Total | 806 (53.9%) | 688 (46.1%) |
Education in Baca County
School Enrollment in Baca County
The most common levels of schooling among the 833 students in Baca County are elementary school (224 | 26.9%), middle school (192 | 23.1%), and high school (134 | 16.1%).

| School Level | # Students | % Students |
| Nursery / Preschool | 81 | 9.7% |
| Kindergarten | 65 | 7.8% |
| Elementary School | 224 | 26.9% |
| Middle School | 192 | 23.1% |
| High School | 134 | 16.1% |
| College / Undergraduate | 129 | 15.5% |
| Graduate / Professional | 8 | 1.0% |
| Total | 833 | 100.0% |
School Enrollment by Age by Funding Source in Baca County
Out of a total of 833 students who are enrolled in schools in Baca County, 70 (8.4%) attend a private institution, while the remaining 763 (91.6%) are enrolled in public schools. The age group of 3 to 4 year olds has the highest likelihood of being enrolled in private schools, with 17 (34.7% in the age bracket) enrolled. Conversely, the age group of 15 to 17 year olds has the lowest likelihood of being enrolled in a private school, with 100 (100.0% in the age bracket) attending a public institution.
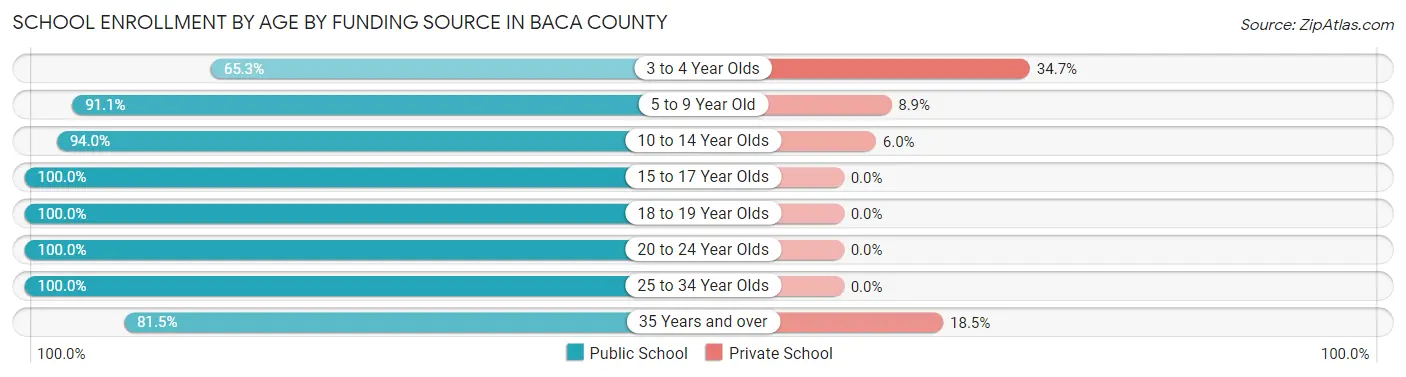
| Age Bracket | Public School | Private School |
| 3 to 4 Year Olds | 32 (65.3%) | 17 (34.7%) |
| 5 to 9 Year Old | 257 (91.1%) | 25 (8.9%) |
| 10 to 14 Year Olds | 204 (94.0%) | 13 (6.0%) |
| 15 to 17 Year Olds | 100 (100.0%) | 0 (0.0%) |
| 18 to 19 Year Olds | 40 (100.0%) | 0 (0.0%) |
| 20 to 24 Year Olds | 43 (100.0%) | 0 (0.0%) |
| 25 to 34 Year Olds | 21 (100.0%) | 0 (0.0%) |
| 35 Years and over | 66 (81.5%) | 15 (18.5%) |
| Total | 763 (91.6%) | 70 (8.4%) |
Educational Attainment by Field of Study in Baca County
Education (135 | 21.2%), business (125 | 19.6%), bio, nature & agricultural (118 | 18.5%), science & technology (70 | 11.0%), and psychology (48 | 7.5%) are the most common fields of study among 638 individuals in Baca County who have obtained a bachelor's degree or higher.
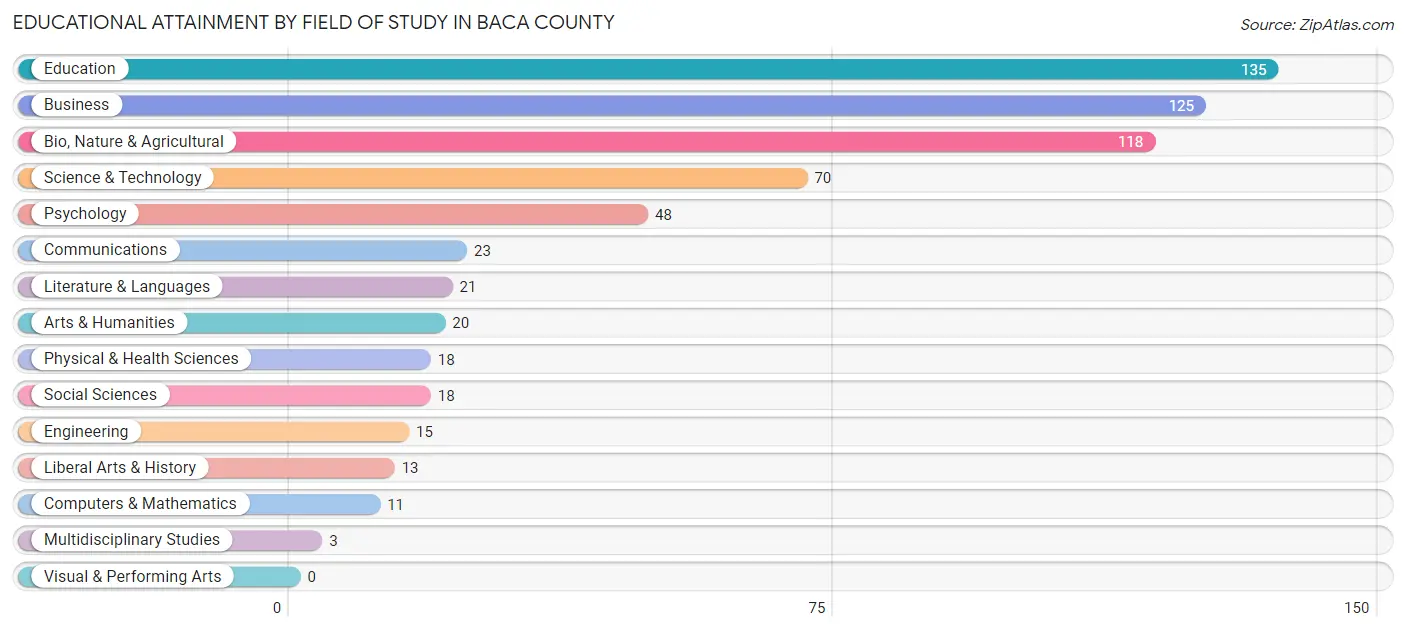
| Field of Study | # Graduates | % Graduates |
| Computers & Mathematics | 11 | 1.7% |
| Bio, Nature & Agricultural | 118 | 18.5% |
| Physical & Health Sciences | 18 | 2.8% |
| Psychology | 48 | 7.5% |
| Social Sciences | 18 | 2.8% |
| Engineering | 15 | 2.4% |
| Multidisciplinary Studies | 3 | 0.5% |
| Science & Technology | 70 | 11.0% |
| Business | 125 | 19.6% |
| Education | 135 | 21.2% |
| Literature & Languages | 21 | 3.3% |
| Liberal Arts & History | 13 | 2.0% |
| Visual & Performing Arts | 0 | 0.0% |
| Communications | 23 | 3.6% |
| Arts & Humanities | 20 | 3.1% |
| Total | 638 | 100.0% |
Transportation & Commute in Baca County
Vehicle Availability by Sex in Baca County
The most prevalent vehicle ownership categories in Baca County are males with 2 vehicles (250, accounting for 31.5%) and females with 2 vehicles (215, making up 37.1%).
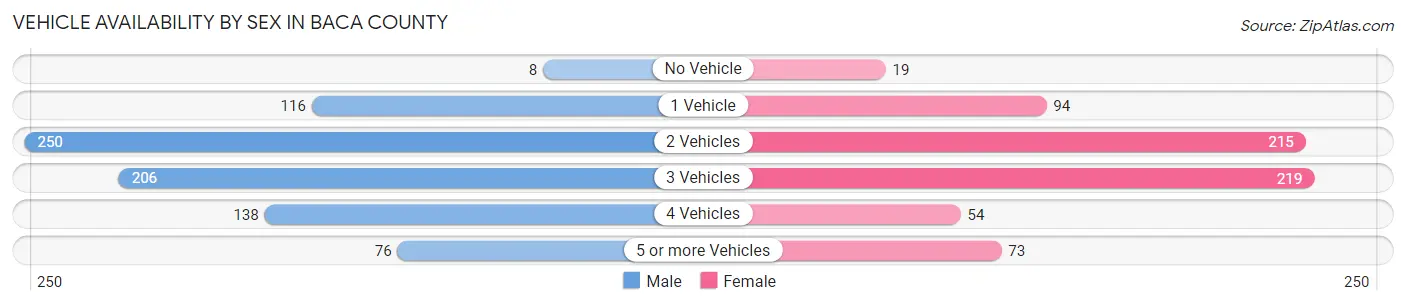
| Vehicles Available | Male | Female |
| No Vehicle | 8 (1.0%) | 19 (2.8%) |
| 1 Vehicle | 116 (14.6%) | 94 (14.0%) |
| 2 Vehicles | 250 (31.5%) | 215 (31.9%) |
| 3 Vehicles | 206 (25.9%) | 219 (32.5%) |
| 4 Vehicles | 138 (17.4%) | 54 (8.0%) |
| 5 or more Vehicles | 76 (9.6%) | 73 (10.8%) |
| Total | 794 (100.0%) | 674 (100.0%) |
Commute Time in Baca County
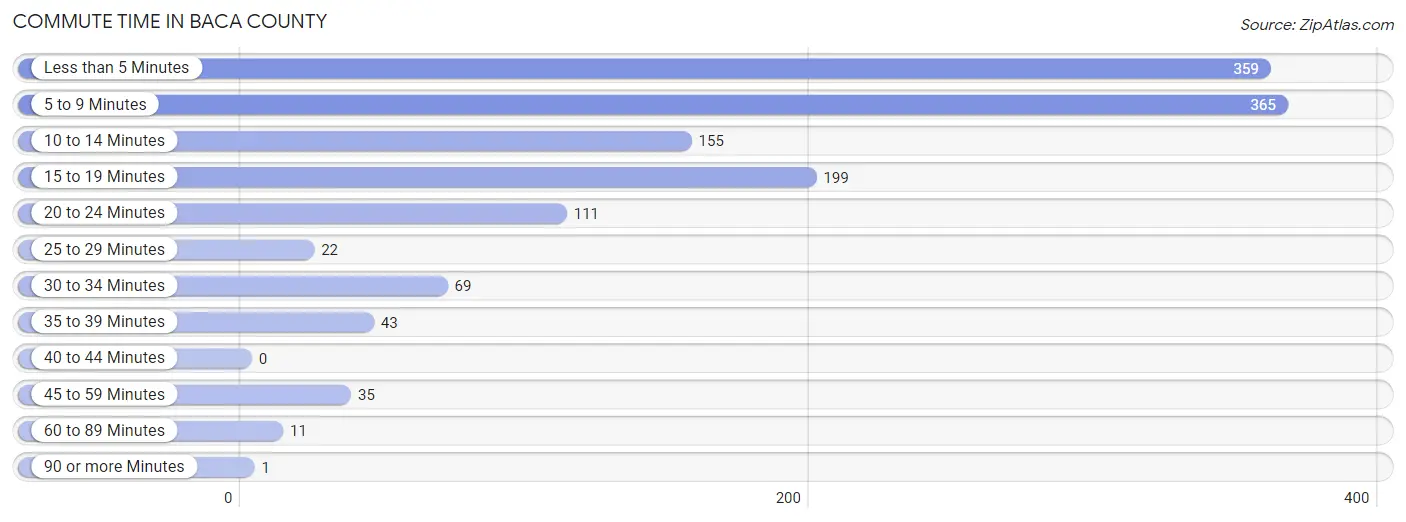
The most frequently occuring commute durations in Baca County are 5 to 9 minutes (365 commuters, 26.6%), less than 5 minutes (359 commuters, 26.2%), and 15 to 19 minutes (199 commuters, 14.5%).
| Commute Time | # Commuters | % Commuters |
| Less than 5 Minutes | 359 | 26.2% |
| 5 to 9 Minutes | 365 | 26.6% |
| 10 to 14 Minutes | 155 | 11.3% |
| 15 to 19 Minutes | 199 | 14.5% |
| 20 to 24 Minutes | 111 | 8.1% |
| 25 to 29 Minutes | 22 | 1.6% |
| 30 to 34 Minutes | 69 | 5.0% |
| 35 to 39 Minutes | 43 | 3.1% |
| 40 to 44 Minutes | 0 | 0.0% |
| 45 to 59 Minutes | 35 | 2.5% |
| 60 to 89 Minutes | 11 | 0.8% |
| 90 or more Minutes | 1 | 0.1% |
Commute Time by Sex in Baca County
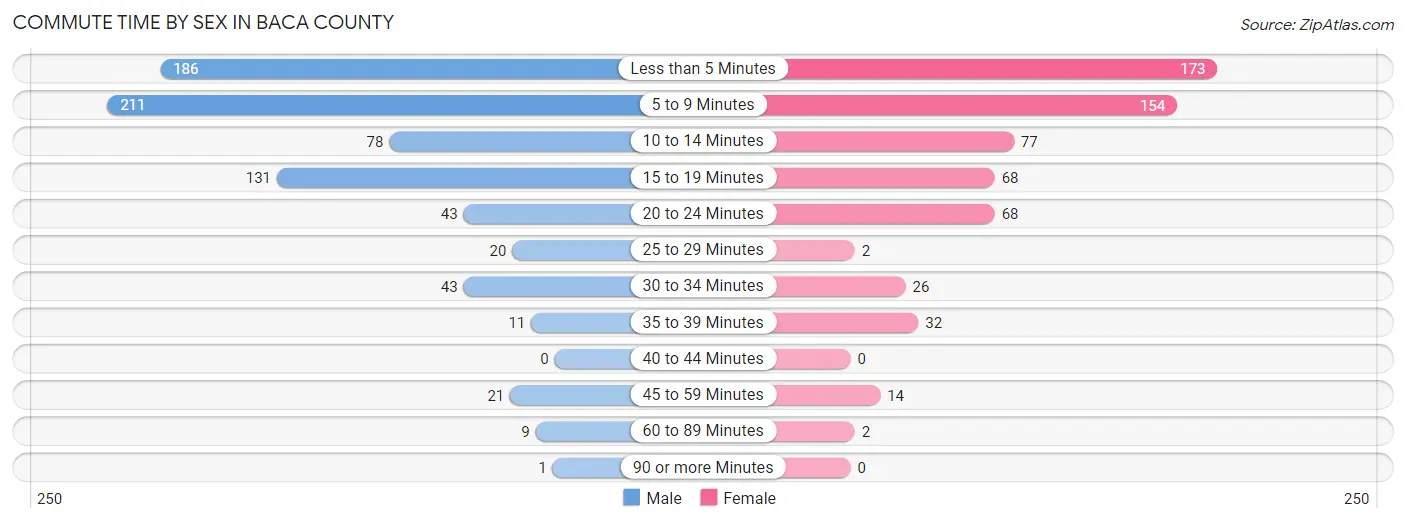
The most common commute times in Baca County are 5 to 9 minutes (211 commuters, 28.0%) for males and less than 5 minutes (173 commuters, 28.1%) for females.
| Commute Time | Male | Female |
| Less than 5 Minutes | 186 (24.7%) | 173 (28.1%) |
| 5 to 9 Minutes | 211 (28.0%) | 154 (25.0%) |
| 10 to 14 Minutes | 78 (10.3%) | 77 (12.5%) |
| 15 to 19 Minutes | 131 (17.4%) | 68 (11.0%) |
| 20 to 24 Minutes | 43 (5.7%) | 68 (11.0%) |
| 25 to 29 Minutes | 20 (2.6%) | 2 (0.3%) |
| 30 to 34 Minutes | 43 (5.7%) | 26 (4.2%) |
| 35 to 39 Minutes | 11 (1.5%) | 32 (5.2%) |
| 40 to 44 Minutes | 0 (0.0%) | 0 (0.0%) |
| 45 to 59 Minutes | 21 (2.8%) | 14 (2.3%) |
| 60 to 89 Minutes | 9 (1.2%) | 2 (0.3%) |
| 90 or more Minutes | 1 (0.1%) | 0 (0.0%) |
Time of Departure to Work by Sex in Baca County
The most frequent times of departure to work in Baca County are 7:00 AM to 7:29 AM (190, 25.2%) for males and 7:30 AM to 7:59 AM (164, 26.6%) for females.

| Time of Departure | Male | Female |
| 12:00 AM to 4:59 AM | 7 (0.9%) | 20 (3.3%) |
| 5:00 AM to 5:29 AM | 4 (0.5%) | 25 (4.1%) |
| 5:30 AM to 5:59 AM | 4 (0.5%) | 18 (2.9%) |
| 6:00 AM to 6:29 AM | 77 (10.2%) | 19 (3.1%) |
| 6:30 AM to 6:59 AM | 157 (20.8%) | 57 (9.2%) |
| 7:00 AM to 7:29 AM | 190 (25.2%) | 95 (15.4%) |
| 7:30 AM to 7:59 AM | 179 (23.7%) | 164 (26.6%) |
| 8:00 AM to 8:29 AM | 48 (6.4%) | 55 (8.9%) |
| 8:30 AM to 8:59 AM | 20 (2.6%) | 49 (8.0%) |
| 9:00 AM to 9:59 AM | 21 (2.8%) | 57 (9.2%) |
| 10:00 AM to 10:59 AM | 1 (0.1%) | 1 (0.2%) |
| 11:00 AM to 11:59 AM | 10 (1.3%) | 15 (2.4%) |
| 12:00 PM to 3:59 PM | 23 (3.0%) | 21 (3.4%) |
| 4:00 PM to 11:59 PM | 13 (1.7%) | 20 (3.3%) |
| Total | 754 (100.0%) | 616 (100.0%) |
Housing Occupancy in Baca County
Occupancy by Ownership in Baca County
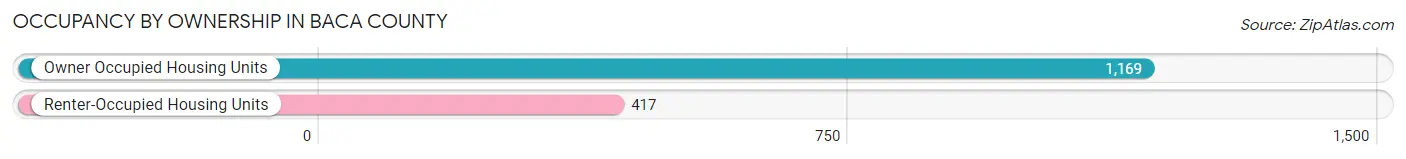
Of the total 1,586 dwellings in Baca County, owner-occupied units account for 1,169 (73.7%), while renter-occupied units make up 417 (26.3%).
| Occupancy | # Housing Units | % Housing Units |
| Owner Occupied Housing Units | 1,169 | 73.7% |
| Renter-Occupied Housing Units | 417 | 26.3% |
| Total Occupied Housing Units | 1,586 | 100.0% |
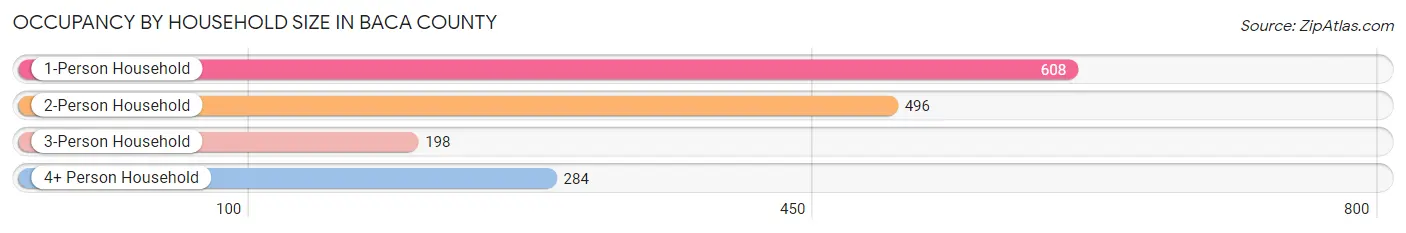
Occupancy by Household Size in Baca County
| Household Size | # Housing Units | % Housing Units |
| 1-Person Household | 608 | 38.3% |
| 2-Person Household | 496 | 31.3% |
| 3-Person Household | 198 | 12.5% |
| 4+ Person Household | 284 | 17.9% |
| Total Housing Units | 1,586 | 100.0% |
Occupancy by Ownership by Household Size in Baca County
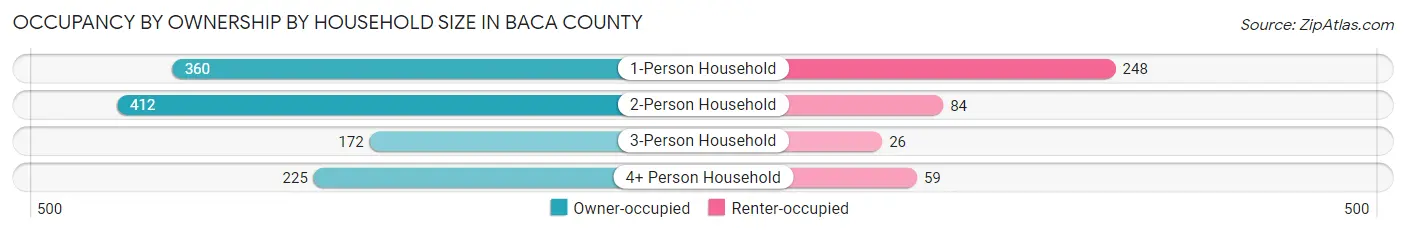
| Household Size | Owner-occupied | Renter-occupied |
| 1-Person Household | 360 (59.2%) | 248 (40.8%) |
| 2-Person Household | 412 (83.1%) | 84 (16.9%) |
| 3-Person Household | 172 (86.9%) | 26 (13.1%) |
| 4+ Person Household | 225 (79.2%) | 59 (20.8%) |
| Total Housing Units | 1,169 (73.7%) | 417 (26.3%) |
Occupancy by Educational Attainment in Baca County
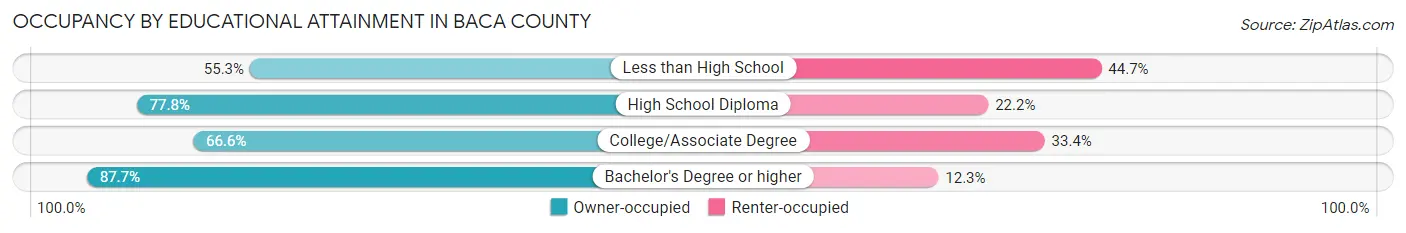
| Household Size | Owner-occupied | Renter-occupied |
| Less than High School | 114 (55.3%) | 92 (44.7%) |
| High School Diploma | 399 (77.8%) | 114 (22.2%) |
| College/Associate Degree | 329 (66.6%) | 165 (33.4%) |
| Bachelor's Degree or higher | 327 (87.7%) | 46 (12.3%) |
Occupancy by Age of Householder in Baca County
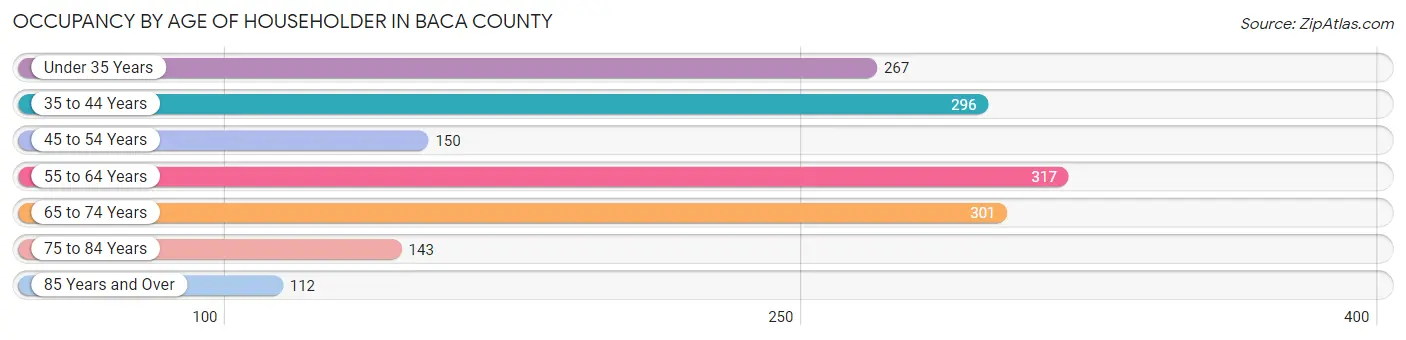
| Age Bracket | # Households | % Households |
| Under 35 Years | 267 | 16.8% |
| 35 to 44 Years | 296 | 18.7% |
| 45 to 54 Years | 150 | 9.5% |
| 55 to 64 Years | 317 | 20.0% |
| 65 to 74 Years | 301 | 19.0% |
| 75 to 84 Years | 143 | 9.0% |
| 85 Years and Over | 112 | 7.1% |
| Total | 1,586 | 100.0% |
Housing Finances in Baca County
Median Income by Occupancy in Baca County
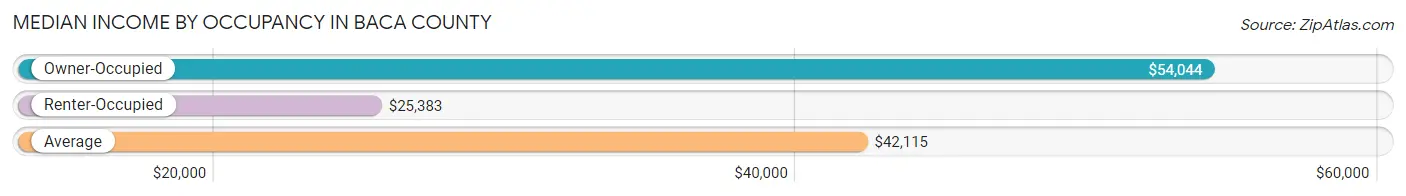
| Occupancy Type | # Households | Median Income |
| Owner-Occupied | 1,169 (73.7%) | $54,044 |
| Renter-Occupied | 417 (26.3%) | $25,383 |
| Average | 1,586 (100.0%) | $42,115 |
Occupancy by Householder Income Bracket in Baca County
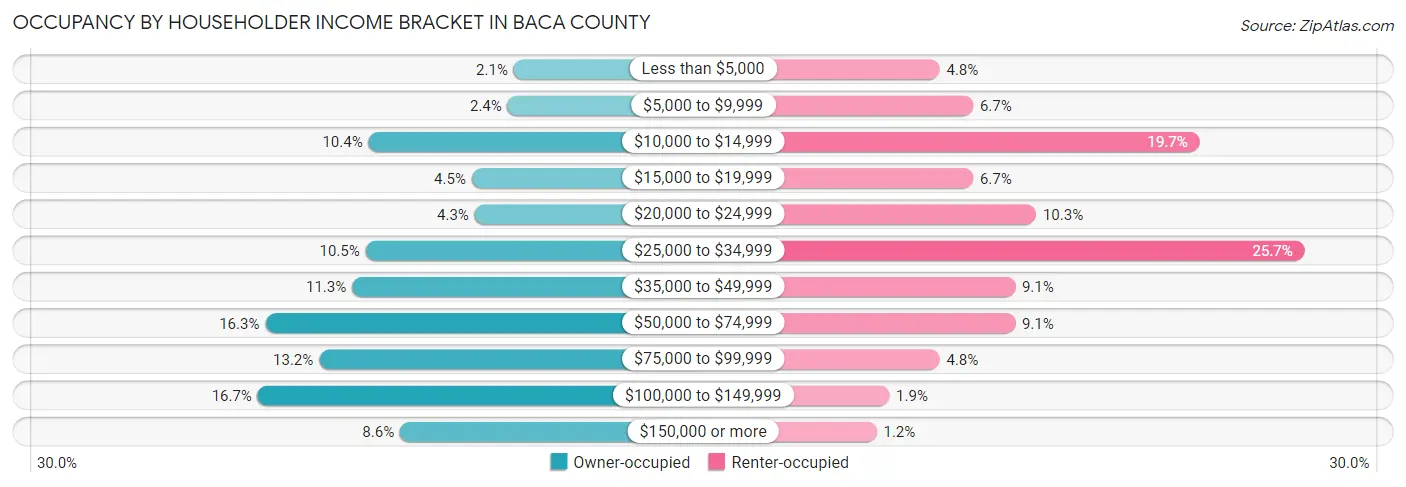
| Income Bracket | Owner-occupied | Renter-occupied |
| Less than $5,000 | 24 (2.1%) | 20 (4.8%) |
| $5,000 to $9,999 | 28 (2.4%) | 28 (6.7%) |
| $10,000 to $14,999 | 121 (10.3%) | 82 (19.7%) |
| $15,000 to $19,999 | 52 (4.4%) | 28 (6.7%) |
| $20,000 to $24,999 | 50 (4.3%) | 43 (10.3%) |
| $25,000 to $34,999 | 123 (10.5%) | 107 (25.7%) |
| $35,000 to $49,999 | 132 (11.3%) | 38 (9.1%) |
| $50,000 to $74,999 | 190 (16.3%) | 38 (9.1%) |
| $75,000 to $99,999 | 154 (13.2%) | 20 (4.8%) |
| $100,000 to $149,999 | 195 (16.7%) | 8 (1.9%) |
| $150,000 or more | 100 (8.6%) | 5 (1.2%) |
| Total | 1,169 (100.0%) | 417 (100.0%) |
Monthly Housing Cost Tiers in Baca County

| Monthly Cost | Owner-occupied | Renter-occupied |
| Less than $300 | 163 (13.9%) | 106 (25.4%) |
| $300 to $499 | 297 (25.4%) | 91 (21.8%) |
| $500 to $799 | 318 (27.2%) | 105 (25.2%) |
| $800 to $999 | 142 (12.1%) | 15 (3.6%) |
| $1,000 to $1,499 | 147 (12.6%) | 40 (9.6%) |
| $1,500 to $1,999 | 43 (3.7%) | 1 (0.2%) |
| $2,000 to $2,499 | 36 (3.1%) | 0 (0.0%) |
| $2,500 to $2,999 | 17 (1.5%) | 0 (0.0%) |
| $3,000 or more | 6 (0.5%) | 0 (0.0%) |
| Total | 1,169 (100.0%) | 417 (100.0%) |
Physical Housing Characteristics in Baca County
Housing Structures in Baca County
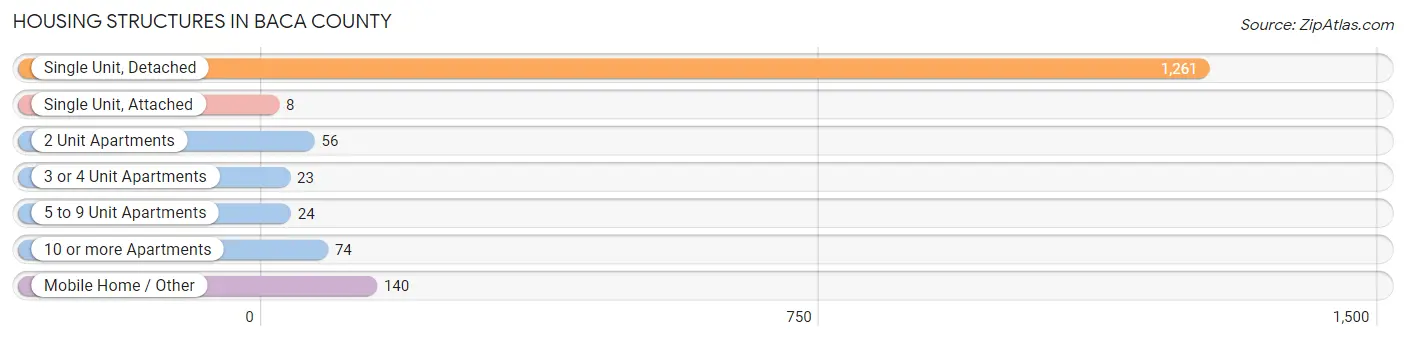
| Structure Type | # Housing Units | % Housing Units |
| Single Unit, Detached | 1,261 | 79.5% |
| Single Unit, Attached | 8 | 0.5% |
| 2 Unit Apartments | 56 | 3.5% |
| 3 or 4 Unit Apartments | 23 | 1.5% |
| 5 to 9 Unit Apartments | 24 | 1.5% |
| 10 or more Apartments | 74 | 4.7% |
| Mobile Home / Other | 140 | 8.8% |
| Total | 1,586 | 100.0% |
Housing Structures by Occupancy in Baca County
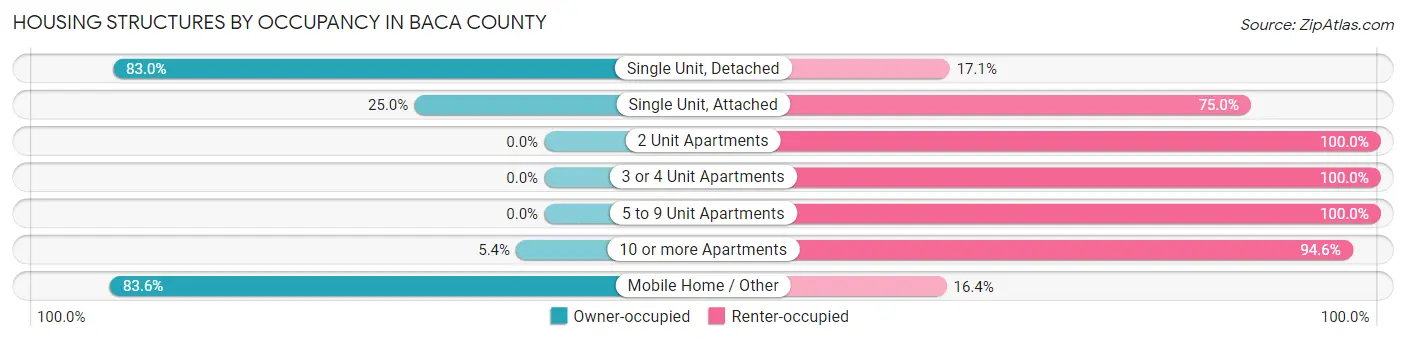
| Structure Type | Owner-occupied | Renter-occupied |
| Single Unit, Detached | 1,046 (83.0%) | 215 (17.1%) |
| Single Unit, Attached | 2 (25.0%) | 6 (75.0%) |
| 2 Unit Apartments | 0 (0.0%) | 56 (100.0%) |
| 3 or 4 Unit Apartments | 0 (0.0%) | 23 (100.0%) |
| 5 to 9 Unit Apartments | 0 (0.0%) | 24 (100.0%) |
| 10 or more Apartments | 4 (5.4%) | 70 (94.6%) |
| Mobile Home / Other | 117 (83.6%) | 23 (16.4%) |
| Total | 1,169 (73.7%) | 417 (26.3%) |
Housing Structures by Number of Rooms in Baca County
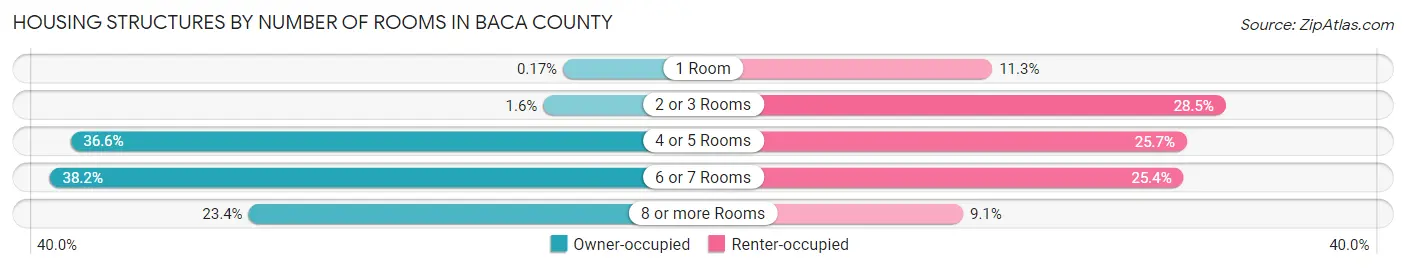
| Number of Rooms | Owner-occupied | Renter-occupied |
| 1 Room | 2 (0.2%) | 47 (11.3%) |
| 2 or 3 Rooms | 19 (1.6%) | 119 (28.5%) |
| 4 or 5 Rooms | 428 (36.6%) | 107 (25.7%) |
| 6 or 7 Rooms | 446 (38.2%) | 106 (25.4%) |
| 8 or more Rooms | 274 (23.4%) | 38 (9.1%) |
| Total | 1,169 (100.0%) | 417 (100.0%) |
Housing Structure by Heating Type in Baca County
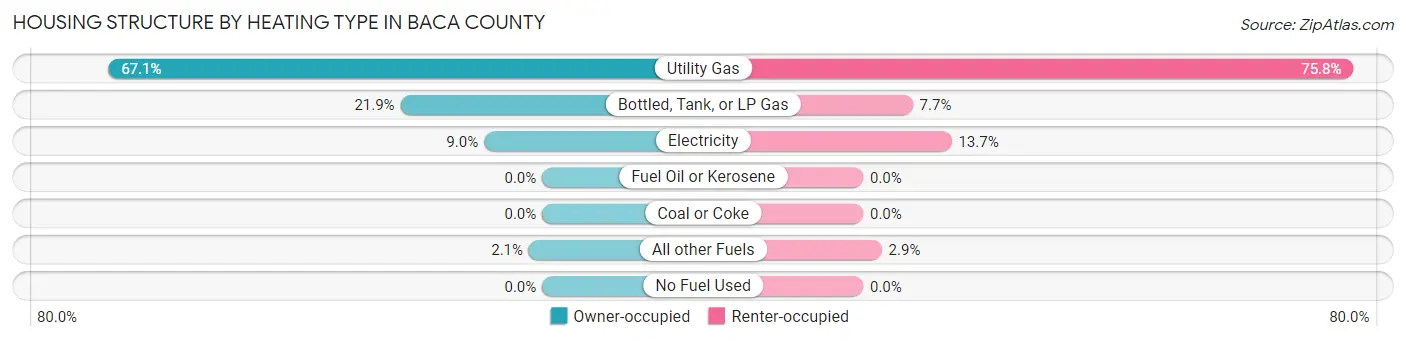
| Heating Type | Owner-occupied | Renter-occupied |
| Utility Gas | 784 (67.1%) | 316 (75.8%) |
| Bottled, Tank, or LP Gas | 256 (21.9%) | 32 (7.7%) |
| Electricity | 105 (9.0%) | 57 (13.7%) |
| Fuel Oil or Kerosene | 0 (0.0%) | 0 (0.0%) |
| Coal or Coke | 0 (0.0%) | 0 (0.0%) |
| All other Fuels | 24 (2.1%) | 12 (2.9%) |
| No Fuel Used | 0 (0.0%) | 0 (0.0%) |
| Total | 1,169 (100.0%) | 417 (100.0%) |
Household Vehicle Usage in Baca County
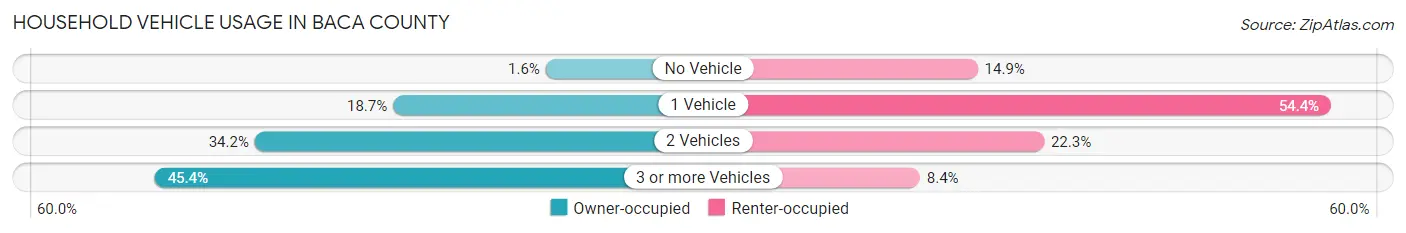
| Vehicles per Household | Owner-occupied | Renter-occupied |
| No Vehicle | 19 (1.6%) | 62 (14.9%) |
| 1 Vehicle | 219 (18.7%) | 227 (54.4%) |
| 2 Vehicles | 400 (34.2%) | 93 (22.3%) |
| 3 or more Vehicles | 531 (45.4%) | 35 (8.4%) |
| Total | 1,169 (100.0%) | 417 (100.0%) |
Real Estate & Mortgages in Baca County
Real Estate and Mortgage Overview in Baca County
| Characteristic | Without Mortgage | With Mortgage |
| Housing Units | 752 | 417 |
| Median Property Value | $118,800 | $120,800 |
| Median Household Income | $50,893 | $40 |
| Monthly Housing Costs | $453 | $6 |
| Real Estate Taxes | $404 | $28 |
Property Value by Mortgage Status in Baca County
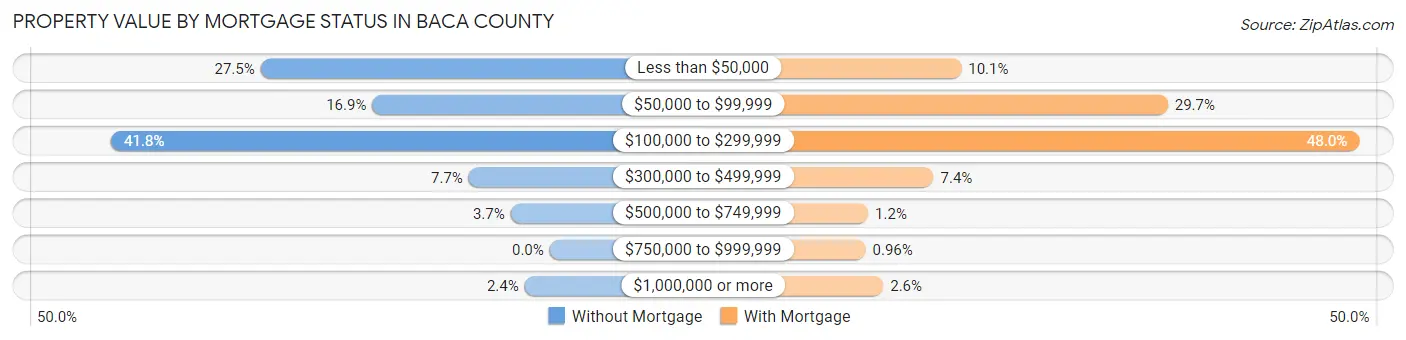
| Property Value | Without Mortgage | With Mortgage |
| Less than $50,000 | 207 (27.5%) | 42 (10.1%) |
| $50,000 to $99,999 | 127 (16.9%) | 124 (29.7%) |
| $100,000 to $299,999 | 314 (41.8%) | 200 (48.0%) |
| $300,000 to $499,999 | 58 (7.7%) | 31 (7.4%) |
| $500,000 to $749,999 | 28 (3.7%) | 5 (1.2%) |
| $750,000 to $999,999 | 0 (0.0%) | 4 (1.0%) |
| $1,000,000 or more | 18 (2.4%) | 11 (2.6%) |
| Total | 752 (100.0%) | 417 (100.0%) |
Household Income by Mortgage Status in Baca County
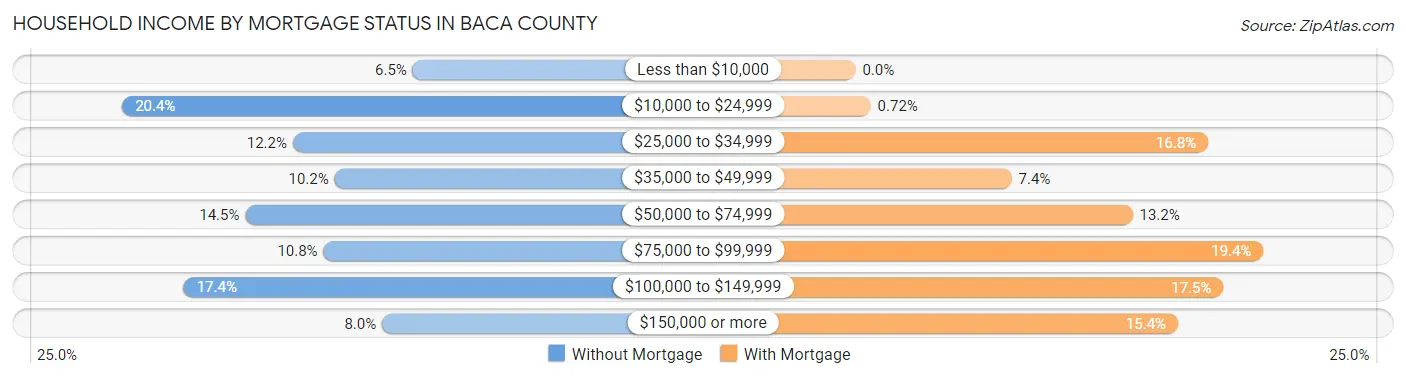
| Household Income | Without Mortgage | With Mortgage |
| Less than $10,000 | 49 (6.5%) | 0 (0.0%) |
| $10,000 to $24,999 | 153 (20.3%) | 3 (0.7%) |
| $25,000 to $34,999 | 92 (12.2%) | 70 (16.8%) |
| $35,000 to $49,999 | 77 (10.2%) | 31 (7.4%) |
| $50,000 to $74,999 | 109 (14.5%) | 55 (13.2%) |
| $75,000 to $99,999 | 81 (10.8%) | 81 (19.4%) |
| $100,000 to $149,999 | 131 (17.4%) | 73 (17.5%) |
| $150,000 or more | 60 (8.0%) | 64 (15.3%) |
| Total | 752 (100.0%) | 417 (100.0%) |
Property Value to Household Income Ratio in Baca County
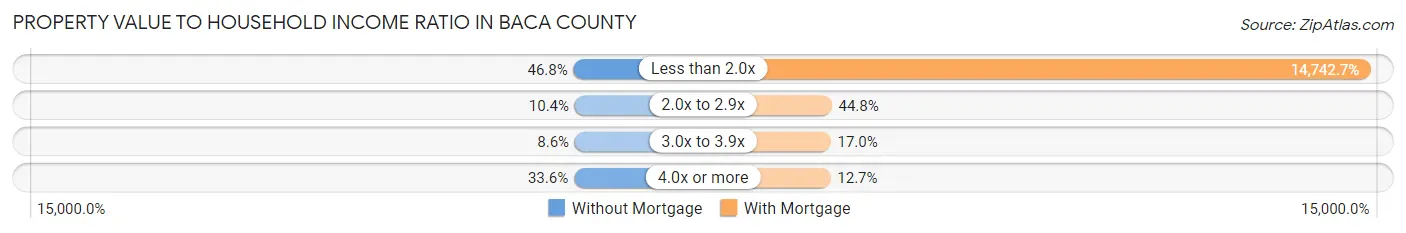
| Value-to-Income Ratio | Without Mortgage | With Mortgage |
| Less than 2.0x | 352 (46.8%) | 61,477 (14,742.7%) |
| 2.0x to 2.9x | 78 (10.4%) | 187 (44.8%) |
| 3.0x to 3.9x | 65 (8.6%) | 71 (17.0%) |
| 4.0x or more | 253 (33.6%) | 53 (12.7%) |
| Total | 752 (100.0%) | 417 (100.0%) |
Real Estate Taxes by Mortgage Status in Baca County
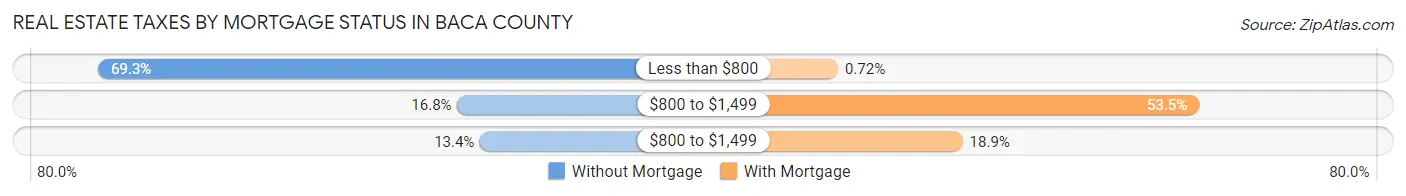
| Property Taxes | Without Mortgage | With Mortgage |
| Less than $800 | 521 (69.3%) | 3 (0.7%) |
| $800 to $1,499 | 126 (16.8%) | 223 (53.5%) |
| $800 to $1,499 | 101 (13.4%) | 79 (18.9%) |
| Total | 752 (100.0%) | 417 (100.0%) |
Health & Disability in Baca County
Health Insurance Coverage by Age in Baca County
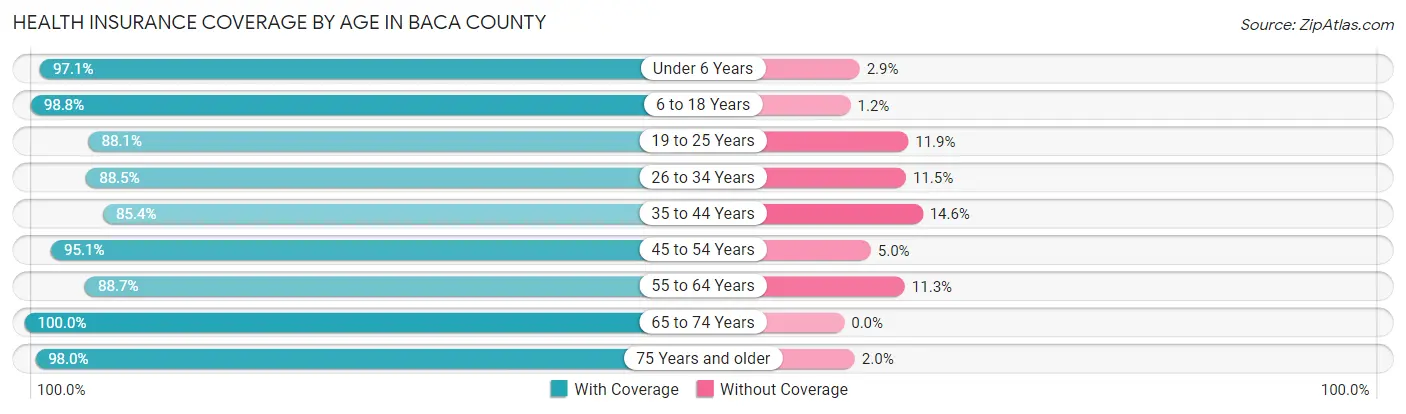
| Age Bracket | With Coverage | Without Coverage |
| Under 6 Years | 202 (97.1%) | 6 (2.9%) |
| 6 to 18 Years | 588 (98.8%) | 7 (1.2%) |
| 19 to 25 Years | 192 (88.1%) | 26 (11.9%) |
| 26 to 34 Years | 269 (88.5%) | 35 (11.5%) |
| 35 to 44 Years | 444 (85.4%) | 76 (14.6%) |
| 45 to 54 Years | 288 (95.1%) | 15 (5.0%) |
| 55 to 64 Years | 424 (88.7%) | 54 (11.3%) |
| 65 to 74 Years | 425 (100.0%) | 0 (0.0%) |
| 75 Years and older | 346 (98.0%) | 7 (2.0%) |
| Total | 3,178 (93.4%) | 226 (6.6%) |
Health Insurance Coverage by Citizenship Status in Baca County
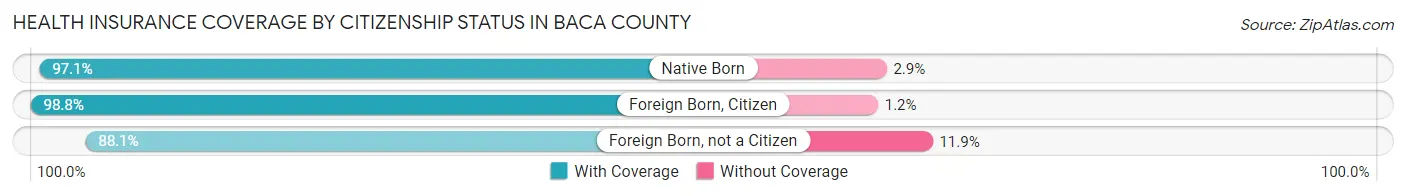
| Citizenship Status | With Coverage | Without Coverage |
| Native Born | 202 (97.1%) | 6 (2.9%) |
| Foreign Born, Citizen | 588 (98.8%) | 7 (1.2%) |
| Foreign Born, not a Citizen | 192 (88.1%) | 26 (11.9%) |
Health Insurance Coverage by Household Income in Baca County
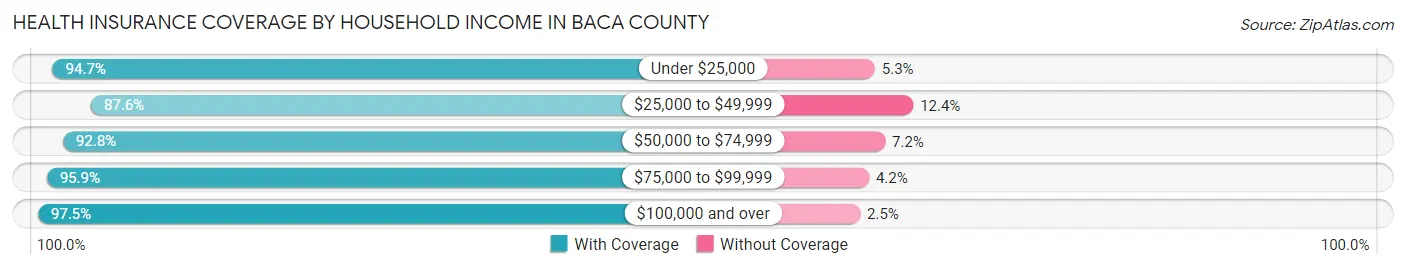
| Household Income | With Coverage | Without Coverage |
| Under $25,000 | 703 (94.7%) | 39 (5.3%) |
| $25,000 to $49,999 | 753 (87.6%) | 107 (12.4%) |
| $50,000 to $74,999 | 569 (92.8%) | 44 (7.2%) |
| $75,000 to $99,999 | 370 (95.9%) | 16 (4.2%) |
| $100,000 and over | 783 (97.5%) | 20 (2.5%) |
Public vs Private Health Insurance Coverage by Age in Baca County
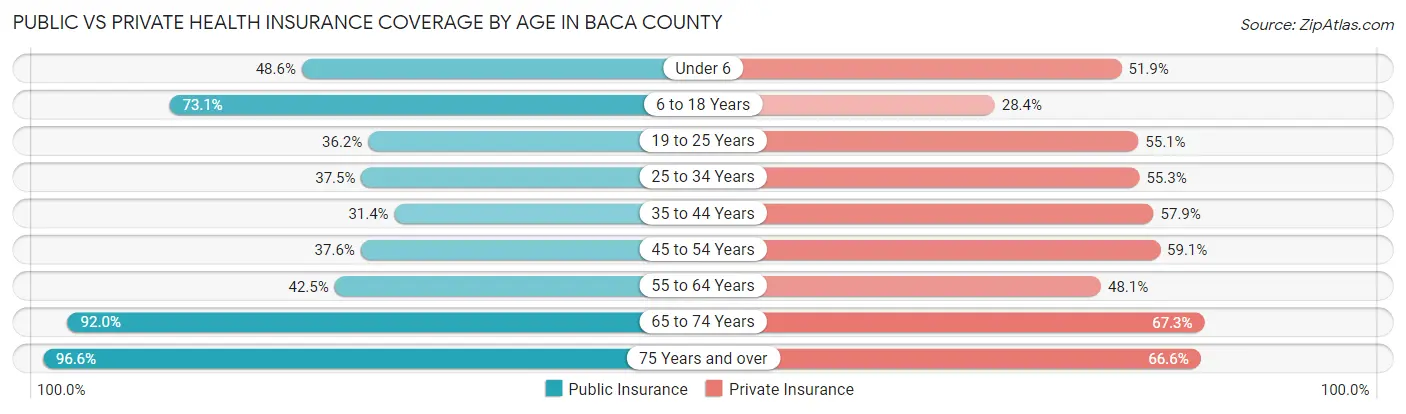
| Age Bracket | Public Insurance | Private Insurance |
| Under 6 | 101 (48.6%) | 108 (51.9%) |
| 6 to 18 Years | 435 (73.1%) | 169 (28.4%) |
| 19 to 25 Years | 79 (36.2%) | 120 (55.0%) |
| 25 to 34 Years | 114 (37.5%) | 168 (55.3%) |
| 35 to 44 Years | 163 (31.4%) | 301 (57.9%) |
| 45 to 54 Years | 114 (37.6%) | 179 (59.1%) |
| 55 to 64 Years | 203 (42.5%) | 230 (48.1%) |
| 65 to 74 Years | 391 (92.0%) | 286 (67.3%) |
| 75 Years and over | 341 (96.6%) | 235 (66.6%) |
| Total | 1,941 (57.0%) | 1,796 (52.8%) |
Disability Status by Sex by Age in Baca County
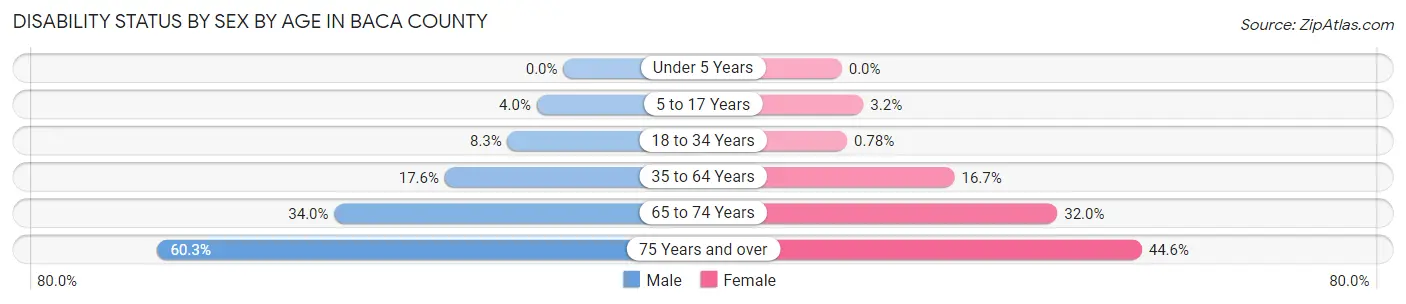
| Age Bracket | Male | Female |
| Under 5 Years | 0 (0.0%) | 0 (0.0%) |
| 5 to 17 Years | 13 (4.0%) | 9 (3.2%) |
| 18 to 34 Years | 24 (8.3%) | 2 (0.8%) |
| 35 to 64 Years | 107 (17.6%) | 116 (16.7%) |
| 65 to 74 Years | 68 (34.0%) | 72 (32.0%) |
| 75 Years and over | 91 (60.3%) | 90 (44.6%) |
Disability Class by Sex by Age in Baca County
Disability Class: Hearing Difficulty
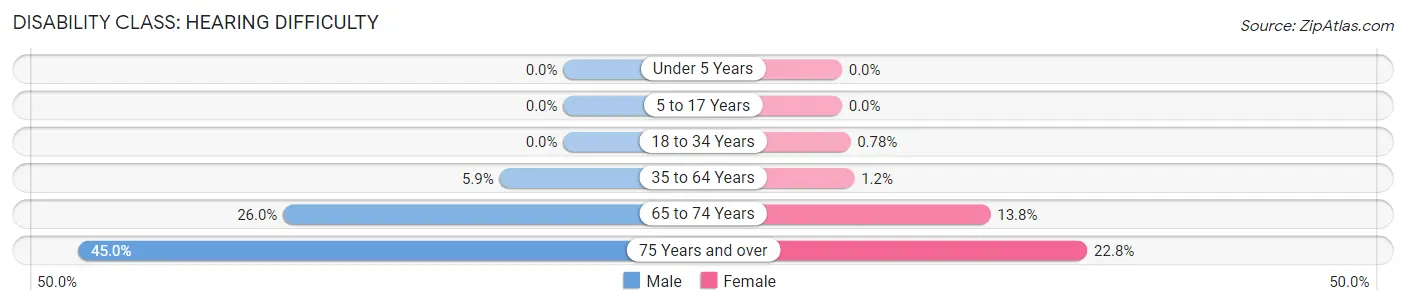
| Age Bracket | Male | Female |
| Under 5 Years | 0 (0.0%) | 0 (0.0%) |
| 5 to 17 Years | 0 (0.0%) | 0 (0.0%) |
| 18 to 34 Years | 0 (0.0%) | 2 (0.8%) |
| 35 to 64 Years | 36 (5.9%) | 8 (1.1%) |
| 65 to 74 Years | 52 (26.0%) | 31 (13.8%) |
| 75 Years and over | 68 (45.0%) | 46 (22.8%) |
Disability Class: Vision Difficulty
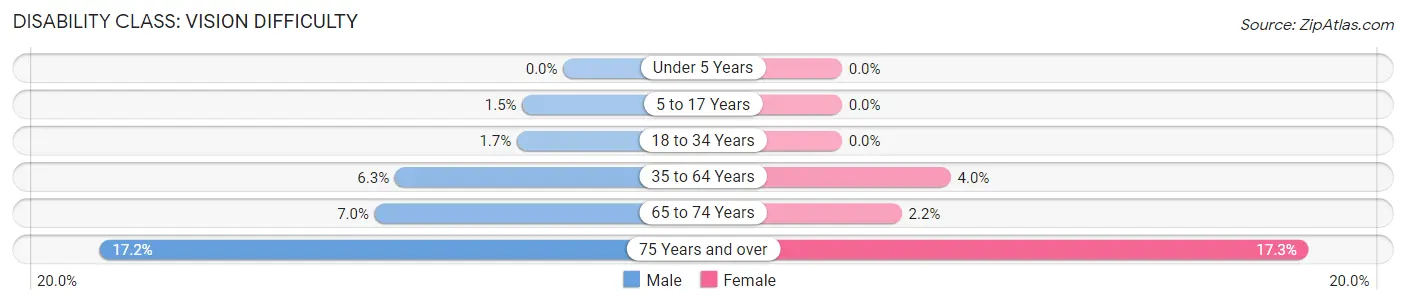
| Age Bracket | Male | Female |
| Under 5 Years | 0 (0.0%) | 0 (0.0%) |
| 5 to 17 Years | 5 (1.5%) | 0 (0.0%) |
| 18 to 34 Years | 5 (1.7%) | 0 (0.0%) |
| 35 to 64 Years | 38 (6.2%) | 28 (4.0%) |
| 65 to 74 Years | 14 (7.0%) | 5 (2.2%) |
| 75 Years and over | 26 (17.2%) | 35 (17.3%) |
Disability Class: Cognitive Difficulty
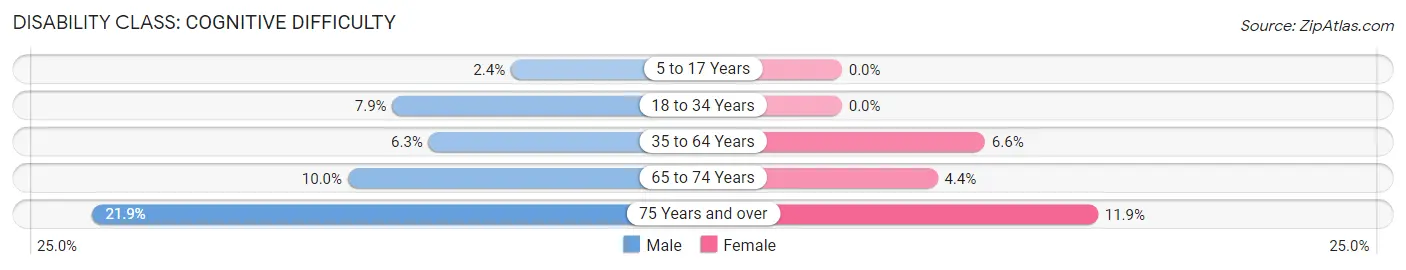
| Age Bracket | Male | Female |
| 5 to 17 Years | 8 (2.4%) | 0 (0.0%) |
| 18 to 34 Years | 23 (7.9%) | 0 (0.0%) |
| 35 to 64 Years | 38 (6.2%) | 46 (6.6%) |
| 65 to 74 Years | 20 (10.0%) | 10 (4.4%) |
| 75 Years and over | 33 (21.8%) | 24 (11.9%) |
Disability Class: Ambulatory Difficulty
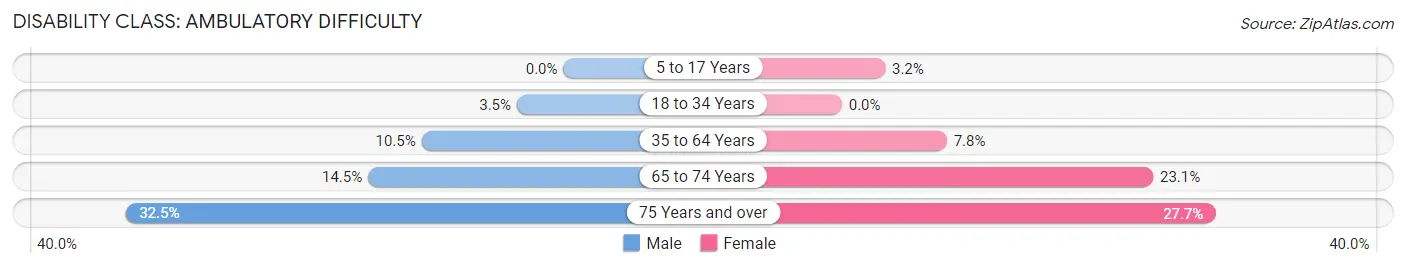
| Age Bracket | Male | Female |
| 5 to 17 Years | 0 (0.0%) | 9 (3.2%) |
| 18 to 34 Years | 10 (3.5%) | 0 (0.0%) |
| 35 to 64 Years | 64 (10.5%) | 54 (7.8%) |
| 65 to 74 Years | 29 (14.5%) | 52 (23.1%) |
| 75 Years and over | 49 (32.5%) | 56 (27.7%) |
Disability Class: Self-Care Difficulty

| Age Bracket | Male | Female |
| 5 to 17 Years | 0 (0.0%) | 0 (0.0%) |
| 18 to 34 Years | 10 (3.5%) | 0 (0.0%) |
| 35 to 64 Years | 29 (4.8%) | 0 (0.0%) |
| 65 to 74 Years | 6 (3.0%) | 0 (0.0%) |
| 75 Years and over | 27 (17.9%) | 19 (9.4%) |
Technology Access in Baca County
Computing Device Access in Baca County
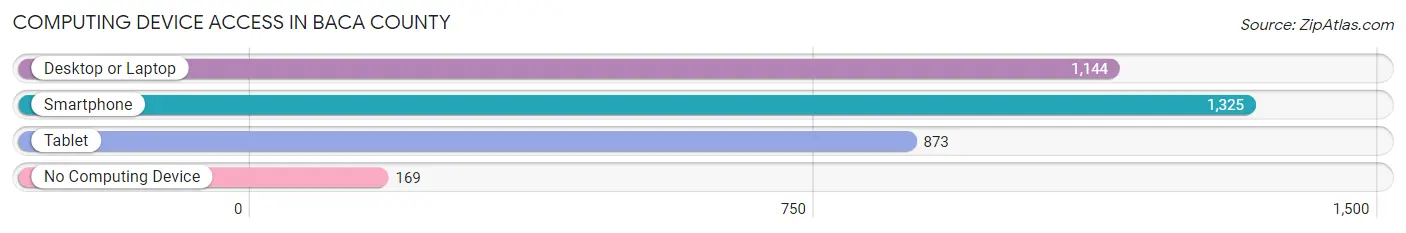
| Device Type | # Households | % Households |
| Desktop or Laptop | 1,144 | 72.1% |
| Smartphone | 1,325 | 83.5% |
| Tablet | 873 | 55.0% |
| No Computing Device | 169 | 10.7% |
| Total | 1,586 | 100.0% |
Internet Access in Baca County
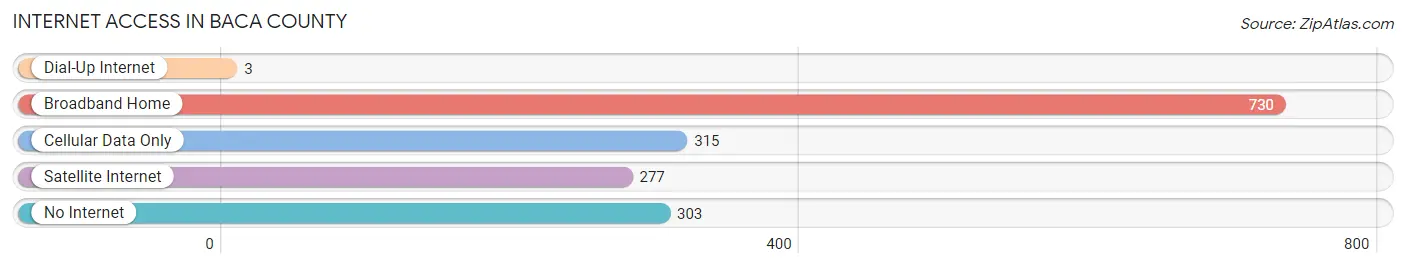
| Internet Type | # Households | % Households |
| Dial-Up Internet | 3 | 0.2% |
| Broadband Home | 730 | 46.0% |
| Cellular Data Only | 315 | 19.9% |
| Satellite Internet | 277 | 17.5% |
| No Internet | 303 | 19.1% |
| Total | 1,586 | 100.0% |
Baca County Summary
Baca County is located in the southeastern corner of Colorado, and is bordered by Kansas to the east, Oklahoma to the south, and New Mexico to the west. The county seat is Springfield, and the county is named after Felipe Baca, a prominent early settler. Baca County covers an area of 1,890 square miles, and has a population of 5,717 as of the 2010 census.
Geography
Baca County is located in the southeastern corner of Colorado, and is bordered by Kansas to the east, Oklahoma to the south, and New Mexico to the west. The county is located in the High Plains region of the state, and is characterized by flat to rolling terrain. The county is drained by the Arkansas River, which flows through the western part of the county. The county is also home to several small lakes, including Lake Meredith, which is located in the northern part of the county.
The climate of Baca County is semi-arid, with hot summers and cold winters. The average annual precipitation is around 16 inches, with most of it falling in the spring and summer months.
History
Baca County was established in 1889, and was named after Felipe Baca, a prominent early settler. The county was originally part of Las Animas County, but was split off in 1889. The county seat was originally located in Springfield, but was moved to Springfield in 1891.
The county was largely agricultural in its early years, with wheat, corn, and other crops being grown. The county also had a thriving cattle industry, with many ranchers raising cattle on the open range.
In the early 20th century, the county began to diversify its economy, with oil and gas production becoming an important part of the local economy. The county also began to attract tourists, with the opening of the Great Sand Dunes National Park in 1932.
Economy
The economy of Baca County is largely based on agriculture and tourism. The county is home to several large farms, which produce wheat, corn, and other crops. The county also has a thriving cattle industry, with many ranchers raising cattle on the open range.
The county is also home to several oil and gas fields, which provide jobs and revenue for the county. Tourism is also an important part of the local economy, with the Great Sand Dunes National Park being a major draw for visitors.
Demographics
As of the 2010 census, Baca County had a population of 5,717. The racial makeup of the county was 95.3% White, 0.3% African American, 0.7% Native American, 0.2% Asian, 0.1% Pacific Islander, 2.2% from other races, and 1.3% from two or more races. Hispanic or Latino of any race were 5.3% of the population.
The median income for a household in the county was $35,938, and the median income for a family was $41,944. The per capita income for the county was $17,845. About 11.2% of families and 14.2% of the population were below the poverty line, including 18.2% of those under age 18 and 8.2% of those age 65 or over.
Common Questions
What is Per Capita Income in Baca County?
Per Capita income in Baca County is $28,115.
What is the Median Family Income in Baca County?
Median Family Income in Baca County is $65,735.
What is the Median Household income in Baca County?
Median Household Income in Baca County is $42,115.
What is Income or Wage Gap in Baca County?
Income or Wage Gap in Baca County is 28.9%.
Women in Baca County earn 71.1 cents for every dollar earned by a man.
What is Family Income Deficit in Baca County?
Family Income Deficit in Baca County is $6,955.
Families that are below poverty line in Baca County earn $6,955 less on average than the poverty threshold level.
What is Inequality or Gini Index in Baca County?
Inequality or Gini Index in Baca County is 0.49.
What is the Total Population of Baca County?
Total Population of Baca County is 3,496.
What is the Total Male Population of Baca County?
Total Male Population of Baca County is 1,731.
What is the Total Female Population of Baca County?
Total Female Population of Baca County is 1,765.
What is the Ratio of Males per 100 Females in Baca County?
There are 98.07 Males per 100 Females in Baca County.
What is the Ratio of Females per 100 Males in Baca County?
There are 101.96 Females per 100 Males in Baca County.
What is the Median Population Age in Baca County?
Median Population Age in Baca County is 42.0 Years.
What is the Average Family Size in Baca County
Average Family Size in Baca County is 2.9 People.
What is the Average Household Size in Baca County
Average Household Size in Baca County is 2.1 People.
How Large is the Labor Force in Baca County?
There are 1,519 People in the Labor Forcein in Baca County.
What is the Percentage of People in the Labor Force in Baca County?
54.6% of People are in the Labor Force in Baca County.
What is the Unemployment Rate in Baca County?
Unemployment Rate in Baca County is 1.7%.