Archuleta County, CO Map & Demographics
Archuleta County Map
Archuleta County Overview
$39,155
PER CAPITA INCOME
$78,896
AVG FAMILY INCOME
$66,813
AVG HOUSEHOLD INCOME
29.4%
WAGE / INCOME GAP [ % ]
70.6¢/ $1
WAGE / INCOME GAP [ $ ]
0.44
INEQUALITY / GINI INDEX
13,509
TOTAL POPULATION
6,827
MALE POPULATION
6,682
FEMALE POPULATION
102.17
MALES / 100 FEMALES
97.88
FEMALES / 100 MALES
50.8
MEDIAN AGE
2.7
AVG FAMILY SIZE
2.3
AVG HOUSEHOLD SIZE
6,293
LABOR FORCE [ PEOPLE ]
55.4%
PERCENT IN LABOR FORCE
4.8%
UNEMPLOYMENT RATE
Archuleta County Area Codes
Income in Archuleta County
Income Overview in Archuleta County
Per Capita Income in Archuleta County is $39,155, while median incomes of families and households are $78,896 and $66,813 respectively.
| Characteristic | Number | Measure |
| Per Capita Income | 13,509 | $39,155 |
| Median Family Income | 4,036 | $78,896 |
| Mean Family Income | 4,036 | $105,641 |
| Median Household Income | 5,738 | $66,813 |
| Mean Household Income | 5,738 | $90,766 |
| Income Deficit | 4,036 | $0 |
| Wage / Income Gap (%) | 13,509 | 29.36% |
| Wage / Income Gap ($) | 13,509 | 70.64¢ per $1 |
| Gini / Inequality Index | 13,509 | 0.44 |
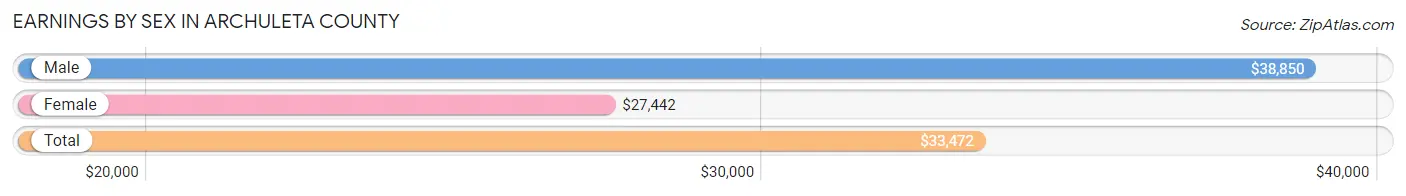
Earnings by Sex in Archuleta County
Average Earnings in Archuleta County are $33,472, $38,850 for men and $27,442 for women, a difference of 29.4%.
| Sex | Number | Average Earnings |
| Male | 3,644 (53.5%) | $38,850 |
| Female | 3,168 (46.5%) | $27,442 |
| Total | 6,812 (100.0%) | $33,472 |
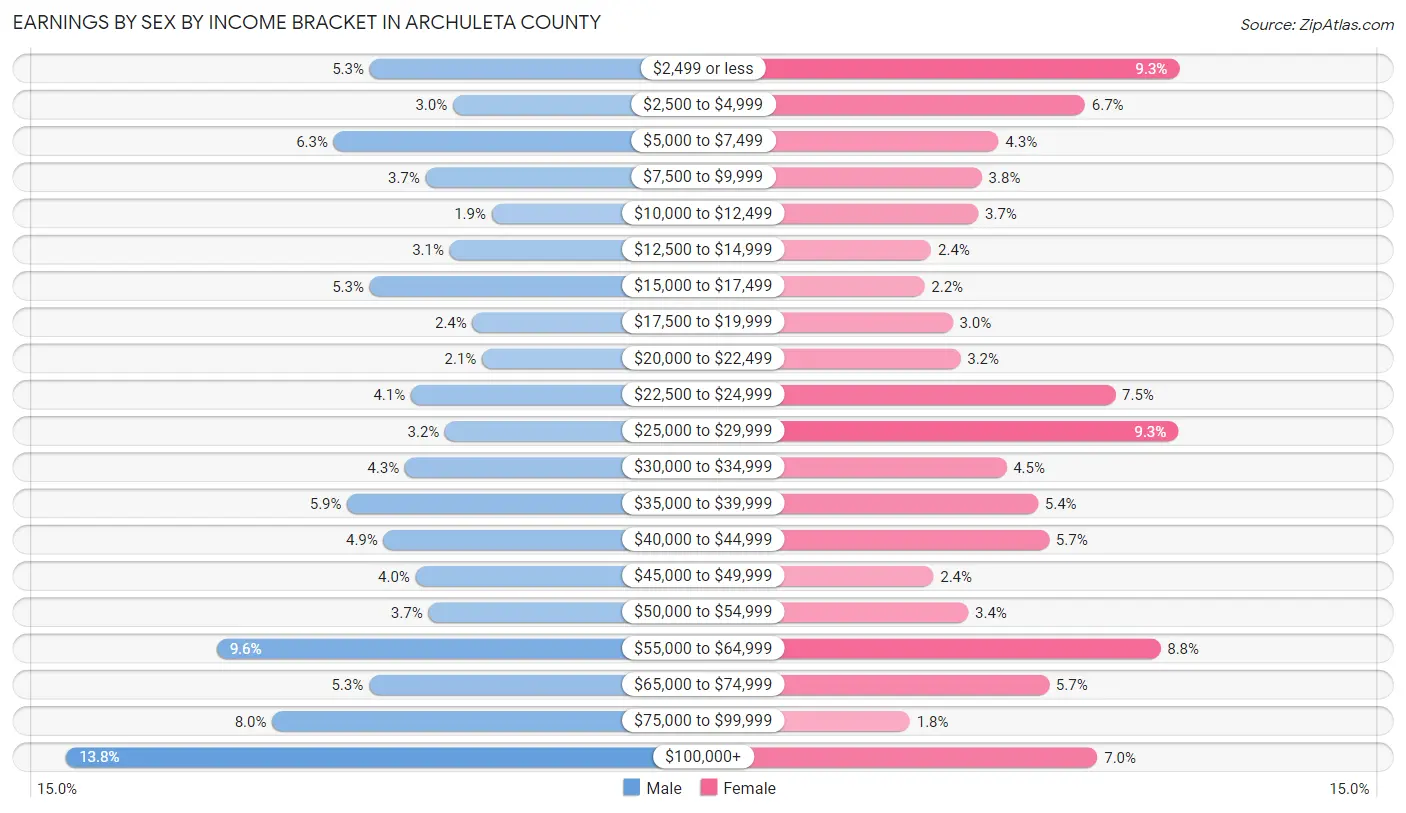
Earnings by Sex by Income Bracket in Archuleta County
The most common earnings brackets in Archuleta County are $100,000+ for men (504 | 13.8%) and $2,499 or less for women (296 | 9.3%).
| Income | Male | Female |
| $2,499 or less | 193 (5.3%) | 296 (9.3%) |
| $2,500 to $4,999 | 108 (3.0%) | 212 (6.7%) |
| $5,000 to $7,499 | 230 (6.3%) | 135 (4.3%) |
| $7,500 to $9,999 | 136 (3.7%) | 120 (3.8%) |
| $10,000 to $12,499 | 68 (1.9%) | 117 (3.7%) |
| $12,500 to $14,999 | 111 (3.0%) | 75 (2.4%) |
| $15,000 to $17,499 | 193 (5.3%) | 69 (2.2%) |
| $17,500 to $19,999 | 88 (2.4%) | 94 (3.0%) |
| $20,000 to $22,499 | 78 (2.1%) | 101 (3.2%) |
| $22,500 to $24,999 | 151 (4.1%) | 239 (7.5%) |
| $25,000 to $29,999 | 116 (3.2%) | 295 (9.3%) |
| $30,000 to $34,999 | 157 (4.3%) | 142 (4.5%) |
| $35,000 to $39,999 | 216 (5.9%) | 170 (5.4%) |
| $40,000 to $44,999 | 179 (4.9%) | 180 (5.7%) |
| $45,000 to $49,999 | 146 (4.0%) | 77 (2.4%) |
| $50,000 to $54,999 | 133 (3.6%) | 108 (3.4%) |
| $55,000 to $64,999 | 350 (9.6%) | 279 (8.8%) |
| $65,000 to $74,999 | 194 (5.3%) | 180 (5.7%) |
| $75,000 to $99,999 | 293 (8.0%) | 56 (1.8%) |
| $100,000+ | 504 (13.8%) | 223 (7.0%) |
| Total | 3,644 (100.0%) | 3,168 (100.0%) |
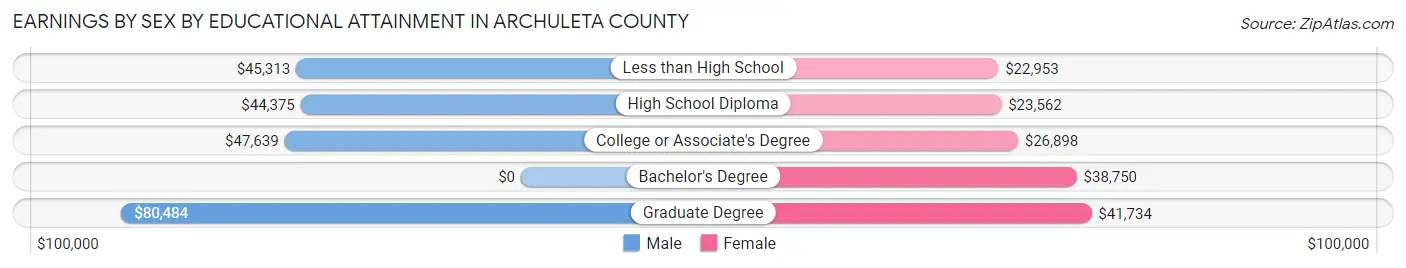
Earnings by Sex by Educational Attainment in Archuleta County
Average earnings in Archuleta County are $44,330 for men and $28,825 for women, a difference of 35.0%. Men with an educational attainment of graduate degree enjoy the highest average annual earnings of $80,484, while those with high school diploma education earn the least with $44,375. Women with an educational attainment of graduate degree earn the most with the average annual earnings of $41,734, while those with less than high school education have the smallest earnings of $22,953.
| Educational Attainment | Male Income | Female Income |
| Less than High School | $45,313 | $22,953 |
| High School Diploma | $44,375 | $23,562 |
| College or Associate's Degree | $47,639 | $26,898 |
| Bachelor's Degree | - | - |
| Graduate Degree | $80,484 | $41,734 |
| Total | $44,330 | $28,825 |
Family Income in Archuleta County
Family Income Brackets in Archuleta County
According to the Archuleta County family income data, there are 864 families falling into the $100,000 to $149,999 income range, which is the most common income bracket and makes up 21.4% of all families. Conversely, the $10,000 to $14,999 income bracket is the least frequent group with only 32 families (0.8%) belonging to this category.
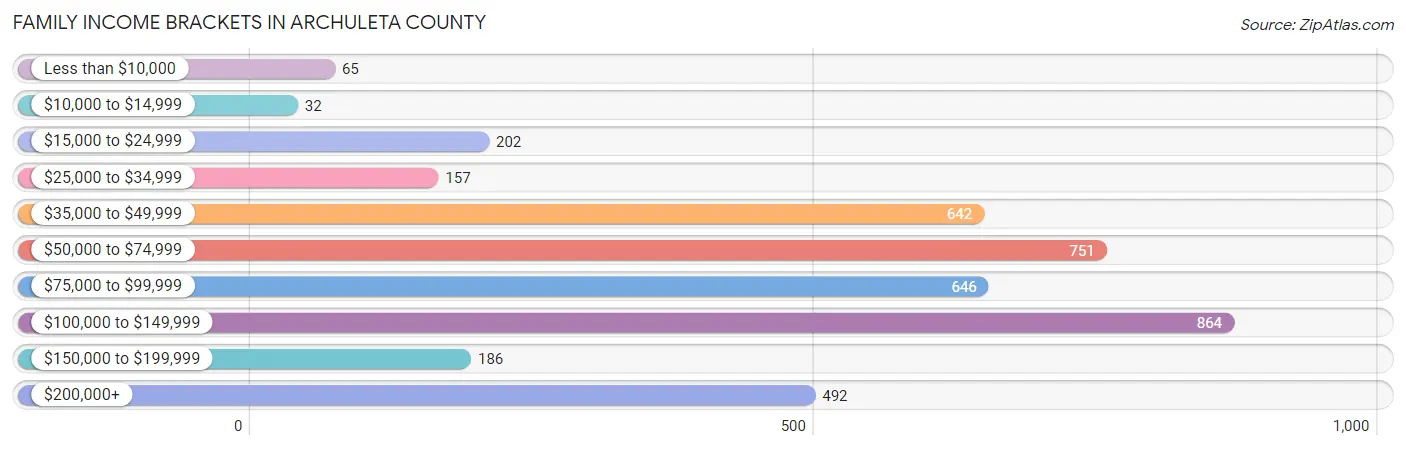
| Income Bracket | # Families | % Families |
| Less than $10,000 | 65 | 1.6% |
| $10,000 to $14,999 | 32 | 0.8% |
| $15,000 to $24,999 | 202 | 5.0% |
| $25,000 to $34,999 | 157 | 3.9% |
| $35,000 to $49,999 | 642 | 15.9% |
| $50,000 to $74,999 | 751 | 18.6% |
| $75,000 to $99,999 | 646 | 16.0% |
| $100,000 to $149,999 | 864 | 21.4% |
| $150,000 to $199,999 | 186 | 4.6% |
| $200,000+ | 492 | 12.2% |
Family Income by Famaliy Size in Archuleta County
6-person families (63 | 1.6%) account for the highest median family income in Archuleta County with $184,417 per family, while 2-person families (2,621 | 64.9%) have the highest median income of $39,177 per family member.
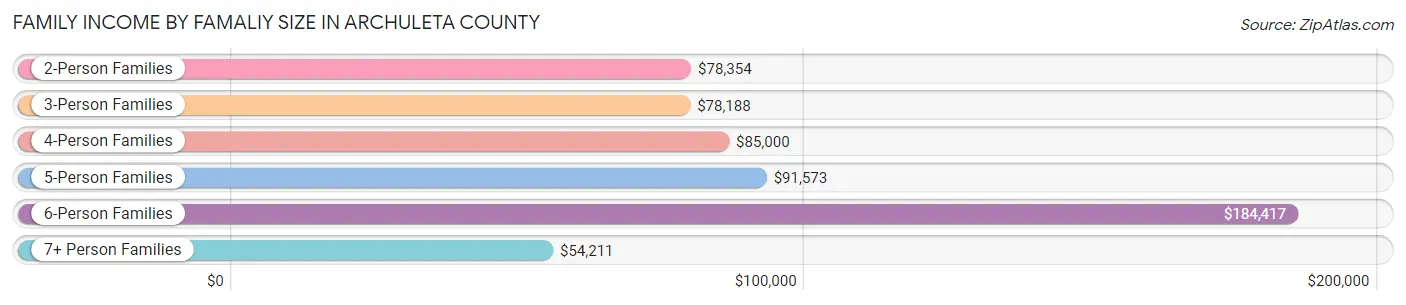
| Income Bracket | # Families | Median Income |
| 2-Person Families | 2,621 (64.9%) | $78,354 |
| 3-Person Families | 731 (18.1%) | $78,188 |
| 4-Person Families | 384 (9.5%) | $85,000 |
| 5-Person Families | 159 (3.9%) | $91,573 |
| 6-Person Families | 63 (1.6%) | $184,417 |
| 7+ Person Families | 78 (1.9%) | $54,211 |
| Total | 4,036 (100.0%) | $78,896 |
Family Income by Number of Earners in Archuleta County
The median family income in Archuleta County is $78,896, with families comprising 3+ earners (341) having the highest median family income of $95,083, while families with 1 earner (1,177) have the lowest median family income of $55,426, accounting for 8.5% and 29.2% of families, respectively.
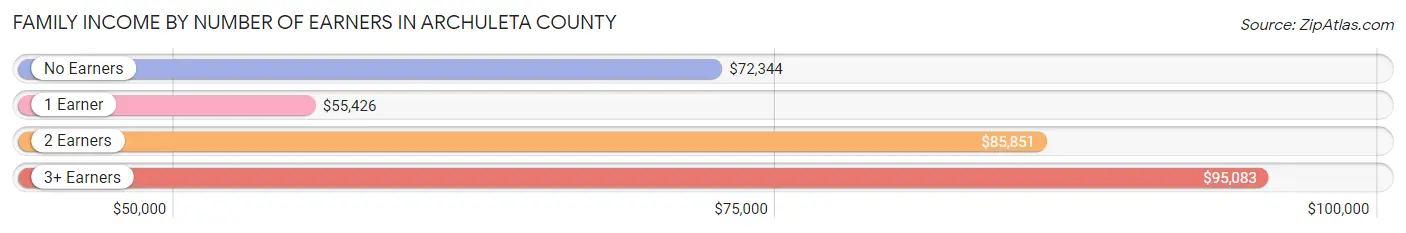
| Number of Earners | # Families | Median Income |
| No Earners | 1,044 (25.9%) | $72,344 |
| 1 Earner | 1,177 (29.2%) | $55,426 |
| 2 Earners | 1,474 (36.5%) | $85,851 |
| 3+ Earners | 341 (8.5%) | $95,083 |
| Total | 4,036 (100.0%) | $78,896 |
Household Income in Archuleta County
Household Income Brackets in Archuleta County
With 1,107 households falling in the category, the $50,000 to $74,999 income range is the most frequent in Archuleta County, accounting for 19.3% of all households. In contrast, only 143 households (2.5%) fall into the less than $10,000 income bracket, making it the least populous group.
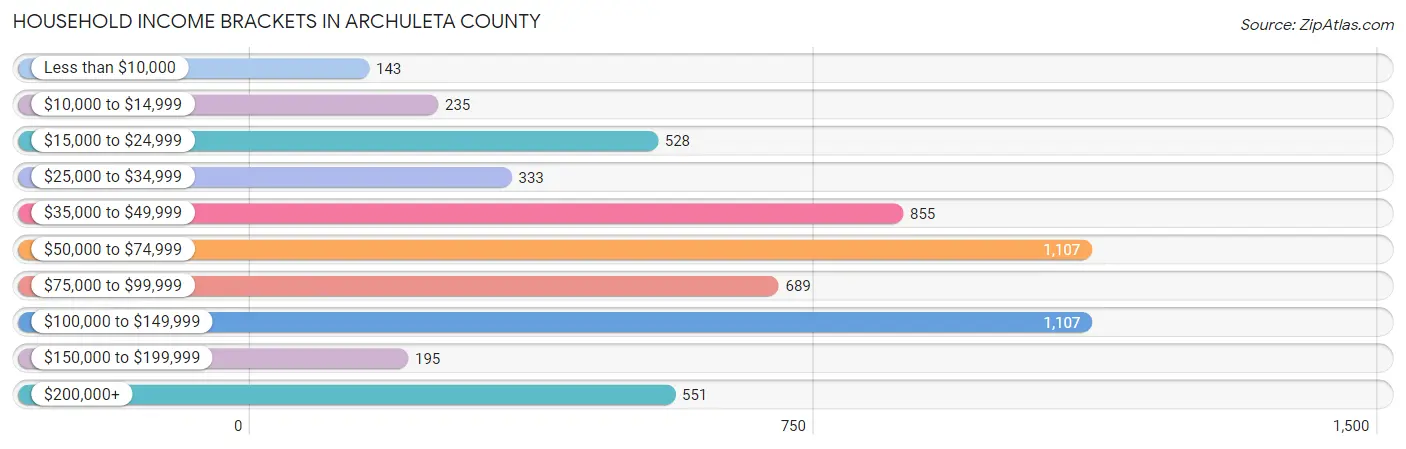
| Income Bracket | # Households | % Households |
| Less than $10,000 | 143 | 2.5% |
| $10,000 to $14,999 | 235 | 4.1% |
| $15,000 to $24,999 | 528 | 9.2% |
| $25,000 to $34,999 | 333 | 5.8% |
| $35,000 to $49,999 | 855 | 14.9% |
| $50,000 to $74,999 | 1,107 | 19.3% |
| $75,000 to $99,999 | 689 | 12.0% |
| $100,000 to $149,999 | 1,107 | 19.3% |
| $150,000 to $199,999 | 195 | 3.4% |
| $200,000+ | 551 | 9.6% |
Household Income by Householder Age in Archuleta County
The median household income in Archuleta County is $66,813, with the highest median household income of $89,471 found in the 45 to 64 years age bracket for the primary householder. A total of 1,857 households (32.4%) fall into this category. Meanwhile, the 15 to 24 years age bracket for the primary householder has the lowest median household income of $9,464, with 44 households (0.8%) in this group.
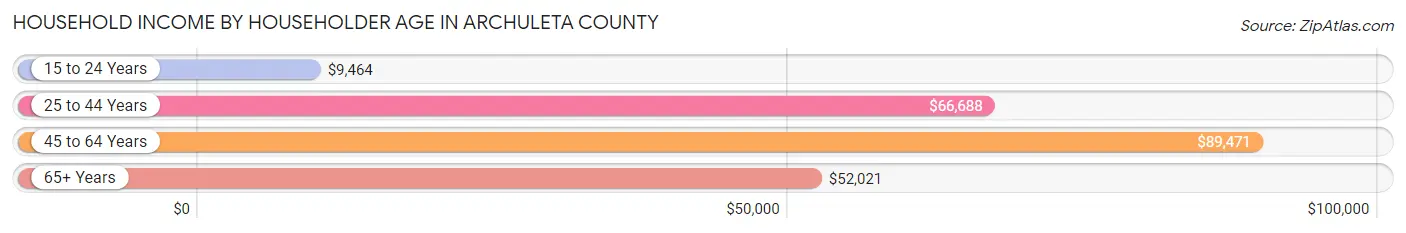
| Income Bracket | # Households | Median Income |
| 15 to 24 Years | 44 (0.8%) | $9,464 |
| 25 to 44 Years | 1,495 (26.1%) | $66,688 |
| 45 to 64 Years | 1,857 (32.4%) | $89,471 |
| 65+ Years | 2,342 (40.8%) | $52,021 |
| Total | 5,738 (100.0%) | $66,813 |
Poverty in Archuleta County
Income Below Poverty by Sex and Age in Archuleta County
With 8.6% poverty level for males and 7.7% for females among the residents of Archuleta County, 16 and 17 year old males and 12 to 14 year old females are the most vulnerable to poverty, with 46 males (26.4%) and 21 females (14.7%) in their respective age groups living below the poverty level.
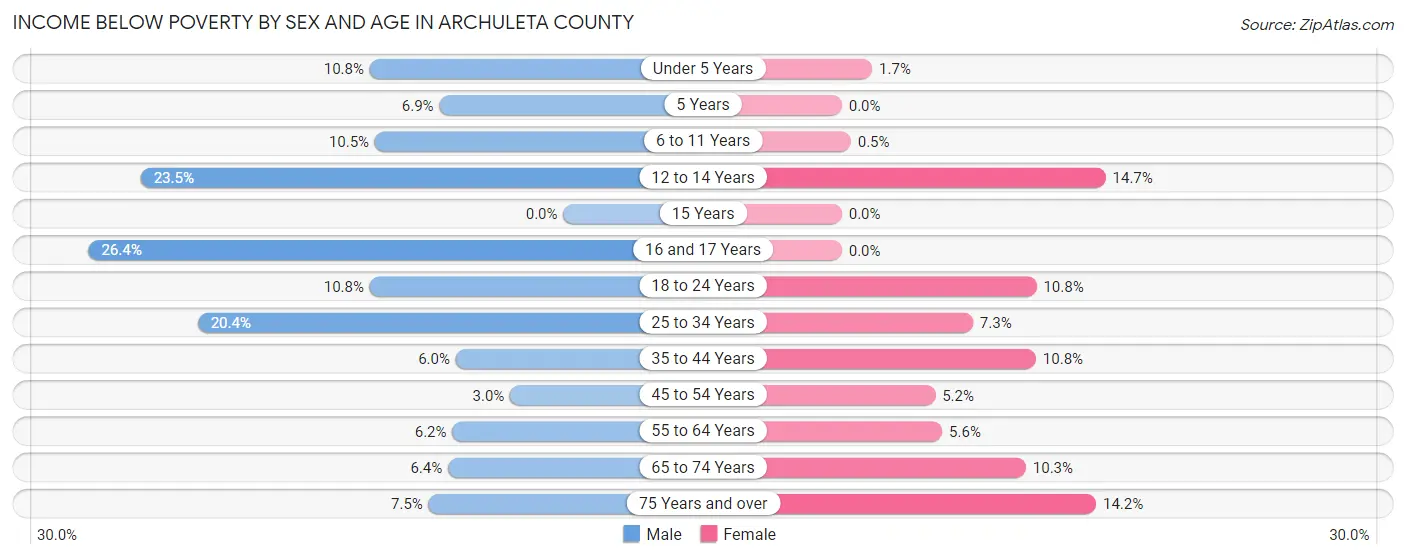
| Age Bracket | Male | Female |
| Under 5 Years | 22 (10.8%) | 6 (1.7%) |
| 5 Years | 4 (6.9%) | 0 (0.0%) |
| 6 to 11 Years | 58 (10.5%) | 2 (0.5%) |
| 12 to 14 Years | 40 (23.5%) | 21 (14.7%) |
| 15 Years | 0 (0.0%) | 0 (0.0%) |
| 16 and 17 Years | 46 (26.4%) | 0 (0.0%) |
| 18 to 24 Years | 43 (10.8%) | 31 (10.8%) |
| 25 to 34 Years | 101 (20.4%) | 52 (7.3%) |
| 35 to 44 Years | 52 (6.0%) | 88 (10.8%) |
| 45 to 54 Years | 23 (3.0%) | 35 (5.2%) |
| 55 to 64 Years | 70 (6.2%) | 71 (5.6%) |
| 65 to 74 Years | 83 (6.4%) | 125 (10.2%) |
| 75 Years and over | 39 (7.5%) | 80 (14.2%) |
| Total | 581 (8.6%) | 511 (7.7%) |
Income Above Poverty by Sex and Age in Archuleta County
According to the poverty statistics in Archuleta County, males aged 15 years and females aged 5 years are the age groups that are most secure financially, with 100.0% of males and 100.0% of females in these age groups living above the poverty line.
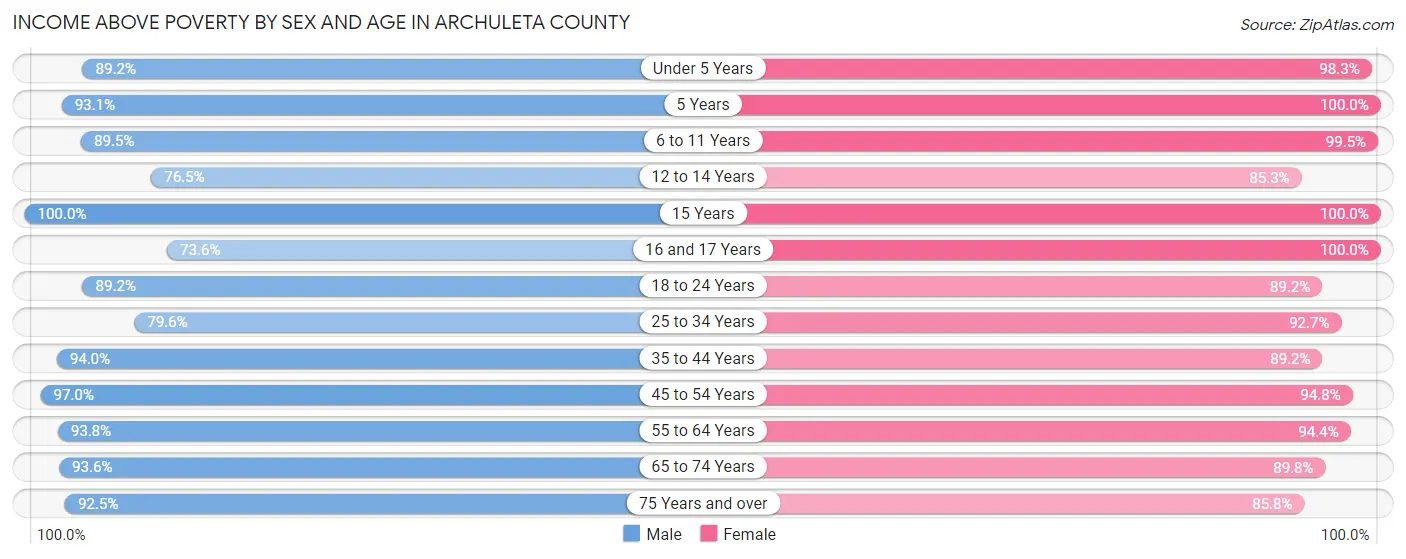
| Age Bracket | Male | Female |
| Under 5 Years | 182 (89.2%) | 349 (98.3%) |
| 5 Years | 54 (93.1%) | 113 (100.0%) |
| 6 to 11 Years | 495 (89.5%) | 402 (99.5%) |
| 12 to 14 Years | 130 (76.5%) | 122 (85.3%) |
| 15 Years | 85 (100.0%) | 39 (100.0%) |
| 16 and 17 Years | 128 (73.6%) | 70 (100.0%) |
| 18 to 24 Years | 356 (89.2%) | 255 (89.2%) |
| 25 to 34 Years | 395 (79.6%) | 660 (92.7%) |
| 35 to 44 Years | 816 (94.0%) | 726 (89.2%) |
| 45 to 54 Years | 753 (97.0%) | 638 (94.8%) |
| 55 to 64 Years | 1,062 (93.8%) | 1,199 (94.4%) |
| 65 to 74 Years | 1,209 (93.6%) | 1,095 (89.7%) |
| 75 Years and over | 481 (92.5%) | 485 (85.8%) |
| Total | 6,146 (91.4%) | 6,153 (92.3%) |
Income Below Poverty Among Married-Couple Families in Archuleta County
The poverty statistics for married-couple families in Archuleta County show that 3.1% or 109 of the total 3,545 families live below the poverty line. Families with 3 or 4 children have the highest poverty rate of 4.0%, comprising of 4 families. On the other hand, families with 5 or more children have the lowest poverty rate of 0.0%, which includes 0 families.
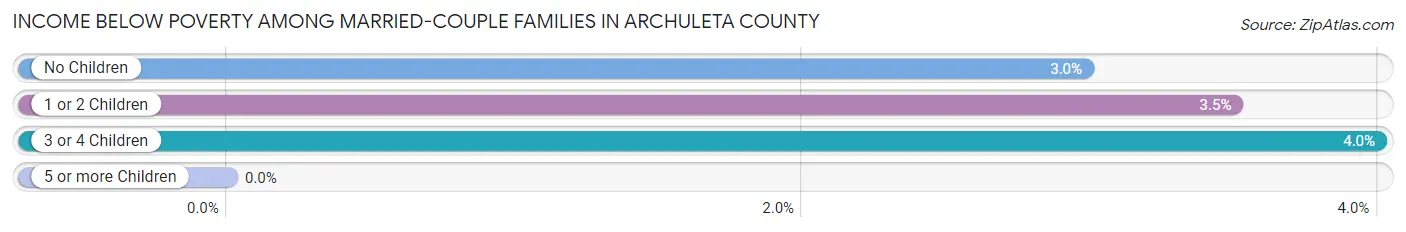
| Children | Above Poverty | Below Poverty |
| No Children | 2,538 (97.0%) | 78 (3.0%) |
| 1 or 2 Children | 745 (96.5%) | 27 (3.5%) |
| 3 or 4 Children | 96 (96.0%) | 4 (4.0%) |
| 5 or more Children | 57 (100.0%) | 0 (0.0%) |
| Total | 3,436 (96.9%) | 109 (3.1%) |
Income Below Poverty Among Single-Parent Households in Archuleta County
According to the poverty data in Archuleta County, 10.2% or 14 single-father households and 19.2% or 68 single-mother households are living below the poverty line. Among single-father households, those with no children have the highest poverty rate, with 14 households (16.9%) experiencing poverty. Likewise, among single-mother households, those with 1 or 2 children have the highest poverty rate, with 53 households (28.8%) falling below the poverty line.

| Children | Single Father | Single Mother |
| No Children | 14 (16.9%) | 15 (9.6%) |
| 1 or 2 Children | 0 (0.0%) | 53 (28.8%) |
| 3 or 4 Children | 0 (0.0%) | 0 (0.0%) |
| 5 or more Children | 0 (0.0%) | 0 (0.0%) |
| Total | 14 (10.2%) | 68 (19.2%) |
Income Below Poverty Among Married-Couple vs Single-Parent Households in Archuleta County
The poverty data for Archuleta County shows that 109 of the married-couple family households (3.1%) and 82 of the single-parent households (16.7%) are living below the poverty level. Within the married-couple family households, those with 3 or 4 children have the highest poverty rate, with 4 households (4.0%) falling below the poverty line. Among the single-parent households, those with 1 or 2 children have the highest poverty rate, with 53 household (24.8%) living below poverty.
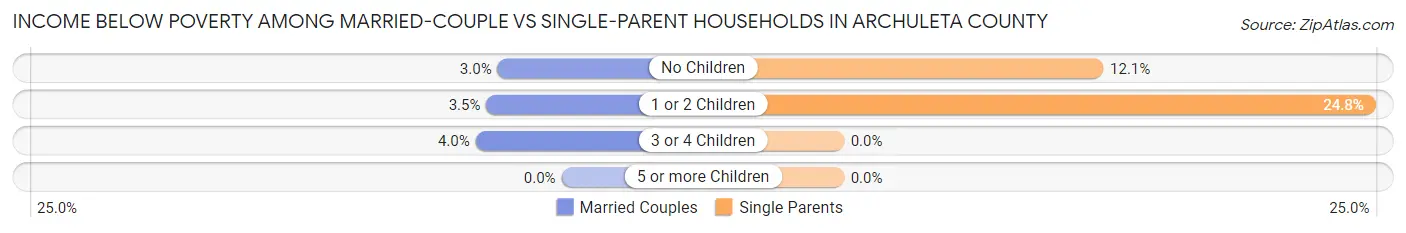
| Children | Married-Couple Families | Single-Parent Households |
| No Children | 78 (3.0%) | 29 (12.1%) |
| 1 or 2 Children | 27 (3.5%) | 53 (24.8%) |
| 3 or 4 Children | 4 (4.0%) | 0 (0.0%) |
| 5 or more Children | 0 (0.0%) | 0 (0.0%) |
| Total | 109 (3.1%) | 82 (16.7%) |
Race in Archuleta County
The most populous races in Archuleta County are White / Caucasian (10,759 | 79.6%), Hispanic or Latino (2,498 | 18.5%), and Some other Race (1,608 | 11.9%).
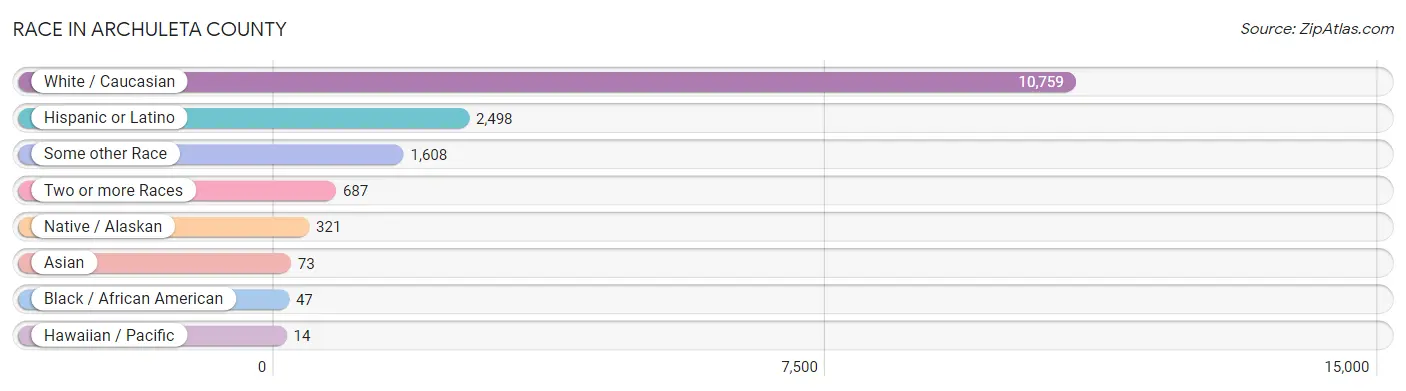
| Race | # Population | % Population |
| Asian | 73 | 0.5% |
| Black / African American | 47 | 0.4% |
| Hawaiian / Pacific | 14 | 0.1% |
| Hispanic or Latino | 2,498 | 18.5% |
| Native / Alaskan | 321 | 2.4% |
| White / Caucasian | 10,759 | 79.6% |
| Two or more Races | 687 | 5.1% |
| Some other Race | 1,608 | 11.9% |
| Total | 13,509 | 100.0% |
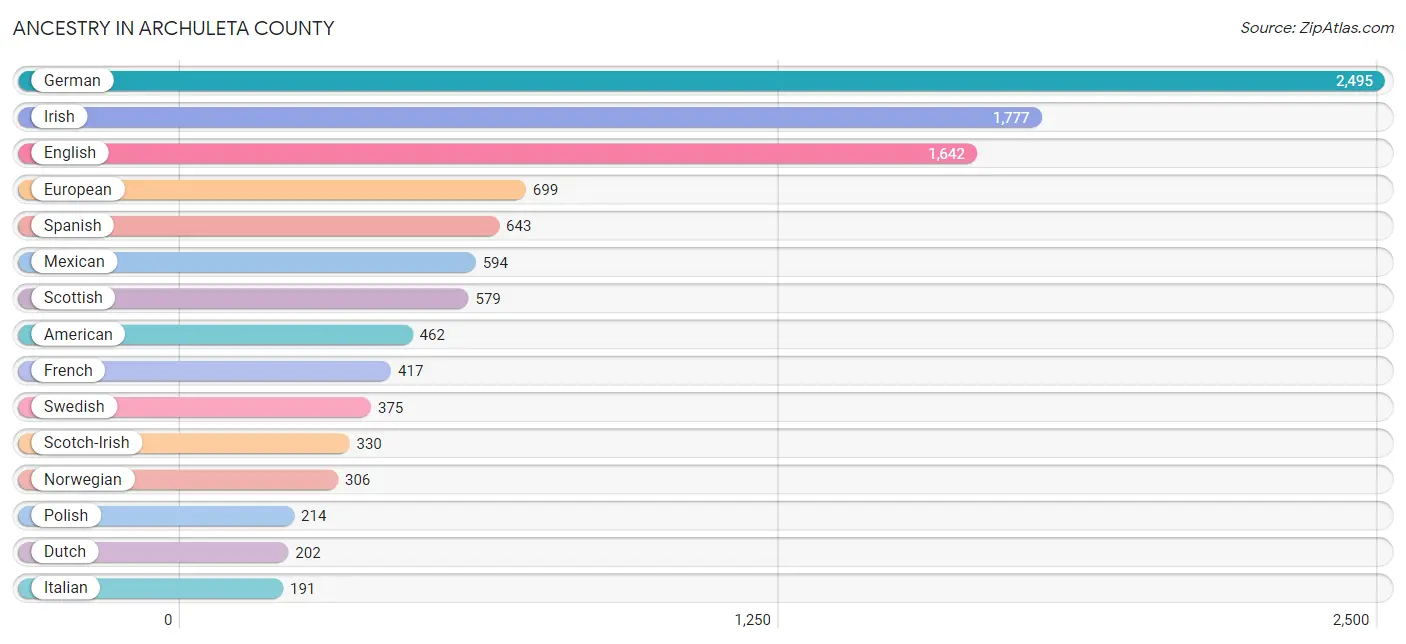
Ancestry in Archuleta County
The most populous ancestries reported in Archuleta County are German (2,495 | 18.5%), Irish (1,777 | 13.2%), English (1,642 | 12.1%), European (699 | 5.2%), and Spanish (643 | 4.8%), together accounting for 53.7% of all Archuleta County residents.
| Ancestry | # Population | % Population |
| African | 20 | 0.2% |
| American | 462 | 3.4% |
| Apache | 6 | 0.0% |
| Arab | 5 | 0.0% |
| Armenian | 21 | 0.2% |
| Australian | 15 | 0.1% |
| Austrian | 71 | 0.5% |
| Basque | 20 | 0.2% |
| Belgian | 20 | 0.2% |
| Bhutanese | 8 | 0.1% |
| Blackfeet | 6 | 0.0% |
| British | 141 | 1.0% |
| Burmese | 30 | 0.2% |
| Cajun | 6 | 0.0% |
| Cambodian | 21 | 0.2% |
| Canadian | 4 | 0.0% |
| Cherokee | 60 | 0.4% |
| Croatian | 24 | 0.2% |
| Czech | 22 | 0.2% |
| Czechoslovakian | 9 | 0.1% |
| Danish | 56 | 0.4% |
| Dutch | 202 | 1.5% |
| Eastern European | 13 | 0.1% |
| Egyptian | 5 | 0.0% |
| English | 1,642 | 12.1% |
| European | 699 | 5.2% |
| Finnish | 15 | 0.1% |
| French | 417 | 3.1% |
| French Canadian | 81 | 0.6% |
| German | 2,495 | 18.5% |
| Greek | 18 | 0.1% |
| Hungarian | 30 | 0.2% |
| Icelander | 5 | 0.0% |
| Indian (Asian) | 28 | 0.2% |
| Irish | 1,777 | 13.2% |
| Iroquois | 1 | 0.0% |
| Italian | 191 | 1.4% |
| Lithuanian | 28 | 0.2% |
| Maltese | 24 | 0.2% |
| Mexican | 594 | 4.4% |
| Native Hawaiian | 81 | 0.6% |
| Navajo | 5 | 0.0% |
| Northern European | 42 | 0.3% |
| Norwegian | 306 | 2.3% |
| Osage | 29 | 0.2% |
| Polish | 214 | 1.6% |
| Portuguese | 10 | 0.1% |
| Pueblo | 1 | 0.0% |
| Puerto Rican | 24 | 0.2% |
| Russian | 108 | 0.8% |
| Scandinavian | 86 | 0.6% |
| Scotch-Irish | 330 | 2.4% |
| Scottish | 579 | 4.3% |
| Sioux | 65 | 0.5% |
| Slavic | 5 | 0.0% |
| Spaniard | 74 | 0.5% |
| Spanish | 643 | 4.8% |
| Subsaharan African | 24 | 0.2% |
| Swedish | 375 | 2.8% |
| Swiss | 45 | 0.3% |
| Thai | 15 | 0.1% |
| Ukrainian | 29 | 0.2% |
| Ute | 25 | 0.2% |
| Welsh | 143 | 1.1% |
| Yugoslavian | 11 | 0.1% |
| Yuman | 54 | 0.4% | View All 66 Rows |
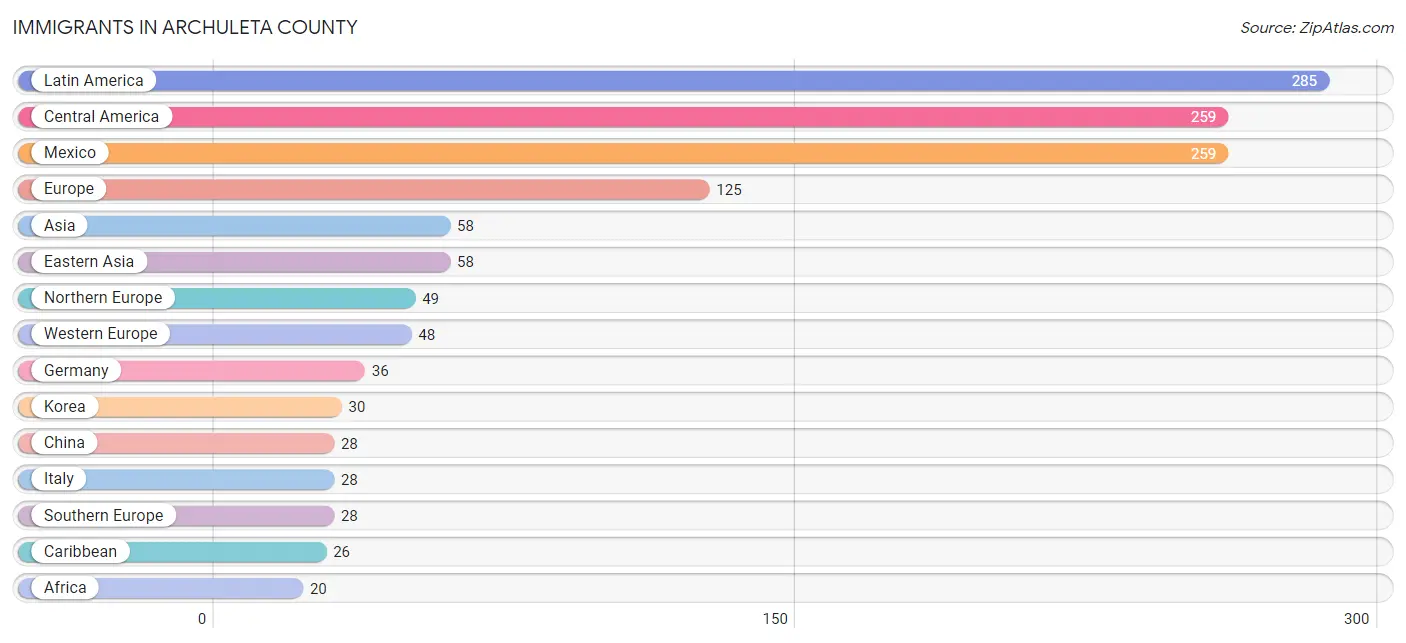
Immigrants in Archuleta County
The most numerous immigrant groups reported in Archuleta County came from Latin America (285 | 2.1%), Central America (259 | 1.9%), Mexico (259 | 1.9%), Europe (125 | 0.9%), and Asia (58 | 0.4%), together accounting for 7.3% of all Archuleta County residents.
| Immigration Origin | # Population | % Population |
| Africa | 20 | 0.2% |
| Asia | 58 | 0.4% |
| Canada | 13 | 0.1% |
| Caribbean | 26 | 0.2% |
| Central America | 259 | 1.9% |
| China | 28 | 0.2% |
| Eastern Africa | 4 | 0.0% |
| Eastern Asia | 58 | 0.4% |
| England | 15 | 0.1% |
| Europe | 125 | 0.9% |
| France | 12 | 0.1% |
| Germany | 36 | 0.3% |
| Haiti | 20 | 0.2% |
| Italy | 28 | 0.2% |
| Korea | 30 | 0.2% |
| Latin America | 285 | 2.1% |
| Mexico | 259 | 1.9% |
| Northern Europe | 49 | 0.4% |
| Scotland | 6 | 0.0% |
| South Africa | 16 | 0.1% |
| Southern Europe | 28 | 0.2% |
| West Indies | 6 | 0.0% |
| Western Europe | 48 | 0.4% | View All 23 Rows |
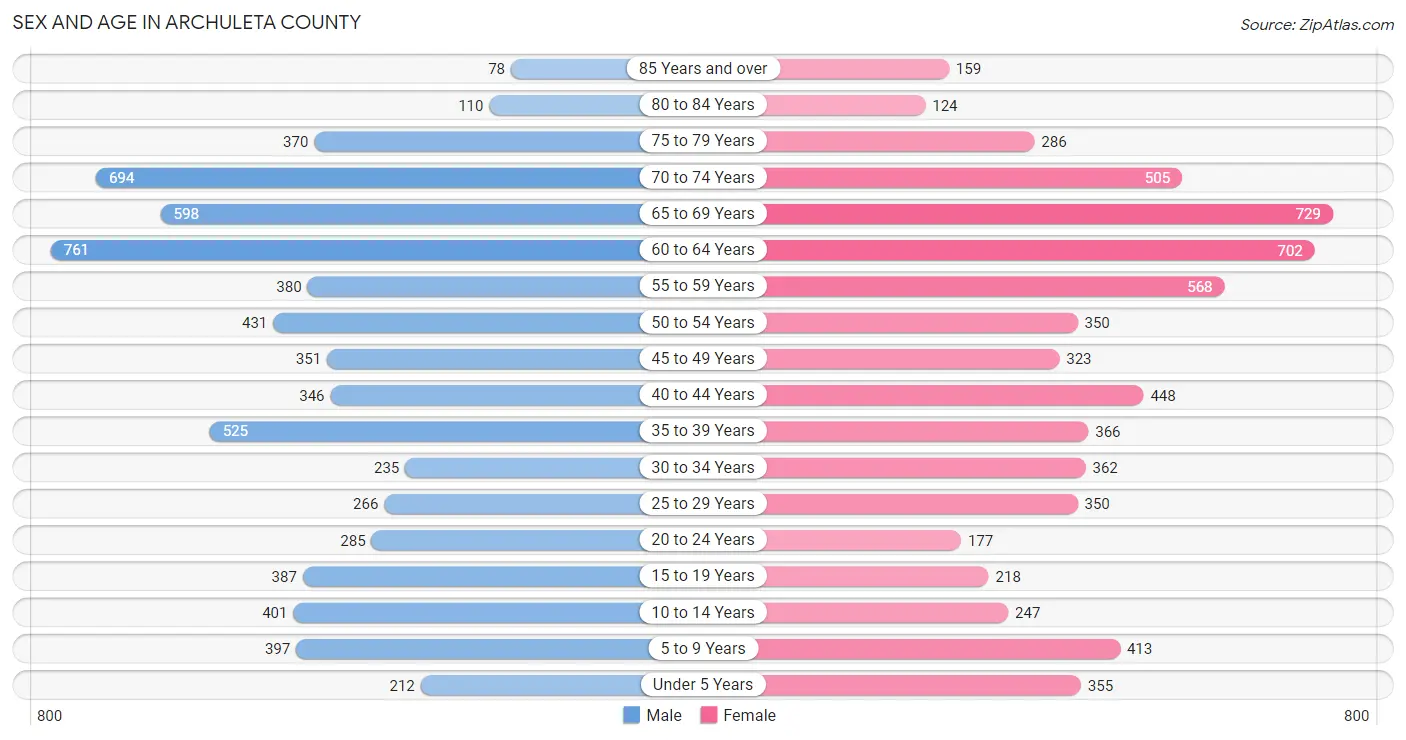
Sex and Age in Archuleta County
Sex and Age in Archuleta County
The most populous age groups in Archuleta County are 60 to 64 Years (761 | 11.2%) for men and 65 to 69 Years (729 | 10.9%) for women.
| Age Bracket | Male | Female |
| Under 5 Years | 212 (3.1%) | 355 (5.3%) |
| 5 to 9 Years | 397 (5.8%) | 413 (6.2%) |
| 10 to 14 Years | 401 (5.9%) | 247 (3.7%) |
| 15 to 19 Years | 387 (5.7%) | 218 (3.3%) |
| 20 to 24 Years | 285 (4.2%) | 177 (2.6%) |
| 25 to 29 Years | 266 (3.9%) | 350 (5.2%) |
| 30 to 34 Years | 235 (3.4%) | 362 (5.4%) |
| 35 to 39 Years | 525 (7.7%) | 366 (5.5%) |
| 40 to 44 Years | 346 (5.1%) | 448 (6.7%) |
| 45 to 49 Years | 351 (5.1%) | 323 (4.8%) |
| 50 to 54 Years | 431 (6.3%) | 350 (5.2%) |
| 55 to 59 Years | 380 (5.6%) | 568 (8.5%) |
| 60 to 64 Years | 761 (11.2%) | 702 (10.5%) |
| 65 to 69 Years | 598 (8.8%) | 729 (10.9%) |
| 70 to 74 Years | 694 (10.2%) | 505 (7.6%) |
| 75 to 79 Years | 370 (5.4%) | 286 (4.3%) |
| 80 to 84 Years | 110 (1.6%) | 124 (1.9%) |
| 85 Years and over | 78 (1.1%) | 159 (2.4%) |
| Total | 6,827 (100.0%) | 6,682 (100.0%) |
Families and Households in Archuleta County
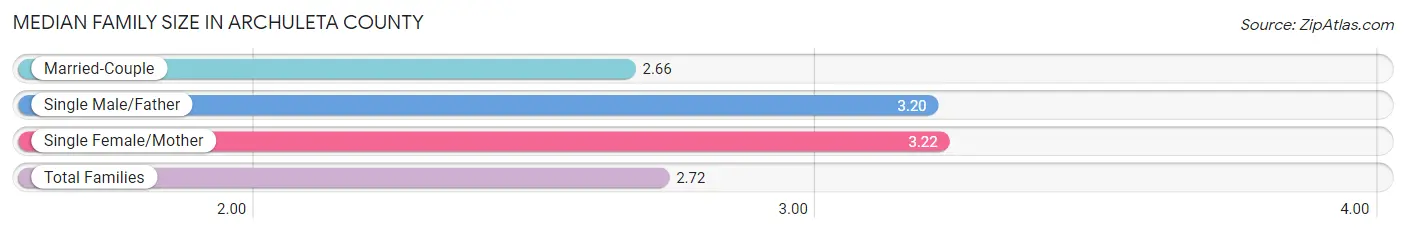
Median Family Size in Archuleta County
The median family size in Archuleta County is 2.72 persons per family, with single female/mother families (354 | 8.8%) accounting for the largest median family size of 3.22 persons per family. On the other hand, married-couple families (3,545 | 87.8%) represent the smallest median family size with 2.66 persons per family.
| Family Type | # Families | Family Size |
| Married-Couple | 3,545 (87.8%) | 2.66 |
| Single Male/Father | 137 (3.4%) | 3.20 |
| Single Female/Mother | 354 (8.8%) | 3.22 |
| Total Families | 4,036 (100.0%) | 2.72 |
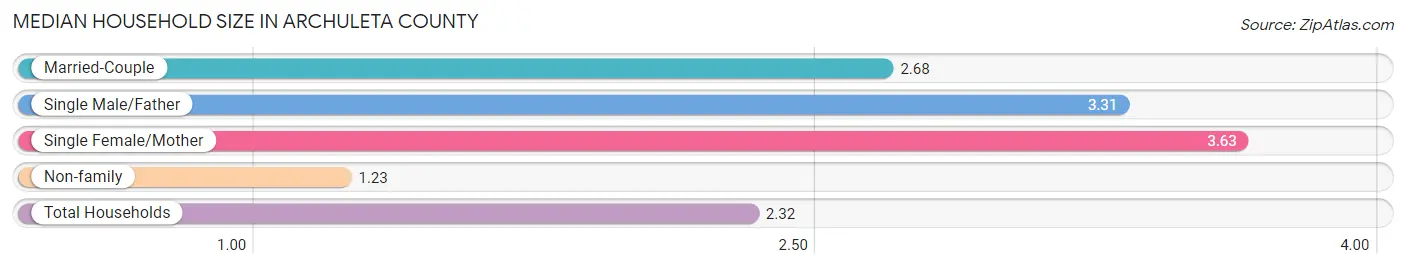
Median Household Size in Archuleta County
The median household size in Archuleta County is 2.32 persons per household, with single female/mother households (354 | 6.2%) accounting for the largest median household size of 3.63 persons per household. non-family households (1,702 | 29.7%) represent the smallest median household size with 1.23 persons per household.
| Household Type | # Households | Household Size |
| Married-Couple | 3,545 (61.8%) | 2.68 |
| Single Male/Father | 137 (2.4%) | 3.31 |
| Single Female/Mother | 354 (6.2%) | 3.63 |
| Non-family | 1,702 (29.7%) | 1.23 |
| Total Households | 5,738 (100.0%) | 2.32 |
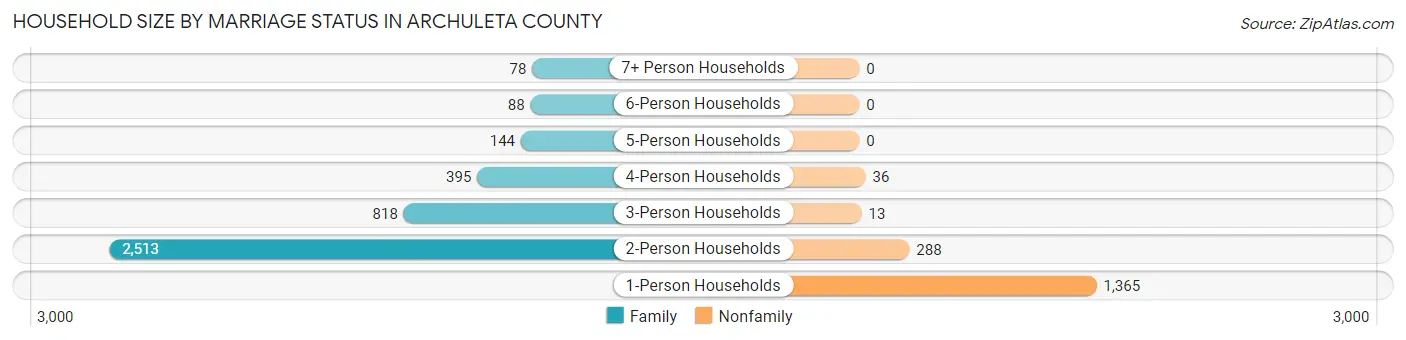
Household Size by Marriage Status in Archuleta County
Out of a total of 5,738 households in Archuleta County, 4,036 (70.3%) are family households, while 1,702 (29.7%) are nonfamily households. The most numerous type of family households are 2-person households, comprising 2,513, and the most common type of nonfamily households are 1-person households, comprising 1,365.
| Household Size | Family Households | Nonfamily Households |
| 1-Person Households | - | 1,365 (23.8%) |
| 2-Person Households | 2,513 (43.8%) | 288 (5.0%) |
| 3-Person Households | 818 (14.3%) | 13 (0.2%) |
| 4-Person Households | 395 (6.9%) | 36 (0.6%) |
| 5-Person Households | 144 (2.5%) | 0 (0.0%) |
| 6-Person Households | 88 (1.5%) | 0 (0.0%) |
| 7+ Person Households | 78 (1.4%) | 0 (0.0%) |
| Total | 4,036 (70.3%) | 1,702 (29.7%) |
Female Fertility in Archuleta County
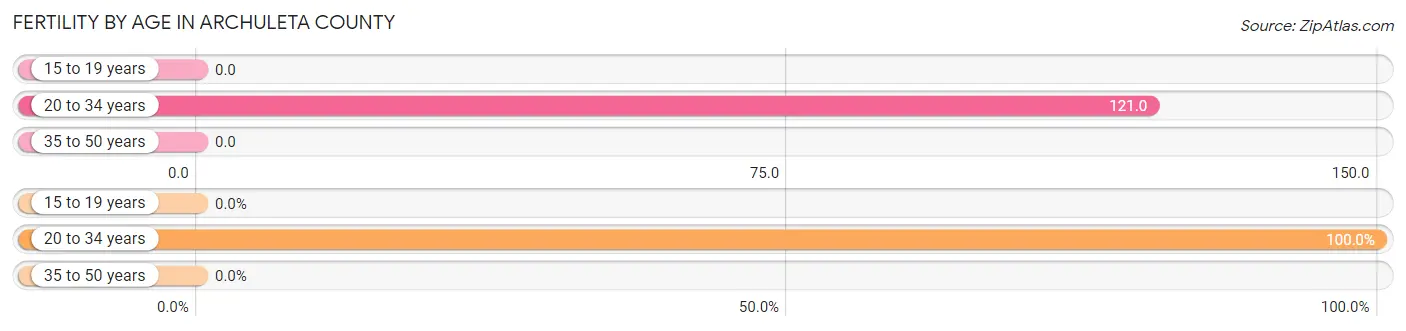
Fertility by Age in Archuleta County
Average fertility rate in Archuleta County is 47.0 births per 1,000 women. Women in the age bracket of 20 to 34 years have the highest fertility rate with 121.0 births per 1,000 women. Women in the age bracket of 20 to 34 years acount for 100.0% of all women with births.
| Age Bracket | Women with Births | Births / 1,000 Women |
| 15 to 19 years | 0 (0.0%) | 0.0 |
| 20 to 34 years | 108 (100.0%) | 121.0 |
| 35 to 50 years | 0 (0.0%) | 0.0 |
| Total | 108 (100.0%) | 47.0 |
Fertility by Age by Marriage Status in Archuleta County
39.8% of women with births (108) in Archuleta County are married. The highest percentage of unmarried women with births falls into 20 to 34 years age bracket with 60.2% of them unmarried at the time of birth, while the lowest percentage of unmarried women with births belong to 20 to 34 years age bracket with 60.2% of them unmarried.

| Age Bracket | Married | Unmarried |
| 15 to 19 years | 0 (0.0%) | 0 (0.0%) |
| 20 to 34 years | 43 (39.8%) | 65 (60.2%) |
| 35 to 50 years | 0 (0.0%) | 0 (0.0%) |
| Total | 43 (39.8%) | 65 (60.2%) |
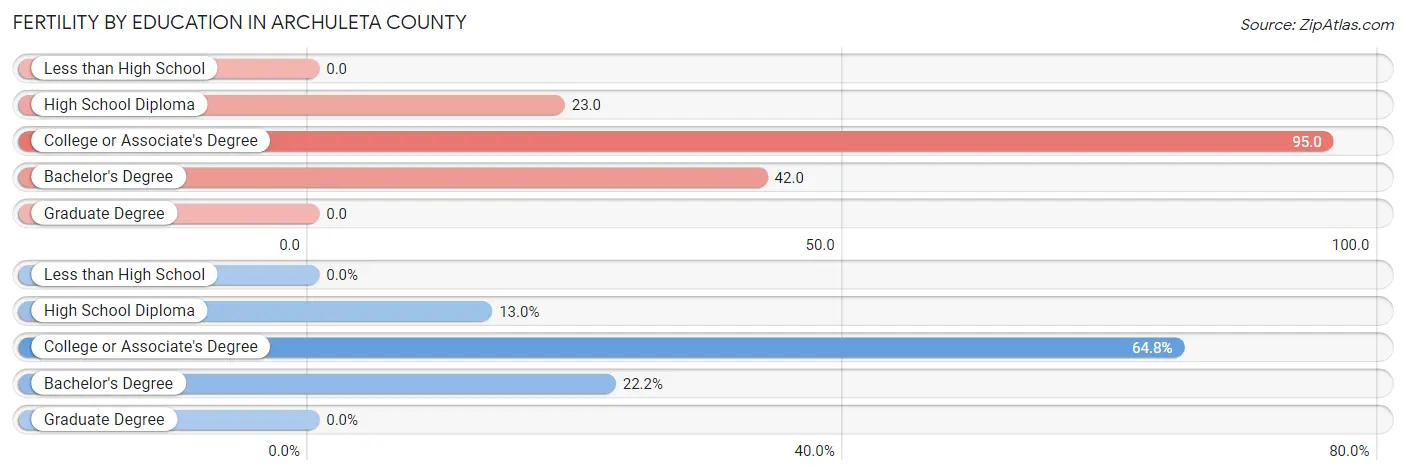
Fertility by Education in Archuleta County
| Educational Attainment | Women with Births | Births / 1,000 Women |
| Less than High School | 0 (0.0%) | 0.0 |
| High School Diploma | 14 (13.0%) | 23.0 |
| College or Associate's Degree | 70 (64.8%) | 95.0 |
| Bachelor's Degree | 24 (22.2%) | 42.0 |
| Graduate Degree | 0 (0.0%) | 0.0 |
| Total | 108 (100.0%) | 47.0 |
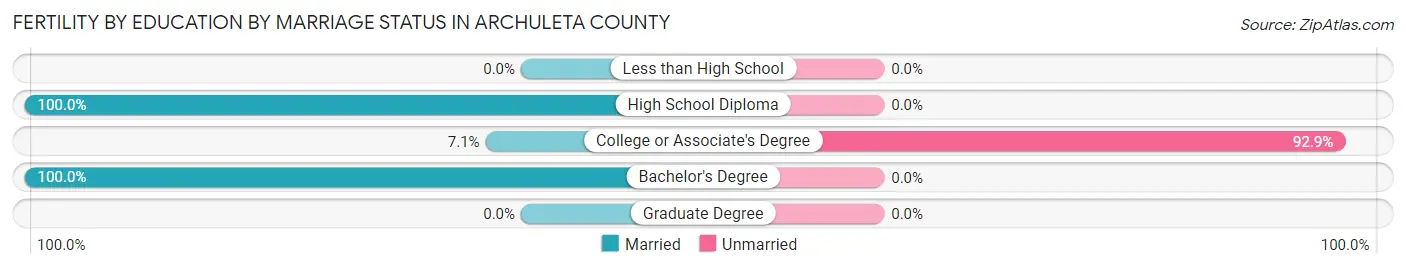
Fertility by Education by Marriage Status in Archuleta County
60.2% of women with births in Archuleta County are unmarried. Women with the educational attainment of high school diploma are most likely to be married with 100.0% of them married at childbirth, while women with the educational attainment of college or associate's degree are least likely to be married with 92.9% of them unmarried at childbirth.
| Educational Attainment | Married | Unmarried |
| Less than High School | 0 (0.0%) | 0 (0.0%) |
| High School Diploma | 14 (100.0%) | 0 (0.0%) |
| College or Associate's Degree | 5 (7.1%) | 65 (92.9%) |
| Bachelor's Degree | 24 (100.0%) | 0 (0.0%) |
| Graduate Degree | 0 (0.0%) | 0 (0.0%) |
| Total | 43 (39.8%) | 65 (60.2%) |
Employment Characteristics in Archuleta County
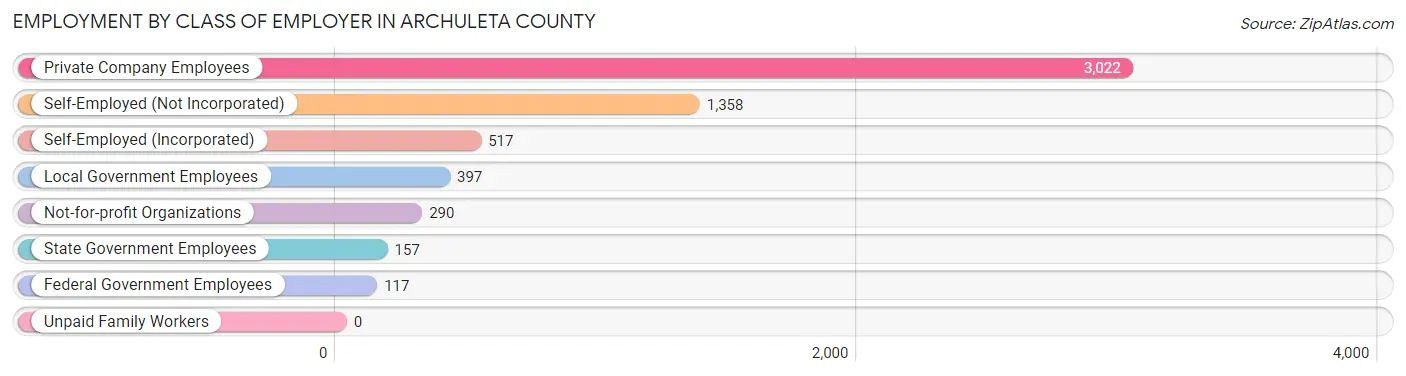
Employment by Class of Employer in Archuleta County
Among the 5,858 employed individuals in Archuleta County, private company employees (3,022 | 51.6%), self-employed (not incorporated) (1,358 | 23.2%), and self-employed (incorporated) (517 | 8.8%) make up the most common classes of employment.
| Employer Class | # Employees | % Employees |
| Private Company Employees | 3,022 | 51.6% |
| Self-Employed (Incorporated) | 517 | 8.8% |
| Self-Employed (Not Incorporated) | 1,358 | 23.2% |
| Not-for-profit Organizations | 290 | 5.0% |
| Local Government Employees | 397 | 6.8% |
| State Government Employees | 157 | 2.7% |
| Federal Government Employees | 117 | 2.0% |
| Unpaid Family Workers | 0 | 0.0% |
| Total | 5,858 | 100.0% |
Employment Status by Age in Archuleta County
According to the labor force statistics for Archuleta County, out of the total population over 16 years of age (11,360), 55.4% or 6,293 individuals are in the labor force, with 4.8% or 302 of them unemployed. The age group with the highest labor force participation rate is 30 to 34 years, with 86.4% or 516 individuals in the labor force. Within the labor force, the 75 years and over age range has the highest percentage of unemployed individuals, with 30.2% or 13 of them being unemployed.
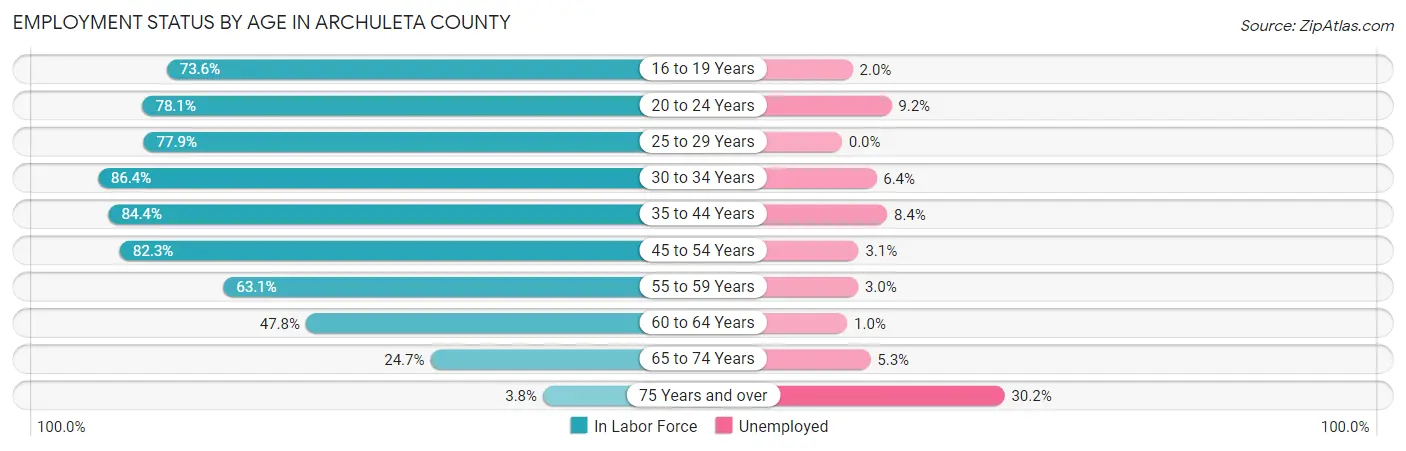
| Age Bracket | In Labor Force | Unemployed |
| 16 to 19 Years | 354 (73.6%) | 7 (2.0%) |
| 20 to 24 Years | 361 (78.1%) | 33 (9.2%) |
| 25 to 29 Years | 480 (77.9%) | 0 (0.0%) |
| 30 to 34 Years | 516 (86.4%) | 33 (6.4%) |
| 35 to 44 Years | 1,422 (84.4%) | 119 (8.4%) |
| 45 to 54 Years | 1,197 (82.3%) | 37 (3.1%) |
| 55 to 59 Years | 598 (63.1%) | 18 (3.0%) |
| 60 to 64 Years | 699 (47.8%) | 7 (1.0%) |
| 65 to 74 Years | 624 (24.7%) | 33 (5.3%) |
| 75 Years and over | 43 (3.8%) | 13 (30.2%) |
| Total | 6,293 (55.4%) | 302 (4.8%) |
Employment Status by Educational Attainment in Archuleta County
According to labor force statistics for Archuleta County, 72.6% of individuals (4,911) out of the total population between 25 and 64 years of age (6,764) are in the labor force, with 4.4% or 216 of them being unemployed. The group with the highest labor force participation rate are those with the educational attainment of high school diploma, with 75.0% or 1,481 individuals in the labor force. Within the labor force, individuals with high school diploma education have the highest percentage of unemployment, with 8.7% or 129 of them being unemployed.
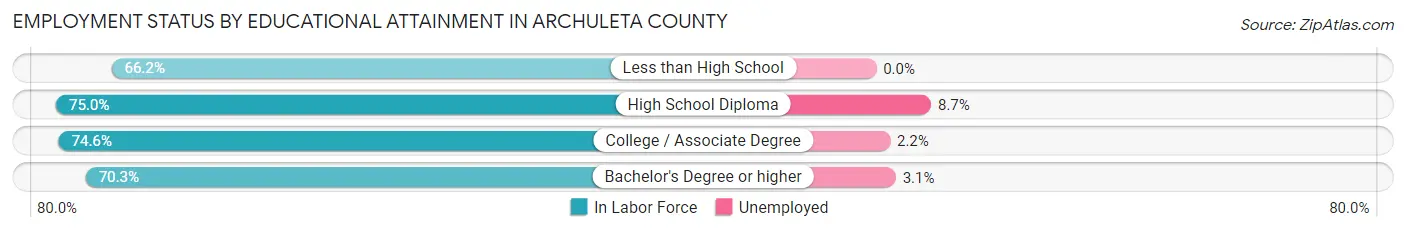
| Educational Attainment | In Labor Force | Unemployed |
| Less than High School | 303 (66.2%) | 0 (0.0%) |
| High School Diploma | 1,481 (75.0%) | 172 (8.7%) |
| College / Associate Degree | 1,432 (74.6%) | 42 (2.2%) |
| Bachelor's Degree or higher | 1,695 (70.3%) | 75 (3.1%) |
| Total | 4,911 (72.6%) | 298 (4.4%) |
Employment Occupations by Sex in Archuleta County
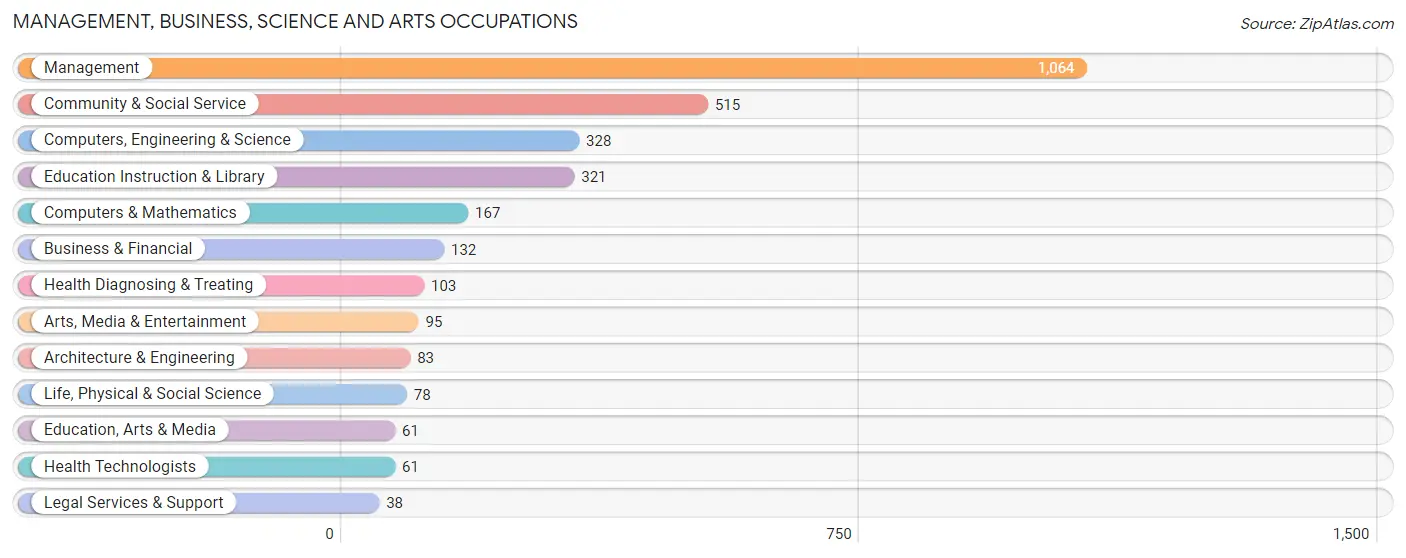
Management, Business, Science and Arts Occupations
The most common Management, Business, Science and Arts occupations in Archuleta County are Management (1,064 | 17.8%), Community & Social Service (515 | 8.6%), Computers, Engineering & Science (328 | 5.5%), Education Instruction & Library (321 | 5.4%), and Computers & Mathematics (167 | 2.8%).
Management, Business, Science and Arts Occupations by Sex
Within the Management, Business, Science and Arts occupations in Archuleta County, the most male-oriented occupations are Legal Services & Support (100.0%), Computers & Mathematics (91.0%), and Education, Arts & Media (70.5%), while the most female-oriented occupations are Health Diagnosing & Treating (95.2%), Health Technologists (91.8%), and Education Instruction & Library (86.3%).

| Occupation | Male | Female |
| Management | 691 (64.9%) | 373 (35.1%) |
| Business & Financial | 56 (42.4%) | 76 (57.6%) |
| Computers, Engineering & Science | 187 (57.0%) | 141 (43.0%) |
| Computers & Mathematics | 152 (91.0%) | 15 (9.0%) |
| Architecture & Engineering | 24 (28.9%) | 59 (71.1%) |
| Life, Physical & Social Science | 11 (14.1%) | 67 (85.9%) |
| Community & Social Service | 182 (35.3%) | 333 (64.7%) |
| Education, Arts & Media | 43 (70.5%) | 18 (29.5%) |
| Legal Services & Support | 38 (100.0%) | 0 (0.0%) |
| Education Instruction & Library | 44 (13.7%) | 277 (86.3%) |
| Arts, Media & Entertainment | 57 (60.0%) | 38 (40.0%) |
| Health Diagnosing & Treating | 5 (4.9%) | 98 (95.2%) |
| Health Technologists | 5 (8.2%) | 56 (91.8%) |
| Total (Category) | 1,121 (52.3%) | 1,021 (47.7%) |
| Total (Overall) | 3,246 (54.3%) | 2,728 (45.7%) |
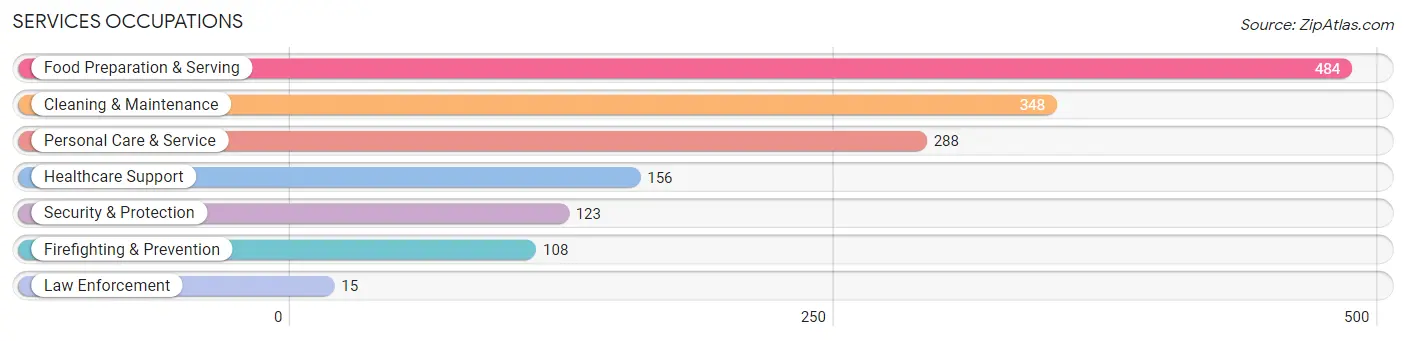
Services Occupations
The most common Services occupations in Archuleta County are Food Preparation & Serving (484 | 8.1%), Cleaning & Maintenance (348 | 5.8%), Personal Care & Service (288 | 4.8%), Healthcare Support (156 | 2.6%), and Security & Protection (123 | 2.1%).
Services Occupations by Sex
Within the Services occupations in Archuleta County, the most male-oriented occupations are Law Enforcement (100.0%), Security & Protection (56.9%), and Firefighting & Prevention (50.9%), while the most female-oriented occupations are Personal Care & Service (84.4%), Healthcare Support (78.8%), and Food Preparation & Serving (67.1%).
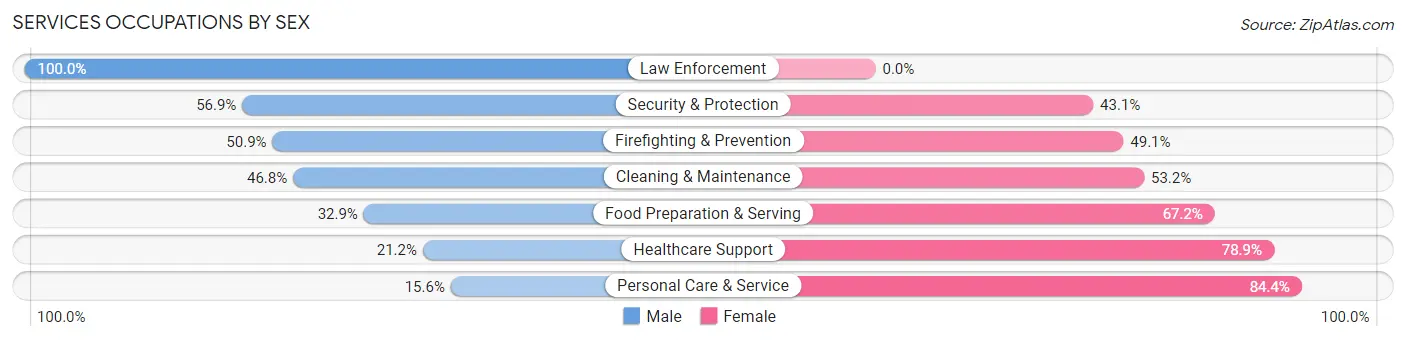
| Occupation | Male | Female |
| Healthcare Support | 33 (21.1%) | 123 (78.8%) |
| Security & Protection | 70 (56.9%) | 53 (43.1%) |
| Firefighting & Prevention | 55 (50.9%) | 53 (49.1%) |
| Law Enforcement | 15 (100.0%) | 0 (0.0%) |
| Food Preparation & Serving | 159 (32.9%) | 325 (67.1%) |
| Cleaning & Maintenance | 163 (46.8%) | 185 (53.2%) |
| Personal Care & Service | 45 (15.6%) | 243 (84.4%) |
| Total (Category) | 470 (33.6%) | 929 (66.4%) |
| Total (Overall) | 3,246 (54.3%) | 2,728 (45.7%) |
Sales and Office Occupations
The most common Sales and Office occupations in Archuleta County are Sales & Related (573 | 9.6%), and Office & Administration (400 | 6.7%).
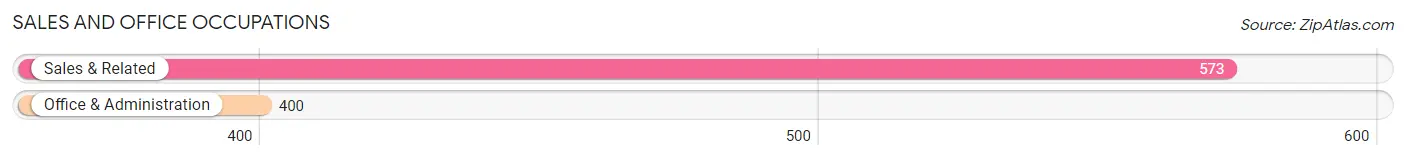
Sales and Office Occupations by Sex

| Occupation | Male | Female |
| Sales & Related | 248 (43.3%) | 325 (56.7%) |
| Office & Administration | 65 (16.3%) | 335 (83.8%) |
| Total (Category) | 313 (32.2%) | 660 (67.8%) |
| Total (Overall) | 3,246 (54.3%) | 2,728 (45.7%) |
Natural Resources, Construction and Maintenance Occupations
The most common Natural Resources, Construction and Maintenance occupations in Archuleta County are Construction & Extraction (632 | 10.6%), Installation, Maintenance & Repair (199 | 3.3%), and Farming, Fishing & Forestry (121 | 2.0%).
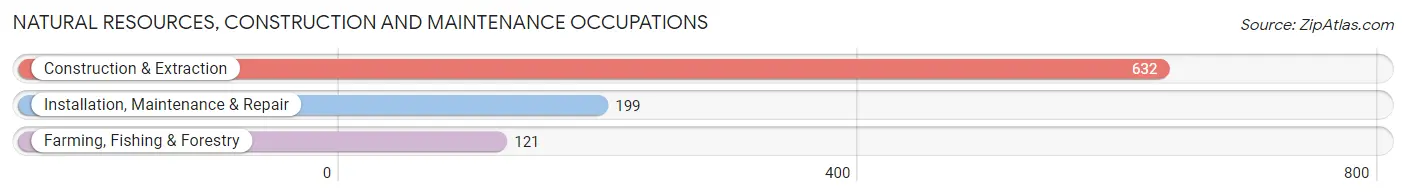
Natural Resources, Construction and Maintenance Occupations by Sex

| Occupation | Male | Female |
| Farming, Fishing & Forestry | 107 (88.4%) | 14 (11.6%) |
| Construction & Extraction | 621 (98.3%) | 11 (1.7%) |
| Installation, Maintenance & Repair | 189 (95.0%) | 10 (5.0%) |
| Total (Category) | 917 (96.3%) | 35 (3.7%) |
| Total (Overall) | 3,246 (54.3%) | 2,728 (45.7%) |
Production, Transportation and Moving Occupations
The most common Production, Transportation and Moving occupations in Archuleta County are Material Moving (214 | 3.6%), Production (150 | 2.5%), and Transportation (144 | 2.4%).
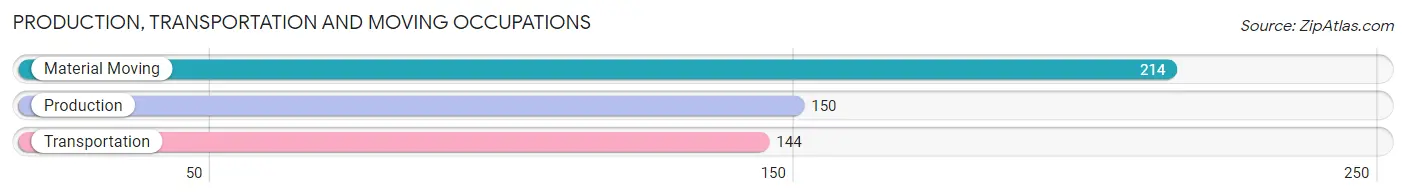
Production, Transportation and Moving Occupations by Sex

| Occupation | Male | Female |
| Production | 84 (56.0%) | 66 (44.0%) |
| Transportation | 141 (97.9%) | 3 (2.1%) |
| Material Moving | 200 (93.5%) | 14 (6.5%) |
| Total (Category) | 425 (83.7%) | 83 (16.3%) |
| Total (Overall) | 3,246 (54.3%) | 2,728 (45.7%) |
Employment Industries by Sex in Archuleta County
Employment Industries in Archuleta County
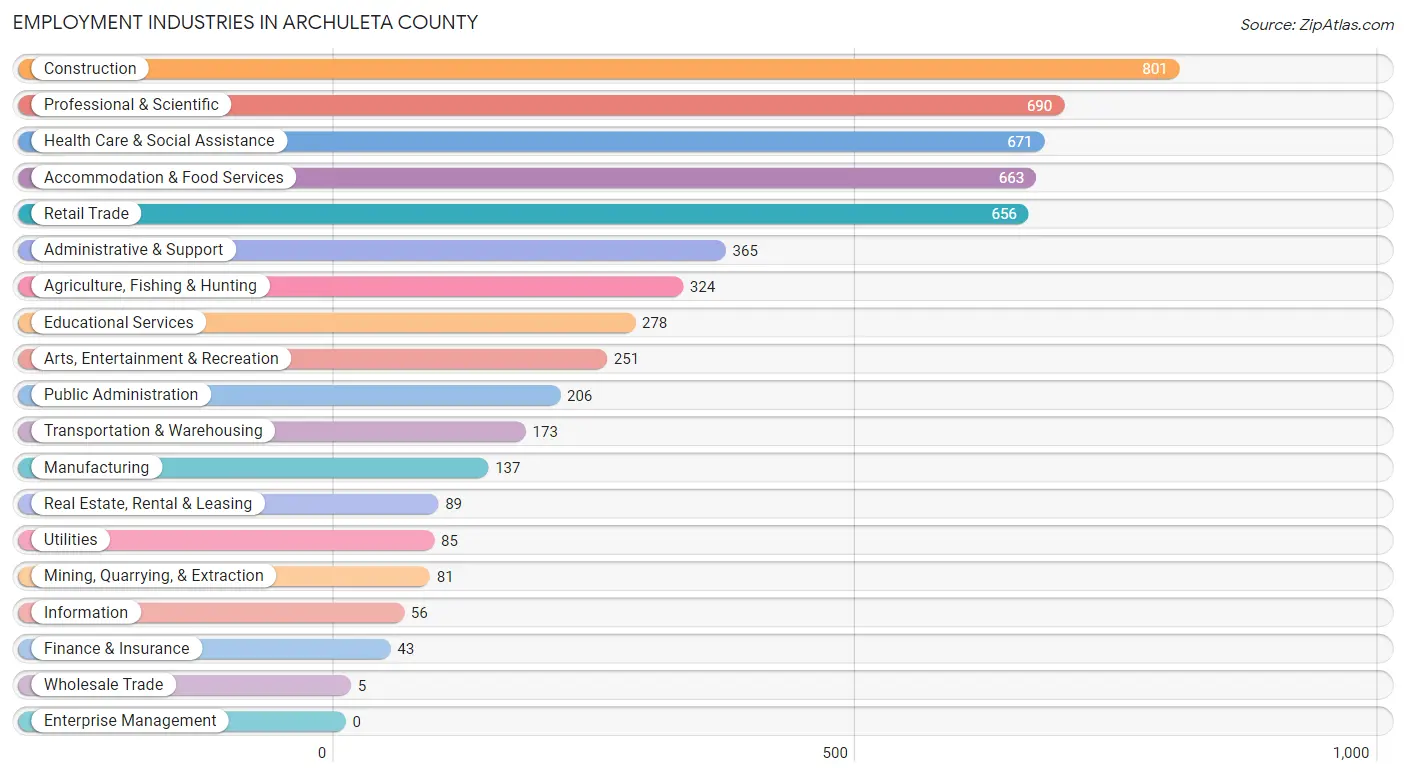
The major employment industries in Archuleta County include Construction (801 | 13.4%), Professional & Scientific (690 | 11.6%), Health Care & Social Assistance (671 | 11.2%), Accommodation & Food Services (663 | 11.1%), and Retail Trade (656 | 11.0%).
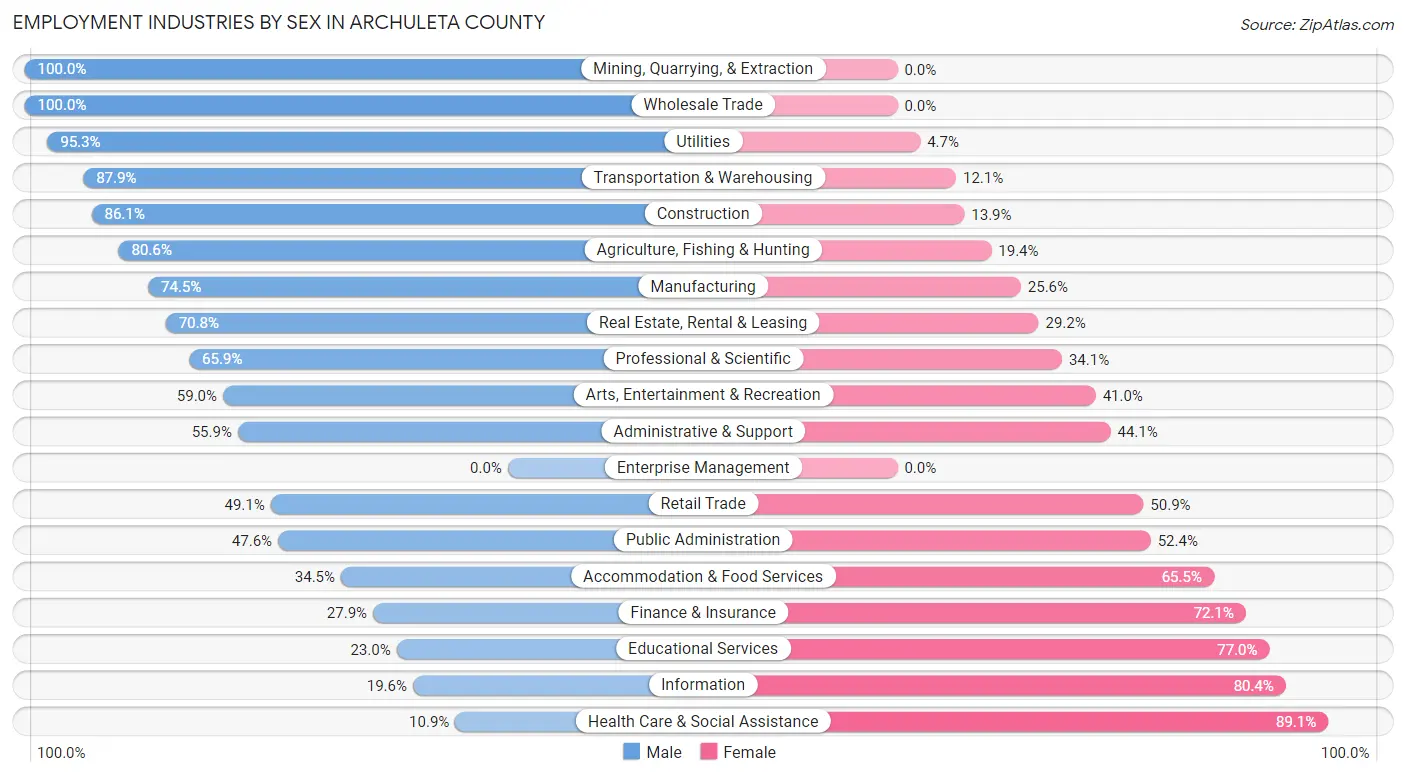
Employment Industries by Sex in Archuleta County
The Archuleta County industries that see more men than women are Mining, Quarrying, & Extraction (100.0%), Wholesale Trade (100.0%), and Utilities (95.3%), whereas the industries that tend to have a higher number of women are Health Care & Social Assistance (89.1%), Information (80.4%), and Educational Services (77.0%).
| Industry | Male | Female |
| Agriculture, Fishing & Hunting | 261 (80.6%) | 63 (19.4%) |
| Mining, Quarrying, & Extraction | 81 (100.0%) | 0 (0.0%) |
| Construction | 690 (86.1%) | 111 (13.9%) |
| Manufacturing | 102 (74.5%) | 35 (25.6%) |
| Wholesale Trade | 5 (100.0%) | 0 (0.0%) |
| Retail Trade | 322 (49.1%) | 334 (50.9%) |
| Transportation & Warehousing | 152 (87.9%) | 21 (12.1%) |
| Utilities | 81 (95.3%) | 4 (4.7%) |
| Information | 11 (19.6%) | 45 (80.4%) |
| Finance & Insurance | 12 (27.9%) | 31 (72.1%) |
| Real Estate, Rental & Leasing | 63 (70.8%) | 26 (29.2%) |
| Professional & Scientific | 455 (65.9%) | 235 (34.1%) |
| Enterprise Management | 0 (0.0%) | 0 (0.0%) |
| Administrative & Support | 204 (55.9%) | 161 (44.1%) |
| Educational Services | 64 (23.0%) | 214 (77.0%) |
| Health Care & Social Assistance | 73 (10.9%) | 598 (89.1%) |
| Arts, Entertainment & Recreation | 148 (59.0%) | 103 (41.0%) |
| Accommodation & Food Services | 229 (34.5%) | 434 (65.5%) |
| Public Administration | 98 (47.6%) | 108 (52.4%) |
| Total | 3,246 (54.3%) | 2,728 (45.7%) |
Education in Archuleta County
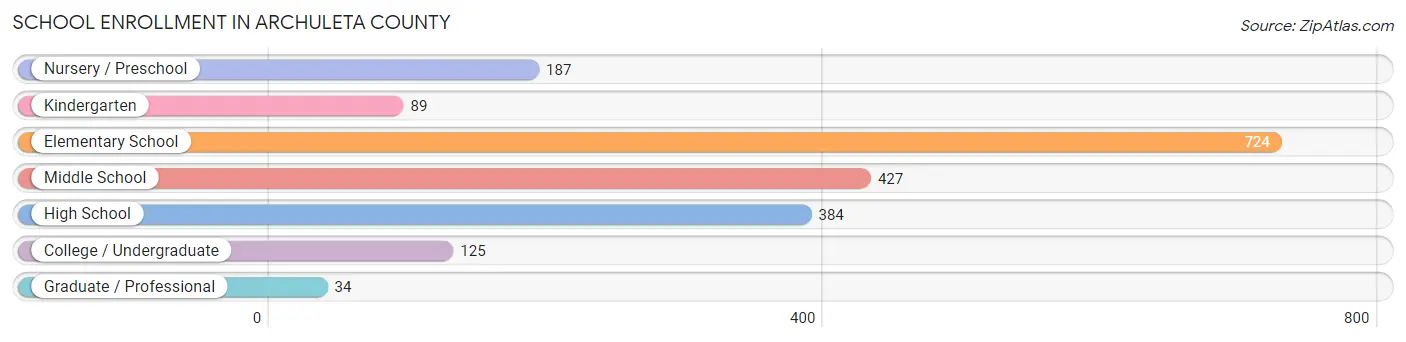
School Enrollment in Archuleta County
The most common levels of schooling among the 1,970 students in Archuleta County are elementary school (724 | 36.7%), middle school (427 | 21.7%), and high school (384 | 19.5%).
| School Level | # Students | % Students |
| Nursery / Preschool | 187 | 9.5% |
| Kindergarten | 89 | 4.5% |
| Elementary School | 724 | 36.7% |
| Middle School | 427 | 21.7% |
| High School | 384 | 19.5% |
| College / Undergraduate | 125 | 6.4% |
| Graduate / Professional | 34 | 1.7% |
| Total | 1,970 | 100.0% |
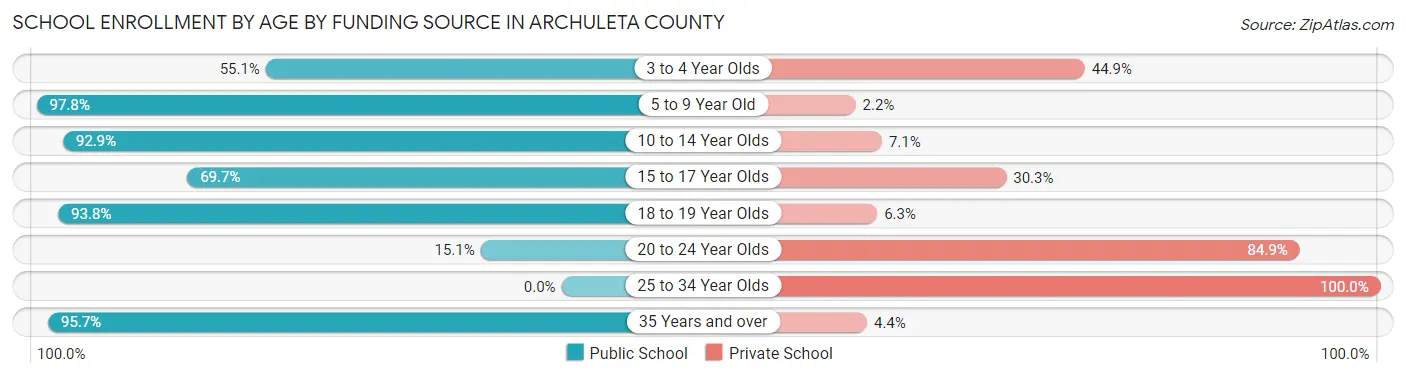
School Enrollment by Age by Funding Source in Archuleta County
Out of a total of 1,970 students who are enrolled in schools in Archuleta County, 305 (15.5%) attend a private institution, while the remaining 1,665 (84.5%) are enrolled in public schools. The age group of 25 to 34 year olds has the highest likelihood of being enrolled in private schools, with 21 (100.0% in the age bracket) enrolled. Conversely, the age group of 5 to 9 year old has the lowest likelihood of being enrolled in a private school, with 701 (97.8% in the age bracket) attending a public institution.
| Age Bracket | Public School | Private School |
| 3 to 4 Year Olds | 92 (55.1%) | 75 (44.9%) |
| 5 to 9 Year Old | 701 (97.8%) | 16 (2.2%) |
| 10 to 14 Year Olds | 573 (92.9%) | 44 (7.1%) |
| 15 to 17 Year Olds | 191 (69.7%) | 83 (30.3%) |
| 18 to 19 Year Olds | 30 (93.8%) | 2 (6.2%) |
| 20 to 24 Year Olds | 11 (15.1%) | 62 (84.9%) |
| 25 to 34 Year Olds | 0 (0.0%) | 21 (100.0%) |
| 35 Years and over | 66 (95.7%) | 3 (4.3%) |
| Total | 1,665 (84.5%) | 305 (15.5%) |
Educational Attainment by Field of Study in Archuleta County
Education (745 | 16.9%), business (716 | 16.2%), physical & health sciences (484 | 11.0%), bio, nature & agricultural (441 | 10.0%), and science & technology (354 | 8.0%) are the most common fields of study among 4,418 individuals in Archuleta County who have obtained a bachelor's degree or higher.
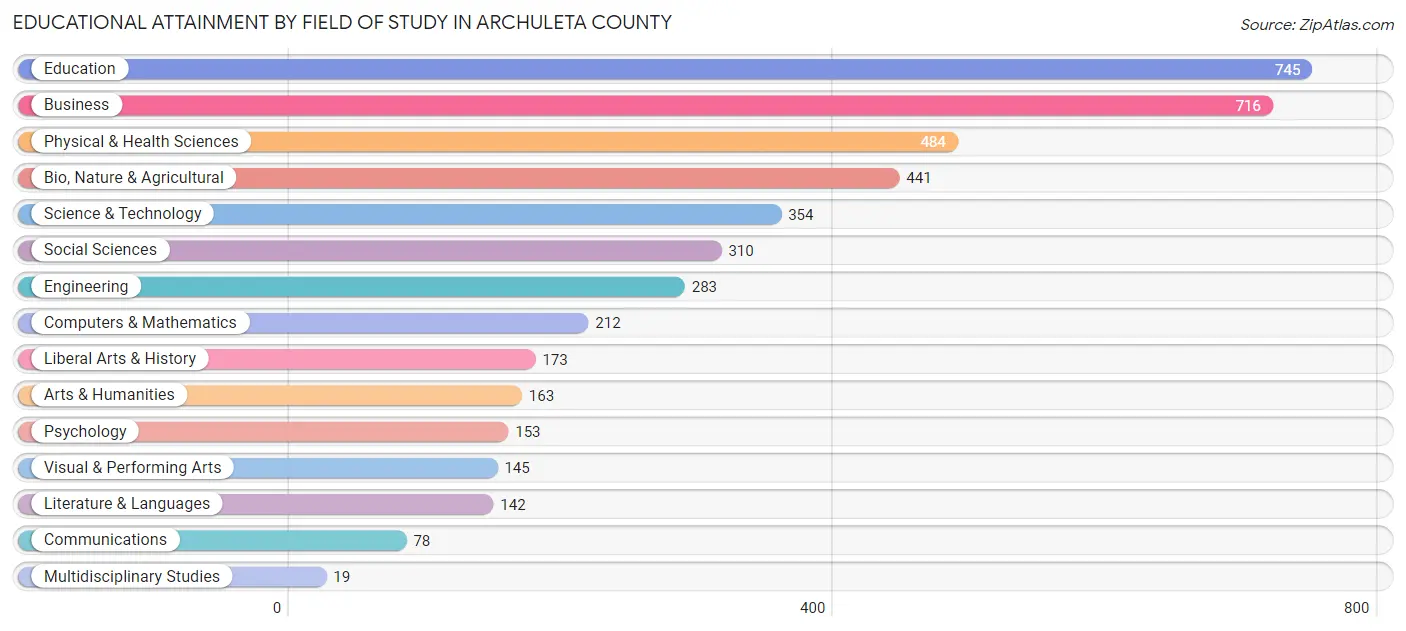
| Field of Study | # Graduates | % Graduates |
| Computers & Mathematics | 212 | 4.8% |
| Bio, Nature & Agricultural | 441 | 10.0% |
| Physical & Health Sciences | 484 | 11.0% |
| Psychology | 153 | 3.5% |
| Social Sciences | 310 | 7.0% |
| Engineering | 283 | 6.4% |
| Multidisciplinary Studies | 19 | 0.4% |
| Science & Technology | 354 | 8.0% |
| Business | 716 | 16.2% |
| Education | 745 | 16.9% |
| Literature & Languages | 142 | 3.2% |
| Liberal Arts & History | 173 | 3.9% |
| Visual & Performing Arts | 145 | 3.3% |
| Communications | 78 | 1.8% |
| Arts & Humanities | 163 | 3.7% |
| Total | 4,418 | 100.0% |
Transportation & Commute in Archuleta County
Vehicle Availability by Sex in Archuleta County
The most prevalent vehicle ownership categories in Archuleta County are males with 2 vehicles (1,181, accounting for 37.9%) and females with 2 vehicles (979, making up 43.5%).
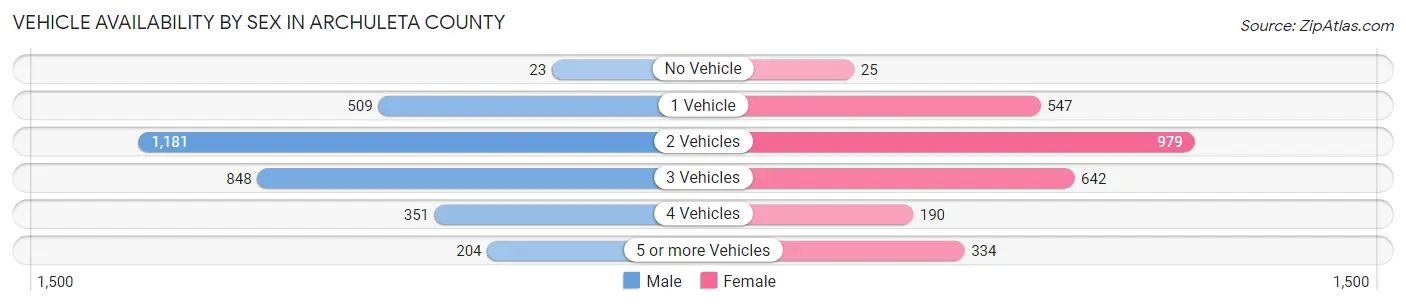
| Vehicles Available | Male | Female |
| No Vehicle | 23 (0.7%) | 25 (0.9%) |
| 1 Vehicle | 509 (16.3%) | 547 (20.1%) |
| 2 Vehicles | 1,181 (37.9%) | 979 (36.0%) |
| 3 Vehicles | 848 (27.2%) | 642 (23.6%) |
| 4 Vehicles | 351 (11.3%) | 190 (7.0%) |
| 5 or more Vehicles | 204 (6.6%) | 334 (12.3%) |
| Total | 3,116 (100.0%) | 2,717 (100.0%) |
Commute Time in Archuleta County
The most frequently occuring commute durations in Archuleta County are 10 to 14 minutes (922 commuters, 18.8%), 5 to 9 minutes (820 commuters, 16.7%), and 15 to 19 minutes (778 commuters, 15.9%).
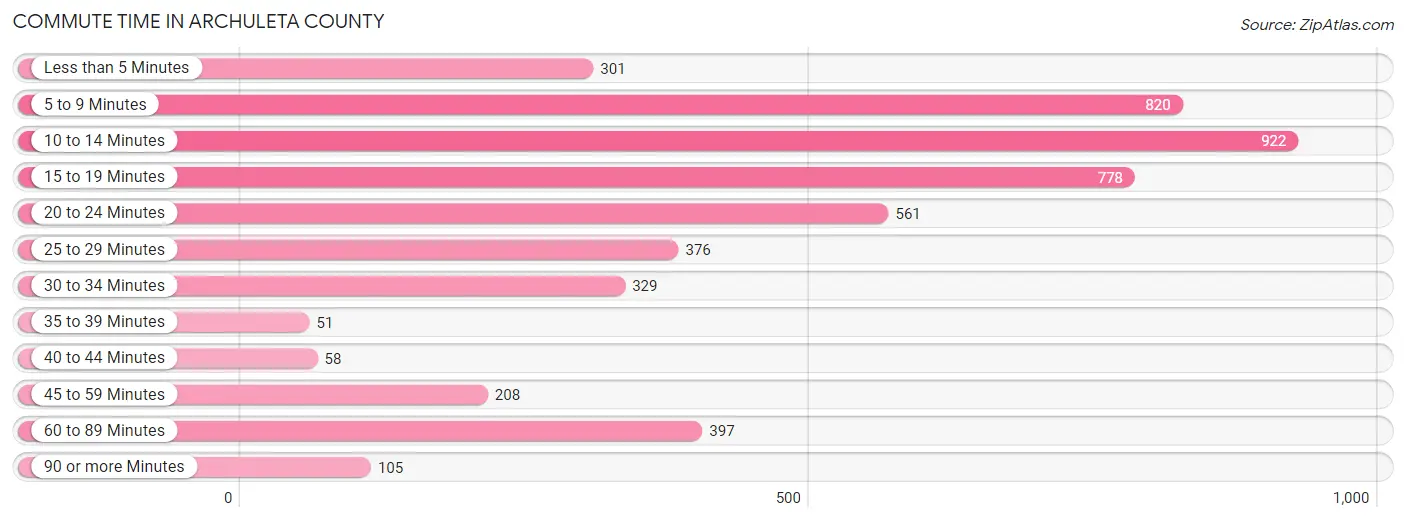
| Commute Time | # Commuters | % Commuters |
| Less than 5 Minutes | 301 | 6.1% |
| 5 to 9 Minutes | 820 | 16.7% |
| 10 to 14 Minutes | 922 | 18.8% |
| 15 to 19 Minutes | 778 | 15.9% |
| 20 to 24 Minutes | 561 | 11.4% |
| 25 to 29 Minutes | 376 | 7.7% |
| 30 to 34 Minutes | 329 | 6.7% |
| 35 to 39 Minutes | 51 | 1.0% |
| 40 to 44 Minutes | 58 | 1.2% |
| 45 to 59 Minutes | 208 | 4.2% |
| 60 to 89 Minutes | 397 | 8.1% |
| 90 or more Minutes | 105 | 2.1% |
Commute Time by Sex in Archuleta County
The most common commute times in Archuleta County are 10 to 14 minutes (533 commuters, 21.3%) for males and 5 to 9 minutes (607 commuters, 25.2%) for females.
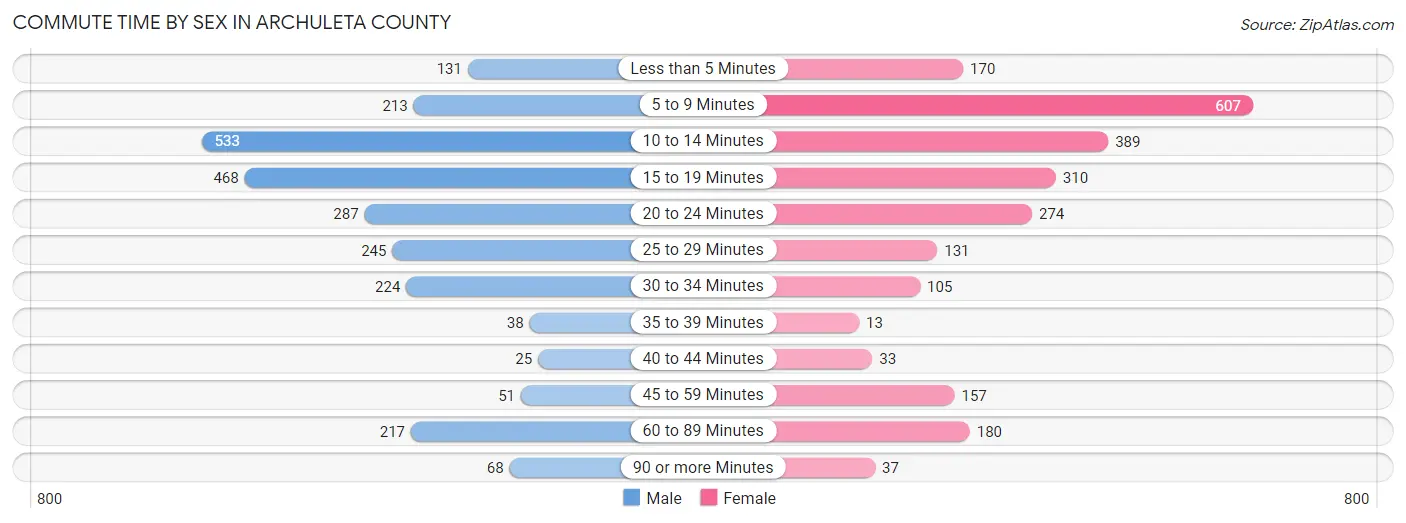
| Commute Time | Male | Female |
| Less than 5 Minutes | 131 (5.2%) | 170 (7.1%) |
| 5 to 9 Minutes | 213 (8.5%) | 607 (25.2%) |
| 10 to 14 Minutes | 533 (21.3%) | 389 (16.2%) |
| 15 to 19 Minutes | 468 (18.7%) | 310 (12.9%) |
| 20 to 24 Minutes | 287 (11.5%) | 274 (11.4%) |
| 25 to 29 Minutes | 245 (9.8%) | 131 (5.4%) |
| 30 to 34 Minutes | 224 (9.0%) | 105 (4.4%) |
| 35 to 39 Minutes | 38 (1.5%) | 13 (0.5%) |
| 40 to 44 Minutes | 25 (1.0%) | 33 (1.4%) |
| 45 to 59 Minutes | 51 (2.0%) | 157 (6.5%) |
| 60 to 89 Minutes | 217 (8.7%) | 180 (7.5%) |
| 90 or more Minutes | 68 (2.7%) | 37 (1.5%) |
Time of Departure to Work by Sex in Archuleta County
The most frequent times of departure to work in Archuleta County are 7:30 AM to 7:59 AM (483, 19.3%) for males and 7:00 AM to 7:29 AM (494, 20.5%) for females.
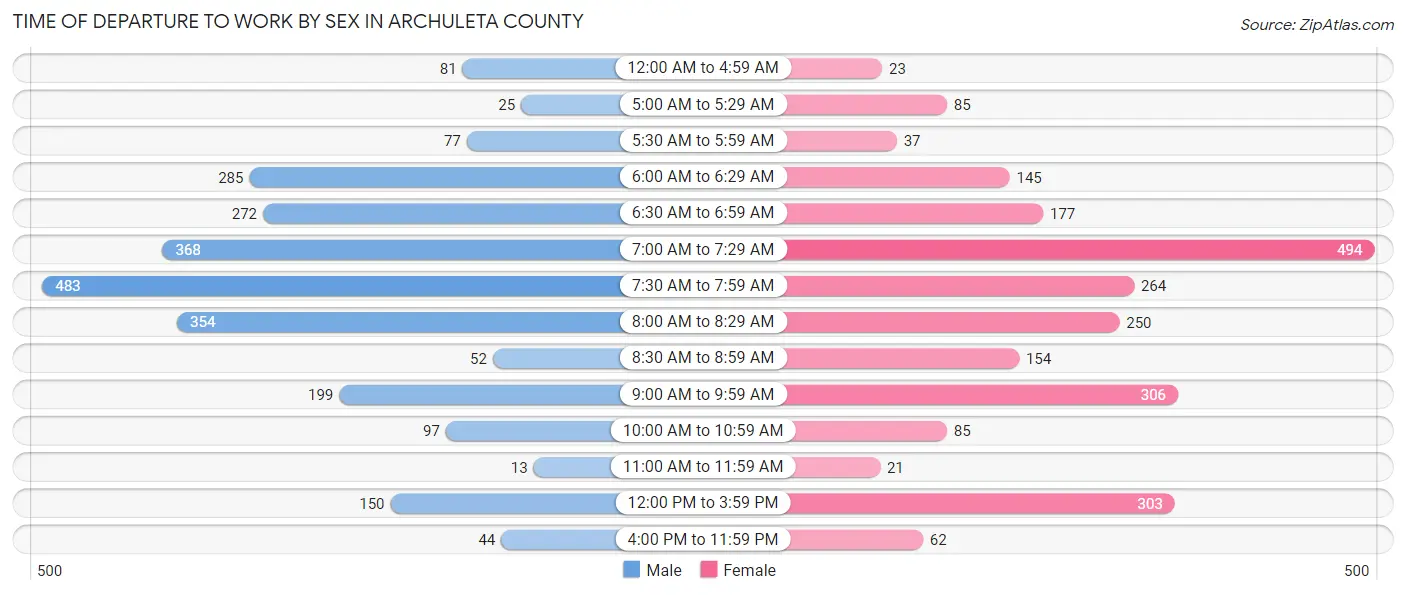
| Time of Departure | Male | Female |
| 12:00 AM to 4:59 AM | 81 (3.2%) | 23 (1.0%) |
| 5:00 AM to 5:29 AM | 25 (1.0%) | 85 (3.5%) |
| 5:30 AM to 5:59 AM | 77 (3.1%) | 37 (1.5%) |
| 6:00 AM to 6:29 AM | 285 (11.4%) | 145 (6.0%) |
| 6:30 AM to 6:59 AM | 272 (10.9%) | 177 (7.4%) |
| 7:00 AM to 7:29 AM | 368 (14.7%) | 494 (20.5%) |
| 7:30 AM to 7:59 AM | 483 (19.3%) | 264 (11.0%) |
| 8:00 AM to 8:29 AM | 354 (14.2%) | 250 (10.4%) |
| 8:30 AM to 8:59 AM | 52 (2.1%) | 154 (6.4%) |
| 9:00 AM to 9:59 AM | 199 (8.0%) | 306 (12.7%) |
| 10:00 AM to 10:59 AM | 97 (3.9%) | 85 (3.5%) |
| 11:00 AM to 11:59 AM | 13 (0.5%) | 21 (0.9%) |
| 12:00 PM to 3:59 PM | 150 (6.0%) | 303 (12.6%) |
| 4:00 PM to 11:59 PM | 44 (1.8%) | 62 (2.6%) |
| Total | 2,500 (100.0%) | 2,406 (100.0%) |
Housing Occupancy in Archuleta County
Occupancy by Ownership in Archuleta County
Of the total 5,738 dwellings in Archuleta County, owner-occupied units account for 4,349 (75.8%), while renter-occupied units make up 1,389 (24.2%).
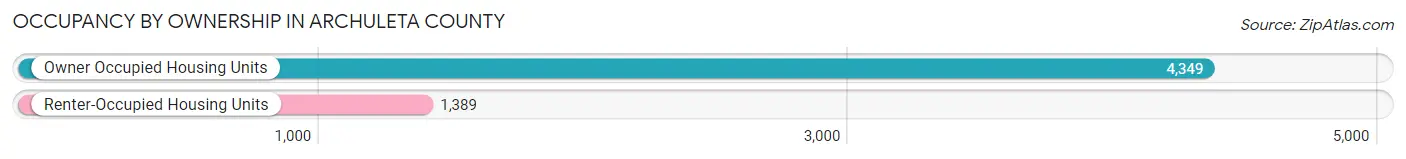
| Occupancy | # Housing Units | % Housing Units |
| Owner Occupied Housing Units | 4,349 | 75.8% |
| Renter-Occupied Housing Units | 1,389 | 24.2% |
| Total Occupied Housing Units | 5,738 | 100.0% |
Occupancy by Household Size in Archuleta County
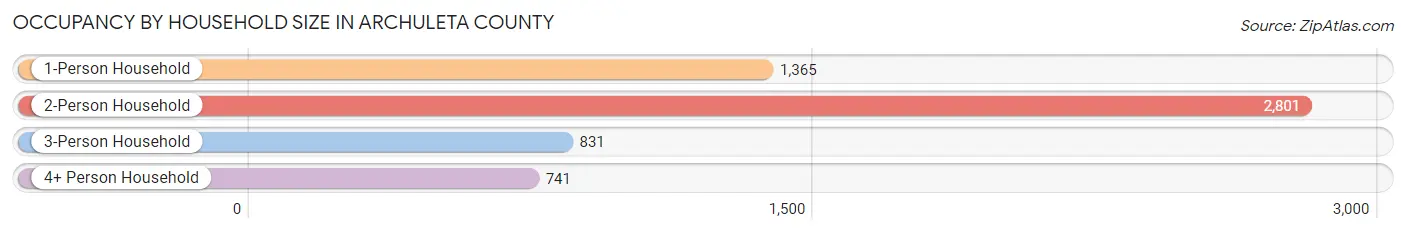
| Household Size | # Housing Units | % Housing Units |
| 1-Person Household | 1,365 | 23.8% |
| 2-Person Household | 2,801 | 48.8% |
| 3-Person Household | 831 | 14.5% |
| 4+ Person Household | 741 | 12.9% |
| Total Housing Units | 5,738 | 100.0% |
Occupancy by Ownership by Household Size in Archuleta County
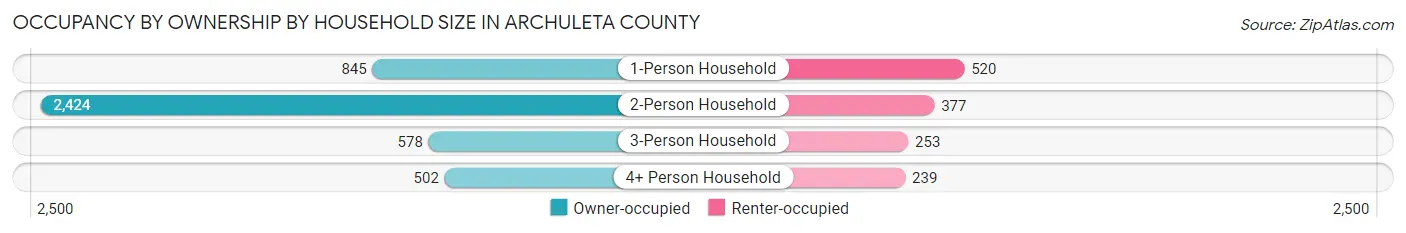
| Household Size | Owner-occupied | Renter-occupied |
| 1-Person Household | 845 (61.9%) | 520 (38.1%) |
| 2-Person Household | 2,424 (86.5%) | 377 (13.5%) |
| 3-Person Household | 578 (69.6%) | 253 (30.4%) |
| 4+ Person Household | 502 (67.7%) | 239 (32.3%) |
| Total Housing Units | 4,349 (75.8%) | 1,389 (24.2%) |
Occupancy by Educational Attainment in Archuleta County
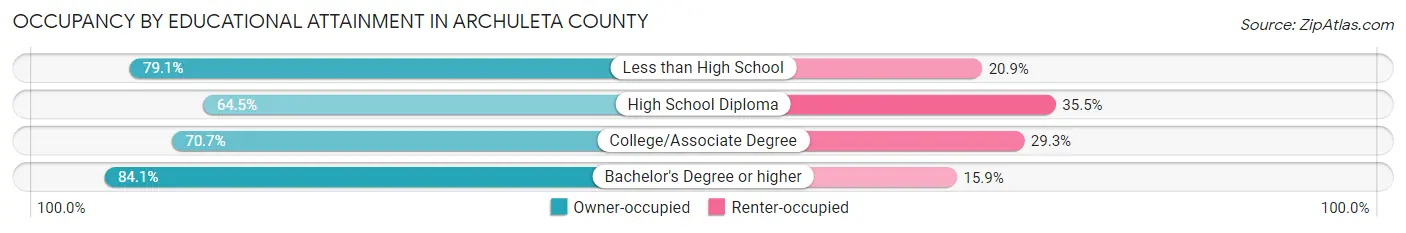
| Household Size | Owner-occupied | Renter-occupied |
| Less than High School | 189 (79.1%) | 50 (20.9%) |
| High School Diploma | 720 (64.5%) | 397 (35.5%) |
| College/Associate Degree | 1,289 (70.7%) | 534 (29.3%) |
| Bachelor's Degree or higher | 2,151 (84.1%) | 408 (15.9%) |
Occupancy by Age of Householder in Archuleta County
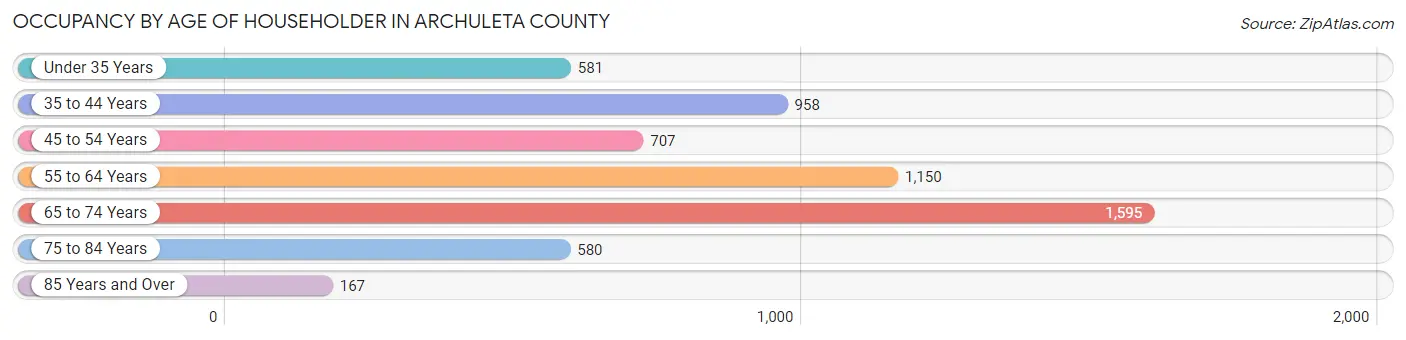
| Age Bracket | # Households | % Households |
| Under 35 Years | 581 | 10.1% |
| 35 to 44 Years | 958 | 16.7% |
| 45 to 54 Years | 707 | 12.3% |
| 55 to 64 Years | 1,150 | 20.0% |
| 65 to 74 Years | 1,595 | 27.8% |
| 75 to 84 Years | 580 | 10.1% |
| 85 Years and Over | 167 | 2.9% |
| Total | 5,738 | 100.0% |
Housing Finances in Archuleta County
Median Income by Occupancy in Archuleta County
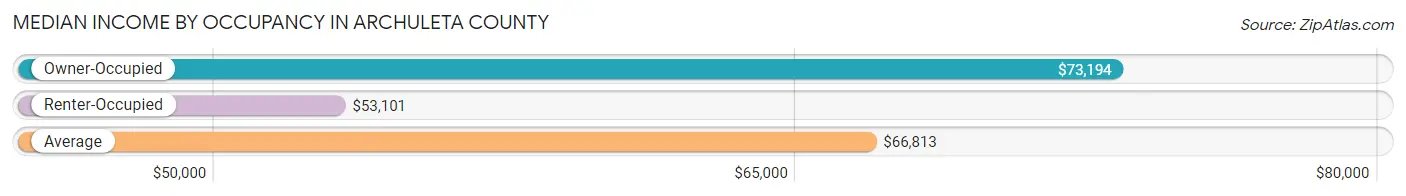
| Occupancy Type | # Households | Median Income |
| Owner-Occupied | 4,349 (75.8%) | $73,194 |
| Renter-Occupied | 1,389 (24.2%) | $53,101 |
| Average | 5,738 (100.0%) | $66,813 |
Occupancy by Householder Income Bracket in Archuleta County
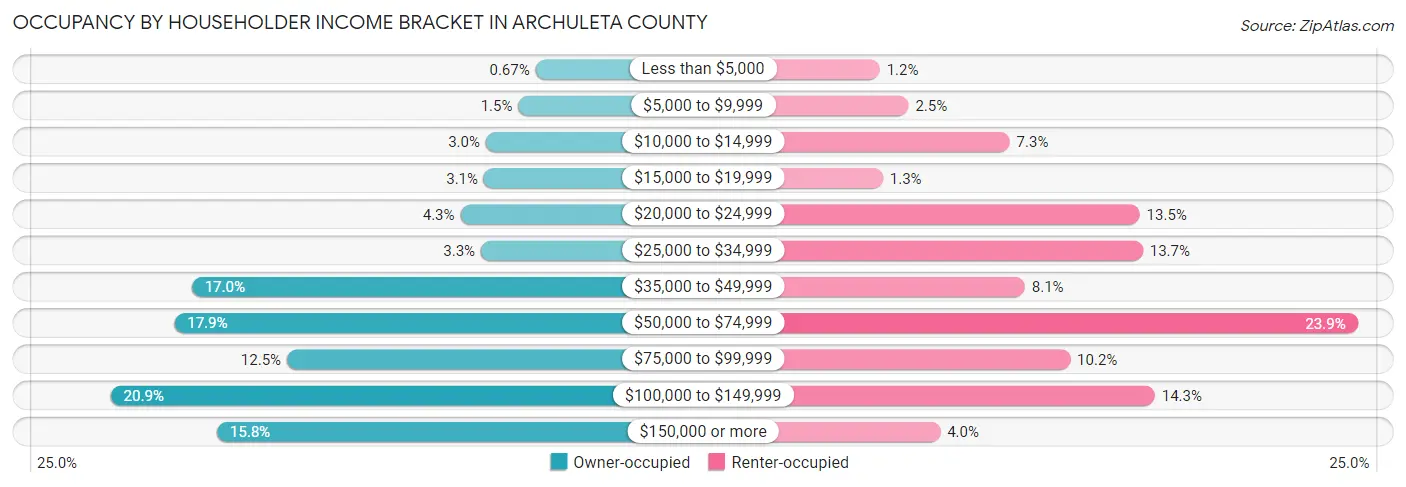
| Income Bracket | Owner-occupied | Renter-occupied |
| Less than $5,000 | 29 (0.7%) | 16 (1.1%) |
| $5,000 to $9,999 | 65 (1.5%) | 35 (2.5%) |
| $10,000 to $14,999 | 132 (3.0%) | 102 (7.3%) |
| $15,000 to $19,999 | 136 (3.1%) | 18 (1.3%) |
| $20,000 to $24,999 | 185 (4.3%) | 188 (13.5%) |
| $25,000 to $34,999 | 142 (3.3%) | 190 (13.7%) |
| $35,000 to $49,999 | 741 (17.0%) | 112 (8.1%) |
| $50,000 to $74,999 | 777 (17.9%) | 332 (23.9%) |
| $75,000 to $99,999 | 544 (12.5%) | 142 (10.2%) |
| $100,000 to $149,999 | 909 (20.9%) | 198 (14.2%) |
| $150,000 or more | 689 (15.8%) | 56 (4.0%) |
| Total | 4,349 (100.0%) | 1,389 (100.0%) |
Monthly Housing Cost Tiers in Archuleta County
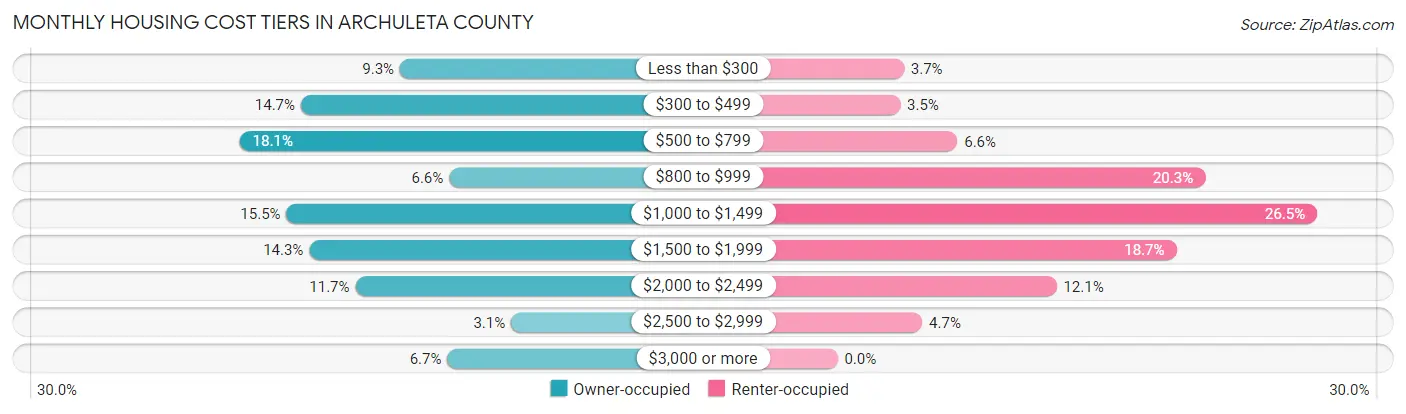
| Monthly Cost | Owner-occupied | Renter-occupied |
| Less than $300 | 403 (9.3%) | 51 (3.7%) |
| $300 to $499 | 641 (14.7%) | 48 (3.5%) |
| $500 to $799 | 788 (18.1%) | 92 (6.6%) |
| $800 to $999 | 285 (6.6%) | 282 (20.3%) |
| $1,000 to $1,499 | 676 (15.5%) | 368 (26.5%) |
| $1,500 to $1,999 | 621 (14.3%) | 260 (18.7%) |
| $2,000 to $2,499 | 510 (11.7%) | 168 (12.1%) |
| $2,500 to $2,999 | 136 (3.1%) | 65 (4.7%) |
| $3,000 or more | 289 (6.7%) | 0 (0.0%) |
| Total | 4,349 (100.0%) | 1,389 (100.0%) |
Physical Housing Characteristics in Archuleta County
Housing Structures in Archuleta County
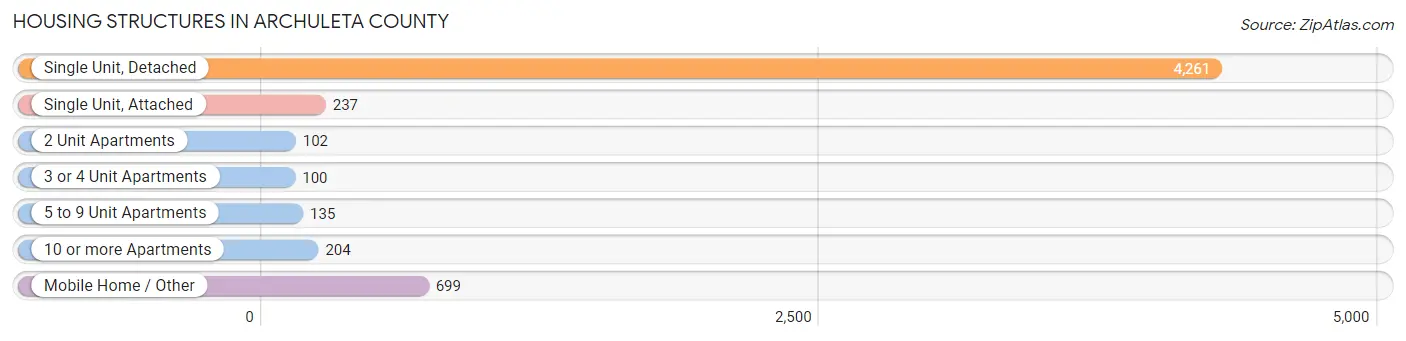
| Structure Type | # Housing Units | % Housing Units |
| Single Unit, Detached | 4,261 | 74.3% |
| Single Unit, Attached | 237 | 4.1% |
| 2 Unit Apartments | 102 | 1.8% |
| 3 or 4 Unit Apartments | 100 | 1.7% |
| 5 to 9 Unit Apartments | 135 | 2.4% |
| 10 or more Apartments | 204 | 3.6% |
| Mobile Home / Other | 699 | 12.2% |
| Total | 5,738 | 100.0% |
Housing Structures by Occupancy in Archuleta County
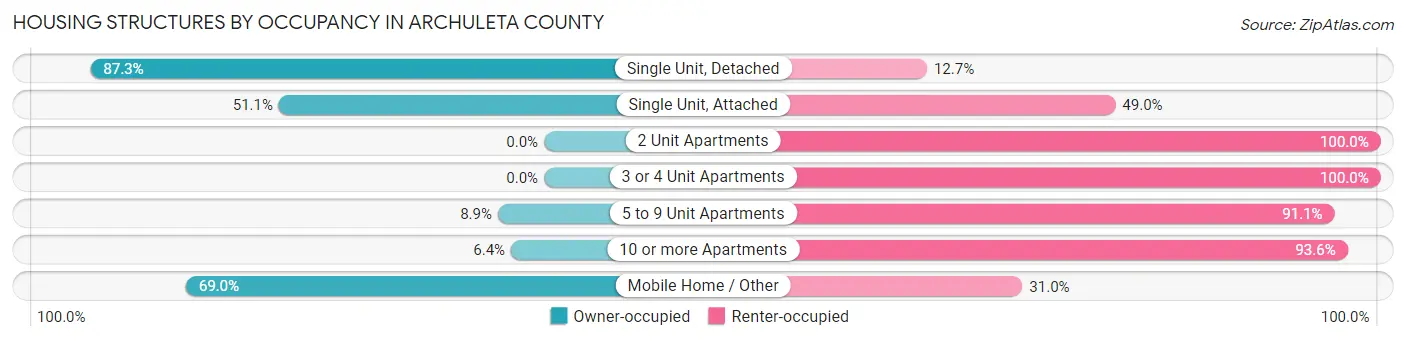
| Structure Type | Owner-occupied | Renter-occupied |
| Single Unit, Detached | 3,721 (87.3%) | 540 (12.7%) |
| Single Unit, Attached | 121 (51.0%) | 116 (48.9%) |
| 2 Unit Apartments | 0 (0.0%) | 102 (100.0%) |
| 3 or 4 Unit Apartments | 0 (0.0%) | 100 (100.0%) |
| 5 to 9 Unit Apartments | 12 (8.9%) | 123 (91.1%) |
| 10 or more Apartments | 13 (6.4%) | 191 (93.6%) |
| Mobile Home / Other | 482 (69.0%) | 217 (31.0%) |
| Total | 4,349 (75.8%) | 1,389 (24.2%) |
Housing Structures by Number of Rooms in Archuleta County
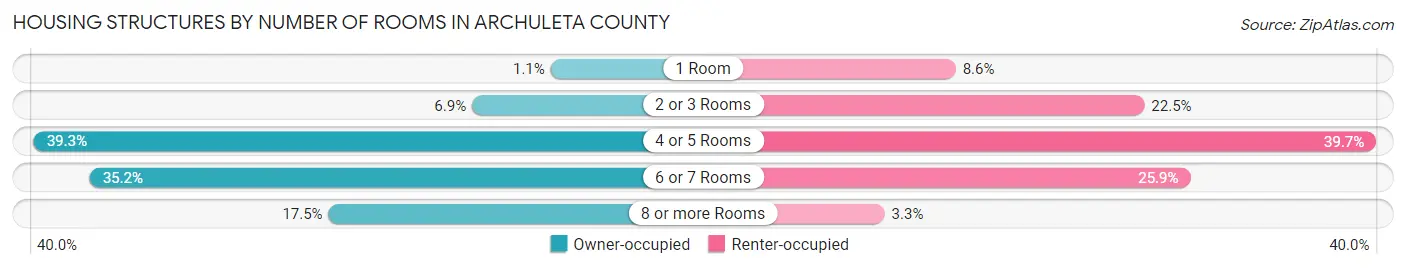
| Number of Rooms | Owner-occupied | Renter-occupied |
| 1 Room | 47 (1.1%) | 119 (8.6%) |
| 2 or 3 Rooms | 300 (6.9%) | 313 (22.5%) |
| 4 or 5 Rooms | 1,710 (39.3%) | 551 (39.7%) |
| 6 or 7 Rooms | 1,530 (35.2%) | 360 (25.9%) |
| 8 or more Rooms | 762 (17.5%) | 46 (3.3%) |
| Total | 4,349 (100.0%) | 1,389 (100.0%) |
Housing Structure by Heating Type in Archuleta County
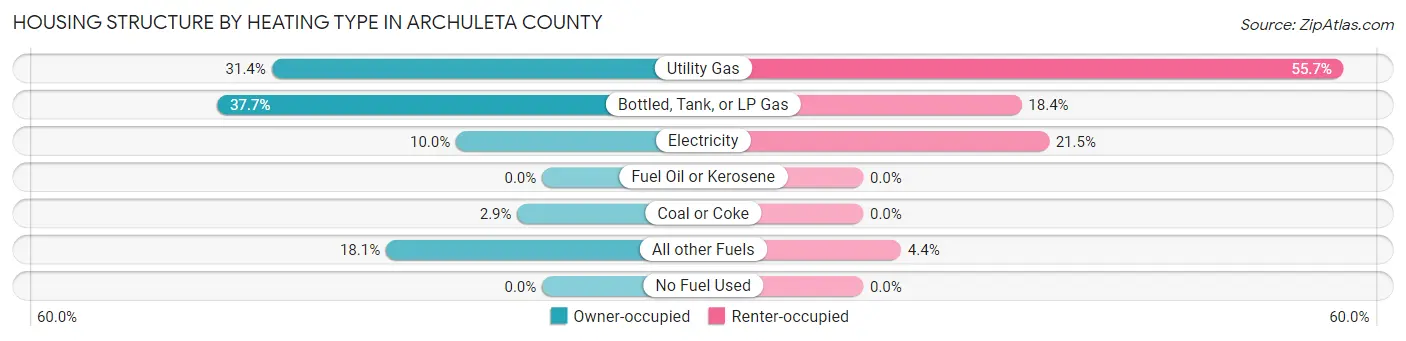
| Heating Type | Owner-occupied | Renter-occupied |
| Utility Gas | 1,364 (31.4%) | 774 (55.7%) |
| Bottled, Tank, or LP Gas | 1,639 (37.7%) | 255 (18.4%) |
| Electricity | 434 (10.0%) | 299 (21.5%) |
| Fuel Oil or Kerosene | 0 (0.0%) | 0 (0.0%) |
| Coal or Coke | 125 (2.9%) | 0 (0.0%) |
| All other Fuels | 787 (18.1%) | 61 (4.4%) |
| No Fuel Used | 0 (0.0%) | 0 (0.0%) |
| Total | 4,349 (100.0%) | 1,389 (100.0%) |
Household Vehicle Usage in Archuleta County
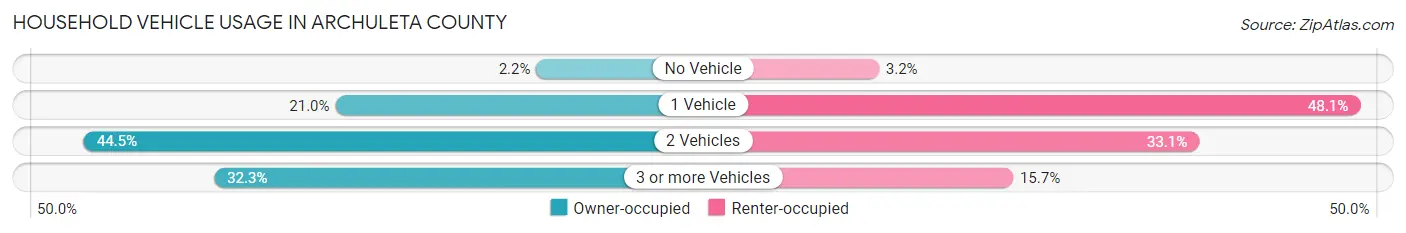
| Vehicles per Household | Owner-occupied | Renter-occupied |
| No Vehicle | 97 (2.2%) | 44 (3.2%) |
| 1 Vehicle | 913 (21.0%) | 668 (48.1%) |
| 2 Vehicles | 1,934 (44.5%) | 459 (33.1%) |
| 3 or more Vehicles | 1,405 (32.3%) | 218 (15.7%) |
| Total | 4,349 (100.0%) | 1,389 (100.0%) |
Real Estate & Mortgages in Archuleta County
Real Estate and Mortgage Overview in Archuleta County
| Characteristic | Without Mortgage | With Mortgage |
| Housing Units | 2,007 | 2,342 |
| Median Property Value | $431,500 | $433,100 |
| Median Household Income | $60,764 | $418 |
| Monthly Housing Costs | $491 | $270 |
| Real Estate Taxes | $1,449 | $4 |
Property Value by Mortgage Status in Archuleta County
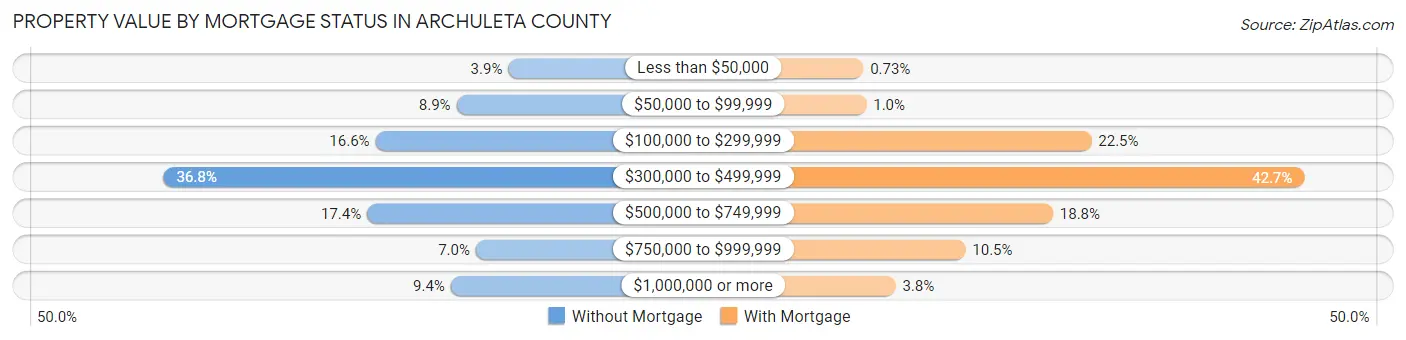
| Property Value | Without Mortgage | With Mortgage |
| Less than $50,000 | 79 (3.9%) | 17 (0.7%) |
| $50,000 to $99,999 | 178 (8.9%) | 24 (1.0%) |
| $100,000 to $299,999 | 333 (16.6%) | 526 (22.5%) |
| $300,000 to $499,999 | 738 (36.8%) | 1,001 (42.7%) |
| $500,000 to $749,999 | 349 (17.4%) | 440 (18.8%) |
| $750,000 to $999,999 | 141 (7.0%) | 245 (10.5%) |
| $1,000,000 or more | 189 (9.4%) | 89 (3.8%) |
| Total | 2,007 (100.0%) | 2,342 (100.0%) |
Household Income by Mortgage Status in Archuleta County
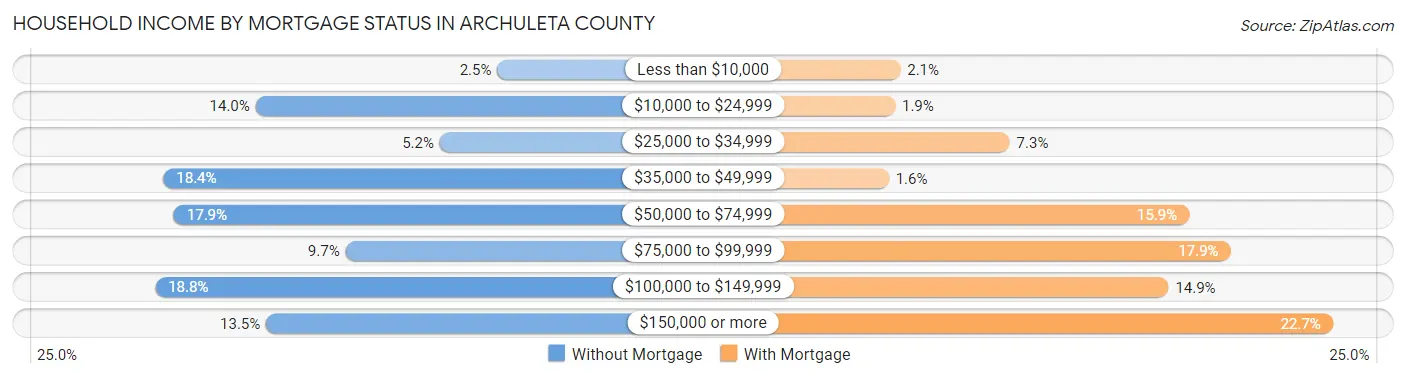
| Household Income | Without Mortgage | With Mortgage |
| Less than $10,000 | 50 (2.5%) | 50 (2.1%) |
| $10,000 to $24,999 | 281 (14.0%) | 44 (1.9%) |
| $25,000 to $34,999 | 105 (5.2%) | 172 (7.3%) |
| $35,000 to $49,999 | 369 (18.4%) | 37 (1.6%) |
| $50,000 to $74,999 | 359 (17.9%) | 372 (15.9%) |
| $75,000 to $99,999 | 195 (9.7%) | 418 (17.8%) |
| $100,000 to $149,999 | 377 (18.8%) | 349 (14.9%) |
| $150,000 or more | 271 (13.5%) | 532 (22.7%) |
| Total | 2,007 (100.0%) | 2,342 (100.0%) |
Property Value to Household Income Ratio in Archuleta County
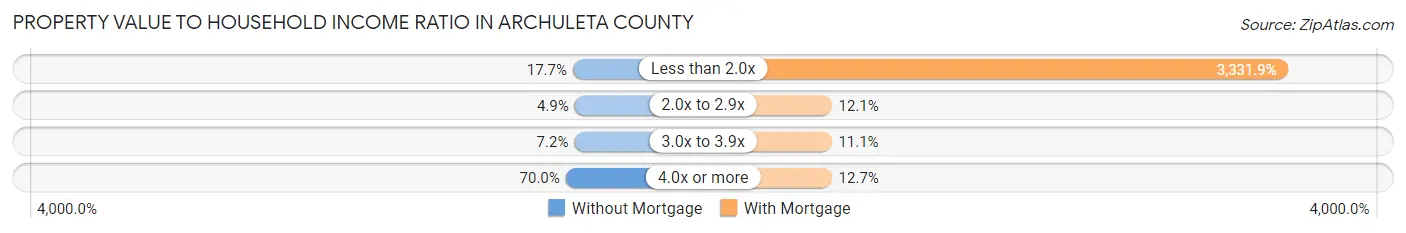
| Value-to-Income Ratio | Without Mortgage | With Mortgage |
| Less than 2.0x | 355 (17.7%) | 78,033 (3,331.9%) |
| 2.0x to 2.9x | 99 (4.9%) | 283 (12.1%) |
| 3.0x to 3.9x | 145 (7.2%) | 259 (11.1%) |
| 4.0x or more | 1,405 (70.0%) | 297 (12.7%) |
| Total | 2,007 (100.0%) | 2,342 (100.0%) |
Real Estate Taxes by Mortgage Status in Archuleta County
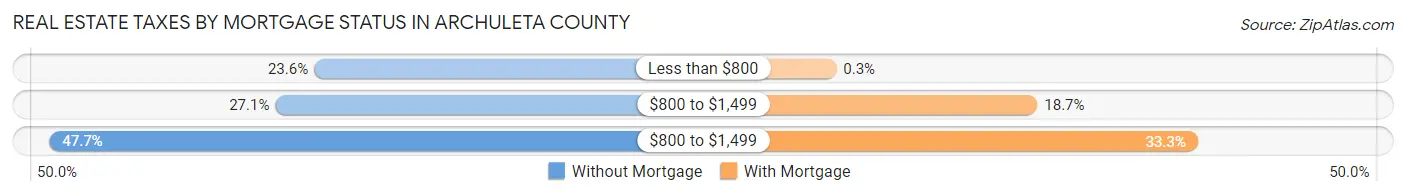
| Property Taxes | Without Mortgage | With Mortgage |
| Less than $800 | 473 (23.6%) | 7 (0.3%) |
| $800 to $1,499 | 544 (27.1%) | 437 (18.7%) |
| $800 to $1,499 | 958 (47.7%) | 780 (33.3%) |
| Total | 2,007 (100.0%) | 2,342 (100.0%) |
Health & Disability in Archuleta County
Health Insurance Coverage by Age in Archuleta County
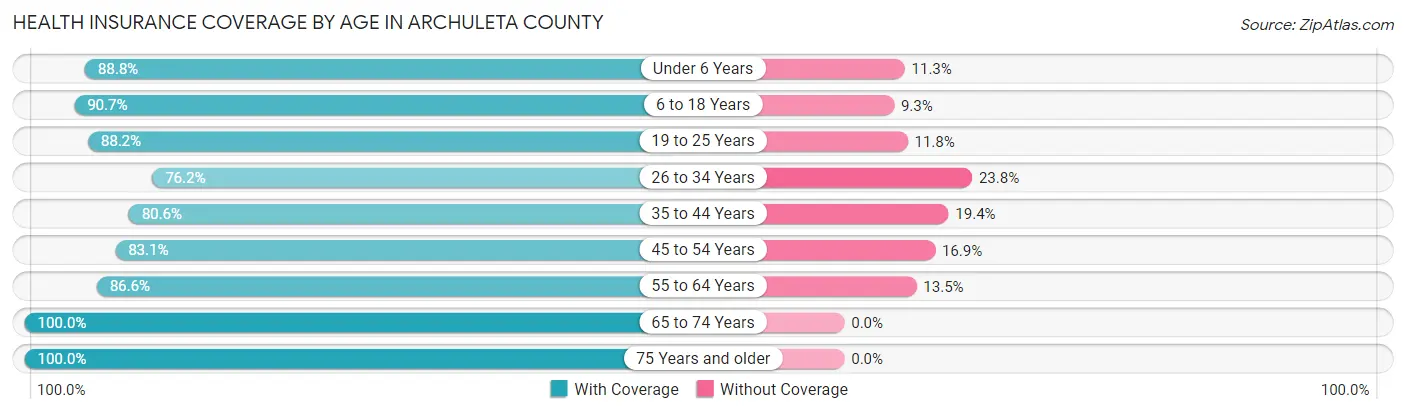
| Age Bracket | With Coverage | Without Coverage |
| Under 6 Years | 655 (88.7%) | 83 (11.3%) |
| 6 to 18 Years | 1,656 (90.7%) | 169 (9.3%) |
| 19 to 25 Years | 553 (88.2%) | 74 (11.8%) |
| 26 to 34 Years | 832 (76.2%) | 260 (23.8%) |
| 35 to 44 Years | 1,340 (80.6%) | 323 (19.4%) |
| 45 to 54 Years | 1,204 (83.1%) | 245 (16.9%) |
| 55 to 64 Years | 2,078 (86.6%) | 323 (13.5%) |
| 65 to 74 Years | 2,512 (100.0%) | 0 (0.0%) |
| 75 Years and older | 1,085 (100.0%) | 0 (0.0%) |
| Total | 11,915 (89.0%) | 1,477 (11.0%) |
Health Insurance Coverage by Citizenship Status in Archuleta County
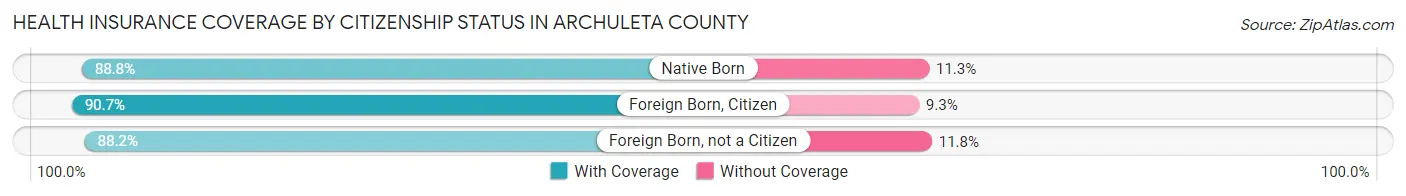
| Citizenship Status | With Coverage | Without Coverage |
| Native Born | 655 (88.7%) | 83 (11.3%) |
| Foreign Born, Citizen | 1,656 (90.7%) | 169 (9.3%) |
| Foreign Born, not a Citizen | 553 (88.2%) | 74 (11.8%) |
Health Insurance Coverage by Household Income in Archuleta County
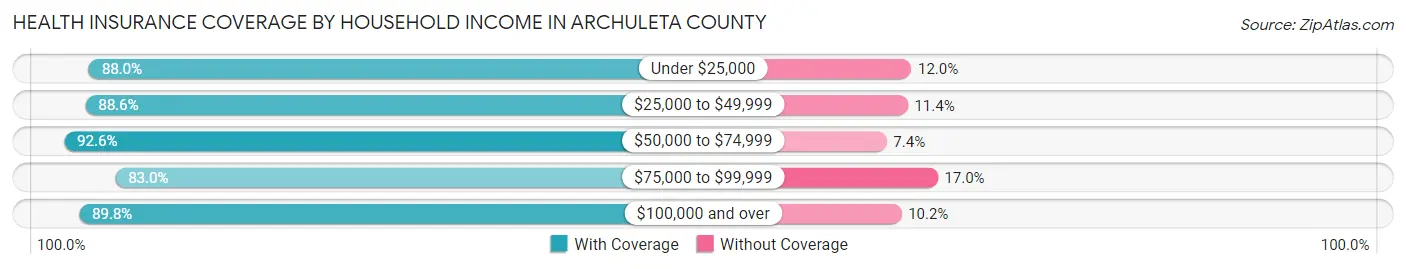
| Household Income | With Coverage | Without Coverage |
| Under $25,000 | 1,264 (88.0%) | 173 (12.0%) |
| $25,000 to $49,999 | 2,167 (88.6%) | 278 (11.4%) |
| $50,000 to $74,999 | 2,559 (92.6%) | 205 (7.4%) |
| $75,000 to $99,999 | 1,633 (83.0%) | 334 (17.0%) |
| $100,000 and over | 4,214 (89.8%) | 478 (10.2%) |
Public vs Private Health Insurance Coverage by Age in Archuleta County
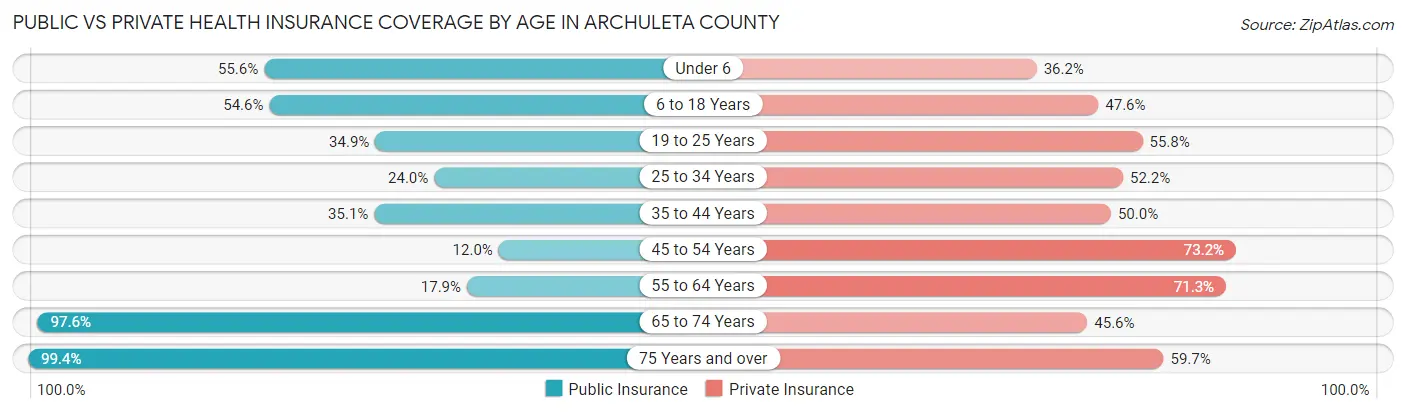
| Age Bracket | Public Insurance | Private Insurance |
| Under 6 | 410 (55.6%) | 267 (36.2%) |
| 6 to 18 Years | 996 (54.6%) | 869 (47.6%) |
| 19 to 25 Years | 219 (34.9%) | 350 (55.8%) |
| 25 to 34 Years | 262 (24.0%) | 570 (52.2%) |
| 35 to 44 Years | 584 (35.1%) | 831 (50.0%) |
| 45 to 54 Years | 174 (12.0%) | 1,060 (73.2%) |
| 55 to 64 Years | 430 (17.9%) | 1,712 (71.3%) |
| 65 to 74 Years | 2,451 (97.6%) | 1,145 (45.6%) |
| 75 Years and over | 1,078 (99.4%) | 648 (59.7%) |
| Total | 6,604 (49.3%) | 7,452 (55.6%) |
Disability Status by Sex by Age in Archuleta County
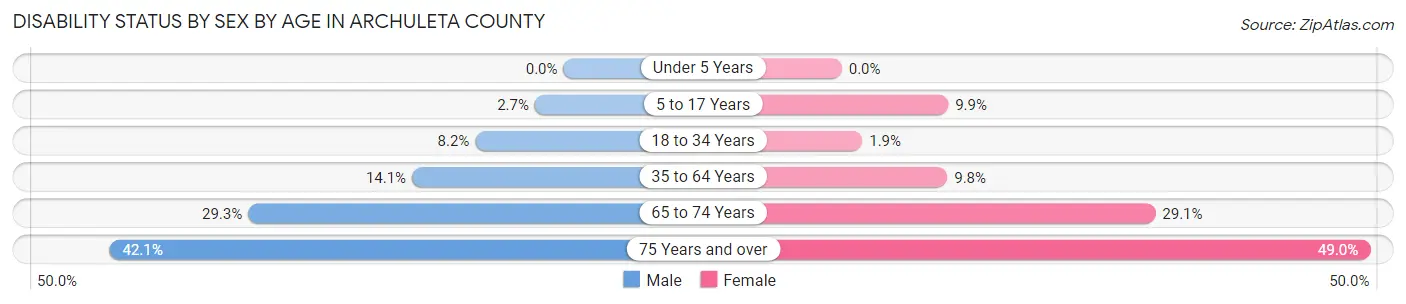
| Age Bracket | Male | Female |
| Under 5 Years | 0 (0.0%) | 0 (0.0%) |
| 5 to 17 Years | 28 (2.6%) | 76 (9.9%) |
| 18 to 34 Years | 73 (8.2%) | 19 (1.9%) |
| 35 to 64 Years | 390 (14.1%) | 268 (9.8%) |
| 65 to 74 Years | 378 (29.3%) | 355 (29.1%) |
| 75 Years and over | 219 (42.1%) | 277 (49.0%) |
Disability Class by Sex by Age in Archuleta County
Disability Class: Hearing Difficulty
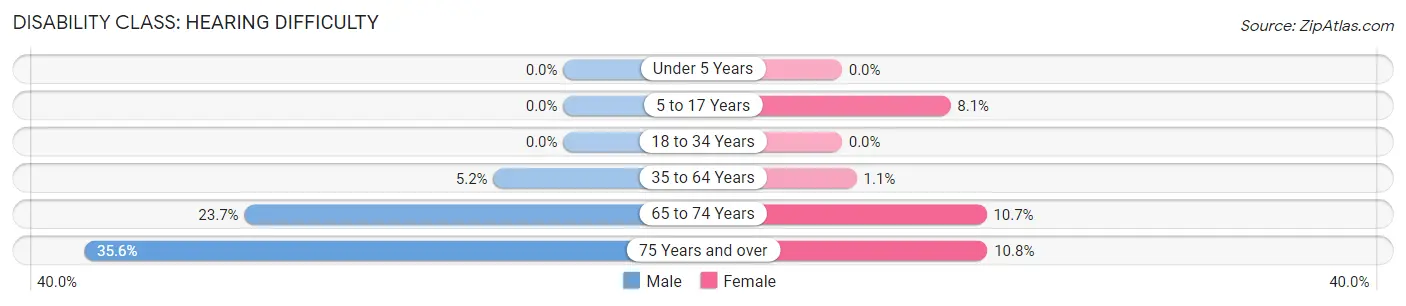
| Age Bracket | Male | Female |
| Under 5 Years | 0 (0.0%) | 0 (0.0%) |
| 5 to 17 Years | 0 (0.0%) | 62 (8.1%) |
| 18 to 34 Years | 0 (0.0%) | 0 (0.0%) |
| 35 to 64 Years | 144 (5.2%) | 30 (1.1%) |
| 65 to 74 Years | 306 (23.7%) | 131 (10.7%) |
| 75 Years and over | 185 (35.6%) | 61 (10.8%) |
Disability Class: Vision Difficulty
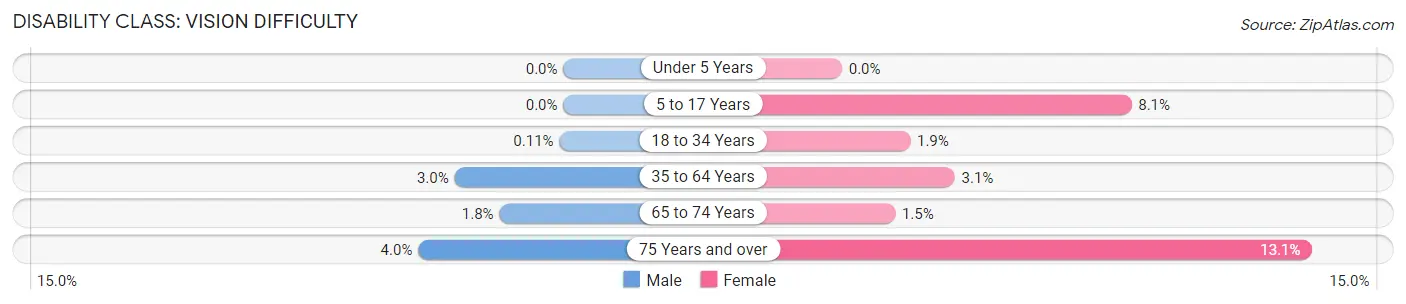
| Age Bracket | Male | Female |
| Under 5 Years | 0 (0.0%) | 0 (0.0%) |
| 5 to 17 Years | 0 (0.0%) | 62 (8.1%) |
| 18 to 34 Years | 1 (0.1%) | 19 (1.9%) |
| 35 to 64 Years | 84 (3.0%) | 86 (3.1%) |
| 65 to 74 Years | 23 (1.8%) | 18 (1.5%) |
| 75 Years and over | 21 (4.0%) | 74 (13.1%) |
Disability Class: Cognitive Difficulty
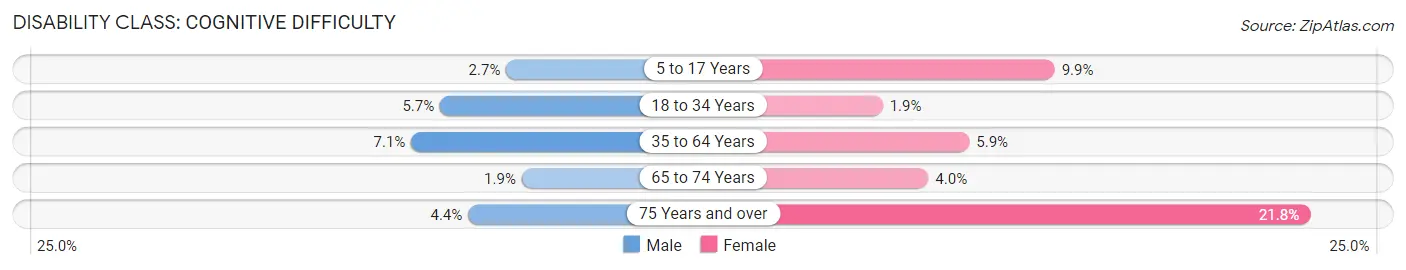
| Age Bracket | Male | Female |
| 5 to 17 Years | 28 (2.6%) | 76 (9.9%) |
| 18 to 34 Years | 51 (5.7%) | 19 (1.9%) |
| 35 to 64 Years | 196 (7.1%) | 162 (5.9%) |
| 65 to 74 Years | 25 (1.9%) | 49 (4.0%) |
| 75 Years and over | 23 (4.4%) | 123 (21.8%) |
Disability Class: Ambulatory Difficulty
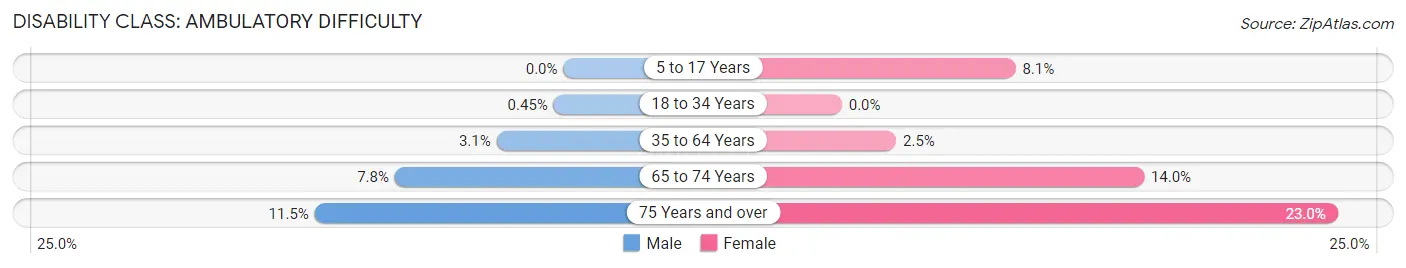
| Age Bracket | Male | Female |
| 5 to 17 Years | 0 (0.0%) | 62 (8.1%) |
| 18 to 34 Years | 4 (0.4%) | 0 (0.0%) |
| 35 to 64 Years | 86 (3.1%) | 69 (2.5%) |
| 65 to 74 Years | 101 (7.8%) | 171 (14.0%) |
| 75 Years and over | 60 (11.5%) | 130 (23.0%) |
Disability Class: Self-Care Difficulty
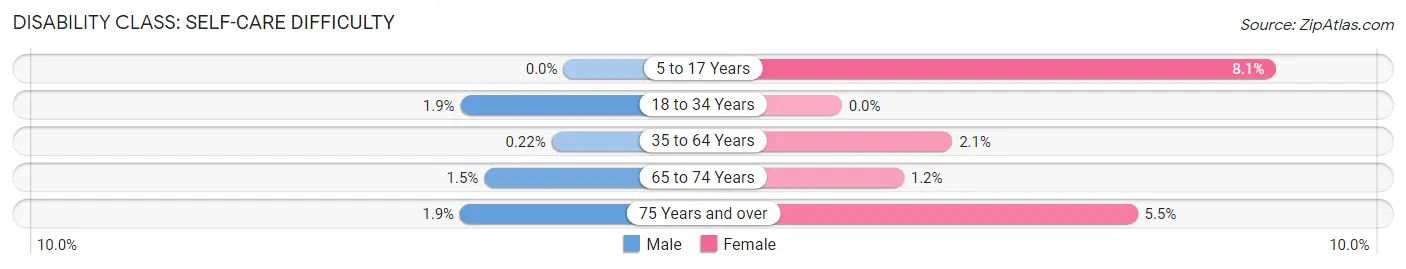
| Age Bracket | Male | Female |
| 5 to 17 Years | 0 (0.0%) | 62 (8.1%) |
| 18 to 34 Years | 17 (1.9%) | 0 (0.0%) |
| 35 to 64 Years | 6 (0.2%) | 56 (2.1%) |
| 65 to 74 Years | 19 (1.5%) | 14 (1.1%) |
| 75 Years and over | 10 (1.9%) | 31 (5.5%) |
Technology Access in Archuleta County
Computing Device Access in Archuleta County
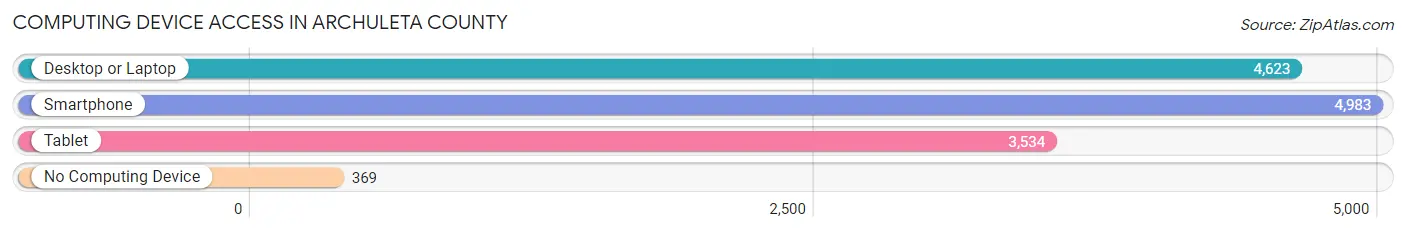
| Device Type | # Households | % Households |
| Desktop or Laptop | 4,623 | 80.6% |
| Smartphone | 4,983 | 86.8% |
| Tablet | 3,534 | 61.6% |
| No Computing Device | 369 | 6.4% |
| Total | 5,738 | 100.0% |
Internet Access in Archuleta County
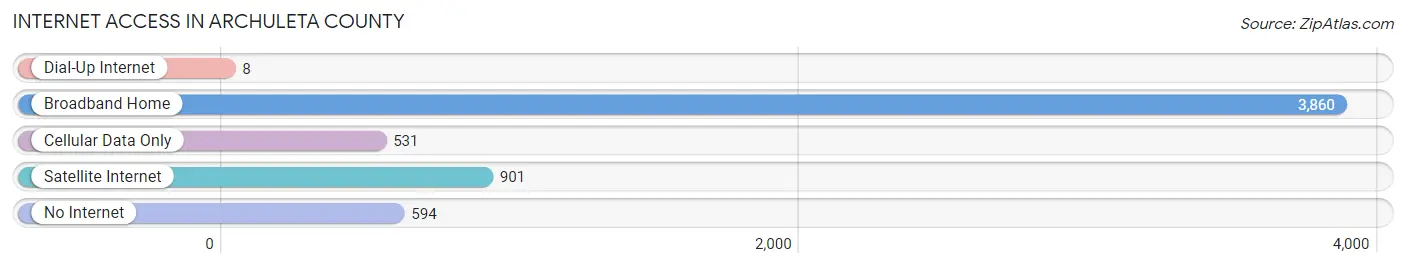
| Internet Type | # Households | % Households |
| Dial-Up Internet | 8 | 0.1% |
| Broadband Home | 3,860 | 67.3% |
| Cellular Data Only | 531 | 9.2% |
| Satellite Internet | 901 | 15.7% |
| No Internet | 594 | 10.3% |
| Total | 5,738 | 100.0% |
Archuleta County Summary
Archuleta County is located in the southwestern corner of Colorado, and is bordered by La Plata County to the north, San Juan County to the east, and Rio Arriba County, New Mexico to the south and west. The county seat is Pagosa Springs, and the county is named after the Archuleta family, who were early settlers in the area. The county has a total area of 1,845 square miles, and a population of 12,084 as of the 2010 census.
Archuleta County was established in 1885, and was originally part of La Plata County. The county was named after the Archuleta family, who were early settlers in the area. The county seat is Pagosa Springs, which was founded in 1876. The county is home to the San Juan National Forest, which covers over 1.8 million acres and is the largest national forest in Colorado.
Geography
Archuleta County is located in the southwestern corner of Colorado, and is bordered by La Plata County to the north, San Juan County to the east, and Rio Arriba County, New Mexico to the south and west. The county has a total area of 1,845 square miles, and is the second largest county in Colorado. The county is located in the San Juan Mountains, and is home to the San Juan National Forest, which covers over 1.8 million acres and is the largest national forest in Colorado. The county is also home to the Weminuche Wilderness, which is the largest wilderness area in Colorado.
The county is home to several mountain peaks, including Mount Baldy, which is the highest peak in the county at 12,441 feet. The county also contains several rivers, including the San Juan River, which is the longest river in the county at over 200 miles.
Economy
Archuleta County has a diverse economy, with the largest industries being tourism, agriculture, and energy. Tourism is the largest industry in the county, and is driven by the county's natural beauty and outdoor recreation opportunities. The county is home to several ski resorts, including Wolf Creek Ski Area, which is the largest ski area in Colorado. The county is also home to several national parks and monuments, including Mesa Verde National Park and Chimney Rock National Monument.
Agriculture is also an important part of the county's economy, and the county is home to several farms and ranches. The county is home to several wineries, and is also home to the Pagosa Springs Brewing Company, which produces several craft beers.
Energy is also an important part of the county's economy, and the county is home to several coal mines and natural gas wells. The county is also home to several renewable energy projects, including wind farms and solar farms.
Demographics
As of the 2010 census, the population of Archuleta County was 12,084. The population is spread out with a median age of 44.7 years. The racial makeup of the county is 87.3% White, 0.7% African American, 1.2% Native American, 0.5% Asian, 0.1% Pacific Islander, 8.2% from other races, and 2.1% from two or more races. Hispanic or Latino of any race were 18.3% of the population.
The median income for a household in the county was $41,945, and the median income for a family was $50,945. The per capita income for the county was $22,945. About 11.3% of families and 15.2% of the population were below the poverty line, including 19.3% of those under age 18 and 8.2% of those age 65 or over.
Common Questions
What is Per Capita Income in Archuleta County?
Per Capita income in Archuleta County is $39,155.
What is the Median Family Income in Archuleta County?
Median Family Income in Archuleta County is $78,896.
What is the Median Household income in Archuleta County?
Median Household Income in Archuleta County is $66,813.
What is Income or Wage Gap in Archuleta County?
Income or Wage Gap in Archuleta County is 29.4%.
Women in Archuleta County earn 70.6 cents for every dollar earned by a man.
What is Inequality or Gini Index in Archuleta County?
Inequality or Gini Index in Archuleta County is 0.44.
What is the Total Population of Archuleta County?
Total Population of Archuleta County is 13,509.
What is the Total Male Population of Archuleta County?
Total Male Population of Archuleta County is 6,827.
What is the Total Female Population of Archuleta County?
Total Female Population of Archuleta County is 6,682.
What is the Ratio of Males per 100 Females in Archuleta County?
There are 102.17 Males per 100 Females in Archuleta County.
What is the Ratio of Females per 100 Males in Archuleta County?
There are 97.88 Females per 100 Males in Archuleta County.
What is the Median Population Age in Archuleta County?
Median Population Age in Archuleta County is 50.8 Years.
What is the Average Family Size in Archuleta County
Average Family Size in Archuleta County is 2.7 People.
What is the Average Household Size in Archuleta County
Average Household Size in Archuleta County is 2.3 People.
How Large is the Labor Force in Archuleta County?
There are 6,293 People in the Labor Forcein in Archuleta County.
What is the Percentage of People in the Labor Force in Archuleta County?
55.4% of People are in the Labor Force in Archuleta County.
What is the Unemployment Rate in Archuleta County?
Unemployment Rate in Archuleta County is 4.8%.