Alamosa County, CO Map & Demographics
Alamosa County Map
Alamosa County Overview
$28,945
PER CAPITA INCOME
$65,720
AVG FAMILY INCOME
$52,271
AVG HOUSEHOLD INCOME
17.3%
WAGE / INCOME GAP [ % ]
82.7¢/ $1
WAGE / INCOME GAP [ $ ]
$8,387
FAMILY INCOME DEFICIT
0.47
INEQUALITY / GINI INDEX
16,460
TOTAL POPULATION
8,160
MALE POPULATION
8,300
FEMALE POPULATION
98.31
MALES / 100 FEMALES
101.72
FEMALES / 100 MALES
32.2
MEDIAN AGE
3.0
AVG FAMILY SIZE
2.4
AVG HOUSEHOLD SIZE
8,176
LABOR FORCE [ PEOPLE ]
63.1%
PERCENT IN LABOR FORCE
3.4%
UNEMPLOYMENT RATE
Alamosa County Area Codes
Income in Alamosa County
Income Overview in Alamosa County
Per Capita Income in Alamosa County is $28,945, while median incomes of families and households are $65,720 and $52,271 respectively.
| Characteristic | Number | Measure |
| Per Capita Income | 16,460 | $28,945 |
| Median Family Income | 4,044 | $65,720 |
| Mean Family Income | 4,044 | $90,810 |
| Median Household Income | 6,471 | $52,271 |
| Mean Household Income | 6,471 | $74,983 |
| Income Deficit | 4,044 | $8,387 |
| Wage / Income Gap (%) | 16,460 | 17.30% |
| Wage / Income Gap ($) | 16,460 | 82.70¢ per $1 |
| Gini / Inequality Index | 16,460 | 0.47 |
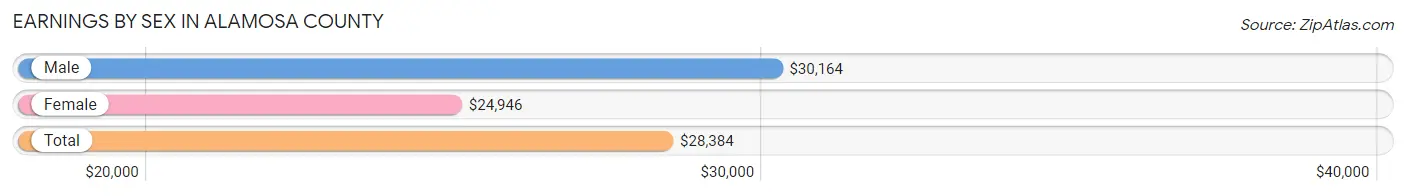
Earnings by Sex in Alamosa County
Average Earnings in Alamosa County are $28,384, $30,164 for men and $24,946 for women, a difference of 17.3%.
| Sex | Number | Average Earnings |
| Male | 4,834 (52.2%) | $30,164 |
| Female | 4,420 (47.8%) | $24,946 |
| Total | 9,254 (100.0%) | $28,384 |
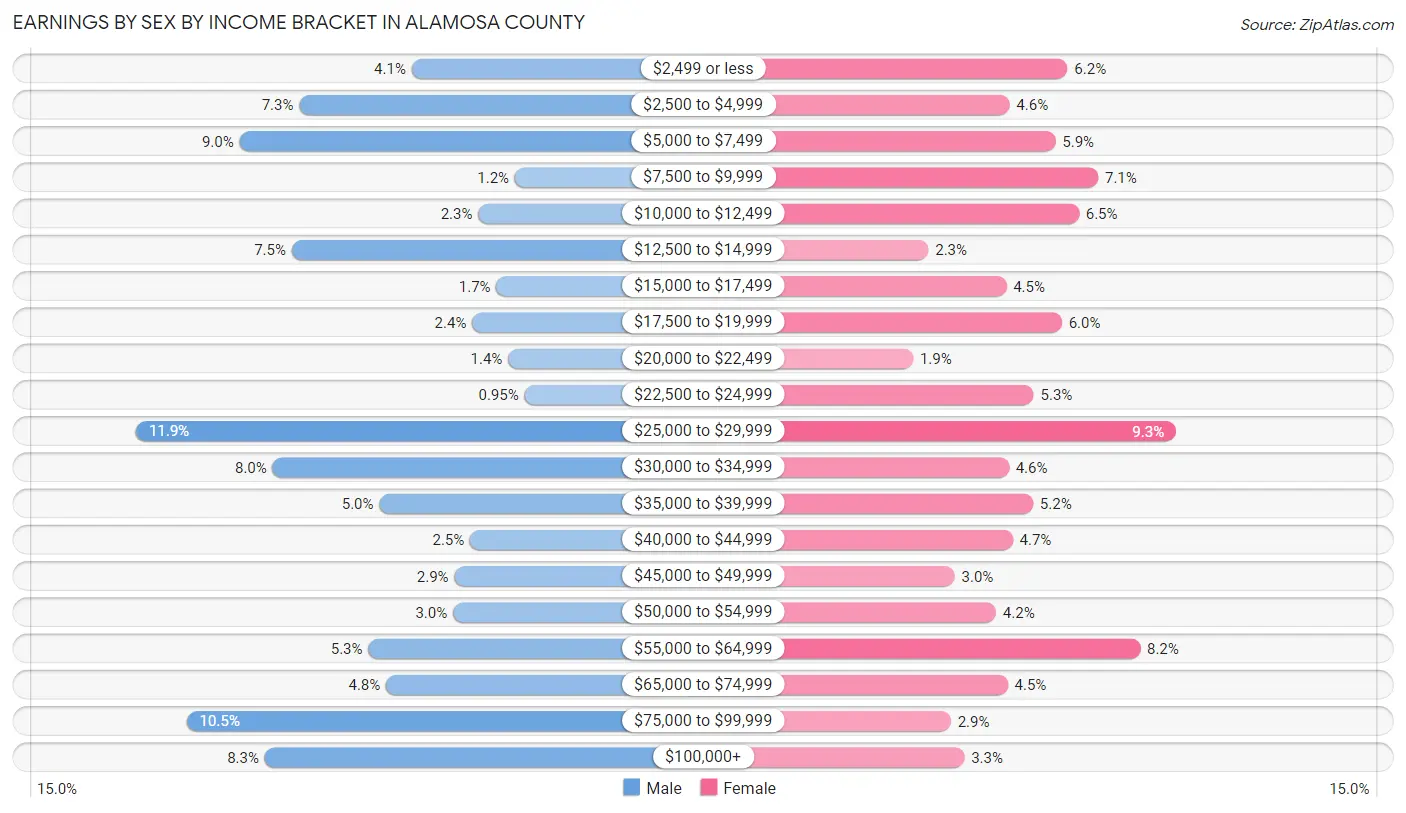
Earnings by Sex by Income Bracket in Alamosa County
The most common earnings brackets in Alamosa County are $25,000 to $29,999 for men (574 | 11.9%) and $25,000 to $29,999 for women (409 | 9.2%).
| Income | Male | Female |
| $2,499 or less | 199 (4.1%) | 274 (6.2%) |
| $2,500 to $4,999 | 352 (7.3%) | 202 (4.6%) |
| $5,000 to $7,499 | 433 (9.0%) | 259 (5.9%) |
| $7,500 to $9,999 | 59 (1.2%) | 312 (7.1%) |
| $10,000 to $12,499 | 109 (2.2%) | 288 (6.5%) |
| $12,500 to $14,999 | 362 (7.5%) | 101 (2.3%) |
| $15,000 to $17,499 | 84 (1.7%) | 198 (4.5%) |
| $17,500 to $19,999 | 117 (2.4%) | 267 (6.0%) |
| $20,000 to $22,499 | 68 (1.4%) | 82 (1.9%) |
| $22,500 to $24,999 | 46 (0.9%) | 232 (5.2%) |
| $25,000 to $29,999 | 574 (11.9%) | 409 (9.2%) |
| $30,000 to $34,999 | 388 (8.0%) | 201 (4.5%) |
| $35,000 to $39,999 | 243 (5.0%) | 231 (5.2%) |
| $40,000 to $44,999 | 120 (2.5%) | 206 (4.7%) |
| $45,000 to $49,999 | 141 (2.9%) | 134 (3.0%) |
| $50,000 to $54,999 | 143 (3.0%) | 185 (4.2%) |
| $55,000 to $64,999 | 258 (5.3%) | 364 (8.2%) |
| $65,000 to $74,999 | 234 (4.8%) | 200 (4.5%) |
| $75,000 to $99,999 | 505 (10.4%) | 129 (2.9%) |
| $100,000+ | 399 (8.3%) | 146 (3.3%) |
| Total | 4,834 (100.0%) | 4,420 (100.0%) |
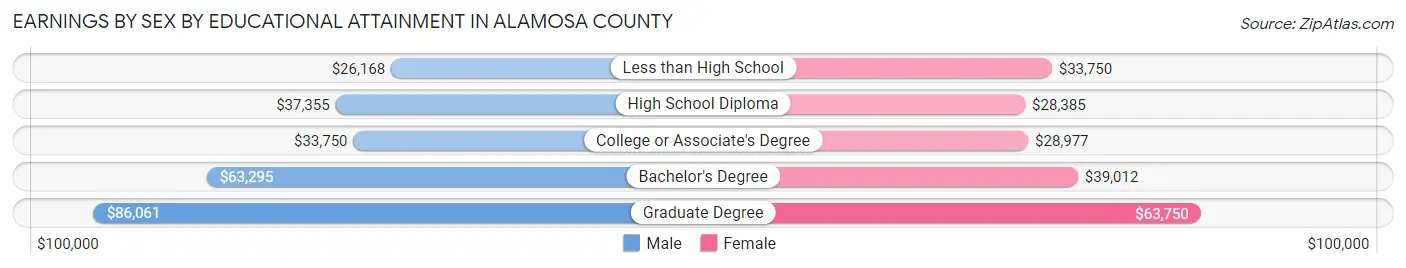
Earnings by Sex by Educational Attainment in Alamosa County
Average earnings in Alamosa County are $40,971 for men and $34,968 for women, a difference of 14.6%. Men with an educational attainment of graduate degree enjoy the highest average annual earnings of $86,061, while those with less than high school education earn the least with $26,168. Women with an educational attainment of graduate degree earn the most with the average annual earnings of $63,750, while those with high school diploma education have the smallest earnings of $28,385.
| Educational Attainment | Male Income | Female Income |
| Less than High School | $26,168 | $33,750 |
| High School Diploma | $37,355 | $28,385 |
| College or Associate's Degree | $33,750 | $28,977 |
| Bachelor's Degree | $63,295 | $39,012 |
| Graduate Degree | $86,061 | $63,750 |
| Total | $40,971 | $34,968 |
Family Income in Alamosa County
Family Income Brackets in Alamosa County
According to the Alamosa County family income data, there are 853 families falling into the $50,000 to $74,999 income range, which is the most common income bracket and makes up 21.1% of all families. Conversely, the less than $10,000 income bracket is the least frequent group with only 105 families (2.6%) belonging to this category.
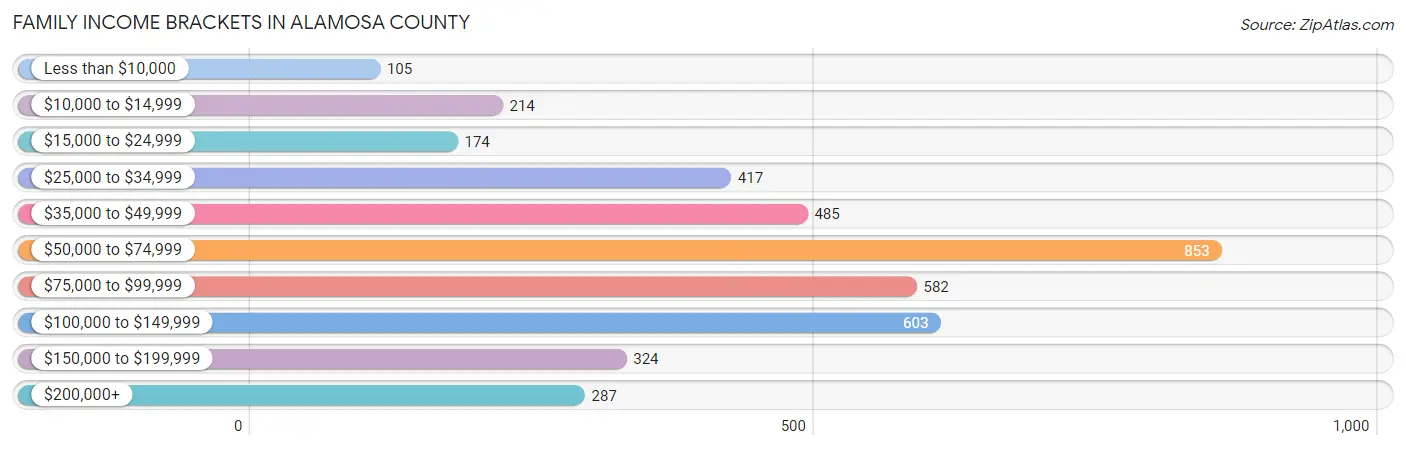
| Income Bracket | # Families | % Families |
| Less than $10,000 | 105 | 2.6% |
| $10,000 to $14,999 | 214 | 5.3% |
| $15,000 to $24,999 | 174 | 4.3% |
| $25,000 to $34,999 | 417 | 10.3% |
| $35,000 to $49,999 | 485 | 12.0% |
| $50,000 to $74,999 | 853 | 21.1% |
| $75,000 to $99,999 | 582 | 14.4% |
| $100,000 to $149,999 | 603 | 14.9% |
| $150,000 to $199,999 | 324 | 8.0% |
| $200,000+ | 287 | 7.1% |
Family Income by Famaliy Size in Alamosa County
4-person families (754 | 18.6%) account for the highest median family income in Alamosa County with $116,395 per family, while 2-person families (1,930 | 47.7%) have the highest median income of $30,982 per family member.
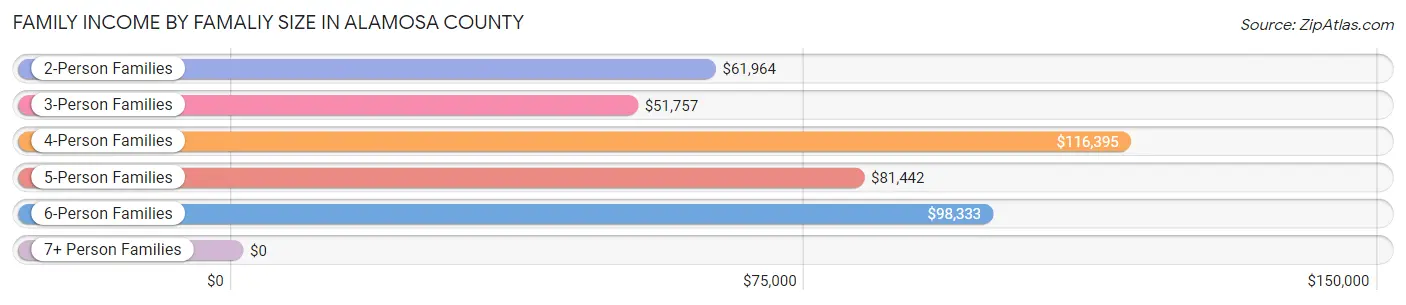
| Income Bracket | # Families | Median Income |
| 2-Person Families | 1,930 (47.7%) | $61,964 |
| 3-Person Families | 1,028 (25.4%) | $51,757 |
| 4-Person Families | 754 (18.6%) | $116,395 |
| 5-Person Families | 170 (4.2%) | $81,442 |
| 6-Person Families | 52 (1.3%) | $98,333 |
| 7+ Person Families | 110 (2.7%) | $0 |
| Total | 4,044 (100.0%) | $65,720 |
Family Income by Number of Earners in Alamosa County
The median family income in Alamosa County is $65,720, with families comprising 3+ earners (460) having the highest median family income of $115,523, while families with no earners (440) have the lowest median family income of $40,417, accounting for 11.4% and 10.9% of families, respectively.
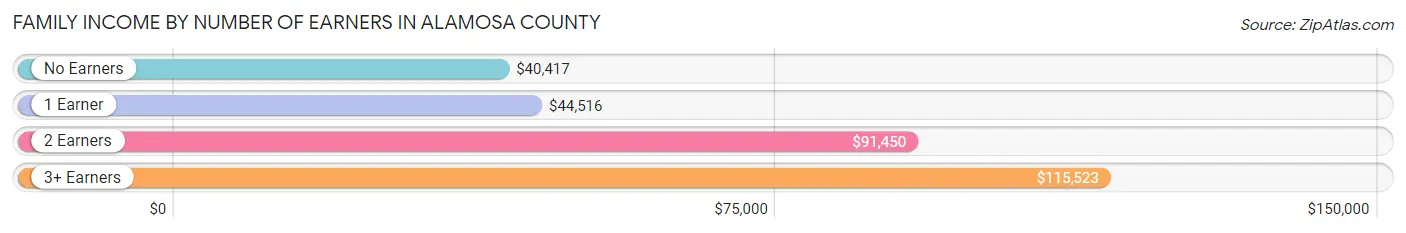
| Number of Earners | # Families | Median Income |
| No Earners | 440 (10.9%) | $40,417 |
| 1 Earner | 1,445 (35.7%) | $44,516 |
| 2 Earners | 1,699 (42.0%) | $91,450 |
| 3+ Earners | 460 (11.4%) | $115,523 |
| Total | 4,044 (100.0%) | $65,720 |
Household Income in Alamosa County
Household Income Brackets in Alamosa County
With 1,307 households falling in the category, the $50,000 to $74,999 income range is the most frequent in Alamosa County, accounting for 20.2% of all households. In contrast, only 304 households (4.7%) fall into the less than $10,000 income bracket, making it the least populous group.
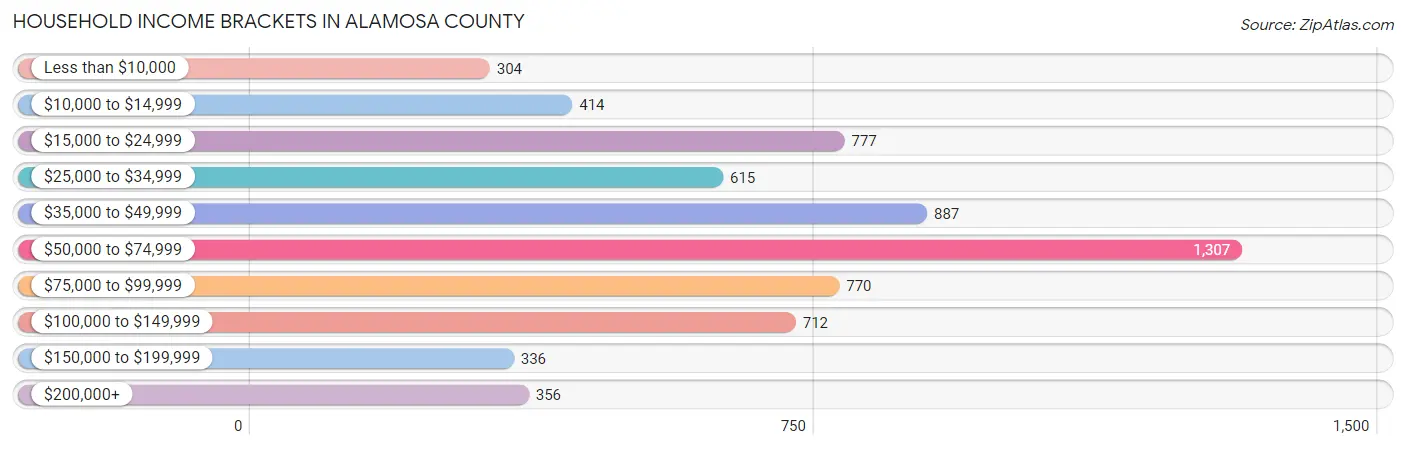
| Income Bracket | # Households | % Households |
| Less than $10,000 | 304 | 4.7% |
| $10,000 to $14,999 | 414 | 6.4% |
| $15,000 to $24,999 | 777 | 12.0% |
| $25,000 to $34,999 | 615 | 9.5% |
| $35,000 to $49,999 | 887 | 13.7% |
| $50,000 to $74,999 | 1,307 | 20.2% |
| $75,000 to $99,999 | 770 | 11.9% |
| $100,000 to $149,999 | 712 | 11.0% |
| $150,000 to $199,999 | 336 | 5.2% |
| $200,000+ | 356 | 5.5% |
Household Income by Householder Age in Alamosa County
The median household income in Alamosa County is $52,271, with the highest median household income of $56,773 found in the 25 to 44 years age bracket for the primary householder. A total of 2,285 households (35.3%) fall into this category. Meanwhile, the 15 to 24 years age bracket for the primary householder has the lowest median household income of $34,276, with 728 households (11.3%) in this group.
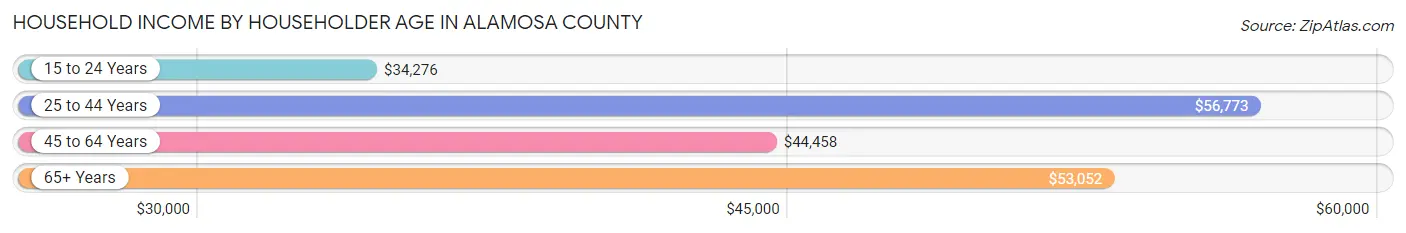
| Income Bracket | # Households | Median Income |
| 15 to 24 Years | 728 (11.3%) | $34,276 |
| 25 to 44 Years | 2,285 (35.3%) | $56,773 |
| 45 to 64 Years | 1,911 (29.5%) | $44,458 |
| 65+ Years | 1,547 (23.9%) | $53,052 |
| Total | 6,471 (100.0%) | $52,271 |
Poverty in Alamosa County
Income Below Poverty by Sex and Age in Alamosa County
With 14.4% poverty level for males and 16.6% for females among the residents of Alamosa County, 15 year old males and 12 to 14 year old females are the most vulnerable to poverty, with 39 males (50.6%) and 124 females (44.6%) in their respective age groups living below the poverty level.
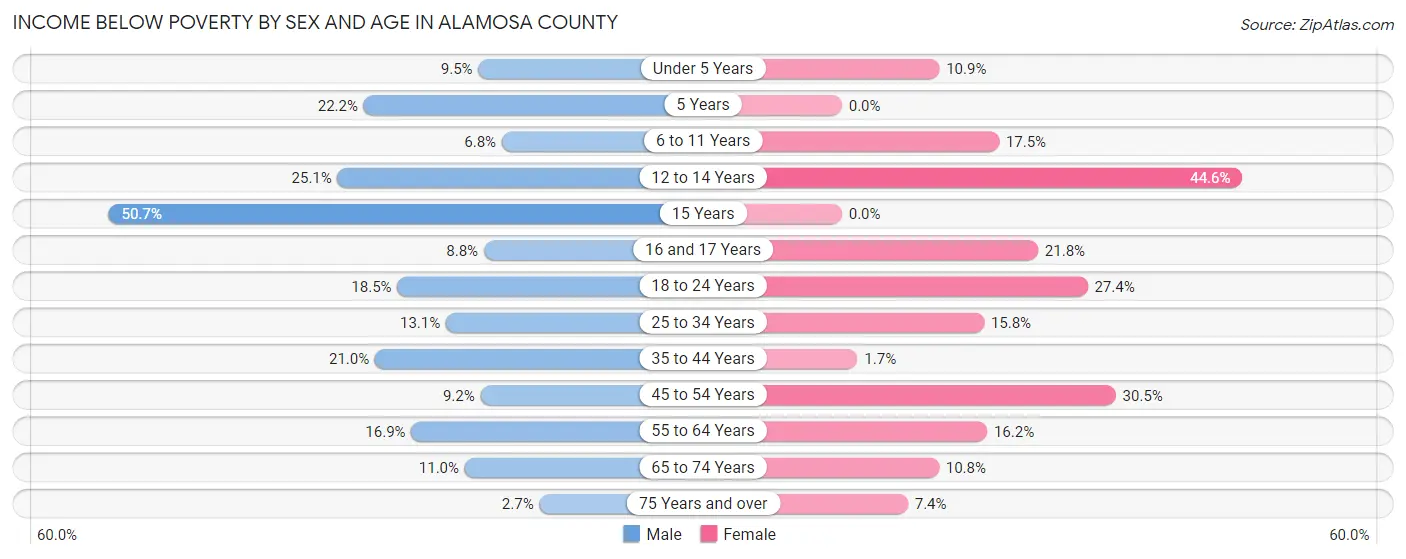
| Age Bracket | Male | Female |
| Under 5 Years | 40 (9.5%) | 59 (10.8%) |
| 5 Years | 16 (22.2%) | 0 (0.0%) |
| 6 to 11 Years | 54 (6.8%) | 112 (17.5%) |
| 12 to 14 Years | 92 (25.1%) | 124 (44.6%) |
| 15 Years | 39 (50.6%) | 0 (0.0%) |
| 16 and 17 Years | 22 (8.8%) | 38 (21.8%) |
| 18 to 24 Years | 192 (18.5%) | 298 (27.4%) |
| 25 to 34 Years | 143 (13.1%) | 171 (15.8%) |
| 35 to 44 Years | 217 (21.0%) | 15 (1.7%) |
| 45 to 54 Years | 58 (9.2%) | 226 (30.5%) |
| 55 to 64 Years | 144 (16.9%) | 148 (16.2%) |
| 65 to 74 Years | 80 (11.0%) | 89 (10.8%) |
| 75 Years and over | 8 (2.7%) | 33 (7.3%) |
| Total | 1,105 (14.4%) | 1,313 (16.6%) |
Income Above Poverty by Sex and Age in Alamosa County
According to the poverty statistics in Alamosa County, males aged 75 years and over and females aged 5 years are the age groups that are most secure financially, with 97.3% of males and 100.0% of females in these age groups living above the poverty line.
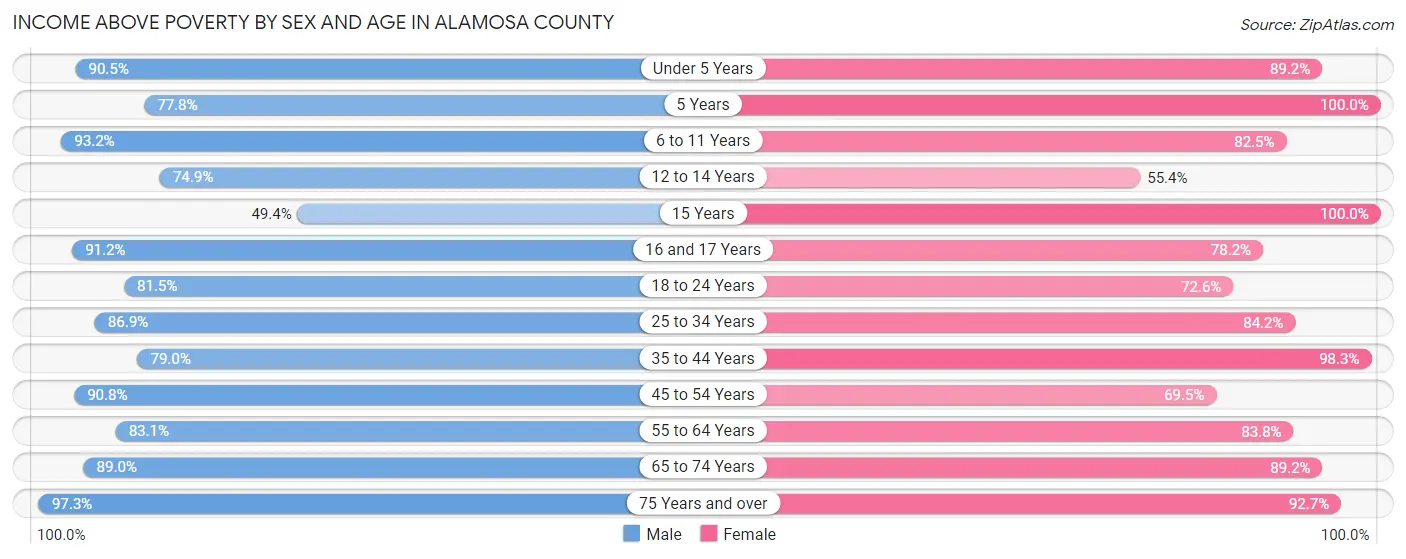
| Age Bracket | Male | Female |
| Under 5 Years | 383 (90.5%) | 485 (89.1%) |
| 5 Years | 56 (77.8%) | 184 (100.0%) |
| 6 to 11 Years | 735 (93.2%) | 528 (82.5%) |
| 12 to 14 Years | 274 (74.9%) | 154 (55.4%) |
| 15 Years | 38 (49.3%) | 130 (100.0%) |
| 16 and 17 Years | 227 (91.2%) | 136 (78.2%) |
| 18 to 24 Years | 847 (81.5%) | 791 (72.6%) |
| 25 to 34 Years | 952 (86.9%) | 909 (84.2%) |
| 35 to 44 Years | 818 (79.0%) | 848 (98.3%) |
| 45 to 54 Years | 571 (90.8%) | 515 (69.5%) |
| 55 to 64 Years | 707 (83.1%) | 767 (83.8%) |
| 65 to 74 Years | 649 (89.0%) | 735 (89.2%) |
| 75 Years and over | 293 (97.3%) | 416 (92.6%) |
| Total | 6,550 (85.6%) | 6,598 (83.4%) |
Income Below Poverty Among Married-Couple Families in Alamosa County
The poverty statistics for married-couple families in Alamosa County show that 6.1% or 169 of the total 2,785 families live below the poverty line. Families with 5 or more children have the highest poverty rate of 58.8%, comprising of 47 families. On the other hand, families with 1 or 2 children have the lowest poverty rate of 0.4%, which includes 4 families.
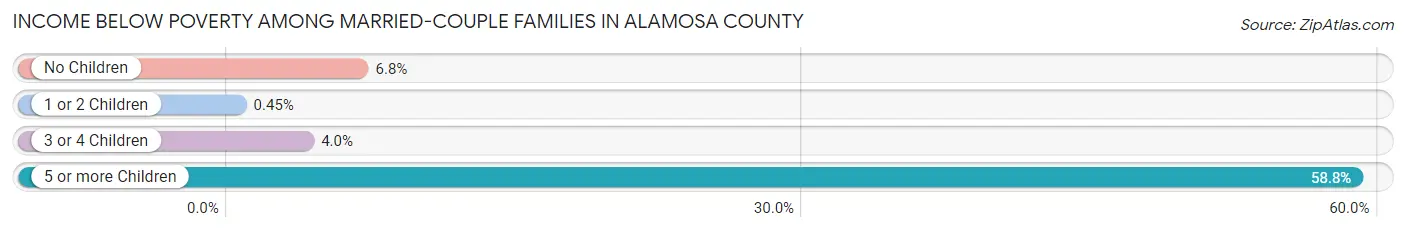
| Children | Above Poverty | Below Poverty |
| No Children | 1,504 (93.2%) | 110 (6.8%) |
| 1 or 2 Children | 886 (99.6%) | 4 (0.4%) |
| 3 or 4 Children | 193 (96.0%) | 8 (4.0%) |
| 5 or more Children | 33 (41.2%) | 47 (58.8%) |
| Total | 2,616 (93.9%) | 169 (6.1%) |
Income Below Poverty Among Single-Parent Households in Alamosa County
According to the poverty data in Alamosa County, 15.6% or 83 single-father households and 29.3% or 213 single-mother households are living below the poverty line. Among single-father households, those with 1 or 2 children have the highest poverty rate, with 31 households (18.4%) experiencing poverty. Likewise, among single-mother households, those with 1 or 2 children have the highest poverty rate, with 189 households (39.9%) falling below the poverty line.
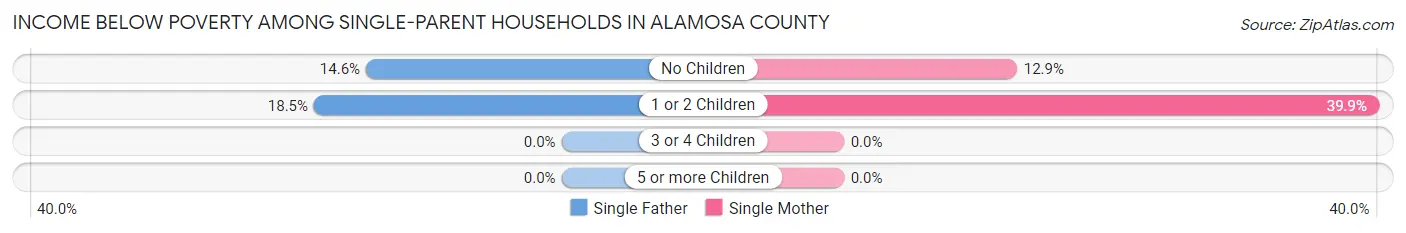
| Children | Single Father | Single Mother |
| No Children | 52 (14.6%) | 24 (12.9%) |
| 1 or 2 Children | 31 (18.4%) | 189 (39.9%) |
| 3 or 4 Children | 0 (0.0%) | 0 (0.0%) |
| 5 or more Children | 0 (0.0%) | 0 (0.0%) |
| Total | 83 (15.6%) | 213 (29.3%) |
Income Below Poverty Among Married-Couple vs Single-Parent Households in Alamosa County
The poverty data for Alamosa County shows that 169 of the married-couple family households (6.1%) and 296 of the single-parent households (23.5%) are living below the poverty level. Within the married-couple family households, those with 5 or more children have the highest poverty rate, with 47 households (58.8%) falling below the poverty line. Among the single-parent households, those with 1 or 2 children have the highest poverty rate, with 220 household (34.3%) living below poverty.
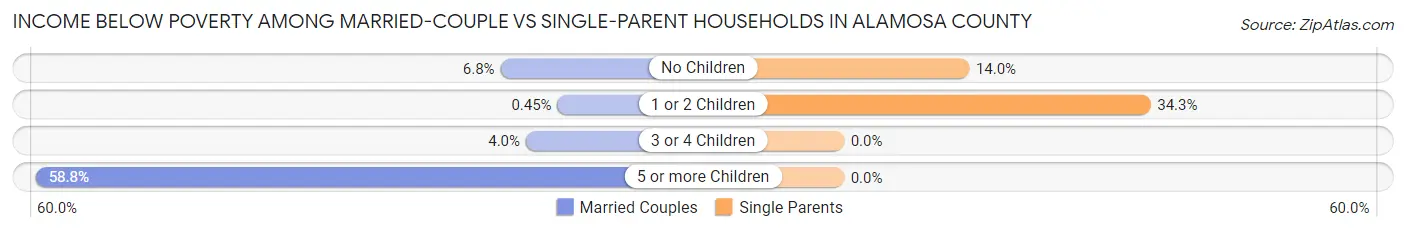
| Children | Married-Couple Families | Single-Parent Households |
| No Children | 110 (6.8%) | 76 (14.0%) |
| 1 or 2 Children | 4 (0.4%) | 220 (34.3%) |
| 3 or 4 Children | 8 (4.0%) | 0 (0.0%) |
| 5 or more Children | 47 (58.8%) | 0 (0.0%) |
| Total | 169 (6.1%) | 296 (23.5%) |
Race in Alamosa County
The most populous races in Alamosa County are White / Caucasian (11,104 | 67.5%), Hispanic or Latino (7,897 | 48.0%), and Two or more Races (2,837 | 17.2%).
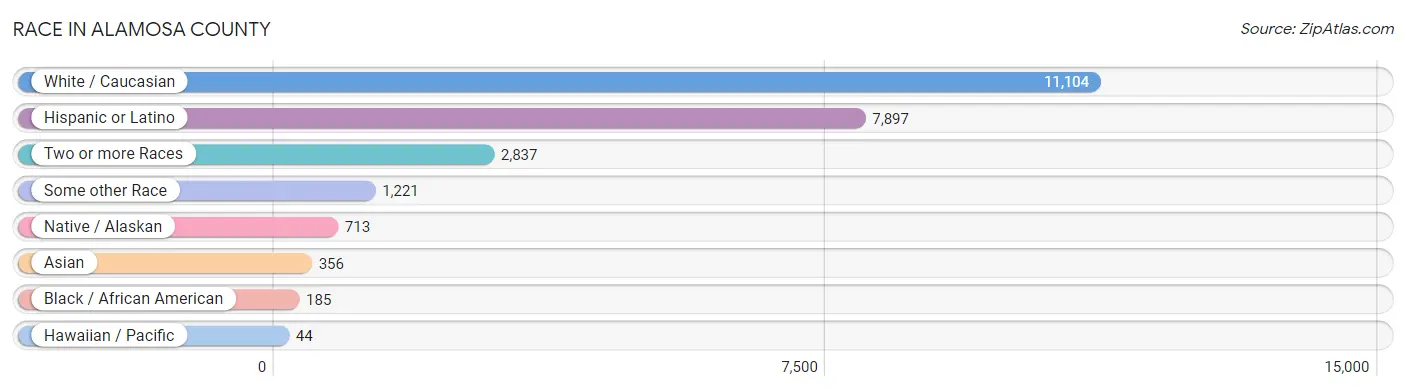
| Race | # Population | % Population |
| Asian | 356 | 2.2% |
| Black / African American | 185 | 1.1% |
| Hawaiian / Pacific | 44 | 0.3% |
| Hispanic or Latino | 7,897 | 48.0% |
| Native / Alaskan | 713 | 4.3% |
| White / Caucasian | 11,104 | 67.5% |
| Two or more Races | 2,837 | 17.2% |
| Some other Race | 1,221 | 7.4% |
| Total | 16,460 | 100.0% |
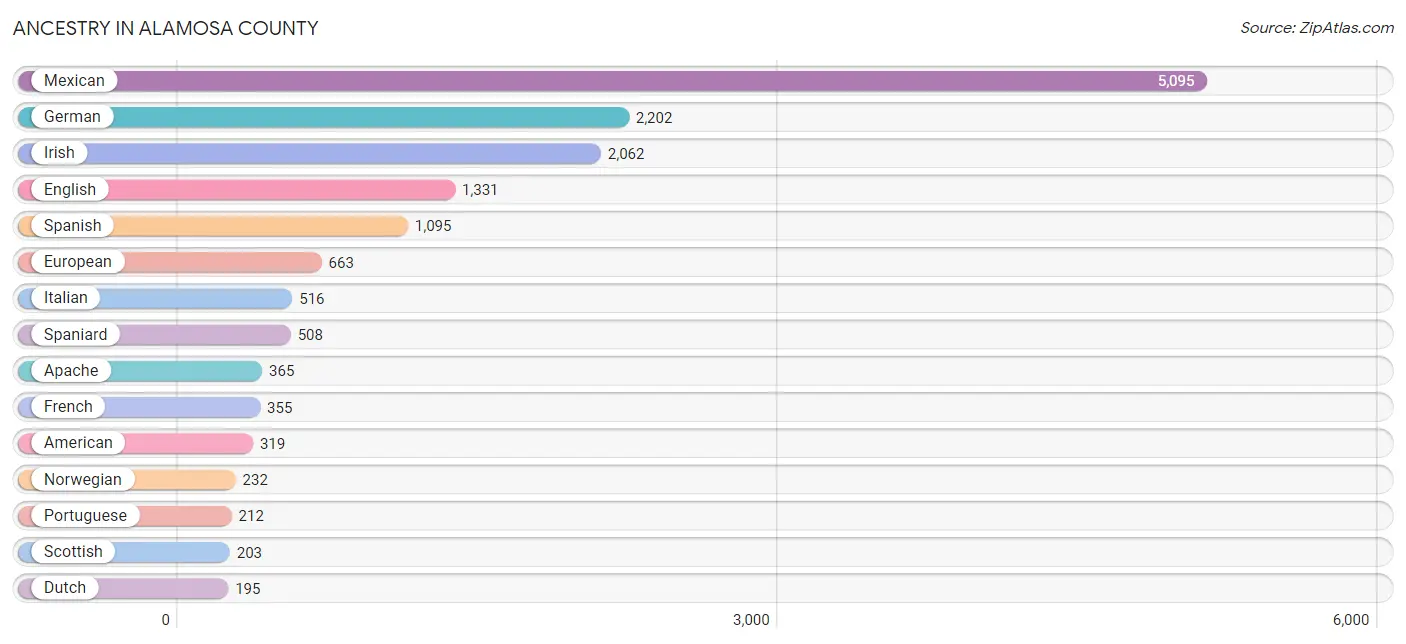
Ancestry in Alamosa County
The most populous ancestries reported in Alamosa County are Mexican (5,095 | 30.9%), German (2,202 | 13.4%), Irish (2,062 | 12.5%), English (1,331 | 8.1%), and Spanish (1,095 | 6.7%), together accounting for 71.6% of all Alamosa County residents.
| Ancestry | # Population | % Population |
| American | 319 | 1.9% |
| Apache | 365 | 2.2% |
| Arab | 77 | 0.5% |
| Austrian | 88 | 0.5% |
| Bhutanese | 39 | 0.2% |
| Blackfeet | 101 | 0.6% |
| British | 88 | 0.5% |
| Burmese | 96 | 0.6% |
| Canadian | 24 | 0.2% |
| Central American | 130 | 0.8% |
| Central American Indian | 81 | 0.5% |
| Cherokee | 22 | 0.1% |
| Cheyenne | 5 | 0.0% |
| Chippewa | 18 | 0.1% |
| Croatian | 21 | 0.1% |
| Cuban | 10 | 0.1% |
| Czech | 35 | 0.2% |
| Czechoslovakian | 23 | 0.1% |
| Danish | 38 | 0.2% |
| Dutch | 195 | 1.2% |
| Eastern European | 12 | 0.1% |
| English | 1,331 | 8.1% |
| Ethiopian | 18 | 0.1% |
| European | 663 | 4.0% |
| Finnish | 12 | 0.1% |
| French | 355 | 2.2% |
| French American Indian | 5 | 0.0% |
| French Canadian | 16 | 0.1% |
| German | 2,202 | 13.4% |
| Greek | 42 | 0.3% |
| Guamanian / Chamorro | 38 | 0.2% |
| Guatemalan | 81 | 0.5% |
| Hungarian | 13 | 0.1% |
| Icelander | 5 | 0.0% |
| Indian (Asian) | 168 | 1.0% |
| Irish | 2,062 | 12.5% |
| Italian | 516 | 3.1% |
| Jamaican | 12 | 0.1% |
| Korean | 48 | 0.3% |
| Lebanese | 64 | 0.4% |
| Lithuanian | 75 | 0.5% |
| Mexican | 5,095 | 30.9% |
| Mexican American Indian | 14 | 0.1% |
| Native Hawaiian | 42 | 0.3% |
| Navajo | 157 | 0.9% |
| Nigerian | 23 | 0.1% |
| Northern European | 2 | 0.0% |
| Norwegian | 232 | 1.4% |
| Pakistani | 38 | 0.2% |
| Peruvian | 76 | 0.5% |
| Polish | 130 | 0.8% |
| Portuguese | 212 | 1.3% |
| Pueblo | 39 | 0.2% |
| Puerto Rican | 97 | 0.6% |
| Russian | 9 | 0.1% |
| Salvadoran | 5 | 0.0% |
| Scandinavian | 107 | 0.6% |
| Scotch-Irish | 146 | 0.9% |
| Scottish | 203 | 1.2% |
| Shoshone | 1 | 0.0% |
| Sioux | 133 | 0.8% |
| Slavic | 28 | 0.2% |
| South American | 76 | 0.5% |
| Spaniard | 508 | 3.1% |
| Spanish | 1,095 | 6.7% |
| Spanish American | 4 | 0.0% |
| Sri Lankan | 85 | 0.5% |
| Subsaharan African | 45 | 0.3% |
| Swedish | 188 | 1.1% |
| Swiss | 64 | 0.4% |
| Syrian | 47 | 0.3% |
| Ute | 5 | 0.0% |
| Welsh | 92 | 0.6% |
| Yugoslavian | 11 | 0.1% | View All 74 Rows |
Immigrants in Alamosa County
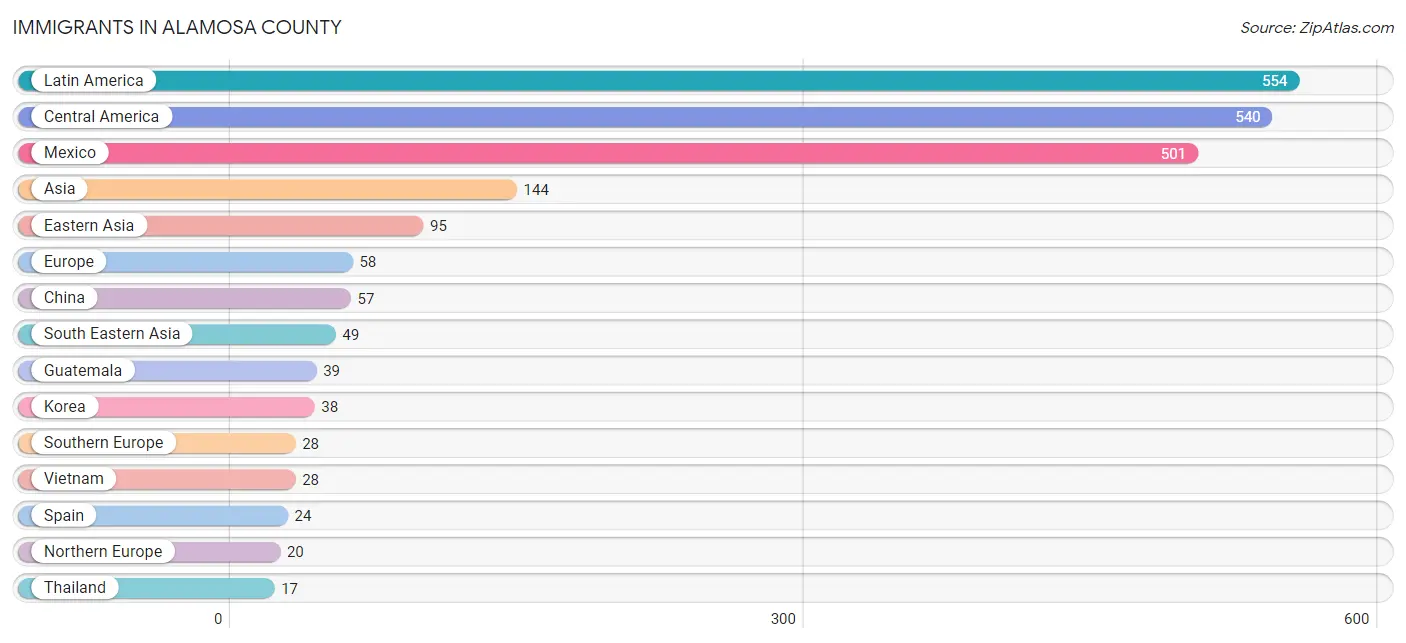
The most numerous immigrant groups reported in Alamosa County came from Latin America (554 | 3.4%), Central America (540 | 3.3%), Mexico (501 | 3.0%), Asia (144 | 0.9%), and Eastern Asia (95 | 0.6%), together accounting for 11.1% of all Alamosa County residents.
| Immigration Origin | # Population | % Population |
| Africa | 15 | 0.1% |
| Asia | 144 | 0.9% |
| Caribbean | 12 | 0.1% |
| Central America | 540 | 3.3% |
| China | 57 | 0.4% |
| Eastern Africa | 15 | 0.1% |
| Eastern Asia | 95 | 0.6% |
| England | 15 | 0.1% |
| Ethiopia | 15 | 0.1% |
| Europe | 58 | 0.4% |
| Greece | 4 | 0.0% |
| Guatemala | 39 | 0.2% |
| Jamaica | 12 | 0.1% |
| Korea | 38 | 0.2% |
| Latin America | 554 | 3.4% |
| Mexico | 501 | 3.0% |
| Netherlands | 5 | 0.0% |
| Northern Europe | 20 | 0.1% |
| Peru | 2 | 0.0% |
| Philippines | 4 | 0.0% |
| South America | 2 | 0.0% |
| South Eastern Asia | 49 | 0.3% |
| Southern Europe | 28 | 0.2% |
| Spain | 24 | 0.2% |
| Switzerland | 5 | 0.0% |
| Thailand | 17 | 0.1% |
| Vietnam | 28 | 0.2% |
| Western Europe | 10 | 0.1% | View All 28 Rows |
Sex and Age in Alamosa County
Sex and Age in Alamosa County
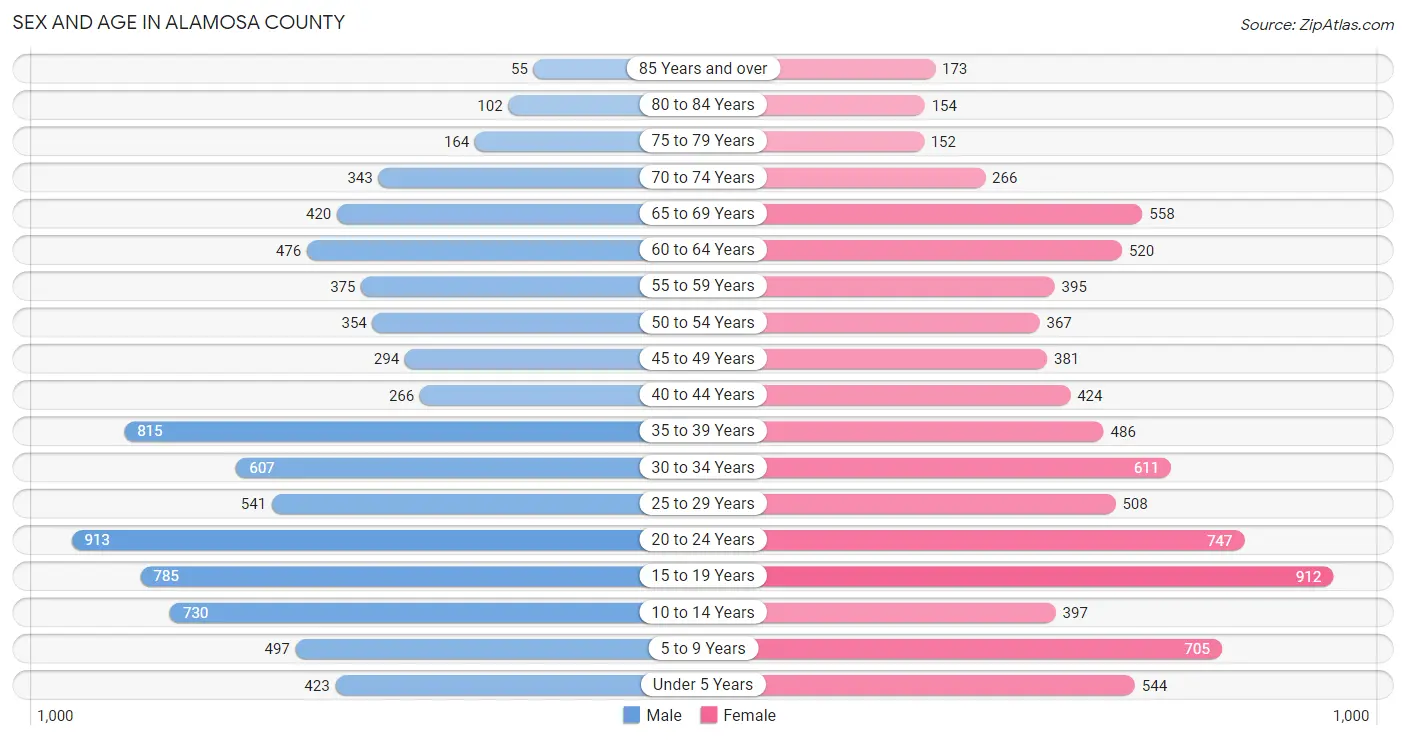
The most populous age groups in Alamosa County are 20 to 24 Years (913 | 11.2%) for men and 15 to 19 Years (912 | 11.0%) for women.
| Age Bracket | Male | Female |
| Under 5 Years | 423 (5.2%) | 544 (6.6%) |
| 5 to 9 Years | 497 (6.1%) | 705 (8.5%) |
| 10 to 14 Years | 730 (8.9%) | 397 (4.8%) |
| 15 to 19 Years | 785 (9.6%) | 912 (11.0%) |
| 20 to 24 Years | 913 (11.2%) | 747 (9.0%) |
| 25 to 29 Years | 541 (6.6%) | 508 (6.1%) |
| 30 to 34 Years | 607 (7.4%) | 611 (7.4%) |
| 35 to 39 Years | 815 (10.0%) | 486 (5.9%) |
| 40 to 44 Years | 266 (3.3%) | 424 (5.1%) |
| 45 to 49 Years | 294 (3.6%) | 381 (4.6%) |
| 50 to 54 Years | 354 (4.3%) | 367 (4.4%) |
| 55 to 59 Years | 375 (4.6%) | 395 (4.8%) |
| 60 to 64 Years | 476 (5.8%) | 520 (6.3%) |
| 65 to 69 Years | 420 (5.1%) | 558 (6.7%) |
| 70 to 74 Years | 343 (4.2%) | 266 (3.2%) |
| 75 to 79 Years | 164 (2.0%) | 152 (1.8%) |
| 80 to 84 Years | 102 (1.3%) | 154 (1.9%) |
| 85 Years and over | 55 (0.7%) | 173 (2.1%) |
| Total | 8,160 (100.0%) | 8,300 (100.0%) |
Families and Households in Alamosa County
Median Family Size in Alamosa County
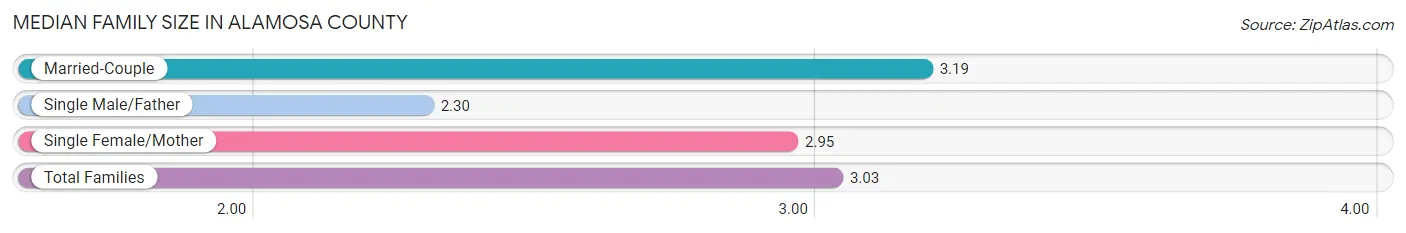
The median family size in Alamosa County is 3.03 persons per family, with married-couple families (2,785 | 68.9%) accounting for the largest median family size of 3.19 persons per family. On the other hand, single male/father families (533 | 13.2%) represent the smallest median family size with 2.30 persons per family.
| Family Type | # Families | Family Size |
| Married-Couple | 2,785 (68.9%) | 3.19 |
| Single Male/Father | 533 (13.2%) | 2.30 |
| Single Female/Mother | 726 (17.9%) | 2.95 |
| Total Families | 4,044 (100.0%) | 3.03 |
Median Household Size in Alamosa County
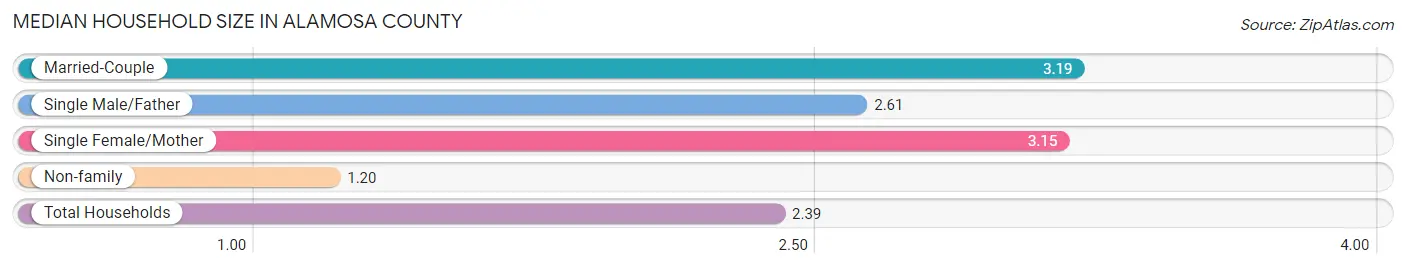
The median household size in Alamosa County is 2.39 persons per household, with married-couple households (2,785 | 43.0%) accounting for the largest median household size of 3.19 persons per household. non-family households (2,427 | 37.5%) represent the smallest median household size with 1.20 persons per household.
| Household Type | # Households | Household Size |
| Married-Couple | 2,785 (43.0%) | 3.19 |
| Single Male/Father | 533 (8.2%) | 2.61 |
| Single Female/Mother | 726 (11.2%) | 3.15 |
| Non-family | 2,427 (37.5%) | 1.20 |
| Total Households | 6,471 (100.0%) | 2.39 |
Household Size by Marriage Status in Alamosa County
Out of a total of 6,471 households in Alamosa County, 4,044 (62.5%) are family households, while 2,427 (37.5%) are nonfamily households. The most numerous type of family households are 2-person households, comprising 1,823, and the most common type of nonfamily households are 1-person households, comprising 1,944.
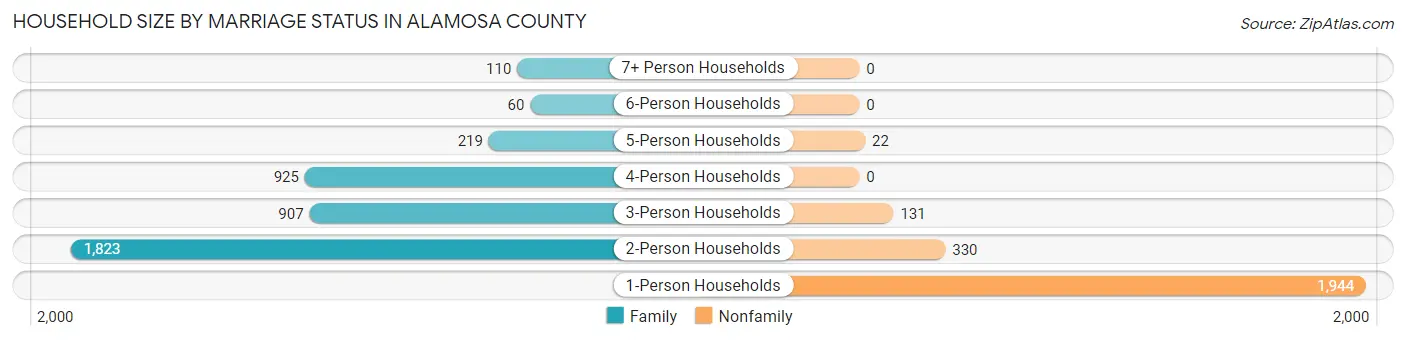
| Household Size | Family Households | Nonfamily Households |
| 1-Person Households | - | 1,944 (30.0%) |
| 2-Person Households | 1,823 (28.2%) | 330 (5.1%) |
| 3-Person Households | 907 (14.0%) | 131 (2.0%) |
| 4-Person Households | 925 (14.3%) | 0 (0.0%) |
| 5-Person Households | 219 (3.4%) | 22 (0.3%) |
| 6-Person Households | 60 (0.9%) | 0 (0.0%) |
| 7+ Person Households | 110 (1.7%) | 0 (0.0%) |
| Total | 4,044 (62.5%) | 2,427 (37.5%) |
Female Fertility in Alamosa County
Fertility by Age in Alamosa County
Average fertility rate in Alamosa County is 49.0 births per 1,000 women. Women in the age bracket of 20 to 34 years have the highest fertility rate with 68.0 births per 1,000 women. Women in the age bracket of 20 to 34 years acount for 62.9% of all women with births.
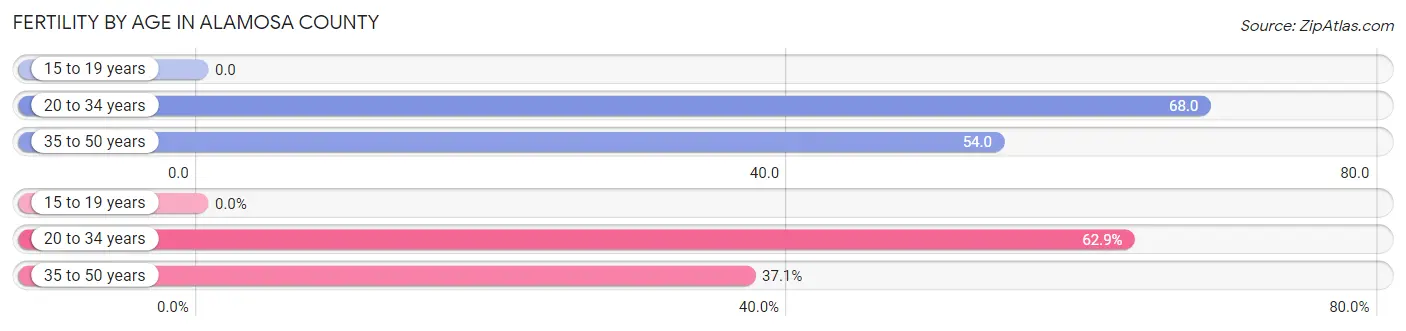
| Age Bracket | Women with Births | Births / 1,000 Women |
| 15 to 19 years | 0 (0.0%) | 0.0 |
| 20 to 34 years | 127 (62.9%) | 68.0 |
| 35 to 50 years | 75 (37.1%) | 54.0 |
| Total | 202 (100.0%) | 49.0 |
Fertility by Age by Marriage Status in Alamosa County
53.5% of women with births (202) in Alamosa County are married. The highest percentage of unmarried women with births falls into 20 to 34 years age bracket with 74.0% of them unmarried at the time of birth, while the lowest percentage of unmarried women with births belong to 35 to 50 years age bracket with 0.0% of them unmarried.
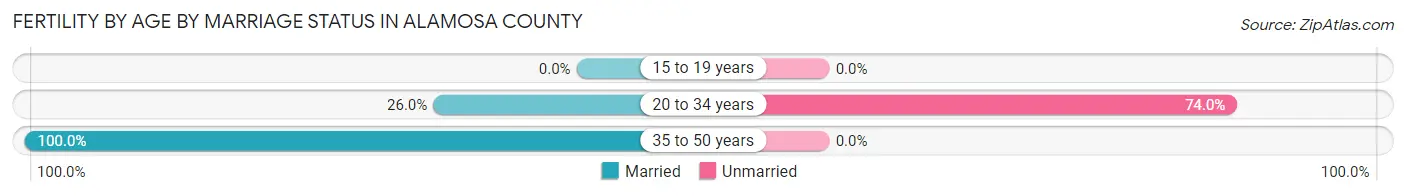
| Age Bracket | Married | Unmarried |
| 15 to 19 years | 0 (0.0%) | 0 (0.0%) |
| 20 to 34 years | 33 (26.0%) | 94 (74.0%) |
| 35 to 50 years | 75 (100.0%) | 0 (0.0%) |
| Total | 108 (53.5%) | 94 (46.5%) |
Fertility by Education in Alamosa County
Average fertility rate in Alamosa County is 49.0 births per 1,000 women. Women with the education attainment of graduate degree have the highest fertility rate of 90.0 births per 1,000 women, while women with the education attainment of bachelor's degree have the lowest fertility at 34.0 births per 1,000 women. Women with the education attainment of college or associate's degree represent 45.1% of all women with births.
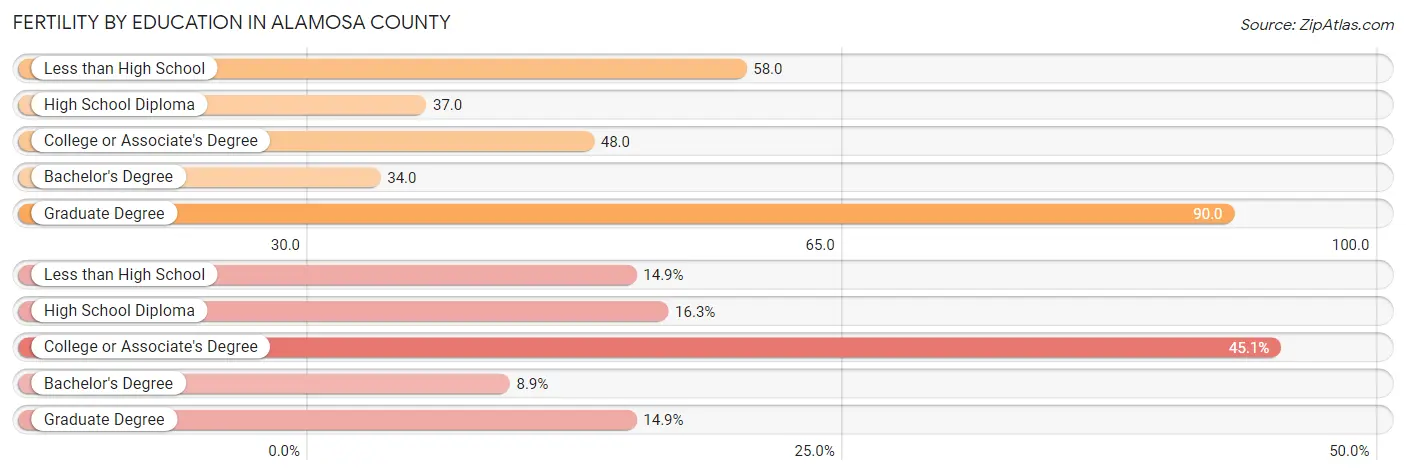
| Educational Attainment | Women with Births | Births / 1,000 Women |
| Less than High School | 30 (14.8%) | 58.0 |
| High School Diploma | 33 (16.3%) | 37.0 |
| College or Associate's Degree | 91 (45.1%) | 48.0 |
| Bachelor's Degree | 18 (8.9%) | 34.0 |
| Graduate Degree | 30 (14.8%) | 90.0 |
| Total | 202 (100.0%) | 49.0 |
Fertility by Education by Marriage Status in Alamosa County
46.5% of women with births in Alamosa County are unmarried. Women with the educational attainment of less than high school are most likely to be married with 100.0% of them married at childbirth, while women with the educational attainment of high school diploma are least likely to be married with 100.0% of them unmarried at childbirth.
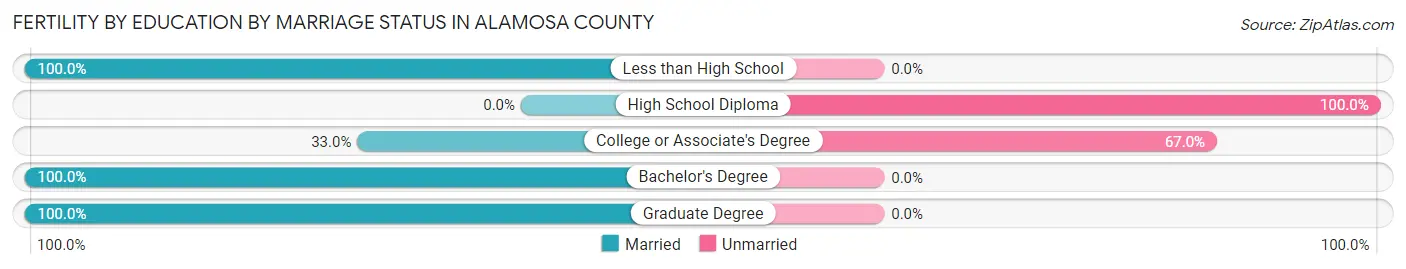
| Educational Attainment | Married | Unmarried |
| Less than High School | 30 (100.0%) | 0 (0.0%) |
| High School Diploma | 0 (0.0%) | 33 (100.0%) |
| College or Associate's Degree | 30 (33.0%) | 61 (67.0%) |
| Bachelor's Degree | 18 (100.0%) | 0 (0.0%) |
| Graduate Degree | 30 (100.0%) | 0 (0.0%) |
| Total | 108 (53.5%) | 94 (46.5%) |
Employment Characteristics in Alamosa County
Employment by Class of Employer in Alamosa County
Among the 7,632 employed individuals in Alamosa County, private company employees (4,346 | 56.9%), state government employees (772 | 10.1%), and not-for-profit organizations (753 | 9.9%) make up the most common classes of employment.
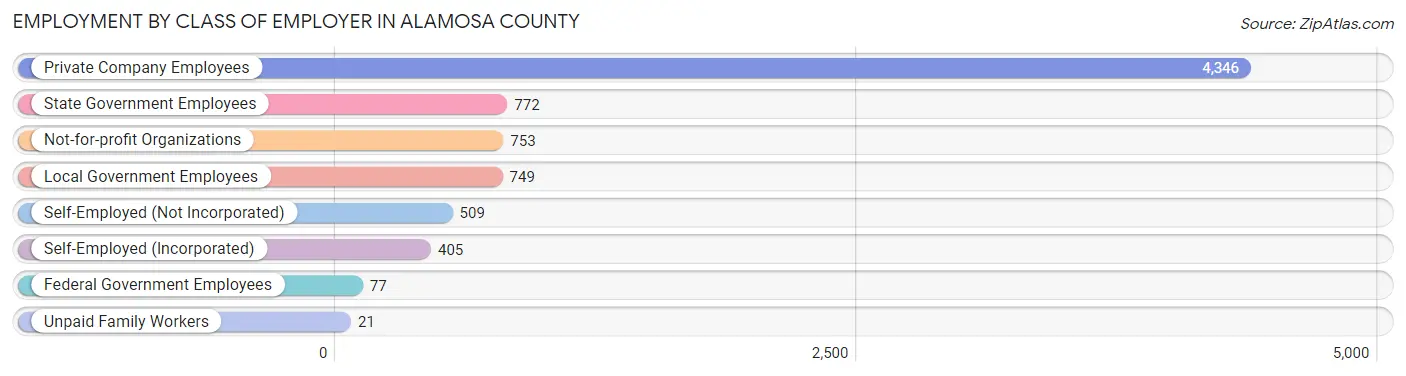
| Employer Class | # Employees | % Employees |
| Private Company Employees | 4,346 | 56.9% |
| Self-Employed (Incorporated) | 405 | 5.3% |
| Self-Employed (Not Incorporated) | 509 | 6.7% |
| Not-for-profit Organizations | 753 | 9.9% |
| Local Government Employees | 749 | 9.8% |
| State Government Employees | 772 | 10.1% |
| Federal Government Employees | 77 | 1.0% |
| Unpaid Family Workers | 21 | 0.3% |
| Total | 7,632 | 100.0% |
Employment Status by Age in Alamosa County
According to the labor force statistics for Alamosa County, out of the total population over 16 years of age (12,957), 63.1% or 8,176 individuals are in the labor force, with 3.4% or 278 of them unemployed. The age group with the highest labor force participation rate is 20 to 24 years, with 84.0% or 1,394 individuals in the labor force. Within the labor force, the 16 to 19 years age range has the highest percentage of unemployed individuals, with 11.1% or 81 of them being unemployed.
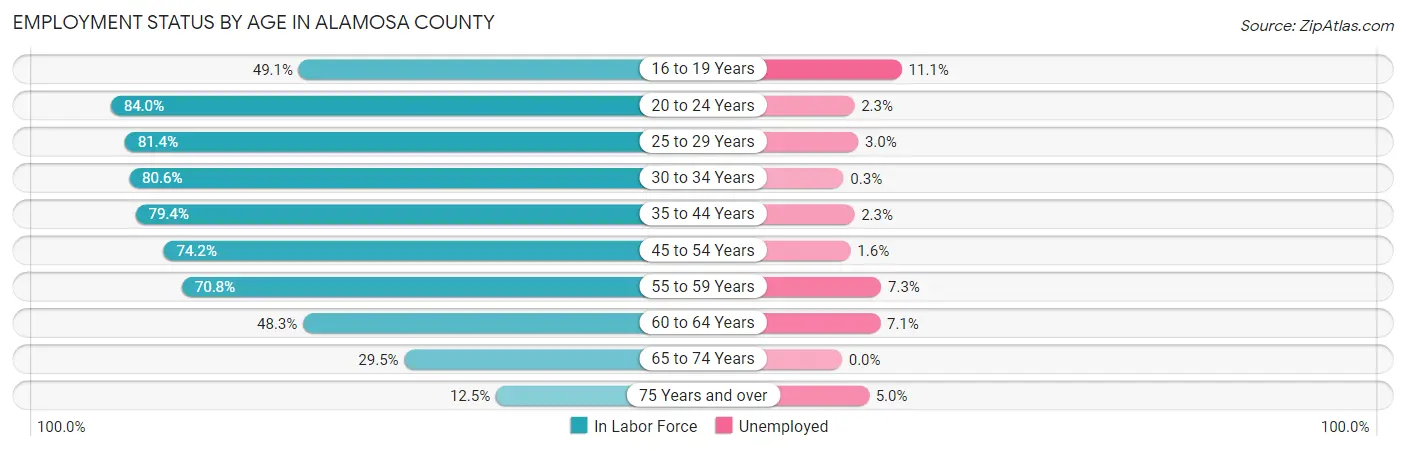
| Age Bracket | In Labor Force | Unemployed |
| 16 to 19 Years | 732 (49.1%) | 81 (11.1%) |
| 20 to 24 Years | 1,394 (84.0%) | 32 (2.3%) |
| 25 to 29 Years | 854 (81.4%) | 26 (3.0%) |
| 30 to 34 Years | 982 (80.6%) | 3 (0.3%) |
| 35 to 44 Years | 1,581 (79.4%) | 36 (2.3%) |
| 45 to 54 Years | 1,036 (74.2%) | 17 (1.6%) |
| 55 to 59 Years | 545 (70.8%) | 40 (7.3%) |
| 60 to 64 Years | 481 (48.3%) | 34 (7.1%) |
| 65 to 74 Years | 468 (29.5%) | 0 (0.0%) |
| 75 Years and over | 100 (12.5%) | 5 (5.0%) |
| Total | 8,176 (63.1%) | 278 (3.4%) |
Employment Status by Educational Attainment in Alamosa County
According to labor force statistics for Alamosa County, 73.8% of individuals (5,476) out of the total population between 25 and 64 years of age (7,420) are in the labor force, with 2.8% or 153 of them being unemployed. The group with the highest labor force participation rate are those with the educational attainment of bachelor's degree or higher, with 87.5% or 1,737 individuals in the labor force. Within the labor force, individuals with less than high school education have the highest percentage of unemployment, with 16.0% or 51 of them being unemployed.
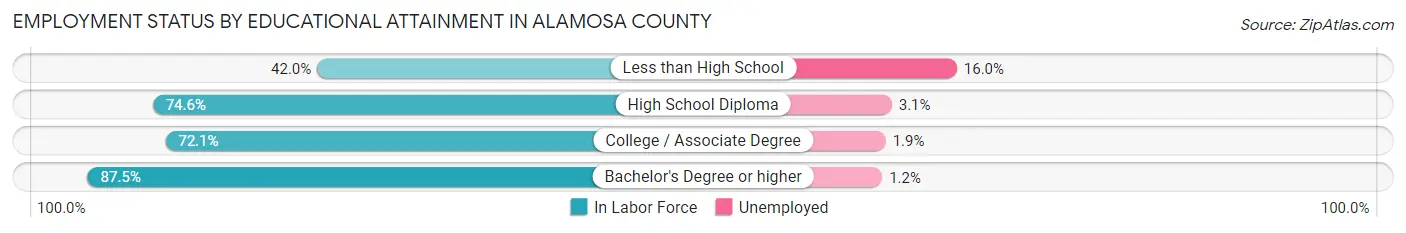
| Educational Attainment | In Labor Force | Unemployed |
| Less than High School | 318 (42.0%) | 121 (16.0%) |
| High School Diploma | 1,505 (74.6%) | 63 (3.1%) |
| College / Associate Degree | 1,918 (72.1%) | 51 (1.9%) |
| Bachelor's Degree or higher | 1,737 (87.5%) | 24 (1.2%) |
| Total | 5,476 (73.8%) | 208 (2.8%) |
Employment Occupations by Sex in Alamosa County
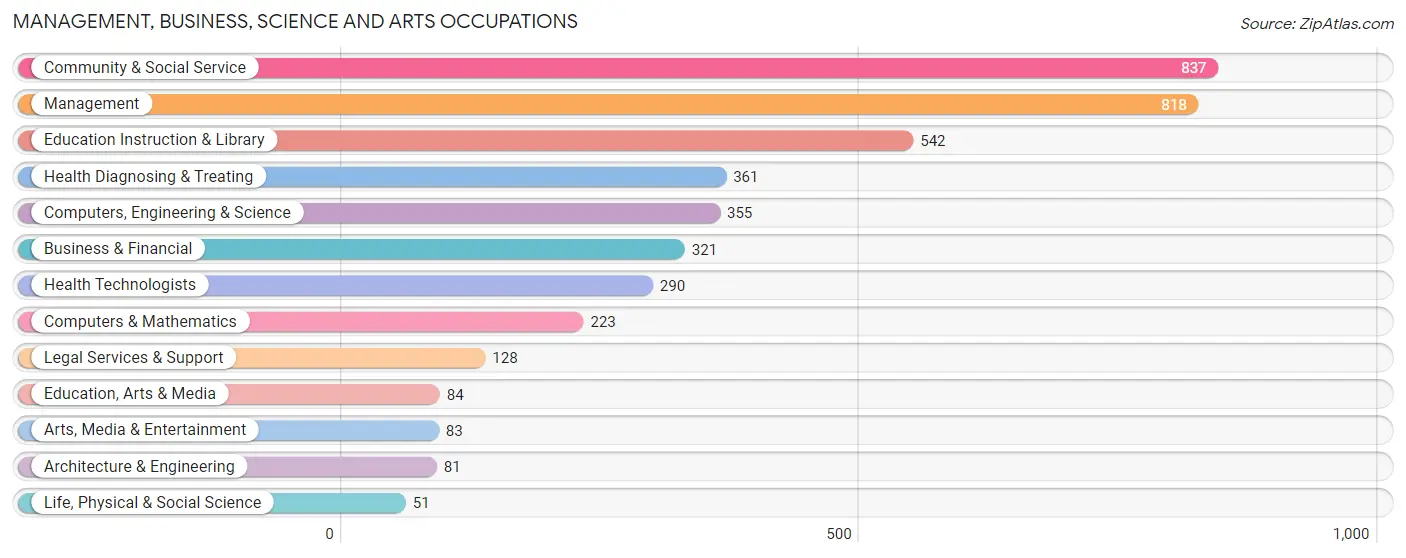
Management, Business, Science and Arts Occupations
The most common Management, Business, Science and Arts occupations in Alamosa County are Community & Social Service (837 | 10.6%), Management (818 | 10.4%), Education Instruction & Library (542 | 6.9%), Health Diagnosing & Treating (361 | 4.6%), and Computers, Engineering & Science (355 | 4.5%).
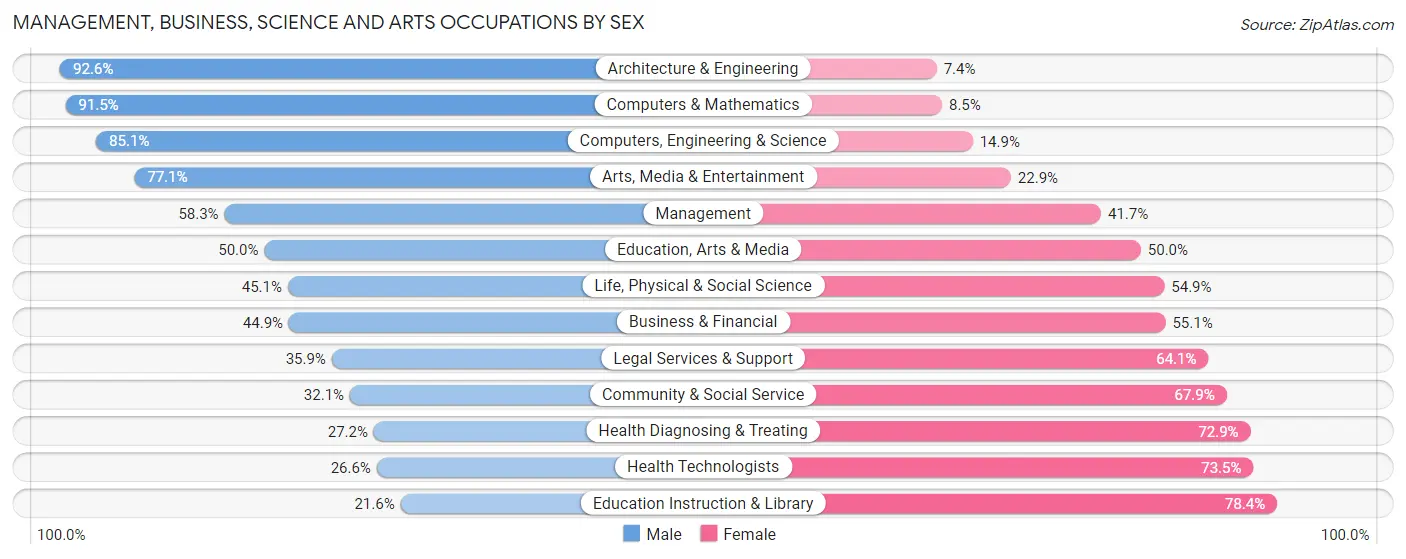
Management, Business, Science and Arts Occupations by Sex
Within the Management, Business, Science and Arts occupations in Alamosa County, the most male-oriented occupations are Architecture & Engineering (92.6%), Computers & Mathematics (91.5%), and Computers, Engineering & Science (85.1%), while the most female-oriented occupations are Education Instruction & Library (78.4%), Health Technologists (73.5%), and Health Diagnosing & Treating (72.9%).
| Occupation | Male | Female |
| Management | 477 (58.3%) | 341 (41.7%) |
| Business & Financial | 144 (44.9%) | 177 (55.1%) |
| Computers, Engineering & Science | 302 (85.1%) | 53 (14.9%) |
| Computers & Mathematics | 204 (91.5%) | 19 (8.5%) |
| Architecture & Engineering | 75 (92.6%) | 6 (7.4%) |
| Life, Physical & Social Science | 23 (45.1%) | 28 (54.9%) |
| Community & Social Service | 269 (32.1%) | 568 (67.9%) |
| Education, Arts & Media | 42 (50.0%) | 42 (50.0%) |
| Legal Services & Support | 46 (35.9%) | 82 (64.1%) |
| Education Instruction & Library | 117 (21.6%) | 425 (78.4%) |
| Arts, Media & Entertainment | 64 (77.1%) | 19 (22.9%) |
| Health Diagnosing & Treating | 98 (27.2%) | 263 (72.9%) |
| Health Technologists | 77 (26.6%) | 213 (73.5%) |
| Total (Category) | 1,290 (47.9%) | 1,402 (52.1%) |
| Total (Overall) | 3,957 (50.1%) | 3,940 (49.9%) |
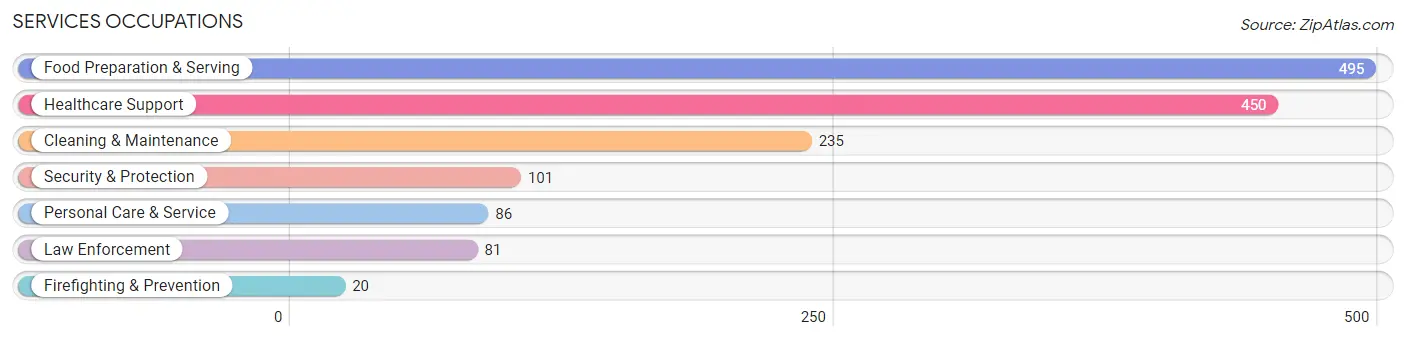
Services Occupations
The most common Services occupations in Alamosa County are Food Preparation & Serving (495 | 6.3%), Healthcare Support (450 | 5.7%), Cleaning & Maintenance (235 | 3.0%), Security & Protection (101 | 1.3%), and Personal Care & Service (86 | 1.1%).
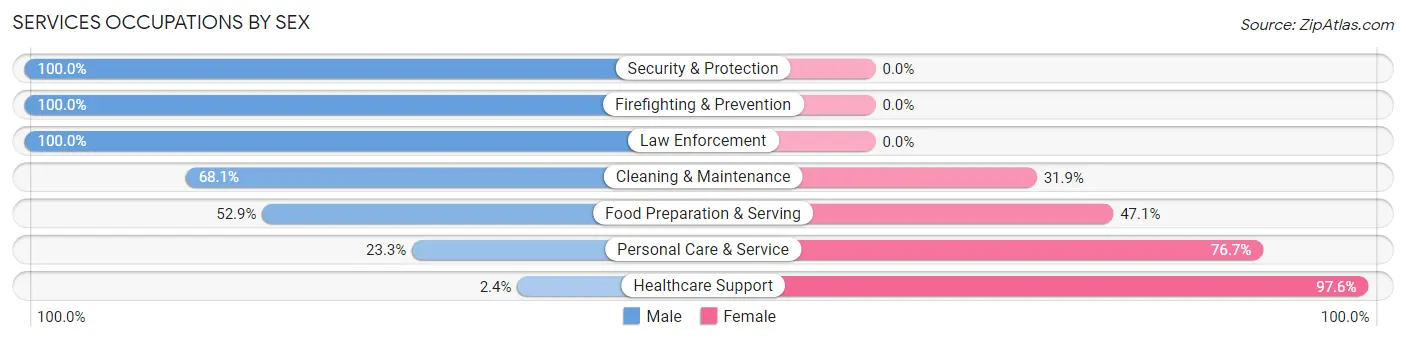
Services Occupations by Sex
Within the Services occupations in Alamosa County, the most male-oriented occupations are Security & Protection (100.0%), Firefighting & Prevention (100.0%), and Law Enforcement (100.0%), while the most female-oriented occupations are Healthcare Support (97.6%), Personal Care & Service (76.7%), and Food Preparation & Serving (47.1%).
| Occupation | Male | Female |
| Healthcare Support | 11 (2.4%) | 439 (97.6%) |
| Security & Protection | 101 (100.0%) | 0 (0.0%) |
| Firefighting & Prevention | 20 (100.0%) | 0 (0.0%) |
| Law Enforcement | 81 (100.0%) | 0 (0.0%) |
| Food Preparation & Serving | 262 (52.9%) | 233 (47.1%) |
| Cleaning & Maintenance | 160 (68.1%) | 75 (31.9%) |
| Personal Care & Service | 20 (23.3%) | 66 (76.7%) |
| Total (Category) | 554 (40.5%) | 813 (59.5%) |
| Total (Overall) | 3,957 (50.1%) | 3,940 (49.9%) |
Sales and Office Occupations
The most common Sales and Office occupations in Alamosa County are Office & Administration (1,063 | 13.5%), and Sales & Related (828 | 10.5%).

Sales and Office Occupations by Sex

| Occupation | Male | Female |
| Sales & Related | 351 (42.4%) | 477 (57.6%) |
| Office & Administration | 112 (10.5%) | 951 (89.5%) |
| Total (Category) | 463 (24.5%) | 1,428 (75.5%) |
| Total (Overall) | 3,957 (50.1%) | 3,940 (49.9%) |
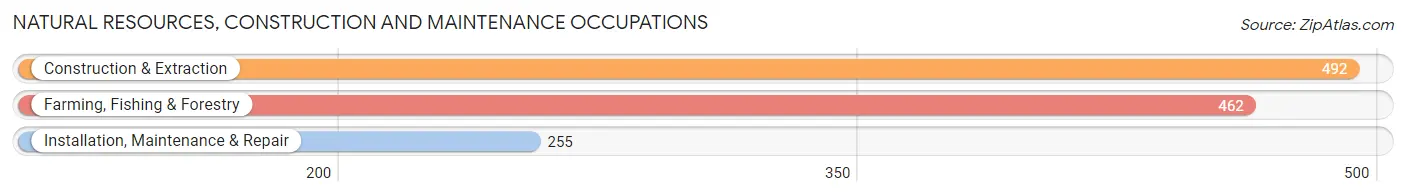
Natural Resources, Construction and Maintenance Occupations
The most common Natural Resources, Construction and Maintenance occupations in Alamosa County are Construction & Extraction (492 | 6.2%), Farming, Fishing & Forestry (462 | 5.9%), and Installation, Maintenance & Repair (255 | 3.2%).
Natural Resources, Construction and Maintenance Occupations by Sex
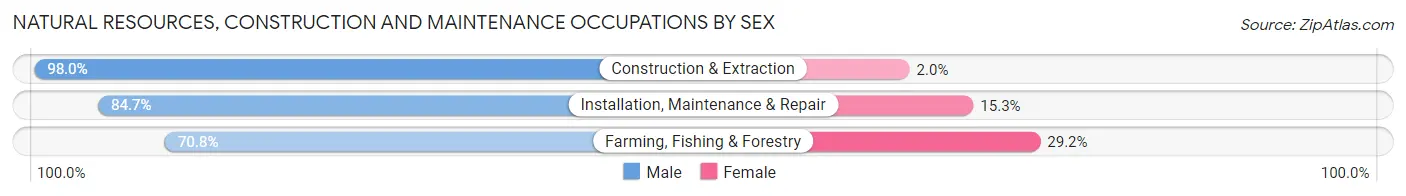
| Occupation | Male | Female |
| Farming, Fishing & Forestry | 327 (70.8%) | 135 (29.2%) |
| Construction & Extraction | 482 (98.0%) | 10 (2.0%) |
| Installation, Maintenance & Repair | 216 (84.7%) | 39 (15.3%) |
| Total (Category) | 1,025 (84.8%) | 184 (15.2%) |
| Total (Overall) | 3,957 (50.1%) | 3,940 (49.9%) |
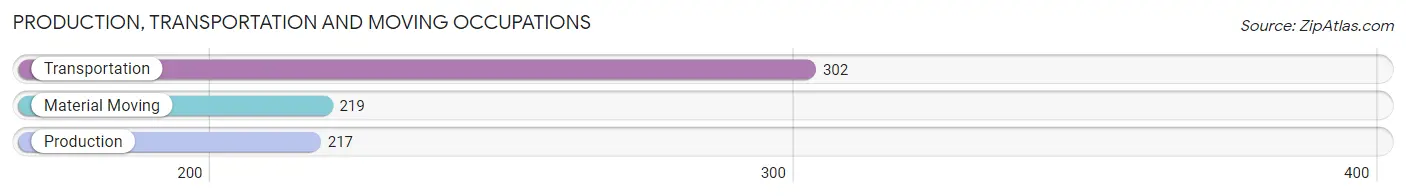
Production, Transportation and Moving Occupations
The most common Production, Transportation and Moving occupations in Alamosa County are Transportation (302 | 3.8%), Material Moving (219 | 2.8%), and Production (217 | 2.8%).
Production, Transportation and Moving Occupations by Sex
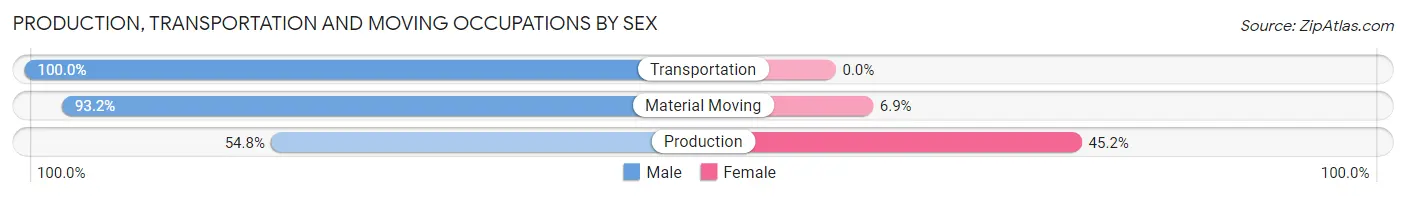
| Occupation | Male | Female |
| Production | 119 (54.8%) | 98 (45.2%) |
| Transportation | 302 (100.0%) | 0 (0.0%) |
| Material Moving | 204 (93.1%) | 15 (6.9%) |
| Total (Category) | 625 (84.7%) | 113 (15.3%) |
| Total (Overall) | 3,957 (50.1%) | 3,940 (49.9%) |
Employment Industries by Sex in Alamosa County
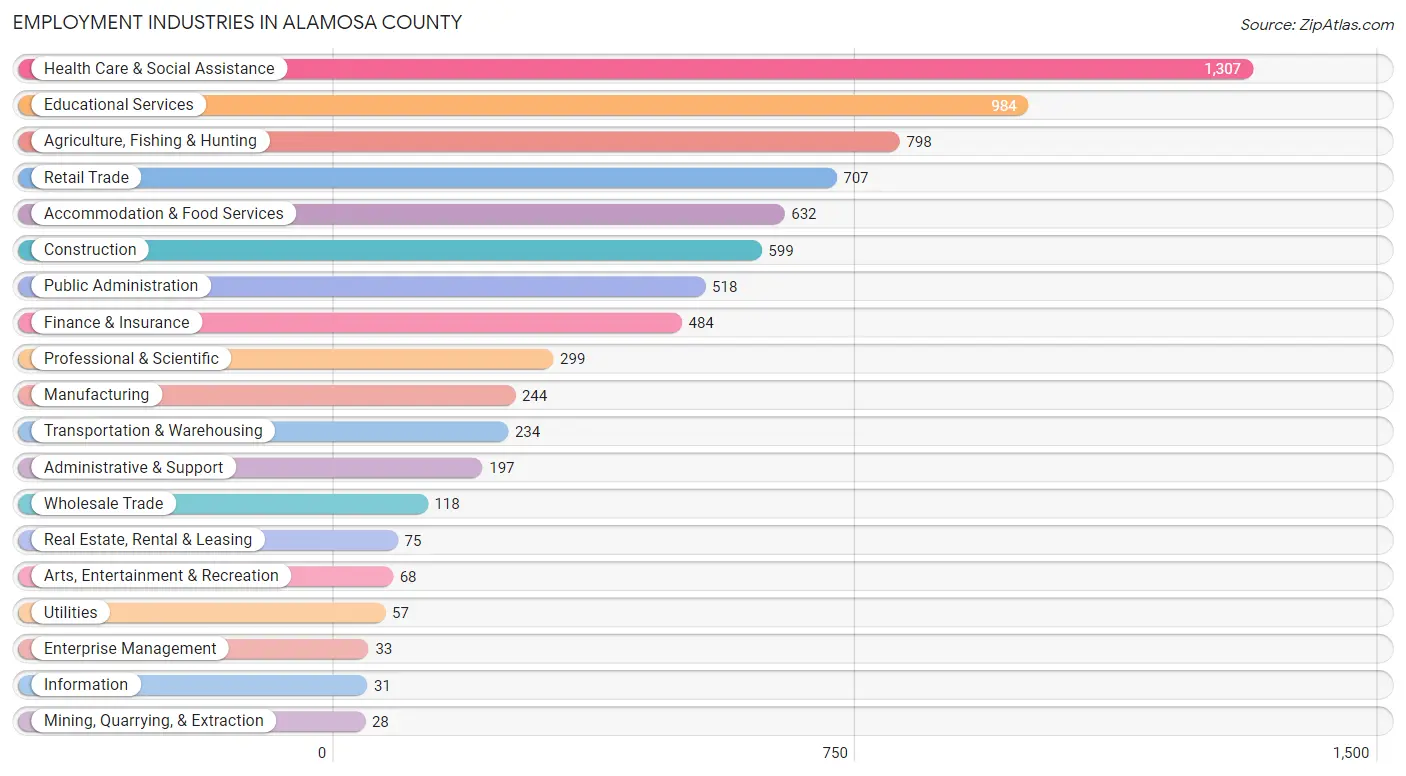
Employment Industries in Alamosa County
The major employment industries in Alamosa County include Health Care & Social Assistance (1,307 | 16.6%), Educational Services (984 | 12.5%), Agriculture, Fishing & Hunting (798 | 10.1%), Retail Trade (707 | 8.9%), and Accommodation & Food Services (632 | 8.0%).
Employment Industries by Sex in Alamosa County
The Alamosa County industries that see more men than women are Mining, Quarrying, & Extraction (100.0%), Utilities (100.0%), and Enterprise Management (100.0%), whereas the industries that tend to have a higher number of women are Health Care & Social Assistance (83.9%), Finance & Insurance (77.5%), and Public Administration (64.3%).
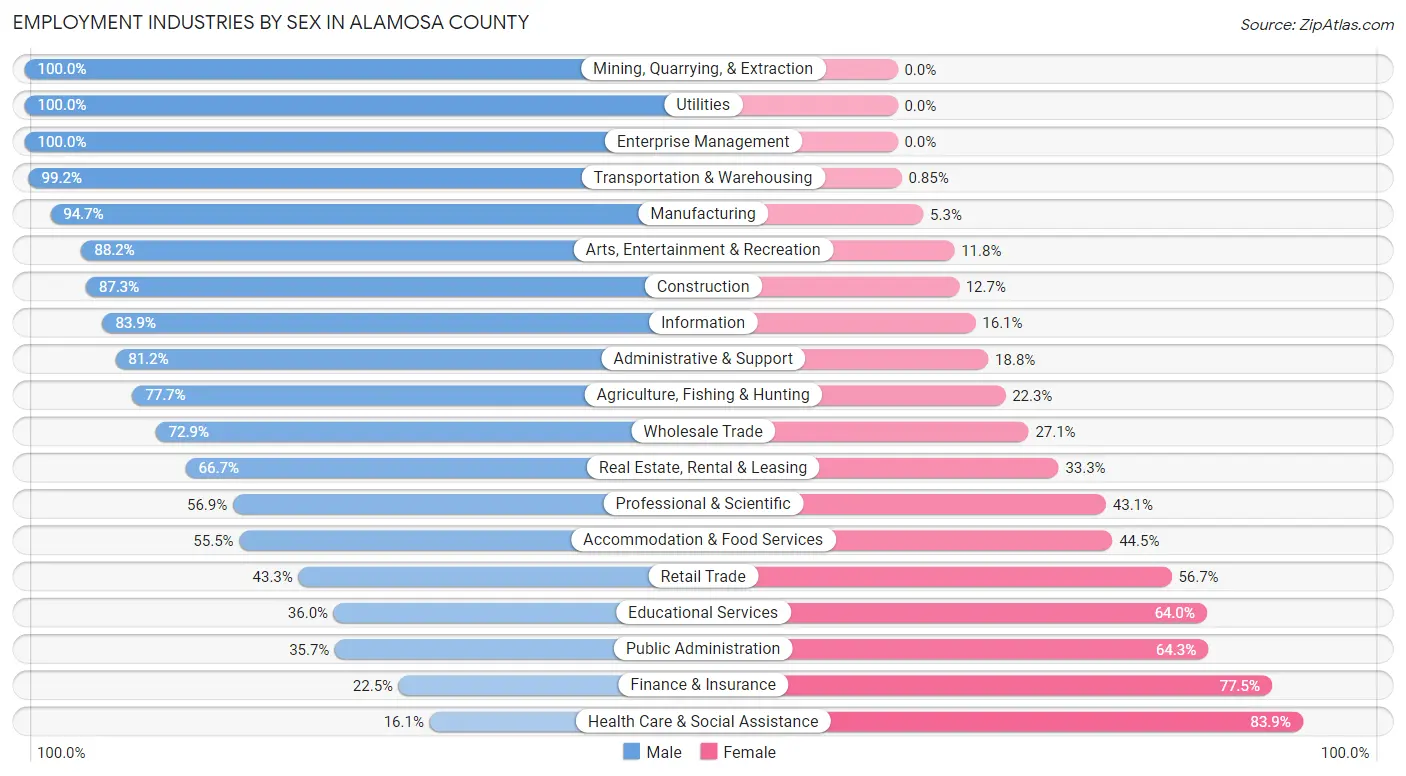
| Industry | Male | Female |
| Agriculture, Fishing & Hunting | 620 (77.7%) | 178 (22.3%) |
| Mining, Quarrying, & Extraction | 28 (100.0%) | 0 (0.0%) |
| Construction | 523 (87.3%) | 76 (12.7%) |
| Manufacturing | 231 (94.7%) | 13 (5.3%) |
| Wholesale Trade | 86 (72.9%) | 32 (27.1%) |
| Retail Trade | 306 (43.3%) | 401 (56.7%) |
| Transportation & Warehousing | 232 (99.2%) | 2 (0.9%) |
| Utilities | 57 (100.0%) | 0 (0.0%) |
| Information | 26 (83.9%) | 5 (16.1%) |
| Finance & Insurance | 109 (22.5%) | 375 (77.5%) |
| Real Estate, Rental & Leasing | 50 (66.7%) | 25 (33.3%) |
| Professional & Scientific | 170 (56.9%) | 129 (43.1%) |
| Enterprise Management | 33 (100.0%) | 0 (0.0%) |
| Administrative & Support | 160 (81.2%) | 37 (18.8%) |
| Educational Services | 354 (36.0%) | 630 (64.0%) |
| Health Care & Social Assistance | 211 (16.1%) | 1,096 (83.9%) |
| Arts, Entertainment & Recreation | 60 (88.2%) | 8 (11.8%) |
| Accommodation & Food Services | 351 (55.5%) | 281 (44.5%) |
| Public Administration | 185 (35.7%) | 333 (64.3%) |
| Total | 3,957 (50.1%) | 3,940 (49.9%) |
Education in Alamosa County
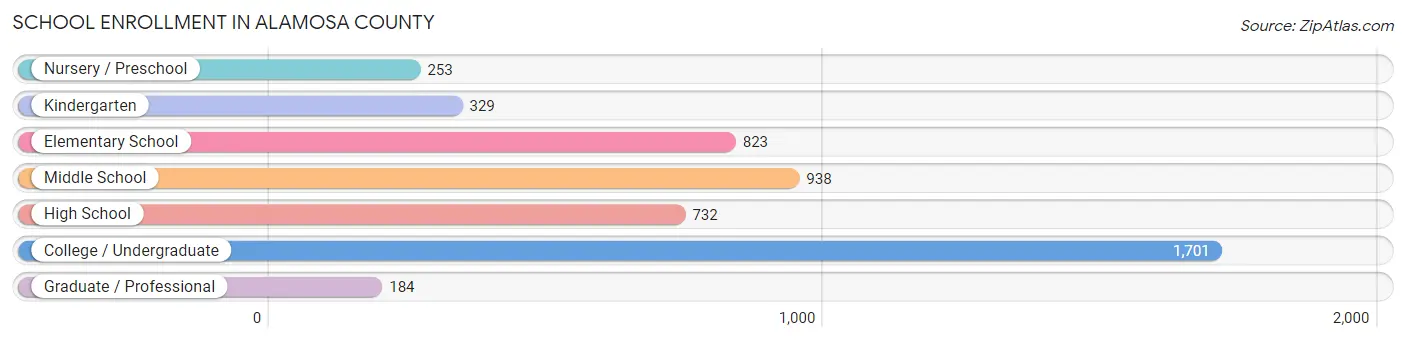
School Enrollment in Alamosa County
The most common levels of schooling among the 4,960 students in Alamosa County are college / undergraduate (1,701 | 34.3%), middle school (938 | 18.9%), and elementary school (823 | 16.6%).
| School Level | # Students | % Students |
| Nursery / Preschool | 253 | 5.1% |
| Kindergarten | 329 | 6.6% |
| Elementary School | 823 | 16.6% |
| Middle School | 938 | 18.9% |
| High School | 732 | 14.8% |
| College / Undergraduate | 1,701 | 34.3% |
| Graduate / Professional | 184 | 3.7% |
| Total | 4,960 | 100.0% |
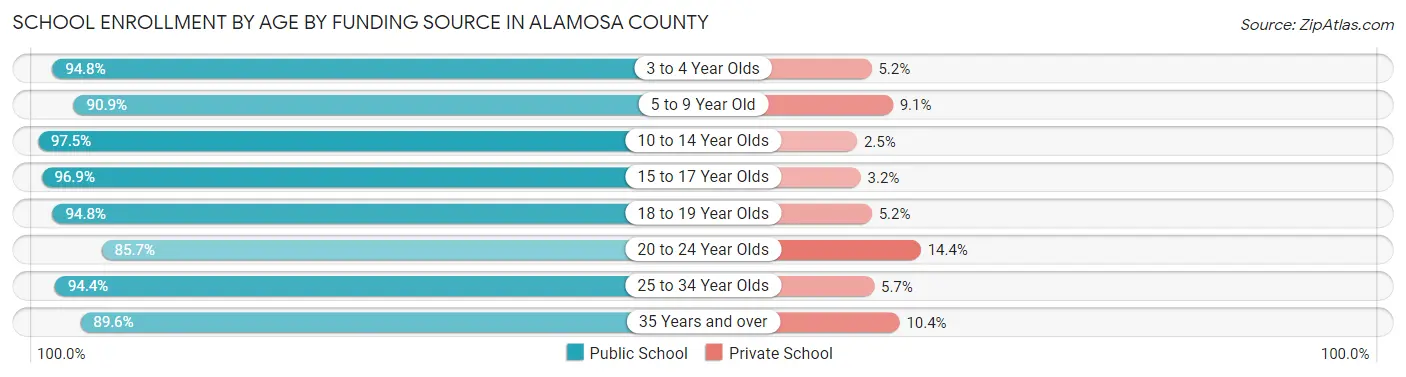
School Enrollment by Age by Funding Source in Alamosa County
Out of a total of 4,960 students who are enrolled in schools in Alamosa County, 327 (6.6%) attend a private institution, while the remaining 4,633 (93.4%) are enrolled in public schools. The age group of 20 to 24 year olds has the highest likelihood of being enrolled in private schools, with 91 (14.3% in the age bracket) enrolled. Conversely, the age group of 10 to 14 year olds has the lowest likelihood of being enrolled in a private school, with 1,099 (97.5% in the age bracket) attending a public institution.
| Age Bracket | Public School | Private School |
| 3 to 4 Year Olds | 165 (94.8%) | 9 (5.2%) |
| 5 to 9 Year Old | 994 (90.9%) | 100 (9.1%) |
| 10 to 14 Year Olds | 1,099 (97.5%) | 28 (2.5%) |
| 15 to 17 Year Olds | 615 (96.9%) | 20 (3.2%) |
| 18 to 19 Year Olds | 797 (94.8%) | 44 (5.2%) |
| 20 to 24 Year Olds | 543 (85.7%) | 91 (14.3%) |
| 25 to 34 Year Olds | 284 (94.4%) | 17 (5.7%) |
| 35 Years and over | 138 (89.6%) | 16 (10.4%) |
| Total | 4,633 (93.4%) | 327 (6.6%) |
Educational Attainment by Field of Study in Alamosa County
Business (546 | 17.0%), education (497 | 15.5%), psychology (340 | 10.6%), science & technology (314 | 9.8%), and liberal arts & history (287 | 8.9%) are the most common fields of study among 3,205 individuals in Alamosa County who have obtained a bachelor's degree or higher.
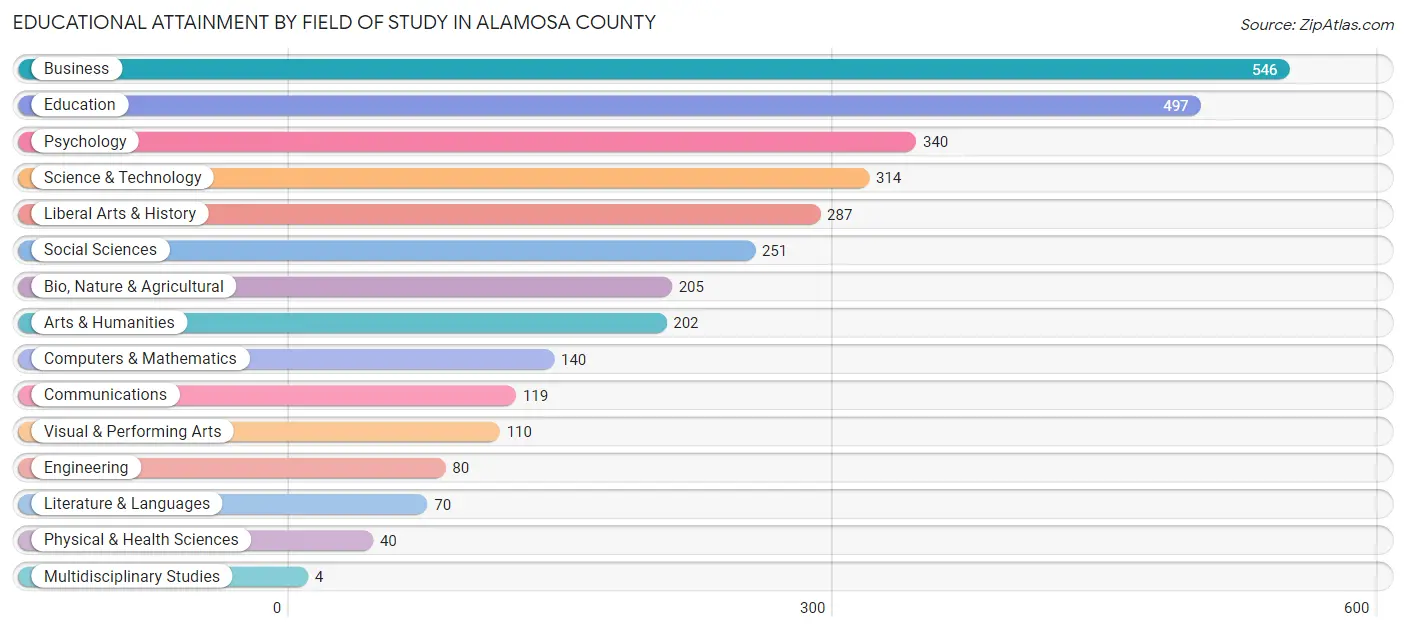
| Field of Study | # Graduates | % Graduates |
| Computers & Mathematics | 140 | 4.4% |
| Bio, Nature & Agricultural | 205 | 6.4% |
| Physical & Health Sciences | 40 | 1.3% |
| Psychology | 340 | 10.6% |
| Social Sciences | 251 | 7.8% |
| Engineering | 80 | 2.5% |
| Multidisciplinary Studies | 4 | 0.1% |
| Science & Technology | 314 | 9.8% |
| Business | 546 | 17.0% |
| Education | 497 | 15.5% |
| Literature & Languages | 70 | 2.2% |
| Liberal Arts & History | 287 | 8.9% |
| Visual & Performing Arts | 110 | 3.4% |
| Communications | 119 | 3.7% |
| Arts & Humanities | 202 | 6.3% |
| Total | 3,205 | 100.0% |
Transportation & Commute in Alamosa County
Vehicle Availability by Sex in Alamosa County
The most prevalent vehicle ownership categories in Alamosa County are males with 2 vehicles (1,457, accounting for 38.4%) and females with 2 vehicles (1,393, making up 39.9%).
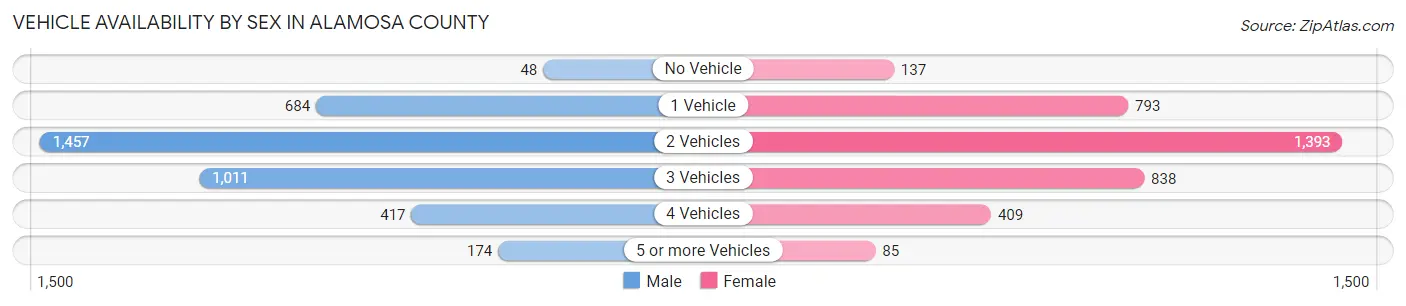
| Vehicles Available | Male | Female |
| No Vehicle | 48 (1.3%) | 137 (3.7%) |
| 1 Vehicle | 684 (18.0%) | 793 (21.7%) |
| 2 Vehicles | 1,457 (38.4%) | 1,393 (38.1%) |
| 3 Vehicles | 1,011 (26.7%) | 838 (22.9%) |
| 4 Vehicles | 417 (11.0%) | 409 (11.2%) |
| 5 or more Vehicles | 174 (4.6%) | 85 (2.3%) |
| Total | 3,791 (100.0%) | 3,655 (100.0%) |
Commute Time in Alamosa County
The most frequently occuring commute durations in Alamosa County are 5 to 9 minutes (2,666 commuters, 36.4%), 10 to 14 minutes (1,374 commuters, 18.8%), and 15 to 19 minutes (869 commuters, 11.9%).
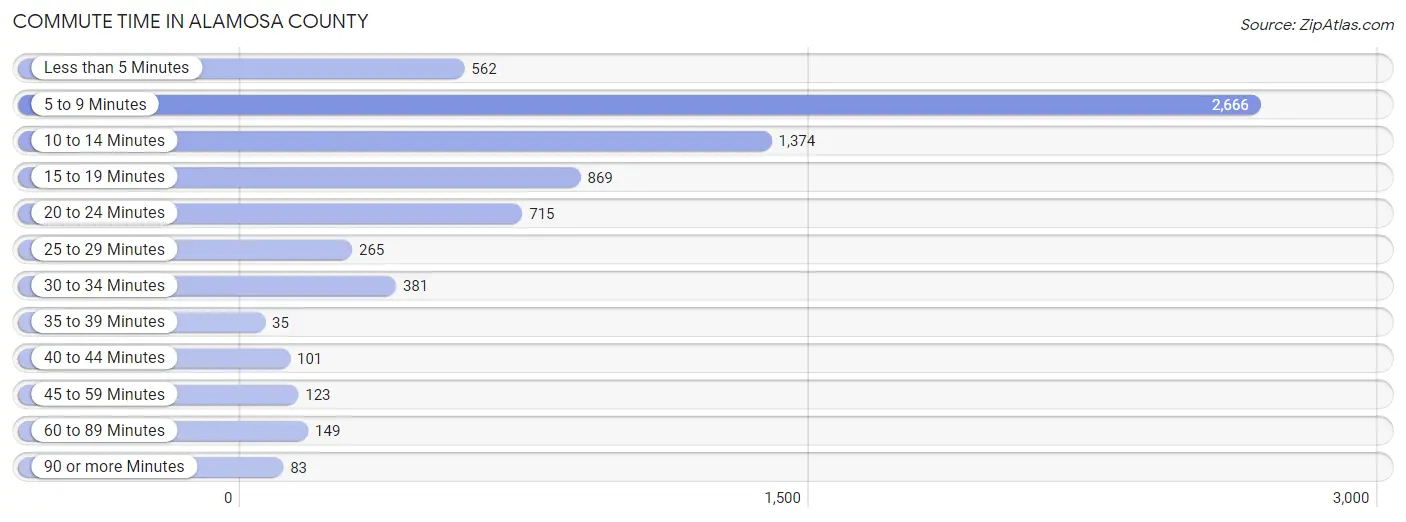
| Commute Time | # Commuters | % Commuters |
| Less than 5 Minutes | 562 | 7.7% |
| 5 to 9 Minutes | 2,666 | 36.4% |
| 10 to 14 Minutes | 1,374 | 18.8% |
| 15 to 19 Minutes | 869 | 11.9% |
| 20 to 24 Minutes | 715 | 9.8% |
| 25 to 29 Minutes | 265 | 3.6% |
| 30 to 34 Minutes | 381 | 5.2% |
| 35 to 39 Minutes | 35 | 0.5% |
| 40 to 44 Minutes | 101 | 1.4% |
| 45 to 59 Minutes | 123 | 1.7% |
| 60 to 89 Minutes | 149 | 2.0% |
| 90 or more Minutes | 83 | 1.1% |
Commute Time by Sex in Alamosa County
The most common commute times in Alamosa County are 5 to 9 minutes (1,165 commuters, 31.2%) for males and 5 to 9 minutes (1,501 commuters, 41.8%) for females.
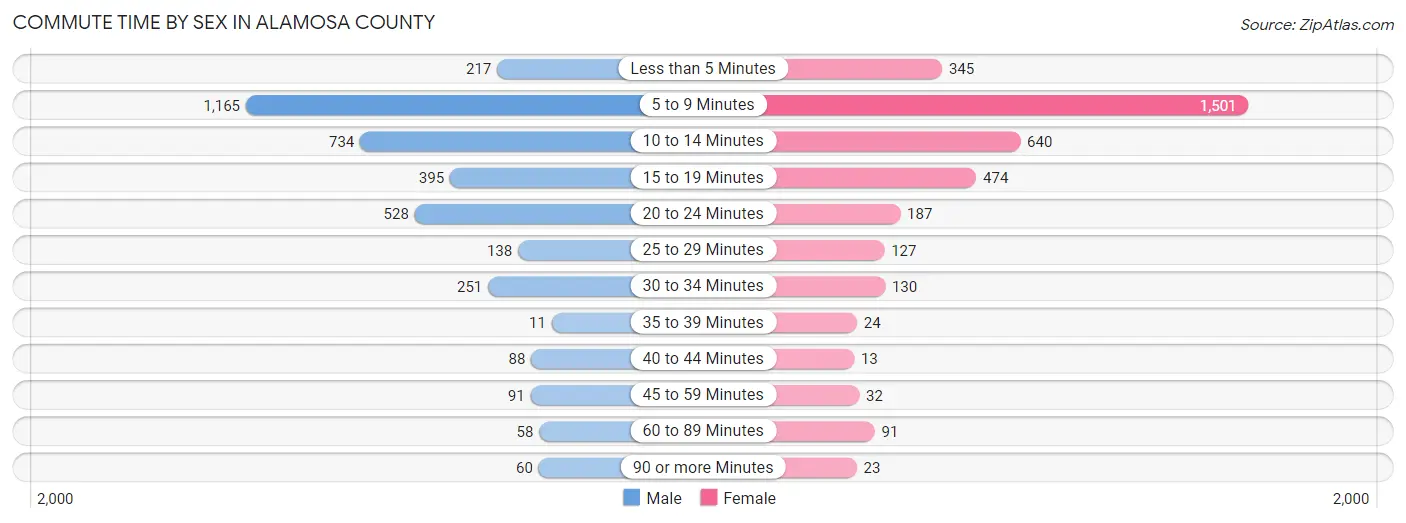
| Commute Time | Male | Female |
| Less than 5 Minutes | 217 (5.8%) | 345 (9.6%) |
| 5 to 9 Minutes | 1,165 (31.2%) | 1,501 (41.8%) |
| 10 to 14 Minutes | 734 (19.7%) | 640 (17.8%) |
| 15 to 19 Minutes | 395 (10.6%) | 474 (13.2%) |
| 20 to 24 Minutes | 528 (14.1%) | 187 (5.2%) |
| 25 to 29 Minutes | 138 (3.7%) | 127 (3.5%) |
| 30 to 34 Minutes | 251 (6.7%) | 130 (3.6%) |
| 35 to 39 Minutes | 11 (0.3%) | 24 (0.7%) |
| 40 to 44 Minutes | 88 (2.4%) | 13 (0.4%) |
| 45 to 59 Minutes | 91 (2.4%) | 32 (0.9%) |
| 60 to 89 Minutes | 58 (1.5%) | 91 (2.5%) |
| 90 or more Minutes | 60 (1.6%) | 23 (0.6%) |
Time of Departure to Work by Sex in Alamosa County
The most frequent times of departure to work in Alamosa County are 7:00 AM to 7:29 AM (784, 21.0%) for males and 7:30 AM to 7:59 AM (1,303, 36.3%) for females.
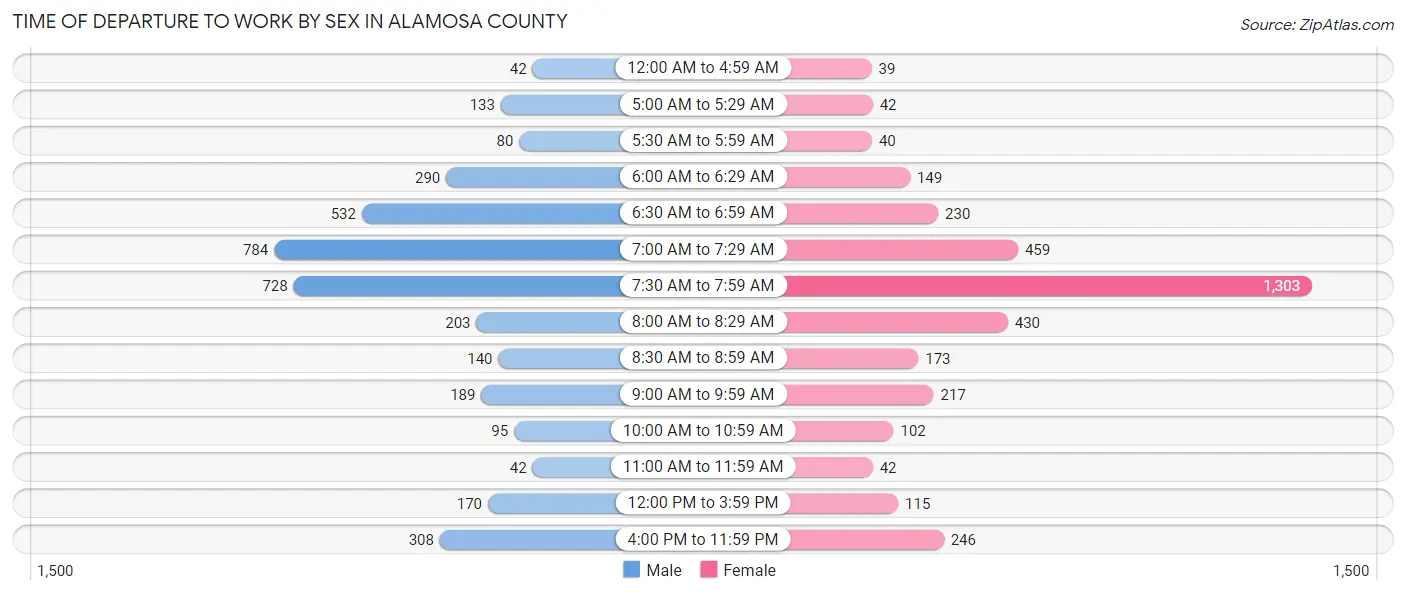
| Time of Departure | Male | Female |
| 12:00 AM to 4:59 AM | 42 (1.1%) | 39 (1.1%) |
| 5:00 AM to 5:29 AM | 133 (3.6%) | 42 (1.2%) |
| 5:30 AM to 5:59 AM | 80 (2.1%) | 40 (1.1%) |
| 6:00 AM to 6:29 AM | 290 (7.8%) | 149 (4.2%) |
| 6:30 AM to 6:59 AM | 532 (14.2%) | 230 (6.4%) |
| 7:00 AM to 7:29 AM | 784 (21.0%) | 459 (12.8%) |
| 7:30 AM to 7:59 AM | 728 (19.5%) | 1,303 (36.3%) |
| 8:00 AM to 8:29 AM | 203 (5.4%) | 430 (12.0%) |
| 8:30 AM to 8:59 AM | 140 (3.7%) | 173 (4.8%) |
| 9:00 AM to 9:59 AM | 189 (5.1%) | 217 (6.0%) |
| 10:00 AM to 10:59 AM | 95 (2.5%) | 102 (2.8%) |
| 11:00 AM to 11:59 AM | 42 (1.1%) | 42 (1.2%) |
| 12:00 PM to 3:59 PM | 170 (4.5%) | 115 (3.2%) |
| 4:00 PM to 11:59 PM | 308 (8.2%) | 246 (6.9%) |
| Total | 3,736 (100.0%) | 3,587 (100.0%) |
Housing Occupancy in Alamosa County
Occupancy by Ownership in Alamosa County
Of the total 6,471 dwellings in Alamosa County, owner-occupied units account for 3,702 (57.2%), while renter-occupied units make up 2,769 (42.8%).
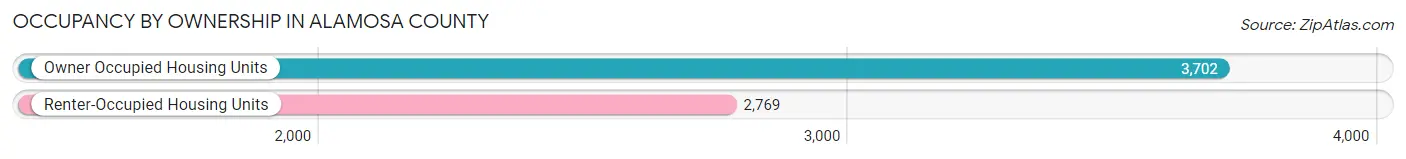
| Occupancy | # Housing Units | % Housing Units |
| Owner Occupied Housing Units | 3,702 | 57.2% |
| Renter-Occupied Housing Units | 2,769 | 42.8% |
| Total Occupied Housing Units | 6,471 | 100.0% |
Occupancy by Household Size in Alamosa County
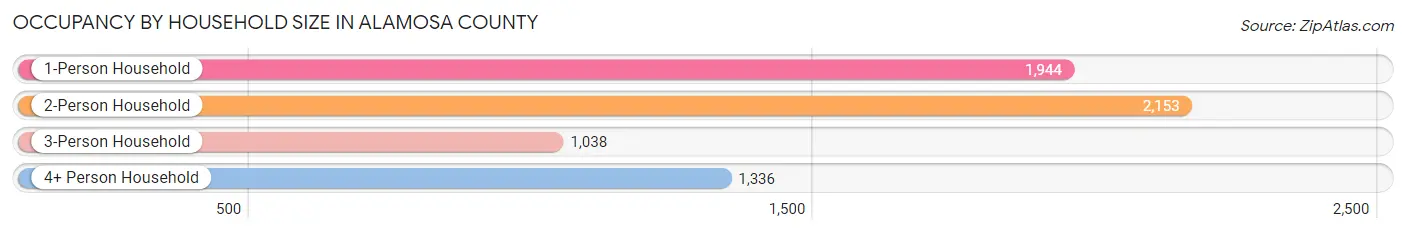
| Household Size | # Housing Units | % Housing Units |
| 1-Person Household | 1,944 | 30.0% |
| 2-Person Household | 2,153 | 33.3% |
| 3-Person Household | 1,038 | 16.0% |
| 4+ Person Household | 1,336 | 20.6% |
| Total Housing Units | 6,471 | 100.0% |
Occupancy by Ownership by Household Size in Alamosa County
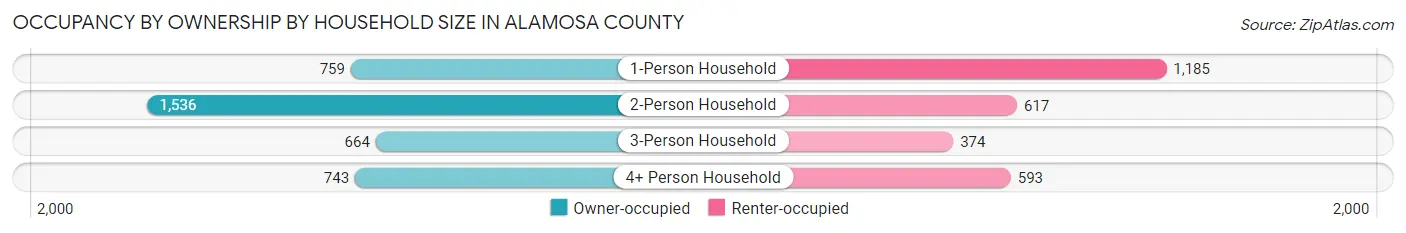
| Household Size | Owner-occupied | Renter-occupied |
| 1-Person Household | 759 (39.0%) | 1,185 (61.0%) |
| 2-Person Household | 1,536 (71.3%) | 617 (28.7%) |
| 3-Person Household | 664 (64.0%) | 374 (36.0%) |
| 4+ Person Household | 743 (55.6%) | 593 (44.4%) |
| Total Housing Units | 3,702 (57.2%) | 2,769 (42.8%) |
Occupancy by Educational Attainment in Alamosa County
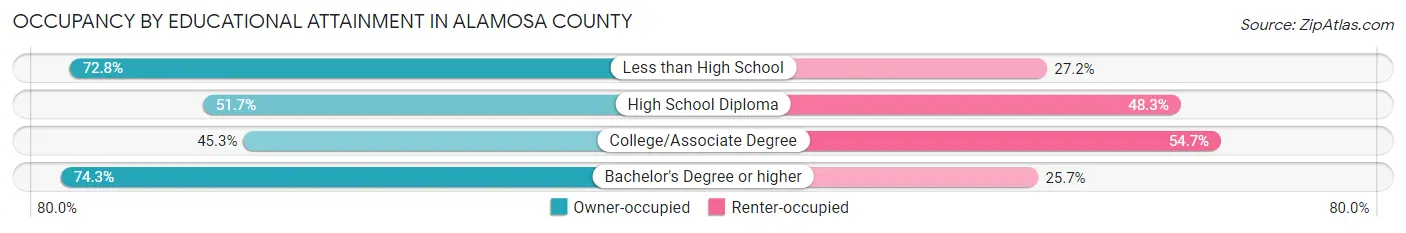
| Household Size | Owner-occupied | Renter-occupied |
| Less than High School | 346 (72.8%) | 129 (27.2%) |
| High School Diploma | 835 (51.7%) | 779 (48.3%) |
| College/Associate Degree | 1,148 (45.3%) | 1,385 (54.7%) |
| Bachelor's Degree or higher | 1,373 (74.3%) | 476 (25.7%) |
Occupancy by Age of Householder in Alamosa County
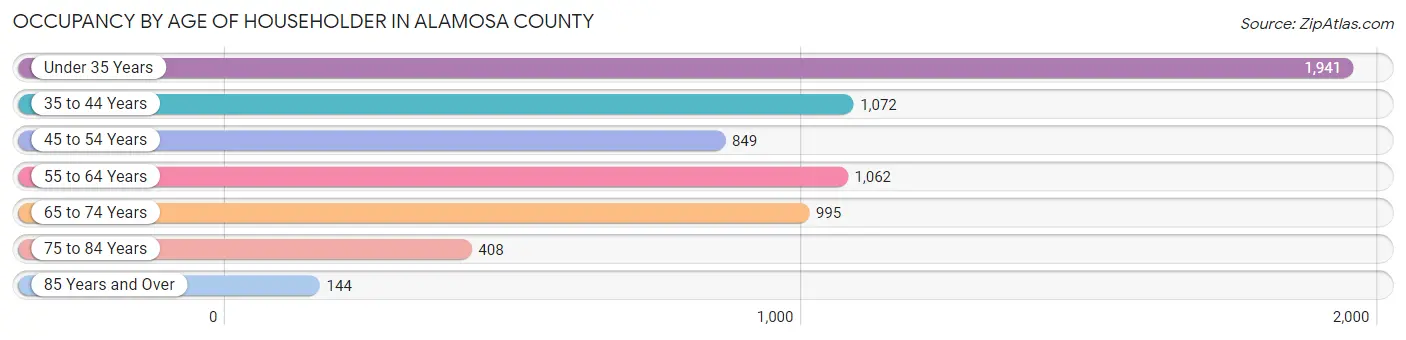
| Age Bracket | # Households | % Households |
| Under 35 Years | 1,941 | 30.0% |
| 35 to 44 Years | 1,072 | 16.6% |
| 45 to 54 Years | 849 | 13.1% |
| 55 to 64 Years | 1,062 | 16.4% |
| 65 to 74 Years | 995 | 15.4% |
| 75 to 84 Years | 408 | 6.3% |
| 85 Years and Over | 144 | 2.2% |
| Total | 6,471 | 100.0% |
Housing Finances in Alamosa County
Median Income by Occupancy in Alamosa County
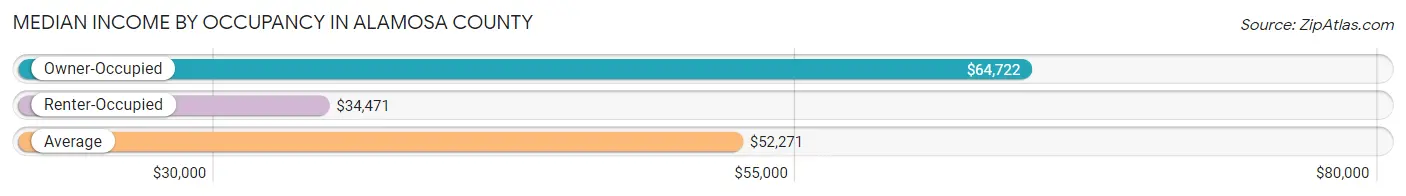
| Occupancy Type | # Households | Median Income |
| Owner-Occupied | 3,702 (57.2%) | $64,722 |
| Renter-Occupied | 2,769 (42.8%) | $34,471 |
| Average | 6,471 (100.0%) | $52,271 |
Occupancy by Householder Income Bracket in Alamosa County
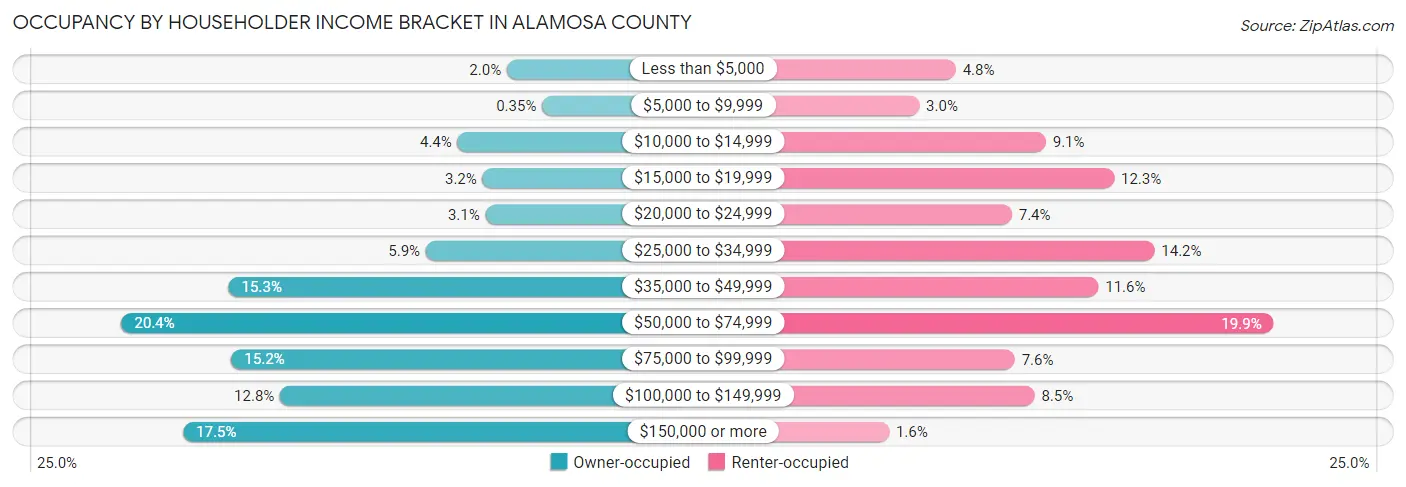
| Income Bracket | Owner-occupied | Renter-occupied |
| Less than $5,000 | 75 (2.0%) | 132 (4.8%) |
| $5,000 to $9,999 | 13 (0.4%) | 84 (3.0%) |
| $10,000 to $14,999 | 162 (4.4%) | 251 (9.1%) |
| $15,000 to $19,999 | 118 (3.2%) | 341 (12.3%) |
| $20,000 to $24,999 | 113 (3.0%) | 206 (7.4%) |
| $25,000 to $34,999 | 218 (5.9%) | 394 (14.2%) |
| $35,000 to $49,999 | 566 (15.3%) | 320 (11.6%) |
| $50,000 to $74,999 | 755 (20.4%) | 551 (19.9%) |
| $75,000 to $99,999 | 561 (15.1%) | 210 (7.6%) |
| $100,000 to $149,999 | 475 (12.8%) | 236 (8.5%) |
| $150,000 or more | 646 (17.4%) | 44 (1.6%) |
| Total | 3,702 (100.0%) | 2,769 (100.0%) |
Monthly Housing Cost Tiers in Alamosa County
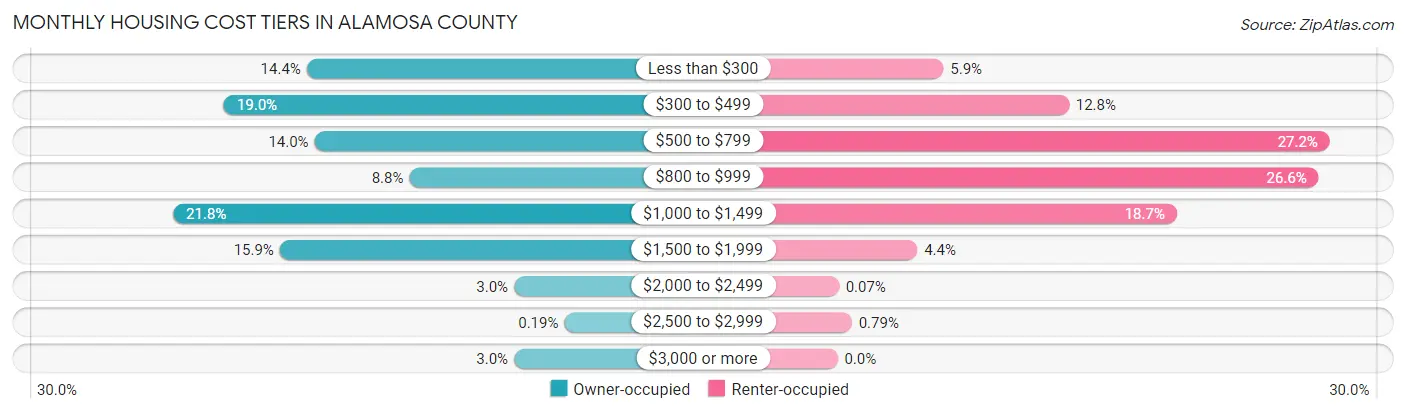
| Monthly Cost | Owner-occupied | Renter-occupied |
| Less than $300 | 534 (14.4%) | 162 (5.9%) |
| $300 to $499 | 703 (19.0%) | 354 (12.8%) |
| $500 to $799 | 518 (14.0%) | 753 (27.2%) |
| $800 to $999 | 324 (8.7%) | 736 (26.6%) |
| $1,000 to $1,499 | 807 (21.8%) | 519 (18.7%) |
| $1,500 to $1,999 | 589 (15.9%) | 122 (4.4%) |
| $2,000 to $2,499 | 110 (3.0%) | 2 (0.1%) |
| $2,500 to $2,999 | 7 (0.2%) | 22 (0.8%) |
| $3,000 or more | 110 (3.0%) | 0 (0.0%) |
| Total | 3,702 (100.0%) | 2,769 (100.0%) |
Physical Housing Characteristics in Alamosa County
Housing Structures in Alamosa County
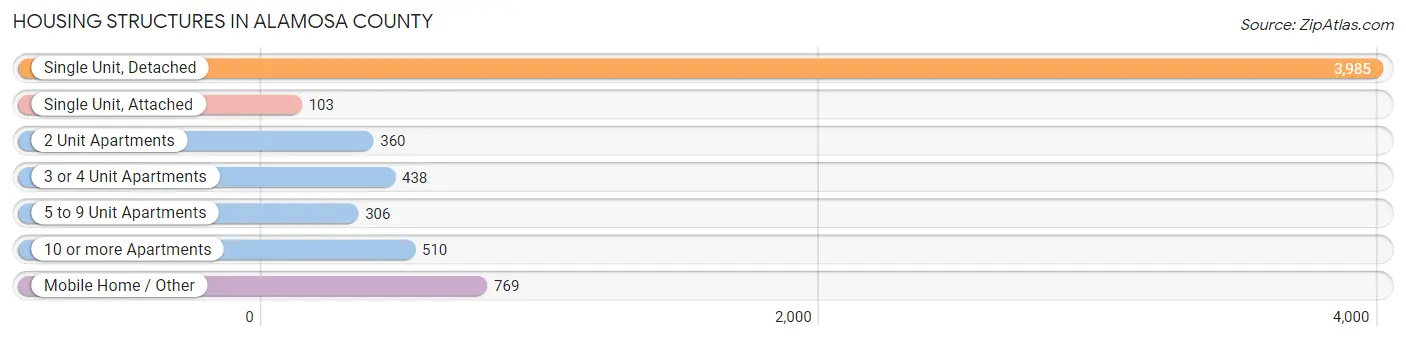
| Structure Type | # Housing Units | % Housing Units |
| Single Unit, Detached | 3,985 | 61.6% |
| Single Unit, Attached | 103 | 1.6% |
| 2 Unit Apartments | 360 | 5.6% |
| 3 or 4 Unit Apartments | 438 | 6.8% |
| 5 to 9 Unit Apartments | 306 | 4.7% |
| 10 or more Apartments | 510 | 7.9% |
| Mobile Home / Other | 769 | 11.9% |
| Total | 6,471 | 100.0% |
Housing Structures by Occupancy in Alamosa County
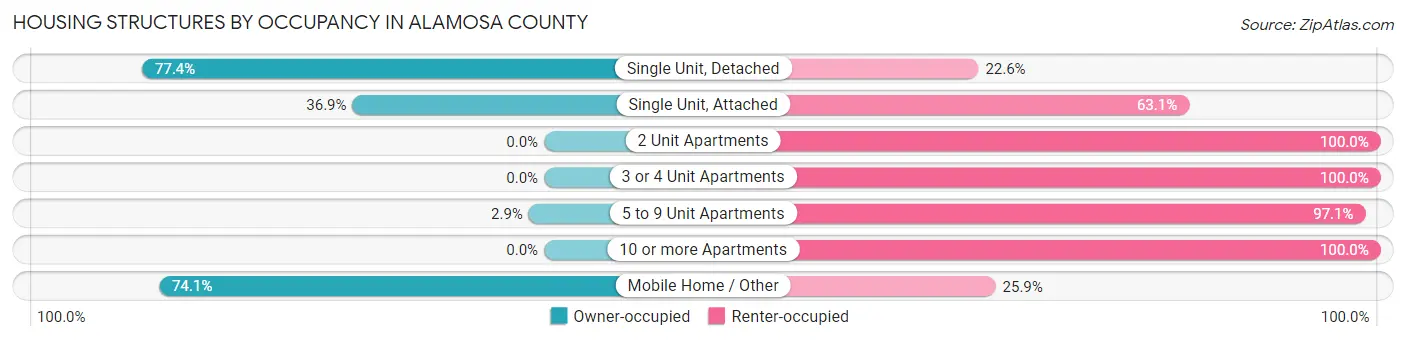
| Structure Type | Owner-occupied | Renter-occupied |
| Single Unit, Detached | 3,085 (77.4%) | 900 (22.6%) |
| Single Unit, Attached | 38 (36.9%) | 65 (63.1%) |
| 2 Unit Apartments | 0 (0.0%) | 360 (100.0%) |
| 3 or 4 Unit Apartments | 0 (0.0%) | 438 (100.0%) |
| 5 to 9 Unit Apartments | 9 (2.9%) | 297 (97.1%) |
| 10 or more Apartments | 0 (0.0%) | 510 (100.0%) |
| Mobile Home / Other | 570 (74.1%) | 199 (25.9%) |
| Total | 3,702 (57.2%) | 2,769 (42.8%) |
Housing Structures by Number of Rooms in Alamosa County
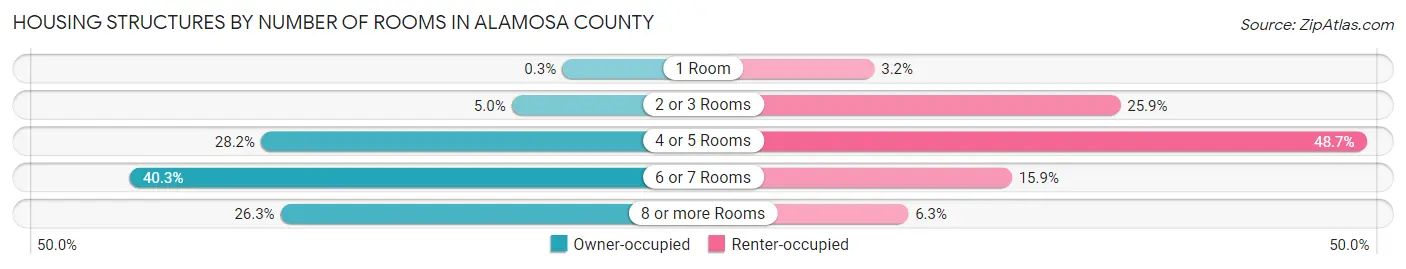
| Number of Rooms | Owner-occupied | Renter-occupied |
| 1 Room | 11 (0.3%) | 88 (3.2%) |
| 2 or 3 Rooms | 184 (5.0%) | 718 (25.9%) |
| 4 or 5 Rooms | 1,042 (28.1%) | 1,348 (48.7%) |
| 6 or 7 Rooms | 1,490 (40.3%) | 440 (15.9%) |
| 8 or more Rooms | 975 (26.3%) | 175 (6.3%) |
| Total | 3,702 (100.0%) | 2,769 (100.0%) |
Housing Structure by Heating Type in Alamosa County
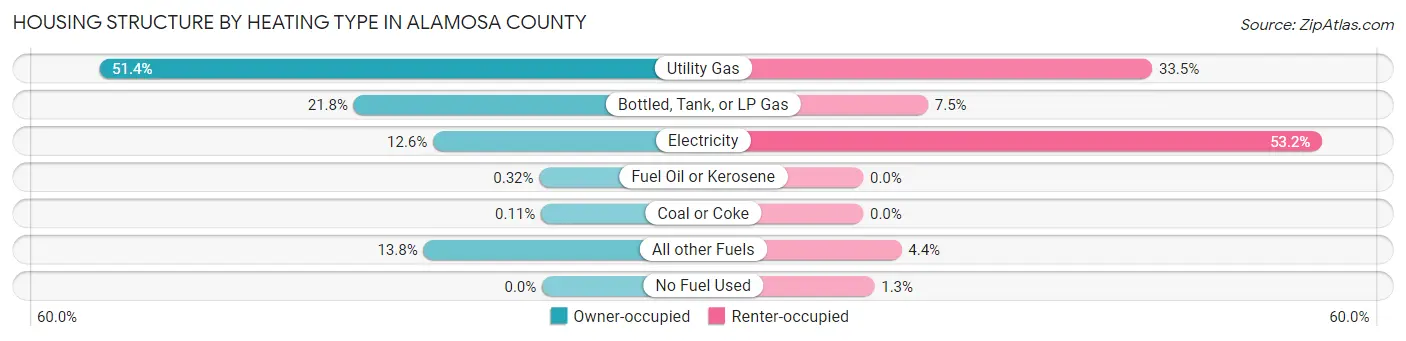
| Heating Type | Owner-occupied | Renter-occupied |
| Utility Gas | 1,901 (51.3%) | 928 (33.5%) |
| Bottled, Tank, or LP Gas | 808 (21.8%) | 208 (7.5%) |
| Electricity | 468 (12.6%) | 1,474 (53.2%) |
| Fuel Oil or Kerosene | 12 (0.3%) | 0 (0.0%) |
| Coal or Coke | 4 (0.1%) | 0 (0.0%) |
| All other Fuels | 509 (13.8%) | 123 (4.4%) |
| No Fuel Used | 0 (0.0%) | 36 (1.3%) |
| Total | 3,702 (100.0%) | 2,769 (100.0%) |
Household Vehicle Usage in Alamosa County
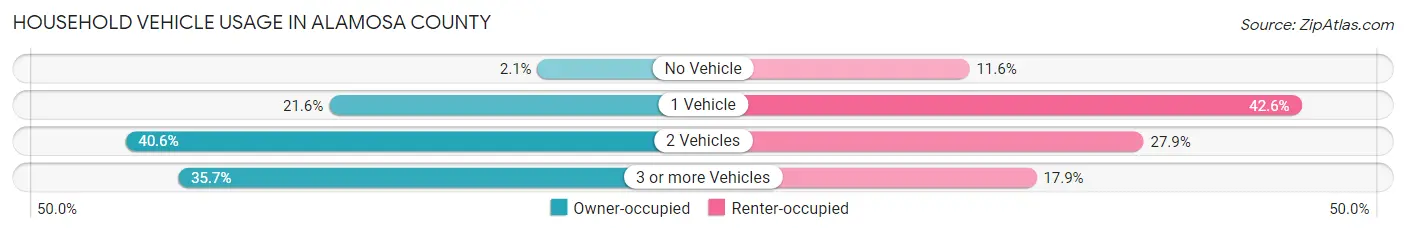
| Vehicles per Household | Owner-occupied | Renter-occupied |
| No Vehicle | 79 (2.1%) | 322 (11.6%) |
| 1 Vehicle | 799 (21.6%) | 1,180 (42.6%) |
| 2 Vehicles | 1,503 (40.6%) | 772 (27.9%) |
| 3 or more Vehicles | 1,321 (35.7%) | 495 (17.9%) |
| Total | 3,702 (100.0%) | 2,769 (100.0%) |
Real Estate & Mortgages in Alamosa County
Real Estate and Mortgage Overview in Alamosa County
| Characteristic | Without Mortgage | With Mortgage |
| Housing Units | 1,509 | 2,193 |
| Median Property Value | $158,100 | $218,600 |
| Median Household Income | $51,505 | $526 |
| Monthly Housing Costs | $361 | $107 |
| Real Estate Taxes | $823 | $84 |
Property Value by Mortgage Status in Alamosa County
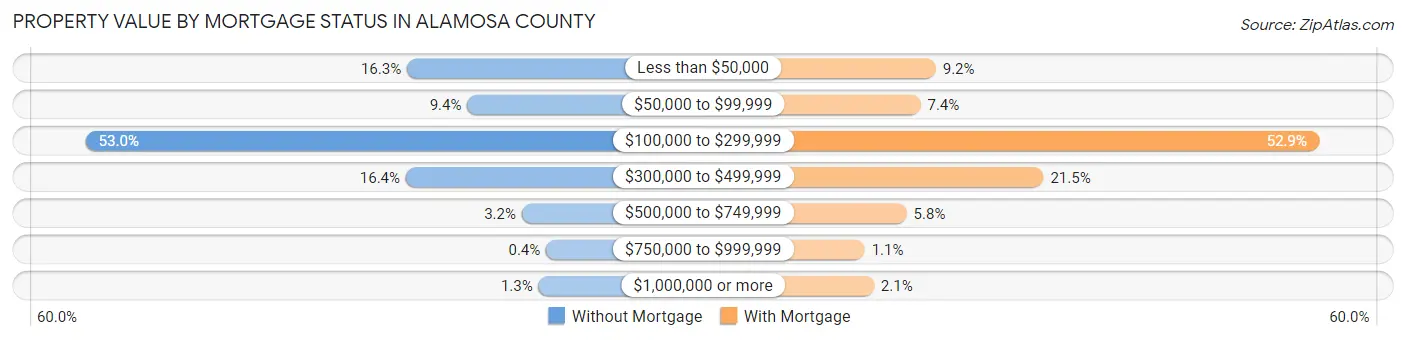
| Property Value | Without Mortgage | With Mortgage |
| Less than $50,000 | 246 (16.3%) | 201 (9.2%) |
| $50,000 to $99,999 | 142 (9.4%) | 163 (7.4%) |
| $100,000 to $299,999 | 800 (53.0%) | 1,161 (52.9%) |
| $300,000 to $499,999 | 248 (16.4%) | 471 (21.5%) |
| $500,000 to $749,999 | 48 (3.2%) | 128 (5.8%) |
| $750,000 to $999,999 | 6 (0.4%) | 23 (1.1%) |
| $1,000,000 or more | 19 (1.3%) | 46 (2.1%) |
| Total | 1,509 (100.0%) | 2,193 (100.0%) |
Household Income by Mortgage Status in Alamosa County
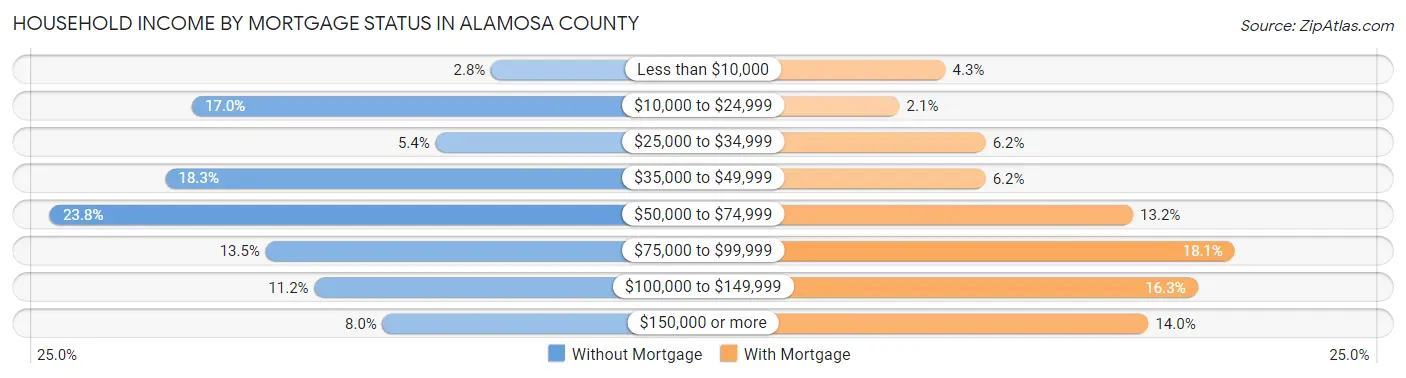
| Household Income | Without Mortgage | With Mortgage |
| Less than $10,000 | 42 (2.8%) | 94 (4.3%) |
| $10,000 to $24,999 | 257 (17.0%) | 46 (2.1%) |
| $25,000 to $34,999 | 82 (5.4%) | 136 (6.2%) |
| $35,000 to $49,999 | 276 (18.3%) | 136 (6.2%) |
| $50,000 to $74,999 | 359 (23.8%) | 290 (13.2%) |
| $75,000 to $99,999 | 204 (13.5%) | 396 (18.1%) |
| $100,000 to $149,999 | 169 (11.2%) | 357 (16.3%) |
| $150,000 or more | 120 (8.0%) | 306 (14.0%) |
| Total | 1,509 (100.0%) | 2,193 (100.0%) |
Property Value to Household Income Ratio in Alamosa County
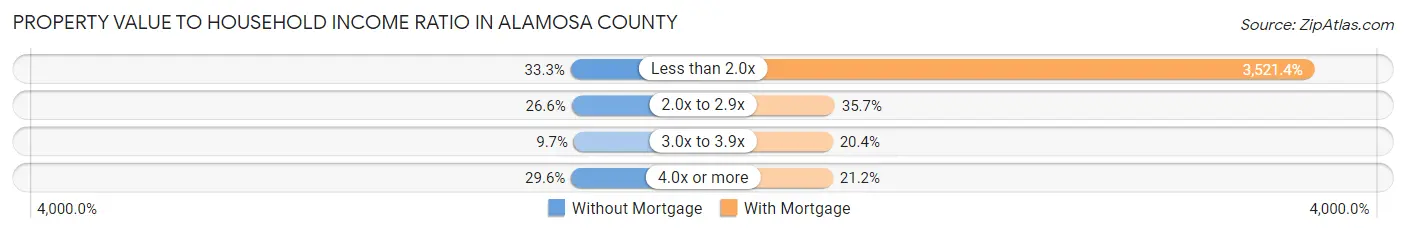
| Value-to-Income Ratio | Without Mortgage | With Mortgage |
| Less than 2.0x | 502 (33.3%) | 77,224 (3,521.4%) |
| 2.0x to 2.9x | 402 (26.6%) | 782 (35.7%) |
| 3.0x to 3.9x | 146 (9.7%) | 448 (20.4%) |
| 4.0x or more | 447 (29.6%) | 465 (21.2%) |
| Total | 1,509 (100.0%) | 2,193 (100.0%) |
Real Estate Taxes by Mortgage Status in Alamosa County
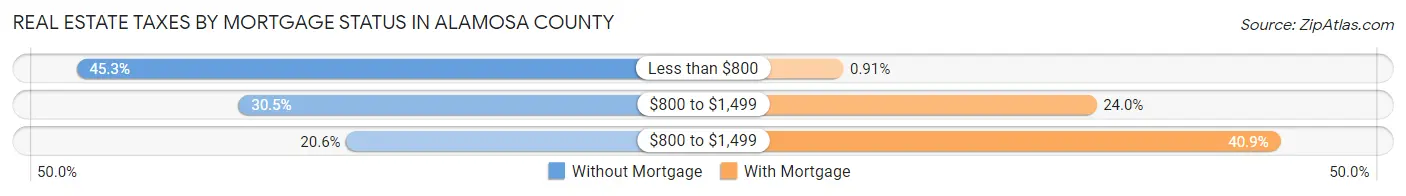
| Property Taxes | Without Mortgage | With Mortgage |
| Less than $800 | 683 (45.3%) | 20 (0.9%) |
| $800 to $1,499 | 460 (30.5%) | 527 (24.0%) |
| $800 to $1,499 | 311 (20.6%) | 896 (40.9%) |
| Total | 1,509 (100.0%) | 2,193 (100.0%) |
Health & Disability in Alamosa County
Health Insurance Coverage by Age in Alamosa County
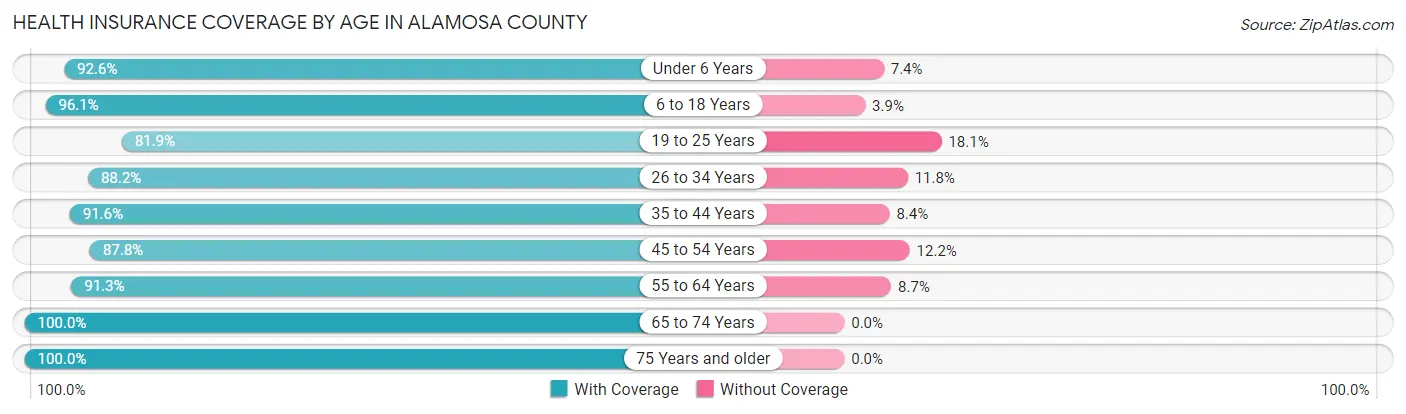
| Age Bracket | With Coverage | Without Coverage |
| Under 6 Years | 1,133 (92.6%) | 90 (7.4%) |
| 6 to 18 Years | 3,014 (96.1%) | 122 (3.9%) |
| 19 to 25 Years | 1,898 (81.9%) | 420 (18.1%) |
| 26 to 34 Years | 1,858 (88.2%) | 249 (11.8%) |
| 35 to 44 Years | 1,738 (91.6%) | 160 (8.4%) |
| 45 to 54 Years | 1,203 (87.8%) | 167 (12.2%) |
| 55 to 64 Years | 1,612 (91.3%) | 154 (8.7%) |
| 65 to 74 Years | 1,553 (100.0%) | 0 (0.0%) |
| 75 Years and older | 750 (100.0%) | 0 (0.0%) |
| Total | 14,759 (91.5%) | 1,362 (8.5%) |
Health Insurance Coverage by Citizenship Status in Alamosa County
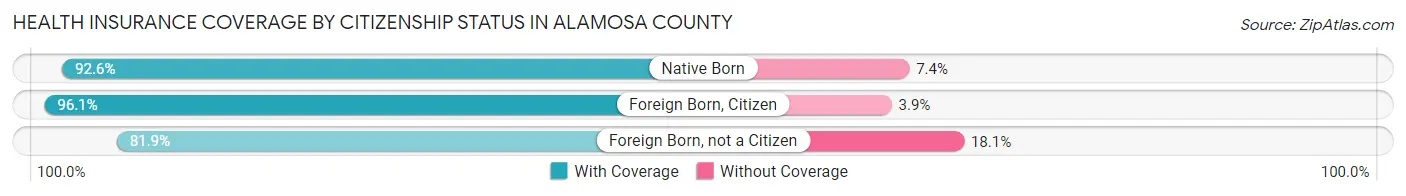
| Citizenship Status | With Coverage | Without Coverage |
| Native Born | 1,133 (92.6%) | 90 (7.4%) |
| Foreign Born, Citizen | 3,014 (96.1%) | 122 (3.9%) |
| Foreign Born, not a Citizen | 1,898 (81.9%) | 420 (18.1%) |
Health Insurance Coverage by Household Income in Alamosa County
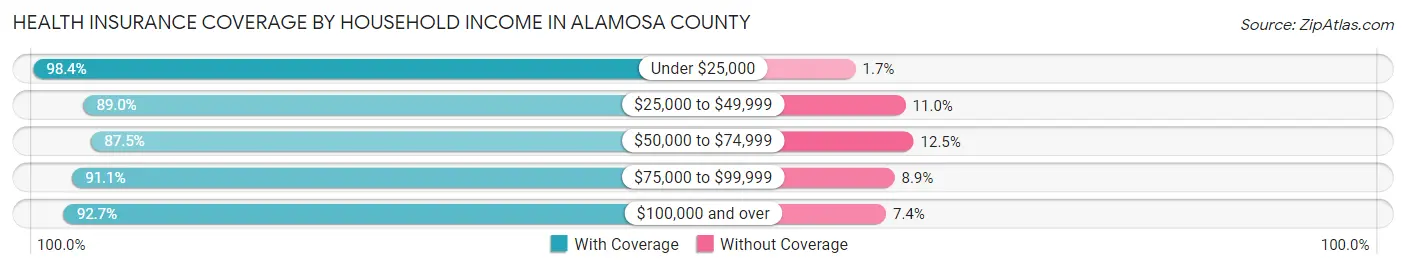
| Household Income | With Coverage | Without Coverage |
| Under $25,000 | 2,152 (98.4%) | 36 (1.7%) |
| $25,000 to $49,999 | 3,146 (89.0%) | 390 (11.0%) |
| $50,000 to $74,999 | 2,899 (87.5%) | 415 (12.5%) |
| $75,000 to $99,999 | 1,772 (91.1%) | 174 (8.9%) |
| $100,000 and over | 4,174 (92.6%) | 331 (7.3%) |
Public vs Private Health Insurance Coverage by Age in Alamosa County
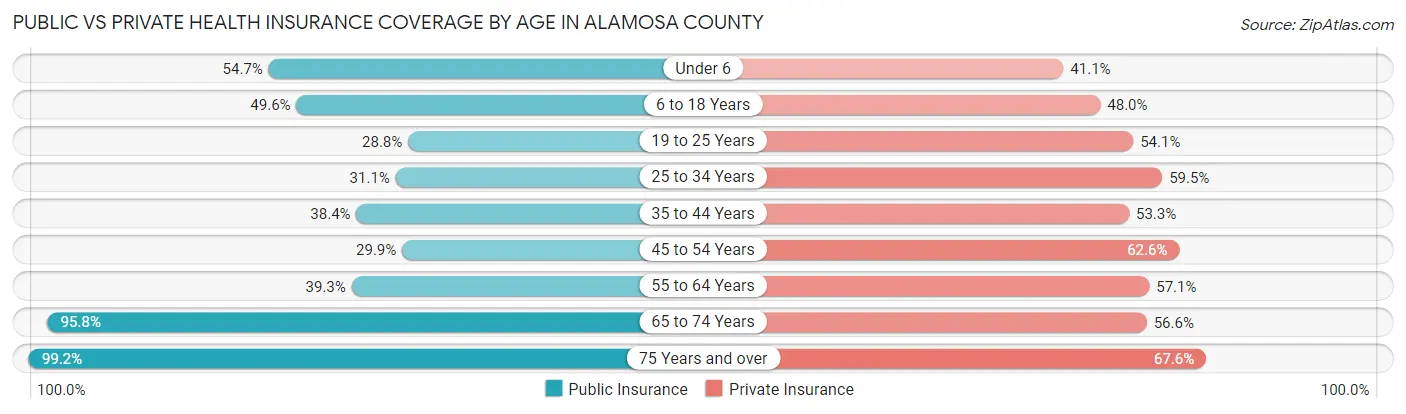
| Age Bracket | Public Insurance | Private Insurance |
| Under 6 | 669 (54.7%) | 503 (41.1%) |
| 6 to 18 Years | 1,554 (49.5%) | 1,505 (48.0%) |
| 19 to 25 Years | 668 (28.8%) | 1,254 (54.1%) |
| 25 to 34 Years | 656 (31.1%) | 1,253 (59.5%) |
| 35 to 44 Years | 729 (38.4%) | 1,012 (53.3%) |
| 45 to 54 Years | 410 (29.9%) | 858 (62.6%) |
| 55 to 64 Years | 694 (39.3%) | 1,008 (57.1%) |
| 65 to 74 Years | 1,487 (95.8%) | 879 (56.6%) |
| 75 Years and over | 744 (99.2%) | 507 (67.6%) |
| Total | 7,611 (47.2%) | 8,779 (54.5%) |
Disability Status by Sex by Age in Alamosa County
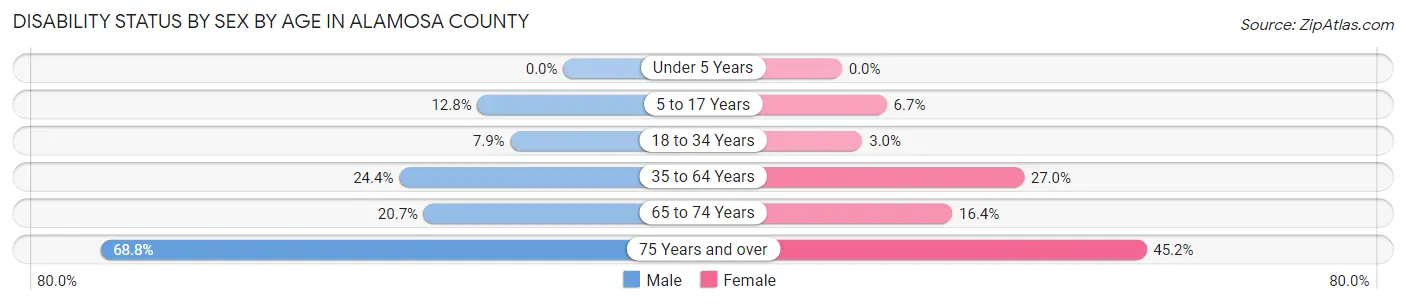
| Age Bracket | Male | Female |
| Under 5 Years | 0 (0.0%) | 0 (0.0%) |
| 5 to 17 Years | 198 (12.8%) | 94 (6.7%) |
| 18 to 34 Years | 190 (7.9%) | 74 (3.0%) |
| 35 to 64 Years | 613 (24.4%) | 681 (27.0%) |
| 65 to 74 Years | 151 (20.7%) | 135 (16.4%) |
| 75 Years and over | 207 (68.8%) | 203 (45.2%) |
Disability Class by Sex by Age in Alamosa County
Disability Class: Hearing Difficulty
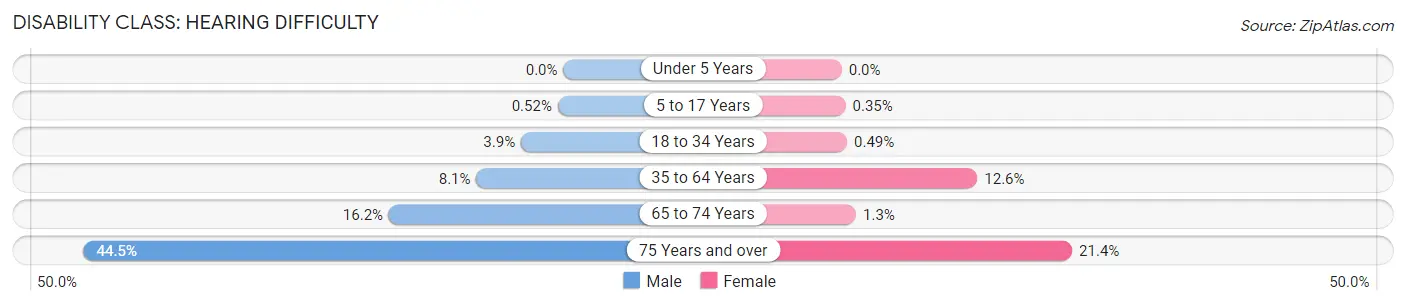
| Age Bracket | Male | Female |
| Under 5 Years | 0 (0.0%) | 0 (0.0%) |
| 5 to 17 Years | 8 (0.5%) | 5 (0.4%) |
| 18 to 34 Years | 95 (3.9%) | 12 (0.5%) |
| 35 to 64 Years | 203 (8.1%) | 317 (12.6%) |
| 65 to 74 Years | 118 (16.2%) | 11 (1.3%) |
| 75 Years and over | 134 (44.5%) | 96 (21.4%) |
Disability Class: Vision Difficulty
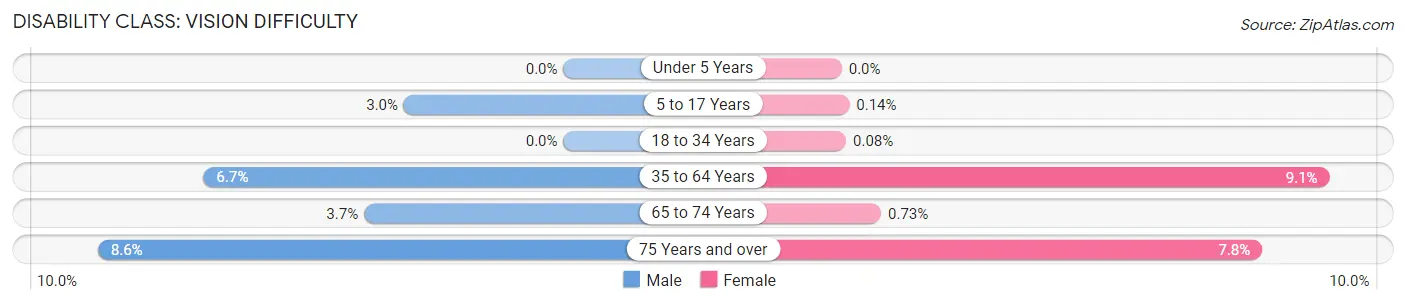
| Age Bracket | Male | Female |
| Under 5 Years | 0 (0.0%) | 0 (0.0%) |
| 5 to 17 Years | 46 (3.0%) | 2 (0.1%) |
| 18 to 34 Years | 0 (0.0%) | 2 (0.1%) |
| 35 to 64 Years | 168 (6.7%) | 228 (9.0%) |
| 65 to 74 Years | 27 (3.7%) | 6 (0.7%) |
| 75 Years and over | 26 (8.6%) | 35 (7.8%) |
Disability Class: Cognitive Difficulty
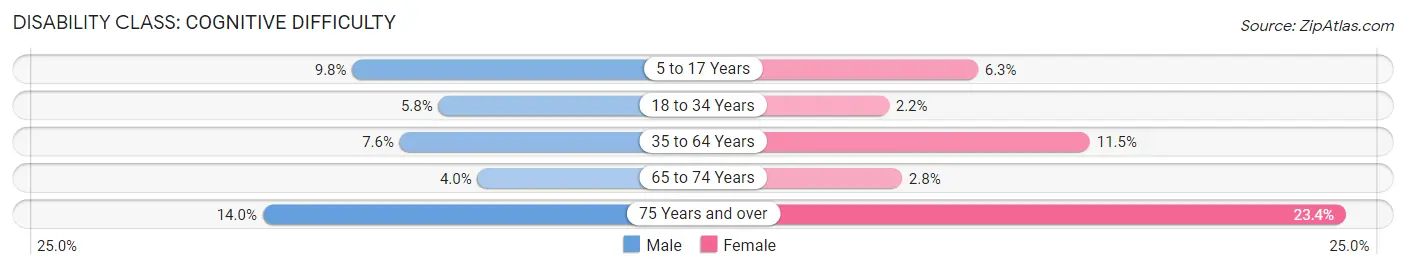
| Age Bracket | Male | Female |
| 5 to 17 Years | 152 (9.8%) | 89 (6.3%) |
| 18 to 34 Years | 140 (5.8%) | 53 (2.2%) |
| 35 to 64 Years | 191 (7.6%) | 290 (11.5%) |
| 65 to 74 Years | 29 (4.0%) | 23 (2.8%) |
| 75 Years and over | 42 (14.0%) | 105 (23.4%) |
Disability Class: Ambulatory Difficulty
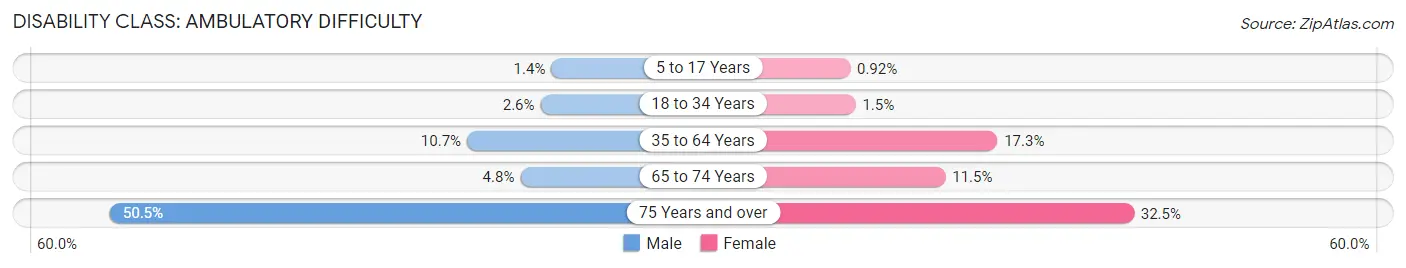
| Age Bracket | Male | Female |
| 5 to 17 Years | 21 (1.3%) | 13 (0.9%) |
| 18 to 34 Years | 62 (2.6%) | 37 (1.5%) |
| 35 to 64 Years | 270 (10.7%) | 436 (17.3%) |
| 65 to 74 Years | 35 (4.8%) | 95 (11.5%) |
| 75 Years and over | 152 (50.5%) | 146 (32.5%) |
Disability Class: Self-Care Difficulty
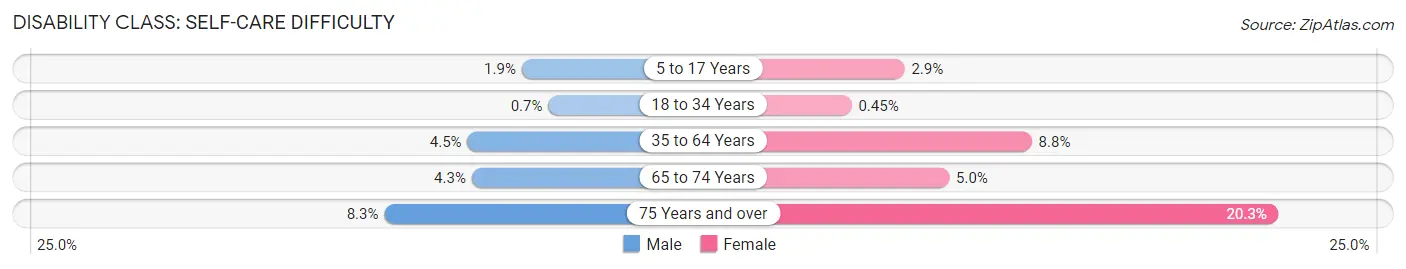
| Age Bracket | Male | Female |
| 5 to 17 Years | 30 (1.9%) | 41 (2.9%) |
| 18 to 34 Years | 17 (0.7%) | 11 (0.4%) |
| 35 to 64 Years | 112 (4.4%) | 222 (8.8%) |
| 65 to 74 Years | 31 (4.3%) | 41 (5.0%) |
| 75 Years and over | 25 (8.3%) | 91 (20.3%) |
Technology Access in Alamosa County
Computing Device Access in Alamosa County
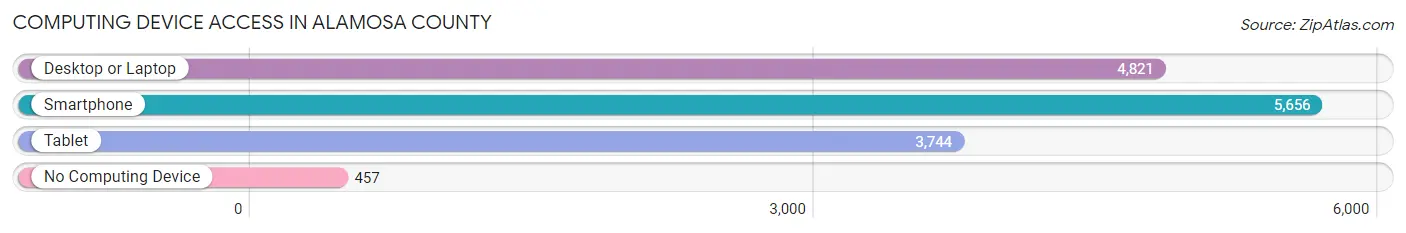
| Device Type | # Households | % Households |
| Desktop or Laptop | 4,821 | 74.5% |
| Smartphone | 5,656 | 87.4% |
| Tablet | 3,744 | 57.9% |
| No Computing Device | 457 | 7.1% |
| Total | 6,471 | 100.0% |
Internet Access in Alamosa County
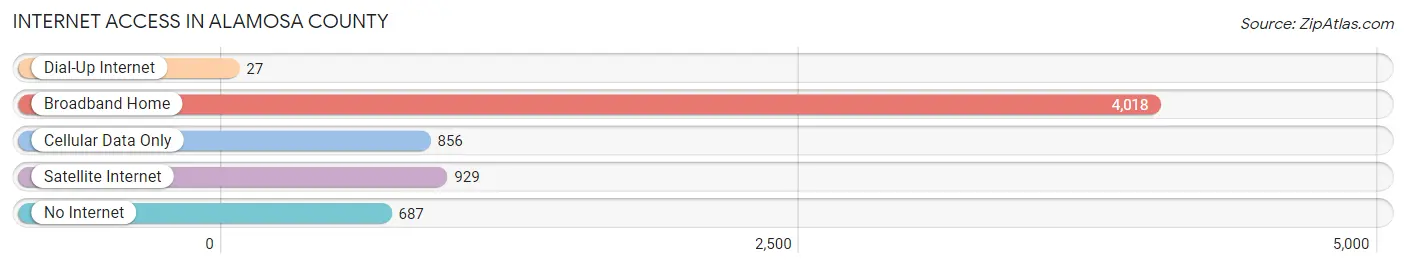
| Internet Type | # Households | % Households |
| Dial-Up Internet | 27 | 0.4% |
| Broadband Home | 4,018 | 62.1% |
| Cellular Data Only | 856 | 13.2% |
| Satellite Internet | 929 | 14.4% |
| No Internet | 687 | 10.6% |
| Total | 6,471 | 100.0% |
Alamosa County Summary
Alamosa County is located in the San Luis Valley of south-central Colorado. It is bordered by Costilla County to the north, Conejos County to the east, Rio Grande County to the south, and Saguache County to the west. The county seat is Alamosa, which is also the largest city in the county. The county covers an area of 1,230 square miles and has a population of 15,445 as of the 2010 census.
Geography
Alamosa County is located in the San Luis Valley, which is a large intermontane basin in the Rocky Mountains of south-central Colorado. The valley is surrounded by the Sangre de Cristo Mountains to the east and the San Juan Mountains to the west. The Rio Grande River flows through the valley, and the county is home to several reservoirs, including the Alamosa National Wildlife Refuge. The county is also home to several mountain peaks, including Mount Blanca, which is the fourth highest peak in Colorado.
The county has a semi-arid climate, with hot summers and cold winters. The average annual precipitation is 11.5 inches, and the average annual snowfall is 33.5 inches.
Economy
Agriculture is the main economic activity in Alamosa County. The county is home to several large farms, and the main crops grown in the area are potatoes, alfalfa, wheat, and barley. The county is also home to several dairies, and the main livestock raised in the area are cattle and sheep.
The county is also home to several manufacturing companies, including a large potato processing plant. Tourism is also an important part of the local economy, and the county is home to several ski resorts, including Wolf Creek Ski Area.
Demographics
As of the 2010 census, there were 15,445 people, 5,845 households, and 3,845 families living in Alamosa County. The population density was 12.5 people per square mile. The racial makeup of the county was 75.3% White, 0.7% African American, 1.3% Native American, 0.7% Asian, 0.1% Pacific Islander, 19.2% from other races, and 2.9% from two or more races. Hispanic or Latino of any race were 44.2% of the population.
The median income for a household in the county was $32,917, and the median income for a family was $41,945. The per capita income for the county was $17,845. About 17.2% of families and 22.2% of the population were below the poverty line, including 28.3% of those under age 18 and 11.2% of those age 65 or over.
Alamosa County is a diverse and vibrant community with a rich history and a bright future. The county is home to a variety of industries, from agriculture to tourism, and its population is growing. With its beautiful scenery and friendly people, Alamosa County is a great place to live, work, and play.
Common Questions
What is Per Capita Income in Alamosa County?
Per Capita income in Alamosa County is $28,945.
What is the Median Family Income in Alamosa County?
Median Family Income in Alamosa County is $65,720.
What is the Median Household income in Alamosa County?
Median Household Income in Alamosa County is $52,271.
What is Income or Wage Gap in Alamosa County?
Income or Wage Gap in Alamosa County is 17.3%.
Women in Alamosa County earn 82.7 cents for every dollar earned by a man.
What is Family Income Deficit in Alamosa County?
Family Income Deficit in Alamosa County is $8,387.
Families that are below poverty line in Alamosa County earn $8,387 less on average than the poverty threshold level.
What is Inequality or Gini Index in Alamosa County?
Inequality or Gini Index in Alamosa County is 0.47.
What is the Total Population of Alamosa County?
Total Population of Alamosa County is 16,460.
What is the Total Male Population of Alamosa County?
Total Male Population of Alamosa County is 8,160.
What is the Total Female Population of Alamosa County?
Total Female Population of Alamosa County is 8,300.
What is the Ratio of Males per 100 Females in Alamosa County?
There are 98.31 Males per 100 Females in Alamosa County.
What is the Ratio of Females per 100 Males in Alamosa County?
There are 101.72 Females per 100 Males in Alamosa County.
What is the Median Population Age in Alamosa County?
Median Population Age in Alamosa County is 32.2 Years.
What is the Average Family Size in Alamosa County
Average Family Size in Alamosa County is 3.0 People.
What is the Average Household Size in Alamosa County
Average Household Size in Alamosa County is 2.4 People.
How Large is the Labor Force in Alamosa County?
There are 8,176 People in the Labor Forcein in Alamosa County.
What is the Percentage of People in the Labor Force in Alamosa County?
63.1% of People are in the Labor Force in Alamosa County.
What is the Unemployment Rate in Alamosa County?
Unemployment Rate in Alamosa County is 3.4%.