Columbia, TN Map & Demographics
Columbia Map
Columbia Overview
$30,249
PER CAPITA INCOME
$72,745
AVG FAMILY INCOME
$58,110
AVG HOUSEHOLD INCOME
18.5%
WAGE / INCOME GAP [ % ]
81.5¢/ $1
WAGE / INCOME GAP [ $ ]
$9,503
FAMILY INCOME DEFICIT
0.42
INEQUALITY / GINI INDEX
42,474
TOTAL POPULATION
19,834
MALE POPULATION
22,640
FEMALE POPULATION
87.61
MALES / 100 FEMALES
114.15
FEMALES / 100 MALES
36.2
MEDIAN AGE
3.1
AVG FAMILY SIZE
2.4
AVG HOUSEHOLD SIZE
21,286
LABOR FORCE [ PEOPLE ]
64.4%
PERCENT IN LABOR FORCE
3.4%
UNEMPLOYMENT RATE
Columbia Zip Codes
Income in Columbia
Income Overview in Columbia
Per Capita Income in Columbia is $30,249, while median incomes of families and households are $72,745 and $58,110 respectively.
| Characteristic | Number | Measure |
| Per Capita Income | 42,474 | $30,249 |
| Median Family Income | 10,738 | $72,745 |
| Mean Family Income | 10,738 | $83,596 |
| Median Household Income | 17,041 | $58,110 |
| Mean Household Income | 17,041 | $73,923 |
| Income Deficit | 10,738 | $9,503 |
| Wage / Income Gap (%) | 42,474 | 18.48% |
| Wage / Income Gap ($) | 42,474 | 81.52¢ per $1 |
| Gini / Inequality Index | 42,474 | 0.42 |
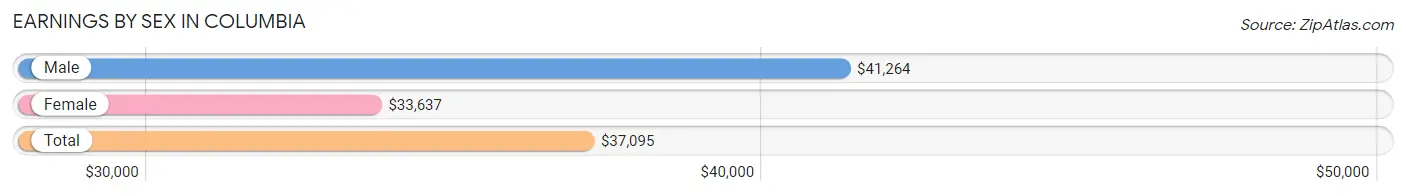
Earnings by Sex in Columbia
Average Earnings in Columbia are $37,095, $41,264 for men and $33,637 for women, a difference of 18.5%.
| Sex | Number | Average Earnings |
| Male | 11,343 (51.7%) | $41,264 |
| Female | 10,593 (48.3%) | $33,637 |
| Total | 21,936 (100.0%) | $37,095 |
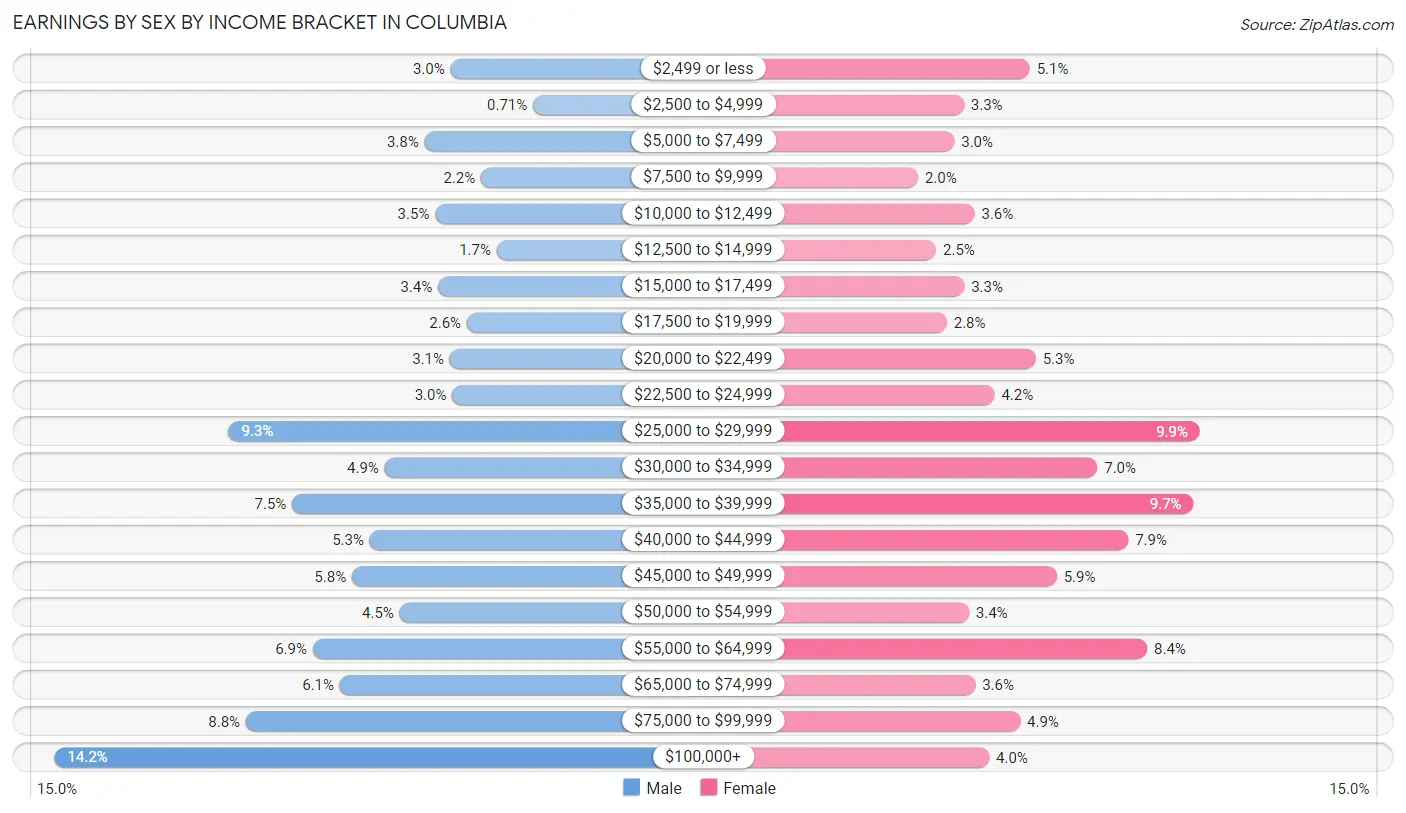
Earnings by Sex by Income Bracket in Columbia
The most common earnings brackets in Columbia are $100,000+ for men (1,606 | 14.2%) and $25,000 to $29,999 for women (1,051 | 9.9%).
| Income | Male | Female |
| $2,499 or less | 344 (3.0%) | 544 (5.1%) |
| $2,500 to $4,999 | 81 (0.7%) | 349 (3.3%) |
| $5,000 to $7,499 | 426 (3.8%) | 320 (3.0%) |
| $7,500 to $9,999 | 246 (2.2%) | 212 (2.0%) |
| $10,000 to $12,499 | 392 (3.5%) | 380 (3.6%) |
| $12,500 to $14,999 | 196 (1.7%) | 266 (2.5%) |
| $15,000 to $17,499 | 383 (3.4%) | 350 (3.3%) |
| $17,500 to $19,999 | 291 (2.6%) | 298 (2.8%) |
| $20,000 to $22,499 | 346 (3.0%) | 563 (5.3%) |
| $22,500 to $24,999 | 338 (3.0%) | 440 (4.2%) |
| $25,000 to $29,999 | 1,051 (9.3%) | 1,051 (9.9%) |
| $30,000 to $34,999 | 553 (4.9%) | 746 (7.0%) |
| $35,000 to $39,999 | 849 (7.5%) | 1,032 (9.7%) |
| $40,000 to $44,999 | 601 (5.3%) | 838 (7.9%) |
| $45,000 to $49,999 | 658 (5.8%) | 625 (5.9%) |
| $50,000 to $54,999 | 506 (4.5%) | 363 (3.4%) |
| $55,000 to $64,999 | 783 (6.9%) | 894 (8.4%) |
| $65,000 to $74,999 | 697 (6.1%) | 382 (3.6%) |
| $75,000 to $99,999 | 996 (8.8%) | 516 (4.9%) |
| $100,000+ | 1,606 (14.2%) | 424 (4.0%) |
| Total | 11,343 (100.0%) | 10,593 (100.0%) |
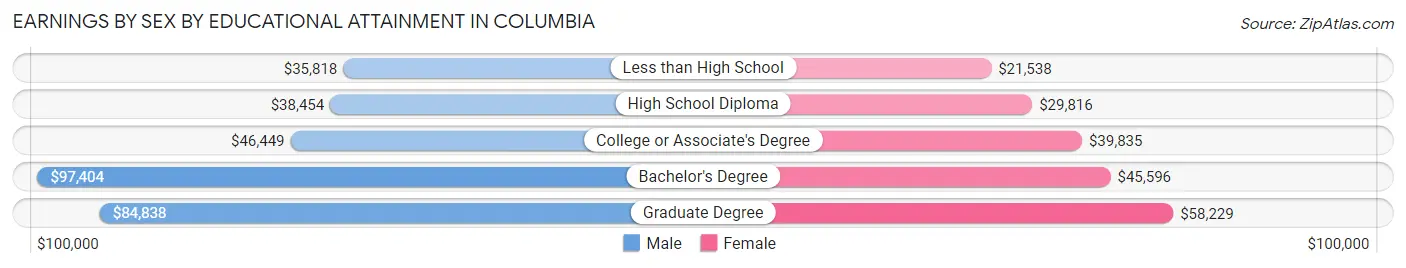
Earnings by Sex by Educational Attainment in Columbia
Average earnings in Columbia are $46,322 for men and $37,371 for women, a difference of 19.3%. Men with an educational attainment of bachelor's degree enjoy the highest average annual earnings of $97,404, while those with less than high school education earn the least with $35,818. Women with an educational attainment of graduate degree earn the most with the average annual earnings of $58,229, while those with less than high school education have the smallest earnings of $21,538.
| Educational Attainment | Male Income | Female Income |
| Less than High School | $35,818 | $21,538 |
| High School Diploma | $38,454 | $29,816 |
| College or Associate's Degree | $46,449 | $39,835 |
| Bachelor's Degree | $97,404 | $45,596 |
| Graduate Degree | $84,838 | $58,229 |
| Total | $46,322 | $37,371 |
Family Income in Columbia
Family Income Brackets in Columbia
According to the Columbia family income data, there are 2,083 families falling into the $75,000 to $99,999 income range, which is the most common income bracket and makes up 19.4% of all families. Conversely, the $10,000 to $14,999 income bracket is the least frequent group with only 311 families (2.9%) belonging to this category.
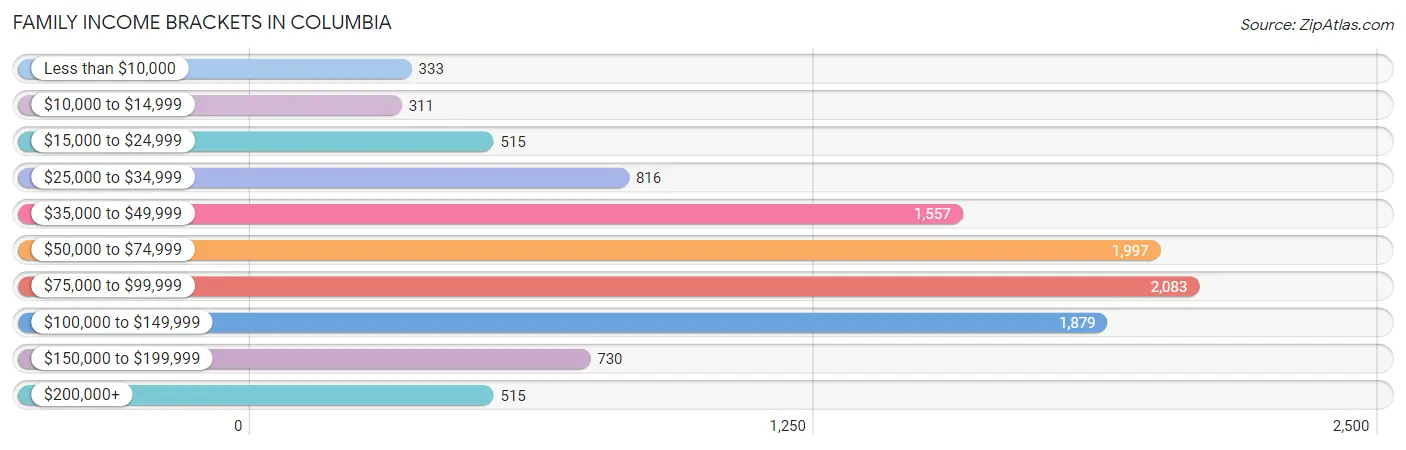
| Income Bracket | # Families | % Families |
| Less than $10,000 | 333 | 3.1% |
| $10,000 to $14,999 | 311 | 2.9% |
| $15,000 to $24,999 | 515 | 4.8% |
| $25,000 to $34,999 | 816 | 7.6% |
| $35,000 to $49,999 | 1,557 | 14.5% |
| $50,000 to $74,999 | 1,997 | 18.6% |
| $75,000 to $99,999 | 2,083 | 19.4% |
| $100,000 to $149,999 | 1,879 | 17.5% |
| $150,000 to $199,999 | 730 | 6.8% |
| $200,000+ | 515 | 4.8% |
Family Income by Famaliy Size in Columbia
6-person families (187 | 1.7%) account for the highest median family income in Columbia with $113,274 per family, while 2-person families (4,949 | 46.1%) have the highest median income of $28,967 per family member.
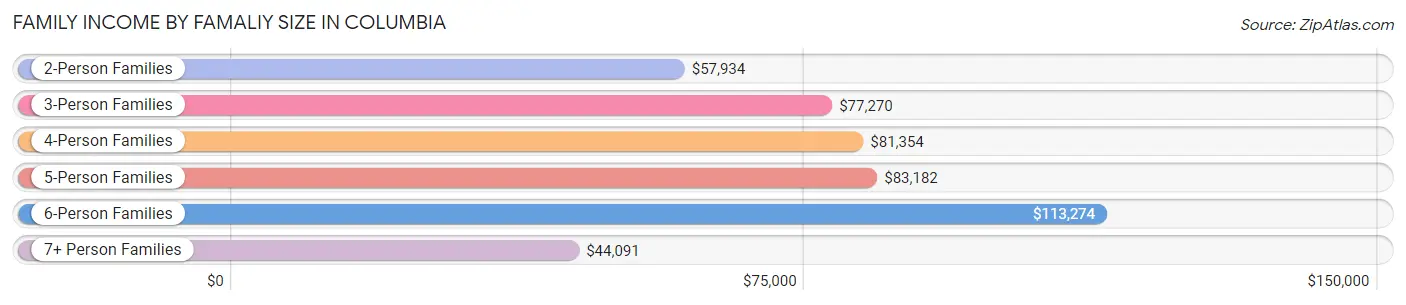
| Income Bracket | # Families | Median Income |
| 2-Person Families | 4,949 (46.1%) | $57,934 |
| 3-Person Families | 2,292 (21.3%) | $77,270 |
| 4-Person Families | 2,162 (20.1%) | $81,354 |
| 5-Person Families | 1,064 (9.9%) | $83,182 |
| 6-Person Families | 187 (1.7%) | $113,274 |
| 7+ Person Families | 84 (0.8%) | $44,091 |
| Total | 10,738 (100.0%) | $72,745 |
Family Income by Number of Earners in Columbia
The median family income in Columbia is $72,745, with families comprising 2 earners (3,989) having the highest median family income of $94,339, while families with no earners (1,175) have the lowest median family income of $40,313, accounting for 37.1% and 10.9% of families, respectively.
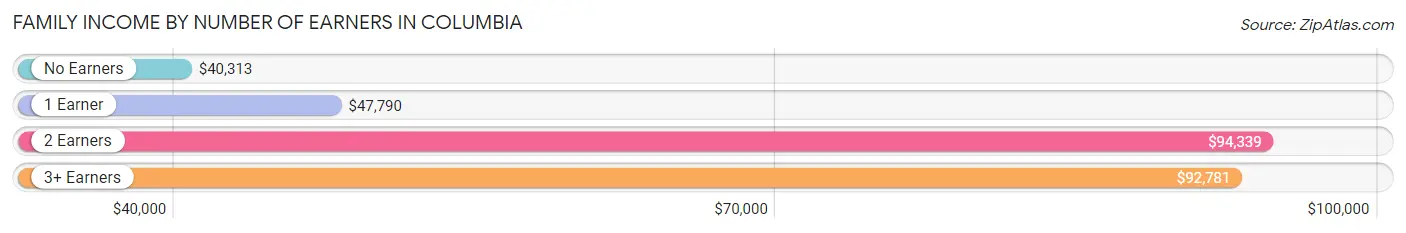
| Number of Earners | # Families | Median Income |
| No Earners | 1,175 (10.9%) | $40,313 |
| 1 Earner | 4,477 (41.7%) | $47,790 |
| 2 Earners | 3,989 (37.1%) | $94,339 |
| 3+ Earners | 1,097 (10.2%) | $92,781 |
| Total | 10,738 (100.0%) | $72,745 |
Household Income in Columbia
Household Income Brackets in Columbia
With 3,289 households falling in the category, the $50,000 to $74,999 income range is the most frequent in Columbia, accounting for 19.3% of all households. In contrast, only 579 households (3.4%) fall into the $10,000 to $14,999 income bracket, making it the least populous group.
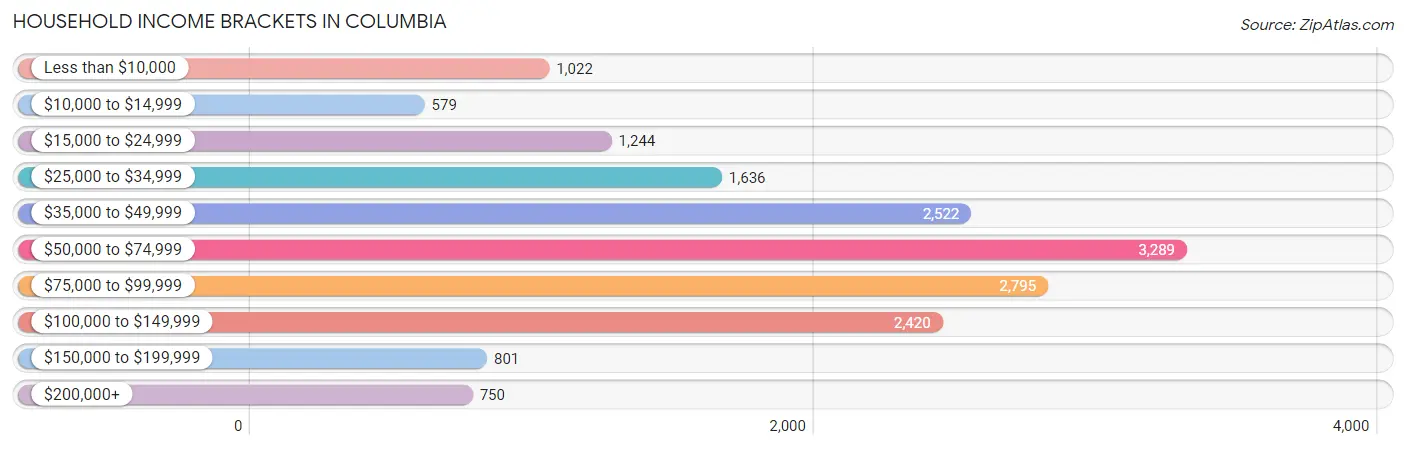
| Income Bracket | # Households | % Households |
| Less than $10,000 | 1,022 | 6.0% |
| $10,000 to $14,999 | 579 | 3.4% |
| $15,000 to $24,999 | 1,244 | 7.3% |
| $25,000 to $34,999 | 1,636 | 9.6% |
| $35,000 to $49,999 | 2,522 | 14.8% |
| $50,000 to $74,999 | 3,289 | 19.3% |
| $75,000 to $99,999 | 2,795 | 16.4% |
| $100,000 to $149,999 | 2,420 | 14.2% |
| $150,000 to $199,999 | 801 | 4.7% |
| $200,000+ | 750 | 4.4% |
Household Income by Householder Age in Columbia
The median household income in Columbia is $58,110, with the highest median household income of $73,511 found in the 25 to 44 years age bracket for the primary householder. A total of 6,211 households (36.4%) fall into this category. Meanwhile, the 65+ years age bracket for the primary householder has the lowest median household income of $41,724, with 4,329 households (25.4%) in this group.
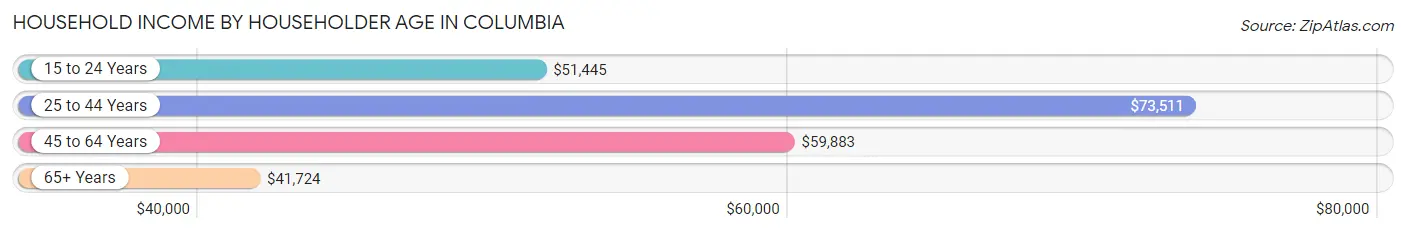
| Income Bracket | # Households | Median Income |
| 15 to 24 Years | 938 (5.5%) | $51,445 |
| 25 to 44 Years | 6,211 (36.4%) | $73,511 |
| 45 to 64 Years | 5,563 (32.6%) | $59,883 |
| 65+ Years | 4,329 (25.4%) | $41,724 |
| Total | 17,041 (100.0%) | $58,110 |
Poverty in Columbia
Income Below Poverty by Sex and Age in Columbia
With 10.4% poverty level for males and 14.4% for females among the residents of Columbia, under 5 year old males and 5 year old females are the most vulnerable to poverty, with 371 males (24.4%) and 45 females (45.5%) in their respective age groups living below the poverty level.
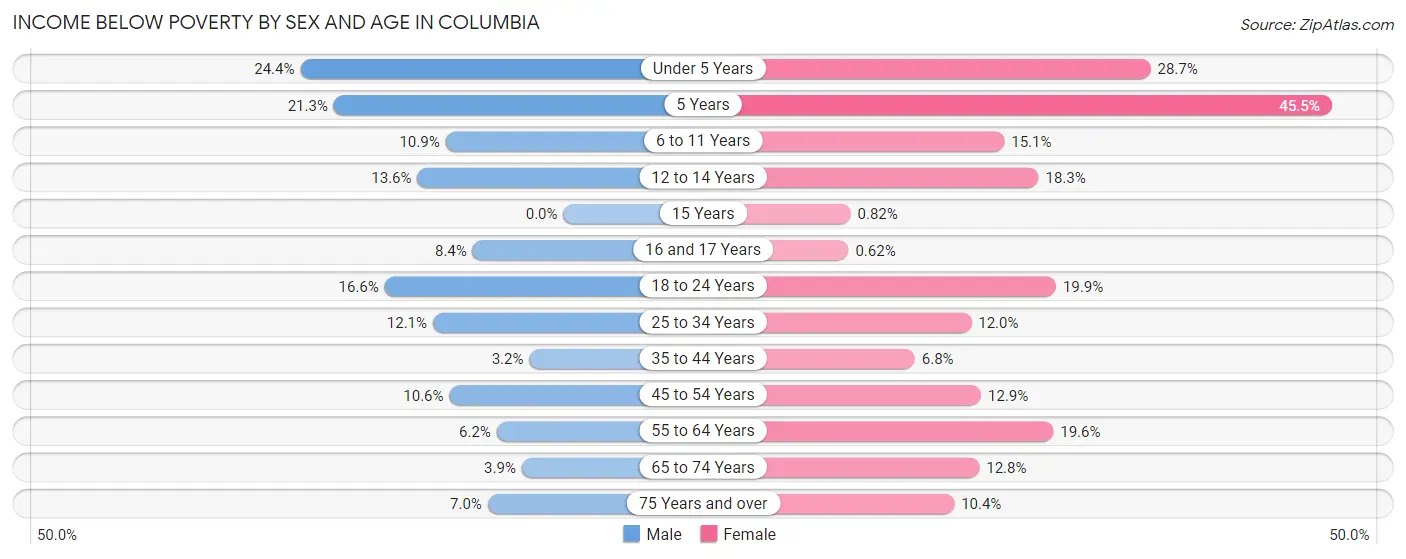
| Age Bracket | Male | Female |
| Under 5 Years | 371 (24.4%) | 450 (28.7%) |
| 5 Years | 62 (21.3%) | 45 (45.5%) |
| 6 to 11 Years | 172 (10.9%) | 238 (15.1%) |
| 12 to 14 Years | 118 (13.6%) | 249 (18.3%) |
| 15 Years | 0 (0.0%) | 3 (0.8%) |
| 16 and 17 Years | 55 (8.4%) | 3 (0.6%) |
| 18 to 24 Years | 323 (16.6%) | 338 (19.9%) |
| 25 to 34 Years | 341 (12.1%) | 424 (12.0%) |
| 35 to 44 Years | 88 (3.2%) | 193 (6.8%) |
| 45 to 54 Years | 224 (10.6%) | 299 (12.9%) |
| 55 to 64 Years | 128 (6.2%) | 514 (19.6%) |
| 65 to 74 Years | 64 (3.9%) | 255 (12.8%) |
| 75 Years and over | 65 (7.0%) | 178 (10.4%) |
| Total | 2,011 (10.4%) | 3,189 (14.4%) |
Income Above Poverty by Sex and Age in Columbia
According to the poverty statistics in Columbia, males aged 15 years and females aged 16 and 17 years are the age groups that are most secure financially, with 100.0% of males and 99.4% of females in these age groups living above the poverty line.
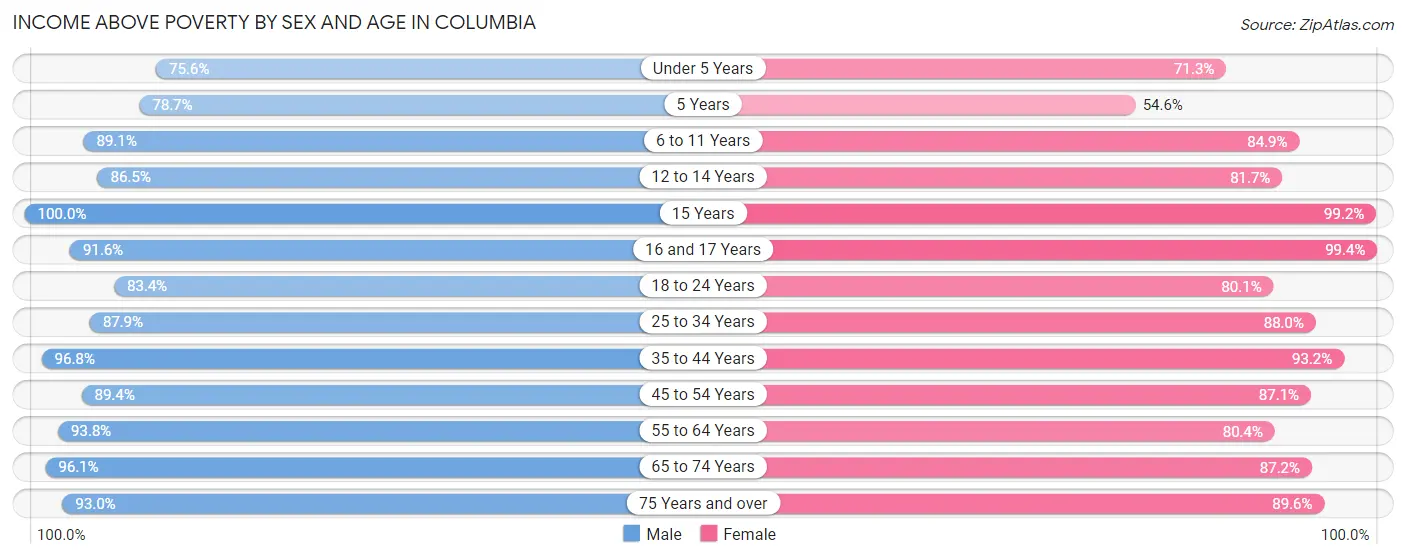
| Age Bracket | Male | Female |
| Under 5 Years | 1,149 (75.6%) | 1,120 (71.3%) |
| 5 Years | 229 (78.7%) | 54 (54.5%) |
| 6 to 11 Years | 1,400 (89.1%) | 1,340 (84.9%) |
| 12 to 14 Years | 753 (86.5%) | 1,115 (81.7%) |
| 15 Years | 144 (100.0%) | 365 (99.2%) |
| 16 and 17 Years | 598 (91.6%) | 477 (99.4%) |
| 18 to 24 Years | 1,624 (83.4%) | 1,362 (80.1%) |
| 25 to 34 Years | 2,475 (87.9%) | 3,103 (88.0%) |
| 35 to 44 Years | 2,694 (96.8%) | 2,653 (93.2%) |
| 45 to 54 Years | 1,894 (89.4%) | 2,013 (87.1%) |
| 55 to 64 Years | 1,939 (93.8%) | 2,105 (80.4%) |
| 65 to 74 Years | 1,592 (96.1%) | 1,743 (87.2%) |
| 75 Years and over | 861 (93.0%) | 1,529 (89.6%) |
| Total | 17,352 (89.6%) | 18,979 (85.6%) |
Income Below Poverty Among Married-Couple Families in Columbia
The poverty statistics for married-couple families in Columbia show that 2.5% or 173 of the total 6,813 families live below the poverty line. Families with no children have the highest poverty rate of 3.6%, comprising of 137 families. On the other hand, families with 5 or more children have the lowest poverty rate of 0.0%, which includes 0 families.
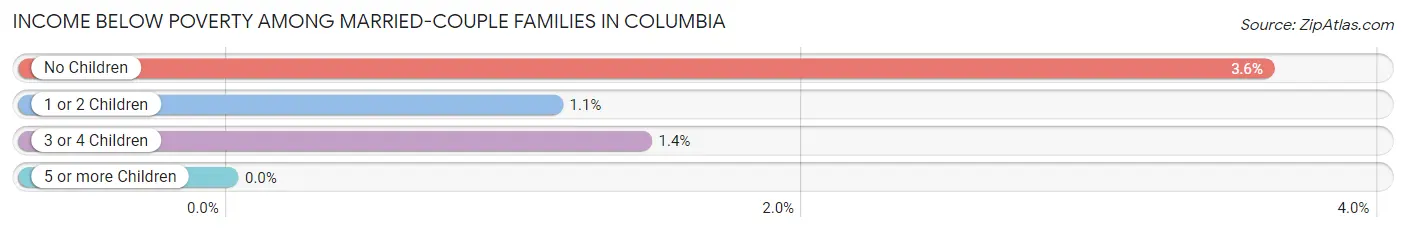
| Children | Above Poverty | Below Poverty |
| No Children | 3,659 (96.4%) | 137 (3.6%) |
| 1 or 2 Children | 2,091 (98.9%) | 24 (1.1%) |
| 3 or 4 Children | 824 (98.6%) | 12 (1.4%) |
| 5 or more Children | 66 (100.0%) | 0 (0.0%) |
| Total | 6,640 (97.5%) | 173 (2.5%) |
Income Below Poverty Among Single-Parent Households in Columbia
According to the poverty data in Columbia, 30.3% or 278 single-father households and 21.1% or 635 single-mother households are living below the poverty line. Among single-father households, those with 1 or 2 children have the highest poverty rate, with 160 households (40.2%) experiencing poverty. Likewise, among single-mother households, those with 3 or 4 children have the highest poverty rate, with 256 households (68.4%) falling below the poverty line.
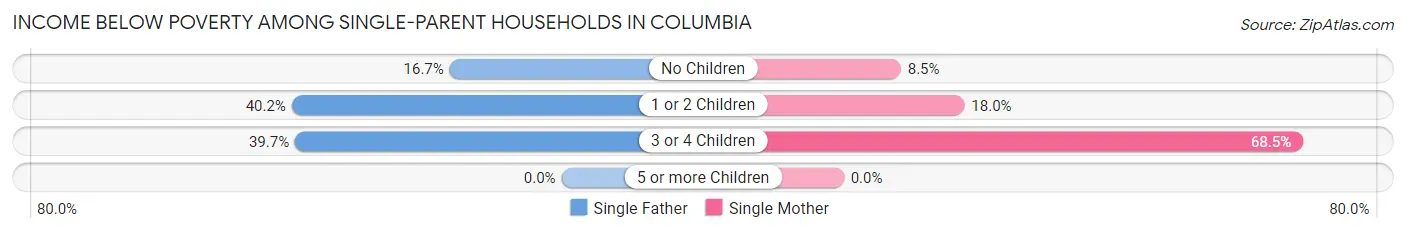
| Children | Single Father | Single Mother |
| No Children | 64 (16.7%) | 85 (8.5%) |
| 1 or 2 Children | 160 (40.2%) | 294 (18.0%) |
| 3 or 4 Children | 54 (39.7%) | 256 (68.4%) |
| 5 or more Children | 0 (0.0%) | 0 (0.0%) |
| Total | 278 (30.3%) | 635 (21.1%) |
Income Below Poverty Among Married-Couple vs Single-Parent Households in Columbia
The poverty data for Columbia shows that 173 of the married-couple family households (2.5%) and 913 of the single-parent households (23.3%) are living below the poverty level. Within the married-couple family households, those with no children have the highest poverty rate, with 137 households (3.6%) falling below the poverty line. Among the single-parent households, those with 3 or 4 children have the highest poverty rate, with 310 household (60.8%) living below poverty.
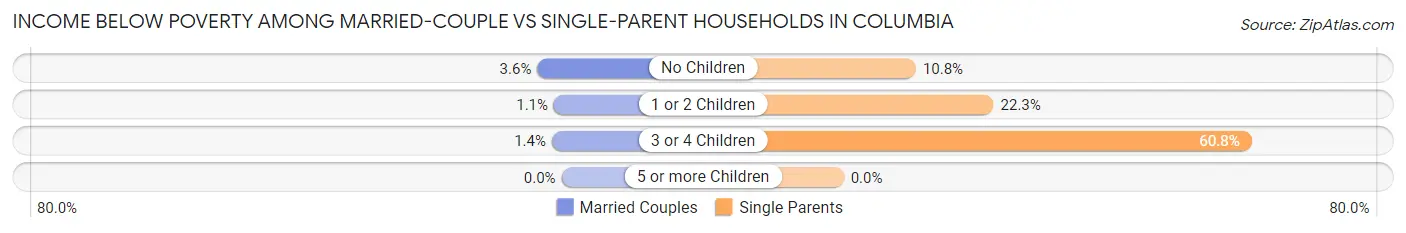
| Children | Married-Couple Families | Single-Parent Households |
| No Children | 137 (3.6%) | 149 (10.8%) |
| 1 or 2 Children | 24 (1.1%) | 454 (22.3%) |
| 3 or 4 Children | 12 (1.4%) | 310 (60.8%) |
| 5 or more Children | 0 (0.0%) | 0 (0.0%) |
| Total | 173 (2.5%) | 913 (23.3%) |
Race in Columbia
The most populous races in Columbia are White / Caucasian (31,162 | 73.4%), Black / African American (7,274 | 17.1%), and Hispanic or Latino (4,111 | 9.7%).
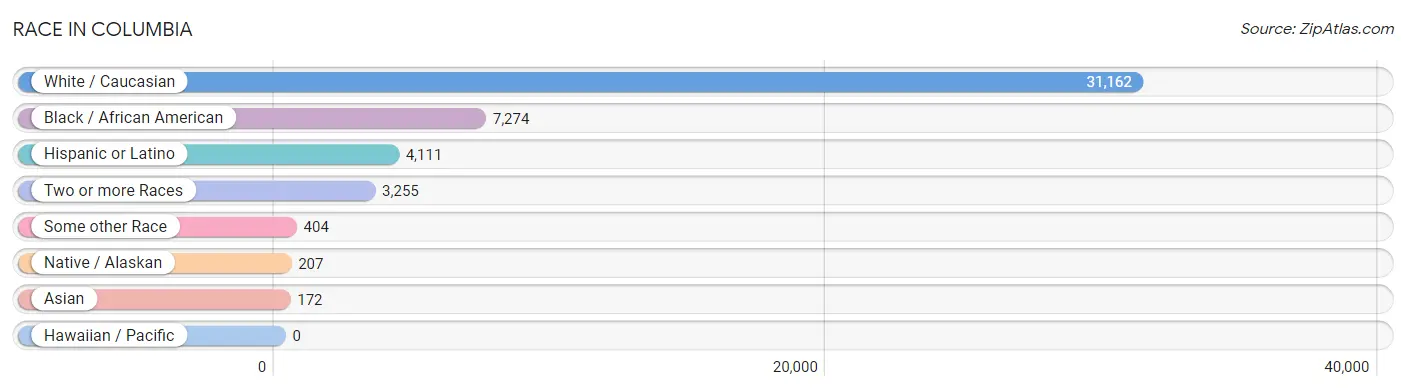
| Race | # Population | % Population |
| Asian | 172 | 0.4% |
| Black / African American | 7,274 | 17.1% |
| Hawaiian / Pacific | 0 | 0.0% |
| Hispanic or Latino | 4,111 | 9.7% |
| Native / Alaskan | 207 | 0.5% |
| White / Caucasian | 31,162 | 73.4% |
| Two or more Races | 3,255 | 7.7% |
| Some other Race | 404 | 0.9% |
| Total | 42,474 | 100.0% |
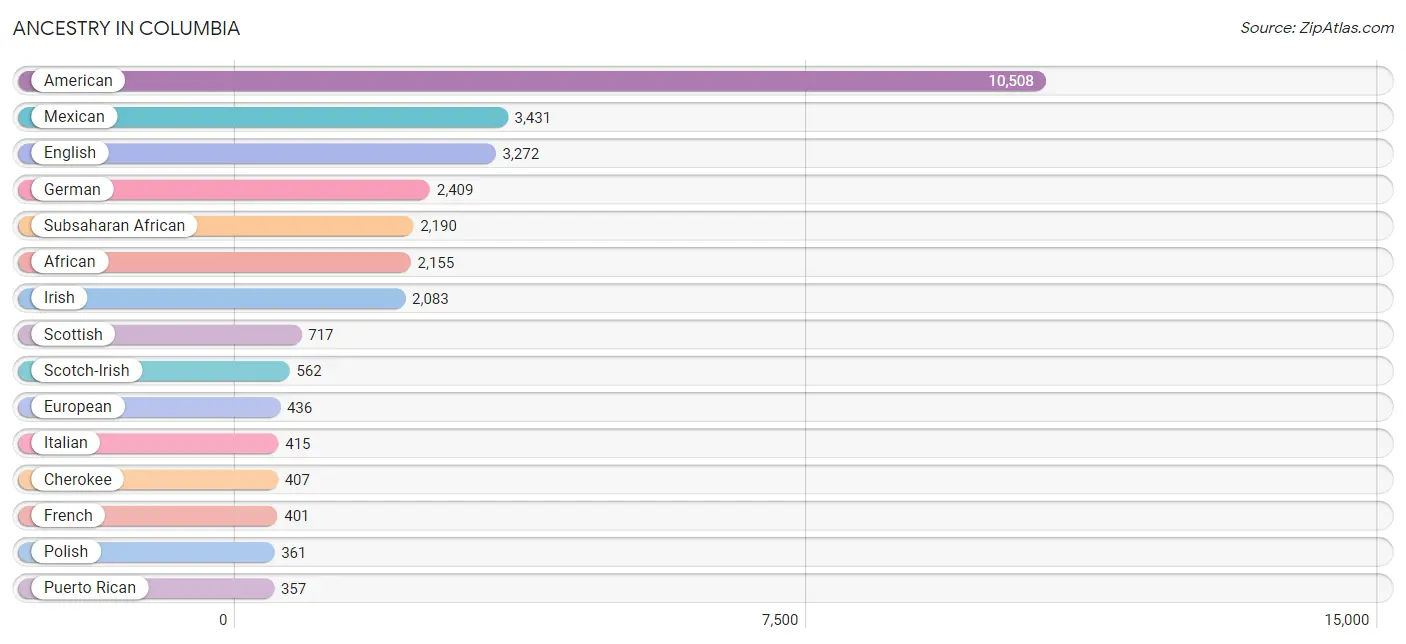
Ancestry in Columbia
The most populous ancestries reported in Columbia are American (10,508 | 24.7%), Mexican (3,431 | 8.1%), English (3,272 | 7.7%), German (2,409 | 5.7%), and Subsaharan African (2,190 | 5.2%), together accounting for 51.3% of all Columbia residents.
| Ancestry | # Population | % Population |
| African | 2,155 | 5.1% |
| American | 10,508 | 24.7% |
| Arab | 101 | 0.2% |
| Austrian | 7 | 0.0% |
| Bhutanese | 43 | 0.1% |
| Blackfeet | 85 | 0.2% |
| Bolivian | 22 | 0.1% |
| Brazilian | 11 | 0.0% |
| British | 185 | 0.4% |
| Burmese | 17 | 0.0% |
| Canadian | 29 | 0.1% |
| Central American | 13 | 0.0% |
| Central American Indian | 15 | 0.0% |
| Cherokee | 407 | 1.0% |
| Colombian | 97 | 0.2% |
| Comanche | 5 | 0.0% |
| Cuban | 16 | 0.0% |
| Czech | 52 | 0.1% |
| Danish | 67 | 0.2% |
| Dominican | 55 | 0.1% |
| Dutch | 259 | 0.6% |
| Egyptian | 35 | 0.1% |
| English | 3,272 | 7.7% |
| European | 436 | 1.0% |
| French | 401 | 0.9% |
| French American Indian | 46 | 0.1% |
| French Canadian | 171 | 0.4% |
| German | 2,409 | 5.7% |
| Hungarian | 163 | 0.4% |
| Indian (Asian) | 63 | 0.2% |
| Irish | 2,083 | 4.9% |
| Italian | 415 | 1.0% |
| Jamaican | 43 | 0.1% |
| Korean | 16 | 0.0% |
| Lebanese | 20 | 0.1% |
| Lithuanian | 9 | 0.0% |
| Mexican | 3,431 | 8.1% |
| Mexican American Indian | 15 | 0.0% |
| Moroccan | 20 | 0.1% |
| Nicaraguan | 13 | 0.0% |
| Northern European | 8 | 0.0% |
| Norwegian | 91 | 0.2% |
| Osage | 37 | 0.1% |
| Polish | 361 | 0.9% |
| Portuguese | 49 | 0.1% |
| Puerto Rican | 357 | 0.8% |
| Russian | 52 | 0.1% |
| Scandinavian | 224 | 0.5% |
| Scotch-Irish | 562 | 1.3% |
| Scottish | 717 | 1.7% |
| Slavic | 12 | 0.0% |
| Slovak | 21 | 0.1% |
| South American | 198 | 0.5% |
| South American Indian | 37 | 0.1% |
| Spanish | 12 | 0.0% |
| Subsaharan African | 2,190 | 5.2% |
| Swedish | 153 | 0.4% |
| Swiss | 10 | 0.0% |
| Thai | 15 | 0.0% |
| Ukrainian | 29 | 0.1% |
| Uruguayan | 37 | 0.1% |
| Venezuelan | 42 | 0.1% |
| Welsh | 64 | 0.2% | View All 63 Rows |
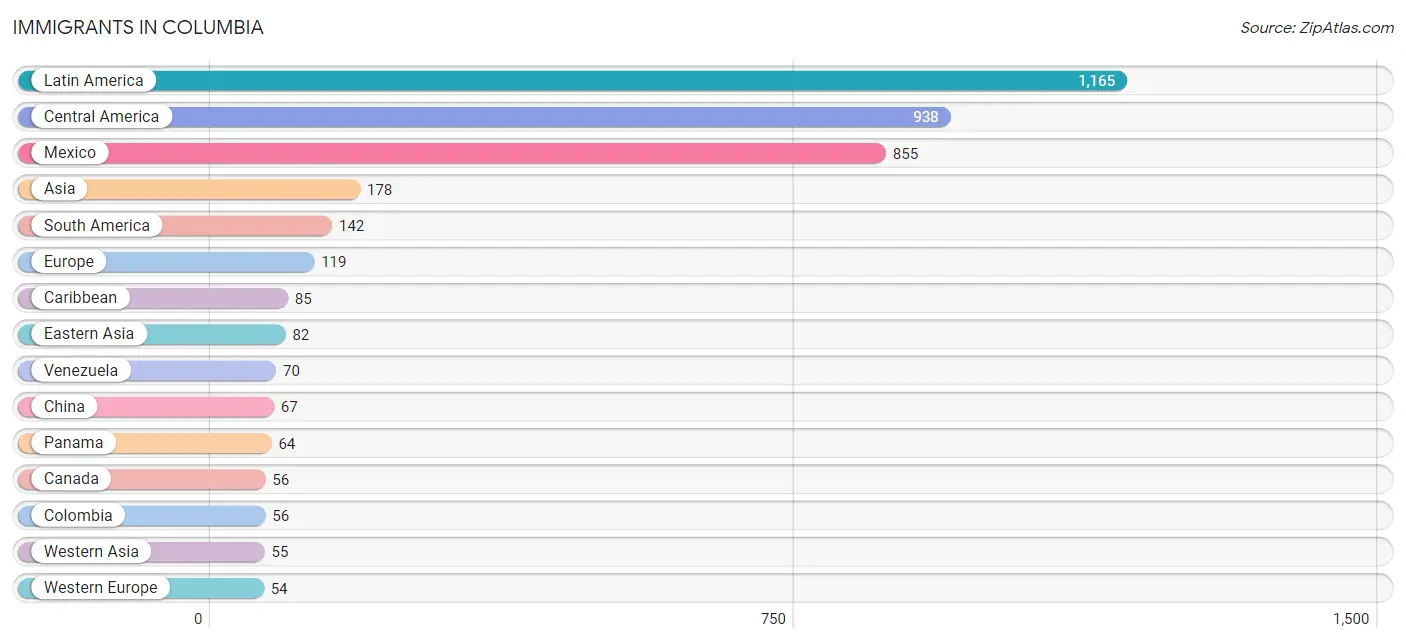
Immigrants in Columbia
The most numerous immigrant groups reported in Columbia came from Latin America (1,165 | 2.7%), Central America (938 | 2.2%), Mexico (855 | 2.0%), Asia (178 | 0.4%), and South America (142 | 0.3%), together accounting for 7.7% of all Columbia residents.
| Immigration Origin | # Population | % Population |
| Africa | 25 | 0.1% |
| Asia | 178 | 0.4% |
| Belgium | 1 | 0.0% |
| Brazil | 11 | 0.0% |
| Canada | 56 | 0.1% |
| Caribbean | 85 | 0.2% |
| Central America | 938 | 2.2% |
| China | 67 | 0.2% |
| Colombia | 56 | 0.1% |
| Cuba | 16 | 0.0% |
| Dominican Republic | 26 | 0.1% |
| Eastern Asia | 82 | 0.2% |
| Eastern Europe | 29 | 0.1% |
| Egypt | 25 | 0.1% |
| El Salvador | 6 | 0.0% |
| Europe | 119 | 0.3% |
| Germany | 53 | 0.1% |
| India | 14 | 0.0% |
| Iraq | 10 | 0.0% |
| Israel | 45 | 0.1% |
| Jamaica | 43 | 0.1% |
| Japan | 15 | 0.0% |
| Latin America | 1,165 | 2.7% |
| Mexico | 855 | 2.0% |
| Nicaragua | 13 | 0.0% |
| Northern Africa | 25 | 0.1% |
| Northern Europe | 36 | 0.1% |
| Pakistan | 10 | 0.0% |
| Panama | 64 | 0.2% |
| Philippines | 16 | 0.0% |
| Scotland | 36 | 0.1% |
| South America | 142 | 0.3% |
| South Central Asia | 24 | 0.1% |
| South Eastern Asia | 17 | 0.0% |
| Thailand | 1 | 0.0% |
| Ukraine | 29 | 0.1% |
| Uruguay | 5 | 0.0% |
| Venezuela | 70 | 0.2% |
| Western Asia | 55 | 0.1% |
| Western Europe | 54 | 0.1% | View All 40 Rows |
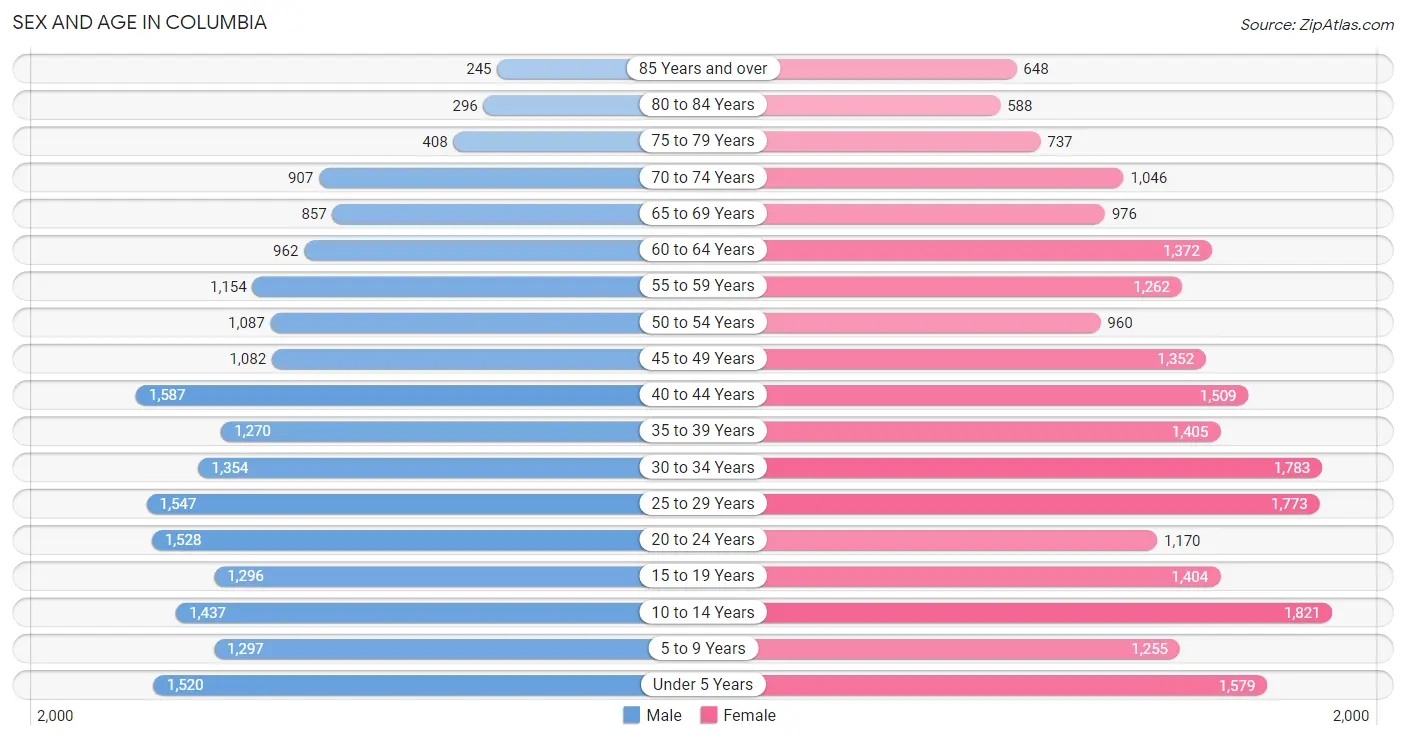
Sex and Age in Columbia
Sex and Age in Columbia
The most populous age groups in Columbia are 40 to 44 Years (1,587 | 8.0%) for men and 10 to 14 Years (1,821 | 8.0%) for women.
| Age Bracket | Male | Female |
| Under 5 Years | 1,520 (7.7%) | 1,579 (7.0%) |
| 5 to 9 Years | 1,297 (6.5%) | 1,255 (5.5%) |
| 10 to 14 Years | 1,437 (7.2%) | 1,821 (8.0%) |
| 15 to 19 Years | 1,296 (6.5%) | 1,404 (6.2%) |
| 20 to 24 Years | 1,528 (7.7%) | 1,170 (5.2%) |
| 25 to 29 Years | 1,547 (7.8%) | 1,773 (7.8%) |
| 30 to 34 Years | 1,354 (6.8%) | 1,783 (7.9%) |
| 35 to 39 Years | 1,270 (6.4%) | 1,405 (6.2%) |
| 40 to 44 Years | 1,587 (8.0%) | 1,509 (6.7%) |
| 45 to 49 Years | 1,082 (5.5%) | 1,352 (6.0%) |
| 50 to 54 Years | 1,087 (5.5%) | 960 (4.2%) |
| 55 to 59 Years | 1,154 (5.8%) | 1,262 (5.6%) |
| 60 to 64 Years | 962 (4.9%) | 1,372 (6.1%) |
| 65 to 69 Years | 857 (4.3%) | 976 (4.3%) |
| 70 to 74 Years | 907 (4.6%) | 1,046 (4.6%) |
| 75 to 79 Years | 408 (2.1%) | 737 (3.3%) |
| 80 to 84 Years | 296 (1.5%) | 588 (2.6%) |
| 85 Years and over | 245 (1.2%) | 648 (2.9%) |
| Total | 19,834 (100.0%) | 22,640 (100.0%) |
Families and Households in Columbia
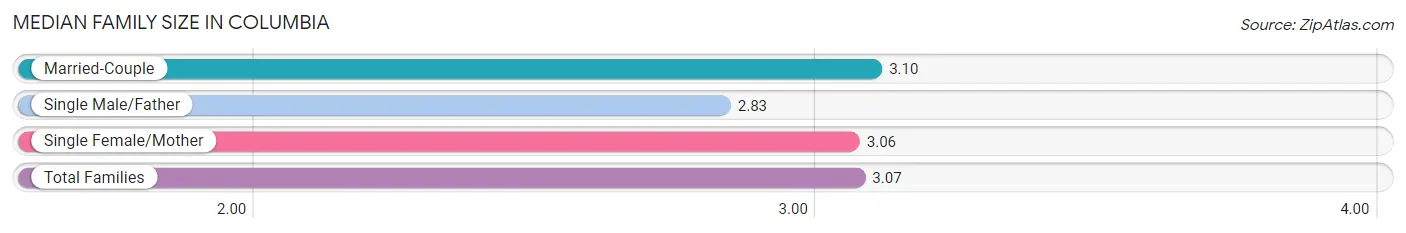
Median Family Size in Columbia
The median family size in Columbia is 3.07 persons per family, with married-couple families (6,813 | 63.4%) accounting for the largest median family size of 3.1 persons per family. On the other hand, single male/father families (918 | 8.6%) represent the smallest median family size with 2.83 persons per family.
| Family Type | # Families | Family Size |
| Married-Couple | 6,813 (63.4%) | 3.10 |
| Single Male/Father | 918 (8.6%) | 2.83 |
| Single Female/Mother | 3,007 (28.0%) | 3.06 |
| Total Families | 10,738 (100.0%) | 3.07 |
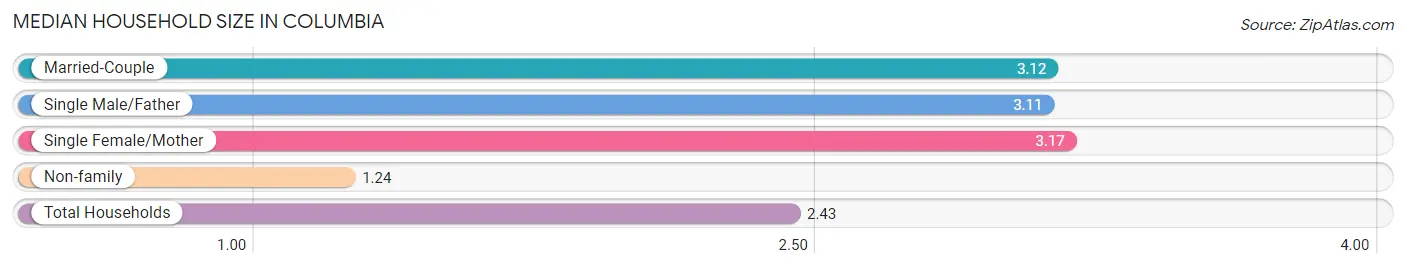
Median Household Size in Columbia
The median household size in Columbia is 2.43 persons per household, with single female/mother households (3,007 | 17.6%) accounting for the largest median household size of 3.17 persons per household. non-family households (6,303 | 37.0%) represent the smallest median household size with 1.24 persons per household.
| Household Type | # Households | Household Size |
| Married-Couple | 6,813 (40.0%) | 3.12 |
| Single Male/Father | 918 (5.4%) | 3.11 |
| Single Female/Mother | 3,007 (17.6%) | 3.17 |
| Non-family | 6,303 (37.0%) | 1.24 |
| Total Households | 17,041 (100.0%) | 2.43 |
Household Size by Marriage Status in Columbia
Out of a total of 17,041 households in Columbia, 10,738 (63.0%) are family households, while 6,303 (37.0%) are nonfamily households. The most numerous type of family households are 2-person households, comprising 4,584, and the most common type of nonfamily households are 1-person households, comprising 5,122.
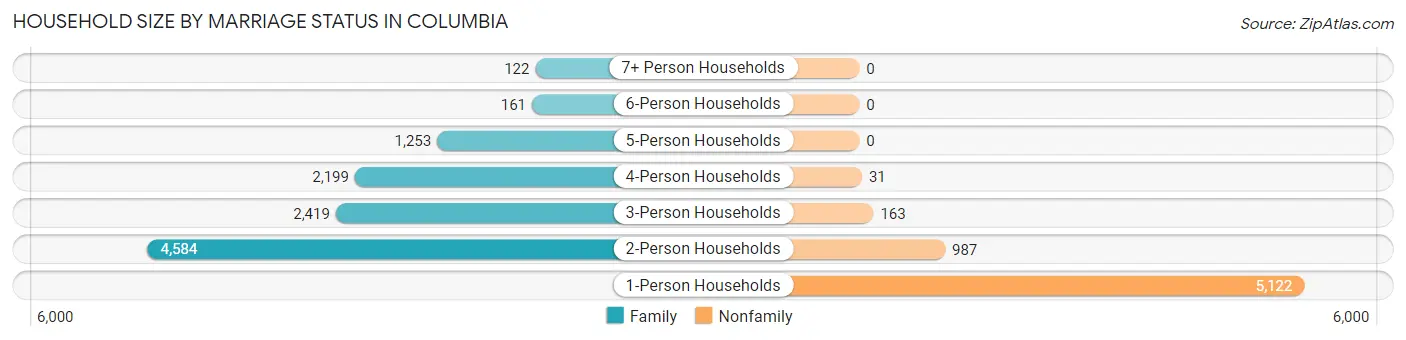
| Household Size | Family Households | Nonfamily Households |
| 1-Person Households | - | 5,122 (30.1%) |
| 2-Person Households | 4,584 (26.9%) | 987 (5.8%) |
| 3-Person Households | 2,419 (14.2%) | 163 (1.0%) |
| 4-Person Households | 2,199 (12.9%) | 31 (0.2%) |
| 5-Person Households | 1,253 (7.3%) | 0 (0.0%) |
| 6-Person Households | 161 (0.9%) | 0 (0.0%) |
| 7+ Person Households | 122 (0.7%) | 0 (0.0%) |
| Total | 10,738 (63.0%) | 6,303 (37.0%) |
Female Fertility in Columbia
Fertility by Age in Columbia
Average fertility rate in Columbia is 26.0 births per 1,000 women. Women in the age bracket of 20 to 34 years have the highest fertility rate with 56.0 births per 1,000 women. Women in the age bracket of 20 to 34 years acount for 92.9% of all women with births.
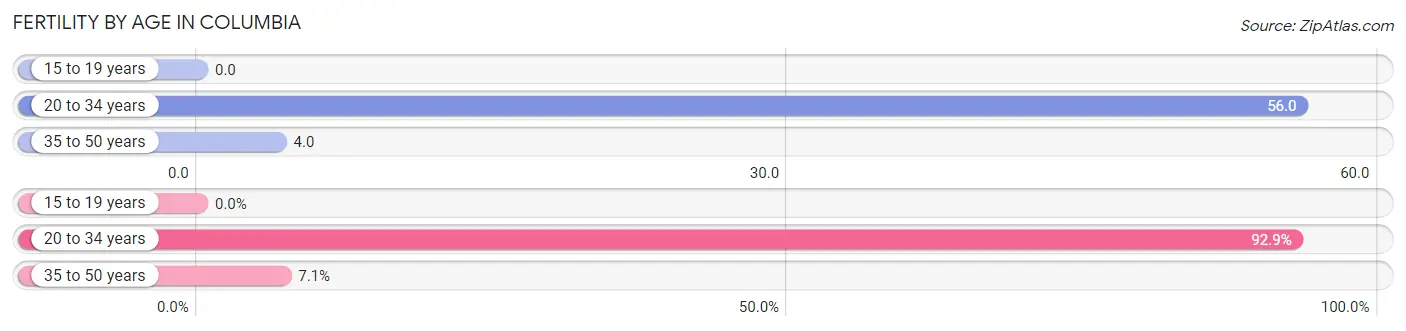
| Age Bracket | Women with Births | Births / 1,000 Women |
| 15 to 19 years | 0 (0.0%) | 0.0 |
| 20 to 34 years | 263 (92.9%) | 56.0 |
| 35 to 50 years | 20 (7.1%) | 4.0 |
| Total | 283 (100.0%) | 26.0 |
Fertility by Age by Marriage Status in Columbia
92.6% of women with births (283) in Columbia are married. The highest percentage of unmarried women with births falls into 35 to 50 years age bracket with 65.0% of them unmarried at the time of birth, while the lowest percentage of unmarried women with births belong to 20 to 34 years age bracket with 3.0% of them unmarried.
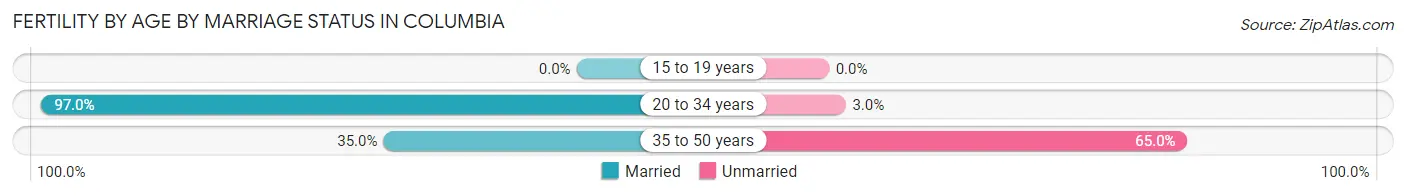
| Age Bracket | Married | Unmarried |
| 15 to 19 years | 0 (0.0%) | 0 (0.0%) |
| 20 to 34 years | 255 (97.0%) | 8 (3.0%) |
| 35 to 50 years | 7 (35.0%) | 13 (65.0%) |
| Total | 262 (92.6%) | 21 (7.4%) |
Fertility by Education in Columbia
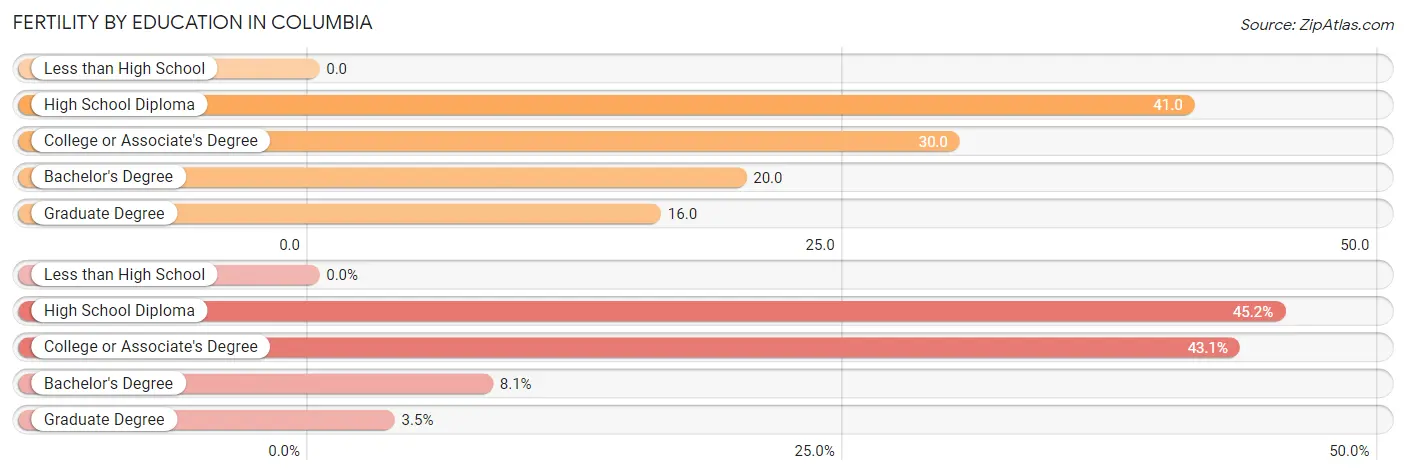
| Educational Attainment | Women with Births | Births / 1,000 Women |
| Less than High School | 0 (0.0%) | 0.0 |
| High School Diploma | 128 (45.2%) | 41.0 |
| College or Associate's Degree | 122 (43.1%) | 30.0 |
| Bachelor's Degree | 23 (8.1%) | 20.0 |
| Graduate Degree | 10 (3.5%) | 16.0 |
| Total | 283 (100.0%) | 26.0 |
Fertility by Education by Marriage Status in Columbia
7.4% of women with births in Columbia are unmarried. Women with the educational attainment of college or associate's degree are most likely to be married with 100.0% of them married at childbirth, while women with the educational attainment of bachelor's degree are least likely to be married with 56.5% of them unmarried at childbirth.
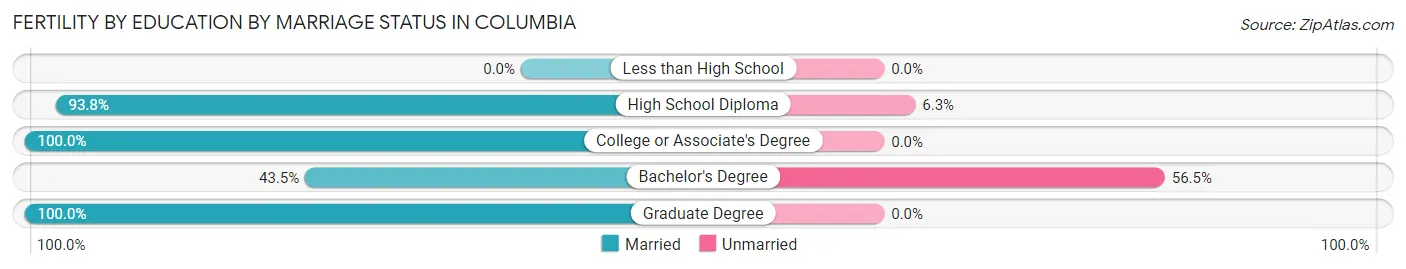
| Educational Attainment | Married | Unmarried |
| Less than High School | 0 (0.0%) | 0 (0.0%) |
| High School Diploma | 120 (93.8%) | 8 (6.2%) |
| College or Associate's Degree | 122 (100.0%) | 0 (0.0%) |
| Bachelor's Degree | 10 (43.5%) | 13 (56.5%) |
| Graduate Degree | 10 (100.0%) | 0 (0.0%) |
| Total | 262 (92.6%) | 21 (7.4%) |
Employment Characteristics in Columbia
Employment by Class of Employer in Columbia
Among the 20,252 employed individuals in Columbia, private company employees (15,374 | 75.9%), not-for-profit organizations (1,762 | 8.7%), and local government employees (1,259 | 6.2%) make up the most common classes of employment.
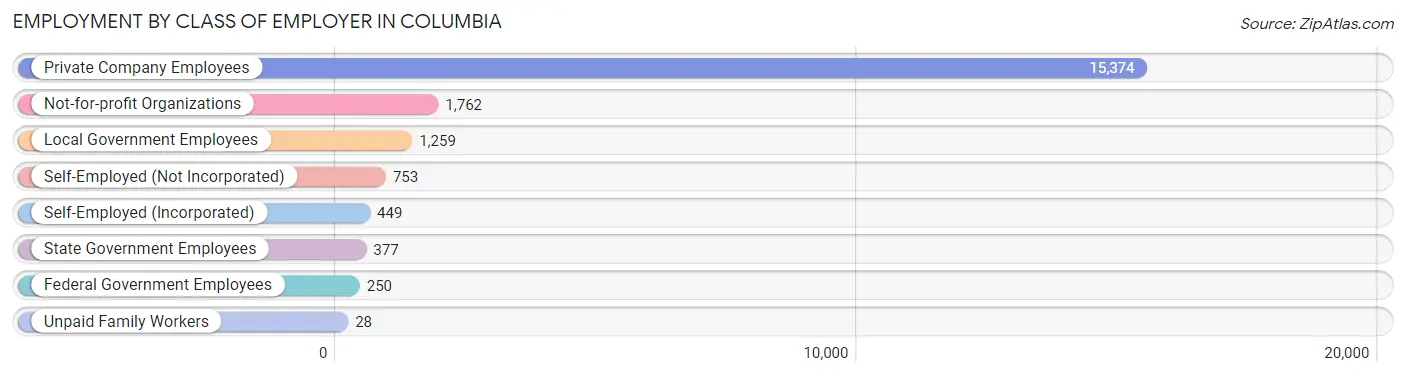
| Employer Class | # Employees | % Employees |
| Private Company Employees | 15,374 | 75.9% |
| Self-Employed (Incorporated) | 449 | 2.2% |
| Self-Employed (Not Incorporated) | 753 | 3.7% |
| Not-for-profit Organizations | 1,762 | 8.7% |
| Local Government Employees | 1,259 | 6.2% |
| State Government Employees | 377 | 1.9% |
| Federal Government Employees | 250 | 1.2% |
| Unpaid Family Workers | 28 | 0.1% |
| Total | 20,252 | 100.0% |
Employment Status by Age in Columbia
According to the labor force statistics for Columbia, out of the total population over 16 years of age (33,053), 64.4% or 21,286 individuals are in the labor force, with 3.4% or 724 of them unemployed. The age group with the highest labor force participation rate is 30 to 34 years, with 88.8% or 2,786 individuals in the labor force. Within the labor force, the 25 to 29 years age range has the highest percentage of unemployed individuals, with 5.4% or 140 of them being unemployed.
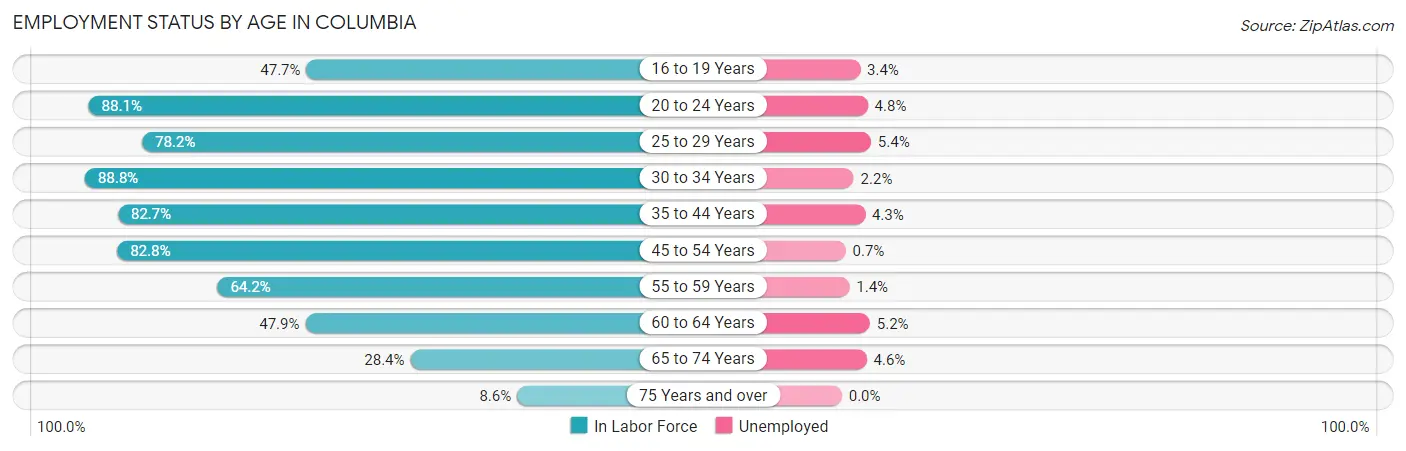
| Age Bracket | In Labor Force | Unemployed |
| 16 to 19 Years | 1,044 (47.7%) | 35 (3.4%) |
| 20 to 24 Years | 2,377 (88.1%) | 114 (4.8%) |
| 25 to 29 Years | 2,596 (78.2%) | 140 (5.4%) |
| 30 to 34 Years | 2,786 (88.8%) | 61 (2.2%) |
| 35 to 44 Years | 4,773 (82.7%) | 205 (4.3%) |
| 45 to 54 Years | 3,710 (82.8%) | 26 (0.7%) |
| 55 to 59 Years | 1,551 (64.2%) | 22 (1.4%) |
| 60 to 64 Years | 1,118 (47.9%) | 58 (5.2%) |
| 65 to 74 Years | 1,075 (28.4%) | 49 (4.6%) |
| 75 Years and over | 251 (8.6%) | 0 (0.0%) |
| Total | 21,286 (64.4%) | 724 (3.4%) |
Employment Status by Educational Attainment in Columbia
According to labor force statistics for Columbia, 77.0% of individuals (16,523) out of the total population between 25 and 64 years of age (21,459) are in the labor force, with 3.1% or 512 of them being unemployed. The group with the highest labor force participation rate are those with the educational attainment of bachelor's degree or higher, with 87.6% or 4,217 individuals in the labor force. Within the labor force, individuals with less than high school education have the highest percentage of unemployment, with 9.5% or 99 of them being unemployed.
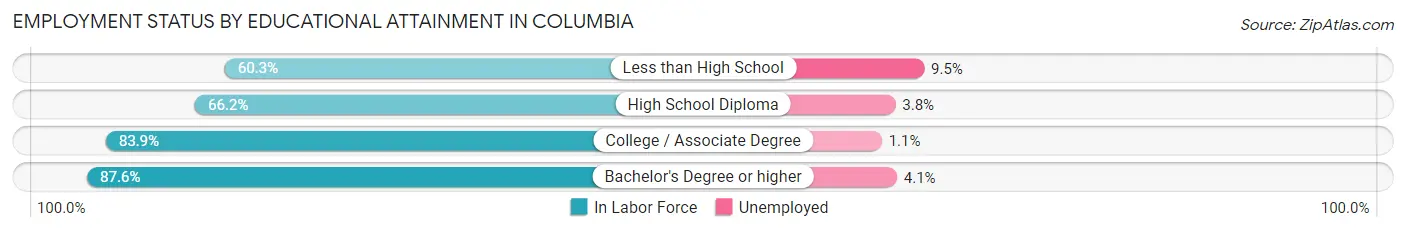
| Educational Attainment | In Labor Force | Unemployed |
| Less than High School | 1,043 (60.3%) | 164 (9.5%) |
| High School Diploma | 4,628 (66.2%) | 266 (3.8%) |
| College / Associate Degree | 6,649 (83.9%) | 87 (1.1%) |
| Bachelor's Degree or higher | 4,217 (87.6%) | 197 (4.1%) |
| Total | 16,523 (77.0%) | 665 (3.1%) |
Employment Occupations by Sex in Columbia
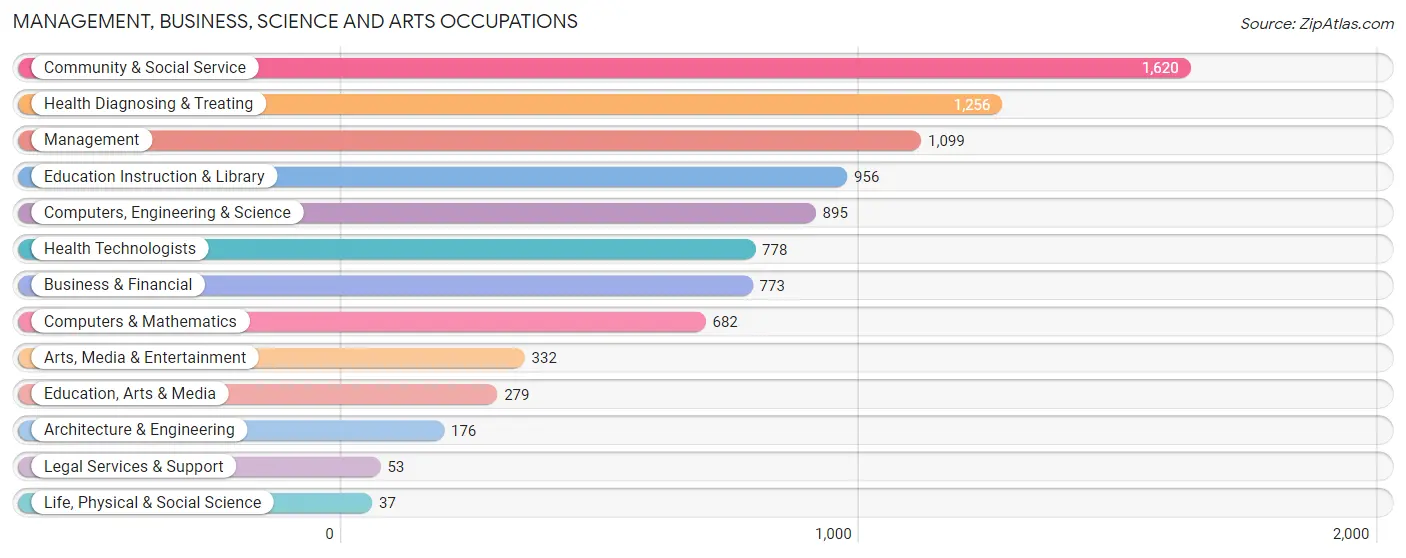
Management, Business, Science and Arts Occupations
The most common Management, Business, Science and Arts occupations in Columbia are Community & Social Service (1,620 | 7.9%), Health Diagnosing & Treating (1,256 | 6.1%), Management (1,099 | 5.3%), Education Instruction & Library (956 | 4.6%), and Computers, Engineering & Science (895 | 4.3%).
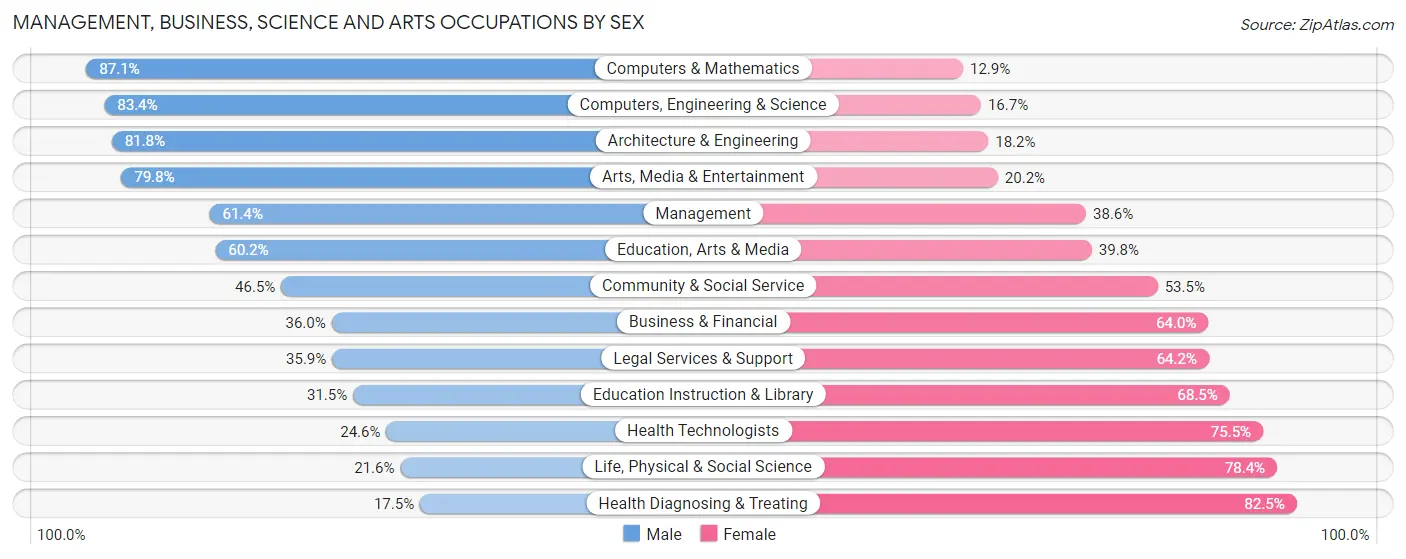
Management, Business, Science and Arts Occupations by Sex
Within the Management, Business, Science and Arts occupations in Columbia, the most male-oriented occupations are Computers & Mathematics (87.1%), Computers, Engineering & Science (83.4%), and Architecture & Engineering (81.8%), while the most female-oriented occupations are Health Diagnosing & Treating (82.5%), Life, Physical & Social Science (78.4%), and Health Technologists (75.4%).
| Occupation | Male | Female |
| Management | 675 (61.4%) | 424 (38.6%) |
| Business & Financial | 278 (36.0%) | 495 (64.0%) |
| Computers, Engineering & Science | 746 (83.4%) | 149 (16.7%) |
| Computers & Mathematics | 594 (87.1%) | 88 (12.9%) |
| Architecture & Engineering | 144 (81.8%) | 32 (18.2%) |
| Life, Physical & Social Science | 8 (21.6%) | 29 (78.4%) |
| Community & Social Service | 753 (46.5%) | 867 (53.5%) |
| Education, Arts & Media | 168 (60.2%) | 111 (39.8%) |
| Legal Services & Support | 19 (35.8%) | 34 (64.1%) |
| Education Instruction & Library | 301 (31.5%) | 655 (68.5%) |
| Arts, Media & Entertainment | 265 (79.8%) | 67 (20.2%) |
| Health Diagnosing & Treating | 220 (17.5%) | 1,036 (82.5%) |
| Health Technologists | 191 (24.5%) | 587 (75.4%) |
| Total (Category) | 2,672 (47.3%) | 2,971 (52.6%) |
| Total (Overall) | 10,717 (52.1%) | 9,848 (47.9%) |
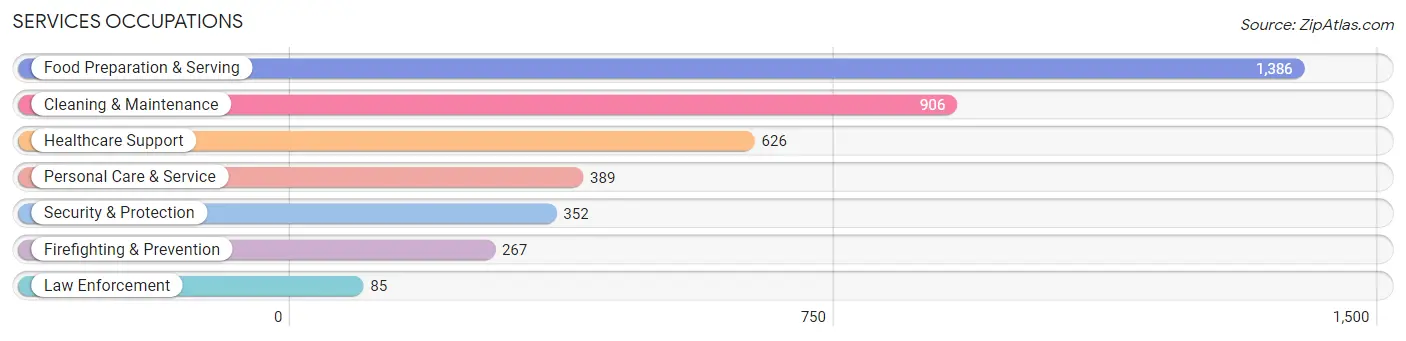
Services Occupations
The most common Services occupations in Columbia are Food Preparation & Serving (1,386 | 6.7%), Cleaning & Maintenance (906 | 4.4%), Healthcare Support (626 | 3.0%), Personal Care & Service (389 | 1.9%), and Security & Protection (352 | 1.7%).
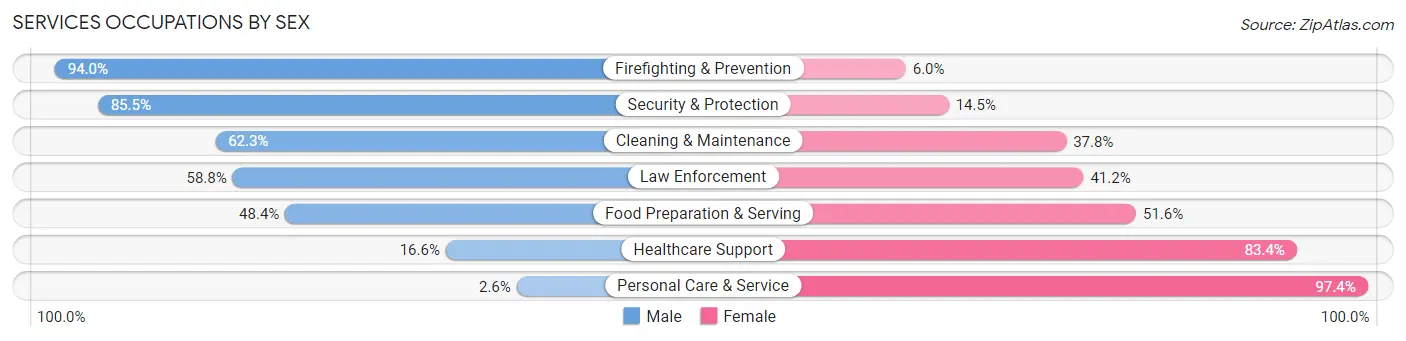
Services Occupations by Sex
Within the Services occupations in Columbia, the most male-oriented occupations are Firefighting & Prevention (94.0%), Security & Protection (85.5%), and Cleaning & Maintenance (62.3%), while the most female-oriented occupations are Personal Care & Service (97.4%), Healthcare Support (83.4%), and Food Preparation & Serving (51.6%).
| Occupation | Male | Female |
| Healthcare Support | 104 (16.6%) | 522 (83.4%) |
| Security & Protection | 301 (85.5%) | 51 (14.5%) |
| Firefighting & Prevention | 251 (94.0%) | 16 (6.0%) |
| Law Enforcement | 50 (58.8%) | 35 (41.2%) |
| Food Preparation & Serving | 671 (48.4%) | 715 (51.6%) |
| Cleaning & Maintenance | 564 (62.3%) | 342 (37.8%) |
| Personal Care & Service | 10 (2.6%) | 379 (97.4%) |
| Total (Category) | 1,650 (45.1%) | 2,009 (54.9%) |
| Total (Overall) | 10,717 (52.1%) | 9,848 (47.9%) |
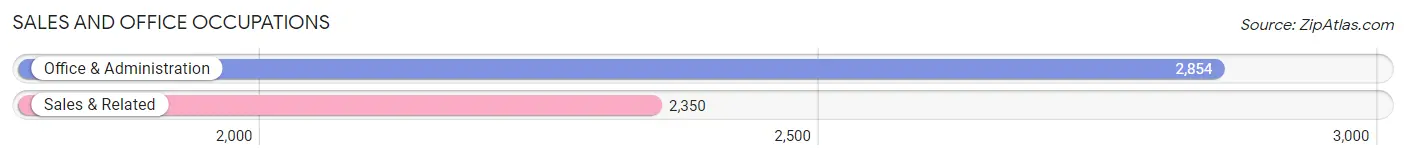
Sales and Office Occupations
The most common Sales and Office occupations in Columbia are Office & Administration (2,854 | 13.9%), and Sales & Related (2,350 | 11.4%).
Sales and Office Occupations by Sex
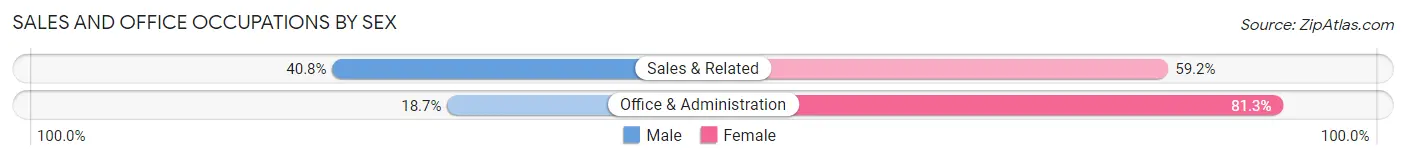
| Occupation | Male | Female |
| Sales & Related | 959 (40.8%) | 1,391 (59.2%) |
| Office & Administration | 534 (18.7%) | 2,320 (81.3%) |
| Total (Category) | 1,493 (28.7%) | 3,711 (71.3%) |
| Total (Overall) | 10,717 (52.1%) | 9,848 (47.9%) |
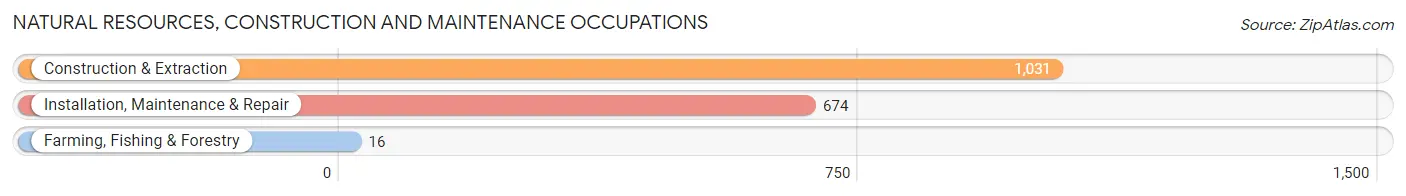
Natural Resources, Construction and Maintenance Occupations
The most common Natural Resources, Construction and Maintenance occupations in Columbia are Construction & Extraction (1,031 | 5.0%), Installation, Maintenance & Repair (674 | 3.3%), and Farming, Fishing & Forestry (16 | 0.1%).
Natural Resources, Construction and Maintenance Occupations by Sex
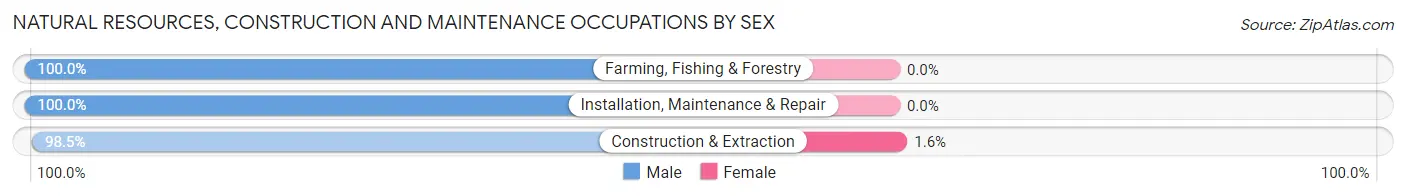
| Occupation | Male | Female |
| Farming, Fishing & Forestry | 16 (100.0%) | 0 (0.0%) |
| Construction & Extraction | 1,015 (98.5%) | 16 (1.5%) |
| Installation, Maintenance & Repair | 674 (100.0%) | 0 (0.0%) |
| Total (Category) | 1,705 (99.1%) | 16 (0.9%) |
| Total (Overall) | 10,717 (52.1%) | 9,848 (47.9%) |
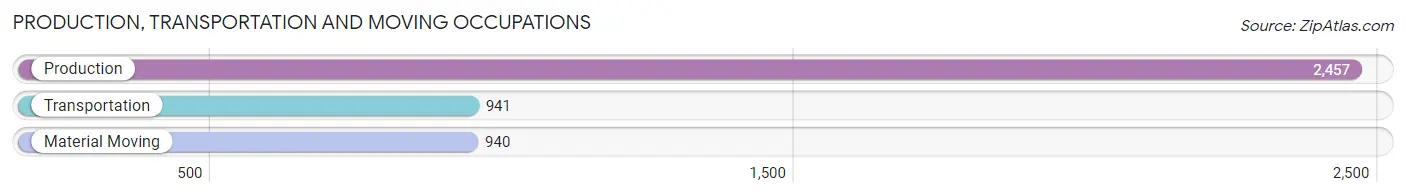
Production, Transportation and Moving Occupations
The most common Production, Transportation and Moving occupations in Columbia are Production (2,457 | 11.9%), Transportation (941 | 4.6%), and Material Moving (940 | 4.6%).
Production, Transportation and Moving Occupations by Sex
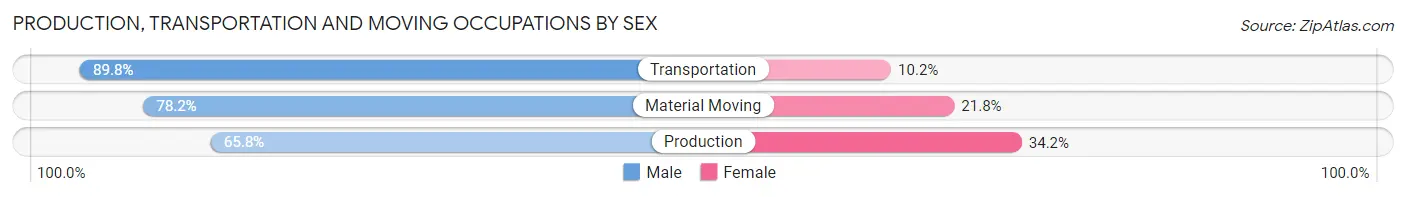
| Occupation | Male | Female |
| Production | 1,617 (65.8%) | 840 (34.2%) |
| Transportation | 845 (89.8%) | 96 (10.2%) |
| Material Moving | 735 (78.2%) | 205 (21.8%) |
| Total (Category) | 3,197 (73.7%) | 1,141 (26.3%) |
| Total (Overall) | 10,717 (52.1%) | 9,848 (47.9%) |
Employment Industries by Sex in Columbia
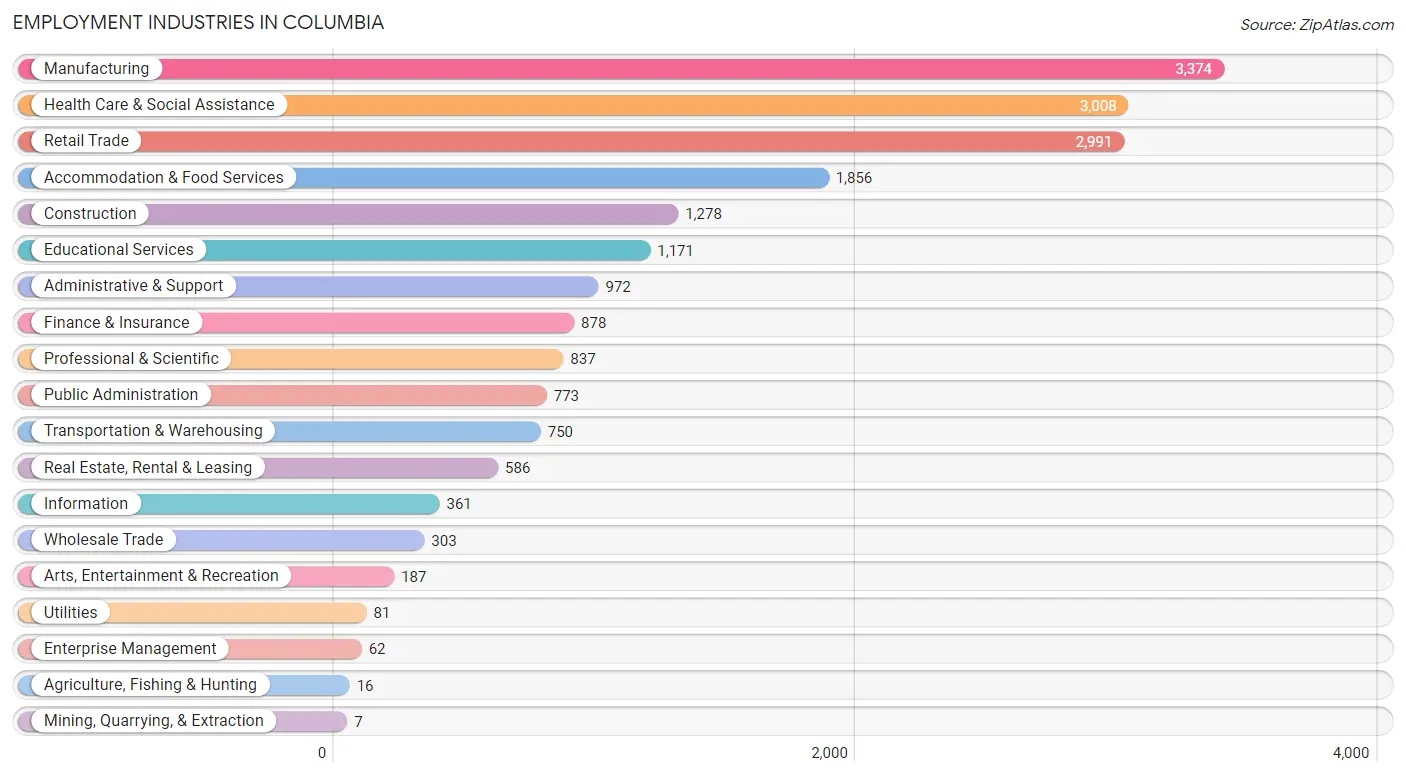
Employment Industries in Columbia
The major employment industries in Columbia include Manufacturing (3,374 | 16.4%), Health Care & Social Assistance (3,008 | 14.6%), Retail Trade (2,991 | 14.5%), Accommodation & Food Services (1,856 | 9.0%), and Construction (1,278 | 6.2%).
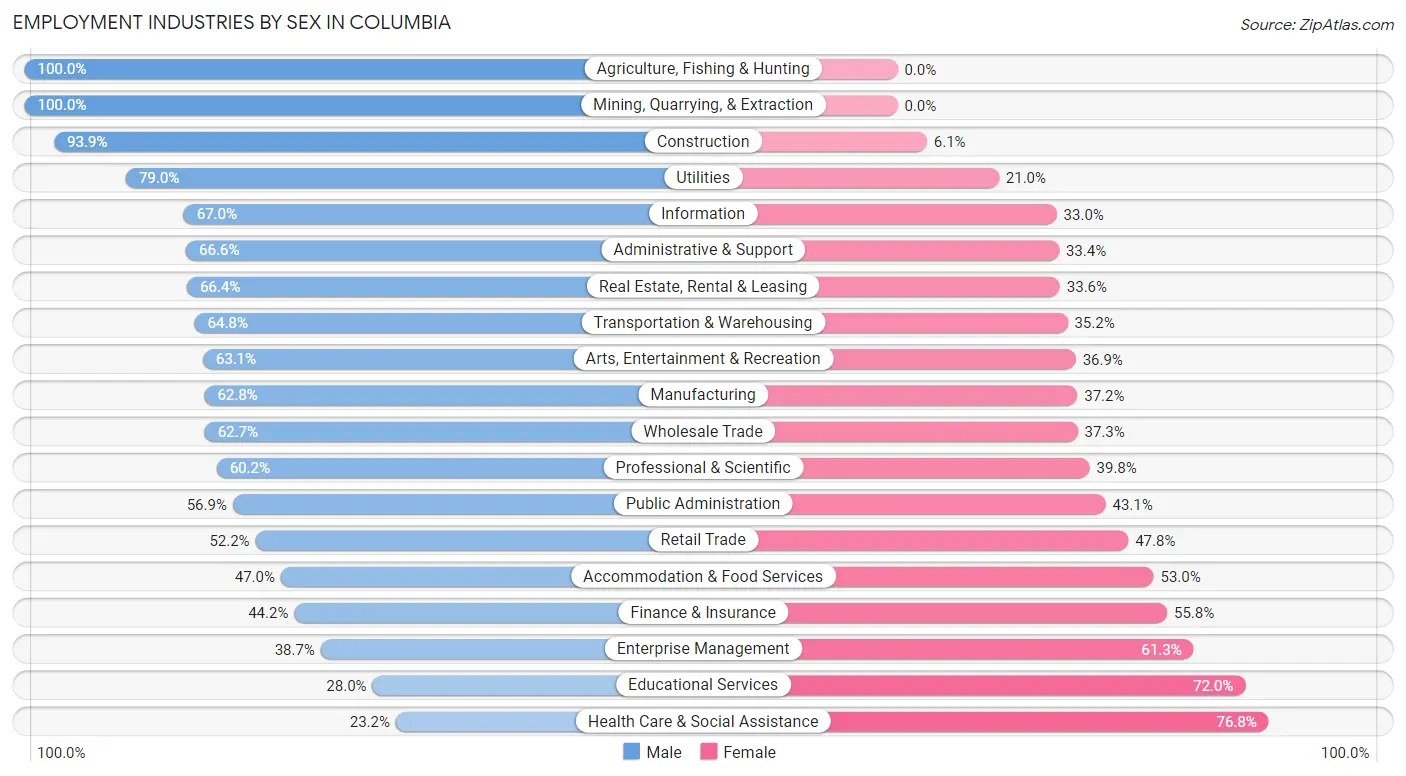
Employment Industries by Sex in Columbia
The Columbia industries that see more men than women are Agriculture, Fishing & Hunting (100.0%), Mining, Quarrying, & Extraction (100.0%), and Construction (93.9%), whereas the industries that tend to have a higher number of women are Health Care & Social Assistance (76.8%), Educational Services (72.0%), and Enterprise Management (61.3%).
| Industry | Male | Female |
| Agriculture, Fishing & Hunting | 16 (100.0%) | 0 (0.0%) |
| Mining, Quarrying, & Extraction | 7 (100.0%) | 0 (0.0%) |
| Construction | 1,200 (93.9%) | 78 (6.1%) |
| Manufacturing | 2,118 (62.8%) | 1,256 (37.2%) |
| Wholesale Trade | 190 (62.7%) | 113 (37.3%) |
| Retail Trade | 1,562 (52.2%) | 1,429 (47.8%) |
| Transportation & Warehousing | 486 (64.8%) | 264 (35.2%) |
| Utilities | 64 (79.0%) | 17 (21.0%) |
| Information | 242 (67.0%) | 119 (33.0%) |
| Finance & Insurance | 388 (44.2%) | 490 (55.8%) |
| Real Estate, Rental & Leasing | 389 (66.4%) | 197 (33.6%) |
| Professional & Scientific | 504 (60.2%) | 333 (39.8%) |
| Enterprise Management | 24 (38.7%) | 38 (61.3%) |
| Administrative & Support | 647 (66.6%) | 325 (33.4%) |
| Educational Services | 328 (28.0%) | 843 (72.0%) |
| Health Care & Social Assistance | 697 (23.2%) | 2,311 (76.8%) |
| Arts, Entertainment & Recreation | 118 (63.1%) | 69 (36.9%) |
| Accommodation & Food Services | 872 (47.0%) | 984 (53.0%) |
| Public Administration | 440 (56.9%) | 333 (43.1%) |
| Total | 10,717 (52.1%) | 9,848 (47.9%) |
Education in Columbia
School Enrollment in Columbia
The most common levels of schooling among the 8,924 students in Columbia are middle school (2,816 | 31.6%), high school (2,251 | 25.2%), and elementary school (1,712 | 19.2%).
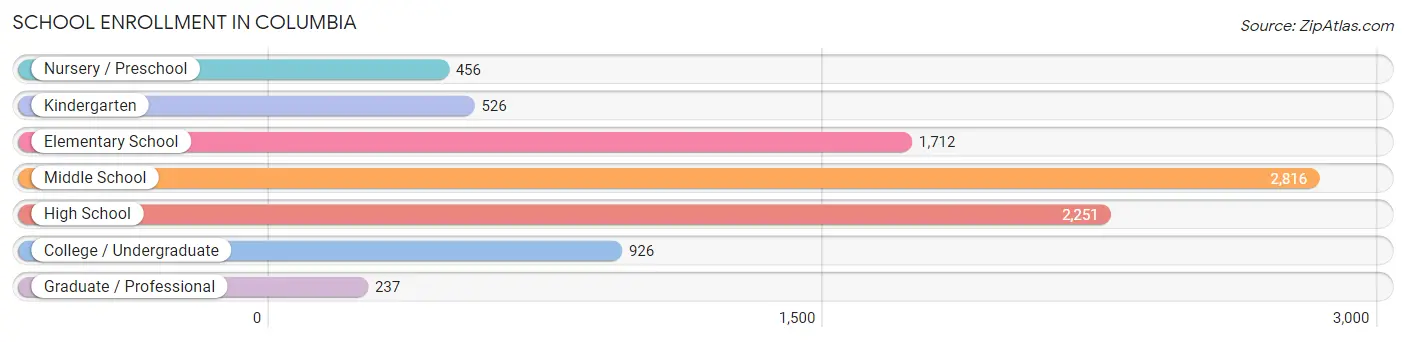
| School Level | # Students | % Students |
| Nursery / Preschool | 456 | 5.1% |
| Kindergarten | 526 | 5.9% |
| Elementary School | 1,712 | 19.2% |
| Middle School | 2,816 | 31.6% |
| High School | 2,251 | 25.2% |
| College / Undergraduate | 926 | 10.4% |
| Graduate / Professional | 237 | 2.7% |
| Total | 8,924 | 100.0% |
School Enrollment by Age by Funding Source in Columbia
Out of a total of 8,924 students who are enrolled in schools in Columbia, 1,196 (13.4%) attend a private institution, while the remaining 7,728 (86.6%) are enrolled in public schools. The age group of 25 to 34 year olds has the highest likelihood of being enrolled in private schools, with 106 (41.1% in the age bracket) enrolled. Conversely, the age group of 15 to 17 year olds has the lowest likelihood of being enrolled in a private school, with 1,501 (92.5% in the age bracket) attending a public institution.
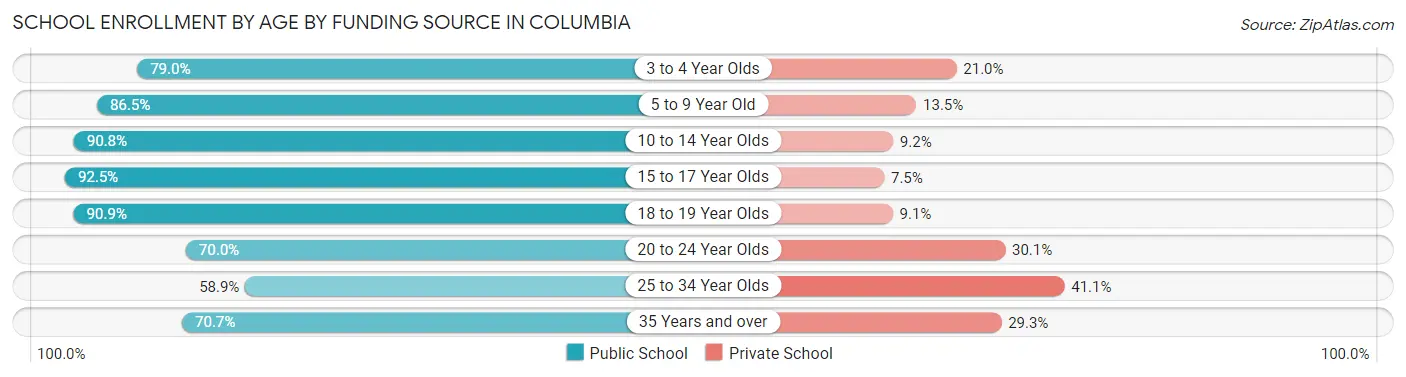
| Age Bracket | Public School | Private School |
| 3 to 4 Year Olds | 414 (79.0%) | 110 (21.0%) |
| 5 to 9 Year Old | 1,841 (86.5%) | 287 (13.5%) |
| 10 to 14 Year Olds | 2,824 (90.8%) | 285 (9.2%) |
| 15 to 17 Year Olds | 1,501 (92.5%) | 122 (7.5%) |
| 18 to 19 Year Olds | 409 (90.9%) | 41 (9.1%) |
| 20 to 24 Year Olds | 284 (70.0%) | 122 (30.0%) |
| 25 to 34 Year Olds | 152 (58.9%) | 106 (41.1%) |
| 35 Years and over | 301 (70.7%) | 125 (29.3%) |
| Total | 7,728 (86.6%) | 1,196 (13.4%) |
Educational Attainment by Field of Study in Columbia
Business (1,623 | 25.3%), education (1,032 | 16.1%), arts & humanities (581 | 9.0%), science & technology (546 | 8.5%), and liberal arts & history (456 | 7.1%) are the most common fields of study among 6,419 individuals in Columbia who have obtained a bachelor's degree or higher.
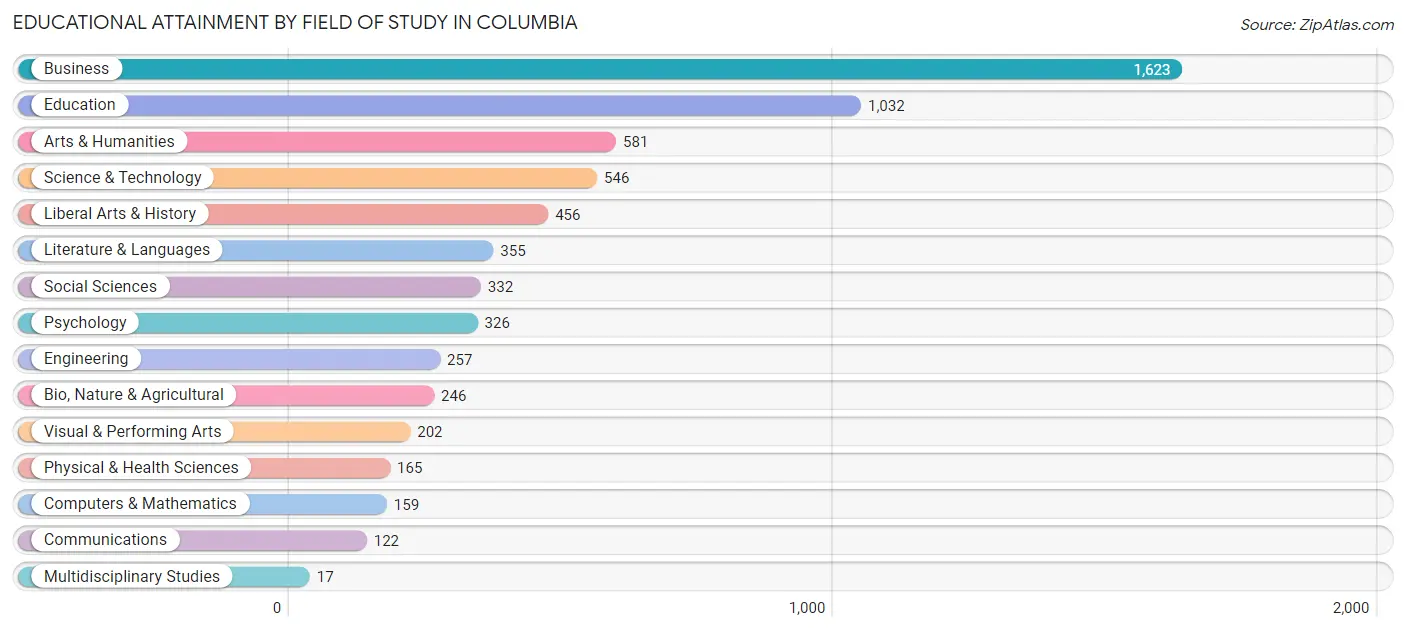
| Field of Study | # Graduates | % Graduates |
| Computers & Mathematics | 159 | 2.5% |
| Bio, Nature & Agricultural | 246 | 3.8% |
| Physical & Health Sciences | 165 | 2.6% |
| Psychology | 326 | 5.1% |
| Social Sciences | 332 | 5.2% |
| Engineering | 257 | 4.0% |
| Multidisciplinary Studies | 17 | 0.3% |
| Science & Technology | 546 | 8.5% |
| Business | 1,623 | 25.3% |
| Education | 1,032 | 16.1% |
| Literature & Languages | 355 | 5.5% |
| Liberal Arts & History | 456 | 7.1% |
| Visual & Performing Arts | 202 | 3.2% |
| Communications | 122 | 1.9% |
| Arts & Humanities | 581 | 9.0% |
| Total | 6,419 | 100.0% |
Transportation & Commute in Columbia
Vehicle Availability by Sex in Columbia
The most prevalent vehicle ownership categories in Columbia are males with 2 vehicles (5,029, accounting for 47.5%) and females with 2 vehicles (3,992, making up 52.2%).
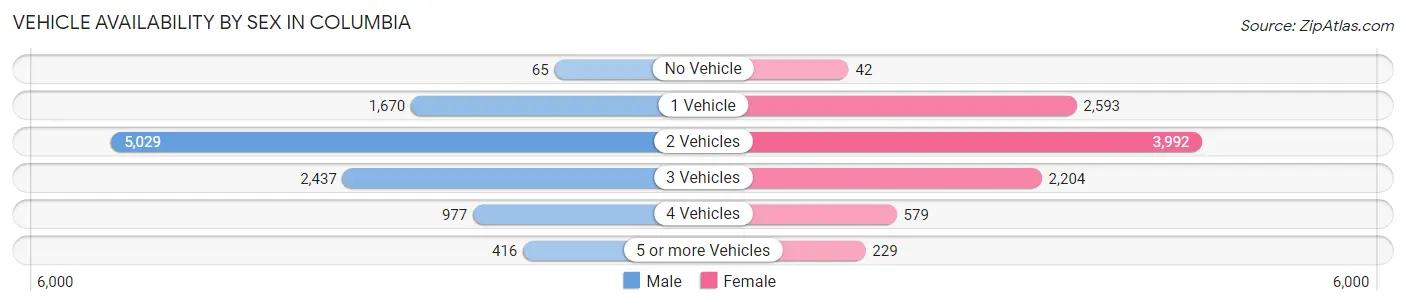
| Vehicles Available | Male | Female |
| No Vehicle | 65 (0.6%) | 42 (0.4%) |
| 1 Vehicle | 1,670 (15.8%) | 2,593 (26.9%) |
| 2 Vehicles | 5,029 (47.5%) | 3,992 (41.4%) |
| 3 Vehicles | 2,437 (23.0%) | 2,204 (22.9%) |
| 4 Vehicles | 977 (9.2%) | 579 (6.0%) |
| 5 or more Vehicles | 416 (3.9%) | 229 (2.4%) |
| Total | 10,594 (100.0%) | 9,639 (100.0%) |
Commute Time in Columbia
The most frequently occuring commute durations in Columbia are 10 to 14 minutes (2,991 commuters, 16.4%), 15 to 19 minutes (2,441 commuters, 13.4%), and 30 to 34 minutes (2,374 commuters, 13.0%).
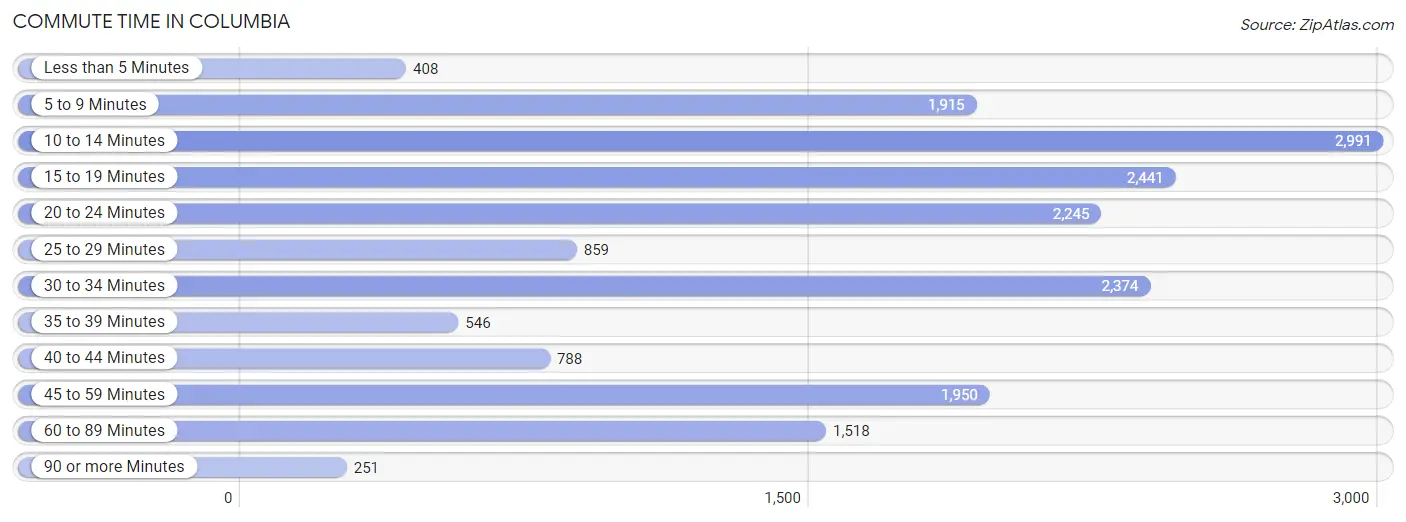
| Commute Time | # Commuters | % Commuters |
| Less than 5 Minutes | 408 | 2.2% |
| 5 to 9 Minutes | 1,915 | 10.5% |
| 10 to 14 Minutes | 2,991 | 16.4% |
| 15 to 19 Minutes | 2,441 | 13.4% |
| 20 to 24 Minutes | 2,245 | 12.3% |
| 25 to 29 Minutes | 859 | 4.7% |
| 30 to 34 Minutes | 2,374 | 13.0% |
| 35 to 39 Minutes | 546 | 3.0% |
| 40 to 44 Minutes | 788 | 4.3% |
| 45 to 59 Minutes | 1,950 | 10.7% |
| 60 to 89 Minutes | 1,518 | 8.3% |
| 90 or more Minutes | 251 | 1.4% |
Commute Time by Sex in Columbia
The most common commute times in Columbia are 10 to 14 minutes (1,424 commuters, 15.2%) for males and 10 to 14 minutes (1,567 commuters, 17.6%) for females.
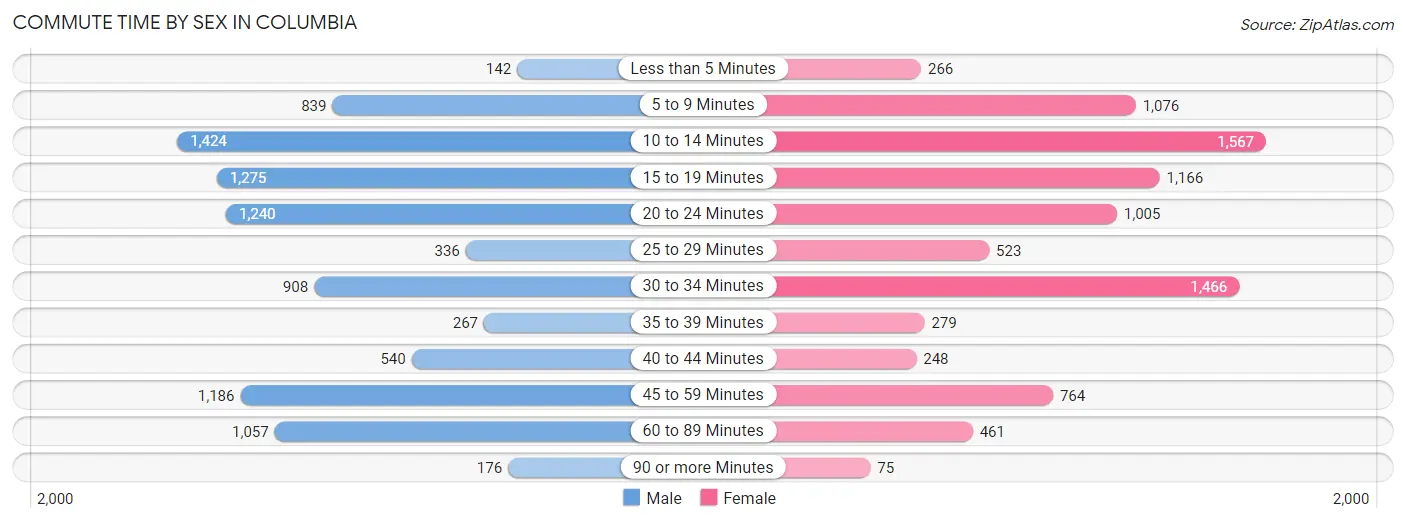
| Commute Time | Male | Female |
| Less than 5 Minutes | 142 (1.5%) | 266 (3.0%) |
| 5 to 9 Minutes | 839 (8.9%) | 1,076 (12.1%) |
| 10 to 14 Minutes | 1,424 (15.2%) | 1,567 (17.6%) |
| 15 to 19 Minutes | 1,275 (13.6%) | 1,166 (13.1%) |
| 20 to 24 Minutes | 1,240 (13.2%) | 1,005 (11.3%) |
| 25 to 29 Minutes | 336 (3.6%) | 523 (5.9%) |
| 30 to 34 Minutes | 908 (9.7%) | 1,466 (16.5%) |
| 35 to 39 Minutes | 267 (2.8%) | 279 (3.1%) |
| 40 to 44 Minutes | 540 (5.8%) | 248 (2.8%) |
| 45 to 59 Minutes | 1,186 (12.6%) | 764 (8.6%) |
| 60 to 89 Minutes | 1,057 (11.3%) | 461 (5.2%) |
| 90 or more Minutes | 176 (1.9%) | 75 (0.8%) |
Time of Departure to Work by Sex in Columbia
The most frequent times of departure to work in Columbia are 6:00 AM to 6:29 AM (1,548, 16.5%) for males and 7:30 AM to 7:59 AM (1,554, 17.5%) for females.
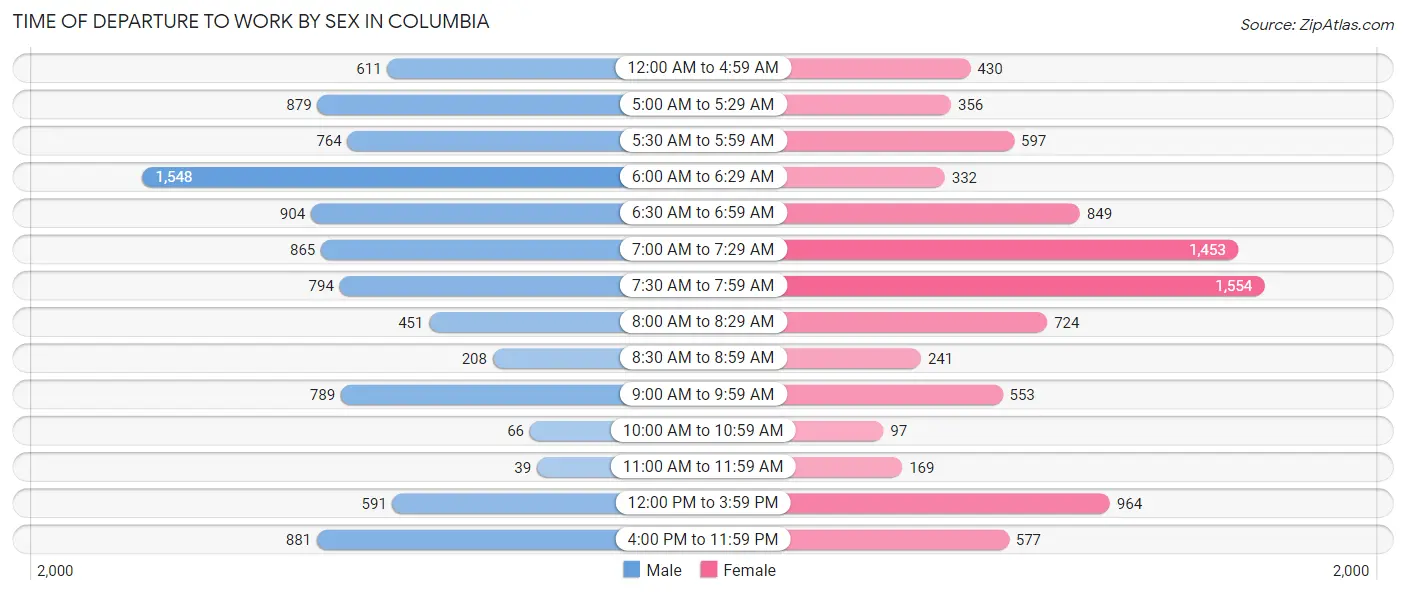
| Time of Departure | Male | Female |
| 12:00 AM to 4:59 AM | 611 (6.5%) | 430 (4.8%) |
| 5:00 AM to 5:29 AM | 879 (9.4%) | 356 (4.0%) |
| 5:30 AM to 5:59 AM | 764 (8.1%) | 597 (6.7%) |
| 6:00 AM to 6:29 AM | 1,548 (16.5%) | 332 (3.7%) |
| 6:30 AM to 6:59 AM | 904 (9.6%) | 849 (9.5%) |
| 7:00 AM to 7:29 AM | 865 (9.2%) | 1,453 (16.3%) |
| 7:30 AM to 7:59 AM | 794 (8.5%) | 1,554 (17.5%) |
| 8:00 AM to 8:29 AM | 451 (4.8%) | 724 (8.1%) |
| 8:30 AM to 8:59 AM | 208 (2.2%) | 241 (2.7%) |
| 9:00 AM to 9:59 AM | 789 (8.4%) | 553 (6.2%) |
| 10:00 AM to 10:59 AM | 66 (0.7%) | 97 (1.1%) |
| 11:00 AM to 11:59 AM | 39 (0.4%) | 169 (1.9%) |
| 12:00 PM to 3:59 PM | 591 (6.3%) | 964 (10.8%) |
| 4:00 PM to 11:59 PM | 881 (9.4%) | 577 (6.5%) |
| Total | 9,390 (100.0%) | 8,896 (100.0%) |
Housing Occupancy in Columbia
Occupancy by Ownership in Columbia
Of the total 17,041 dwellings in Columbia, owner-occupied units account for 10,895 (63.9%), while renter-occupied units make up 6,146 (36.1%).
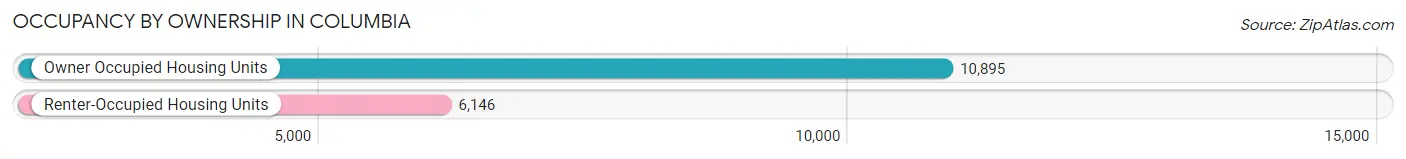
| Occupancy | # Housing Units | % Housing Units |
| Owner Occupied Housing Units | 10,895 | 63.9% |
| Renter-Occupied Housing Units | 6,146 | 36.1% |
| Total Occupied Housing Units | 17,041 | 100.0% |
Occupancy by Household Size in Columbia
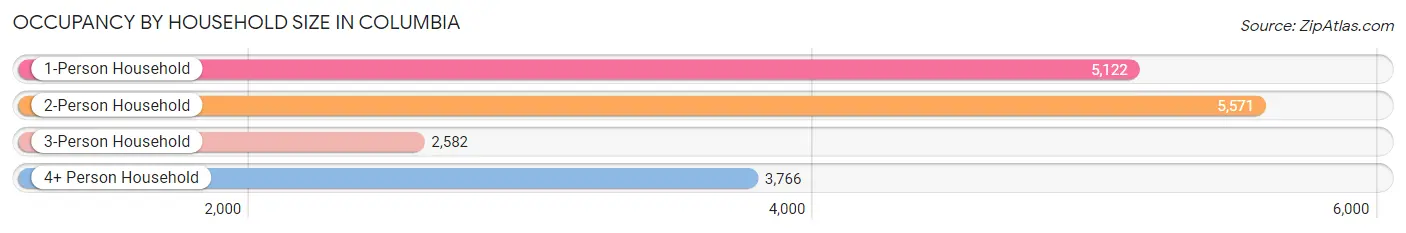
| Household Size | # Housing Units | % Housing Units |
| 1-Person Household | 5,122 | 30.1% |
| 2-Person Household | 5,571 | 32.7% |
| 3-Person Household | 2,582 | 15.1% |
| 4+ Person Household | 3,766 | 22.1% |
| Total Housing Units | 17,041 | 100.0% |
Occupancy by Ownership by Household Size in Columbia
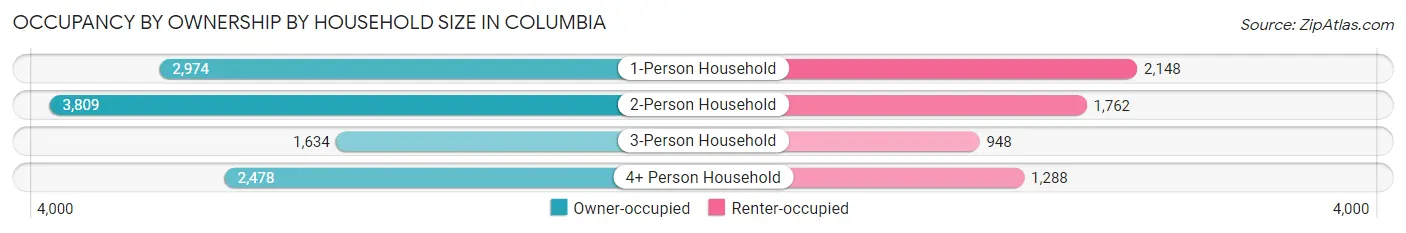
| Household Size | Owner-occupied | Renter-occupied |
| 1-Person Household | 2,974 (58.1%) | 2,148 (41.9%) |
| 2-Person Household | 3,809 (68.4%) | 1,762 (31.6%) |
| 3-Person Household | 1,634 (63.3%) | 948 (36.7%) |
| 4+ Person Household | 2,478 (65.8%) | 1,288 (34.2%) |
| Total Housing Units | 10,895 (63.9%) | 6,146 (36.1%) |
Occupancy by Educational Attainment in Columbia
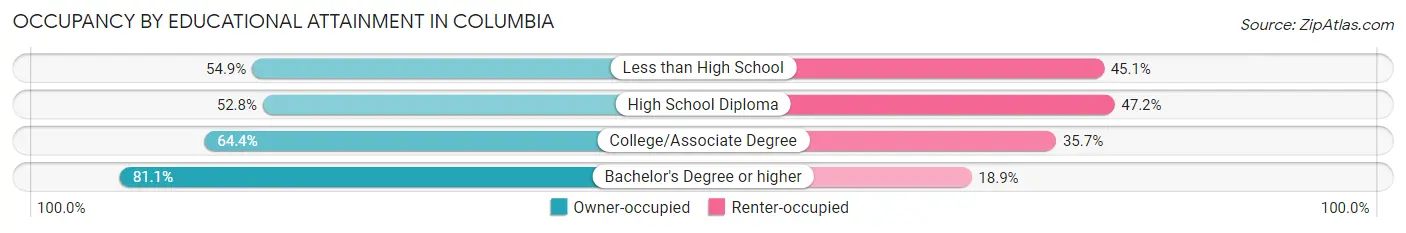
| Household Size | Owner-occupied | Renter-occupied |
| Less than High School | 735 (54.9%) | 604 (45.1%) |
| High School Diploma | 2,747 (52.8%) | 2,458 (47.2%) |
| College/Associate Degree | 4,230 (64.3%) | 2,343 (35.6%) |
| Bachelor's Degree or higher | 3,183 (81.1%) | 741 (18.9%) |
Occupancy by Age of Householder in Columbia
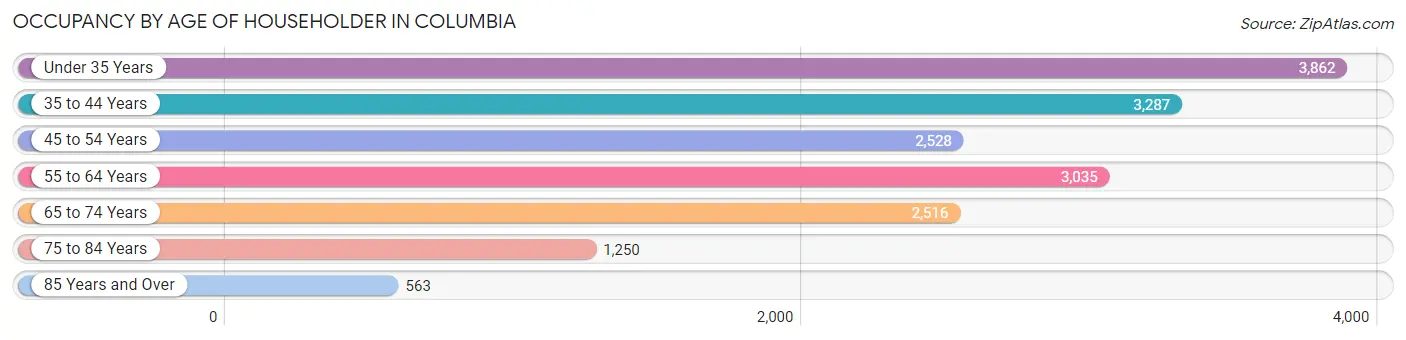
| Age Bracket | # Households | % Households |
| Under 35 Years | 3,862 | 22.7% |
| 35 to 44 Years | 3,287 | 19.3% |
| 45 to 54 Years | 2,528 | 14.8% |
| 55 to 64 Years | 3,035 | 17.8% |
| 65 to 74 Years | 2,516 | 14.8% |
| 75 to 84 Years | 1,250 | 7.3% |
| 85 Years and Over | 563 | 3.3% |
| Total | 17,041 | 100.0% |
Housing Finances in Columbia
Median Income by Occupancy in Columbia
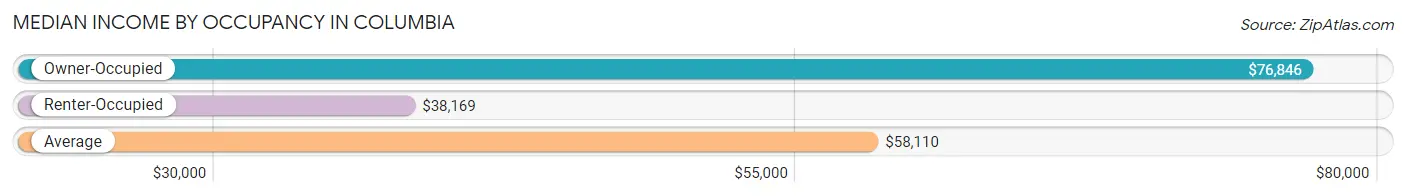
| Occupancy Type | # Households | Median Income |
| Owner-Occupied | 10,895 (63.9%) | $76,846 |
| Renter-Occupied | 6,146 (36.1%) | $38,169 |
| Average | 17,041 (100.0%) | $58,110 |
Occupancy by Householder Income Bracket in Columbia
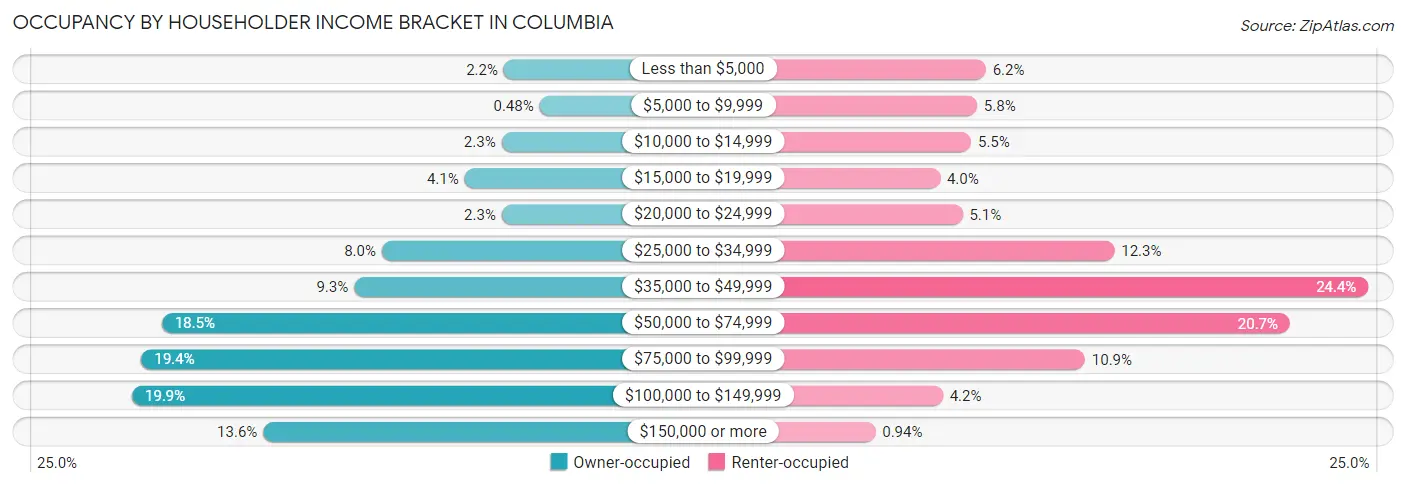
| Income Bracket | Owner-occupied | Renter-occupied |
| Less than $5,000 | 237 (2.2%) | 381 (6.2%) |
| $5,000 to $9,999 | 52 (0.5%) | 355 (5.8%) |
| $10,000 to $14,999 | 249 (2.3%) | 338 (5.5%) |
| $15,000 to $19,999 | 441 (4.1%) | 247 (4.0%) |
| $20,000 to $24,999 | 248 (2.3%) | 313 (5.1%) |
| $25,000 to $34,999 | 871 (8.0%) | 757 (12.3%) |
| $35,000 to $49,999 | 1,014 (9.3%) | 1,500 (24.4%) |
| $50,000 to $74,999 | 2,012 (18.5%) | 1,271 (20.7%) |
| $75,000 to $99,999 | 2,118 (19.4%) | 671 (10.9%) |
| $100,000 to $149,999 | 2,167 (19.9%) | 255 (4.2%) |
| $150,000 or more | 1,486 (13.6%) | 58 (0.9%) |
| Total | 10,895 (100.0%) | 6,146 (100.0%) |
Monthly Housing Cost Tiers in Columbia
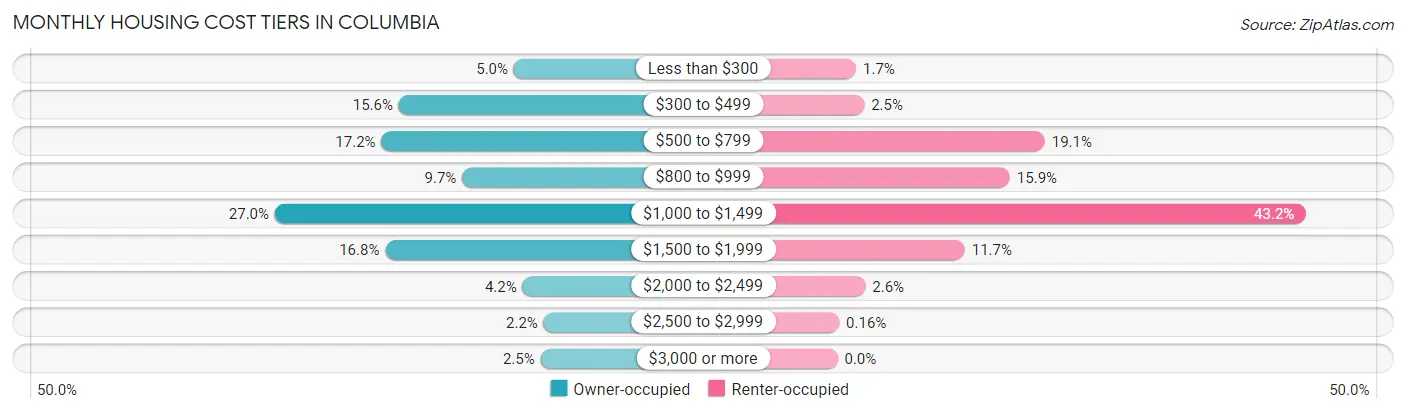
| Monthly Cost | Owner-occupied | Renter-occupied |
| Less than $300 | 540 (5.0%) | 106 (1.7%) |
| $300 to $499 | 1,694 (15.5%) | 152 (2.5%) |
| $500 to $799 | 1,869 (17.2%) | 1,173 (19.1%) |
| $800 to $999 | 1,059 (9.7%) | 976 (15.9%) |
| $1,000 to $1,499 | 2,937 (27.0%) | 2,652 (43.1%) |
| $1,500 to $1,999 | 1,830 (16.8%) | 721 (11.7%) |
| $2,000 to $2,499 | 453 (4.2%) | 158 (2.6%) |
| $2,500 to $2,999 | 241 (2.2%) | 10 (0.2%) |
| $3,000 or more | 272 (2.5%) | 0 (0.0%) |
| Total | 10,895 (100.0%) | 6,146 (100.0%) |
Physical Housing Characteristics in Columbia
Housing Structures in Columbia
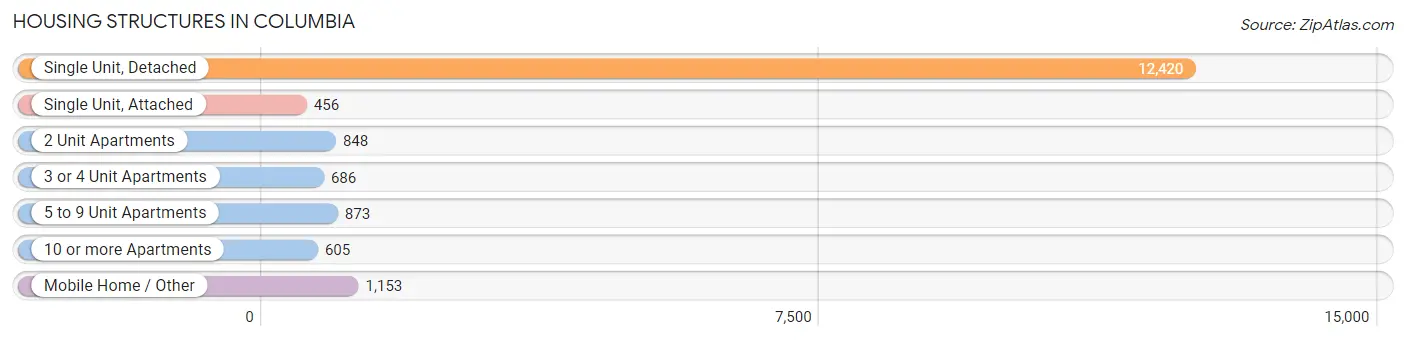
| Structure Type | # Housing Units | % Housing Units |
| Single Unit, Detached | 12,420 | 72.9% |
| Single Unit, Attached | 456 | 2.7% |
| 2 Unit Apartments | 848 | 5.0% |
| 3 or 4 Unit Apartments | 686 | 4.0% |
| 5 to 9 Unit Apartments | 873 | 5.1% |
| 10 or more Apartments | 605 | 3.5% |
| Mobile Home / Other | 1,153 | 6.8% |
| Total | 17,041 | 100.0% |
Housing Structures by Occupancy in Columbia
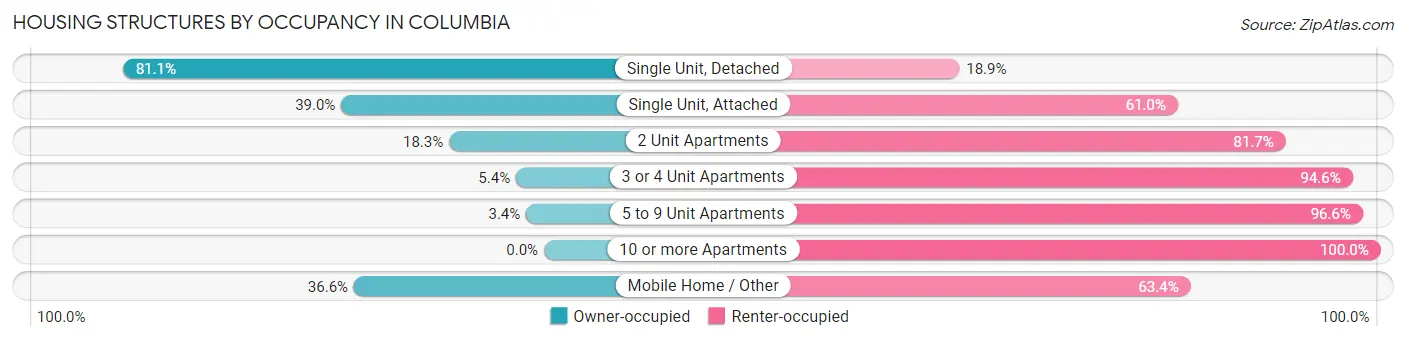
| Structure Type | Owner-occupied | Renter-occupied |
| Single Unit, Detached | 10,073 (81.1%) | 2,347 (18.9%) |
| Single Unit, Attached | 178 (39.0%) | 278 (61.0%) |
| 2 Unit Apartments | 155 (18.3%) | 693 (81.7%) |
| 3 or 4 Unit Apartments | 37 (5.4%) | 649 (94.6%) |
| 5 to 9 Unit Apartments | 30 (3.4%) | 843 (96.6%) |
| 10 or more Apartments | 0 (0.0%) | 605 (100.0%) |
| Mobile Home / Other | 422 (36.6%) | 731 (63.4%) |
| Total | 10,895 (63.9%) | 6,146 (36.1%) |
Housing Structures by Number of Rooms in Columbia
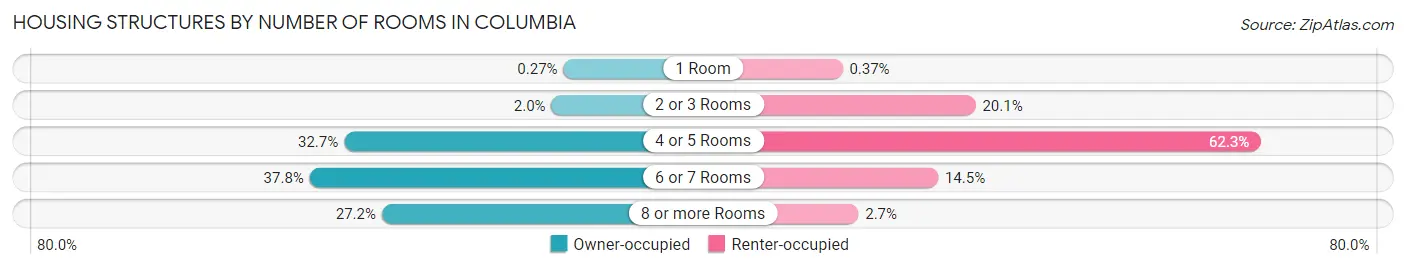
| Number of Rooms | Owner-occupied | Renter-occupied |
| 1 Room | 29 (0.3%) | 23 (0.4%) |
| 2 or 3 Rooms | 222 (2.0%) | 1,233 (20.1%) |
| 4 or 5 Rooms | 3,566 (32.7%) | 3,831 (62.3%) |
| 6 or 7 Rooms | 4,120 (37.8%) | 892 (14.5%) |
| 8 or more Rooms | 2,958 (27.2%) | 167 (2.7%) |
| Total | 10,895 (100.0%) | 6,146 (100.0%) |
Housing Structure by Heating Type in Columbia
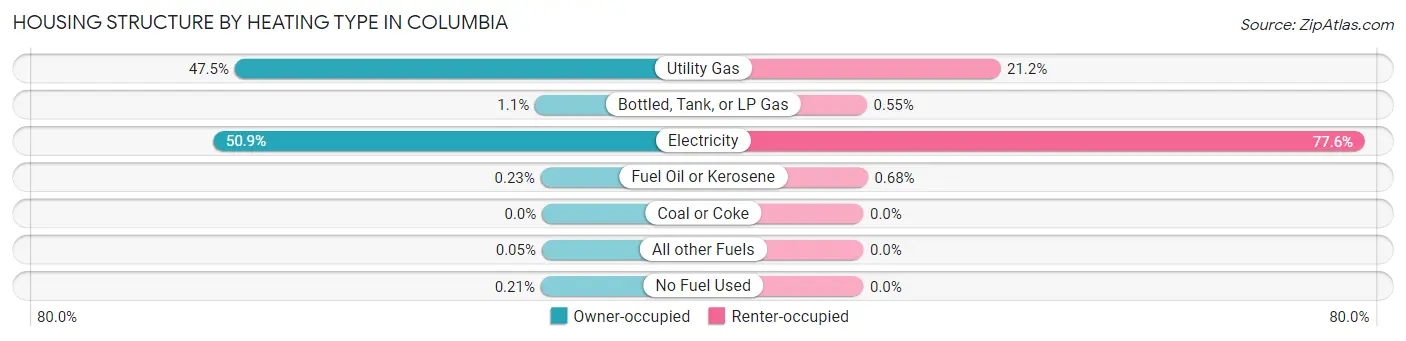
| Heating Type | Owner-occupied | Renter-occupied |
| Utility Gas | 5,176 (47.5%) | 1,302 (21.2%) |
| Bottled, Tank, or LP Gas | 120 (1.1%) | 34 (0.5%) |
| Electricity | 5,546 (50.9%) | 4,768 (77.6%) |
| Fuel Oil or Kerosene | 25 (0.2%) | 42 (0.7%) |
| Coal or Coke | 0 (0.0%) | 0 (0.0%) |
| All other Fuels | 5 (0.1%) | 0 (0.0%) |
| No Fuel Used | 23 (0.2%) | 0 (0.0%) |
| Total | 10,895 (100.0%) | 6,146 (100.0%) |
Household Vehicle Usage in Columbia
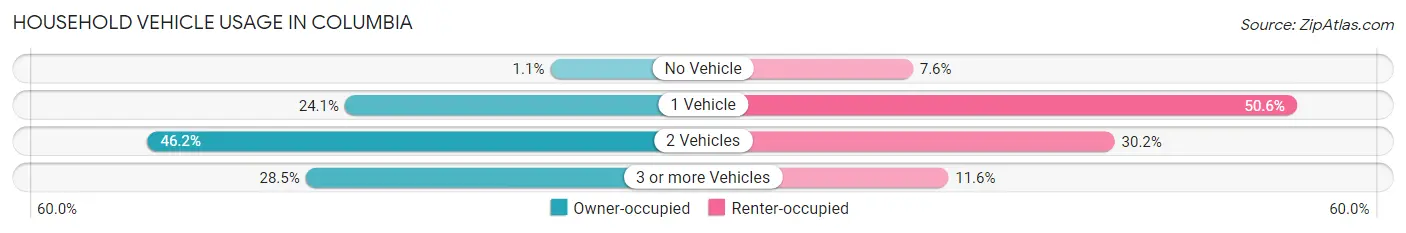
| Vehicles per Household | Owner-occupied | Renter-occupied |
| No Vehicle | 122 (1.1%) | 467 (7.6%) |
| 1 Vehicle | 2,629 (24.1%) | 3,110 (50.6%) |
| 2 Vehicles | 5,036 (46.2%) | 1,857 (30.2%) |
| 3 or more Vehicles | 3,108 (28.5%) | 712 (11.6%) |
| Total | 10,895 (100.0%) | 6,146 (100.0%) |
Real Estate & Mortgages in Columbia
Real Estate and Mortgage Overview in Columbia
| Characteristic | Without Mortgage | With Mortgage |
| Housing Units | 3,581 | 7,314 |
| Median Property Value | $199,500 | $249,900 |
| Median Household Income | $55,978 | $1,115 |
| Monthly Housing Costs | $443 | $272 |
| Real Estate Taxes | $1,327 | $209 |
Property Value by Mortgage Status in Columbia
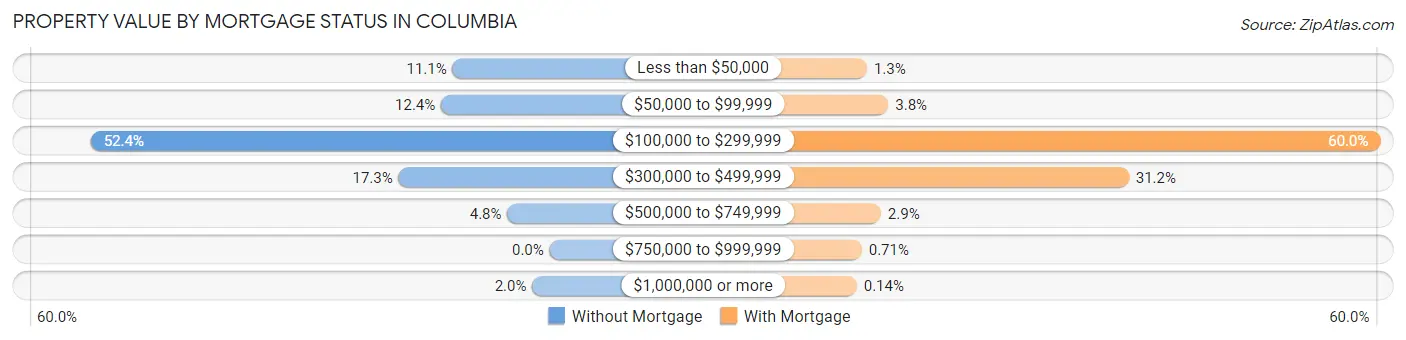
| Property Value | Without Mortgage | With Mortgage |
| Less than $50,000 | 397 (11.1%) | 96 (1.3%) |
| $50,000 to $99,999 | 444 (12.4%) | 274 (3.7%) |
| $100,000 to $299,999 | 1,878 (52.4%) | 4,386 (60.0%) |
| $300,000 to $499,999 | 618 (17.3%) | 2,284 (31.2%) |
| $500,000 to $749,999 | 173 (4.8%) | 212 (2.9%) |
| $750,000 to $999,999 | 0 (0.0%) | 52 (0.7%) |
| $1,000,000 or more | 71 (2.0%) | 10 (0.1%) |
| Total | 3,581 (100.0%) | 7,314 (100.0%) |
Household Income by Mortgage Status in Columbia
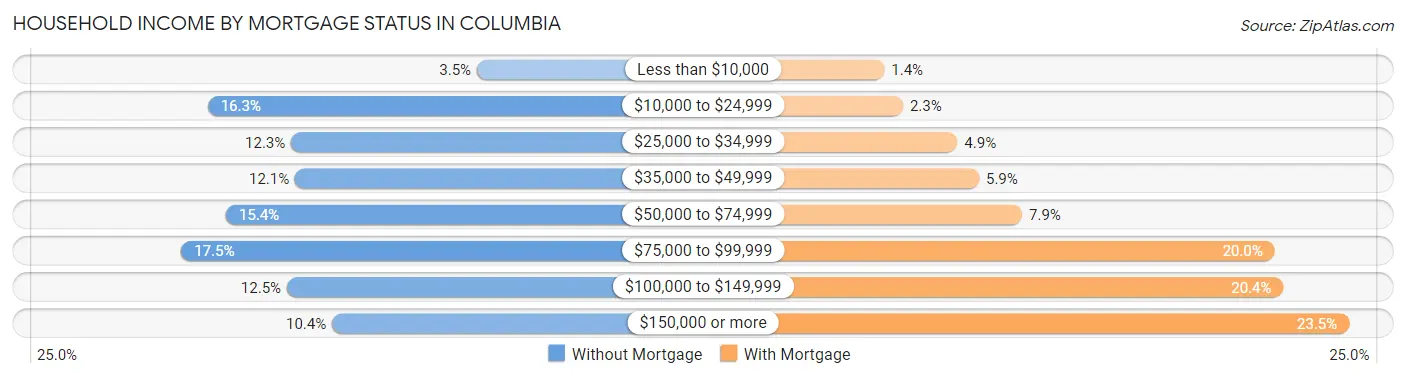
| Household Income | Without Mortgage | With Mortgage |
| Less than $10,000 | 124 (3.5%) | 100 (1.4%) |
| $10,000 to $24,999 | 583 (16.3%) | 165 (2.3%) |
| $25,000 to $34,999 | 441 (12.3%) | 355 (4.9%) |
| $35,000 to $49,999 | 434 (12.1%) | 430 (5.9%) |
| $50,000 to $74,999 | 552 (15.4%) | 580 (7.9%) |
| $75,000 to $99,999 | 628 (17.5%) | 1,460 (20.0%) |
| $100,000 to $149,999 | 448 (12.5%) | 1,490 (20.4%) |
| $150,000 or more | 371 (10.4%) | 1,719 (23.5%) |
| Total | 3,581 (100.0%) | 7,314 (100.0%) |
Property Value to Household Income Ratio in Columbia
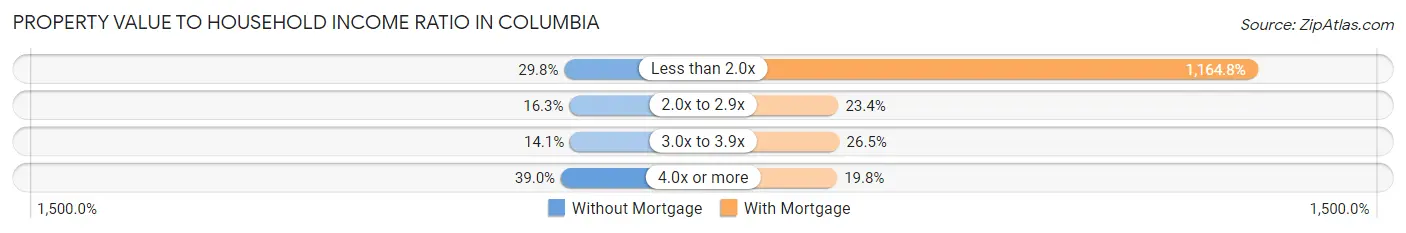
| Value-to-Income Ratio | Without Mortgage | With Mortgage |
| Less than 2.0x | 1,068 (29.8%) | 85,196 (1,164.8%) |
| 2.0x to 2.9x | 583 (16.3%) | 1,709 (23.4%) |
| 3.0x to 3.9x | 504 (14.1%) | 1,938 (26.5%) |
| 4.0x or more | 1,398 (39.0%) | 1,451 (19.8%) |
| Total | 3,581 (100.0%) | 7,314 (100.0%) |
Real Estate Taxes by Mortgage Status in Columbia
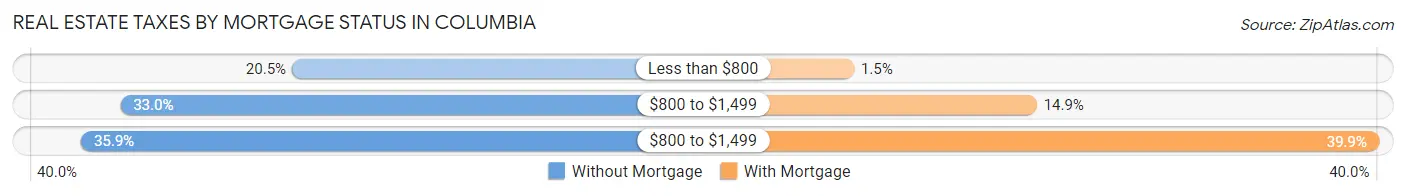
| Property Taxes | Without Mortgage | With Mortgage |
| Less than $800 | 733 (20.5%) | 112 (1.5%) |
| $800 to $1,499 | 1,182 (33.0%) | 1,088 (14.9%) |
| $800 to $1,499 | 1,285 (35.9%) | 2,916 (39.9%) |
| Total | 3,581 (100.0%) | 7,314 (100.0%) |
Health & Disability in Columbia
Health Insurance Coverage by Age in Columbia
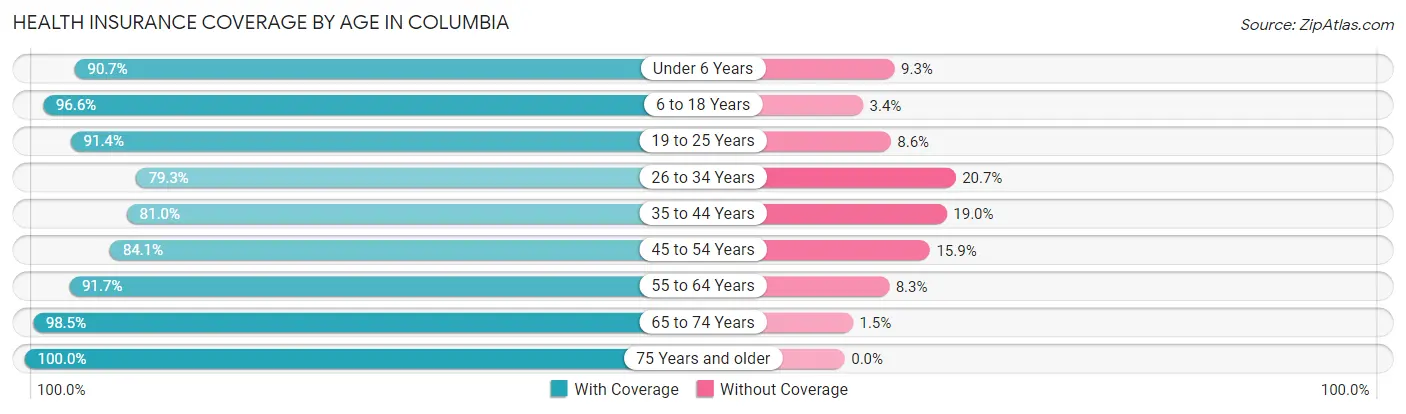
| Age Bracket | With Coverage | Without Coverage |
| Under 6 Years | 3,165 (90.7%) | 324 (9.3%) |
| 6 to 18 Years | 7,210 (96.6%) | 255 (3.4%) |
| 19 to 25 Years | 3,586 (91.4%) | 337 (8.6%) |
| 26 to 34 Years | 4,506 (79.3%) | 1,175 (20.7%) |
| 35 to 44 Years | 4,557 (81.0%) | 1,071 (19.0%) |
| 45 to 54 Years | 3,726 (84.1%) | 704 (15.9%) |
| 55 to 64 Years | 4,298 (91.7%) | 388 (8.3%) |
| 65 to 74 Years | 3,598 (98.5%) | 56 (1.5%) |
| 75 Years and older | 2,633 (100.0%) | 0 (0.0%) |
| Total | 37,279 (89.6%) | 4,310 (10.4%) |
Health Insurance Coverage by Citizenship Status in Columbia
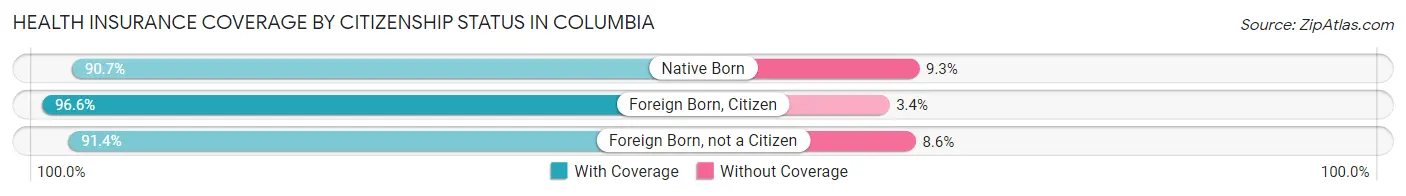
| Citizenship Status | With Coverage | Without Coverage |
| Native Born | 3,165 (90.7%) | 324 (9.3%) |
| Foreign Born, Citizen | 7,210 (96.6%) | 255 (3.4%) |
| Foreign Born, not a Citizen | 3,586 (91.4%) | 337 (8.6%) |
Health Insurance Coverage by Household Income in Columbia
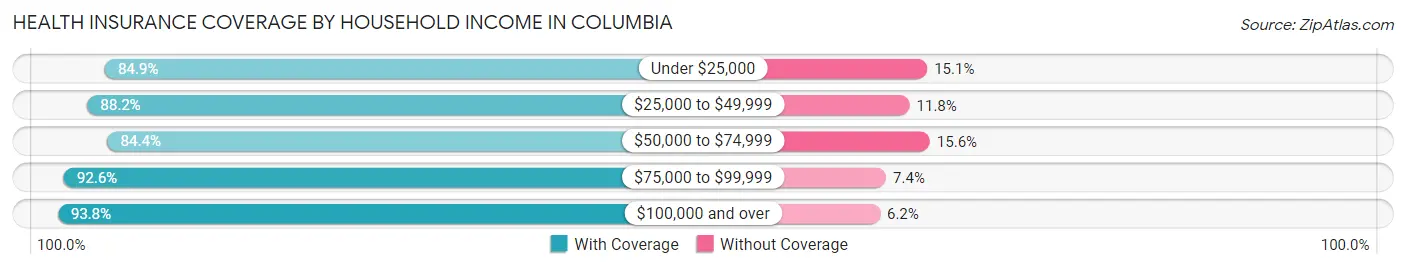
| Household Income | With Coverage | Without Coverage |
| Under $25,000 | 4,262 (84.9%) | 756 (15.1%) |
| $25,000 to $49,999 | 7,599 (88.2%) | 1,014 (11.8%) |
| $50,000 to $74,999 | 6,216 (84.4%) | 1,146 (15.6%) |
| $75,000 to $99,999 | 7,197 (92.6%) | 573 (7.4%) |
| $100,000 and over | 11,919 (93.8%) | 792 (6.2%) |
Public vs Private Health Insurance Coverage by Age in Columbia
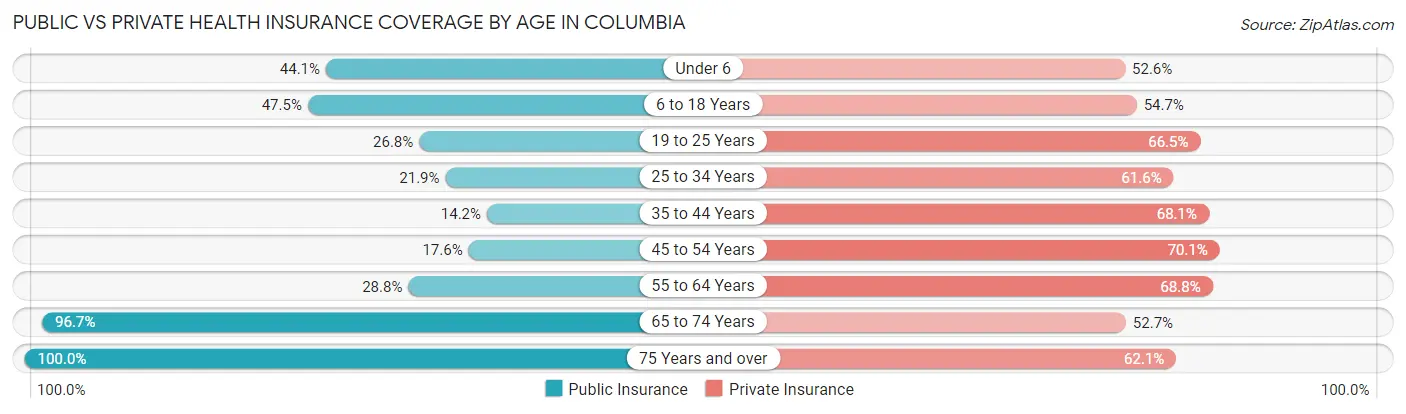
| Age Bracket | Public Insurance | Private Insurance |
| Under 6 | 1,538 (44.1%) | 1,835 (52.6%) |
| 6 to 18 Years | 3,542 (47.4%) | 4,086 (54.7%) |
| 19 to 25 Years | 1,050 (26.8%) | 2,610 (66.5%) |
| 25 to 34 Years | 1,244 (21.9%) | 3,497 (61.6%) |
| 35 to 44 Years | 799 (14.2%) | 3,834 (68.1%) |
| 45 to 54 Years | 780 (17.6%) | 3,107 (70.1%) |
| 55 to 64 Years | 1,349 (28.8%) | 3,224 (68.8%) |
| 65 to 74 Years | 3,535 (96.7%) | 1,927 (52.7%) |
| 75 Years and over | 2,633 (100.0%) | 1,634 (62.1%) |
| Total | 16,470 (39.6%) | 25,754 (61.9%) |
Disability Status by Sex by Age in Columbia
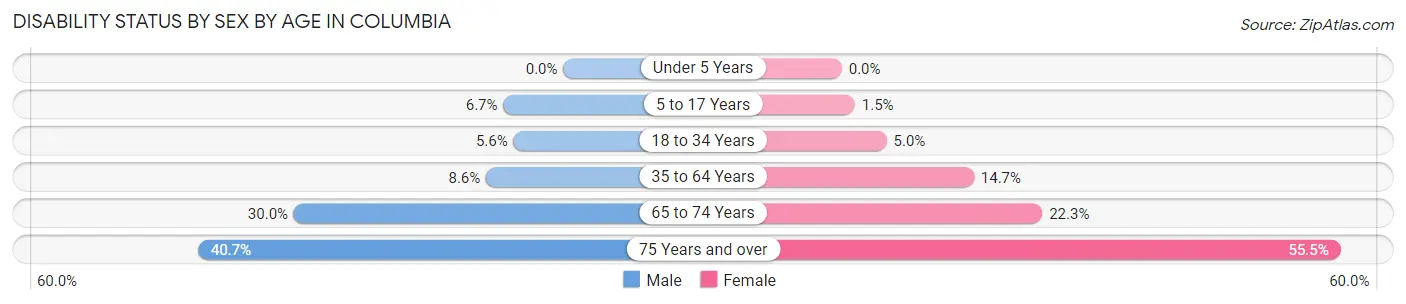
| Age Bracket | Male | Female |
| Under 5 Years | 0 (0.0%) | 0 (0.0%) |
| 5 to 17 Years | 236 (6.7%) | 57 (1.5%) |
| 18 to 34 Years | 265 (5.6%) | 261 (5.0%) |
| 35 to 64 Years | 599 (8.6%) | 1,144 (14.7%) |
| 65 to 74 Years | 497 (30.0%) | 446 (22.3%) |
| 75 Years and over | 377 (40.7%) | 948 (55.5%) |
Disability Class by Sex by Age in Columbia
Disability Class: Hearing Difficulty
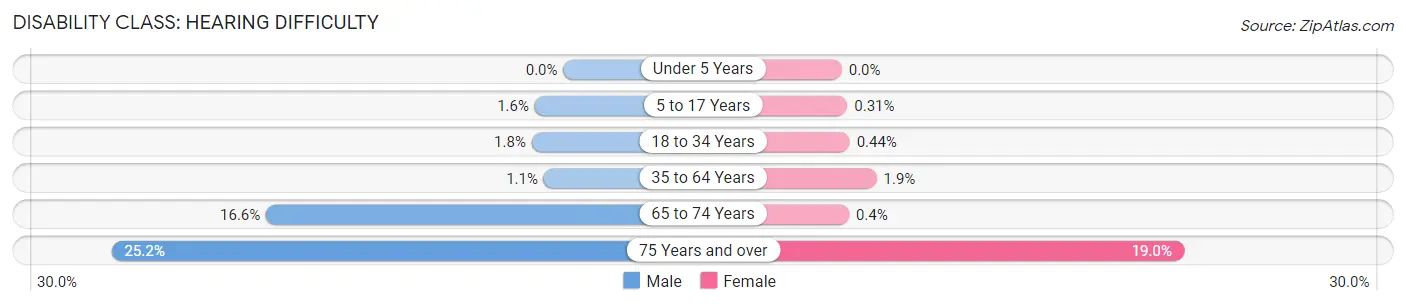
| Age Bracket | Male | Female |
| Under 5 Years | 0 (0.0%) | 0 (0.0%) |
| 5 to 17 Years | 56 (1.6%) | 12 (0.3%) |
| 18 to 34 Years | 84 (1.8%) | 23 (0.4%) |
| 35 to 64 Years | 76 (1.1%) | 151 (1.9%) |
| 65 to 74 Years | 274 (16.6%) | 8 (0.4%) |
| 75 Years and over | 233 (25.2%) | 325 (19.0%) |
Disability Class: Vision Difficulty
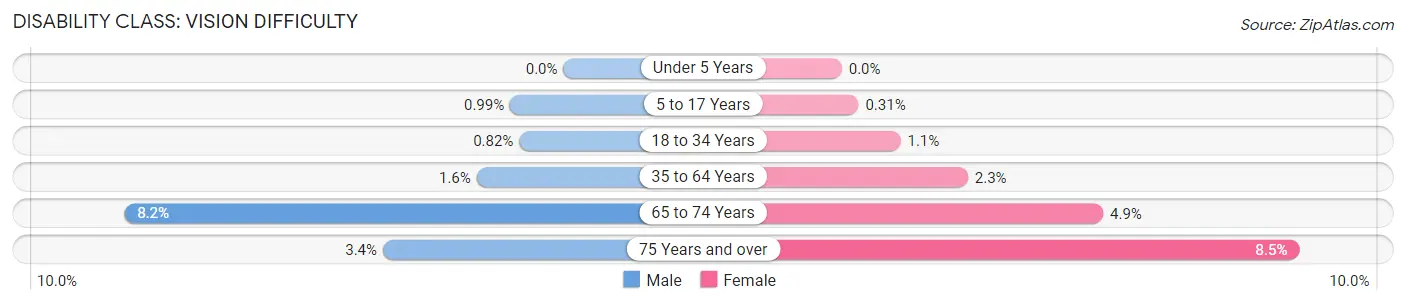
| Age Bracket | Male | Female |
| Under 5 Years | 0 (0.0%) | 0 (0.0%) |
| 5 to 17 Years | 35 (1.0%) | 12 (0.3%) |
| 18 to 34 Years | 39 (0.8%) | 57 (1.1%) |
| 35 to 64 Years | 112 (1.6%) | 182 (2.3%) |
| 65 to 74 Years | 135 (8.2%) | 97 (4.9%) |
| 75 Years and over | 31 (3.4%) | 145 (8.5%) |
Disability Class: Cognitive Difficulty
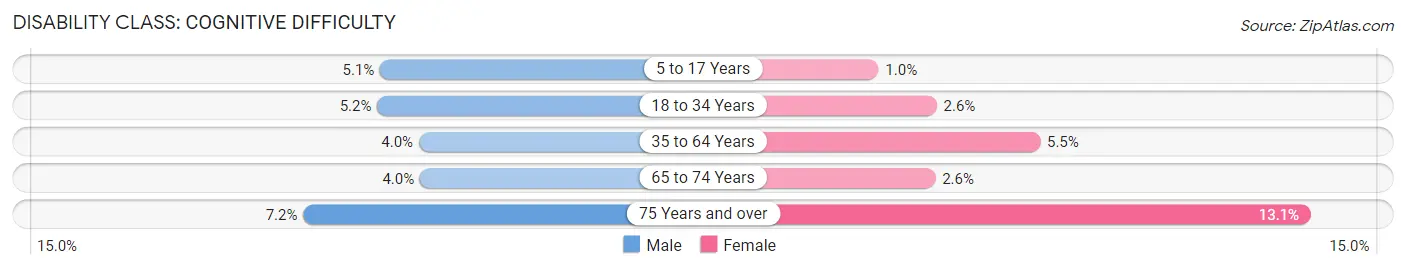
| Age Bracket | Male | Female |
| 5 to 17 Years | 180 (5.1%) | 40 (1.0%) |
| 18 to 34 Years | 247 (5.2%) | 138 (2.6%) |
| 35 to 64 Years | 280 (4.0%) | 429 (5.5%) |
| 65 to 74 Years | 66 (4.0%) | 52 (2.6%) |
| 75 Years and over | 67 (7.2%) | 223 (13.1%) |
Disability Class: Ambulatory Difficulty
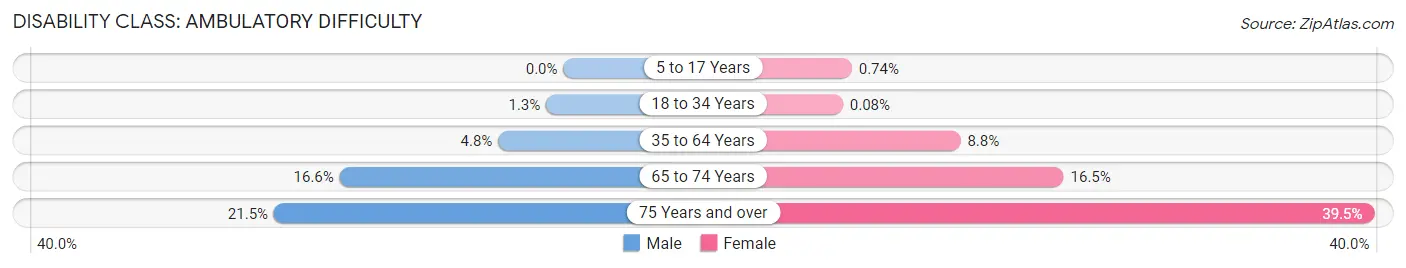
| Age Bracket | Male | Female |
| 5 to 17 Years | 0 (0.0%) | 29 (0.7%) |
| 18 to 34 Years | 61 (1.3%) | 4 (0.1%) |
| 35 to 64 Years | 337 (4.8%) | 685 (8.8%) |
| 65 to 74 Years | 275 (16.6%) | 329 (16.5%) |
| 75 Years and over | 199 (21.5%) | 675 (39.5%) |
Disability Class: Self-Care Difficulty
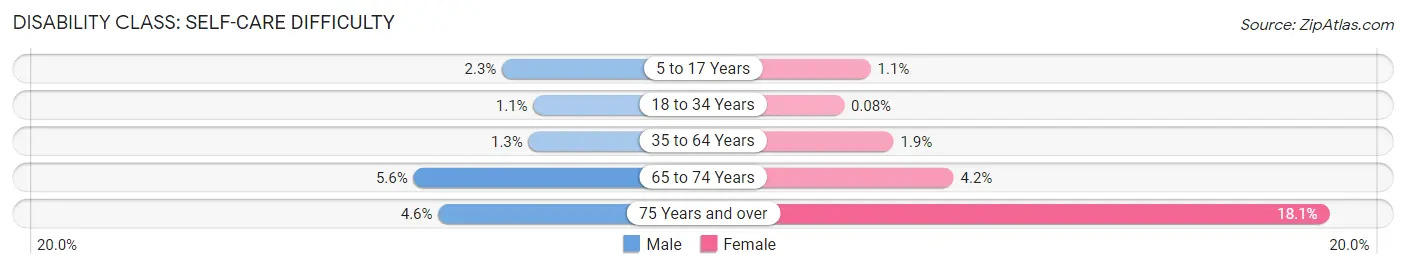
| Age Bracket | Male | Female |
| 5 to 17 Years | 80 (2.3%) | 42 (1.1%) |
| 18 to 34 Years | 53 (1.1%) | 4 (0.1%) |
| 35 to 64 Years | 90 (1.3%) | 149 (1.9%) |
| 65 to 74 Years | 92 (5.6%) | 83 (4.2%) |
| 75 Years and over | 43 (4.6%) | 309 (18.1%) |
Technology Access in Columbia
Computing Device Access in Columbia
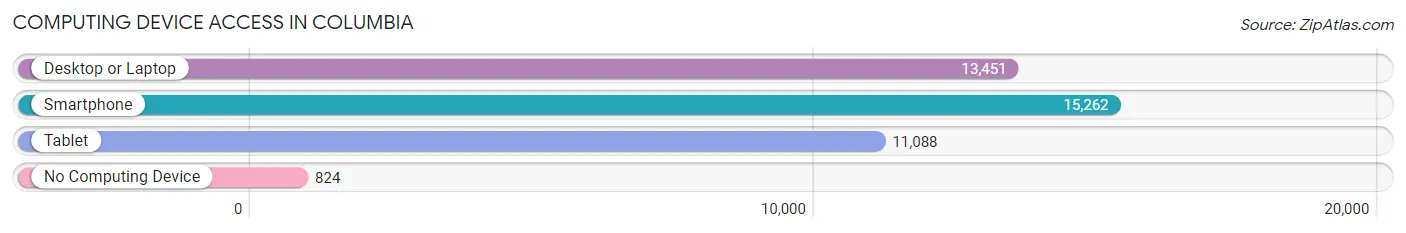
| Device Type | # Households | % Households |
| Desktop or Laptop | 13,451 | 78.9% |
| Smartphone | 15,262 | 89.6% |
| Tablet | 11,088 | 65.1% |
| No Computing Device | 824 | 4.8% |
| Total | 17,041 | 100.0% |
Internet Access in Columbia
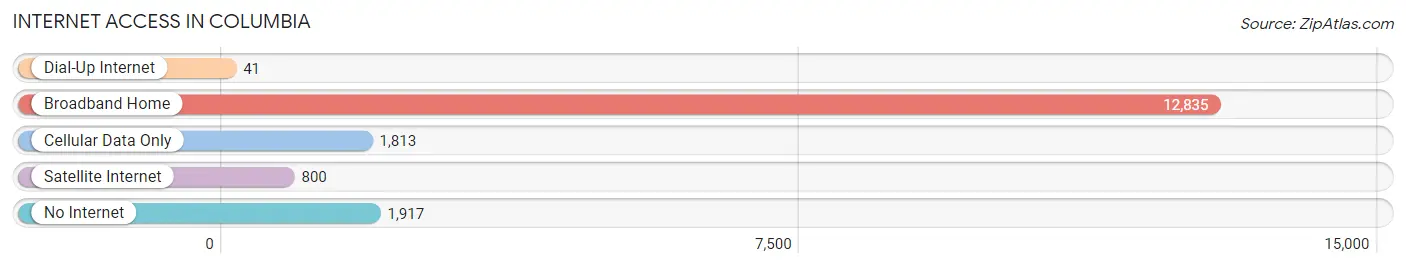
| Internet Type | # Households | % Households |
| Dial-Up Internet | 41 | 0.2% |
| Broadband Home | 12,835 | 75.3% |
| Cellular Data Only | 1,813 | 10.6% |
| Satellite Internet | 800 | 4.7% |
| No Internet | 1,917 | 11.3% |
| Total | 17,041 | 100.0% |
Columbia Summary
Columbia, Tennessee is a city located in Maury County, Tennessee, United States. It is the county seat of Maury County and the home of the Columbia State Community College. The population of Columbia was 34,681 at the 2010 census, making it the largest city in the county.
History
The area that is now Columbia was first settled in the late 1700s by settlers from North Carolina. The town was originally known as "Williamsburg" and was renamed "Columbia" in 1817. The name was chosen to honor Christopher Columbus.
Columbia was officially incorporated in 1817 and was designated as the county seat of Maury County. The city quickly grew and became an important center for trade and commerce in the region.
In the early 1800s, Columbia was a major stop on the stagecoach route between Nashville and Huntsville, Alabama. The city was also a major stop on the railroad line between Nashville and Chattanooga.
In the late 1800s, Columbia was a major center for the production of cotton and tobacco. The city was also home to several large manufacturing plants, including a cotton mill, a tobacco factory, and a shoe factory.
Geography
Columbia is located in the central part of Maury County, in Middle Tennessee. The city is situated on the banks of the Duck River, which flows through the city. The city is located approximately 50 miles south of Nashville and 40 miles north of Huntsville, Alabama.
The city has a total area of 24.2 square miles, of which 24.1 square miles is land and 0.1 square miles is water. The city is located in a hilly region, with the highest point being 645 feet above sea level.
Economy
The economy of Columbia is largely based on manufacturing and agriculture. The city is home to several large manufacturing plants, including a cotton mill, a tobacco factory, and a shoe factory.
Agriculture is also an important part of the local economy. The city is home to several large farms, which produce a variety of crops, including cotton, soybeans, corn, and wheat.
Demographics
As of the 2010 census, the population of Columbia was 34,681. The racial makeup of the city was 79.2% White, 17.2% African American, 0.5% Native American, 0.7% Asian, 0.1% Pacific Islander, 1.2% from other races, and 1.2% from two or more races. Hispanic or Latino of any race were 3.2% of the population.
The median income for a household in the city was $37,845, and the median income for a family was $45,945. The per capita income for the city was $20,845. About 15.2% of families and 19.2% of the population were below the poverty line, including 28.2% of those under age 18 and 11.2% of those age 65 or over.
Common Questions
What is Per Capita Income in Columbia?
Per Capita income in Columbia is $30,249.
What is the Median Family Income in Columbia?
Median Family Income in Columbia is $72,745.
What is the Median Household income in Columbia?
Median Household Income in Columbia is $58,110.
What is Income or Wage Gap in Columbia?
Income or Wage Gap in Columbia is 18.5%.
Women in Columbia earn 81.5 cents for every dollar earned by a man.
What is Family Income Deficit in Columbia?
Family Income Deficit in Columbia is $9,503.
Families that are below poverty line in Columbia earn $9,503 less on average than the poverty threshold level.
What is Inequality or Gini Index in Columbia?
Inequality or Gini Index in Columbia is 0.42.
What is the Total Population of Columbia?
Total Population of Columbia is 42,474.
What is the Total Male Population of Columbia?
Total Male Population of Columbia is 19,834.
What is the Total Female Population of Columbia?
Total Female Population of Columbia is 22,640.
What is the Ratio of Males per 100 Females in Columbia?
There are 87.61 Males per 100 Females in Columbia.
What is the Ratio of Females per 100 Males in Columbia?
There are 114.15 Females per 100 Males in Columbia.
What is the Median Population Age in Columbia?
Median Population Age in Columbia is 36.2 Years.
What is the Average Family Size in Columbia
Average Family Size in Columbia is 3.1 People.
What is the Average Household Size in Columbia
Average Household Size in Columbia is 2.4 People.
How Large is the Labor Force in Columbia?
There are 21,286 People in the Labor Forcein in Columbia.
What is the Percentage of People in the Labor Force in Columbia?
64.4% of People are in the Labor Force in Columbia.
What is the Unemployment Rate in Columbia?
Unemployment Rate in Columbia is 3.4%.