Cleveland, TN Map & Demographics
Cleveland Map
Cleveland Overview
$29,719
PER CAPITA INCOME
$71,141
AVG FAMILY INCOME
$52,468
AVG HOUSEHOLD INCOME
32.5%
WAGE / INCOME GAP [ % ]
67.5¢/ $1
WAGE / INCOME GAP [ $ ]
$9,521
FAMILY INCOME DEFICIT
0.48
INEQUALITY / GINI INDEX
47,725
TOTAL POPULATION
22,486
MALE POPULATION
25,239
FEMALE POPULATION
89.09
MALES / 100 FEMALES
112.24
FEMALES / 100 MALES
34.5
MEDIAN AGE
3.1
AVG FAMILY SIZE
2.5
AVG HOUSEHOLD SIZE
23,369
LABOR FORCE [ PEOPLE ]
61.4%
PERCENT IN LABOR FORCE
4.3%
UNEMPLOYMENT RATE
Cleveland Area Codes
Income in Cleveland
Income Overview in Cleveland
Per Capita Income in Cleveland is $29,719, while median incomes of families and households are $71,141 and $52,468 respectively.
| Characteristic | Number | Measure |
| Per Capita Income | 47,725 | $29,719 |
| Median Family Income | 10,992 | $71,141 |
| Mean Family Income | 10,992 | $92,676 |
| Median Household Income | 17,801 | $52,468 |
| Mean Household Income | 17,801 | $75,777 |
| Income Deficit | 10,992 | $9,521 |
| Wage / Income Gap (%) | 47,725 | 32.51% |
| Wage / Income Gap ($) | 47,725 | 67.49¢ per $1 |
| Gini / Inequality Index | 47,725 | 0.48 |
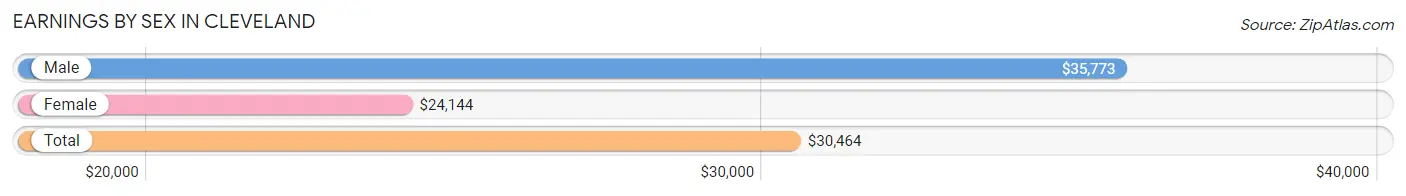
Earnings by Sex in Cleveland
Average Earnings in Cleveland are $30,464, $35,773 for men and $24,144 for women, a difference of 32.5%.
| Sex | Number | Average Earnings |
| Male | 12,323 (49.0%) | $35,773 |
| Female | 12,812 (51.0%) | $24,144 |
| Total | 25,135 (100.0%) | $30,464 |
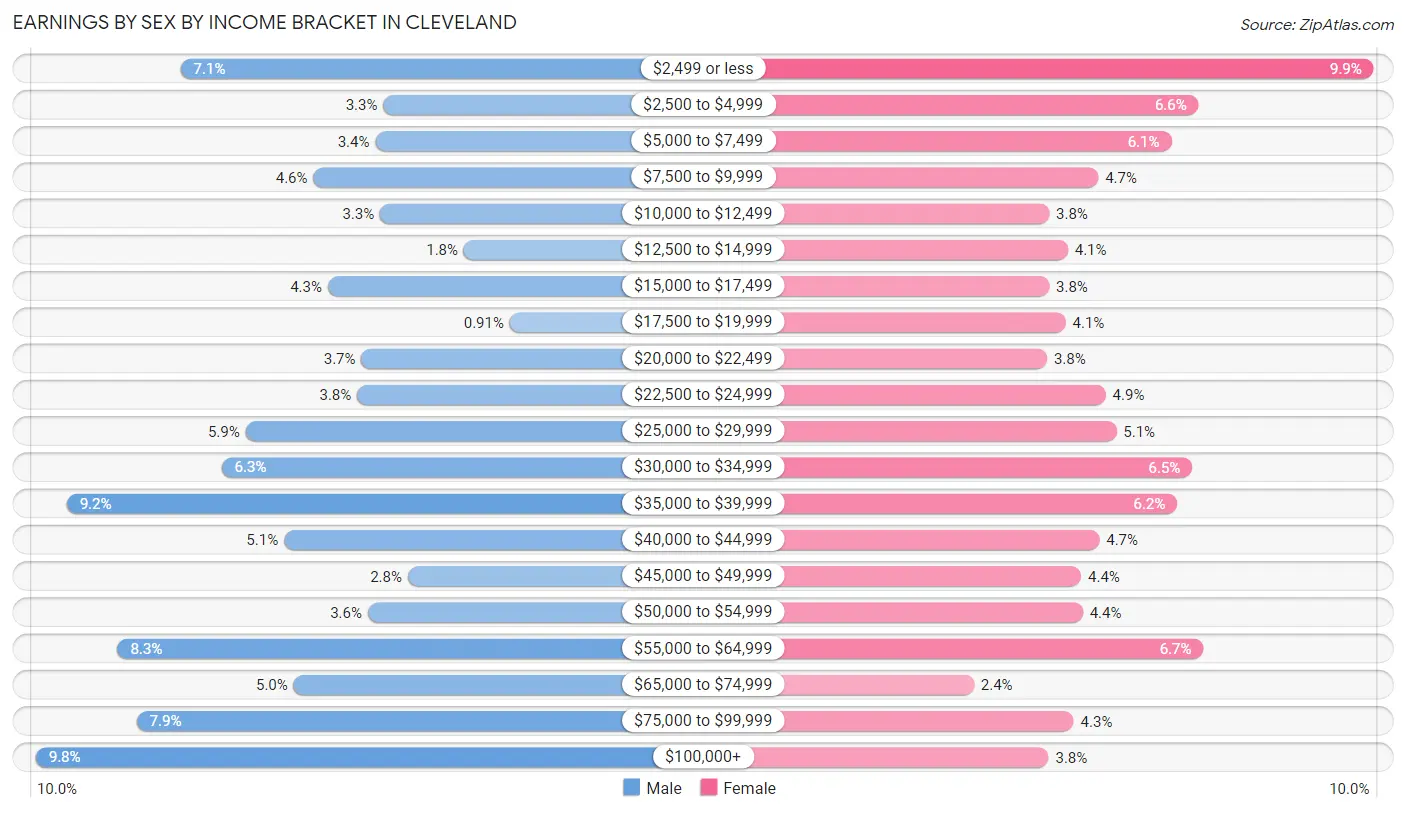
Earnings by Sex by Income Bracket in Cleveland
The most common earnings brackets in Cleveland are $100,000+ for men (1,207 | 9.8%) and $2,499 or less for women (1,264 | 9.9%).
| Income | Male | Female |
| $2,499 or less | 873 (7.1%) | 1,264 (9.9%) |
| $2,500 to $4,999 | 404 (3.3%) | 844 (6.6%) |
| $5,000 to $7,499 | 423 (3.4%) | 779 (6.1%) |
| $7,500 to $9,999 | 566 (4.6%) | 604 (4.7%) |
| $10,000 to $12,499 | 411 (3.3%) | 486 (3.8%) |
| $12,500 to $14,999 | 218 (1.8%) | 530 (4.1%) |
| $15,000 to $17,499 | 532 (4.3%) | 485 (3.8%) |
| $17,500 to $19,999 | 112 (0.9%) | 525 (4.1%) |
| $20,000 to $22,499 | 455 (3.7%) | 480 (3.7%) |
| $22,500 to $24,999 | 464 (3.8%) | 622 (4.9%) |
| $25,000 to $29,999 | 722 (5.9%) | 647 (5.1%) |
| $30,000 to $34,999 | 778 (6.3%) | 829 (6.5%) |
| $35,000 to $39,999 | 1,135 (9.2%) | 793 (6.2%) |
| $40,000 to $44,999 | 633 (5.1%) | 606 (4.7%) |
| $45,000 to $49,999 | 348 (2.8%) | 563 (4.4%) |
| $50,000 to $54,999 | 440 (3.6%) | 566 (4.4%) |
| $55,000 to $64,999 | 1,018 (8.3%) | 856 (6.7%) |
| $65,000 to $74,999 | 611 (5.0%) | 305 (2.4%) |
| $75,000 to $99,999 | 973 (7.9%) | 544 (4.3%) |
| $100,000+ | 1,207 (9.8%) | 484 (3.8%) |
| Total | 12,323 (100.0%) | 12,812 (100.0%) |
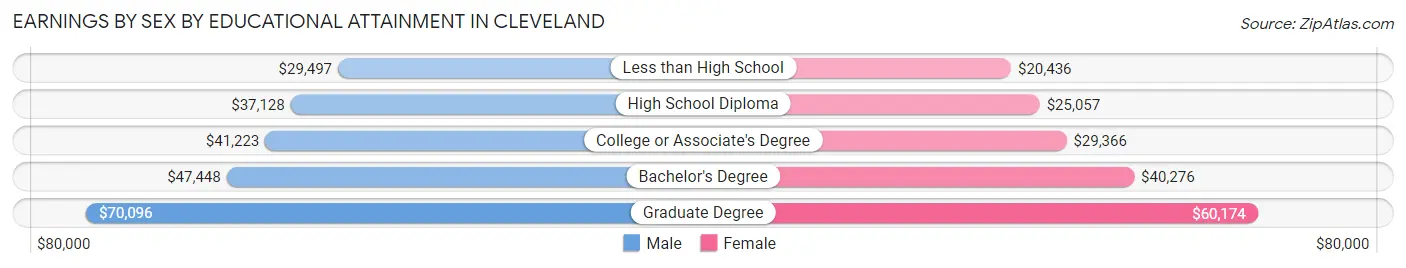
Earnings by Sex by Educational Attainment in Cleveland
Average earnings in Cleveland are $42,330 for men and $33,611 for women, a difference of 20.6%. Men with an educational attainment of graduate degree enjoy the highest average annual earnings of $70,096, while those with less than high school education earn the least with $29,497. Women with an educational attainment of graduate degree earn the most with the average annual earnings of $60,174, while those with less than high school education have the smallest earnings of $20,436.
| Educational Attainment | Male Income | Female Income |
| Less than High School | $29,497 | $20,436 |
| High School Diploma | $37,128 | $25,057 |
| College or Associate's Degree | $41,223 | $29,366 |
| Bachelor's Degree | $47,448 | $40,276 |
| Graduate Degree | $70,096 | $60,174 |
| Total | $42,330 | $33,611 |
Family Income in Cleveland
Family Income Brackets in Cleveland
According to the Cleveland family income data, there are 2,429 families falling into the $100,000 to $149,999 income range, which is the most common income bracket and makes up 22.1% of all families. Conversely, the $10,000 to $14,999 income bracket is the least frequent group with only 231 families (2.1%) belonging to this category.
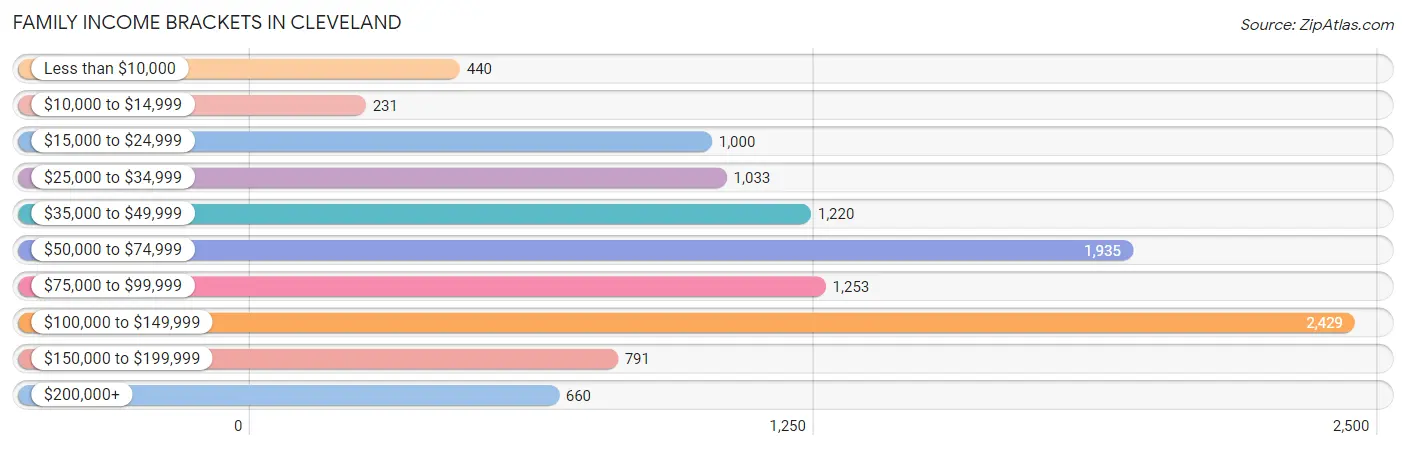
| Income Bracket | # Families | % Families |
| Less than $10,000 | 440 | 4.0% |
| $10,000 to $14,999 | 231 | 2.1% |
| $15,000 to $24,999 | 1,000 | 9.1% |
| $25,000 to $34,999 | 1,033 | 9.4% |
| $35,000 to $49,999 | 1,220 | 11.1% |
| $50,000 to $74,999 | 1,935 | 17.6% |
| $75,000 to $99,999 | 1,253 | 11.4% |
| $100,000 to $149,999 | 2,429 | 22.1% |
| $150,000 to $199,999 | 791 | 7.2% |
| $200,000+ | 660 | 6.0% |
Family Income by Famaliy Size in Cleveland
6-person families (278 | 2.5%) account for the highest median family income in Cleveland with $122,372 per family, while 2-person families (5,001 | 45.5%) have the highest median income of $29,636 per family member.
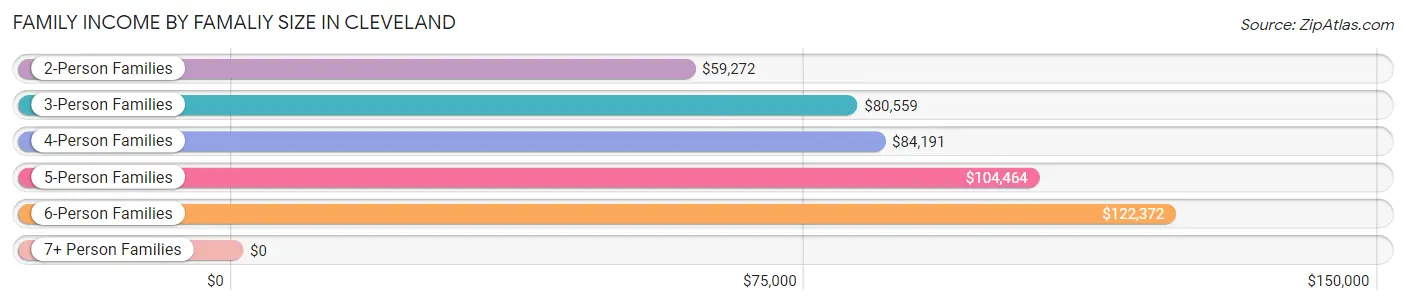
| Income Bracket | # Families | Median Income |
| 2-Person Families | 5,001 (45.5%) | $59,272 |
| 3-Person Families | 2,879 (26.2%) | $80,559 |
| 4-Person Families | 1,949 (17.7%) | $84,191 |
| 5-Person Families | 713 (6.5%) | $104,464 |
| 6-Person Families | 278 (2.5%) | $122,372 |
| 7+ Person Families | 172 (1.6%) | $0 |
| Total | 10,992 (100.0%) | $71,141 |
Family Income by Number of Earners in Cleveland
The median family income in Cleveland is $71,141, with families comprising 3+ earners (1,263) having the highest median family income of $123,856, while families with no earners (1,578) have the lowest median family income of $40,000, accounting for 11.5% and 14.4% of families, respectively.
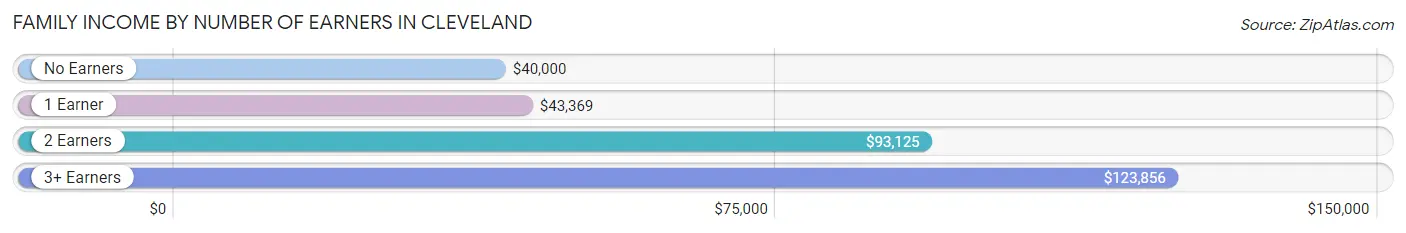
| Number of Earners | # Families | Median Income |
| No Earners | 1,578 (14.4%) | $40,000 |
| 1 Earner | 3,763 (34.2%) | $43,369 |
| 2 Earners | 4,388 (39.9%) | $93,125 |
| 3+ Earners | 1,263 (11.5%) | $123,856 |
| Total | 10,992 (100.0%) | $71,141 |
Household Income in Cleveland
Household Income Brackets in Cleveland
With 3,026 households falling in the category, the $100,000 to $149,999 income range is the most frequent in Cleveland, accounting for 17.0% of all households. In contrast, only 819 households (4.6%) fall into the $150,000 to $199,999 income bracket, making it the least populous group.
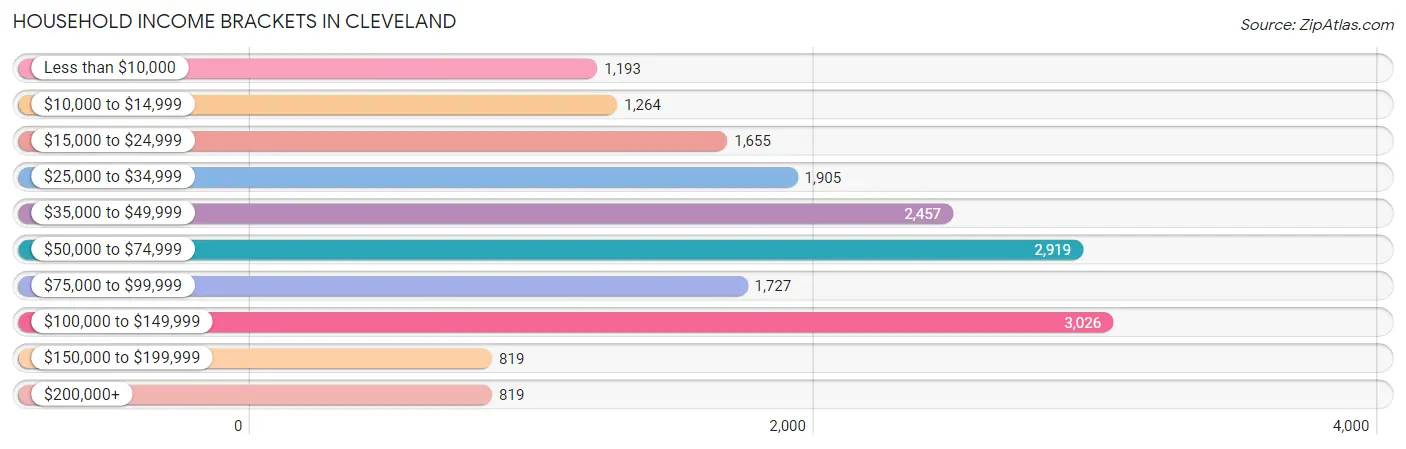
| Income Bracket | # Households | % Households |
| Less than $10,000 | 1,193 | 6.7% |
| $10,000 to $14,999 | 1,264 | 7.1% |
| $15,000 to $24,999 | 1,655 | 9.3% |
| $25,000 to $34,999 | 1,905 | 10.7% |
| $35,000 to $49,999 | 2,457 | 13.8% |
| $50,000 to $74,999 | 2,919 | 16.4% |
| $75,000 to $99,999 | 1,727 | 9.7% |
| $100,000 to $149,999 | 3,026 | 17.0% |
| $150,000 to $199,999 | 819 | 4.6% |
| $200,000+ | 819 | 4.6% |
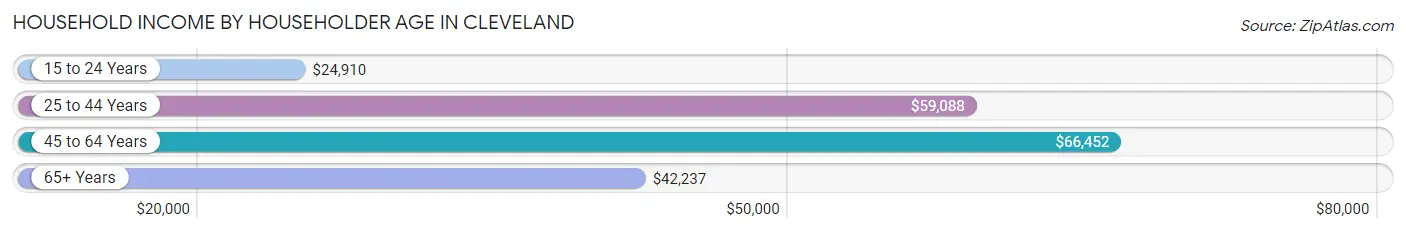
Household Income by Householder Age in Cleveland
The median household income in Cleveland is $52,468, with the highest median household income of $66,452 found in the 45 to 64 years age bracket for the primary householder. A total of 5,796 households (32.6%) fall into this category. Meanwhile, the 15 to 24 years age bracket for the primary householder has the lowest median household income of $24,910, with 902 households (5.1%) in this group.
| Income Bracket | # Households | Median Income |
| 15 to 24 Years | 902 (5.1%) | $24,910 |
| 25 to 44 Years | 6,042 (33.9%) | $59,088 |
| 45 to 64 Years | 5,796 (32.6%) | $66,452 |
| 65+ Years | 5,061 (28.4%) | $42,237 |
| Total | 17,801 (100.0%) | $52,468 |
Poverty in Cleveland
Income Below Poverty by Sex and Age in Cleveland
With 14.7% poverty level for males and 19.7% for females among the residents of Cleveland, under 5 year old males and 15 year old females are the most vulnerable to poverty, with 404 males (28.0%) and 154 females (46.0%) in their respective age groups living below the poverty level.
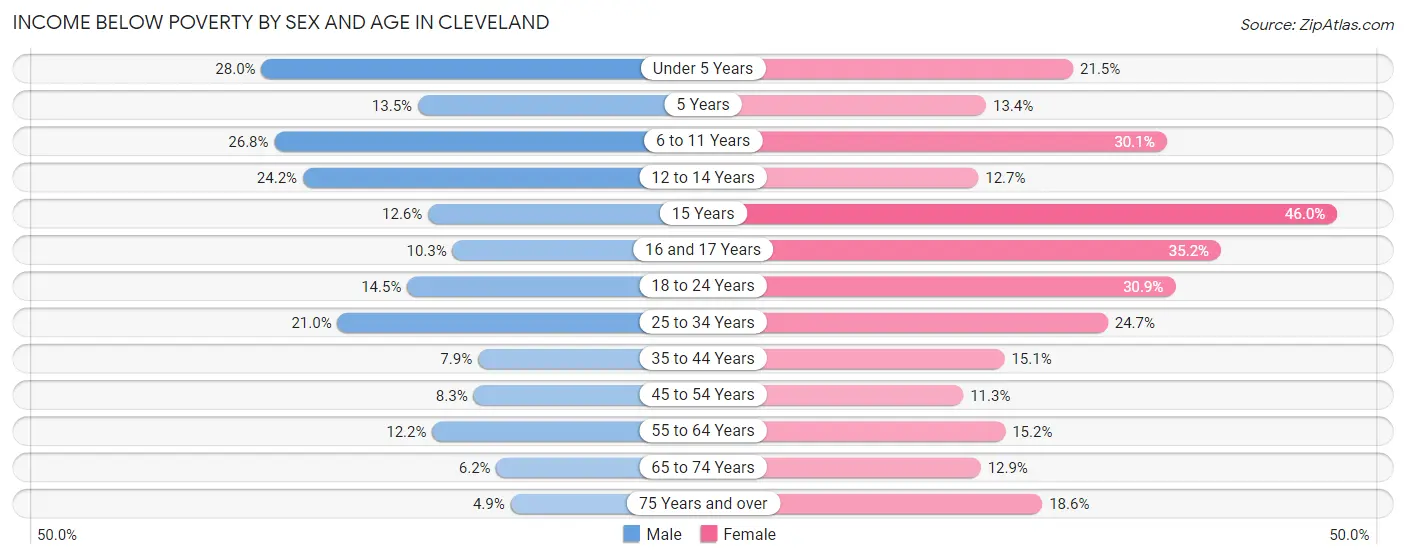
| Age Bracket | Male | Female |
| Under 5 Years | 404 (28.0%) | 373 (21.5%) |
| 5 Years | 27 (13.5%) | 45 (13.4%) |
| 6 to 11 Years | 501 (26.8%) | 505 (30.1%) |
| 12 to 14 Years | 161 (24.2%) | 113 (12.7%) |
| 15 Years | 33 (12.6%) | 154 (46.0%) |
| 16 and 17 Years | 51 (10.3%) | 127 (35.2%) |
| 18 to 24 Years | 398 (14.5%) | 686 (30.9%) |
| 25 to 34 Years | 677 (21.0%) | 788 (24.7%) |
| 35 to 44 Years | 202 (7.9%) | 404 (15.1%) |
| 45 to 54 Years | 203 (8.3%) | 331 (11.3%) |
| 55 to 64 Years | 258 (12.2%) | 361 (15.2%) |
| 65 to 74 Years | 131 (6.2%) | 338 (12.9%) |
| 75 Years and over | 48 (4.9%) | 377 (18.6%) |
| Total | 3,094 (14.7%) | 4,602 (19.7%) |
Income Above Poverty by Sex and Age in Cleveland
According to the poverty statistics in Cleveland, males aged 75 years and over and females aged 45 to 54 years are the age groups that are most secure financially, with 95.1% of males and 88.7% of females in these age groups living above the poverty line.
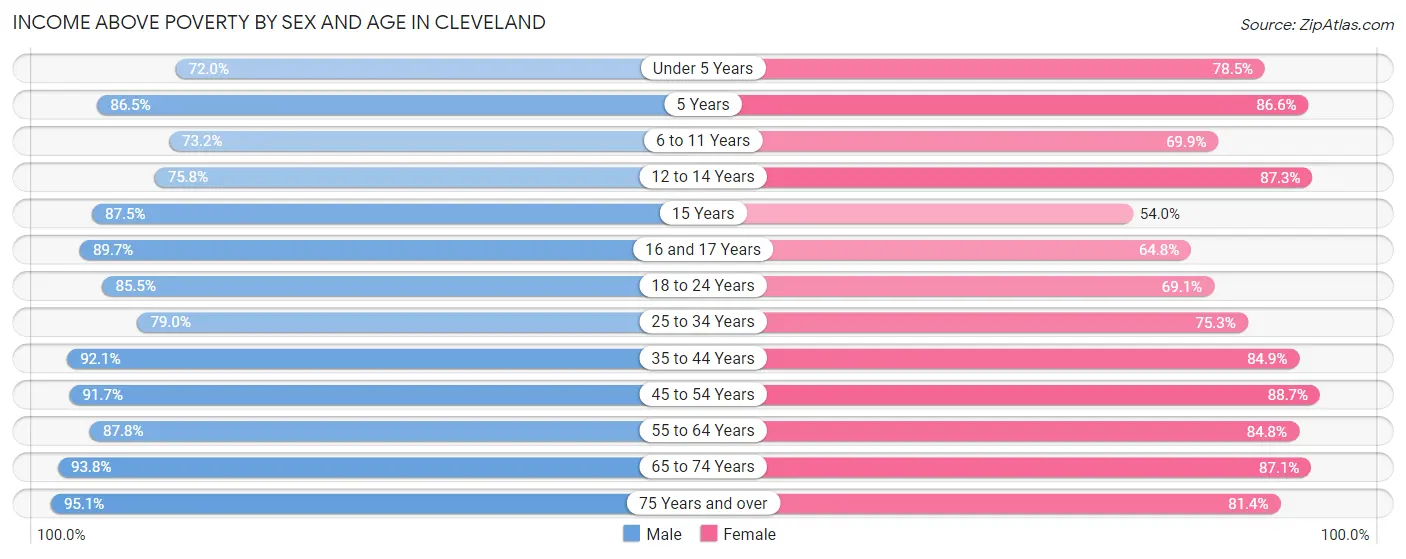
| Age Bracket | Male | Female |
| Under 5 Years | 1,038 (72.0%) | 1,364 (78.5%) |
| 5 Years | 173 (86.5%) | 291 (86.6%) |
| 6 to 11 Years | 1,367 (73.2%) | 1,171 (69.9%) |
| 12 to 14 Years | 505 (75.8%) | 779 (87.3%) |
| 15 Years | 230 (87.5%) | 181 (54.0%) |
| 16 and 17 Years | 445 (89.7%) | 234 (64.8%) |
| 18 to 24 Years | 2,348 (85.5%) | 1,531 (69.1%) |
| 25 to 34 Years | 2,553 (79.0%) | 2,403 (75.3%) |
| 35 to 44 Years | 2,348 (92.1%) | 2,272 (84.9%) |
| 45 to 54 Years | 2,230 (91.7%) | 2,606 (88.7%) |
| 55 to 64 Years | 1,864 (87.8%) | 2,018 (84.8%) |
| 65 to 74 Years | 1,979 (93.8%) | 2,285 (87.1%) |
| 75 Years and over | 932 (95.1%) | 1,650 (81.4%) |
| Total | 18,012 (85.3%) | 18,785 (80.3%) |
Income Below Poverty Among Married-Couple Families in Cleveland
The poverty statistics for married-couple families in Cleveland show that 5.0% or 360 of the total 7,277 families live below the poverty line. Families with 3 or 4 children have the highest poverty rate of 15.0%, comprising of 70 families. On the other hand, families with no children have the lowest poverty rate of 4.2%, which includes 190 families.
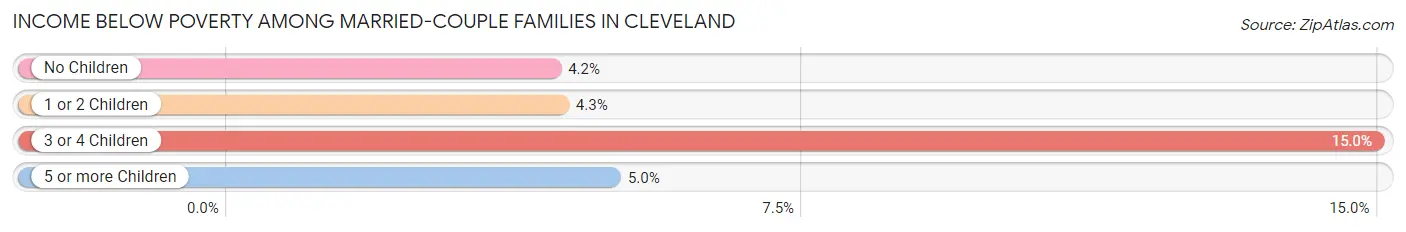
| Children | Above Poverty | Below Poverty |
| No Children | 4,316 (95.8%) | 190 (4.2%) |
| 1 or 2 Children | 2,127 (95.7%) | 96 (4.3%) |
| 3 or 4 Children | 398 (85.0%) | 70 (15.0%) |
| 5 or more Children | 76 (95.0%) | 4 (5.0%) |
| Total | 6,917 (95.1%) | 360 (5.0%) |
Income Below Poverty Among Single-Parent Households in Cleveland
According to the poverty data in Cleveland, 13.0% or 152 single-father households and 35.6% or 906 single-mother households are living below the poverty line. Among single-father households, those with 1 or 2 children have the highest poverty rate, with 126 households (18.2%) experiencing poverty. Likewise, among single-mother households, those with 3 or 4 children have the highest poverty rate, with 394 households (64.7%) falling below the poverty line.
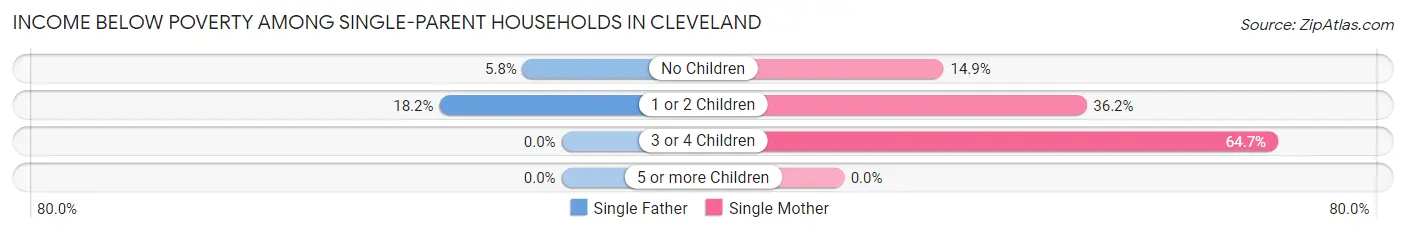
| Children | Single Father | Single Mother |
| No Children | 26 (5.8%) | 132 (14.9%) |
| 1 or 2 Children | 126 (18.2%) | 380 (36.2%) |
| 3 or 4 Children | 0 (0.0%) | 394 (64.7%) |
| 5 or more Children | 0 (0.0%) | 0 (0.0%) |
| Total | 152 (13.0%) | 906 (35.6%) |
Income Below Poverty Among Married-Couple vs Single-Parent Households in Cleveland
The poverty data for Cleveland shows that 360 of the married-couple family households (5.0%) and 1,058 of the single-parent households (28.5%) are living below the poverty level. Within the married-couple family households, those with 3 or 4 children have the highest poverty rate, with 70 households (15.0%) falling below the poverty line. Among the single-parent households, those with 3 or 4 children have the highest poverty rate, with 394 household (64.0%) living below poverty.
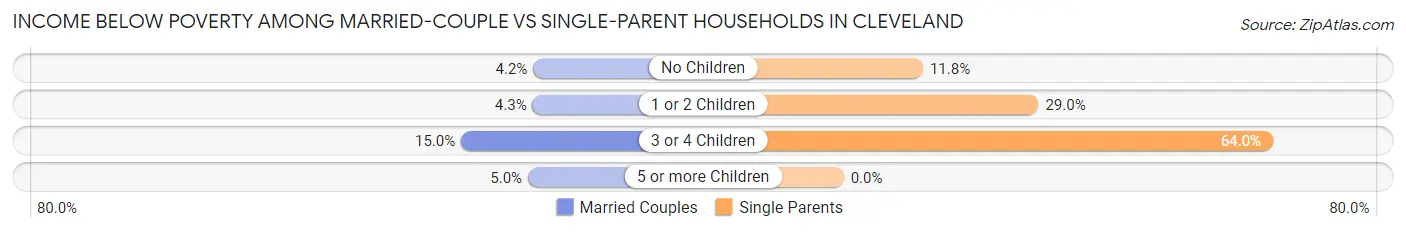
| Children | Married-Couple Families | Single-Parent Households |
| No Children | 190 (4.2%) | 158 (11.8%) |
| 1 or 2 Children | 96 (4.3%) | 506 (29.0%) |
| 3 or 4 Children | 70 (15.0%) | 394 (64.0%) |
| 5 or more Children | 4 (5.0%) | 0 (0.0%) |
| Total | 360 (5.0%) | 1,058 (28.5%) |
Race in Cleveland
The most populous races in Cleveland are White / Caucasian (37,761 | 79.1%), Hispanic or Latino (4,522 | 9.5%), and Black / African American (4,037 | 8.5%).
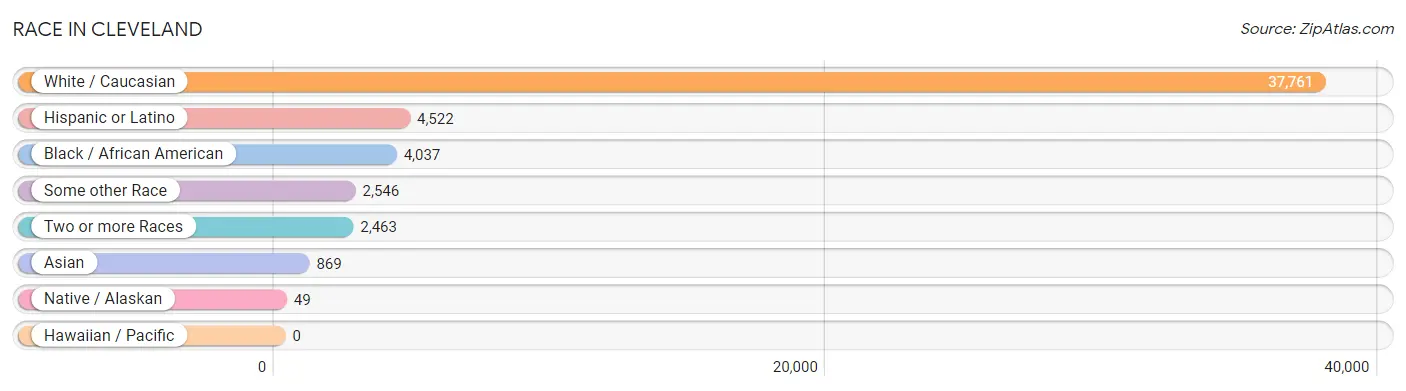
| Race | # Population | % Population |
| Asian | 869 | 1.8% |
| Black / African American | 4,037 | 8.5% |
| Hawaiian / Pacific | 0 | 0.0% |
| Hispanic or Latino | 4,522 | 9.5% |
| Native / Alaskan | 49 | 0.1% |
| White / Caucasian | 37,761 | 79.1% |
| Two or more Races | 2,463 | 5.2% |
| Some other Race | 2,546 | 5.3% |
| Total | 47,725 | 100.0% |
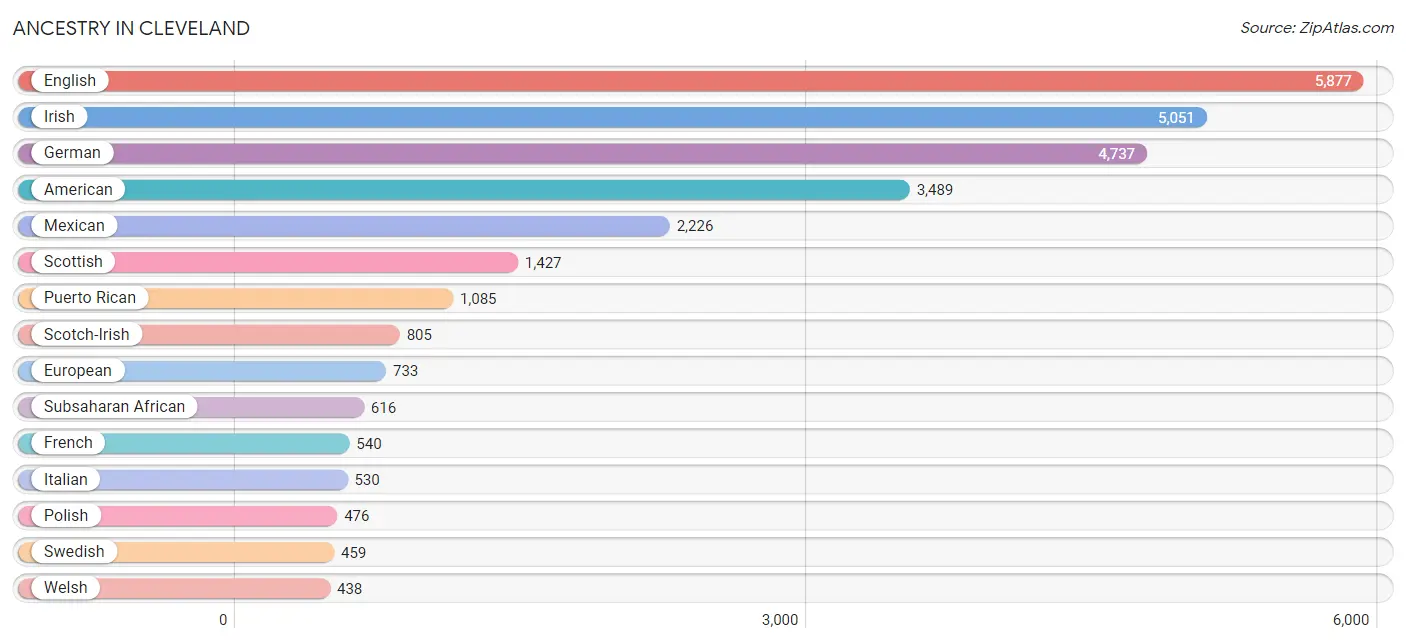
Ancestry in Cleveland
The most populous ancestries reported in Cleveland are English (5,877 | 12.3%), Irish (5,051 | 10.6%), German (4,737 | 9.9%), American (3,489 | 7.3%), and Mexican (2,226 | 4.7%), together accounting for 44.8% of all Cleveland residents.
| Ancestry | # Population | % Population |
| African | 256 | 0.5% |
| Alaska Native | 3 | 0.0% |
| Aleut | 66 | 0.1% |
| Alsatian | 24 | 0.1% |
| American | 3,489 | 7.3% |
| Arab | 101 | 0.2% |
| Argentinean | 9 | 0.0% |
| Assyrian / Chaldean / Syriac | 15 | 0.0% |
| Austrian | 18 | 0.0% |
| Bahamian | 4 | 0.0% |
| Belgian | 38 | 0.1% |
| Bhutanese | 7 | 0.0% |
| Blackfeet | 3 | 0.0% |
| Brazilian | 35 | 0.1% |
| British | 378 | 0.8% |
| British West Indian | 78 | 0.2% |
| Bulgarian | 39 | 0.1% |
| Burmese | 95 | 0.2% |
| Canadian | 8 | 0.0% |
| Central American | 257 | 0.5% |
| Cherokee | 184 | 0.4% |
| Cheyenne | 2 | 0.0% |
| Chilean | 12 | 0.0% |
| Choctaw | 7 | 0.0% |
| Colombian | 71 | 0.2% |
| Costa Rican | 20 | 0.0% |
| Croatian | 27 | 0.1% |
| Crow | 29 | 0.1% |
| Cuban | 123 | 0.3% |
| Czech | 102 | 0.2% |
| Czechoslovakian | 37 | 0.1% |
| Danish | 179 | 0.4% |
| Dominican | 428 | 0.9% |
| Dutch | 417 | 0.9% |
| Eastern European | 96 | 0.2% |
| Ecuadorian | 10 | 0.0% |
| Egyptian | 57 | 0.1% |
| English | 5,877 | 12.3% |
| European | 733 | 1.5% |
| Finnish | 23 | 0.1% |
| French | 540 | 1.1% |
| French Canadian | 173 | 0.4% |
| German | 4,737 | 9.9% |
| Greek | 96 | 0.2% |
| Guatemalan | 134 | 0.3% |
| Haitian | 49 | 0.1% |
| Honduran | 19 | 0.0% |
| Hungarian | 97 | 0.2% |
| Indian (Asian) | 103 | 0.2% |
| Inupiat | 7 | 0.0% |
| Irish | 5,051 | 10.6% |
| Italian | 530 | 1.1% |
| Jamaican | 27 | 0.1% |
| Kenyan | 24 | 0.1% |
| Korean | 282 | 0.6% |
| Laotian | 6 | 0.0% |
| Liberian | 20 | 0.0% |
| Lithuanian | 35 | 0.1% |
| Lumbee | 36 | 0.1% |
| Luxembourger | 4 | 0.0% |
| Malaysian | 40 | 0.1% |
| Mexican | 2,226 | 4.7% |
| Mexican American Indian | 7 | 0.0% |
| Native Hawaiian | 62 | 0.1% |
| New Zealander | 26 | 0.1% |
| Nicaraguan | 26 | 0.1% |
| Nigerian | 233 | 0.5% |
| Northern European | 49 | 0.1% |
| Norwegian | 139 | 0.3% |
| Pakistani | 26 | 0.1% |
| Panamanian | 12 | 0.0% |
| Pennsylvania German | 11 | 0.0% |
| Peruvian | 21 | 0.0% |
| Polish | 476 | 1.0% |
| Portuguese | 90 | 0.2% |
| Puerto Rican | 1,085 | 2.3% |
| Romanian | 27 | 0.1% |
| Russian | 429 | 0.9% |
| Salvadoran | 46 | 0.1% |
| Scandinavian | 191 | 0.4% |
| Scotch-Irish | 805 | 1.7% |
| Scottish | 1,427 | 3.0% |
| Slovak | 39 | 0.1% |
| South African | 57 | 0.1% |
| South American | 243 | 0.5% |
| Spaniard | 30 | 0.1% |
| Spanish | 10 | 0.0% |
| Sri Lankan | 146 | 0.3% |
| Subsaharan African | 616 | 1.3% |
| Swedish | 459 | 1.0% |
| Swiss | 52 | 0.1% |
| Thai | 237 | 0.5% |
| Trinidadian and Tobagonian | 7 | 0.0% |
| U.S. Virgin Islander | 42 | 0.1% |
| Ukrainian | 201 | 0.4% |
| Venezuelan | 120 | 0.3% |
| Welsh | 438 | 0.9% |
| West Indian | 7 | 0.0% | View All 98 Rows |
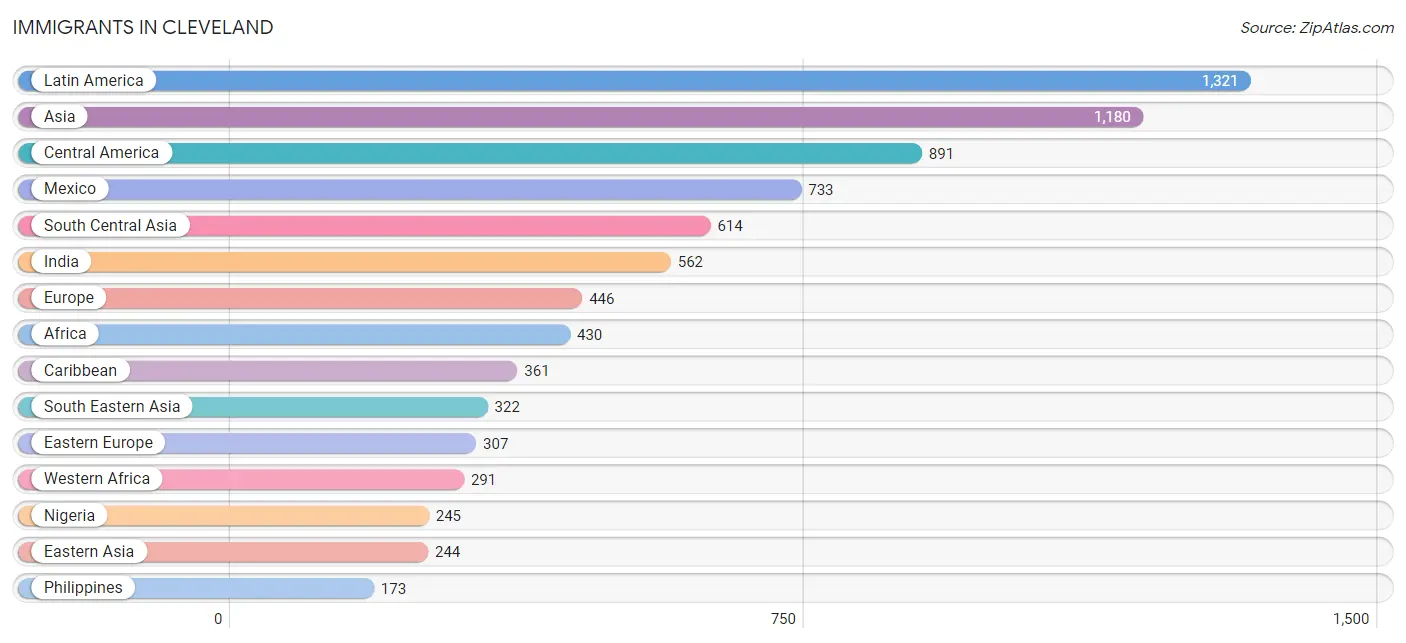
Immigrants in Cleveland
The most numerous immigrant groups reported in Cleveland came from Latin America (1,321 | 2.8%), Asia (1,180 | 2.5%), Central America (891 | 1.9%), Mexico (733 | 1.5%), and South Central Asia (614 | 1.3%), together accounting for 9.9% of all Cleveland residents.
| Immigration Origin | # Population | % Population |
| Africa | 430 | 0.9% |
| Asia | 1,180 | 2.5% |
| Bahamas | 100 | 0.2% |
| Bulgaria | 30 | 0.1% |
| Canada | 95 | 0.2% |
| Caribbean | 361 | 0.8% |
| Central America | 891 | 1.9% |
| Chile | 24 | 0.1% |
| China | 101 | 0.2% |
| Colombia | 17 | 0.0% |
| Costa Rica | 20 | 0.0% |
| Cuba | 18 | 0.0% |
| Dominican Republic | 166 | 0.4% |
| Eastern Africa | 98 | 0.2% |
| Eastern Asia | 244 | 0.5% |
| Eastern Europe | 307 | 0.6% |
| Ecuador | 10 | 0.0% |
| Egypt | 28 | 0.1% |
| England | 38 | 0.1% |
| Europe | 446 | 0.9% |
| Germany | 15 | 0.0% |
| Guatemala | 119 | 0.3% |
| Haiti | 3 | 0.0% |
| Honduras | 19 | 0.0% |
| India | 562 | 1.2% |
| Ireland | 14 | 0.0% |
| Kenya | 24 | 0.1% |
| Korea | 143 | 0.3% |
| Laos | 40 | 0.1% |
| Latin America | 1,321 | 2.8% |
| Liberia | 20 | 0.0% |
| Mexico | 733 | 1.5% |
| Nepal | 4 | 0.0% |
| Netherlands | 24 | 0.1% |
| Nigeria | 245 | 0.5% |
| Northern Africa | 41 | 0.1% |
| Northern Europe | 91 | 0.2% |
| Pakistan | 48 | 0.1% |
| Peru | 18 | 0.0% |
| Philippines | 173 | 0.4% |
| Romania | 26 | 0.1% |
| Russia | 152 | 0.3% |
| Scotland | 25 | 0.1% |
| South America | 69 | 0.1% |
| South Central Asia | 614 | 1.3% |
| South Eastern Asia | 322 | 0.7% |
| Southern Europe | 9 | 0.0% |
| Spain | 9 | 0.0% |
| Sudan | 13 | 0.0% |
| Sweden | 14 | 0.0% |
| Thailand | 11 | 0.0% |
| Trinidad and Tobago | 34 | 0.1% |
| Ukraine | 99 | 0.2% |
| Vietnam | 98 | 0.2% |
| Western Africa | 291 | 0.6% |
| Western Europe | 39 | 0.1% |
| Zimbabwe | 74 | 0.2% | View All 57 Rows |
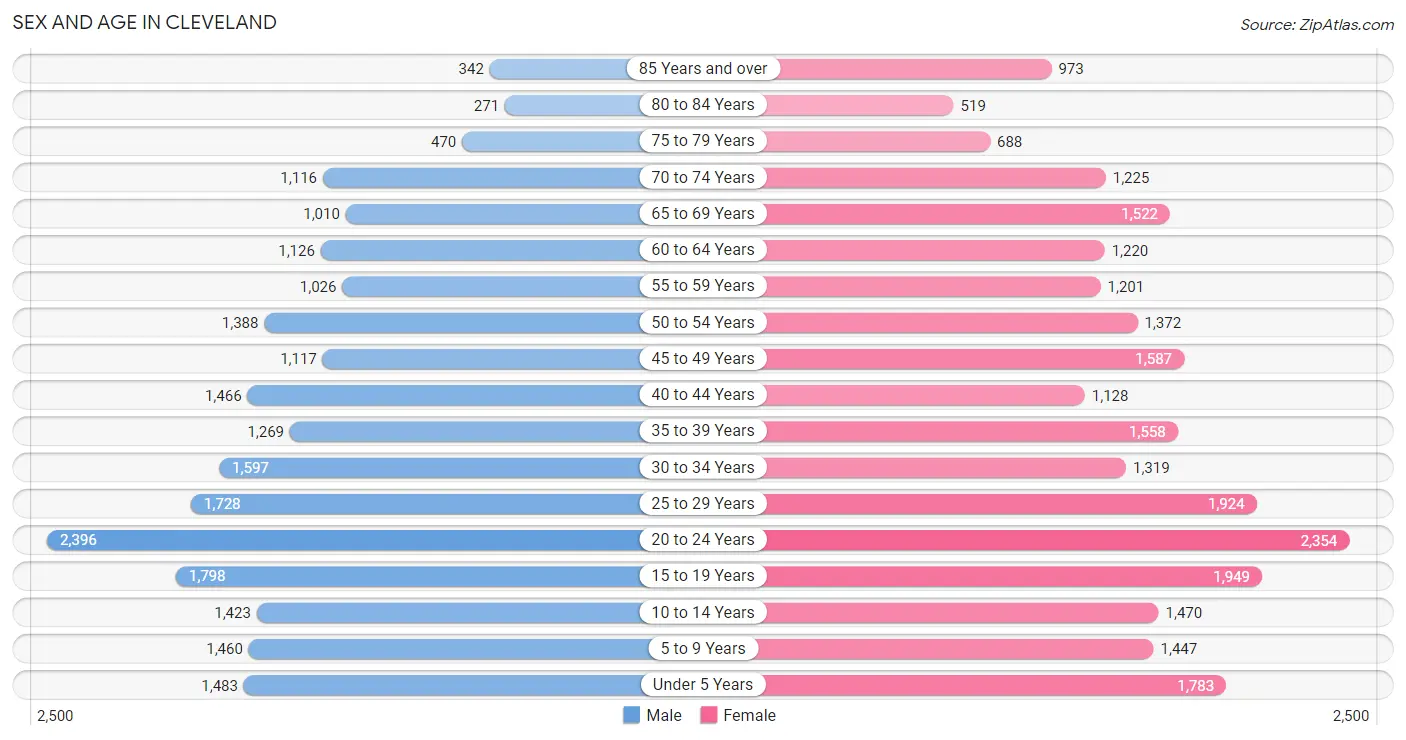
Sex and Age in Cleveland
Sex and Age in Cleveland
The most populous age groups in Cleveland are 20 to 24 Years (2,396 | 10.7%) for men and 20 to 24 Years (2,354 | 9.3%) for women.
| Age Bracket | Male | Female |
| Under 5 Years | 1,483 (6.6%) | 1,783 (7.1%) |
| 5 to 9 Years | 1,460 (6.5%) | 1,447 (5.7%) |
| 10 to 14 Years | 1,423 (6.3%) | 1,470 (5.8%) |
| 15 to 19 Years | 1,798 (8.0%) | 1,949 (7.7%) |
| 20 to 24 Years | 2,396 (10.7%) | 2,354 (9.3%) |
| 25 to 29 Years | 1,728 (7.7%) | 1,924 (7.6%) |
| 30 to 34 Years | 1,597 (7.1%) | 1,319 (5.2%) |
| 35 to 39 Years | 1,269 (5.6%) | 1,558 (6.2%) |
| 40 to 44 Years | 1,466 (6.5%) | 1,128 (4.5%) |
| 45 to 49 Years | 1,117 (5.0%) | 1,587 (6.3%) |
| 50 to 54 Years | 1,388 (6.2%) | 1,372 (5.4%) |
| 55 to 59 Years | 1,026 (4.6%) | 1,201 (4.8%) |
| 60 to 64 Years | 1,126 (5.0%) | 1,220 (4.8%) |
| 65 to 69 Years | 1,010 (4.5%) | 1,522 (6.0%) |
| 70 to 74 Years | 1,116 (5.0%) | 1,225 (4.9%) |
| 75 to 79 Years | 470 (2.1%) | 688 (2.7%) |
| 80 to 84 Years | 271 (1.2%) | 519 (2.1%) |
| 85 Years and over | 342 (1.5%) | 973 (3.9%) |
| Total | 22,486 (100.0%) | 25,239 (100.0%) |
Families and Households in Cleveland
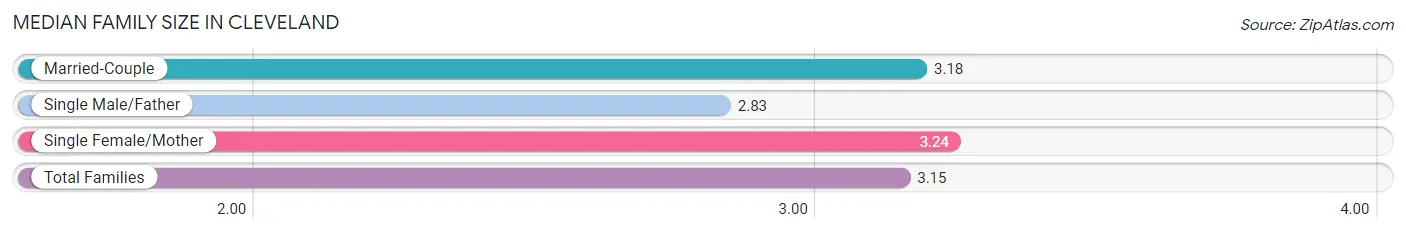
Median Family Size in Cleveland
The median family size in Cleveland is 3.15 persons per family, with single female/mother families (2,547 | 23.2%) accounting for the largest median family size of 3.24 persons per family. On the other hand, single male/father families (1,168 | 10.6%) represent the smallest median family size with 2.83 persons per family.
| Family Type | # Families | Family Size |
| Married-Couple | 7,277 (66.2%) | 3.18 |
| Single Male/Father | 1,168 (10.6%) | 2.83 |
| Single Female/Mother | 2,547 (23.2%) | 3.24 |
| Total Families | 10,992 (100.0%) | 3.15 |
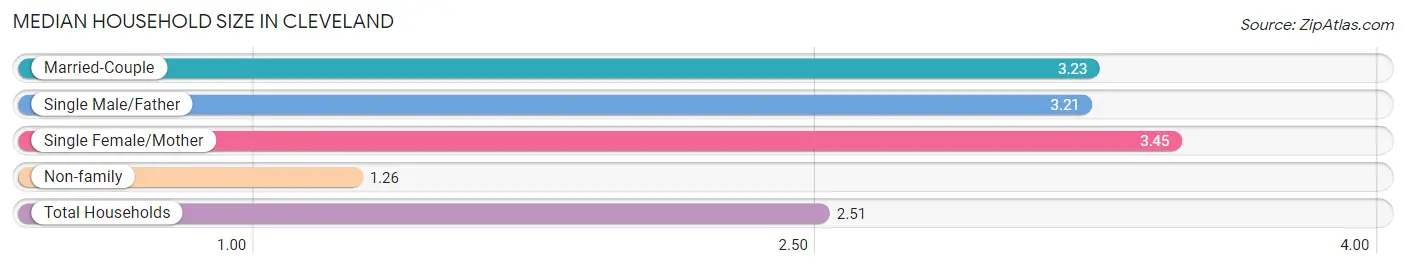
Median Household Size in Cleveland
The median household size in Cleveland is 2.51 persons per household, with single female/mother households (2,547 | 14.3%) accounting for the largest median household size of 3.45 persons per household. non-family households (6,809 | 38.3%) represent the smallest median household size with 1.26 persons per household.
| Household Type | # Households | Household Size |
| Married-Couple | 7,277 (40.9%) | 3.23 |
| Single Male/Father | 1,168 (6.6%) | 3.21 |
| Single Female/Mother | 2,547 (14.3%) | 3.45 |
| Non-family | 6,809 (38.3%) | 1.26 |
| Total Households | 17,801 (100.0%) | 2.51 |
Household Size by Marriage Status in Cleveland
Out of a total of 17,801 households in Cleveland, 10,992 (61.8%) are family households, while 6,809 (38.3%) are nonfamily households. The most numerous type of family households are 2-person households, comprising 4,525, and the most common type of nonfamily households are 1-person households, comprising 5,608.
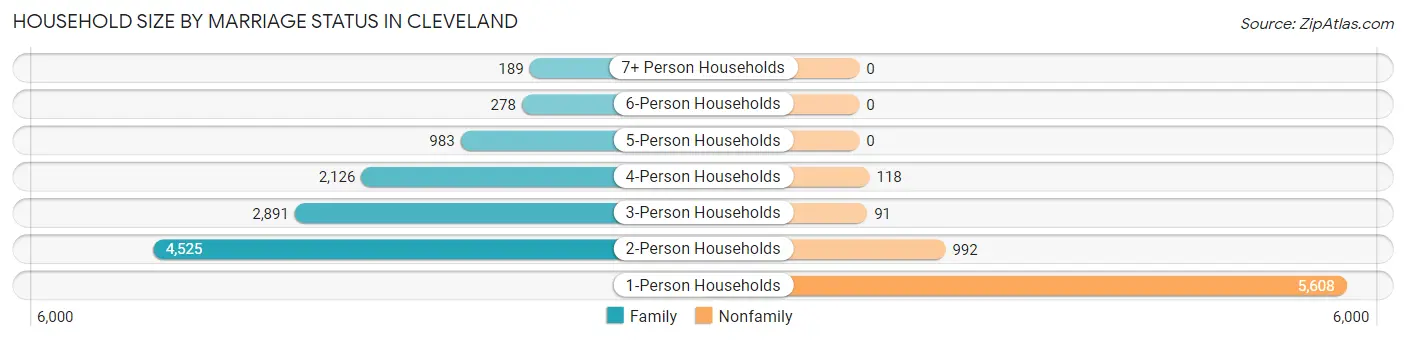
| Household Size | Family Households | Nonfamily Households |
| 1-Person Households | - | 5,608 (31.5%) |
| 2-Person Households | 4,525 (25.4%) | 992 (5.6%) |
| 3-Person Households | 2,891 (16.2%) | 91 (0.5%) |
| 4-Person Households | 2,126 (11.9%) | 118 (0.7%) |
| 5-Person Households | 983 (5.5%) | 0 (0.0%) |
| 6-Person Households | 278 (1.6%) | 0 (0.0%) |
| 7+ Person Households | 189 (1.1%) | 0 (0.0%) |
| Total | 10,992 (61.8%) | 6,809 (38.3%) |
Female Fertility in Cleveland
Fertility by Age in Cleveland
Average fertility rate in Cleveland is 70.0 births per 1,000 women. Women in the age bracket of 20 to 34 years have the highest fertility rate with 99.0 births per 1,000 women. Women in the age bracket of 20 to 34 years acount for 65.0% of all women with births.
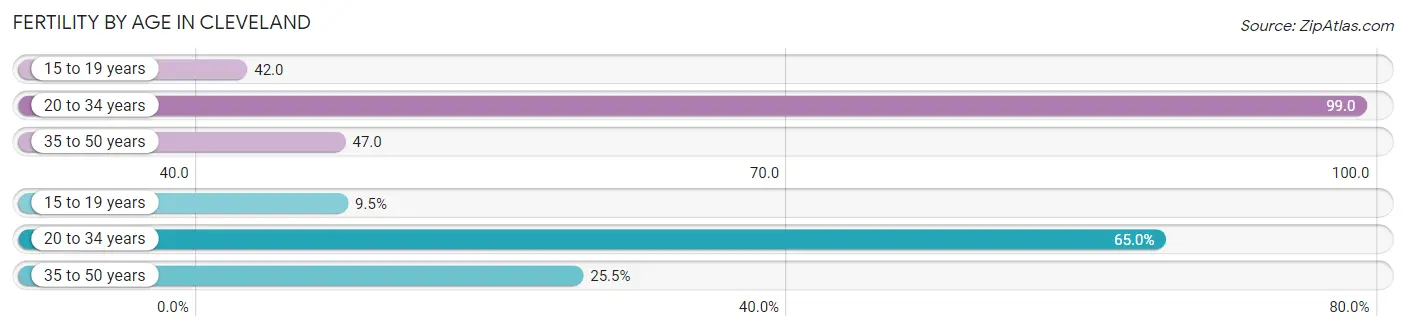
| Age Bracket | Women with Births | Births / 1,000 Women |
| 15 to 19 years | 81 (9.5%) | 42.0 |
| 20 to 34 years | 554 (65.0%) | 99.0 |
| 35 to 50 years | 217 (25.5%) | 47.0 |
| Total | 852 (100.0%) | 70.0 |
Fertility by Age by Marriage Status in Cleveland
50.1% of women with births (852) in Cleveland are married. The highest percentage of unmarried women with births falls into 15 to 19 years age bracket with 84.0% of them unmarried at the time of birth, while the lowest percentage of unmarried women with births belong to 20 to 34 years age bracket with 46.0% of them unmarried.
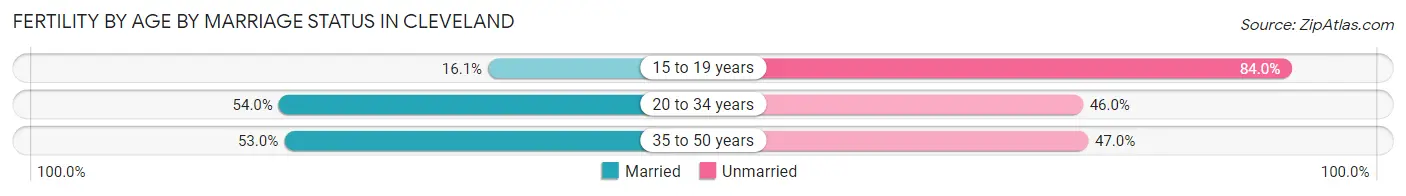
| Age Bracket | Married | Unmarried |
| 15 to 19 years | 13 (16.1%) | 68 (84.0%) |
| 20 to 34 years | 299 (54.0%) | 255 (46.0%) |
| 35 to 50 years | 115 (53.0%) | 102 (47.0%) |
| Total | 427 (50.1%) | 425 (49.9%) |
Fertility by Education in Cleveland
Average fertility rate in Cleveland is 70.0 births per 1,000 women. Women with the education attainment of high school diploma have the highest fertility rate of 106.0 births per 1,000 women, while women with the education attainment of bachelor's degree have the lowest fertility at 21.0 births per 1,000 women. Women with the education attainment of high school diploma represent 36.1% of all women with births.
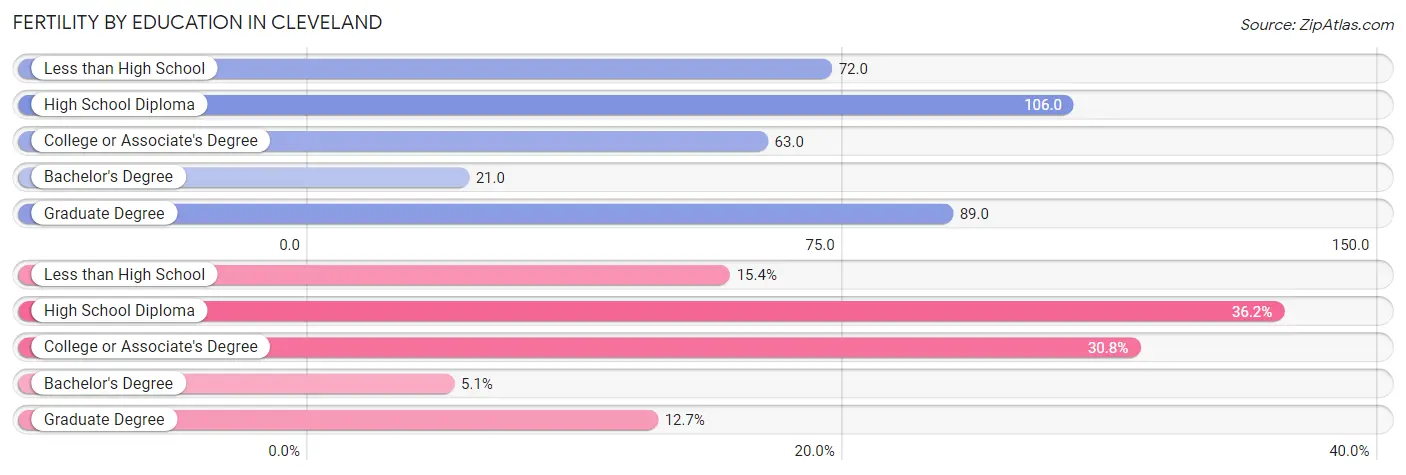
| Educational Attainment | Women with Births | Births / 1,000 Women |
| Less than High School | 131 (15.4%) | 72.0 |
| High School Diploma | 308 (36.1%) | 106.0 |
| College or Associate's Degree | 262 (30.7%) | 63.0 |
| Bachelor's Degree | 43 (5.1%) | 21.0 |
| Graduate Degree | 108 (12.7%) | 89.0 |
| Total | 852 (100.0%) | 70.0 |
Fertility by Education by Marriage Status in Cleveland
49.9% of women with births in Cleveland are unmarried. Women with the educational attainment of graduate degree are most likely to be married with 90.7% of them married at childbirth, while women with the educational attainment of college or associate's degree are least likely to be married with 70.2% of them unmarried at childbirth.

| Educational Attainment | Married | Unmarried |
| Less than High School | 100 (76.3%) | 31 (23.7%) |
| High School Diploma | 121 (39.3%) | 187 (60.7%) |
| College or Associate's Degree | 78 (29.8%) | 184 (70.2%) |
| Bachelor's Degree | 30 (69.8%) | 13 (30.2%) |
| Graduate Degree | 98 (90.7%) | 10 (9.3%) |
| Total | 427 (50.1%) | 425 (49.9%) |
Employment Characteristics in Cleveland
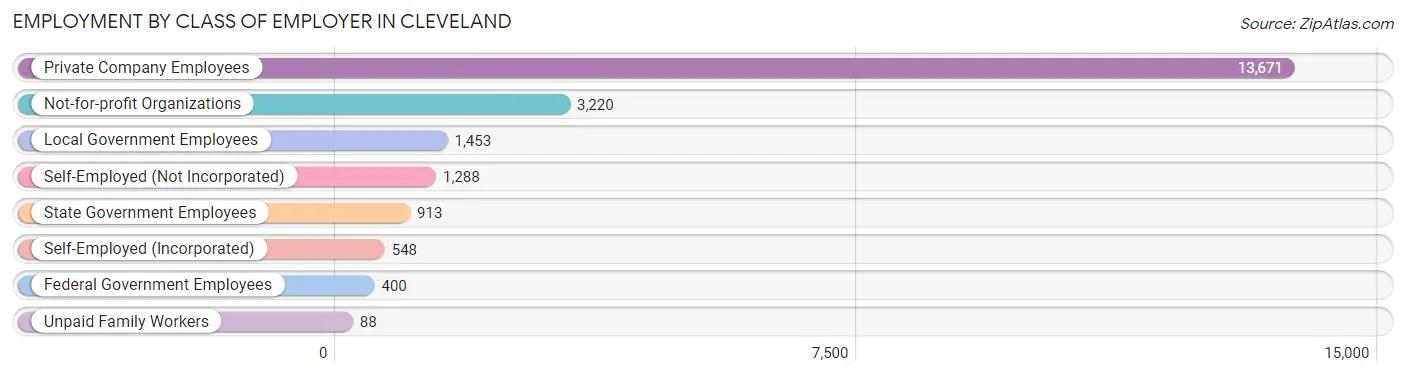
Employment by Class of Employer in Cleveland
Among the 21,581 employed individuals in Cleveland, private company employees (13,671 | 63.3%), not-for-profit organizations (3,220 | 14.9%), and local government employees (1,453 | 6.7%) make up the most common classes of employment.
| Employer Class | # Employees | % Employees |
| Private Company Employees | 13,671 | 63.3% |
| Self-Employed (Incorporated) | 548 | 2.5% |
| Self-Employed (Not Incorporated) | 1,288 | 6.0% |
| Not-for-profit Organizations | 3,220 | 14.9% |
| Local Government Employees | 1,453 | 6.7% |
| State Government Employees | 913 | 4.2% |
| Federal Government Employees | 400 | 1.8% |
| Unpaid Family Workers | 88 | 0.4% |
| Total | 21,581 | 100.0% |
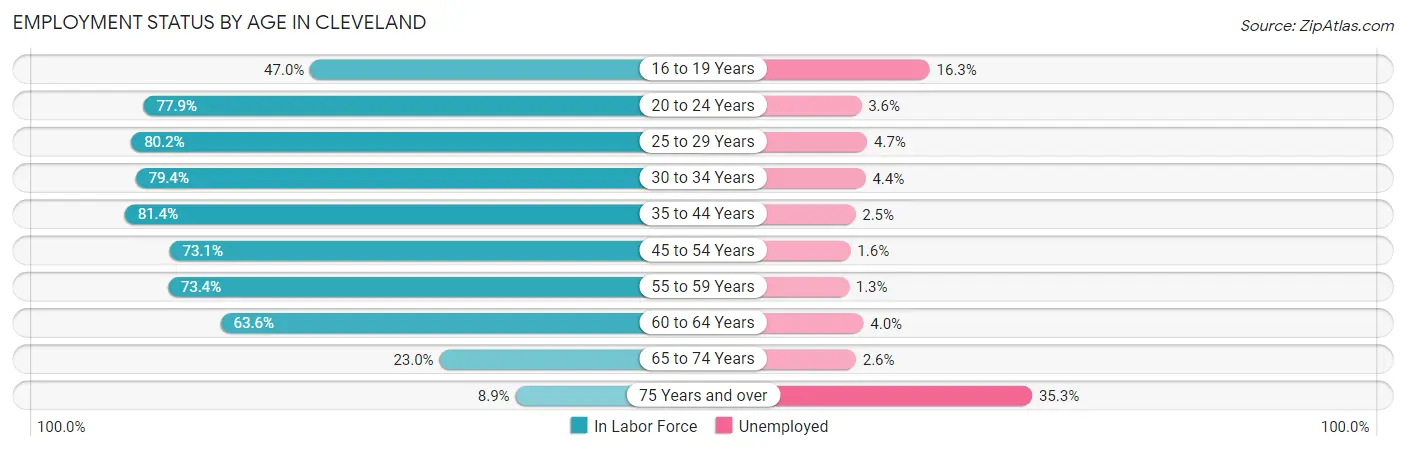
Employment Status by Age in Cleveland
According to the labor force statistics for Cleveland, out of the total population over 16 years of age (38,061), 61.4% or 23,369 individuals are in the labor force, with 4.3% or 1,005 of them unemployed. The age group with the highest labor force participation rate is 35 to 44 years, with 81.4% or 4,413 individuals in the labor force. Within the labor force, the 75 years and over age range has the highest percentage of unemployed individuals, with 35.3% or 102 of them being unemployed.
| Age Bracket | In Labor Force | Unemployed |
| 16 to 19 Years | 1,480 (47.0%) | 241 (16.3%) |
| 20 to 24 Years | 3,700 (77.9%) | 133 (3.6%) |
| 25 to 29 Years | 2,929 (80.2%) | 138 (4.7%) |
| 30 to 34 Years | 2,315 (79.4%) | 102 (4.4%) |
| 35 to 44 Years | 4,413 (81.4%) | 110 (2.5%) |
| 45 to 54 Years | 3,994 (73.1%) | 64 (1.6%) |
| 55 to 59 Years | 1,635 (73.4%) | 21 (1.3%) |
| 60 to 64 Years | 1,492 (63.6%) | 60 (4.0%) |
| 65 to 74 Years | 1,121 (23.0%) | 29 (2.6%) |
| 75 Years and over | 290 (8.9%) | 102 (35.3%) |
| Total | 23,369 (61.4%) | 1,005 (4.3%) |
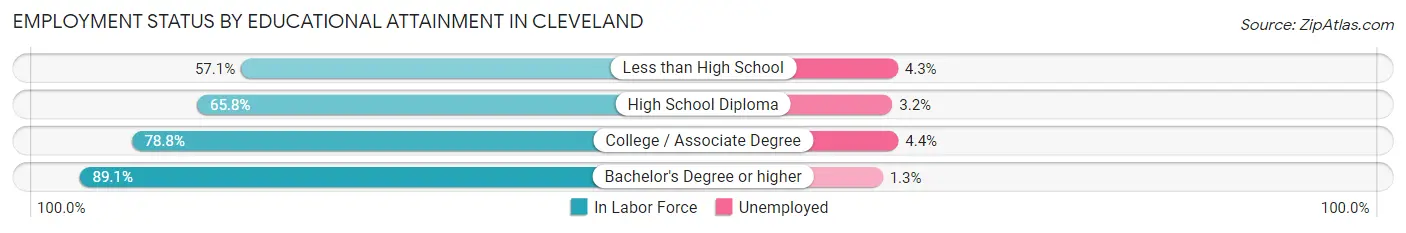
Employment Status by Educational Attainment in Cleveland
According to labor force statistics for Cleveland, 76.2% of individuals (16,784) out of the total population between 25 and 64 years of age (22,026) are in the labor force, with 2.9% or 487 of them being unemployed. The group with the highest labor force participation rate are those with the educational attainment of bachelor's degree or higher, with 89.1% or 6,178 individuals in the labor force. Within the labor force, individuals with college / associate degree education have the highest percentage of unemployment, with 4.4% or 232 of them being unemployed.
| Educational Attainment | In Labor Force | Unemployed |
| Less than High School | 1,346 (57.1%) | 101 (4.3%) |
| High School Diploma | 3,978 (65.8%) | 193 (3.2%) |
| College / Associate Degree | 5,270 (78.8%) | 294 (4.4%) |
| Bachelor's Degree or higher | 6,178 (89.1%) | 90 (1.3%) |
| Total | 16,784 (76.2%) | 639 (2.9%) |
Employment Occupations by Sex in Cleveland
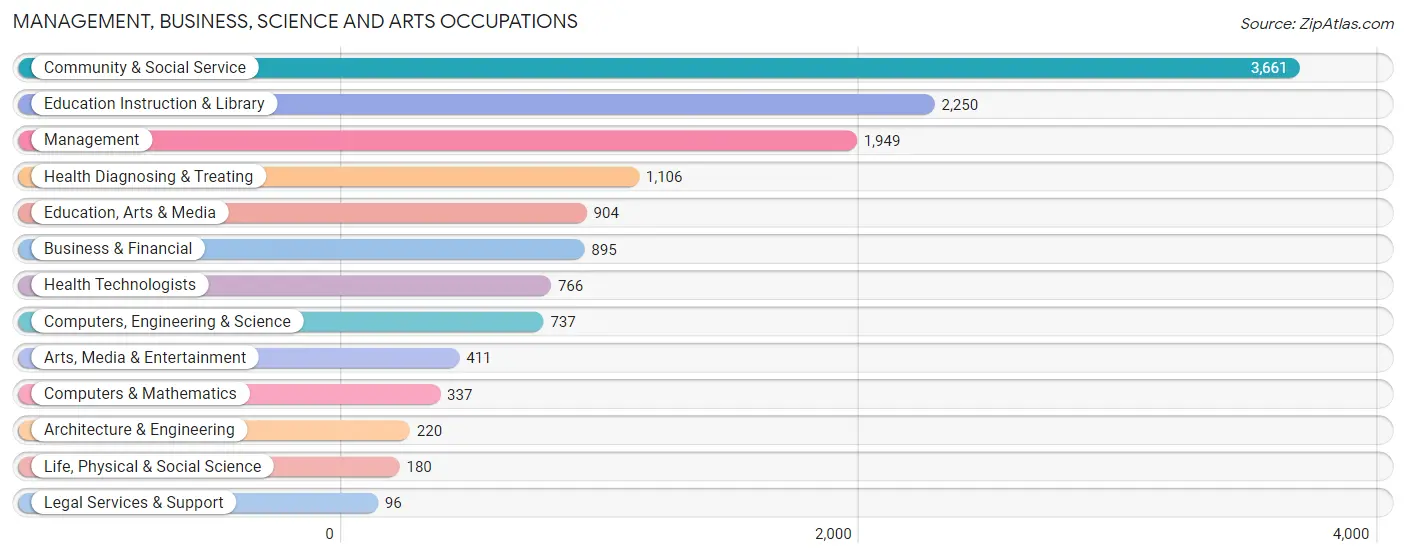
Management, Business, Science and Arts Occupations
The most common Management, Business, Science and Arts occupations in Cleveland are Community & Social Service (3,661 | 16.4%), Education Instruction & Library (2,250 | 10.1%), Management (1,949 | 8.7%), Health Diagnosing & Treating (1,106 | 5.0%), and Education, Arts & Media (904 | 4.0%).
Management, Business, Science and Arts Occupations by Sex
Within the Management, Business, Science and Arts occupations in Cleveland, the most male-oriented occupations are Computers & Mathematics (82.8%), Architecture & Engineering (80.4%), and Computers, Engineering & Science (76.3%), while the most female-oriented occupations are Health Diagnosing & Treating (74.9%), Health Technologists (71.8%), and Education Instruction & Library (69.4%).
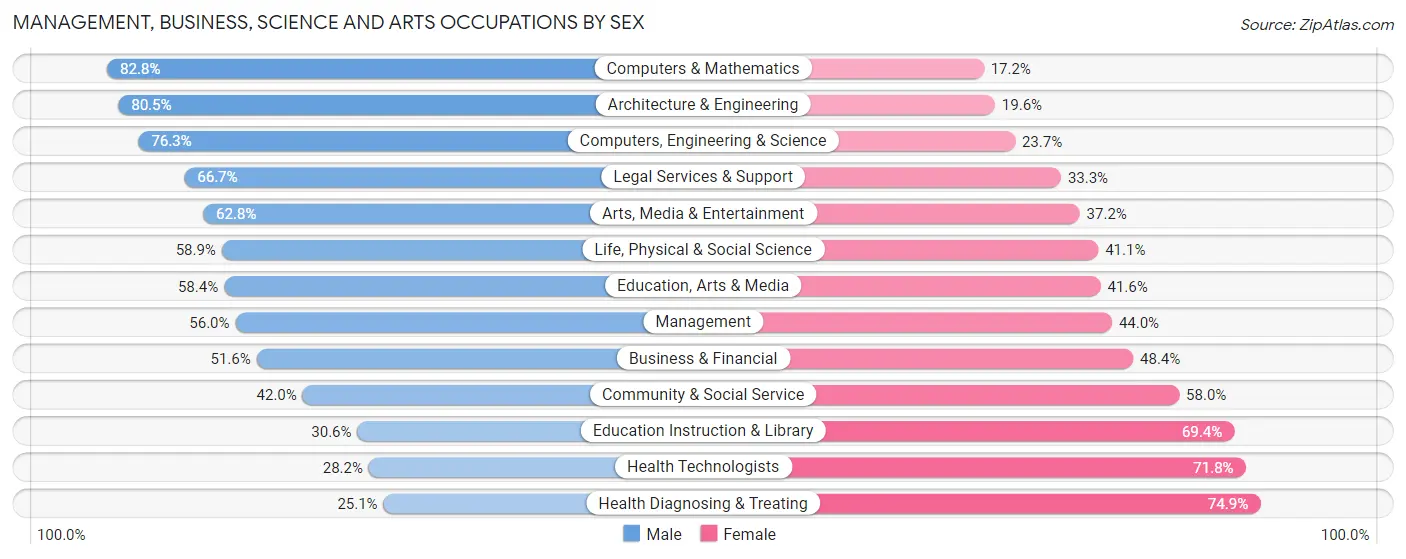
| Occupation | Male | Female |
| Management | 1,092 (56.0%) | 857 (44.0%) |
| Business & Financial | 462 (51.6%) | 433 (48.4%) |
| Computers, Engineering & Science | 562 (76.3%) | 175 (23.7%) |
| Computers & Mathematics | 279 (82.8%) | 58 (17.2%) |
| Architecture & Engineering | 177 (80.4%) | 43 (19.6%) |
| Life, Physical & Social Science | 106 (58.9%) | 74 (41.1%) |
| Community & Social Service | 1,538 (42.0%) | 2,123 (58.0%) |
| Education, Arts & Media | 528 (58.4%) | 376 (41.6%) |
| Legal Services & Support | 64 (66.7%) | 32 (33.3%) |
| Education Instruction & Library | 688 (30.6%) | 1,562 (69.4%) |
| Arts, Media & Entertainment | 258 (62.8%) | 153 (37.2%) |
| Health Diagnosing & Treating | 278 (25.1%) | 828 (74.9%) |
| Health Technologists | 216 (28.2%) | 550 (71.8%) |
| Total (Category) | 3,932 (47.1%) | 4,416 (52.9%) |
| Total (Overall) | 11,037 (49.4%) | 11,321 (50.6%) |
Services Occupations
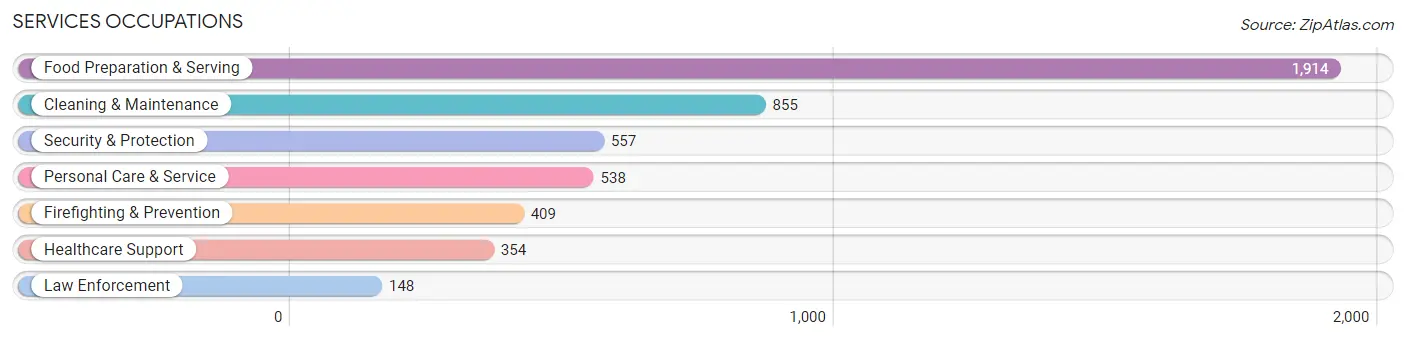
The most common Services occupations in Cleveland are Food Preparation & Serving (1,914 | 8.6%), Cleaning & Maintenance (855 | 3.8%), Security & Protection (557 | 2.5%), Personal Care & Service (538 | 2.4%), and Firefighting & Prevention (409 | 1.8%).
Services Occupations by Sex
Within the Services occupations in Cleveland, the most male-oriented occupations are Law Enforcement (94.6%), Security & Protection (71.3%), and Firefighting & Prevention (62.8%), while the most female-oriented occupations are Healthcare Support (91.0%), Personal Care & Service (81.6%), and Food Preparation & Serving (62.8%).
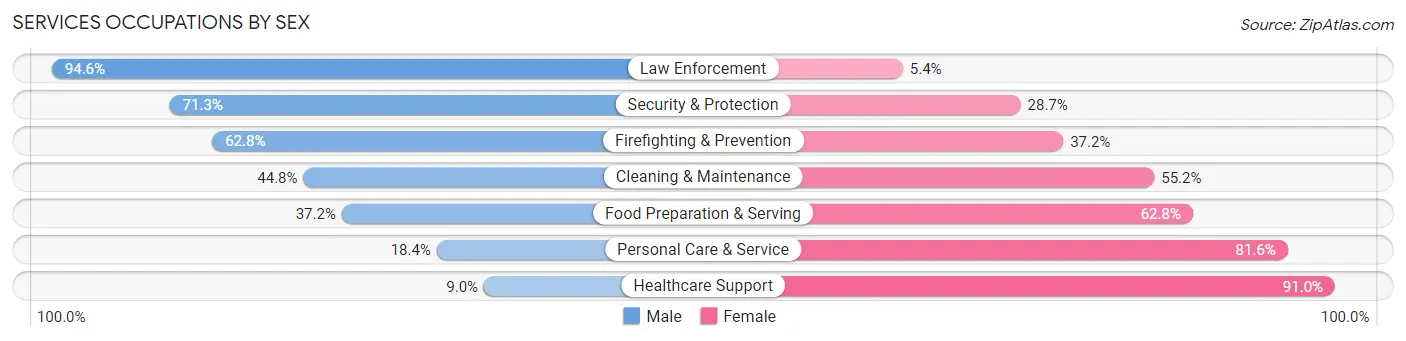
| Occupation | Male | Female |
| Healthcare Support | 32 (9.0%) | 322 (91.0%) |
| Security & Protection | 397 (71.3%) | 160 (28.7%) |
| Firefighting & Prevention | 257 (62.8%) | 152 (37.2%) |
| Law Enforcement | 140 (94.6%) | 8 (5.4%) |
| Food Preparation & Serving | 712 (37.2%) | 1,202 (62.8%) |
| Cleaning & Maintenance | 383 (44.8%) | 472 (55.2%) |
| Personal Care & Service | 99 (18.4%) | 439 (81.6%) |
| Total (Category) | 1,623 (38.5%) | 2,595 (61.5%) |
| Total (Overall) | 11,037 (49.4%) | 11,321 (50.6%) |
Sales and Office Occupations
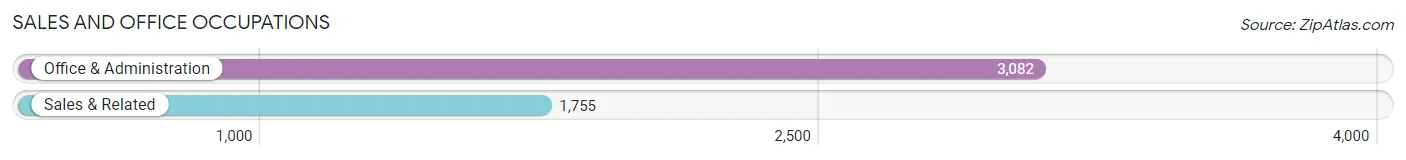
The most common Sales and Office occupations in Cleveland are Office & Administration (3,082 | 13.8%), and Sales & Related (1,755 | 7.9%).
Sales and Office Occupations by Sex
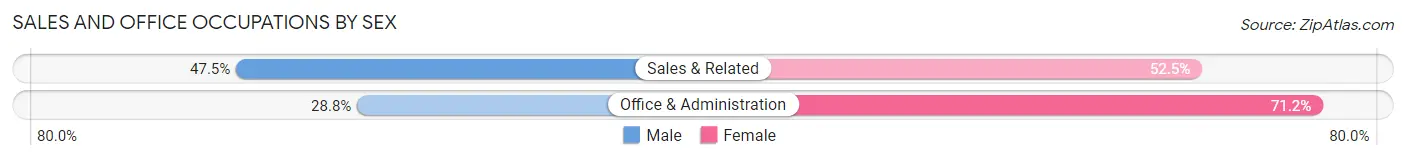
| Occupation | Male | Female |
| Sales & Related | 833 (47.5%) | 922 (52.5%) |
| Office & Administration | 889 (28.8%) | 2,193 (71.2%) |
| Total (Category) | 1,722 (35.6%) | 3,115 (64.4%) |
| Total (Overall) | 11,037 (49.4%) | 11,321 (50.6%) |
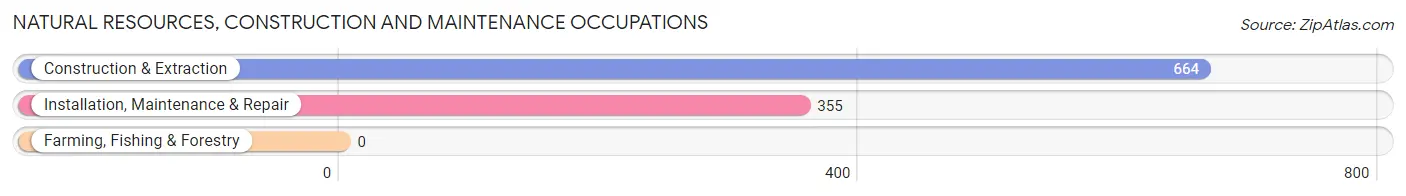
Natural Resources, Construction and Maintenance Occupations
The most common Natural Resources, Construction and Maintenance occupations in Cleveland are Construction & Extraction (664 | 3.0%), and Installation, Maintenance & Repair (355 | 1.6%).
Natural Resources, Construction and Maintenance Occupations by Sex
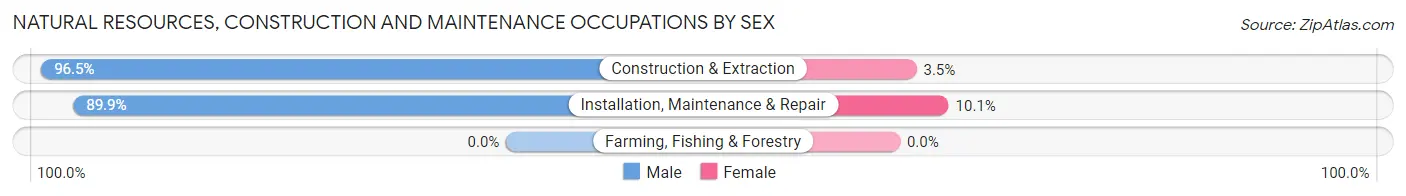
| Occupation | Male | Female |
| Farming, Fishing & Forestry | 0 (0.0%) | 0 (0.0%) |
| Construction & Extraction | 641 (96.5%) | 23 (3.5%) |
| Installation, Maintenance & Repair | 319 (89.9%) | 36 (10.1%) |
| Total (Category) | 960 (94.2%) | 59 (5.8%) |
| Total (Overall) | 11,037 (49.4%) | 11,321 (50.6%) |
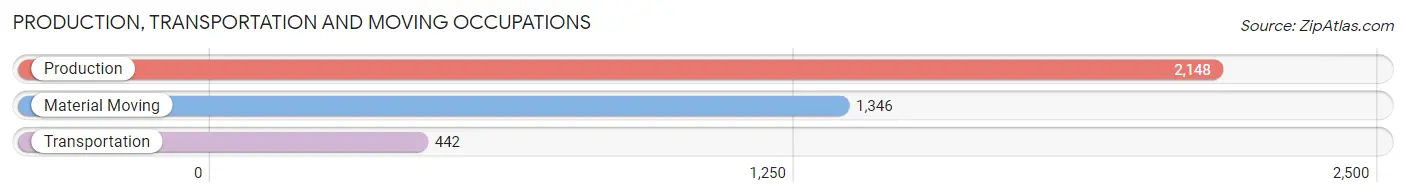
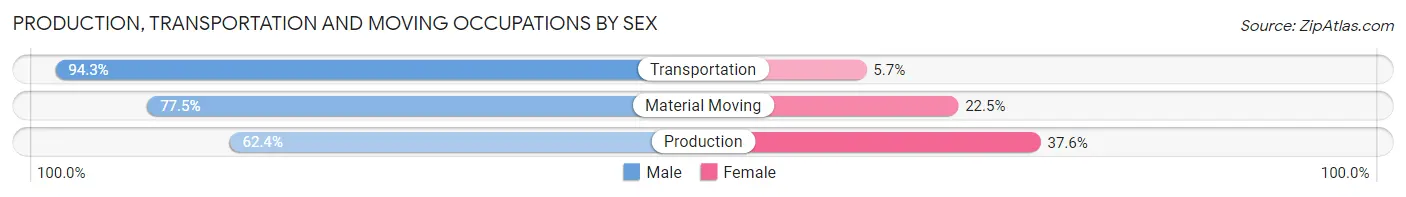
Production, Transportation and Moving Occupations
The most common Production, Transportation and Moving occupations in Cleveland are Production (2,148 | 9.6%), Material Moving (1,346 | 6.0%), and Transportation (442 | 2.0%).
Production, Transportation and Moving Occupations by Sex
| Occupation | Male | Female |
| Production | 1,340 (62.4%) | 808 (37.6%) |
| Transportation | 417 (94.3%) | 25 (5.7%) |
| Material Moving | 1,043 (77.5%) | 303 (22.5%) |
| Total (Category) | 2,800 (71.1%) | 1,136 (28.9%) |
| Total (Overall) | 11,037 (49.4%) | 11,321 (50.6%) |
Employment Industries by Sex in Cleveland
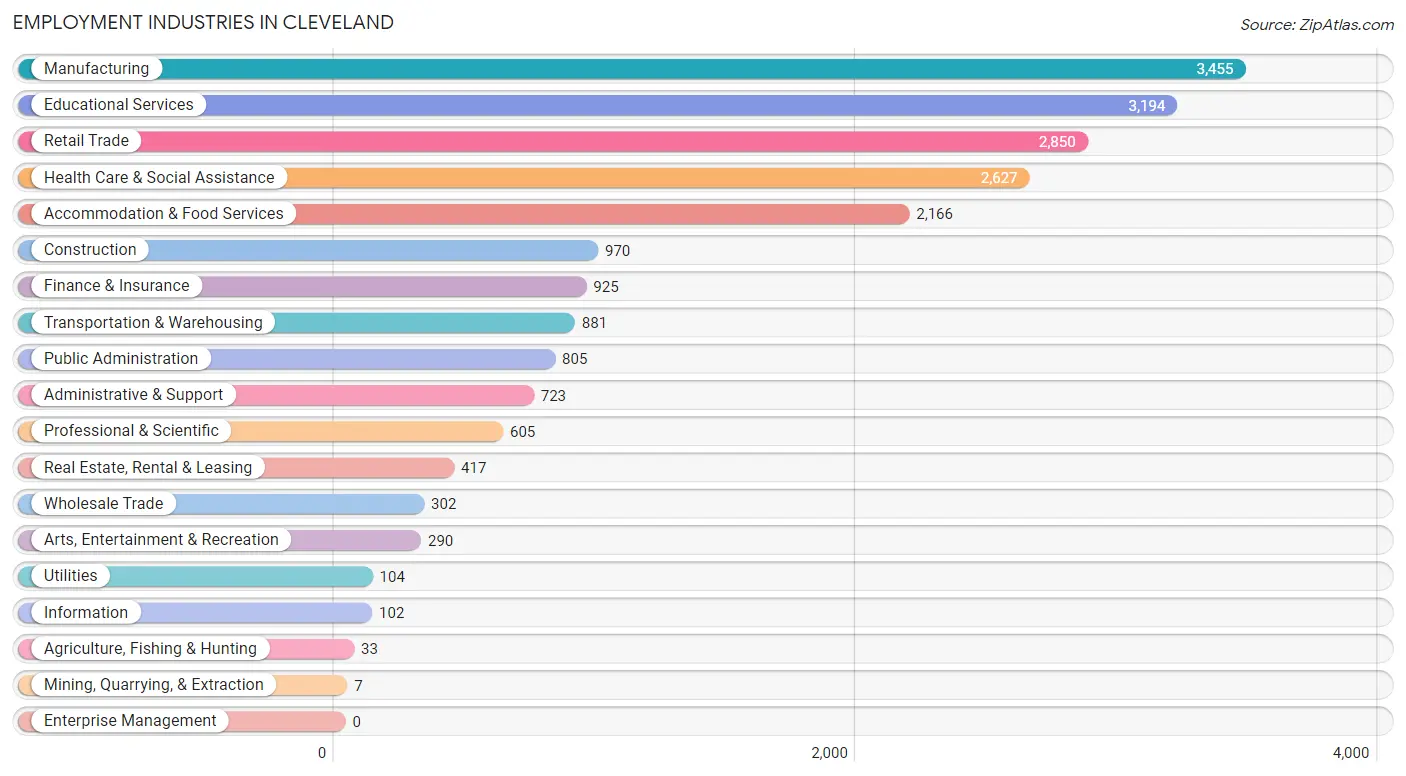
Employment Industries in Cleveland
The major employment industries in Cleveland include Manufacturing (3,455 | 15.4%), Educational Services (3,194 | 14.3%), Retail Trade (2,850 | 12.8%), Health Care & Social Assistance (2,627 | 11.7%), and Accommodation & Food Services (2,166 | 9.7%).
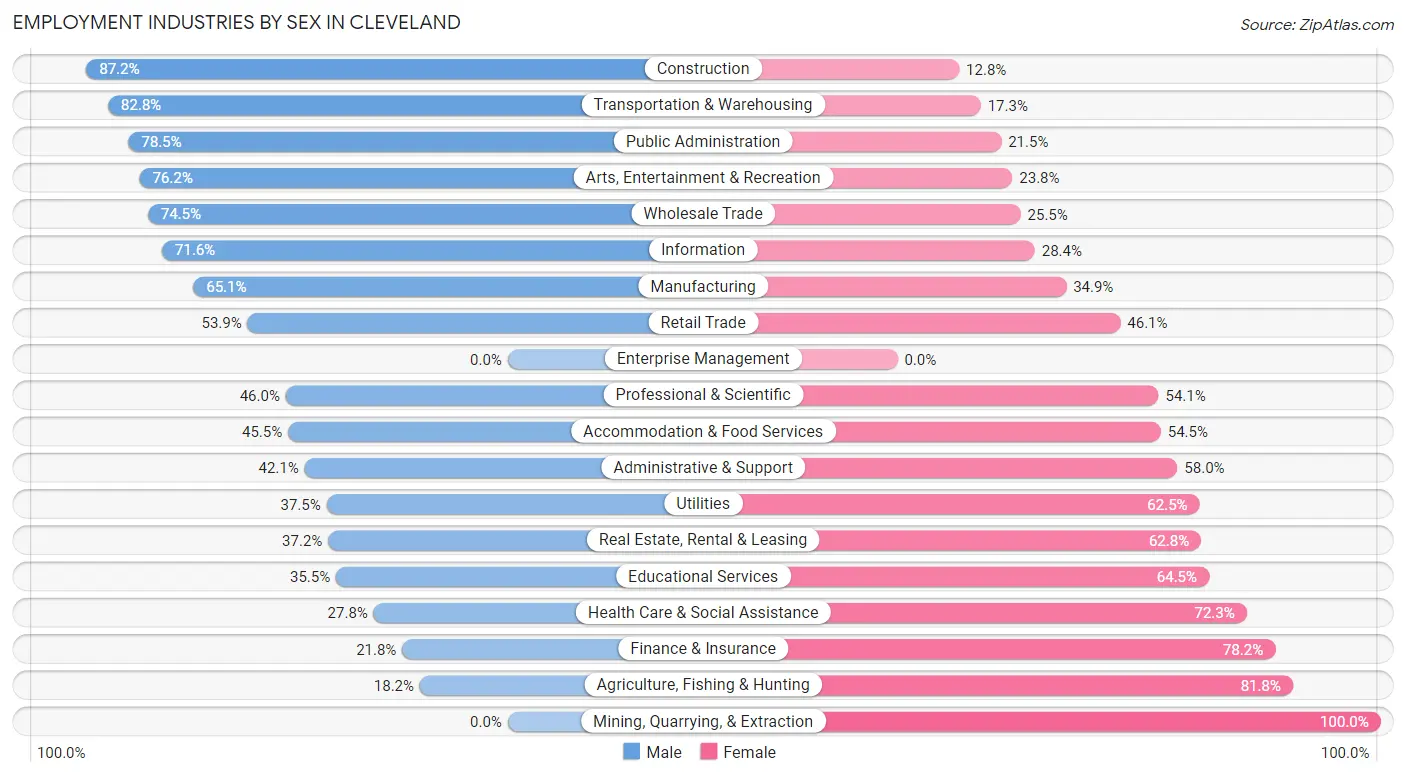
Employment Industries by Sex in Cleveland
The Cleveland industries that see more men than women are Construction (87.2%), Transportation & Warehousing (82.8%), and Public Administration (78.5%), whereas the industries that tend to have a higher number of women are Mining, Quarrying, & Extraction (100.0%), Agriculture, Fishing & Hunting (81.8%), and Finance & Insurance (78.2%).
| Industry | Male | Female |
| Agriculture, Fishing & Hunting | 6 (18.2%) | 27 (81.8%) |
| Mining, Quarrying, & Extraction | 0 (0.0%) | 7 (100.0%) |
| Construction | 846 (87.2%) | 124 (12.8%) |
| Manufacturing | 2,248 (65.1%) | 1,207 (34.9%) |
| Wholesale Trade | 225 (74.5%) | 77 (25.5%) |
| Retail Trade | 1,535 (53.9%) | 1,315 (46.1%) |
| Transportation & Warehousing | 729 (82.8%) | 152 (17.2%) |
| Utilities | 39 (37.5%) | 65 (62.5%) |
| Information | 73 (71.6%) | 29 (28.4%) |
| Finance & Insurance | 202 (21.8%) | 723 (78.2%) |
| Real Estate, Rental & Leasing | 155 (37.2%) | 262 (62.8%) |
| Professional & Scientific | 278 (46.0%) | 327 (54.0%) |
| Enterprise Management | 0 (0.0%) | 0 (0.0%) |
| Administrative & Support | 304 (42.0%) | 419 (58.0%) |
| Educational Services | 1,135 (35.5%) | 2,059 (64.5%) |
| Health Care & Social Assistance | 729 (27.8%) | 1,898 (72.3%) |
| Arts, Entertainment & Recreation | 221 (76.2%) | 69 (23.8%) |
| Accommodation & Food Services | 985 (45.5%) | 1,181 (54.5%) |
| Public Administration | 632 (78.5%) | 173 (21.5%) |
| Total | 11,037 (49.4%) | 11,321 (50.6%) |
Education in Cleveland
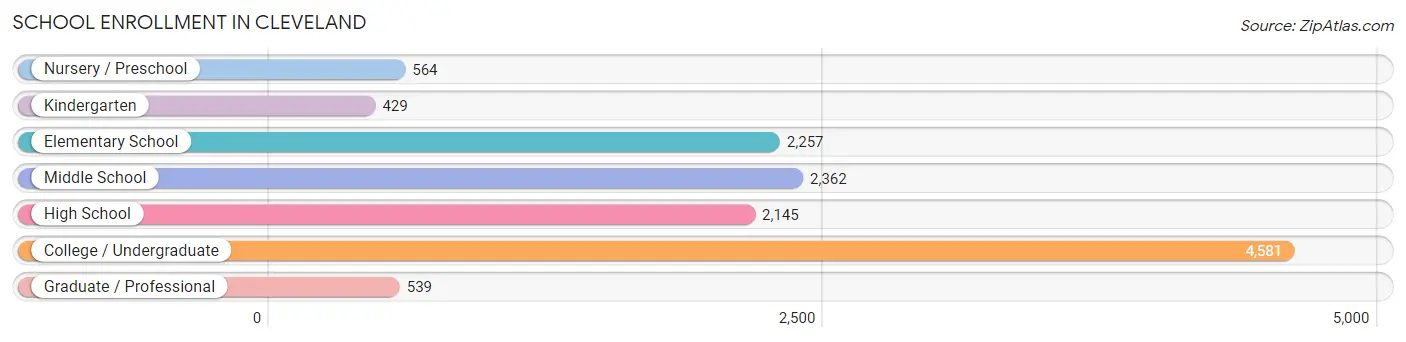
School Enrollment in Cleveland
The most common levels of schooling among the 12,877 students in Cleveland are college / undergraduate (4,581 | 35.6%), middle school (2,362 | 18.3%), and elementary school (2,257 | 17.5%).
| School Level | # Students | % Students |
| Nursery / Preschool | 564 | 4.4% |
| Kindergarten | 429 | 3.3% |
| Elementary School | 2,257 | 17.5% |
| Middle School | 2,362 | 18.3% |
| High School | 2,145 | 16.7% |
| College / Undergraduate | 4,581 | 35.6% |
| Graduate / Professional | 539 | 4.2% |
| Total | 12,877 | 100.0% |
School Enrollment by Age by Funding Source in Cleveland
Out of a total of 12,877 students who are enrolled in schools in Cleveland, 4,661 (36.2%) attend a private institution, while the remaining 8,216 (63.8%) are enrolled in public schools. The age group of 20 to 24 year olds has the highest likelihood of being enrolled in private schools, with 2,064 (80.0% in the age bracket) enrolled. Conversely, the age group of 5 to 9 year old has the lowest likelihood of being enrolled in a private school, with 2,521 (93.9% in the age bracket) attending a public institution.
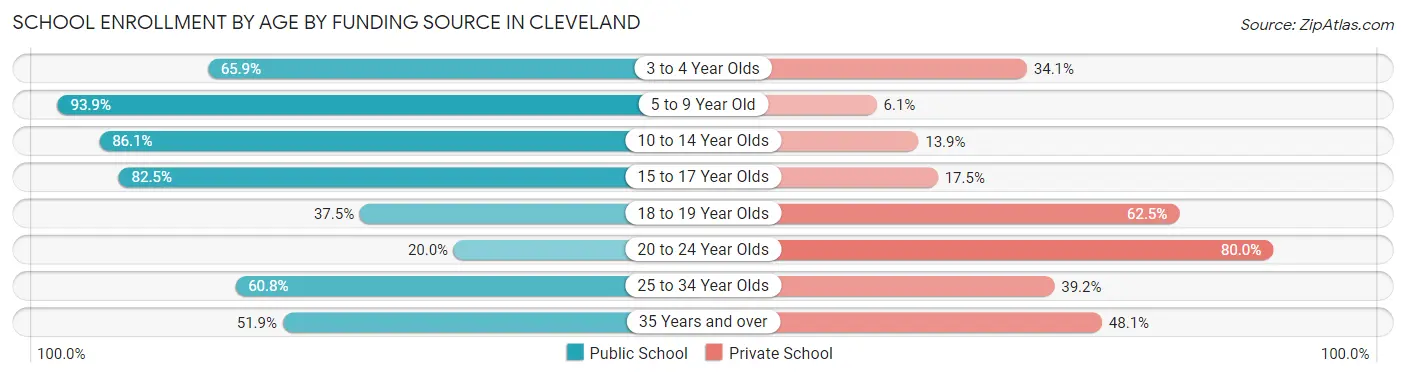
| Age Bracket | Public School | Private School |
| 3 to 4 Year Olds | 251 (65.9%) | 130 (34.1%) |
| 5 to 9 Year Old | 2,521 (93.9%) | 165 (6.1%) |
| 10 to 14 Year Olds | 2,366 (86.1%) | 382 (13.9%) |
| 15 to 17 Year Olds | 1,144 (82.5%) | 243 (17.5%) |
| 18 to 19 Year Olds | 691 (37.5%) | 1,150 (62.5%) |
| 20 to 24 Year Olds | 517 (20.0%) | 2,064 (80.0%) |
| 25 to 34 Year Olds | 505 (60.8%) | 326 (39.2%) |
| 35 Years and over | 219 (51.9%) | 203 (48.1%) |
| Total | 8,216 (63.8%) | 4,661 (36.2%) |
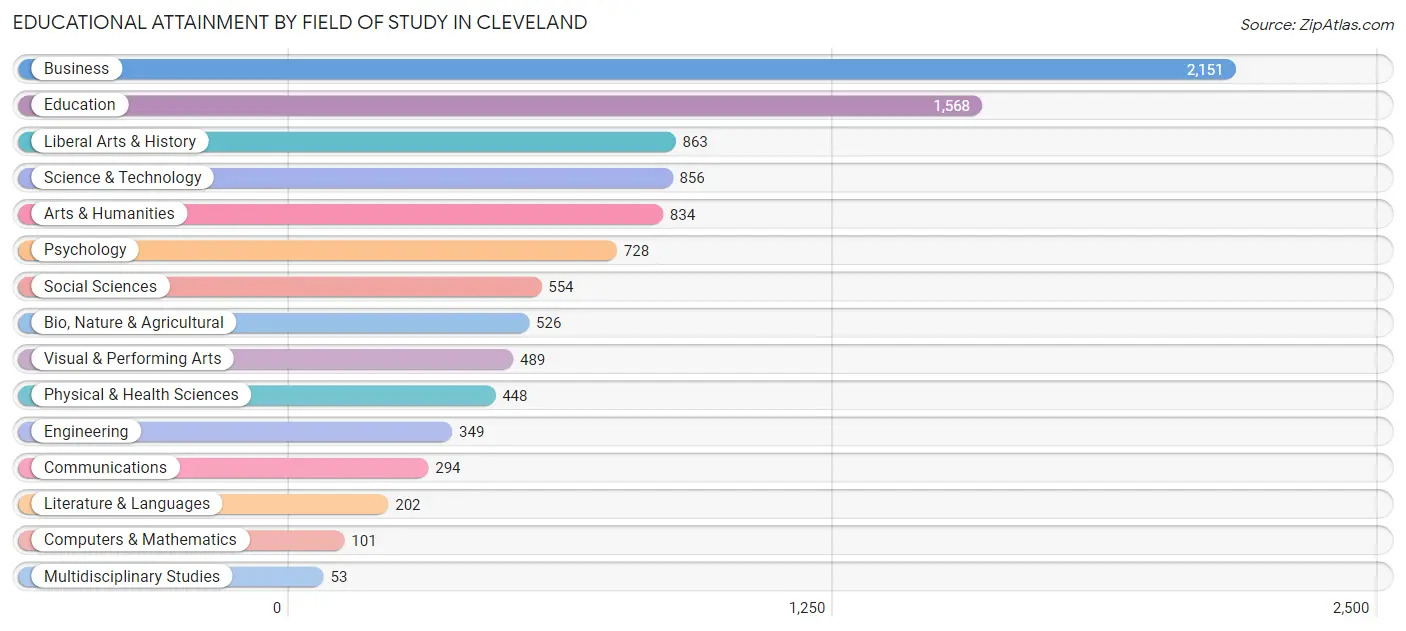
Educational Attainment by Field of Study in Cleveland
Business (2,151 | 21.5%), education (1,568 | 15.7%), liberal arts & history (863 | 8.6%), science & technology (856 | 8.6%), and arts & humanities (834 | 8.3%) are the most common fields of study among 10,016 individuals in Cleveland who have obtained a bachelor's degree or higher.
| Field of Study | # Graduates | % Graduates |
| Computers & Mathematics | 101 | 1.0% |
| Bio, Nature & Agricultural | 526 | 5.2% |
| Physical & Health Sciences | 448 | 4.5% |
| Psychology | 728 | 7.3% |
| Social Sciences | 554 | 5.5% |
| Engineering | 349 | 3.5% |
| Multidisciplinary Studies | 53 | 0.5% |
| Science & Technology | 856 | 8.6% |
| Business | 2,151 | 21.5% |
| Education | 1,568 | 15.7% |
| Literature & Languages | 202 | 2.0% |
| Liberal Arts & History | 863 | 8.6% |
| Visual & Performing Arts | 489 | 4.9% |
| Communications | 294 | 2.9% |
| Arts & Humanities | 834 | 8.3% |
| Total | 10,016 | 100.0% |
Transportation & Commute in Cleveland
Vehicle Availability by Sex in Cleveland
The most prevalent vehicle ownership categories in Cleveland are males with 2 vehicles (4,384, accounting for 42.1%) and females with 2 vehicles (4,130, making up 42.8%).
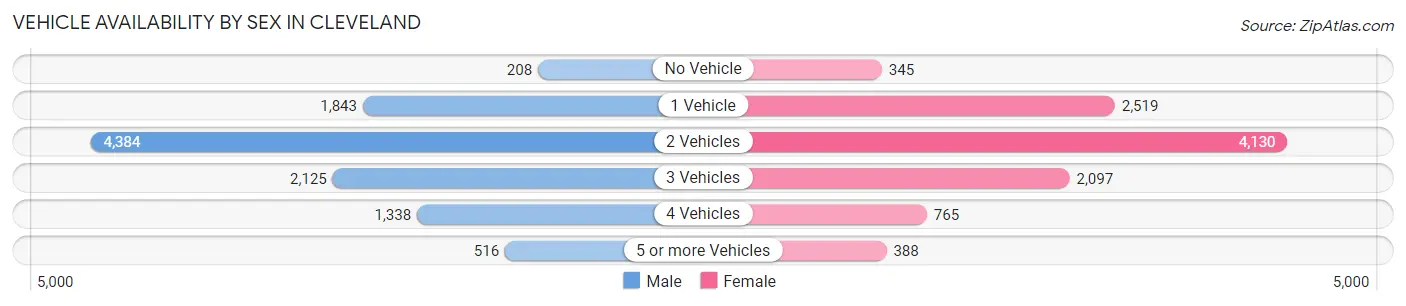
| Vehicles Available | Male | Female |
| No Vehicle | 208 (2.0%) | 345 (3.4%) |
| 1 Vehicle | 1,843 (17.7%) | 2,519 (24.6%) |
| 2 Vehicles | 4,384 (42.1%) | 4,130 (40.3%) |
| 3 Vehicles | 2,125 (20.4%) | 2,097 (20.5%) |
| 4 Vehicles | 1,338 (12.9%) | 765 (7.5%) |
| 5 or more Vehicles | 516 (5.0%) | 388 (3.8%) |
| Total | 10,414 (100.0%) | 10,244 (100.0%) |
Commute Time in Cleveland
The most frequently occuring commute durations in Cleveland are 10 to 14 minutes (4,149 commuters, 20.4%), 5 to 9 minutes (4,107 commuters, 20.2%), and 15 to 19 minutes (3,970 commuters, 19.5%).
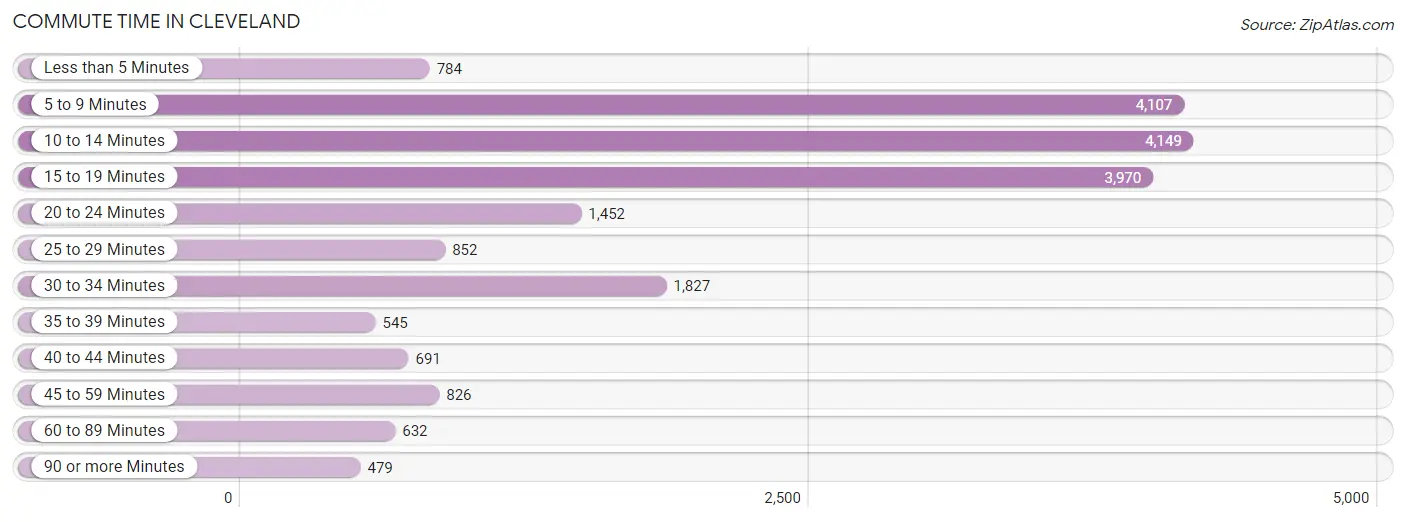
| Commute Time | # Commuters | % Commuters |
| Less than 5 Minutes | 784 | 3.9% |
| 5 to 9 Minutes | 4,107 | 20.2% |
| 10 to 14 Minutes | 4,149 | 20.4% |
| 15 to 19 Minutes | 3,970 | 19.5% |
| 20 to 24 Minutes | 1,452 | 7.1% |
| 25 to 29 Minutes | 852 | 4.2% |
| 30 to 34 Minutes | 1,827 | 9.0% |
| 35 to 39 Minutes | 545 | 2.7% |
| 40 to 44 Minutes | 691 | 3.4% |
| 45 to 59 Minutes | 826 | 4.1% |
| 60 to 89 Minutes | 632 | 3.1% |
| 90 or more Minutes | 479 | 2.4% |
Commute Time by Sex in Cleveland
The most common commute times in Cleveland are 10 to 14 minutes (2,029 commuters, 19.6%) for males and 5 to 9 minutes (2,202 commuters, 22.1%) for females.
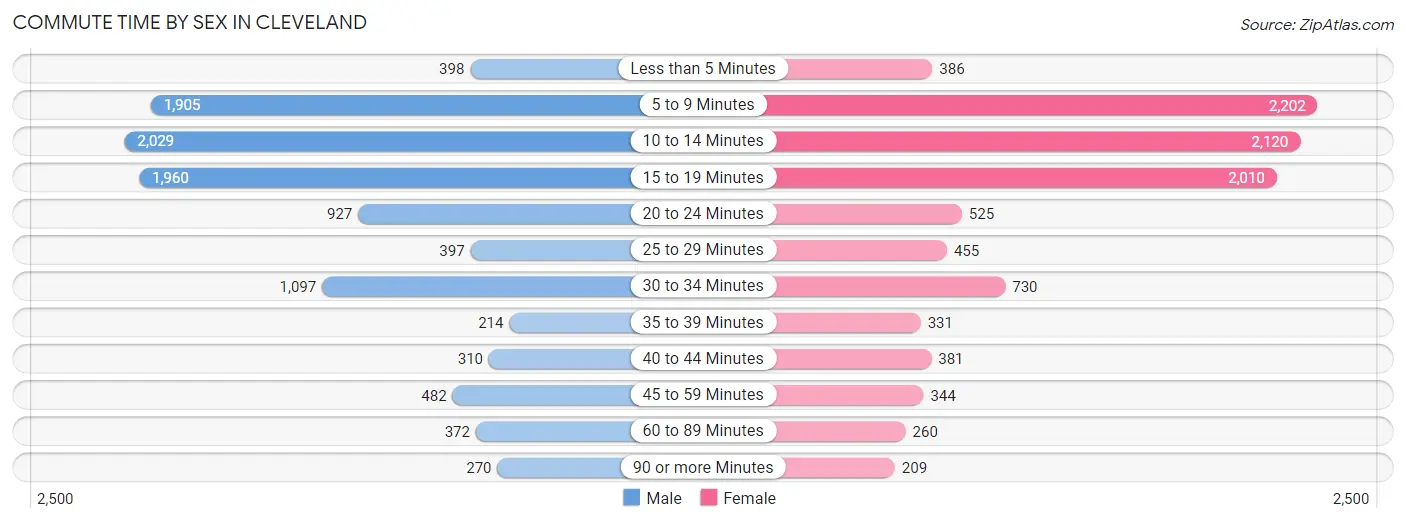
| Commute Time | Male | Female |
| Less than 5 Minutes | 398 (3.8%) | 386 (3.9%) |
| 5 to 9 Minutes | 1,905 (18.4%) | 2,202 (22.1%) |
| 10 to 14 Minutes | 2,029 (19.6%) | 2,120 (21.3%) |
| 15 to 19 Minutes | 1,960 (18.9%) | 2,010 (20.2%) |
| 20 to 24 Minutes | 927 (8.9%) | 525 (5.3%) |
| 25 to 29 Minutes | 397 (3.8%) | 455 (4.6%) |
| 30 to 34 Minutes | 1,097 (10.6%) | 730 (7.3%) |
| 35 to 39 Minutes | 214 (2.1%) | 331 (3.3%) |
| 40 to 44 Minutes | 310 (3.0%) | 381 (3.8%) |
| 45 to 59 Minutes | 482 (4.6%) | 344 (3.5%) |
| 60 to 89 Minutes | 372 (3.6%) | 260 (2.6%) |
| 90 or more Minutes | 270 (2.6%) | 209 (2.1%) |
Time of Departure to Work by Sex in Cleveland
The most frequent times of departure to work in Cleveland are 7:00 AM to 7:29 AM (1,676, 16.2%) for males and 7:30 AM to 7:59 AM (1,514, 15.2%) for females.
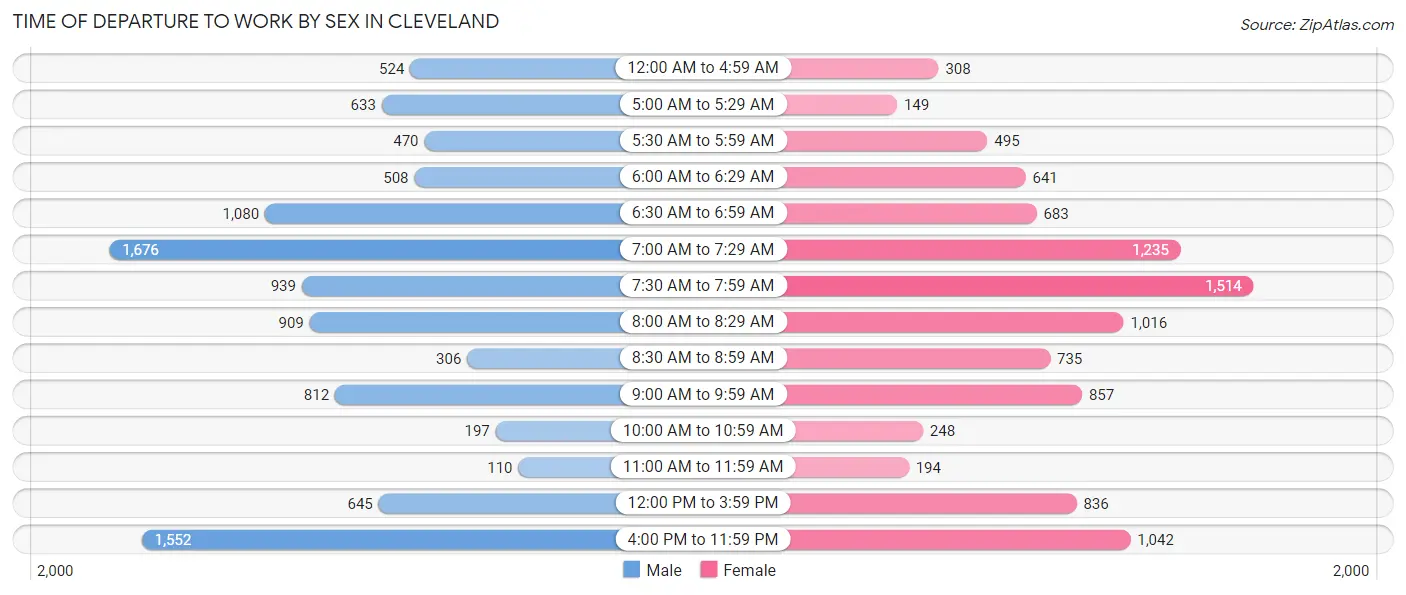
| Time of Departure | Male | Female |
| 12:00 AM to 4:59 AM | 524 (5.1%) | 308 (3.1%) |
| 5:00 AM to 5:29 AM | 633 (6.1%) | 149 (1.5%) |
| 5:30 AM to 5:59 AM | 470 (4.5%) | 495 (5.0%) |
| 6:00 AM to 6:29 AM | 508 (4.9%) | 641 (6.4%) |
| 6:30 AM to 6:59 AM | 1,080 (10.4%) | 683 (6.9%) |
| 7:00 AM to 7:29 AM | 1,676 (16.2%) | 1,235 (12.4%) |
| 7:30 AM to 7:59 AM | 939 (9.1%) | 1,514 (15.2%) |
| 8:00 AM to 8:29 AM | 909 (8.8%) | 1,016 (10.2%) |
| 8:30 AM to 8:59 AM | 306 (2.9%) | 735 (7.4%) |
| 9:00 AM to 9:59 AM | 812 (7.8%) | 857 (8.6%) |
| 10:00 AM to 10:59 AM | 197 (1.9%) | 248 (2.5%) |
| 11:00 AM to 11:59 AM | 110 (1.1%) | 194 (1.9%) |
| 12:00 PM to 3:59 PM | 645 (6.2%) | 836 (8.4%) |
| 4:00 PM to 11:59 PM | 1,552 (15.0%) | 1,042 (10.5%) |
| Total | 10,361 (100.0%) | 9,953 (100.0%) |
Housing Occupancy in Cleveland
Occupancy by Ownership in Cleveland
Of the total 17,801 dwellings in Cleveland, owner-occupied units account for 8,958 (50.3%), while renter-occupied units make up 8,843 (49.7%).
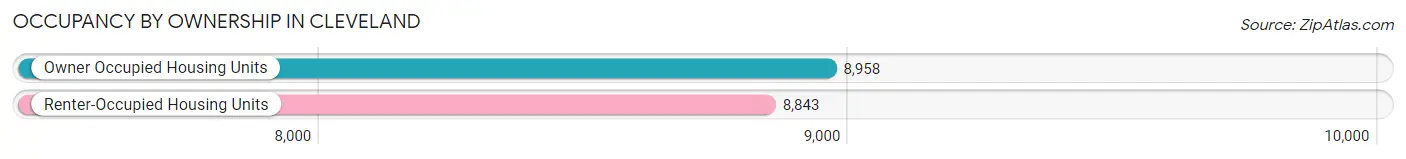
| Occupancy | # Housing Units | % Housing Units |
| Owner Occupied Housing Units | 8,958 | 50.3% |
| Renter-Occupied Housing Units | 8,843 | 49.7% |
| Total Occupied Housing Units | 17,801 | 100.0% |
Occupancy by Household Size in Cleveland
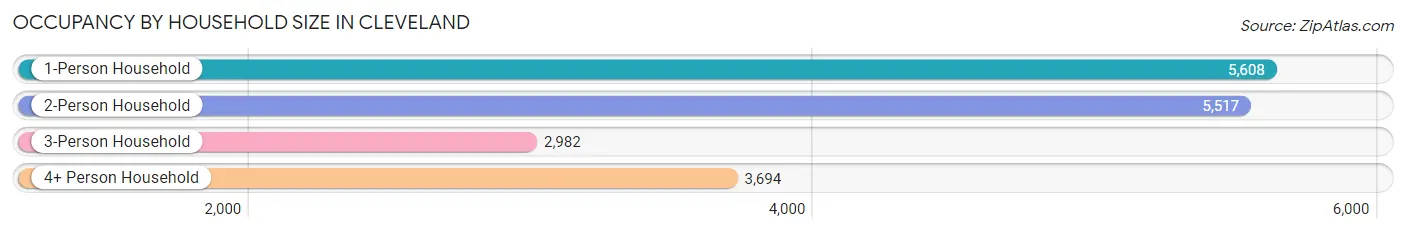
| Household Size | # Housing Units | % Housing Units |
| 1-Person Household | 5,608 | 31.5% |
| 2-Person Household | 5,517 | 31.0% |
| 3-Person Household | 2,982 | 16.8% |
| 4+ Person Household | 3,694 | 20.7% |
| Total Housing Units | 17,801 | 100.0% |
Occupancy by Ownership by Household Size in Cleveland
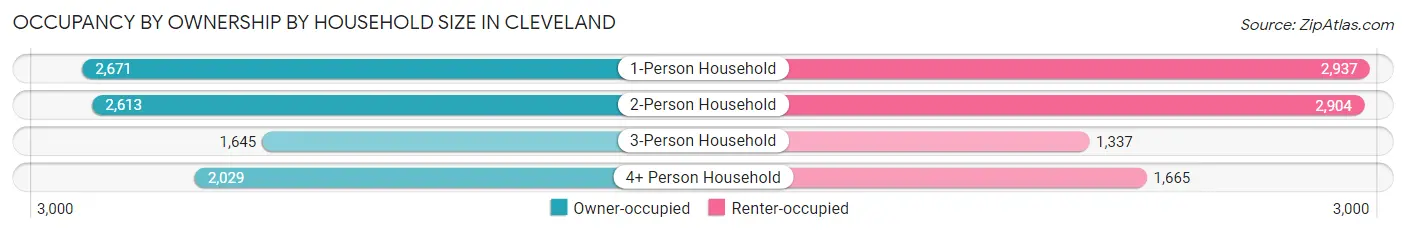
| Household Size | Owner-occupied | Renter-occupied |
| 1-Person Household | 2,671 (47.6%) | 2,937 (52.4%) |
| 2-Person Household | 2,613 (47.4%) | 2,904 (52.6%) |
| 3-Person Household | 1,645 (55.2%) | 1,337 (44.8%) |
| 4+ Person Household | 2,029 (54.9%) | 1,665 (45.1%) |
| Total Housing Units | 8,958 (50.3%) | 8,843 (49.7%) |
Occupancy by Educational Attainment in Cleveland
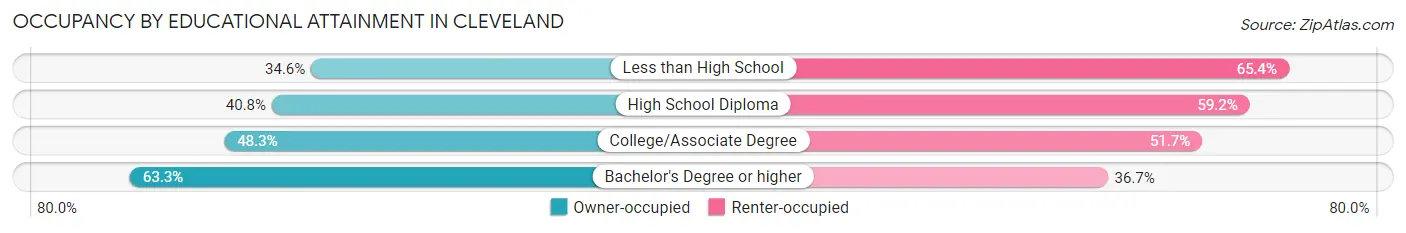
| Household Size | Owner-occupied | Renter-occupied |
| Less than High School | 571 (34.6%) | 1,081 (65.4%) |
| High School Diploma | 1,698 (40.8%) | 2,466 (59.2%) |
| College/Associate Degree | 2,895 (48.3%) | 3,095 (51.7%) |
| Bachelor's Degree or higher | 3,794 (63.3%) | 2,201 (36.7%) |
Occupancy by Age of Householder in Cleveland
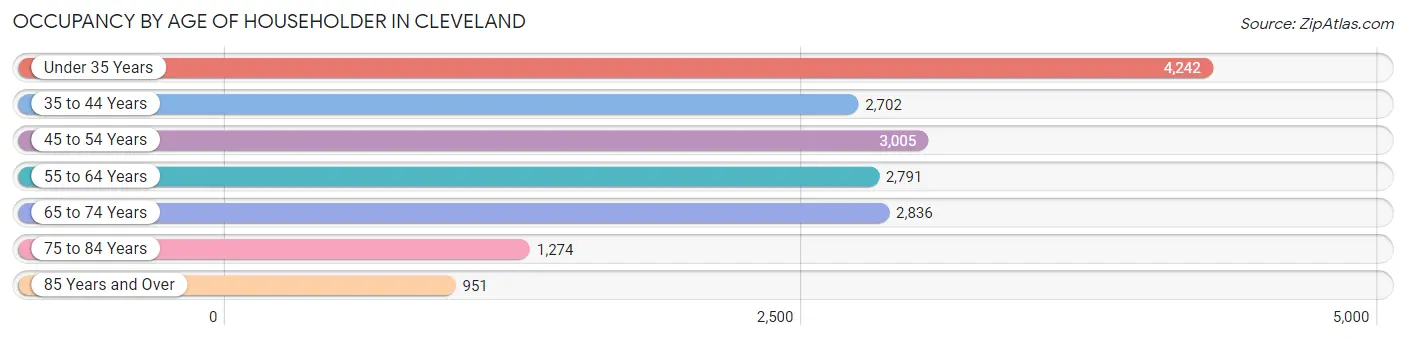
| Age Bracket | # Households | % Households |
| Under 35 Years | 4,242 | 23.8% |
| 35 to 44 Years | 2,702 | 15.2% |
| 45 to 54 Years | 3,005 | 16.9% |
| 55 to 64 Years | 2,791 | 15.7% |
| 65 to 74 Years | 2,836 | 15.9% |
| 75 to 84 Years | 1,274 | 7.2% |
| 85 Years and Over | 951 | 5.3% |
| Total | 17,801 | 100.0% |
Housing Finances in Cleveland
Median Income by Occupancy in Cleveland
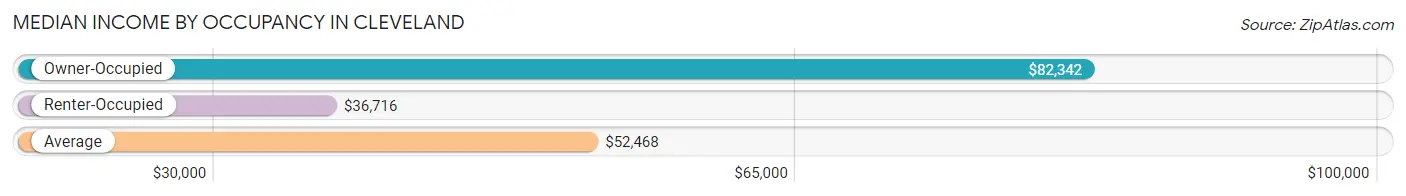
| Occupancy Type | # Households | Median Income |
| Owner-Occupied | 8,958 (50.3%) | $82,342 |
| Renter-Occupied | 8,843 (49.7%) | $36,716 |
| Average | 17,801 (100.0%) | $52,468 |
Occupancy by Householder Income Bracket in Cleveland
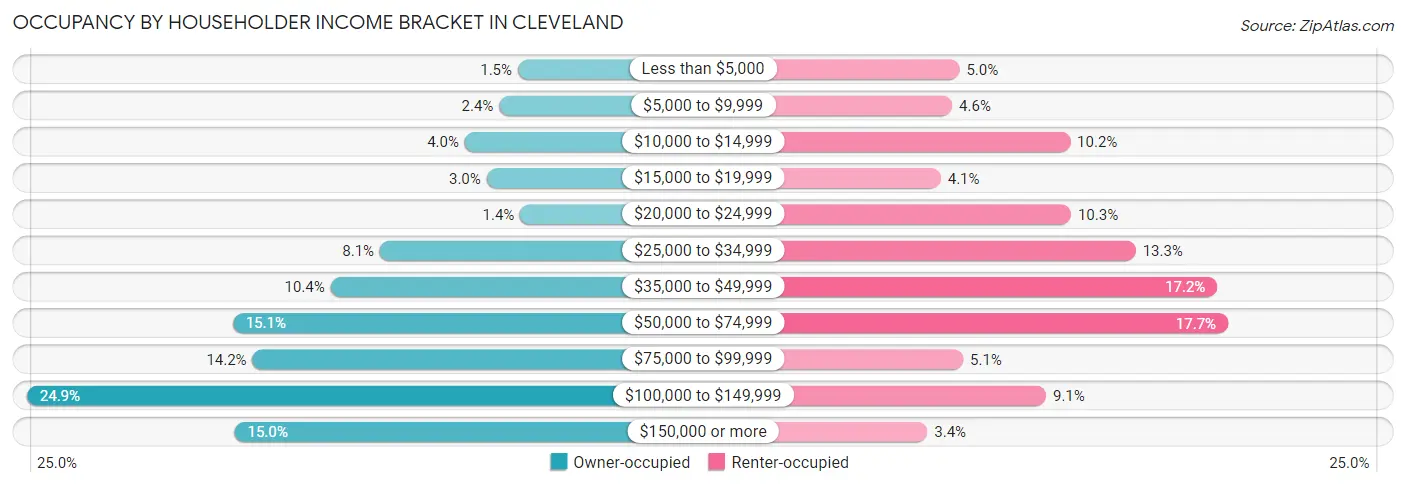
| Income Bracket | Owner-occupied | Renter-occupied |
| Less than $5,000 | 135 (1.5%) | 438 (5.0%) |
| $5,000 to $9,999 | 215 (2.4%) | 407 (4.6%) |
| $10,000 to $14,999 | 362 (4.0%) | 904 (10.2%) |
| $15,000 to $19,999 | 269 (3.0%) | 359 (4.1%) |
| $20,000 to $24,999 | 125 (1.4%) | 907 (10.3%) |
| $25,000 to $34,999 | 724 (8.1%) | 1,180 (13.3%) |
| $35,000 to $49,999 | 934 (10.4%) | 1,523 (17.2%) |
| $50,000 to $74,999 | 1,352 (15.1%) | 1,568 (17.7%) |
| $75,000 to $99,999 | 1,268 (14.1%) | 453 (5.1%) |
| $100,000 to $149,999 | 2,230 (24.9%) | 802 (9.1%) |
| $150,000 or more | 1,344 (15.0%) | 302 (3.4%) |
| Total | 8,958 (100.0%) | 8,843 (100.0%) |
Monthly Housing Cost Tiers in Cleveland
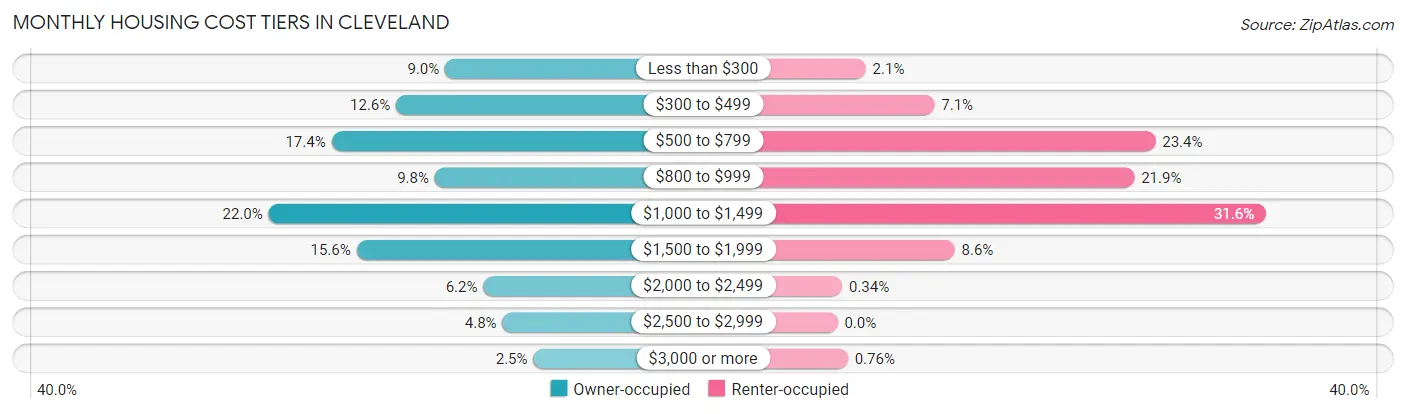
| Monthly Cost | Owner-occupied | Renter-occupied |
| Less than $300 | 809 (9.0%) | 184 (2.1%) |
| $300 to $499 | 1,132 (12.6%) | 631 (7.1%) |
| $500 to $799 | 1,559 (17.4%) | 2,070 (23.4%) |
| $800 to $999 | 877 (9.8%) | 1,933 (21.9%) |
| $1,000 to $1,499 | 1,973 (22.0%) | 2,791 (31.6%) |
| $1,500 to $1,999 | 1,393 (15.5%) | 763 (8.6%) |
| $2,000 to $2,499 | 557 (6.2%) | 30 (0.3%) |
| $2,500 to $2,999 | 431 (4.8%) | 0 (0.0%) |
| $3,000 or more | 227 (2.5%) | 67 (0.8%) |
| Total | 8,958 (100.0%) | 8,843 (100.0%) |
Physical Housing Characteristics in Cleveland
Housing Structures in Cleveland
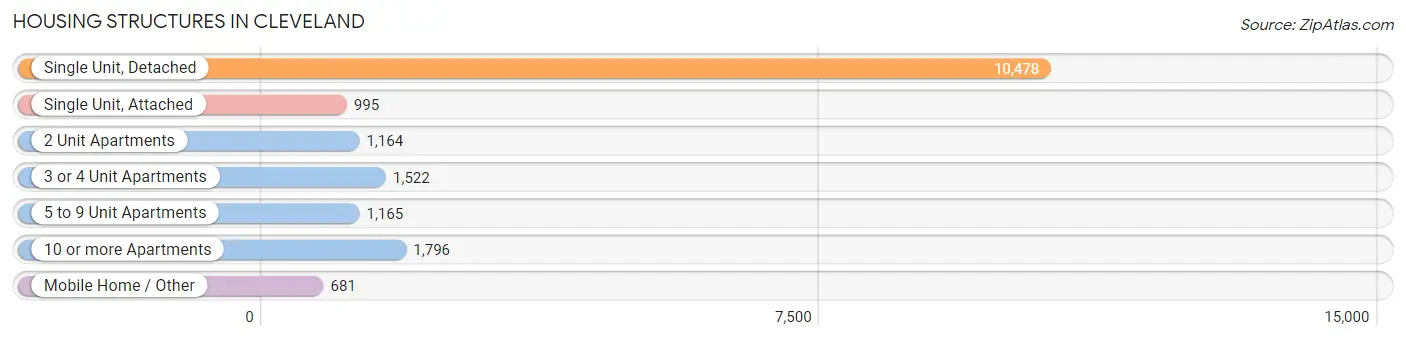
| Structure Type | # Housing Units | % Housing Units |
| Single Unit, Detached | 10,478 | 58.9% |
| Single Unit, Attached | 995 | 5.6% |
| 2 Unit Apartments | 1,164 | 6.5% |
| 3 or 4 Unit Apartments | 1,522 | 8.6% |
| 5 to 9 Unit Apartments | 1,165 | 6.5% |
| 10 or more Apartments | 1,796 | 10.1% |
| Mobile Home / Other | 681 | 3.8% |
| Total | 17,801 | 100.0% |
Housing Structures by Occupancy in Cleveland
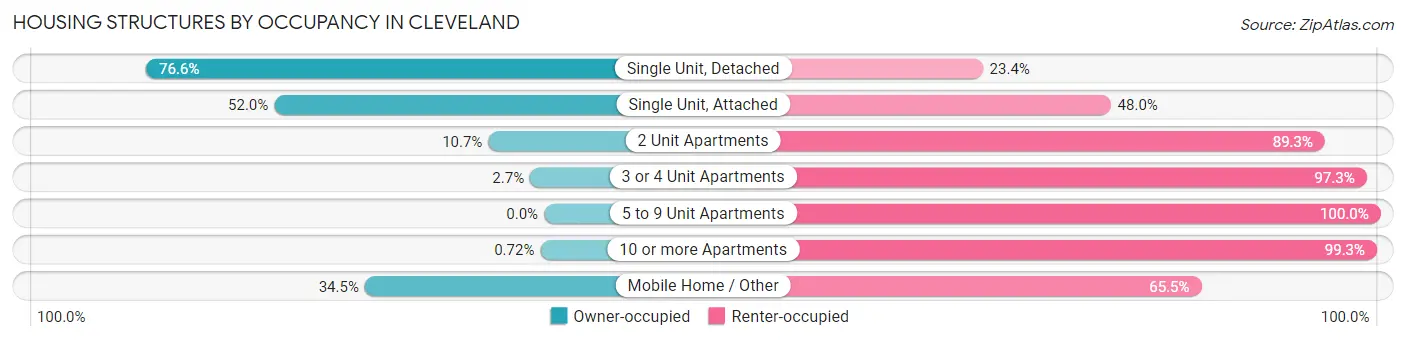
| Structure Type | Owner-occupied | Renter-occupied |
| Single Unit, Detached | 8,027 (76.6%) | 2,451 (23.4%) |
| Single Unit, Attached | 517 (52.0%) | 478 (48.0%) |
| 2 Unit Apartments | 125 (10.7%) | 1,039 (89.3%) |
| 3 or 4 Unit Apartments | 41 (2.7%) | 1,481 (97.3%) |
| 5 to 9 Unit Apartments | 0 (0.0%) | 1,165 (100.0%) |
| 10 or more Apartments | 13 (0.7%) | 1,783 (99.3%) |
| Mobile Home / Other | 235 (34.5%) | 446 (65.5%) |
| Total | 8,958 (50.3%) | 8,843 (49.7%) |
Housing Structures by Number of Rooms in Cleveland
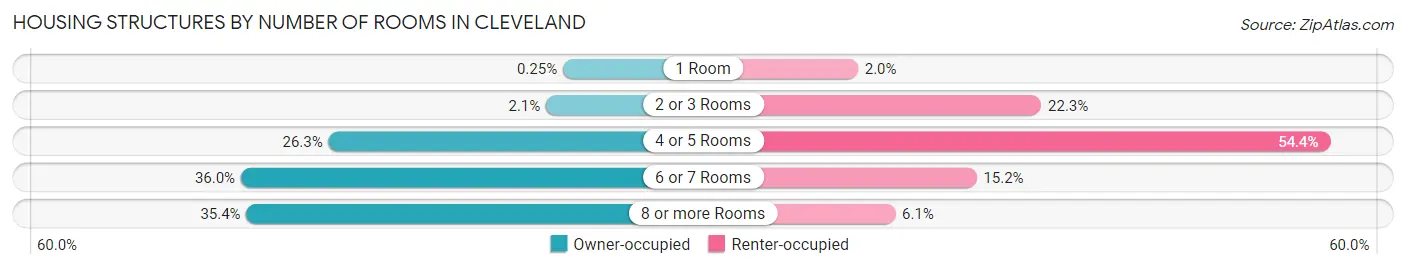
| Number of Rooms | Owner-occupied | Renter-occupied |
| 1 Room | 22 (0.3%) | 175 (2.0%) |
| 2 or 3 Rooms | 190 (2.1%) | 1,975 (22.3%) |
| 4 or 5 Rooms | 2,353 (26.3%) | 4,812 (54.4%) |
| 6 or 7 Rooms | 3,224 (36.0%) | 1,340 (15.1%) |
| 8 or more Rooms | 3,169 (35.4%) | 541 (6.1%) |
| Total | 8,958 (100.0%) | 8,843 (100.0%) |
Housing Structure by Heating Type in Cleveland
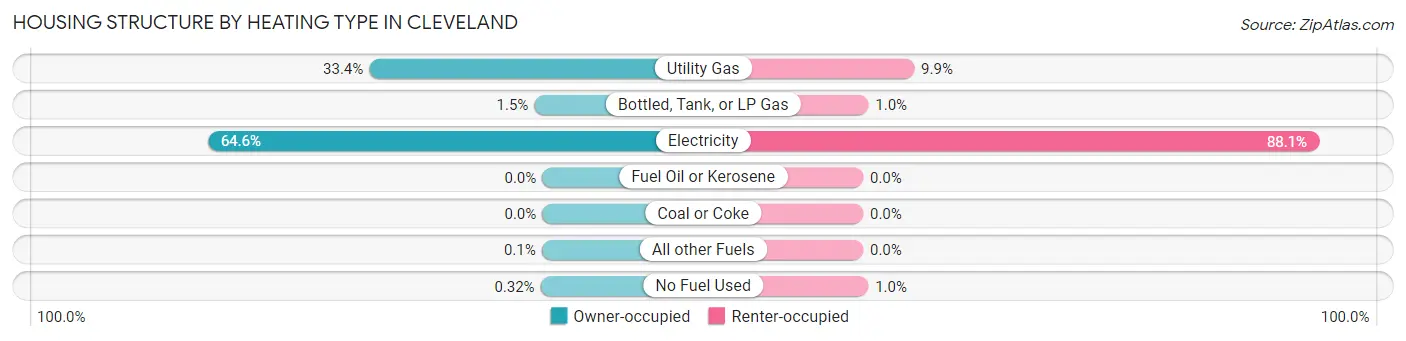
| Heating Type | Owner-occupied | Renter-occupied |
| Utility Gas | 2,995 (33.4%) | 874 (9.9%) |
| Bottled, Tank, or LP Gas | 137 (1.5%) | 91 (1.0%) |
| Electricity | 5,788 (64.6%) | 7,790 (88.1%) |
| Fuel Oil or Kerosene | 0 (0.0%) | 0 (0.0%) |
| Coal or Coke | 0 (0.0%) | 0 (0.0%) |
| All other Fuels | 9 (0.1%) | 0 (0.0%) |
| No Fuel Used | 29 (0.3%) | 88 (1.0%) |
| Total | 8,958 (100.0%) | 8,843 (100.0%) |
Household Vehicle Usage in Cleveland
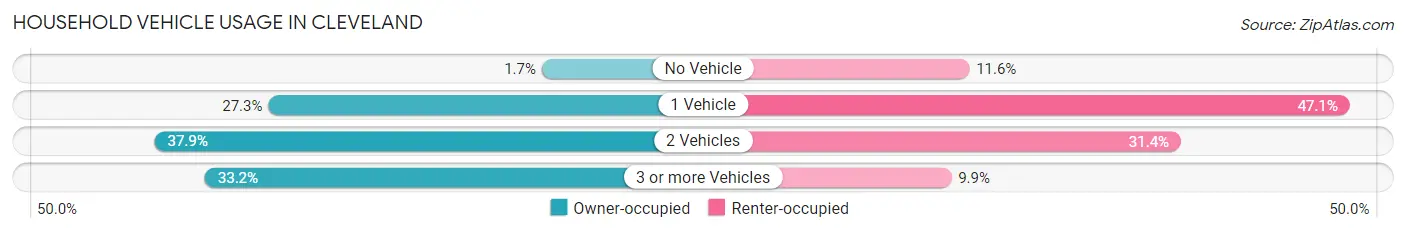
| Vehicles per Household | Owner-occupied | Renter-occupied |
| No Vehicle | 154 (1.7%) | 1,026 (11.6%) |
| 1 Vehicle | 2,441 (27.3%) | 4,167 (47.1%) |
| 2 Vehicles | 3,392 (37.9%) | 2,773 (31.4%) |
| 3 or more Vehicles | 2,971 (33.2%) | 877 (9.9%) |
| Total | 8,958 (100.0%) | 8,843 (100.0%) |
Real Estate & Mortgages in Cleveland
Real Estate and Mortgage Overview in Cleveland
| Characteristic | Without Mortgage | With Mortgage |
| Housing Units | 3,610 | 5,348 |
| Median Property Value | $201,300 | $242,700 |
| Median Household Income | $51,295 | $987 |
| Monthly Housing Costs | $479 | $209 |
| Real Estate Taxes | $1,367 | $183 |
Property Value by Mortgage Status in Cleveland
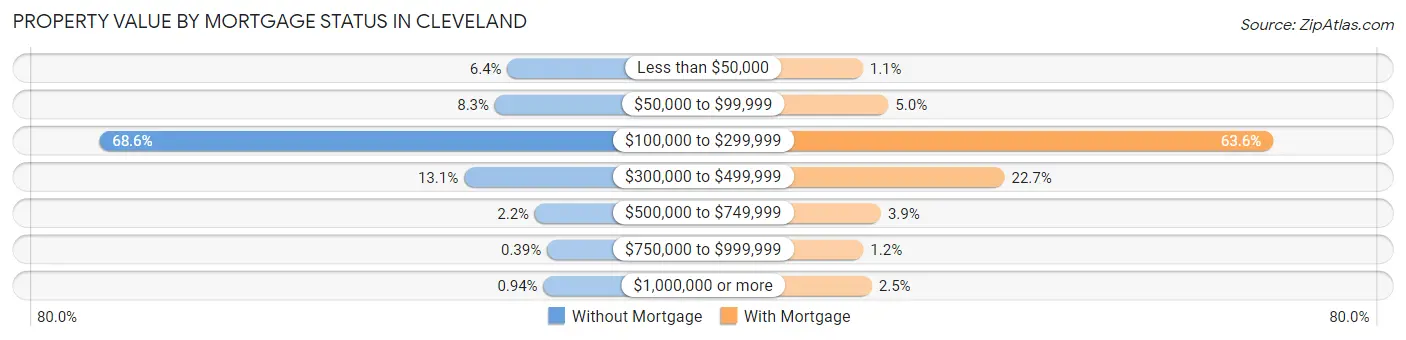
| Property Value | Without Mortgage | With Mortgage |
| Less than $50,000 | 232 (6.4%) | 59 (1.1%) |
| $50,000 to $99,999 | 301 (8.3%) | 268 (5.0%) |
| $100,000 to $299,999 | 2,477 (68.6%) | 3,403 (63.6%) |
| $300,000 to $499,999 | 471 (13.1%) | 1,214 (22.7%) |
| $500,000 to $749,999 | 81 (2.2%) | 207 (3.9%) |
| $750,000 to $999,999 | 14 (0.4%) | 64 (1.2%) |
| $1,000,000 or more | 34 (0.9%) | 133 (2.5%) |
| Total | 3,610 (100.0%) | 5,348 (100.0%) |
Household Income by Mortgage Status in Cleveland
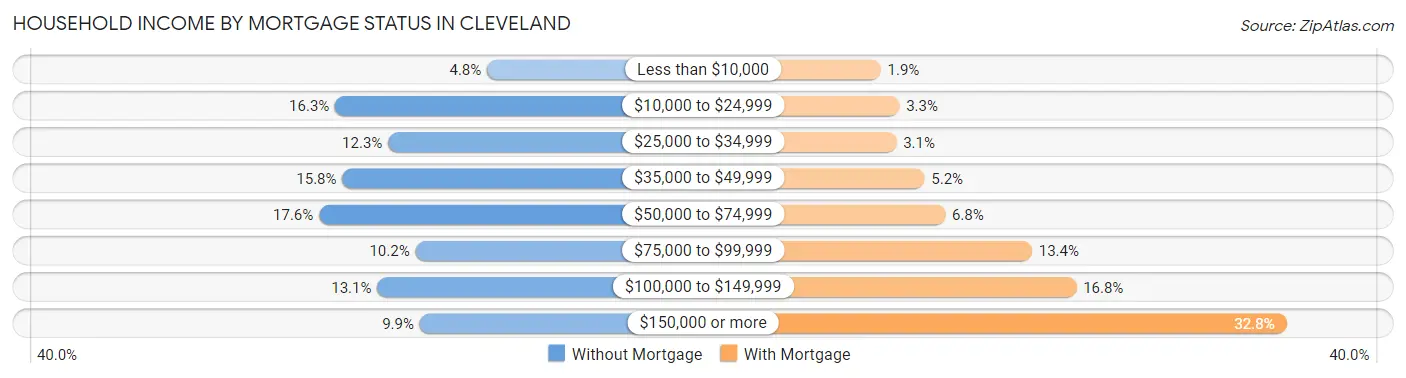
| Household Income | Without Mortgage | With Mortgage |
| Less than $10,000 | 172 (4.8%) | 102 (1.9%) |
| $10,000 to $24,999 | 590 (16.3%) | 178 (3.3%) |
| $25,000 to $34,999 | 444 (12.3%) | 166 (3.1%) |
| $35,000 to $49,999 | 570 (15.8%) | 280 (5.2%) |
| $50,000 to $74,999 | 634 (17.6%) | 364 (6.8%) |
| $75,000 to $99,999 | 369 (10.2%) | 718 (13.4%) |
| $100,000 to $149,999 | 474 (13.1%) | 899 (16.8%) |
| $150,000 or more | 357 (9.9%) | 1,756 (32.8%) |
| Total | 3,610 (100.0%) | 5,348 (100.0%) |
Property Value to Household Income Ratio in Cleveland
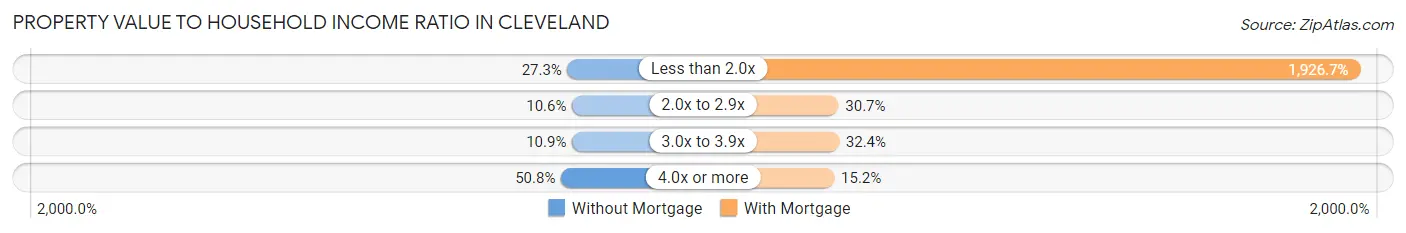
| Value-to-Income Ratio | Without Mortgage | With Mortgage |
| Less than 2.0x | 987 (27.3%) | 103,039 (1,926.7%) |
| 2.0x to 2.9x | 384 (10.6%) | 1,641 (30.7%) |
| 3.0x to 3.9x | 393 (10.9%) | 1,734 (32.4%) |
| 4.0x or more | 1,832 (50.7%) | 812 (15.2%) |
| Total | 3,610 (100.0%) | 5,348 (100.0%) |
Real Estate Taxes by Mortgage Status in Cleveland
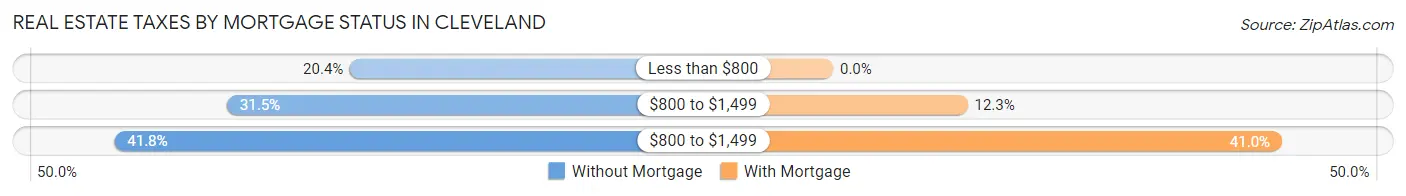
| Property Taxes | Without Mortgage | With Mortgage |
| Less than $800 | 735 (20.4%) | 0 (0.0%) |
| $800 to $1,499 | 1,138 (31.5%) | 657 (12.3%) |
| $800 to $1,499 | 1,509 (41.8%) | 2,192 (41.0%) |
| Total | 3,610 (100.0%) | 5,348 (100.0%) |
Health & Disability in Cleveland
Health Insurance Coverage by Age in Cleveland
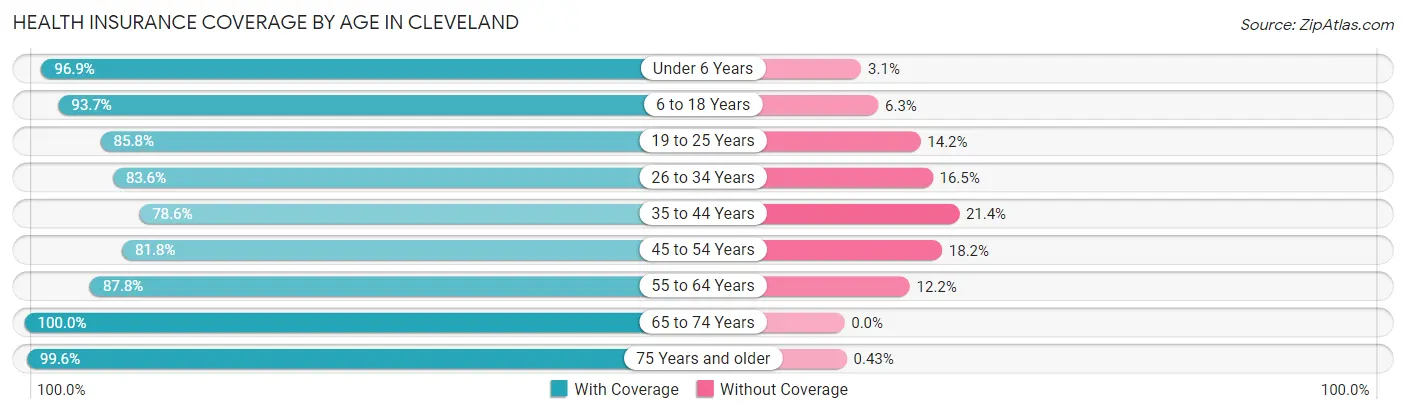
| Age Bracket | With Coverage | Without Coverage |
| Under 6 Years | 3,704 (96.9%) | 120 (3.1%) |
| 6 to 18 Years | 7,116 (93.7%) | 479 (6.3%) |
| 19 to 25 Years | 5,966 (85.8%) | 986 (14.2%) |
| 26 to 34 Years | 4,657 (83.6%) | 917 (16.5%) |
| 35 to 44 Years | 4,099 (78.6%) | 1,115 (21.4%) |
| 45 to 54 Years | 4,393 (81.8%) | 977 (18.2%) |
| 55 to 64 Years | 3,953 (87.8%) | 548 (12.2%) |
| 65 to 74 Years | 4,733 (100.0%) | 0 (0.0%) |
| 75 Years and older | 2,994 (99.6%) | 13 (0.4%) |
| Total | 41,615 (89.0%) | 5,155 (11.0%) |
Health Insurance Coverage by Citizenship Status in Cleveland
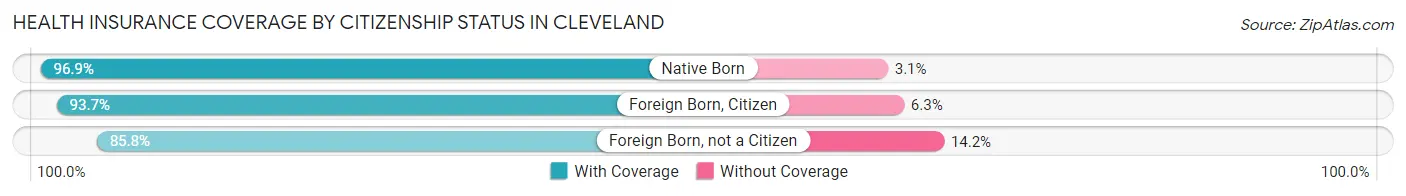
| Citizenship Status | With Coverage | Without Coverage |
| Native Born | 3,704 (96.9%) | 120 (3.1%) |
| Foreign Born, Citizen | 7,116 (93.7%) | 479 (6.3%) |
| Foreign Born, not a Citizen | 5,966 (85.8%) | 986 (14.2%) |
Health Insurance Coverage by Household Income in Cleveland
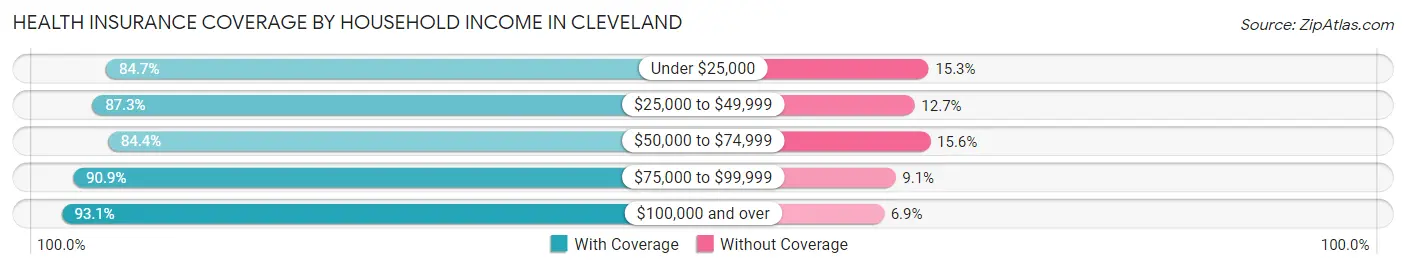
| Household Income | With Coverage | Without Coverage |
| Under $25,000 | 6,266 (84.7%) | 1,130 (15.3%) |
| $25,000 to $49,999 | 7,981 (87.3%) | 1,158 (12.7%) |
| $50,000 to $74,999 | 6,190 (84.4%) | 1,145 (15.6%) |
| $75,000 to $99,999 | 4,198 (90.9%) | 420 (9.1%) |
| $100,000 and over | 15,014 (93.1%) | 1,114 (6.9%) |
Public vs Private Health Insurance Coverage by Age in Cleveland
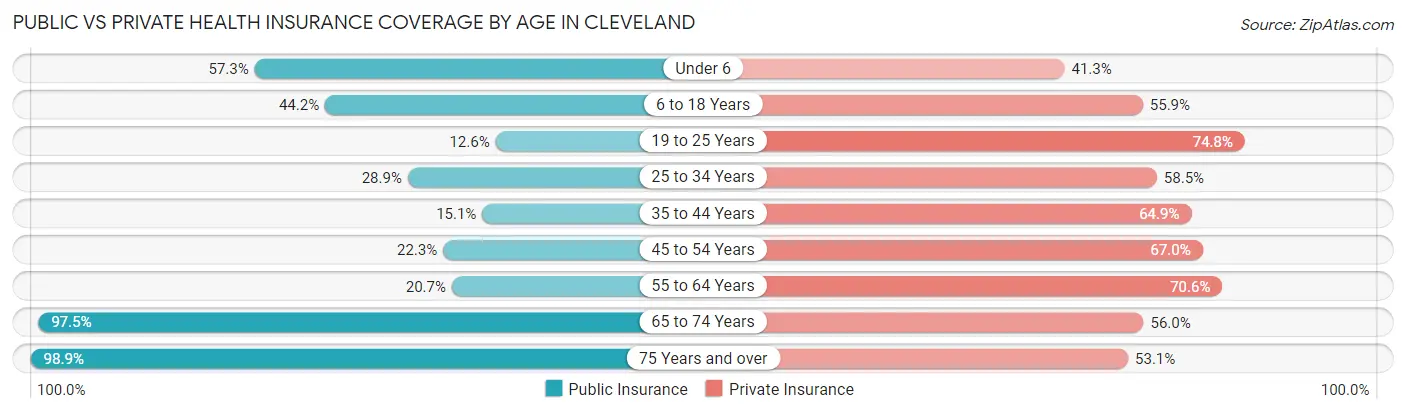
| Age Bracket | Public Insurance | Private Insurance |
| Under 6 | 2,192 (57.3%) | 1,581 (41.3%) |
| 6 to 18 Years | 3,360 (44.2%) | 4,244 (55.9%) |
| 19 to 25 Years | 876 (12.6%) | 5,200 (74.8%) |
| 25 to 34 Years | 1,610 (28.9%) | 3,260 (58.5%) |
| 35 to 44 Years | 785 (15.1%) | 3,382 (64.9%) |
| 45 to 54 Years | 1,199 (22.3%) | 3,595 (66.9%) |
| 55 to 64 Years | 932 (20.7%) | 3,178 (70.6%) |
| 65 to 74 Years | 4,613 (97.5%) | 2,651 (56.0%) |
| 75 Years and over | 2,973 (98.9%) | 1,598 (53.1%) |
| Total | 18,540 (39.6%) | 28,689 (61.3%) |
Disability Status by Sex by Age in Cleveland
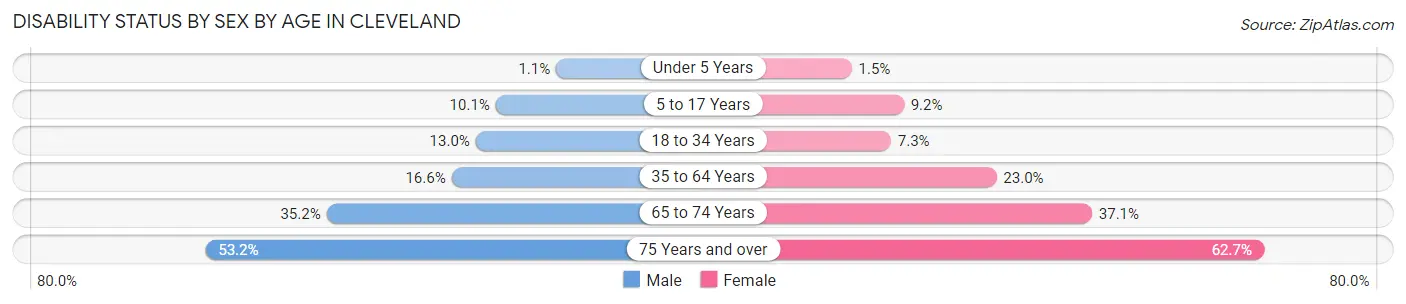
| Age Bracket | Male | Female |
| Under 5 Years | 16 (1.1%) | 26 (1.5%) |
| 5 to 17 Years | 366 (10.1%) | 332 (9.2%) |
| 18 to 34 Years | 862 (13.0%) | 495 (7.3%) |
| 35 to 64 Years | 1,178 (16.6%) | 1,835 (23.0%) |
| 65 to 74 Years | 742 (35.2%) | 974 (37.1%) |
| 75 Years and over | 521 (53.2%) | 1,270 (62.6%) |
Disability Class by Sex by Age in Cleveland
Disability Class: Hearing Difficulty
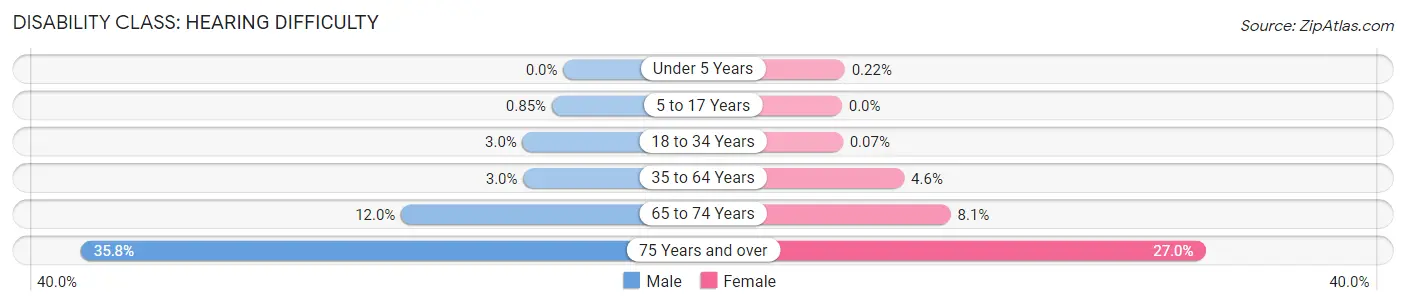
| Age Bracket | Male | Female |
| Under 5 Years | 0 (0.0%) | 4 (0.2%) |
| 5 to 17 Years | 31 (0.9%) | 0 (0.0%) |
| 18 to 34 Years | 200 (3.0%) | 5 (0.1%) |
| 35 to 64 Years | 211 (3.0%) | 370 (4.6%) |
| 65 to 74 Years | 254 (12.0%) | 212 (8.1%) |
| 75 Years and over | 351 (35.8%) | 547 (27.0%) |
Disability Class: Vision Difficulty
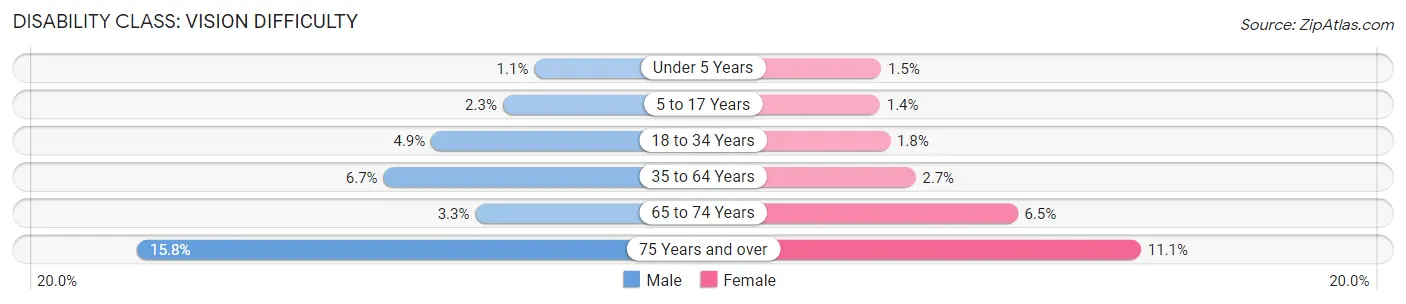
| Age Bracket | Male | Female |
| Under 5 Years | 16 (1.1%) | 26 (1.5%) |
| 5 to 17 Years | 82 (2.2%) | 51 (1.4%) |
| 18 to 34 Years | 325 (4.9%) | 122 (1.8%) |
| 35 to 64 Years | 474 (6.7%) | 218 (2.7%) |
| 65 to 74 Years | 69 (3.3%) | 171 (6.5%) |
| 75 Years and over | 155 (15.8%) | 225 (11.1%) |
Disability Class: Cognitive Difficulty
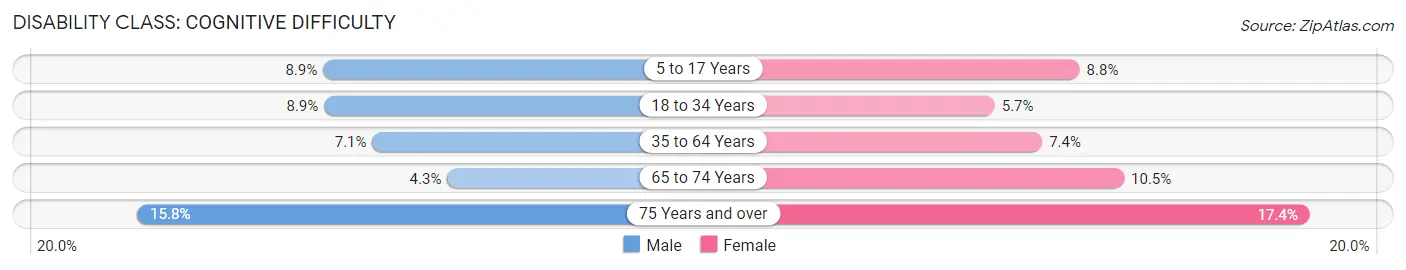
| Age Bracket | Male | Female |
| 5 to 17 Years | 325 (8.9%) | 319 (8.8%) |
| 18 to 34 Years | 588 (8.9%) | 386 (5.7%) |
| 35 to 64 Years | 503 (7.1%) | 595 (7.4%) |
| 65 to 74 Years | 91 (4.3%) | 275 (10.5%) |
| 75 Years and over | 155 (15.8%) | 352 (17.4%) |
Disability Class: Ambulatory Difficulty
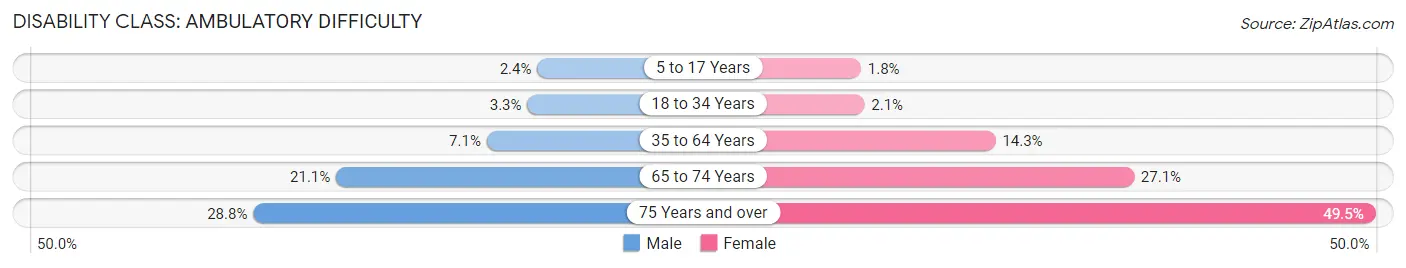
| Age Bracket | Male | Female |
| 5 to 17 Years | 88 (2.4%) | 64 (1.8%) |
| 18 to 34 Years | 221 (3.3%) | 142 (2.1%) |
| 35 to 64 Years | 504 (7.1%) | 1,140 (14.3%) |
| 65 to 74 Years | 445 (21.1%) | 711 (27.1%) |
| 75 Years and over | 282 (28.8%) | 1,004 (49.5%) |
Disability Class: Self-Care Difficulty
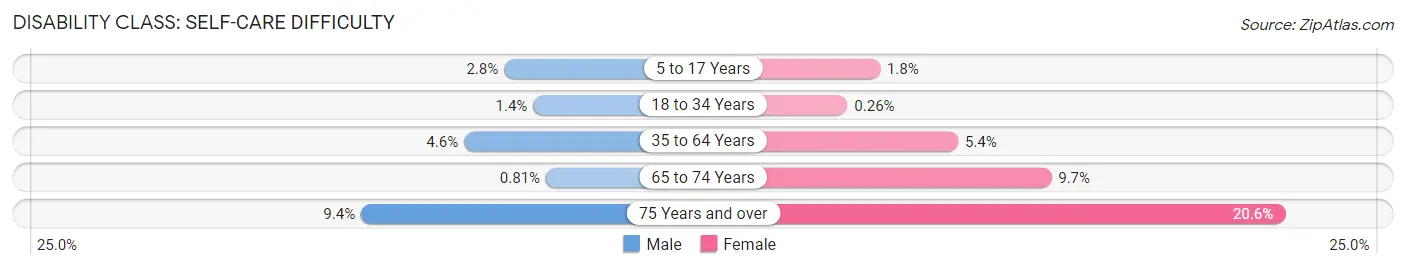
| Age Bracket | Male | Female |
| 5 to 17 Years | 100 (2.8%) | 64 (1.8%) |
| 18 to 34 Years | 93 (1.4%) | 18 (0.3%) |
| 35 to 64 Years | 327 (4.6%) | 431 (5.4%) |
| 65 to 74 Years | 17 (0.8%) | 255 (9.7%) |
| 75 Years and over | 92 (9.4%) | 417 (20.6%) |
Technology Access in Cleveland
Computing Device Access in Cleveland
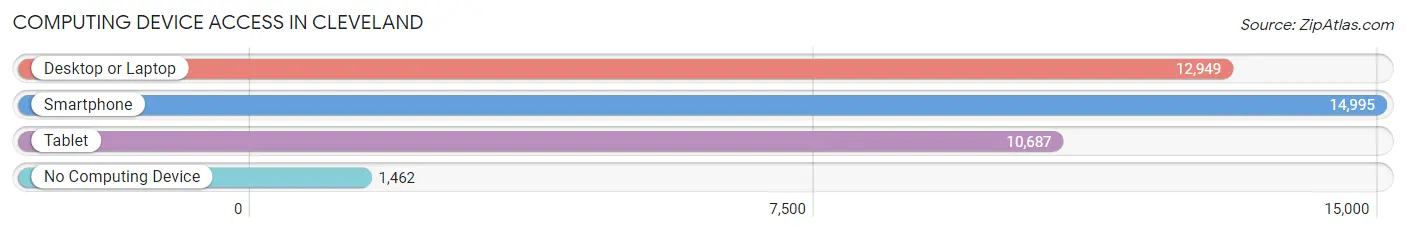
| Device Type | # Households | % Households |
| Desktop or Laptop | 12,949 | 72.7% |
| Smartphone | 14,995 | 84.2% |
| Tablet | 10,687 | 60.0% |
| No Computing Device | 1,462 | 8.2% |
| Total | 17,801 | 100.0% |
Internet Access in Cleveland
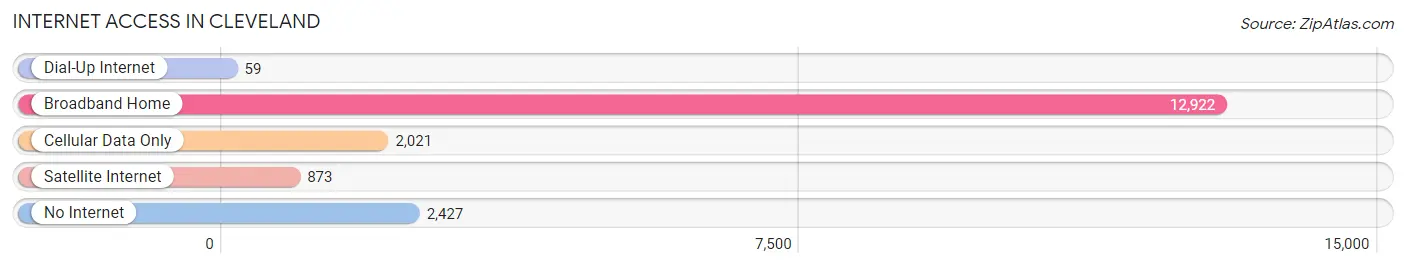
| Internet Type | # Households | % Households |
| Dial-Up Internet | 59 | 0.3% |
| Broadband Home | 12,922 | 72.6% |
| Cellular Data Only | 2,021 | 11.4% |
| Satellite Internet | 873 | 4.9% |
| No Internet | 2,427 | 13.6% |
| Total | 17,801 | 100.0% |
Cleveland Summary
Cleveland, Tennessee is a city located in Bradley County, Tennessee, United States. It is the county seat of Bradley County and the largest city in the southeastern portion of the state. The population of Cleveland was 41,285 as of the 2010 census, making it the state's fourteenth largest city.
History
Cleveland was founded in 1837 by Colonel Benjamin Cleveland, a Revolutionary War veteran and a member of the state legislature. The city was named after him and was incorporated in 1842. The city was originally located in the center of Bradley County, but it was moved to its current location in 1854.
Cleveland was an important center of industry during the 19th century. It was home to several cotton mills, a paper mill, and a large tannery. The city was also the site of the first railroad in the county, which was built in 1851.
During the Civil War, Cleveland was a major supply center for the Confederate Army. The city was also the site of several battles, including the Battle of Cleveland in 1863.
Geography
Cleveland is located in the southeastern portion of Tennessee, approximately 25 miles northeast of Chattanooga. The city is situated in the foothills of the Appalachian Mountains and is surrounded by several lakes and rivers, including the Hiwassee River, the Ocoee River, and the Little Tennessee River.
The city has a total area of 24.2 square miles, of which 24.1 square miles is land and 0.1 square miles is water.
Economy
Cleveland is a major industrial center in the region. The city is home to several large manufacturing companies, including Whirlpool Corporation, Wacker Chemical Corporation, and the Cleveland/Bradley County Industrial Park. The city is also home to several educational institutions, including Lee University, Cleveland State Community College, and the Tennessee College of Applied Technology.
The city's economy is also supported by tourism, with several attractions in the area, including the Museum Center at Five Points, the Cleveland/Bradley County Greenway, and the Cherokee National Forest.
Demographics
As of the 2010 census, the population of Cleveland was 41,285. The racial makeup of the city was 79.2% White, 15.3% African American, 0.4% Native American, 1.2% Asian, 0.1% Pacific Islander, 1.7% from other races, and 2.1% from two or more races. Hispanic or Latino of any race were 4.2% of the population.
The median income for a household in the city was $35,945, and the median income for a family was $45,945. The per capita income for the city was $20,845. About 15.2% of families and 19.2% of the population were below the poverty line, including 28.2% of those under age 18 and 11.2% of those age 65 or over.
Common Questions
What is Per Capita Income in Cleveland?
Per Capita income in Cleveland is $29,719.
What is the Median Family Income in Cleveland?
Median Family Income in Cleveland is $71,141.
What is the Median Household income in Cleveland?
Median Household Income in Cleveland is $52,468.
What is Income or Wage Gap in Cleveland?
Income or Wage Gap in Cleveland is 32.5%.
Women in Cleveland earn 67.5 cents for every dollar earned by a man.
What is Family Income Deficit in Cleveland?
Family Income Deficit in Cleveland is $9,521.
Families that are below poverty line in Cleveland earn $9,521 less on average than the poverty threshold level.
What is Inequality or Gini Index in Cleveland?
Inequality or Gini Index in Cleveland is 0.48.
What is the Total Population of Cleveland?
Total Population of Cleveland is 47,725.
What is the Total Male Population of Cleveland?
Total Male Population of Cleveland is 22,486.
What is the Total Female Population of Cleveland?
Total Female Population of Cleveland is 25,239.
What is the Ratio of Males per 100 Females in Cleveland?
There are 89.09 Males per 100 Females in Cleveland.
What is the Ratio of Females per 100 Males in Cleveland?
There are 112.24 Females per 100 Males in Cleveland.
What is the Median Population Age in Cleveland?
Median Population Age in Cleveland is 34.5 Years.
What is the Average Family Size in Cleveland
Average Family Size in Cleveland is 3.1 People.
What is the Average Household Size in Cleveland
Average Household Size in Cleveland is 2.5 People.
How Large is the Labor Force in Cleveland?
There are 23,369 People in the Labor Forcein in Cleveland.
What is the Percentage of People in the Labor Force in Cleveland?
61.4% of People are in the Labor Force in Cleveland.
What is the Unemployment Rate in Cleveland?
Unemployment Rate in Cleveland is 4.3%.