Celina, TN Map & Demographics
Celina Map
Celina Overview
$15,743
PER CAPITA INCOME
$50,417
AVG FAMILY INCOME
$33,689
AVG HOUSEHOLD INCOME
36.7%
WAGE / INCOME GAP [ % ]
63.3¢/ $1
WAGE / INCOME GAP [ $ ]
$18,945
FAMILY INCOME DEFICIT
0.48
INEQUALITY / GINI INDEX
1,767
TOTAL POPULATION
840
MALE POPULATION
927
FEMALE POPULATION
90.61
MALES / 100 FEMALES
110.36
FEMALES / 100 MALES
45.0
MEDIAN AGE
3.4
AVG FAMILY SIZE
2.6
AVG HOUSEHOLD SIZE
463
LABOR FORCE [ PEOPLE ]
35.2%
PERCENT IN LABOR FORCE
13.9%
UNEMPLOYMENT RATE
Celina Zip Codes
Celina Area Codes
Income in Celina
Income Overview in Celina
Per Capita Income in Celina is $15,743, while median incomes of families and households are $50,417 and $33,689 respectively.
| Characteristic | Number | Measure |
| Per Capita Income | 1,767 | $15,743 |
| Median Family Income | 408 | $50,417 |
| Mean Family Income | 408 | $57,462 |
| Median Household Income | 631 | $33,689 |
| Mean Household Income | 631 | $44,066 |
| Income Deficit | 408 | $18,945 |
| Wage / Income Gap (%) | 1,767 | 36.67% |
| Wage / Income Gap ($) | 1,767 | 63.33¢ per $1 |
| Gini / Inequality Index | 1,767 | 0.48 |
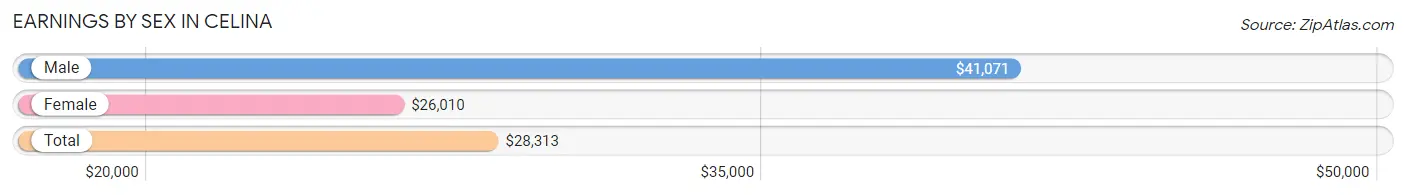
Earnings by Sex in Celina
Average Earnings in Celina are $28,313, $41,071 for men and $26,010 for women, a difference of 36.7%.
| Sex | Number | Average Earnings |
| Male | 198 (41.5%) | $41,071 |
| Female | 279 (58.5%) | $26,010 |
| Total | 477 (100.0%) | $28,313 |
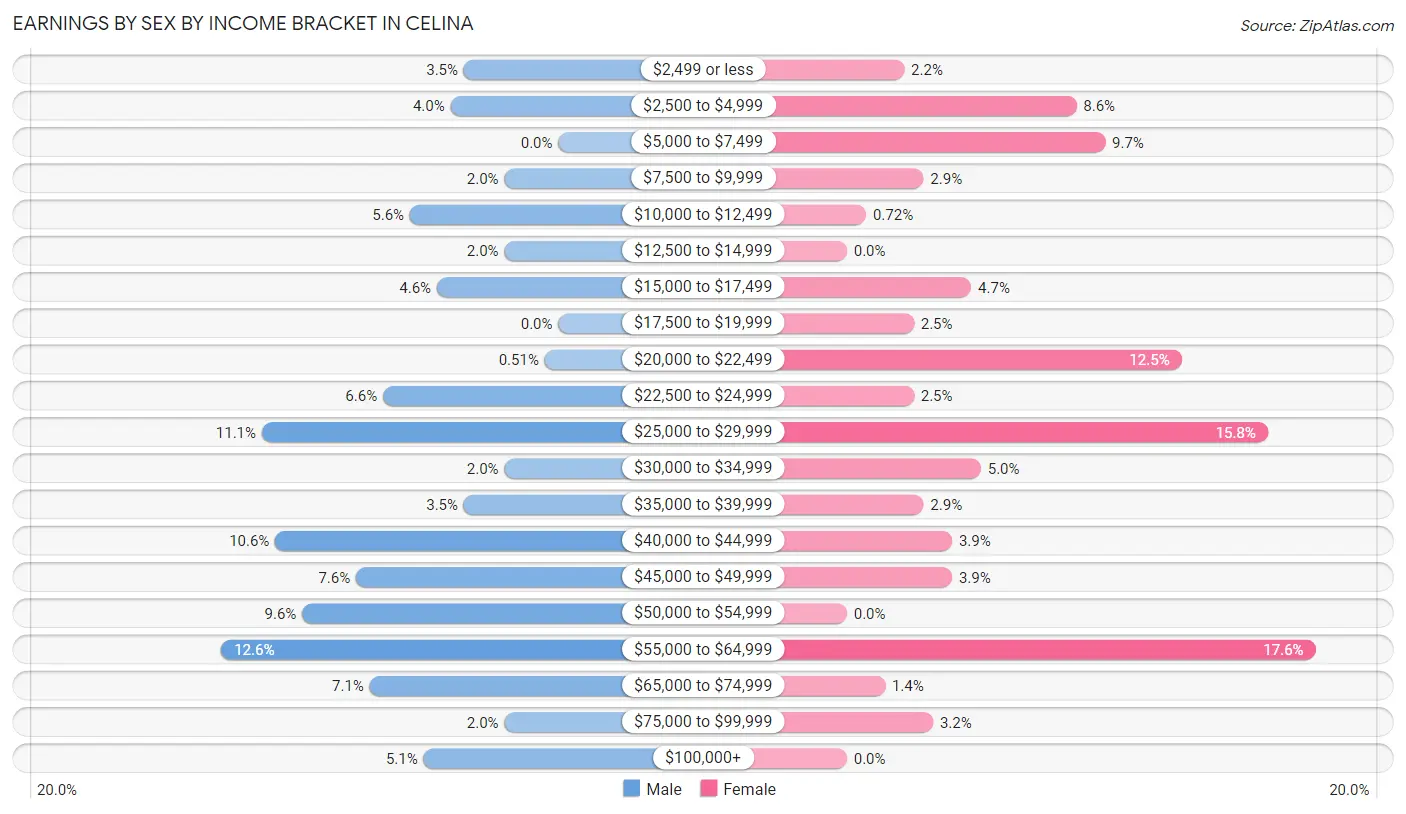
Earnings by Sex by Income Bracket in Celina
The most common earnings brackets in Celina are $55,000 to $64,999 for men (25 | 12.6%) and $55,000 to $64,999 for women (49 | 17.6%).
| Income | Male | Female |
| $2,499 or less | 7 (3.5%) | 6 (2.1%) |
| $2,500 to $4,999 | 8 (4.0%) | 24 (8.6%) |
| $5,000 to $7,499 | 0 (0.0%) | 27 (9.7%) |
| $7,500 to $9,999 | 4 (2.0%) | 8 (2.9%) |
| $10,000 to $12,499 | 11 (5.6%) | 2 (0.7%) |
| $12,500 to $14,999 | 4 (2.0%) | 0 (0.0%) |
| $15,000 to $17,499 | 9 (4.5%) | 13 (4.7%) |
| $17,500 to $19,999 | 0 (0.0%) | 7 (2.5%) |
| $20,000 to $22,499 | 1 (0.5%) | 35 (12.5%) |
| $22,500 to $24,999 | 13 (6.6%) | 7 (2.5%) |
| $25,000 to $29,999 | 22 (11.1%) | 44 (15.8%) |
| $30,000 to $34,999 | 4 (2.0%) | 14 (5.0%) |
| $35,000 to $39,999 | 7 (3.5%) | 8 (2.9%) |
| $40,000 to $44,999 | 21 (10.6%) | 11 (3.9%) |
| $45,000 to $49,999 | 15 (7.6%) | 11 (3.9%) |
| $50,000 to $54,999 | 19 (9.6%) | 0 (0.0%) |
| $55,000 to $64,999 | 25 (12.6%) | 49 (17.6%) |
| $65,000 to $74,999 | 14 (7.1%) | 4 (1.4%) |
| $75,000 to $99,999 | 4 (2.0%) | 9 (3.2%) |
| $100,000+ | 10 (5.1%) | 0 (0.0%) |
| Total | 198 (100.0%) | 279 (100.0%) |
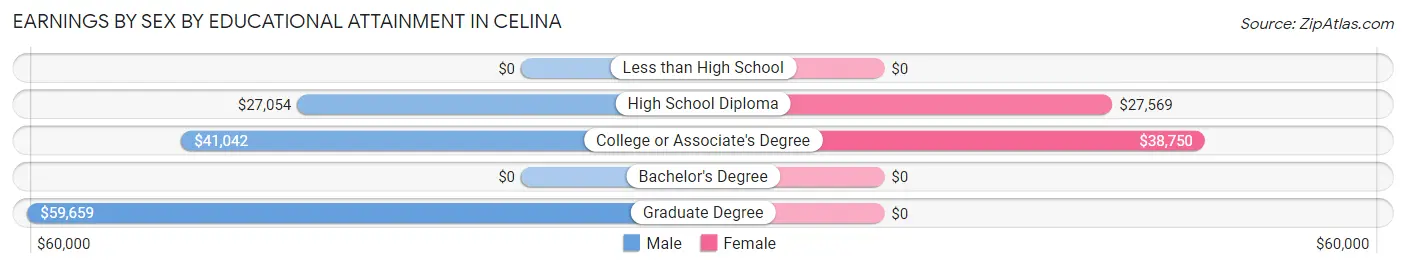
Earnings by Sex by Educational Attainment in Celina
Average earnings in Celina are $41,488 for men and $30,000 for women, a difference of 27.7%. Men with an educational attainment of graduate degree enjoy the highest average annual earnings of $59,659, while those with high school diploma education earn the least with $27,054. Women with an educational attainment of college or associate's degree earn the most with the average annual earnings of $38,750, while those with high school diploma education have the smallest earnings of $27,569.
| Educational Attainment | Male Income | Female Income |
| Less than High School | - | - |
| High School Diploma | $27,054 | $27,569 |
| College or Associate's Degree | $41,042 | $38,750 |
| Bachelor's Degree | - | - |
| Graduate Degree | $59,659 | $0 |
| Total | $41,488 | $30,000 |
Family Income in Celina
Family Income Brackets in Celina
According to the Celina family income data, there are 90 families falling into the $25,000 to $34,999 income range, which is the most common income bracket and makes up 22.1% of all families.
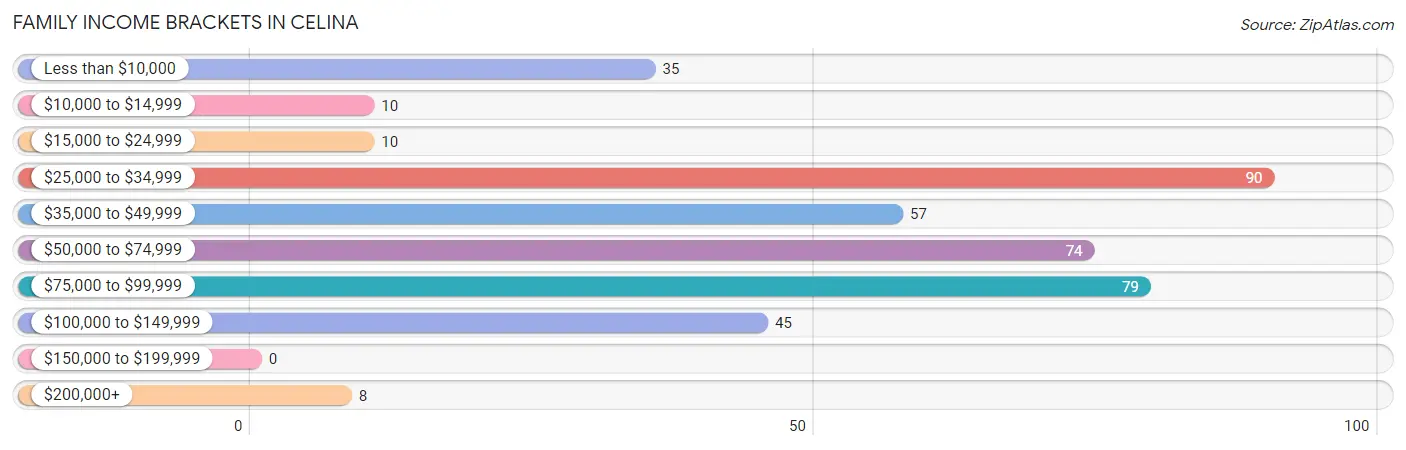
| Income Bracket | # Families | % Families |
| Less than $10,000 | 35 | 8.6% |
| $10,000 to $14,999 | 10 | 2.5% |
| $15,000 to $24,999 | 10 | 2.5% |
| $25,000 to $34,999 | 90 | 22.1% |
| $35,000 to $49,999 | 57 | 14.0% |
| $50,000 to $74,999 | 74 | 18.1% |
| $75,000 to $99,999 | 79 | 19.4% |
| $100,000 to $149,999 | 45 | 11.0% |
| $150,000 to $199,999 | 0 | 0.0% |
| $200,000+ | 8 | 2.0% |
Family Income by Famaliy Size in Celina
3-person families (67 | 16.4%) account for the highest median family income in Celina with $100,179 per family, while 3-person families (67 | 16.4%) have the highest median income of $33,393 per family member.
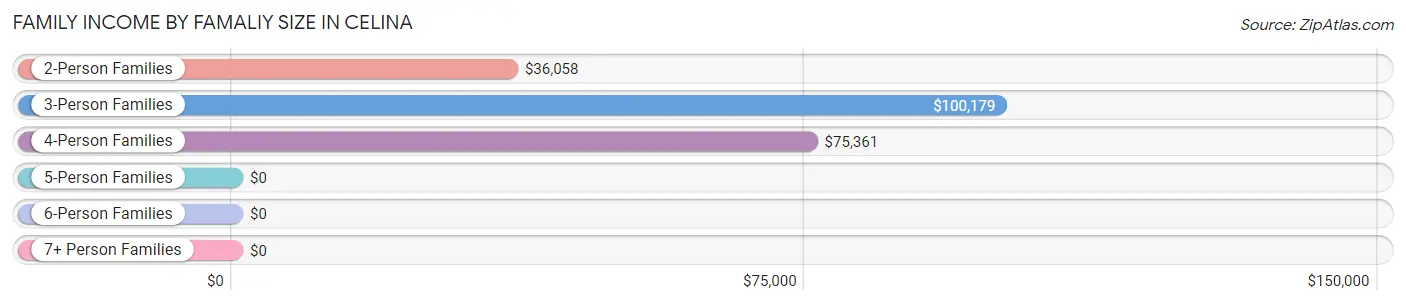
| Income Bracket | # Families | Median Income |
| 2-Person Families | 199 (48.8%) | $36,058 |
| 3-Person Families | 67 (16.4%) | $100,179 |
| 4-Person Families | 101 (24.7%) | $75,361 |
| 5-Person Families | 16 (3.9%) | $0 |
| 6-Person Families | 20 (4.9%) | $0 |
| 7+ Person Families | 5 (1.2%) | $0 |
| Total | 408 (100.0%) | $50,417 |
Family Income by Number of Earners in Celina
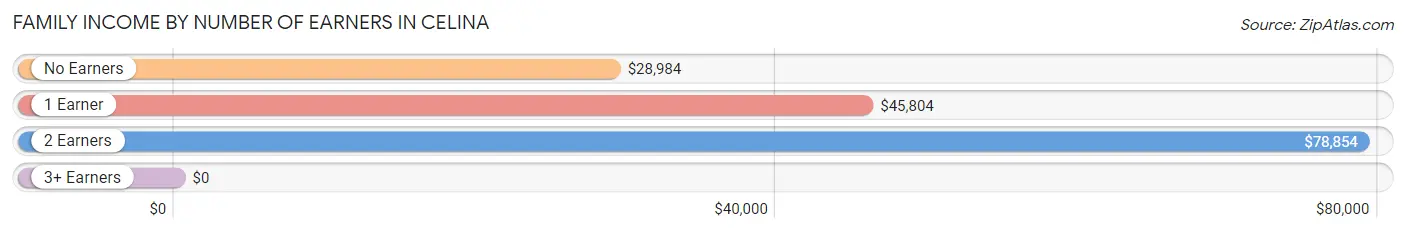
| Number of Earners | # Families | Median Income |
| No Earners | 122 (29.9%) | $28,984 |
| 1 Earner | 183 (44.9%) | $45,804 |
| 2 Earners | 73 (17.9%) | $78,854 |
| 3+ Earners | 30 (7.3%) | $0 |
| Total | 408 (100.0%) | $50,417 |
Household Income in Celina
Household Income Brackets in Celina
With 124 households falling in the category, the $25,000 to $34,999 income range is the most frequent in Celina, accounting for 19.7% of all households. In contrast, only 3 households (0.5%) fall into the $150,000 to $199,999 income bracket, making it the least populous group.
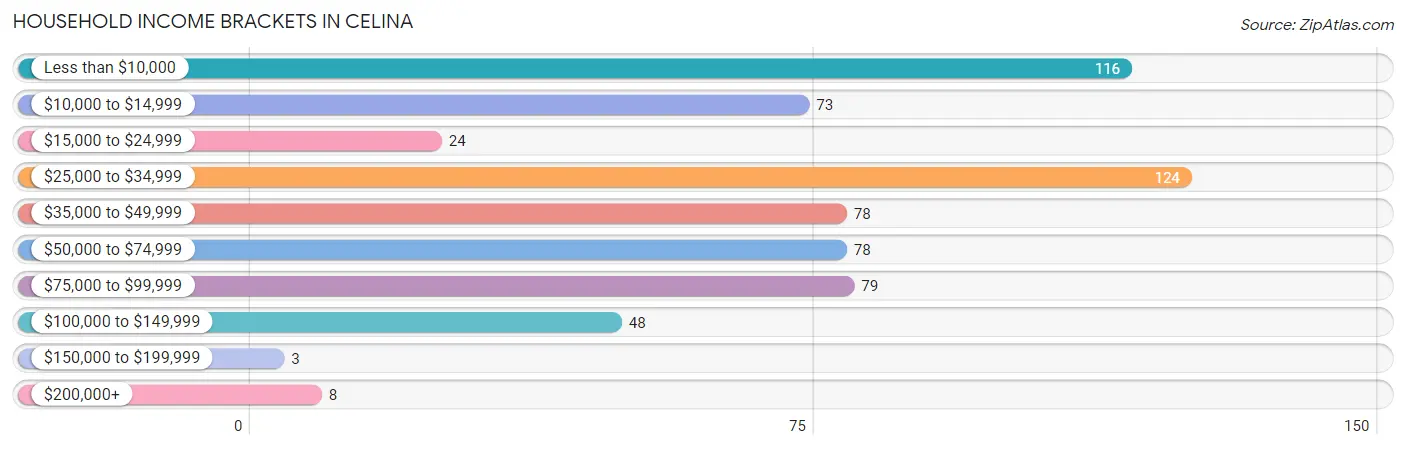
| Income Bracket | # Households | % Households |
| Less than $10,000 | 116 | 18.4% |
| $10,000 to $14,999 | 73 | 11.6% |
| $15,000 to $24,999 | 24 | 3.8% |
| $25,000 to $34,999 | 124 | 19.7% |
| $35,000 to $49,999 | 78 | 12.4% |
| $50,000 to $74,999 | 78 | 12.4% |
| $75,000 to $99,999 | 79 | 12.5% |
| $100,000 to $149,999 | 48 | 7.6% |
| $150,000 to $199,999 | 3 | 0.5% |
| $200,000+ | 8 | 1.3% |
Household Income by Householder Age in Celina
The median household income in Celina is $33,689, with the highest median household income of $34,432 found in the 65+ years age bracket for the primary householder. A total of 261 households (41.4%) fall into this category. Meanwhile, the 15 to 24 years age bracket for the primary householder has the lowest median household income of $0, with 16 households (2.5%) in this group.
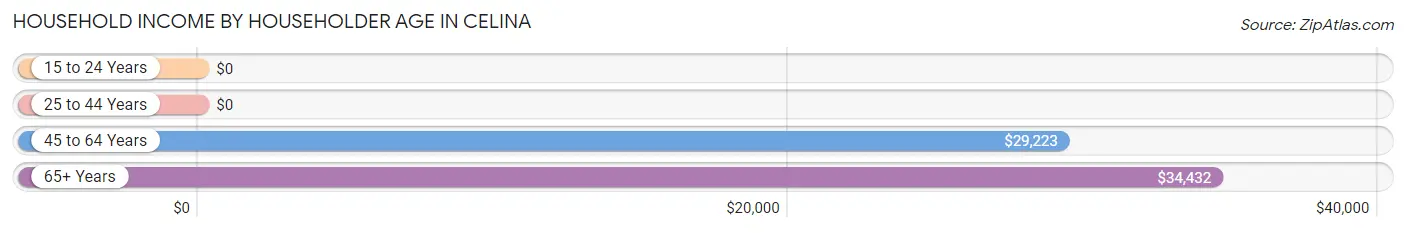
| Income Bracket | # Households | Median Income |
| 15 to 24 Years | 16 (2.5%) | $0 |
| 25 to 44 Years | 111 (17.6%) | $0 |
| 45 to 64 Years | 243 (38.5%) | $29,223 |
| 65+ Years | 261 (41.4%) | $34,432 |
| Total | 631 (100.0%) | $33,689 |
Poverty in Celina
Income Below Poverty by Sex and Age in Celina
With 25.3% poverty level for males and 25.9% for females among the residents of Celina, 18 to 24 year old males and 45 to 54 year old females are the most vulnerable to poverty, with 7 males (50.0%) and 60 females (43.2%) in their respective age groups living below the poverty level.
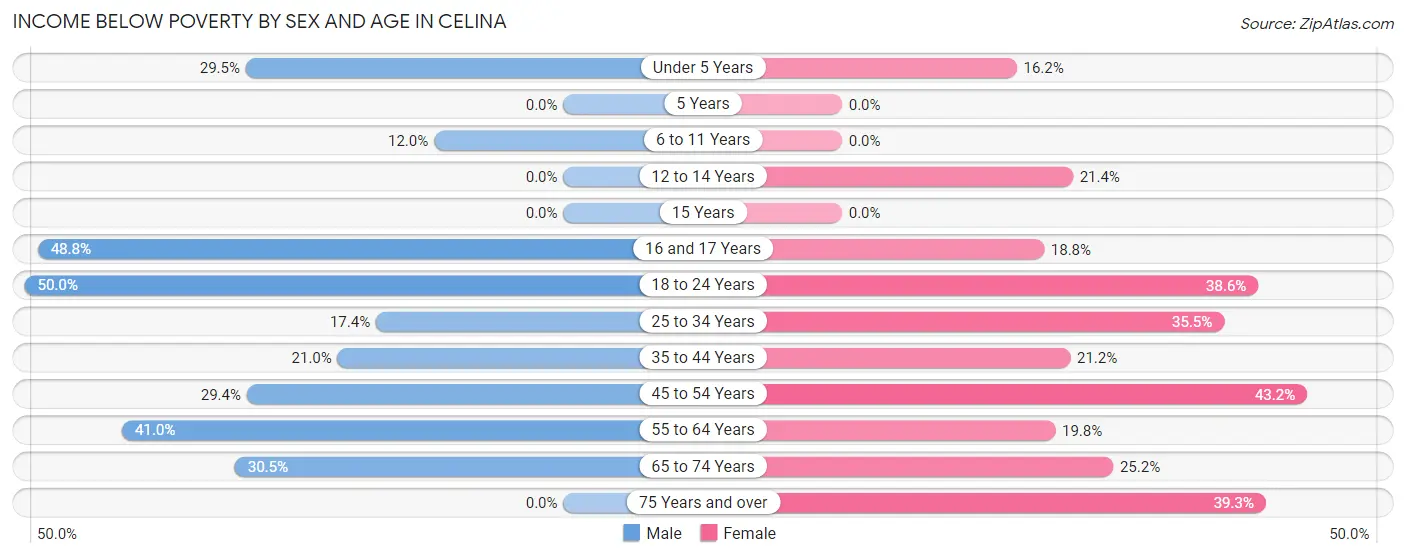
| Age Bracket | Male | Female |
| Under 5 Years | 28 (29.5%) | 12 (16.2%) |
| 5 Years | 0 (0.0%) | 0 (0.0%) |
| 6 to 11 Years | 12 (12.0%) | 0 (0.0%) |
| 12 to 14 Years | 0 (0.0%) | 9 (21.4%) |
| 15 Years | 0 (0.0%) | 0 (0.0%) |
| 16 and 17 Years | 20 (48.8%) | 3 (18.8%) |
| 18 to 24 Years | 7 (50.0%) | 34 (38.6%) |
| 25 to 34 Years | 4 (17.4%) | 11 (35.5%) |
| 35 to 44 Years | 22 (20.9%) | 18 (21.2%) |
| 45 to 54 Years | 47 (29.4%) | 60 (43.2%) |
| 55 to 64 Years | 34 (41.0%) | 19 (19.8%) |
| 65 to 74 Years | 25 (30.5%) | 37 (25.2%) |
| 75 Years and over | 0 (0.0%) | 24 (39.3%) |
| Total | 199 (25.3%) | 227 (25.9%) |
Income Above Poverty by Sex and Age in Celina
According to the poverty statistics in Celina, males aged 12 to 14 years and females aged 6 to 11 years are the age groups that are most secure financially, with 100.0% of males and 100.0% of females in these age groups living above the poverty line.
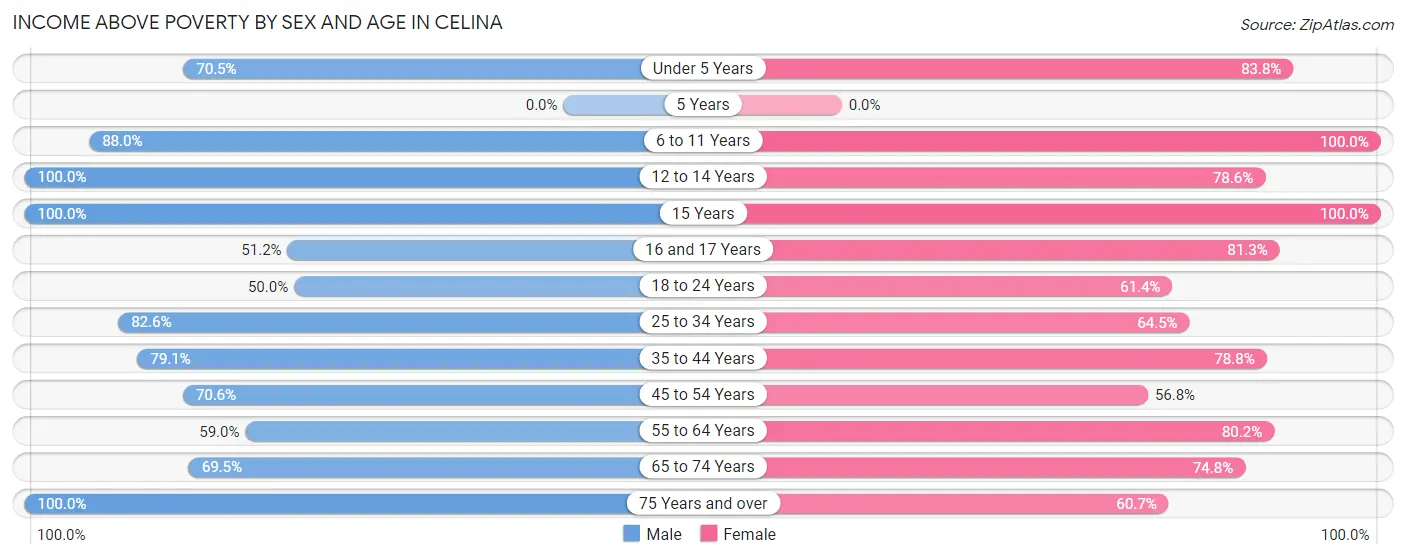
| Age Bracket | Male | Female |
| Under 5 Years | 67 (70.5%) | 62 (83.8%) |
| 5 Years | 0 (0.0%) | 0 (0.0%) |
| 6 to 11 Years | 88 (88.0%) | 12 (100.0%) |
| 12 to 14 Years | 40 (100.0%) | 33 (78.6%) |
| 15 Years | 1 (100.0%) | 87 (100.0%) |
| 16 and 17 Years | 21 (51.2%) | 13 (81.2%) |
| 18 to 24 Years | 7 (50.0%) | 54 (61.4%) |
| 25 to 34 Years | 19 (82.6%) | 20 (64.5%) |
| 35 to 44 Years | 83 (79.0%) | 67 (78.8%) |
| 45 to 54 Years | 113 (70.6%) | 79 (56.8%) |
| 55 to 64 Years | 49 (59.0%) | 77 (80.2%) |
| 65 to 74 Years | 57 (69.5%) | 110 (74.8%) |
| 75 Years and over | 44 (100.0%) | 37 (60.7%) |
| Total | 589 (74.8%) | 651 (74.2%) |
Income Below Poverty Among Married-Couple Families in Celina
The poverty statistics for married-couple families in Celina show that 17.1% or 43 of the total 252 families live below the poverty line. Families with 3 or 4 children have the highest poverty rate of 100.0%, comprising of 5 families. On the other hand, families with no children have the lowest poverty rate of 12.3%, which includes 16 families.
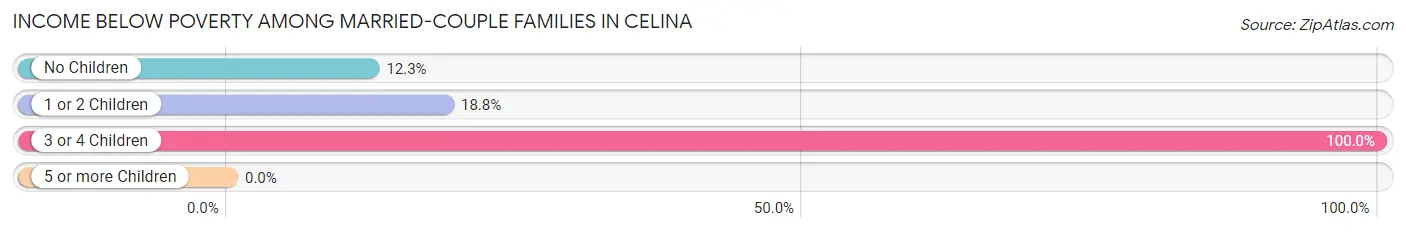
| Children | Above Poverty | Below Poverty |
| No Children | 114 (87.7%) | 16 (12.3%) |
| 1 or 2 Children | 95 (81.2%) | 22 (18.8%) |
| 3 or 4 Children | 0 (0.0%) | 5 (100.0%) |
| 5 or more Children | 0 (0.0%) | 0 (0.0%) |
| Total | 209 (82.9%) | 43 (17.1%) |
Income Below Poverty Among Single-Parent Households in Celina
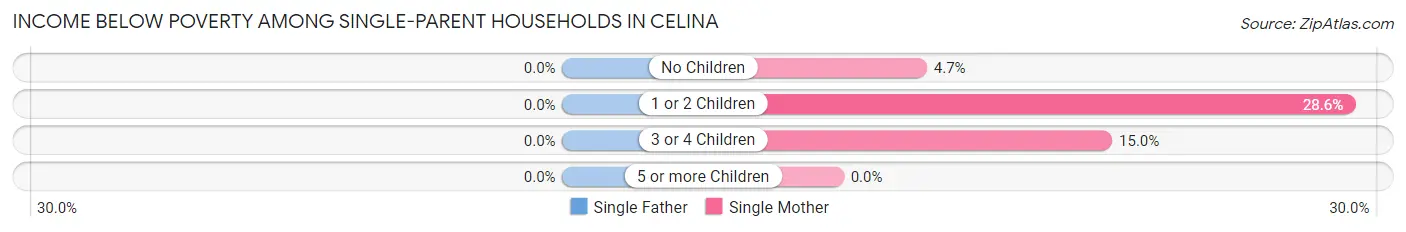
| Children | Single Father | Single Mother |
| No Children | 0 (0.0%) | 2 (4.6%) |
| 1 or 2 Children | 0 (0.0%) | 8 (28.6%) |
| 3 or 4 Children | 0 (0.0%) | 3 (15.0%) |
| 5 or more Children | 0 (0.0%) | 0 (0.0%) |
| Total | 0 (0.0%) | 13 (11.7%) |
Income Below Poverty Among Married-Couple vs Single-Parent Households in Celina
The poverty data for Celina shows that 43 of the married-couple family households (17.1%) and 13 of the single-parent households (8.3%) are living below the poverty level. Within the married-couple family households, those with 3 or 4 children have the highest poverty rate, with 5 households (100.0%) falling below the poverty line. Among the single-parent households, those with 3 or 4 children have the highest poverty rate, with 3 household (15.0%) living below poverty.
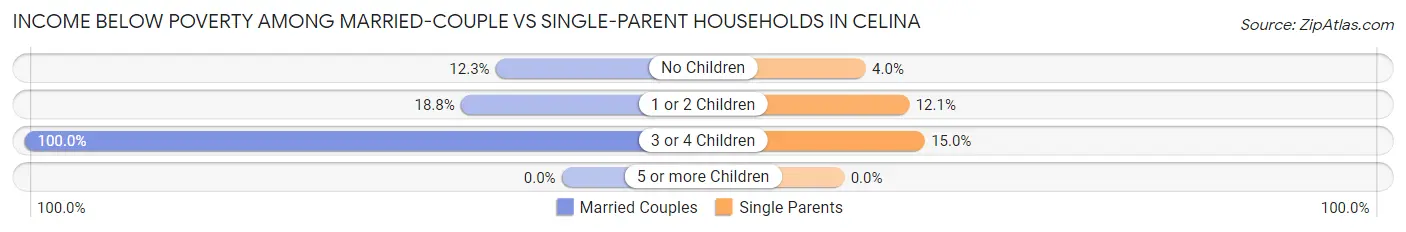
| Children | Married-Couple Families | Single-Parent Households |
| No Children | 16 (12.3%) | 2 (4.0%) |
| 1 or 2 Children | 22 (18.8%) | 8 (12.1%) |
| 3 or 4 Children | 5 (100.0%) | 3 (15.0%) |
| 5 or more Children | 0 (0.0%) | 0 (0.0%) |
| Total | 43 (17.1%) | 13 (8.3%) |
Race in Celina
The most populous races in Celina are White / Caucasian (1,577 | 89.2%), Two or more Races (94 | 5.3%), and Black / African American (53 | 3.0%).
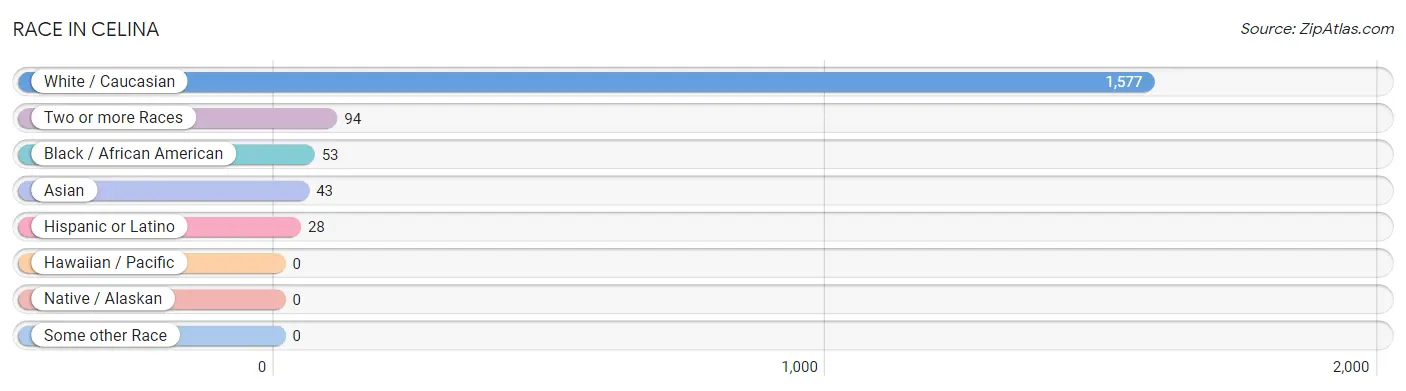
| Race | # Population | % Population |
| Asian | 43 | 2.4% |
| Black / African American | 53 | 3.0% |
| Hawaiian / Pacific | 0 | 0.0% |
| Hispanic or Latino | 28 | 1.6% |
| Native / Alaskan | 0 | 0.0% |
| White / Caucasian | 1,577 | 89.2% |
| Two or more Races | 94 | 5.3% |
| Some other Race | 0 | 0.0% |
| Total | 1,767 | 100.0% |
Ancestry in Celina
The most populous ancestries reported in Celina are American (609 | 34.5%), English (100 | 5.7%), Korean (55 | 3.1%), Irish (23 | 1.3%), and Cherokee (16 | 0.9%), together accounting for 45.5% of all Celina residents.
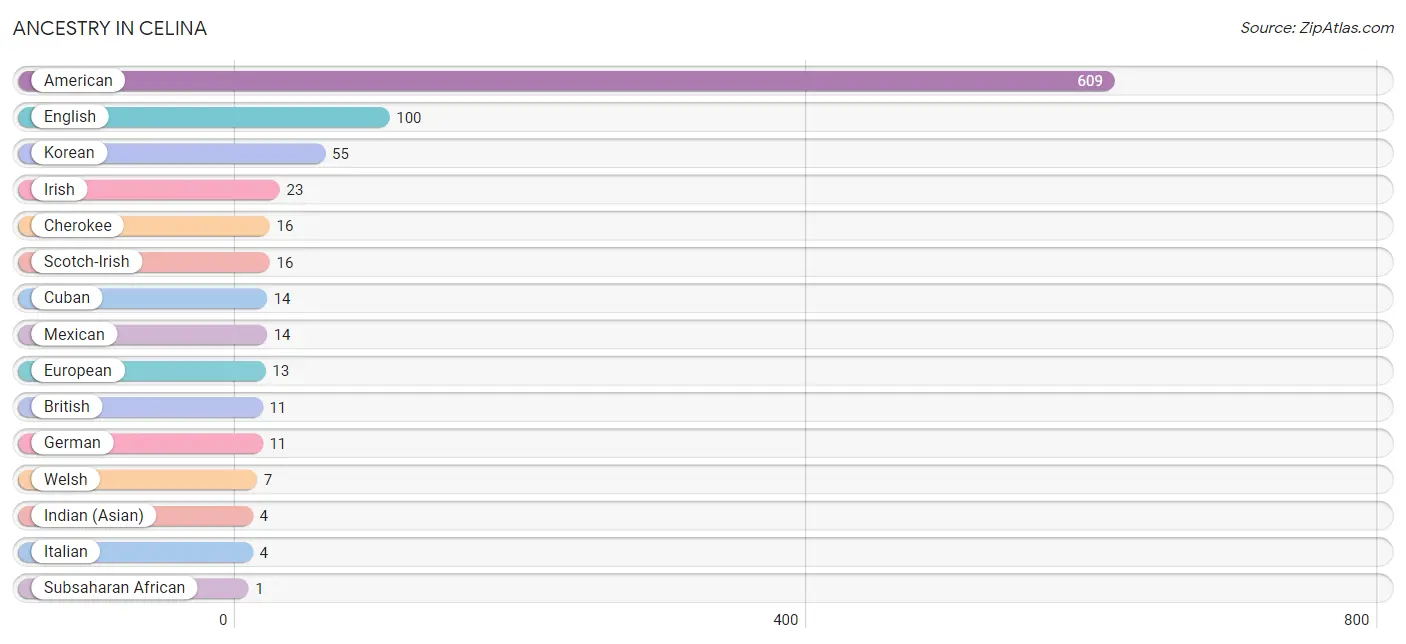
| Ancestry | # Population | % Population |
| American | 609 | 34.5% |
| British | 11 | 0.6% |
| Cherokee | 16 | 0.9% |
| Cuban | 14 | 0.8% |
| English | 100 | 5.7% |
| European | 13 | 0.7% |
| German | 11 | 0.6% |
| Indian (Asian) | 4 | 0.2% |
| Irish | 23 | 1.3% |
| Italian | 4 | 0.2% |
| Korean | 55 | 3.1% |
| Mexican | 14 | 0.8% |
| Scotch-Irish | 16 | 0.9% |
| Subsaharan African | 1 | 0.1% |
| Welsh | 7 | 0.4% | View All 15 Rows |
Immigrants in Celina
The most numerous immigrant groups reported in Celina came from Asia (43 | 2.4%), Philippines (39 | 2.2%), South Eastern Asia (39 | 2.2%), Latin America (28 | 1.6%), and Caribbean (14 | 0.8%), together accounting for 9.2% of all Celina residents.
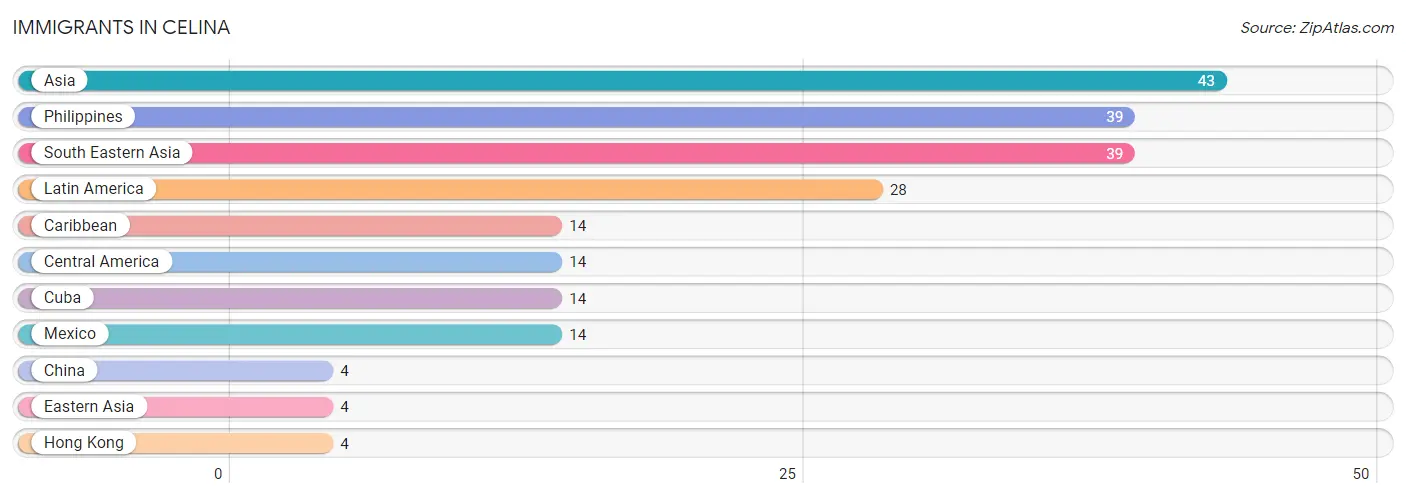
| Immigration Origin | # Population | % Population |
| Asia | 43 | 2.4% |
| Caribbean | 14 | 0.8% |
| Central America | 14 | 0.8% |
| China | 4 | 0.2% |
| Cuba | 14 | 0.8% |
| Eastern Asia | 4 | 0.2% |
| Hong Kong | 4 | 0.2% |
| Latin America | 28 | 1.6% |
| Mexico | 14 | 0.8% |
| Philippines | 39 | 2.2% |
| South Eastern Asia | 39 | 2.2% | View All 11 Rows |
Sex and Age in Celina
Sex and Age in Celina
The most populous age groups in Celina are 40 to 44 Years (104 | 12.4%) for men and 15 to 19 Years (148 | 16.0%) for women.
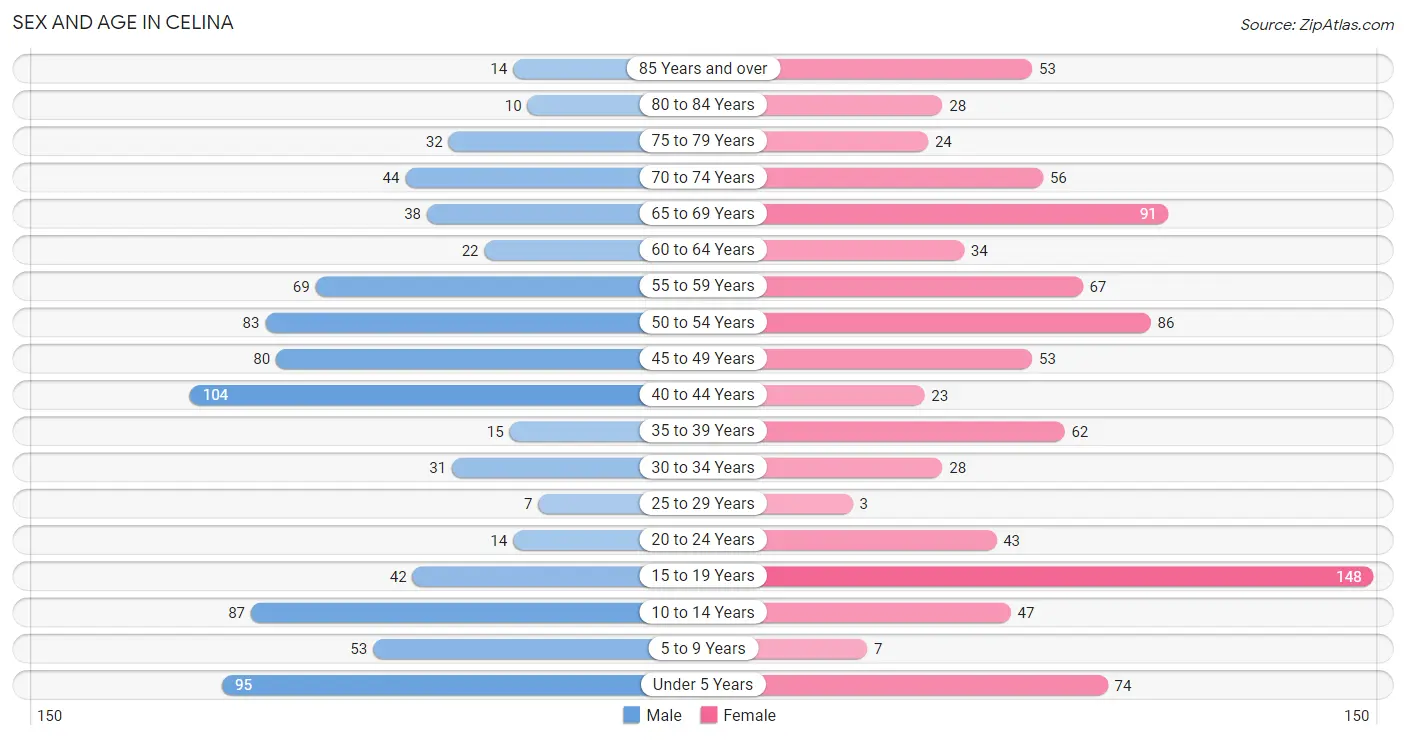
| Age Bracket | Male | Female |
| Under 5 Years | 95 (11.3%) | 74 (8.0%) |
| 5 to 9 Years | 53 (6.3%) | 7 (0.8%) |
| 10 to 14 Years | 87 (10.4%) | 47 (5.1%) |
| 15 to 19 Years | 42 (5.0%) | 148 (16.0%) |
| 20 to 24 Years | 14 (1.7%) | 43 (4.6%) |
| 25 to 29 Years | 7 (0.8%) | 3 (0.3%) |
| 30 to 34 Years | 31 (3.7%) | 28 (3.0%) |
| 35 to 39 Years | 15 (1.8%) | 62 (6.7%) |
| 40 to 44 Years | 104 (12.4%) | 23 (2.5%) |
| 45 to 49 Years | 80 (9.5%) | 53 (5.7%) |
| 50 to 54 Years | 83 (9.9%) | 86 (9.3%) |
| 55 to 59 Years | 69 (8.2%) | 67 (7.2%) |
| 60 to 64 Years | 22 (2.6%) | 34 (3.7%) |
| 65 to 69 Years | 38 (4.5%) | 91 (9.8%) |
| 70 to 74 Years | 44 (5.2%) | 56 (6.0%) |
| 75 to 79 Years | 32 (3.8%) | 24 (2.6%) |
| 80 to 84 Years | 10 (1.2%) | 28 (3.0%) |
| 85 Years and over | 14 (1.7%) | 53 (5.7%) |
| Total | 840 (100.0%) | 927 (100.0%) |
Families and Households in Celina
Median Family Size in Celina
The median family size in Celina is 3.40 persons per family, with single female/mother families (111 | 27.2%) accounting for the largest median family size of 4.67 persons per family. On the other hand, single male/father families (45 | 11.0%) represent the smallest median family size with 2.73 persons per family.
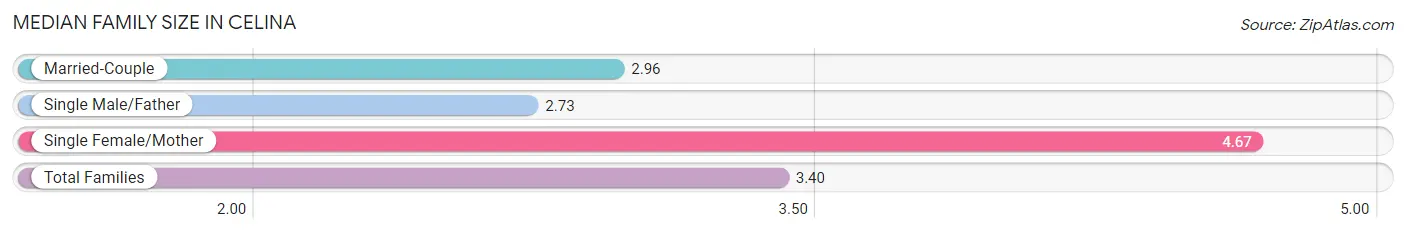
| Family Type | # Families | Family Size |
| Married-Couple | 252 (61.8%) | 2.96 |
| Single Male/Father | 45 (11.0%) | 2.73 |
| Single Female/Mother | 111 (27.2%) | 4.67 |
| Total Families | 408 (100.0%) | 3.40 |
Median Household Size in Celina
The median household size in Celina is 2.64 persons per household, with single female/mother households (111 | 17.6%) accounting for the largest median household size of 4.75 persons per household. non-family households (223 | 35.3%) represent the smallest median household size with 1.22 persons per household.
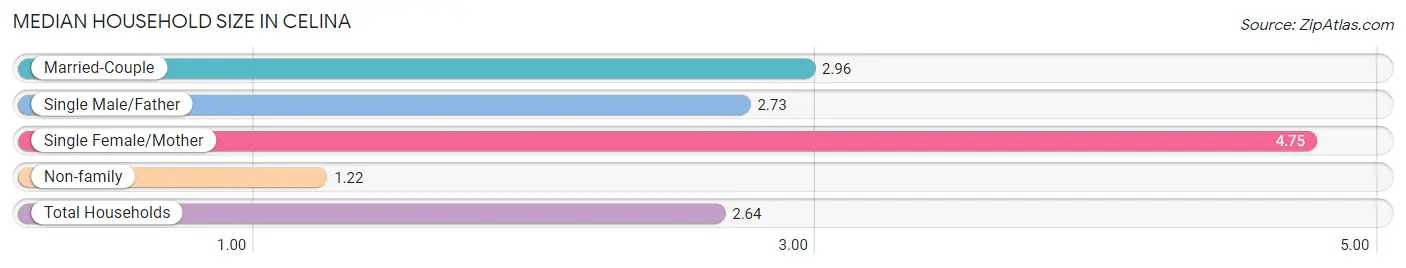
| Household Type | # Households | Household Size |
| Married-Couple | 252 (39.9%) | 2.96 |
| Single Male/Father | 45 (7.1%) | 2.73 |
| Single Female/Mother | 111 (17.6%) | 4.75 |
| Non-family | 223 (35.3%) | 1.22 |
| Total Households | 631 (100.0%) | 2.64 |
Household Size by Marriage Status in Celina
Out of a total of 631 households in Celina, 408 (64.7%) are family households, while 223 (35.3%) are nonfamily households. The most numerous type of family households are 2-person households, comprising 191, and the most common type of nonfamily households are 1-person households, comprising 201.
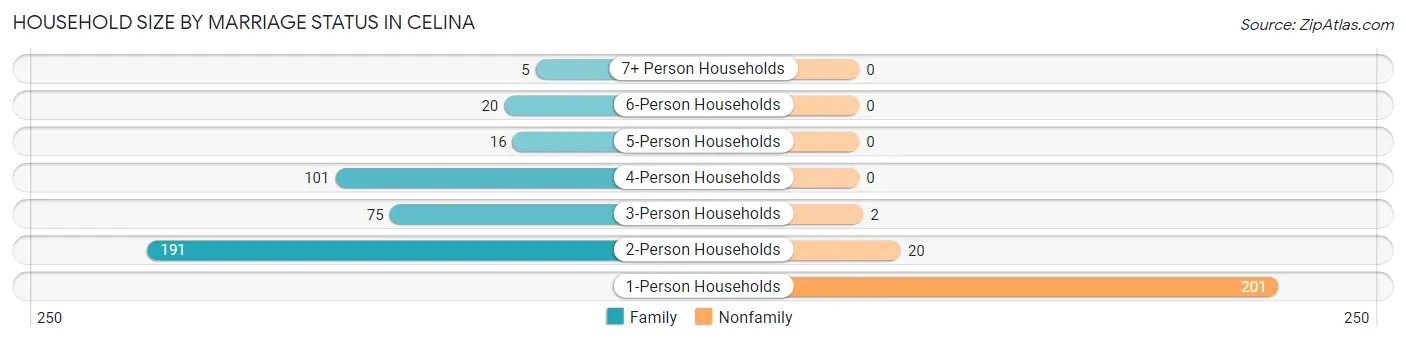
| Household Size | Family Households | Nonfamily Households |
| 1-Person Households | - | 201 (31.9%) |
| 2-Person Households | 191 (30.3%) | 20 (3.2%) |
| 3-Person Households | 75 (11.9%) | 2 (0.3%) |
| 4-Person Households | 101 (16.0%) | 0 (0.0%) |
| 5-Person Households | 16 (2.5%) | 0 (0.0%) |
| 6-Person Households | 20 (3.2%) | 0 (0.0%) |
| 7+ Person Households | 5 (0.8%) | 0 (0.0%) |
| Total | 408 (64.7%) | 223 (35.3%) |
Female Fertility in Celina
Fertility by Age in Celina
Average fertility rate in Celina is 61.0 births per 1,000 women. Women in the age bracket of 20 to 34 years have the highest fertility rate with 216.0 births per 1,000 women. Women in the age bracket of 20 to 34 years acount for 72.7% of all women with births.
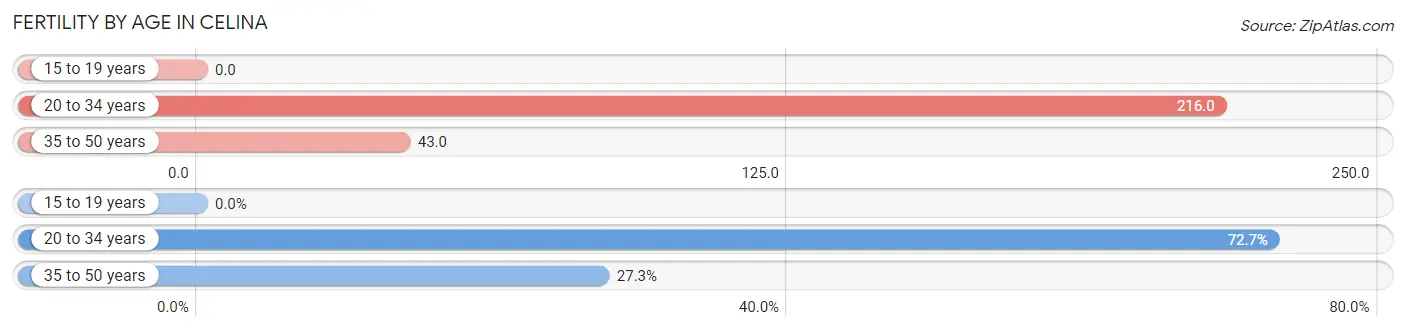
| Age Bracket | Women with Births | Births / 1,000 Women |
| 15 to 19 years | 0 (0.0%) | 0.0 |
| 20 to 34 years | 16 (72.7%) | 216.0 |
| 35 to 50 years | 6 (27.3%) | 43.0 |
| Total | 22 (100.0%) | 61.0 |
Fertility by Age by Marriage Status in Celina
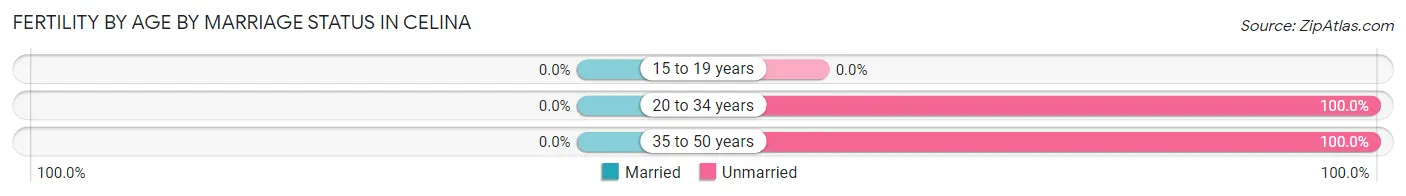
| Age Bracket | Married | Unmarried |
| 15 to 19 years | 0 (0.0%) | 0 (0.0%) |
| 20 to 34 years | 0 (0.0%) | 16 (100.0%) |
| 35 to 50 years | 0 (0.0%) | 6 (100.0%) |
| Total | 0 (0.0%) | 22 (100.0%) |
Fertility by Education in Celina
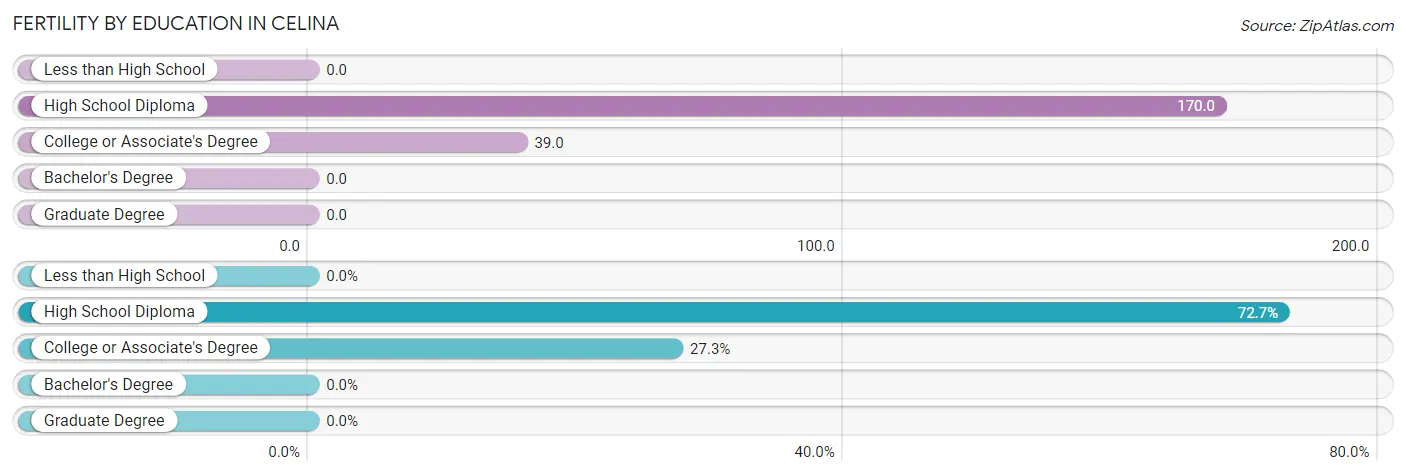
| Educational Attainment | Women with Births | Births / 1,000 Women |
| Less than High School | 0 (0.0%) | 0.0 |
| High School Diploma | 16 (72.7%) | 170.0 |
| College or Associate's Degree | 6 (27.3%) | 39.0 |
| Bachelor's Degree | 0 (0.0%) | 0.0 |
| Graduate Degree | 0 (0.0%) | 0.0 |
| Total | 22 (100.0%) | 61.0 |
Fertility by Education by Marriage Status in Celina
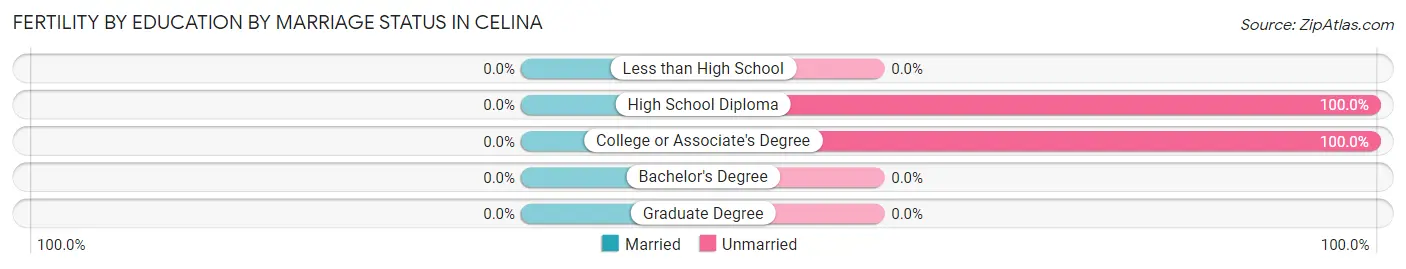
| Educational Attainment | Married | Unmarried |
| Less than High School | 0 (0.0%) | 0 (0.0%) |
| High School Diploma | 0 (0.0%) | 16 (100.0%) |
| College or Associate's Degree | 0 (0.0%) | 6 (100.0%) |
| Bachelor's Degree | 0 (0.0%) | 0 (0.0%) |
| Graduate Degree | 0 (0.0%) | 0 (0.0%) |
| Total | 0 (0.0%) | 22 (100.0%) |
Employment Characteristics in Celina
Employment by Class of Employer in Celina
Among the 394 employed individuals in Celina, private company employees (253 | 64.2%), local government employees (79 | 20.1%), and not-for-profit organizations (21 | 5.3%) make up the most common classes of employment.
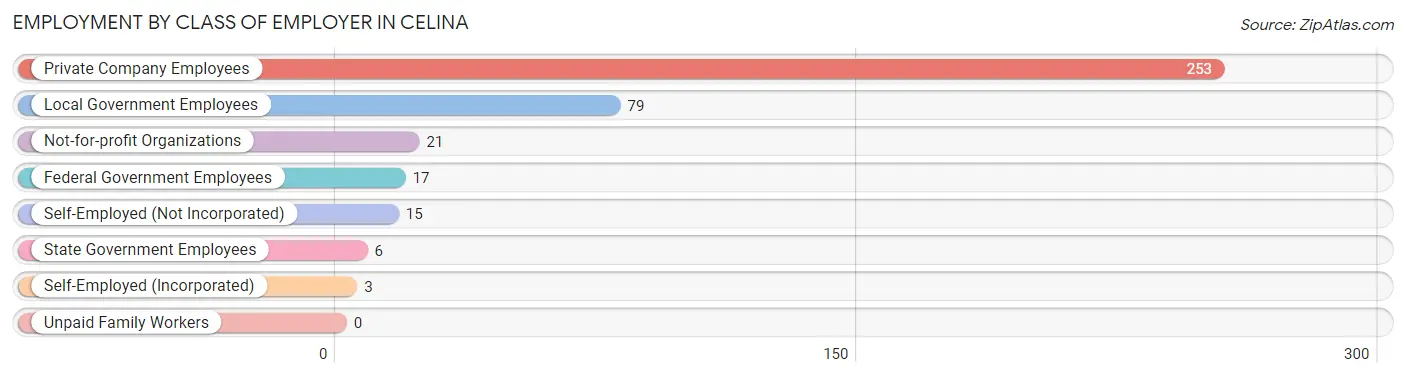
| Employer Class | # Employees | % Employees |
| Private Company Employees | 253 | 64.2% |
| Self-Employed (Incorporated) | 3 | 0.8% |
| Self-Employed (Not Incorporated) | 15 | 3.8% |
| Not-for-profit Organizations | 21 | 5.3% |
| Local Government Employees | 79 | 20.1% |
| State Government Employees | 6 | 1.5% |
| Federal Government Employees | 17 | 4.3% |
| Unpaid Family Workers | 0 | 0.0% |
| Total | 394 | 100.0% |
Employment Status by Age in Celina
According to the labor force statistics for Celina, out of the total population over 16 years of age (1,316), 35.2% or 463 individuals are in the labor force, with 13.9% or 64 of them unemployed. The age group with the highest labor force participation rate is 25 to 29 years, with 90.0% or 9 individuals in the labor force. Within the labor force, the 65 to 74 years age range has the highest percentage of unemployed individuals, with 73.2% or 30 of them being unemployed.
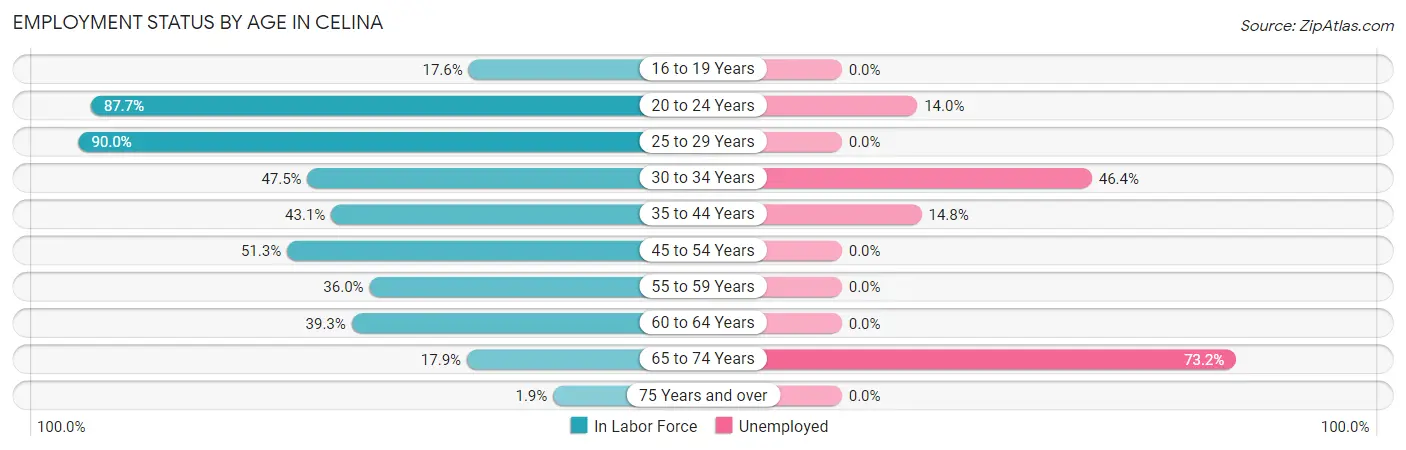
| Age Bracket | In Labor Force | Unemployed |
| 16 to 19 Years | 18 (17.6%) | 0 (0.0%) |
| 20 to 24 Years | 50 (87.7%) | 7 (14.0%) |
| 25 to 29 Years | 9 (90.0%) | 0 (0.0%) |
| 30 to 34 Years | 28 (47.5%) | 13 (46.4%) |
| 35 to 44 Years | 88 (43.1%) | 13 (14.8%) |
| 45 to 54 Years | 155 (51.3%) | 0 (0.0%) |
| 55 to 59 Years | 49 (36.0%) | 0 (0.0%) |
| 60 to 64 Years | 22 (39.3%) | 0 (0.0%) |
| 65 to 74 Years | 41 (17.9%) | 30 (73.2%) |
| 75 Years and over | 3 (1.9%) | 0 (0.0%) |
| Total | 463 (35.2%) | 64 (13.9%) |
Employment Status by Educational Attainment in Celina
According to labor force statistics for Celina, 45.8% of individuals (351) out of the total population between 25 and 64 years of age (767) are in the labor force, with 7.6% or 27 of them being unemployed. The group with the highest labor force participation rate are those with the educational attainment of bachelor's degree or higher, with 96.5% or 55 individuals in the labor force. Within the labor force, individuals with high school diploma education have the highest percentage of unemployment, with 17.3% or 26 of them being unemployed.
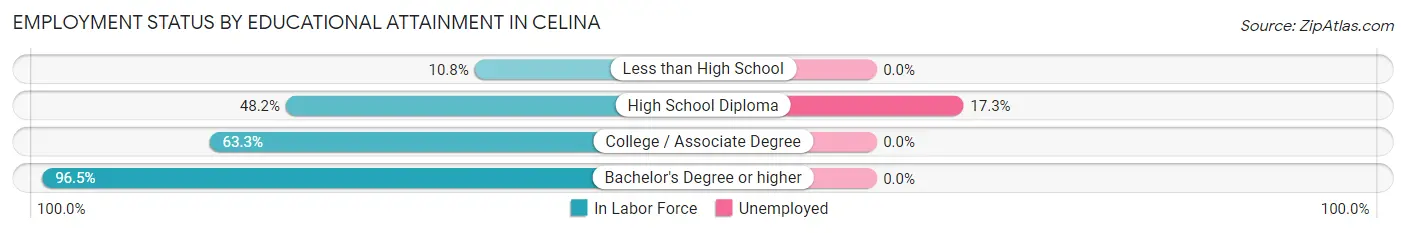
| Educational Attainment | In Labor Force | Unemployed |
| Less than High School | 22 (10.8%) | 0 (0.0%) |
| High School Diploma | 150 (48.2%) | 54 (17.3%) |
| College / Associate Degree | 124 (63.3%) | 0 (0.0%) |
| Bachelor's Degree or higher | 55 (96.5%) | 0 (0.0%) |
| Total | 351 (45.8%) | 58 (7.6%) |
Employment Occupations by Sex in Celina
Management, Business, Science and Arts Occupations
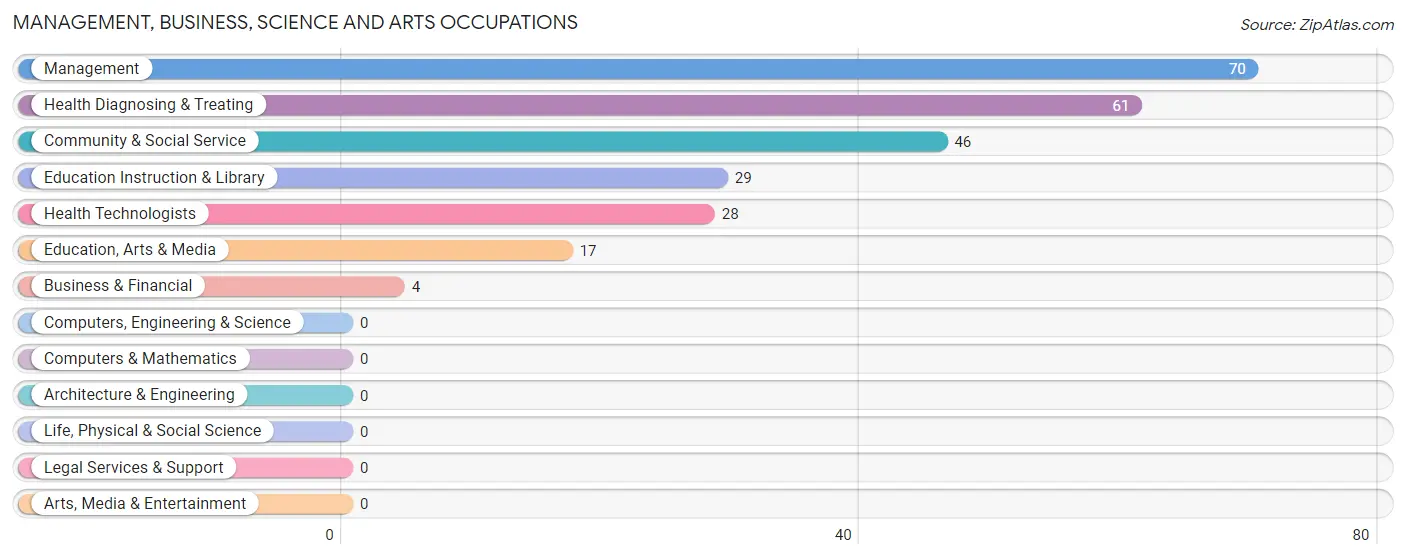
The most common Management, Business, Science and Arts occupations in Celina are Management (70 | 18.0%), Health Diagnosing & Treating (61 | 15.7%), Community & Social Service (46 | 11.8%), Education Instruction & Library (29 | 7.5%), and Health Technologists (28 | 7.2%).
Management, Business, Science and Arts Occupations by Sex
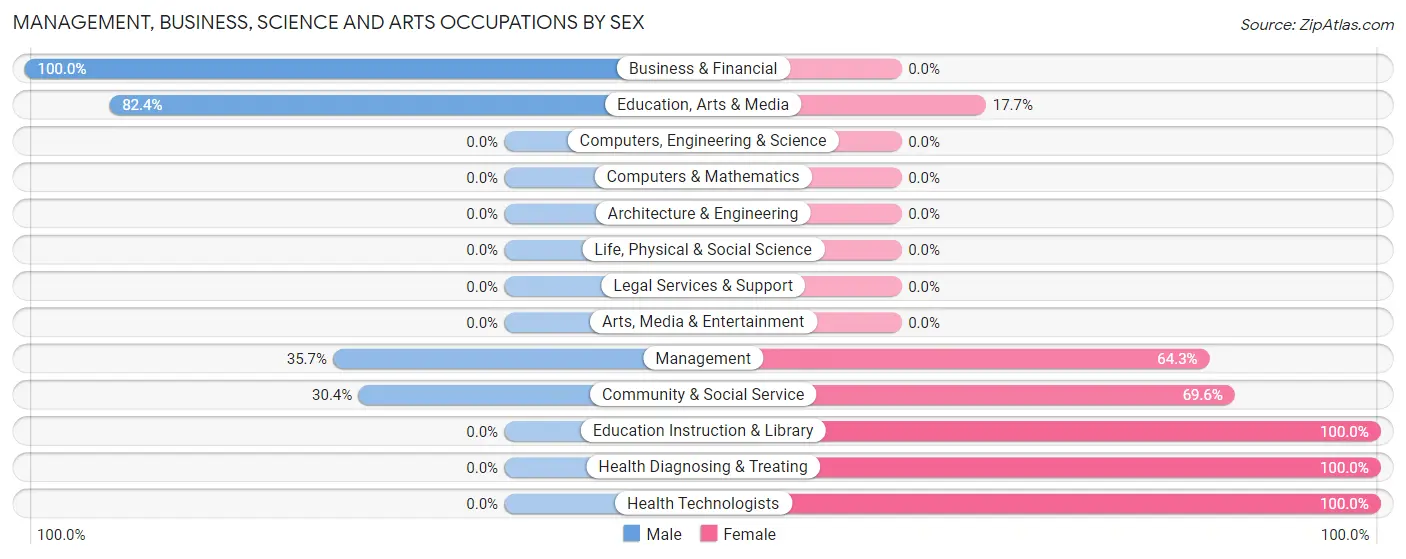
Within the Management, Business, Science and Arts occupations in Celina, the most male-oriented occupations are Business & Financial (100.0%), Education, Arts & Media (82.4%), and Management (35.7%), while the most female-oriented occupations are Education Instruction & Library (100.0%), Health Diagnosing & Treating (100.0%), and Health Technologists (100.0%).
| Occupation | Male | Female |
| Management | 25 (35.7%) | 45 (64.3%) |
| Business & Financial | 4 (100.0%) | 0 (0.0%) |
| Computers, Engineering & Science | 0 (0.0%) | 0 (0.0%) |
| Computers & Mathematics | 0 (0.0%) | 0 (0.0%) |
| Architecture & Engineering | 0 (0.0%) | 0 (0.0%) |
| Life, Physical & Social Science | 0 (0.0%) | 0 (0.0%) |
| Community & Social Service | 14 (30.4%) | 32 (69.6%) |
| Education, Arts & Media | 14 (82.4%) | 3 (17.6%) |
| Legal Services & Support | 0 (0.0%) | 0 (0.0%) |
| Education Instruction & Library | 0 (0.0%) | 29 (100.0%) |
| Arts, Media & Entertainment | 0 (0.0%) | 0 (0.0%) |
| Health Diagnosing & Treating | 0 (0.0%) | 61 (100.0%) |
| Health Technologists | 0 (0.0%) | 28 (100.0%) |
| Total (Category) | 43 (23.8%) | 138 (76.2%) |
| Total (Overall) | 157 (40.4%) | 232 (59.6%) |
Services Occupations
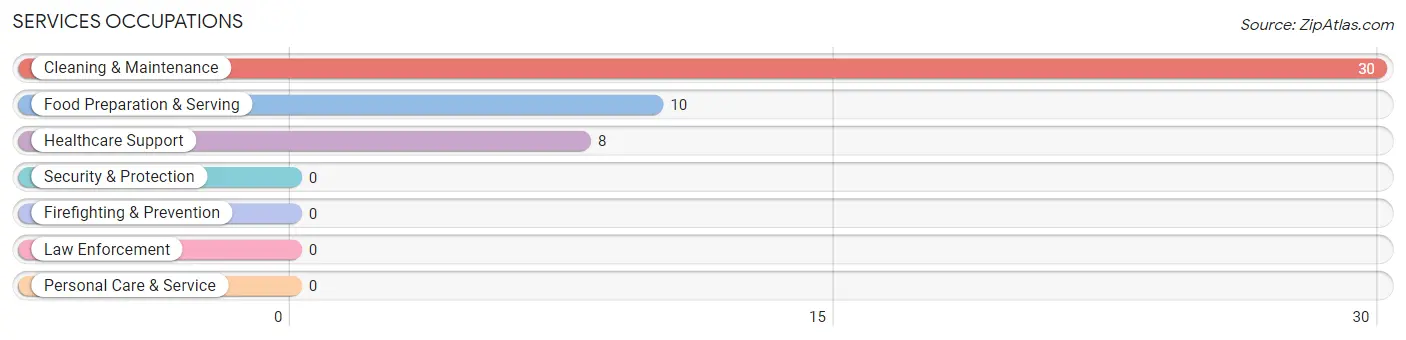
The most common Services occupations in Celina are Cleaning & Maintenance (30 | 7.7%), Food Preparation & Serving (10 | 2.6%), and Healthcare Support (8 | 2.1%).
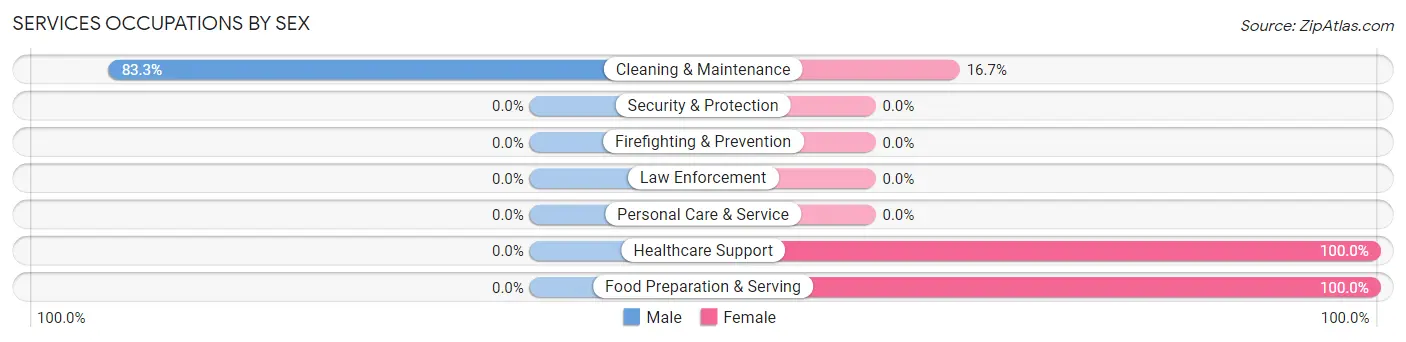
Services Occupations by Sex
| Occupation | Male | Female |
| Healthcare Support | 0 (0.0%) | 8 (100.0%) |
| Security & Protection | 0 (0.0%) | 0 (0.0%) |
| Firefighting & Prevention | 0 (0.0%) | 0 (0.0%) |
| Law Enforcement | 0 (0.0%) | 0 (0.0%) |
| Food Preparation & Serving | 0 (0.0%) | 10 (100.0%) |
| Cleaning & Maintenance | 25 (83.3%) | 5 (16.7%) |
| Personal Care & Service | 0 (0.0%) | 0 (0.0%) |
| Total (Category) | 25 (52.1%) | 23 (47.9%) |
| Total (Overall) | 157 (40.4%) | 232 (59.6%) |
Sales and Office Occupations
The most common Sales and Office occupations in Celina are Office & Administration (28 | 7.2%), and Sales & Related (24 | 6.2%).

Sales and Office Occupations by Sex
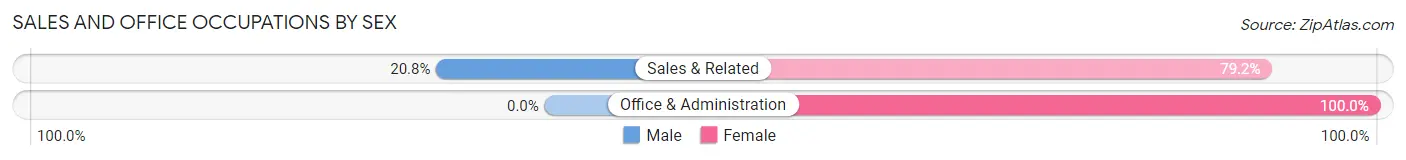
| Occupation | Male | Female |
| Sales & Related | 5 (20.8%) | 19 (79.2%) |
| Office & Administration | 0 (0.0%) | 28 (100.0%) |
| Total (Category) | 5 (9.6%) | 47 (90.4%) |
| Total (Overall) | 157 (40.4%) | 232 (59.6%) |
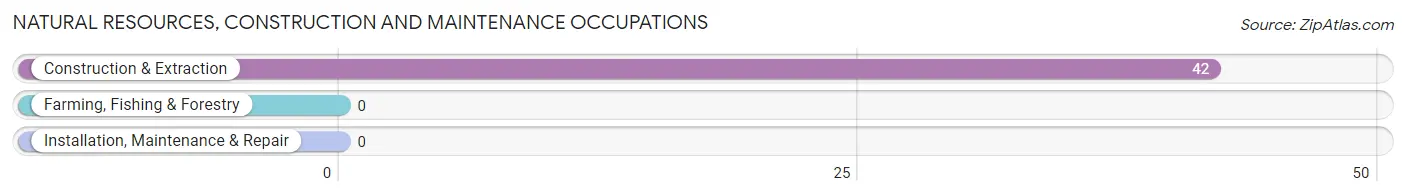
Natural Resources, Construction and Maintenance Occupations
The most common Natural Resources, Construction and Maintenance occupations in Celina are , and Construction & Extraction (42 | 10.8%).
Natural Resources, Construction and Maintenance Occupations by Sex
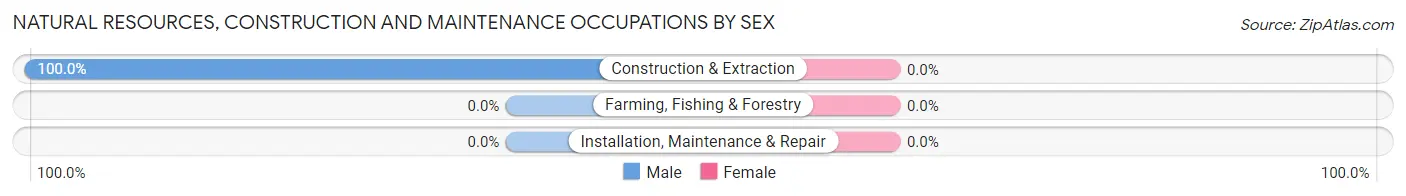
| Occupation | Male | Female |
| Farming, Fishing & Forestry | 0 (0.0%) | 0 (0.0%) |
| Construction & Extraction | 42 (100.0%) | 0 (0.0%) |
| Installation, Maintenance & Repair | 0 (0.0%) | 0 (0.0%) |
| Total (Category) | 42 (100.0%) | 0 (0.0%) |
| Total (Overall) | 157 (40.4%) | 232 (59.6%) |
Production, Transportation and Moving Occupations
The most common Production, Transportation and Moving occupations in Celina are Production (43 | 11.1%), Transportation (20 | 5.1%), and Material Moving (3 | 0.8%).
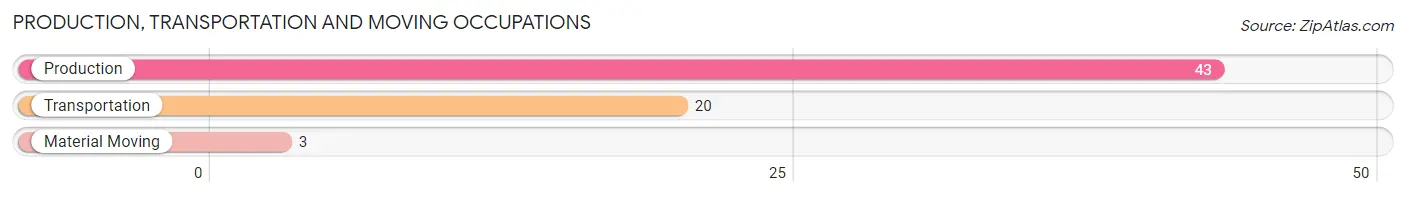
Production, Transportation and Moving Occupations by Sex
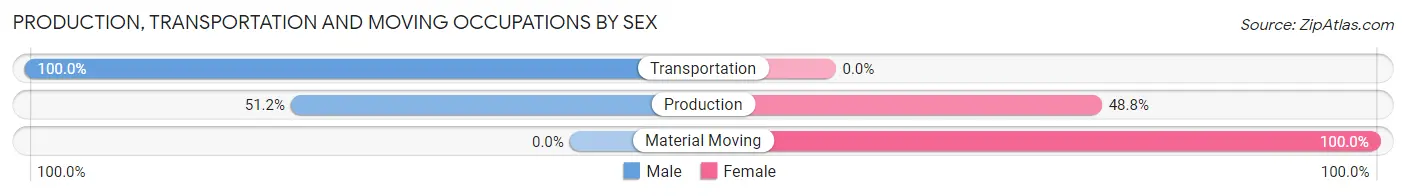
| Occupation | Male | Female |
| Production | 22 (51.2%) | 21 (48.8%) |
| Transportation | 20 (100.0%) | 0 (0.0%) |
| Material Moving | 0 (0.0%) | 3 (100.0%) |
| Total (Category) | 42 (63.6%) | 24 (36.4%) |
| Total (Overall) | 157 (40.4%) | 232 (59.6%) |
Employment Industries by Sex in Celina
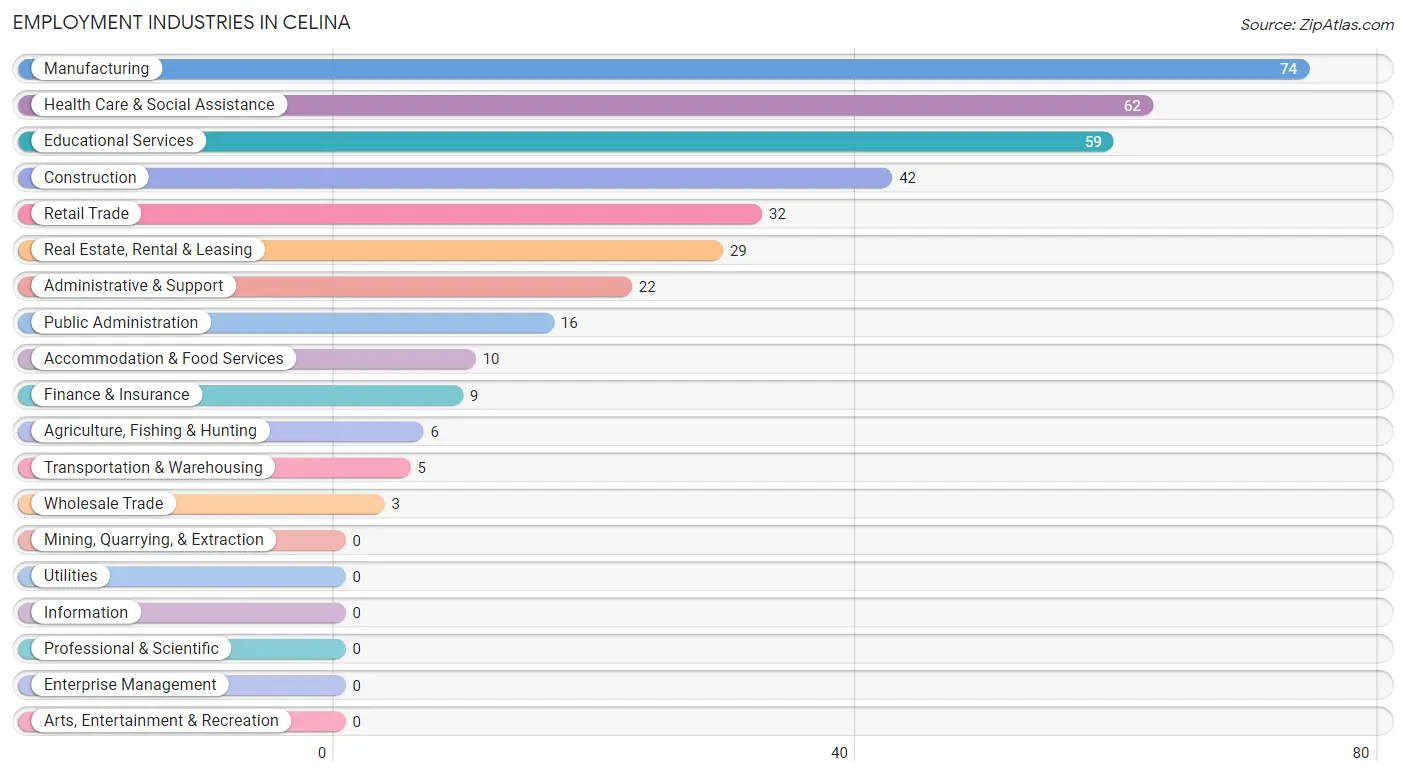
Employment Industries in Celina
The major employment industries in Celina include Manufacturing (74 | 19.0%), Health Care & Social Assistance (62 | 15.9%), Educational Services (59 | 15.2%), Construction (42 | 10.8%), and Retail Trade (32 | 8.2%).
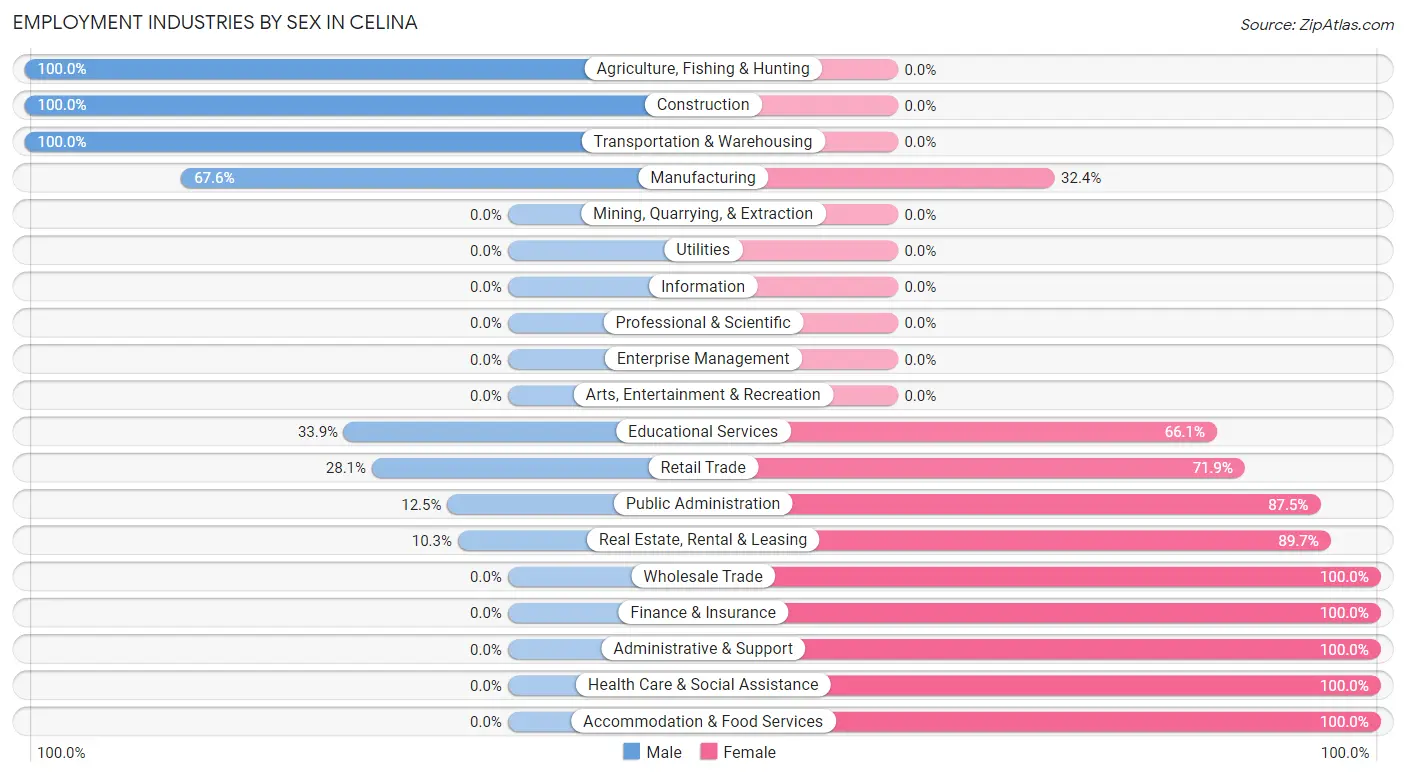
Employment Industries by Sex in Celina
The Celina industries that see more men than women are Agriculture, Fishing & Hunting (100.0%), Construction (100.0%), and Transportation & Warehousing (100.0%), whereas the industries that tend to have a higher number of women are Wholesale Trade (100.0%), Finance & Insurance (100.0%), and Administrative & Support (100.0%).
| Industry | Male | Female |
| Agriculture, Fishing & Hunting | 6 (100.0%) | 0 (0.0%) |
| Mining, Quarrying, & Extraction | 0 (0.0%) | 0 (0.0%) |
| Construction | 42 (100.0%) | 0 (0.0%) |
| Manufacturing | 50 (67.6%) | 24 (32.4%) |
| Wholesale Trade | 0 (0.0%) | 3 (100.0%) |
| Retail Trade | 9 (28.1%) | 23 (71.9%) |
| Transportation & Warehousing | 5 (100.0%) | 0 (0.0%) |
| Utilities | 0 (0.0%) | 0 (0.0%) |
| Information | 0 (0.0%) | 0 (0.0%) |
| Finance & Insurance | 0 (0.0%) | 9 (100.0%) |
| Real Estate, Rental & Leasing | 3 (10.3%) | 26 (89.7%) |
| Professional & Scientific | 0 (0.0%) | 0 (0.0%) |
| Enterprise Management | 0 (0.0%) | 0 (0.0%) |
| Administrative & Support | 0 (0.0%) | 22 (100.0%) |
| Educational Services | 20 (33.9%) | 39 (66.1%) |
| Health Care & Social Assistance | 0 (0.0%) | 62 (100.0%) |
| Arts, Entertainment & Recreation | 0 (0.0%) | 0 (0.0%) |
| Accommodation & Food Services | 0 (0.0%) | 10 (100.0%) |
| Public Administration | 2 (12.5%) | 14 (87.5%) |
| Total | 157 (40.4%) | 232 (59.6%) |
Education in Celina
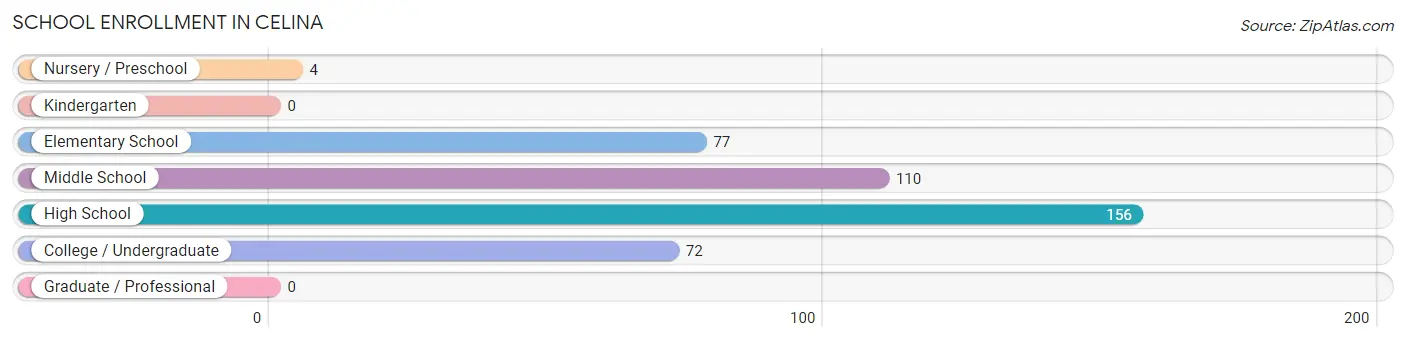
School Enrollment in Celina
The most common levels of schooling among the 419 students in Celina are high school (156 | 37.2%), middle school (110 | 26.3%), and elementary school (77 | 18.4%).
| School Level | # Students | % Students |
| Nursery / Preschool | 4 | 0.9% |
| Kindergarten | 0 | 0.0% |
| Elementary School | 77 | 18.4% |
| Middle School | 110 | 26.3% |
| High School | 156 | 37.2% |
| College / Undergraduate | 72 | 17.2% |
| Graduate / Professional | 0 | 0.0% |
| Total | 419 | 100.0% |
School Enrollment by Age by Funding Source in Celina
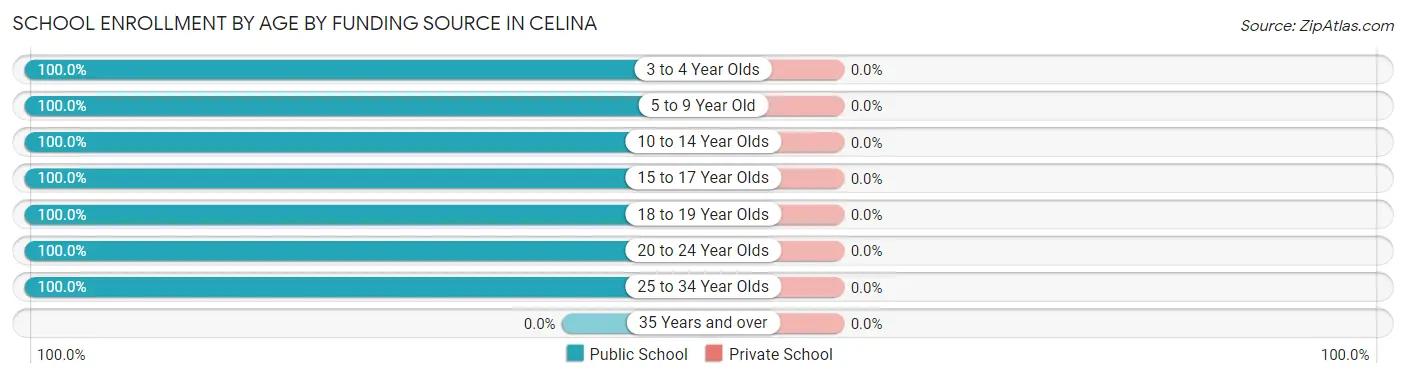
| Age Bracket | Public School | Private School |
| 3 to 4 Year Olds | 4 (100.0%) | 0 (0.0%) |
| 5 to 9 Year Old | 53 (100.0%) | 0 (0.0%) |
| 10 to 14 Year Olds | 134 (100.0%) | 0 (0.0%) |
| 15 to 17 Year Olds | 145 (100.0%) | 0 (0.0%) |
| 18 to 19 Year Olds | 45 (100.0%) | 0 (0.0%) |
| 20 to 24 Year Olds | 27 (100.0%) | 0 (0.0%) |
| 25 to 34 Year Olds | 11 (100.0%) | 0 (0.0%) |
| 35 Years and over | 0 (0.0%) | 0 (0.0%) |
| Total | 419 (100.0%) | 0 (0.0%) |
Educational Attainment by Field of Study in Celina
Education (56 | 40.9%), science & technology (50 | 36.5%), bio, nature & agricultural (14 | 10.2%), literature & languages (8 | 5.8%), and communications (5 | 3.6%) are the most common fields of study among 137 individuals in Celina who have obtained a bachelor's degree or higher.
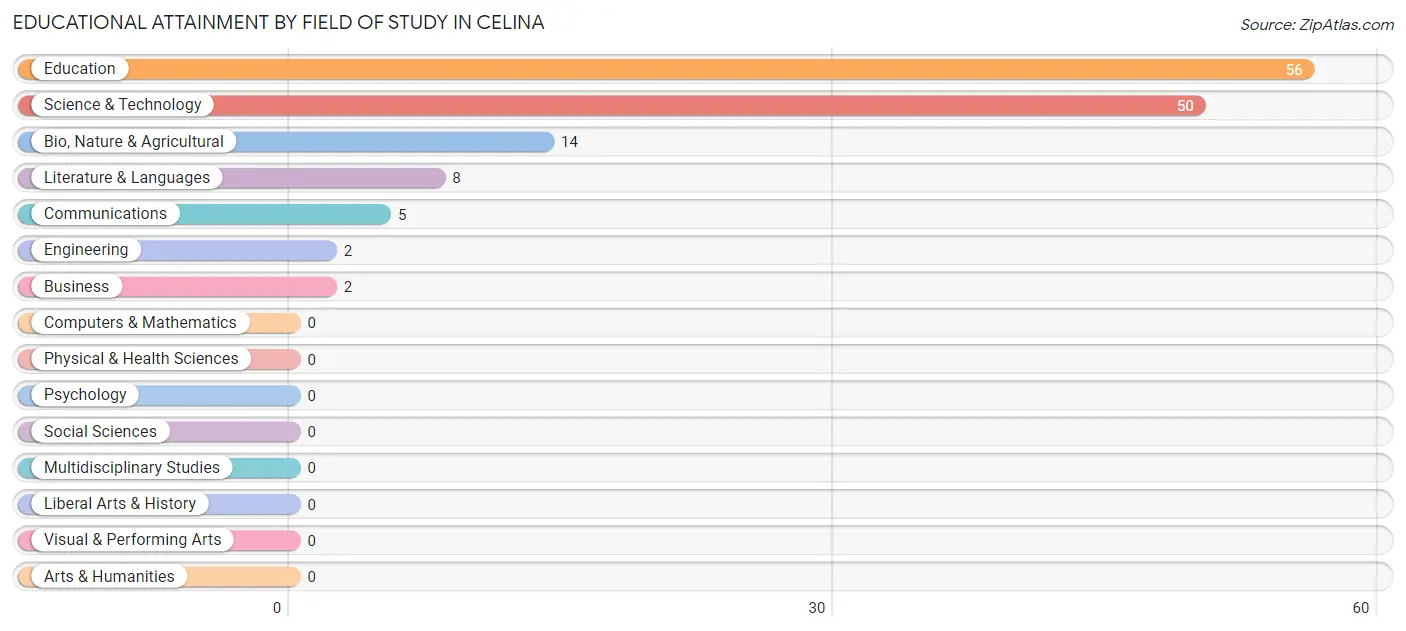
| Field of Study | # Graduates | % Graduates |
| Computers & Mathematics | 0 | 0.0% |
| Bio, Nature & Agricultural | 14 | 10.2% |
| Physical & Health Sciences | 0 | 0.0% |
| Psychology | 0 | 0.0% |
| Social Sciences | 0 | 0.0% |
| Engineering | 2 | 1.5% |
| Multidisciplinary Studies | 0 | 0.0% |
| Science & Technology | 50 | 36.5% |
| Business | 2 | 1.5% |
| Education | 56 | 40.9% |
| Literature & Languages | 8 | 5.8% |
| Liberal Arts & History | 0 | 0.0% |
| Visual & Performing Arts | 0 | 0.0% |
| Communications | 5 | 3.6% |
| Arts & Humanities | 0 | 0.0% |
| Total | 137 | 100.0% |
Transportation & Commute in Celina
Vehicle Availability by Sex in Celina
The most prevalent vehicle ownership categories in Celina are males with 2 vehicles (38, accounting for 23.5%) and females with 2 vehicles (34, making up 16.4%).
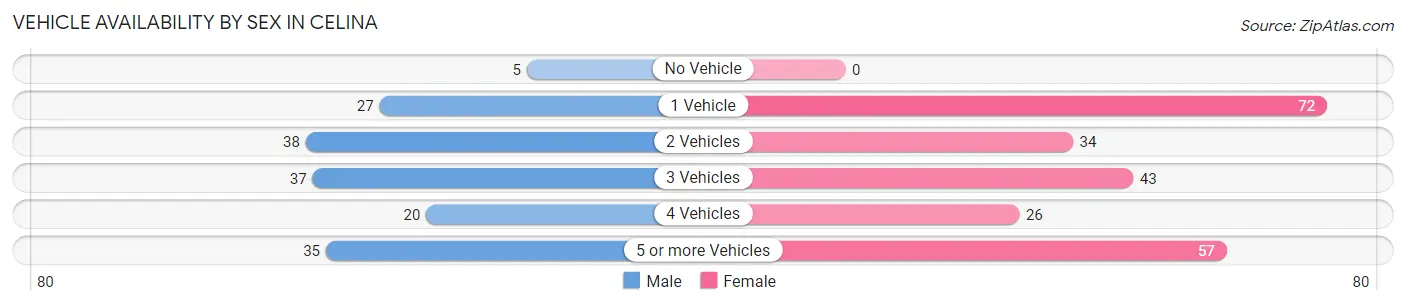
| Vehicles Available | Male | Female |
| No Vehicle | 5 (3.1%) | 0 (0.0%) |
| 1 Vehicle | 27 (16.7%) | 72 (31.0%) |
| 2 Vehicles | 38 (23.5%) | 34 (14.7%) |
| 3 Vehicles | 37 (22.8%) | 43 (18.5%) |
| 4 Vehicles | 20 (12.3%) | 26 (11.2%) |
| 5 or more Vehicles | 35 (21.6%) | 57 (24.6%) |
| Total | 162 (100.0%) | 232 (100.0%) |
Commute Time in Celina
The most frequently occuring commute durations in Celina are 15 to 19 minutes (94 commuters, 24.2%), 5 to 9 minutes (68 commuters, 17.5%), and 30 to 34 minutes (60 commuters, 15.5%).
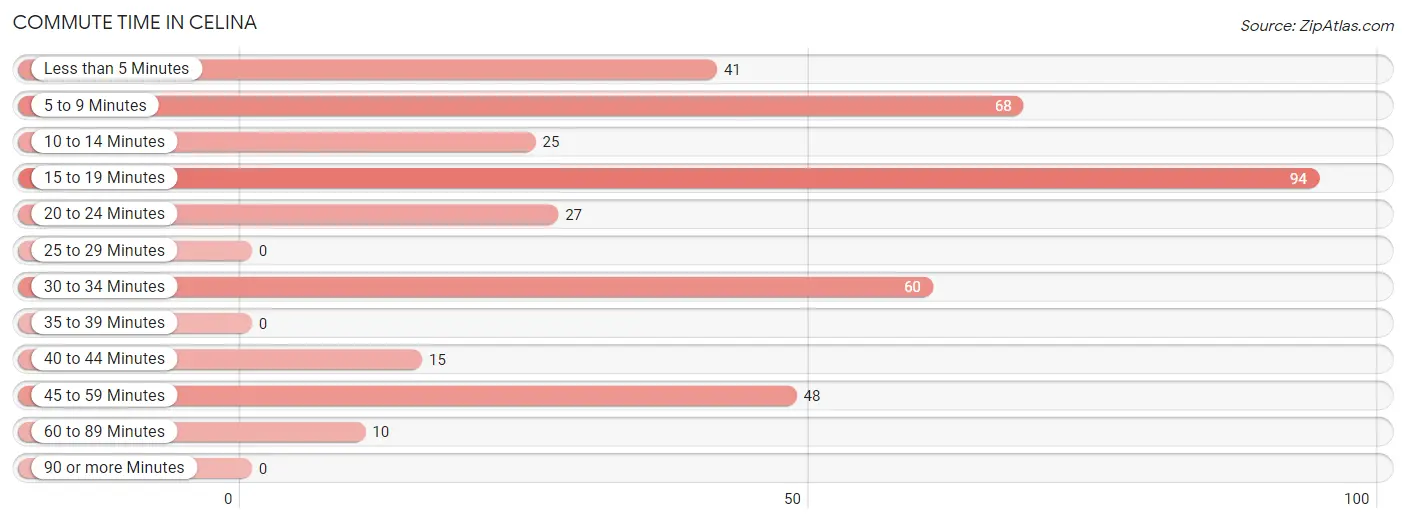
| Commute Time | # Commuters | % Commuters |
| Less than 5 Minutes | 41 | 10.6% |
| 5 to 9 Minutes | 68 | 17.5% |
| 10 to 14 Minutes | 25 | 6.4% |
| 15 to 19 Minutes | 94 | 24.2% |
| 20 to 24 Minutes | 27 | 7.0% |
| 25 to 29 Minutes | 0 | 0.0% |
| 30 to 34 Minutes | 60 | 15.5% |
| 35 to 39 Minutes | 0 | 0.0% |
| 40 to 44 Minutes | 15 | 3.9% |
| 45 to 59 Minutes | 48 | 12.4% |
| 60 to 89 Minutes | 10 | 2.6% |
| 90 or more Minutes | 0 | 0.0% |
Commute Time by Sex in Celina
The most common commute times in Celina are 30 to 34 minutes (31 commuters, 19.1%) for males and 15 to 19 minutes (80 commuters, 35.4%) for females.
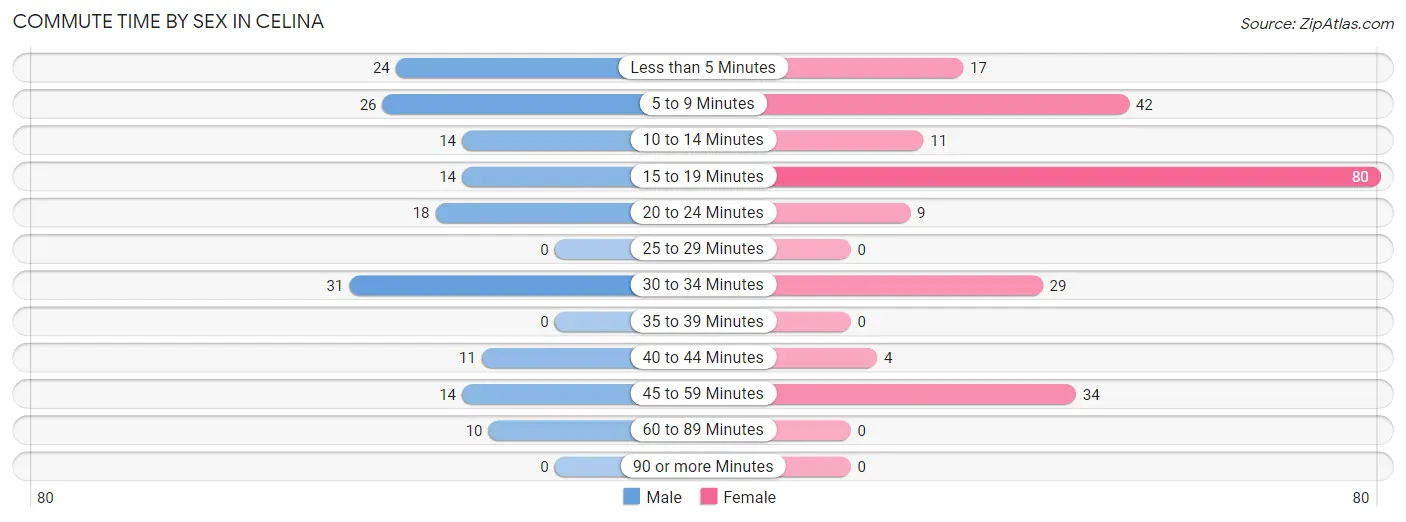
| Commute Time | Male | Female |
| Less than 5 Minutes | 24 (14.8%) | 17 (7.5%) |
| 5 to 9 Minutes | 26 (16.1%) | 42 (18.6%) |
| 10 to 14 Minutes | 14 (8.6%) | 11 (4.9%) |
| 15 to 19 Minutes | 14 (8.6%) | 80 (35.4%) |
| 20 to 24 Minutes | 18 (11.1%) | 9 (4.0%) |
| 25 to 29 Minutes | 0 (0.0%) | 0 (0.0%) |
| 30 to 34 Minutes | 31 (19.1%) | 29 (12.8%) |
| 35 to 39 Minutes | 0 (0.0%) | 0 (0.0%) |
| 40 to 44 Minutes | 11 (6.8%) | 4 (1.8%) |
| 45 to 59 Minutes | 14 (8.6%) | 34 (15.0%) |
| 60 to 89 Minutes | 10 (6.2%) | 0 (0.0%) |
| 90 or more Minutes | 0 (0.0%) | 0 (0.0%) |
Time of Departure to Work by Sex in Celina
The most frequent times of departure to work in Celina are 6:30 AM to 6:59 AM (65, 40.1%) for males and 5:00 AM to 5:29 AM (35, 15.5%) for females.
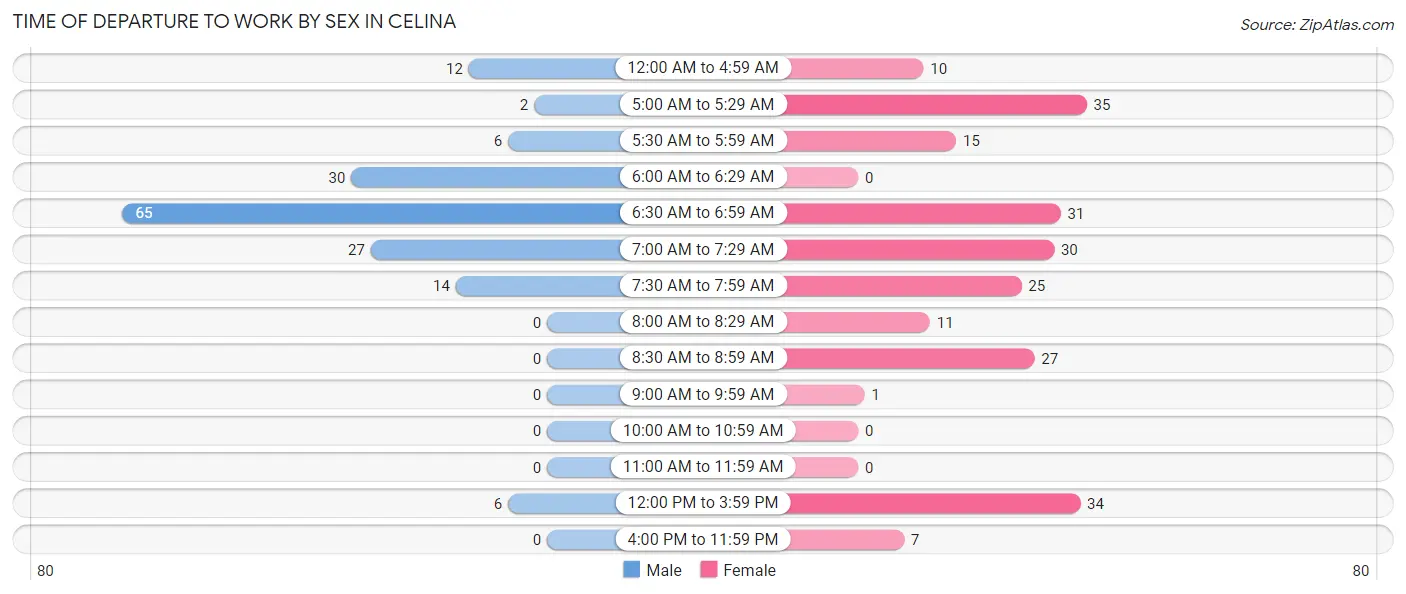
| Time of Departure | Male | Female |
| 12:00 AM to 4:59 AM | 12 (7.4%) | 10 (4.4%) |
| 5:00 AM to 5:29 AM | 2 (1.2%) | 35 (15.5%) |
| 5:30 AM to 5:59 AM | 6 (3.7%) | 15 (6.6%) |
| 6:00 AM to 6:29 AM | 30 (18.5%) | 0 (0.0%) |
| 6:30 AM to 6:59 AM | 65 (40.1%) | 31 (13.7%) |
| 7:00 AM to 7:29 AM | 27 (16.7%) | 30 (13.3%) |
| 7:30 AM to 7:59 AM | 14 (8.6%) | 25 (11.1%) |
| 8:00 AM to 8:29 AM | 0 (0.0%) | 11 (4.9%) |
| 8:30 AM to 8:59 AM | 0 (0.0%) | 27 (11.9%) |
| 9:00 AM to 9:59 AM | 0 (0.0%) | 1 (0.4%) |
| 10:00 AM to 10:59 AM | 0 (0.0%) | 0 (0.0%) |
| 11:00 AM to 11:59 AM | 0 (0.0%) | 0 (0.0%) |
| 12:00 PM to 3:59 PM | 6 (3.7%) | 34 (15.0%) |
| 4:00 PM to 11:59 PM | 0 (0.0%) | 7 (3.1%) |
| Total | 162 (100.0%) | 226 (100.0%) |
Housing Occupancy in Celina
Occupancy by Ownership in Celina
Of the total 631 dwellings in Celina, owner-occupied units account for 322 (51.0%), while renter-occupied units make up 309 (49.0%).
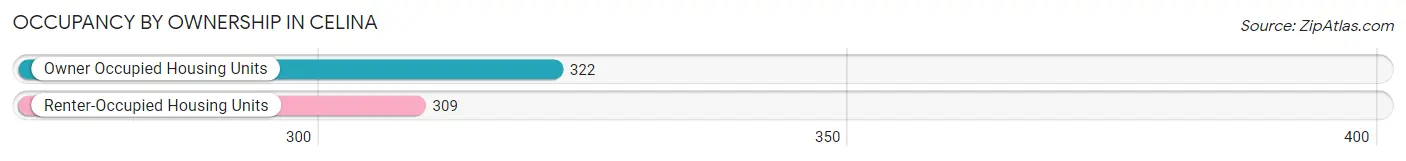
| Occupancy | # Housing Units | % Housing Units |
| Owner Occupied Housing Units | 322 | 51.0% |
| Renter-Occupied Housing Units | 309 | 49.0% |
| Total Occupied Housing Units | 631 | 100.0% |
Occupancy by Household Size in Celina
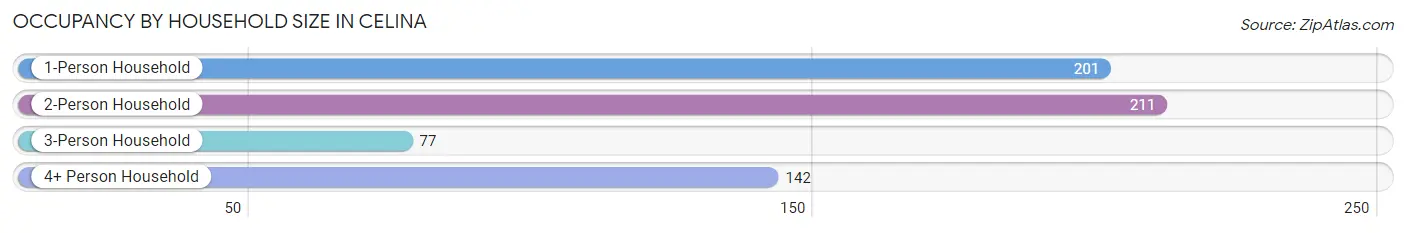
| Household Size | # Housing Units | % Housing Units |
| 1-Person Household | 201 | 31.9% |
| 2-Person Household | 211 | 33.4% |
| 3-Person Household | 77 | 12.2% |
| 4+ Person Household | 142 | 22.5% |
| Total Housing Units | 631 | 100.0% |
Occupancy by Ownership by Household Size in Celina
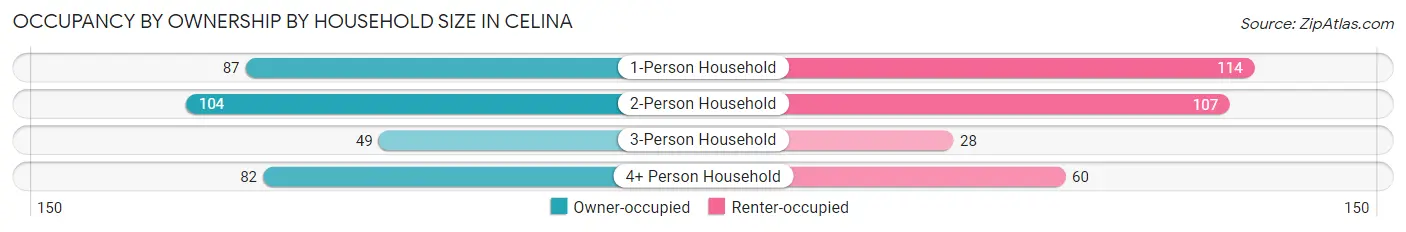
| Household Size | Owner-occupied | Renter-occupied |
| 1-Person Household | 87 (43.3%) | 114 (56.7%) |
| 2-Person Household | 104 (49.3%) | 107 (50.7%) |
| 3-Person Household | 49 (63.6%) | 28 (36.4%) |
| 4+ Person Household | 82 (57.8%) | 60 (42.2%) |
| Total Housing Units | 322 (51.0%) | 309 (49.0%) |
Occupancy by Educational Attainment in Celina
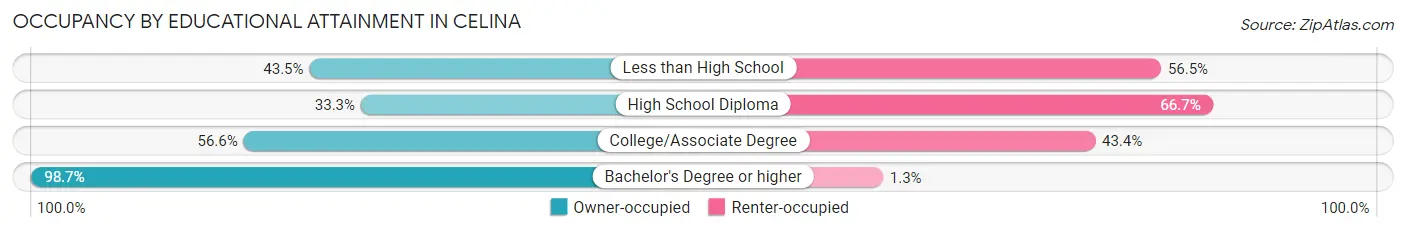
| Household Size | Owner-occupied | Renter-occupied |
| Less than High School | 64 (43.5%) | 83 (56.5%) |
| High School Diploma | 68 (33.3%) | 136 (66.7%) |
| College/Associate Degree | 116 (56.6%) | 89 (43.4%) |
| Bachelor's Degree or higher | 74 (98.7%) | 1 (1.3%) |
Occupancy by Age of Householder in Celina
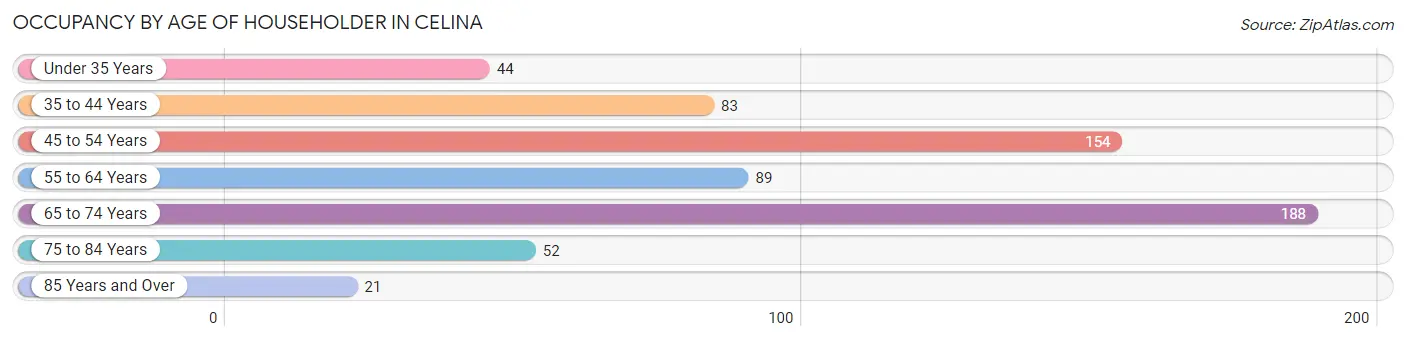
| Age Bracket | # Households | % Households |
| Under 35 Years | 44 | 7.0% |
| 35 to 44 Years | 83 | 13.2% |
| 45 to 54 Years | 154 | 24.4% |
| 55 to 64 Years | 89 | 14.1% |
| 65 to 74 Years | 188 | 29.8% |
| 75 to 84 Years | 52 | 8.2% |
| 85 Years and Over | 21 | 3.3% |
| Total | 631 | 100.0% |
Housing Finances in Celina
Median Income by Occupancy in Celina
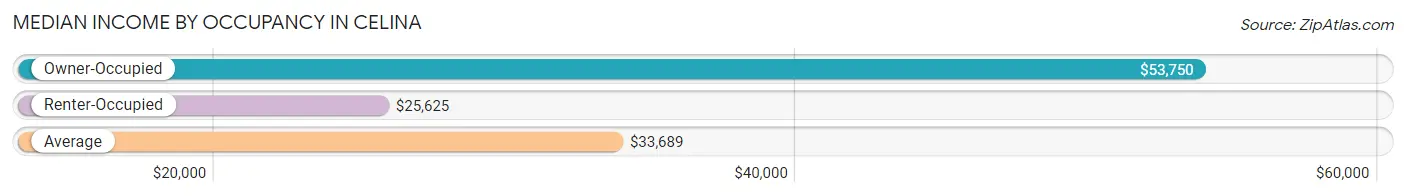
| Occupancy Type | # Households | Median Income |
| Owner-Occupied | 322 (51.0%) | $53,750 |
| Renter-Occupied | 309 (49.0%) | $25,625 |
| Average | 631 (100.0%) | $33,689 |
Occupancy by Householder Income Bracket in Celina
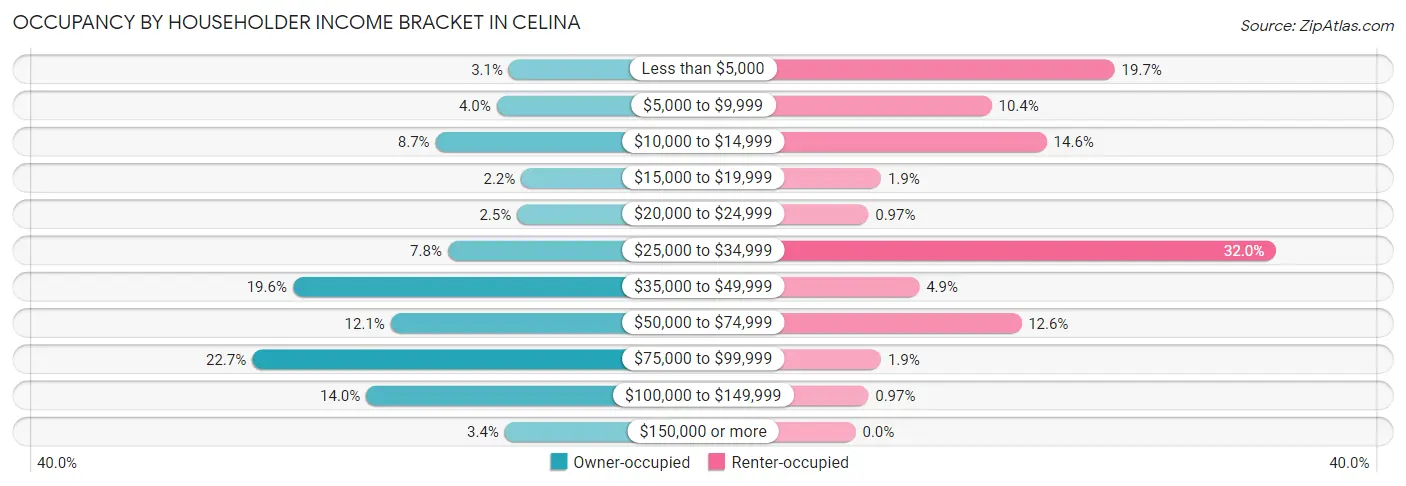
| Income Bracket | Owner-occupied | Renter-occupied |
| Less than $5,000 | 10 (3.1%) | 61 (19.7%) |
| $5,000 to $9,999 | 13 (4.0%) | 32 (10.4%) |
| $10,000 to $14,999 | 28 (8.7%) | 45 (14.6%) |
| $15,000 to $19,999 | 7 (2.2%) | 6 (1.9%) |
| $20,000 to $24,999 | 8 (2.5%) | 3 (1.0%) |
| $25,000 to $34,999 | 25 (7.8%) | 99 (32.0%) |
| $35,000 to $49,999 | 63 (19.6%) | 15 (4.9%) |
| $50,000 to $74,999 | 39 (12.1%) | 39 (12.6%) |
| $75,000 to $99,999 | 73 (22.7%) | 6 (1.9%) |
| $100,000 to $149,999 | 45 (14.0%) | 3 (1.0%) |
| $150,000 or more | 11 (3.4%) | 0 (0.0%) |
| Total | 322 (100.0%) | 309 (100.0%) |
Monthly Housing Cost Tiers in Celina
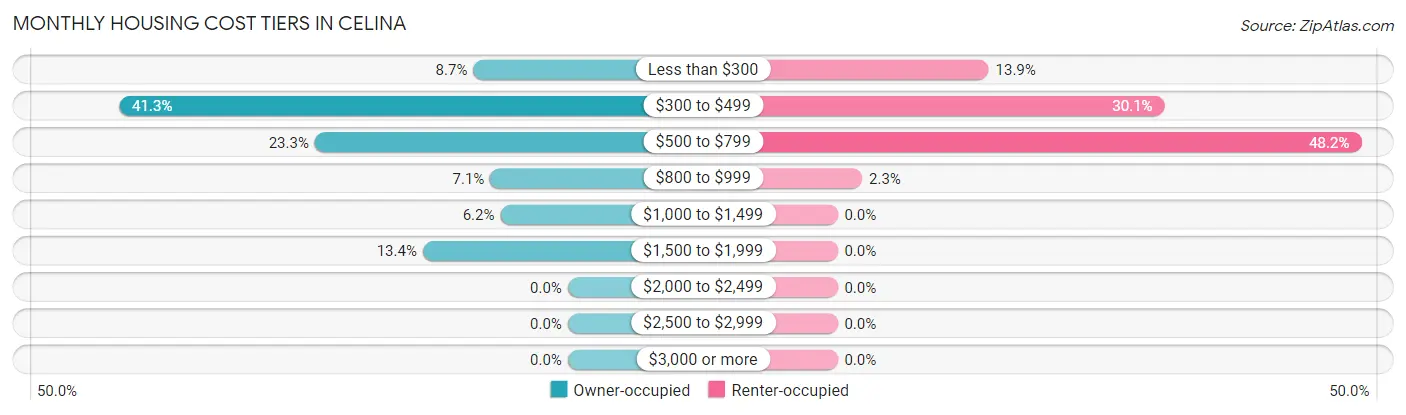
| Monthly Cost | Owner-occupied | Renter-occupied |
| Less than $300 | 28 (8.7%) | 43 (13.9%) |
| $300 to $499 | 133 (41.3%) | 93 (30.1%) |
| $500 to $799 | 75 (23.3%) | 149 (48.2%) |
| $800 to $999 | 23 (7.1%) | 7 (2.3%) |
| $1,000 to $1,499 | 20 (6.2%) | 0 (0.0%) |
| $1,500 to $1,999 | 43 (13.4%) | 0 (0.0%) |
| $2,000 to $2,499 | 0 (0.0%) | 0 (0.0%) |
| $2,500 to $2,999 | 0 (0.0%) | 0 (0.0%) |
| $3,000 or more | 0 (0.0%) | 0 (0.0%) |
| Total | 322 (100.0%) | 309 (100.0%) |
Physical Housing Characteristics in Celina
Housing Structures in Celina
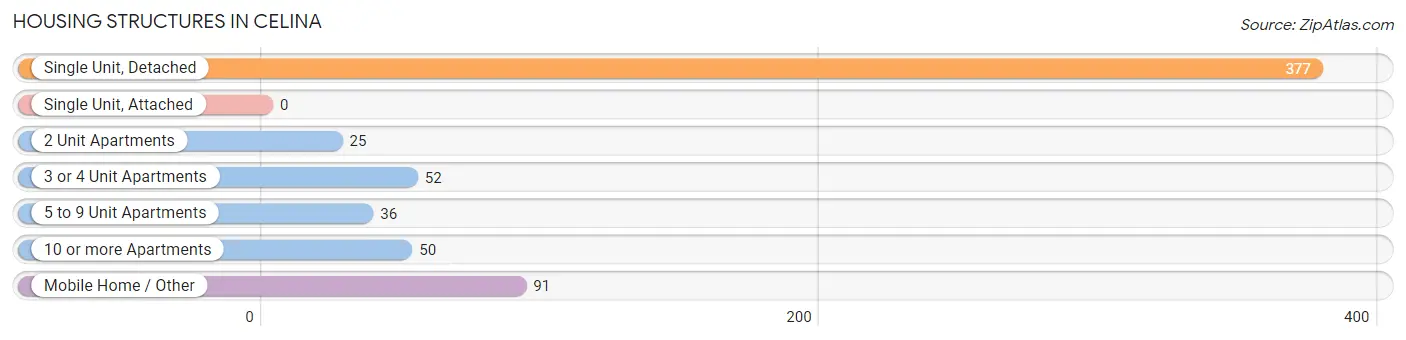
| Structure Type | # Housing Units | % Housing Units |
| Single Unit, Detached | 377 | 59.8% |
| Single Unit, Attached | 0 | 0.0% |
| 2 Unit Apartments | 25 | 4.0% |
| 3 or 4 Unit Apartments | 52 | 8.2% |
| 5 to 9 Unit Apartments | 36 | 5.7% |
| 10 or more Apartments | 50 | 7.9% |
| Mobile Home / Other | 91 | 14.4% |
| Total | 631 | 100.0% |
Housing Structures by Occupancy in Celina
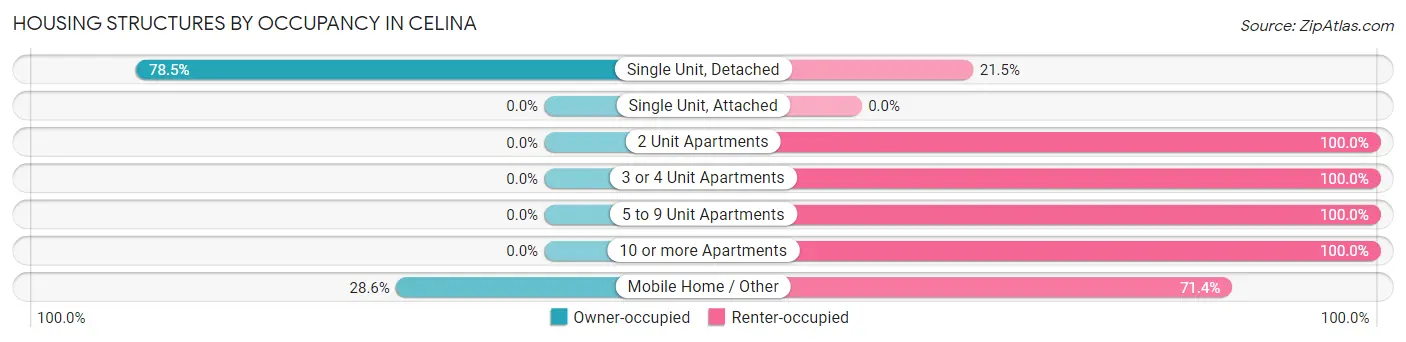
| Structure Type | Owner-occupied | Renter-occupied |
| Single Unit, Detached | 296 (78.5%) | 81 (21.5%) |
| Single Unit, Attached | 0 (0.0%) | 0 (0.0%) |
| 2 Unit Apartments | 0 (0.0%) | 25 (100.0%) |
| 3 or 4 Unit Apartments | 0 (0.0%) | 52 (100.0%) |
| 5 to 9 Unit Apartments | 0 (0.0%) | 36 (100.0%) |
| 10 or more Apartments | 0 (0.0%) | 50 (100.0%) |
| Mobile Home / Other | 26 (28.6%) | 65 (71.4%) |
| Total | 322 (51.0%) | 309 (49.0%) |
Housing Structures by Number of Rooms in Celina
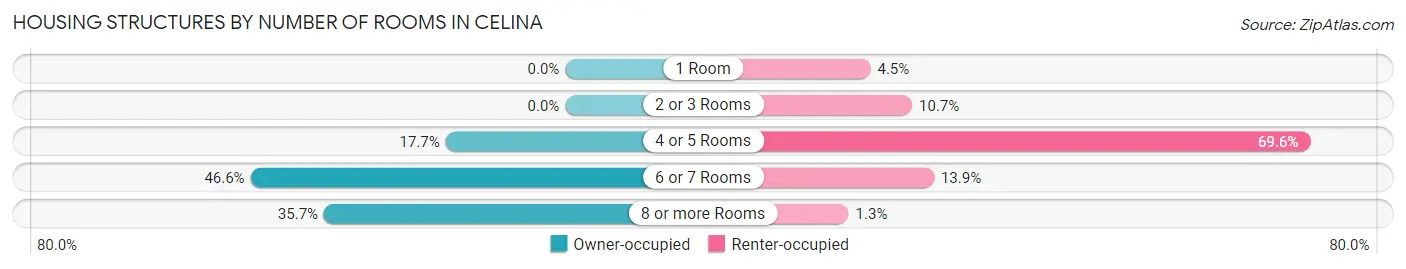
| Number of Rooms | Owner-occupied | Renter-occupied |
| 1 Room | 0 (0.0%) | 14 (4.5%) |
| 2 or 3 Rooms | 0 (0.0%) | 33 (10.7%) |
| 4 or 5 Rooms | 57 (17.7%) | 215 (69.6%) |
| 6 or 7 Rooms | 150 (46.6%) | 43 (13.9%) |
| 8 or more Rooms | 115 (35.7%) | 4 (1.3%) |
| Total | 322 (100.0%) | 309 (100.0%) |
Housing Structure by Heating Type in Celina
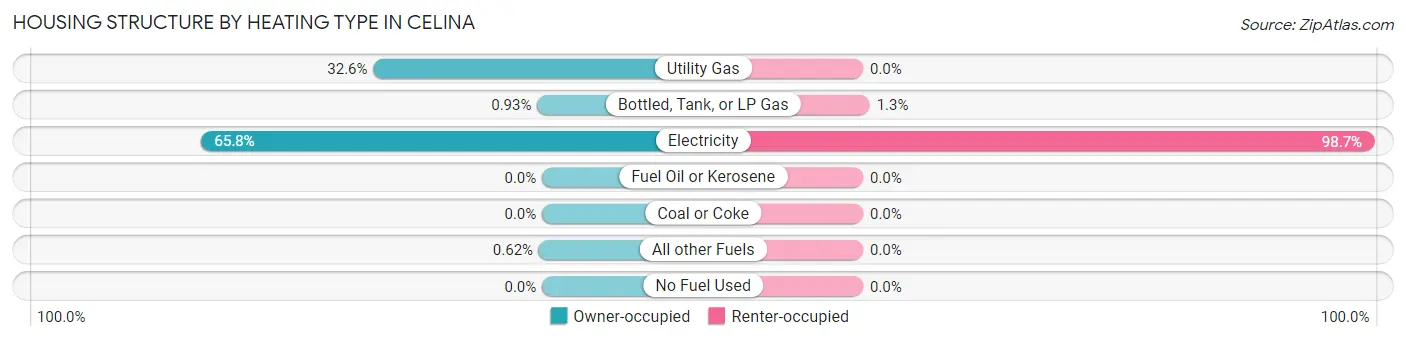
| Heating Type | Owner-occupied | Renter-occupied |
| Utility Gas | 105 (32.6%) | 0 (0.0%) |
| Bottled, Tank, or LP Gas | 3 (0.9%) | 4 (1.3%) |
| Electricity | 212 (65.8%) | 305 (98.7%) |
| Fuel Oil or Kerosene | 0 (0.0%) | 0 (0.0%) |
| Coal or Coke | 0 (0.0%) | 0 (0.0%) |
| All other Fuels | 2 (0.6%) | 0 (0.0%) |
| No Fuel Used | 0 (0.0%) | 0 (0.0%) |
| Total | 322 (100.0%) | 309 (100.0%) |
Household Vehicle Usage in Celina
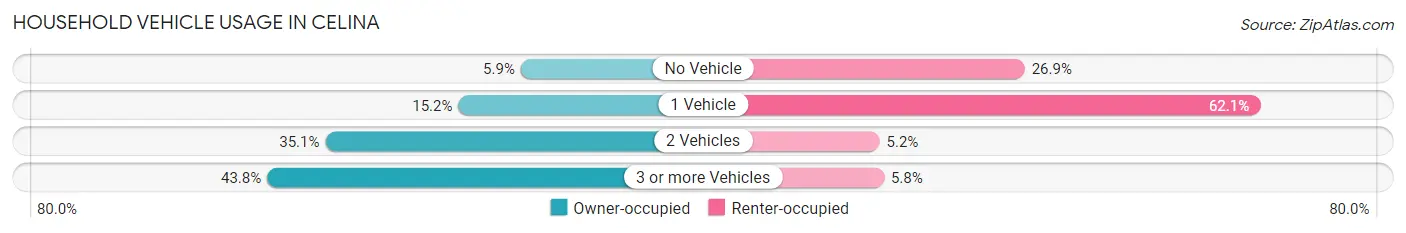
| Vehicles per Household | Owner-occupied | Renter-occupied |
| No Vehicle | 19 (5.9%) | 83 (26.9%) |
| 1 Vehicle | 49 (15.2%) | 192 (62.1%) |
| 2 Vehicles | 113 (35.1%) | 16 (5.2%) |
| 3 or more Vehicles | 141 (43.8%) | 18 (5.8%) |
| Total | 322 (100.0%) | 309 (100.0%) |
Real Estate & Mortgages in Celina
Real Estate and Mortgage Overview in Celina
| Characteristic | Without Mortgage | With Mortgage |
| Housing Units | 214 | 108 |
| Median Property Value | $130,100 | $0 |
| Median Household Income | $42,500 | $4 |
| Monthly Housing Costs | $418 | $0 |
| Real Estate Taxes | $821 | $39 |
Property Value by Mortgage Status in Celina
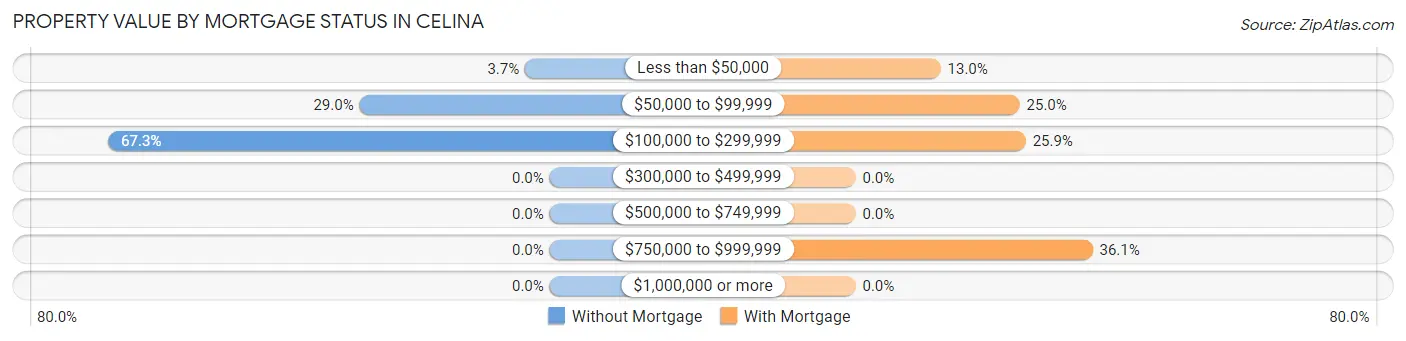
| Property Value | Without Mortgage | With Mortgage |
| Less than $50,000 | 8 (3.7%) | 14 (13.0%) |
| $50,000 to $99,999 | 62 (29.0%) | 27 (25.0%) |
| $100,000 to $299,999 | 144 (67.3%) | 28 (25.9%) |
| $300,000 to $499,999 | 0 (0.0%) | 0 (0.0%) |
| $500,000 to $749,999 | 0 (0.0%) | 0 (0.0%) |
| $750,000 to $999,999 | 0 (0.0%) | 39 (36.1%) |
| $1,000,000 or more | 0 (0.0%) | 0 (0.0%) |
| Total | 214 (100.0%) | 108 (100.0%) |
Household Income by Mortgage Status in Celina
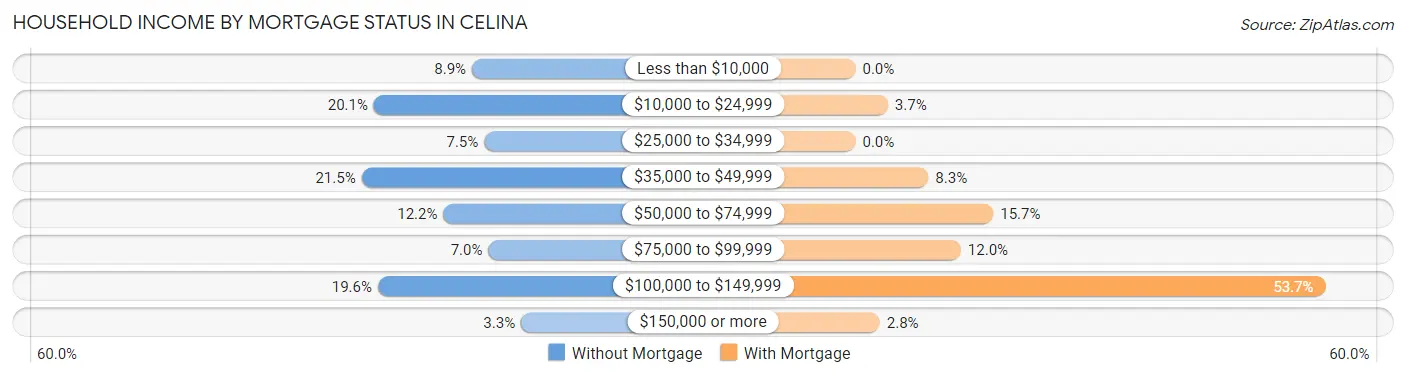
| Household Income | Without Mortgage | With Mortgage |
| Less than $10,000 | 19 (8.9%) | 0 (0.0%) |
| $10,000 to $24,999 | 43 (20.1%) | 4 (3.7%) |
| $25,000 to $34,999 | 16 (7.5%) | 0 (0.0%) |
| $35,000 to $49,999 | 46 (21.5%) | 9 (8.3%) |
| $50,000 to $74,999 | 26 (12.1%) | 17 (15.7%) |
| $75,000 to $99,999 | 15 (7.0%) | 13 (12.0%) |
| $100,000 to $149,999 | 42 (19.6%) | 58 (53.7%) |
| $150,000 or more | 7 (3.3%) | 3 (2.8%) |
| Total | 214 (100.0%) | 108 (100.0%) |
Property Value to Household Income Ratio in Celina
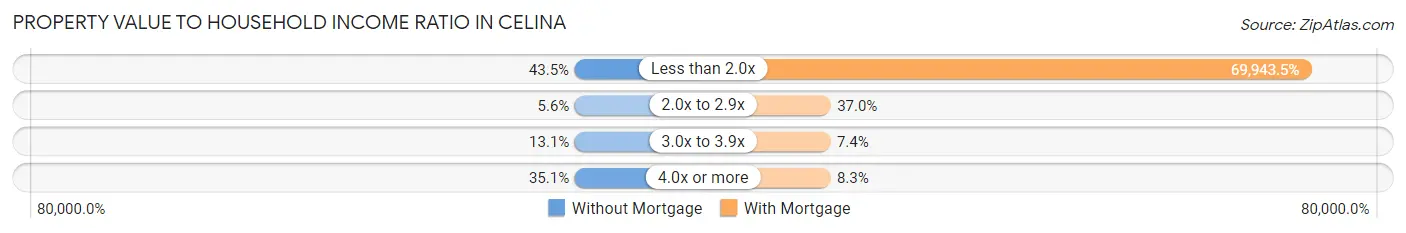
| Value-to-Income Ratio | Without Mortgage | With Mortgage |
| Less than 2.0x | 93 (43.5%) | 75,539 (69,943.5%) |
| 2.0x to 2.9x | 12 (5.6%) | 40 (37.0%) |
| 3.0x to 3.9x | 28 (13.1%) | 8 (7.4%) |
| 4.0x or more | 75 (35.0%) | 9 (8.3%) |
| Total | 214 (100.0%) | 108 (100.0%) |
Real Estate Taxes by Mortgage Status in Celina
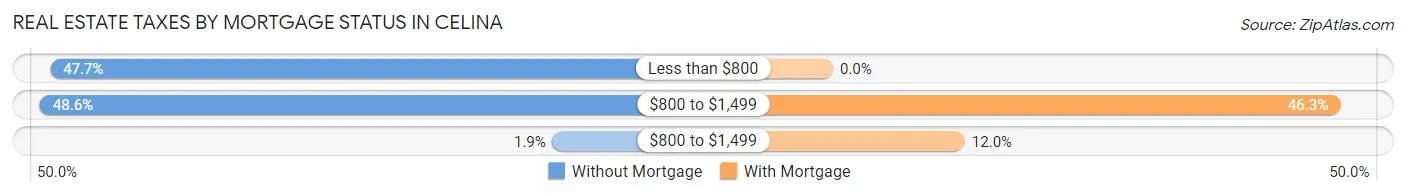
| Property Taxes | Without Mortgage | With Mortgage |
| Less than $800 | 102 (47.7%) | 0 (0.0%) |
| $800 to $1,499 | 104 (48.6%) | 50 (46.3%) |
| $800 to $1,499 | 4 (1.9%) | 13 (12.0%) |
| Total | 214 (100.0%) | 108 (100.0%) |
Health & Disability in Celina
Health Insurance Coverage by Age in Celina
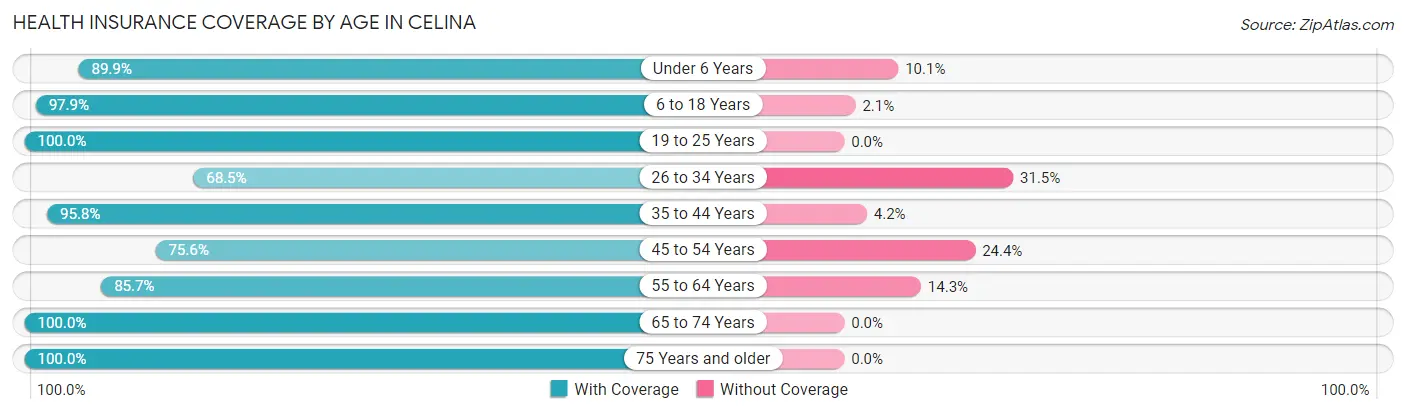
| Age Bracket | With Coverage | Without Coverage |
| Under 6 Years | 152 (89.9%) | 17 (10.1%) |
| 6 to 18 Years | 376 (97.9%) | 8 (2.1%) |
| 19 to 25 Years | 57 (100.0%) | 0 (0.0%) |
| 26 to 34 Years | 37 (68.5%) | 17 (31.5%) |
| 35 to 44 Years | 182 (95.8%) | 8 (4.2%) |
| 45 to 54 Years | 226 (75.6%) | 73 (24.4%) |
| 55 to 64 Years | 144 (85.7%) | 24 (14.3%) |
| 65 to 74 Years | 229 (100.0%) | 0 (0.0%) |
| 75 Years and older | 105 (100.0%) | 0 (0.0%) |
| Total | 1,508 (91.1%) | 147 (8.9%) |
Health Insurance Coverage by Citizenship Status in Celina
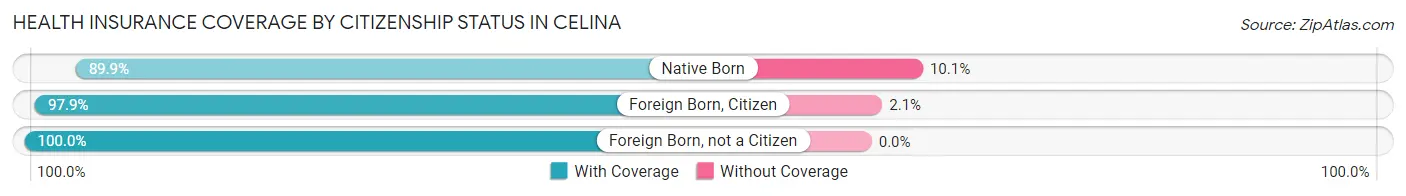
| Citizenship Status | With Coverage | Without Coverage |
| Native Born | 152 (89.9%) | 17 (10.1%) |
| Foreign Born, Citizen | 376 (97.9%) | 8 (2.1%) |
| Foreign Born, not a Citizen | 57 (100.0%) | 0 (0.0%) |
Health Insurance Coverage by Household Income in Celina
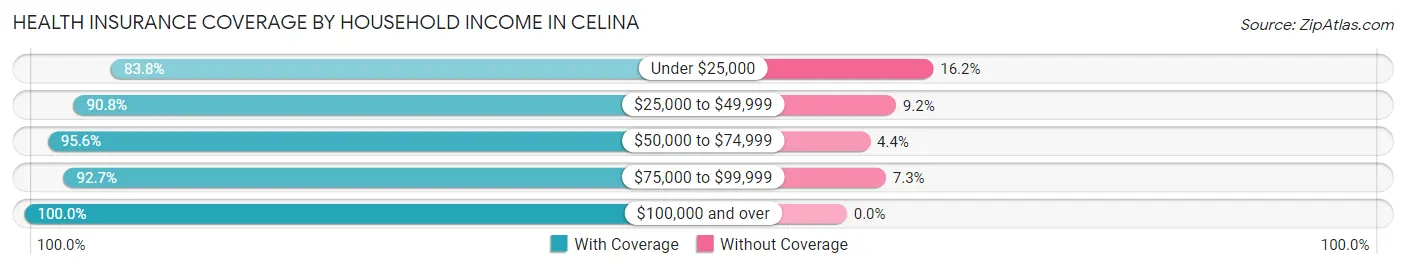
| Household Income | With Coverage | Without Coverage |
| Under $25,000 | 336 (83.8%) | 65 (16.2%) |
| $25,000 to $49,999 | 533 (90.8%) | 54 (9.2%) |
| $50,000 to $74,999 | 285 (95.6%) | 13 (4.4%) |
| $75,000 to $99,999 | 190 (92.7%) | 15 (7.3%) |
| $100,000 and over | 164 (100.0%) | 0 (0.0%) |
Public vs Private Health Insurance Coverage by Age in Celina
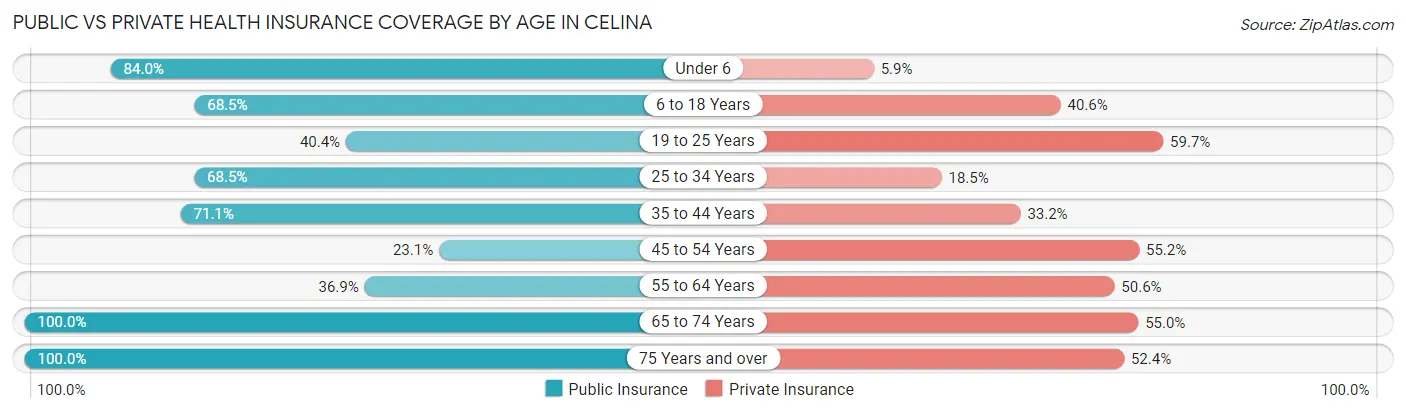
| Age Bracket | Public Insurance | Private Insurance |
| Under 6 | 142 (84.0%) | 10 (5.9%) |
| 6 to 18 Years | 263 (68.5%) | 156 (40.6%) |
| 19 to 25 Years | 23 (40.4%) | 34 (59.7%) |
| 25 to 34 Years | 37 (68.5%) | 10 (18.5%) |
| 35 to 44 Years | 135 (71.1%) | 63 (33.2%) |
| 45 to 54 Years | 69 (23.1%) | 165 (55.2%) |
| 55 to 64 Years | 62 (36.9%) | 85 (50.6%) |
| 65 to 74 Years | 229 (100.0%) | 126 (55.0%) |
| 75 Years and over | 105 (100.0%) | 55 (52.4%) |
| Total | 1,065 (64.3%) | 704 (42.5%) |
Disability Status by Sex by Age in Celina
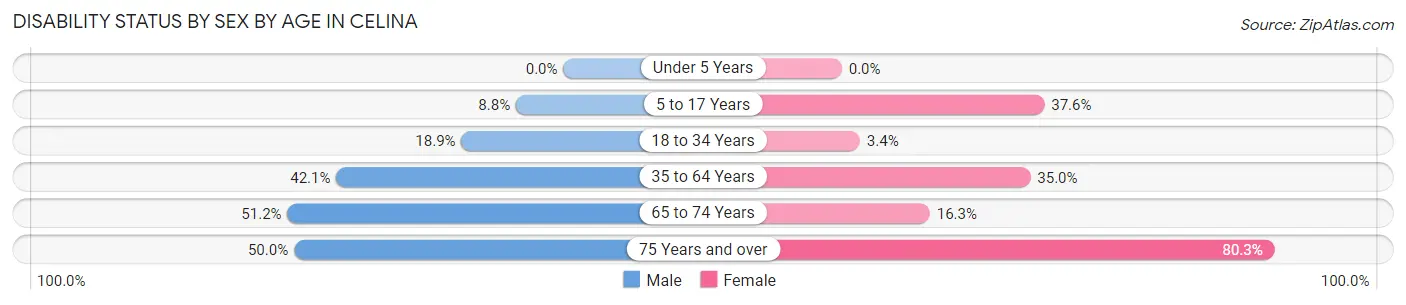
| Age Bracket | Male | Female |
| Under 5 Years | 0 (0.0%) | 0 (0.0%) |
| 5 to 17 Years | 16 (8.8%) | 59 (37.6%) |
| 18 to 34 Years | 7 (18.9%) | 4 (3.4%) |
| 35 to 64 Years | 142 (42.1%) | 112 (35.0%) |
| 65 to 74 Years | 42 (51.2%) | 24 (16.3%) |
| 75 Years and over | 22 (50.0%) | 49 (80.3%) |
Disability Class by Sex by Age in Celina
Disability Class: Hearing Difficulty
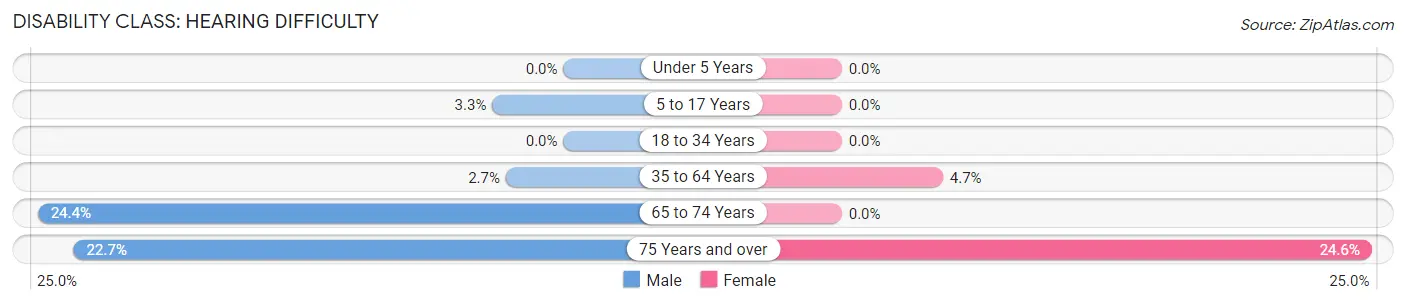
| Age Bracket | Male | Female |
| Under 5 Years | 0 (0.0%) | 0 (0.0%) |
| 5 to 17 Years | 6 (3.3%) | 0 (0.0%) |
| 18 to 34 Years | 0 (0.0%) | 0 (0.0%) |
| 35 to 64 Years | 9 (2.7%) | 15 (4.7%) |
| 65 to 74 Years | 20 (24.4%) | 0 (0.0%) |
| 75 Years and over | 10 (22.7%) | 15 (24.6%) |
Disability Class: Vision Difficulty
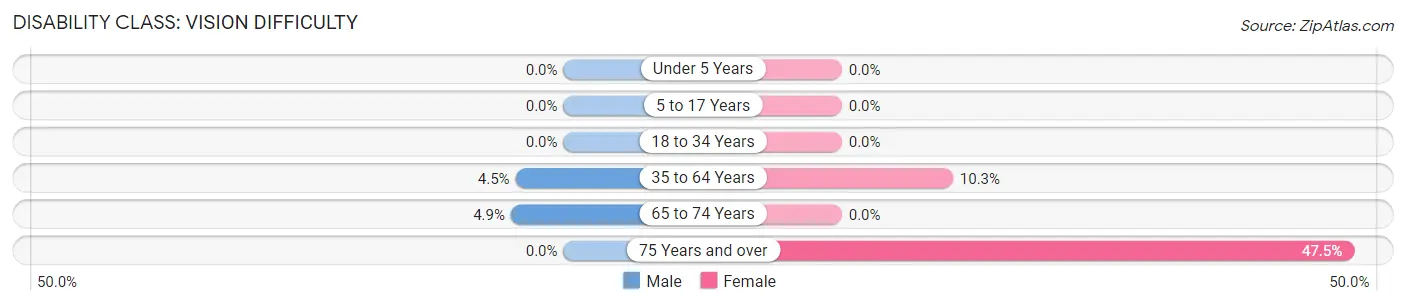
| Age Bracket | Male | Female |
| Under 5 Years | 0 (0.0%) | 0 (0.0%) |
| 5 to 17 Years | 0 (0.0%) | 0 (0.0%) |
| 18 to 34 Years | 0 (0.0%) | 0 (0.0%) |
| 35 to 64 Years | 15 (4.4%) | 33 (10.3%) |
| 65 to 74 Years | 4 (4.9%) | 0 (0.0%) |
| 75 Years and over | 0 (0.0%) | 29 (47.5%) |
Disability Class: Cognitive Difficulty
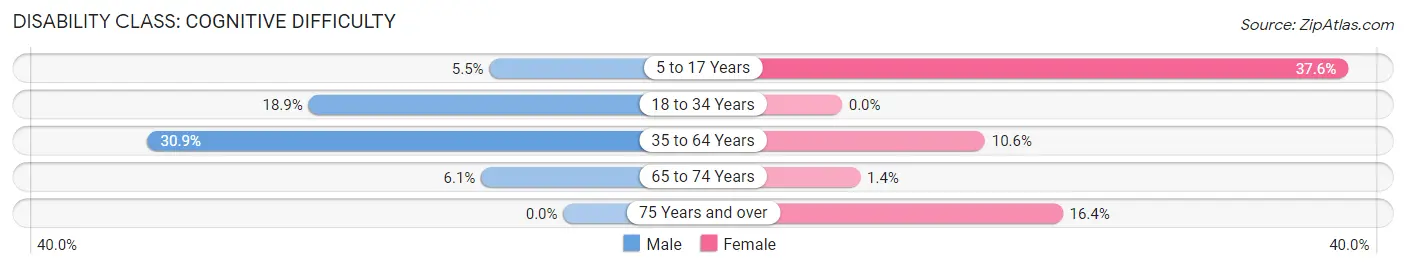
| Age Bracket | Male | Female |
| 5 to 17 Years | 10 (5.5%) | 59 (37.6%) |
| 18 to 34 Years | 7 (18.9%) | 0 (0.0%) |
| 35 to 64 Years | 104 (30.9%) | 34 (10.6%) |
| 65 to 74 Years | 5 (6.1%) | 2 (1.4%) |
| 75 Years and over | 0 (0.0%) | 10 (16.4%) |
Disability Class: Ambulatory Difficulty
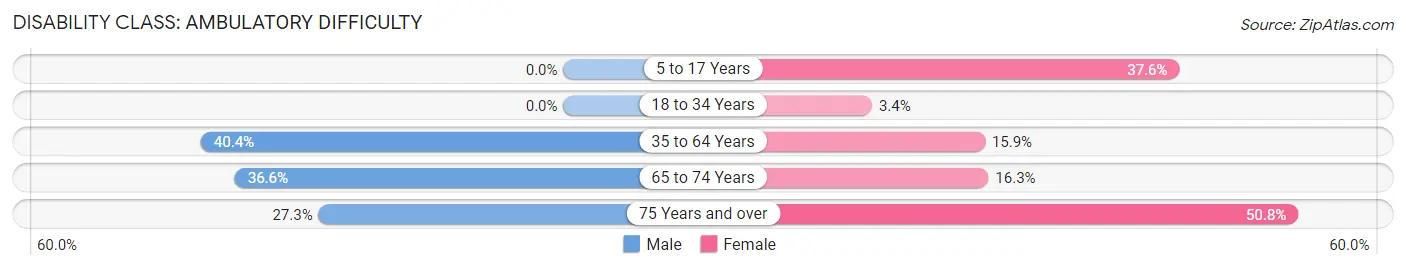
| Age Bracket | Male | Female |
| 5 to 17 Years | 0 (0.0%) | 59 (37.6%) |
| 18 to 34 Years | 0 (0.0%) | 4 (3.4%) |
| 35 to 64 Years | 136 (40.4%) | 51 (15.9%) |
| 65 to 74 Years | 30 (36.6%) | 24 (16.3%) |
| 75 Years and over | 12 (27.3%) | 31 (50.8%) |
Disability Class: Self-Care Difficulty
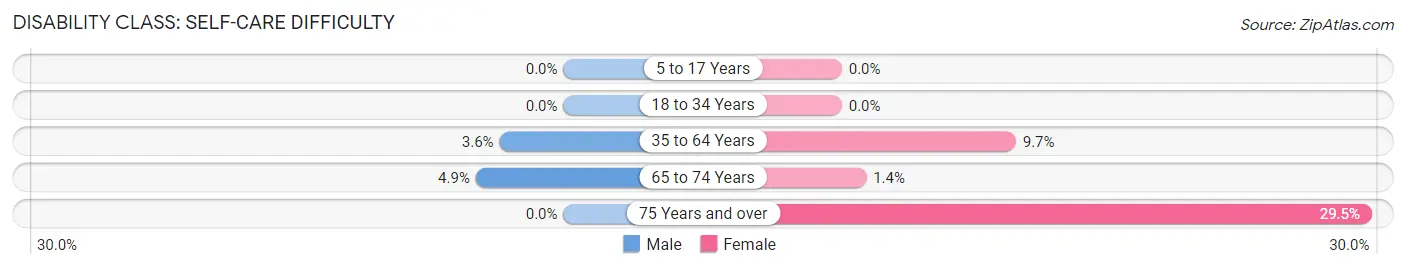
| Age Bracket | Male | Female |
| 5 to 17 Years | 0 (0.0%) | 0 (0.0%) |
| 18 to 34 Years | 0 (0.0%) | 0 (0.0%) |
| 35 to 64 Years | 12 (3.6%) | 31 (9.7%) |
| 65 to 74 Years | 4 (4.9%) | 2 (1.4%) |
| 75 Years and over | 0 (0.0%) | 18 (29.5%) |
Technology Access in Celina
Computing Device Access in Celina
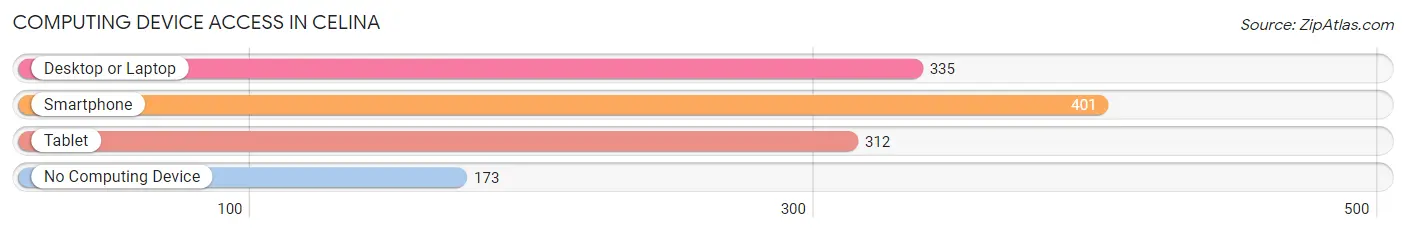
| Device Type | # Households | % Households |
| Desktop or Laptop | 335 | 53.1% |
| Smartphone | 401 | 63.5% |
| Tablet | 312 | 49.4% |
| No Computing Device | 173 | 27.4% |
| Total | 631 | 100.0% |
Internet Access in Celina
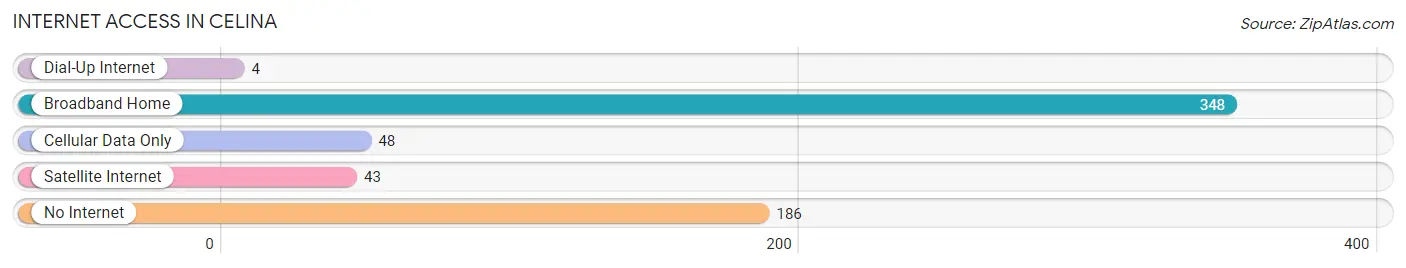
| Internet Type | # Households | % Households |
| Dial-Up Internet | 4 | 0.6% |
| Broadband Home | 348 | 55.1% |
| Cellular Data Only | 48 | 7.6% |
| Satellite Internet | 43 | 6.8% |
| No Internet | 186 | 29.5% |
| Total | 631 | 100.0% |
Celina Summary
Celina, Tennessee is a small town located in Clay County, Tennessee. It is situated in the foothills of the Cumberland Plateau, and is the county seat of Clay County. The town was founded in 1854 and has a population of approximately 1,500 people.
Geography
Celina is located in the western part of Clay County, Tennessee, in the foothills of the Cumberland Plateau. The town is situated on the banks of the Obey River, which is a tributary of the Cumberland River. The town is surrounded by rolling hills and forests, and is located approximately 30 miles from the Kentucky border. The town is located at an elevation of 890 feet above sea level.
Climate
Celina has a humid subtropical climate, with hot summers and mild winters. The average annual temperature is around 60 degrees Fahrenheit, with an average high of around 80 degrees in the summer and an average low of around 40 degrees in the winter. The town receives an average of 48 inches of precipitation per year, with most of it falling in the spring and summer months.
Demographics
As of the 2010 census, the population of Celina was 1,521. The racial makeup of the town was 97.2% White, 0.7% African American, 0.3% Native American, 0.2% Asian, 0.1% Pacific Islander, 0.7% from other races, and 0.9% from two or more races. Hispanic or Latino of any race were 1.3% of the population.
Economy
Celina’s economy is largely based on agriculture and tourism. The town is home to several farms, which produce a variety of crops, including corn, soybeans, wheat, and hay. The town is also home to several small businesses, including restaurants, retail stores, and service providers. Tourism is also an important part of the local economy, as the town is located near several popular recreational areas, including Dale Hollow Lake and the Obey River.
History
Celina was founded in 1854, when the county seat of Clay County was moved from Gainesboro to Celina. The town was named after Celina, the daughter of a local landowner. The town grew slowly over the years, and by the early 1900s, it had become a thriving agricultural center. In the 1950s, the town began to experience a decline in population, as many of its residents moved away in search of better economic opportunities. However, in recent years, the town has seen a resurgence in population, as many people have moved back to the area in search of a more rural lifestyle.
Conclusion
Celina, Tennessee is a small town located in Clay County, Tennessee. It is situated in the foothills of the Cumberland Plateau, and is the county seat of Clay County. The town was founded in 1854 and has a population of approximately 1,500 people. The town’s economy is largely based on agriculture and tourism, and it is home to several small businesses. The town has a humid subtropical climate, with hot summers and mild winters. The population of Celina is 97.2% White, 0.7% African American, 0.3% Native American, 0.2% Asian, 0.1% Pacific Islander, 0.7% from other races, and 0.9% from two or more races. Hispanic or Latino of any race were 1.3% of the population. Celina is a small town with a rich history and a bright future.
Common Questions
What is Per Capita Income in Celina?
Per Capita income in Celina is $15,743.
What is the Median Family Income in Celina?
Median Family Income in Celina is $50,417.
What is the Median Household income in Celina?
Median Household Income in Celina is $33,689.
What is Income or Wage Gap in Celina?
Income or Wage Gap in Celina is 36.7%.
Women in Celina earn 63.3 cents for every dollar earned by a man.
What is Family Income Deficit in Celina?
Family Income Deficit in Celina is $18,945.
Families that are below poverty line in Celina earn $18,945 less on average than the poverty threshold level.
What is Inequality or Gini Index in Celina?
Inequality or Gini Index in Celina is 0.48.
What is the Total Population of Celina?
Total Population of Celina is 1,767.
What is the Total Male Population of Celina?
Total Male Population of Celina is 840.
What is the Total Female Population of Celina?
Total Female Population of Celina is 927.
What is the Ratio of Males per 100 Females in Celina?
There are 90.61 Males per 100 Females in Celina.
What is the Ratio of Females per 100 Males in Celina?
There are 110.36 Females per 100 Males in Celina.
What is the Median Population Age in Celina?
Median Population Age in Celina is 45.0 Years.
What is the Average Family Size in Celina
Average Family Size in Celina is 3.4 People.
What is the Average Household Size in Celina
Average Household Size in Celina is 2.6 People.
How Large is the Labor Force in Celina?
There are 463 People in the Labor Forcein in Celina.
What is the Percentage of People in the Labor Force in Celina?
35.2% of People are in the Labor Force in Celina.
What is the Unemployment Rate in Celina?
Unemployment Rate in Celina is 13.9%.