Jackson, TN Map & Demographics
Jackson Map
Jackson Overview
$28,544
PER CAPITA INCOME
$61,397
AVG FAMILY INCOME
$48,058
AVG HOUSEHOLD INCOME
19.1%
WAGE / INCOME GAP [ % ]
80.9¢/ $1
WAGE / INCOME GAP [ $ ]
$12,380
FAMILY INCOME DEFICIT
0.50
INEQUALITY / GINI INDEX
67,993
TOTAL POPULATION
32,149
MALE POPULATION
35,844
FEMALE POPULATION
89.69
MALES / 100 FEMALES
111.49
FEMALES / 100 MALES
34.6
MEDIAN AGE
3.2
AVG FAMILY SIZE
2.4
AVG HOUSEHOLD SIZE
32,756
LABOR FORCE [ PEOPLE ]
61.3%
PERCENT IN LABOR FORCE
9.0%
UNEMPLOYMENT RATE
Jackson Area Codes
Income in Jackson
Income Overview in Jackson
Per Capita Income in Jackson is $28,544, while median incomes of families and households are $61,397 and $48,058 respectively.
| Characteristic | Number | Measure |
| Per Capita Income | 67,993 | $28,544 |
| Median Family Income | 15,657 | $61,397 |
| Mean Family Income | 15,657 | $84,614 |
| Median Household Income | 26,387 | $48,058 |
| Mean Household Income | 26,387 | $69,939 |
| Income Deficit | 15,657 | $12,380 |
| Wage / Income Gap (%) | 67,993 | 19.14% |
| Wage / Income Gap ($) | 67,993 | 80.86¢ per $1 |
| Gini / Inequality Index | 67,993 | 0.50 |
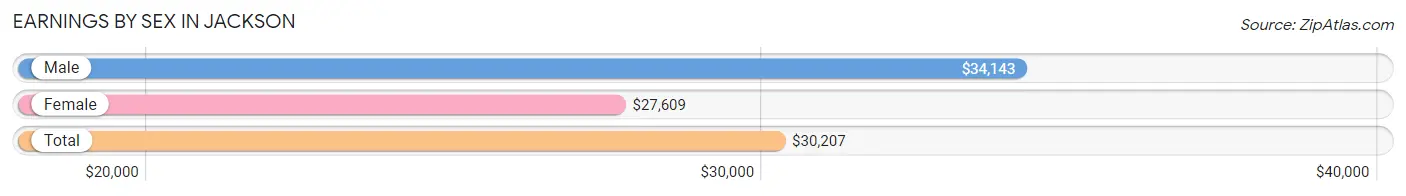
Earnings by Sex in Jackson
Average Earnings in Jackson are $30,207, $34,143 for men and $27,609 for women, a difference of 19.1%.
| Sex | Number | Average Earnings |
| Male | 16,709 (48.8%) | $34,143 |
| Female | 17,500 (51.2%) | $27,609 |
| Total | 34,209 (100.0%) | $30,207 |
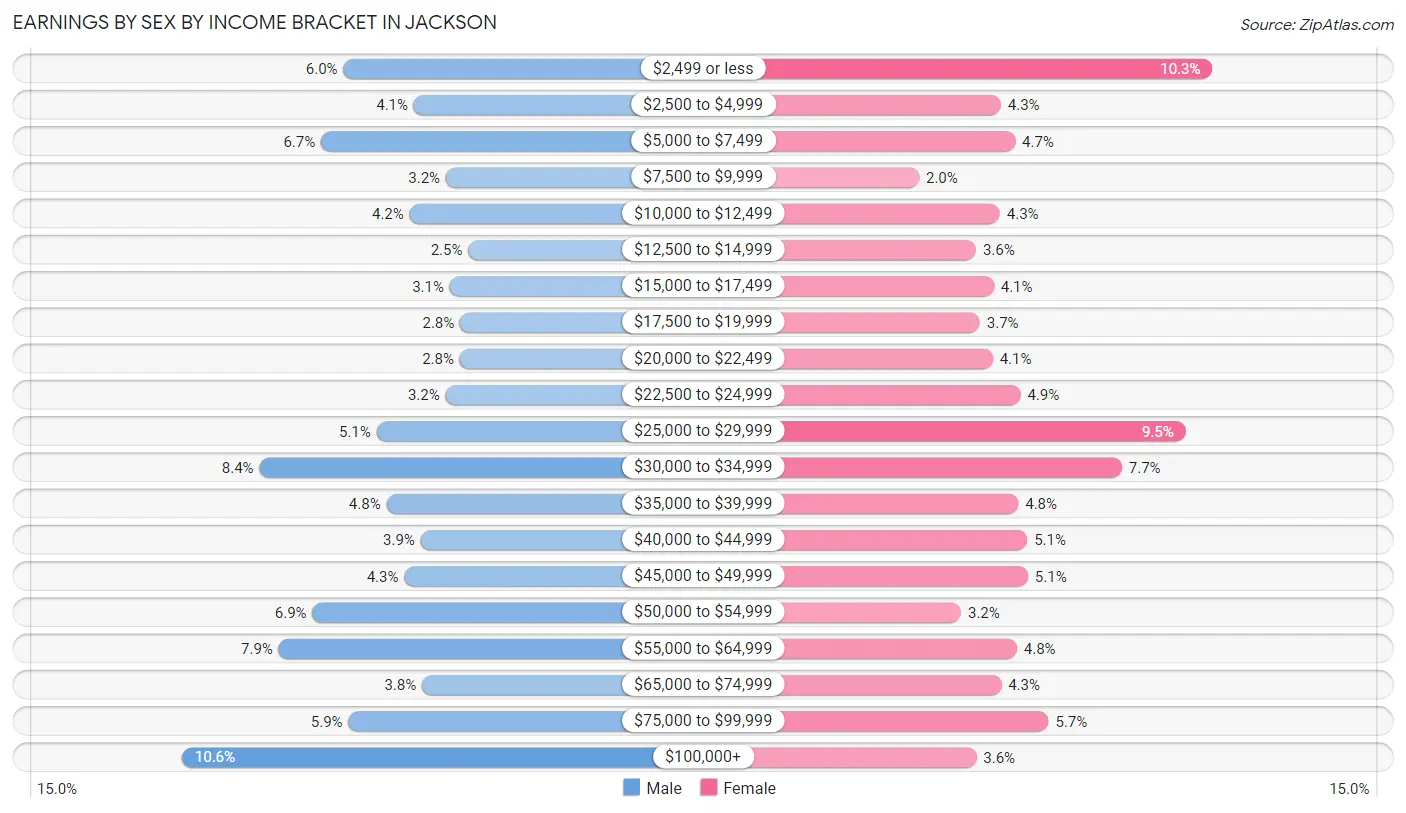
Earnings by Sex by Income Bracket in Jackson
The most common earnings brackets in Jackson are $100,000+ for men (1,768 | 10.6%) and $2,499 or less for women (1,798 | 10.3%).
| Income | Male | Female |
| $2,499 or less | 1,010 (6.0%) | 1,798 (10.3%) |
| $2,500 to $4,999 | 678 (4.1%) | 758 (4.3%) |
| $5,000 to $7,499 | 1,114 (6.7%) | 827 (4.7%) |
| $7,500 to $9,999 | 528 (3.2%) | 356 (2.0%) |
| $10,000 to $12,499 | 698 (4.2%) | 753 (4.3%) |
| $12,500 to $14,999 | 423 (2.5%) | 635 (3.6%) |
| $15,000 to $17,499 | 510 (3.0%) | 722 (4.1%) |
| $17,500 to $19,999 | 461 (2.8%) | 654 (3.7%) |
| $20,000 to $22,499 | 463 (2.8%) | 718 (4.1%) |
| $22,500 to $24,999 | 529 (3.2%) | 854 (4.9%) |
| $25,000 to $29,999 | 853 (5.1%) | 1,666 (9.5%) |
| $30,000 to $34,999 | 1,403 (8.4%) | 1,352 (7.7%) |
| $35,000 to $39,999 | 807 (4.8%) | 843 (4.8%) |
| $40,000 to $44,999 | 647 (3.9%) | 888 (5.1%) |
| $45,000 to $49,999 | 723 (4.3%) | 890 (5.1%) |
| $50,000 to $54,999 | 1,154 (6.9%) | 561 (3.2%) |
| $55,000 to $64,999 | 1,314 (7.9%) | 836 (4.8%) |
| $65,000 to $74,999 | 640 (3.8%) | 759 (4.3%) |
| $75,000 to $99,999 | 986 (5.9%) | 993 (5.7%) |
| $100,000+ | 1,768 (10.6%) | 637 (3.6%) |
| Total | 16,709 (100.0%) | 17,500 (100.0%) |
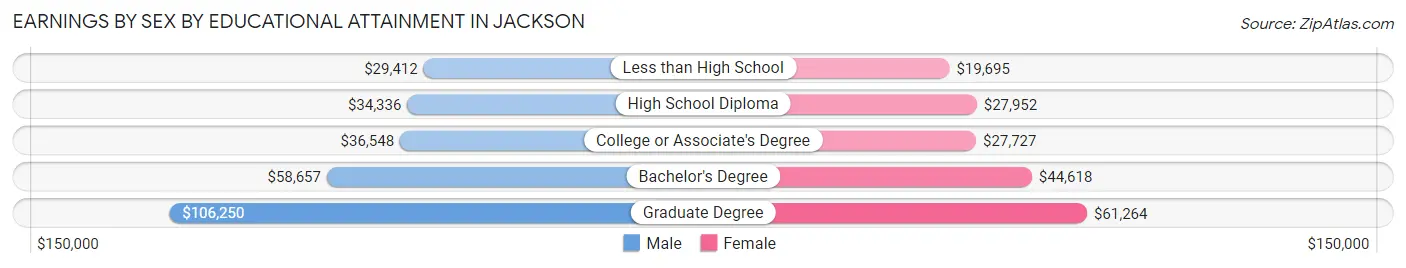
Earnings by Sex by Educational Attainment in Jackson
Average earnings in Jackson are $42,452 for men and $31,646 for women, a difference of 25.5%. Men with an educational attainment of graduate degree enjoy the highest average annual earnings of $106,250, while those with less than high school education earn the least with $29,412. Women with an educational attainment of graduate degree earn the most with the average annual earnings of $61,264, while those with less than high school education have the smallest earnings of $19,695.
| Educational Attainment | Male Income | Female Income |
| Less than High School | $29,412 | $19,695 |
| High School Diploma | $34,336 | $27,952 |
| College or Associate's Degree | $36,548 | $27,727 |
| Bachelor's Degree | $58,657 | $44,618 |
| Graduate Degree | $106,250 | $61,264 |
| Total | $42,452 | $31,646 |
Family Income in Jackson
Family Income Brackets in Jackson
According to the Jackson family income data, there are 2,771 families falling into the $100,000 to $149,999 income range, which is the most common income bracket and makes up 17.7% of all families. Conversely, the $150,000 to $199,999 income bracket is the least frequent group with only 736 families (4.7%) belonging to this category.
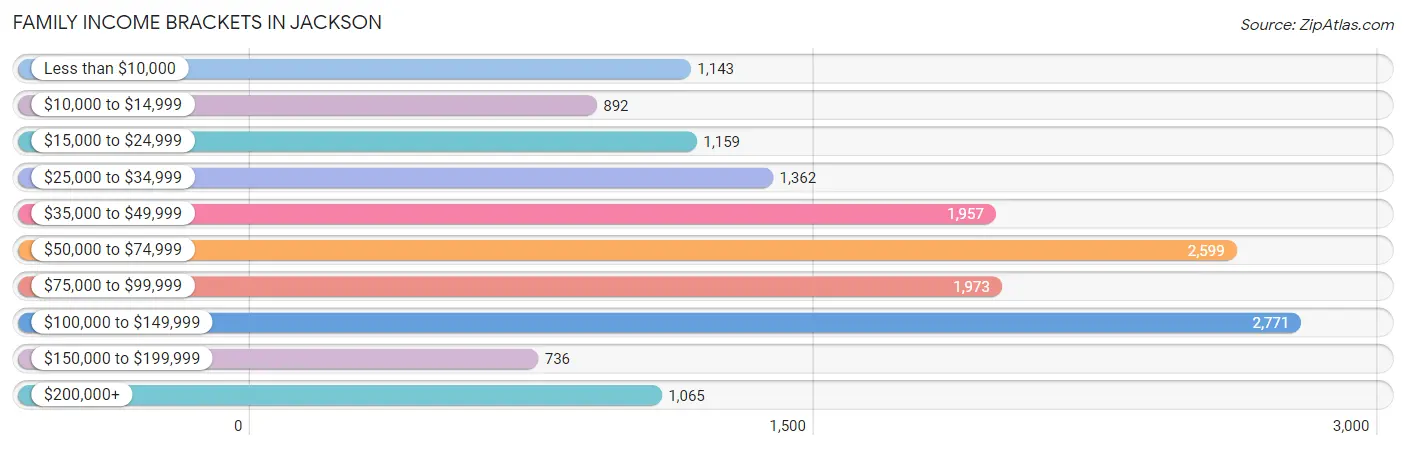
| Income Bracket | # Families | % Families |
| Less than $10,000 | 1,143 | 7.3% |
| $10,000 to $14,999 | 892 | 5.7% |
| $15,000 to $24,999 | 1,159 | 7.4% |
| $25,000 to $34,999 | 1,362 | 8.7% |
| $35,000 to $49,999 | 1,957 | 12.5% |
| $50,000 to $74,999 | 2,599 | 16.6% |
| $75,000 to $99,999 | 1,973 | 12.6% |
| $100,000 to $149,999 | 2,771 | 17.7% |
| $150,000 to $199,999 | 736 | 4.7% |
| $200,000+ | 1,065 | 6.8% |
Family Income by Famaliy Size in Jackson
7+ person families (227 | 1.5%) account for the highest median family income in Jackson with $110,875 per family, while 2-person families (7,065 | 45.1%) have the highest median income of $28,594 per family member.

| Income Bracket | # Families | Median Income |
| 2-Person Families | 7,065 (45.1%) | $57,188 |
| 3-Person Families | 3,889 (24.8%) | $62,746 |
| 4-Person Families | 2,621 (16.7%) | $77,995 |
| 5-Person Families | 1,433 (9.1%) | $43,938 |
| 6-Person Families | 422 (2.7%) | $105,682 |
| 7+ Person Families | 227 (1.5%) | $110,875 |
| Total | 15,657 (100.0%) | $61,397 |
Family Income by Number of Earners in Jackson
The median family income in Jackson is $61,397, with families comprising 3+ earners (1,280) having the highest median family income of $106,563, while families with no earners (2,321) have the lowest median family income of $28,621, accounting for 8.2% and 14.8% of families, respectively.
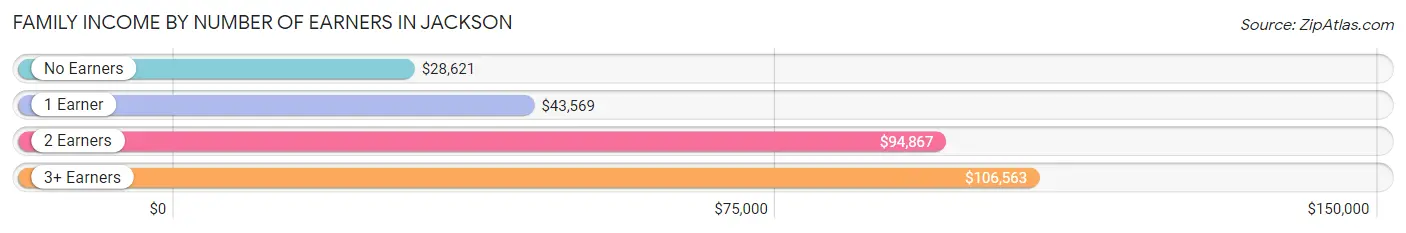
| Number of Earners | # Families | Median Income |
| No Earners | 2,321 (14.8%) | $28,621 |
| 1 Earner | 6,397 (40.9%) | $43,569 |
| 2 Earners | 5,659 (36.1%) | $94,867 |
| 3+ Earners | 1,280 (8.2%) | $106,563 |
| Total | 15,657 (100.0%) | $61,397 |
Household Income in Jackson
Household Income Brackets in Jackson
With 4,486 households falling in the category, the $50,000 to $74,999 income range is the most frequent in Jackson, accounting for 17.0% of all households. In contrast, only 897 households (3.4%) fall into the $150,000 to $199,999 income bracket, making it the least populous group.
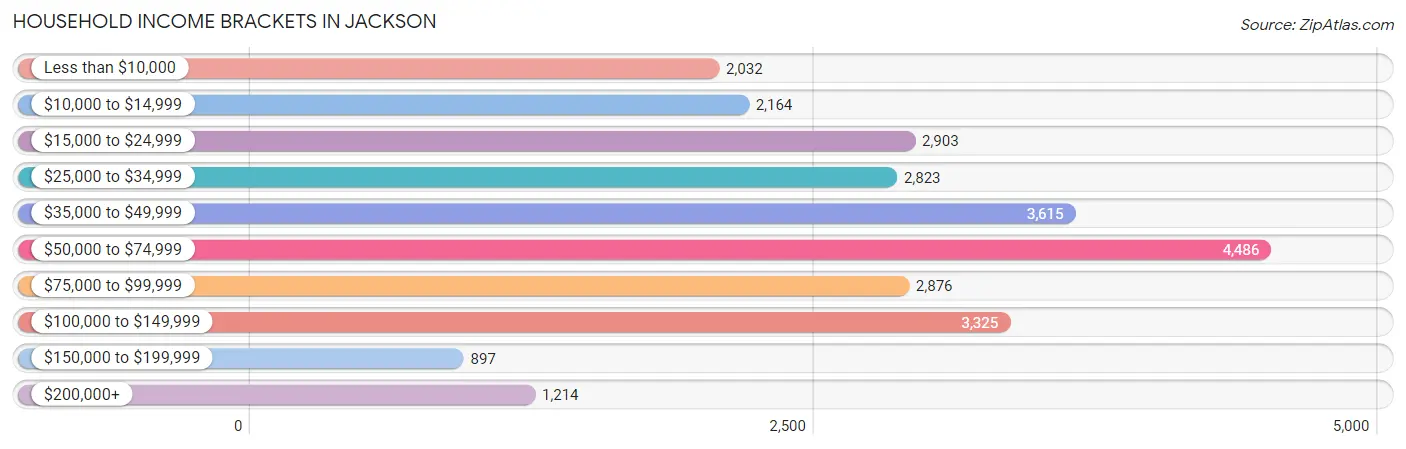
| Income Bracket | # Households | % Households |
| Less than $10,000 | 2,032 | 7.7% |
| $10,000 to $14,999 | 2,164 | 8.2% |
| $15,000 to $24,999 | 2,903 | 11.0% |
| $25,000 to $34,999 | 2,823 | 10.7% |
| $35,000 to $49,999 | 3,615 | 13.7% |
| $50,000 to $74,999 | 4,486 | 17.0% |
| $75,000 to $99,999 | 2,876 | 10.9% |
| $100,000 to $149,999 | 3,325 | 12.6% |
| $150,000 to $199,999 | 897 | 3.4% |
| $200,000+ | 1,214 | 4.6% |
Household Income by Householder Age in Jackson
The median household income in Jackson is $48,058, with the highest median household income of $51,904 found in the 45 to 64 years age bracket for the primary householder. A total of 8,948 households (33.9%) fall into this category. Meanwhile, the 15 to 24 years age bracket for the primary householder has the lowest median household income of $37,670, with 1,227 households (4.6%) in this group.
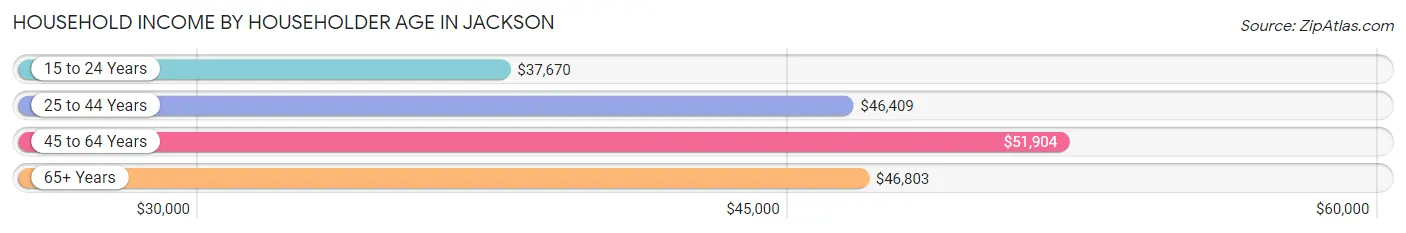
| Income Bracket | # Households | Median Income |
| 15 to 24 Years | 1,227 (4.6%) | $37,670 |
| 25 to 44 Years | 9,289 (35.2%) | $46,409 |
| 45 to 64 Years | 8,948 (33.9%) | $51,904 |
| 65+ Years | 6,923 (26.2%) | $46,803 |
| Total | 26,387 (100.0%) | $48,058 |
Poverty in Jackson
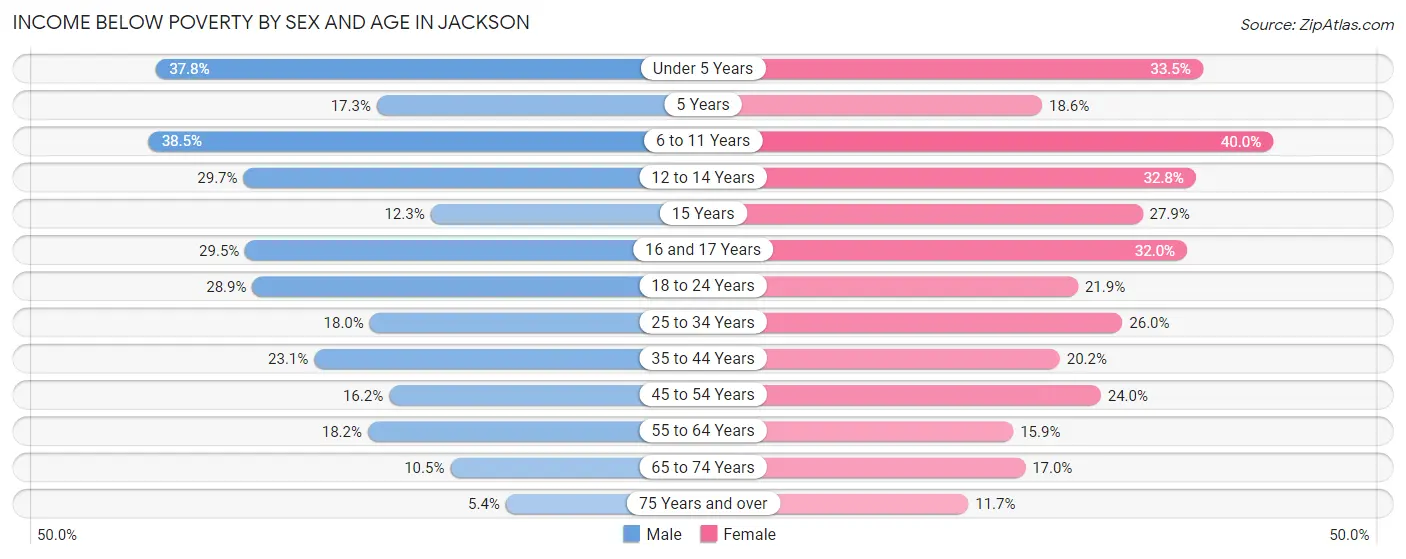
Income Below Poverty by Sex and Age in Jackson
With 22.5% poverty level for males and 23.3% for females among the residents of Jackson, 6 to 11 year old males and 6 to 11 year old females are the most vulnerable to poverty, with 1,081 males (38.5%) and 1,031 females (40.0%) in their respective age groups living below the poverty level.
| Age Bracket | Male | Female |
| Under 5 Years | 838 (37.8%) | 738 (33.5%) |
| 5 Years | 89 (17.3%) | 148 (18.6%) |
| 6 to 11 Years | 1,081 (38.5%) | 1,031 (40.0%) |
| 12 to 14 Years | 360 (29.7%) | 399 (32.8%) |
| 15 Years | 37 (12.3%) | 115 (27.9%) |
| 16 and 17 Years | 336 (29.5%) | 294 (32.0%) |
| 18 to 24 Years | 861 (28.9%) | 630 (21.9%) |
| 25 to 34 Years | 828 (18.0%) | 1,278 (26.0%) |
| 35 to 44 Years | 834 (23.1%) | 844 (20.2%) |
| 45 to 54 Years | 525 (16.2%) | 830 (24.0%) |
| 55 to 64 Years | 665 (18.1%) | 744 (15.9%) |
| 65 to 74 Years | 290 (10.5%) | 566 (17.0%) |
| 75 Years and over | 65 (5.3%) | 286 (11.7%) |
| Total | 6,809 (22.5%) | 7,903 (23.3%) |
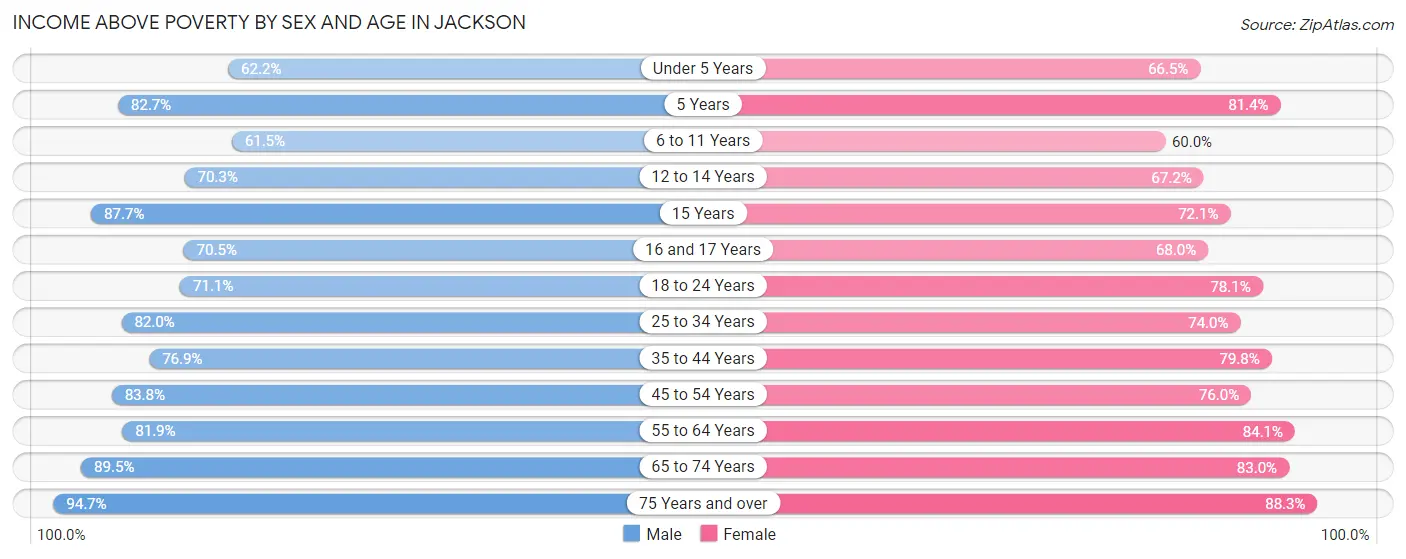
Income Above Poverty by Sex and Age in Jackson
According to the poverty statistics in Jackson, males aged 75 years and over and females aged 75 years and over are the age groups that are most secure financially, with 94.7% of males and 88.3% of females in these age groups living above the poverty line.
| Age Bracket | Male | Female |
| Under 5 Years | 1,380 (62.2%) | 1,466 (66.5%) |
| 5 Years | 425 (82.7%) | 648 (81.4%) |
| 6 to 11 Years | 1,728 (61.5%) | 1,545 (60.0%) |
| 12 to 14 Years | 852 (70.3%) | 816 (67.2%) |
| 15 Years | 263 (87.7%) | 297 (72.1%) |
| 16 and 17 Years | 802 (70.5%) | 624 (68.0%) |
| 18 to 24 Years | 2,121 (71.1%) | 2,244 (78.1%) |
| 25 to 34 Years | 3,777 (82.0%) | 3,629 (74.0%) |
| 35 to 44 Years | 2,772 (76.9%) | 3,328 (79.8%) |
| 45 to 54 Years | 2,720 (83.8%) | 2,622 (76.0%) |
| 55 to 64 Years | 2,998 (81.9%) | 3,931 (84.1%) |
| 65 to 74 Years | 2,473 (89.5%) | 2,760 (83.0%) |
| 75 Years and over | 1,151 (94.7%) | 2,150 (88.3%) |
| Total | 23,462 (77.5%) | 26,060 (76.7%) |
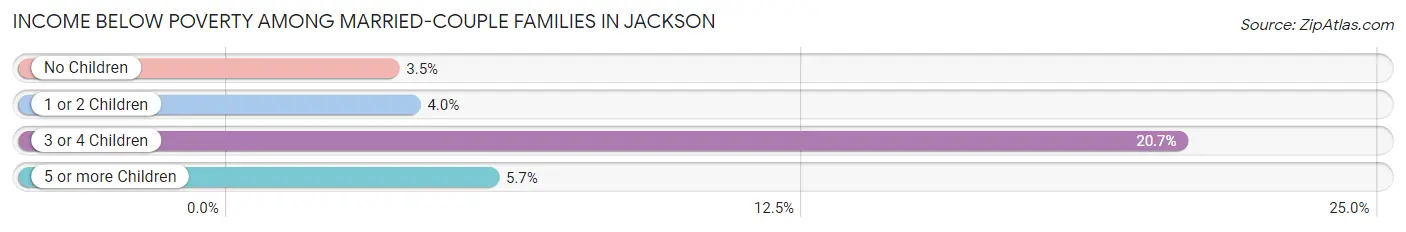
Income Below Poverty Among Married-Couple Families in Jackson
The poverty statistics for married-couple families in Jackson show that 5.0% or 436 of the total 8,711 families live below the poverty line. Families with 3 or 4 children have the highest poverty rate of 20.7%, comprising of 139 families. On the other hand, families with no children have the lowest poverty rate of 3.5%, which includes 180 families.
| Children | Above Poverty | Below Poverty |
| No Children | 4,948 (96.5%) | 180 (3.5%) |
| 1 or 2 Children | 2,711 (96.0%) | 112 (4.0%) |
| 3 or 4 Children | 533 (79.3%) | 139 (20.7%) |
| 5 or more Children | 83 (94.3%) | 5 (5.7%) |
| Total | 8,275 (95.0%) | 436 (5.0%) |
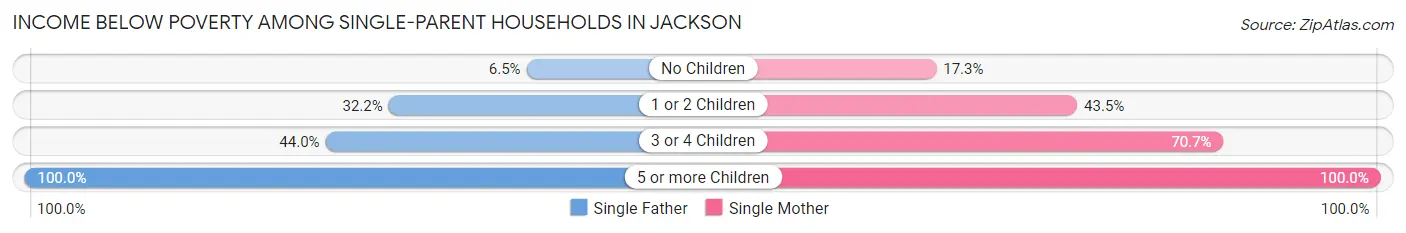
Income Below Poverty Among Single-Parent Households in Jackson
According to the poverty data in Jackson, 26.6% or 359 single-father households and 42.0% or 2,350 single-mother households are living below the poverty line. Among single-father households, those with 5 or more children have the highest poverty rate, with 7 households (100.0%) experiencing poverty. Likewise, among single-mother households, those with 5 or more children have the highest poverty rate, with 22 households (100.0%) falling below the poverty line.
| Children | Single Father | Single Mother |
| No Children | 24 (6.5%) | 260 (17.2%) |
| 1 or 2 Children | 277 (32.2%) | 1,290 (43.5%) |
| 3 or 4 Children | 51 (44.0%) | 778 (70.7%) |
| 5 or more Children | 7 (100.0%) | 22 (100.0%) |
| Total | 359 (26.6%) | 2,350 (42.0%) |
Income Below Poverty Among Married-Couple vs Single-Parent Households in Jackson
The poverty data for Jackson shows that 436 of the married-couple family households (5.0%) and 2,709 of the single-parent households (39.0%) are living below the poverty level. Within the married-couple family households, those with 3 or 4 children have the highest poverty rate, with 139 households (20.7%) falling below the poverty line. Among the single-parent households, those with 5 or more children have the highest poverty rate, with 29 household (100.0%) living below poverty.
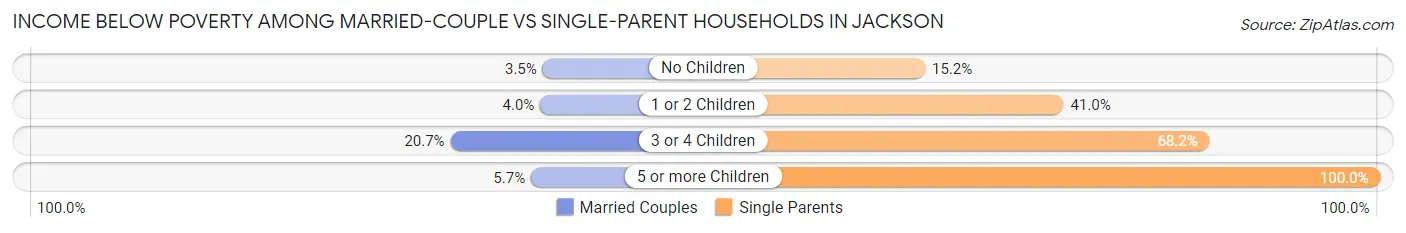
| Children | Married-Couple Families | Single-Parent Households |
| No Children | 180 (3.5%) | 284 (15.1%) |
| 1 or 2 Children | 112 (4.0%) | 1,567 (41.0%) |
| 3 or 4 Children | 139 (20.7%) | 829 (68.2%) |
| 5 or more Children | 5 (5.7%) | 29 (100.0%) |
| Total | 436 (5.0%) | 2,709 (39.0%) |
Race in Jackson
The most populous races in Jackson are White / Caucasian (31,637 | 46.5%), Black / African American (30,961 | 45.5%), and Hispanic or Latino (2,973 | 4.4%).
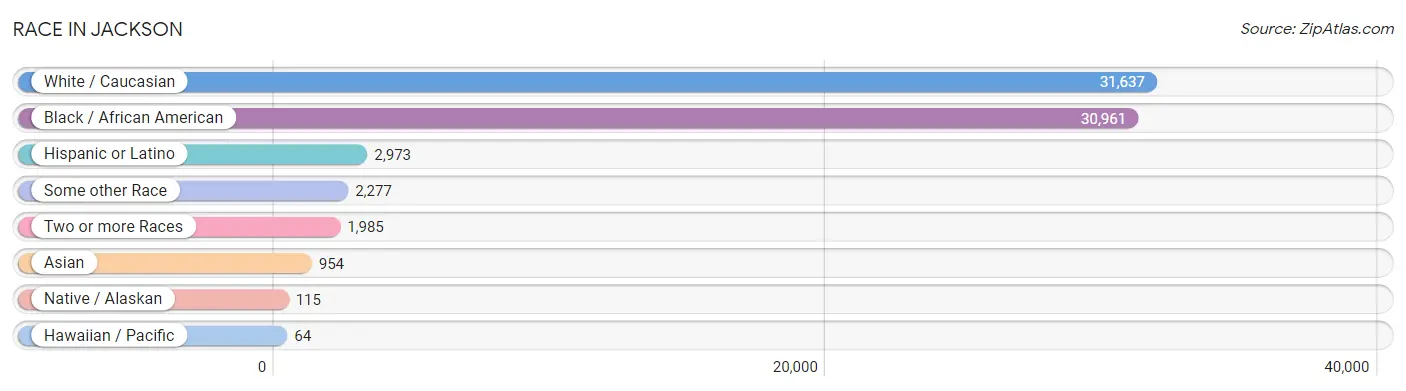
| Race | # Population | % Population |
| Asian | 954 | 1.4% |
| Black / African American | 30,961 | 45.5% |
| Hawaiian / Pacific | 64 | 0.1% |
| Hispanic or Latino | 2,973 | 4.4% |
| Native / Alaskan | 115 | 0.2% |
| White / Caucasian | 31,637 | 46.5% |
| Two or more Races | 1,985 | 2.9% |
| Some other Race | 2,277 | 3.4% |
| Total | 67,993 | 100.0% |
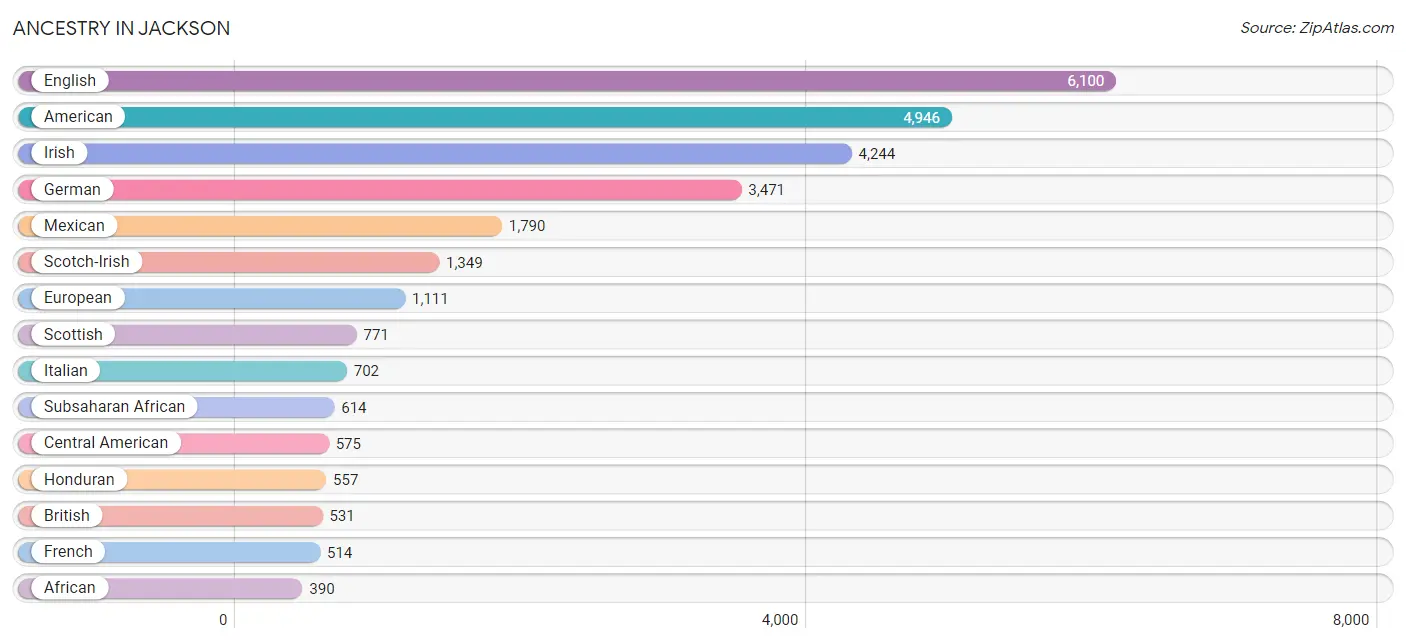
Ancestry in Jackson
The most populous ancestries reported in Jackson are English (6,100 | 9.0%), American (4,946 | 7.3%), Irish (4,244 | 6.2%), German (3,471 | 5.1%), and Mexican (1,790 | 2.6%), together accounting for 30.2% of all Jackson residents.
| Ancestry | # Population | % Population |
| African | 390 | 0.6% |
| Albanian | 191 | 0.3% |
| American | 4,946 | 7.3% |
| Apache | 14 | 0.0% |
| Arab | 31 | 0.1% |
| Argentinean | 25 | 0.0% |
| Armenian | 34 | 0.1% |
| Austrian | 22 | 0.0% |
| Belizean | 19 | 0.0% |
| Bhutanese | 82 | 0.1% |
| Blackfeet | 62 | 0.1% |
| Brazilian | 24 | 0.0% |
| British | 531 | 0.8% |
| Burmese | 174 | 0.3% |
| Canadian | 86 | 0.1% |
| Central American | 575 | 0.9% |
| Central American Indian | 46 | 0.1% |
| Cherokee | 316 | 0.5% |
| Chickasaw | 2 | 0.0% |
| Colombian | 5 | 0.0% |
| Croatian | 108 | 0.2% |
| Cuban | 106 | 0.2% |
| Czech | 53 | 0.1% |
| Czechoslovakian | 5 | 0.0% |
| Danish | 25 | 0.0% |
| Dutch | 224 | 0.3% |
| Eastern European | 38 | 0.1% |
| English | 6,100 | 9.0% |
| Ethiopian | 75 | 0.1% |
| European | 1,111 | 1.6% |
| French | 514 | 0.8% |
| French Canadian | 93 | 0.1% |
| German | 3,471 | 5.1% |
| Greek | 19 | 0.0% |
| Guatemalan | 11 | 0.0% |
| Haitian | 59 | 0.1% |
| Honduran | 557 | 0.8% |
| Hungarian | 57 | 0.1% |
| Indian (Asian) | 152 | 0.2% |
| Iranian | 34 | 0.1% |
| Irish | 4,244 | 6.2% |
| Israeli | 31 | 0.1% |
| Italian | 702 | 1.0% |
| Jamaican | 35 | 0.1% |
| Japanese | 20 | 0.0% |
| Korean | 193 | 0.3% |
| Laotian | 7 | 0.0% |
| Lebanese | 2 | 0.0% |
| Lithuanian | 5 | 0.0% |
| Mexican | 1,790 | 2.6% |
| Moroccan | 27 | 0.0% |
| Native Hawaiian | 102 | 0.2% |
| Nigerian | 55 | 0.1% |
| Northern European | 66 | 0.1% |
| Norwegian | 124 | 0.2% |
| Ottawa | 1 | 0.0% |
| Pakistani | 44 | 0.1% |
| Peruvian | 49 | 0.1% |
| Polish | 300 | 0.4% |
| Portuguese | 14 | 0.0% |
| Puerto Rican | 198 | 0.3% |
| Romanian | 55 | 0.1% |
| Russian | 119 | 0.2% |
| Salvadoran | 7 | 0.0% |
| Scandinavian | 280 | 0.4% |
| Scotch-Irish | 1,349 | 2.0% |
| Scottish | 771 | 1.1% |
| Slavic | 16 | 0.0% |
| Slovak | 24 | 0.0% |
| Slovene | 11 | 0.0% |
| Somali | 64 | 0.1% |
| South American | 79 | 0.1% |
| Spaniard | 110 | 0.2% |
| Spanish | 10 | 0.0% |
| Sri Lankan | 215 | 0.3% |
| Subsaharan African | 614 | 0.9% |
| Swedish | 235 | 0.4% |
| Swiss | 17 | 0.0% |
| Syrian | 2 | 0.0% |
| Thai | 233 | 0.3% |
| Trinidadian and Tobagonian | 7 | 0.0% |
| Ukrainian | 26 | 0.0% |
| Welsh | 155 | 0.2% | View All 83 Rows |
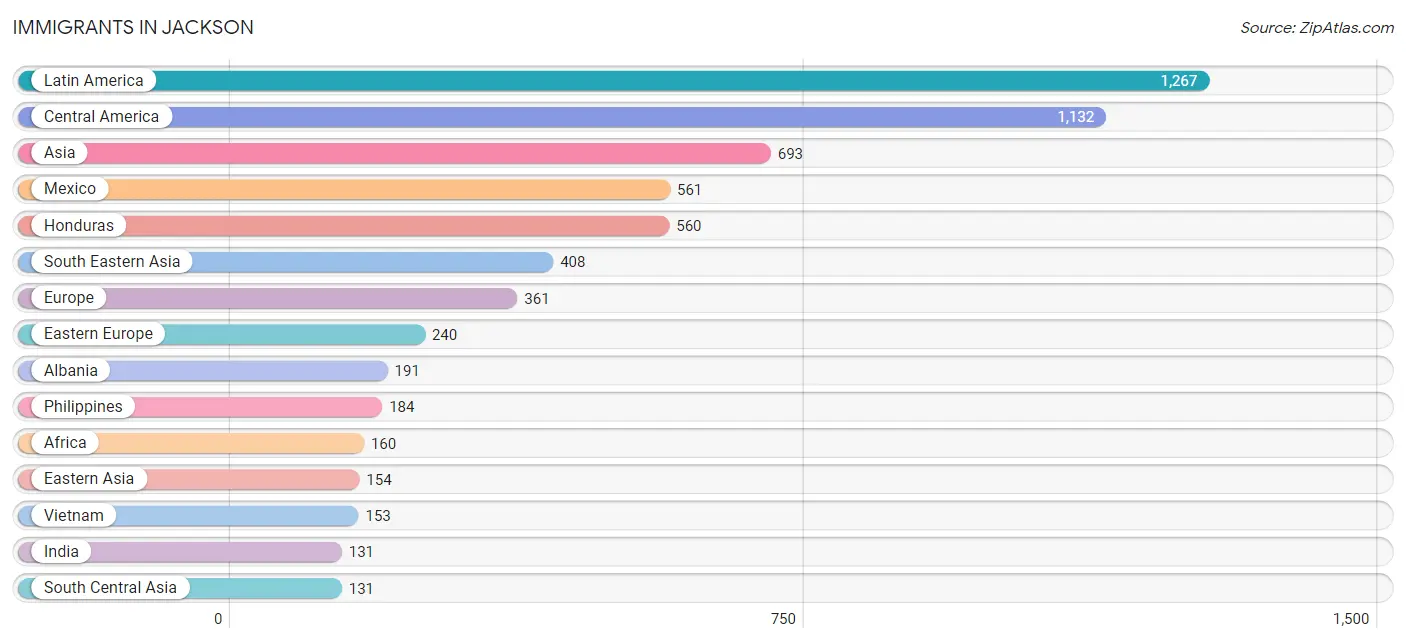
Immigrants in Jackson
The most numerous immigrant groups reported in Jackson came from Latin America (1,267 | 1.9%), Central America (1,132 | 1.7%), Asia (693 | 1.0%), Mexico (561 | 0.8%), and Honduras (560 | 0.8%), together accounting for 6.2% of all Jackson residents.
| Immigration Origin | # Population | % Population |
| Africa | 160 | 0.2% |
| Albania | 191 | 0.3% |
| Argentina | 23 | 0.0% |
| Asia | 693 | 1.0% |
| Brazil | 24 | 0.0% |
| Cambodia | 20 | 0.0% |
| Canada | 37 | 0.1% |
| Caribbean | 35 | 0.1% |
| Central America | 1,132 | 1.7% |
| China | 86 | 0.1% |
| Croatia | 7 | 0.0% |
| Dominican Republic | 9 | 0.0% |
| Eastern Africa | 85 | 0.1% |
| Eastern Asia | 154 | 0.2% |
| Eastern Europe | 240 | 0.4% |
| England | 66 | 0.1% |
| Ethiopia | 51 | 0.1% |
| Europe | 361 | 0.5% |
| Germany | 38 | 0.1% |
| Guatemala | 11 | 0.0% |
| Haiti | 19 | 0.0% |
| Honduras | 560 | 0.8% |
| Hong Kong | 11 | 0.0% |
| India | 131 | 0.2% |
| Indonesia | 7 | 0.0% |
| Japan | 36 | 0.1% |
| Korea | 32 | 0.1% |
| Latin America | 1,267 | 1.9% |
| Mexico | 561 | 0.8% |
| Nigeria | 36 | 0.1% |
| Northern Europe | 83 | 0.1% |
| Peru | 49 | 0.1% |
| Philippines | 184 | 0.3% |
| Russia | 42 | 0.1% |
| South America | 100 | 0.2% |
| South Central Asia | 131 | 0.2% |
| South Eastern Asia | 408 | 0.6% |
| Thailand | 44 | 0.1% |
| Trinidad and Tobago | 7 | 0.0% |
| Venezuela | 4 | 0.0% |
| Vietnam | 153 | 0.2% |
| Western Africa | 36 | 0.1% |
| Western Europe | 38 | 0.1% |
| Zimbabwe | 31 | 0.1% | View All 44 Rows |
Sex and Age in Jackson
Sex and Age in Jackson
The most populous age groups in Jackson are 15 to 19 Years (3,254 | 10.1%) for men and 20 to 24 Years (2,692 | 7.5%) for women.
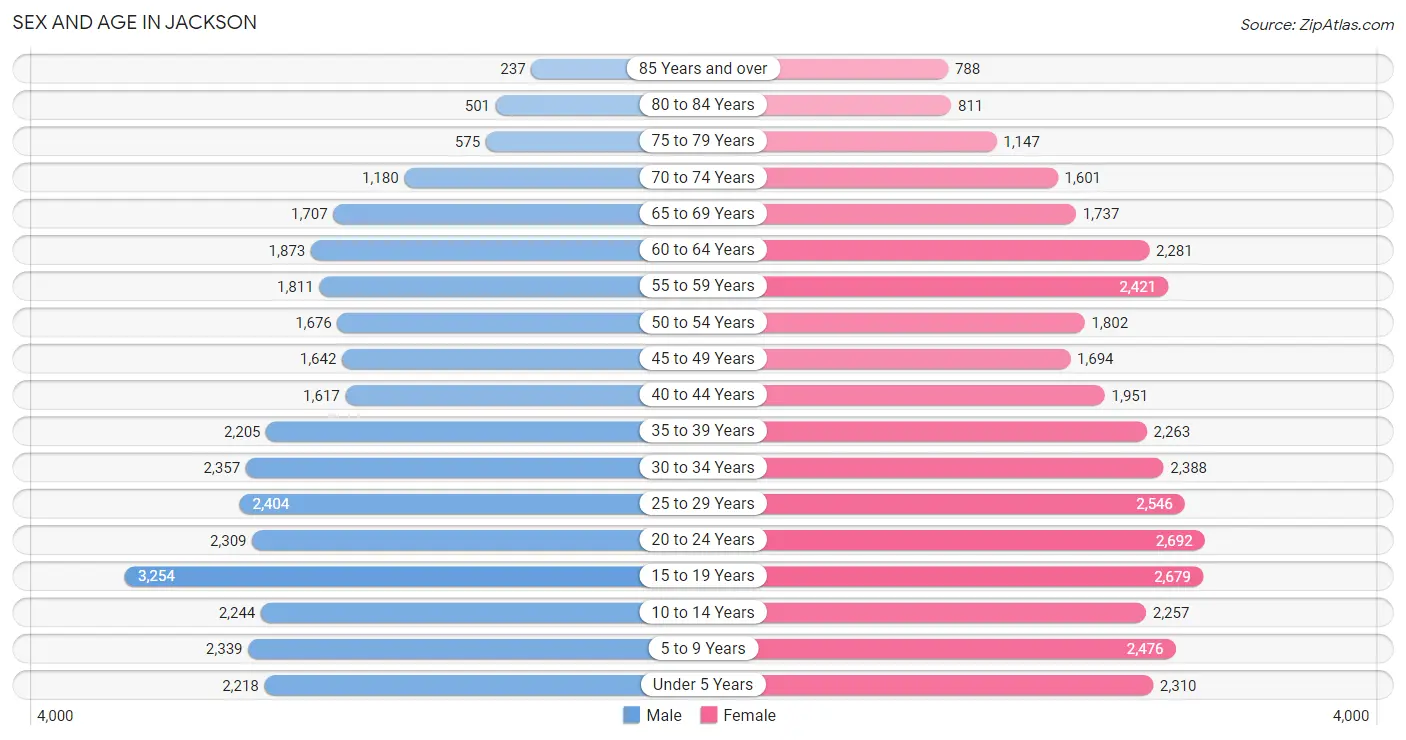
| Age Bracket | Male | Female |
| Under 5 Years | 2,218 (6.9%) | 2,310 (6.4%) |
| 5 to 9 Years | 2,339 (7.3%) | 2,476 (6.9%) |
| 10 to 14 Years | 2,244 (7.0%) | 2,257 (6.3%) |
| 15 to 19 Years | 3,254 (10.1%) | 2,679 (7.5%) |
| 20 to 24 Years | 2,309 (7.2%) | 2,692 (7.5%) |
| 25 to 29 Years | 2,404 (7.5%) | 2,546 (7.1%) |
| 30 to 34 Years | 2,357 (7.3%) | 2,388 (6.7%) |
| 35 to 39 Years | 2,205 (6.9%) | 2,263 (6.3%) |
| 40 to 44 Years | 1,617 (5.0%) | 1,951 (5.4%) |
| 45 to 49 Years | 1,642 (5.1%) | 1,694 (4.7%) |
| 50 to 54 Years | 1,676 (5.2%) | 1,802 (5.0%) |
| 55 to 59 Years | 1,811 (5.6%) | 2,421 (6.8%) |
| 60 to 64 Years | 1,873 (5.8%) | 2,281 (6.4%) |
| 65 to 69 Years | 1,707 (5.3%) | 1,737 (4.9%) |
| 70 to 74 Years | 1,180 (3.7%) | 1,601 (4.5%) |
| 75 to 79 Years | 575 (1.8%) | 1,147 (3.2%) |
| 80 to 84 Years | 501 (1.6%) | 811 (2.3%) |
| 85 Years and over | 237 (0.7%) | 788 (2.2%) |
| Total | 32,149 (100.0%) | 35,844 (100.0%) |
Families and Households in Jackson
Median Family Size in Jackson
The median family size in Jackson is 3.17 persons per family, with single male/father families (1,351 | 8.6%) accounting for the largest median family size of 3.26 persons per family. On the other hand, single female/mother families (5,595 | 35.7%) represent the smallest median family size with 3.06 persons per family.
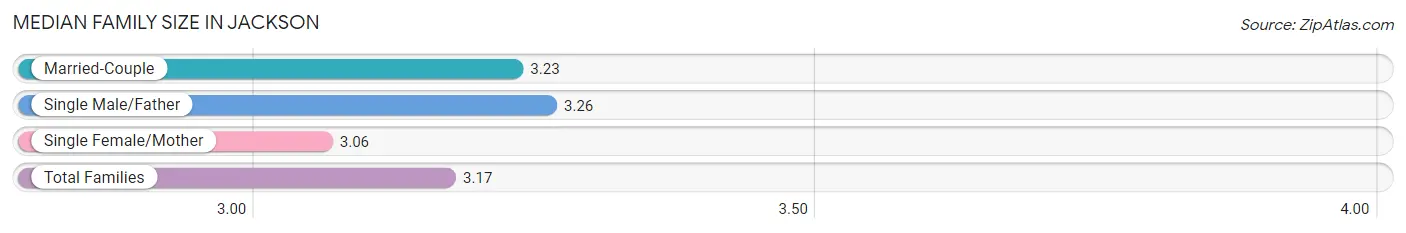
| Family Type | # Families | Family Size |
| Married-Couple | 8,711 (55.6%) | 3.23 |
| Single Male/Father | 1,351 (8.6%) | 3.26 |
| Single Female/Mother | 5,595 (35.7%) | 3.06 |
| Total Families | 15,657 (100.0%) | 3.17 |
Median Household Size in Jackson
The median household size in Jackson is 2.43 persons per household, with single male/father households (1,351 | 5.1%) accounting for the largest median household size of 3.54 persons per household. non-family households (10,730 | 40.7%) represent the smallest median household size with 1.21 persons per household.
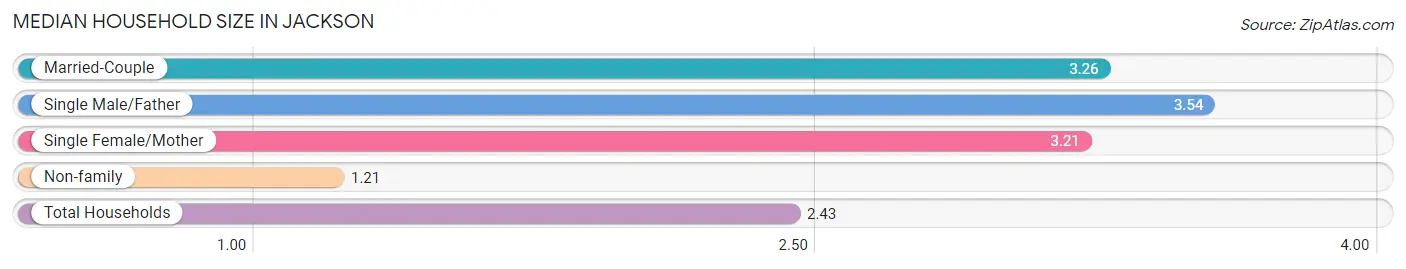
| Household Type | # Households | Household Size |
| Married-Couple | 8,711 (33.0%) | 3.26 |
| Single Male/Father | 1,351 (5.1%) | 3.54 |
| Single Female/Mother | 5,595 (21.2%) | 3.21 |
| Non-family | 10,730 (40.7%) | 1.21 |
| Total Households | 26,387 (100.0%) | 2.43 |
Household Size by Marriage Status in Jackson
Out of a total of 26,387 households in Jackson, 15,657 (59.3%) are family households, while 10,730 (40.7%) are nonfamily households. The most numerous type of family households are 2-person households, comprising 6,631, and the most common type of nonfamily households are 1-person households, comprising 9,391.
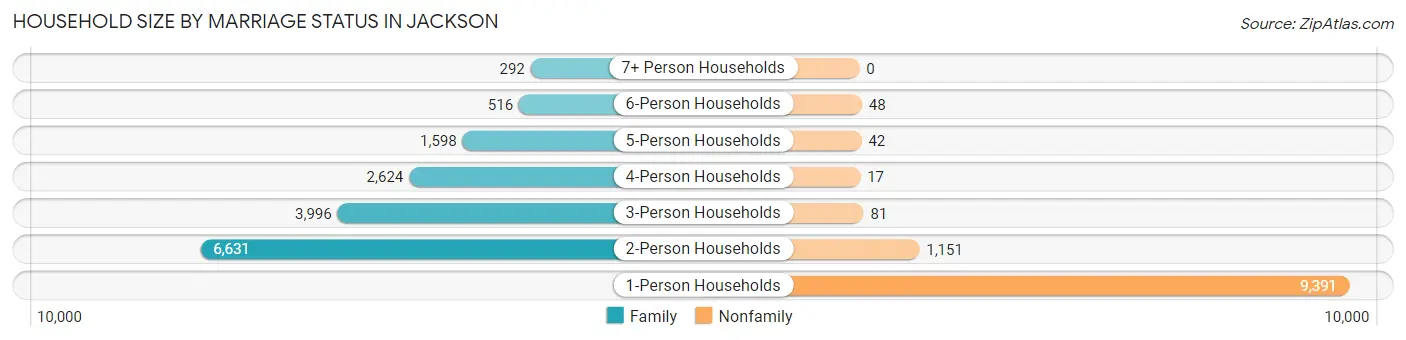
| Household Size | Family Households | Nonfamily Households |
| 1-Person Households | - | 9,391 (35.6%) |
| 2-Person Households | 6,631 (25.1%) | 1,151 (4.4%) |
| 3-Person Households | 3,996 (15.1%) | 81 (0.3%) |
| 4-Person Households | 2,624 (9.9%) | 17 (0.1%) |
| 5-Person Households | 1,598 (6.1%) | 42 (0.2%) |
| 6-Person Households | 516 (2.0%) | 48 (0.2%) |
| 7+ Person Households | 292 (1.1%) | 0 (0.0%) |
| Total | 15,657 (59.3%) | 10,730 (40.7%) |
Female Fertility in Jackson
Fertility by Age in Jackson
Average fertility rate in Jackson is 62.0 births per 1,000 women. Women in the age bracket of 20 to 34 years have the highest fertility rate with 126.0 births per 1,000 women. Women in the age bracket of 20 to 34 years acount for 93.6% of all women with births.
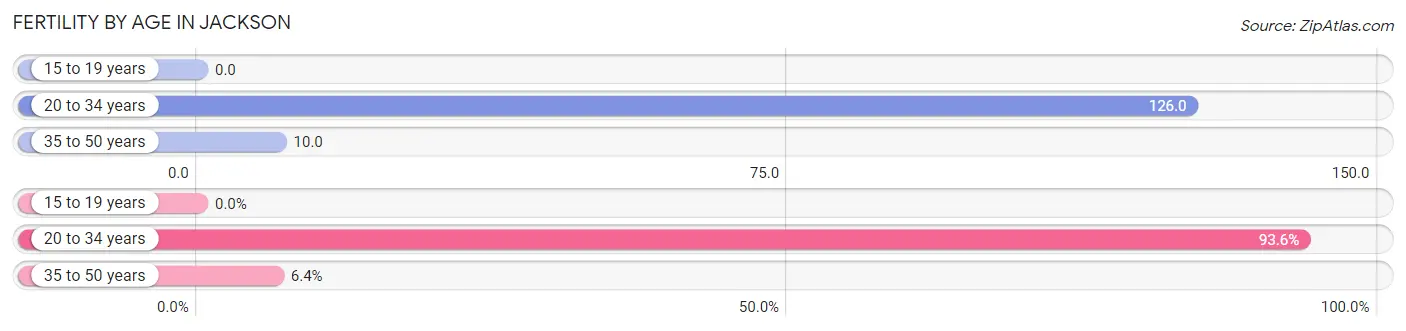
| Age Bracket | Women with Births | Births / 1,000 Women |
| 15 to 19 years | 0 (0.0%) | 0.0 |
| 20 to 34 years | 960 (93.6%) | 126.0 |
| 35 to 50 years | 66 (6.4%) | 10.0 |
| Total | 1,026 (100.0%) | 62.0 |
Fertility by Age by Marriage Status in Jackson
58.9% of women with births (1,026) in Jackson are married. The highest percentage of unmarried women with births falls into 20 to 34 years age bracket with 42.1% of them unmarried at the time of birth, while the lowest percentage of unmarried women with births belong to 35 to 50 years age bracket with 27.3% of them unmarried.
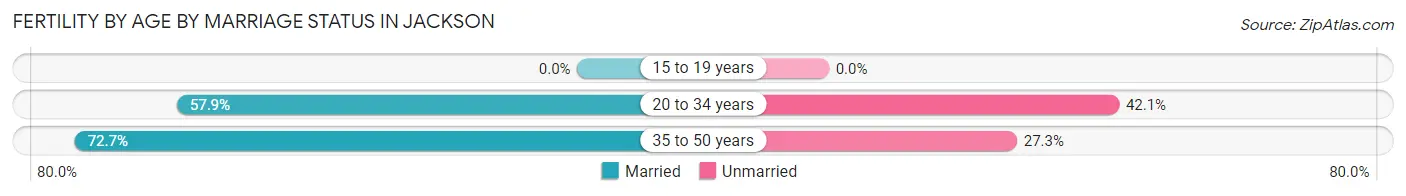
| Age Bracket | Married | Unmarried |
| 15 to 19 years | 0 (0.0%) | 0 (0.0%) |
| 20 to 34 years | 556 (57.9%) | 404 (42.1%) |
| 35 to 50 years | 48 (72.7%) | 18 (27.3%) |
| Total | 604 (58.9%) | 422 (41.1%) |
Fertility by Education in Jackson
Average fertility rate in Jackson is 62.0 births per 1,000 women. Women with the education attainment of graduate degree have the highest fertility rate of 119.0 births per 1,000 women, while women with the education attainment of less than high school have the lowest fertility at 13.0 births per 1,000 women. Women with the education attainment of college or associate's degree represent 40.8% of all women with births.
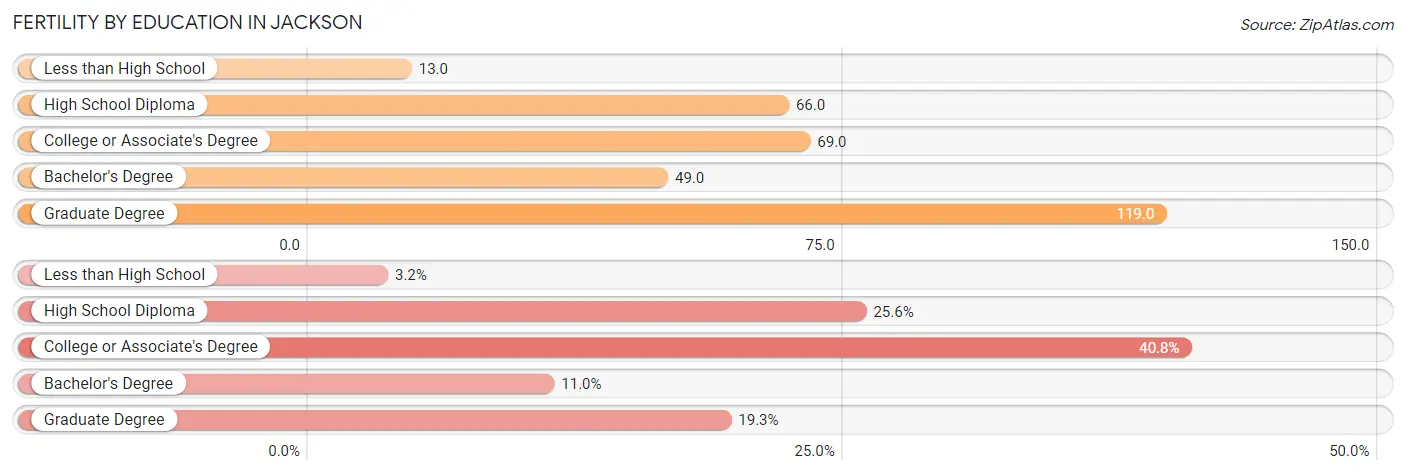
| Educational Attainment | Women with Births | Births / 1,000 Women |
| Less than High School | 33 (3.2%) | 13.0 |
| High School Diploma | 263 (25.6%) | 66.0 |
| College or Associate's Degree | 419 (40.8%) | 69.0 |
| Bachelor's Degree | 113 (11.0%) | 49.0 |
| Graduate Degree | 198 (19.3%) | 119.0 |
| Total | 1,026 (100.0%) | 62.0 |
Fertility by Education by Marriage Status in Jackson
41.1% of women with births in Jackson are unmarried. Women with the educational attainment of bachelor's degree are most likely to be married with 100.0% of them married at childbirth, while women with the educational attainment of less than high school are least likely to be married with 100.0% of them unmarried at childbirth.
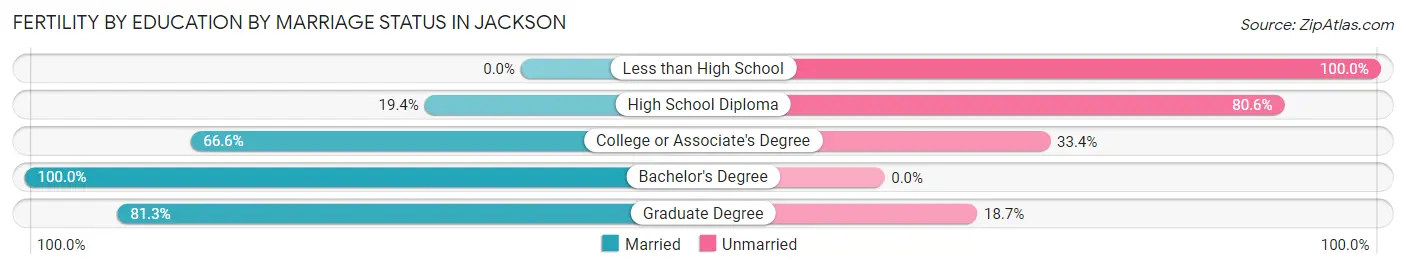
| Educational Attainment | Married | Unmarried |
| Less than High School | 0 (0.0%) | 33 (100.0%) |
| High School Diploma | 51 (19.4%) | 212 (80.6%) |
| College or Associate's Degree | 279 (66.6%) | 140 (33.4%) |
| Bachelor's Degree | 113 (100.0%) | 0 (0.0%) |
| Graduate Degree | 161 (81.3%) | 37 (18.7%) |
| Total | 604 (58.9%) | 422 (41.1%) |
Employment Characteristics in Jackson
Employment by Class of Employer in Jackson
Among the 29,134 employed individuals in Jackson, private company employees (19,605 | 67.3%), not-for-profit organizations (3,346 | 11.5%), and local government employees (2,011 | 6.9%) make up the most common classes of employment.
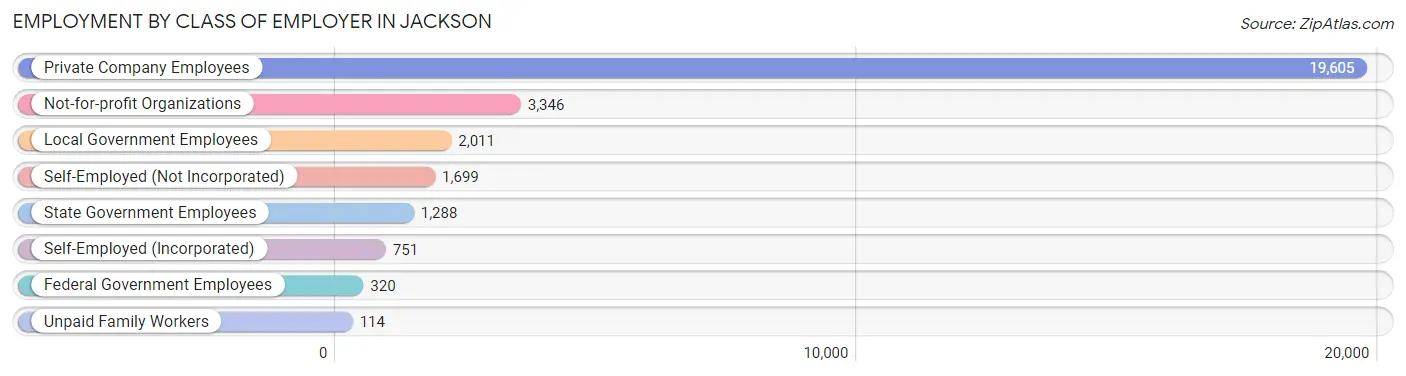
| Employer Class | # Employees | % Employees |
| Private Company Employees | 19,605 | 67.3% |
| Self-Employed (Incorporated) | 751 | 2.6% |
| Self-Employed (Not Incorporated) | 1,699 | 5.8% |
| Not-for-profit Organizations | 3,346 | 11.5% |
| Local Government Employees | 2,011 | 6.9% |
| State Government Employees | 1,288 | 4.4% |
| Federal Government Employees | 320 | 1.1% |
| Unpaid Family Workers | 114 | 0.4% |
| Total | 29,134 | 100.0% |
Employment Status by Age in Jackson
According to the labor force statistics for Jackson, out of the total population over 16 years of age (53,436), 61.3% or 32,756 individuals are in the labor force, with 9.0% or 2,948 of them unemployed. The age group with the highest labor force participation rate is 25 to 29 years, with 83.3% or 4,123 individuals in the labor force. Within the labor force, the 16 to 19 years age range has the highest percentage of unemployed individuals, with 15.4% or 375 of them being unemployed.
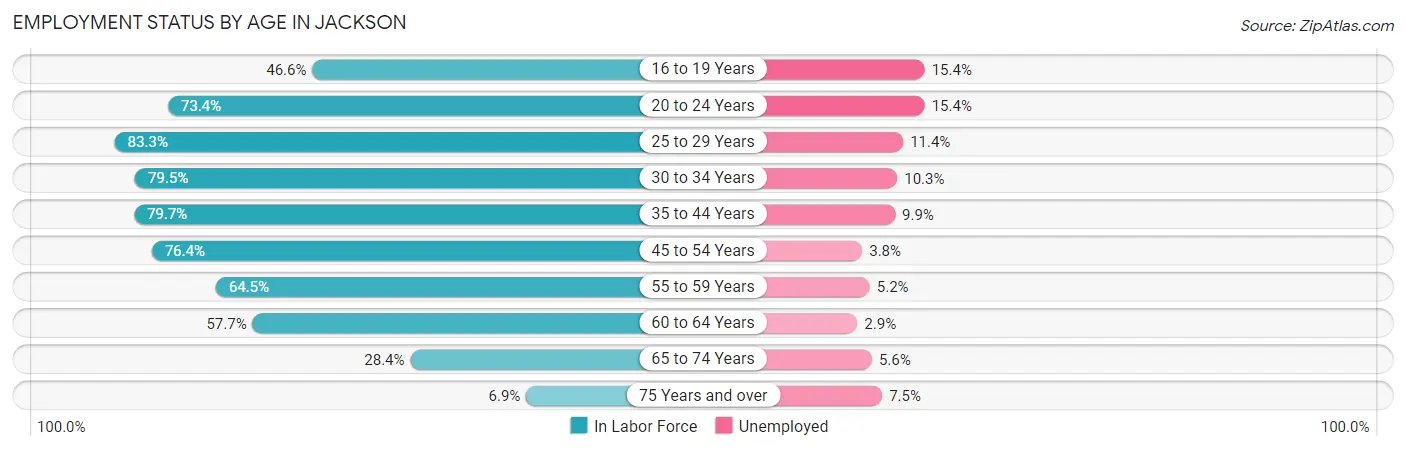
| Age Bracket | In Labor Force | Unemployed |
| 16 to 19 Years | 2,433 (46.6%) | 375 (15.4%) |
| 20 to 24 Years | 3,671 (73.4%) | 565 (15.4%) |
| 25 to 29 Years | 4,123 (83.3%) | 470 (11.4%) |
| 30 to 34 Years | 3,772 (79.5%) | 389 (10.3%) |
| 35 to 44 Years | 6,405 (79.7%) | 634 (9.9%) |
| 45 to 54 Years | 5,206 (76.4%) | 198 (3.8%) |
| 55 to 59 Years | 2,730 (64.5%) | 142 (5.2%) |
| 60 to 64 Years | 2,397 (57.7%) | 70 (2.9%) |
| 65 to 74 Years | 1,768 (28.4%) | 99 (5.6%) |
| 75 Years and over | 280 (6.9%) | 21 (7.5%) |
| Total | 32,756 (61.3%) | 2,948 (9.0%) |
Employment Status by Educational Attainment in Jackson
According to labor force statistics for Jackson, 74.8% of individuals (24,632) out of the total population between 25 and 64 years of age (32,931) are in the labor force, with 7.7% or 1,897 of them being unemployed. The group with the highest labor force participation rate are those with the educational attainment of bachelor's degree or higher, with 86.5% or 7,634 individuals in the labor force. Within the labor force, individuals with high school diploma education have the highest percentage of unemployment, with 10.1% or 809 of them being unemployed.
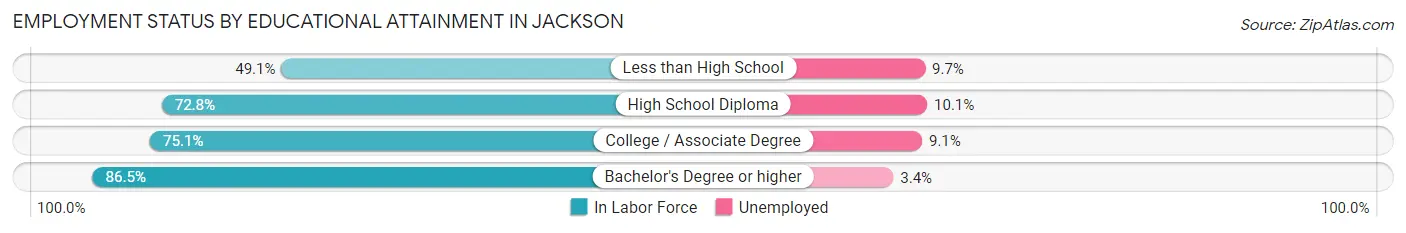
| Educational Attainment | In Labor Force | Unemployed |
| Less than High School | 1,609 (49.1%) | 318 (9.7%) |
| High School Diploma | 8,012 (72.8%) | 1,112 (10.1%) |
| College / Associate Degree | 7,377 (75.1%) | 894 (9.1%) |
| Bachelor's Degree or higher | 7,634 (86.5%) | 300 (3.4%) |
| Total | 24,632 (74.8%) | 2,536 (7.7%) |
Employment Occupations by Sex in Jackson
Management, Business, Science and Arts Occupations
The most common Management, Business, Science and Arts occupations in Jackson are Community & Social Service (3,609 | 12.1%), Management (2,857 | 9.6%), Health Diagnosing & Treating (2,039 | 6.9%), Education Instruction & Library (1,887 | 6.3%), and Health Technologists (1,608 | 5.4%).
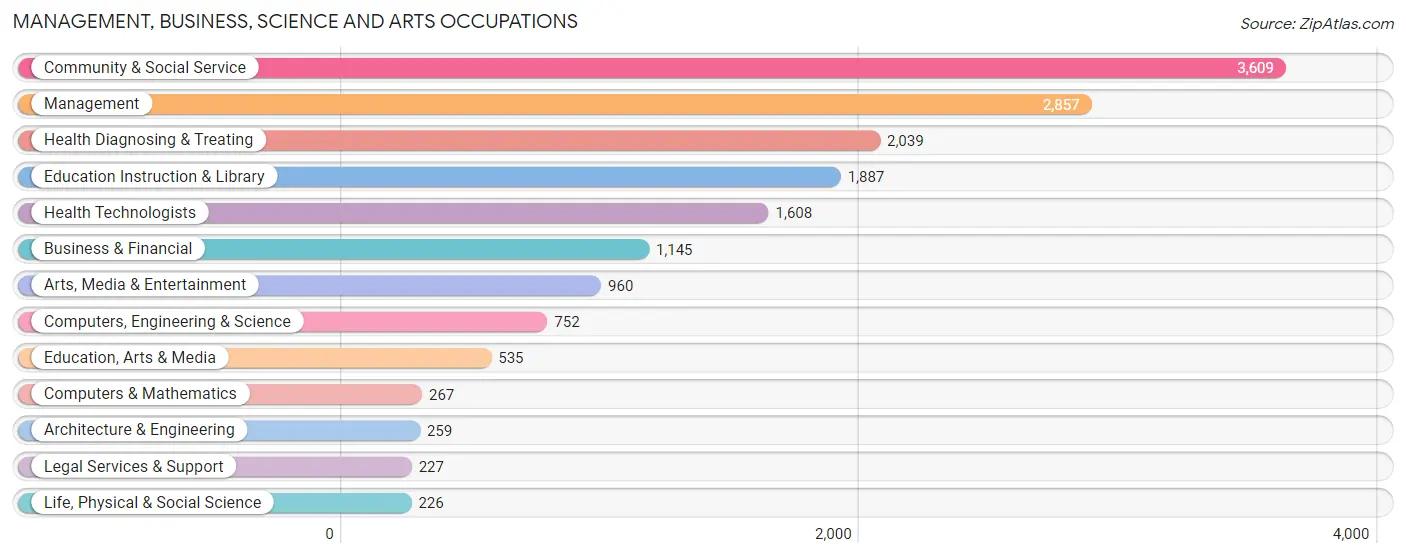
Management, Business, Science and Arts Occupations by Sex
Within the Management, Business, Science and Arts occupations in Jackson, the most male-oriented occupations are Computers & Mathematics (89.9%), Legal Services & Support (72.7%), and Computers, Engineering & Science (72.1%), while the most female-oriented occupations are Education Instruction & Library (67.6%), Health Diagnosing & Treating (64.0%), and Health Technologists (63.0%).
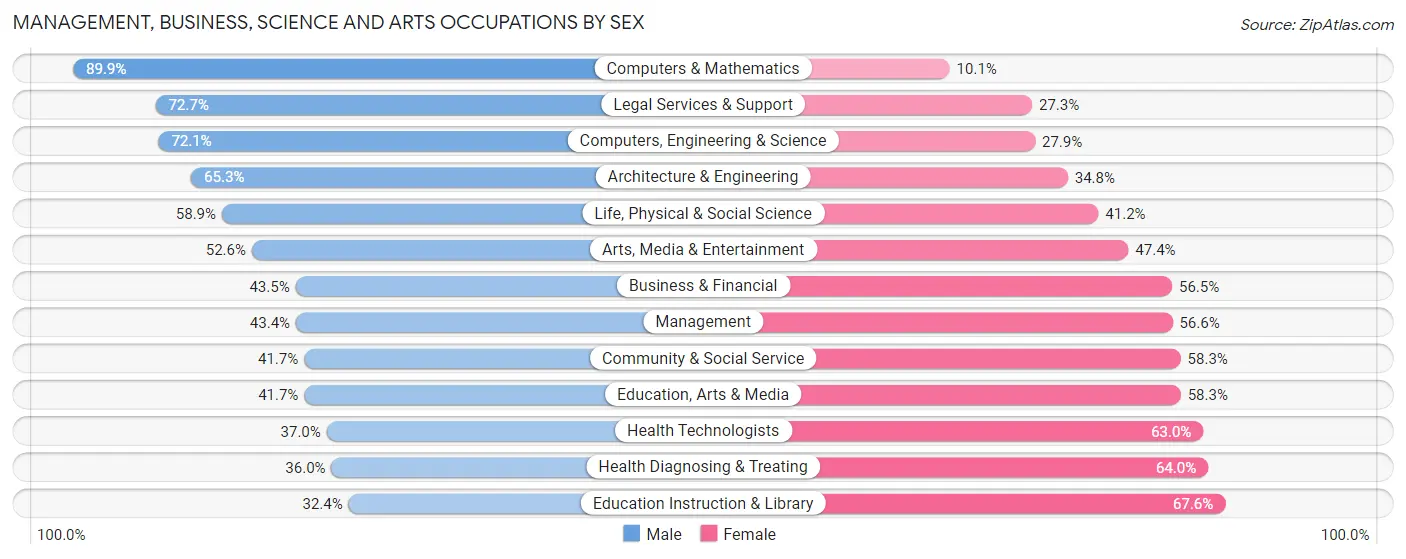
| Occupation | Male | Female |
| Management | 1,240 (43.4%) | 1,617 (56.6%) |
| Business & Financial | 498 (43.5%) | 647 (56.5%) |
| Computers, Engineering & Science | 542 (72.1%) | 210 (27.9%) |
| Computers & Mathematics | 240 (89.9%) | 27 (10.1%) |
| Architecture & Engineering | 169 (65.2%) | 90 (34.7%) |
| Life, Physical & Social Science | 133 (58.9%) | 93 (41.1%) |
| Community & Social Service | 1,505 (41.7%) | 2,104 (58.3%) |
| Education, Arts & Media | 223 (41.7%) | 312 (58.3%) |
| Legal Services & Support | 165 (72.7%) | 62 (27.3%) |
| Education Instruction & Library | 612 (32.4%) | 1,275 (67.6%) |
| Arts, Media & Entertainment | 505 (52.6%) | 455 (47.4%) |
| Health Diagnosing & Treating | 734 (36.0%) | 1,305 (64.0%) |
| Health Technologists | 595 (37.0%) | 1,013 (63.0%) |
| Total (Category) | 4,519 (43.4%) | 5,883 (56.6%) |
| Total (Overall) | 14,564 (48.9%) | 15,196 (51.1%) |
Services Occupations
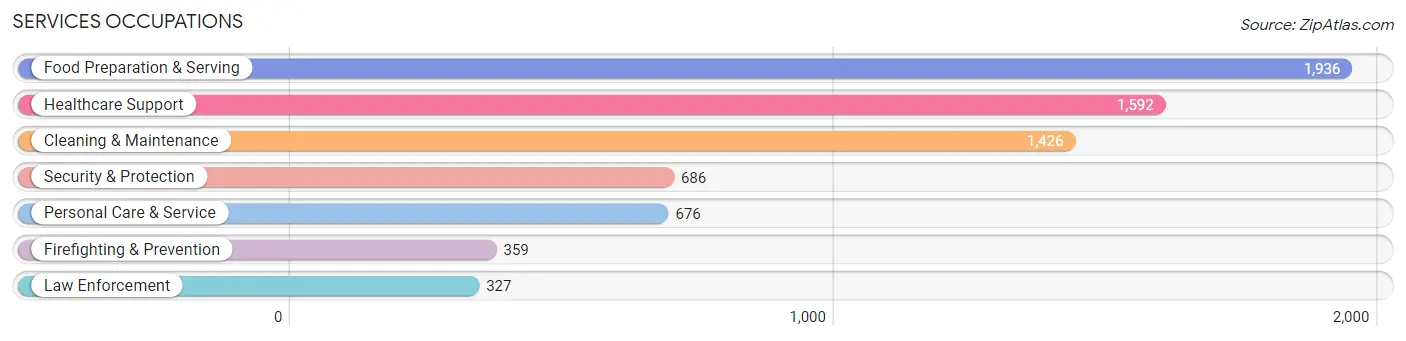
The most common Services occupations in Jackson are Food Preparation & Serving (1,936 | 6.5%), Healthcare Support (1,592 | 5.3%), Cleaning & Maintenance (1,426 | 4.8%), Security & Protection (686 | 2.3%), and Personal Care & Service (676 | 2.3%).
Services Occupations by Sex
Within the Services occupations in Jackson, the most male-oriented occupations are Firefighting & Prevention (74.1%), Security & Protection (69.2%), and Law Enforcement (63.9%), while the most female-oriented occupations are Healthcare Support (84.6%), Personal Care & Service (76.6%), and Cleaning & Maintenance (53.0%).
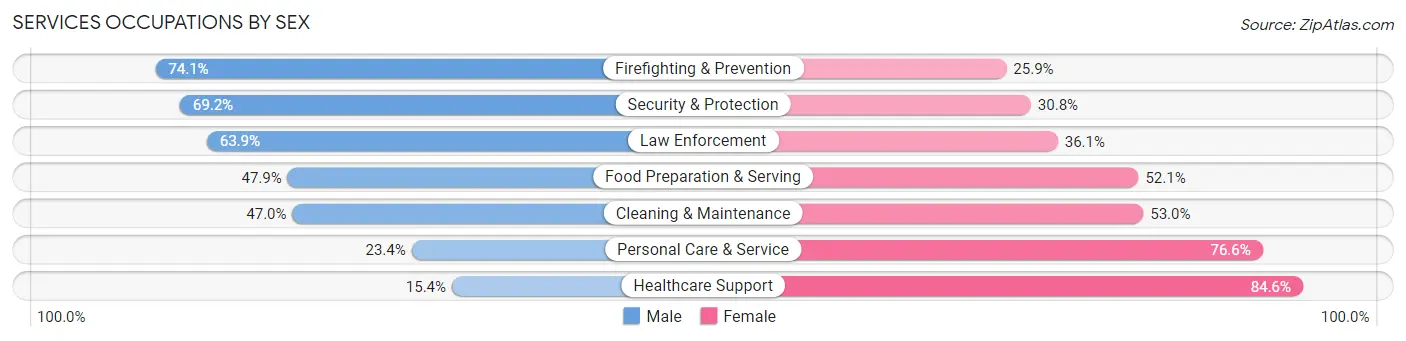
| Occupation | Male | Female |
| Healthcare Support | 245 (15.4%) | 1,347 (84.6%) |
| Security & Protection | 475 (69.2%) | 211 (30.8%) |
| Firefighting & Prevention | 266 (74.1%) | 93 (25.9%) |
| Law Enforcement | 209 (63.9%) | 118 (36.1%) |
| Food Preparation & Serving | 928 (47.9%) | 1,008 (52.1%) |
| Cleaning & Maintenance | 670 (47.0%) | 756 (53.0%) |
| Personal Care & Service | 158 (23.4%) | 518 (76.6%) |
| Total (Category) | 2,476 (39.2%) | 3,840 (60.8%) |
| Total (Overall) | 14,564 (48.9%) | 15,196 (51.1%) |
Sales and Office Occupations
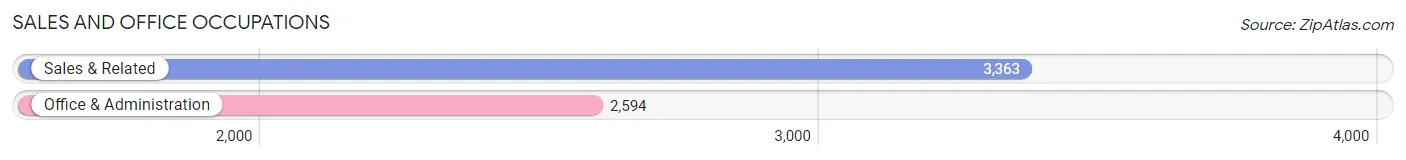
The most common Sales and Office occupations in Jackson are Sales & Related (3,363 | 11.3%), and Office & Administration (2,594 | 8.7%).
Sales and Office Occupations by Sex
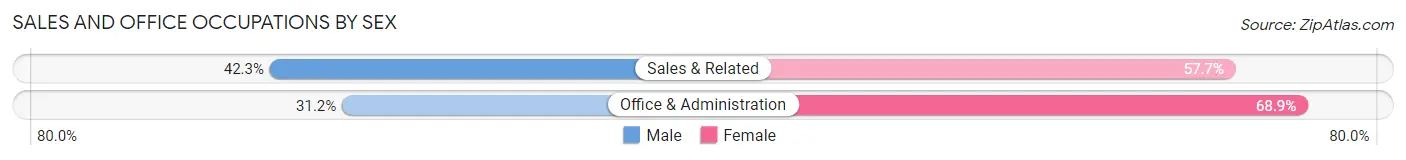
| Occupation | Male | Female |
| Sales & Related | 1,422 (42.3%) | 1,941 (57.7%) |
| Office & Administration | 808 (31.1%) | 1,786 (68.9%) |
| Total (Category) | 2,230 (37.4%) | 3,727 (62.6%) |
| Total (Overall) | 14,564 (48.9%) | 15,196 (51.1%) |
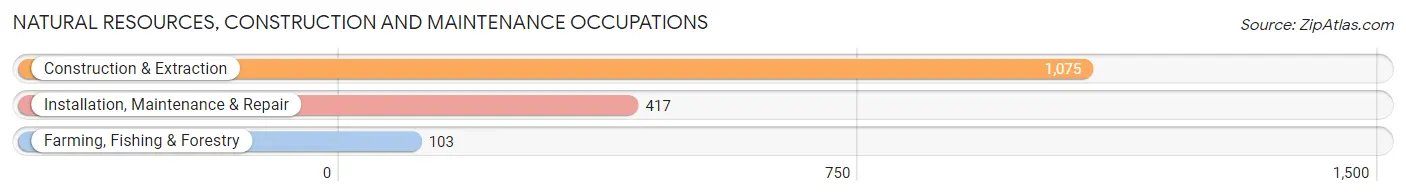
Natural Resources, Construction and Maintenance Occupations
The most common Natural Resources, Construction and Maintenance occupations in Jackson are Construction & Extraction (1,075 | 3.6%), Installation, Maintenance & Repair (417 | 1.4%), and Farming, Fishing & Forestry (103 | 0.4%).
Natural Resources, Construction and Maintenance Occupations by Sex
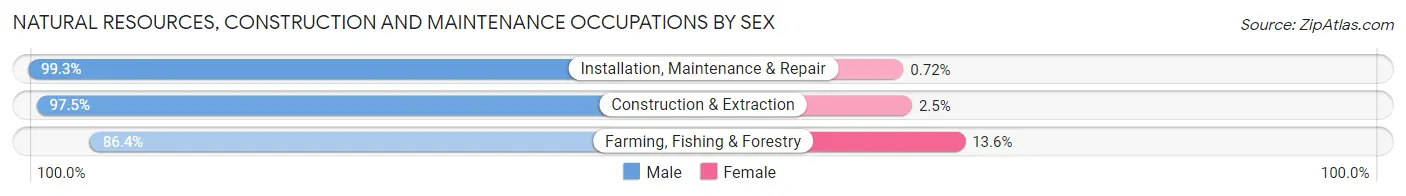
| Occupation | Male | Female |
| Farming, Fishing & Forestry | 89 (86.4%) | 14 (13.6%) |
| Construction & Extraction | 1,048 (97.5%) | 27 (2.5%) |
| Installation, Maintenance & Repair | 414 (99.3%) | 3 (0.7%) |
| Total (Category) | 1,551 (97.2%) | 44 (2.8%) |
| Total (Overall) | 14,564 (48.9%) | 15,196 (51.1%) |
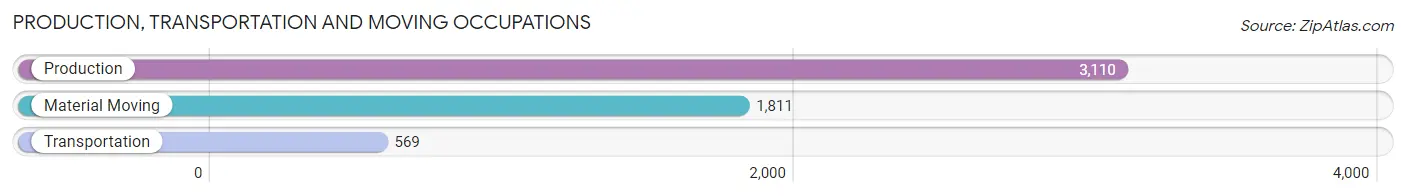
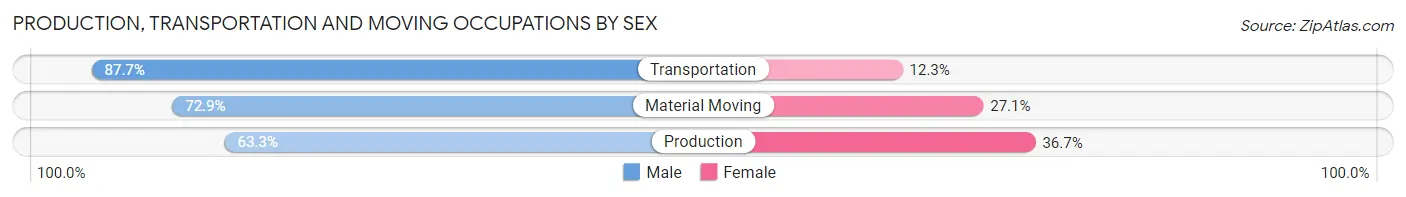
Production, Transportation and Moving Occupations
The most common Production, Transportation and Moving occupations in Jackson are Production (3,110 | 10.4%), Material Moving (1,811 | 6.1%), and Transportation (569 | 1.9%).
Production, Transportation and Moving Occupations by Sex
| Occupation | Male | Female |
| Production | 1,969 (63.3%) | 1,141 (36.7%) |
| Transportation | 499 (87.7%) | 70 (12.3%) |
| Material Moving | 1,320 (72.9%) | 491 (27.1%) |
| Total (Category) | 3,788 (69.0%) | 1,702 (31.0%) |
| Total (Overall) | 14,564 (48.9%) | 15,196 (51.1%) |
Employment Industries by Sex in Jackson
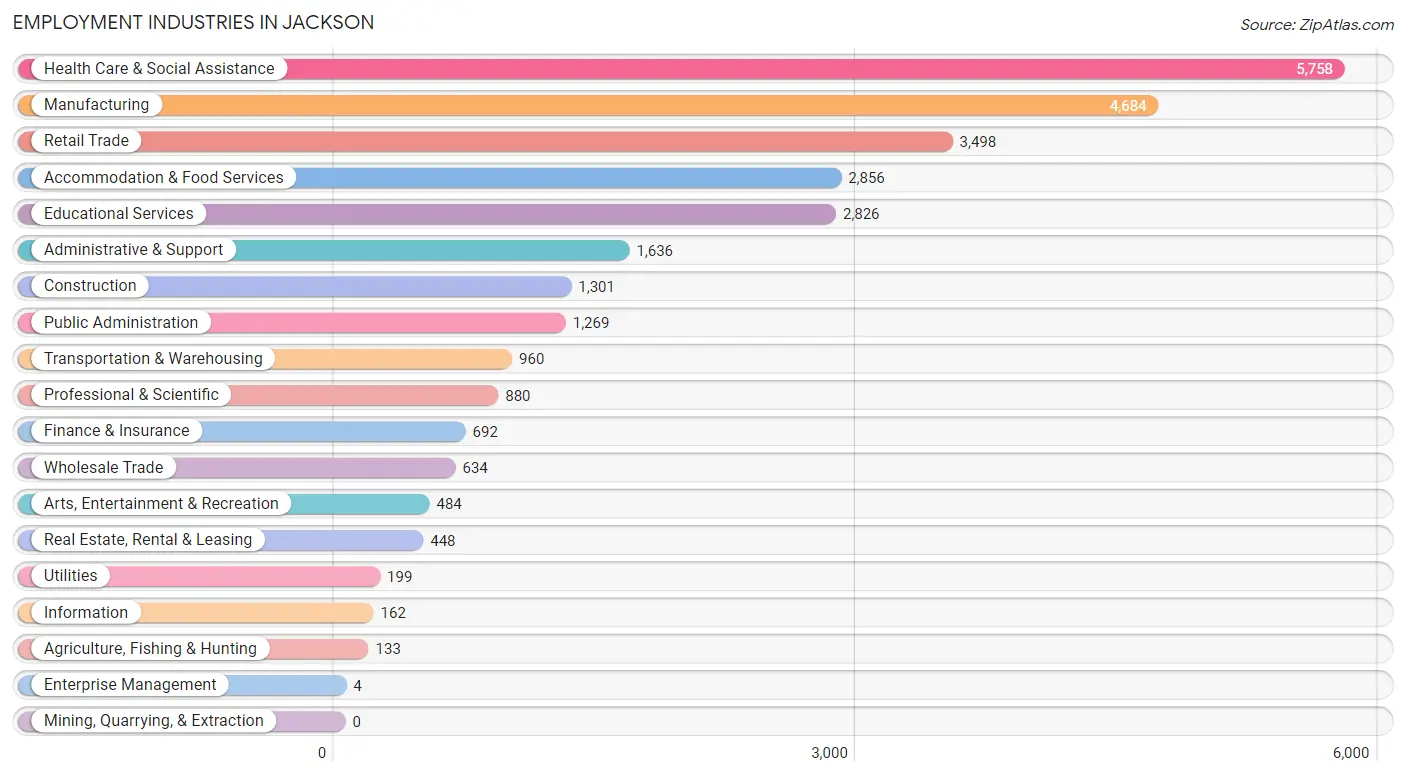
Employment Industries in Jackson
The major employment industries in Jackson include Health Care & Social Assistance (5,758 | 19.4%), Manufacturing (4,684 | 15.7%), Retail Trade (3,498 | 11.7%), Accommodation & Food Services (2,856 | 9.6%), and Educational Services (2,826 | 9.5%).
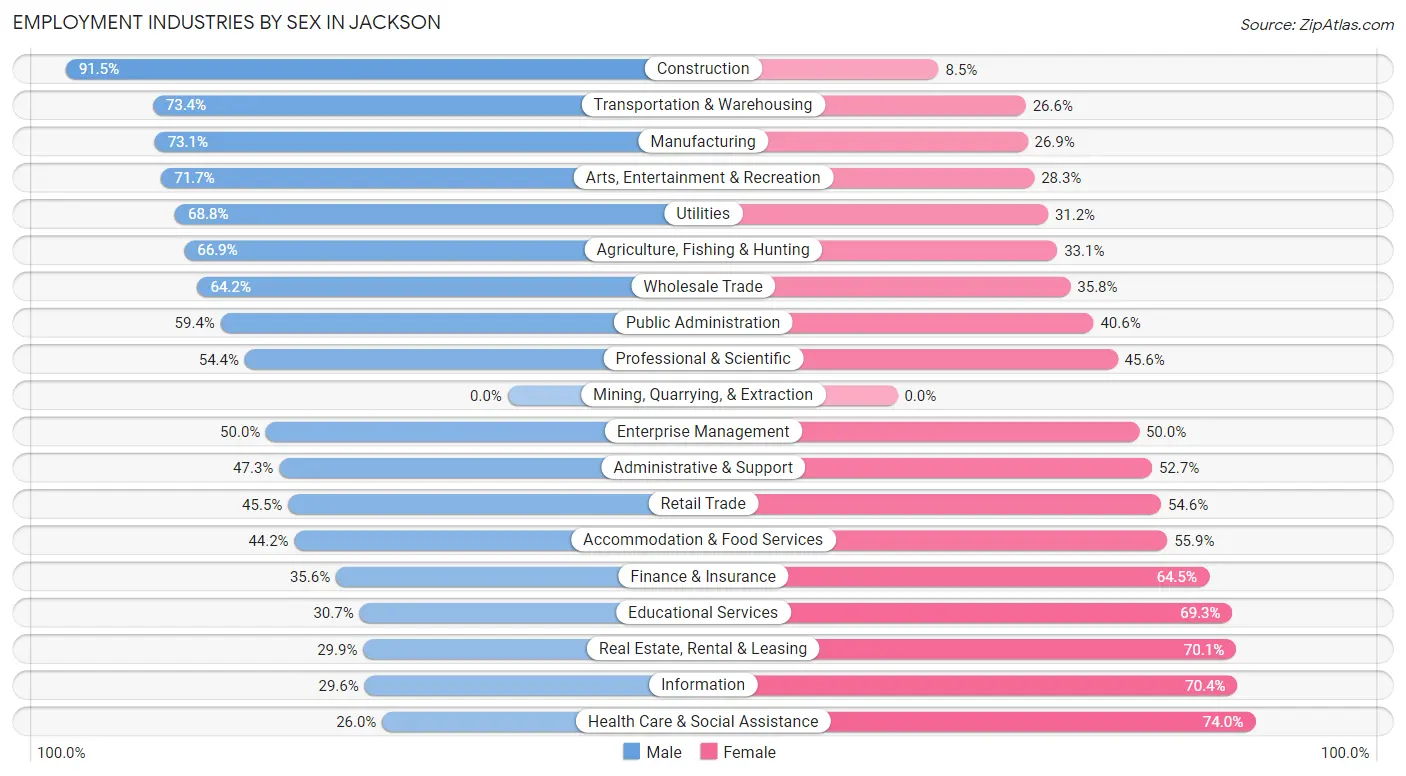
Employment Industries by Sex in Jackson
The Jackson industries that see more men than women are Construction (91.5%), Transportation & Warehousing (73.4%), and Manufacturing (73.1%), whereas the industries that tend to have a higher number of women are Health Care & Social Assistance (74.0%), Information (70.4%), and Real Estate, Rental & Leasing (70.1%).
| Industry | Male | Female |
| Agriculture, Fishing & Hunting | 89 (66.9%) | 44 (33.1%) |
| Mining, Quarrying, & Extraction | 0 (0.0%) | 0 (0.0%) |
| Construction | 1,190 (91.5%) | 111 (8.5%) |
| Manufacturing | 3,422 (73.1%) | 1,262 (26.9%) |
| Wholesale Trade | 407 (64.2%) | 227 (35.8%) |
| Retail Trade | 1,590 (45.5%) | 1,908 (54.5%) |
| Transportation & Warehousing | 705 (73.4%) | 255 (26.6%) |
| Utilities | 137 (68.8%) | 62 (31.2%) |
| Information | 48 (29.6%) | 114 (70.4%) |
| Finance & Insurance | 246 (35.5%) | 446 (64.4%) |
| Real Estate, Rental & Leasing | 134 (29.9%) | 314 (70.1%) |
| Professional & Scientific | 479 (54.4%) | 401 (45.6%) |
| Enterprise Management | 2 (50.0%) | 2 (50.0%) |
| Administrative & Support | 774 (47.3%) | 862 (52.7%) |
| Educational Services | 867 (30.7%) | 1,959 (69.3%) |
| Health Care & Social Assistance | 1,496 (26.0%) | 4,262 (74.0%) |
| Arts, Entertainment & Recreation | 347 (71.7%) | 137 (28.3%) |
| Accommodation & Food Services | 1,261 (44.2%) | 1,595 (55.8%) |
| Public Administration | 754 (59.4%) | 515 (40.6%) |
| Total | 14,564 (48.9%) | 15,196 (51.1%) |
Education in Jackson
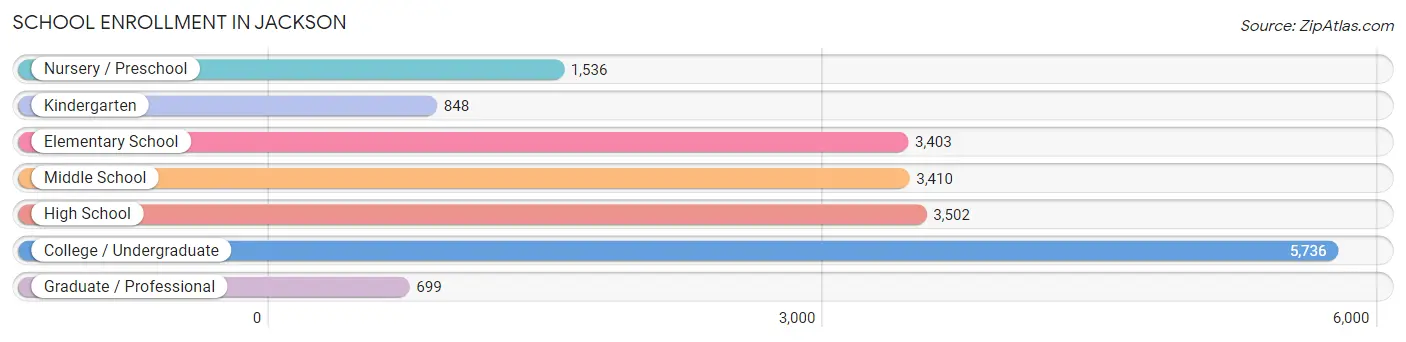
School Enrollment in Jackson
The most common levels of schooling among the 19,134 students in Jackson are college / undergraduate (5,736 | 30.0%), high school (3,502 | 18.3%), and middle school (3,410 | 17.8%).
| School Level | # Students | % Students |
| Nursery / Preschool | 1,536 | 8.0% |
| Kindergarten | 848 | 4.4% |
| Elementary School | 3,403 | 17.8% |
| Middle School | 3,410 | 17.8% |
| High School | 3,502 | 18.3% |
| College / Undergraduate | 5,736 | 30.0% |
| Graduate / Professional | 699 | 3.6% |
| Total | 19,134 | 100.0% |
School Enrollment by Age by Funding Source in Jackson
Out of a total of 19,134 students who are enrolled in schools in Jackson, 5,472 (28.6%) attend a private institution, while the remaining 13,662 (71.4%) are enrolled in public schools. The age group of 20 to 24 year olds has the highest likelihood of being enrolled in private schools, with 1,435 (58.6% in the age bracket) enrolled. Conversely, the age group of 25 to 34 year olds has the lowest likelihood of being enrolled in a private school, with 1,047 (89.4% in the age bracket) attending a public institution.
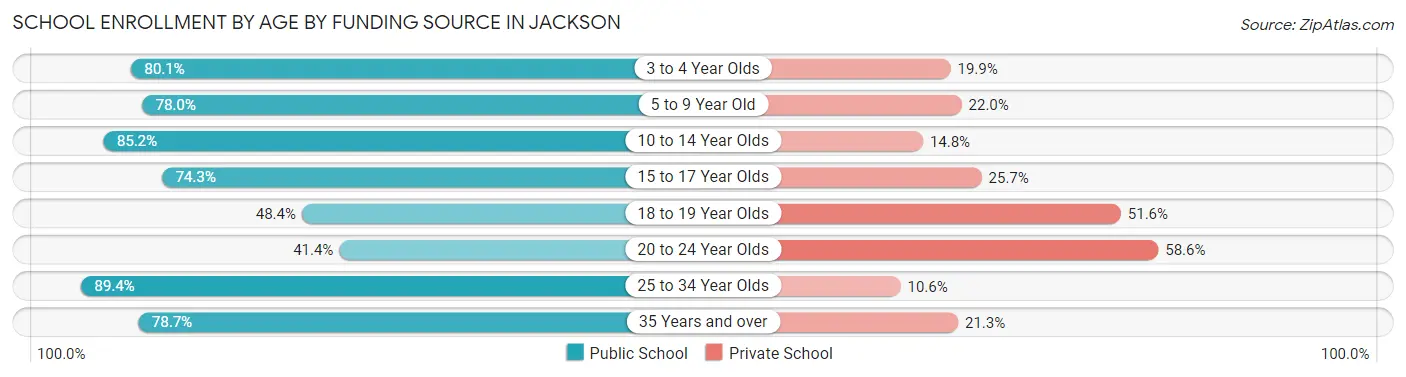
| Age Bracket | Public School | Private School |
| 3 to 4 Year Olds | 648 (80.1%) | 161 (19.9%) |
| 5 to 9 Year Old | 3,382 (78.0%) | 952 (22.0%) |
| 10 to 14 Year Olds | 3,711 (85.2%) | 643 (14.8%) |
| 15 to 17 Year Olds | 2,077 (74.3%) | 718 (25.7%) |
| 18 to 19 Year Olds | 1,186 (48.4%) | 1,266 (51.6%) |
| 20 to 24 Year Olds | 1,014 (41.4%) | 1,435 (58.6%) |
| 25 to 34 Year Olds | 1,047 (89.4%) | 124 (10.6%) |
| 35 Years and over | 606 (78.7%) | 164 (21.3%) |
| Total | 13,662 (71.4%) | 5,472 (28.6%) |
Educational Attainment by Field of Study in Jackson
Business (2,636 | 21.2%), education (1,687 | 13.6%), science & technology (1,281 | 10.3%), arts & humanities (936 | 7.5%), and bio, nature & agricultural (888 | 7.1%) are the most common fields of study among 12,418 individuals in Jackson who have obtained a bachelor's degree or higher.
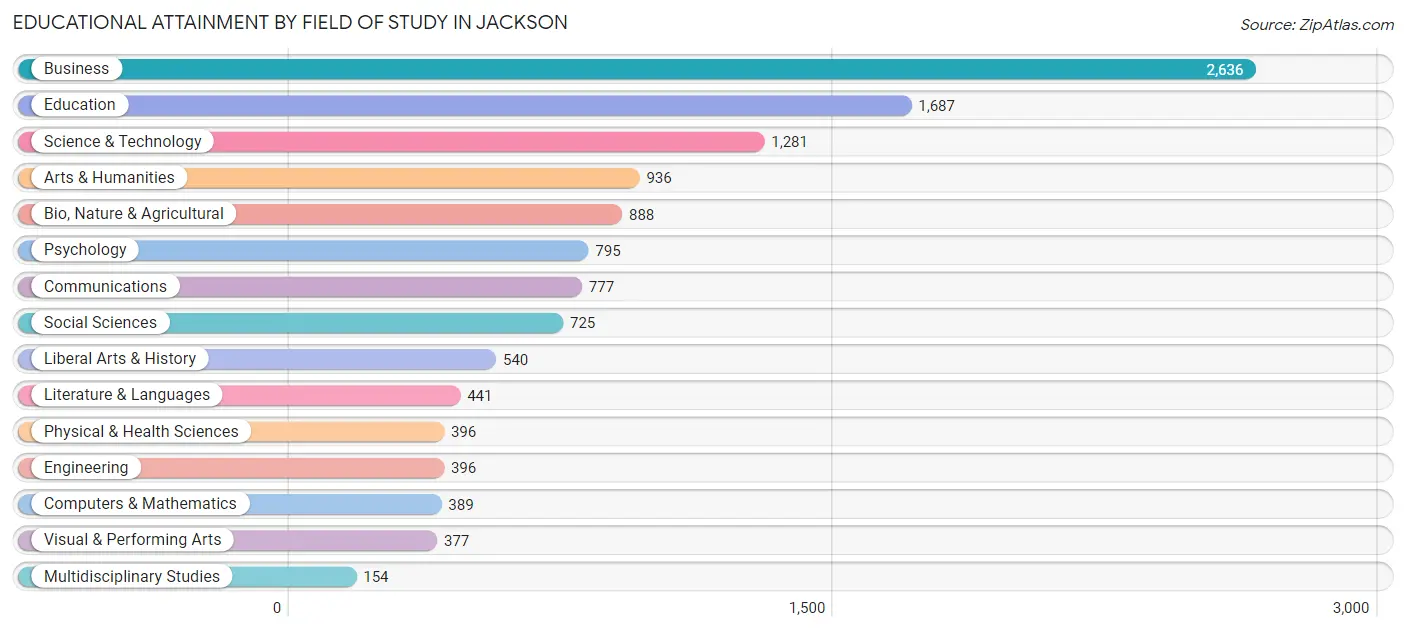
| Field of Study | # Graduates | % Graduates |
| Computers & Mathematics | 389 | 3.1% |
| Bio, Nature & Agricultural | 888 | 7.1% |
| Physical & Health Sciences | 396 | 3.2% |
| Psychology | 795 | 6.4% |
| Social Sciences | 725 | 5.8% |
| Engineering | 396 | 3.2% |
| Multidisciplinary Studies | 154 | 1.2% |
| Science & Technology | 1,281 | 10.3% |
| Business | 2,636 | 21.2% |
| Education | 1,687 | 13.6% |
| Literature & Languages | 441 | 3.5% |
| Liberal Arts & History | 540 | 4.3% |
| Visual & Performing Arts | 377 | 3.0% |
| Communications | 777 | 6.3% |
| Arts & Humanities | 936 | 7.5% |
| Total | 12,418 | 100.0% |
Transportation & Commute in Jackson
Vehicle Availability by Sex in Jackson
The most prevalent vehicle ownership categories in Jackson are males with 2 vehicles (5,630, accounting for 40.6%) and females with 2 vehicles (5,491, making up 39.0%).
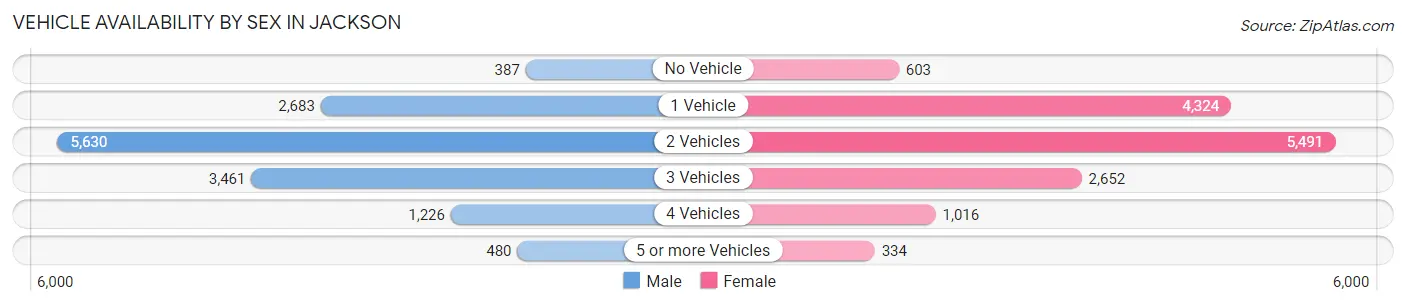
| Vehicles Available | Male | Female |
| No Vehicle | 387 (2.8%) | 603 (4.2%) |
| 1 Vehicle | 2,683 (19.4%) | 4,324 (30.0%) |
| 2 Vehicles | 5,630 (40.6%) | 5,491 (38.1%) |
| 3 Vehicles | 3,461 (25.0%) | 2,652 (18.4%) |
| 4 Vehicles | 1,226 (8.8%) | 1,016 (7.0%) |
| 5 or more Vehicles | 480 (3.5%) | 334 (2.3%) |
| Total | 13,867 (100.0%) | 14,420 (100.0%) |
Commute Time in Jackson
The most frequently occuring commute durations in Jackson are 15 to 19 minutes (7,296 commuters, 27.1%), 10 to 14 minutes (6,439 commuters, 23.9%), and 5 to 9 minutes (4,989 commuters, 18.5%).
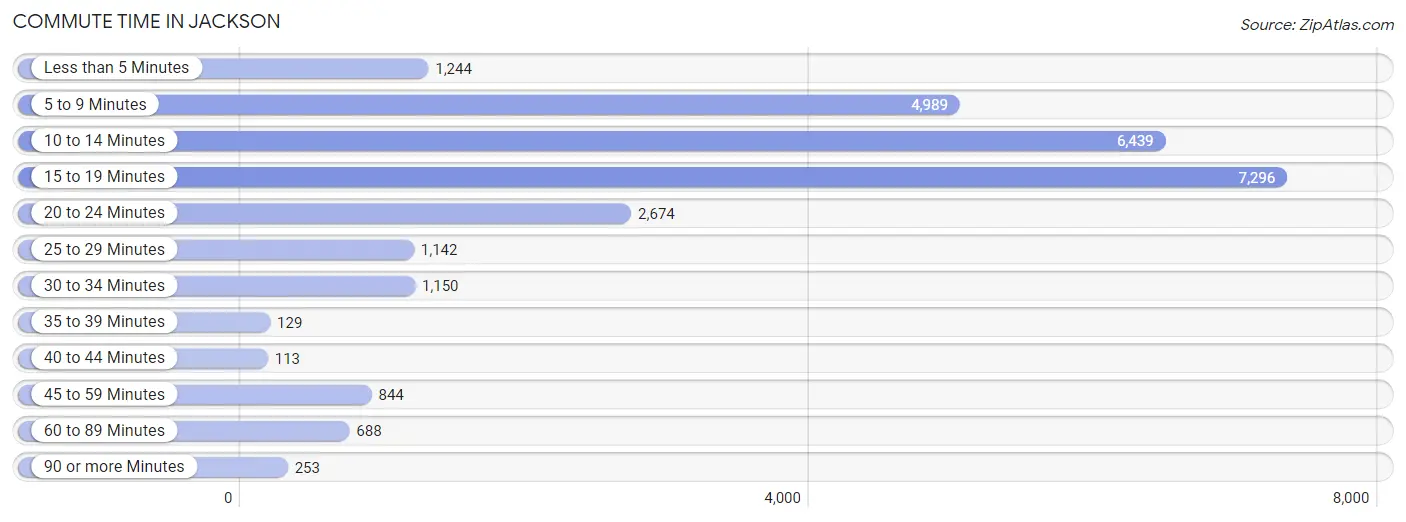
| Commute Time | # Commuters | % Commuters |
| Less than 5 Minutes | 1,244 | 4.6% |
| 5 to 9 Minutes | 4,989 | 18.5% |
| 10 to 14 Minutes | 6,439 | 23.9% |
| 15 to 19 Minutes | 7,296 | 27.1% |
| 20 to 24 Minutes | 2,674 | 9.9% |
| 25 to 29 Minutes | 1,142 | 4.2% |
| 30 to 34 Minutes | 1,150 | 4.3% |
| 35 to 39 Minutes | 129 | 0.5% |
| 40 to 44 Minutes | 113 | 0.4% |
| 45 to 59 Minutes | 844 | 3.1% |
| 60 to 89 Minutes | 688 | 2.5% |
| 90 or more Minutes | 253 | 0.9% |
Commute Time by Sex in Jackson
The most common commute times in Jackson are 10 to 14 minutes (3,325 commuters, 24.7%) for males and 15 to 19 minutes (4,251 commuters, 31.5%) for females.
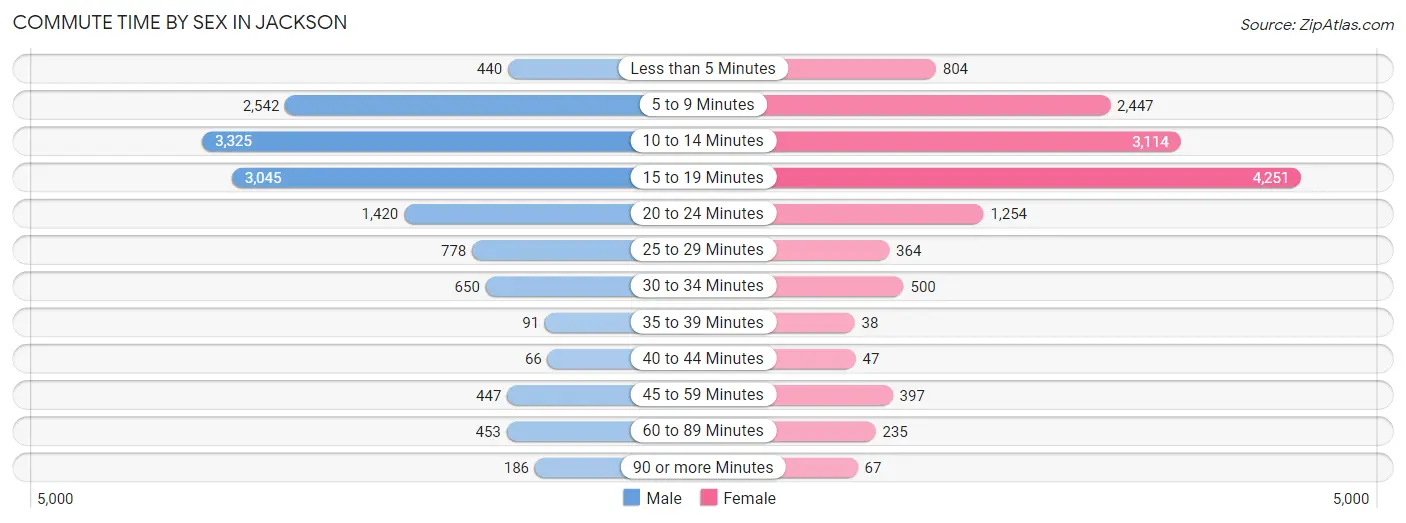
| Commute Time | Male | Female |
| Less than 5 Minutes | 440 (3.3%) | 804 (5.9%) |
| 5 to 9 Minutes | 2,542 (18.9%) | 2,447 (18.1%) |
| 10 to 14 Minutes | 3,325 (24.7%) | 3,114 (23.0%) |
| 15 to 19 Minutes | 3,045 (22.7%) | 4,251 (31.5%) |
| 20 to 24 Minutes | 1,420 (10.6%) | 1,254 (9.3%) |
| 25 to 29 Minutes | 778 (5.8%) | 364 (2.7%) |
| 30 to 34 Minutes | 650 (4.8%) | 500 (3.7%) |
| 35 to 39 Minutes | 91 (0.7%) | 38 (0.3%) |
| 40 to 44 Minutes | 66 (0.5%) | 47 (0.4%) |
| 45 to 59 Minutes | 447 (3.3%) | 397 (2.9%) |
| 60 to 89 Minutes | 453 (3.4%) | 235 (1.7%) |
| 90 or more Minutes | 186 (1.4%) | 67 (0.5%) |
Time of Departure to Work by Sex in Jackson
The most frequent times of departure to work in Jackson are 7:30 AM to 7:59 AM (2,038, 15.2%) for males and 7:30 AM to 7:59 AM (2,389, 17.7%) for females.
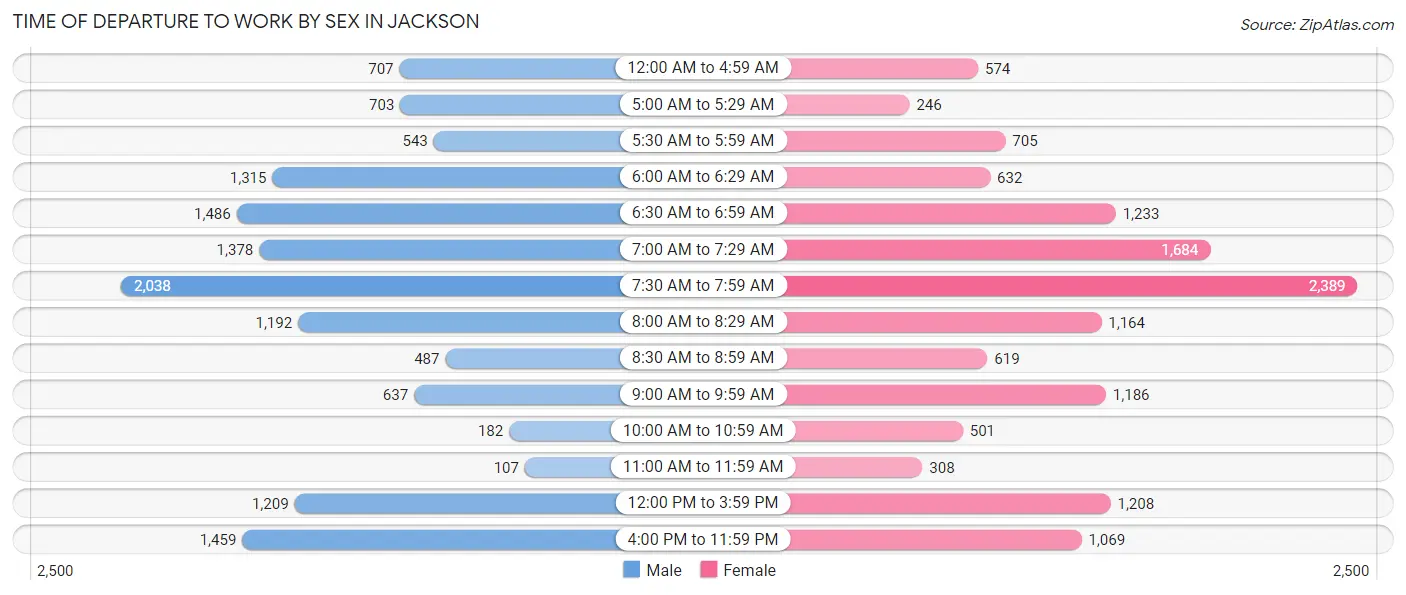
| Time of Departure | Male | Female |
| 12:00 AM to 4:59 AM | 707 (5.3%) | 574 (4.3%) |
| 5:00 AM to 5:29 AM | 703 (5.2%) | 246 (1.8%) |
| 5:30 AM to 5:59 AM | 543 (4.0%) | 705 (5.2%) |
| 6:00 AM to 6:29 AM | 1,315 (9.8%) | 632 (4.7%) |
| 6:30 AM to 6:59 AM | 1,486 (11.1%) | 1,233 (9.1%) |
| 7:00 AM to 7:29 AM | 1,378 (10.2%) | 1,684 (12.5%) |
| 7:30 AM to 7:59 AM | 2,038 (15.2%) | 2,389 (17.7%) |
| 8:00 AM to 8:29 AM | 1,192 (8.9%) | 1,164 (8.6%) |
| 8:30 AM to 8:59 AM | 487 (3.6%) | 619 (4.6%) |
| 9:00 AM to 9:59 AM | 637 (4.7%) | 1,186 (8.8%) |
| 10:00 AM to 10:59 AM | 182 (1.3%) | 501 (3.7%) |
| 11:00 AM to 11:59 AM | 107 (0.8%) | 308 (2.3%) |
| 12:00 PM to 3:59 PM | 1,209 (9.0%) | 1,208 (8.9%) |
| 4:00 PM to 11:59 PM | 1,459 (10.8%) | 1,069 (7.9%) |
| Total | 13,443 (100.0%) | 13,518 (100.0%) |
Housing Occupancy in Jackson
Occupancy by Ownership in Jackson
Of the total 26,387 dwellings in Jackson, owner-occupied units account for 13,500 (51.2%), while renter-occupied units make up 12,887 (48.8%).
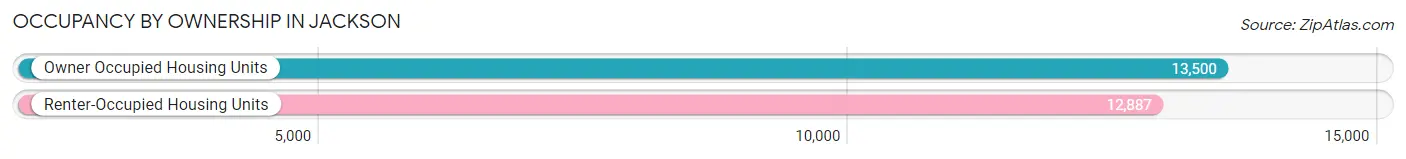
| Occupancy | # Housing Units | % Housing Units |
| Owner Occupied Housing Units | 13,500 | 51.2% |
| Renter-Occupied Housing Units | 12,887 | 48.8% |
| Total Occupied Housing Units | 26,387 | 100.0% |
Occupancy by Household Size in Jackson
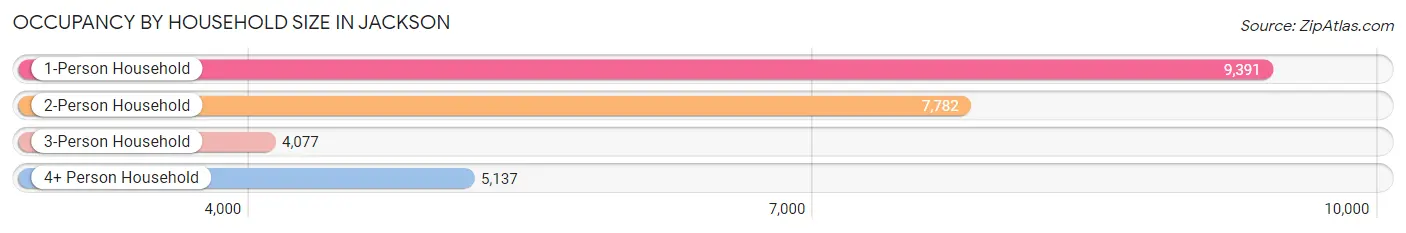
| Household Size | # Housing Units | % Housing Units |
| 1-Person Household | 9,391 | 35.6% |
| 2-Person Household | 7,782 | 29.5% |
| 3-Person Household | 4,077 | 15.4% |
| 4+ Person Household | 5,137 | 19.5% |
| Total Housing Units | 26,387 | 100.0% |
Occupancy by Ownership by Household Size in Jackson
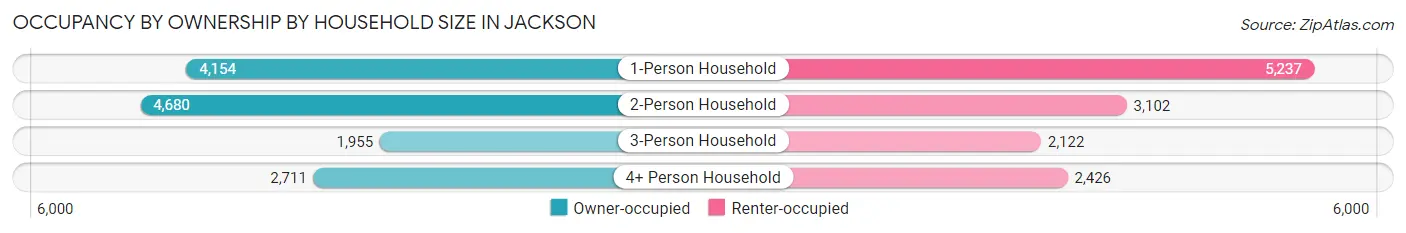
| Household Size | Owner-occupied | Renter-occupied |
| 1-Person Household | 4,154 (44.2%) | 5,237 (55.8%) |
| 2-Person Household | 4,680 (60.1%) | 3,102 (39.9%) |
| 3-Person Household | 1,955 (47.9%) | 2,122 (52.0%) |
| 4+ Person Household | 2,711 (52.8%) | 2,426 (47.2%) |
| Total Housing Units | 13,500 (51.2%) | 12,887 (48.8%) |
Occupancy by Educational Attainment in Jackson
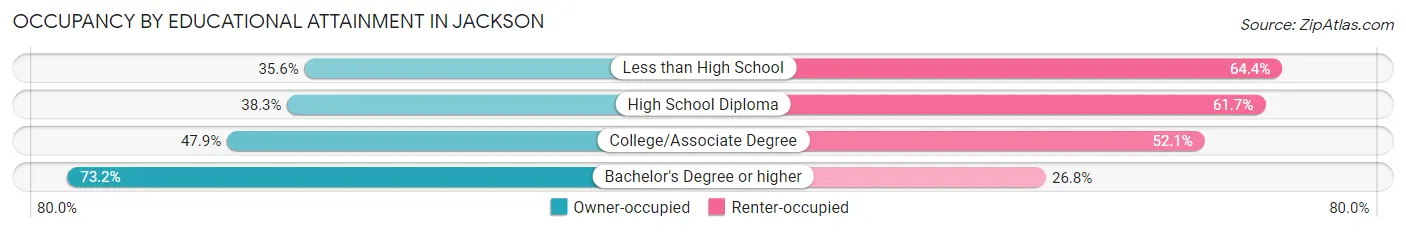
| Household Size | Owner-occupied | Renter-occupied |
| Less than High School | 1,039 (35.6%) | 1,879 (64.4%) |
| High School Diploma | 2,962 (38.3%) | 4,767 (61.7%) |
| College/Associate Degree | 3,832 (47.9%) | 4,168 (52.1%) |
| Bachelor's Degree or higher | 5,667 (73.2%) | 2,073 (26.8%) |
Occupancy by Age of Householder in Jackson
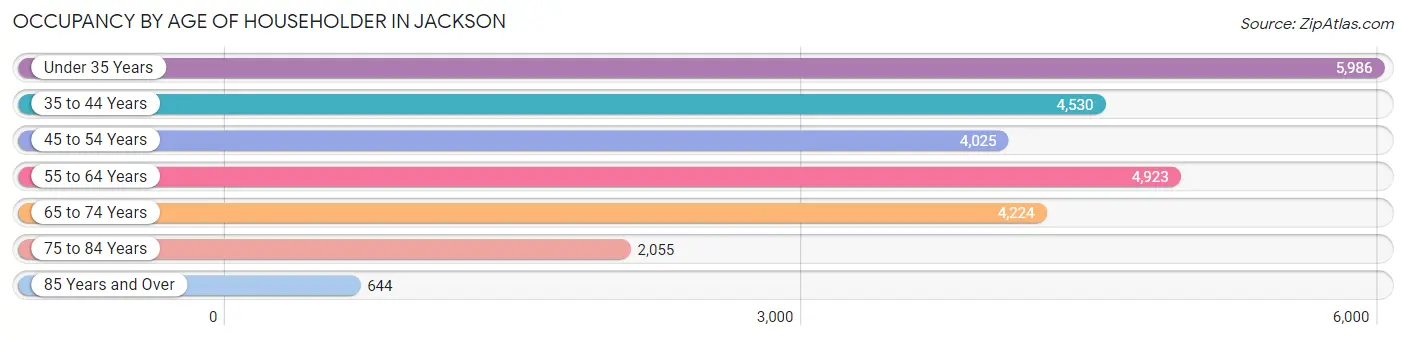
| Age Bracket | # Households | % Households |
| Under 35 Years | 5,986 | 22.7% |
| 35 to 44 Years | 4,530 | 17.2% |
| 45 to 54 Years | 4,025 | 15.2% |
| 55 to 64 Years | 4,923 | 18.7% |
| 65 to 74 Years | 4,224 | 16.0% |
| 75 to 84 Years | 2,055 | 7.8% |
| 85 Years and Over | 644 | 2.4% |
| Total | 26,387 | 100.0% |
Housing Finances in Jackson
Median Income by Occupancy in Jackson
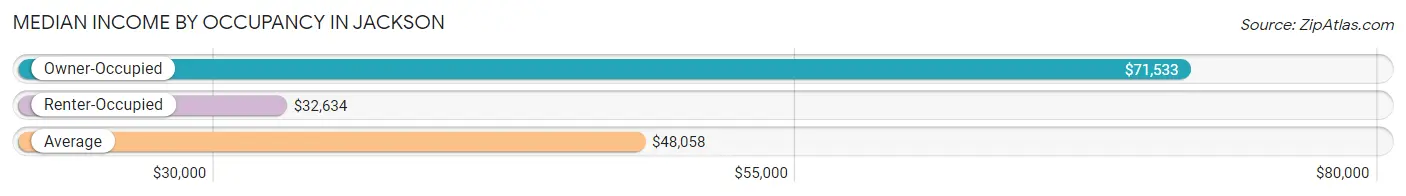
| Occupancy Type | # Households | Median Income |
| Owner-Occupied | 13,500 (51.2%) | $71,533 |
| Renter-Occupied | 12,887 (48.8%) | $32,634 |
| Average | 26,387 (100.0%) | $48,058 |
Occupancy by Householder Income Bracket in Jackson
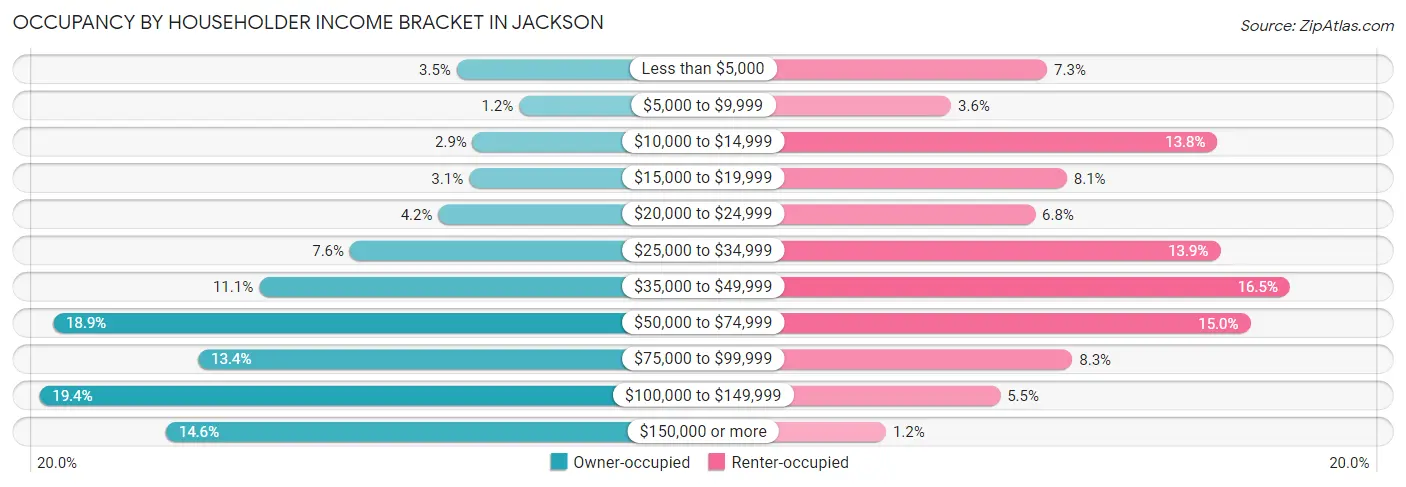
| Income Bracket | Owner-occupied | Renter-occupied |
| Less than $5,000 | 478 (3.5%) | 941 (7.3%) |
| $5,000 to $9,999 | 156 (1.2%) | 469 (3.6%) |
| $10,000 to $14,999 | 396 (2.9%) | 1,776 (13.8%) |
| $15,000 to $19,999 | 415 (3.1%) | 1,037 (8.1%) |
| $20,000 to $24,999 | 572 (4.2%) | 881 (6.8%) |
| $25,000 to $34,999 | 1,028 (7.6%) | 1,790 (13.9%) |
| $35,000 to $49,999 | 1,494 (11.1%) | 2,131 (16.5%) |
| $50,000 to $74,999 | 2,554 (18.9%) | 1,938 (15.0%) |
| $75,000 to $99,999 | 1,808 (13.4%) | 1,064 (8.3%) |
| $100,000 to $149,999 | 2,625 (19.4%) | 710 (5.5%) |
| $150,000 or more | 1,974 (14.6%) | 150 (1.2%) |
| Total | 13,500 (100.0%) | 12,887 (100.0%) |
Monthly Housing Cost Tiers in Jackson
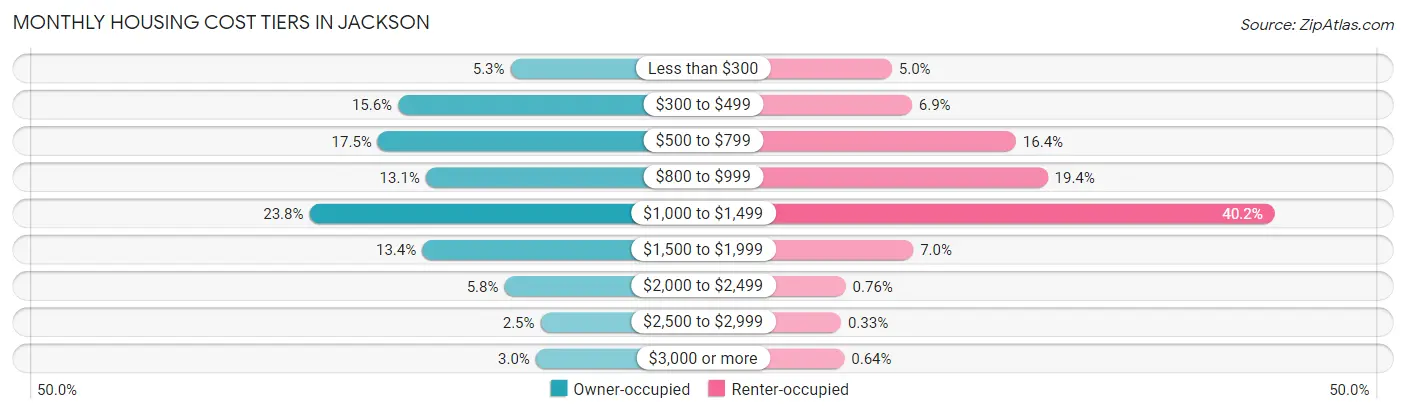
| Monthly Cost | Owner-occupied | Renter-occupied |
| Less than $300 | 713 (5.3%) | 645 (5.0%) |
| $300 to $499 | 2,110 (15.6%) | 883 (6.9%) |
| $500 to $799 | 2,362 (17.5%) | 2,117 (16.4%) |
| $800 to $999 | 1,766 (13.1%) | 2,493 (19.4%) |
| $1,000 to $1,499 | 3,212 (23.8%) | 5,186 (40.2%) |
| $1,500 to $1,999 | 1,811 (13.4%) | 899 (7.0%) |
| $2,000 to $2,499 | 788 (5.8%) | 98 (0.8%) |
| $2,500 to $2,999 | 340 (2.5%) | 42 (0.3%) |
| $3,000 or more | 398 (2.9%) | 83 (0.6%) |
| Total | 13,500 (100.0%) | 12,887 (100.0%) |
Physical Housing Characteristics in Jackson
Housing Structures in Jackson
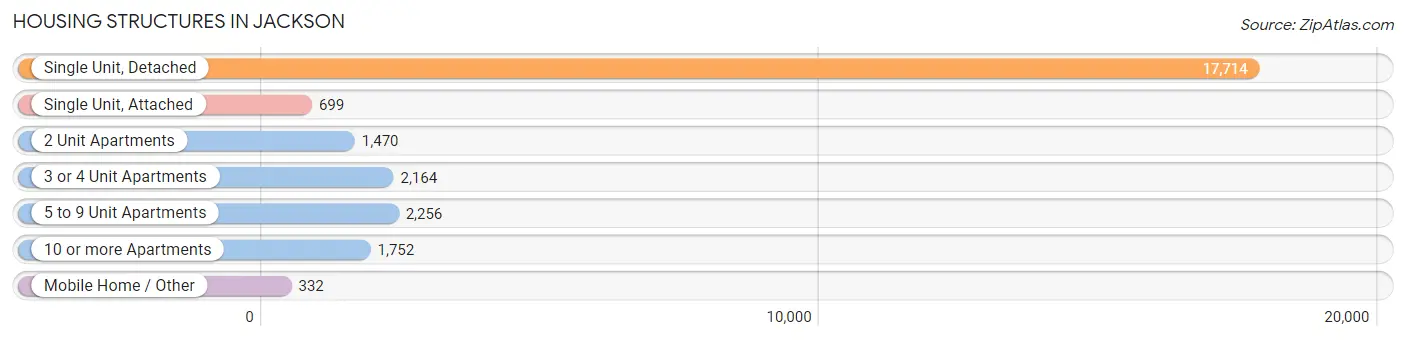
| Structure Type | # Housing Units | % Housing Units |
| Single Unit, Detached | 17,714 | 67.1% |
| Single Unit, Attached | 699 | 2.6% |
| 2 Unit Apartments | 1,470 | 5.6% |
| 3 or 4 Unit Apartments | 2,164 | 8.2% |
| 5 to 9 Unit Apartments | 2,256 | 8.6% |
| 10 or more Apartments | 1,752 | 6.6% |
| Mobile Home / Other | 332 | 1.3% |
| Total | 26,387 | 100.0% |
Housing Structures by Occupancy in Jackson
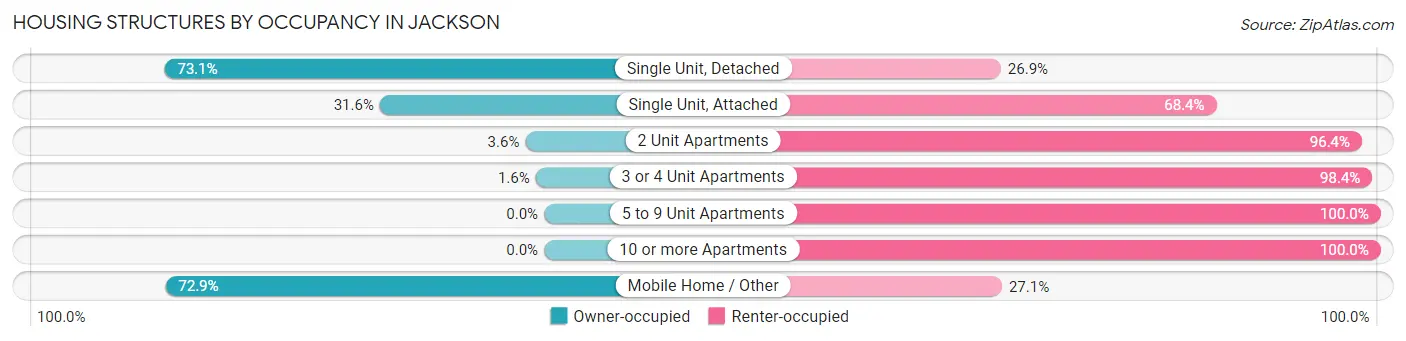
| Structure Type | Owner-occupied | Renter-occupied |
| Single Unit, Detached | 12,949 (73.1%) | 4,765 (26.9%) |
| Single Unit, Attached | 221 (31.6%) | 478 (68.4%) |
| 2 Unit Apartments | 53 (3.6%) | 1,417 (96.4%) |
| 3 or 4 Unit Apartments | 35 (1.6%) | 2,129 (98.4%) |
| 5 to 9 Unit Apartments | 0 (0.0%) | 2,256 (100.0%) |
| 10 or more Apartments | 0 (0.0%) | 1,752 (100.0%) |
| Mobile Home / Other | 242 (72.9%) | 90 (27.1%) |
| Total | 13,500 (51.2%) | 12,887 (48.8%) |
Housing Structures by Number of Rooms in Jackson
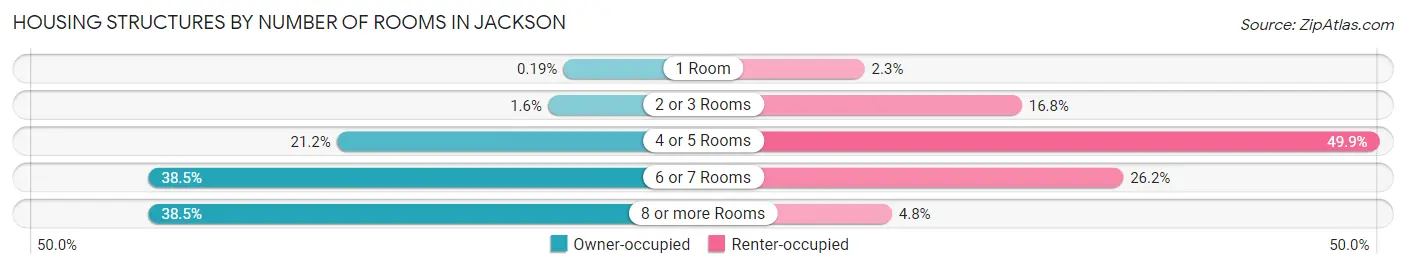
| Number of Rooms | Owner-occupied | Renter-occupied |
| 1 Room | 25 (0.2%) | 295 (2.3%) |
| 2 or 3 Rooms | 218 (1.6%) | 2,168 (16.8%) |
| 4 or 5 Rooms | 2,855 (21.1%) | 6,429 (49.9%) |
| 6 or 7 Rooms | 5,201 (38.5%) | 3,377 (26.2%) |
| 8 or more Rooms | 5,201 (38.5%) | 618 (4.8%) |
| Total | 13,500 (100.0%) | 12,887 (100.0%) |
Housing Structure by Heating Type in Jackson
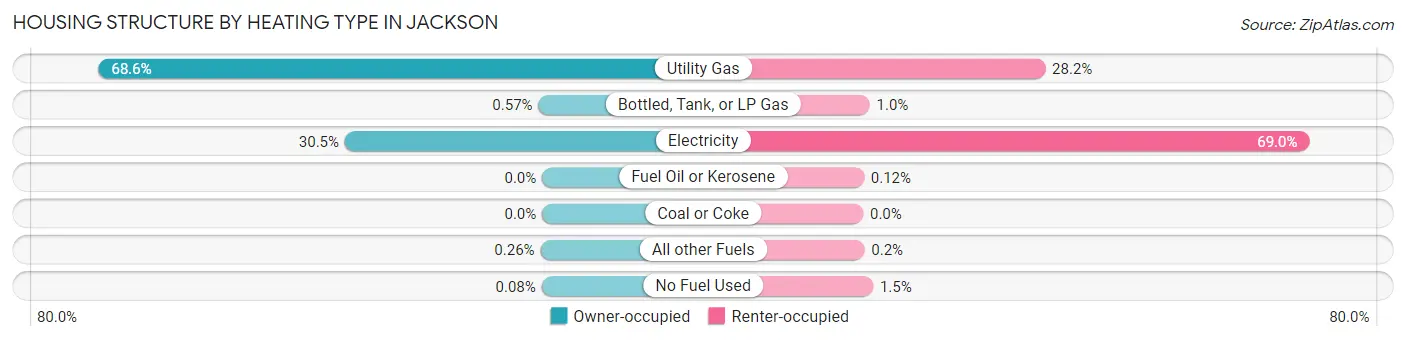
| Heating Type | Owner-occupied | Renter-occupied |
| Utility Gas | 9,261 (68.6%) | 3,628 (28.1%) |
| Bottled, Tank, or LP Gas | 77 (0.6%) | 130 (1.0%) |
| Electricity | 4,116 (30.5%) | 8,890 (69.0%) |
| Fuel Oil or Kerosene | 0 (0.0%) | 16 (0.1%) |
| Coal or Coke | 0 (0.0%) | 0 (0.0%) |
| All other Fuels | 35 (0.3%) | 26 (0.2%) |
| No Fuel Used | 11 (0.1%) | 197 (1.5%) |
| Total | 13,500 (100.0%) | 12,887 (100.0%) |
Household Vehicle Usage in Jackson
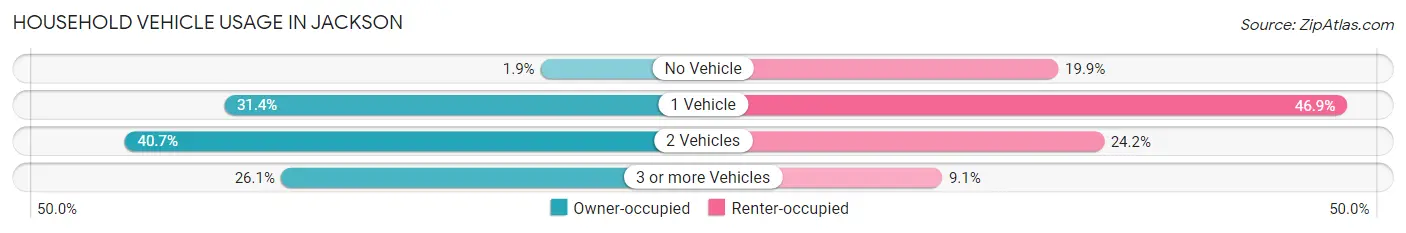
| Vehicles per Household | Owner-occupied | Renter-occupied |
| No Vehicle | 250 (1.8%) | 2,565 (19.9%) |
| 1 Vehicle | 4,237 (31.4%) | 6,040 (46.9%) |
| 2 Vehicles | 5,491 (40.7%) | 3,114 (24.2%) |
| 3 or more Vehicles | 3,522 (26.1%) | 1,168 (9.1%) |
| Total | 13,500 (100.0%) | 12,887 (100.0%) |
Real Estate & Mortgages in Jackson
Real Estate and Mortgage Overview in Jackson
| Characteristic | Without Mortgage | With Mortgage |
| Housing Units | 5,521 | 7,979 |
| Median Property Value | $142,100 | $183,000 |
| Median Household Income | $58,366 | $1,388 |
| Monthly Housing Costs | $500 | $388 |
| Real Estate Taxes | $1,213 | $228 |
Property Value by Mortgage Status in Jackson
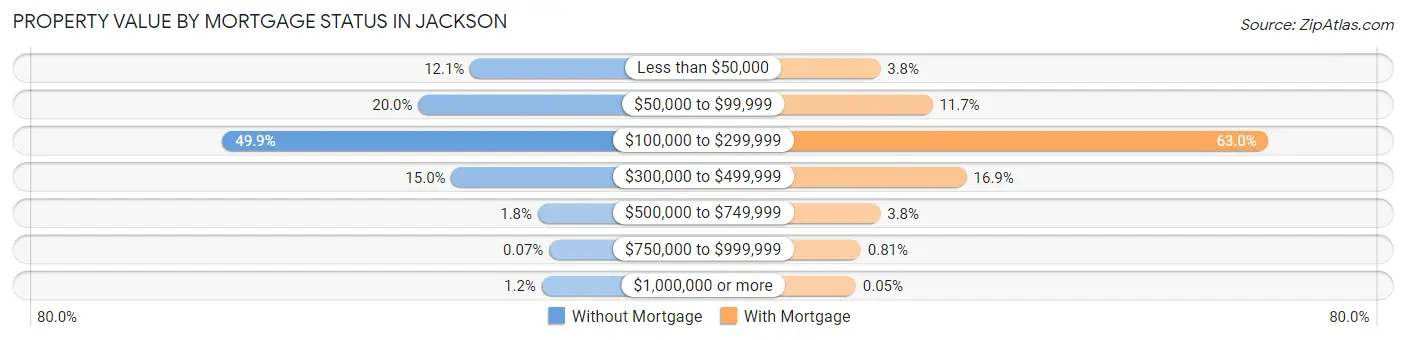
| Property Value | Without Mortgage | With Mortgage |
| Less than $50,000 | 668 (12.1%) | 301 (3.8%) |
| $50,000 to $99,999 | 1,104 (20.0%) | 935 (11.7%) |
| $100,000 to $299,999 | 2,753 (49.9%) | 5,023 (62.9%) |
| $300,000 to $499,999 | 826 (15.0%) | 1,350 (16.9%) |
| $500,000 to $749,999 | 99 (1.8%) | 301 (3.8%) |
| $750,000 to $999,999 | 4 (0.1%) | 65 (0.8%) |
| $1,000,000 or more | 67 (1.2%) | 4 (0.1%) |
| Total | 5,521 (100.0%) | 7,979 (100.0%) |
Household Income by Mortgage Status in Jackson
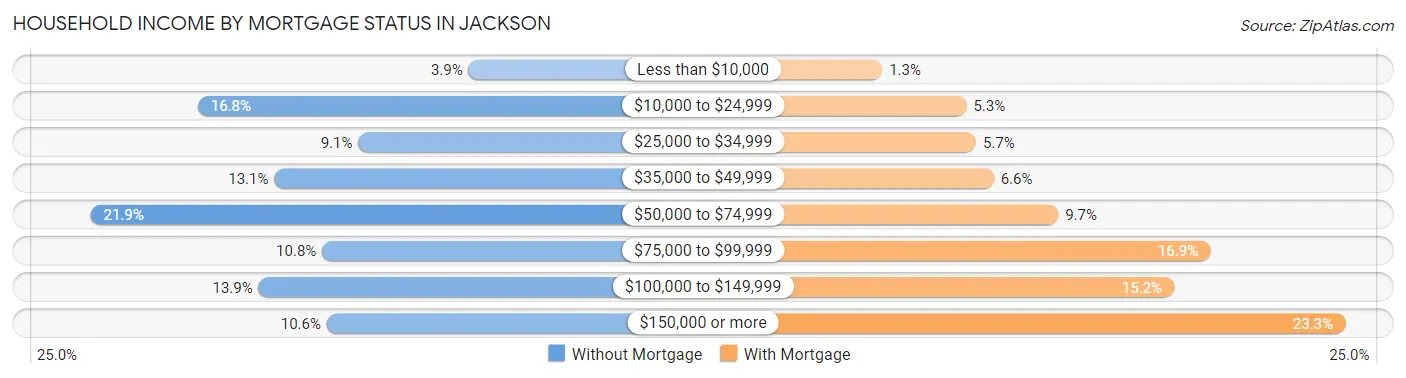
| Household Income | Without Mortgage | With Mortgage |
| Less than $10,000 | 213 (3.9%) | 101 (1.3%) |
| $10,000 to $24,999 | 925 (16.8%) | 421 (5.3%) |
| $25,000 to $34,999 | 503 (9.1%) | 458 (5.7%) |
| $35,000 to $49,999 | 724 (13.1%) | 525 (6.6%) |
| $50,000 to $74,999 | 1,207 (21.9%) | 770 (9.7%) |
| $75,000 to $99,999 | 598 (10.8%) | 1,347 (16.9%) |
| $100,000 to $149,999 | 765 (13.9%) | 1,210 (15.2%) |
| $150,000 or more | 586 (10.6%) | 1,860 (23.3%) |
| Total | 5,521 (100.0%) | 7,979 (100.0%) |
Property Value to Household Income Ratio in Jackson
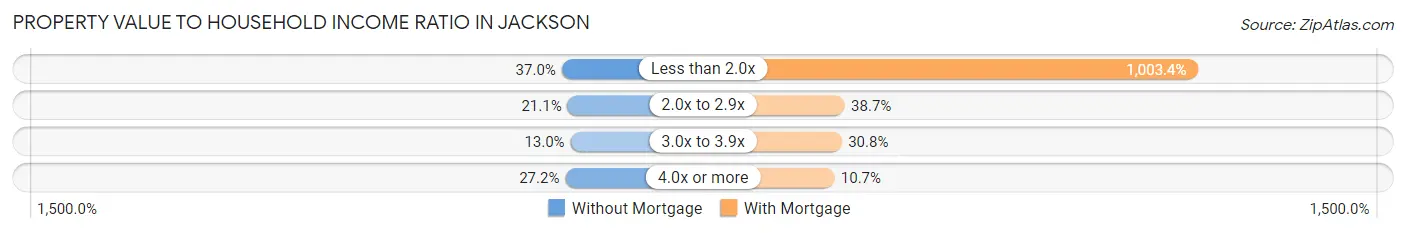
| Value-to-Income Ratio | Without Mortgage | With Mortgage |
| Less than 2.0x | 2,044 (37.0%) | 80,058 (1,003.4%) |
| 2.0x to 2.9x | 1,166 (21.1%) | 3,091 (38.7%) |
| 3.0x to 3.9x | 719 (13.0%) | 2,460 (30.8%) |
| 4.0x or more | 1,501 (27.2%) | 856 (10.7%) |
| Total | 5,521 (100.0%) | 7,979 (100.0%) |
Real Estate Taxes by Mortgage Status in Jackson
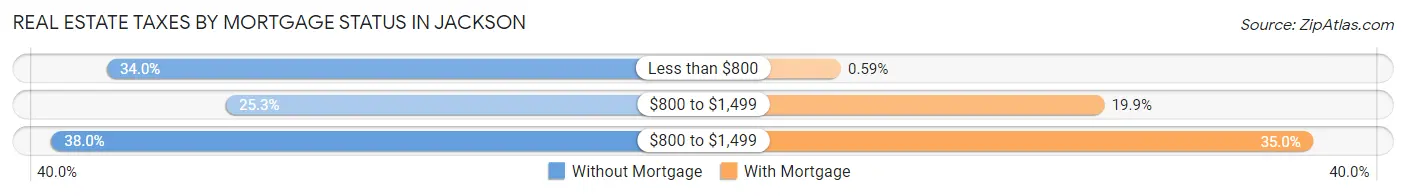
| Property Taxes | Without Mortgage | With Mortgage |
| Less than $800 | 1,876 (34.0%) | 47 (0.6%) |
| $800 to $1,499 | 1,395 (25.3%) | 1,584 (19.9%) |
| $800 to $1,499 | 2,100 (38.0%) | 2,796 (35.0%) |
| Total | 5,521 (100.0%) | 7,979 (100.0%) |
Health & Disability in Jackson
Health Insurance Coverage by Age in Jackson
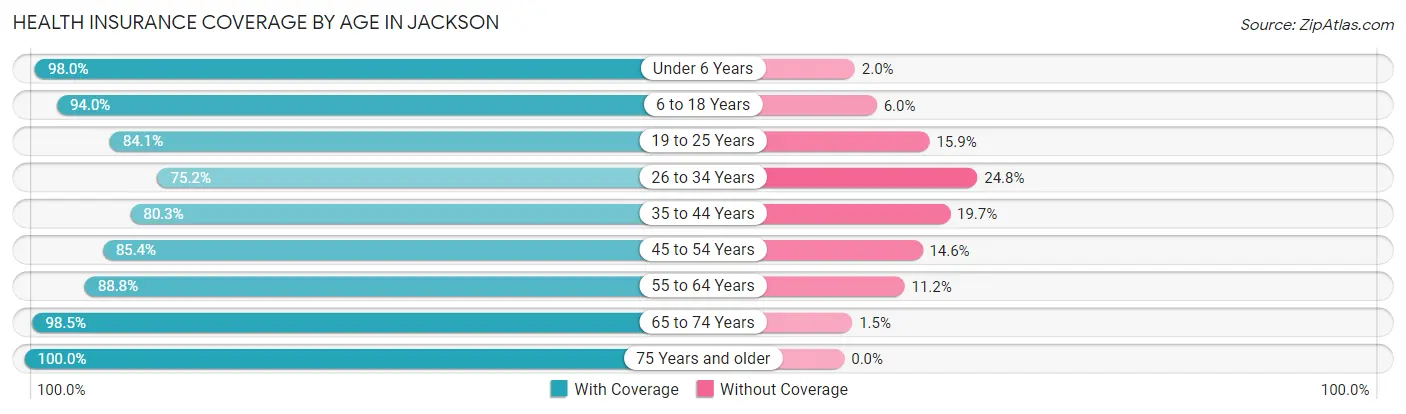
| Age Bracket | With Coverage | Without Coverage |
| Under 6 Years | 5,802 (98.0%) | 116 (2.0%) |
| 6 to 18 Years | 11,128 (94.0%) | 715 (6.0%) |
| 19 to 25 Years | 6,650 (84.1%) | 1,256 (15.9%) |
| 26 to 34 Years | 6,393 (75.2%) | 2,109 (24.8%) |
| 35 to 44 Years | 6,246 (80.3%) | 1,534 (19.7%) |
| 45 to 54 Years | 5,721 (85.4%) | 976 (14.6%) |
| 55 to 64 Years | 7,401 (88.8%) | 937 (11.2%) |
| 65 to 74 Years | 5,999 (98.5%) | 90 (1.5%) |
| 75 Years and older | 3,652 (100.0%) | 0 (0.0%) |
| Total | 58,992 (88.4%) | 7,733 (11.6%) |
Health Insurance Coverage by Citizenship Status in Jackson
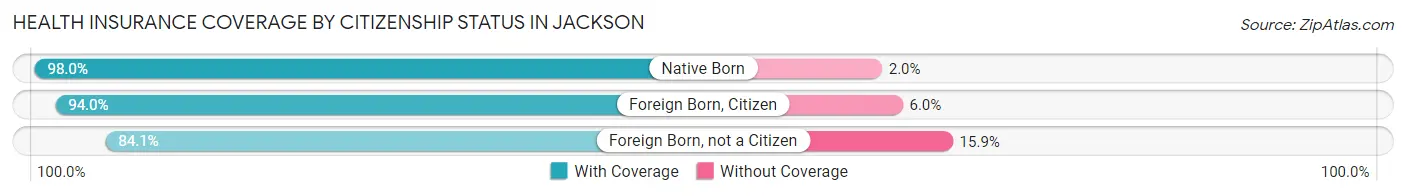
| Citizenship Status | With Coverage | Without Coverage |
| Native Born | 5,802 (98.0%) | 116 (2.0%) |
| Foreign Born, Citizen | 11,128 (94.0%) | 715 (6.0%) |
| Foreign Born, not a Citizen | 6,650 (84.1%) | 1,256 (15.9%) |
Health Insurance Coverage by Household Income in Jackson
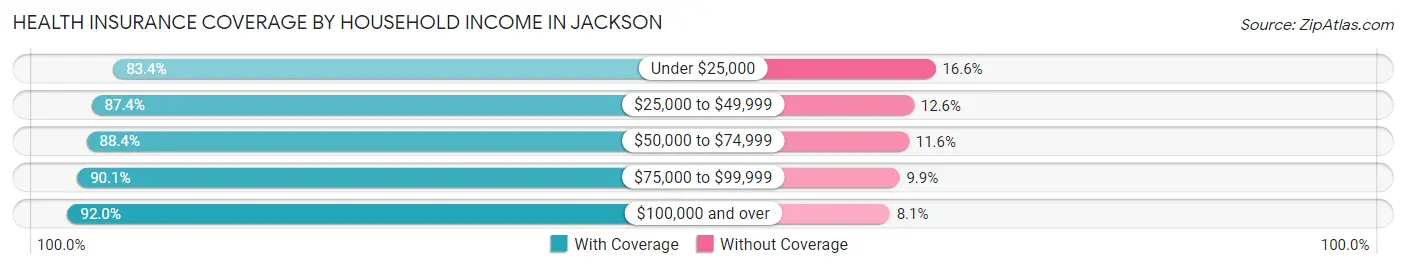
| Household Income | With Coverage | Without Coverage |
| Under $25,000 | 11,375 (83.4%) | 2,266 (16.6%) |
| $25,000 to $49,999 | 12,486 (87.4%) | 1,793 (12.6%) |
| $50,000 to $74,999 | 8,761 (88.4%) | 1,152 (11.6%) |
| $75,000 to $99,999 | 7,107 (90.1%) | 778 (9.9%) |
| $100,000 and over | 16,904 (91.9%) | 1,479 (8.1%) |
Public vs Private Health Insurance Coverage by Age in Jackson
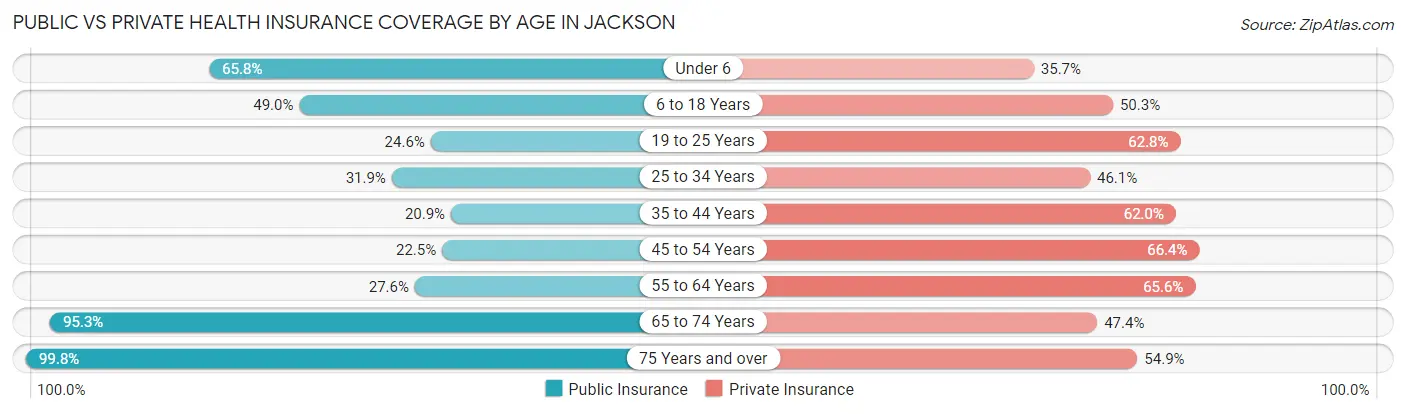
| Age Bracket | Public Insurance | Private Insurance |
| Under 6 | 3,891 (65.7%) | 2,110 (35.6%) |
| 6 to 18 Years | 5,806 (49.0%) | 5,962 (50.3%) |
| 19 to 25 Years | 1,947 (24.6%) | 4,968 (62.8%) |
| 25 to 34 Years | 2,709 (31.9%) | 3,918 (46.1%) |
| 35 to 44 Years | 1,623 (20.9%) | 4,823 (62.0%) |
| 45 to 54 Years | 1,508 (22.5%) | 4,444 (66.4%) |
| 55 to 64 Years | 2,299 (27.6%) | 5,469 (65.6%) |
| 65 to 74 Years | 5,802 (95.3%) | 2,887 (47.4%) |
| 75 Years and over | 3,643 (99.8%) | 2,004 (54.9%) |
| Total | 29,228 (43.8%) | 36,585 (54.8%) |
Disability Status by Sex by Age in Jackson
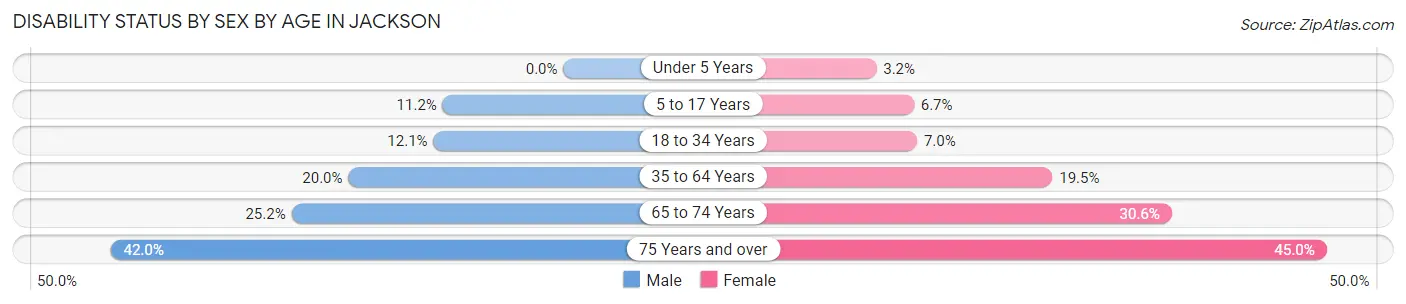
| Age Bracket | Male | Female |
| Under 5 Years | 0 (0.0%) | 74 (3.2%) |
| 5 to 17 Years | 674 (11.2%) | 406 (6.7%) |
| 18 to 34 Years | 1,039 (12.1%) | 623 (7.0%) |
| 35 to 64 Years | 2,098 (20.0%) | 2,404 (19.5%) |
| 65 to 74 Years | 697 (25.2%) | 1,018 (30.6%) |
| 75 Years and over | 511 (42.0%) | 1,096 (45.0%) |
Disability Class by Sex by Age in Jackson
Disability Class: Hearing Difficulty
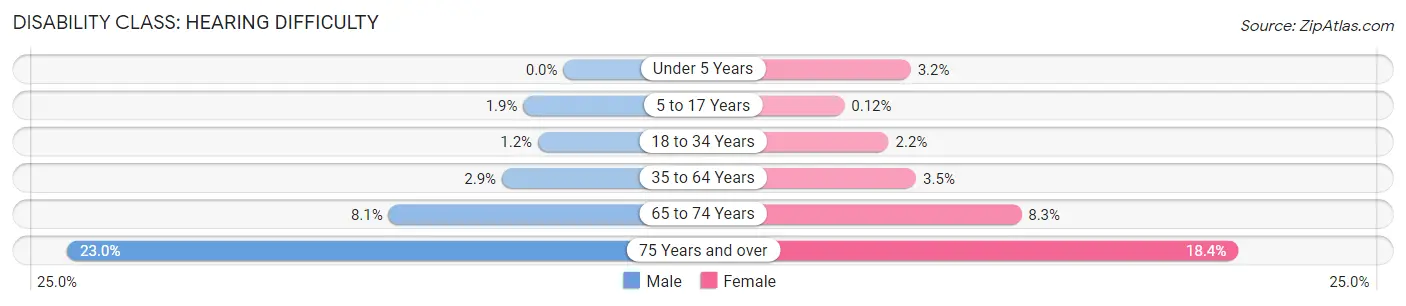
| Age Bracket | Male | Female |
| Under 5 Years | 0 (0.0%) | 74 (3.2%) |
| 5 to 17 Years | 112 (1.9%) | 7 (0.1%) |
| 18 to 34 Years | 102 (1.2%) | 194 (2.2%) |
| 35 to 64 Years | 300 (2.9%) | 424 (3.5%) |
| 65 to 74 Years | 224 (8.1%) | 277 (8.3%) |
| 75 Years and over | 280 (23.0%) | 448 (18.4%) |
Disability Class: Vision Difficulty
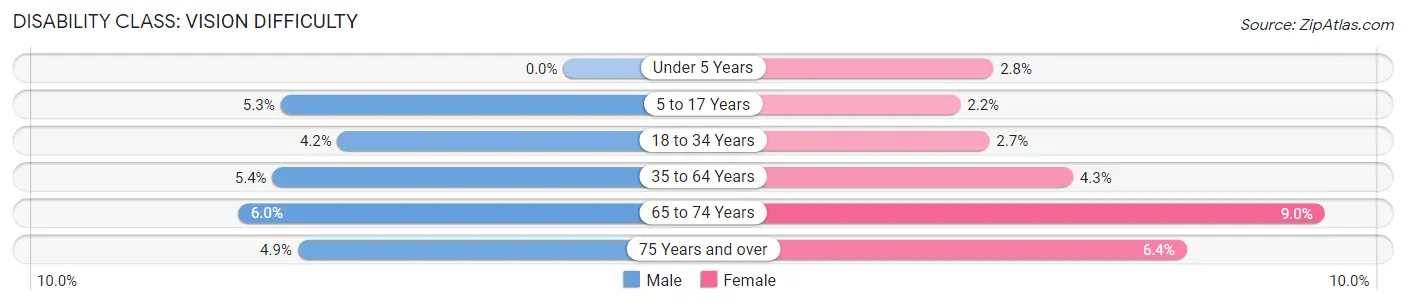
| Age Bracket | Male | Female |
| Under 5 Years | 0 (0.0%) | 65 (2.8%) |
| 5 to 17 Years | 316 (5.2%) | 134 (2.2%) |
| 18 to 34 Years | 361 (4.2%) | 245 (2.7%) |
| 35 to 64 Years | 568 (5.4%) | 528 (4.3%) |
| 65 to 74 Years | 167 (6.0%) | 298 (9.0%) |
| 75 Years and over | 60 (4.9%) | 156 (6.4%) |
Disability Class: Cognitive Difficulty
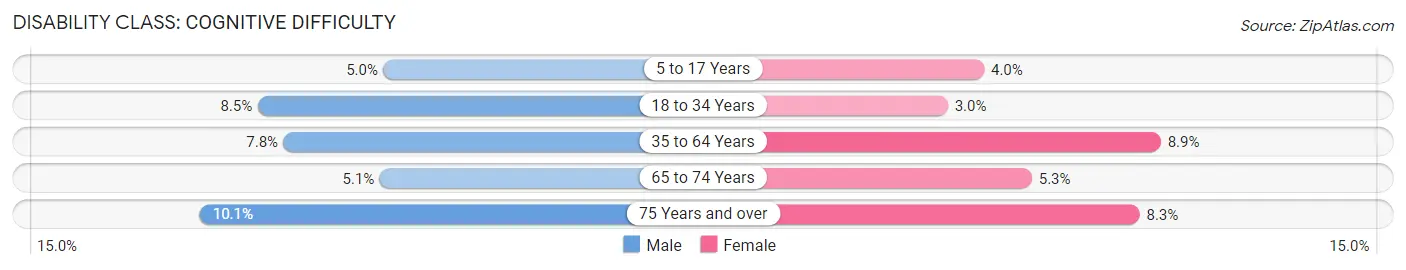
| Age Bracket | Male | Female |
| 5 to 17 Years | 301 (5.0%) | 241 (4.0%) |
| 18 to 34 Years | 732 (8.5%) | 263 (2.9%) |
| 35 to 64 Years | 818 (7.8%) | 1,092 (8.9%) |
| 65 to 74 Years | 141 (5.1%) | 176 (5.3%) |
| 75 Years and over | 123 (10.1%) | 202 (8.3%) |
Disability Class: Ambulatory Difficulty
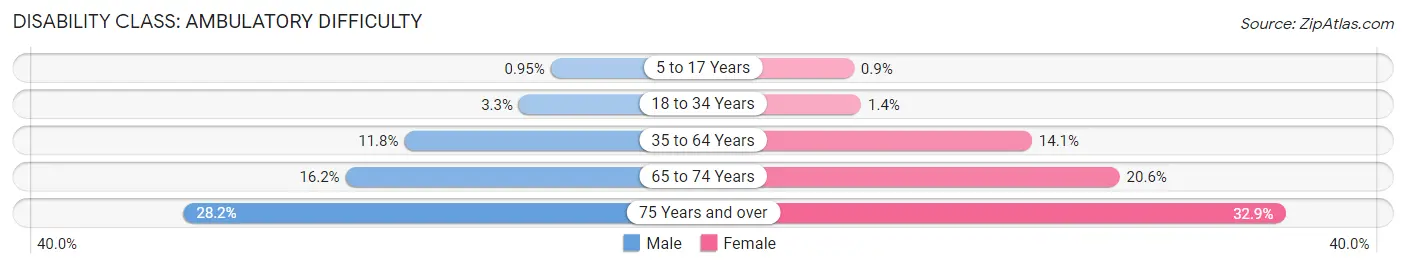
| Age Bracket | Male | Female |
| 5 to 17 Years | 57 (0.9%) | 55 (0.9%) |
| 18 to 34 Years | 285 (3.3%) | 128 (1.4%) |
| 35 to 64 Years | 1,242 (11.8%) | 1,736 (14.1%) |
| 65 to 74 Years | 447 (16.2%) | 686 (20.6%) |
| 75 Years and over | 343 (28.2%) | 802 (32.9%) |
Disability Class: Self-Care Difficulty
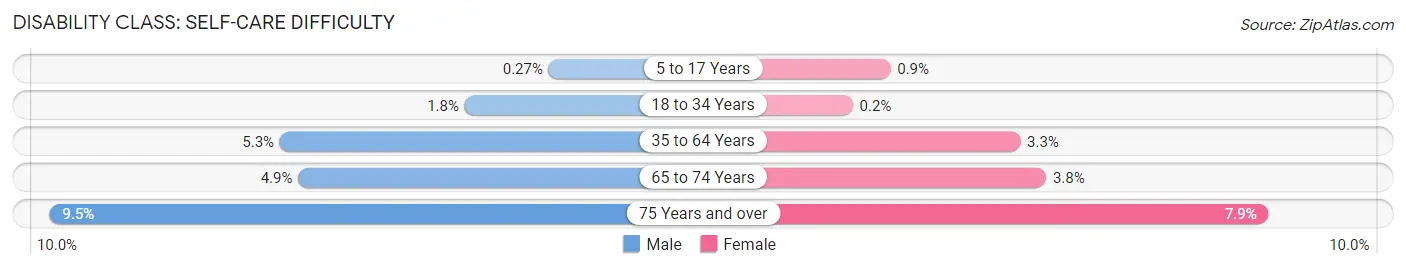
| Age Bracket | Male | Female |
| 5 to 17 Years | 16 (0.3%) | 55 (0.9%) |
| 18 to 34 Years | 158 (1.8%) | 18 (0.2%) |
| 35 to 64 Years | 553 (5.3%) | 407 (3.3%) |
| 65 to 74 Years | 136 (4.9%) | 126 (3.8%) |
| 75 Years and over | 116 (9.5%) | 193 (7.9%) |
Technology Access in Jackson
Computing Device Access in Jackson
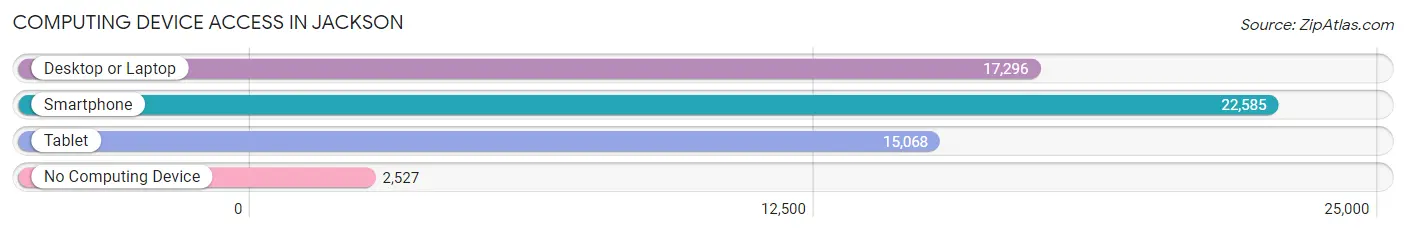
| Device Type | # Households | % Households |
| Desktop or Laptop | 17,296 | 65.5% |
| Smartphone | 22,585 | 85.6% |
| Tablet | 15,068 | 57.1% |
| No Computing Device | 2,527 | 9.6% |
| Total | 26,387 | 100.0% |
Internet Access in Jackson
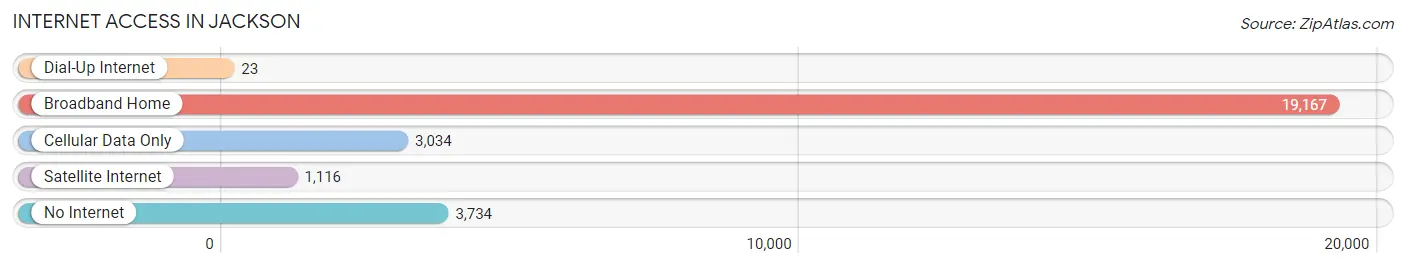
| Internet Type | # Households | % Households |
| Dial-Up Internet | 23 | 0.1% |
| Broadband Home | 19,167 | 72.6% |
| Cellular Data Only | 3,034 | 11.5% |
| Satellite Internet | 1,116 | 4.2% |
| No Internet | 3,734 | 14.1% |
| Total | 26,387 | 100.0% |
Jackson Summary
Jackson, Tennessee is a city located in Madison County, in the western part of the state. It is the county seat and the largest city in Madison County. The city is located along the banks of the Forked Deer River, and is about 80 miles east of Memphis. The city has a population of 65,211, according to the 2019 U.S. Census.
History
Jackson was founded in 1819 by an act of the Tennessee General Assembly. The city was named after Andrew Jackson, who was the seventh president of the United States. The city was originally a trading post and was known as Alexandria. In 1821, the city was renamed Jackson in honor of Andrew Jackson.
Jackson was an important center for the Confederacy during the Civil War. The city was the site of the Battle of Jackson, which was fought in 1862. The city was also the site of the Battle of Jackson in 1864.
Geography
Jackson is located in western Tennessee, in Madison County. The city is located along the banks of the Forked Deer River. The city is about 80 miles east of Memphis. The city has a total area of 33.2 square miles, of which 33.1 square miles is land and 0.1 square miles is water.
The city has a humid subtropical climate, with hot, humid summers and mild winters. The average annual temperature is 61.3 degrees Fahrenheit. The average annual precipitation is 48.3 inches.
Economy
Jackson is a major economic center in western Tennessee. The city is home to several major employers, including the University of Tennessee at Martin, the Jackson Generating Station, and the Jackson-Madison County General Hospital. The city is also home to several manufacturing companies, including the Jackson Furniture Company, the Jackson Hosiery Company, and the Jackson Shoe Company.
The city is also home to several retail stores, including Walmart, Target, and Lowe's. The city is also home to several restaurants, including Applebee's, Chili's, and Olive Garden.
Demographics
According to the 2019 U.S. Census, Jackson has a population of 65,211. The city has a median age of 36.7 years, and a median household income of $41,945. The city is 59.2% White, 34.2% African American, 2.2% Hispanic or Latino, and 4.4% other.
Jackson is a diverse city, with a variety of cultures and religions represented. The city is home to several churches, including the First United Methodist Church, the First Presbyterian Church, and the First Baptist Church. The city is also home to several synagogues, including the Congregation B'nai Israel and the Temple B'nai Israel.
Conclusion
Jackson, Tennessee is a city located in Madison County, in the western part of the state. It is the county seat and the largest city in Madison County. The city is located along the banks of the Forked Deer River, and is about 80 miles east of Memphis. The city has a population of 65,211, according to the 2019 U.S. Census. Jackson is a major economic center in western Tennessee, and is home to several major employers, including the University of Tennessee at Martin, the Jackson Generating Station, and the Jackson-Madison County General Hospital. The city is also home to several manufacturing companies, including the Jackson Furniture Company, the Jackson Hosiery Company, and the Jackson Shoe Company. Jackson is a diverse city, with a variety of cultures and religions represented. The city is home to several churches, including the First United Methodist Church, the First Presbyterian Church, and the First Baptist Church. The city is also home to several synagogues, including the Congregation B'nai Israel and the Temple B'nai Israel.
Common Questions
What is Per Capita Income in Jackson?
Per Capita income in Jackson is $28,544.
What is the Median Family Income in Jackson?
Median Family Income in Jackson is $61,397.
What is the Median Household income in Jackson?
Median Household Income in Jackson is $48,058.
What is Income or Wage Gap in Jackson?
Income or Wage Gap in Jackson is 19.1%.
Women in Jackson earn 80.9 cents for every dollar earned by a man.
What is Family Income Deficit in Jackson?
Family Income Deficit in Jackson is $12,380.
Families that are below poverty line in Jackson earn $12,380 less on average than the poverty threshold level.
What is Inequality or Gini Index in Jackson?
Inequality or Gini Index in Jackson is 0.50.
What is the Total Population of Jackson?
Total Population of Jackson is 67,993.
What is the Total Male Population of Jackson?
Total Male Population of Jackson is 32,149.
What is the Total Female Population of Jackson?
Total Female Population of Jackson is 35,844.
What is the Ratio of Males per 100 Females in Jackson?
There are 89.69 Males per 100 Females in Jackson.
What is the Ratio of Females per 100 Males in Jackson?
There are 111.49 Females per 100 Males in Jackson.
What is the Median Population Age in Jackson?
Median Population Age in Jackson is 34.6 Years.
What is the Average Family Size in Jackson
Average Family Size in Jackson is 3.2 People.
What is the Average Household Size in Jackson
Average Household Size in Jackson is 2.4 People.
How Large is the Labor Force in Jackson?
There are 32,756 People in the Labor Forcein in Jackson.
What is the Percentage of People in the Labor Force in Jackson?
61.3% of People are in the Labor Force in Jackson.
What is the Unemployment Rate in Jackson?
Unemployment Rate in Jackson is 9.0%.