Cookeville, TN Map & Demographics
Cookeville Map
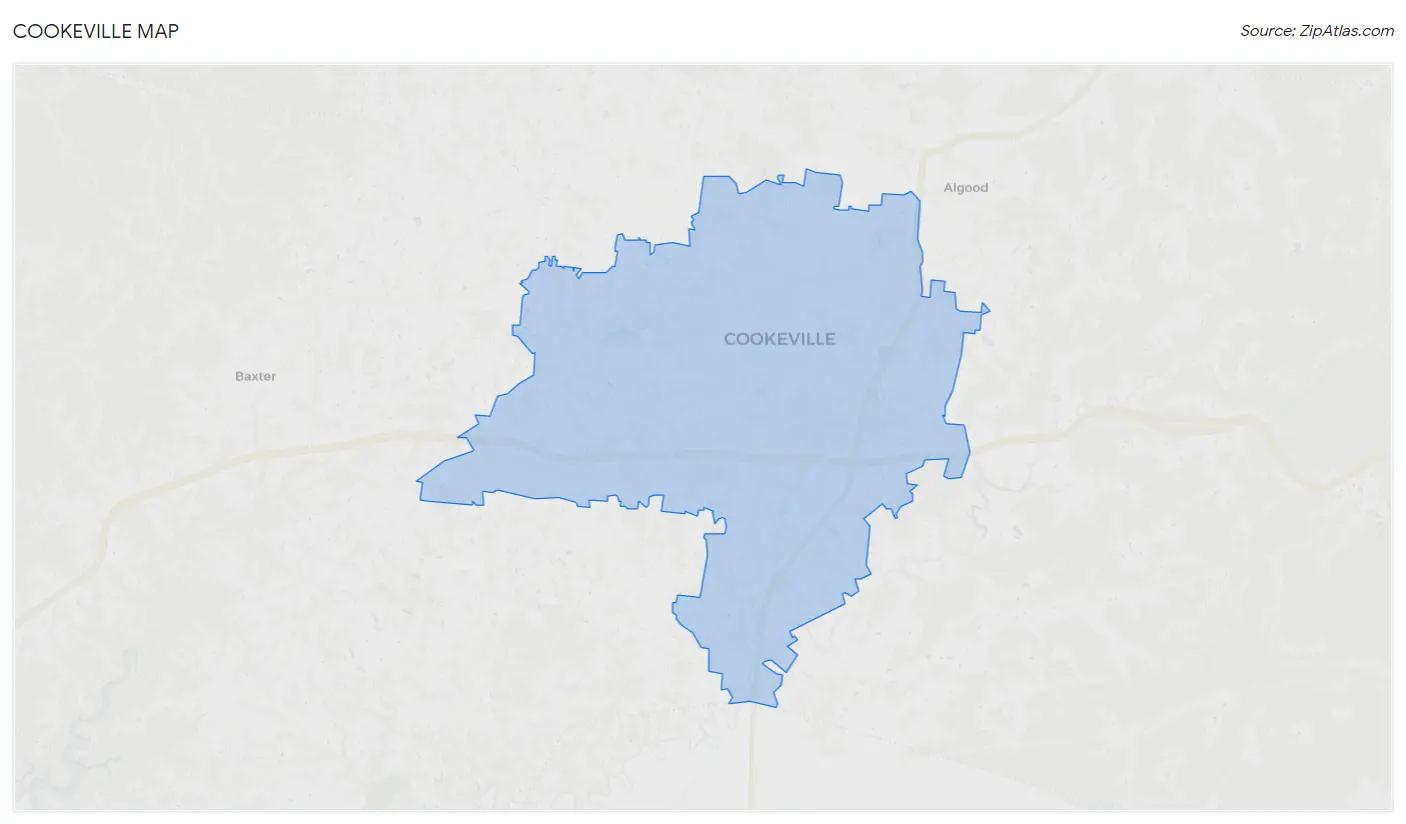
Cookeville Overview
$27,359
PER CAPITA INCOME
$70,326
AVG FAMILY INCOME
$48,094
AVG HOUSEHOLD INCOME
18.1%
WAGE / INCOME GAP [ % ]
81.9¢/ $1
WAGE / INCOME GAP [ $ ]
$12,127
FAMILY INCOME DEFICIT
0.48
INEQUALITY / GINI INDEX
34,967
TOTAL POPULATION
17,310
MALE POPULATION
17,657
FEMALE POPULATION
98.03
MALES / 100 FEMALES
102.00
FEMALES / 100 MALES
29.5
MEDIAN AGE
2.9
AVG FAMILY SIZE
2.2
AVG HOUSEHOLD SIZE
17,439
LABOR FORCE [ PEOPLE ]
60.0%
PERCENT IN LABOR FORCE
6.1%
UNEMPLOYMENT RATE
Cookeville Area Codes
Income in Cookeville
Income Overview in Cookeville
Per Capita Income in Cookeville is $27,359, while median incomes of families and households are $70,326 and $48,094 respectively.
| Characteristic | Number | Measure |
| Per Capita Income | 34,967 | $27,359 |
| Median Family Income | 7,507 | $70,326 |
| Mean Family Income | 7,507 | $86,544 |
| Median Household Income | 14,373 | $48,094 |
| Mean Household Income | 14,373 | $67,301 |
| Income Deficit | 7,507 | $12,127 |
| Wage / Income Gap (%) | 34,967 | 18.14% |
| Wage / Income Gap ($) | 34,967 | 81.86¢ per $1 |
| Gini / Inequality Index | 34,967 | 0.48 |
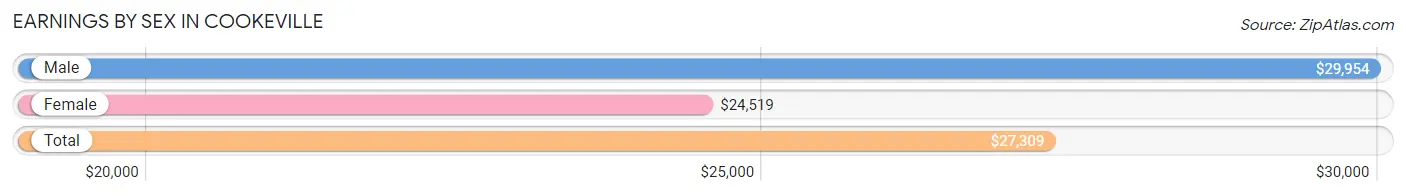
Earnings by Sex in Cookeville
Average Earnings in Cookeville are $27,309, $29,954 for men and $24,519 for women, a difference of 18.1%.
| Sex | Number | Average Earnings |
| Male | 9,799 (53.2%) | $29,954 |
| Female | 8,610 (46.8%) | $24,519 |
| Total | 18,409 (100.0%) | $27,309 |
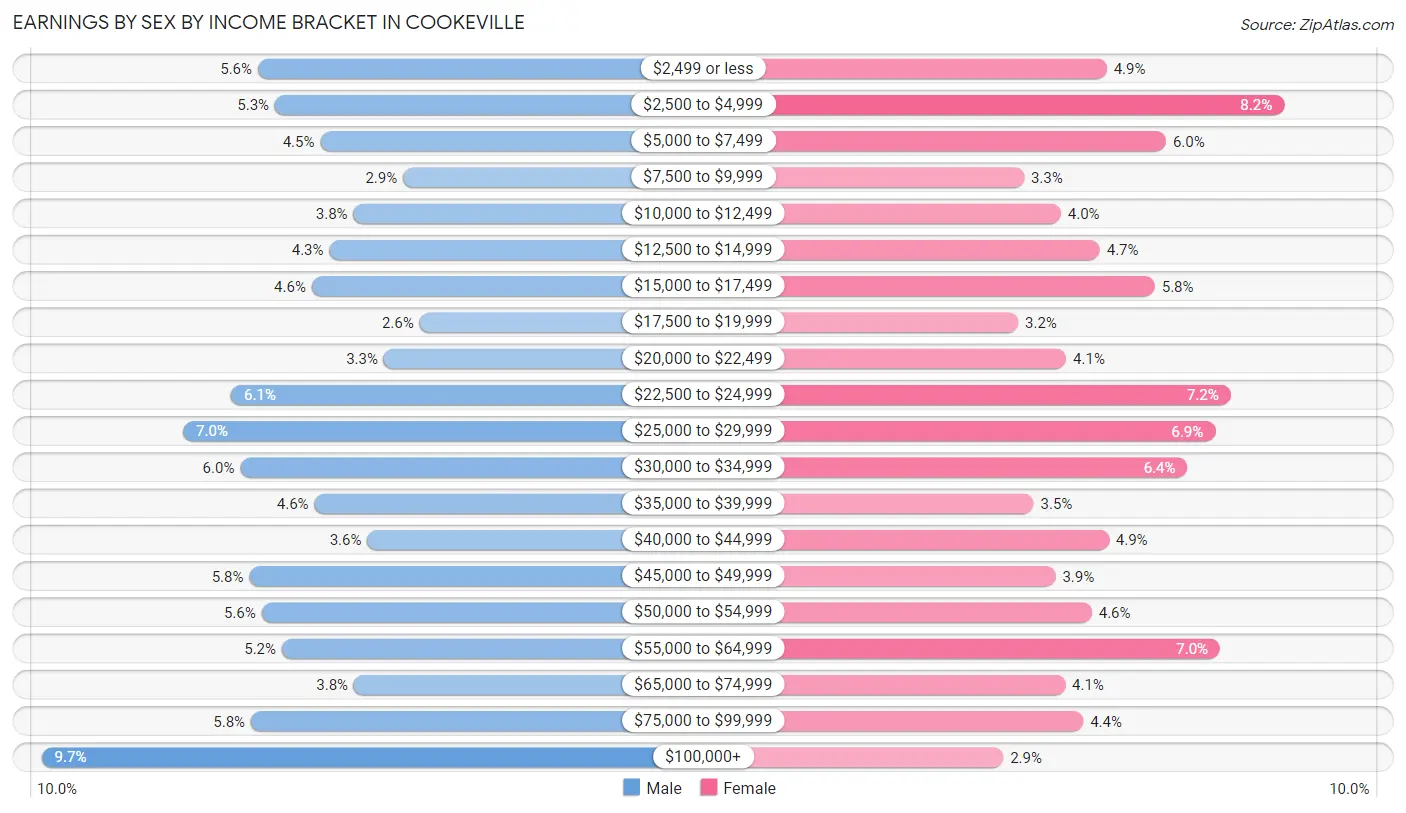
Earnings by Sex by Income Bracket in Cookeville
The most common earnings brackets in Cookeville are $100,000+ for men (949 | 9.7%) and $2,500 to $4,999 for women (705 | 8.2%).
| Income | Male | Female |
| $2,499 or less | 552 (5.6%) | 419 (4.9%) |
| $2,500 to $4,999 | 520 (5.3%) | 705 (8.2%) |
| $5,000 to $7,499 | 437 (4.5%) | 515 (6.0%) |
| $7,500 to $9,999 | 285 (2.9%) | 286 (3.3%) |
| $10,000 to $12,499 | 376 (3.8%) | 345 (4.0%) |
| $12,500 to $14,999 | 420 (4.3%) | 408 (4.7%) |
| $15,000 to $17,499 | 453 (4.6%) | 497 (5.8%) |
| $17,500 to $19,999 | 255 (2.6%) | 276 (3.2%) |
| $20,000 to $22,499 | 320 (3.3%) | 354 (4.1%) |
| $22,500 to $24,999 | 601 (6.1%) | 619 (7.2%) |
| $25,000 to $29,999 | 689 (7.0%) | 594 (6.9%) |
| $30,000 to $34,999 | 584 (6.0%) | 549 (6.4%) |
| $35,000 to $39,999 | 448 (4.6%) | 301 (3.5%) |
| $40,000 to $44,999 | 351 (3.6%) | 423 (4.9%) |
| $45,000 to $49,999 | 567 (5.8%) | 337 (3.9%) |
| $50,000 to $54,999 | 545 (5.6%) | 395 (4.6%) |
| $55,000 to $64,999 | 508 (5.2%) | 602 (7.0%) |
| $65,000 to $74,999 | 375 (3.8%) | 352 (4.1%) |
| $75,000 to $99,999 | 564 (5.8%) | 381 (4.4%) |
| $100,000+ | 949 (9.7%) | 252 (2.9%) |
| Total | 9,799 (100.0%) | 8,610 (100.0%) |
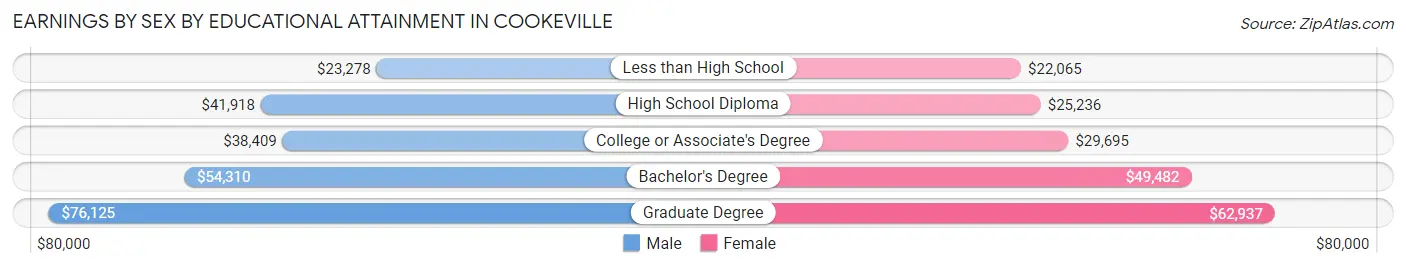
Earnings by Sex by Educational Attainment in Cookeville
Average earnings in Cookeville are $45,034 for men and $36,449 for women, a difference of 19.1%. Men with an educational attainment of graduate degree enjoy the highest average annual earnings of $76,125, while those with less than high school education earn the least with $23,278. Women with an educational attainment of graduate degree earn the most with the average annual earnings of $62,937, while those with less than high school education have the smallest earnings of $22,065.
| Educational Attainment | Male Income | Female Income |
| Less than High School | $23,278 | $22,065 |
| High School Diploma | $41,918 | $25,236 |
| College or Associate's Degree | $38,409 | $29,695 |
| Bachelor's Degree | $54,310 | $49,482 |
| Graduate Degree | $76,125 | $62,937 |
| Total | $45,034 | $36,449 |
Family Income in Cookeville
Family Income Brackets in Cookeville
According to the Cookeville family income data, there are 1,456 families falling into the $50,000 to $74,999 income range, which is the most common income bracket and makes up 19.4% of all families. Conversely, the $10,000 to $14,999 income bracket is the least frequent group with only 270 families (3.6%) belonging to this category.
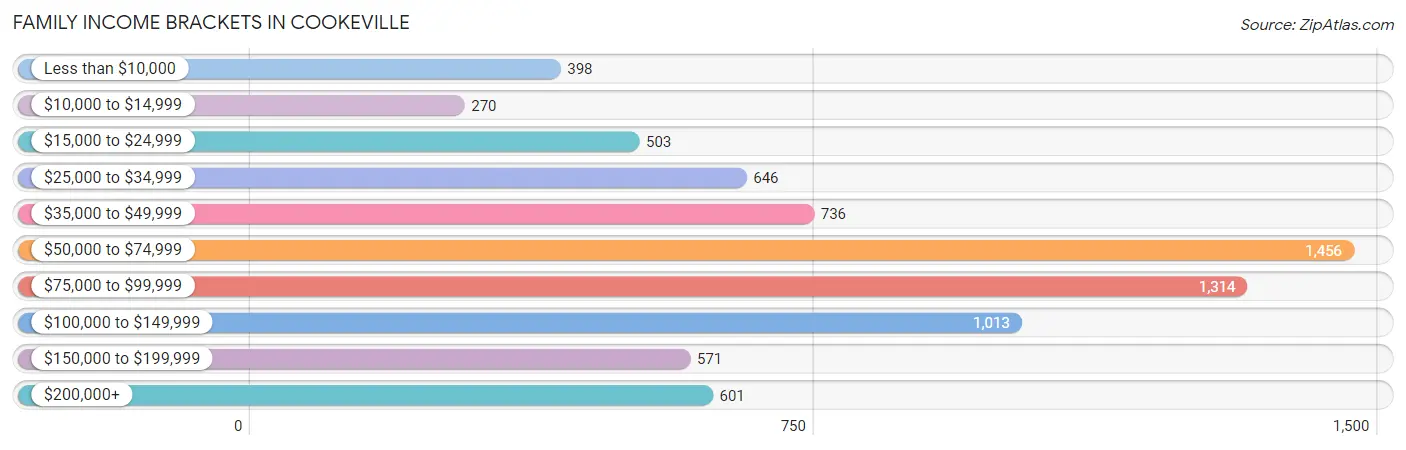
| Income Bracket | # Families | % Families |
| Less than $10,000 | 398 | 5.3% |
| $10,000 to $14,999 | 270 | 3.6% |
| $15,000 to $24,999 | 503 | 6.7% |
| $25,000 to $34,999 | 646 | 8.6% |
| $35,000 to $49,999 | 736 | 9.8% |
| $50,000 to $74,999 | 1,456 | 19.4% |
| $75,000 to $99,999 | 1,314 | 17.5% |
| $100,000 to $149,999 | 1,013 | 13.5% |
| $150,000 to $199,999 | 571 | 7.6% |
| $200,000+ | 601 | 8.0% |
Family Income by Famaliy Size in Cookeville
4-person families (1,281 | 17.1%) account for the highest median family income in Cookeville with $99,904 per family, while 2-person families (3,899 | 51.9%) have the highest median income of $28,463 per family member.
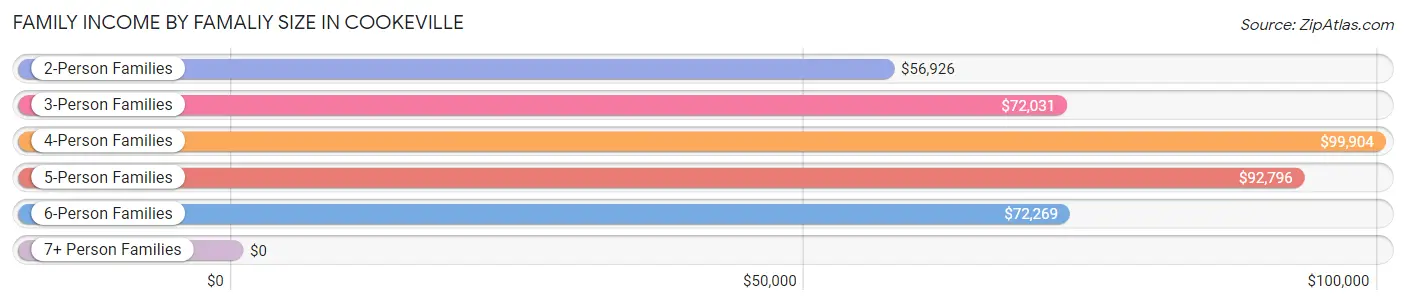
| Income Bracket | # Families | Median Income |
| 2-Person Families | 3,899 (51.9%) | $56,926 |
| 3-Person Families | 1,495 (19.9%) | $72,031 |
| 4-Person Families | 1,281 (17.1%) | $99,904 |
| 5-Person Families | 483 (6.4%) | $92,796 |
| 6-Person Families | 218 (2.9%) | $72,269 |
| 7+ Person Families | 131 (1.8%) | $0 |
| Total | 7,507 (100.0%) | $70,326 |
Family Income by Number of Earners in Cookeville
The median family income in Cookeville is $70,326, with families comprising 3+ earners (410) having the highest median family income of $132,789, while families with no earners (1,285) have the lowest median family income of $44,701, accounting for 5.5% and 17.1% of families, respectively.
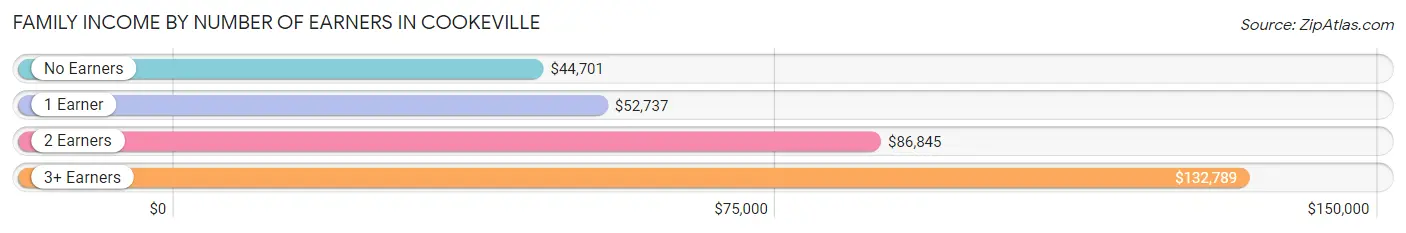
| Number of Earners | # Families | Median Income |
| No Earners | 1,285 (17.1%) | $44,701 |
| 1 Earner | 2,731 (36.4%) | $52,737 |
| 2 Earners | 3,081 (41.0%) | $86,845 |
| 3+ Earners | 410 (5.5%) | $132,789 |
| Total | 7,507 (100.0%) | $70,326 |
Household Income in Cookeville
Household Income Brackets in Cookeville
With 2,573 households falling in the category, the $50,000 to $74,999 income range is the most frequent in Cookeville, accounting for 17.9% of all households. In contrast, only 647 households (4.5%) fall into the $150,000 to $199,999 income bracket, making it the least populous group.
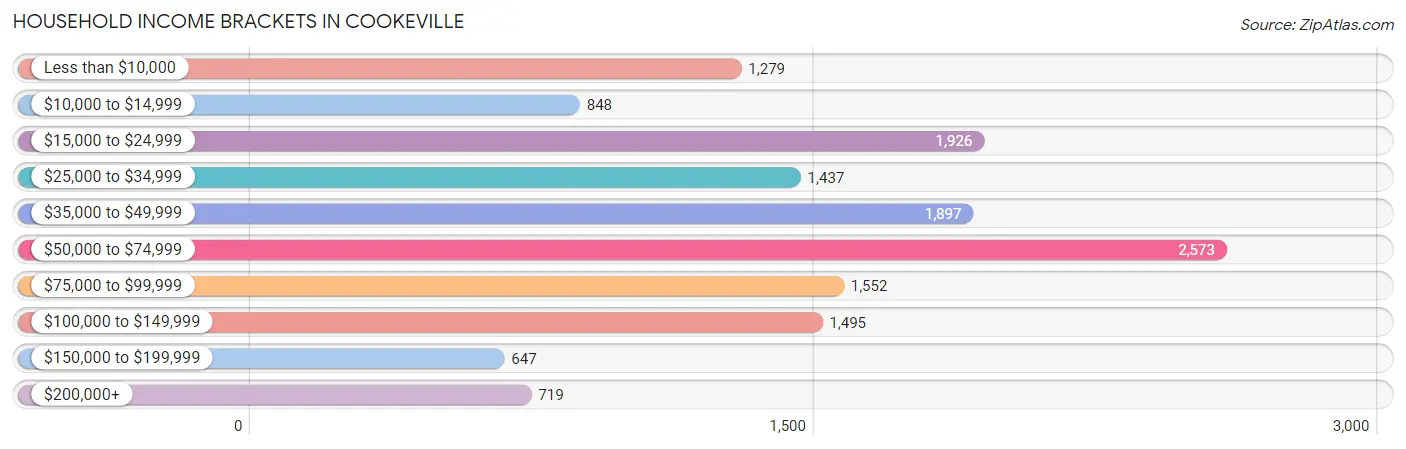
| Income Bracket | # Households | % Households |
| Less than $10,000 | 1,279 | 8.9% |
| $10,000 to $14,999 | 848 | 5.9% |
| $15,000 to $24,999 | 1,926 | 13.4% |
| $25,000 to $34,999 | 1,437 | 10.0% |
| $35,000 to $49,999 | 1,897 | 13.2% |
| $50,000 to $74,999 | 2,573 | 17.9% |
| $75,000 to $99,999 | 1,552 | 10.8% |
| $100,000 to $149,999 | 1,495 | 10.4% |
| $150,000 to $199,999 | 647 | 4.5% |
| $200,000+ | 719 | 5.0% |
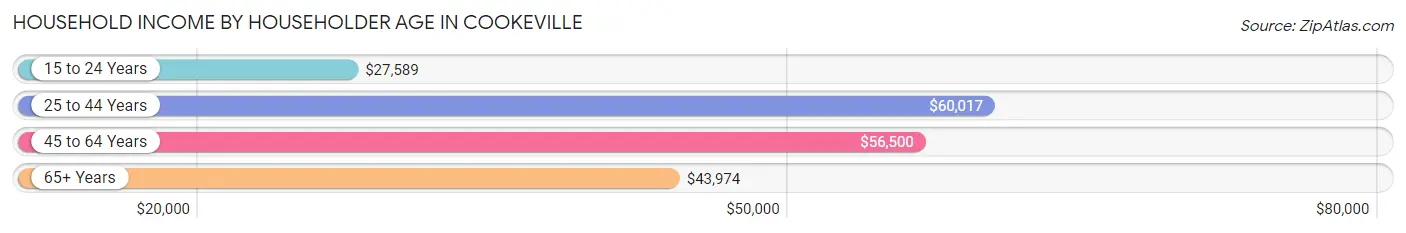
Household Income by Householder Age in Cookeville
The median household income in Cookeville is $48,094, with the highest median household income of $60,017 found in the 25 to 44 years age bracket for the primary householder. A total of 4,640 households (32.3%) fall into this category. Meanwhile, the 15 to 24 years age bracket for the primary householder has the lowest median household income of $27,589, with 2,664 households (18.5%) in this group.
| Income Bracket | # Households | Median Income |
| 15 to 24 Years | 2,664 (18.5%) | $27,589 |
| 25 to 44 Years | 4,640 (32.3%) | $60,017 |
| 45 to 64 Years | 4,002 (27.8%) | $56,500 |
| 65+ Years | 3,067 (21.3%) | $43,974 |
| Total | 14,373 (100.0%) | $48,094 |
Poverty in Cookeville
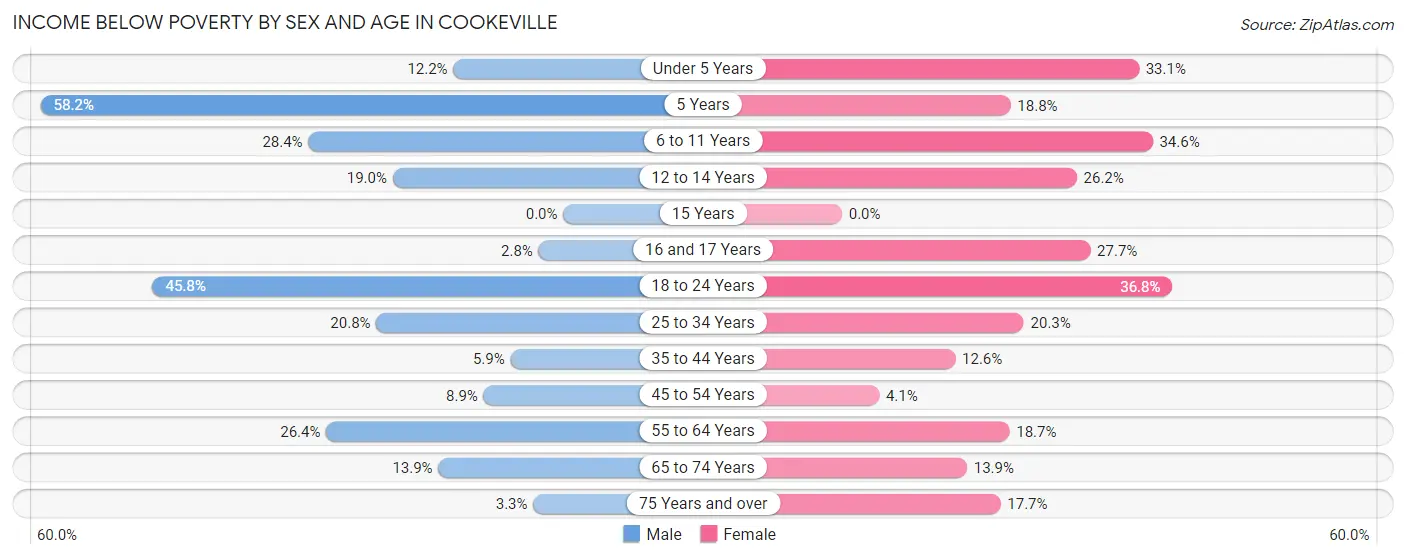
Income Below Poverty by Sex and Age in Cookeville
With 21.9% poverty level for males and 21.1% for females among the residents of Cookeville, 5 year old males and 18 to 24 year old females are the most vulnerable to poverty, with 156 males (58.2%) and 986 females (36.8%) in their respective age groups living below the poverty level.
| Age Bracket | Male | Female |
| Under 5 Years | 110 (12.2%) | 297 (33.1%) |
| 5 Years | 156 (58.2%) | 40 (18.8%) |
| 6 to 11 Years | 264 (28.4%) | 372 (34.6%) |
| 12 to 14 Years | 113 (19.0%) | 137 (26.2%) |
| 15 Years | 0 (0.0%) | 0 (0.0%) |
| 16 and 17 Years | 10 (2.8%) | 130 (27.7%) |
| 18 to 24 Years | 1,476 (45.8%) | 986 (36.8%) |
| 25 to 34 Years | 498 (20.8%) | 462 (20.3%) |
| 35 to 44 Years | 103 (5.9%) | 233 (12.6%) |
| 45 to 54 Years | 166 (8.9%) | 76 (4.1%) |
| 55 to 64 Years | 343 (26.4%) | 310 (18.6%) |
| 65 to 74 Years | 137 (13.9%) | 201 (13.9%) |
| 75 Years and over | 29 (3.3%) | 211 (17.7%) |
| Total | 3,405 (21.9%) | 3,455 (21.1%) |
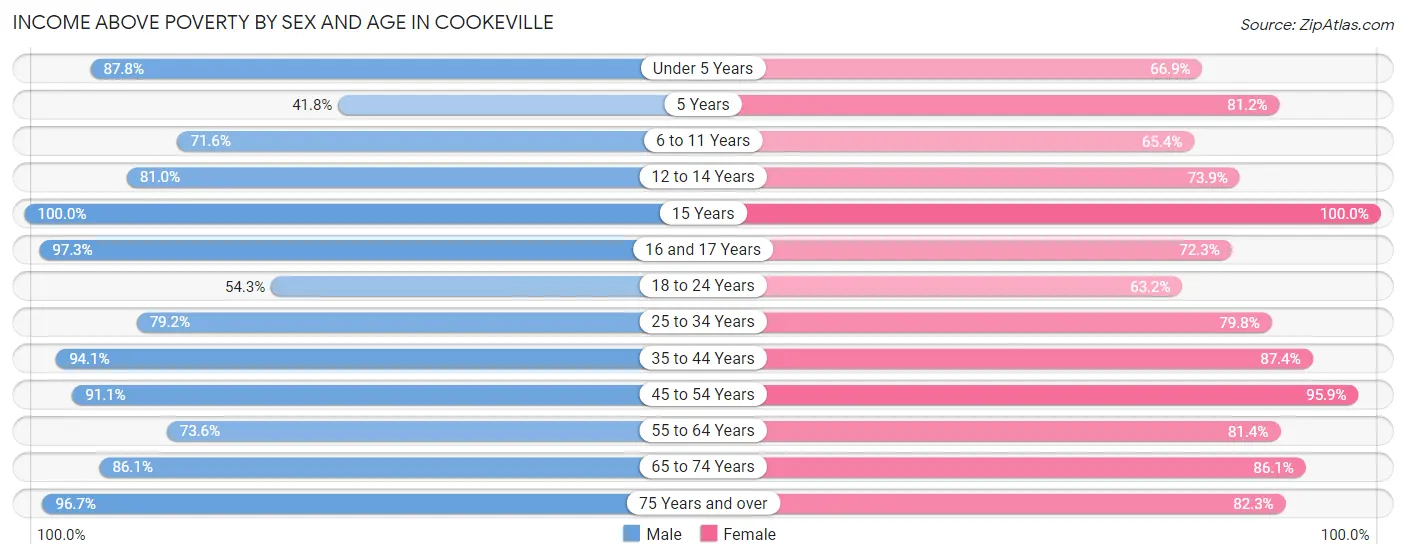
Income Above Poverty by Sex and Age in Cookeville
According to the poverty statistics in Cookeville, males aged 15 years and females aged 15 years are the age groups that are most secure financially, with 100.0% of males and 100.0% of females in these age groups living above the poverty line.
| Age Bracket | Male | Female |
| Under 5 Years | 789 (87.8%) | 601 (66.9%) |
| 5 Years | 112 (41.8%) | 173 (81.2%) |
| 6 to 11 Years | 666 (71.6%) | 703 (65.4%) |
| 12 to 14 Years | 482 (81.0%) | 387 (73.9%) |
| 15 Years | 116 (100.0%) | 241 (100.0%) |
| 16 and 17 Years | 354 (97.3%) | 340 (72.3%) |
| 18 to 24 Years | 1,750 (54.2%) | 1,693 (63.2%) |
| 25 to 34 Years | 1,894 (79.2%) | 1,820 (79.7%) |
| 35 to 44 Years | 1,649 (94.1%) | 1,613 (87.4%) |
| 45 to 54 Years | 1,706 (91.1%) | 1,761 (95.9%) |
| 55 to 64 Years | 956 (73.6%) | 1,352 (81.4%) |
| 65 to 74 Years | 848 (86.1%) | 1,243 (86.1%) |
| 75 Years and over | 840 (96.7%) | 984 (82.3%) |
| Total | 12,162 (78.1%) | 12,911 (78.9%) |
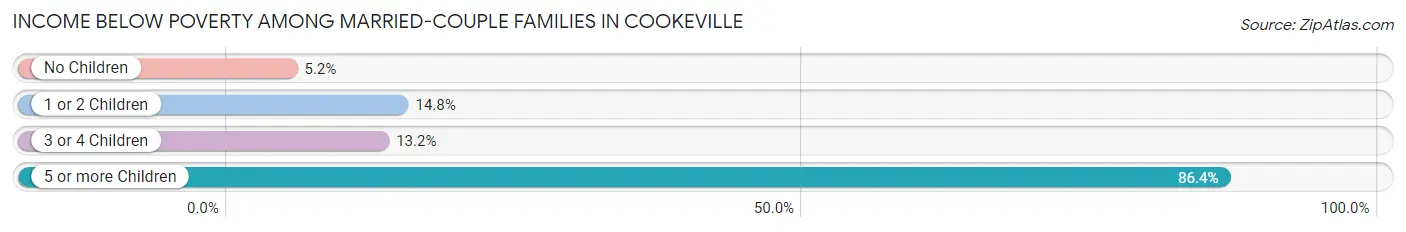
Income Below Poverty Among Married-Couple Families in Cookeville
The poverty statistics for married-couple families in Cookeville show that 9.8% or 504 of the total 5,131 families live below the poverty line. Families with 5 or more children have the highest poverty rate of 86.4%, comprising of 57 families. On the other hand, families with no children have the lowest poverty rate of 5.2%, which includes 159 families.
| Children | Above Poverty | Below Poverty |
| No Children | 2,912 (94.8%) | 159 (5.2%) |
| 1 or 2 Children | 1,297 (85.2%) | 226 (14.8%) |
| 3 or 4 Children | 409 (86.8%) | 62 (13.2%) |
| 5 or more Children | 9 (13.6%) | 57 (86.4%) |
| Total | 4,627 (90.2%) | 504 (9.8%) |
Income Below Poverty Among Single-Parent Households in Cookeville
According to the poverty data in Cookeville, 24.8% or 215 single-father households and 21.3% or 322 single-mother households are living below the poverty line. Among single-father households, those with 3 or 4 children have the highest poverty rate, with 35 households (100.0%) experiencing poverty. Likewise, among single-mother households, those with 3 or 4 children have the highest poverty rate, with 68 households (47.9%) falling below the poverty line.
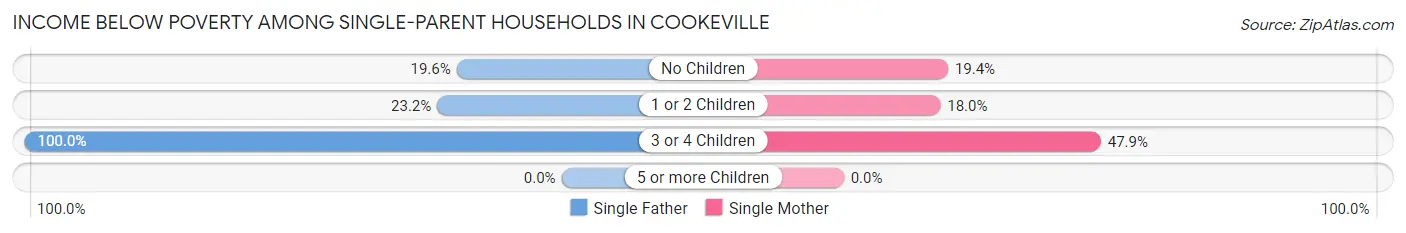
| Children | Single Father | Single Mother |
| No Children | 69 (19.6%) | 108 (19.4%) |
| 1 or 2 Children | 111 (23.2%) | 146 (18.0%) |
| 3 or 4 Children | 35 (100.0%) | 68 (47.9%) |
| 5 or more Children | 0 (0.0%) | 0 (0.0%) |
| Total | 215 (24.8%) | 322 (21.3%) |
Income Below Poverty Among Married-Couple vs Single-Parent Households in Cookeville
The poverty data for Cookeville shows that 504 of the married-couple family households (9.8%) and 537 of the single-parent households (22.6%) are living below the poverty level. Within the married-couple family households, those with 5 or more children have the highest poverty rate, with 57 households (86.4%) falling below the poverty line. Among the single-parent households, those with 3 or 4 children have the highest poverty rate, with 103 household (58.2%) living below poverty.
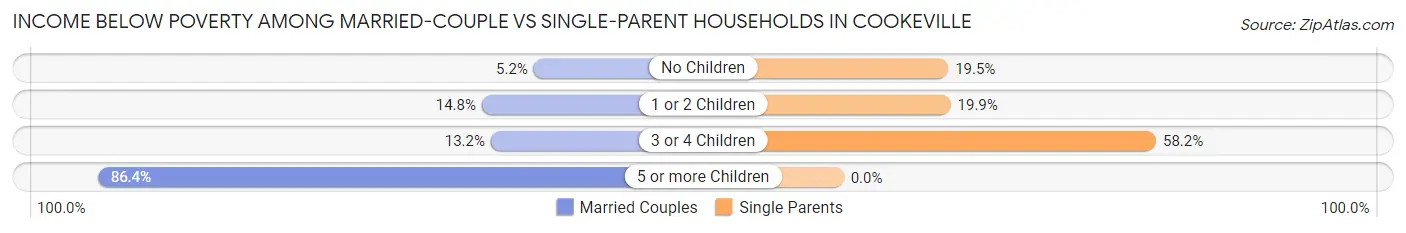
| Children | Married-Couple Families | Single-Parent Households |
| No Children | 159 (5.2%) | 177 (19.5%) |
| 1 or 2 Children | 226 (14.8%) | 257 (19.9%) |
| 3 or 4 Children | 62 (13.2%) | 103 (58.2%) |
| 5 or more Children | 57 (86.4%) | 0 (0.0%) |
| Total | 504 (9.8%) | 537 (22.6%) |
Race in Cookeville
The most populous races in Cookeville are White / Caucasian (29,953 | 85.7%), Hispanic or Latino (3,529 | 10.1%), and Two or more Races (2,161 | 6.2%).
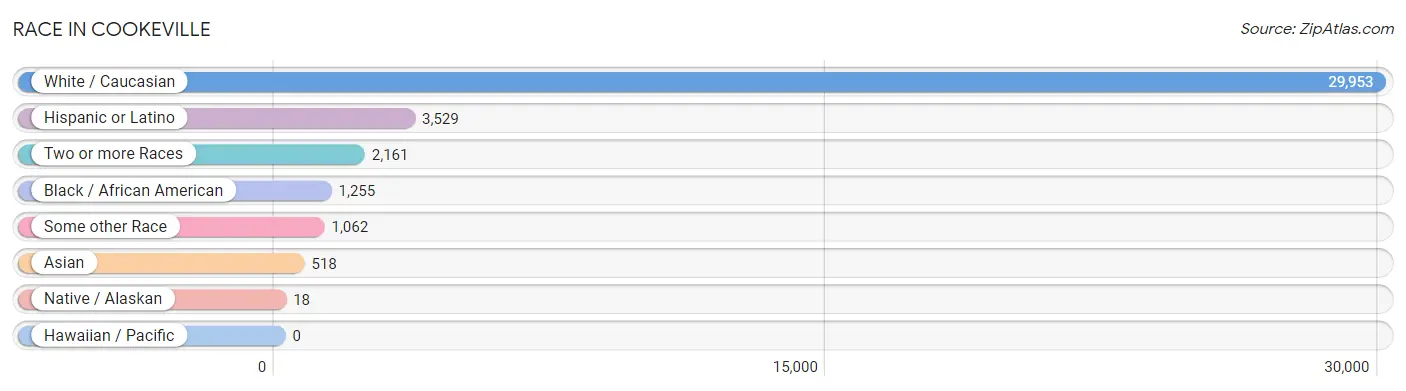
| Race | # Population | % Population |
| Asian | 518 | 1.5% |
| Black / African American | 1,255 | 3.6% |
| Hawaiian / Pacific | 0 | 0.0% |
| Hispanic or Latino | 3,529 | 10.1% |
| Native / Alaskan | 18 | 0.1% |
| White / Caucasian | 29,953 | 85.7% |
| Two or more Races | 2,161 | 6.2% |
| Some other Race | 1,062 | 3.0% |
| Total | 34,967 | 100.0% |
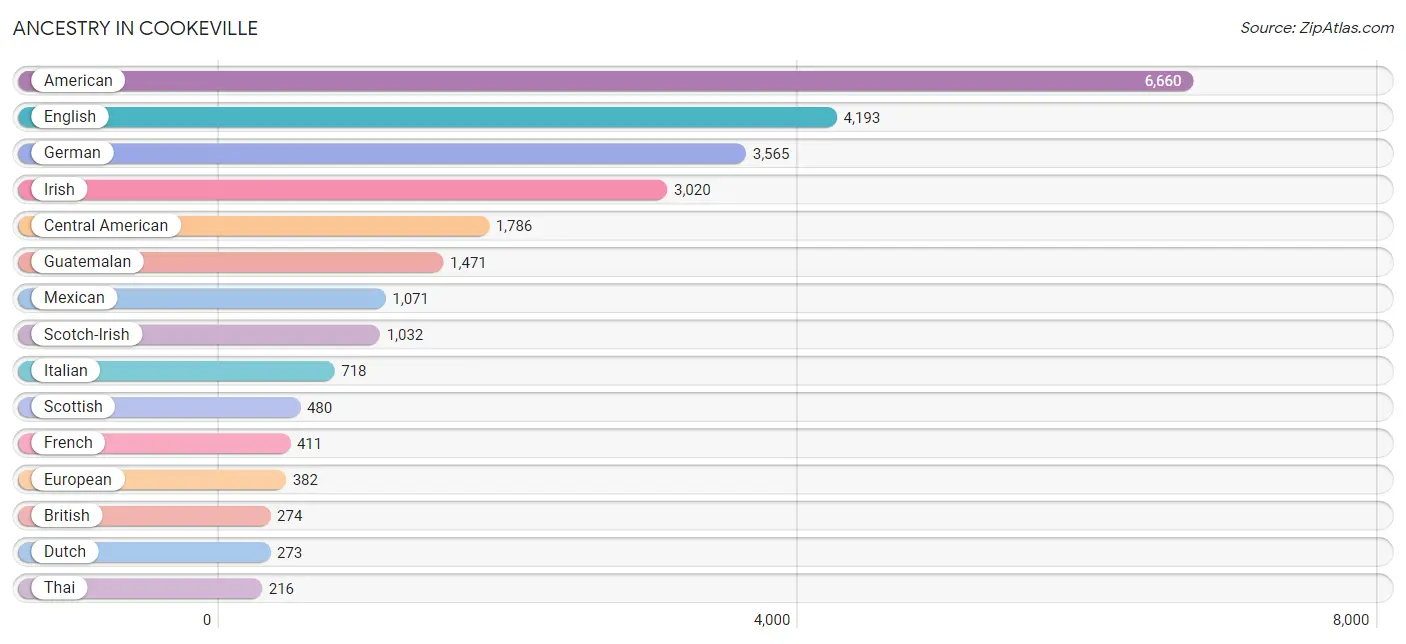
Ancestry in Cookeville
The most populous ancestries reported in Cookeville are American (6,660 | 19.1%), English (4,193 | 12.0%), German (3,565 | 10.2%), Irish (3,020 | 8.6%), and Central American (1,786 | 5.1%), together accounting for 55.0% of all Cookeville residents.
| Ancestry | # Population | % Population |
| African | 60 | 0.2% |
| American | 6,660 | 19.1% |
| Apache | 13 | 0.0% |
| Arab | 155 | 0.4% |
| Argentinean | 19 | 0.1% |
| Armenian | 31 | 0.1% |
| Australian | 11 | 0.0% |
| Austrian | 79 | 0.2% |
| Basque | 10 | 0.0% |
| Belgian | 52 | 0.2% |
| Bhutanese | 40 | 0.1% |
| Brazilian | 18 | 0.1% |
| British | 274 | 0.8% |
| Bulgarian | 20 | 0.1% |
| Burmese | 20 | 0.1% |
| Canadian | 16 | 0.1% |
| Celtic | 33 | 0.1% |
| Central American | 1,786 | 5.1% |
| Central American Indian | 28 | 0.1% |
| Cherokee | 107 | 0.3% |
| Colombian | 110 | 0.3% |
| Cuban | 106 | 0.3% |
| Czech | 24 | 0.1% |
| Czechoslovakian | 15 | 0.0% |
| Danish | 93 | 0.3% |
| Dominican | 99 | 0.3% |
| Dutch | 273 | 0.8% |
| Eastern European | 36 | 0.1% |
| Egyptian | 37 | 0.1% |
| English | 4,193 | 12.0% |
| European | 382 | 1.1% |
| Finnish | 23 | 0.1% |
| French | 411 | 1.2% |
| French American Indian | 8 | 0.0% |
| French Canadian | 180 | 0.5% |
| German | 3,565 | 10.2% |
| Greek | 37 | 0.1% |
| Guatemalan | 1,471 | 4.2% |
| Haitian | 25 | 0.1% |
| Hungarian | 15 | 0.0% |
| Indian (Asian) | 191 | 0.5% |
| Iranian | 46 | 0.1% |
| Irish | 3,020 | 8.6% |
| Italian | 718 | 2.1% |
| Jamaican | 9 | 0.0% |
| Japanese | 5 | 0.0% |
| Korean | 46 | 0.1% |
| Lebanese | 46 | 0.1% |
| Mexican | 1,071 | 3.1% |
| Mongolian | 10 | 0.0% |
| Native Hawaiian | 28 | 0.1% |
| Nicaraguan | 8 | 0.0% |
| Nigerian | 30 | 0.1% |
| Northern European | 54 | 0.2% |
| Norwegian | 210 | 0.6% |
| Pakistani | 14 | 0.0% |
| Palestinian | 11 | 0.0% |
| Panamanian | 117 | 0.3% |
| Pennsylvania German | 23 | 0.1% |
| Peruvian | 41 | 0.1% |
| Polish | 182 | 0.5% |
| Portuguese | 76 | 0.2% |
| Puerto Rican | 203 | 0.6% |
| Russian | 85 | 0.2% |
| Salvadoran | 190 | 0.5% |
| Scandinavian | 156 | 0.4% |
| Scotch-Irish | 1,032 | 2.9% |
| Scottish | 480 | 1.4% |
| Seminole | 20 | 0.1% |
| Sioux | 7 | 0.0% |
| Slavic | 16 | 0.1% |
| Slovak | 50 | 0.1% |
| South American | 204 | 0.6% |
| Spaniard | 13 | 0.0% |
| Spanish | 30 | 0.1% |
| Sri Lankan | 116 | 0.3% |
| Subsaharan African | 97 | 0.3% |
| Swedish | 153 | 0.4% |
| Swiss | 118 | 0.3% |
| Syrian | 11 | 0.0% |
| Thai | 216 | 0.6% |
| Ukrainian | 37 | 0.1% |
| Uruguayan | 8 | 0.0% |
| Venezuelan | 26 | 0.1% |
| Welsh | 67 | 0.2% | View All 85 Rows |
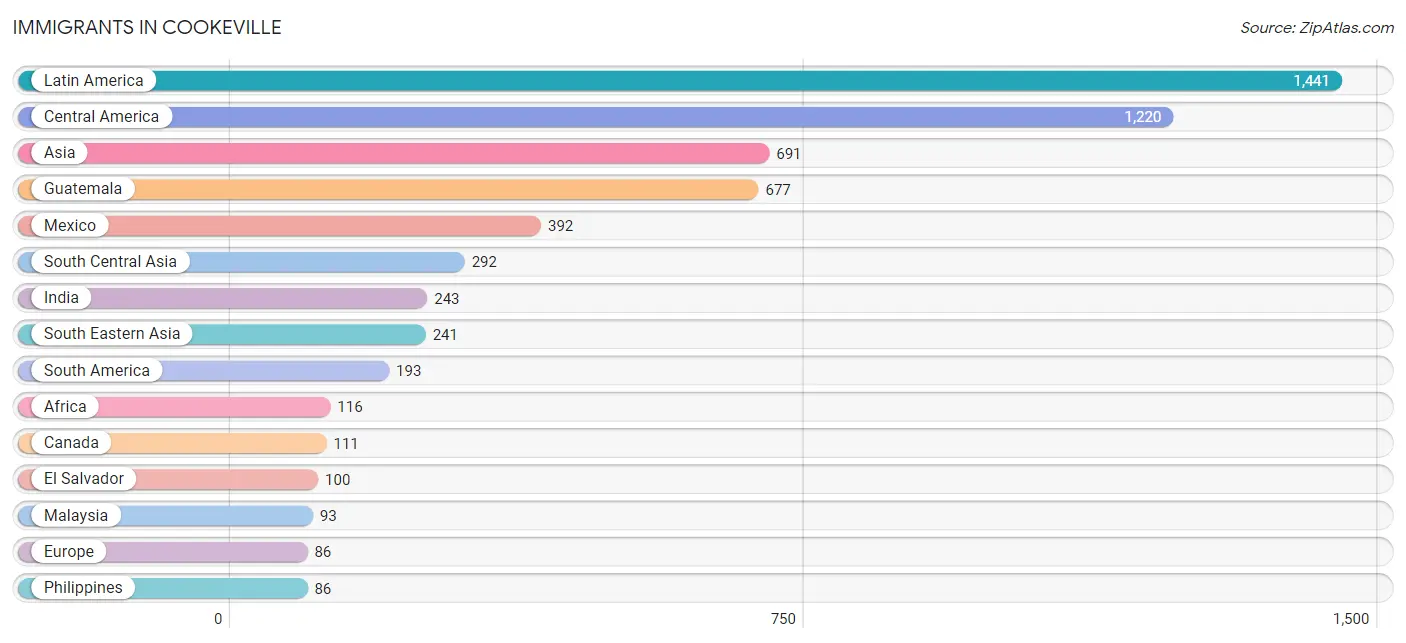
Immigrants in Cookeville
The most numerous immigrant groups reported in Cookeville came from Latin America (1,441 | 4.1%), Central America (1,220 | 3.5%), Asia (691 | 2.0%), Guatemala (677 | 1.9%), and Mexico (392 | 1.1%), together accounting for 12.7% of all Cookeville residents.
| Immigration Origin | # Population | % Population |
| Afghanistan | 14 | 0.0% |
| Africa | 116 | 0.3% |
| Argentina | 19 | 0.1% |
| Asia | 691 | 2.0% |
| Brazil | 84 | 0.2% |
| Cambodia | 5 | 0.0% |
| Cameroon | 7 | 0.0% |
| Canada | 111 | 0.3% |
| Caribbean | 28 | 0.1% |
| Central America | 1,220 | 3.5% |
| China | 58 | 0.2% |
| Colombia | 23 | 0.1% |
| Dominican Republic | 28 | 0.1% |
| Eastern Asia | 80 | 0.2% |
| Eastern Europe | 18 | 0.1% |
| Egypt | 37 | 0.1% |
| El Salvador | 100 | 0.3% |
| England | 4 | 0.0% |
| Europe | 86 | 0.3% |
| Germany | 58 | 0.2% |
| Guatemala | 677 | 1.9% |
| India | 243 | 0.7% |
| Iran | 35 | 0.1% |
| Japan | 7 | 0.0% |
| Korea | 15 | 0.0% |
| Kuwait | 9 | 0.0% |
| Latin America | 1,441 | 4.1% |
| Malaysia | 93 | 0.3% |
| Mexico | 392 | 1.1% |
| Middle Africa | 7 | 0.0% |
| Nicaragua | 8 | 0.0% |
| Nigeria | 72 | 0.2% |
| Northern Africa | 37 | 0.1% |
| Northern Europe | 4 | 0.0% |
| Panama | 43 | 0.1% |
| Peru | 41 | 0.1% |
| Philippines | 86 | 0.3% |
| Poland | 14 | 0.0% |
| Russia | 4 | 0.0% |
| Saudi Arabia | 39 | 0.1% |
| South America | 193 | 0.5% |
| South Central Asia | 292 | 0.8% |
| South Eastern Asia | 241 | 0.7% |
| Southern Europe | 6 | 0.0% |
| Spain | 6 | 0.0% |
| Syria | 11 | 0.0% |
| Taiwan | 27 | 0.1% |
| Thailand | 14 | 0.0% |
| Venezuela | 26 | 0.1% |
| Vietnam | 43 | 0.1% |
| Western Africa | 72 | 0.2% |
| Western Asia | 78 | 0.2% |
| Western Europe | 58 | 0.2% |
| Yemen | 19 | 0.1% | View All 54 Rows |
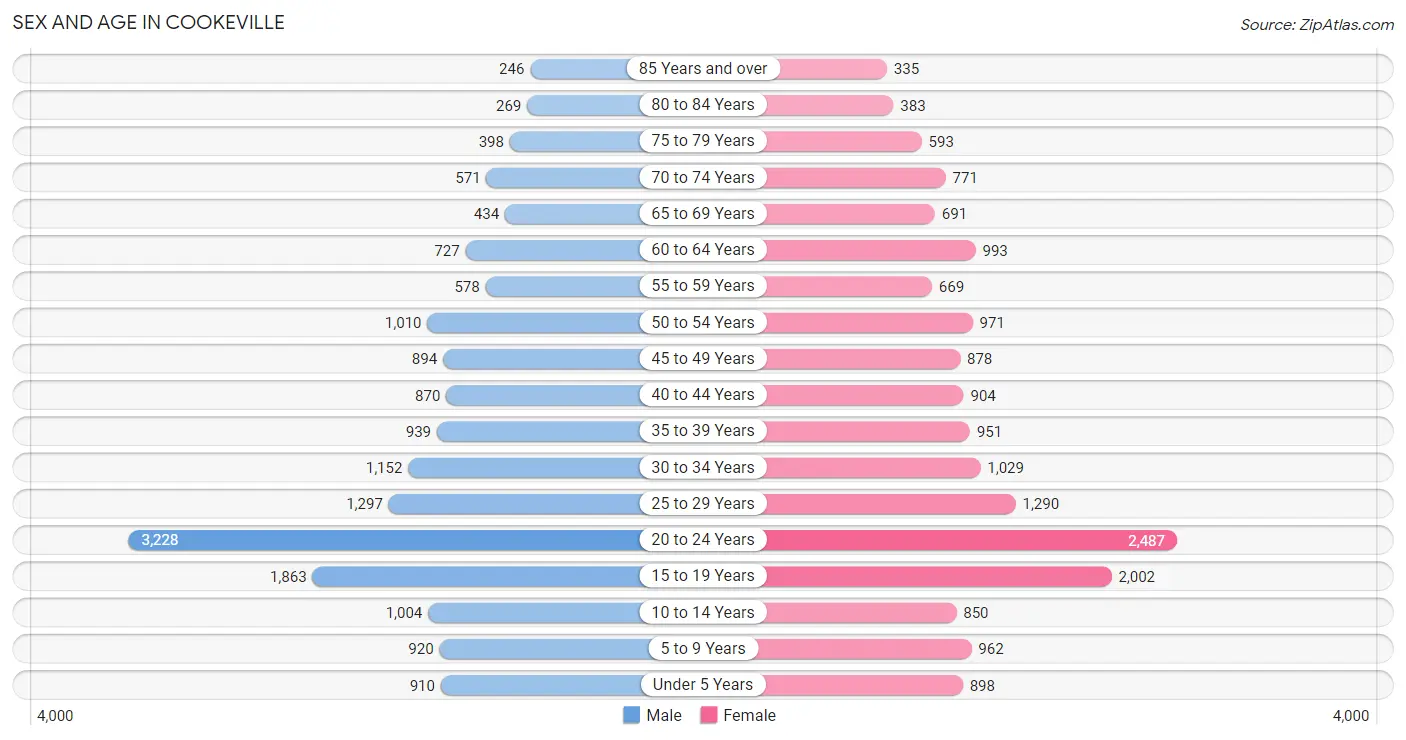
Sex and Age in Cookeville
Sex and Age in Cookeville
The most populous age groups in Cookeville are 20 to 24 Years (3,228 | 18.6%) for men and 20 to 24 Years (2,487 | 14.1%) for women.
| Age Bracket | Male | Female |
| Under 5 Years | 910 (5.3%) | 898 (5.1%) |
| 5 to 9 Years | 920 (5.3%) | 962 (5.4%) |
| 10 to 14 Years | 1,004 (5.8%) | 850 (4.8%) |
| 15 to 19 Years | 1,863 (10.8%) | 2,002 (11.3%) |
| 20 to 24 Years | 3,228 (18.6%) | 2,487 (14.1%) |
| 25 to 29 Years | 1,297 (7.5%) | 1,290 (7.3%) |
| 30 to 34 Years | 1,152 (6.7%) | 1,029 (5.8%) |
| 35 to 39 Years | 939 (5.4%) | 951 (5.4%) |
| 40 to 44 Years | 870 (5.0%) | 904 (5.1%) |
| 45 to 49 Years | 894 (5.2%) | 878 (5.0%) |
| 50 to 54 Years | 1,010 (5.8%) | 971 (5.5%) |
| 55 to 59 Years | 578 (3.3%) | 669 (3.8%) |
| 60 to 64 Years | 727 (4.2%) | 993 (5.6%) |
| 65 to 69 Years | 434 (2.5%) | 691 (3.9%) |
| 70 to 74 Years | 571 (3.3%) | 771 (4.4%) |
| 75 to 79 Years | 398 (2.3%) | 593 (3.4%) |
| 80 to 84 Years | 269 (1.5%) | 383 (2.2%) |
| 85 Years and over | 246 (1.4%) | 335 (1.9%) |
| Total | 17,310 (100.0%) | 17,657 (100.0%) |
Families and Households in Cookeville
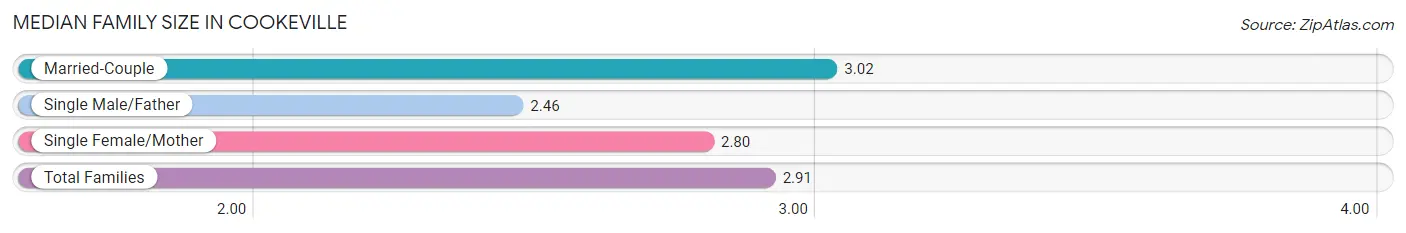
Median Family Size in Cookeville
The median family size in Cookeville is 2.91 persons per family, with married-couple families (5,131 | 68.3%) accounting for the largest median family size of 3.02 persons per family. On the other hand, single male/father families (867 | 11.6%) represent the smallest median family size with 2.46 persons per family.
| Family Type | # Families | Family Size |
| Married-Couple | 5,131 (68.3%) | 3.02 |
| Single Male/Father | 867 (11.6%) | 2.46 |
| Single Female/Mother | 1,509 (20.1%) | 2.80 |
| Total Families | 7,507 (100.0%) | 2.91 |
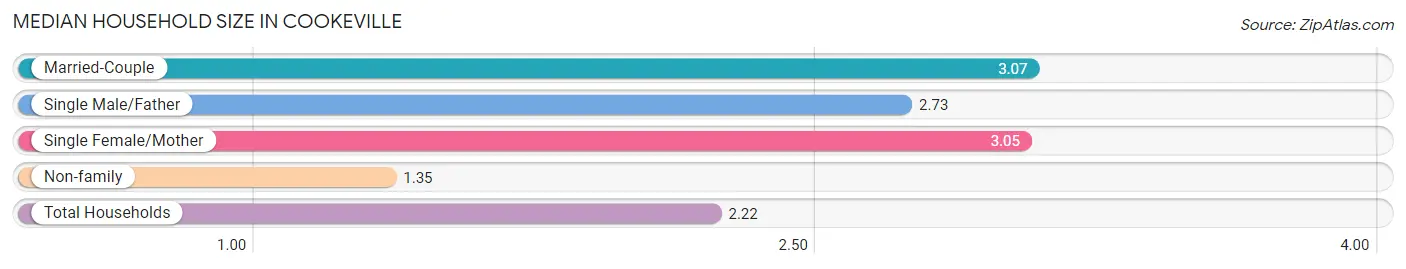
Median Household Size in Cookeville
The median household size in Cookeville is 2.22 persons per household, with married-couple households (5,131 | 35.7%) accounting for the largest median household size of 3.07 persons per household. non-family households (6,866 | 47.8%) represent the smallest median household size with 1.35 persons per household.
| Household Type | # Households | Household Size |
| Married-Couple | 5,131 (35.7%) | 3.07 |
| Single Male/Father | 867 (6.0%) | 2.73 |
| Single Female/Mother | 1,509 (10.5%) | 3.05 |
| Non-family | 6,866 (47.8%) | 1.35 |
| Total Households | 14,373 (100.0%) | 2.22 |
Household Size by Marriage Status in Cookeville
Out of a total of 14,373 households in Cookeville, 7,507 (52.2%) are family households, while 6,866 (47.8%) are nonfamily households. The most numerous type of family households are 2-person households, comprising 3,479, and the most common type of nonfamily households are 1-person households, comprising 4,895.
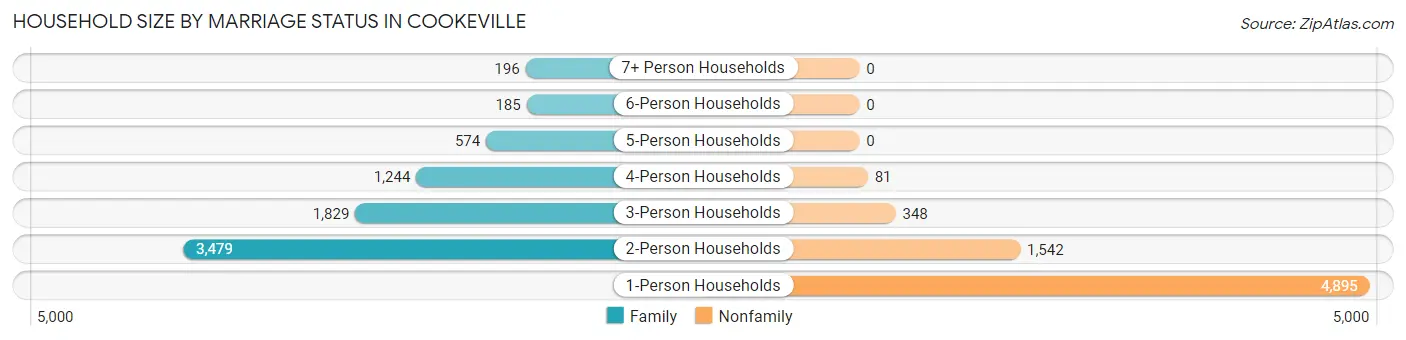
| Household Size | Family Households | Nonfamily Households |
| 1-Person Households | - | 4,895 (34.1%) |
| 2-Person Households | 3,479 (24.2%) | 1,542 (10.7%) |
| 3-Person Households | 1,829 (12.7%) | 348 (2.4%) |
| 4-Person Households | 1,244 (8.7%) | 81 (0.6%) |
| 5-Person Households | 574 (4.0%) | 0 (0.0%) |
| 6-Person Households | 185 (1.3%) | 0 (0.0%) |
| 7+ Person Households | 196 (1.4%) | 0 (0.0%) |
| Total | 7,507 (52.2%) | 6,866 (47.8%) |
Female Fertility in Cookeville
Fertility by Age in Cookeville
Average fertility rate in Cookeville is 43.0 births per 1,000 women. Women in the age bracket of 20 to 34 years have the highest fertility rate with 65.0 births per 1,000 women. Women in the age bracket of 20 to 34 years acount for 72.8% of all women with births.
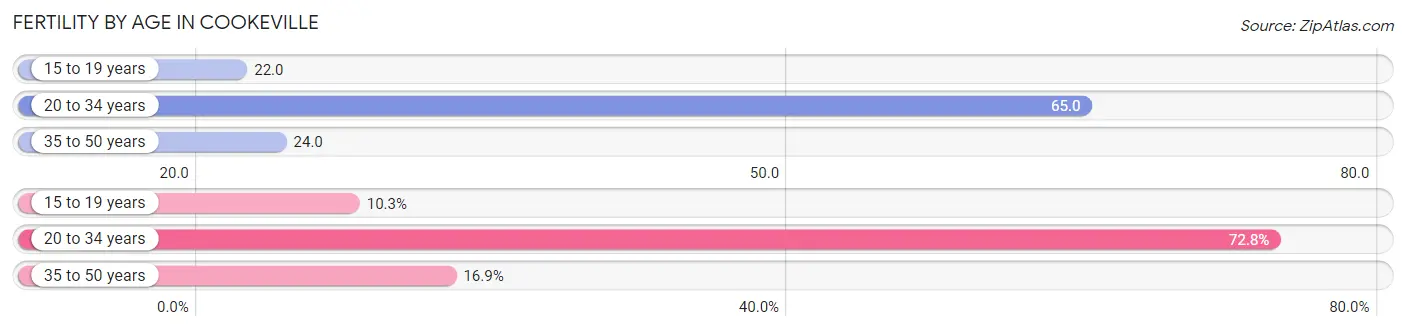
| Age Bracket | Women with Births | Births / 1,000 Women |
| 15 to 19 years | 44 (10.3%) | 22.0 |
| 20 to 34 years | 311 (72.8%) | 65.0 |
| 35 to 50 years | 72 (16.9%) | 24.0 |
| Total | 427 (100.0%) | 43.0 |
Fertility by Age by Marriage Status in Cookeville
63.0% of women with births (427) in Cookeville are married. The highest percentage of unmarried women with births falls into 15 to 19 years age bracket with 100.0% of them unmarried at the time of birth, while the lowest percentage of unmarried women with births belong to 35 to 50 years age bracket with 0.0% of them unmarried.
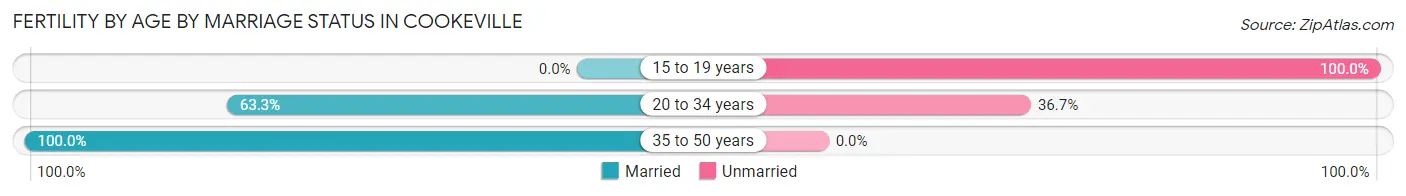
| Age Bracket | Married | Unmarried |
| 15 to 19 years | 0 (0.0%) | 44 (100.0%) |
| 20 to 34 years | 197 (63.3%) | 114 (36.7%) |
| 35 to 50 years | 72 (100.0%) | 0 (0.0%) |
| Total | 269 (63.0%) | 158 (37.0%) |
Fertility by Education in Cookeville
Average fertility rate in Cookeville is 43.0 births per 1,000 women. Women with the education attainment of graduate degree have the highest fertility rate of 72.0 births per 1,000 women, while women with the education attainment of college or associate's degree have the lowest fertility at 20.0 births per 1,000 women. Women with the education attainment of bachelor's degree represent 28.6% of all women with births.
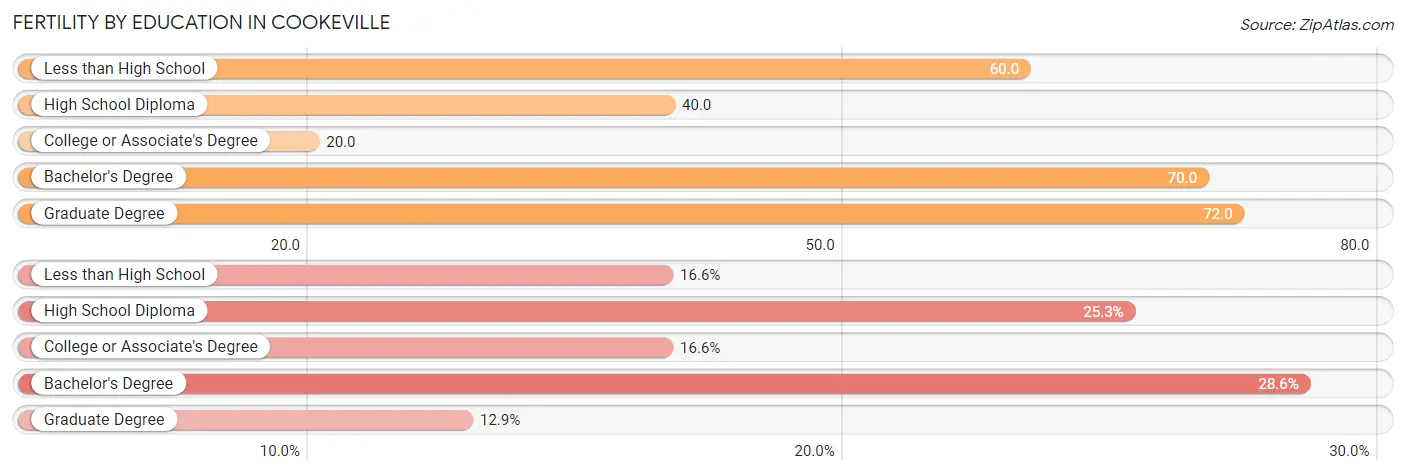
| Educational Attainment | Women with Births | Births / 1,000 Women |
| Less than High School | 71 (16.6%) | 60.0 |
| High School Diploma | 108 (25.3%) | 40.0 |
| College or Associate's Degree | 71 (16.6%) | 20.0 |
| Bachelor's Degree | 122 (28.6%) | 70.0 |
| Graduate Degree | 55 (12.9%) | 72.0 |
| Total | 427 (100.0%) | 43.0 |
Fertility by Education by Marriage Status in Cookeville
37.0% of women with births in Cookeville are unmarried. Women with the educational attainment of bachelor's degree are most likely to be married with 100.0% of them married at childbirth, while women with the educational attainment of less than high school are least likely to be married with 73.2% of them unmarried at childbirth.
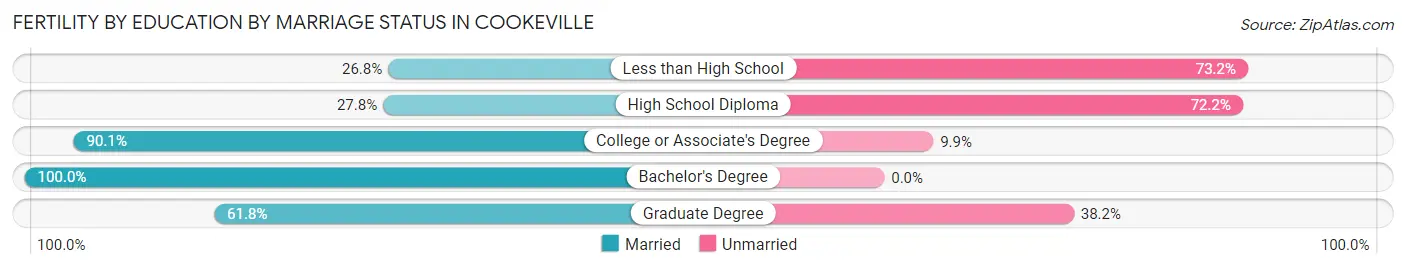
| Educational Attainment | Married | Unmarried |
| Less than High School | 19 (26.8%) | 52 (73.2%) |
| High School Diploma | 30 (27.8%) | 78 (72.2%) |
| College or Associate's Degree | 64 (90.1%) | 7 (9.9%) |
| Bachelor's Degree | 122 (100.0%) | 0 (0.0%) |
| Graduate Degree | 34 (61.8%) | 21 (38.2%) |
| Total | 269 (63.0%) | 158 (37.0%) |
Employment Characteristics in Cookeville
Employment by Class of Employer in Cookeville
Among the 16,097 employed individuals in Cookeville, private company employees (11,287 | 70.1%), state government employees (1,310 | 8.1%), and self-employed (not incorporated) (1,227 | 7.6%) make up the most common classes of employment.
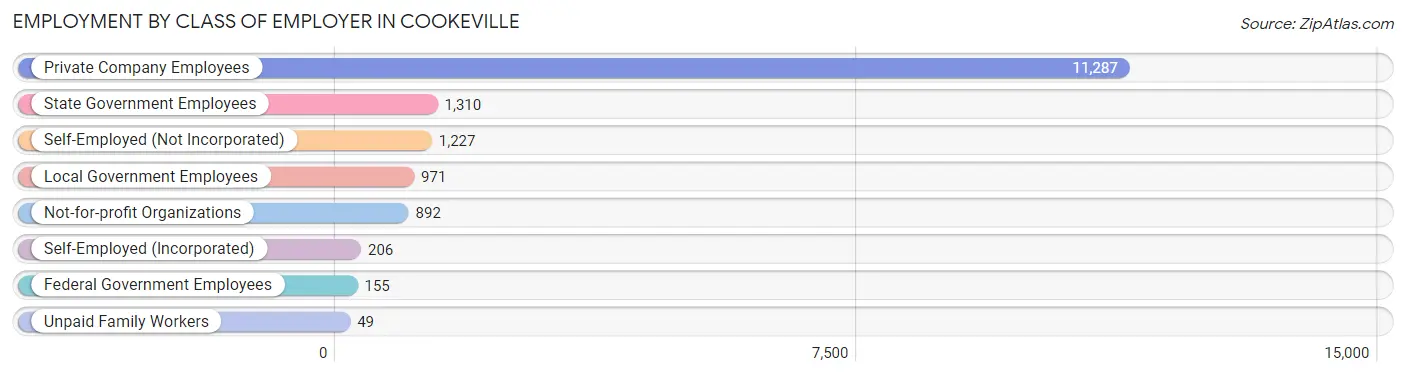
| Employer Class | # Employees | % Employees |
| Private Company Employees | 11,287 | 70.1% |
| Self-Employed (Incorporated) | 206 | 1.3% |
| Self-Employed (Not Incorporated) | 1,227 | 7.6% |
| Not-for-profit Organizations | 892 | 5.5% |
| Local Government Employees | 971 | 6.0% |
| State Government Employees | 1,310 | 8.1% |
| Federal Government Employees | 155 | 1.0% |
| Unpaid Family Workers | 49 | 0.3% |
| Total | 16,097 | 100.0% |
Employment Status by Age in Cookeville
According to the labor force statistics for Cookeville, out of the total population over 16 years of age (29,065), 60.0% or 17,439 individuals are in the labor force, with 6.1% or 1,064 of them unemployed. The age group with the highest labor force participation rate is 30 to 34 years, with 84.8% or 1,849 individuals in the labor force. Within the labor force, the 16 to 19 years age range has the highest percentage of unemployed individuals, with 24.7% or 346 of them being unemployed.

| Age Bracket | In Labor Force | Unemployed |
| 16 to 19 Years | 1,399 (39.9%) | 346 (24.7%) |
| 20 to 24 Years | 3,806 (66.6%) | 365 (9.6%) |
| 25 to 29 Years | 1,987 (76.8%) | 111 (5.6%) |
| 30 to 34 Years | 1,849 (84.8%) | 44 (2.4%) |
| 35 to 44 Years | 3,070 (83.8%) | 37 (1.2%) |
| 45 to 54 Years | 3,104 (82.7%) | 28 (0.9%) |
| 55 to 59 Years | 622 (49.9%) | 46 (7.4%) |
| 60 to 64 Years | 1,027 (59.7%) | 58 (5.6%) |
| 65 to 74 Years | 444 (18.0%) | 26 (5.9%) |
| 75 Years and over | 122 (5.5%) | 9 (7.3%) |
| Total | 17,439 (60.0%) | 1,064 (6.1%) |
Employment Status by Educational Attainment in Cookeville
According to labor force statistics for Cookeville, 76.9% of individuals (11,652) out of the total population between 25 and 64 years of age (15,152) are in the labor force, with 2.8% or 326 of them being unemployed. The group with the highest labor force participation rate are those with the educational attainment of bachelor's degree or higher, with 83.4% or 4,357 individuals in the labor force. Within the labor force, individuals with high school diploma education have the highest percentage of unemployment, with 5.5% or 178 of them being unemployed.
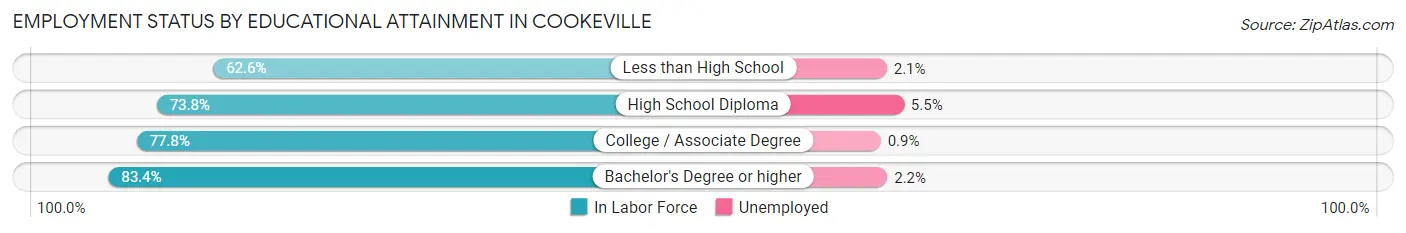
| Educational Attainment | In Labor Force | Unemployed |
| Less than High School | 1,018 (62.6%) | 34 (2.1%) |
| High School Diploma | 3,242 (73.8%) | 242 (5.5%) |
| College / Associate Degree | 3,041 (77.8%) | 35 (0.9%) |
| Bachelor's Degree or higher | 4,357 (83.4%) | 115 (2.2%) |
| Total | 11,652 (76.9%) | 424 (2.8%) |
Employment Occupations by Sex in Cookeville
Management, Business, Science and Arts Occupations
The most common Management, Business, Science and Arts occupations in Cookeville are Community & Social Service (2,127 | 13.0%), Management (1,432 | 8.8%), Education Instruction & Library (1,296 | 7.9%), Health Diagnosing & Treating (1,057 | 6.5%), and Computers, Engineering & Science (906 | 5.5%).
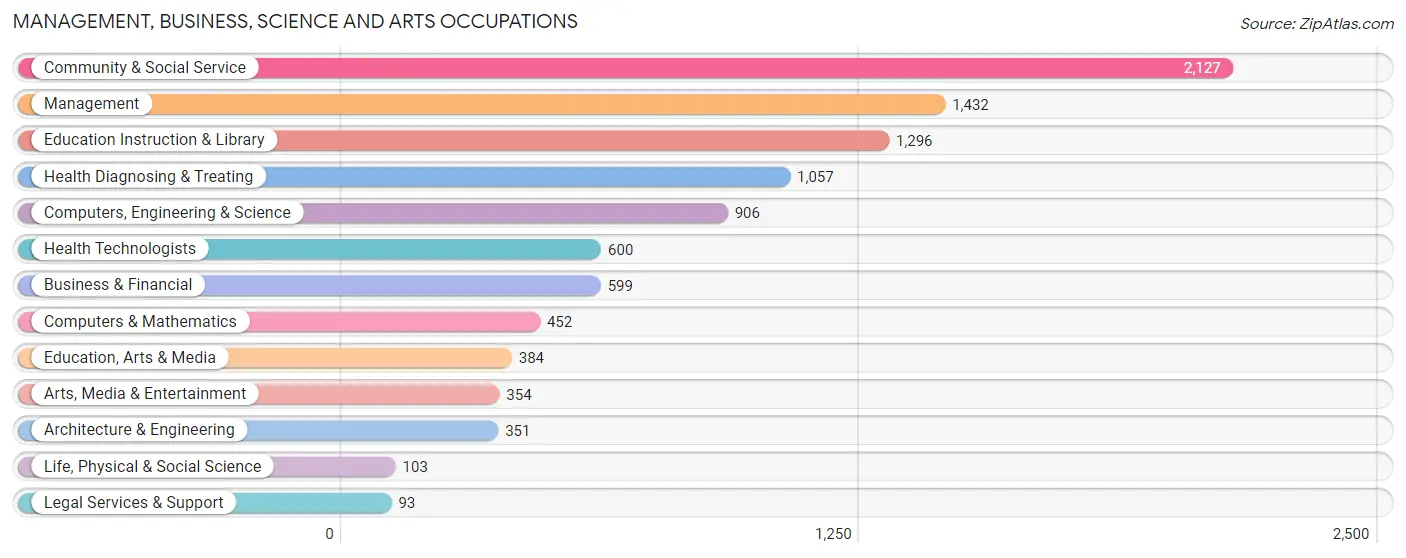
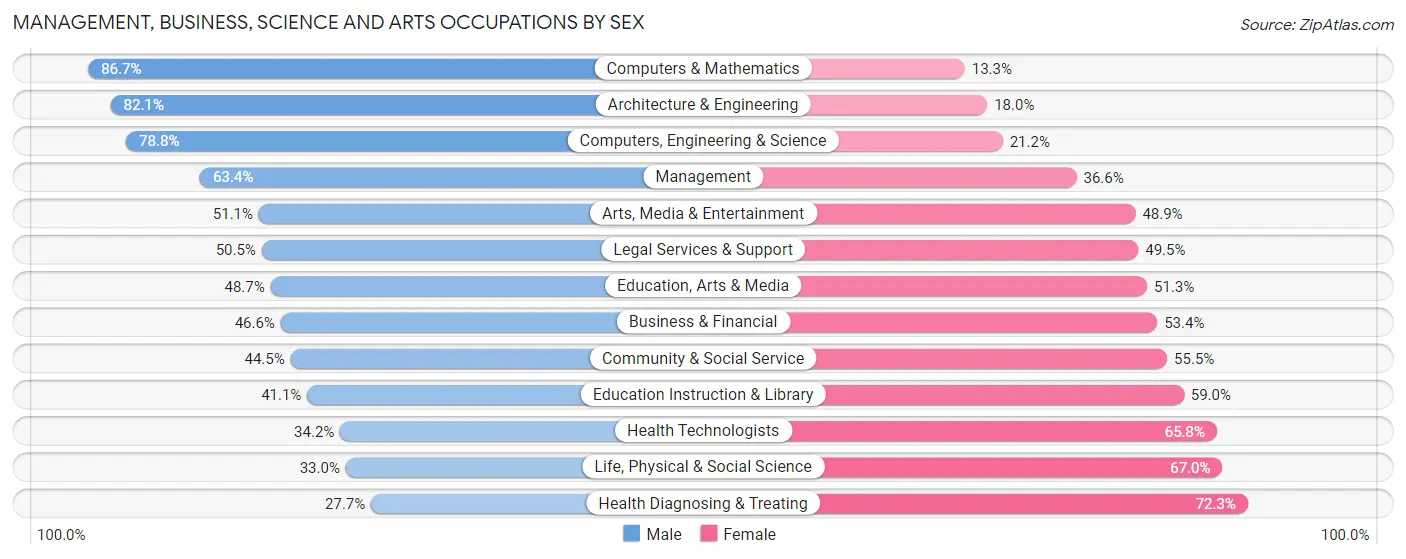
Management, Business, Science and Arts Occupations by Sex
Within the Management, Business, Science and Arts occupations in Cookeville, the most male-oriented occupations are Computers & Mathematics (86.7%), Architecture & Engineering (82.1%), and Computers, Engineering & Science (78.8%), while the most female-oriented occupations are Health Diagnosing & Treating (72.3%), Life, Physical & Social Science (67.0%), and Health Technologists (65.8%).
| Occupation | Male | Female |
| Management | 908 (63.4%) | 524 (36.6%) |
| Business & Financial | 279 (46.6%) | 320 (53.4%) |
| Computers, Engineering & Science | 714 (78.8%) | 192 (21.2%) |
| Computers & Mathematics | 392 (86.7%) | 60 (13.3%) |
| Architecture & Engineering | 288 (82.1%) | 63 (17.9%) |
| Life, Physical & Social Science | 34 (33.0%) | 69 (67.0%) |
| Community & Social Service | 947 (44.5%) | 1,180 (55.5%) |
| Education, Arts & Media | 187 (48.7%) | 197 (51.3%) |
| Legal Services & Support | 47 (50.5%) | 46 (49.5%) |
| Education Instruction & Library | 532 (41.0%) | 764 (59.0%) |
| Arts, Media & Entertainment | 181 (51.1%) | 173 (48.9%) |
| Health Diagnosing & Treating | 293 (27.7%) | 764 (72.3%) |
| Health Technologists | 205 (34.2%) | 395 (65.8%) |
| Total (Category) | 3,141 (51.3%) | 2,980 (48.7%) |
| Total (Overall) | 8,658 (53.0%) | 7,688 (47.0%) |
Services Occupations
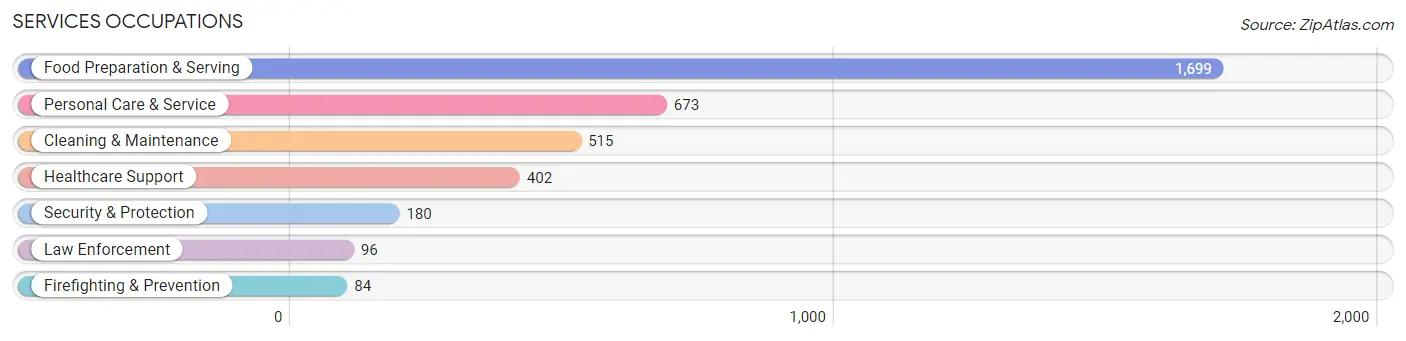
The most common Services occupations in Cookeville are Food Preparation & Serving (1,699 | 10.4%), Personal Care & Service (673 | 4.1%), Cleaning & Maintenance (515 | 3.2%), Healthcare Support (402 | 2.5%), and Security & Protection (180 | 1.1%).
Services Occupations by Sex
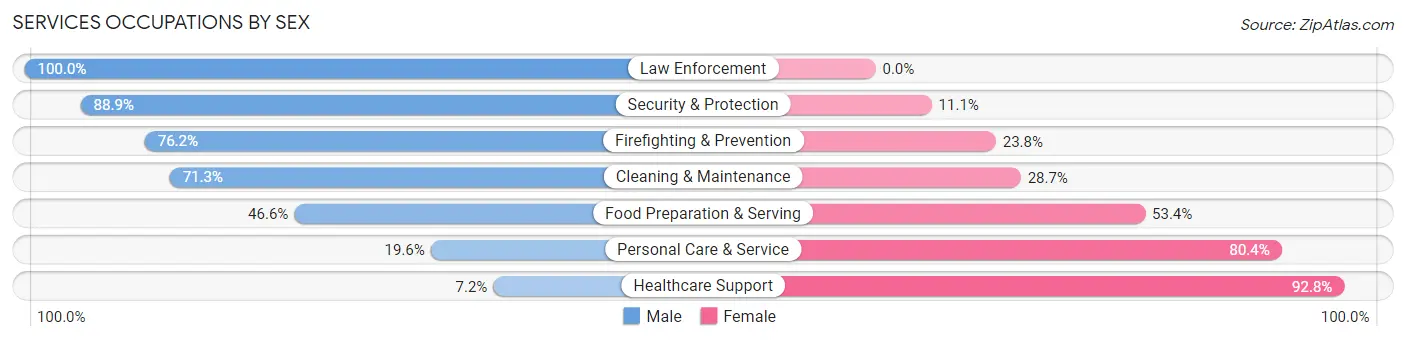
Within the Services occupations in Cookeville, the most male-oriented occupations are Law Enforcement (100.0%), Security & Protection (88.9%), and Firefighting & Prevention (76.2%), while the most female-oriented occupations are Healthcare Support (92.8%), Personal Care & Service (80.4%), and Food Preparation & Serving (53.4%).
| Occupation | Male | Female |
| Healthcare Support | 29 (7.2%) | 373 (92.8%) |
| Security & Protection | 160 (88.9%) | 20 (11.1%) |
| Firefighting & Prevention | 64 (76.2%) | 20 (23.8%) |
| Law Enforcement | 96 (100.0%) | 0 (0.0%) |
| Food Preparation & Serving | 792 (46.6%) | 907 (53.4%) |
| Cleaning & Maintenance | 367 (71.3%) | 148 (28.7%) |
| Personal Care & Service | 132 (19.6%) | 541 (80.4%) |
| Total (Category) | 1,480 (42.7%) | 1,989 (57.3%) |
| Total (Overall) | 8,658 (53.0%) | 7,688 (47.0%) |
Sales and Office Occupations
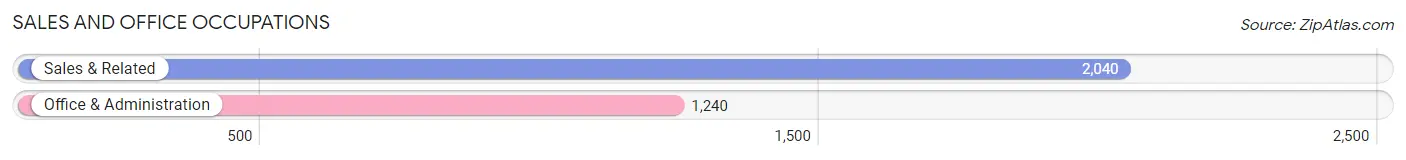
The most common Sales and Office occupations in Cookeville are Sales & Related (2,040 | 12.5%), and Office & Administration (1,240 | 7.6%).
Sales and Office Occupations by Sex
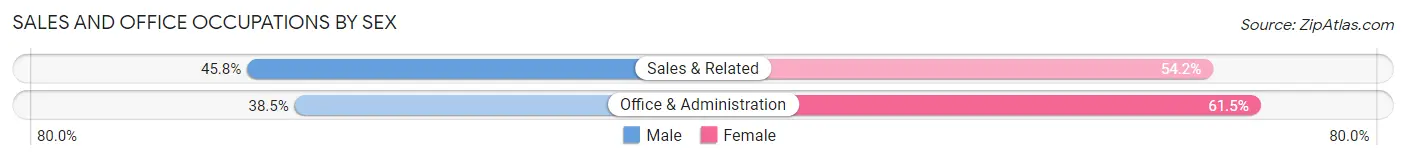
| Occupation | Male | Female |
| Sales & Related | 934 (45.8%) | 1,106 (54.2%) |
| Office & Administration | 477 (38.5%) | 763 (61.5%) |
| Total (Category) | 1,411 (43.0%) | 1,869 (57.0%) |
| Total (Overall) | 8,658 (53.0%) | 7,688 (47.0%) |
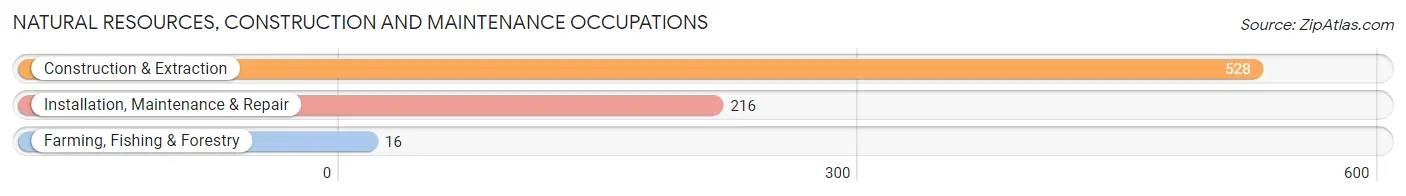
Natural Resources, Construction and Maintenance Occupations
The most common Natural Resources, Construction and Maintenance occupations in Cookeville are Construction & Extraction (528 | 3.2%), Installation, Maintenance & Repair (216 | 1.3%), and Farming, Fishing & Forestry (16 | 0.1%).
Natural Resources, Construction and Maintenance Occupations by Sex
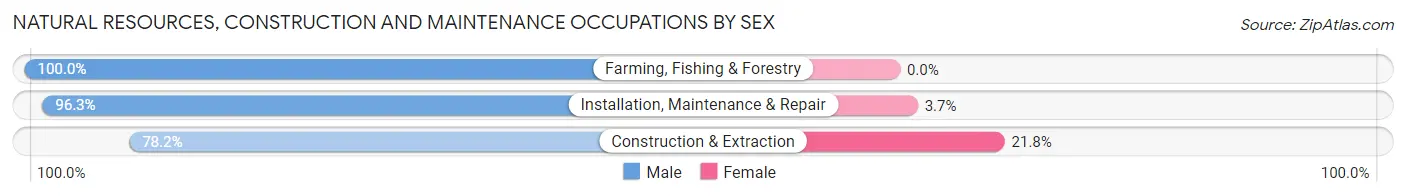
| Occupation | Male | Female |
| Farming, Fishing & Forestry | 16 (100.0%) | 0 (0.0%) |
| Construction & Extraction | 413 (78.2%) | 115 (21.8%) |
| Installation, Maintenance & Repair | 208 (96.3%) | 8 (3.7%) |
| Total (Category) | 637 (83.8%) | 123 (16.2%) |
| Total (Overall) | 8,658 (53.0%) | 7,688 (47.0%) |
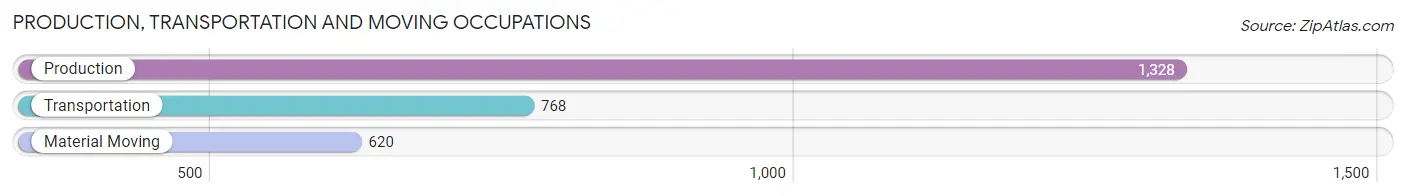
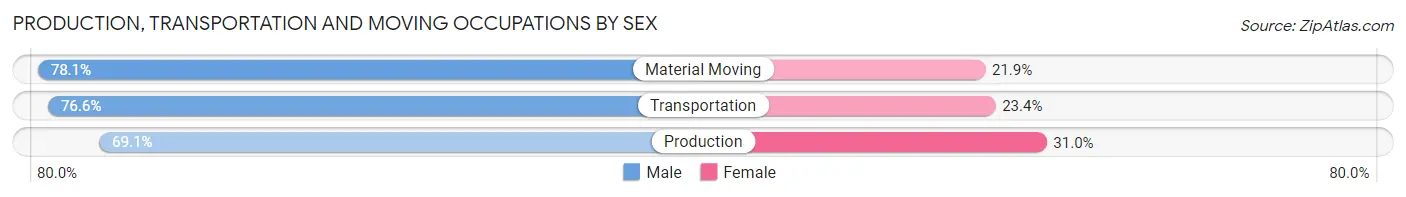
Production, Transportation and Moving Occupations
The most common Production, Transportation and Moving occupations in Cookeville are Production (1,328 | 8.1%), Transportation (768 | 4.7%), and Material Moving (620 | 3.8%).
Production, Transportation and Moving Occupations by Sex
| Occupation | Male | Female |
| Production | 917 (69.1%) | 411 (30.9%) |
| Transportation | 588 (76.6%) | 180 (23.4%) |
| Material Moving | 484 (78.1%) | 136 (21.9%) |
| Total (Category) | 1,989 (73.2%) | 727 (26.8%) |
| Total (Overall) | 8,658 (53.0%) | 7,688 (47.0%) |
Employment Industries by Sex in Cookeville
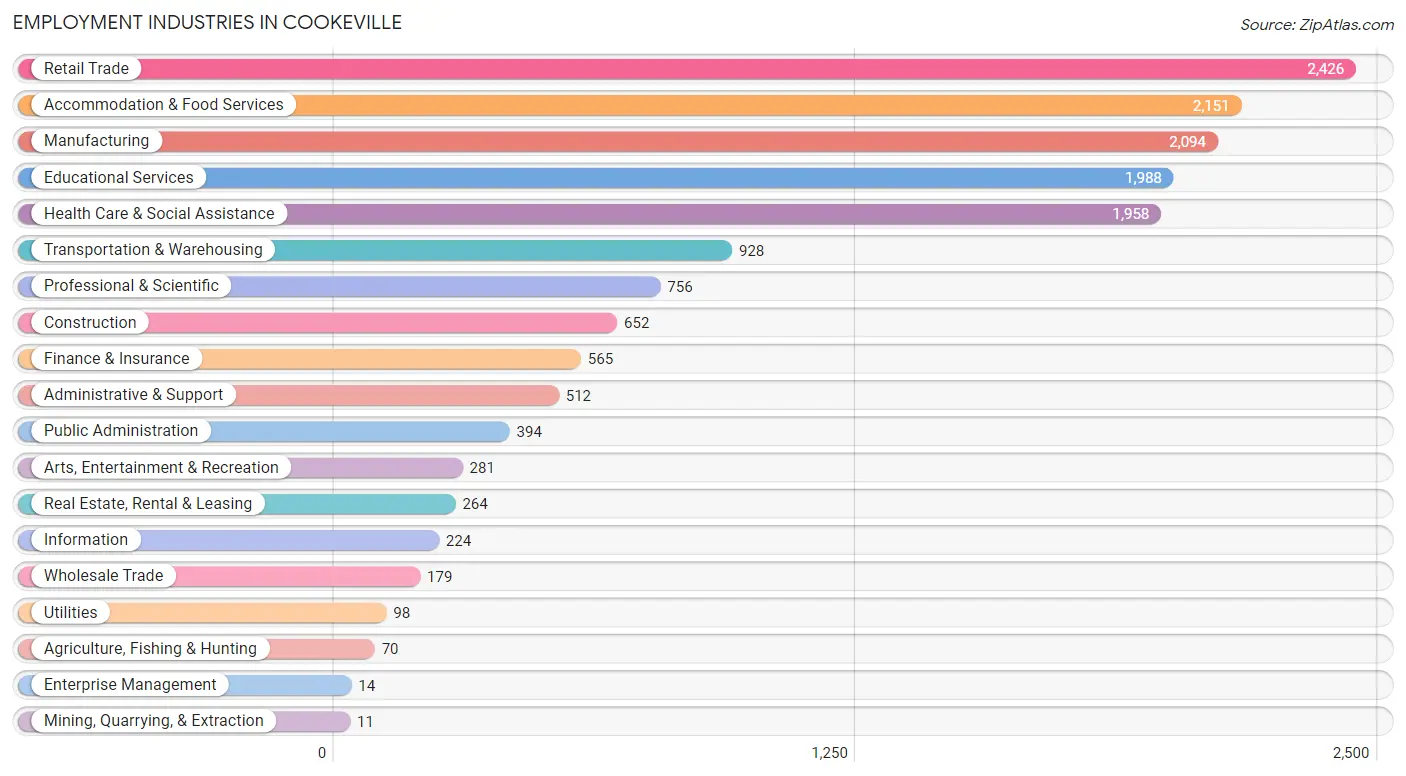
Employment Industries in Cookeville
The major employment industries in Cookeville include Retail Trade (2,426 | 14.8%), Accommodation & Food Services (2,151 | 13.2%), Manufacturing (2,094 | 12.8%), Educational Services (1,988 | 12.2%), and Health Care & Social Assistance (1,958 | 12.0%).
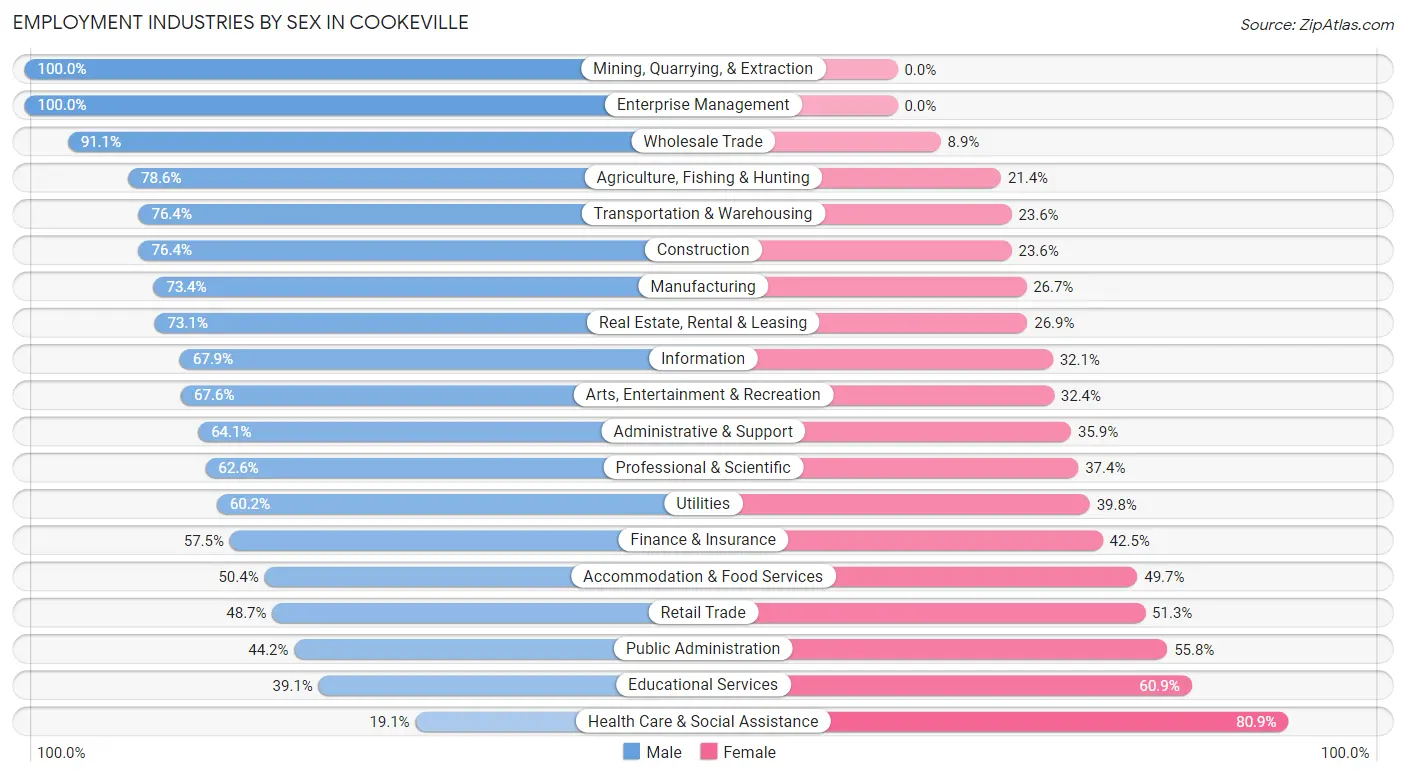
Employment Industries by Sex in Cookeville
The Cookeville industries that see more men than women are Mining, Quarrying, & Extraction (100.0%), Enterprise Management (100.0%), and Wholesale Trade (91.1%), whereas the industries that tend to have a higher number of women are Health Care & Social Assistance (80.9%), Educational Services (60.9%), and Public Administration (55.8%).
| Industry | Male | Female |
| Agriculture, Fishing & Hunting | 55 (78.6%) | 15 (21.4%) |
| Mining, Quarrying, & Extraction | 11 (100.0%) | 0 (0.0%) |
| Construction | 498 (76.4%) | 154 (23.6%) |
| Manufacturing | 1,536 (73.4%) | 558 (26.7%) |
| Wholesale Trade | 163 (91.1%) | 16 (8.9%) |
| Retail Trade | 1,182 (48.7%) | 1,244 (51.3%) |
| Transportation & Warehousing | 709 (76.4%) | 219 (23.6%) |
| Utilities | 59 (60.2%) | 39 (39.8%) |
| Information | 152 (67.9%) | 72 (32.1%) |
| Finance & Insurance | 325 (57.5%) | 240 (42.5%) |
| Real Estate, Rental & Leasing | 193 (73.1%) | 71 (26.9%) |
| Professional & Scientific | 473 (62.6%) | 283 (37.4%) |
| Enterprise Management | 14 (100.0%) | 0 (0.0%) |
| Administrative & Support | 328 (64.1%) | 184 (35.9%) |
| Educational Services | 778 (39.1%) | 1,210 (60.9%) |
| Health Care & Social Assistance | 374 (19.1%) | 1,584 (80.9%) |
| Arts, Entertainment & Recreation | 190 (67.6%) | 91 (32.4%) |
| Accommodation & Food Services | 1,083 (50.3%) | 1,068 (49.6%) |
| Public Administration | 174 (44.2%) | 220 (55.8%) |
| Total | 8,658 (53.0%) | 7,688 (47.0%) |
Education in Cookeville
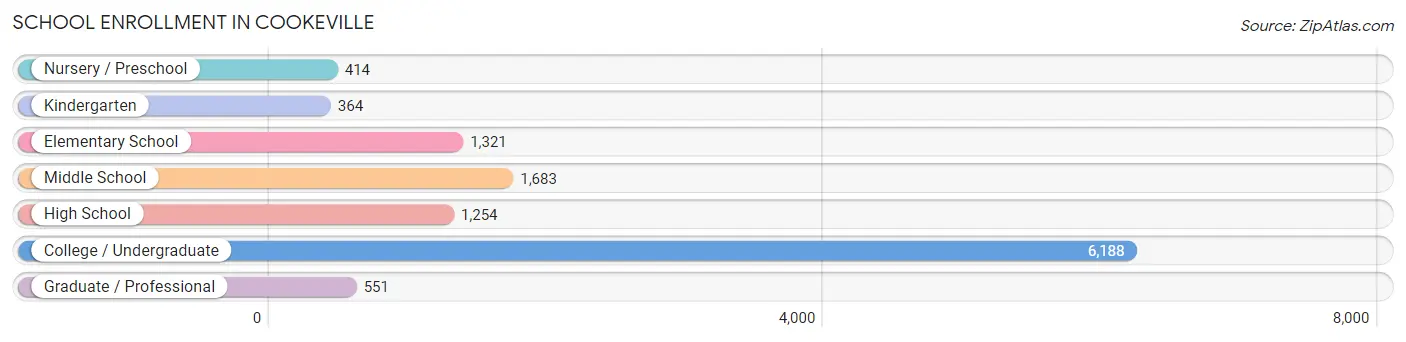
School Enrollment in Cookeville
The most common levels of schooling among the 11,775 students in Cookeville are college / undergraduate (6,188 | 52.5%), middle school (1,683 | 14.3%), and elementary school (1,321 | 11.2%).
| School Level | # Students | % Students |
| Nursery / Preschool | 414 | 3.5% |
| Kindergarten | 364 | 3.1% |
| Elementary School | 1,321 | 11.2% |
| Middle School | 1,683 | 14.3% |
| High School | 1,254 | 10.6% |
| College / Undergraduate | 6,188 | 52.5% |
| Graduate / Professional | 551 | 4.7% |
| Total | 11,775 | 100.0% |
School Enrollment by Age by Funding Source in Cookeville
Out of a total of 11,775 students who are enrolled in schools in Cookeville, 1,389 (11.8%) attend a private institution, while the remaining 10,386 (88.2%) are enrolled in public schools. The age group of 3 to 4 year olds has the highest likelihood of being enrolled in private schools, with 46 (26.1% in the age bracket) enrolled. Conversely, the age group of 25 to 34 year olds has the lowest likelihood of being enrolled in a private school, with 437 (96.0% in the age bracket) attending a public institution.
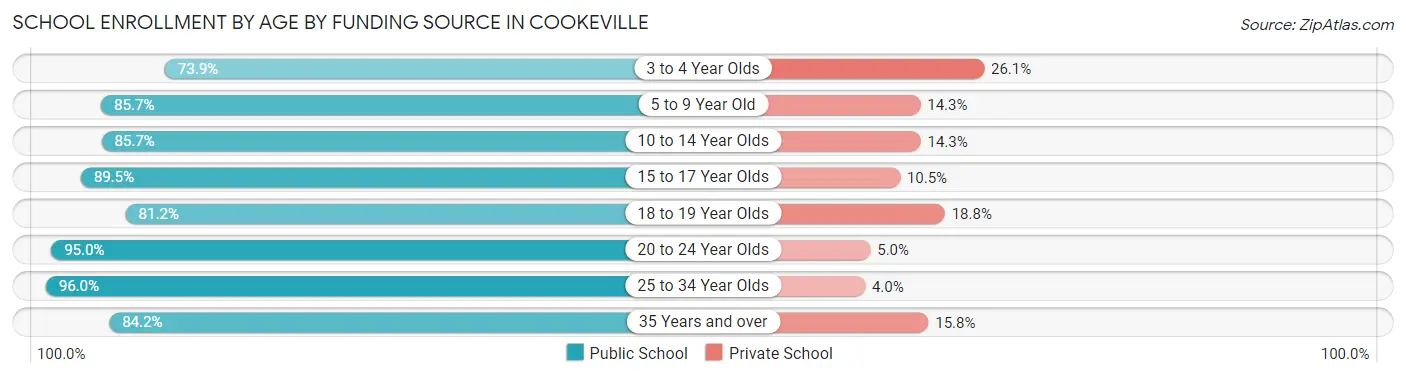
| Age Bracket | Public School | Private School |
| 3 to 4 Year Olds | 130 (73.9%) | 46 (26.1%) |
| 5 to 9 Year Old | 1,532 (85.7%) | 255 (14.3%) |
| 10 to 14 Year Olds | 1,585 (85.7%) | 265 (14.3%) |
| 15 to 17 Year Olds | 991 (89.5%) | 116 (10.5%) |
| 18 to 19 Year Olds | 1,935 (81.2%) | 449 (18.8%) |
| 20 to 24 Year Olds | 3,503 (95.0%) | 183 (5.0%) |
| 25 to 34 Year Olds | 437 (96.0%) | 18 (4.0%) |
| 35 Years and over | 278 (84.2%) | 52 (15.8%) |
| Total | 10,386 (88.2%) | 1,389 (11.8%) |
Educational Attainment by Field of Study in Cookeville
Business (1,559 | 21.5%), education (1,248 | 17.2%), science & technology (574 | 7.9%), bio, nature & agricultural (548 | 7.5%), and psychology (506 | 7.0%) are the most common fields of study among 7,261 individuals in Cookeville who have obtained a bachelor's degree or higher.
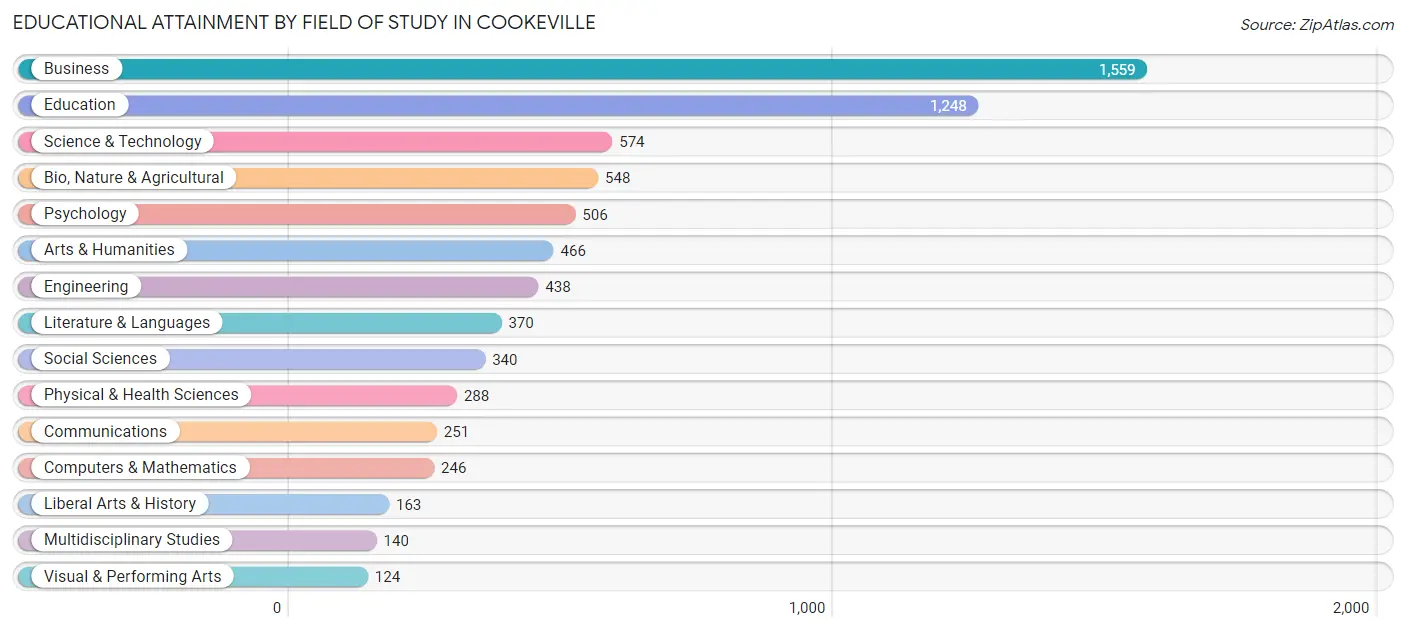
| Field of Study | # Graduates | % Graduates |
| Computers & Mathematics | 246 | 3.4% |
| Bio, Nature & Agricultural | 548 | 7.5% |
| Physical & Health Sciences | 288 | 4.0% |
| Psychology | 506 | 7.0% |
| Social Sciences | 340 | 4.7% |
| Engineering | 438 | 6.0% |
| Multidisciplinary Studies | 140 | 1.9% |
| Science & Technology | 574 | 7.9% |
| Business | 1,559 | 21.5% |
| Education | 1,248 | 17.2% |
| Literature & Languages | 370 | 5.1% |
| Liberal Arts & History | 163 | 2.2% |
| Visual & Performing Arts | 124 | 1.7% |
| Communications | 251 | 3.5% |
| Arts & Humanities | 466 | 6.4% |
| Total | 7,261 | 100.0% |
Transportation & Commute in Cookeville
Vehicle Availability by Sex in Cookeville
The most prevalent vehicle ownership categories in Cookeville are males with 2 vehicles (3,975, accounting for 47.8%) and females with 2 vehicles (3,085, making up 54.0%).
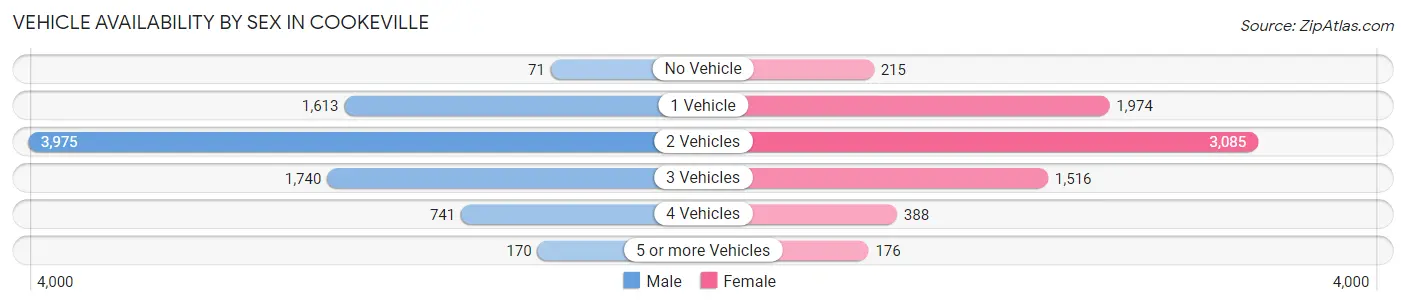
| Vehicles Available | Male | Female |
| No Vehicle | 71 (0.9%) | 215 (2.9%) |
| 1 Vehicle | 1,613 (19.4%) | 1,974 (26.8%) |
| 2 Vehicles | 3,975 (47.8%) | 3,085 (41.9%) |
| 3 Vehicles | 1,740 (20.9%) | 1,516 (20.6%) |
| 4 Vehicles | 741 (8.9%) | 388 (5.3%) |
| 5 or more Vehicles | 170 (2.1%) | 176 (2.4%) |
| Total | 8,310 (100.0%) | 7,354 (100.0%) |
Commute Time in Cookeville
The most frequently occuring commute durations in Cookeville are 10 to 14 minutes (3,902 commuters, 25.9%), 15 to 19 minutes (2,795 commuters, 18.6%), and 5 to 9 minutes (2,582 commuters, 17.2%).
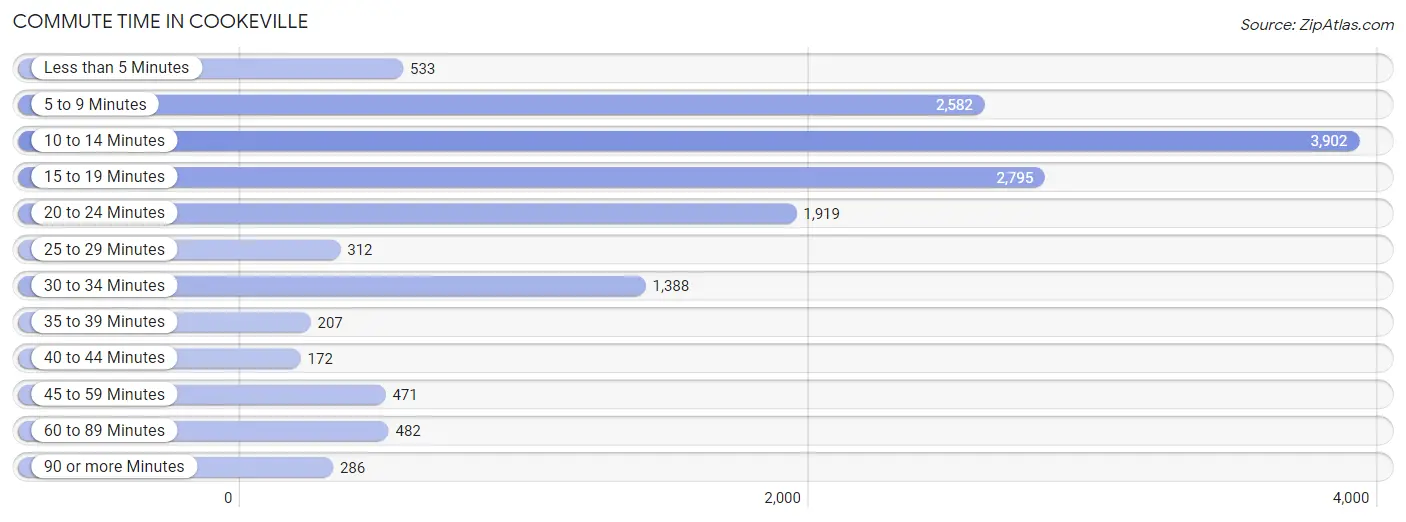
| Commute Time | # Commuters | % Commuters |
| Less than 5 Minutes | 533 | 3.5% |
| 5 to 9 Minutes | 2,582 | 17.2% |
| 10 to 14 Minutes | 3,902 | 25.9% |
| 15 to 19 Minutes | 2,795 | 18.6% |
| 20 to 24 Minutes | 1,919 | 12.8% |
| 25 to 29 Minutes | 312 | 2.1% |
| 30 to 34 Minutes | 1,388 | 9.2% |
| 35 to 39 Minutes | 207 | 1.4% |
| 40 to 44 Minutes | 172 | 1.1% |
| 45 to 59 Minutes | 471 | 3.1% |
| 60 to 89 Minutes | 482 | 3.2% |
| 90 or more Minutes | 286 | 1.9% |
Commute Time by Sex in Cookeville
The most common commute times in Cookeville are 10 to 14 minutes (1,949 commuters, 23.9%) for males and 10 to 14 minutes (1,953 commuters, 28.3%) for females.
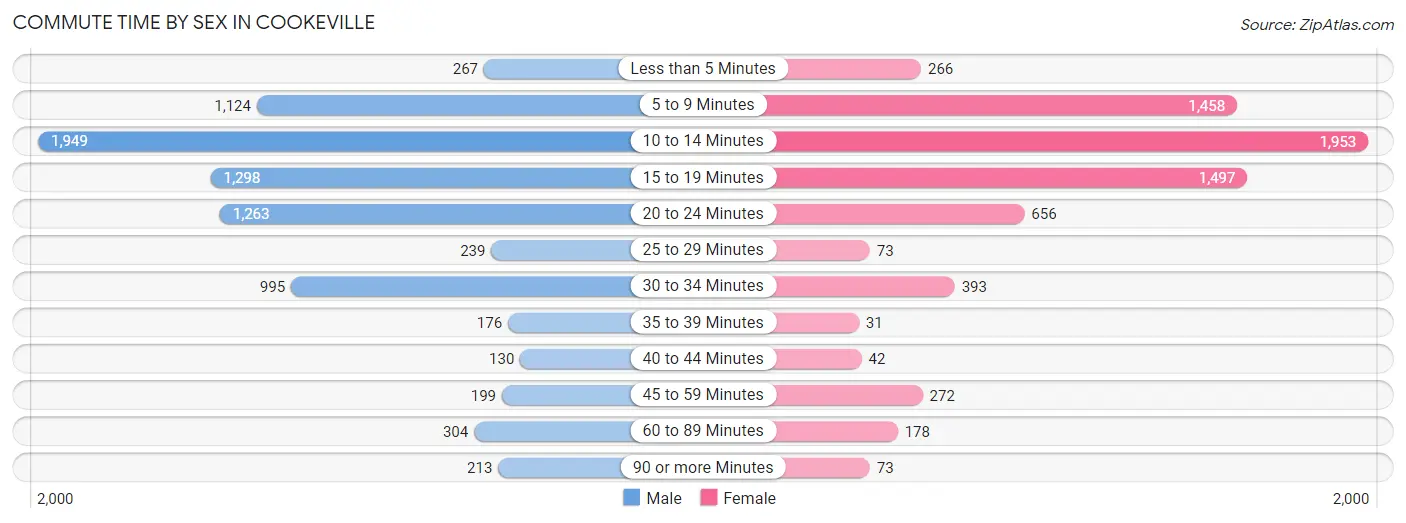
| Commute Time | Male | Female |
| Less than 5 Minutes | 267 (3.3%) | 266 (3.9%) |
| 5 to 9 Minutes | 1,124 (13.8%) | 1,458 (21.1%) |
| 10 to 14 Minutes | 1,949 (23.9%) | 1,953 (28.3%) |
| 15 to 19 Minutes | 1,298 (15.9%) | 1,497 (21.7%) |
| 20 to 24 Minutes | 1,263 (15.5%) | 656 (9.5%) |
| 25 to 29 Minutes | 239 (2.9%) | 73 (1.1%) |
| 30 to 34 Minutes | 995 (12.2%) | 393 (5.7%) |
| 35 to 39 Minutes | 176 (2.2%) | 31 (0.4%) |
| 40 to 44 Minutes | 130 (1.6%) | 42 (0.6%) |
| 45 to 59 Minutes | 199 (2.4%) | 272 (4.0%) |
| 60 to 89 Minutes | 304 (3.7%) | 178 (2.6%) |
| 90 or more Minutes | 213 (2.6%) | 73 (1.1%) |
Time of Departure to Work by Sex in Cookeville
The most frequent times of departure to work in Cookeville are 7:30 AM to 7:59 AM (1,644, 20.2%) for males and 7:30 AM to 7:59 AM (1,110, 16.1%) for females.
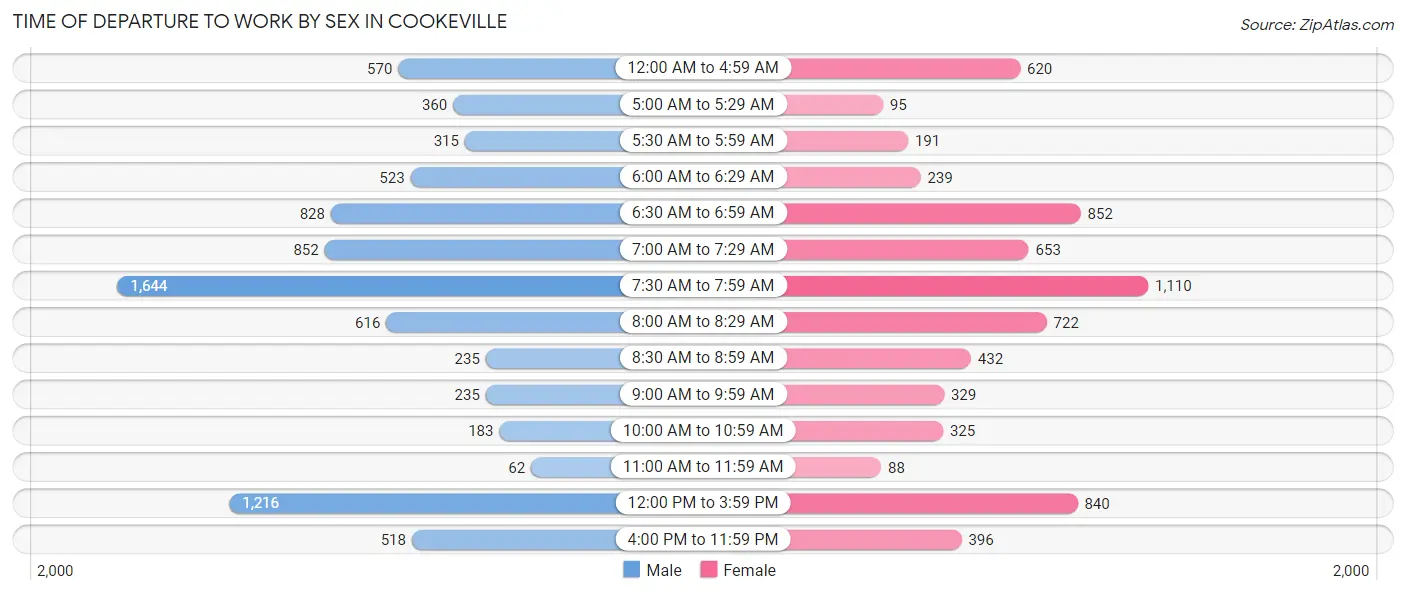
| Time of Departure | Male | Female |
| 12:00 AM to 4:59 AM | 570 (7.0%) | 620 (9.0%) |
| 5:00 AM to 5:29 AM | 360 (4.4%) | 95 (1.4%) |
| 5:30 AM to 5:59 AM | 315 (3.9%) | 191 (2.8%) |
| 6:00 AM to 6:29 AM | 523 (6.4%) | 239 (3.5%) |
| 6:30 AM to 6:59 AM | 828 (10.2%) | 852 (12.4%) |
| 7:00 AM to 7:29 AM | 852 (10.4%) | 653 (9.5%) |
| 7:30 AM to 7:59 AM | 1,644 (20.2%) | 1,110 (16.1%) |
| 8:00 AM to 8:29 AM | 616 (7.5%) | 722 (10.5%) |
| 8:30 AM to 8:59 AM | 235 (2.9%) | 432 (6.3%) |
| 9:00 AM to 9:59 AM | 235 (2.9%) | 329 (4.8%) |
| 10:00 AM to 10:59 AM | 183 (2.2%) | 325 (4.7%) |
| 11:00 AM to 11:59 AM | 62 (0.8%) | 88 (1.3%) |
| 12:00 PM to 3:59 PM | 1,216 (14.9%) | 840 (12.2%) |
| 4:00 PM to 11:59 PM | 518 (6.4%) | 396 (5.8%) |
| Total | 8,157 (100.0%) | 6,892 (100.0%) |
Housing Occupancy in Cookeville
Occupancy by Ownership in Cookeville
Of the total 14,373 dwellings in Cookeville, owner-occupied units account for 5,747 (40.0%), while renter-occupied units make up 8,626 (60.0%).
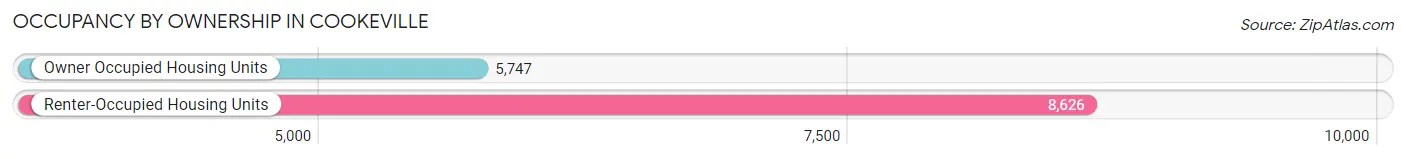
| Occupancy | # Housing Units | % Housing Units |
| Owner Occupied Housing Units | 5,747 | 40.0% |
| Renter-Occupied Housing Units | 8,626 | 60.0% |
| Total Occupied Housing Units | 14,373 | 100.0% |
Occupancy by Household Size in Cookeville
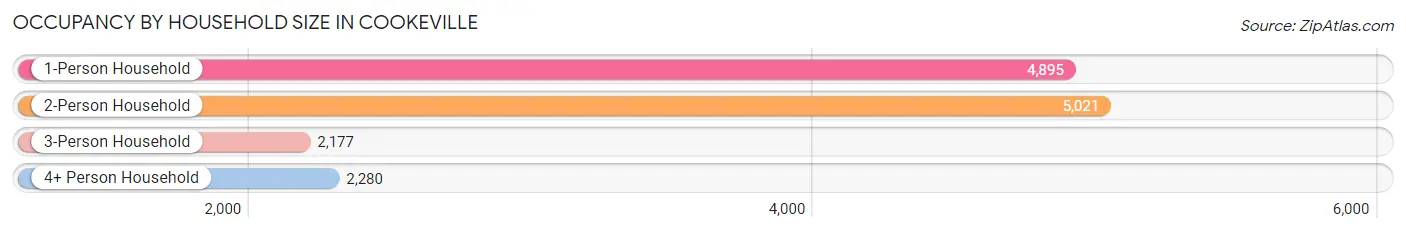
| Household Size | # Housing Units | % Housing Units |
| 1-Person Household | 4,895 | 34.1% |
| 2-Person Household | 5,021 | 34.9% |
| 3-Person Household | 2,177 | 15.1% |
| 4+ Person Household | 2,280 | 15.9% |
| Total Housing Units | 14,373 | 100.0% |
Occupancy by Ownership by Household Size in Cookeville
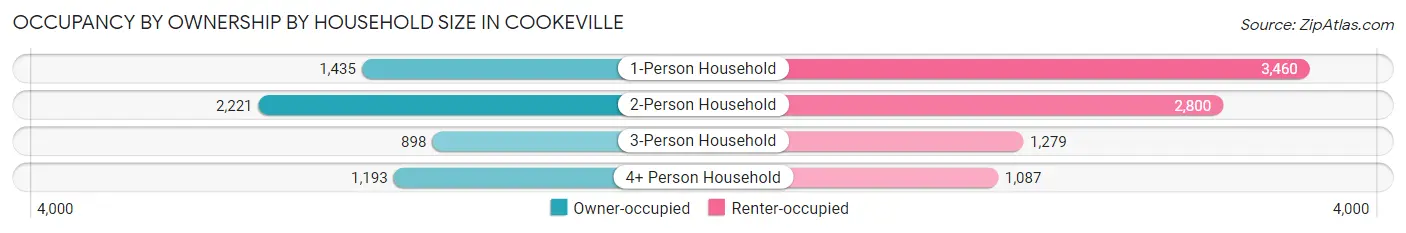
| Household Size | Owner-occupied | Renter-occupied |
| 1-Person Household | 1,435 (29.3%) | 3,460 (70.7%) |
| 2-Person Household | 2,221 (44.2%) | 2,800 (55.8%) |
| 3-Person Household | 898 (41.2%) | 1,279 (58.8%) |
| 4+ Person Household | 1,193 (52.3%) | 1,087 (47.7%) |
| Total Housing Units | 5,747 (40.0%) | 8,626 (60.0%) |
Occupancy by Educational Attainment in Cookeville
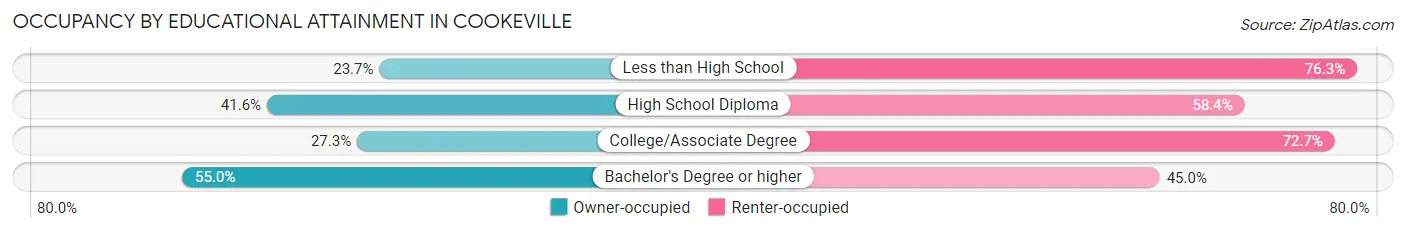
| Household Size | Owner-occupied | Renter-occupied |
| Less than High School | 311 (23.7%) | 999 (76.3%) |
| High School Diploma | 1,506 (41.6%) | 2,117 (58.4%) |
| College/Associate Degree | 1,243 (27.3%) | 3,313 (72.7%) |
| Bachelor's Degree or higher | 2,687 (55.0%) | 2,197 (45.0%) |
Occupancy by Age of Householder in Cookeville
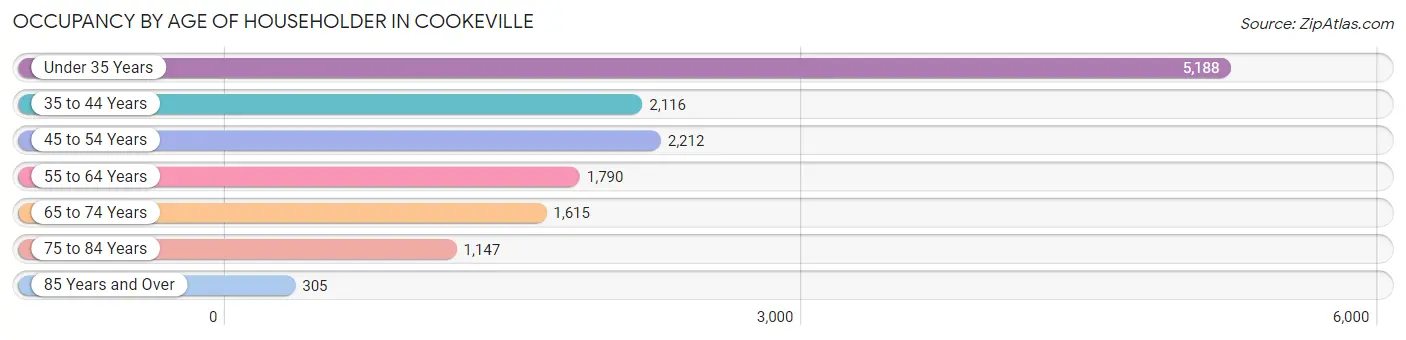
| Age Bracket | # Households | % Households |
| Under 35 Years | 5,188 | 36.1% |
| 35 to 44 Years | 2,116 | 14.7% |
| 45 to 54 Years | 2,212 | 15.4% |
| 55 to 64 Years | 1,790 | 12.4% |
| 65 to 74 Years | 1,615 | 11.2% |
| 75 to 84 Years | 1,147 | 8.0% |
| 85 Years and Over | 305 | 2.1% |
| Total | 14,373 | 100.0% |
Housing Finances in Cookeville
Median Income by Occupancy in Cookeville
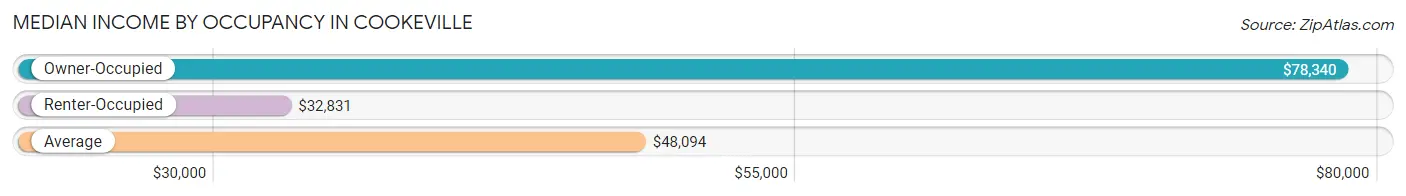
| Occupancy Type | # Households | Median Income |
| Owner-Occupied | 5,747 (40.0%) | $78,340 |
| Renter-Occupied | 8,626 (60.0%) | $32,831 |
| Average | 14,373 (100.0%) | $48,094 |
Occupancy by Householder Income Bracket in Cookeville
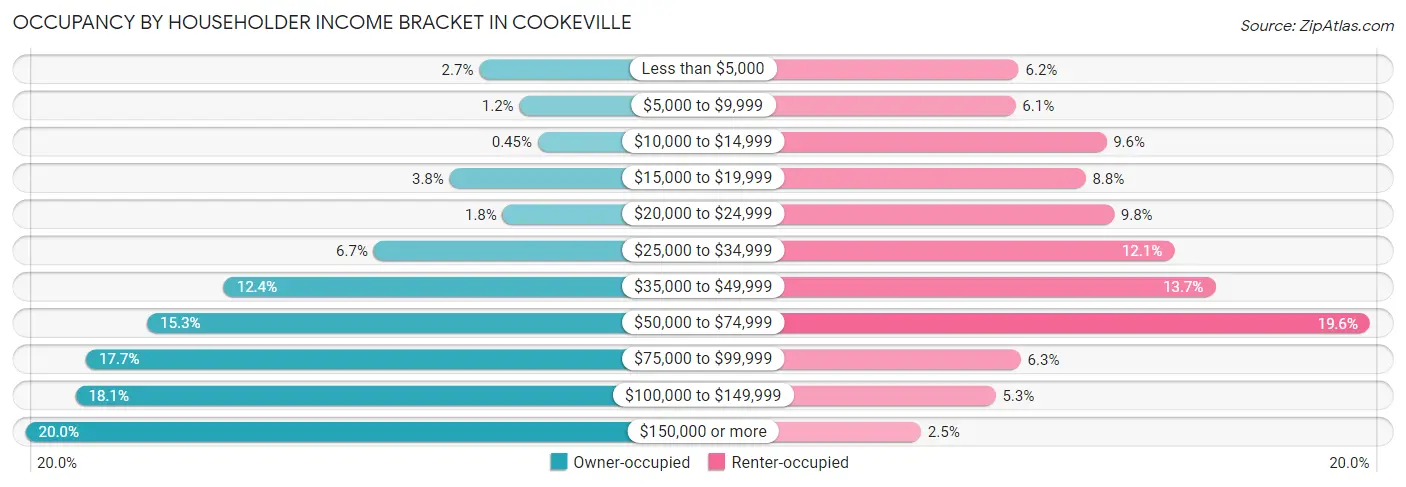
| Income Bracket | Owner-occupied | Renter-occupied |
| Less than $5,000 | 154 (2.7%) | 536 (6.2%) |
| $5,000 to $9,999 | 66 (1.1%) | 525 (6.1%) |
| $10,000 to $14,999 | 26 (0.4%) | 824 (9.6%) |
| $15,000 to $19,999 | 219 (3.8%) | 756 (8.8%) |
| $20,000 to $24,999 | 103 (1.8%) | 849 (9.8%) |
| $25,000 to $34,999 | 385 (6.7%) | 1,046 (12.1%) |
| $35,000 to $49,999 | 713 (12.4%) | 1,182 (13.7%) |
| $50,000 to $74,999 | 881 (15.3%) | 1,690 (19.6%) |
| $75,000 to $99,999 | 1,015 (17.7%) | 543 (6.3%) |
| $100,000 to $149,999 | 1,038 (18.1%) | 460 (5.3%) |
| $150,000 or more | 1,147 (20.0%) | 215 (2.5%) |
| Total | 5,747 (100.0%) | 8,626 (100.0%) |
Monthly Housing Cost Tiers in Cookeville
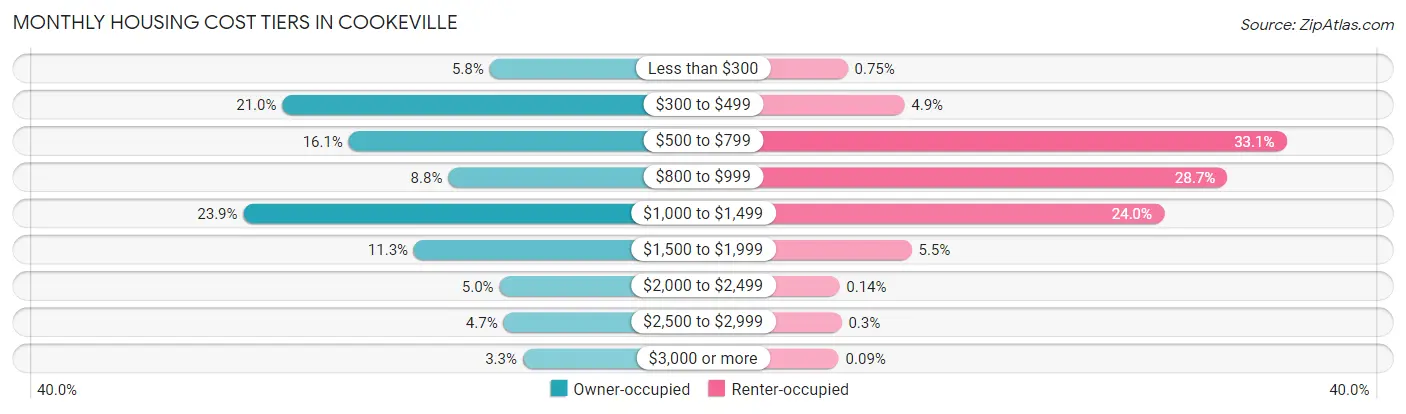
| Monthly Cost | Owner-occupied | Renter-occupied |
| Less than $300 | 331 (5.8%) | 65 (0.7%) |
| $300 to $499 | 1,208 (21.0%) | 425 (4.9%) |
| $500 to $799 | 927 (16.1%) | 2,851 (33.1%) |
| $800 to $999 | 506 (8.8%) | 2,476 (28.7%) |
| $1,000 to $1,499 | 1,373 (23.9%) | 2,074 (24.0%) |
| $1,500 to $1,999 | 651 (11.3%) | 471 (5.5%) |
| $2,000 to $2,499 | 289 (5.0%) | 12 (0.1%) |
| $2,500 to $2,999 | 272 (4.7%) | 26 (0.3%) |
| $3,000 or more | 190 (3.3%) | 8 (0.1%) |
| Total | 5,747 (100.0%) | 8,626 (100.0%) |
Physical Housing Characteristics in Cookeville
Housing Structures in Cookeville
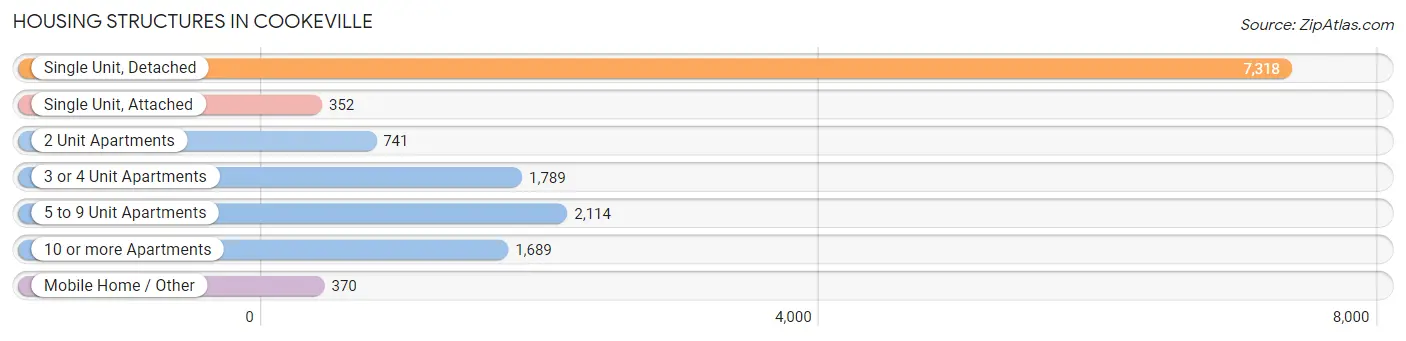
| Structure Type | # Housing Units | % Housing Units |
| Single Unit, Detached | 7,318 | 50.9% |
| Single Unit, Attached | 352 | 2.5% |
| 2 Unit Apartments | 741 | 5.2% |
| 3 or 4 Unit Apartments | 1,789 | 12.4% |
| 5 to 9 Unit Apartments | 2,114 | 14.7% |
| 10 or more Apartments | 1,689 | 11.7% |
| Mobile Home / Other | 370 | 2.6% |
| Total | 14,373 | 100.0% |
Housing Structures by Occupancy in Cookeville
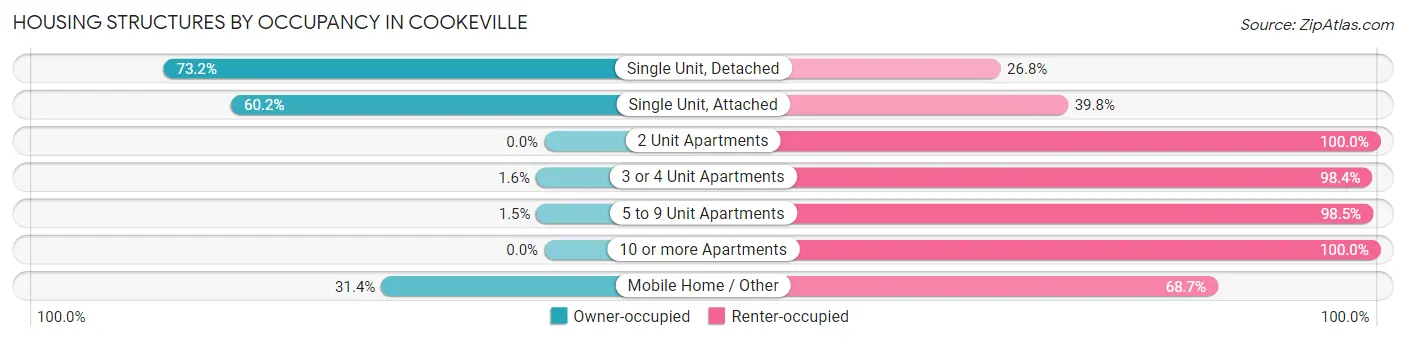
| Structure Type | Owner-occupied | Renter-occupied |
| Single Unit, Detached | 5,360 (73.2%) | 1,958 (26.8%) |
| Single Unit, Attached | 212 (60.2%) | 140 (39.8%) |
| 2 Unit Apartments | 0 (0.0%) | 741 (100.0%) |
| 3 or 4 Unit Apartments | 28 (1.6%) | 1,761 (98.4%) |
| 5 to 9 Unit Apartments | 31 (1.5%) | 2,083 (98.5%) |
| 10 or more Apartments | 0 (0.0%) | 1,689 (100.0%) |
| Mobile Home / Other | 116 (31.4%) | 254 (68.6%) |
| Total | 5,747 (40.0%) | 8,626 (60.0%) |
Housing Structures by Number of Rooms in Cookeville
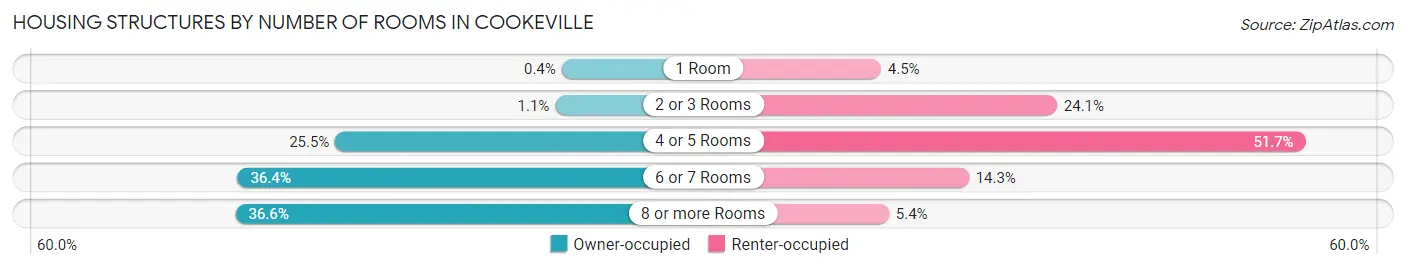
| Number of Rooms | Owner-occupied | Renter-occupied |
| 1 Room | 23 (0.4%) | 392 (4.5%) |
| 2 or 3 Rooms | 64 (1.1%) | 2,077 (24.1%) |
| 4 or 5 Rooms | 1,467 (25.5%) | 4,456 (51.7%) |
| 6 or 7 Rooms | 2,090 (36.4%) | 1,233 (14.3%) |
| 8 or more Rooms | 2,103 (36.6%) | 468 (5.4%) |
| Total | 5,747 (100.0%) | 8,626 (100.0%) |
Housing Structure by Heating Type in Cookeville
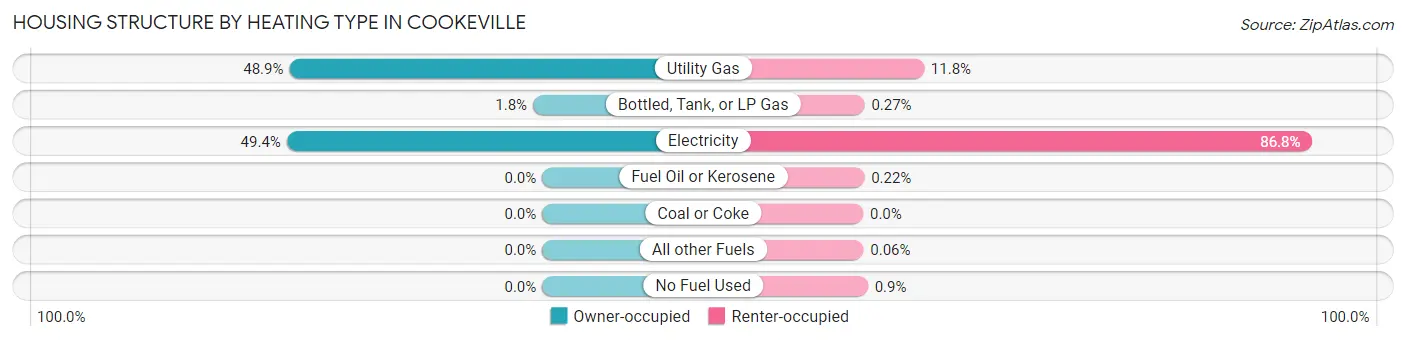
| Heating Type | Owner-occupied | Renter-occupied |
| Utility Gas | 2,808 (48.9%) | 1,014 (11.8%) |
| Bottled, Tank, or LP Gas | 102 (1.8%) | 23 (0.3%) |
| Electricity | 2,837 (49.4%) | 7,487 (86.8%) |
| Fuel Oil or Kerosene | 0 (0.0%) | 19 (0.2%) |
| Coal or Coke | 0 (0.0%) | 0 (0.0%) |
| All other Fuels | 0 (0.0%) | 5 (0.1%) |
| No Fuel Used | 0 (0.0%) | 78 (0.9%) |
| Total | 5,747 (100.0%) | 8,626 (100.0%) |
Household Vehicle Usage in Cookeville
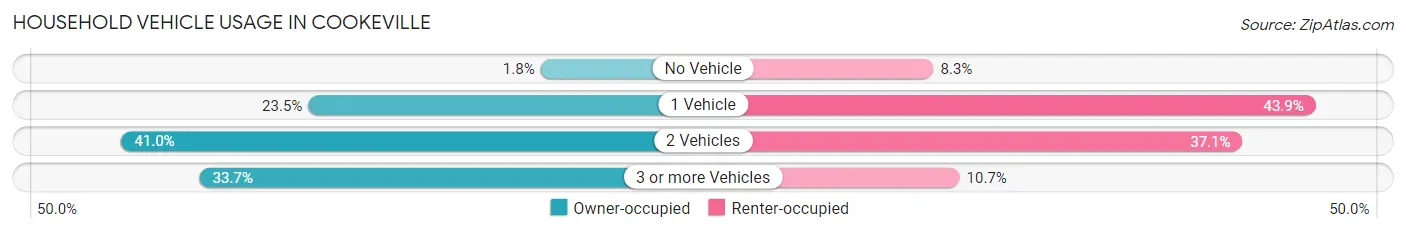
| Vehicles per Household | Owner-occupied | Renter-occupied |
| No Vehicle | 106 (1.8%) | 714 (8.3%) |
| 1 Vehicle | 1,352 (23.5%) | 3,789 (43.9%) |
| 2 Vehicles | 2,354 (41.0%) | 3,199 (37.1%) |
| 3 or more Vehicles | 1,935 (33.7%) | 924 (10.7%) |
| Total | 5,747 (100.0%) | 8,626 (100.0%) |
Real Estate & Mortgages in Cookeville
Real Estate and Mortgage Overview in Cookeville
| Characteristic | Without Mortgage | With Mortgage |
| Housing Units | 2,482 | 3,265 |
| Median Property Value | $223,200 | $259,200 |
| Median Household Income | $61,157 | $787 |
| Monthly Housing Costs | $458 | $177 |
| Real Estate Taxes | $1,528 | $79 |
Property Value by Mortgage Status in Cookeville
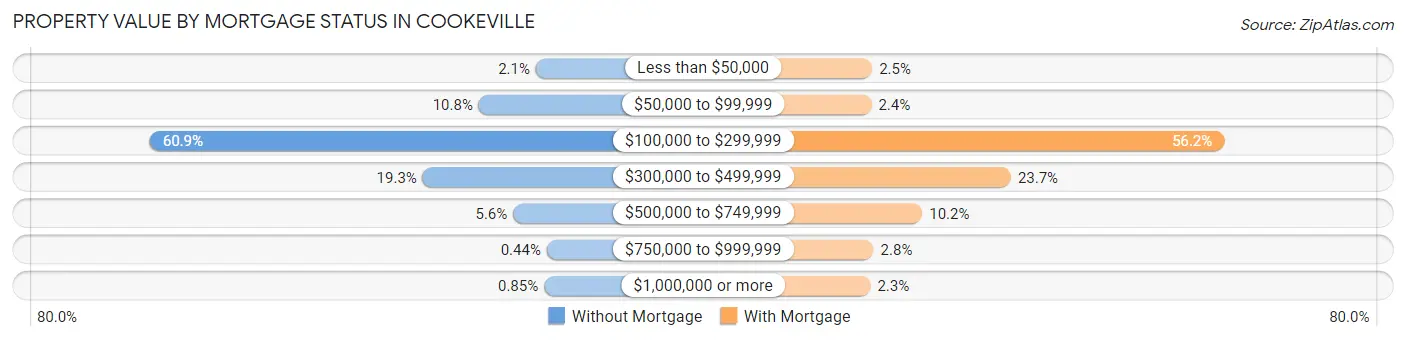
| Property Value | Without Mortgage | With Mortgage |
| Less than $50,000 | 52 (2.1%) | 83 (2.5%) |
| $50,000 to $99,999 | 268 (10.8%) | 79 (2.4%) |
| $100,000 to $299,999 | 1,512 (60.9%) | 1,834 (56.2%) |
| $300,000 to $499,999 | 480 (19.3%) | 773 (23.7%) |
| $500,000 to $749,999 | 138 (5.6%) | 332 (10.2%) |
| $750,000 to $999,999 | 11 (0.4%) | 90 (2.8%) |
| $1,000,000 or more | 21 (0.9%) | 74 (2.3%) |
| Total | 2,482 (100.0%) | 3,265 (100.0%) |
Household Income by Mortgage Status in Cookeville
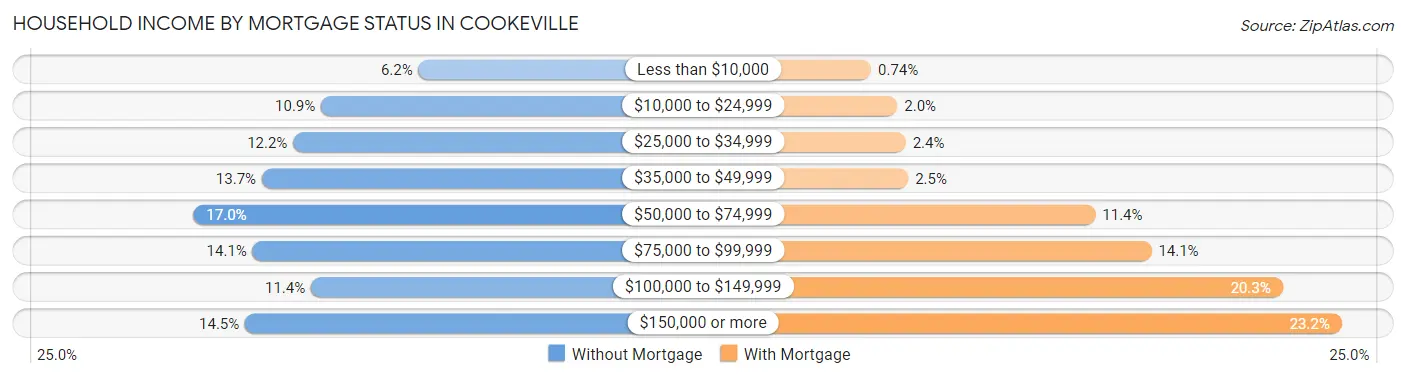
| Household Income | Without Mortgage | With Mortgage |
| Less than $10,000 | 155 (6.2%) | 24 (0.7%) |
| $10,000 to $24,999 | 270 (10.9%) | 65 (2.0%) |
| $25,000 to $34,999 | 303 (12.2%) | 78 (2.4%) |
| $35,000 to $49,999 | 340 (13.7%) | 82 (2.5%) |
| $50,000 to $74,999 | 421 (17.0%) | 373 (11.4%) |
| $75,000 to $99,999 | 351 (14.1%) | 460 (14.1%) |
| $100,000 to $149,999 | 282 (11.4%) | 664 (20.3%) |
| $150,000 or more | 360 (14.5%) | 756 (23.2%) |
| Total | 2,482 (100.0%) | 3,265 (100.0%) |
Property Value to Household Income Ratio in Cookeville
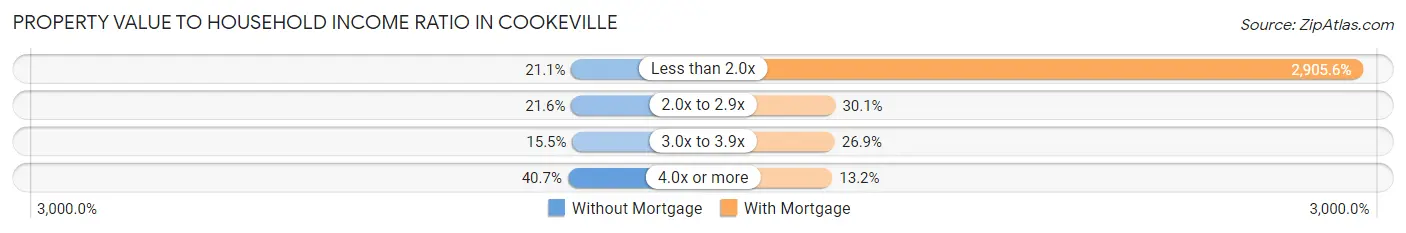
| Value-to-Income Ratio | Without Mortgage | With Mortgage |
| Less than 2.0x | 523 (21.1%) | 94,867 (2,905.6%) |
| 2.0x to 2.9x | 536 (21.6%) | 983 (30.1%) |
| 3.0x to 3.9x | 384 (15.5%) | 879 (26.9%) |
| 4.0x or more | 1,009 (40.6%) | 431 (13.2%) |
| Total | 2,482 (100.0%) | 3,265 (100.0%) |
Real Estate Taxes by Mortgage Status in Cookeville
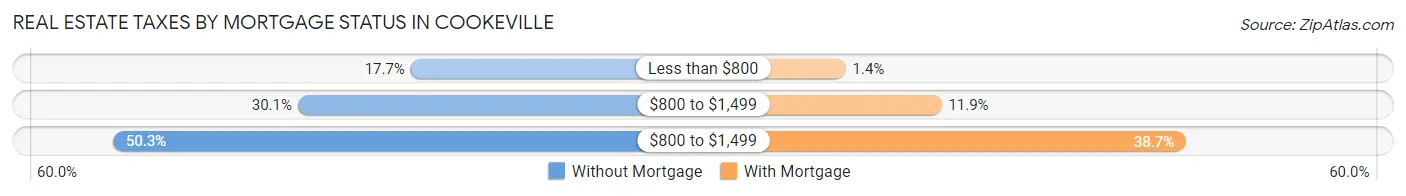
| Property Taxes | Without Mortgage | With Mortgage |
| Less than $800 | 439 (17.7%) | 45 (1.4%) |
| $800 to $1,499 | 746 (30.1%) | 388 (11.9%) |
| $800 to $1,499 | 1,249 (50.3%) | 1,263 (38.7%) |
| Total | 2,482 (100.0%) | 3,265 (100.0%) |
Health & Disability in Cookeville
Health Insurance Coverage by Age in Cookeville
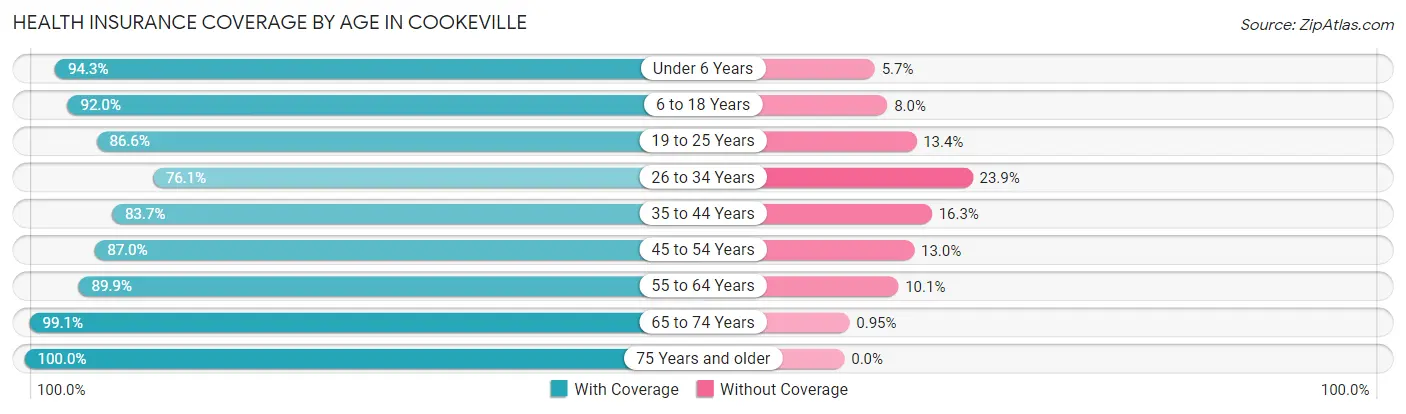
| Age Bracket | With Coverage | Without Coverage |
| Under 6 Years | 2,159 (94.3%) | 130 (5.7%) |
| 6 to 18 Years | 5,308 (92.0%) | 462 (8.0%) |
| 19 to 25 Years | 6,594 (86.6%) | 1,021 (13.4%) |
| 26 to 34 Years | 3,083 (76.1%) | 969 (23.9%) |
| 35 to 44 Years | 3,003 (83.7%) | 585 (16.3%) |
| 45 to 54 Years | 3,227 (87.0%) | 482 (13.0%) |
| 55 to 64 Years | 2,664 (89.9%) | 298 (10.1%) |
| 65 to 74 Years | 2,406 (99.1%) | 23 (0.9%) |
| 75 Years and older | 2,064 (100.0%) | 0 (0.0%) |
| Total | 30,508 (88.5%) | 3,970 (11.5%) |
Health Insurance Coverage by Citizenship Status in Cookeville
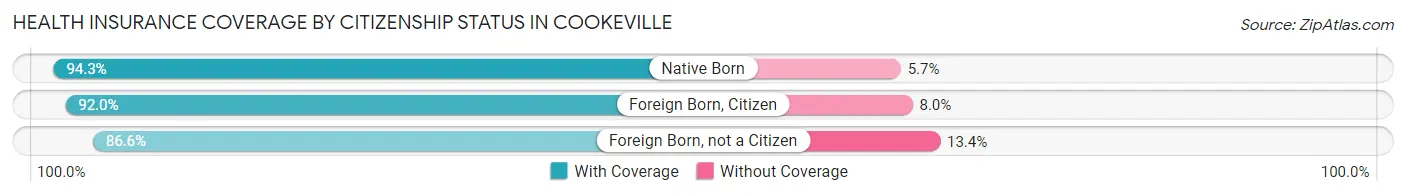
| Citizenship Status | With Coverage | Without Coverage |
| Native Born | 2,159 (94.3%) | 130 (5.7%) |
| Foreign Born, Citizen | 5,308 (92.0%) | 462 (8.0%) |
| Foreign Born, not a Citizen | 6,594 (86.6%) | 1,021 (13.4%) |
Health Insurance Coverage by Household Income in Cookeville
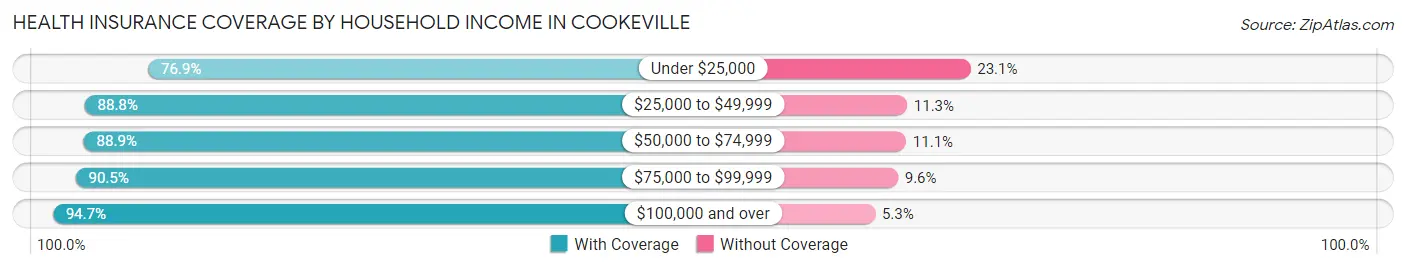
| Household Income | With Coverage | Without Coverage |
| Under $25,000 | 5,394 (76.9%) | 1,624 (23.1%) |
| $25,000 to $49,999 | 5,942 (88.7%) | 753 (11.3%) |
| $50,000 to $74,999 | 5,328 (88.9%) | 663 (11.1%) |
| $75,000 to $99,999 | 3,571 (90.4%) | 377 (9.6%) |
| $100,000 and over | 7,860 (94.7%) | 438 (5.3%) |
Public vs Private Health Insurance Coverage by Age in Cookeville
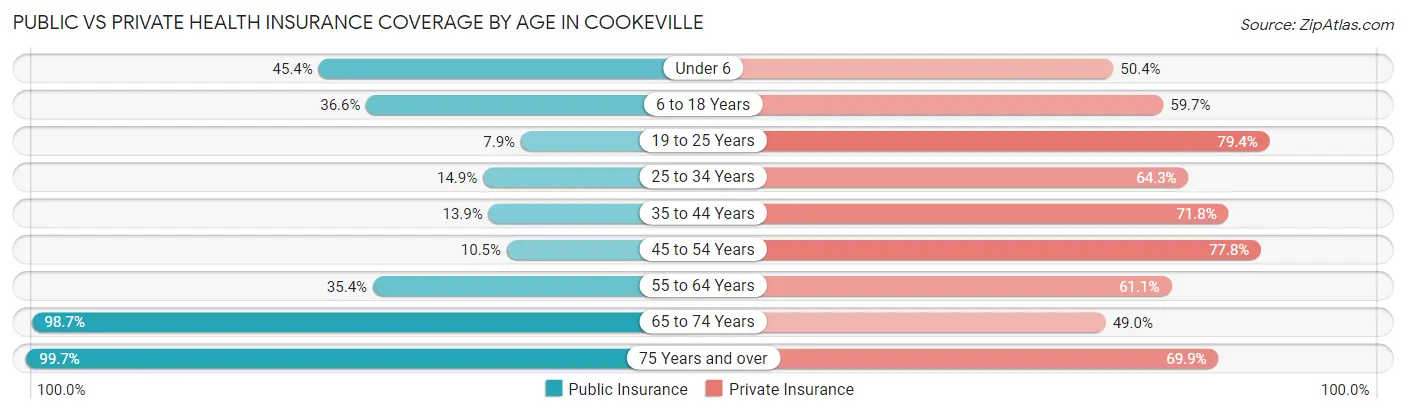
| Age Bracket | Public Insurance | Private Insurance |
| Under 6 | 1,040 (45.4%) | 1,154 (50.4%) |
| 6 to 18 Years | 2,110 (36.6%) | 3,443 (59.7%) |
| 19 to 25 Years | 599 (7.9%) | 6,047 (79.4%) |
| 25 to 34 Years | 604 (14.9%) | 2,607 (64.3%) |
| 35 to 44 Years | 498 (13.9%) | 2,575 (71.8%) |
| 45 to 54 Years | 389 (10.5%) | 2,887 (77.8%) |
| 55 to 64 Years | 1,047 (35.3%) | 1,811 (61.1%) |
| 65 to 74 Years | 2,398 (98.7%) | 1,190 (49.0%) |
| 75 Years and over | 2,057 (99.7%) | 1,443 (69.9%) |
| Total | 10,742 (31.2%) | 23,157 (67.2%) |
Disability Status by Sex by Age in Cookeville
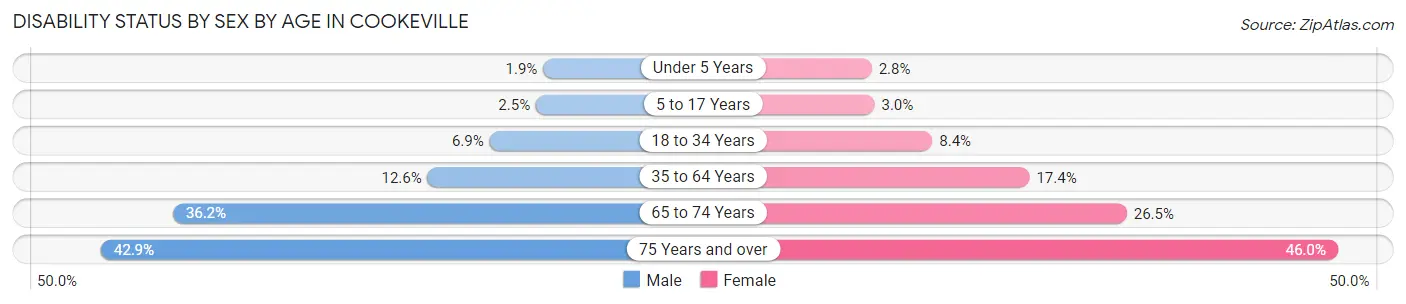
| Age Bracket | Male | Female |
| Under 5 Years | 17 (1.9%) | 25 (2.8%) |
| 5 to 17 Years | 61 (2.5%) | 77 (3.0%) |
| 18 to 34 Years | 476 (6.9%) | 507 (8.4%) |
| 35 to 64 Years | 619 (12.6%) | 931 (17.4%) |
| 65 to 74 Years | 357 (36.2%) | 382 (26.5%) |
| 75 Years and over | 373 (42.9%) | 550 (46.0%) |
Disability Class by Sex by Age in Cookeville
Disability Class: Hearing Difficulty
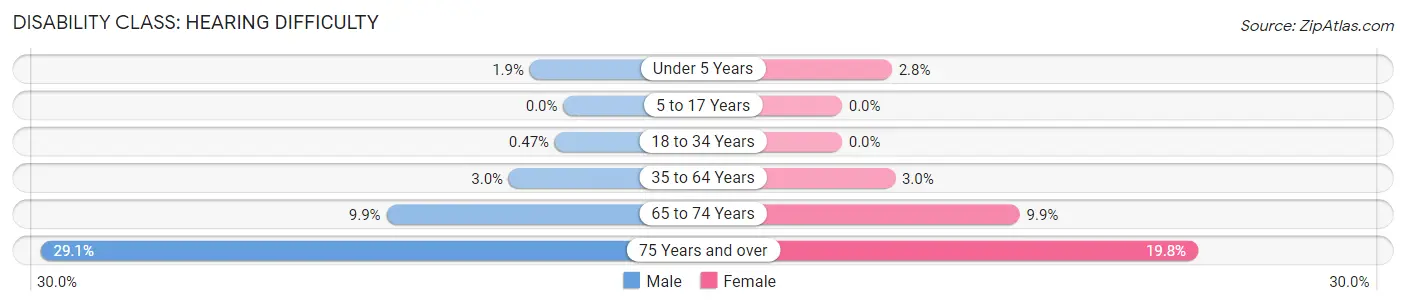
| Age Bracket | Male | Female |
| Under 5 Years | 17 (1.9%) | 25 (2.8%) |
| 5 to 17 Years | 0 (0.0%) | 0 (0.0%) |
| 18 to 34 Years | 33 (0.5%) | 0 (0.0%) |
| 35 to 64 Years | 149 (3.0%) | 158 (3.0%) |
| 65 to 74 Years | 97 (9.9%) | 143 (9.9%) |
| 75 Years and over | 253 (29.1%) | 237 (19.8%) |
Disability Class: Vision Difficulty
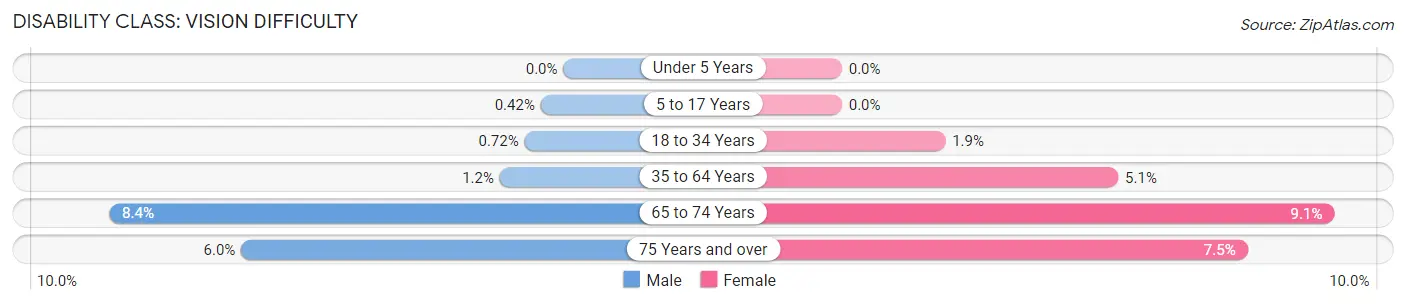
| Age Bracket | Male | Female |
| Under 5 Years | 0 (0.0%) | 0 (0.0%) |
| 5 to 17 Years | 10 (0.4%) | 0 (0.0%) |
| 18 to 34 Years | 50 (0.7%) | 116 (1.9%) |
| 35 to 64 Years | 58 (1.2%) | 274 (5.1%) |
| 65 to 74 Years | 83 (8.4%) | 132 (9.1%) |
| 75 Years and over | 52 (6.0%) | 90 (7.5%) |
Disability Class: Cognitive Difficulty
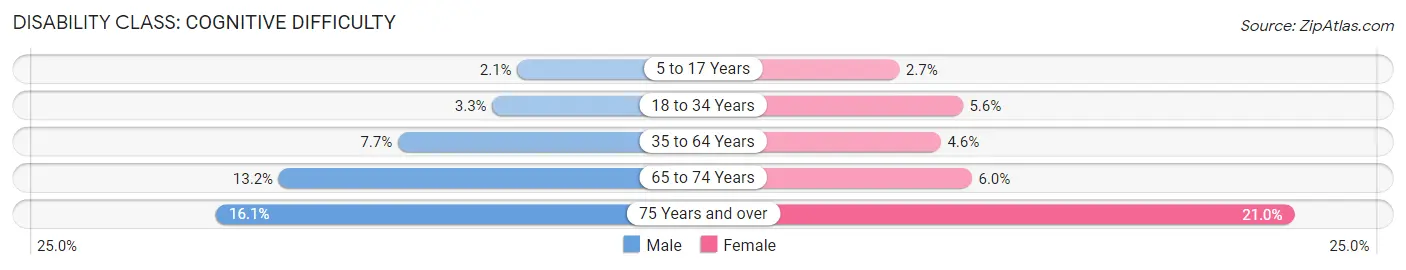
| Age Bracket | Male | Female |
| 5 to 17 Years | 51 (2.1%) | 67 (2.6%) |
| 18 to 34 Years | 229 (3.3%) | 338 (5.6%) |
| 35 to 64 Years | 377 (7.7%) | 245 (4.6%) |
| 65 to 74 Years | 130 (13.2%) | 87 (6.0%) |
| 75 Years and over | 140 (16.1%) | 251 (21.0%) |
Disability Class: Ambulatory Difficulty
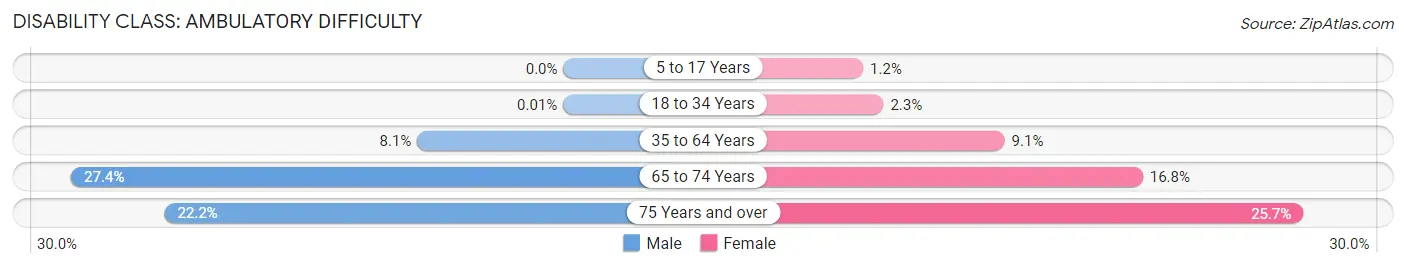
| Age Bracket | Male | Female |
| 5 to 17 Years | 0 (0.0%) | 30 (1.2%) |
| 18 to 34 Years | 1 (0.0%) | 140 (2.3%) |
| 35 to 64 Years | 400 (8.1%) | 485 (9.1%) |
| 65 to 74 Years | 270 (27.4%) | 242 (16.8%) |
| 75 Years and over | 193 (22.2%) | 307 (25.7%) |
Disability Class: Self-Care Difficulty
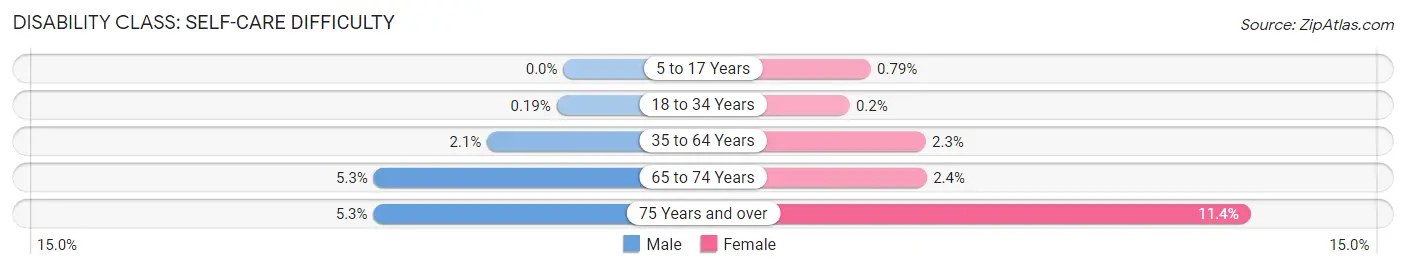
| Age Bracket | Male | Female |
| 5 to 17 Years | 0 (0.0%) | 20 (0.8%) |
| 18 to 34 Years | 13 (0.2%) | 12 (0.2%) |
| 35 to 64 Years | 104 (2.1%) | 124 (2.3%) |
| 65 to 74 Years | 52 (5.3%) | 34 (2.4%) |
| 75 Years and over | 46 (5.3%) | 136 (11.4%) |
Technology Access in Cookeville
Computing Device Access in Cookeville
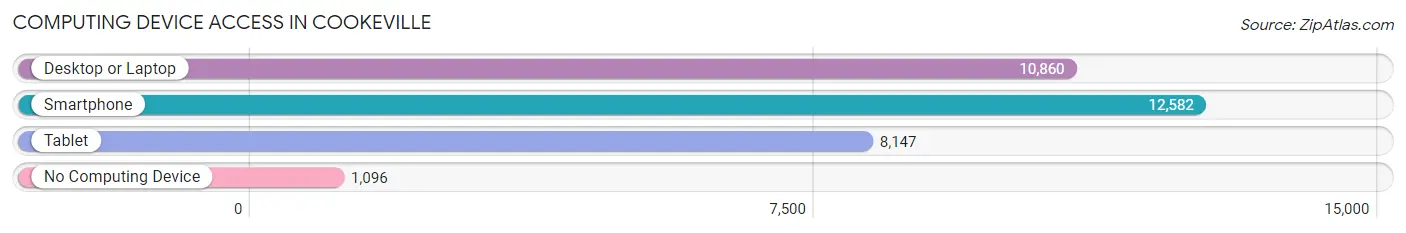
| Device Type | # Households | % Households |
| Desktop or Laptop | 10,860 | 75.6% |
| Smartphone | 12,582 | 87.5% |
| Tablet | 8,147 | 56.7% |
| No Computing Device | 1,096 | 7.6% |
| Total | 14,373 | 100.0% |
Internet Access in Cookeville
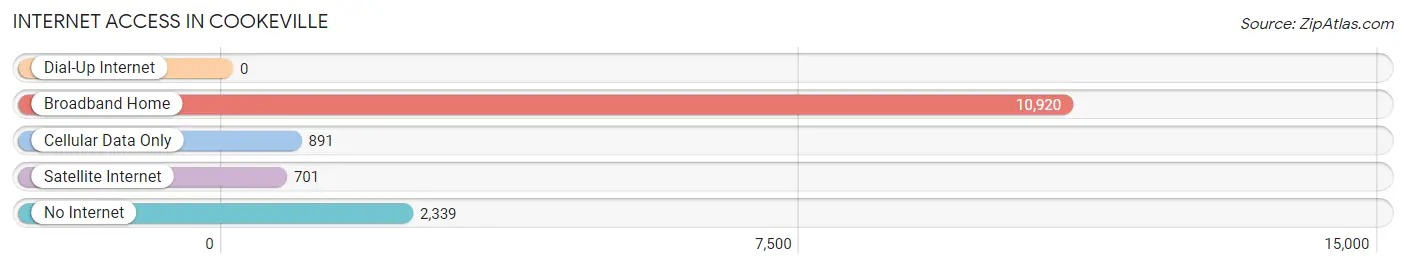
| Internet Type | # Households | % Households |
| Dial-Up Internet | 0 | 0.0% |
| Broadband Home | 10,920 | 76.0% |
| Cellular Data Only | 891 | 6.2% |
| Satellite Internet | 701 | 4.9% |
| No Internet | 2,339 | 16.3% |
| Total | 14,373 | 100.0% |
Cookeville Summary
Cookeville, Tennessee is a city located in Putnam County, Tennessee. It is the county seat and the largest city in the county. The city is located approximately 85 miles east of Nashville and is part of the Nashville metropolitan area. As of the 2010 census, the population of Cookeville was 30,435.
History
The area that is now Cookeville was first settled in the early 19th century by William and Mary Cooke, who moved to the area from Virginia. The town was originally known as “Cooke’sville” and was officially incorporated in 1856. During the Civil War, the town was occupied by Union forces and was the site of a major battle in 1863. After the war, the town began to grow and prosper, and by the early 20th century, it had become an important regional center for commerce and industry.
Geography
Cookeville is located in the Upper Cumberland region of Tennessee, in the foothills of the Cumberland Plateau. The city is situated at the intersection of Interstate 40 and U.S. Route 70. The city is surrounded by several small towns and rural communities, including Baxter, Monterey, Algood, and Gainesboro. The city is located approximately 85 miles east of Nashville and is part of the Nashville metropolitan area.
Economy
Cookeville is a major economic center for the Upper Cumberland region. The city is home to several large employers, including Averitt Express, Oreck Corporation, and the Tennessee Technological University. The city is also home to several manufacturing companies, including the Cookeville Manufacturing Company, which produces automotive parts, and the Cookeville Foundry, which produces cast iron products. The city is also home to several retail stores, restaurants, and other businesses.
Demographics
As of the 2010 census, the population of Cookeville was 30,435. The racial makeup of the city was 87.3% White, 8.2% African American, 0.4% Native American, 1.2% Asian, 0.1% Pacific Islander, 1.2% from other races, and 1.6% from two or more races. Hispanic or Latino of any race were 3.2% of the population. The median household income was $35,945 and the median family income was $45,945. The per capita income was $20,945.
Cookeville is a diverse and vibrant city with a rich history and a bright future. The city is home to a variety of businesses, industries, and educational institutions, and is a major economic center for the Upper Cumberland region. The city is also home to a diverse population, with a variety of cultures and backgrounds.
Common Questions
What is Per Capita Income in Cookeville?
Per Capita income in Cookeville is $27,359.
What is the Median Family Income in Cookeville?
Median Family Income in Cookeville is $70,326.
What is the Median Household income in Cookeville?
Median Household Income in Cookeville is $48,094.
What is Income or Wage Gap in Cookeville?
Income or Wage Gap in Cookeville is 18.1%.
Women in Cookeville earn 81.9 cents for every dollar earned by a man.
What is Family Income Deficit in Cookeville?
Family Income Deficit in Cookeville is $12,127.
Families that are below poverty line in Cookeville earn $12,127 less on average than the poverty threshold level.
What is Inequality or Gini Index in Cookeville?
Inequality or Gini Index in Cookeville is 0.48.
What is the Total Population of Cookeville?
Total Population of Cookeville is 34,967.
What is the Total Male Population of Cookeville?
Total Male Population of Cookeville is 17,310.
What is the Total Female Population of Cookeville?
Total Female Population of Cookeville is 17,657.
What is the Ratio of Males per 100 Females in Cookeville?
There are 98.03 Males per 100 Females in Cookeville.
What is the Ratio of Females per 100 Males in Cookeville?
There are 102.00 Females per 100 Males in Cookeville.
What is the Median Population Age in Cookeville?
Median Population Age in Cookeville is 29.5 Years.
What is the Average Family Size in Cookeville
Average Family Size in Cookeville is 2.9 People.
What is the Average Household Size in Cookeville
Average Household Size in Cookeville is 2.2 People.
How Large is the Labor Force in Cookeville?
There are 17,439 People in the Labor Forcein in Cookeville.
What is the Percentage of People in the Labor Force in Cookeville?
60.0% of People are in the Labor Force in Cookeville.
What is the Unemployment Rate in Cookeville?
Unemployment Rate in Cookeville is 6.1%.