Millington, TN Map & Demographics
Millington Map
Millington Overview
$29,746
PER CAPITA INCOME
$54,661
AVG FAMILY INCOME
$49,543
AVG HOUSEHOLD INCOME
10.2%
WAGE / INCOME GAP [ % ]
89.8¢/ $1
WAGE / INCOME GAP [ $ ]
0.46
INEQUALITY / GINI INDEX
10,558
TOTAL POPULATION
5,004
MALE POPULATION
5,554
FEMALE POPULATION
90.10
MALES / 100 FEMALES
110.99
FEMALES / 100 MALES
38.9
MEDIAN AGE
3.1
AVG FAMILY SIZE
2.5
AVG HOUSEHOLD SIZE
4,636
LABOR FORCE [ PEOPLE ]
56.6%
PERCENT IN LABOR FORCE
8.1%
UNEMPLOYMENT RATE
Millington Area Codes
Income in Millington
Income Overview in Millington
Per Capita Income in Millington is $29,746, while median incomes of families and households are $54,661 and $49,543 respectively.
| Characteristic | Number | Measure |
| Per Capita Income | 10,558 | $29,746 |
| Median Family Income | 2,737 | $54,661 |
| Mean Family Income | 2,737 | $82,486 |
| Median Household Income | 4,194 | $49,543 |
| Mean Household Income | 4,194 | $70,264 |
| Income Deficit | 2,737 | $0 |
| Wage / Income Gap (%) | 10,558 | 10.18% |
| Wage / Income Gap ($) | 10,558 | 89.82¢ per $1 |
| Gini / Inequality Index | 10,558 | 0.46 |
Earnings by Sex in Millington
Average Earnings in Millington are $42,554, $43,219 for men and $38,819 for women, a difference of 10.2%.
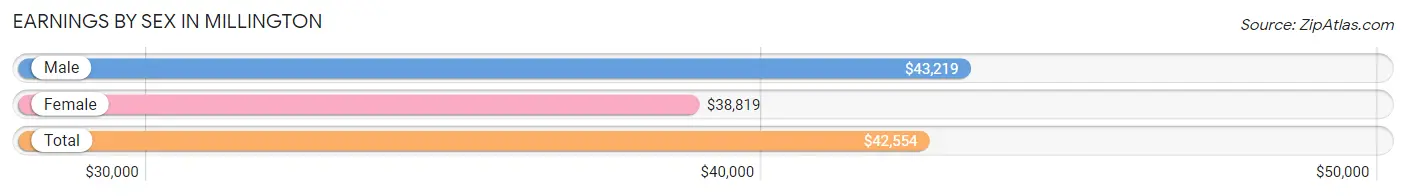
| Sex | Number | Average Earnings |
| Male | 2,503 (53.8%) | $43,219 |
| Female | 2,153 (46.2%) | $38,819 |
| Total | 4,656 (100.0%) | $42,554 |
Earnings by Sex by Income Bracket in Millington
The most common earnings brackets in Millington are $40,000 to $44,999 for men (459 | 18.3%) and $30,000 to $34,999 for women (241 | 11.2%).
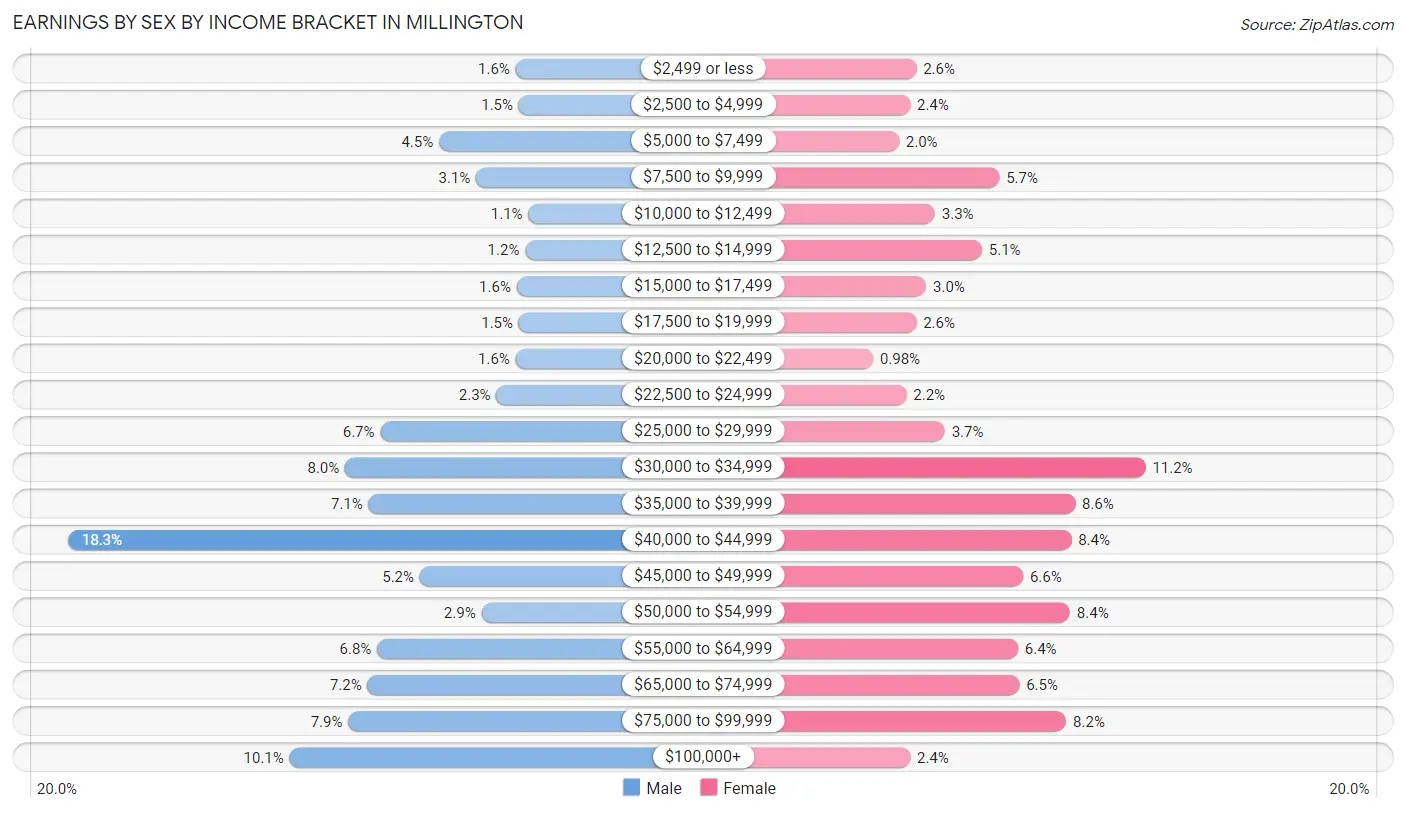
| Income | Male | Female |
| $2,499 or less | 40 (1.6%) | 56 (2.6%) |
| $2,500 to $4,999 | 37 (1.5%) | 51 (2.4%) |
| $5,000 to $7,499 | 112 (4.5%) | 42 (1.9%) |
| $7,500 to $9,999 | 77 (3.1%) | 123 (5.7%) |
| $10,000 to $12,499 | 28 (1.1%) | 71 (3.3%) |
| $12,500 to $14,999 | 31 (1.2%) | 109 (5.1%) |
| $15,000 to $17,499 | 39 (1.6%) | 64 (3.0%) |
| $17,500 to $19,999 | 37 (1.5%) | 56 (2.6%) |
| $20,000 to $22,499 | 40 (1.6%) | 21 (1.0%) |
| $22,500 to $24,999 | 58 (2.3%) | 48 (2.2%) |
| $25,000 to $29,999 | 167 (6.7%) | 79 (3.7%) |
| $30,000 to $34,999 | 200 (8.0%) | 241 (11.2%) |
| $35,000 to $39,999 | 178 (7.1%) | 184 (8.6%) |
| $40,000 to $44,999 | 459 (18.3%) | 181 (8.4%) |
| $45,000 to $49,999 | 130 (5.2%) | 142 (6.6%) |
| $50,000 to $54,999 | 72 (2.9%) | 180 (8.4%) |
| $55,000 to $64,999 | 170 (6.8%) | 138 (6.4%) |
| $65,000 to $74,999 | 179 (7.1%) | 139 (6.5%) |
| $75,000 to $99,999 | 197 (7.9%) | 177 (8.2%) |
| $100,000+ | 252 (10.1%) | 51 (2.4%) |
| Total | 2,503 (100.0%) | 2,153 (100.0%) |
Earnings by Sex by Educational Attainment in Millington
Average earnings in Millington are $44,186 for men and $39,897 for women, a difference of 9.7%. Men with an educational attainment of graduate degree enjoy the highest average annual earnings of $93,326, while those with high school diploma education earn the least with $34,972. Women with an educational attainment of bachelor's degree earn the most with the average annual earnings of $54,208, while those with high school diploma education have the smallest earnings of $29,203.
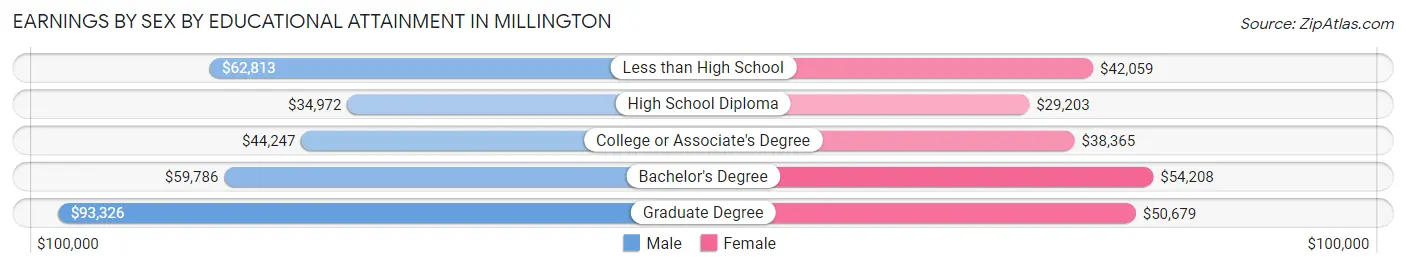
| Educational Attainment | Male Income | Female Income |
| Less than High School | $62,813 | $42,059 |
| High School Diploma | $34,972 | $29,203 |
| College or Associate's Degree | $44,247 | $38,365 |
| Bachelor's Degree | $59,786 | $54,208 |
| Graduate Degree | $93,326 | $50,679 |
| Total | $44,186 | $39,897 |
Family Income in Millington
Family Income Brackets in Millington
According to the Millington family income data, there are 786 families falling into the $35,000 to $49,999 income range, which is the most common income bracket and makes up 28.7% of all families. Conversely, the $10,000 to $14,999 income bracket is the least frequent group with only 38 families (1.4%) belonging to this category.
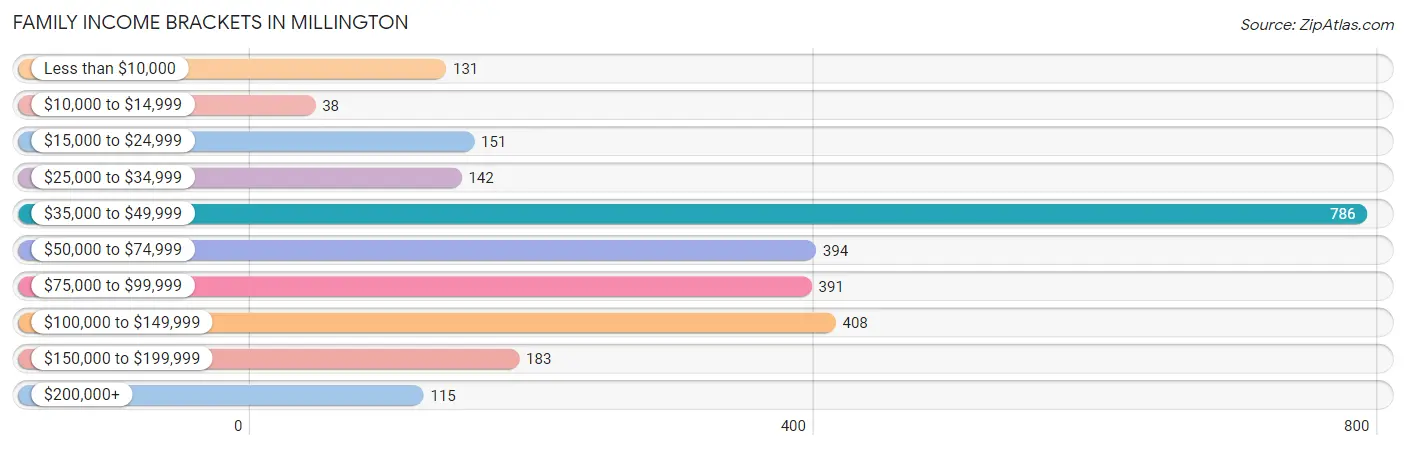
| Income Bracket | # Families | % Families |
| Less than $10,000 | 131 | 4.8% |
| $10,000 to $14,999 | 38 | 1.4% |
| $15,000 to $24,999 | 151 | 5.5% |
| $25,000 to $34,999 | 142 | 5.2% |
| $35,000 to $49,999 | 786 | 28.7% |
| $50,000 to $74,999 | 394 | 14.4% |
| $75,000 to $99,999 | 391 | 14.3% |
| $100,000 to $149,999 | 408 | 14.9% |
| $150,000 to $199,999 | 183 | 6.7% |
| $200,000+ | 115 | 4.2% |
Family Income by Famaliy Size in Millington
7+ person families (68 | 2.5%) account for the highest median family income in Millington with $148,500 per family, while 3-person families (584 | 21.3%) have the highest median income of $26,797 per family member.
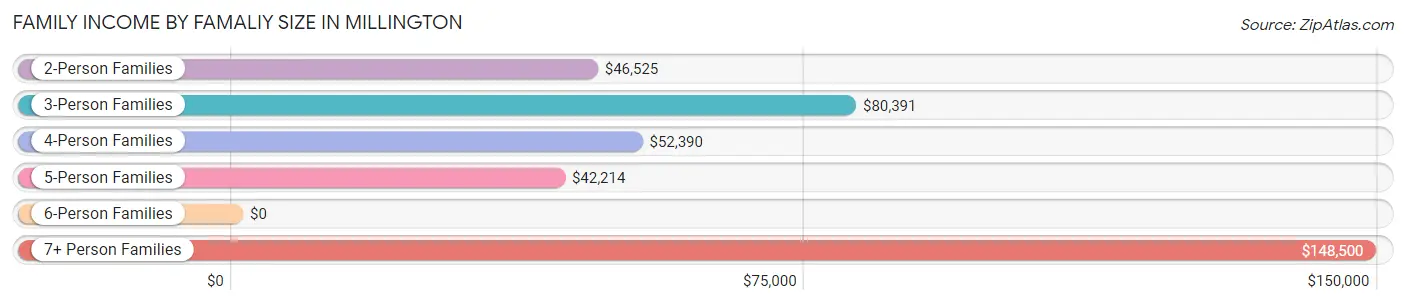
| Income Bracket | # Families | Median Income |
| 2-Person Families | 1,473 (53.8%) | $46,525 |
| 3-Person Families | 584 (21.3%) | $80,391 |
| 4-Person Families | 339 (12.4%) | $52,390 |
| 5-Person Families | 180 (6.6%) | $42,214 |
| 6-Person Families | 93 (3.4%) | $0 |
| 7+ Person Families | 68 (2.5%) | $148,500 |
| Total | 2,737 (100.0%) | $54,661 |
Family Income by Number of Earners in Millington
The median family income in Millington is $54,661, with families comprising 3+ earners (202) having the highest median family income of $164,464, while families with no earners (496) have the lowest median family income of $40,231, accounting for 7.4% and 18.1% of families, respectively.
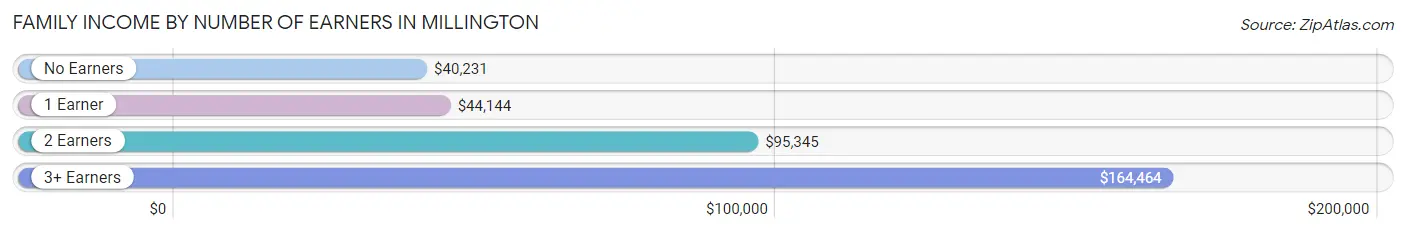
| Number of Earners | # Families | Median Income |
| No Earners | 496 (18.1%) | $40,231 |
| 1 Earner | 1,265 (46.2%) | $44,144 |
| 2 Earners | 774 (28.3%) | $95,345 |
| 3+ Earners | 202 (7.4%) | $164,464 |
| Total | 2,737 (100.0%) | $54,661 |
Household Income in Millington
Household Income Brackets in Millington
With 986 households falling in the category, the $35,000 to $49,999 income range is the most frequent in Millington, accounting for 23.5% of all households. In contrast, only 126 households (3.0%) fall into the $10,000 to $14,999 income bracket, making it the least populous group.
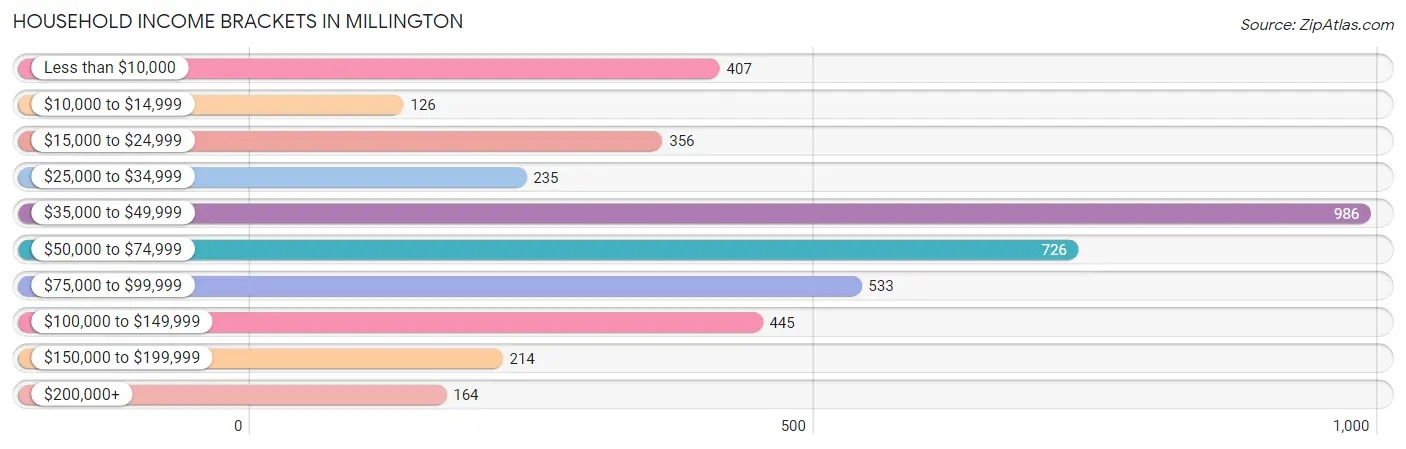
| Income Bracket | # Households | % Households |
| Less than $10,000 | 407 | 9.7% |
| $10,000 to $14,999 | 126 | 3.0% |
| $15,000 to $24,999 | 356 | 8.5% |
| $25,000 to $34,999 | 235 | 5.6% |
| $35,000 to $49,999 | 986 | 23.5% |
| $50,000 to $74,999 | 726 | 17.3% |
| $75,000 to $99,999 | 533 | 12.7% |
| $100,000 to $149,999 | 445 | 10.6% |
| $150,000 to $199,999 | 214 | 5.1% |
| $200,000+ | 164 | 3.9% |
Household Income by Householder Age in Millington
The median household income in Millington is $49,543, with the highest median household income of $52,692 found in the 25 to 44 years age bracket for the primary householder. A total of 1,088 households (25.9%) fall into this category. Meanwhile, the 15 to 24 years age bracket for the primary householder has the lowest median household income of $9,188, with 104 households (2.5%) in this group.
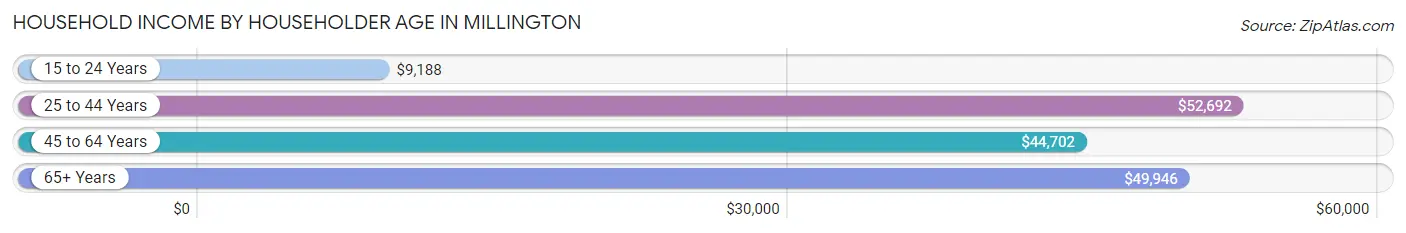
| Income Bracket | # Households | Median Income |
| 15 to 24 Years | 104 (2.5%) | $9,188 |
| 25 to 44 Years | 1,088 (25.9%) | $52,692 |
| 45 to 64 Years | 1,807 (43.1%) | $44,702 |
| 65+ Years | 1,195 (28.5%) | $49,946 |
| Total | 4,194 (100.0%) | $49,543 |
Poverty in Millington
Income Below Poverty by Sex and Age in Millington
With 12.9% poverty level for males and 18.0% for females among the residents of Millington, 18 to 24 year old males and 18 to 24 year old females are the most vulnerable to poverty, with 163 males (38.7%) and 110 females (46.0%) in their respective age groups living below the poverty level.
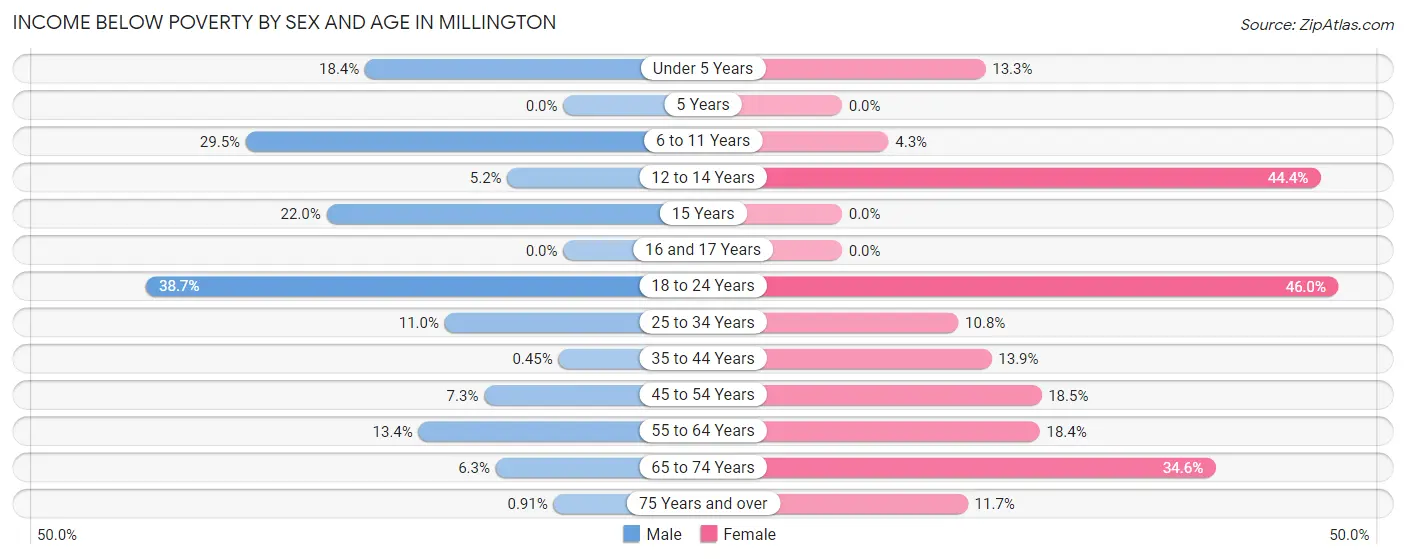
| Age Bracket | Male | Female |
| Under 5 Years | 39 (18.4%) | 51 (13.3%) |
| 5 Years | 0 (0.0%) | 0 (0.0%) |
| 6 to 11 Years | 142 (29.5%) | 20 (4.3%) |
| 12 to 14 Years | 21 (5.2%) | 83 (44.4%) |
| 15 Years | 20 (22.0%) | 0 (0.0%) |
| 16 and 17 Years | 0 (0.0%) | 0 (0.0%) |
| 18 to 24 Years | 163 (38.7%) | 110 (46.0%) |
| 25 to 34 Years | 55 (11.0%) | 84 (10.8%) |
| 35 to 44 Years | 2 (0.4%) | 79 (13.9%) |
| 45 to 54 Years | 40 (7.3%) | 157 (18.5%) |
| 55 to 64 Years | 112 (13.4%) | 136 (18.3%) |
| 65 to 74 Years | 24 (6.3%) | 205 (34.6%) |
| 75 Years and over | 2 (0.9%) | 62 (11.7%) |
| Total | 620 (12.9%) | 987 (18.0%) |
Income Above Poverty by Sex and Age in Millington
According to the poverty statistics in Millington, males aged 5 years and females aged 5 years are the age groups that are most secure financially, with 100.0% of males and 100.0% of females in these age groups living above the poverty line.
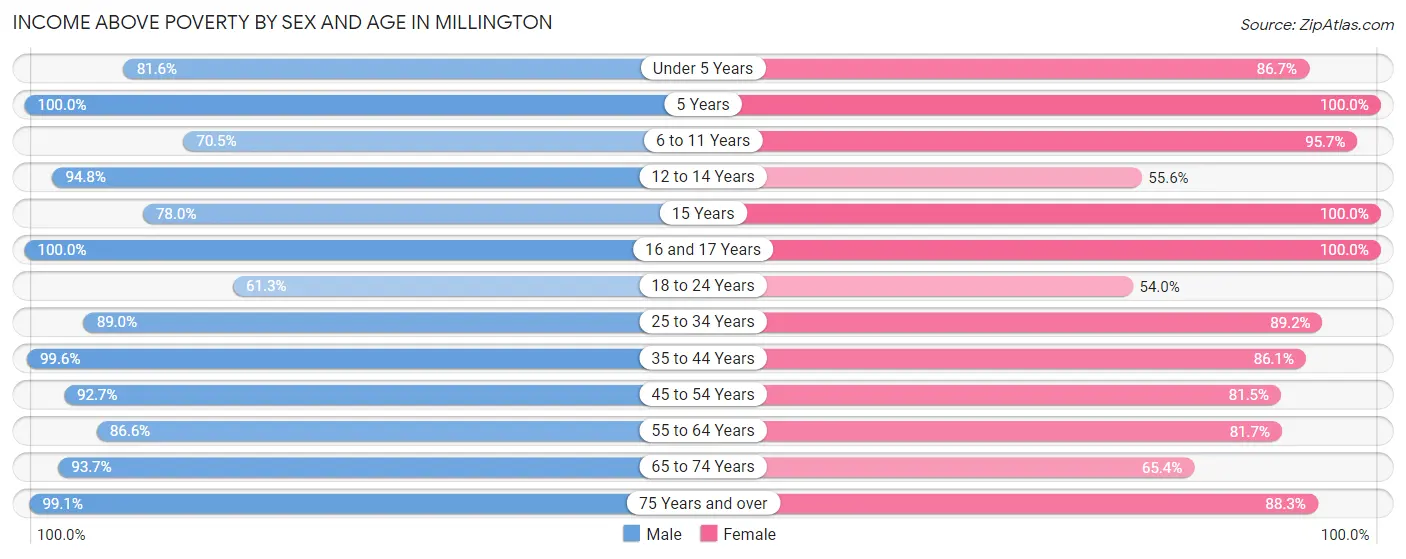
| Age Bracket | Male | Female |
| Under 5 Years | 173 (81.6%) | 332 (86.7%) |
| 5 Years | 27 (100.0%) | 21 (100.0%) |
| 6 to 11 Years | 340 (70.5%) | 443 (95.7%) |
| 12 to 14 Years | 384 (94.8%) | 104 (55.6%) |
| 15 Years | 71 (78.0%) | 75 (100.0%) |
| 16 and 17 Years | 230 (100.0%) | 68 (100.0%) |
| 18 to 24 Years | 258 (61.3%) | 129 (54.0%) |
| 25 to 34 Years | 445 (89.0%) | 694 (89.2%) |
| 35 to 44 Years | 442 (99.6%) | 490 (86.1%) |
| 45 to 54 Years | 505 (92.7%) | 691 (81.5%) |
| 55 to 64 Years | 722 (86.6%) | 605 (81.7%) |
| 65 to 74 Years | 359 (93.7%) | 387 (65.4%) |
| 75 Years and over | 218 (99.1%) | 469 (88.3%) |
| Total | 4,174 (87.1%) | 4,508 (82.0%) |
Income Below Poverty Among Married-Couple Families in Millington
The poverty statistics for married-couple families in Millington show that 10.0% or 173 of the total 1,734 families live below the poverty line. Families with no children have the highest poverty rate of 12.8%, comprising of 157 families. On the other hand, families with 5 or more children have the lowest poverty rate of 0.0%, which includes 0 families.
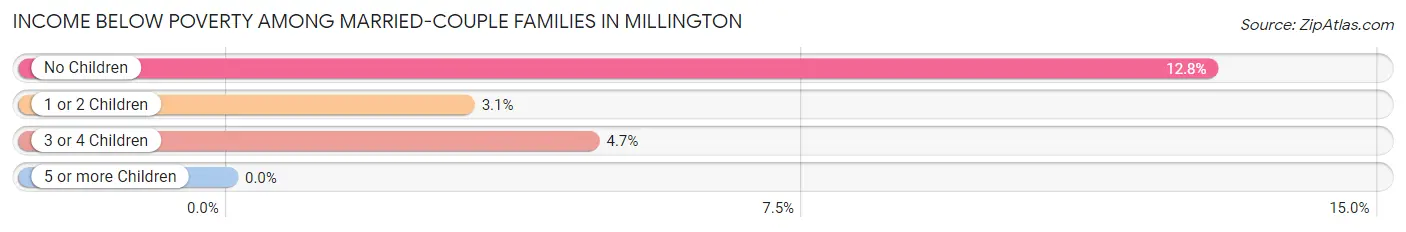
| Children | Above Poverty | Below Poverty |
| No Children | 1,070 (87.2%) | 157 (12.8%) |
| 1 or 2 Children | 345 (96.9%) | 11 (3.1%) |
| 3 or 4 Children | 101 (95.3%) | 5 (4.7%) |
| 5 or more Children | 45 (100.0%) | 0 (0.0%) |
| Total | 1,561 (90.0%) | 173 (10.0%) |
Income Below Poverty Among Single-Parent Households in Millington
According to the poverty data in Millington, 18.5% or 32 single-father households and 21.4% or 178 single-mother households are living below the poverty line. Among single-father households, those with 1 or 2 children have the highest poverty rate, with 32 households (46.4%) experiencing poverty. Likewise, among single-mother households, those with 1 or 2 children have the highest poverty rate, with 143 households (35.3%) falling below the poverty line.
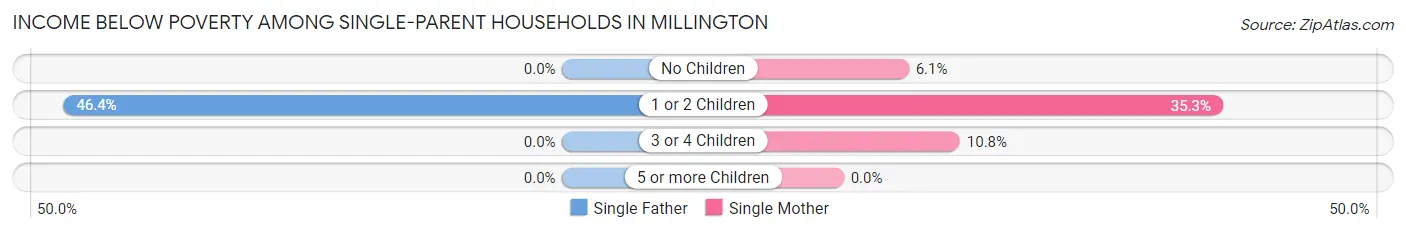
| Children | Single Father | Single Mother |
| No Children | 0 (0.0%) | 14 (6.1%) |
| 1 or 2 Children | 32 (46.4%) | 143 (35.3%) |
| 3 or 4 Children | 0 (0.0%) | 21 (10.8%) |
| 5 or more Children | 0 (0.0%) | 0 (0.0%) |
| Total | 32 (18.5%) | 178 (21.4%) |
Income Below Poverty Among Married-Couple vs Single-Parent Households in Millington
The poverty data for Millington shows that 173 of the married-couple family households (10.0%) and 210 of the single-parent households (20.9%) are living below the poverty level. Within the married-couple family households, those with no children have the highest poverty rate, with 157 households (12.8%) falling below the poverty line. Among the single-parent households, those with 1 or 2 children have the highest poverty rate, with 175 household (36.9%) living below poverty.
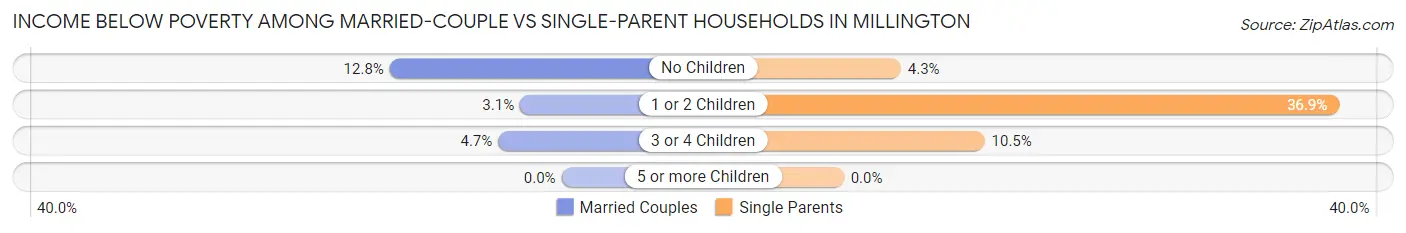
| Children | Married-Couple Families | Single-Parent Households |
| No Children | 157 (12.8%) | 14 (4.3%) |
| 1 or 2 Children | 11 (3.1%) | 175 (36.9%) |
| 3 or 4 Children | 5 (4.7%) | 21 (10.5%) |
| 5 or more Children | 0 (0.0%) | 0 (0.0%) |
| Total | 173 (10.0%) | 210 (20.9%) |
Race in Millington
The most populous races in Millington are White / Caucasian (5,733 | 54.3%), Black / African American (3,239 | 30.7%), and Hispanic or Latino (1,171 | 11.1%).
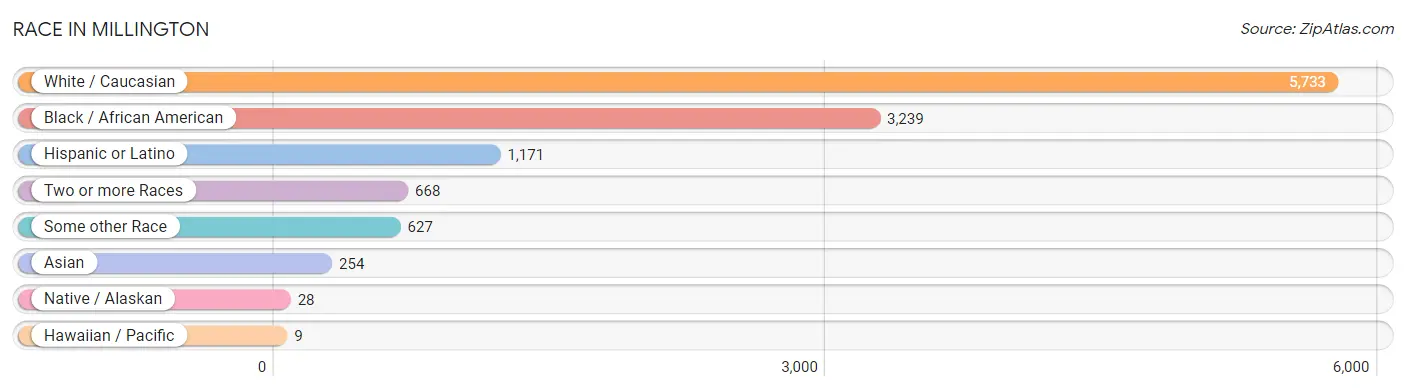
| Race | # Population | % Population |
| Asian | 254 | 2.4% |
| Black / African American | 3,239 | 30.7% |
| Hawaiian / Pacific | 9 | 0.1% |
| Hispanic or Latino | 1,171 | 11.1% |
| Native / Alaskan | 28 | 0.3% |
| White / Caucasian | 5,733 | 54.3% |
| Two or more Races | 668 | 6.3% |
| Some other Race | 627 | 5.9% |
| Total | 10,558 | 100.0% |
Ancestry in Millington
The most populous ancestries reported in Millington are Irish (1,086 | 10.3%), American (899 | 8.5%), German (828 | 7.8%), Mexican (747 | 7.1%), and English (700 | 6.6%), together accounting for 40.3% of all Millington residents.
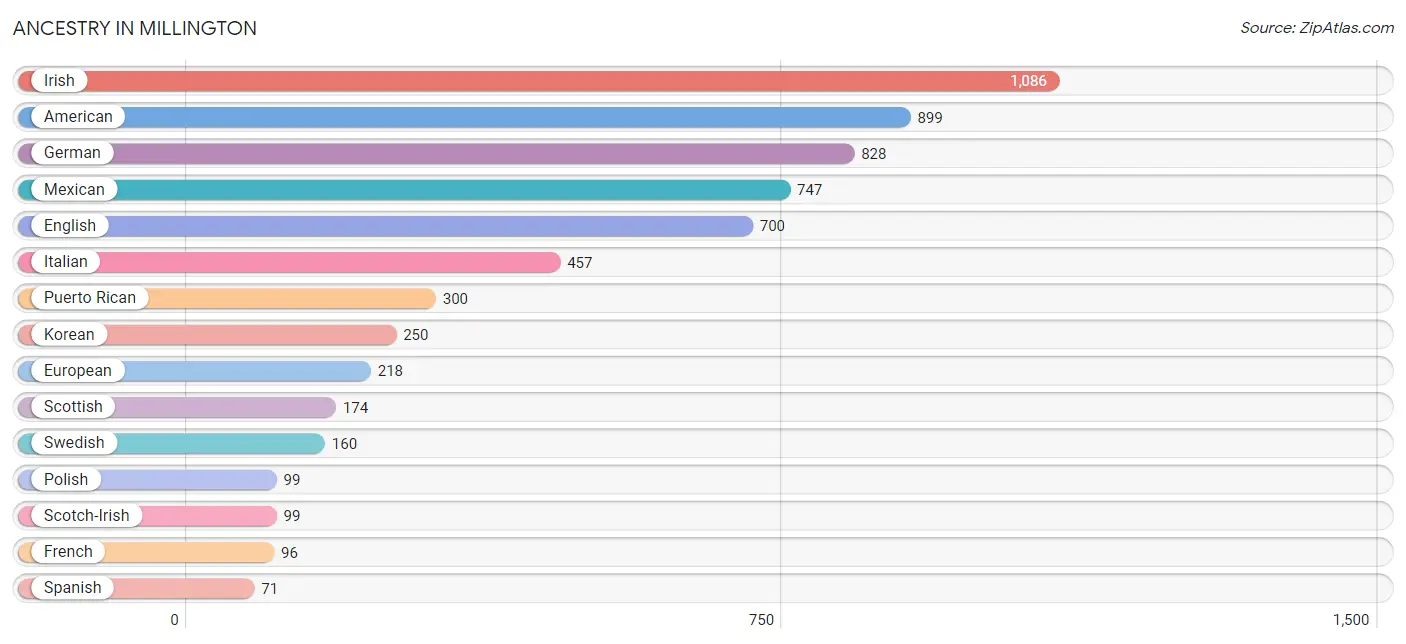
| Ancestry | # Population | % Population |
| African | 15 | 0.1% |
| American | 899 | 8.5% |
| Bhutanese | 30 | 0.3% |
| British | 44 | 0.4% |
| Burmese | 37 | 0.4% |
| Canadian | 11 | 0.1% |
| Central American | 10 | 0.1% |
| Central American Indian | 17 | 0.2% |
| Cherokee | 58 | 0.5% |
| Chickasaw | 7 | 0.1% |
| Chippewa | 3 | 0.0% |
| Colombian | 3 | 0.0% |
| Cuban | 36 | 0.3% |
| Czech | 16 | 0.2% |
| Czechoslovakian | 17 | 0.2% |
| Danish | 8 | 0.1% |
| Dutch | 20 | 0.2% |
| English | 700 | 6.6% |
| European | 218 | 2.1% |
| French | 96 | 0.9% |
| French Canadian | 8 | 0.1% |
| German | 828 | 7.8% |
| Guamanian / Chamorro | 23 | 0.2% |
| Guatemalan | 10 | 0.1% |
| Guyanese | 23 | 0.2% |
| Indian (Asian) | 19 | 0.2% |
| Irish | 1,086 | 10.3% |
| Italian | 457 | 4.3% |
| Jamaican | 20 | 0.2% |
| Korean | 250 | 2.4% |
| Mexican | 747 | 7.1% |
| Mexican American Indian | 11 | 0.1% |
| Native Hawaiian | 9 | 0.1% |
| Nigerian | 8 | 0.1% |
| Norwegian | 37 | 0.4% |
| Pennsylvania German | 11 | 0.1% |
| Peruvian | 4 | 0.0% |
| Polish | 99 | 0.9% |
| Puerto Rican | 300 | 2.8% |
| Russian | 3 | 0.0% |
| Scandinavian | 33 | 0.3% |
| Scotch-Irish | 99 | 0.9% |
| Scottish | 174 | 1.7% |
| Slavic | 15 | 0.1% |
| South American | 7 | 0.1% |
| Spanish | 71 | 0.7% |
| Subsaharan African | 23 | 0.2% |
| Swedish | 160 | 1.5% |
| Tongan | 12 | 0.1% |
| Welsh | 22 | 0.2% | View All 50 Rows |
Immigrants in Millington
The most numerous immigrant groups reported in Millington came from Asia (244 | 2.3%), Latin America (229 | 2.2%), Central America (224 | 2.1%), Mexico (224 | 2.1%), and South Eastern Asia (191 | 1.8%), together accounting for 10.5% of all Millington residents.
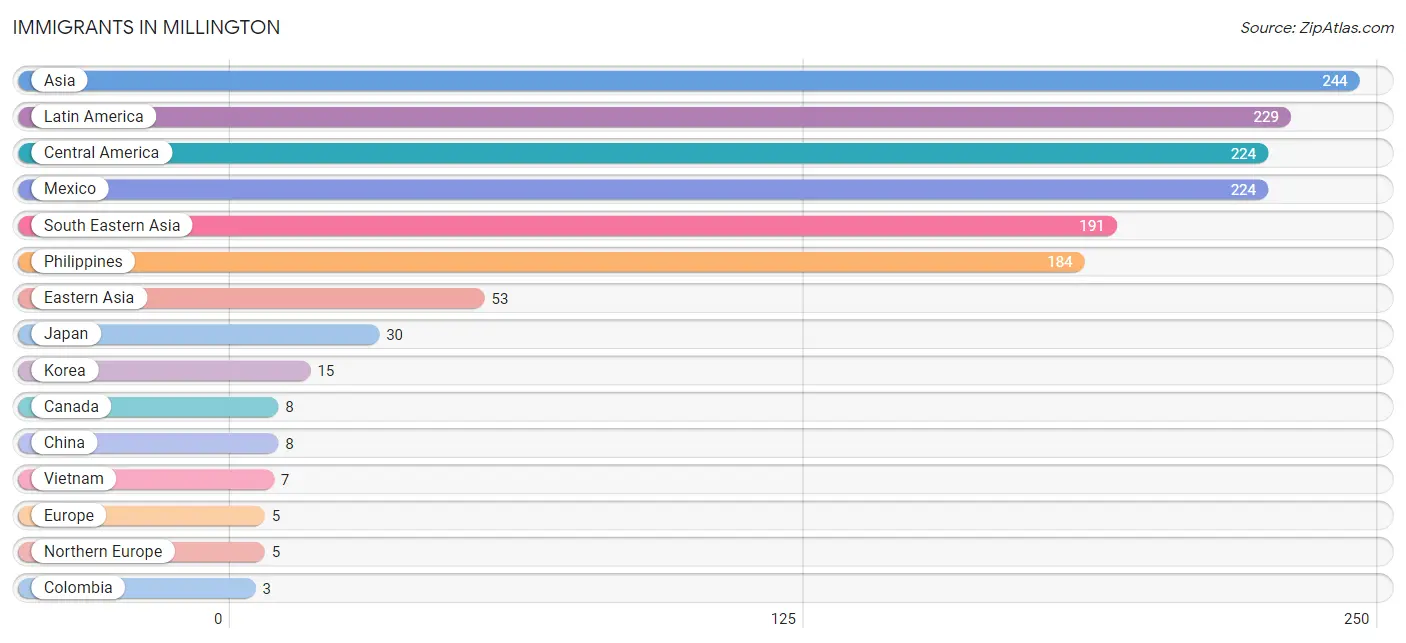
| Immigration Origin | # Population | % Population |
| Asia | 244 | 2.3% |
| Canada | 8 | 0.1% |
| Caribbean | 2 | 0.0% |
| Central America | 224 | 2.1% |
| China | 8 | 0.1% |
| Colombia | 3 | 0.0% |
| Eastern Asia | 53 | 0.5% |
| Europe | 5 | 0.1% |
| Jamaica | 2 | 0.0% |
| Japan | 30 | 0.3% |
| Korea | 15 | 0.1% |
| Latin America | 229 | 2.2% |
| Mexico | 224 | 2.1% |
| Northern Europe | 5 | 0.1% |
| Philippines | 184 | 1.7% |
| South America | 3 | 0.0% |
| South Eastern Asia | 191 | 1.8% |
| Vietnam | 7 | 0.1% | View All 18 Rows |
Sex and Age in Millington
Sex and Age in Millington
The most populous age groups in Millington are 10 to 14 Years (666 | 13.3%) for men and 30 to 34 Years (497 | 8.9%) for women.
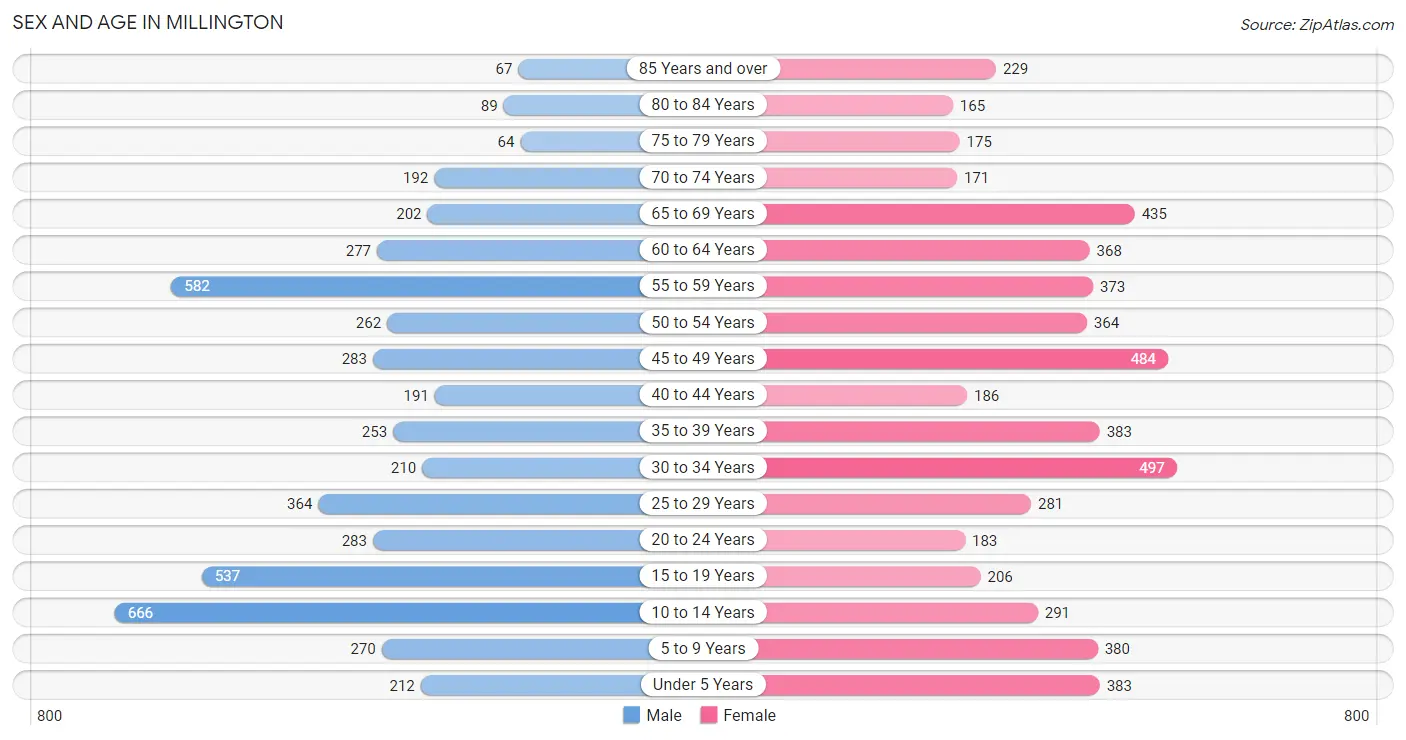
| Age Bracket | Male | Female |
| Under 5 Years | 212 (4.2%) | 383 (6.9%) |
| 5 to 9 Years | 270 (5.4%) | 380 (6.8%) |
| 10 to 14 Years | 666 (13.3%) | 291 (5.2%) |
| 15 to 19 Years | 537 (10.7%) | 206 (3.7%) |
| 20 to 24 Years | 283 (5.7%) | 183 (3.3%) |
| 25 to 29 Years | 364 (7.3%) | 281 (5.1%) |
| 30 to 34 Years | 210 (4.2%) | 497 (8.9%) |
| 35 to 39 Years | 253 (5.1%) | 383 (6.9%) |
| 40 to 44 Years | 191 (3.8%) | 186 (3.4%) |
| 45 to 49 Years | 283 (5.7%) | 484 (8.7%) |
| 50 to 54 Years | 262 (5.2%) | 364 (6.6%) |
| 55 to 59 Years | 582 (11.6%) | 373 (6.7%) |
| 60 to 64 Years | 277 (5.5%) | 368 (6.6%) |
| 65 to 69 Years | 202 (4.0%) | 435 (7.8%) |
| 70 to 74 Years | 192 (3.8%) | 171 (3.1%) |
| 75 to 79 Years | 64 (1.3%) | 175 (3.2%) |
| 80 to 84 Years | 89 (1.8%) | 165 (3.0%) |
| 85 Years and over | 67 (1.3%) | 229 (4.1%) |
| Total | 5,004 (100.0%) | 5,554 (100.0%) |
Families and Households in Millington
Median Family Size in Millington
The median family size in Millington is 3.14 persons per family, with single female/mother families (830 | 30.3%) accounting for the largest median family size of 3.73 persons per family. On the other hand, single male/father families (173 | 6.3%) represent the smallest median family size with 2.65 persons per family.
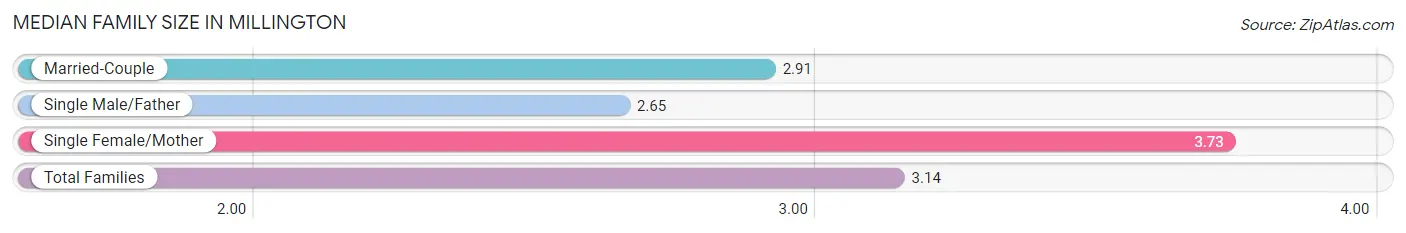
| Family Type | # Families | Family Size |
| Married-Couple | 1,734 (63.3%) | 2.91 |
| Single Male/Father | 173 (6.3%) | 2.65 |
| Single Female/Mother | 830 (30.3%) | 3.73 |
| Total Families | 2,737 (100.0%) | 3.14 |
Median Household Size in Millington
The median household size in Millington is 2.46 persons per household, with single female/mother households (830 | 19.8%) accounting for the largest median household size of 3.79 persons per household. non-family households (1,457 | 34.7%) represent the smallest median household size with 1.11 persons per household.
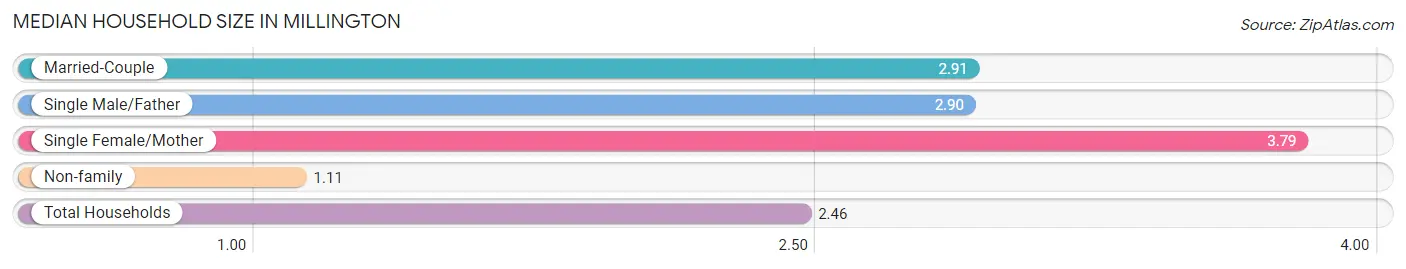
| Household Type | # Households | Household Size |
| Married-Couple | 1,734 (41.3%) | 2.91 |
| Single Male/Father | 173 (4.1%) | 2.90 |
| Single Female/Mother | 830 (19.8%) | 3.79 |
| Non-family | 1,457 (34.7%) | 1.11 |
| Total Households | 4,194 (100.0%) | 2.46 |
Household Size by Marriage Status in Millington
Out of a total of 4,194 households in Millington, 2,737 (65.3%) are family households, while 1,457 (34.7%) are nonfamily households. The most numerous type of family households are 2-person households, comprising 1,454, and the most common type of nonfamily households are 1-person households, comprising 1,317.
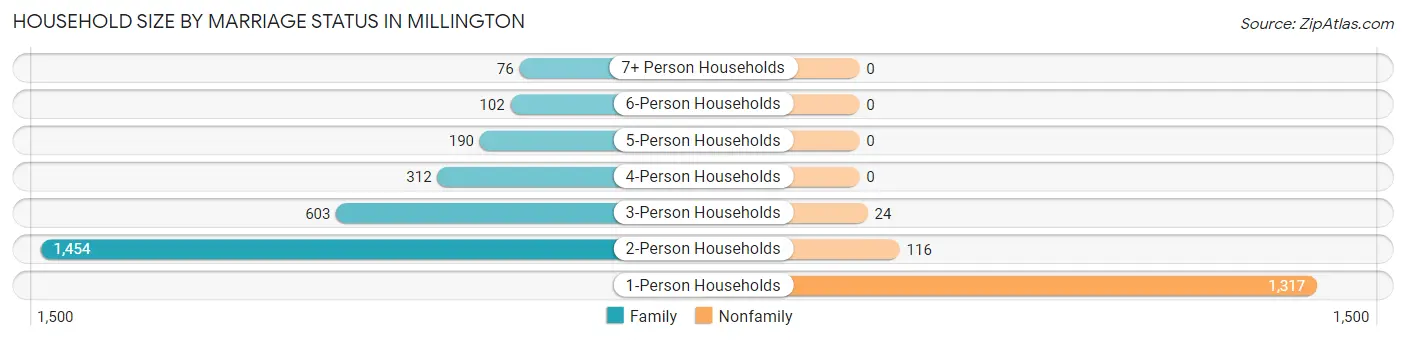
| Household Size | Family Households | Nonfamily Households |
| 1-Person Households | - | 1,317 (31.4%) |
| 2-Person Households | 1,454 (34.7%) | 116 (2.8%) |
| 3-Person Households | 603 (14.4%) | 24 (0.6%) |
| 4-Person Households | 312 (7.4%) | 0 (0.0%) |
| 5-Person Households | 190 (4.5%) | 0 (0.0%) |
| 6-Person Households | 102 (2.4%) | 0 (0.0%) |
| 7+ Person Households | 76 (1.8%) | 0 (0.0%) |
| Total | 2,737 (65.3%) | 1,457 (34.7%) |
Female Fertility in Millington
Fertility by Age in Millington
Average fertility rate in Millington is 29.0 births per 1,000 women. Women in the age bracket of 20 to 34 years have the highest fertility rate with 66.0 births per 1,000 women. Women in the age bracket of 20 to 34 years acount for 95.5% of all women with births.
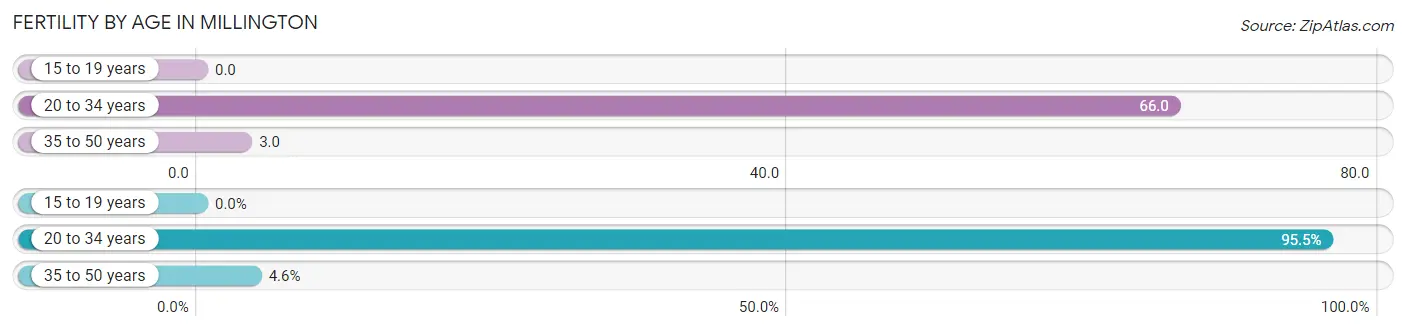
| Age Bracket | Women with Births | Births / 1,000 Women |
| 15 to 19 years | 0 (0.0%) | 0.0 |
| 20 to 34 years | 63 (95.5%) | 66.0 |
| 35 to 50 years | 3 (4.5%) | 3.0 |
| Total | 66 (100.0%) | 29.0 |
Fertility by Age by Marriage Status in Millington
51.5% of women with births (66) in Millington are married. The highest percentage of unmarried women with births falls into 20 to 34 years age bracket with 50.8% of them unmarried at the time of birth, while the lowest percentage of unmarried women with births belong to 35 to 50 years age bracket with 0.0% of them unmarried.
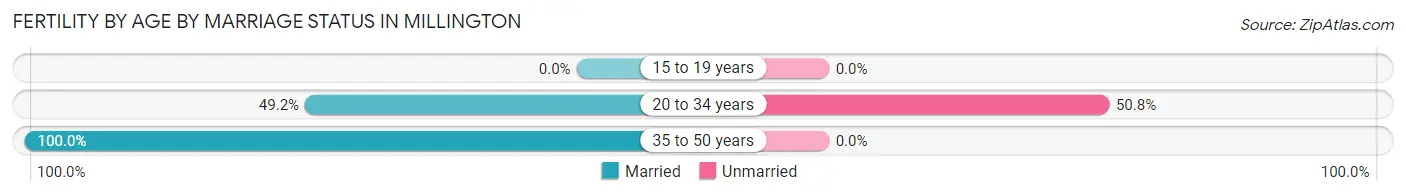
| Age Bracket | Married | Unmarried |
| 15 to 19 years | 0 (0.0%) | 0 (0.0%) |
| 20 to 34 years | 31 (49.2%) | 32 (50.8%) |
| 35 to 50 years | 3 (100.0%) | 0 (0.0%) |
| Total | 34 (51.5%) | 32 (48.5%) |
Fertility by Education in Millington
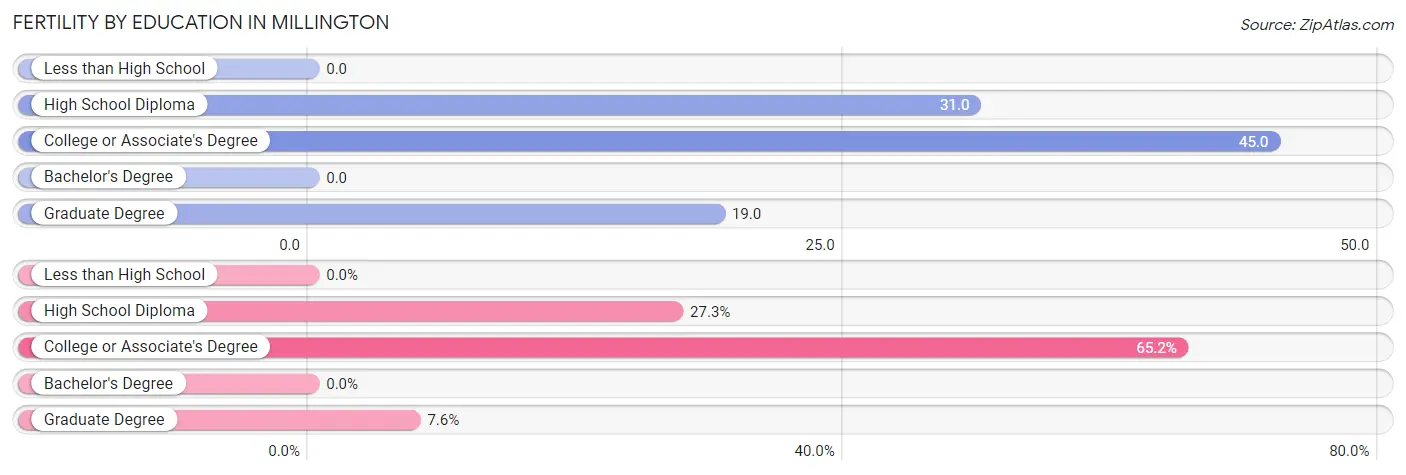
| Educational Attainment | Women with Births | Births / 1,000 Women |
| Less than High School | 0 (0.0%) | 0.0 |
| High School Diploma | 18 (27.3%) | 31.0 |
| College or Associate's Degree | 43 (65.1%) | 45.0 |
| Bachelor's Degree | 0 (0.0%) | 0.0 |
| Graduate Degree | 5 (7.6%) | 19.0 |
| Total | 66 (100.0%) | 29.0 |
Fertility by Education by Marriage Status in Millington
48.5% of women with births in Millington are unmarried. Women with the educational attainment of high school diploma are most likely to be married with 100.0% of them married at childbirth, while women with the educational attainment of college or associate's degree are least likely to be married with 74.4% of them unmarried at childbirth.
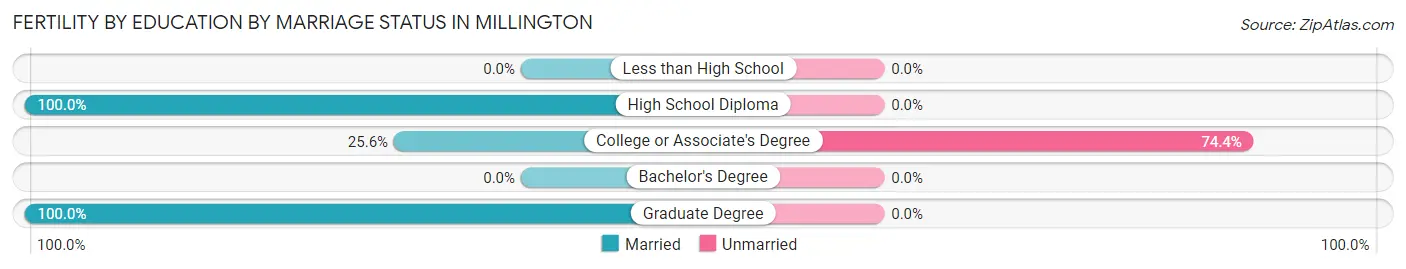
| Educational Attainment | Married | Unmarried |
| Less than High School | 0 (0.0%) | 0 (0.0%) |
| High School Diploma | 18 (100.0%) | 0 (0.0%) |
| College or Associate's Degree | 11 (25.6%) | 32 (74.4%) |
| Bachelor's Degree | 0 (0.0%) | 0 (0.0%) |
| Graduate Degree | 5 (100.0%) | 0 (0.0%) |
| Total | 34 (51.5%) | 32 (48.5%) |
Employment Characteristics in Millington
Employment by Class of Employer in Millington
Among the 4,214 employed individuals in Millington, private company employees (2,375 | 56.4%), federal government employees (582 | 13.8%), and self-employed (not incorporated) (360 | 8.5%) make up the most common classes of employment.
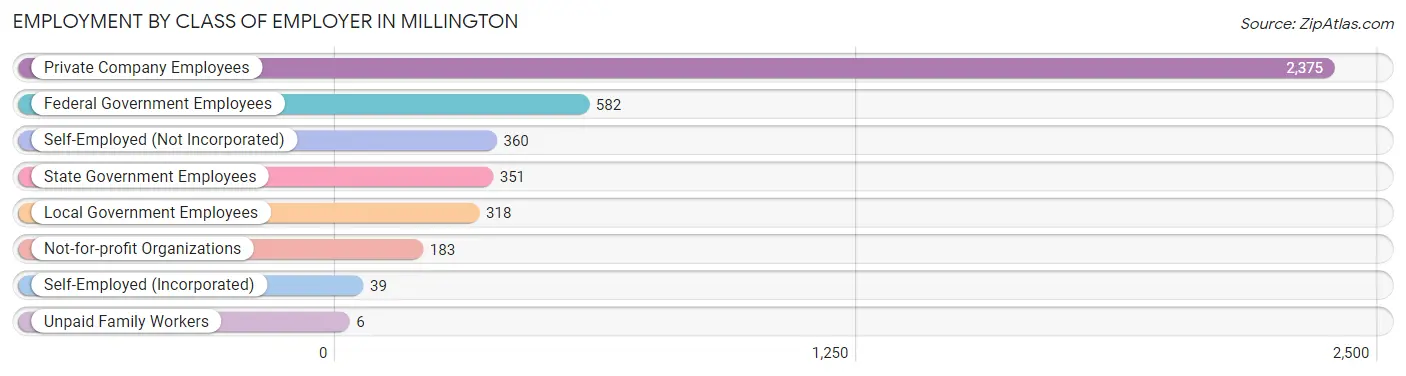
| Employer Class | # Employees | % Employees |
| Private Company Employees | 2,375 | 56.4% |
| Self-Employed (Incorporated) | 39 | 0.9% |
| Self-Employed (Not Incorporated) | 360 | 8.5% |
| Not-for-profit Organizations | 183 | 4.3% |
| Local Government Employees | 318 | 7.5% |
| State Government Employees | 351 | 8.3% |
| Federal Government Employees | 582 | 13.8% |
| Unpaid Family Workers | 6 | 0.1% |
| Total | 4,214 | 100.0% |
Employment Status by Age in Millington
According to the labor force statistics for Millington, out of the total population over 16 years of age (8,190), 56.6% or 4,636 individuals are in the labor force, with 8.1% or 376 of them unemployed. The age group with the highest labor force participation rate is 25 to 29 years, with 88.7% or 572 individuals in the labor force. Within the labor force, the 30 to 34 years age range has the highest percentage of unemployed individuals, with 34.3% or 212 of them being unemployed.
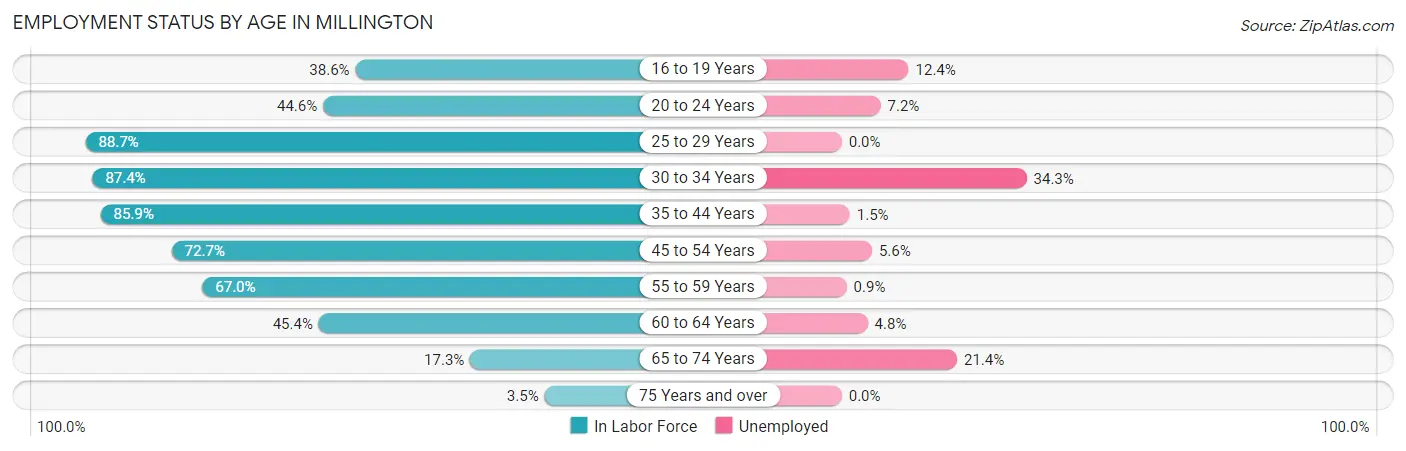
| Age Bracket | In Labor Force | Unemployed |
| 16 to 19 Years | 223 (38.6%) | 28 (12.4%) |
| 20 to 24 Years | 208 (44.6%) | 15 (7.2%) |
| 25 to 29 Years | 572 (88.7%) | 0 (0.0%) |
| 30 to 34 Years | 618 (87.4%) | 212 (34.3%) |
| 35 to 44 Years | 870 (85.9%) | 13 (1.5%) |
| 45 to 54 Years | 1,013 (72.7%) | 57 (5.6%) |
| 55 to 59 Years | 640 (67.0%) | 6 (0.9%) |
| 60 to 64 Years | 293 (45.4%) | 14 (4.8%) |
| 65 to 74 Years | 173 (17.3%) | 37 (21.4%) |
| 75 Years and over | 28 (3.5%) | 0 (0.0%) |
| Total | 4,636 (56.6%) | 376 (8.1%) |
Employment Status by Educational Attainment in Millington
According to labor force statistics for Millington, 74.8% of individuals (4,008) out of the total population between 25 and 64 years of age (5,358) are in the labor force, with 7.3% or 293 of them being unemployed. The group with the highest labor force participation rate are those with the educational attainment of bachelor's degree or higher, with 88.7% or 827 individuals in the labor force. Within the labor force, individuals with less than high school education have the highest percentage of unemployment, with 13.7% or 29 of them being unemployed.
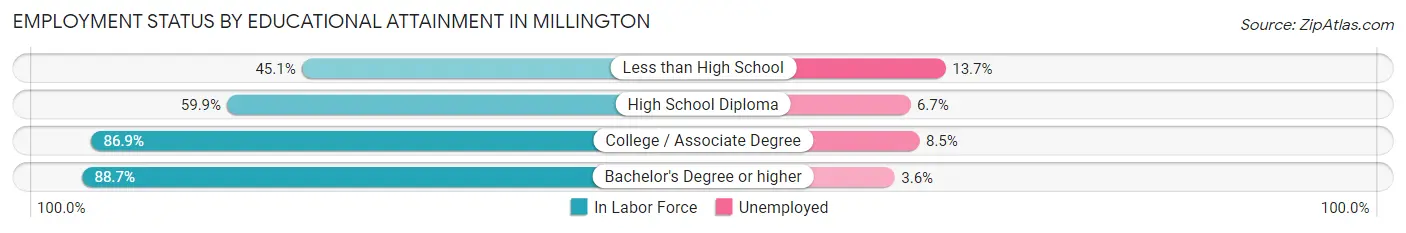
| Educational Attainment | In Labor Force | Unemployed |
| Less than High School | 214 (45.1%) | 65 (13.7%) |
| High School Diploma | 1,037 (59.9%) | 116 (6.7%) |
| College / Associate Degree | 1,928 (86.9%) | 189 (8.5%) |
| Bachelor's Degree or higher | 827 (88.7%) | 34 (3.6%) |
| Total | 4,008 (74.8%) | 391 (7.3%) |
Employment Occupations by Sex in Millington
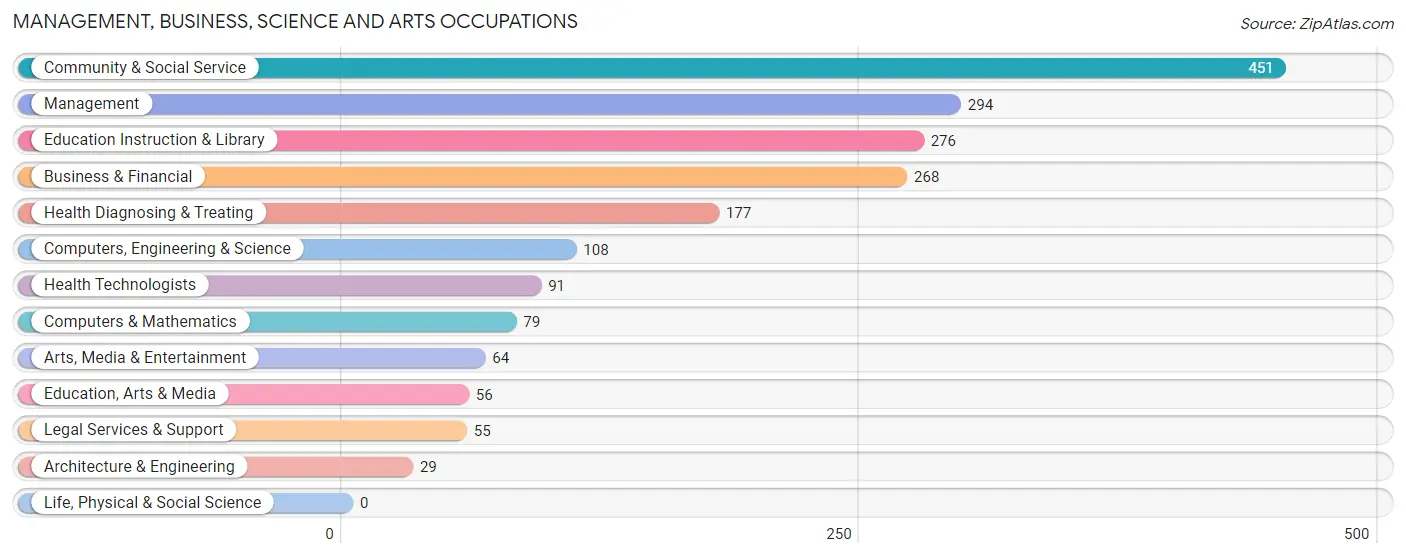
Management, Business, Science and Arts Occupations
The most common Management, Business, Science and Arts occupations in Millington are Community & Social Service (451 | 11.4%), Management (294 | 7.4%), Education Instruction & Library (276 | 7.0%), Business & Financial (268 | 6.8%), and Health Diagnosing & Treating (177 | 4.5%).
Management, Business, Science and Arts Occupations by Sex
Within the Management, Business, Science and Arts occupations in Millington, the most male-oriented occupations are Architecture & Engineering (100.0%), Arts, Media & Entertainment (76.6%), and Computers, Engineering & Science (75.0%), while the most female-oriented occupations are Education, Arts & Media (82.1%), Legal Services & Support (81.8%), and Health Diagnosing & Treating (72.3%).
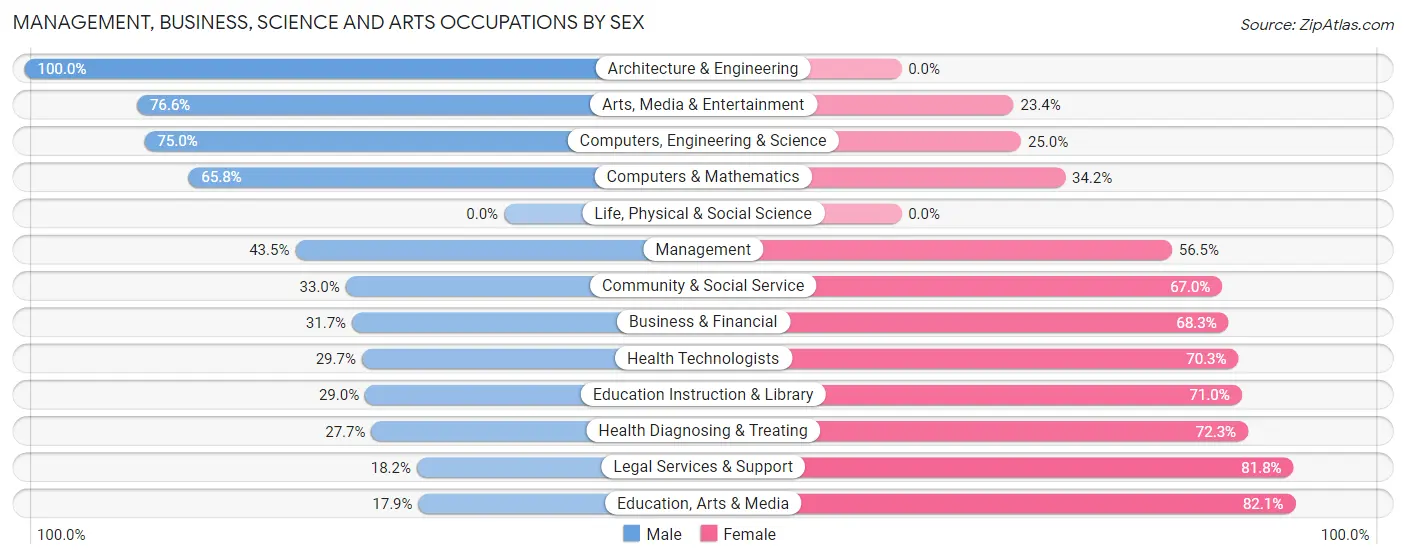
| Occupation | Male | Female |
| Management | 128 (43.5%) | 166 (56.5%) |
| Business & Financial | 85 (31.7%) | 183 (68.3%) |
| Computers, Engineering & Science | 81 (75.0%) | 27 (25.0%) |
| Computers & Mathematics | 52 (65.8%) | 27 (34.2%) |
| Architecture & Engineering | 29 (100.0%) | 0 (0.0%) |
| Life, Physical & Social Science | 0 (0.0%) | 0 (0.0%) |
| Community & Social Service | 149 (33.0%) | 302 (67.0%) |
| Education, Arts & Media | 10 (17.9%) | 46 (82.1%) |
| Legal Services & Support | 10 (18.2%) | 45 (81.8%) |
| Education Instruction & Library | 80 (29.0%) | 196 (71.0%) |
| Arts, Media & Entertainment | 49 (76.6%) | 15 (23.4%) |
| Health Diagnosing & Treating | 49 (27.7%) | 128 (72.3%) |
| Health Technologists | 27 (29.7%) | 64 (70.3%) |
| Total (Category) | 492 (37.9%) | 806 (62.1%) |
| Total (Overall) | 1,995 (50.5%) | 1,954 (49.5%) |
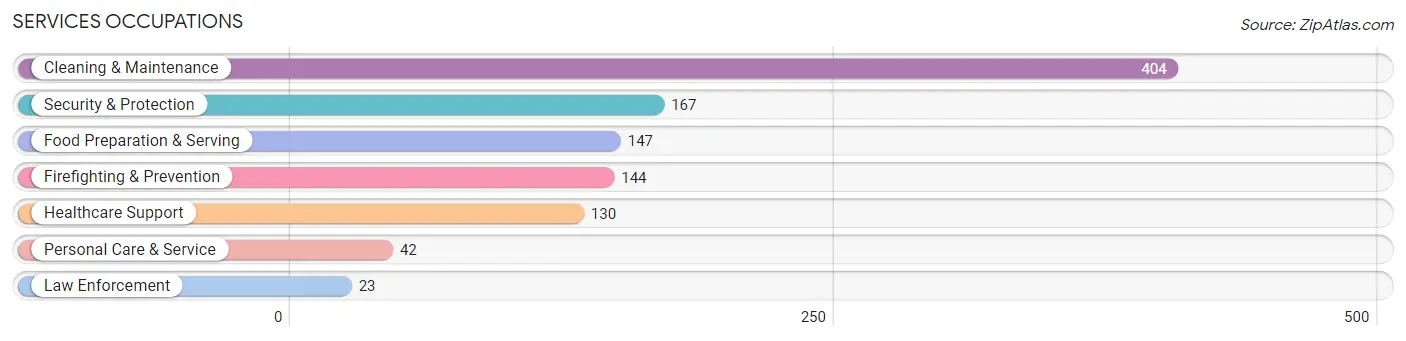
Services Occupations
The most common Services occupations in Millington are Cleaning & Maintenance (404 | 10.2%), Security & Protection (167 | 4.2%), Food Preparation & Serving (147 | 3.7%), Firefighting & Prevention (144 | 3.6%), and Healthcare Support (130 | 3.3%).
Services Occupations by Sex
Within the Services occupations in Millington, the most male-oriented occupations are Law Enforcement (100.0%), Cleaning & Maintenance (88.6%), and Personal Care & Service (76.2%), while the most female-oriented occupations are Healthcare Support (100.0%), Food Preparation & Serving (76.9%), and Firefighting & Prevention (46.5%).
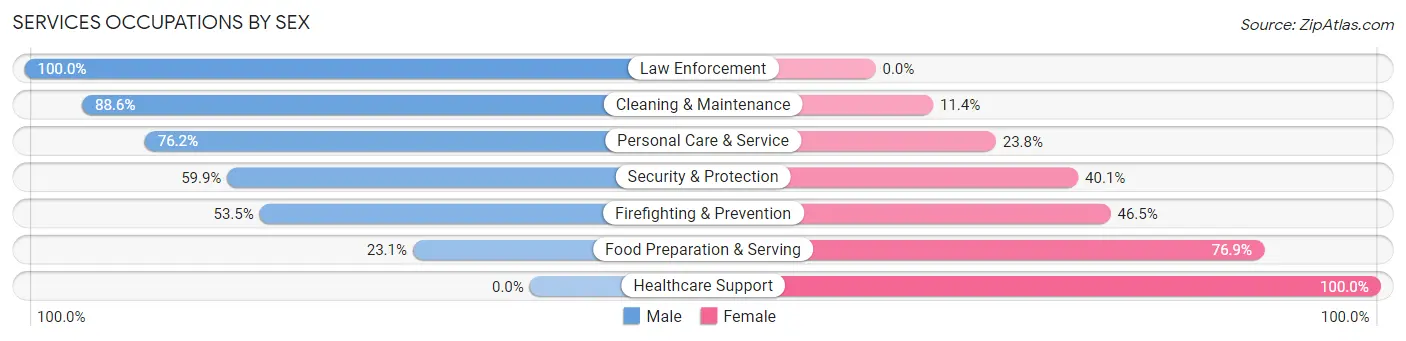
| Occupation | Male | Female |
| Healthcare Support | 0 (0.0%) | 130 (100.0%) |
| Security & Protection | 100 (59.9%) | 67 (40.1%) |
| Firefighting & Prevention | 77 (53.5%) | 67 (46.5%) |
| Law Enforcement | 23 (100.0%) | 0 (0.0%) |
| Food Preparation & Serving | 34 (23.1%) | 113 (76.9%) |
| Cleaning & Maintenance | 358 (88.6%) | 46 (11.4%) |
| Personal Care & Service | 32 (76.2%) | 10 (23.8%) |
| Total (Category) | 524 (58.9%) | 366 (41.1%) |
| Total (Overall) | 1,995 (50.5%) | 1,954 (49.5%) |
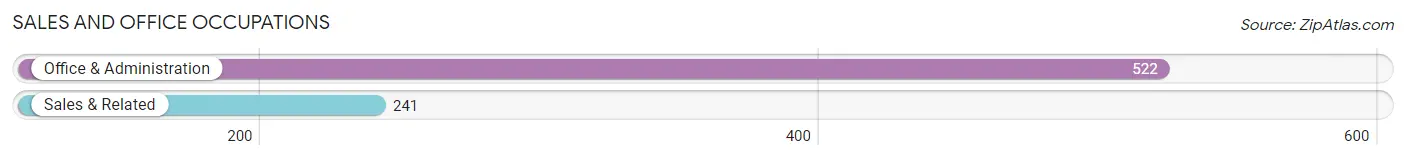
Sales and Office Occupations
The most common Sales and Office occupations in Millington are Office & Administration (522 | 13.2%), and Sales & Related (241 | 6.1%).
Sales and Office Occupations by Sex
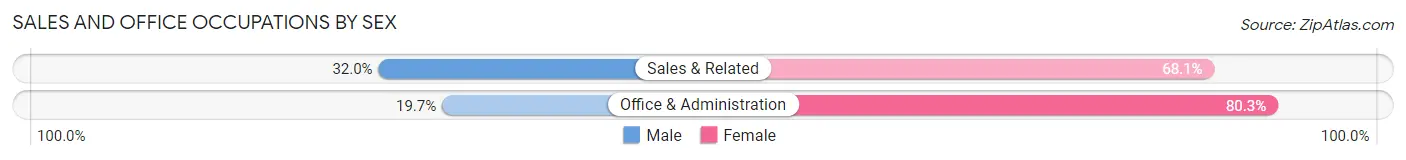
| Occupation | Male | Female |
| Sales & Related | 77 (32.0%) | 164 (68.0%) |
| Office & Administration | 103 (19.7%) | 419 (80.3%) |
| Total (Category) | 180 (23.6%) | 583 (76.4%) |
| Total (Overall) | 1,995 (50.5%) | 1,954 (49.5%) |
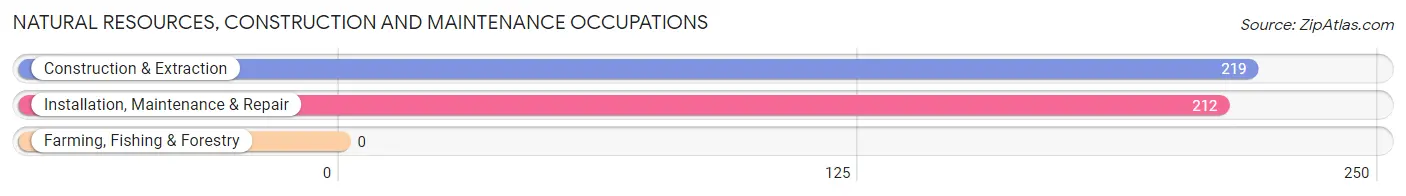
Natural Resources, Construction and Maintenance Occupations
The most common Natural Resources, Construction and Maintenance occupations in Millington are Construction & Extraction (219 | 5.6%), and Installation, Maintenance & Repair (212 | 5.4%).
Natural Resources, Construction and Maintenance Occupations by Sex
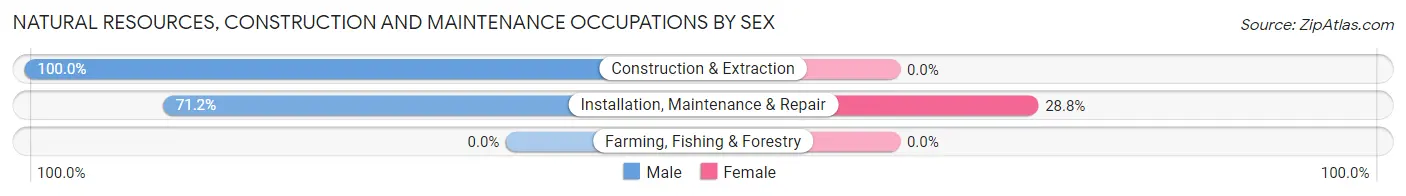
| Occupation | Male | Female |
| Farming, Fishing & Forestry | 0 (0.0%) | 0 (0.0%) |
| Construction & Extraction | 219 (100.0%) | 0 (0.0%) |
| Installation, Maintenance & Repair | 151 (71.2%) | 61 (28.8%) |
| Total (Category) | 370 (85.9%) | 61 (14.1%) |
| Total (Overall) | 1,995 (50.5%) | 1,954 (49.5%) |
Production, Transportation and Moving Occupations
The most common Production, Transportation and Moving occupations in Millington are Production (288 | 7.3%), Material Moving (216 | 5.5%), and Transportation (63 | 1.6%).
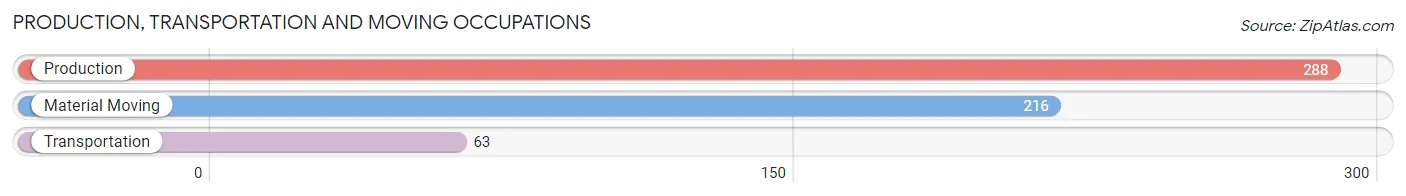
Production, Transportation and Moving Occupations by Sex
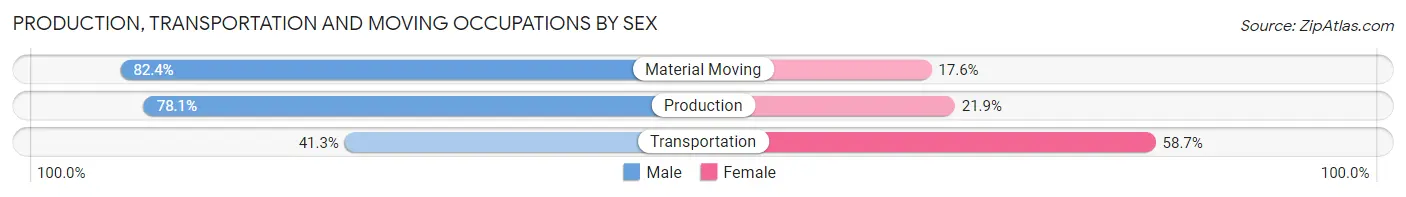
| Occupation | Male | Female |
| Production | 225 (78.1%) | 63 (21.9%) |
| Transportation | 26 (41.3%) | 37 (58.7%) |
| Material Moving | 178 (82.4%) | 38 (17.6%) |
| Total (Category) | 429 (75.7%) | 138 (24.3%) |
| Total (Overall) | 1,995 (50.5%) | 1,954 (49.5%) |
Employment Industries by Sex in Millington
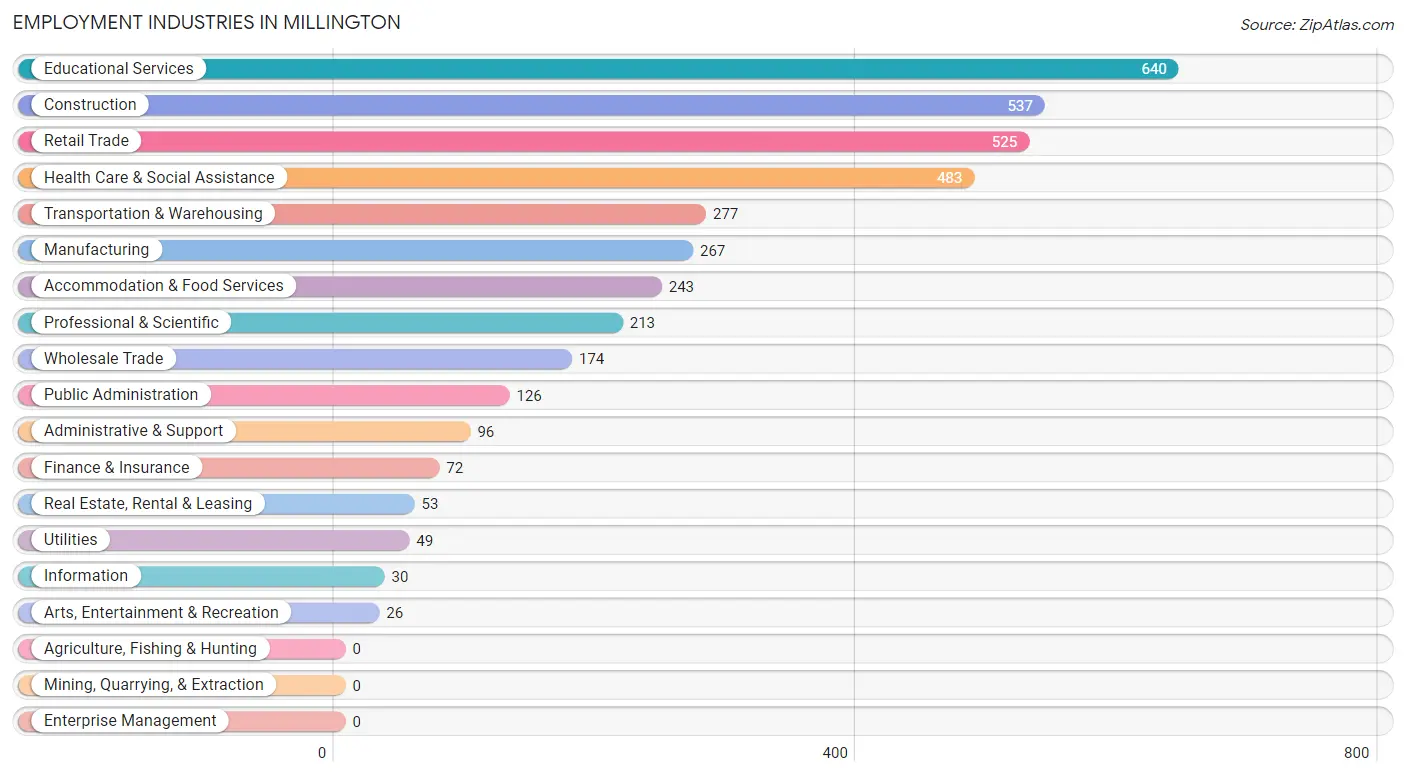
Employment Industries in Millington
The major employment industries in Millington include Educational Services (640 | 16.2%), Construction (537 | 13.6%), Retail Trade (525 | 13.3%), Health Care & Social Assistance (483 | 12.2%), and Transportation & Warehousing (277 | 7.0%).
Employment Industries by Sex in Millington
The Millington industries that see more men than women are Utilities (100.0%), Arts, Entertainment & Recreation (92.3%), and Transportation & Warehousing (81.2%), whereas the industries that tend to have a higher number of women are Information (100.0%), Wholesale Trade (87.4%), and Health Care & Social Assistance (85.3%).
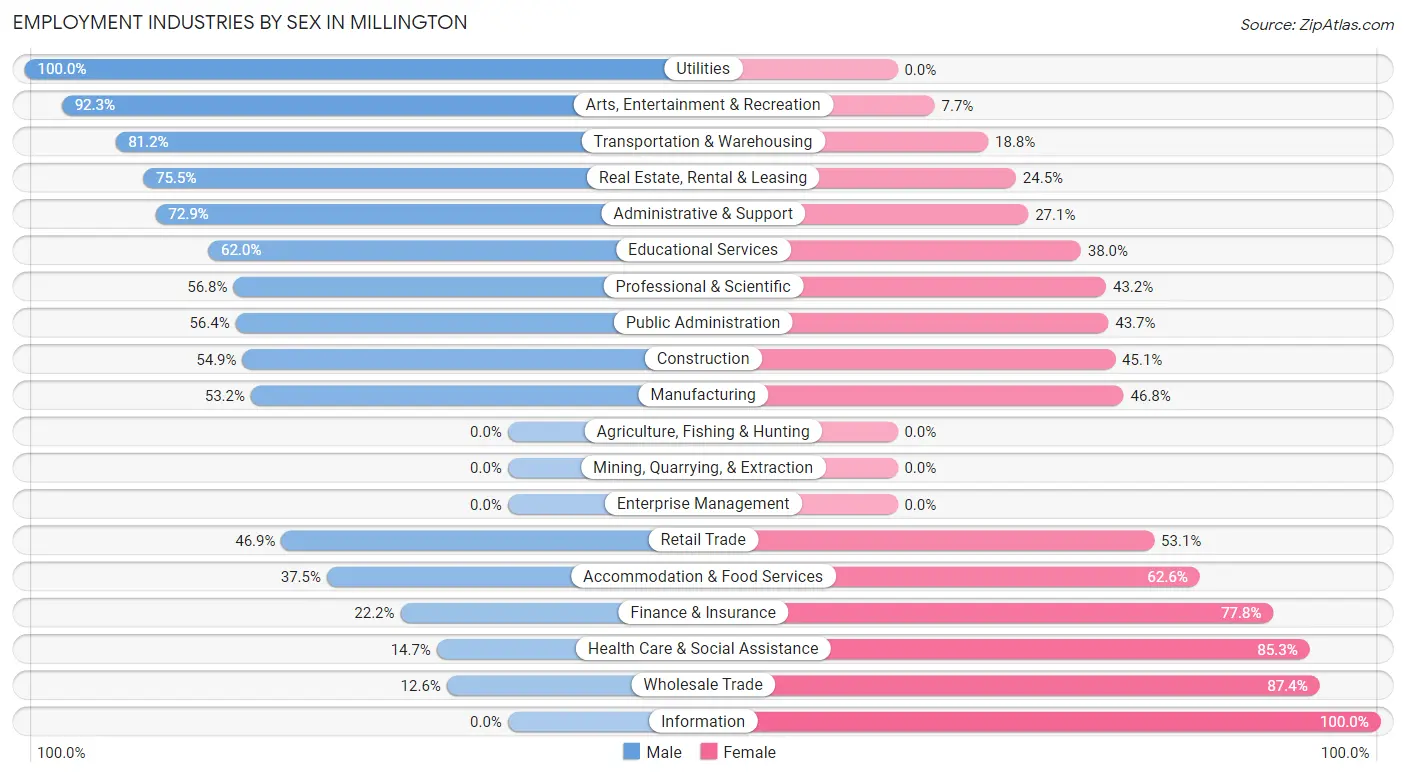
| Industry | Male | Female |
| Agriculture, Fishing & Hunting | 0 (0.0%) | 0 (0.0%) |
| Mining, Quarrying, & Extraction | 0 (0.0%) | 0 (0.0%) |
| Construction | 295 (54.9%) | 242 (45.1%) |
| Manufacturing | 142 (53.2%) | 125 (46.8%) |
| Wholesale Trade | 22 (12.6%) | 152 (87.4%) |
| Retail Trade | 246 (46.9%) | 279 (53.1%) |
| Transportation & Warehousing | 225 (81.2%) | 52 (18.8%) |
| Utilities | 49 (100.0%) | 0 (0.0%) |
| Information | 0 (0.0%) | 30 (100.0%) |
| Finance & Insurance | 16 (22.2%) | 56 (77.8%) |
| Real Estate, Rental & Leasing | 40 (75.5%) | 13 (24.5%) |
| Professional & Scientific | 121 (56.8%) | 92 (43.2%) |
| Enterprise Management | 0 (0.0%) | 0 (0.0%) |
| Administrative & Support | 70 (72.9%) | 26 (27.1%) |
| Educational Services | 397 (62.0%) | 243 (38.0%) |
| Health Care & Social Assistance | 71 (14.7%) | 412 (85.3%) |
| Arts, Entertainment & Recreation | 24 (92.3%) | 2 (7.7%) |
| Accommodation & Food Services | 91 (37.4%) | 152 (62.5%) |
| Public Administration | 71 (56.4%) | 55 (43.6%) |
| Total | 1,995 (50.5%) | 1,954 (49.5%) |
Education in Millington
School Enrollment in Millington
The most common levels of schooling among the 2,348 students in Millington are middle school (794 | 33.8%), elementary school (514 | 21.9%), and high school (448 | 19.1%).
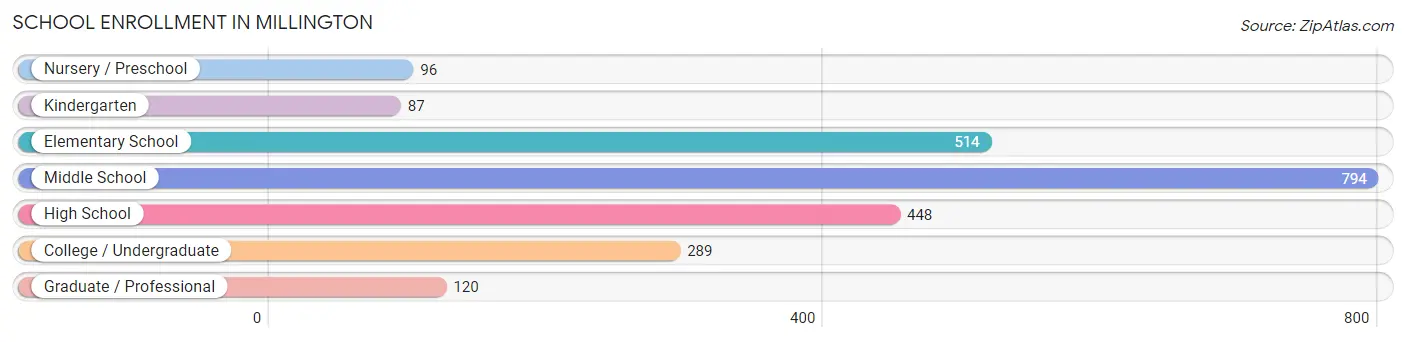
| School Level | # Students | % Students |
| Nursery / Preschool | 96 | 4.1% |
| Kindergarten | 87 | 3.7% |
| Elementary School | 514 | 21.9% |
| Middle School | 794 | 33.8% |
| High School | 448 | 19.1% |
| College / Undergraduate | 289 | 12.3% |
| Graduate / Professional | 120 | 5.1% |
| Total | 2,348 | 100.0% |
School Enrollment by Age by Funding Source in Millington
Out of a total of 2,348 students who are enrolled in schools in Millington, 183 (7.8%) attend a private institution, while the remaining 2,165 (92.2%) are enrolled in public schools. The age group of 20 to 24 year olds has the highest likelihood of being enrolled in private schools, with 26 (38.2% in the age bracket) enrolled. Conversely, the age group of 18 to 19 year olds has the lowest likelihood of being enrolled in a private school, with 24 (100.0% in the age bracket) attending a public institution.
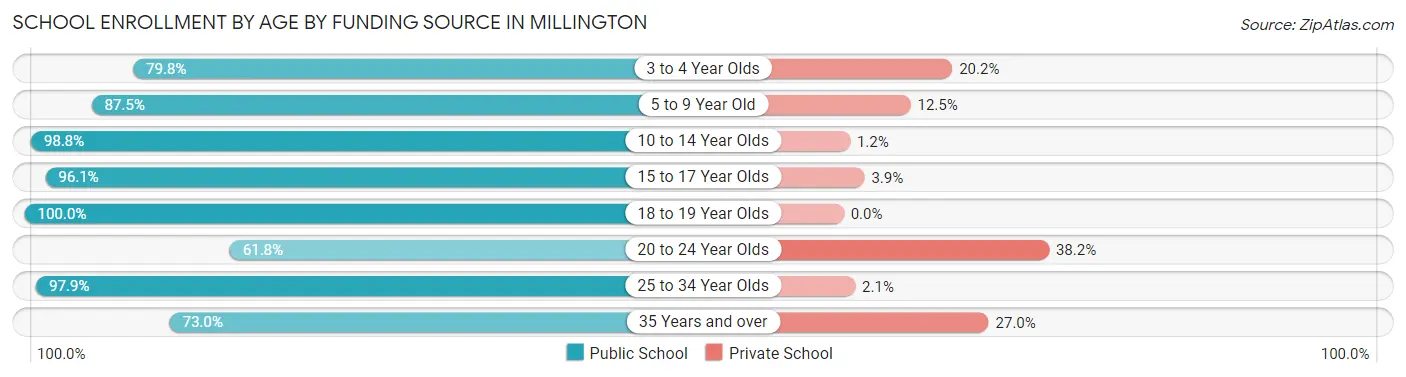
| Age Bracket | Public School | Private School |
| 3 to 4 Year Olds | 71 (79.8%) | 18 (20.2%) |
| 5 to 9 Year Old | 569 (87.5%) | 81 (12.5%) |
| 10 to 14 Year Olds | 762 (98.8%) | 9 (1.2%) |
| 15 to 17 Year Olds | 396 (96.1%) | 16 (3.9%) |
| 18 to 19 Year Olds | 24 (100.0%) | 0 (0.0%) |
| 20 to 24 Year Olds | 42 (61.8%) | 26 (38.2%) |
| 25 to 34 Year Olds | 229 (97.9%) | 5 (2.1%) |
| 35 Years and over | 73 (73.0%) | 27 (27.0%) |
| Total | 2,165 (92.2%) | 183 (7.8%) |
Educational Attainment by Field of Study in Millington
Business (366 | 26.4%), science & technology (287 | 20.7%), education (193 | 13.9%), arts & humanities (133 | 9.6%), and engineering (77 | 5.6%) are the most common fields of study among 1,388 individuals in Millington who have obtained a bachelor's degree or higher.
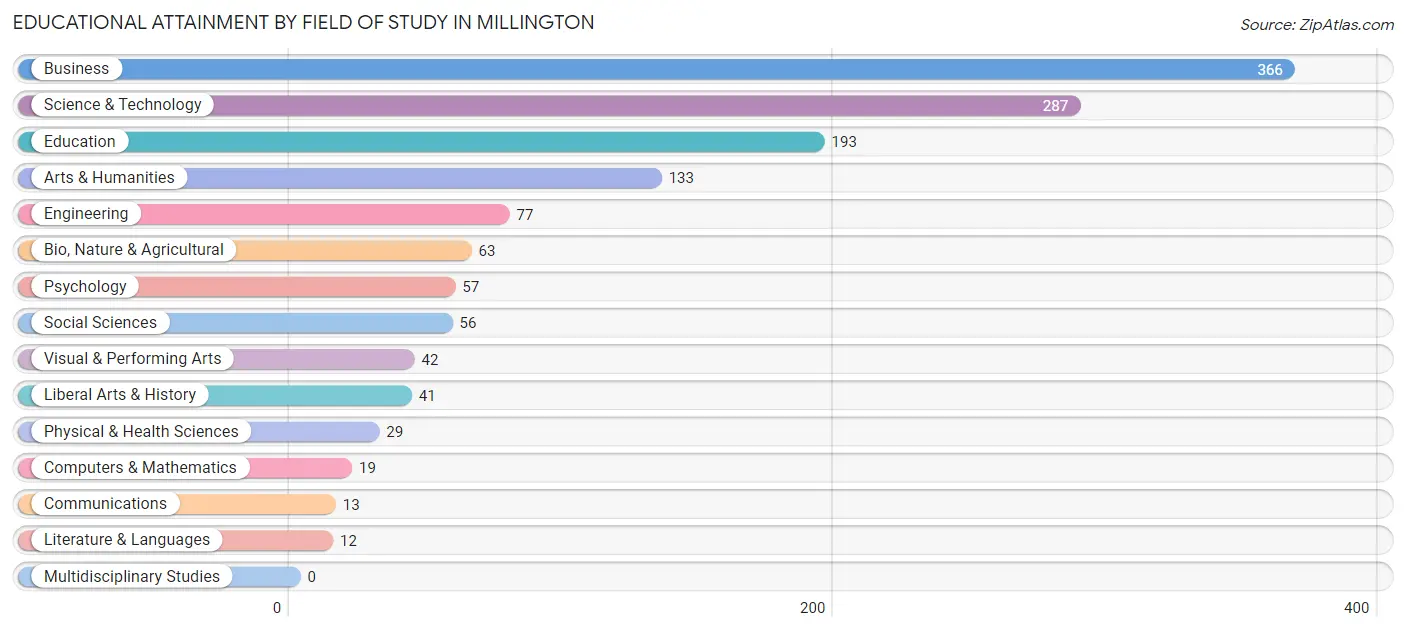
| Field of Study | # Graduates | % Graduates |
| Computers & Mathematics | 19 | 1.4% |
| Bio, Nature & Agricultural | 63 | 4.5% |
| Physical & Health Sciences | 29 | 2.1% |
| Psychology | 57 | 4.1% |
| Social Sciences | 56 | 4.0% |
| Engineering | 77 | 5.6% |
| Multidisciplinary Studies | 0 | 0.0% |
| Science & Technology | 287 | 20.7% |
| Business | 366 | 26.4% |
| Education | 193 | 13.9% |
| Literature & Languages | 12 | 0.9% |
| Liberal Arts & History | 41 | 2.9% |
| Visual & Performing Arts | 42 | 3.0% |
| Communications | 13 | 0.9% |
| Arts & Humanities | 133 | 9.6% |
| Total | 1,388 | 100.0% |
Transportation & Commute in Millington
Vehicle Availability by Sex in Millington
The most prevalent vehicle ownership categories in Millington are males with 2 vehicles (746, accounting for 35.2%) and females with 2 vehicles (814, making up 38.5%).
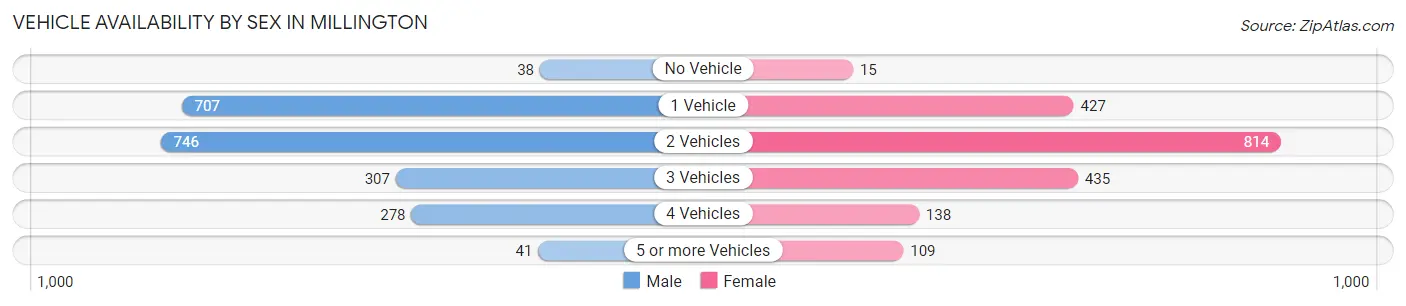
| Vehicles Available | Male | Female |
| No Vehicle | 38 (1.8%) | 15 (0.8%) |
| 1 Vehicle | 707 (33.4%) | 427 (22.0%) |
| 2 Vehicles | 746 (35.2%) | 814 (42.0%) |
| 3 Vehicles | 307 (14.5%) | 435 (22.5%) |
| 4 Vehicles | 278 (13.1%) | 138 (7.1%) |
| 5 or more Vehicles | 41 (1.9%) | 109 (5.6%) |
| Total | 2,117 (100.0%) | 1,938 (100.0%) |
Commute Time in Millington
The most frequently occuring commute durations in Millington are 30 to 34 minutes (840 commuters, 21.6%), less than 5 minutes (527 commuters, 13.5%), and 15 to 19 minutes (475 commuters, 12.2%).
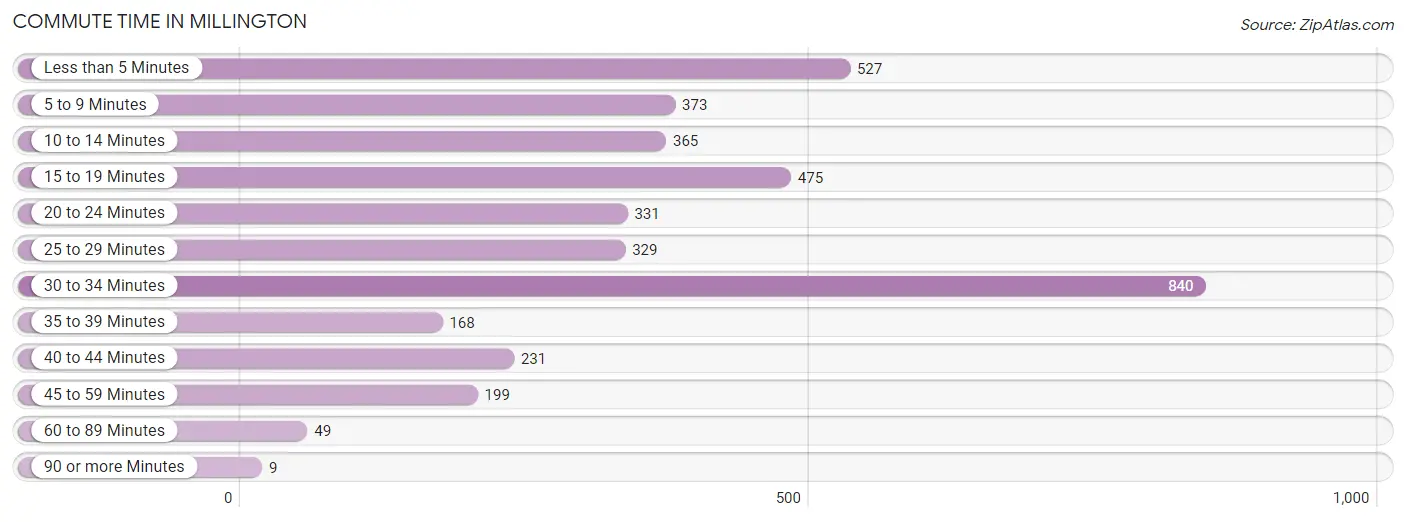
| Commute Time | # Commuters | % Commuters |
| Less than 5 Minutes | 527 | 13.5% |
| 5 to 9 Minutes | 373 | 9.6% |
| 10 to 14 Minutes | 365 | 9.4% |
| 15 to 19 Minutes | 475 | 12.2% |
| 20 to 24 Minutes | 331 | 8.5% |
| 25 to 29 Minutes | 329 | 8.4% |
| 30 to 34 Minutes | 840 | 21.6% |
| 35 to 39 Minutes | 168 | 4.3% |
| 40 to 44 Minutes | 231 | 5.9% |
| 45 to 59 Minutes | 199 | 5.1% |
| 60 to 89 Minutes | 49 | 1.3% |
| 90 or more Minutes | 9 | 0.2% |
Commute Time by Sex in Millington
The most common commute times in Millington are 30 to 34 minutes (419 commuters, 19.5%) for males and 30 to 34 minutes (421 commuters, 24.1%) for females.
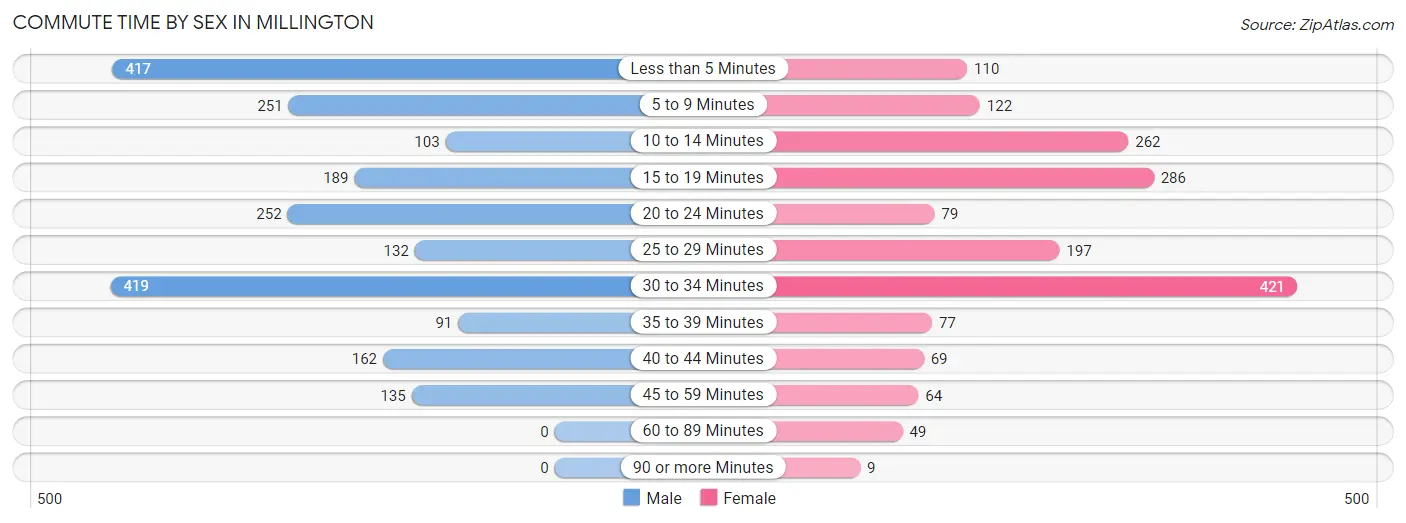
| Commute Time | Male | Female |
| Less than 5 Minutes | 417 (19.4%) | 110 (6.3%) |
| 5 to 9 Minutes | 251 (11.7%) | 122 (7.0%) |
| 10 to 14 Minutes | 103 (4.8%) | 262 (15.0%) |
| 15 to 19 Minutes | 189 (8.8%) | 286 (16.4%) |
| 20 to 24 Minutes | 252 (11.7%) | 79 (4.5%) |
| 25 to 29 Minutes | 132 (6.1%) | 197 (11.3%) |
| 30 to 34 Minutes | 419 (19.5%) | 421 (24.1%) |
| 35 to 39 Minutes | 91 (4.2%) | 77 (4.4%) |
| 40 to 44 Minutes | 162 (7.5%) | 69 (4.0%) |
| 45 to 59 Minutes | 135 (6.3%) | 64 (3.7%) |
| 60 to 89 Minutes | 0 (0.0%) | 49 (2.8%) |
| 90 or more Minutes | 0 (0.0%) | 9 (0.5%) |
Time of Departure to Work by Sex in Millington
The most frequent times of departure to work in Millington are 6:00 AM to 6:29 AM (486, 22.6%) for males and 7:00 AM to 7:29 AM (439, 25.2%) for females.
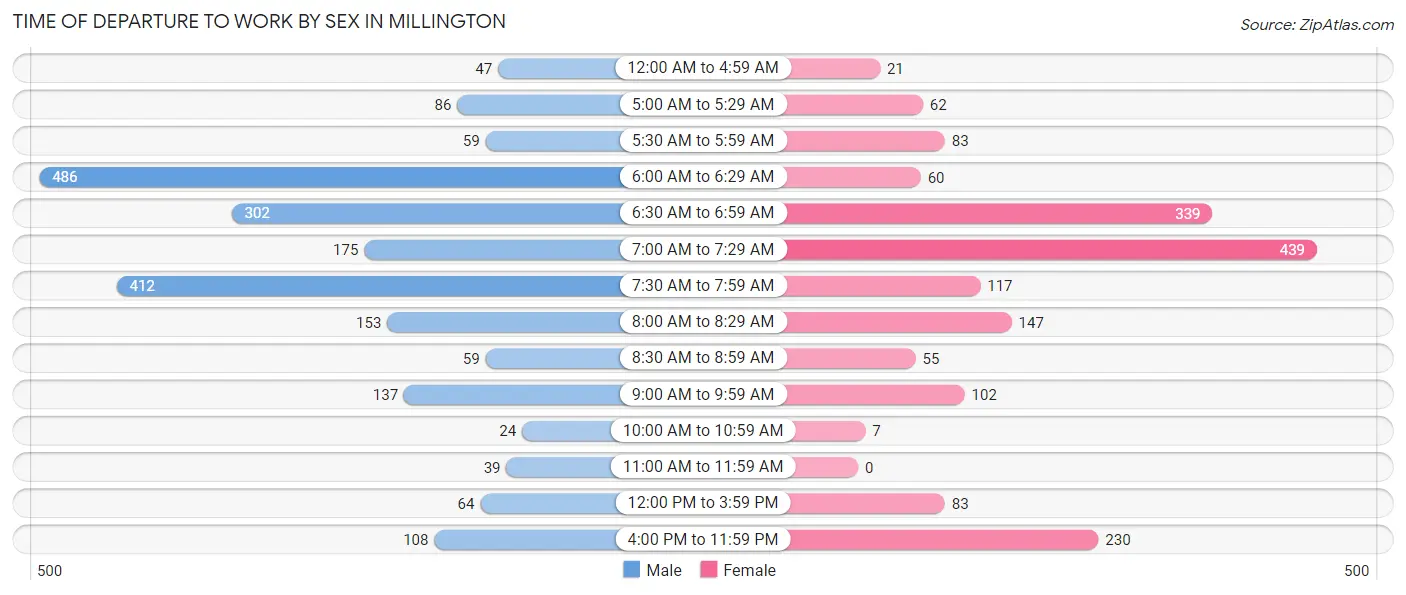
| Time of Departure | Male | Female |
| 12:00 AM to 4:59 AM | 47 (2.2%) | 21 (1.2%) |
| 5:00 AM to 5:29 AM | 86 (4.0%) | 62 (3.5%) |
| 5:30 AM to 5:59 AM | 59 (2.7%) | 83 (4.8%) |
| 6:00 AM to 6:29 AM | 486 (22.6%) | 60 (3.4%) |
| 6:30 AM to 6:59 AM | 302 (14.0%) | 339 (19.4%) |
| 7:00 AM to 7:29 AM | 175 (8.1%) | 439 (25.2%) |
| 7:30 AM to 7:59 AM | 412 (19.2%) | 117 (6.7%) |
| 8:00 AM to 8:29 AM | 153 (7.1%) | 147 (8.4%) |
| 8:30 AM to 8:59 AM | 59 (2.7%) | 55 (3.2%) |
| 9:00 AM to 9:59 AM | 137 (6.4%) | 102 (5.9%) |
| 10:00 AM to 10:59 AM | 24 (1.1%) | 7 (0.4%) |
| 11:00 AM to 11:59 AM | 39 (1.8%) | 0 (0.0%) |
| 12:00 PM to 3:59 PM | 64 (3.0%) | 83 (4.8%) |
| 4:00 PM to 11:59 PM | 108 (5.0%) | 230 (13.2%) |
| Total | 2,151 (100.0%) | 1,745 (100.0%) |
Housing Occupancy in Millington
Occupancy by Ownership in Millington
Of the total 4,194 dwellings in Millington, owner-occupied units account for 2,443 (58.3%), while renter-occupied units make up 1,751 (41.7%).
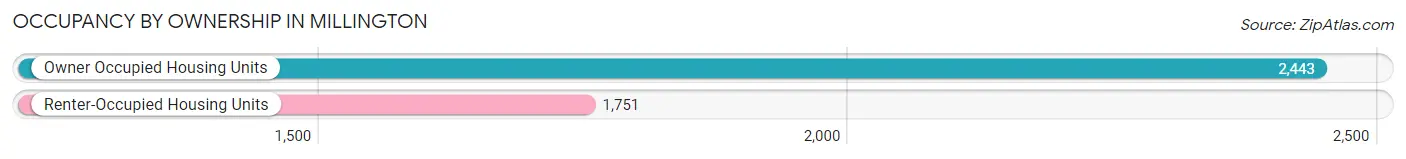
| Occupancy | # Housing Units | % Housing Units |
| Owner Occupied Housing Units | 2,443 | 58.3% |
| Renter-Occupied Housing Units | 1,751 | 41.7% |
| Total Occupied Housing Units | 4,194 | 100.0% |
Occupancy by Household Size in Millington
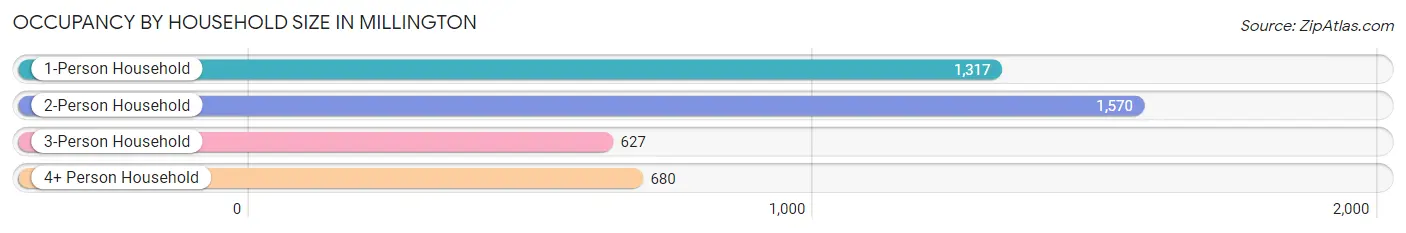
| Household Size | # Housing Units | % Housing Units |
| 1-Person Household | 1,317 | 31.4% |
| 2-Person Household | 1,570 | 37.4% |
| 3-Person Household | 627 | 14.9% |
| 4+ Person Household | 680 | 16.2% |
| Total Housing Units | 4,194 | 100.0% |
Occupancy by Ownership by Household Size in Millington
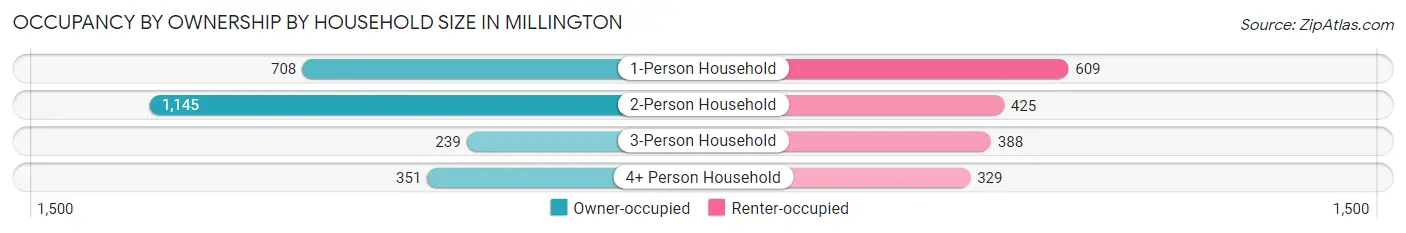
| Household Size | Owner-occupied | Renter-occupied |
| 1-Person Household | 708 (53.8%) | 609 (46.2%) |
| 2-Person Household | 1,145 (72.9%) | 425 (27.1%) |
| 3-Person Household | 239 (38.1%) | 388 (61.9%) |
| 4+ Person Household | 351 (51.6%) | 329 (48.4%) |
| Total Housing Units | 2,443 (58.3%) | 1,751 (41.7%) |
Occupancy by Educational Attainment in Millington
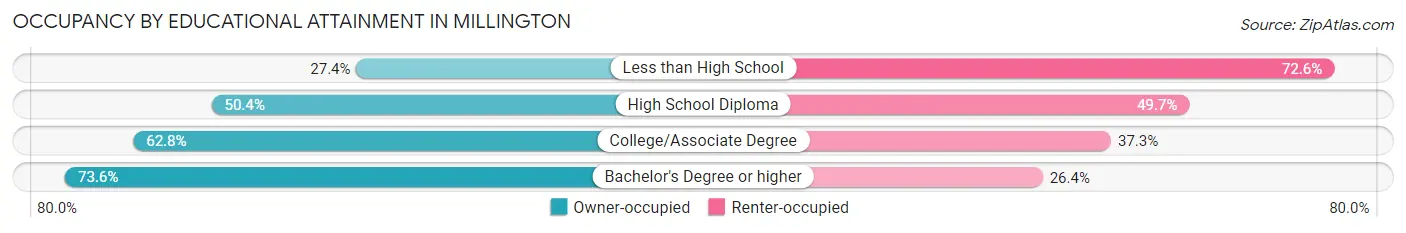
| Household Size | Owner-occupied | Renter-occupied |
| Less than High School | 118 (27.4%) | 313 (72.6%) |
| High School Diploma | 580 (50.3%) | 572 (49.6%) |
| College/Associate Degree | 1,021 (62.7%) | 606 (37.2%) |
| Bachelor's Degree or higher | 724 (73.6%) | 260 (26.4%) |
Occupancy by Age of Householder in Millington
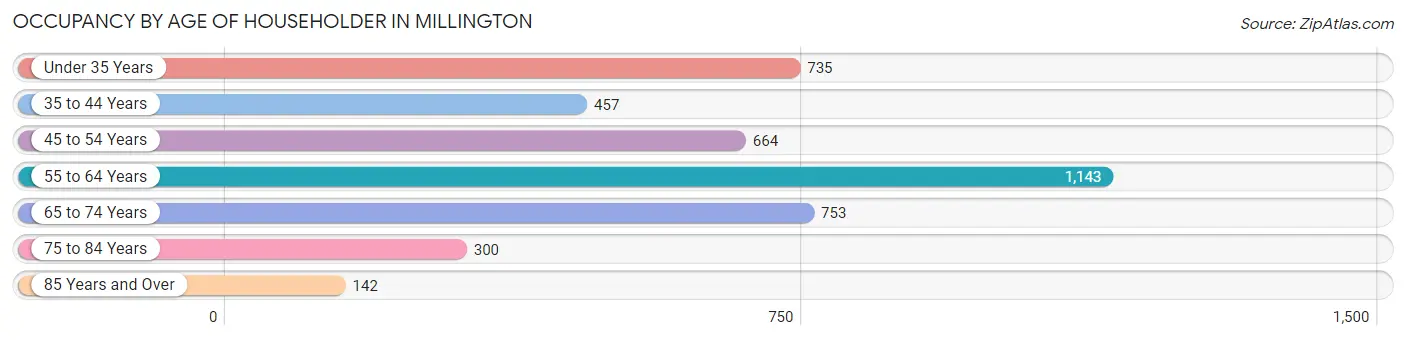
| Age Bracket | # Households | % Households |
| Under 35 Years | 735 | 17.5% |
| 35 to 44 Years | 457 | 10.9% |
| 45 to 54 Years | 664 | 15.8% |
| 55 to 64 Years | 1,143 | 27.3% |
| 65 to 74 Years | 753 | 17.9% |
| 75 to 84 Years | 300 | 7.1% |
| 85 Years and Over | 142 | 3.4% |
| Total | 4,194 | 100.0% |
Housing Finances in Millington
Median Income by Occupancy in Millington
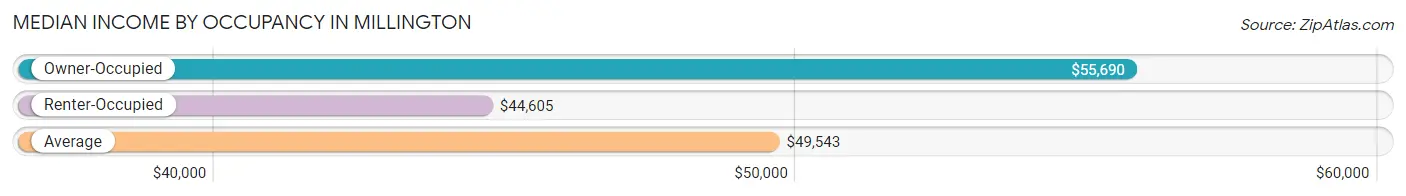
| Occupancy Type | # Households | Median Income |
| Owner-Occupied | 2,443 (58.3%) | $55,690 |
| Renter-Occupied | 1,751 (41.7%) | $44,605 |
| Average | 4,194 (100.0%) | $49,543 |
Occupancy by Householder Income Bracket in Millington
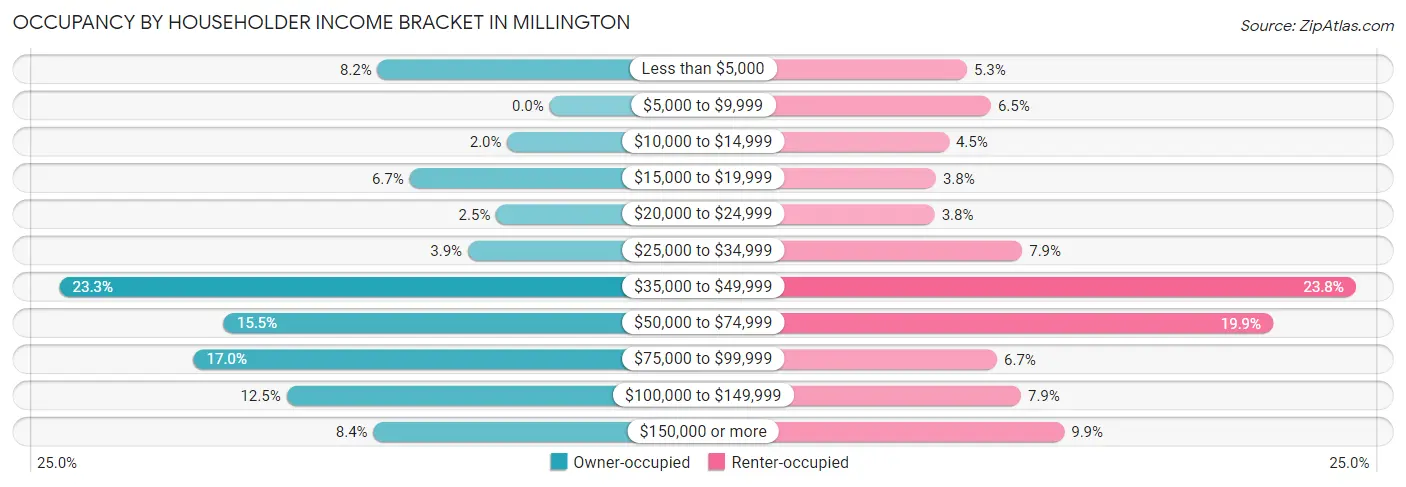
| Income Bracket | Owner-occupied | Renter-occupied |
| Less than $5,000 | 200 (8.2%) | 93 (5.3%) |
| $5,000 to $9,999 | 0 (0.0%) | 113 (6.5%) |
| $10,000 to $14,999 | 49 (2.0%) | 78 (4.4%) |
| $15,000 to $19,999 | 163 (6.7%) | 67 (3.8%) |
| $20,000 to $24,999 | 62 (2.5%) | 66 (3.8%) |
| $25,000 to $34,999 | 95 (3.9%) | 139 (7.9%) |
| $35,000 to $49,999 | 570 (23.3%) | 417 (23.8%) |
| $50,000 to $74,999 | 379 (15.5%) | 348 (19.9%) |
| $75,000 to $99,999 | 414 (17.0%) | 118 (6.7%) |
| $100,000 to $149,999 | 306 (12.5%) | 138 (7.9%) |
| $150,000 or more | 205 (8.4%) | 174 (9.9%) |
| Total | 2,443 (100.0%) | 1,751 (100.0%) |
Monthly Housing Cost Tiers in Millington
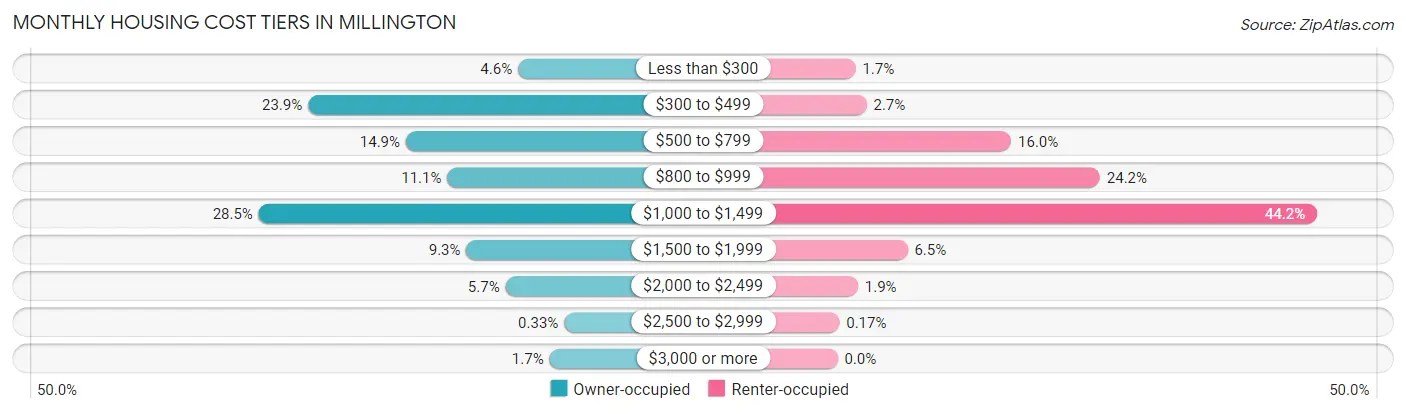
| Monthly Cost | Owner-occupied | Renter-occupied |
| Less than $300 | 112 (4.6%) | 29 (1.7%) |
| $300 to $499 | 584 (23.9%) | 47 (2.7%) |
| $500 to $799 | 364 (14.9%) | 280 (16.0%) |
| $800 to $999 | 271 (11.1%) | 423 (24.2%) |
| $1,000 to $1,499 | 695 (28.4%) | 773 (44.2%) |
| $1,500 to $1,999 | 228 (9.3%) | 113 (6.5%) |
| $2,000 to $2,499 | 140 (5.7%) | 33 (1.9%) |
| $2,500 to $2,999 | 8 (0.3%) | 3 (0.2%) |
| $3,000 or more | 41 (1.7%) | 0 (0.0%) |
| Total | 2,443 (100.0%) | 1,751 (100.0%) |
Physical Housing Characteristics in Millington
Housing Structures in Millington
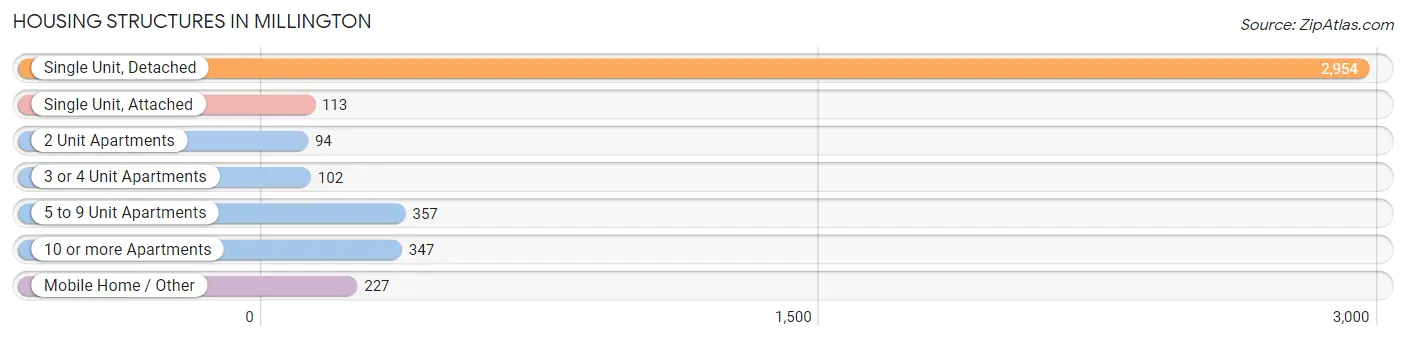
| Structure Type | # Housing Units | % Housing Units |
| Single Unit, Detached | 2,954 | 70.4% |
| Single Unit, Attached | 113 | 2.7% |
| 2 Unit Apartments | 94 | 2.2% |
| 3 or 4 Unit Apartments | 102 | 2.4% |
| 5 to 9 Unit Apartments | 357 | 8.5% |
| 10 or more Apartments | 347 | 8.3% |
| Mobile Home / Other | 227 | 5.4% |
| Total | 4,194 | 100.0% |
Housing Structures by Occupancy in Millington
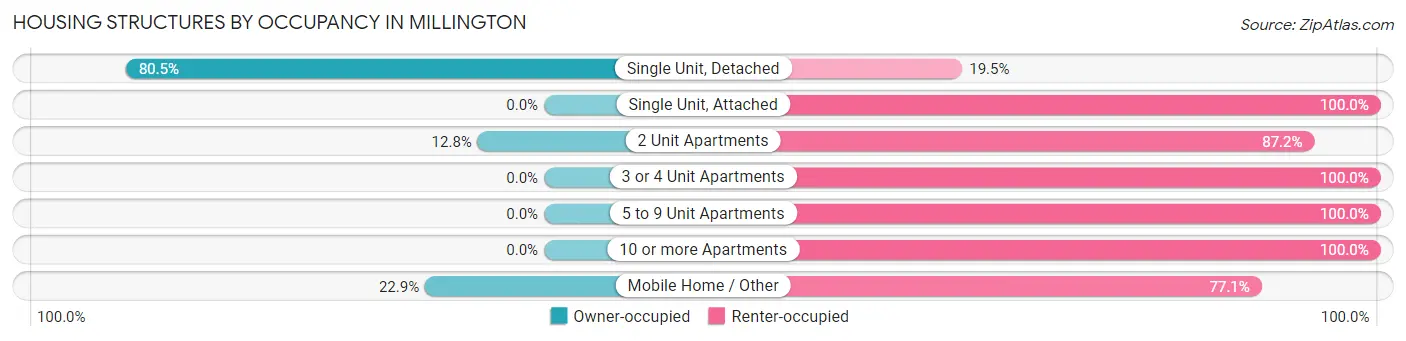
| Structure Type | Owner-occupied | Renter-occupied |
| Single Unit, Detached | 2,379 (80.5%) | 575 (19.5%) |
| Single Unit, Attached | 0 (0.0%) | 113 (100.0%) |
| 2 Unit Apartments | 12 (12.8%) | 82 (87.2%) |
| 3 or 4 Unit Apartments | 0 (0.0%) | 102 (100.0%) |
| 5 to 9 Unit Apartments | 0 (0.0%) | 357 (100.0%) |
| 10 or more Apartments | 0 (0.0%) | 347 (100.0%) |
| Mobile Home / Other | 52 (22.9%) | 175 (77.1%) |
| Total | 2,443 (58.3%) | 1,751 (41.7%) |
Housing Structures by Number of Rooms in Millington
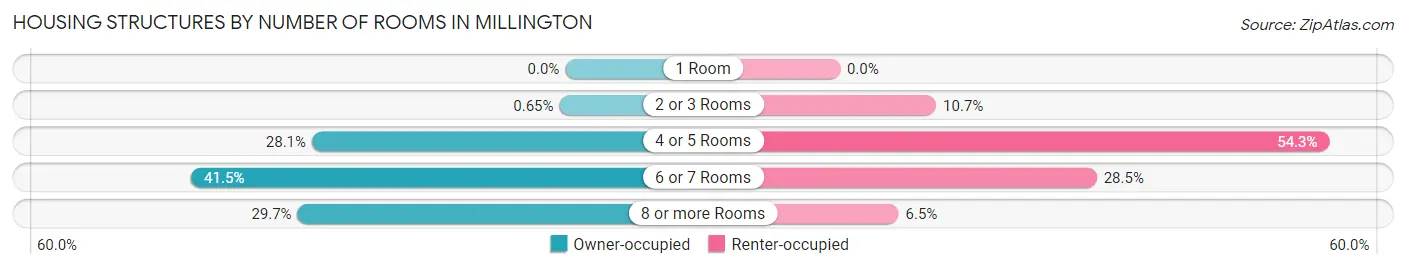
| Number of Rooms | Owner-occupied | Renter-occupied |
| 1 Room | 0 (0.0%) | 0 (0.0%) |
| 2 or 3 Rooms | 16 (0.6%) | 187 (10.7%) |
| 4 or 5 Rooms | 687 (28.1%) | 951 (54.3%) |
| 6 or 7 Rooms | 1,014 (41.5%) | 499 (28.5%) |
| 8 or more Rooms | 726 (29.7%) | 114 (6.5%) |
| Total | 2,443 (100.0%) | 1,751 (100.0%) |
Housing Structure by Heating Type in Millington
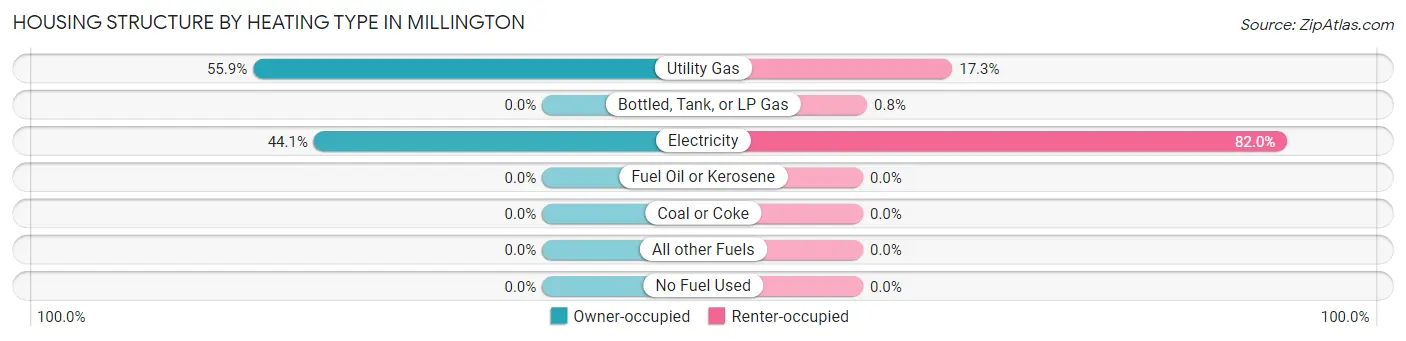
| Heating Type | Owner-occupied | Renter-occupied |
| Utility Gas | 1,365 (55.9%) | 302 (17.2%) |
| Bottled, Tank, or LP Gas | 0 (0.0%) | 14 (0.8%) |
| Electricity | 1,078 (44.1%) | 1,435 (82.0%) |
| Fuel Oil or Kerosene | 0 (0.0%) | 0 (0.0%) |
| Coal or Coke | 0 (0.0%) | 0 (0.0%) |
| All other Fuels | 0 (0.0%) | 0 (0.0%) |
| No Fuel Used | 0 (0.0%) | 0 (0.0%) |
| Total | 2,443 (100.0%) | 1,751 (100.0%) |
Household Vehicle Usage in Millington
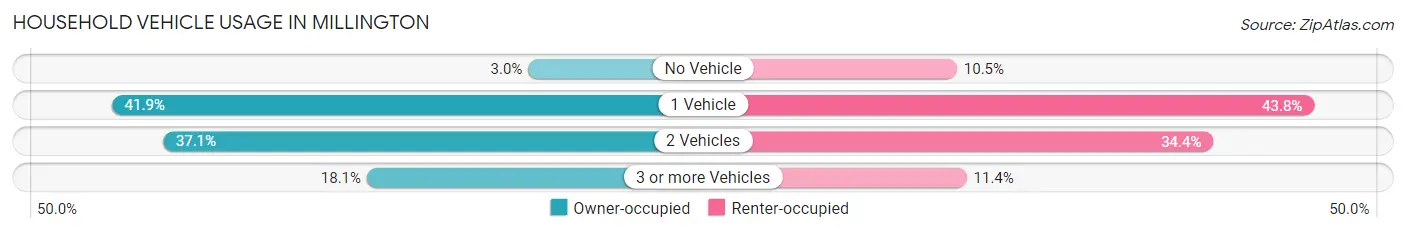
| Vehicles per Household | Owner-occupied | Renter-occupied |
| No Vehicle | 73 (3.0%) | 183 (10.4%) |
| 1 Vehicle | 1,023 (41.9%) | 767 (43.8%) |
| 2 Vehicles | 906 (37.1%) | 602 (34.4%) |
| 3 or more Vehicles | 441 (18.0%) | 199 (11.4%) |
| Total | 2,443 (100.0%) | 1,751 (100.0%) |
Real Estate & Mortgages in Millington
Real Estate and Mortgage Overview in Millington
| Characteristic | Without Mortgage | With Mortgage |
| Housing Units | 1,255 | 1,188 |
| Median Property Value | $142,700 | $178,300 |
| Median Household Income | $43,940 | $174 |
| Monthly Housing Costs | $466 | $41 |
| Real Estate Taxes | $1,447 | $32 |
Property Value by Mortgage Status in Millington
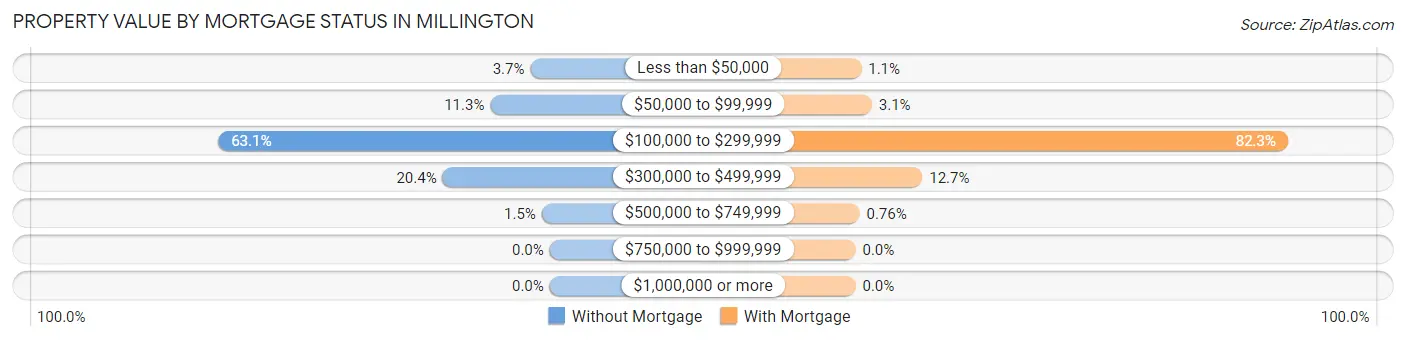
| Property Value | Without Mortgage | With Mortgage |
| Less than $50,000 | 46 (3.7%) | 13 (1.1%) |
| $50,000 to $99,999 | 142 (11.3%) | 37 (3.1%) |
| $100,000 to $299,999 | 792 (63.1%) | 978 (82.3%) |
| $300,000 to $499,999 | 256 (20.4%) | 151 (12.7%) |
| $500,000 to $749,999 | 19 (1.5%) | 9 (0.8%) |
| $750,000 to $999,999 | 0 (0.0%) | 0 (0.0%) |
| $1,000,000 or more | 0 (0.0%) | 0 (0.0%) |
| Total | 1,255 (100.0%) | 1,188 (100.0%) |
Household Income by Mortgage Status in Millington
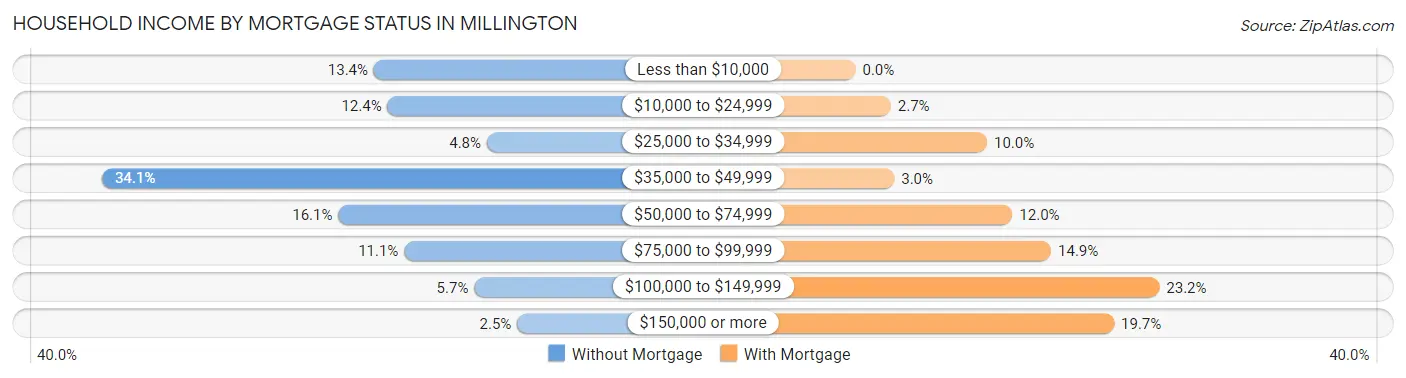
| Household Income | Without Mortgage | With Mortgage |
| Less than $10,000 | 168 (13.4%) | 0 (0.0%) |
| $10,000 to $24,999 | 155 (12.3%) | 32 (2.7%) |
| $25,000 to $34,999 | 60 (4.8%) | 119 (10.0%) |
| $35,000 to $49,999 | 428 (34.1%) | 35 (2.9%) |
| $50,000 to $74,999 | 202 (16.1%) | 142 (11.9%) |
| $75,000 to $99,999 | 139 (11.1%) | 177 (14.9%) |
| $100,000 to $149,999 | 72 (5.7%) | 275 (23.2%) |
| $150,000 or more | 31 (2.5%) | 234 (19.7%) |
| Total | 1,255 (100.0%) | 1,188 (100.0%) |
Property Value to Household Income Ratio in Millington
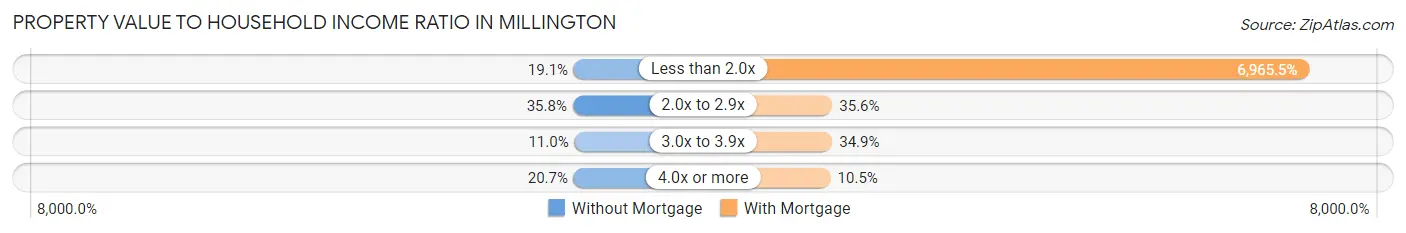
| Value-to-Income Ratio | Without Mortgage | With Mortgage |
| Less than 2.0x | 240 (19.1%) | 82,750 (6,965.5%) |
| 2.0x to 2.9x | 449 (35.8%) | 423 (35.6%) |
| 3.0x to 3.9x | 138 (11.0%) | 414 (34.8%) |
| 4.0x or more | 260 (20.7%) | 125 (10.5%) |
| Total | 1,255 (100.0%) | 1,188 (100.0%) |
Real Estate Taxes by Mortgage Status in Millington
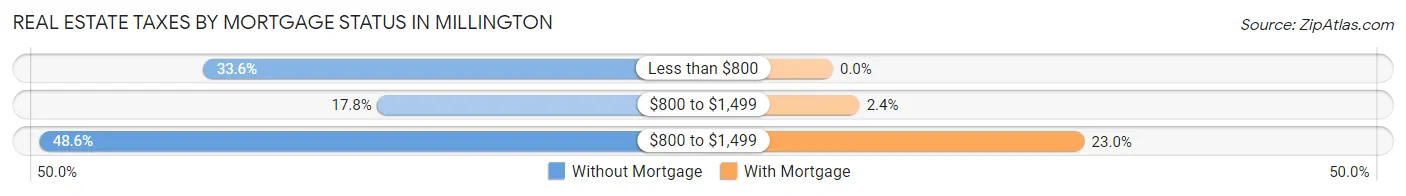
| Property Taxes | Without Mortgage | With Mortgage |
| Less than $800 | 422 (33.6%) | 0 (0.0%) |
| $800 to $1,499 | 223 (17.8%) | 29 (2.4%) |
| $800 to $1,499 | 610 (48.6%) | 273 (23.0%) |
| Total | 1,255 (100.0%) | 1,188 (100.0%) |
Health & Disability in Millington
Health Insurance Coverage by Age in Millington
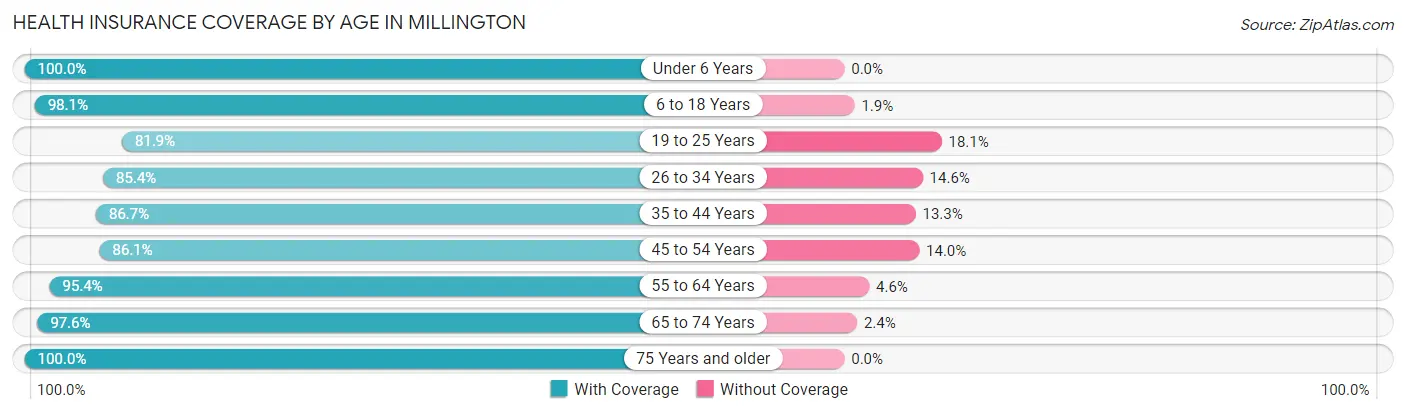
| Age Bracket | With Coverage | Without Coverage |
| Under 6 Years | 643 (100.0%) | 0 (0.0%) |
| 6 to 18 Years | 2,118 (98.1%) | 41 (1.9%) |
| 19 to 25 Years | 510 (81.9%) | 113 (18.1%) |
| 26 to 34 Years | 906 (85.4%) | 155 (14.6%) |
| 35 to 44 Years | 836 (86.7%) | 128 (13.3%) |
| 45 to 54 Years | 1,184 (86.1%) | 192 (14.0%) |
| 55 to 64 Years | 1,502 (95.4%) | 73 (4.6%) |
| 65 to 74 Years | 952 (97.6%) | 23 (2.4%) |
| 75 Years and older | 751 (100.0%) | 0 (0.0%) |
| Total | 9,402 (92.8%) | 725 (7.2%) |
Health Insurance Coverage by Citizenship Status in Millington
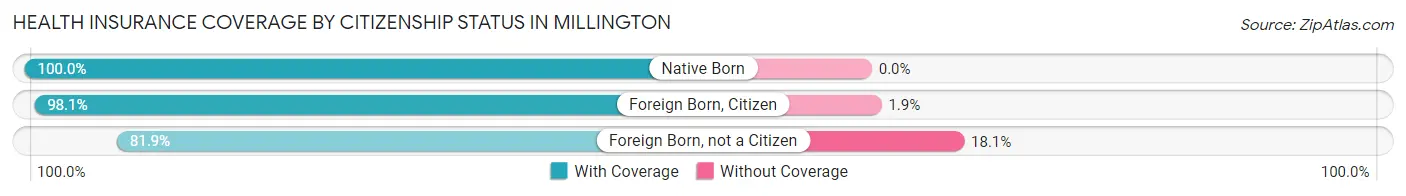
| Citizenship Status | With Coverage | Without Coverage |
| Native Born | 643 (100.0%) | 0 (0.0%) |
| Foreign Born, Citizen | 2,118 (98.1%) | 41 (1.9%) |
| Foreign Born, not a Citizen | 510 (81.9%) | 113 (18.1%) |
Health Insurance Coverage by Household Income in Millington
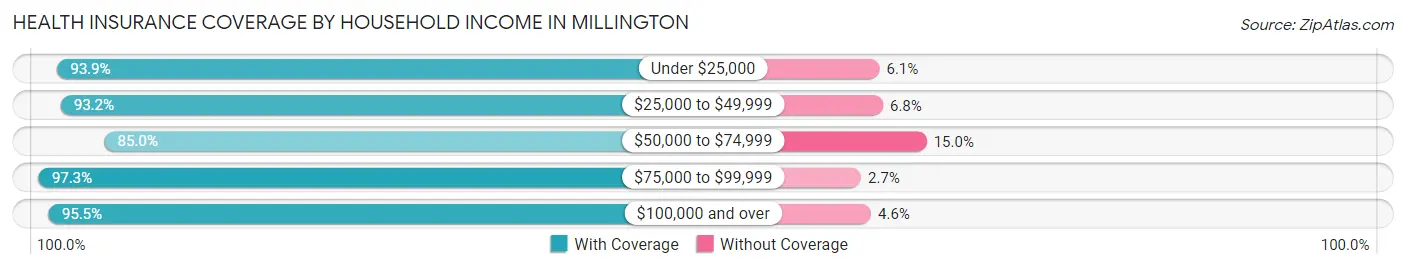
| Household Income | With Coverage | Without Coverage |
| Under $25,000 | 1,225 (93.9%) | 80 (6.1%) |
| $25,000 to $49,999 | 2,579 (93.2%) | 188 (6.8%) |
| $50,000 to $74,999 | 1,663 (85.0%) | 293 (15.0%) |
| $75,000 to $99,999 | 1,163 (97.3%) | 32 (2.7%) |
| $100,000 and over | 2,772 (95.5%) | 132 (4.5%) |
Public vs Private Health Insurance Coverage by Age in Millington
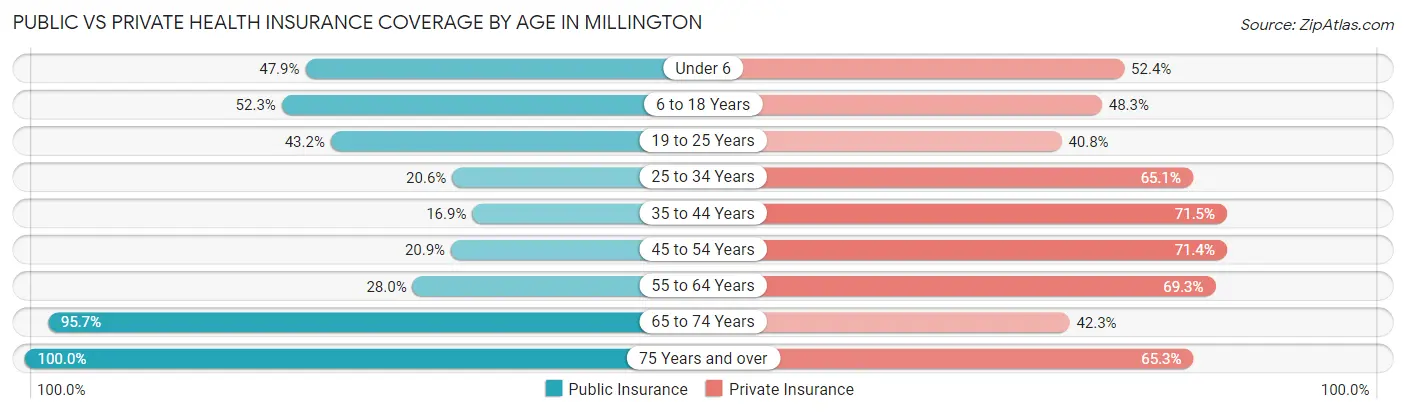
| Age Bracket | Public Insurance | Private Insurance |
| Under 6 | 308 (47.9%) | 337 (52.4%) |
| 6 to 18 Years | 1,129 (52.3%) | 1,042 (48.3%) |
| 19 to 25 Years | 269 (43.2%) | 254 (40.8%) |
| 25 to 34 Years | 219 (20.6%) | 691 (65.1%) |
| 35 to 44 Years | 163 (16.9%) | 689 (71.5%) |
| 45 to 54 Years | 287 (20.9%) | 983 (71.4%) |
| 55 to 64 Years | 441 (28.0%) | 1,092 (69.3%) |
| 65 to 74 Years | 933 (95.7%) | 412 (42.3%) |
| 75 Years and over | 751 (100.0%) | 490 (65.2%) |
| Total | 4,500 (44.4%) | 5,990 (59.2%) |
Disability Status by Sex by Age in Millington
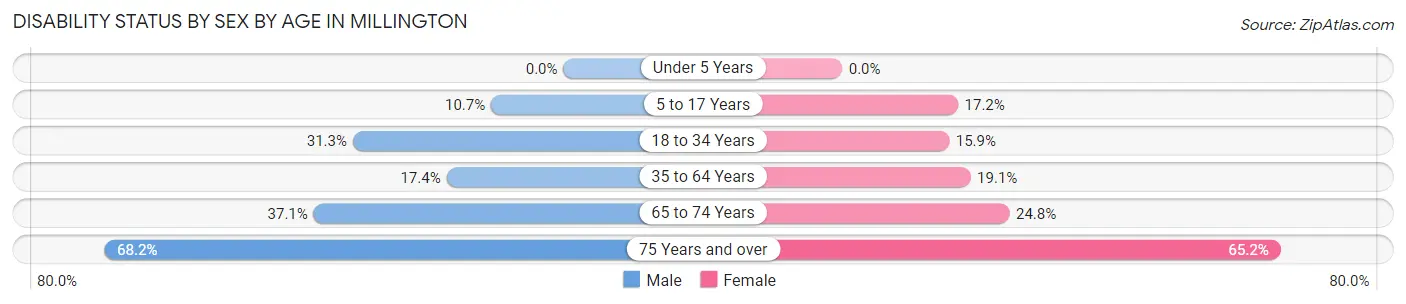
| Age Bracket | Male | Female |
| Under 5 Years | 0 (0.0%) | 0 (0.0%) |
| 5 to 17 Years | 135 (10.7%) | 140 (17.2%) |
| 18 to 34 Years | 262 (31.3%) | 156 (15.9%) |
| 35 to 64 Years | 306 (17.3%) | 410 (19.1%) |
| 65 to 74 Years | 142 (37.1%) | 147 (24.8%) |
| 75 Years and over | 150 (68.2%) | 346 (65.2%) |
Disability Class by Sex by Age in Millington
Disability Class: Hearing Difficulty
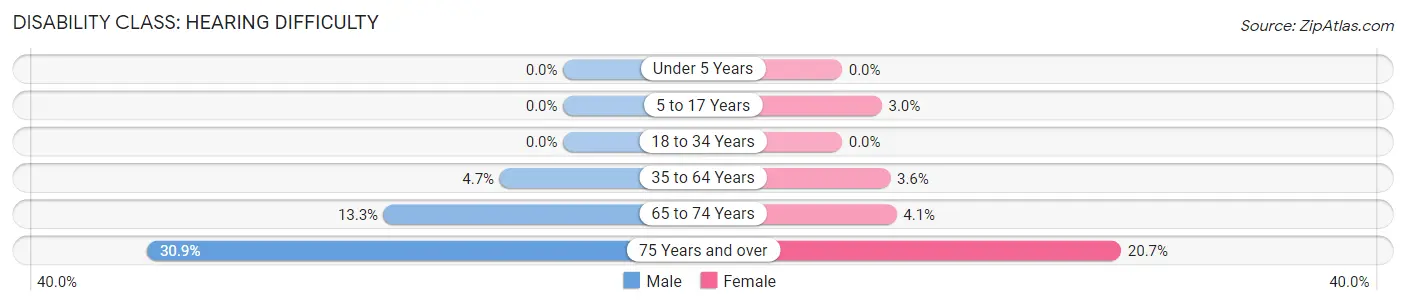
| Age Bracket | Male | Female |
| Under 5 Years | 0 (0.0%) | 0 (0.0%) |
| 5 to 17 Years | 0 (0.0%) | 24 (2.9%) |
| 18 to 34 Years | 0 (0.0%) | 0 (0.0%) |
| 35 to 64 Years | 83 (4.7%) | 77 (3.6%) |
| 65 to 74 Years | 51 (13.3%) | 24 (4.1%) |
| 75 Years and over | 68 (30.9%) | 110 (20.7%) |
Disability Class: Vision Difficulty
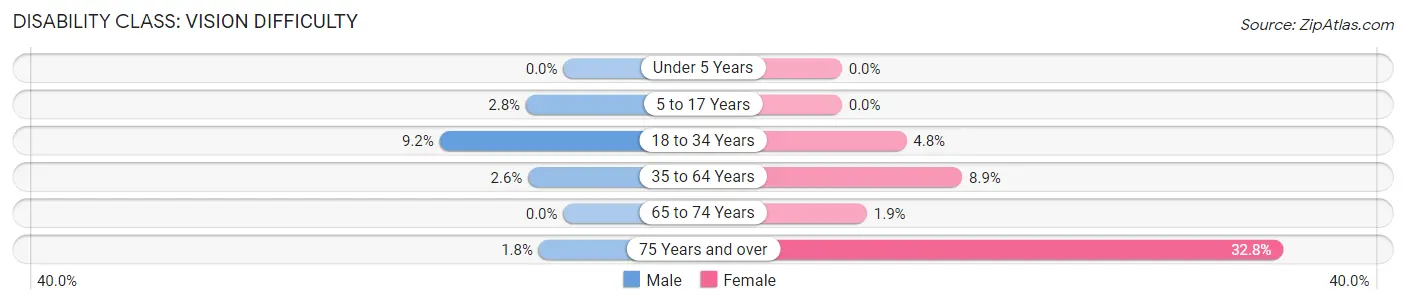
| Age Bracket | Male | Female |
| Under 5 Years | 0 (0.0%) | 0 (0.0%) |
| 5 to 17 Years | 35 (2.8%) | 0 (0.0%) |
| 18 to 34 Years | 77 (9.2%) | 47 (4.8%) |
| 35 to 64 Years | 46 (2.6%) | 192 (8.9%) |
| 65 to 74 Years | 0 (0.0%) | 11 (1.9%) |
| 75 Years and over | 4 (1.8%) | 174 (32.8%) |
Disability Class: Cognitive Difficulty
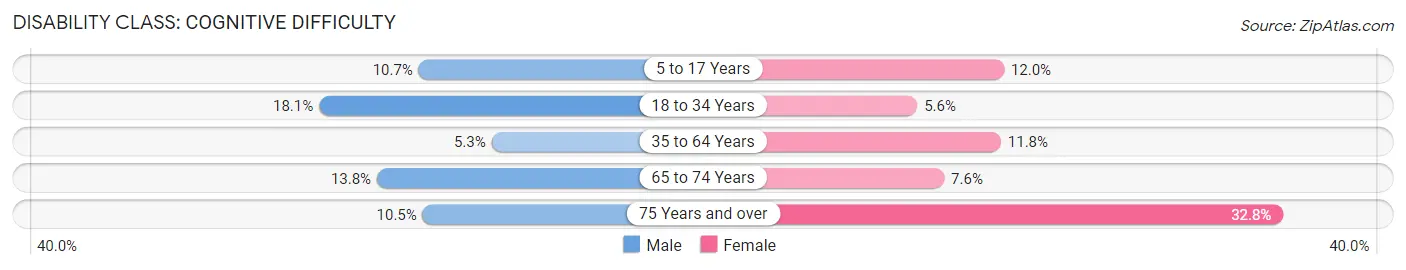
| Age Bracket | Male | Female |
| 5 to 17 Years | 135 (10.7%) | 98 (12.0%) |
| 18 to 34 Years | 152 (18.1%) | 55 (5.6%) |
| 35 to 64 Years | 94 (5.3%) | 254 (11.8%) |
| 65 to 74 Years | 53 (13.8%) | 45 (7.6%) |
| 75 Years and over | 23 (10.4%) | 174 (32.8%) |
Disability Class: Ambulatory Difficulty
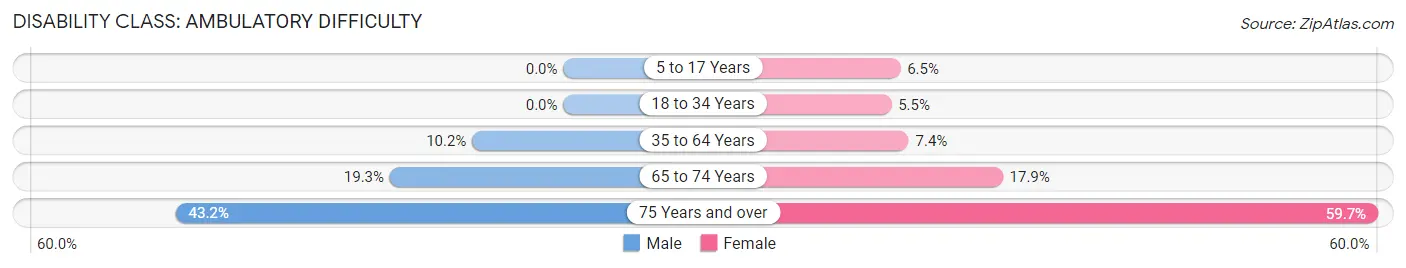
| Age Bracket | Male | Female |
| 5 to 17 Years | 0 (0.0%) | 53 (6.5%) |
| 18 to 34 Years | 0 (0.0%) | 54 (5.5%) |
| 35 to 64 Years | 179 (10.2%) | 160 (7.4%) |
| 65 to 74 Years | 74 (19.3%) | 106 (17.9%) |
| 75 Years and over | 95 (43.2%) | 317 (59.7%) |
Disability Class: Self-Care Difficulty
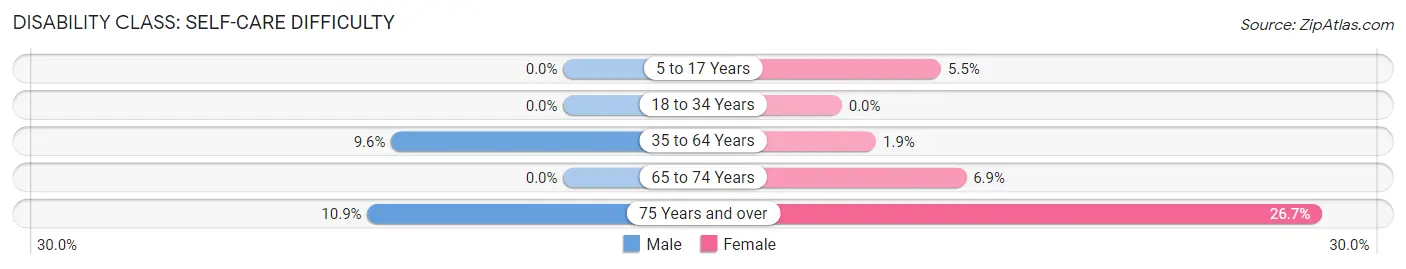
| Age Bracket | Male | Female |
| 5 to 17 Years | 0 (0.0%) | 45 (5.5%) |
| 18 to 34 Years | 0 (0.0%) | 0 (0.0%) |
| 35 to 64 Years | 169 (9.6%) | 41 (1.9%) |
| 65 to 74 Years | 0 (0.0%) | 41 (6.9%) |
| 75 Years and over | 24 (10.9%) | 142 (26.7%) |
Technology Access in Millington
Computing Device Access in Millington
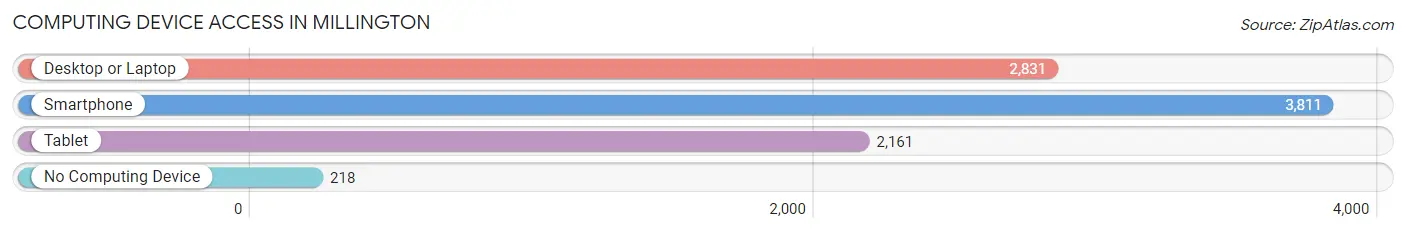
| Device Type | # Households | % Households |
| Desktop or Laptop | 2,831 | 67.5% |
| Smartphone | 3,811 | 90.9% |
| Tablet | 2,161 | 51.5% |
| No Computing Device | 218 | 5.2% |
| Total | 4,194 | 100.0% |
Internet Access in Millington
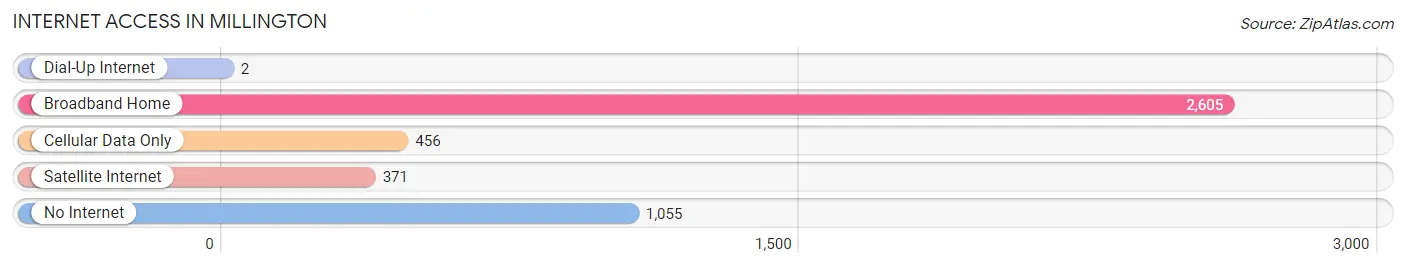
| Internet Type | # Households | % Households |
| Dial-Up Internet | 2 | 0.1% |
| Broadband Home | 2,605 | 62.1% |
| Cellular Data Only | 456 | 10.9% |
| Satellite Internet | 371 | 8.8% |
| No Internet | 1,055 | 25.2% |
| Total | 4,194 | 100.0% |
Millington Summary
Millington is a city located in Shelby County, Tennessee, United States. It is located in the northwest corner of the county, about 9 miles north of Memphis. The population was 10,176 at the 2010 census.
History
Millington was founded in 1878 by Captain John Millington, a Civil War veteran who had served in the Confederate Army. He purchased land in the area and established a small farming community. The town was incorporated in 1887 and named after its founder.
In the early 20th century, Millington was a popular destination for tourists, who came to enjoy the area's natural beauty and outdoor activities. The town was also home to a number of resorts and hotels, including the Millington Hotel, which was built in 1910.
In 1942, the U.S. Navy established a base in Millington, which is now known as the Naval Support Activity Mid-South. The base is home to the Navy's Human Resources Command, the Navy Recruiting Command, and the Navy Personnel Command.
Geography
Millington is located at 35°20'25" North, 89°51'17" West (35.340278, -89.854722). According to the United States Census Bureau, the city has a total area of 10.2 square miles, of which 10.1 square miles is land and 0.1 square miles is water.
Economy
Millington's economy is largely based on the Naval Support Activity Mid-South, which is the largest employer in the city. Other major employers include the Millington Municipal School District, the City of Millington, and the Millington Regional Medical Center.
The city also has a number of small businesses, including restaurants, retail stores, and service providers.
Demographics
As of the 2010 census, there were 10,176 people, 3,845 households, and 2,717 families residing in the city. The population density was 1,006.2 people per square mile. The racial makeup of the city was 68.2% White, 25.2% African American, 0.4% Native American, 1.2% Asian, 0.1% Pacific Islander, 2.7% from other races, and 2.2% from two or more races. Hispanic or Latino of any race were 5.3% of the population.
The median income for a household in the city was $41,945, and the median income for a family was $50,945. Males had a median income of $37,945 versus $27,945 for females. The per capita income for the city was $20,945. About 10.2% of families and 12.2% of the population were below the poverty line, including 17.2% of those under age 18 and 8.2% of those age 65 or over.
Common Questions
What is Per Capita Income in Millington?
Per Capita income in Millington is $29,746.
What is the Median Family Income in Millington?
Median Family Income in Millington is $54,661.
What is the Median Household income in Millington?
Median Household Income in Millington is $49,543.
What is Income or Wage Gap in Millington?
Income or Wage Gap in Millington is 10.2%.
Women in Millington earn 89.8 cents for every dollar earned by a man.
What is Inequality or Gini Index in Millington?
Inequality or Gini Index in Millington is 0.46.
What is the Total Population of Millington?
Total Population of Millington is 10,558.
What is the Total Male Population of Millington?
Total Male Population of Millington is 5,004.
What is the Total Female Population of Millington?
Total Female Population of Millington is 5,554.
What is the Ratio of Males per 100 Females in Millington?
There are 90.10 Males per 100 Females in Millington.
What is the Ratio of Females per 100 Males in Millington?
There are 110.99 Females per 100 Males in Millington.
What is the Median Population Age in Millington?
Median Population Age in Millington is 38.9 Years.
What is the Average Family Size in Millington
Average Family Size in Millington is 3.1 People.
What is the Average Household Size in Millington
Average Household Size in Millington is 2.5 People.
How Large is the Labor Force in Millington?
There are 4,636 People in the Labor Forcein in Millington.
What is the Percentage of People in the Labor Force in Millington?
56.6% of People are in the Labor Force in Millington.
What is the Unemployment Rate in Millington?
Unemployment Rate in Millington is 8.1%.