Newport, TN Map & Demographics
Newport Map
Newport Overview
$20,300
PER CAPITA INCOME
$48,391
AVG FAMILY INCOME
$35,784
AVG HOUSEHOLD INCOME
45.9%
WAGE / INCOME GAP [ % ]
54.1¢/ $1
WAGE / INCOME GAP [ $ ]
0.44
INEQUALITY / GINI INDEX
6,850
TOTAL POPULATION
2,997
MALE POPULATION
3,853
FEMALE POPULATION
77.78
MALES / 100 FEMALES
128.56
FEMALES / 100 MALES
40.0
MEDIAN AGE
3.0
AVG FAMILY SIZE
2.3
AVG HOUSEHOLD SIZE
2,815
LABOR FORCE [ PEOPLE ]
51.3%
PERCENT IN LABOR FORCE
6.1%
UNEMPLOYMENT RATE
Newport Zip Codes
Income in Newport
Income Overview in Newport
Per Capita Income in Newport is $20,300, while median incomes of families and households are $48,391 and $35,784 respectively.
| Characteristic | Number | Measure |
| Per Capita Income | 6,850 | $20,300 |
| Median Family Income | 1,765 | $48,391 |
| Mean Family Income | 1,765 | $53,638 |
| Median Household Income | 2,862 | $35,784 |
| Mean Household Income | 2,862 | $46,124 |
| Income Deficit | 1,765 | $0 |
| Wage / Income Gap (%) | 6,850 | 45.92% |
| Wage / Income Gap ($) | 6,850 | 54.08¢ per $1 |
| Gini / Inequality Index | 6,850 | 0.44 |
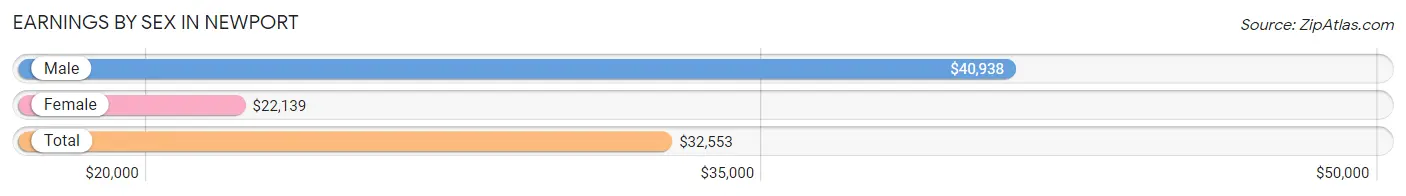
Earnings by Sex in Newport
Average Earnings in Newport are $32,553, $40,938 for men and $22,139 for women, a difference of 45.9%.
| Sex | Number | Average Earnings |
| Male | 1,297 (44.5%) | $40,938 |
| Female | 1,621 (55.5%) | $22,139 |
| Total | 2,918 (100.0%) | $32,553 |
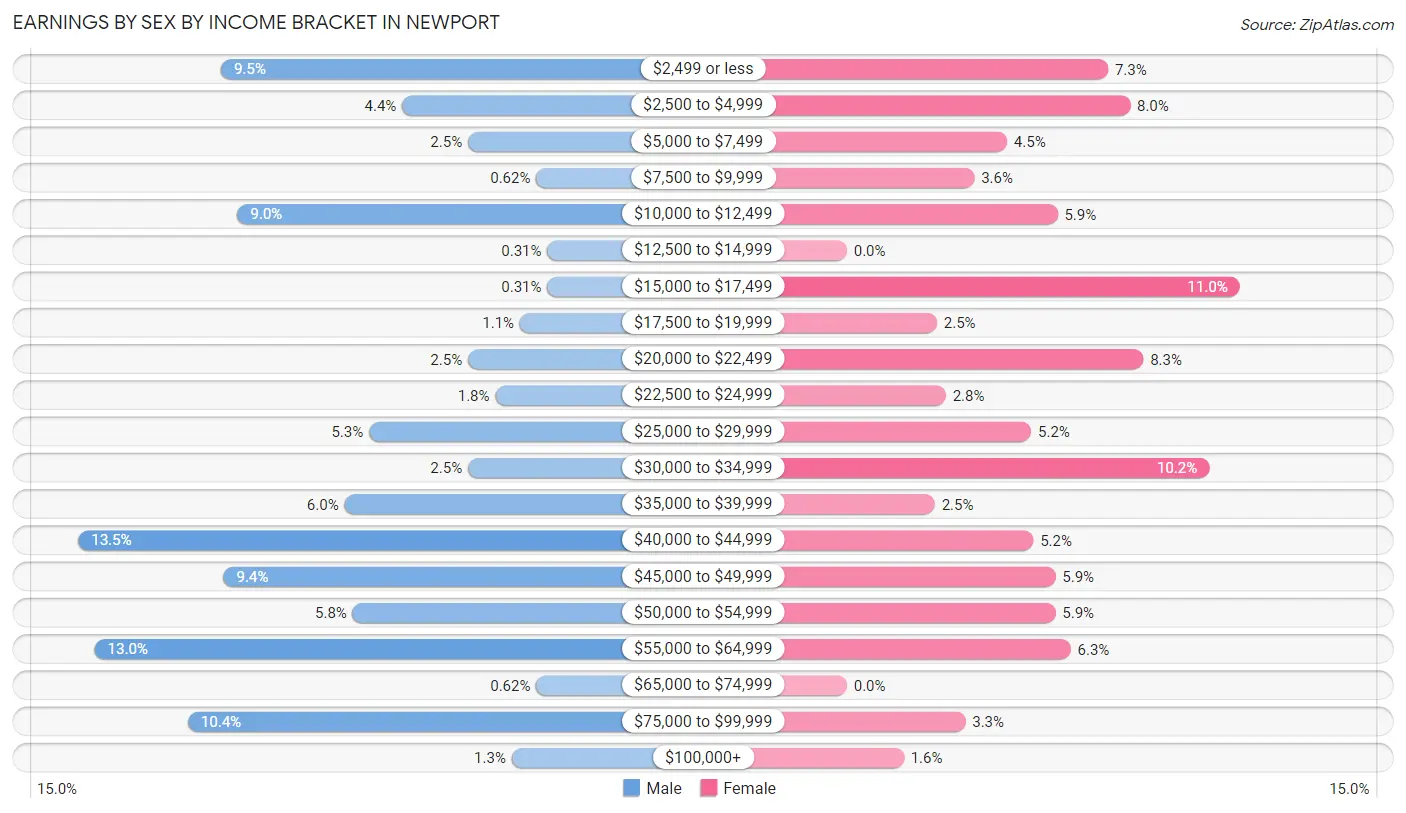
Earnings by Sex by Income Bracket in Newport
The most common earnings brackets in Newport are $40,000 to $44,999 for men (175 | 13.5%) and $15,000 to $17,499 for women (179 | 11.0%).
| Income | Male | Female |
| $2,499 or less | 123 (9.5%) | 119 (7.3%) |
| $2,500 to $4,999 | 57 (4.4%) | 129 (8.0%) |
| $5,000 to $7,499 | 33 (2.5%) | 73 (4.5%) |
| $7,500 to $9,999 | 8 (0.6%) | 58 (3.6%) |
| $10,000 to $12,499 | 117 (9.0%) | 96 (5.9%) |
| $12,500 to $14,999 | 4 (0.3%) | 0 (0.0%) |
| $15,000 to $17,499 | 4 (0.3%) | 179 (11.0%) |
| $17,500 to $19,999 | 14 (1.1%) | 41 (2.5%) |
| $20,000 to $22,499 | 33 (2.5%) | 135 (8.3%) |
| $22,500 to $24,999 | 23 (1.8%) | 45 (2.8%) |
| $25,000 to $29,999 | 69 (5.3%) | 84 (5.2%) |
| $30,000 to $34,999 | 33 (2.5%) | 165 (10.2%) |
| $35,000 to $39,999 | 78 (6.0%) | 40 (2.5%) |
| $40,000 to $44,999 | 175 (13.5%) | 85 (5.2%) |
| $45,000 to $49,999 | 122 (9.4%) | 95 (5.9%) |
| $50,000 to $54,999 | 75 (5.8%) | 95 (5.9%) |
| $55,000 to $64,999 | 169 (13.0%) | 102 (6.3%) |
| $65,000 to $74,999 | 8 (0.6%) | 0 (0.0%) |
| $75,000 to $99,999 | 135 (10.4%) | 54 (3.3%) |
| $100,000+ | 17 (1.3%) | 26 (1.6%) |
| Total | 1,297 (100.0%) | 1,621 (100.0%) |
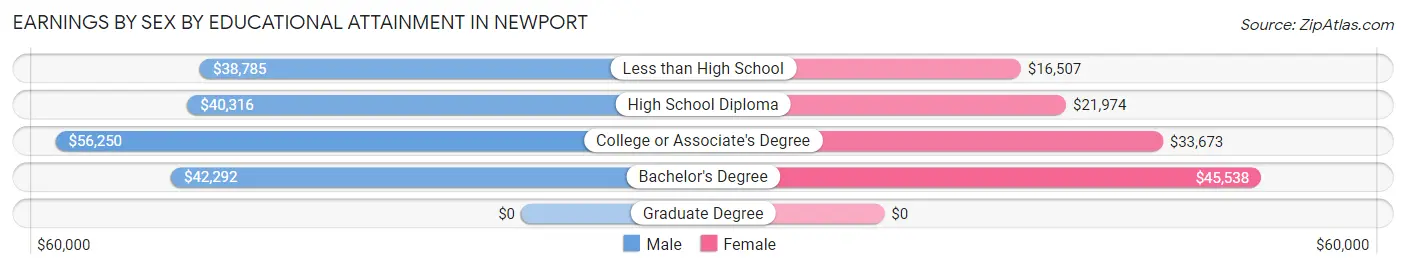
Earnings by Sex by Educational Attainment in Newport
Average earnings in Newport are $41,241 for men and $28,177 for women, a difference of 31.7%. Men with an educational attainment of college or associate's degree enjoy the highest average annual earnings of $56,250, while those with less than high school education earn the least with $38,785. Women with an educational attainment of bachelor's degree earn the most with the average annual earnings of $45,538, while those with less than high school education have the smallest earnings of $16,507.
| Educational Attainment | Male Income | Female Income |
| Less than High School | $38,785 | $16,507 |
| High School Diploma | $40,316 | $21,974 |
| College or Associate's Degree | $56,250 | $33,673 |
| Bachelor's Degree | $42,292 | $45,538 |
| Graduate Degree | - | - |
| Total | $41,241 | $28,177 |
Family Income in Newport
Family Income Brackets in Newport
According to the Newport family income data, there are 392 families falling into the $50,000 to $74,999 income range, which is the most common income bracket and makes up 22.2% of all families. Conversely, the $200,000+ income bracket is the least frequent group with only 11 families (0.6%) belonging to this category.
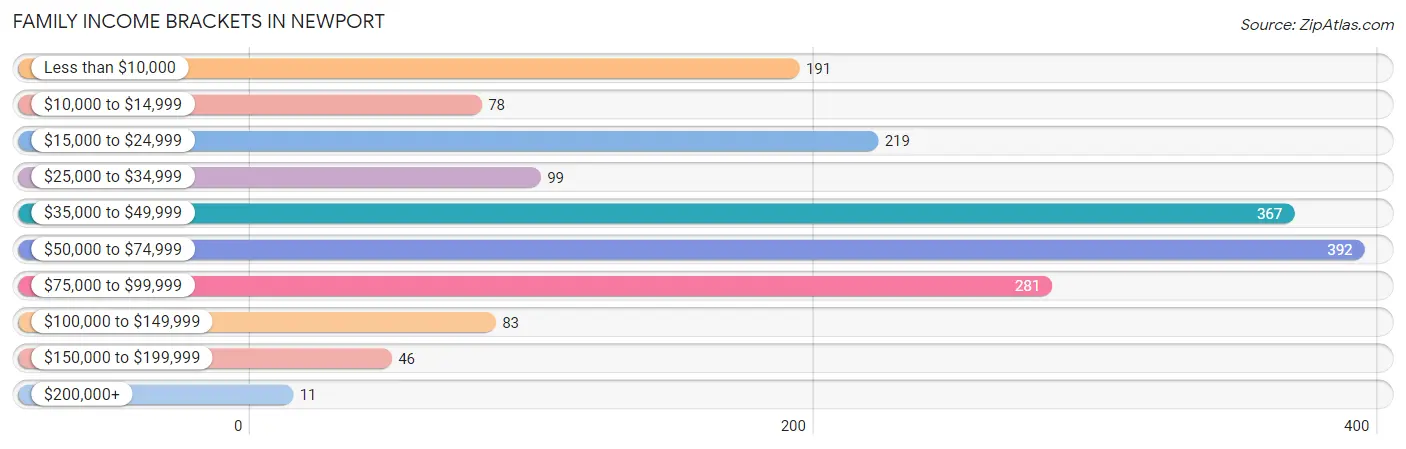
| Income Bracket | # Families | % Families |
| Less than $10,000 | 191 | 10.8% |
| $10,000 to $14,999 | 78 | 4.4% |
| $15,000 to $24,999 | 219 | 12.4% |
| $25,000 to $34,999 | 99 | 5.6% |
| $35,000 to $49,999 | 367 | 20.8% |
| $50,000 to $74,999 | 392 | 22.2% |
| $75,000 to $99,999 | 281 | 15.9% |
| $100,000 to $149,999 | 83 | 4.7% |
| $150,000 to $199,999 | 46 | 2.6% |
| $200,000+ | 11 | 0.6% |
Family Income by Famaliy Size in Newport
2-person families (935 | 53.0%) account for the highest median family income in Newport with $51,042 per family, while 2-person families (935 | 53.0%) have the highest median income of $25,521 per family member.
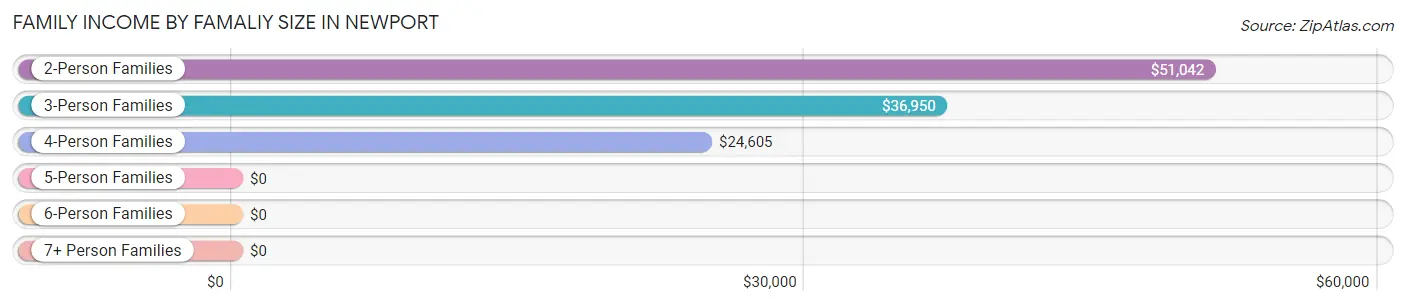
| Income Bracket | # Families | Median Income |
| 2-Person Families | 935 (53.0%) | $51,042 |
| 3-Person Families | 429 (24.3%) | $36,950 |
| 4-Person Families | 206 (11.7%) | $24,605 |
| 5-Person Families | 184 (10.4%) | $0 |
| 6-Person Families | 0 (0.0%) | $0 |
| 7+ Person Families | 11 (0.6%) | $0 |
| Total | 1,765 (100.0%) | $48,391 |
Family Income by Number of Earners in Newport
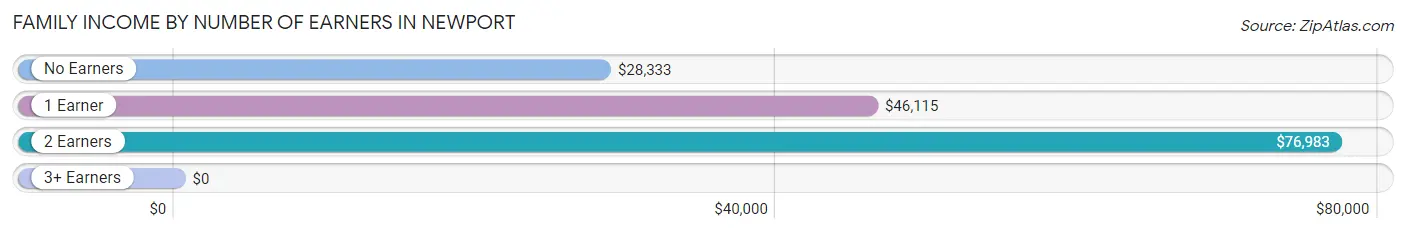
| Number of Earners | # Families | Median Income |
| No Earners | 310 (17.6%) | $28,333 |
| 1 Earner | 922 (52.2%) | $46,115 |
| 2 Earners | 494 (28.0%) | $76,983 |
| 3+ Earners | 39 (2.2%) | $0 |
| Total | 1,765 (100.0%) | $48,391 |
Household Income in Newport
Household Income Brackets in Newport
With 495 households falling in the category, the $15,000 to $24,999 income range is the most frequent in Newport, accounting for 17.3% of all households. In contrast, only 11 households (0.4%) fall into the $200,000+ income bracket, making it the least populous group.
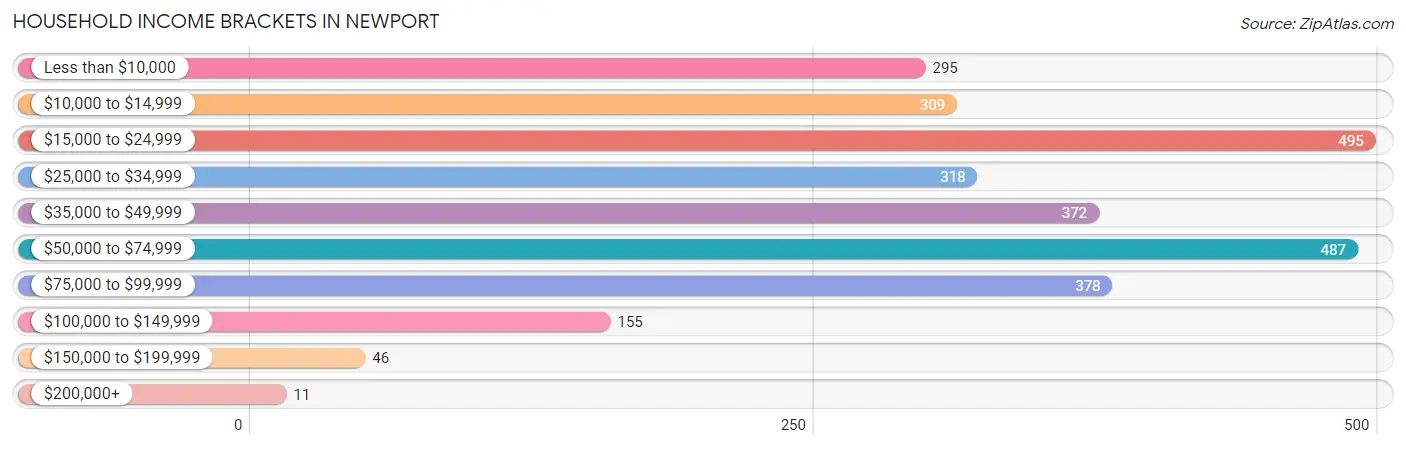
| Income Bracket | # Households | % Households |
| Less than $10,000 | 295 | 10.3% |
| $10,000 to $14,999 | 309 | 10.8% |
| $15,000 to $24,999 | 495 | 17.3% |
| $25,000 to $34,999 | 318 | 11.1% |
| $35,000 to $49,999 | 372 | 13.0% |
| $50,000 to $74,999 | 487 | 17.0% |
| $75,000 to $99,999 | 378 | 13.2% |
| $100,000 to $149,999 | 155 | 5.4% |
| $150,000 to $199,999 | 46 | 1.6% |
| $200,000+ | 11 | 0.4% |
Household Income by Householder Age in Newport
The median household income in Newport is $35,784, with the highest median household income of $47,924 found in the 45 to 64 years age bracket for the primary householder. A total of 1,163 households (40.6%) fall into this category. Meanwhile, the 65+ years age bracket for the primary householder has the lowest median household income of $25,192, with 828 households (28.9%) in this group.
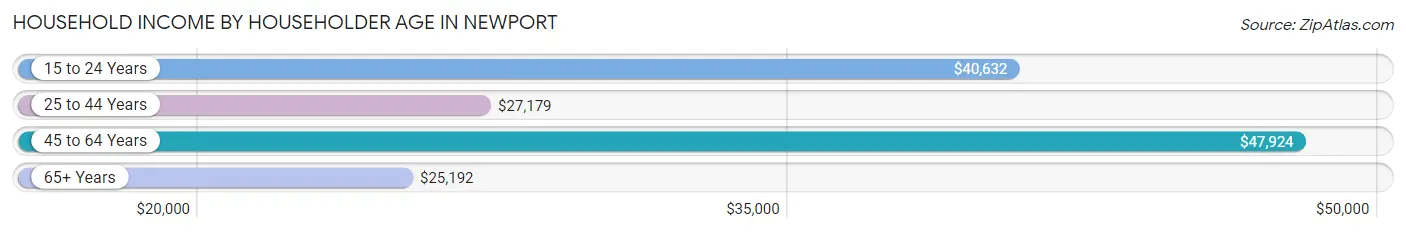
| Income Bracket | # Households | Median Income |
| 15 to 24 Years | 221 (7.7%) | $40,632 |
| 25 to 44 Years | 650 (22.7%) | $27,179 |
| 45 to 64 Years | 1,163 (40.6%) | $47,924 |
| 65+ Years | 828 (28.9%) | $25,192 |
| Total | 2,862 (100.0%) | $35,784 |
Poverty in Newport
Income Below Poverty by Sex and Age in Newport
With 26.5% poverty level for males and 29.4% for females among the residents of Newport, under 5 year old males and 15 year old females are the most vulnerable to poverty, with 216 males (82.8%) and 11 females (100.0%) in their respective age groups living below the poverty level.
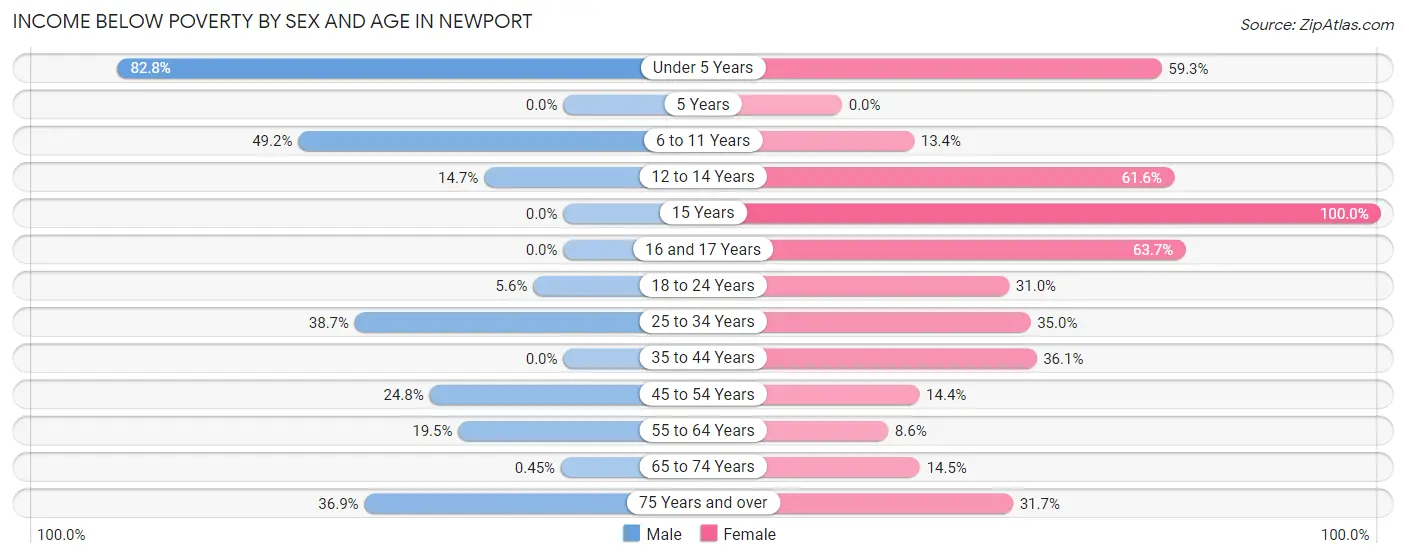
| Age Bracket | Male | Female |
| Under 5 Years | 216 (82.8%) | 258 (59.3%) |
| 5 Years | 0 (0.0%) | 0 (0.0%) |
| 6 to 11 Years | 94 (49.2%) | 29 (13.4%) |
| 12 to 14 Years | 5 (14.7%) | 106 (61.6%) |
| 15 Years | 0 (0.0%) | 11 (100.0%) |
| 16 and 17 Years | 0 (0.0%) | 72 (63.7%) |
| 18 to 24 Years | 21 (5.6%) | 116 (31.0%) |
| 25 to 34 Years | 137 (38.7%) | 177 (35.0%) |
| 35 to 44 Years | 0 (0.0%) | 83 (36.1%) |
| 45 to 54 Years | 113 (24.8%) | 58 (14.4%) |
| 55 to 64 Years | 63 (19.5%) | 53 (8.6%) |
| 65 to 74 Years | 1 (0.4%) | 58 (14.5%) |
| 75 Years and over | 113 (36.9%) | 86 (31.7%) |
| Total | 763 (26.5%) | 1,107 (29.4%) |
Income Above Poverty by Sex and Age in Newport
According to the poverty statistics in Newport, males aged 15 years and females aged 5 years are the age groups that are most secure financially, with 100.0% of males and 100.0% of females in these age groups living above the poverty line.
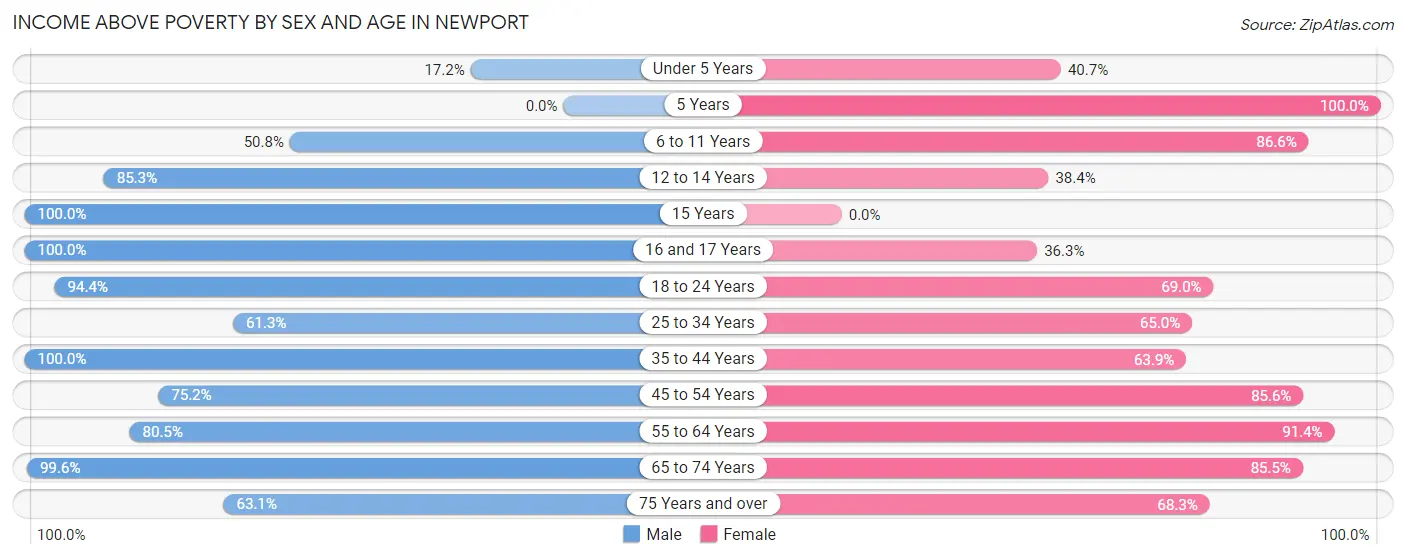
| Age Bracket | Male | Female |
| Under 5 Years | 45 (17.2%) | 177 (40.7%) |
| 5 Years | 0 (0.0%) | 14 (100.0%) |
| 6 to 11 Years | 97 (50.8%) | 188 (86.6%) |
| 12 to 14 Years | 29 (85.3%) | 66 (38.4%) |
| 15 Years | 28 (100.0%) | 0 (0.0%) |
| 16 and 17 Years | 121 (100.0%) | 41 (36.3%) |
| 18 to 24 Years | 355 (94.4%) | 258 (69.0%) |
| 25 to 34 Years | 217 (61.3%) | 329 (65.0%) |
| 35 to 44 Years | 202 (100.0%) | 147 (63.9%) |
| 45 to 54 Years | 342 (75.2%) | 346 (85.6%) |
| 55 to 64 Years | 260 (80.5%) | 566 (91.4%) |
| 65 to 74 Years | 223 (99.6%) | 343 (85.5%) |
| 75 Years and over | 193 (63.1%) | 185 (68.3%) |
| Total | 2,112 (73.5%) | 2,660 (70.6%) |
Income Below Poverty Among Married-Couple Families in Newport
The poverty statistics for married-couple families in Newport show that 4.3% or 41 of the total 954 families live below the poverty line. Families with 1 or 2 children have the highest poverty rate of 20.4%, comprising of 22 families. On the other hand, families with 3 or 4 children have the lowest poverty rate of 0.0%, which includes 0 families.
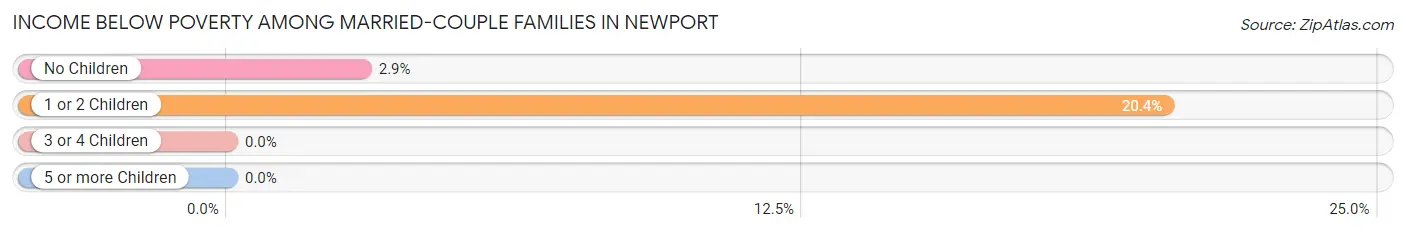
| Children | Above Poverty | Below Poverty |
| No Children | 635 (97.1%) | 19 (2.9%) |
| 1 or 2 Children | 86 (79.6%) | 22 (20.4%) |
| 3 or 4 Children | 181 (100.0%) | 0 (0.0%) |
| 5 or more Children | 11 (100.0%) | 0 (0.0%) |
| Total | 913 (95.7%) | 41 (4.3%) |
Income Below Poverty Among Single-Parent Households in Newport
According to the poverty data in Newport, 27.4% or 34 single-father households and 54.9% or 377 single-mother households are living below the poverty line. Among single-father households, those with 1 or 2 children have the highest poverty rate, with 34 households (56.7%) experiencing poverty. Likewise, among single-mother households, those with 3 or 4 children have the highest poverty rate, with 99 households (100.0%) falling below the poverty line.
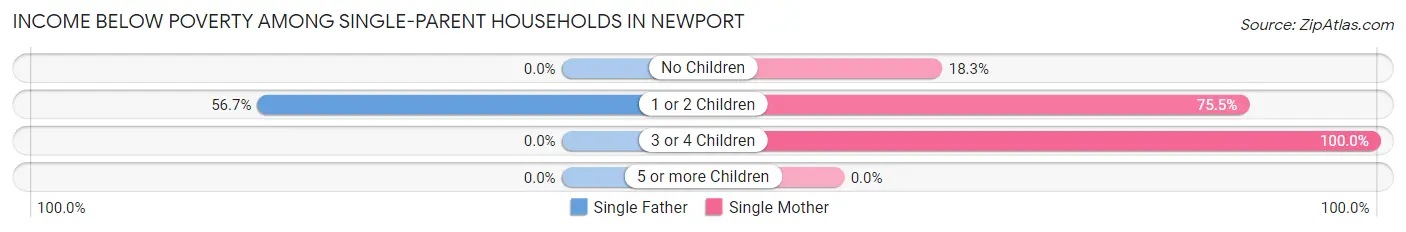
| Children | Single Father | Single Mother |
| No Children | 0 (0.0%) | 53 (18.3%) |
| 1 or 2 Children | 34 (56.7%) | 225 (75.5%) |
| 3 or 4 Children | 0 (0.0%) | 99 (100.0%) |
| 5 or more Children | 0 (0.0%) | 0 (0.0%) |
| Total | 34 (27.4%) | 377 (54.9%) |
Income Below Poverty Among Married-Couple vs Single-Parent Households in Newport
The poverty data for Newport shows that 41 of the married-couple family households (4.3%) and 411 of the single-parent households (50.7%) are living below the poverty level. Within the married-couple family households, those with 1 or 2 children have the highest poverty rate, with 22 households (20.4%) falling below the poverty line. Among the single-parent households, those with 3 or 4 children have the highest poverty rate, with 99 household (90.0%) living below poverty.
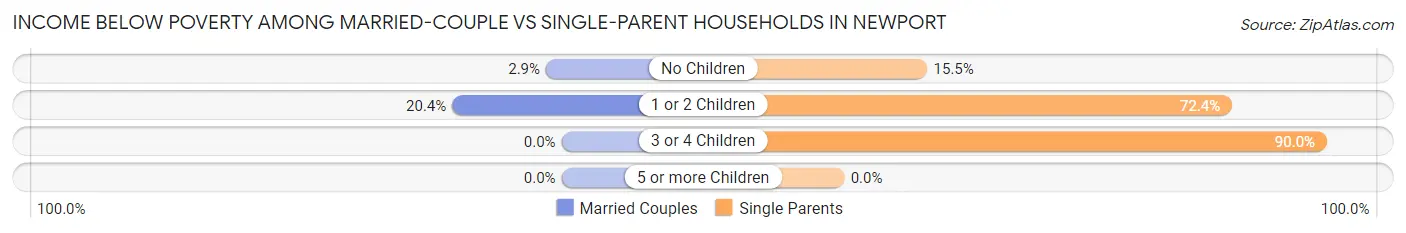
| Children | Married-Couple Families | Single-Parent Households |
| No Children | 19 (2.9%) | 53 (15.4%) |
| 1 or 2 Children | 22 (20.4%) | 259 (72.4%) |
| 3 or 4 Children | 0 (0.0%) | 99 (90.0%) |
| 5 or more Children | 0 (0.0%) | 0 (0.0%) |
| Total | 41 (4.3%) | 411 (50.7%) |
Race in Newport
The most populous races in Newport are White / Caucasian (6,019 | 87.9%), Two or more Races (539 | 7.9%), and Hispanic or Latino (347 | 5.1%).
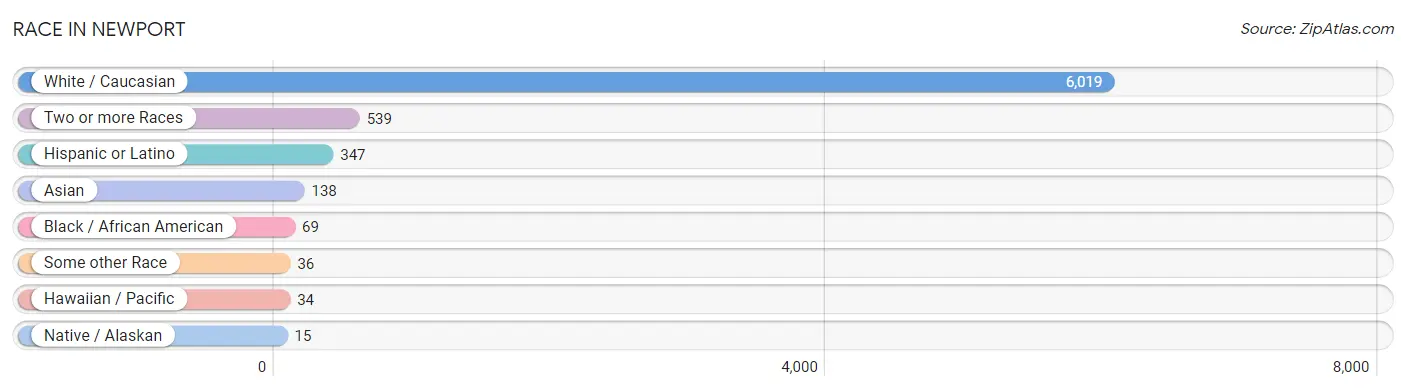
| Race | # Population | % Population |
| Asian | 138 | 2.0% |
| Black / African American | 69 | 1.0% |
| Hawaiian / Pacific | 34 | 0.5% |
| Hispanic or Latino | 347 | 5.1% |
| Native / Alaskan | 15 | 0.2% |
| White / Caucasian | 6,019 | 87.9% |
| Two or more Races | 539 | 7.9% |
| Some other Race | 36 | 0.5% |
| Total | 6,850 | 100.0% |
Ancestry in Newport
The most populous ancestries reported in Newport are American (751 | 11.0%), English (374 | 5.5%), German (329 | 4.8%), Irish (283 | 4.1%), and Thai (162 | 2.4%), together accounting for 27.7% of all Newport residents.
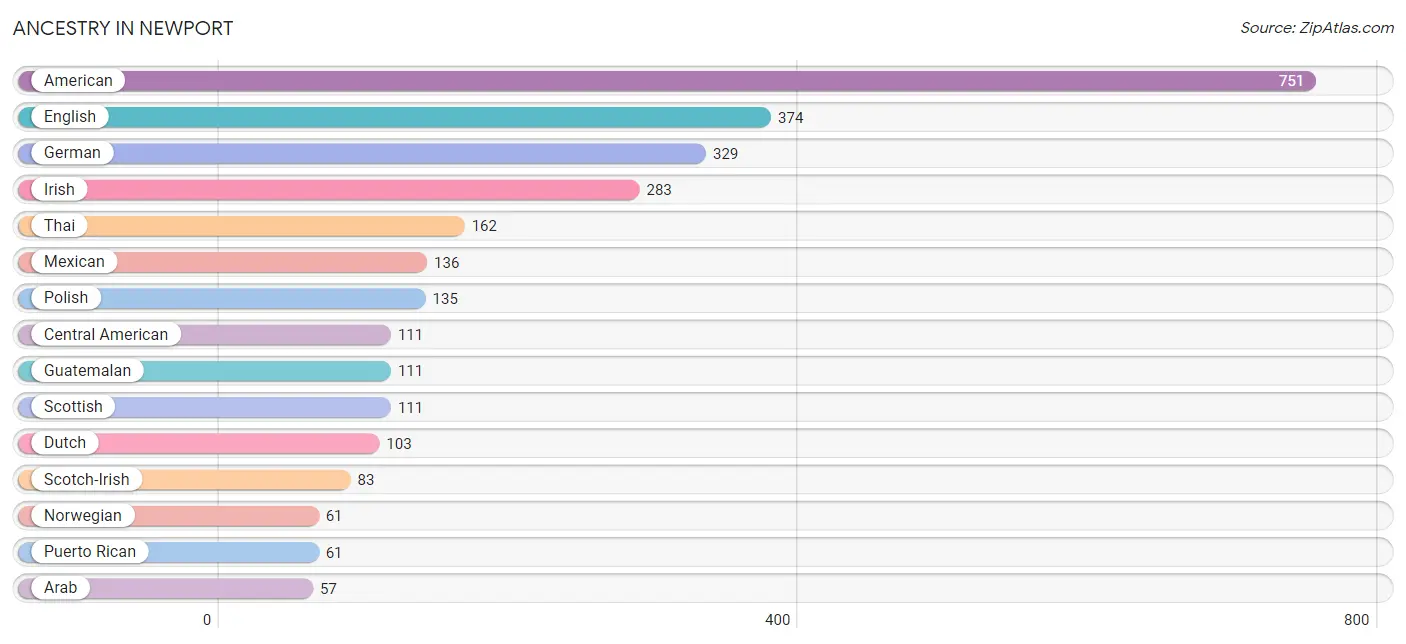
| Ancestry | # Population | % Population |
| African | 39 | 0.6% |
| American | 751 | 11.0% |
| Arab | 57 | 0.8% |
| Bhutanese | 11 | 0.2% |
| Burmese | 19 | 0.3% |
| Central American | 111 | 1.6% |
| Cherokee | 15 | 0.2% |
| Cuban | 39 | 0.6% |
| Czech | 16 | 0.2% |
| Danish | 52 | 0.8% |
| Dutch | 103 | 1.5% |
| English | 374 | 5.5% |
| French | 11 | 0.2% |
| French Canadian | 20 | 0.3% |
| German | 329 | 4.8% |
| Guatemalan | 111 | 1.6% |
| Irish | 283 | 4.1% |
| Italian | 18 | 0.3% |
| Mexican | 136 | 2.0% |
| Native Hawaiian | 42 | 0.6% |
| Norwegian | 61 | 0.9% |
| Polish | 135 | 2.0% |
| Potawatomi | 15 | 0.2% |
| Puerto Rican | 61 | 0.9% |
| Scandinavian | 4 | 0.1% |
| Scotch-Irish | 83 | 1.2% |
| Scottish | 111 | 1.6% |
| Subsaharan African | 39 | 0.6% |
| Swedish | 4 | 0.1% |
| Swiss | 14 | 0.2% |
| Thai | 162 | 2.4% |
| Welsh | 53 | 0.8% | View All 32 Rows |
Immigrants in Newport
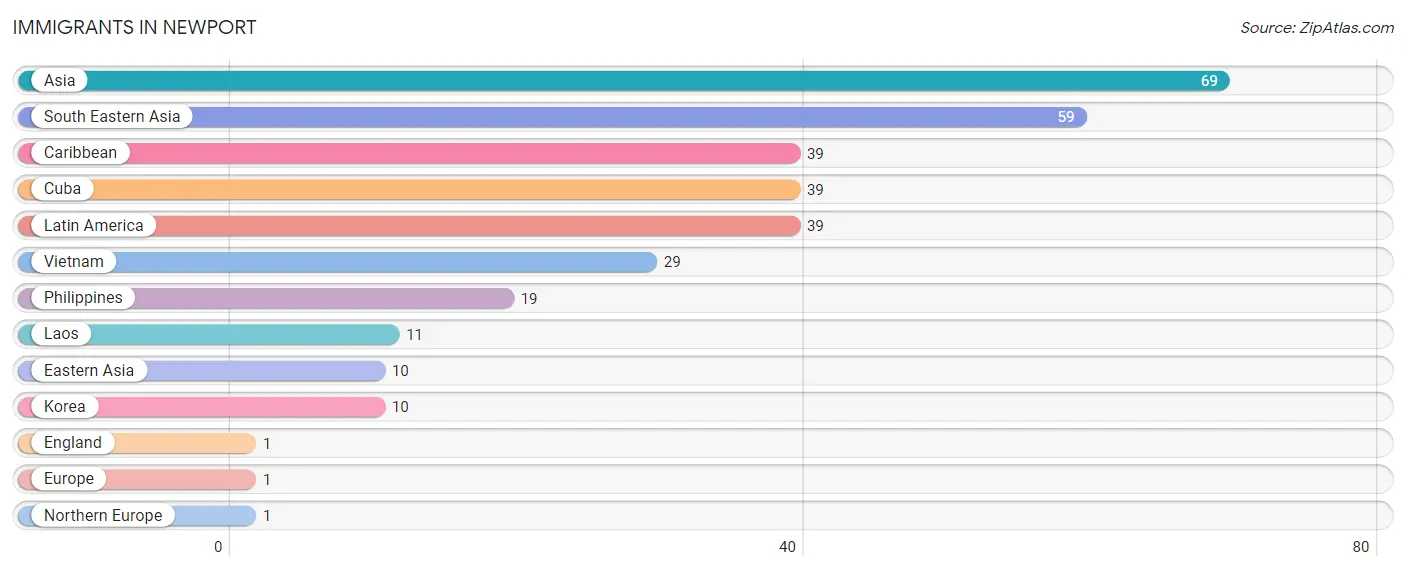
The most numerous immigrant groups reported in Newport came from Asia (69 | 1.0%), South Eastern Asia (59 | 0.9%), Caribbean (39 | 0.6%), Cuba (39 | 0.6%), and Latin America (39 | 0.6%), together accounting for 3.6% of all Newport residents.
| Immigration Origin | # Population | % Population |
| Asia | 69 | 1.0% |
| Caribbean | 39 | 0.6% |
| Cuba | 39 | 0.6% |
| Eastern Asia | 10 | 0.2% |
| England | 1 | 0.0% |
| Europe | 1 | 0.0% |
| Korea | 10 | 0.2% |
| Laos | 11 | 0.2% |
| Latin America | 39 | 0.6% |
| Northern Europe | 1 | 0.0% |
| Philippines | 19 | 0.3% |
| South Eastern Asia | 59 | 0.9% |
| Vietnam | 29 | 0.4% | View All 13 Rows |
Sex and Age in Newport
Sex and Age in Newport
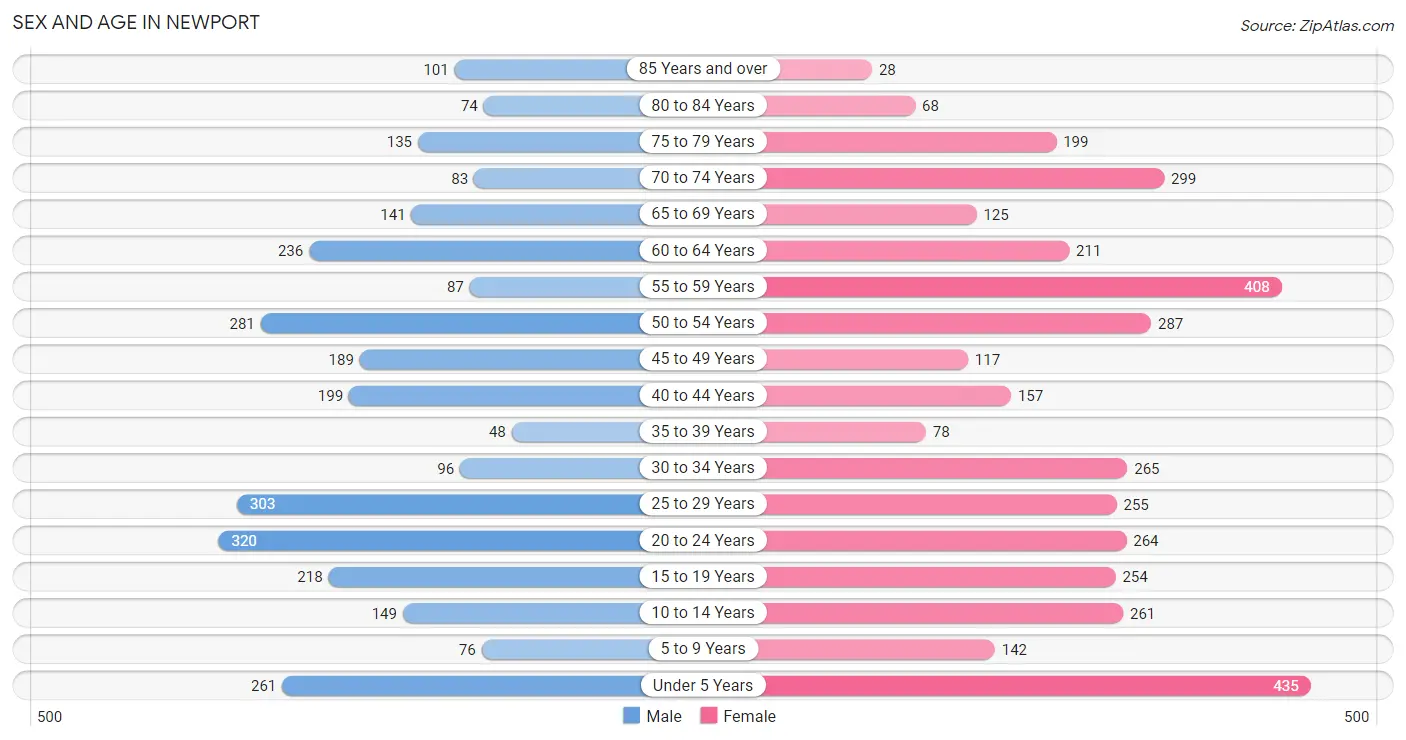
The most populous age groups in Newport are 20 to 24 Years (320 | 10.7%) for men and Under 5 Years (435 | 11.3%) for women.
| Age Bracket | Male | Female |
| Under 5 Years | 261 (8.7%) | 435 (11.3%) |
| 5 to 9 Years | 76 (2.5%) | 142 (3.7%) |
| 10 to 14 Years | 149 (5.0%) | 261 (6.8%) |
| 15 to 19 Years | 218 (7.3%) | 254 (6.6%) |
| 20 to 24 Years | 320 (10.7%) | 264 (6.9%) |
| 25 to 29 Years | 303 (10.1%) | 255 (6.6%) |
| 30 to 34 Years | 96 (3.2%) | 265 (6.9%) |
| 35 to 39 Years | 48 (1.6%) | 78 (2.0%) |
| 40 to 44 Years | 199 (6.6%) | 157 (4.1%) |
| 45 to 49 Years | 189 (6.3%) | 117 (3.0%) |
| 50 to 54 Years | 281 (9.4%) | 287 (7.4%) |
| 55 to 59 Years | 87 (2.9%) | 408 (10.6%) |
| 60 to 64 Years | 236 (7.9%) | 211 (5.5%) |
| 65 to 69 Years | 141 (4.7%) | 125 (3.2%) |
| 70 to 74 Years | 83 (2.8%) | 299 (7.8%) |
| 75 to 79 Years | 135 (4.5%) | 199 (5.2%) |
| 80 to 84 Years | 74 (2.5%) | 68 (1.8%) |
| 85 Years and over | 101 (3.4%) | 28 (0.7%) |
| Total | 2,997 (100.0%) | 3,853 (100.0%) |
Families and Households in Newport
Median Family Size in Newport
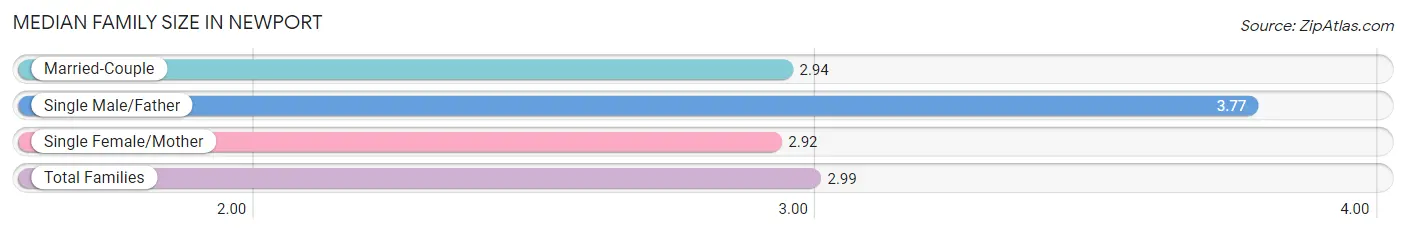
The median family size in Newport is 2.99 persons per family, with single male/father families (124 | 7.0%) accounting for the largest median family size of 3.77 persons per family. On the other hand, single female/mother families (687 | 38.9%) represent the smallest median family size with 2.92 persons per family.
| Family Type | # Families | Family Size |
| Married-Couple | 954 (54.0%) | 2.94 |
| Single Male/Father | 124 (7.0%) | 3.77 |
| Single Female/Mother | 687 (38.9%) | 2.92 |
| Total Families | 1,765 (100.0%) | 2.99 |
Median Household Size in Newport
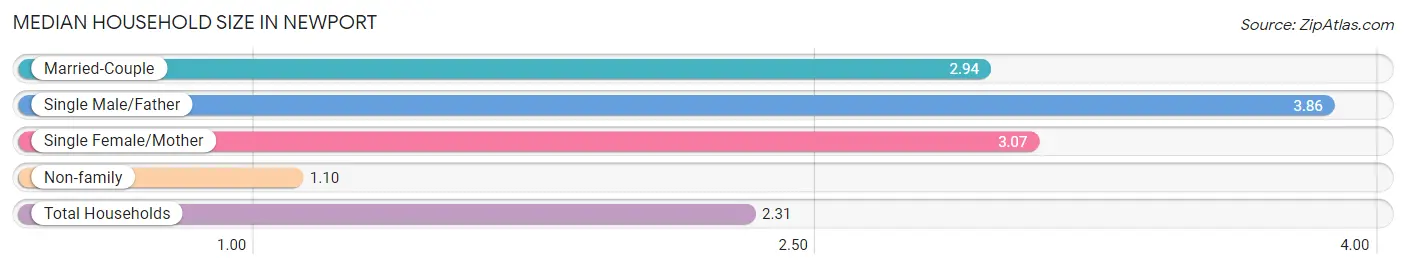
The median household size in Newport is 2.31 persons per household, with single male/father households (124 | 4.3%) accounting for the largest median household size of 3.86 persons per household. non-family households (1,097 | 38.3%) represent the smallest median household size with 1.10 persons per household.
| Household Type | # Households | Household Size |
| Married-Couple | 954 (33.3%) | 2.94 |
| Single Male/Father | 124 (4.3%) | 3.86 |
| Single Female/Mother | 687 (24.0%) | 3.07 |
| Non-family | 1,097 (38.3%) | 1.10 |
| Total Households | 2,862 (100.0%) | 2.31 |
Household Size by Marriage Status in Newport
Out of a total of 2,862 households in Newport, 1,765 (61.7%) are family households, while 1,097 (38.3%) are nonfamily households. The most numerous type of family households are 2-person households, comprising 860, and the most common type of nonfamily households are 1-person households, comprising 951.
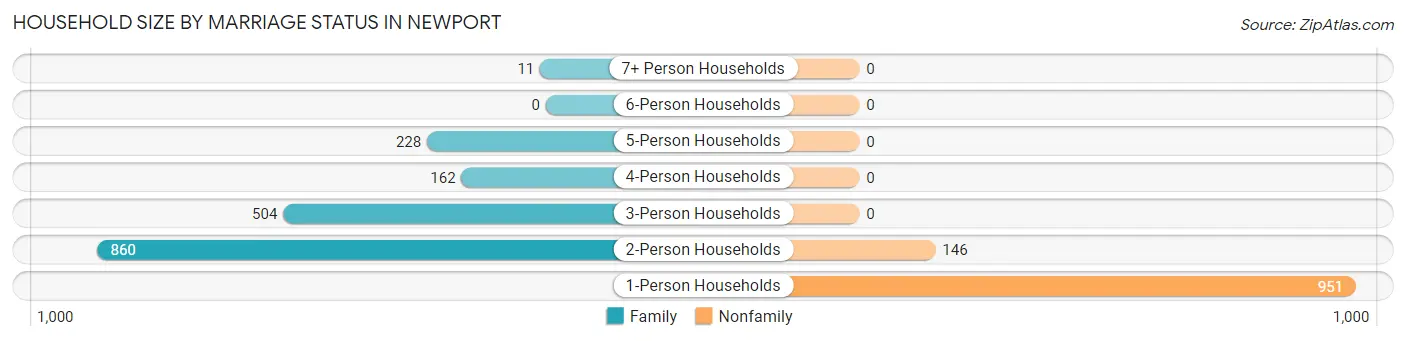
| Household Size | Family Households | Nonfamily Households |
| 1-Person Households | - | 951 (33.2%) |
| 2-Person Households | 860 (30.0%) | 146 (5.1%) |
| 3-Person Households | 504 (17.6%) | 0 (0.0%) |
| 4-Person Households | 162 (5.7%) | 0 (0.0%) |
| 5-Person Households | 228 (8.0%) | 0 (0.0%) |
| 6-Person Households | 0 (0.0%) | 0 (0.0%) |
| 7+ Person Households | 11 (0.4%) | 0 (0.0%) |
| Total | 1,765 (61.7%) | 1,097 (38.3%) |
Female Fertility in Newport
Fertility by Age in Newport
Average fertility rate in Newport is 40.0 births per 1,000 women. Women in the age bracket of 35 to 50 years have the highest fertility rate with 69.0 births per 1,000 women. Women in the age bracket of 20 to 34 years acount for 52.6% of all women with births.
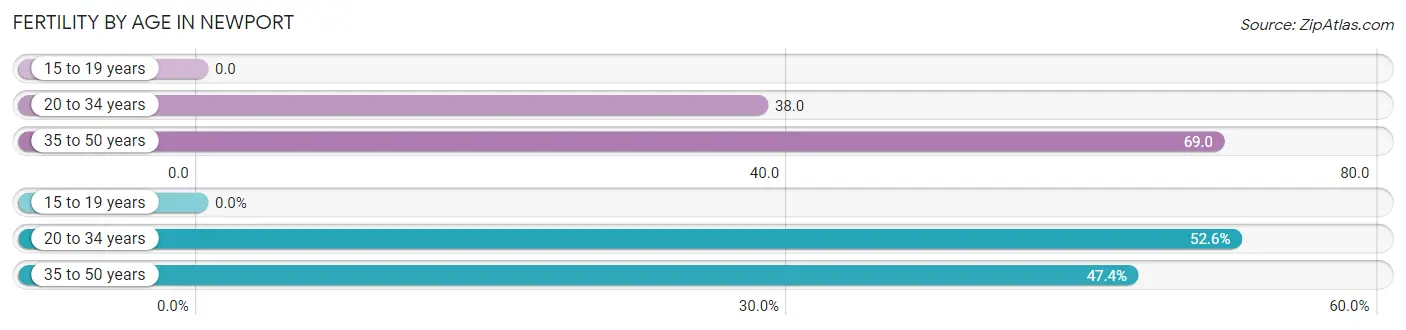
| Age Bracket | Women with Births | Births / 1,000 Women |
| 15 to 19 years | 0 (0.0%) | 0.0 |
| 20 to 34 years | 30 (52.6%) | 38.0 |
| 35 to 50 years | 27 (47.4%) | 69.0 |
| Total | 57 (100.0%) | 40.0 |
Fertility by Age by Marriage Status in Newport
70.2% of women with births (57) in Newport are married. The highest percentage of unmarried women with births falls into 20 to 34 years age bracket with 56.7% of them unmarried at the time of birth, while the lowest percentage of unmarried women with births belong to 35 to 50 years age bracket with 0.0% of them unmarried.
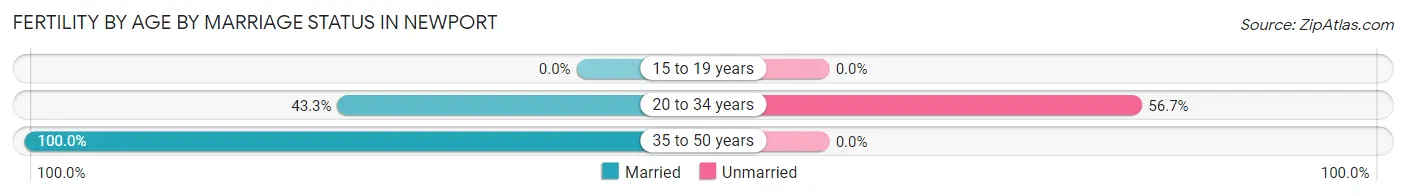
| Age Bracket | Married | Unmarried |
| 15 to 19 years | 0 (0.0%) | 0 (0.0%) |
| 20 to 34 years | 13 (43.3%) | 17 (56.7%) |
| 35 to 50 years | 27 (100.0%) | 0 (0.0%) |
| Total | 40 (70.2%) | 17 (29.8%) |
Fertility by Education in Newport
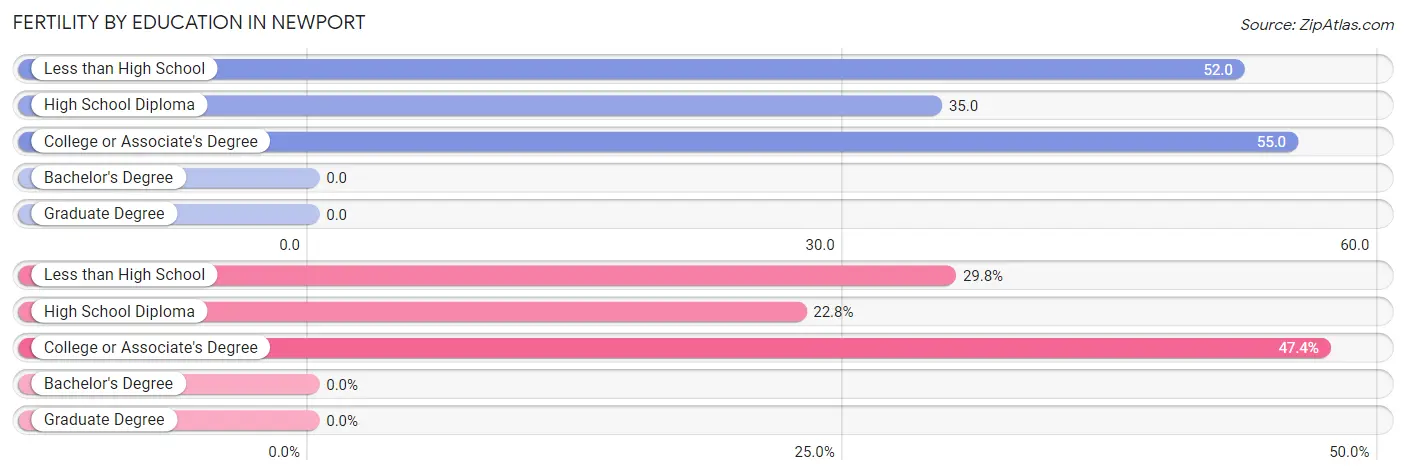
| Educational Attainment | Women with Births | Births / 1,000 Women |
| Less than High School | 17 (29.8%) | 52.0 |
| High School Diploma | 13 (22.8%) | 35.0 |
| College or Associate's Degree | 27 (47.4%) | 55.0 |
| Bachelor's Degree | 0 (0.0%) | 0.0 |
| Graduate Degree | 0 (0.0%) | 0.0 |
| Total | 57 (100.0%) | 40.0 |
Fertility by Education by Marriage Status in Newport
29.8% of women with births in Newport are unmarried. Women with the educational attainment of high school diploma are most likely to be married with 100.0% of them married at childbirth, while women with the educational attainment of less than high school are least likely to be married with 100.0% of them unmarried at childbirth.
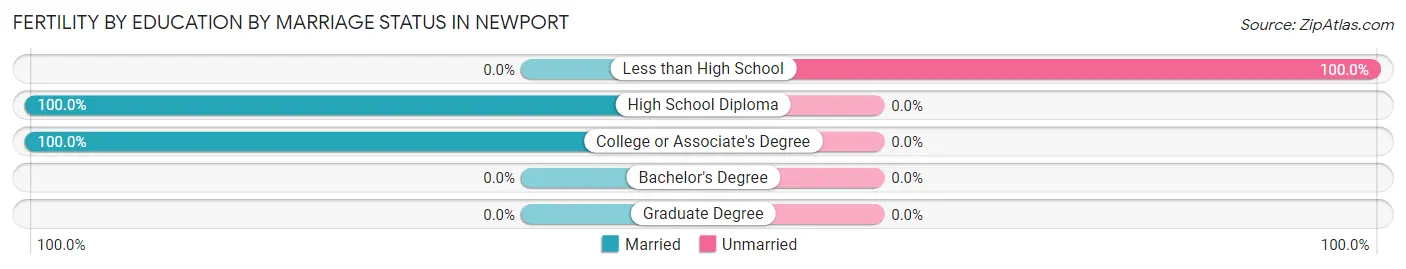
| Educational Attainment | Married | Unmarried |
| Less than High School | 0 (0.0%) | 17 (100.0%) |
| High School Diploma | 13 (100.0%) | 0 (0.0%) |
| College or Associate's Degree | 27 (100.0%) | 0 (0.0%) |
| Bachelor's Degree | 0 (0.0%) | 0 (0.0%) |
| Graduate Degree | 0 (0.0%) | 0 (0.0%) |
| Total | 40 (70.2%) | 17 (29.8%) |
Employment Characteristics in Newport
Employment by Class of Employer in Newport
Among the 2,644 employed individuals in Newport, private company employees (1,914 | 72.4%), local government employees (233 | 8.8%), and state government employees (160 | 6.0%) make up the most common classes of employment.
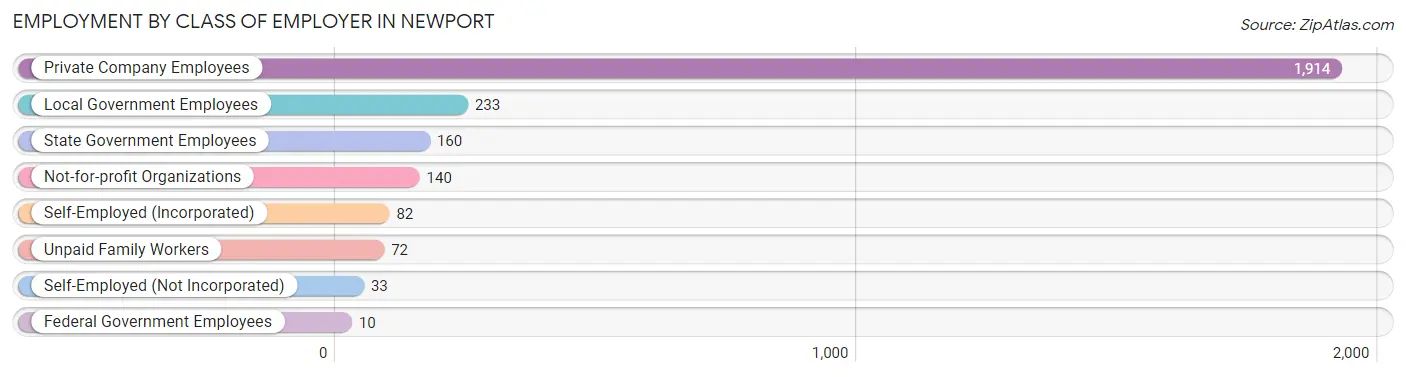
| Employer Class | # Employees | % Employees |
| Private Company Employees | 1,914 | 72.4% |
| Self-Employed (Incorporated) | 82 | 3.1% |
| Self-Employed (Not Incorporated) | 33 | 1.3% |
| Not-for-profit Organizations | 140 | 5.3% |
| Local Government Employees | 233 | 8.8% |
| State Government Employees | 160 | 6.0% |
| Federal Government Employees | 10 | 0.4% |
| Unpaid Family Workers | 72 | 2.7% |
| Total | 2,644 | 100.0% |
Employment Status by Age in Newport
According to the labor force statistics for Newport, out of the total population over 16 years of age (5,487), 51.3% or 2,815 individuals are in the labor force, with 6.1% or 172 of them unemployed. The age group with the highest labor force participation rate is 25 to 29 years, with 79.0% or 441 individuals in the labor force. Within the labor force, the 16 to 19 years age range has the highest percentage of unemployed individuals, with 45.8% or 109 of them being unemployed.
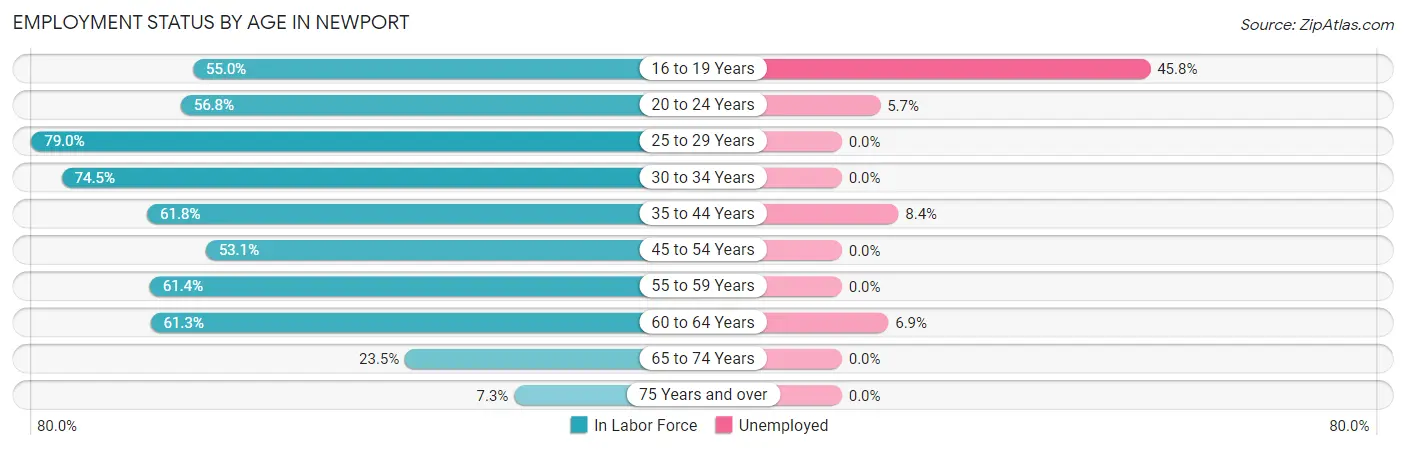
| Age Bracket | In Labor Force | Unemployed |
| 16 to 19 Years | 238 (55.0%) | 109 (45.8%) |
| 20 to 24 Years | 332 (56.8%) | 19 (5.7%) |
| 25 to 29 Years | 441 (79.0%) | 0 (0.0%) |
| 30 to 34 Years | 269 (74.5%) | 0 (0.0%) |
| 35 to 44 Years | 298 (61.8%) | 25 (8.4%) |
| 45 to 54 Years | 464 (53.1%) | 0 (0.0%) |
| 55 to 59 Years | 304 (61.4%) | 0 (0.0%) |
| 60 to 64 Years | 274 (61.3%) | 19 (6.9%) |
| 65 to 74 Years | 152 (23.5%) | 0 (0.0%) |
| 75 Years and over | 44 (7.3%) | 0 (0.0%) |
| Total | 2,815 (51.3%) | 172 (6.1%) |
Employment Status by Educational Attainment in Newport
According to labor force statistics for Newport, 63.7% of individuals (2,049) out of the total population between 25 and 64 years of age (3,217) are in the labor force, with 2.1% or 43 of them being unemployed. The group with the highest labor force participation rate are those with the educational attainment of bachelor's degree or higher, with 90.7% or 332 individuals in the labor force. Within the labor force, individuals with college / associate degree education have the highest percentage of unemployment, with 6.9% or 44 of them being unemployed.
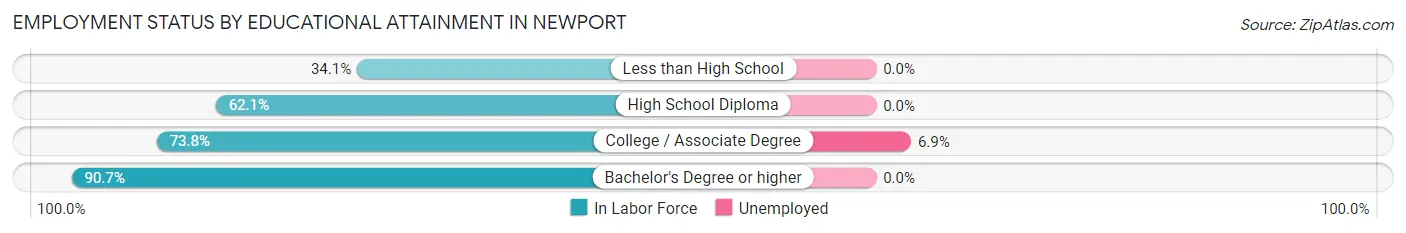
| Educational Attainment | In Labor Force | Unemployed |
| Less than High School | 187 (34.1%) | 0 (0.0%) |
| High School Diploma | 891 (62.1%) | 0 (0.0%) |
| College / Associate Degree | 640 (73.8%) | 60 (6.9%) |
| Bachelor's Degree or higher | 332 (90.7%) | 0 (0.0%) |
| Total | 2,049 (63.7%) | 68 (2.1%) |
Employment Occupations by Sex in Newport
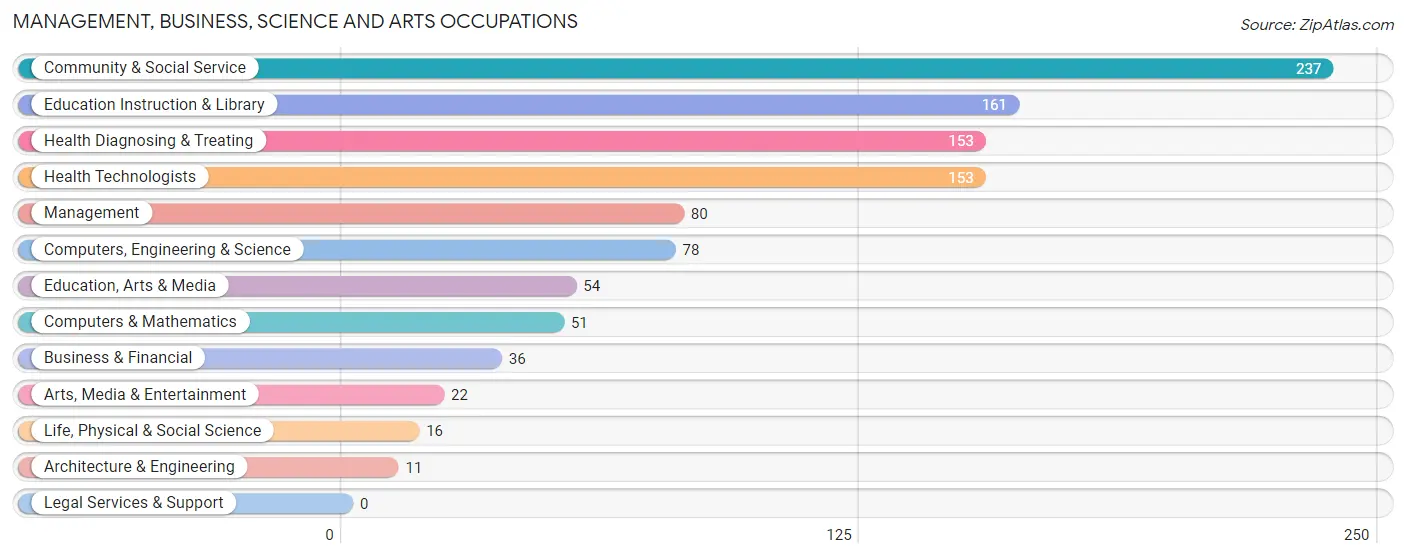
Management, Business, Science and Arts Occupations
The most common Management, Business, Science and Arts occupations in Newport are Community & Social Service (237 | 9.0%), Education Instruction & Library (161 | 6.1%), Health Diagnosing & Treating (153 | 5.8%), Health Technologists (153 | 5.8%), and Management (80 | 3.0%).
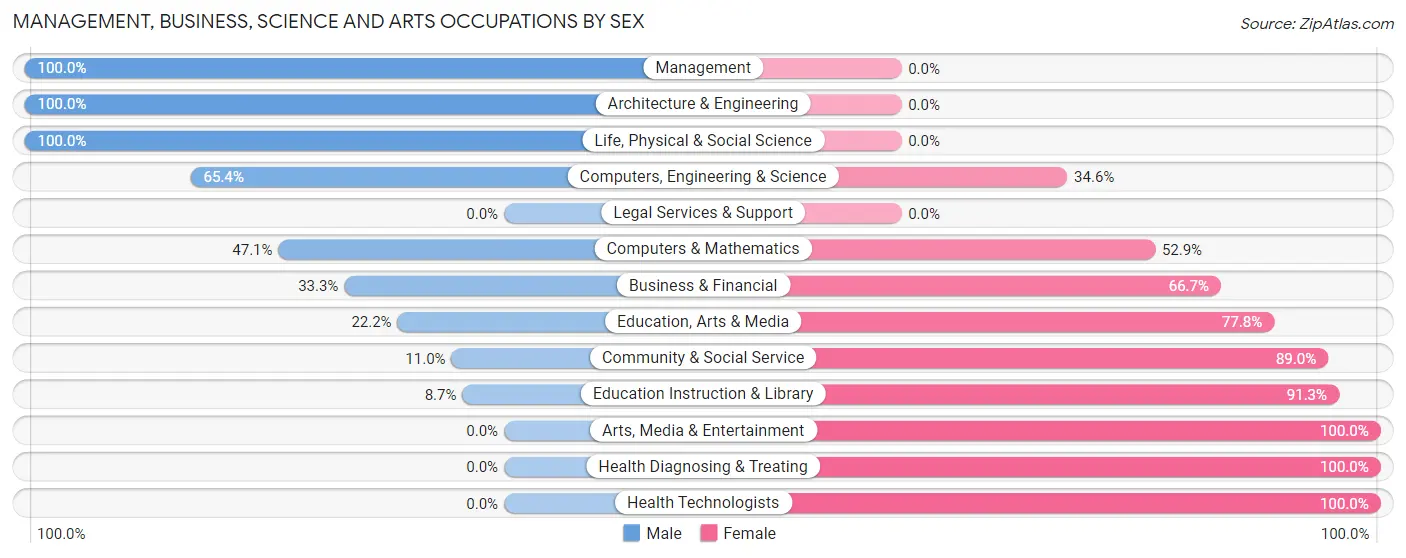
Management, Business, Science and Arts Occupations by Sex
Within the Management, Business, Science and Arts occupations in Newport, the most male-oriented occupations are Management (100.0%), Architecture & Engineering (100.0%), and Life, Physical & Social Science (100.0%), while the most female-oriented occupations are Arts, Media & Entertainment (100.0%), Health Diagnosing & Treating (100.0%), and Health Technologists (100.0%).
| Occupation | Male | Female |
| Management | 80 (100.0%) | 0 (0.0%) |
| Business & Financial | 12 (33.3%) | 24 (66.7%) |
| Computers, Engineering & Science | 51 (65.4%) | 27 (34.6%) |
| Computers & Mathematics | 24 (47.1%) | 27 (52.9%) |
| Architecture & Engineering | 11 (100.0%) | 0 (0.0%) |
| Life, Physical & Social Science | 16 (100.0%) | 0 (0.0%) |
| Community & Social Service | 26 (11.0%) | 211 (89.0%) |
| Education, Arts & Media | 12 (22.2%) | 42 (77.8%) |
| Legal Services & Support | 0 (0.0%) | 0 (0.0%) |
| Education Instruction & Library | 14 (8.7%) | 147 (91.3%) |
| Arts, Media & Entertainment | 0 (0.0%) | 22 (100.0%) |
| Health Diagnosing & Treating | 0 (0.0%) | 153 (100.0%) |
| Health Technologists | 0 (0.0%) | 153 (100.0%) |
| Total (Category) | 169 (28.9%) | 415 (71.1%) |
| Total (Overall) | 1,208 (45.7%) | 1,436 (54.3%) |
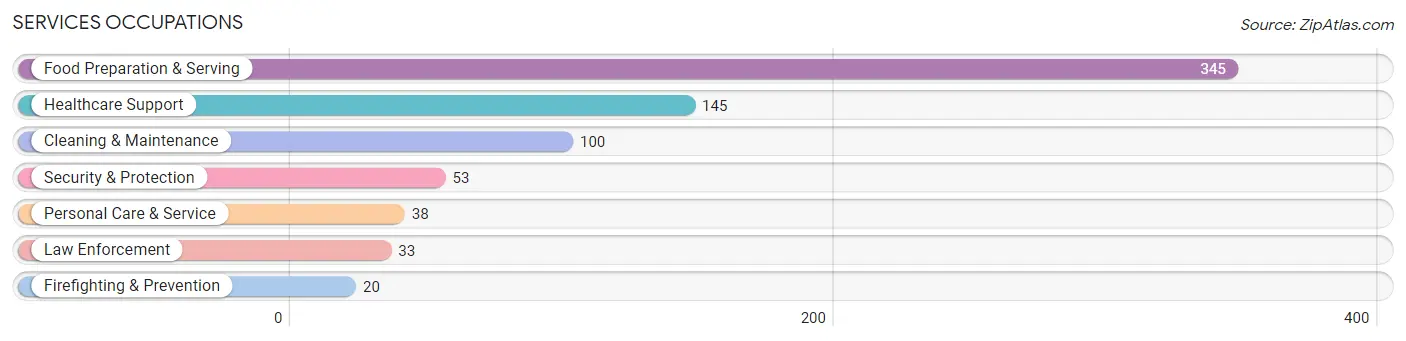
Services Occupations
The most common Services occupations in Newport are Food Preparation & Serving (345 | 13.1%), Healthcare Support (145 | 5.5%), Cleaning & Maintenance (100 | 3.8%), Security & Protection (53 | 2.0%), and Personal Care & Service (38 | 1.4%).
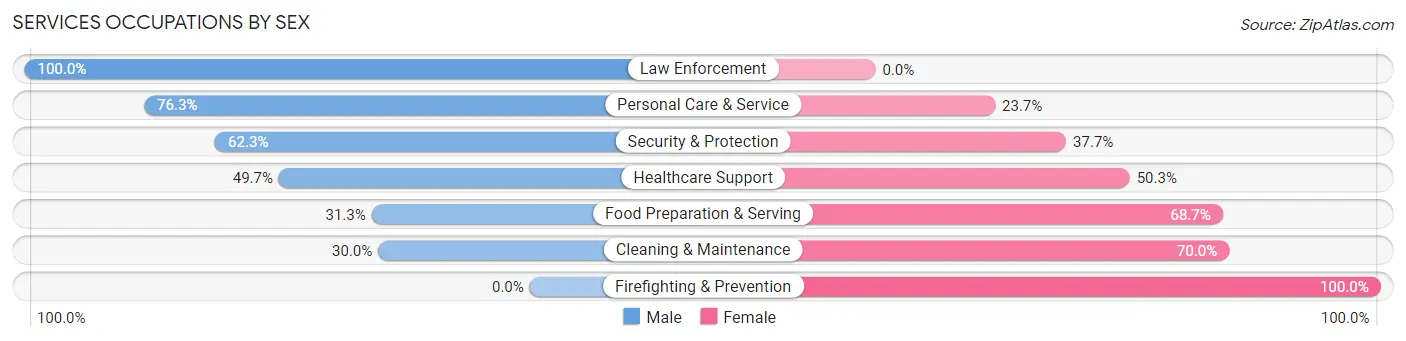
Services Occupations by Sex
Within the Services occupations in Newport, the most male-oriented occupations are Law Enforcement (100.0%), Personal Care & Service (76.3%), and Security & Protection (62.3%), while the most female-oriented occupations are Firefighting & Prevention (100.0%), Cleaning & Maintenance (70.0%), and Food Preparation & Serving (68.7%).
| Occupation | Male | Female |
| Healthcare Support | 72 (49.7%) | 73 (50.3%) |
| Security & Protection | 33 (62.3%) | 20 (37.7%) |
| Firefighting & Prevention | 0 (0.0%) | 20 (100.0%) |
| Law Enforcement | 33 (100.0%) | 0 (0.0%) |
| Food Preparation & Serving | 108 (31.3%) | 237 (68.7%) |
| Cleaning & Maintenance | 30 (30.0%) | 70 (70.0%) |
| Personal Care & Service | 29 (76.3%) | 9 (23.7%) |
| Total (Category) | 272 (39.9%) | 409 (60.1%) |
| Total (Overall) | 1,208 (45.7%) | 1,436 (54.3%) |
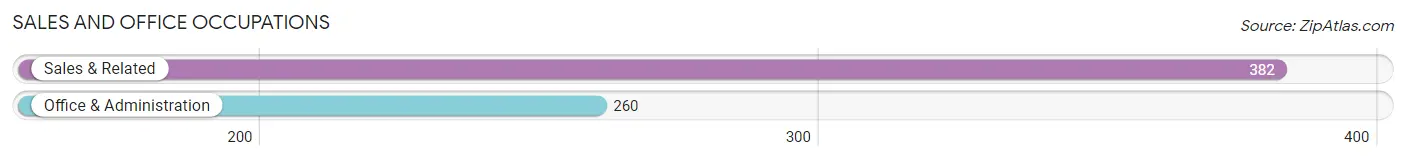
Sales and Office Occupations
The most common Sales and Office occupations in Newport are Sales & Related (382 | 14.4%), and Office & Administration (260 | 9.8%).
Sales and Office Occupations by Sex
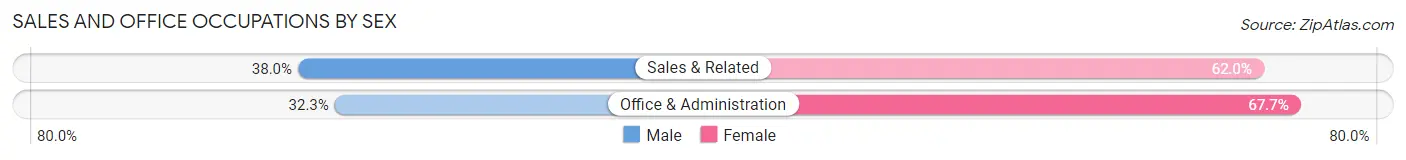
| Occupation | Male | Female |
| Sales & Related | 145 (38.0%) | 237 (62.0%) |
| Office & Administration | 84 (32.3%) | 176 (67.7%) |
| Total (Category) | 229 (35.7%) | 413 (64.3%) |
| Total (Overall) | 1,208 (45.7%) | 1,436 (54.3%) |
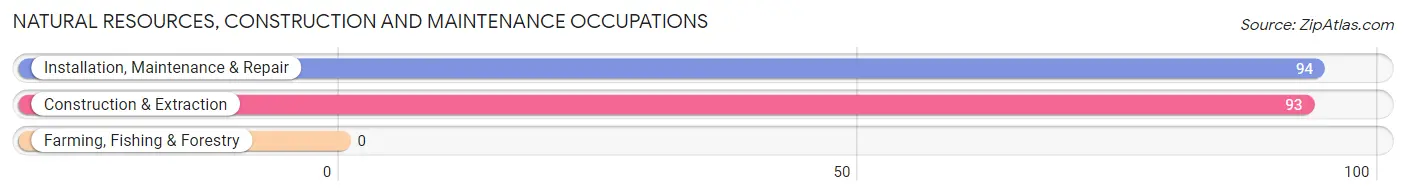
Natural Resources, Construction and Maintenance Occupations
The most common Natural Resources, Construction and Maintenance occupations in Newport are Installation, Maintenance & Repair (94 | 3.6%), and Construction & Extraction (93 | 3.5%).
Natural Resources, Construction and Maintenance Occupations by Sex
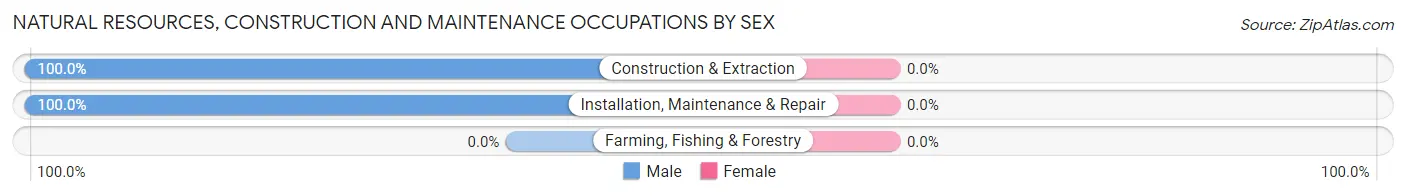
| Occupation | Male | Female |
| Farming, Fishing & Forestry | 0 (0.0%) | 0 (0.0%) |
| Construction & Extraction | 93 (100.0%) | 0 (0.0%) |
| Installation, Maintenance & Repair | 94 (100.0%) | 0 (0.0%) |
| Total (Category) | 187 (100.0%) | 0 (0.0%) |
| Total (Overall) | 1,208 (45.7%) | 1,436 (54.3%) |
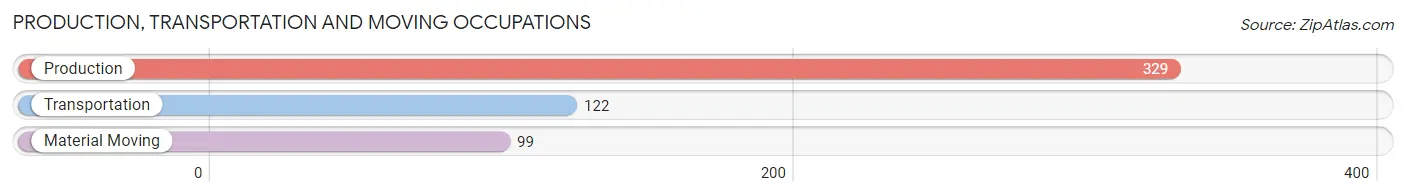
Production, Transportation and Moving Occupations
The most common Production, Transportation and Moving occupations in Newport are Production (329 | 12.4%), Transportation (122 | 4.6%), and Material Moving (99 | 3.7%).
Production, Transportation and Moving Occupations by Sex
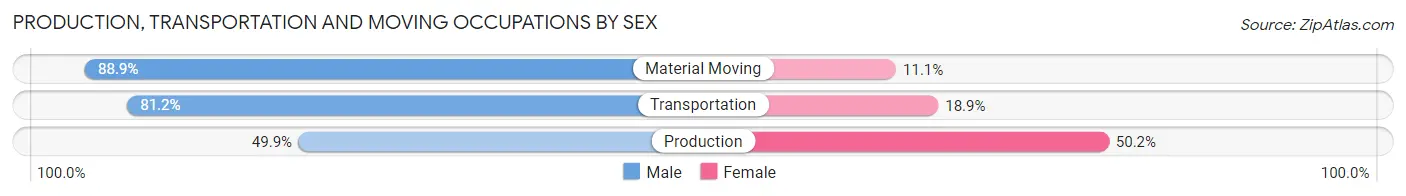
| Occupation | Male | Female |
| Production | 164 (49.8%) | 165 (50.1%) |
| Transportation | 99 (81.1%) | 23 (18.9%) |
| Material Moving | 88 (88.9%) | 11 (11.1%) |
| Total (Category) | 351 (63.8%) | 199 (36.2%) |
| Total (Overall) | 1,208 (45.7%) | 1,436 (54.3%) |
Employment Industries by Sex in Newport
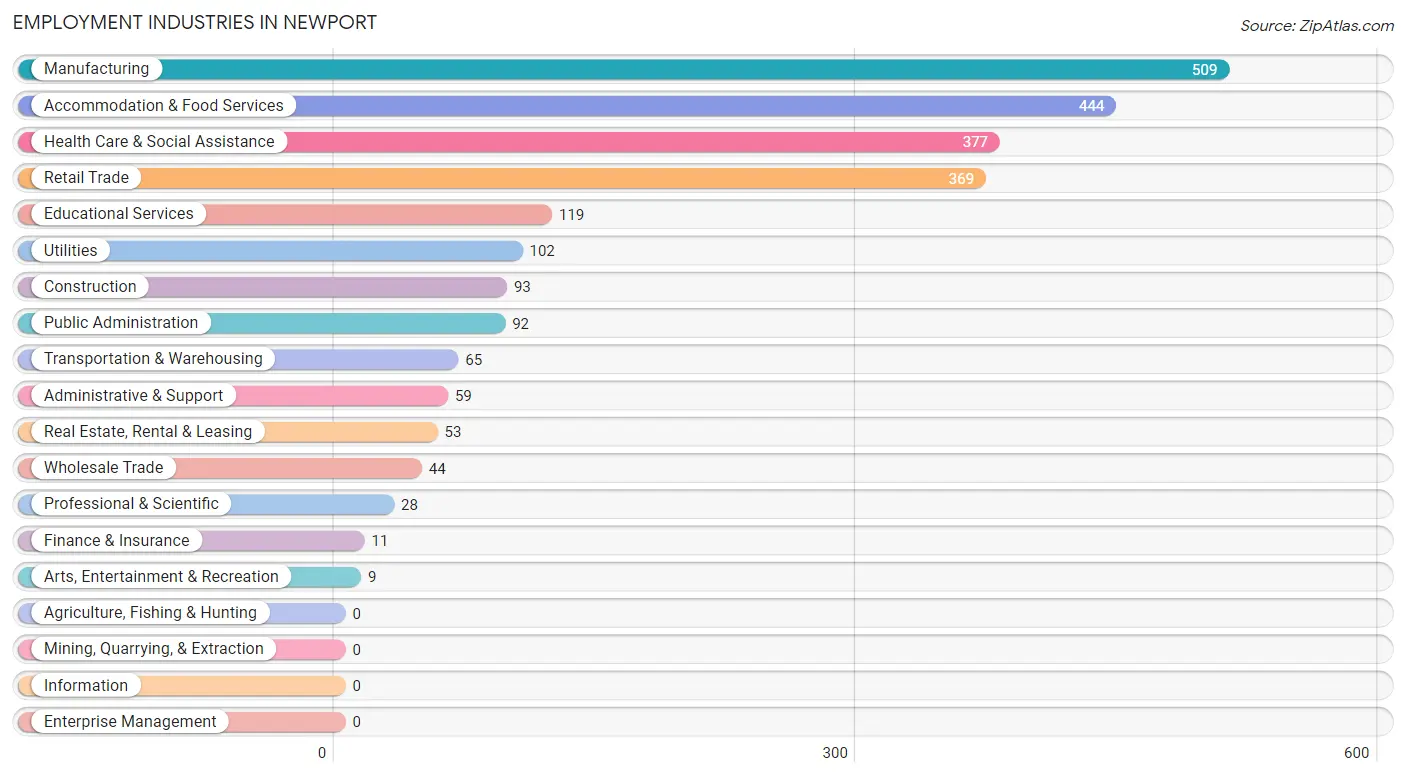
Employment Industries in Newport
The major employment industries in Newport include Manufacturing (509 | 19.3%), Accommodation & Food Services (444 | 16.8%), Health Care & Social Assistance (377 | 14.3%), Retail Trade (369 | 14.0%), and Educational Services (119 | 4.5%).
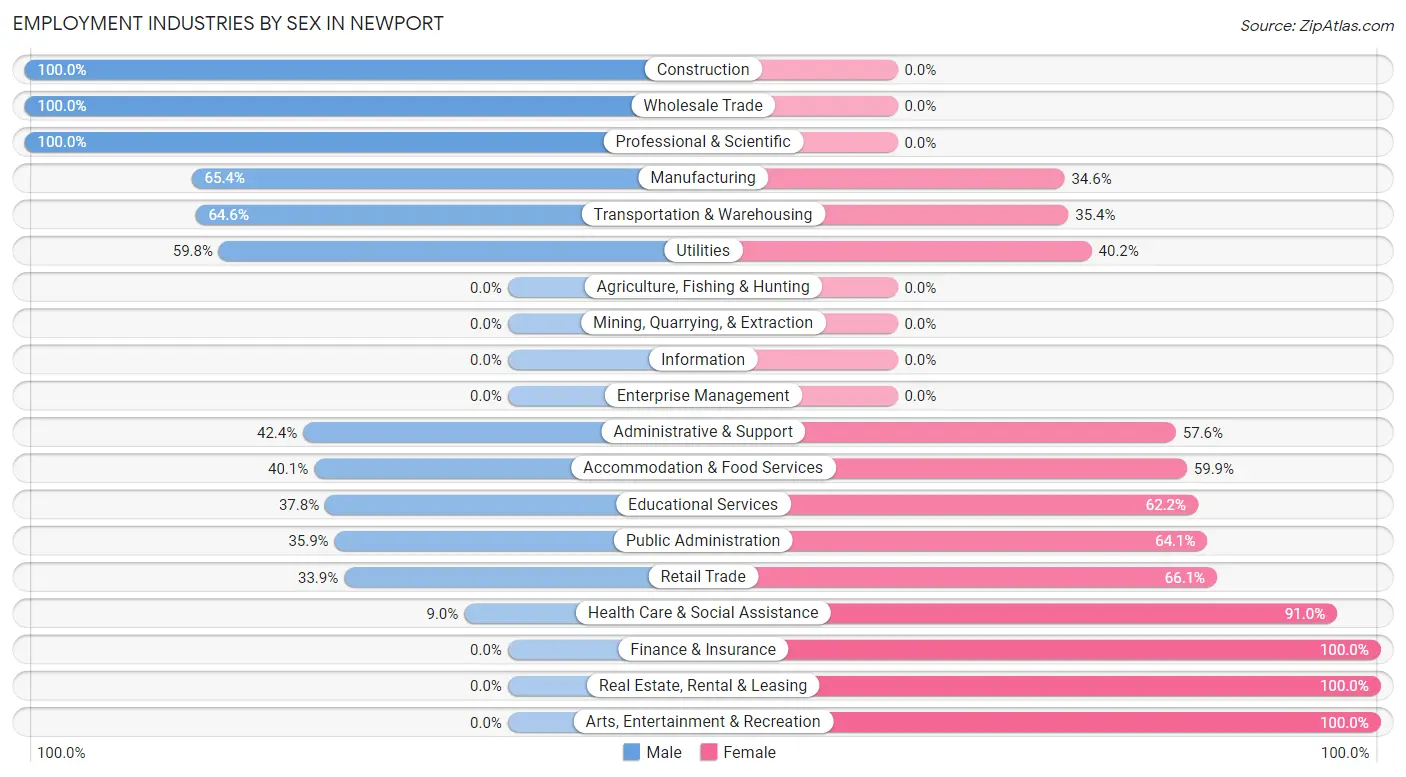
Employment Industries by Sex in Newport
The Newport industries that see more men than women are Construction (100.0%), Wholesale Trade (100.0%), and Professional & Scientific (100.0%), whereas the industries that tend to have a higher number of women are Finance & Insurance (100.0%), Real Estate, Rental & Leasing (100.0%), and Arts, Entertainment & Recreation (100.0%).
| Industry | Male | Female |
| Agriculture, Fishing & Hunting | 0 (0.0%) | 0 (0.0%) |
| Mining, Quarrying, & Extraction | 0 (0.0%) | 0 (0.0%) |
| Construction | 93 (100.0%) | 0 (0.0%) |
| Manufacturing | 333 (65.4%) | 176 (34.6%) |
| Wholesale Trade | 44 (100.0%) | 0 (0.0%) |
| Retail Trade | 125 (33.9%) | 244 (66.1%) |
| Transportation & Warehousing | 42 (64.6%) | 23 (35.4%) |
| Utilities | 61 (59.8%) | 41 (40.2%) |
| Information | 0 (0.0%) | 0 (0.0%) |
| Finance & Insurance | 0 (0.0%) | 11 (100.0%) |
| Real Estate, Rental & Leasing | 0 (0.0%) | 53 (100.0%) |
| Professional & Scientific | 28 (100.0%) | 0 (0.0%) |
| Enterprise Management | 0 (0.0%) | 0 (0.0%) |
| Administrative & Support | 25 (42.4%) | 34 (57.6%) |
| Educational Services | 45 (37.8%) | 74 (62.2%) |
| Health Care & Social Assistance | 34 (9.0%) | 343 (91.0%) |
| Arts, Entertainment & Recreation | 0 (0.0%) | 9 (100.0%) |
| Accommodation & Food Services | 178 (40.1%) | 266 (59.9%) |
| Public Administration | 33 (35.9%) | 59 (64.1%) |
| Total | 1,208 (45.7%) | 1,436 (54.3%) |
Education in Newport
School Enrollment in Newport
The most common levels of schooling among the 1,255 students in Newport are high school (334 | 26.6%), middle school (296 | 23.6%), and elementary school (289 | 23.0%).
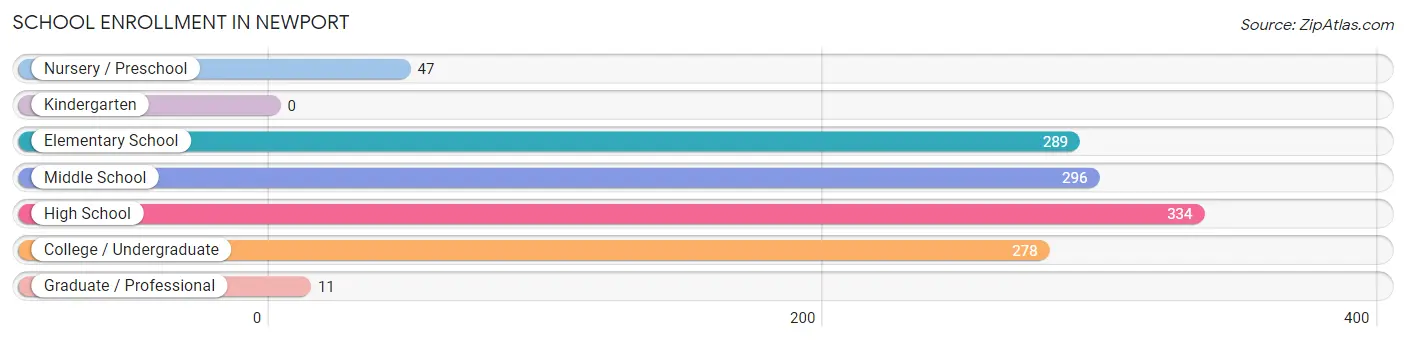
| School Level | # Students | % Students |
| Nursery / Preschool | 47 | 3.7% |
| Kindergarten | 0 | 0.0% |
| Elementary School | 289 | 23.0% |
| Middle School | 296 | 23.6% |
| High School | 334 | 26.6% |
| College / Undergraduate | 278 | 22.2% |
| Graduate / Professional | 11 | 0.9% |
| Total | 1,255 | 100.0% |
School Enrollment by Age by Funding Source in Newport
Out of a total of 1,255 students who are enrolled in schools in Newport, 85 (6.8%) attend a private institution, while the remaining 1,170 (93.2%) are enrolled in public schools. The age group of 35 years and over has the highest likelihood of being enrolled in private schools, with 19 (36.5% in the age bracket) enrolled. Conversely, the age group of 3 to 4 year olds has the lowest likelihood of being enrolled in a private school, with 33 (100.0% in the age bracket) attending a public institution.
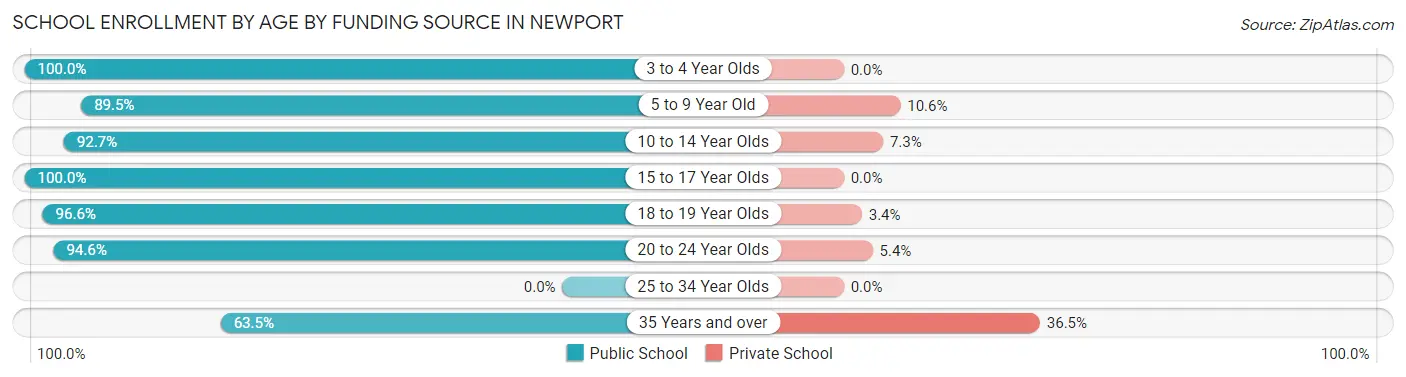
| Age Bracket | Public School | Private School |
| 3 to 4 Year Olds | 33 (100.0%) | 0 (0.0%) |
| 5 to 9 Year Old | 195 (89.4%) | 23 (10.5%) |
| 10 to 14 Year Olds | 367 (92.7%) | 29 (7.3%) |
| 15 to 17 Year Olds | 263 (100.0%) | 0 (0.0%) |
| 18 to 19 Year Olds | 86 (96.6%) | 3 (3.4%) |
| 20 to 24 Year Olds | 193 (94.6%) | 11 (5.4%) |
| 25 to 34 Year Olds | 0 (0.0%) | 0 (0.0%) |
| 35 Years and over | 33 (63.5%) | 19 (36.5%) |
| Total | 1,170 (93.2%) | 85 (6.8%) |
Educational Attainment by Field of Study in Newport
Education (99 | 16.5%), science & technology (90 | 15.0%), liberal arts & history (78 | 13.0%), engineering (77 | 12.9%), and visual & performing arts (73 | 12.2%) are the most common fields of study among 599 individuals in Newport who have obtained a bachelor's degree or higher.
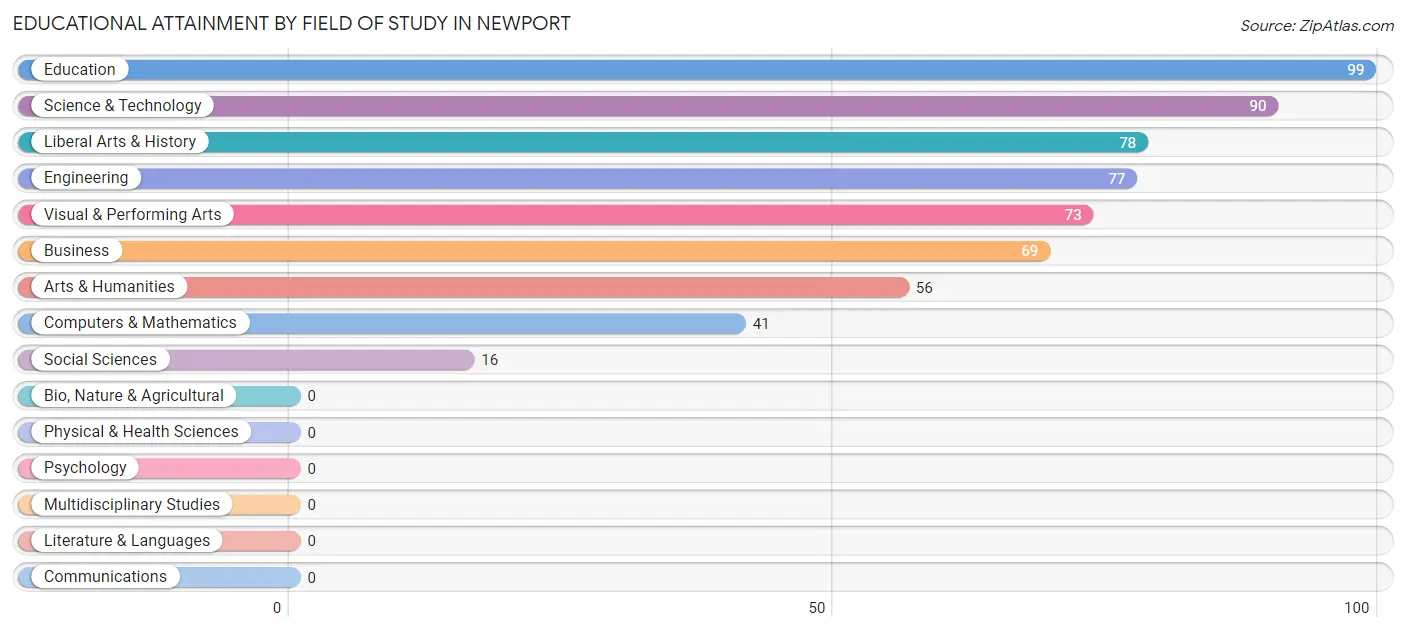
| Field of Study | # Graduates | % Graduates |
| Computers & Mathematics | 41 | 6.8% |
| Bio, Nature & Agricultural | 0 | 0.0% |
| Physical & Health Sciences | 0 | 0.0% |
| Psychology | 0 | 0.0% |
| Social Sciences | 16 | 2.7% |
| Engineering | 77 | 12.9% |
| Multidisciplinary Studies | 0 | 0.0% |
| Science & Technology | 90 | 15.0% |
| Business | 69 | 11.5% |
| Education | 99 | 16.5% |
| Literature & Languages | 0 | 0.0% |
| Liberal Arts & History | 78 | 13.0% |
| Visual & Performing Arts | 73 | 12.2% |
| Communications | 0 | 0.0% |
| Arts & Humanities | 56 | 9.3% |
| Total | 599 | 100.0% |
Transportation & Commute in Newport
Vehicle Availability by Sex in Newport
The most prevalent vehicle ownership categories in Newport are males with 2 vehicles (560, accounting for 46.4%) and females with 2 vehicles (705, making up 39.0%).
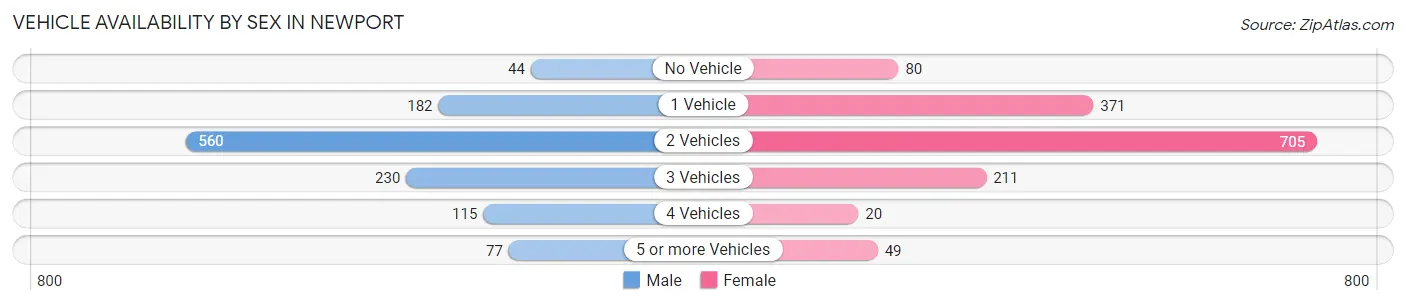
| Vehicles Available | Male | Female |
| No Vehicle | 44 (3.6%) | 80 (5.6%) |
| 1 Vehicle | 182 (15.1%) | 371 (25.8%) |
| 2 Vehicles | 560 (46.4%) | 705 (49.1%) |
| 3 Vehicles | 230 (19.0%) | 211 (14.7%) |
| 4 Vehicles | 115 (9.5%) | 20 (1.4%) |
| 5 or more Vehicles | 77 (6.4%) | 49 (3.4%) |
| Total | 1,208 (100.0%) | 1,436 (100.0%) |
Commute Time in Newport
The most frequently occuring commute durations in Newport are 5 to 9 minutes (422 commuters, 17.1%), 10 to 14 minutes (385 commuters, 15.6%), and less than 5 minutes (270 commuters, 11.0%).
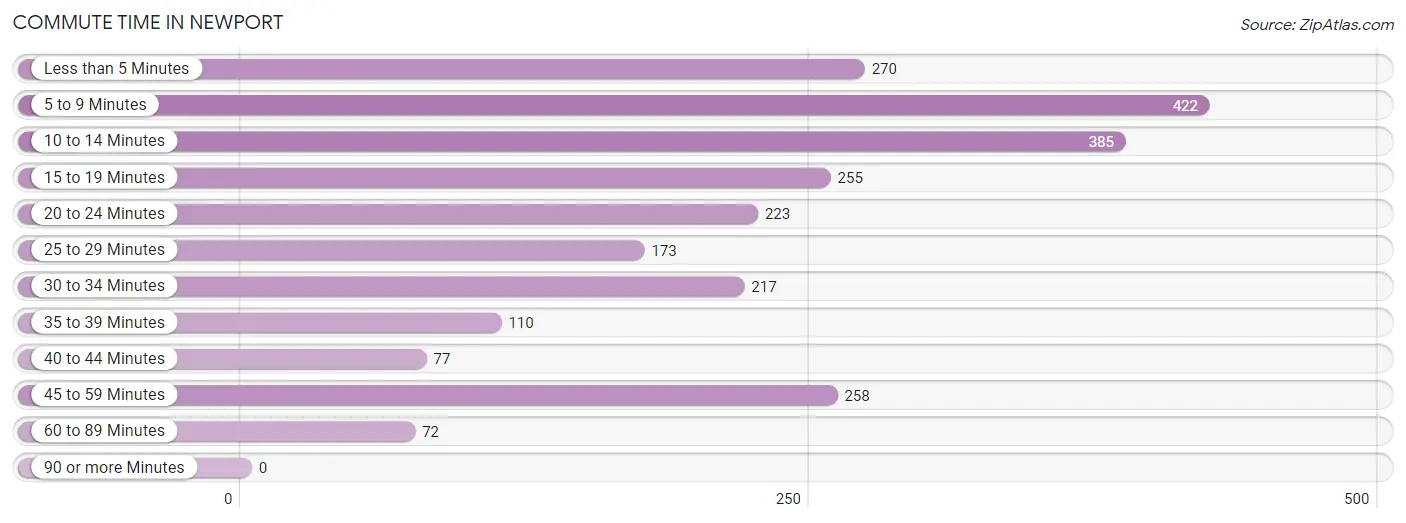
| Commute Time | # Commuters | % Commuters |
| Less than 5 Minutes | 270 | 11.0% |
| 5 to 9 Minutes | 422 | 17.1% |
| 10 to 14 Minutes | 385 | 15.6% |
| 15 to 19 Minutes | 255 | 10.4% |
| 20 to 24 Minutes | 223 | 9.1% |
| 25 to 29 Minutes | 173 | 7.0% |
| 30 to 34 Minutes | 217 | 8.8% |
| 35 to 39 Minutes | 110 | 4.5% |
| 40 to 44 Minutes | 77 | 3.1% |
| 45 to 59 Minutes | 258 | 10.5% |
| 60 to 89 Minutes | 72 | 2.9% |
| 90 or more Minutes | 0 | 0.0% |
Commute Time by Sex in Newport
The most common commute times in Newport are 15 to 19 minutes (184 commuters, 16.3%) for males and 5 to 9 minutes (383 commuters, 28.7%) for females.
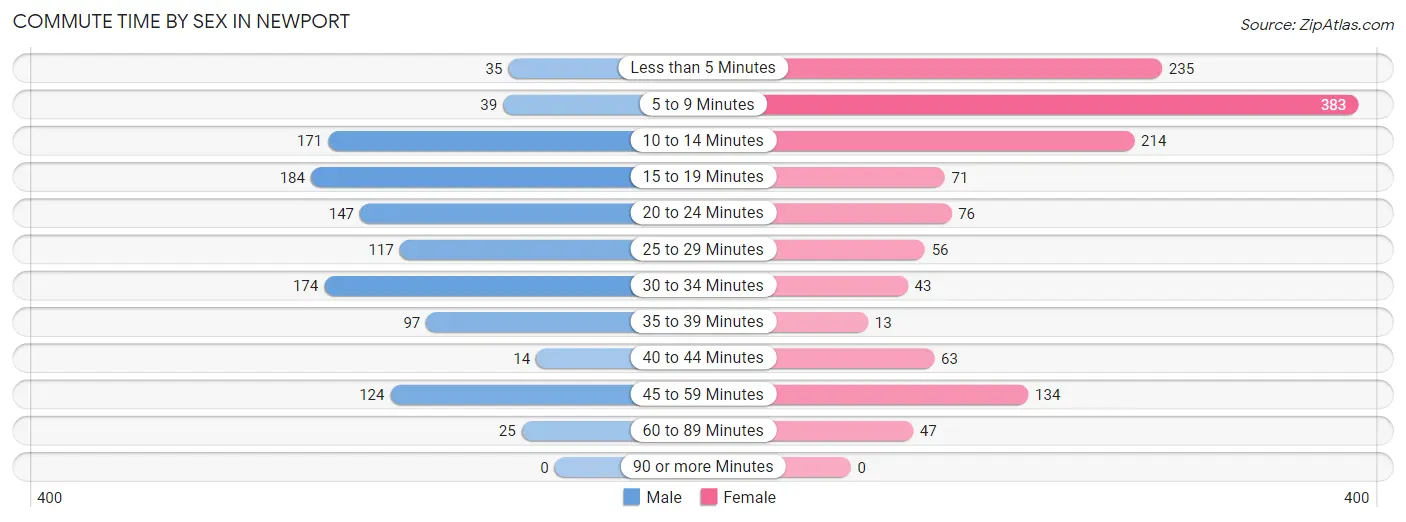
| Commute Time | Male | Female |
| Less than 5 Minutes | 35 (3.1%) | 235 (17.6%) |
| 5 to 9 Minutes | 39 (3.5%) | 383 (28.7%) |
| 10 to 14 Minutes | 171 (15.2%) | 214 (16.0%) |
| 15 to 19 Minutes | 184 (16.3%) | 71 (5.3%) |
| 20 to 24 Minutes | 147 (13.0%) | 76 (5.7%) |
| 25 to 29 Minutes | 117 (10.4%) | 56 (4.2%) |
| 30 to 34 Minutes | 174 (15.4%) | 43 (3.2%) |
| 35 to 39 Minutes | 97 (8.6%) | 13 (1.0%) |
| 40 to 44 Minutes | 14 (1.2%) | 63 (4.7%) |
| 45 to 59 Minutes | 124 (11.0%) | 134 (10.0%) |
| 60 to 89 Minutes | 25 (2.2%) | 47 (3.5%) |
| 90 or more Minutes | 0 (0.0%) | 0 (0.0%) |
Time of Departure to Work by Sex in Newport
The most frequent times of departure to work in Newport are 12:00 AM to 4:59 AM (214, 19.0%) for males and 12:00 PM to 3:59 PM (315, 23.6%) for females.
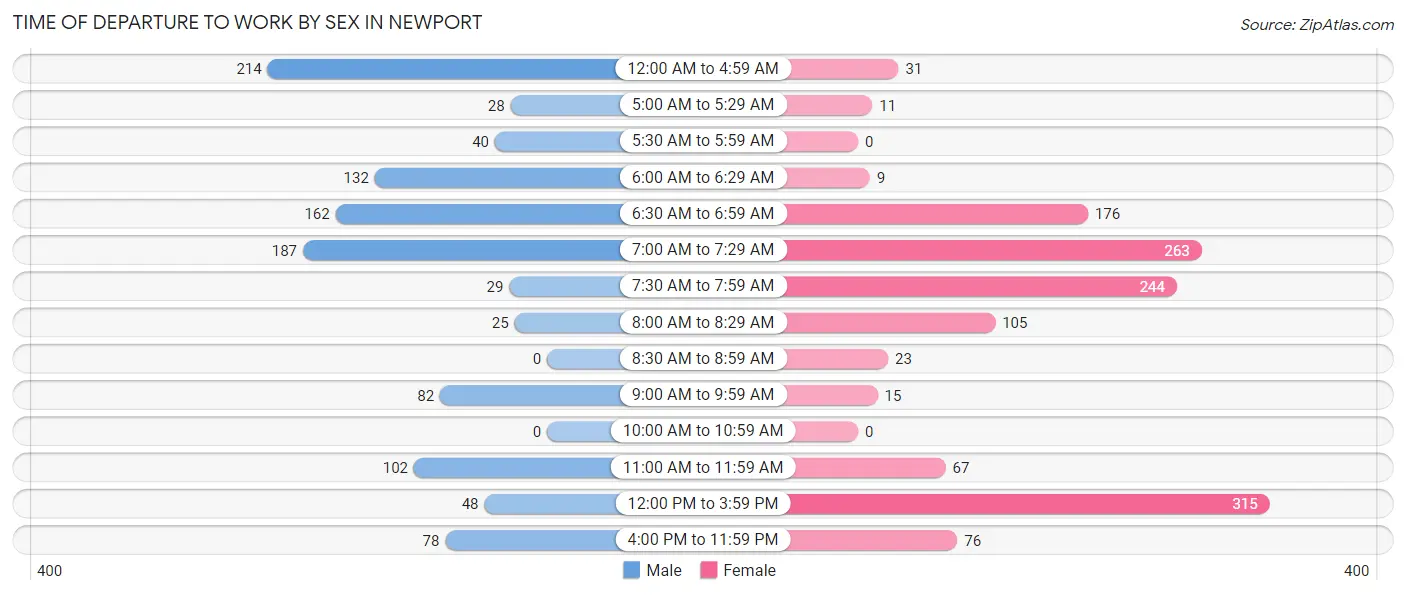
| Time of Departure | Male | Female |
| 12:00 AM to 4:59 AM | 214 (19.0%) | 31 (2.3%) |
| 5:00 AM to 5:29 AM | 28 (2.5%) | 11 (0.8%) |
| 5:30 AM to 5:59 AM | 40 (3.5%) | 0 (0.0%) |
| 6:00 AM to 6:29 AM | 132 (11.7%) | 9 (0.7%) |
| 6:30 AM to 6:59 AM | 162 (14.4%) | 176 (13.2%) |
| 7:00 AM to 7:29 AM | 187 (16.6%) | 263 (19.7%) |
| 7:30 AM to 7:59 AM | 29 (2.6%) | 244 (18.3%) |
| 8:00 AM to 8:29 AM | 25 (2.2%) | 105 (7.9%) |
| 8:30 AM to 8:59 AM | 0 (0.0%) | 23 (1.7%) |
| 9:00 AM to 9:59 AM | 82 (7.3%) | 15 (1.1%) |
| 10:00 AM to 10:59 AM | 0 (0.0%) | 0 (0.0%) |
| 11:00 AM to 11:59 AM | 102 (9.0%) | 67 (5.0%) |
| 12:00 PM to 3:59 PM | 48 (4.3%) | 315 (23.6%) |
| 4:00 PM to 11:59 PM | 78 (6.9%) | 76 (5.7%) |
| Total | 1,127 (100.0%) | 1,335 (100.0%) |
Housing Occupancy in Newport
Occupancy by Ownership in Newport
Of the total 2,862 dwellings in Newport, owner-occupied units account for 1,521 (53.1%), while renter-occupied units make up 1,341 (46.9%).
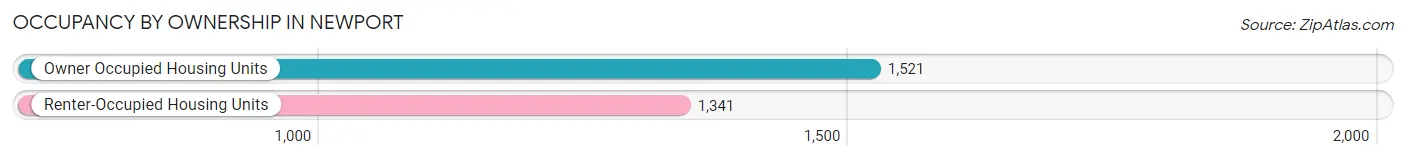
| Occupancy | # Housing Units | % Housing Units |
| Owner Occupied Housing Units | 1,521 | 53.1% |
| Renter-Occupied Housing Units | 1,341 | 46.9% |
| Total Occupied Housing Units | 2,862 | 100.0% |
Occupancy by Household Size in Newport
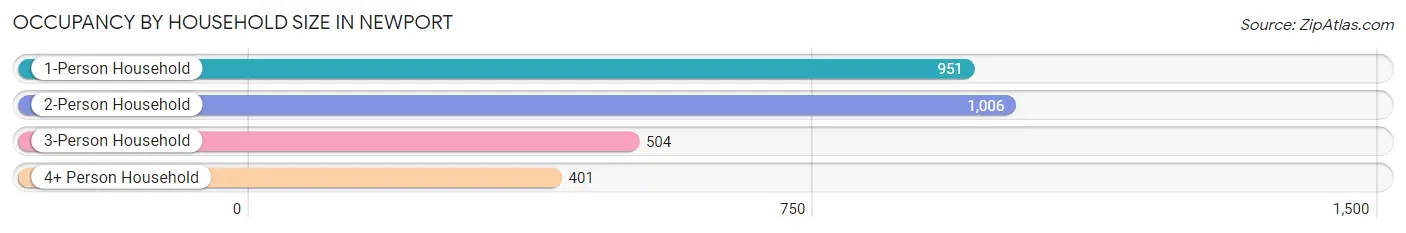
| Household Size | # Housing Units | % Housing Units |
| 1-Person Household | 951 | 33.2% |
| 2-Person Household | 1,006 | 35.1% |
| 3-Person Household | 504 | 17.6% |
| 4+ Person Household | 401 | 14.0% |
| Total Housing Units | 2,862 | 100.0% |
Occupancy by Ownership by Household Size in Newport
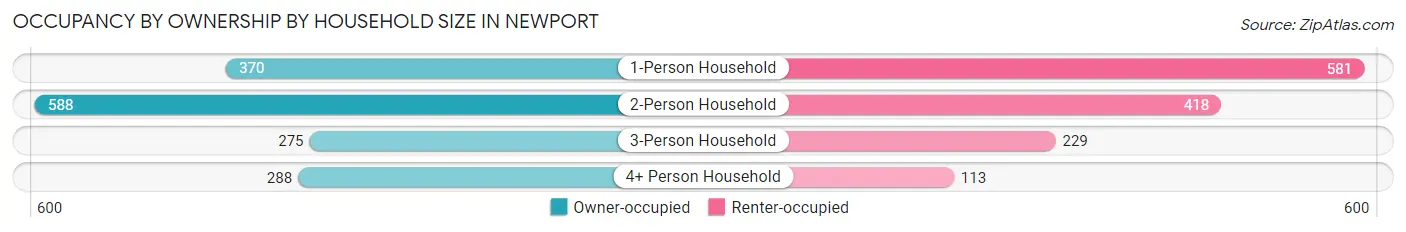
| Household Size | Owner-occupied | Renter-occupied |
| 1-Person Household | 370 (38.9%) | 581 (61.1%) |
| 2-Person Household | 588 (58.5%) | 418 (41.5%) |
| 3-Person Household | 275 (54.6%) | 229 (45.4%) |
| 4+ Person Household | 288 (71.8%) | 113 (28.2%) |
| Total Housing Units | 1,521 (53.1%) | 1,341 (46.9%) |
Occupancy by Educational Attainment in Newport
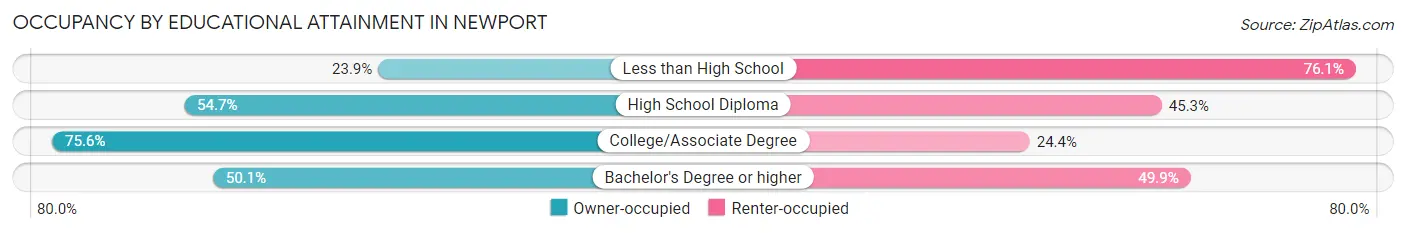
| Household Size | Owner-occupied | Renter-occupied |
| Less than High School | 151 (23.9%) | 480 (76.1%) |
| High School Diploma | 595 (54.7%) | 493 (45.3%) |
| College/Associate Degree | 599 (75.6%) | 193 (24.4%) |
| Bachelor's Degree or higher | 176 (50.1%) | 175 (49.9%) |
Occupancy by Age of Householder in Newport
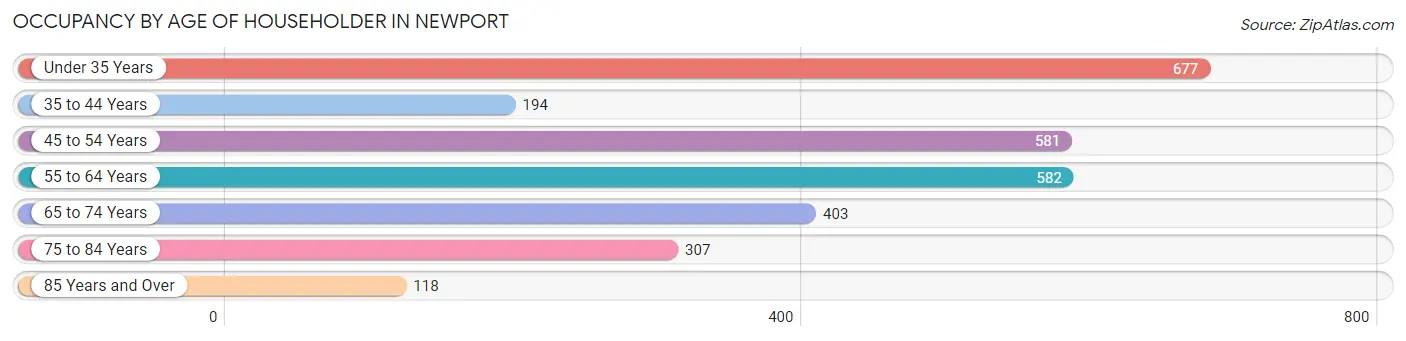
| Age Bracket | # Households | % Households |
| Under 35 Years | 677 | 23.6% |
| 35 to 44 Years | 194 | 6.8% |
| 45 to 54 Years | 581 | 20.3% |
| 55 to 64 Years | 582 | 20.3% |
| 65 to 74 Years | 403 | 14.1% |
| 75 to 84 Years | 307 | 10.7% |
| 85 Years and Over | 118 | 4.1% |
| Total | 2,862 | 100.0% |
Housing Finances in Newport
Median Income by Occupancy in Newport
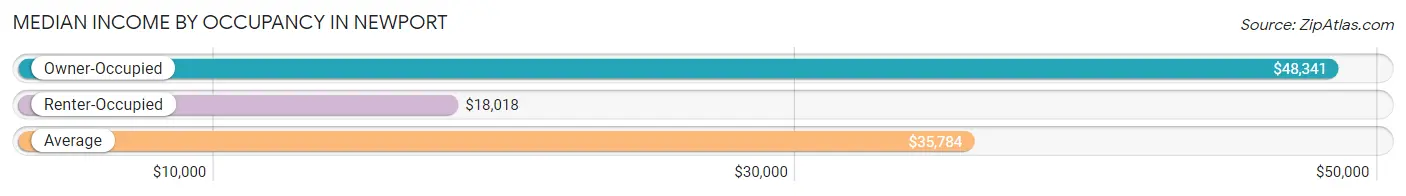
| Occupancy Type | # Households | Median Income |
| Owner-Occupied | 1,521 (53.1%) | $48,341 |
| Renter-Occupied | 1,341 (46.9%) | $18,018 |
| Average | 2,862 (100.0%) | $35,784 |
Occupancy by Householder Income Bracket in Newport
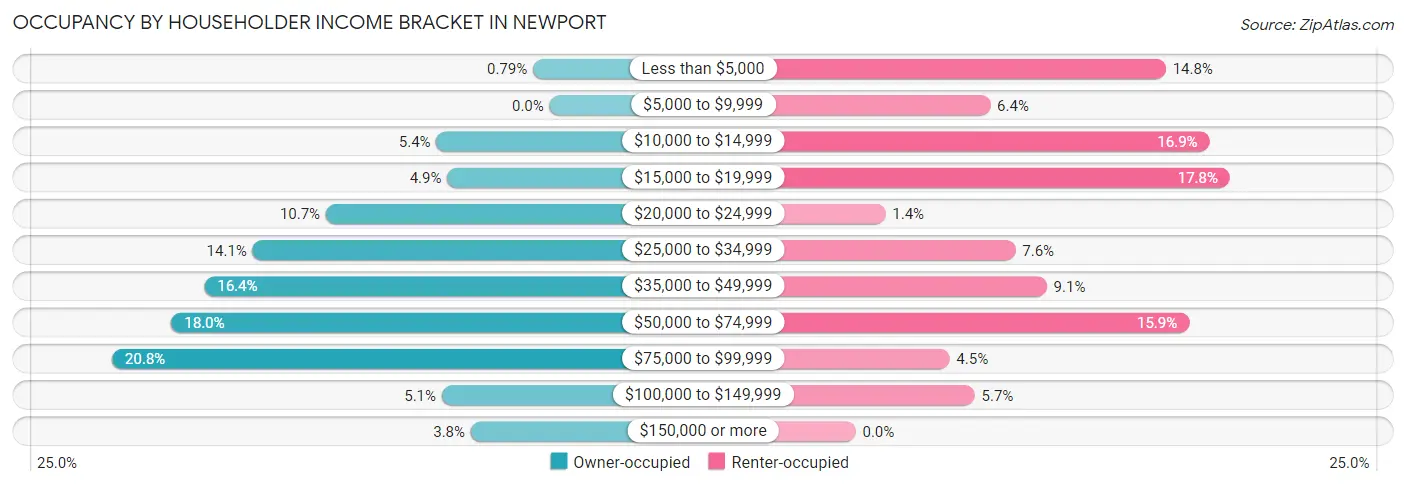
| Income Bracket | Owner-occupied | Renter-occupied |
| Less than $5,000 | 12 (0.8%) | 198 (14.8%) |
| $5,000 to $9,999 | 0 (0.0%) | 86 (6.4%) |
| $10,000 to $14,999 | 82 (5.4%) | 226 (16.9%) |
| $15,000 to $19,999 | 74 (4.9%) | 239 (17.8%) |
| $20,000 to $24,999 | 162 (10.6%) | 19 (1.4%) |
| $25,000 to $34,999 | 215 (14.1%) | 102 (7.6%) |
| $35,000 to $49,999 | 250 (16.4%) | 122 (9.1%) |
| $50,000 to $74,999 | 274 (18.0%) | 213 (15.9%) |
| $75,000 to $99,999 | 317 (20.8%) | 60 (4.5%) |
| $100,000 to $149,999 | 78 (5.1%) | 76 (5.7%) |
| $150,000 or more | 57 (3.7%) | 0 (0.0%) |
| Total | 1,521 (100.0%) | 1,341 (100.0%) |
Monthly Housing Cost Tiers in Newport
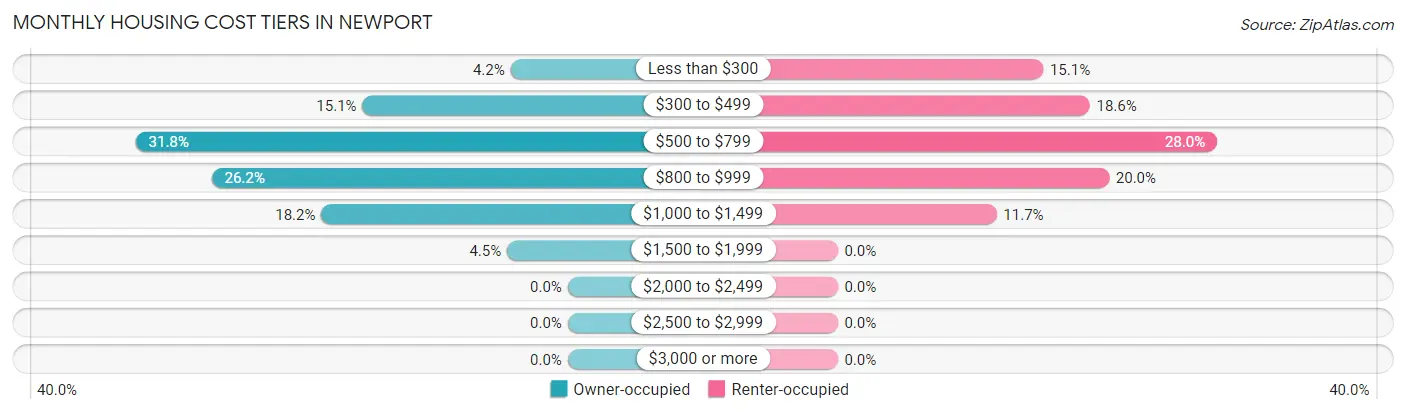
| Monthly Cost | Owner-occupied | Renter-occupied |
| Less than $300 | 64 (4.2%) | 203 (15.1%) |
| $300 to $499 | 230 (15.1%) | 249 (18.6%) |
| $500 to $799 | 484 (31.8%) | 375 (28.0%) |
| $800 to $999 | 399 (26.2%) | 268 (20.0%) |
| $1,000 to $1,499 | 276 (18.1%) | 157 (11.7%) |
| $1,500 to $1,999 | 68 (4.5%) | 0 (0.0%) |
| $2,000 to $2,499 | 0 (0.0%) | 0 (0.0%) |
| $2,500 to $2,999 | 0 (0.0%) | 0 (0.0%) |
| $3,000 or more | 0 (0.0%) | 0 (0.0%) |
| Total | 1,521 (100.0%) | 1,341 (100.0%) |
Physical Housing Characteristics in Newport
Housing Structures in Newport
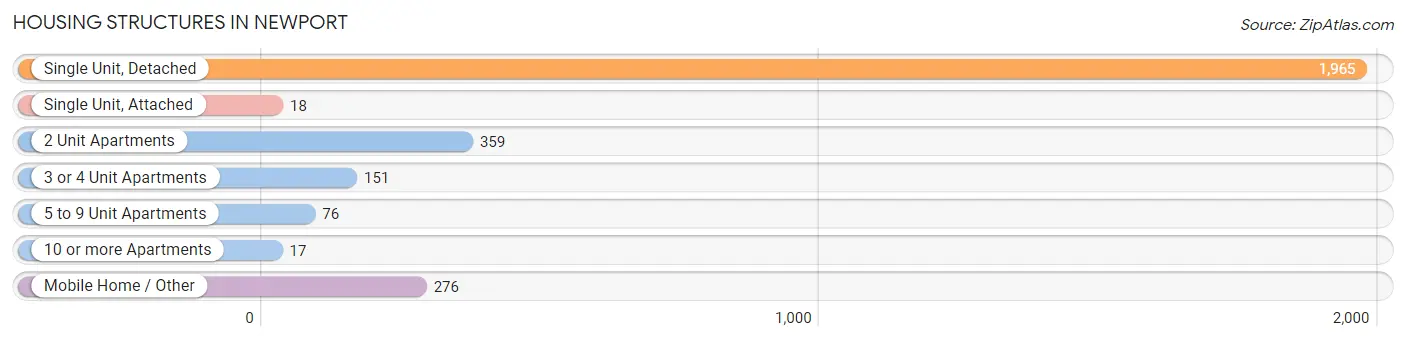
| Structure Type | # Housing Units | % Housing Units |
| Single Unit, Detached | 1,965 | 68.7% |
| Single Unit, Attached | 18 | 0.6% |
| 2 Unit Apartments | 359 | 12.5% |
| 3 or 4 Unit Apartments | 151 | 5.3% |
| 5 to 9 Unit Apartments | 76 | 2.7% |
| 10 or more Apartments | 17 | 0.6% |
| Mobile Home / Other | 276 | 9.6% |
| Total | 2,862 | 100.0% |
Housing Structures by Occupancy in Newport
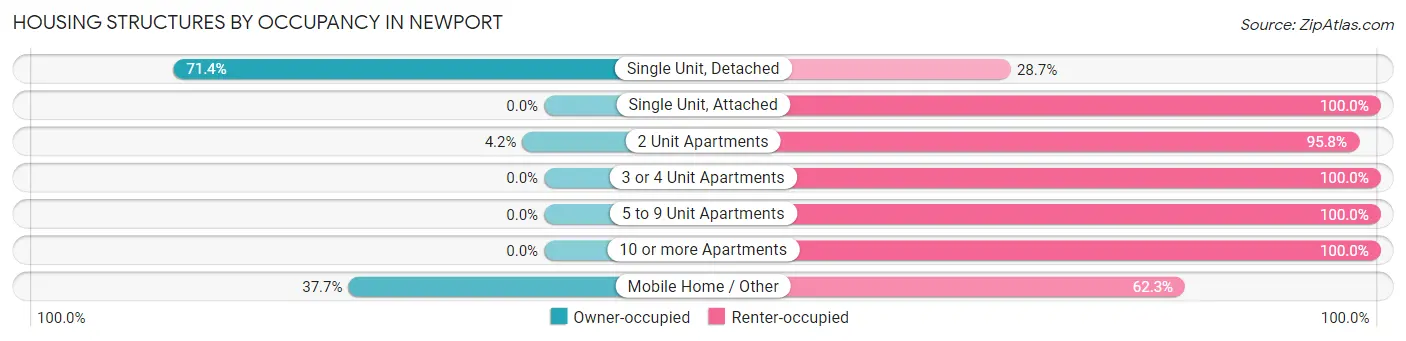
| Structure Type | Owner-occupied | Renter-occupied |
| Single Unit, Detached | 1,402 (71.4%) | 563 (28.6%) |
| Single Unit, Attached | 0 (0.0%) | 18 (100.0%) |
| 2 Unit Apartments | 15 (4.2%) | 344 (95.8%) |
| 3 or 4 Unit Apartments | 0 (0.0%) | 151 (100.0%) |
| 5 to 9 Unit Apartments | 0 (0.0%) | 76 (100.0%) |
| 10 or more Apartments | 0 (0.0%) | 17 (100.0%) |
| Mobile Home / Other | 104 (37.7%) | 172 (62.3%) |
| Total | 1,521 (53.1%) | 1,341 (46.9%) |
Housing Structures by Number of Rooms in Newport
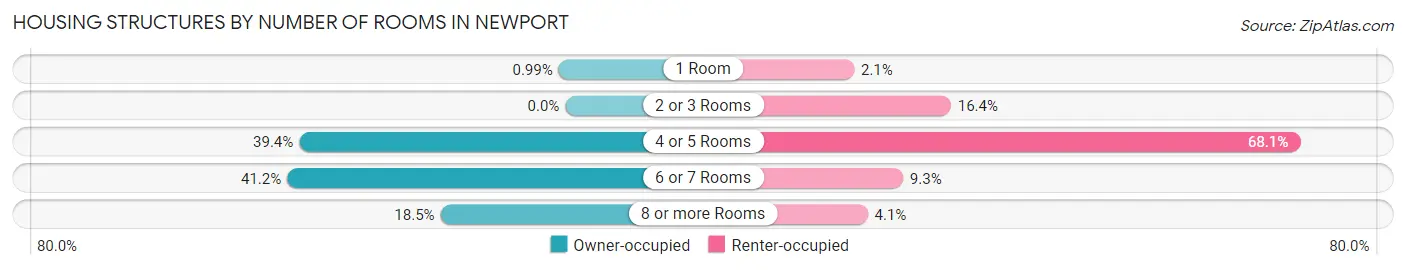
| Number of Rooms | Owner-occupied | Renter-occupied |
| 1 Room | 15 (1.0%) | 28 (2.1%) |
| 2 or 3 Rooms | 0 (0.0%) | 220 (16.4%) |
| 4 or 5 Rooms | 599 (39.4%) | 913 (68.1%) |
| 6 or 7 Rooms | 626 (41.2%) | 125 (9.3%) |
| 8 or more Rooms | 281 (18.5%) | 55 (4.1%) |
| Total | 1,521 (100.0%) | 1,341 (100.0%) |
Housing Structure by Heating Type in Newport
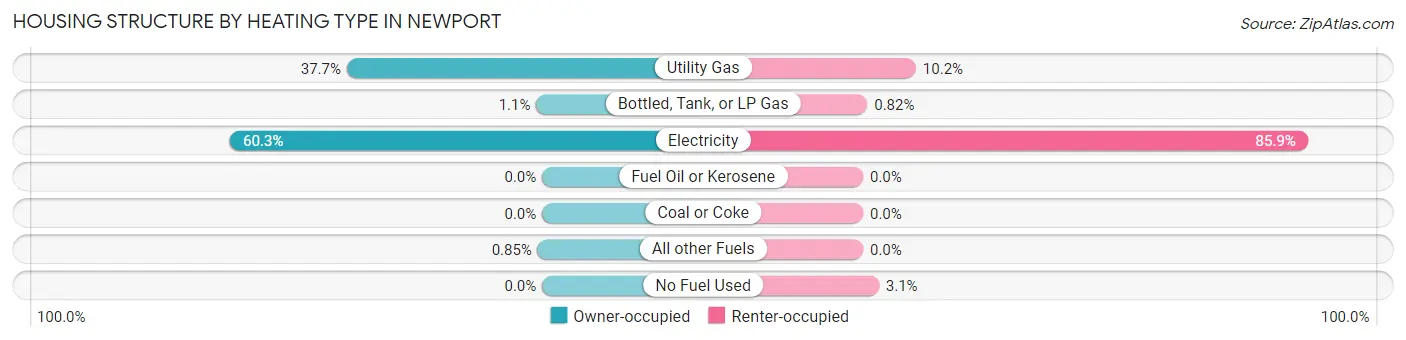
| Heating Type | Owner-occupied | Renter-occupied |
| Utility Gas | 574 (37.7%) | 137 (10.2%) |
| Bottled, Tank, or LP Gas | 17 (1.1%) | 11 (0.8%) |
| Electricity | 917 (60.3%) | 1,152 (85.9%) |
| Fuel Oil or Kerosene | 0 (0.0%) | 0 (0.0%) |
| Coal or Coke | 0 (0.0%) | 0 (0.0%) |
| All other Fuels | 13 (0.9%) | 0 (0.0%) |
| No Fuel Used | 0 (0.0%) | 41 (3.1%) |
| Total | 1,521 (100.0%) | 1,341 (100.0%) |
Household Vehicle Usage in Newport
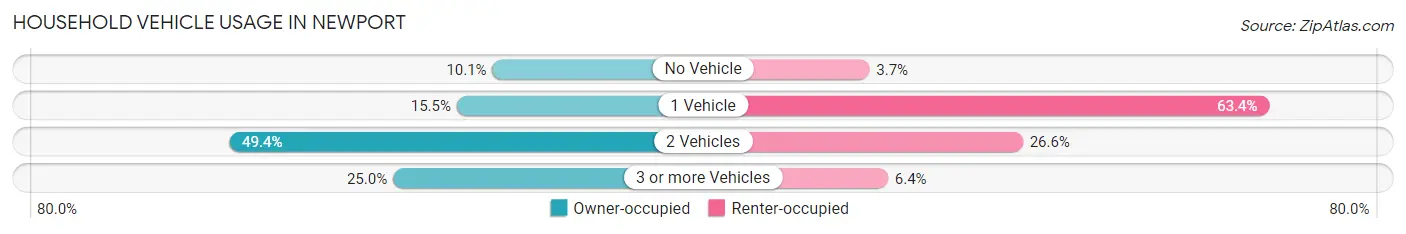
| Vehicles per Household | Owner-occupied | Renter-occupied |
| No Vehicle | 154 (10.1%) | 49 (3.6%) |
| 1 Vehicle | 235 (15.4%) | 850 (63.4%) |
| 2 Vehicles | 752 (49.4%) | 356 (26.6%) |
| 3 or more Vehicles | 380 (25.0%) | 86 (6.4%) |
| Total | 1,521 (100.0%) | 1,341 (100.0%) |
Real Estate & Mortgages in Newport
Real Estate and Mortgage Overview in Newport
| Characteristic | Without Mortgage | With Mortgage |
| Housing Units | 556 | 965 |
| Median Property Value | $120,700 | $126,600 |
| Median Household Income | $35,962 | $17 |
| Monthly Housing Costs | $467 | $0 |
| Real Estate Taxes | $1,160 | $15 |
Property Value by Mortgage Status in Newport
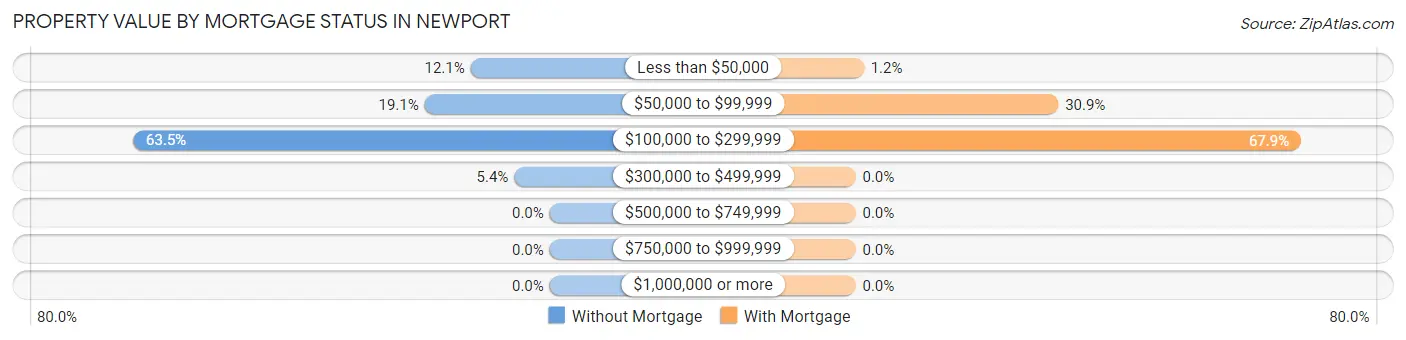
| Property Value | Without Mortgage | With Mortgage |
| Less than $50,000 | 67 (12.0%) | 12 (1.2%) |
| $50,000 to $99,999 | 106 (19.1%) | 298 (30.9%) |
| $100,000 to $299,999 | 353 (63.5%) | 655 (67.9%) |
| $300,000 to $499,999 | 30 (5.4%) | 0 (0.0%) |
| $500,000 to $749,999 | 0 (0.0%) | 0 (0.0%) |
| $750,000 to $999,999 | 0 (0.0%) | 0 (0.0%) |
| $1,000,000 or more | 0 (0.0%) | 0 (0.0%) |
| Total | 556 (100.0%) | 965 (100.0%) |
Household Income by Mortgage Status in Newport
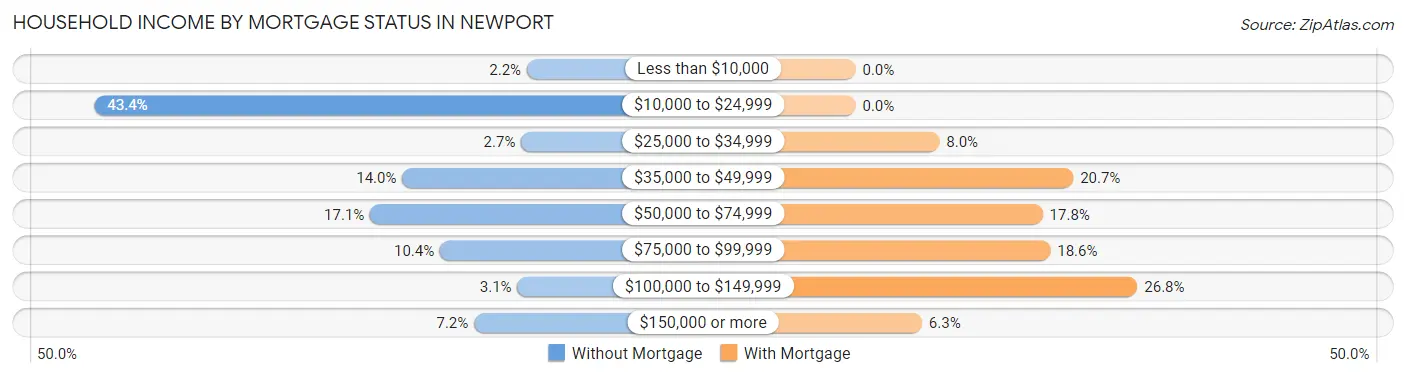
| Household Income | Without Mortgage | With Mortgage |
| Less than $10,000 | 12 (2.2%) | 0 (0.0%) |
| $10,000 to $24,999 | 241 (43.3%) | 0 (0.0%) |
| $25,000 to $34,999 | 15 (2.7%) | 77 (8.0%) |
| $35,000 to $49,999 | 78 (14.0%) | 200 (20.7%) |
| $50,000 to $74,999 | 95 (17.1%) | 172 (17.8%) |
| $75,000 to $99,999 | 58 (10.4%) | 179 (18.5%) |
| $100,000 to $149,999 | 17 (3.1%) | 259 (26.8%) |
| $150,000 or more | 40 (7.2%) | 61 (6.3%) |
| Total | 556 (100.0%) | 965 (100.0%) |
Property Value to Household Income Ratio in Newport
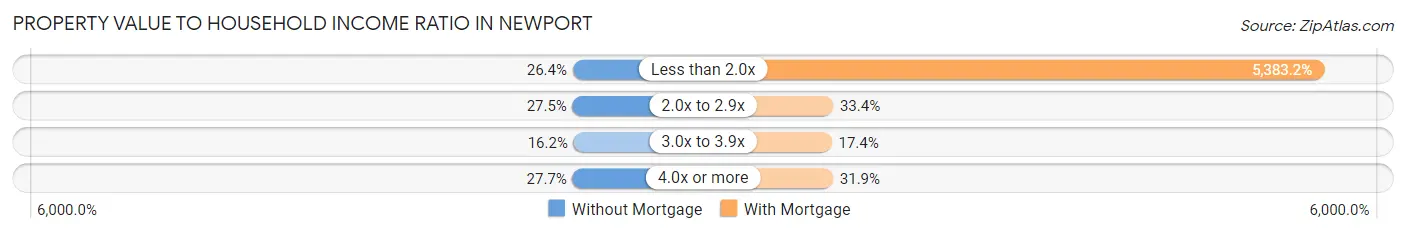
| Value-to-Income Ratio | Without Mortgage | With Mortgage |
| Less than 2.0x | 147 (26.4%) | 51,948 (5,383.2%) |
| 2.0x to 2.9x | 153 (27.5%) | 322 (33.4%) |
| 3.0x to 3.9x | 90 (16.2%) | 168 (17.4%) |
| 4.0x or more | 154 (27.7%) | 308 (31.9%) |
| Total | 556 (100.0%) | 965 (100.0%) |
Real Estate Taxes by Mortgage Status in Newport
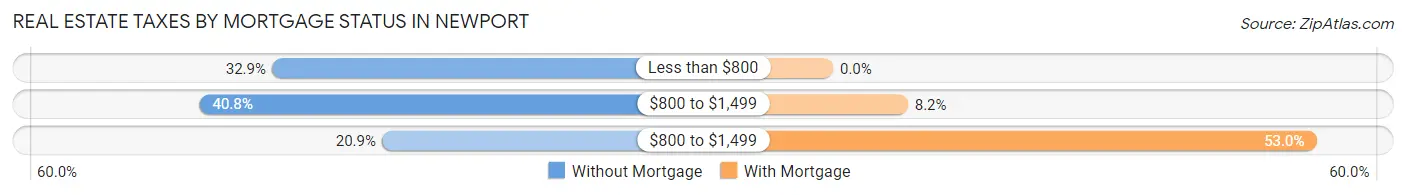
| Property Taxes | Without Mortgage | With Mortgage |
| Less than $800 | 183 (32.9%) | 0 (0.0%) |
| $800 to $1,499 | 227 (40.8%) | 79 (8.2%) |
| $800 to $1,499 | 116 (20.9%) | 511 (52.9%) |
| Total | 556 (100.0%) | 965 (100.0%) |
Health & Disability in Newport
Health Insurance Coverage by Age in Newport
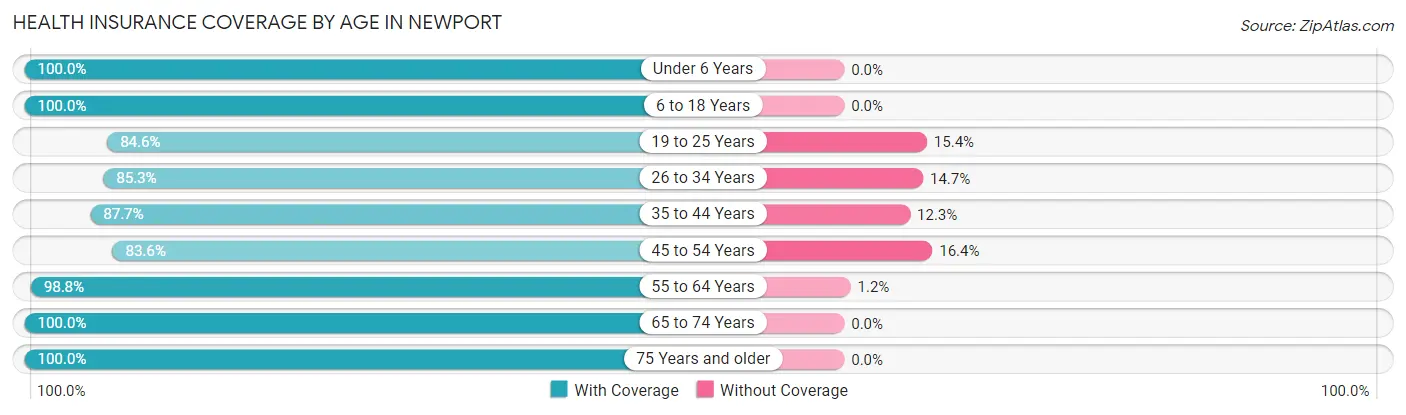
| Age Bracket | With Coverage | Without Coverage |
| Under 6 Years | 710 (100.0%) | 0 (0.0%) |
| 6 to 18 Years | 940 (100.0%) | 0 (0.0%) |
| 19 to 25 Years | 626 (84.6%) | 114 (15.4%) |
| 26 to 34 Years | 697 (85.3%) | 120 (14.7%) |
| 35 to 44 Years | 379 (87.7%) | 53 (12.3%) |
| 45 to 54 Years | 718 (83.6%) | 141 (16.4%) |
| 55 to 64 Years | 931 (98.8%) | 11 (1.2%) |
| 65 to 74 Years | 625 (100.0%) | 0 (0.0%) |
| 75 Years and older | 577 (100.0%) | 0 (0.0%) |
| Total | 6,203 (93.4%) | 439 (6.6%) |
Health Insurance Coverage by Citizenship Status in Newport
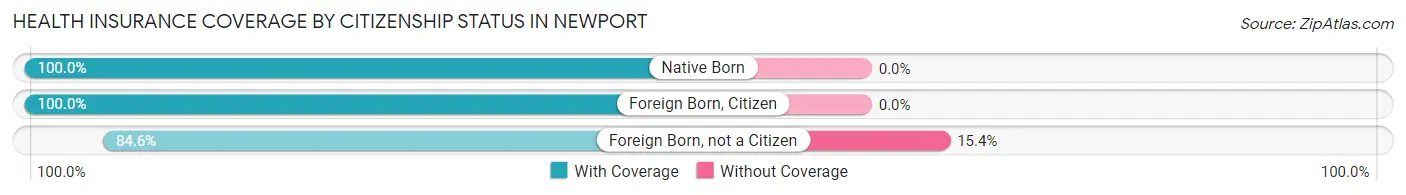
| Citizenship Status | With Coverage | Without Coverage |
| Native Born | 710 (100.0%) | 0 (0.0%) |
| Foreign Born, Citizen | 940 (100.0%) | 0 (0.0%) |
| Foreign Born, not a Citizen | 626 (84.6%) | 114 (15.4%) |
Health Insurance Coverage by Household Income in Newport
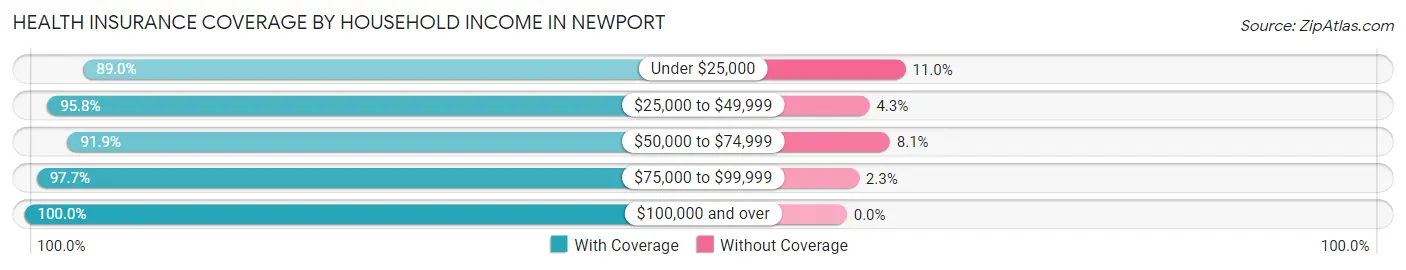
| Household Income | With Coverage | Without Coverage |
| Under $25,000 | 1,794 (89.0%) | 222 (11.0%) |
| $25,000 to $49,999 | 1,735 (95.8%) | 77 (4.3%) |
| $50,000 to $74,999 | 1,025 (91.9%) | 90 (8.1%) |
| $75,000 to $99,999 | 1,119 (97.7%) | 26 (2.3%) |
| $100,000 and over | 517 (100.0%) | 0 (0.0%) |
Public vs Private Health Insurance Coverage by Age in Newport
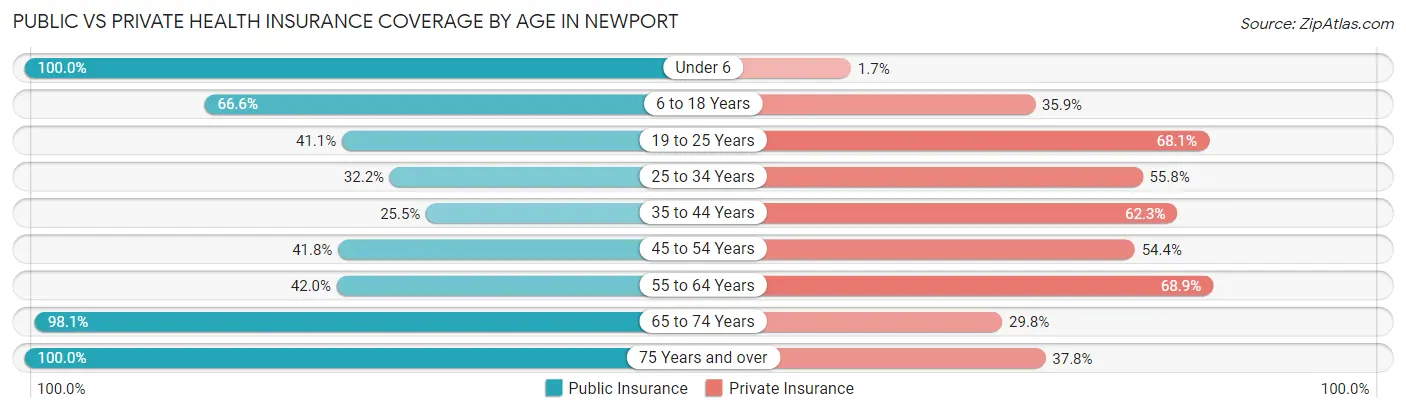
| Age Bracket | Public Insurance | Private Insurance |
| Under 6 | 710 (100.0%) | 12 (1.7%) |
| 6 to 18 Years | 626 (66.6%) | 337 (35.8%) |
| 19 to 25 Years | 304 (41.1%) | 504 (68.1%) |
| 25 to 34 Years | 263 (32.2%) | 456 (55.8%) |
| 35 to 44 Years | 110 (25.5%) | 269 (62.3%) |
| 45 to 54 Years | 359 (41.8%) | 467 (54.4%) |
| 55 to 64 Years | 396 (42.0%) | 649 (68.9%) |
| 65 to 74 Years | 613 (98.1%) | 186 (29.8%) |
| 75 Years and over | 577 (100.0%) | 218 (37.8%) |
| Total | 3,958 (59.6%) | 3,098 (46.6%) |
Disability Status by Sex by Age in Newport
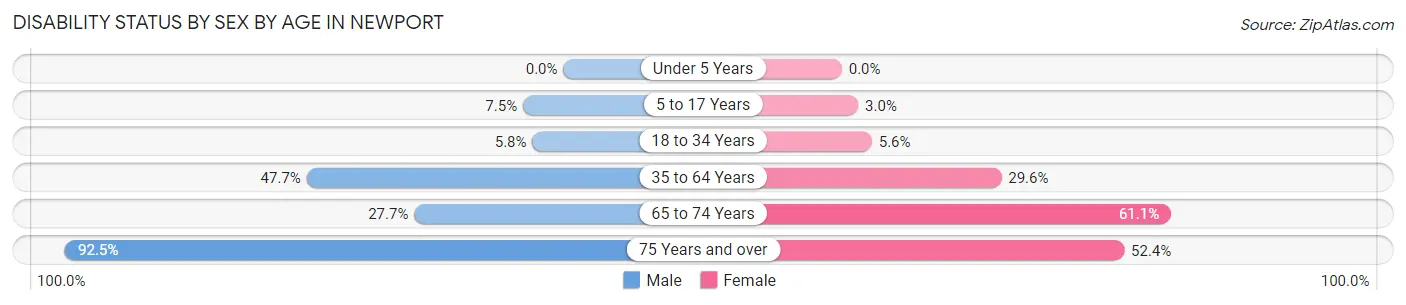
| Age Bracket | Male | Female |
| Under 5 Years | 0 (0.0%) | 0 (0.0%) |
| 5 to 17 Years | 28 (7.5%) | 16 (3.0%) |
| 18 to 34 Years | 42 (5.8%) | 49 (5.6%) |
| 35 to 64 Years | 467 (47.6%) | 371 (29.6%) |
| 65 to 74 Years | 62 (27.7%) | 245 (61.1%) |
| 75 Years and over | 283 (92.5%) | 142 (52.4%) |
Disability Class by Sex by Age in Newport
Disability Class: Hearing Difficulty
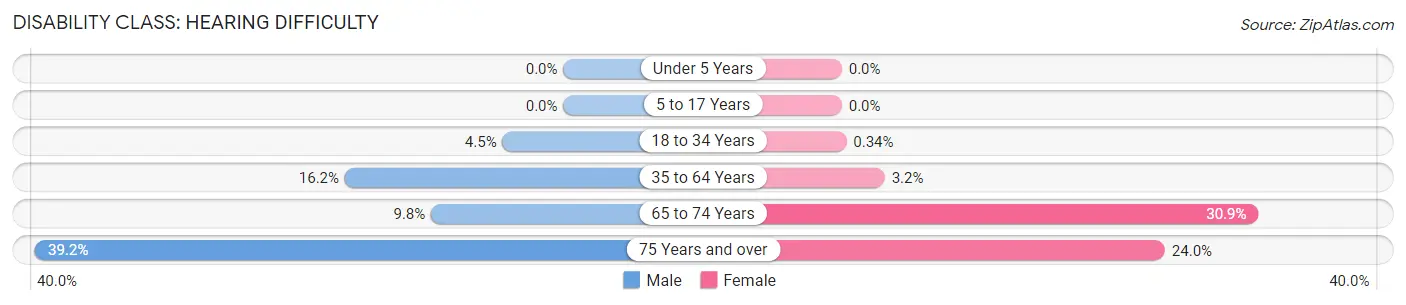
| Age Bracket | Male | Female |
| Under 5 Years | 0 (0.0%) | 0 (0.0%) |
| 5 to 17 Years | 0 (0.0%) | 0 (0.0%) |
| 18 to 34 Years | 33 (4.5%) | 3 (0.3%) |
| 35 to 64 Years | 159 (16.2%) | 40 (3.2%) |
| 65 to 74 Years | 22 (9.8%) | 124 (30.9%) |
| 75 Years and over | 120 (39.2%) | 65 (24.0%) |
Disability Class: Vision Difficulty
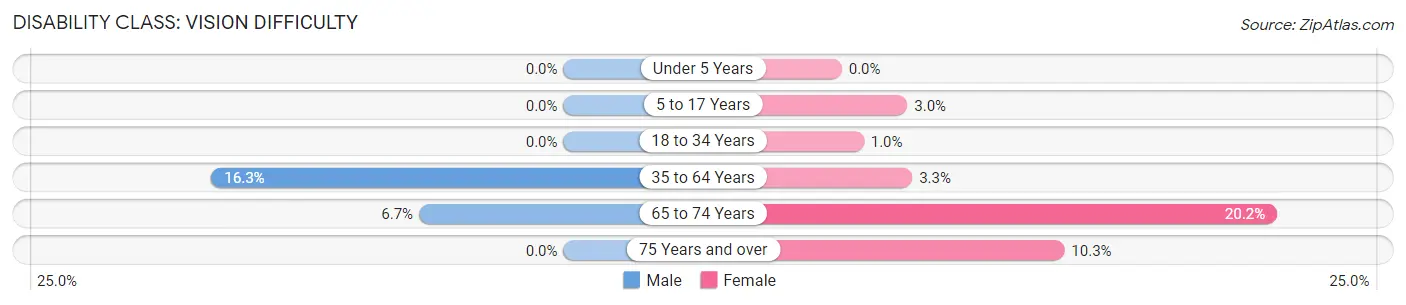
| Age Bracket | Male | Female |
| Under 5 Years | 0 (0.0%) | 0 (0.0%) |
| 5 to 17 Years | 0 (0.0%) | 16 (3.0%) |
| 18 to 34 Years | 0 (0.0%) | 9 (1.0%) |
| 35 to 64 Years | 160 (16.3%) | 41 (3.3%) |
| 65 to 74 Years | 15 (6.7%) | 81 (20.2%) |
| 75 Years and over | 0 (0.0%) | 28 (10.3%) |
Disability Class: Cognitive Difficulty
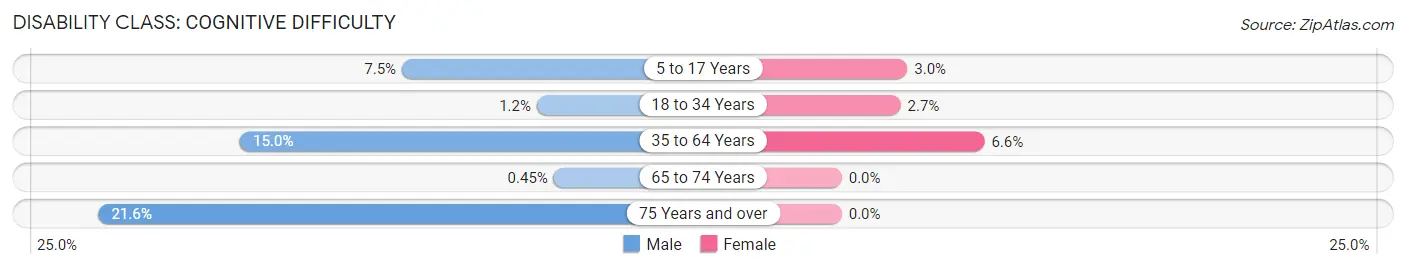
| Age Bracket | Male | Female |
| 5 to 17 Years | 28 (7.5%) | 16 (3.0%) |
| 18 to 34 Years | 9 (1.2%) | 24 (2.7%) |
| 35 to 64 Years | 147 (15.0%) | 83 (6.6%) |
| 65 to 74 Years | 1 (0.4%) | 0 (0.0%) |
| 75 Years and over | 66 (21.6%) | 0 (0.0%) |
Disability Class: Ambulatory Difficulty
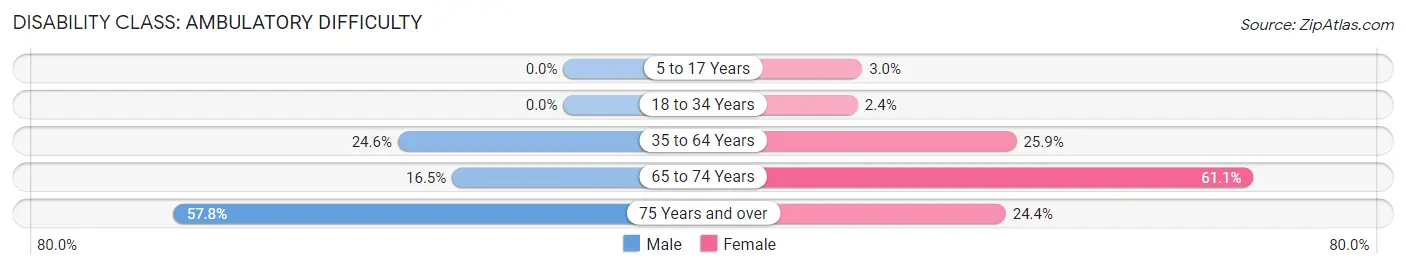
| Age Bracket | Male | Female |
| 5 to 17 Years | 0 (0.0%) | 16 (3.0%) |
| 18 to 34 Years | 0 (0.0%) | 21 (2.4%) |
| 35 to 64 Years | 241 (24.6%) | 325 (25.9%) |
| 65 to 74 Years | 37 (16.5%) | 245 (61.1%) |
| 75 Years and over | 177 (57.8%) | 66 (24.3%) |
Disability Class: Self-Care Difficulty
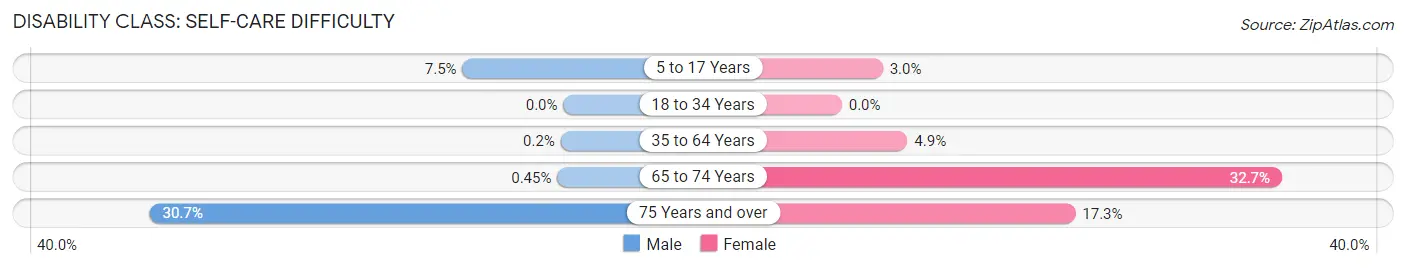
| Age Bracket | Male | Female |
| 5 to 17 Years | 28 (7.5%) | 16 (3.0%) |
| 18 to 34 Years | 0 (0.0%) | 0 (0.0%) |
| 35 to 64 Years | 2 (0.2%) | 61 (4.9%) |
| 65 to 74 Years | 1 (0.4%) | 131 (32.7%) |
| 75 Years and over | 94 (30.7%) | 47 (17.3%) |
Technology Access in Newport
Computing Device Access in Newport
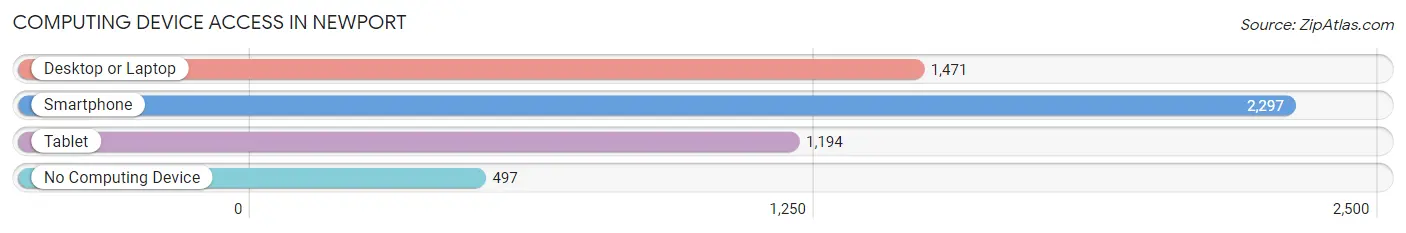
| Device Type | # Households | % Households |
| Desktop or Laptop | 1,471 | 51.4% |
| Smartphone | 2,297 | 80.3% |
| Tablet | 1,194 | 41.7% |
| No Computing Device | 497 | 17.4% |
| Total | 2,862 | 100.0% |
Internet Access in Newport
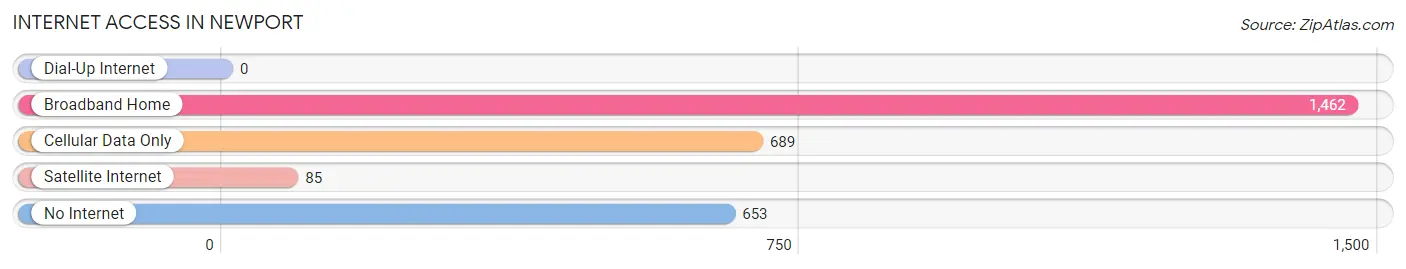
| Internet Type | # Households | % Households |
| Dial-Up Internet | 0 | 0.0% |
| Broadband Home | 1,462 | 51.1% |
| Cellular Data Only | 689 | 24.1% |
| Satellite Internet | 85 | 3.0% |
| No Internet | 653 | 22.8% |
| Total | 2,862 | 100.0% |
Newport Summary
Newport, Tennessee is a small city located in Cocke County, in the eastern part of the state. It is situated along the banks of the French Broad River, and is part of the Knoxville Metropolitan Statistical Area. The city has a population of 6,945, according to the 2010 census, and is the county seat of Cocke County.
History
Newport was founded in 1790 by William Cocke, a Revolutionary War veteran and one of the first settlers in the area. The city was named after Newport, Rhode Island, and was originally part of Jefferson County. In 1807, Cocke County was formed, and Newport was chosen as the county seat. The city was incorporated in 1819, and the first courthouse was built in 1820.
In the early 19th century, Newport was a thriving river port, and the city was a major stop on the stagecoach route between Knoxville and Asheville. The city was also a major center for the production of iron and steel, and the Newport Iron Works was established in 1845. The city was also home to several other industries, including a cotton mill, a woolen mill, and a tannery.
Geography
Newport is located in eastern Tennessee, in Cocke County. The city is situated along the banks of the French Broad River, and is part of the Knoxville Metropolitan Statistical Area. The city has a total area of 4.2 square miles, all of which is land.
The city is located in the Appalachian Mountains, and the terrain is mostly hilly. The highest point in the city is 1,890 feet above sea level. The climate is humid subtropical, with hot, humid summers and mild winters.
Economy
Newport’s economy is largely based on manufacturing and tourism. The city is home to several manufacturing companies, including a steel mill, a paper mill, and a furniture factory. The city is also home to several tourist attractions, including the Newport Aquarium, the Cocke County Museum, and the Newport Speedway.
The city is also home to several retail stores, restaurants, and other businesses. The city is served by the Newport Municipal Airport, and is located near Interstate 40.
Demographics
According to the 2010 census, Newport has a population of 6,945. The racial makeup of the city is 87.3% White, 8.2% African American, 0.4% Native American, 0.7% Asian, 0.1% Pacific Islander, 1.2% from other races, and 2.1% from two or more races. Hispanic or Latino of any race were 2.7% of the population.
The median household income in Newport is $30,945, and the median family income is $37,917. The per capita income in the city is $17,845. The poverty rate in Newport is 22.3%, and the unemployment rate is 8.2%.
Common Questions
What is Per Capita Income in Newport?
Per Capita income in Newport is $20,300.
What is the Median Family Income in Newport?
Median Family Income in Newport is $48,391.
What is the Median Household income in Newport?
Median Household Income in Newport is $35,784.
What is Income or Wage Gap in Newport?
Income or Wage Gap in Newport is 45.9%.
Women in Newport earn 54.1 cents for every dollar earned by a man.
What is Inequality or Gini Index in Newport?
Inequality or Gini Index in Newport is 0.44.
What is the Total Population of Newport?
Total Population of Newport is 6,850.
What is the Total Male Population of Newport?
Total Male Population of Newport is 2,997.
What is the Total Female Population of Newport?
Total Female Population of Newport is 3,853.
What is the Ratio of Males per 100 Females in Newport?
There are 77.78 Males per 100 Females in Newport.
What is the Ratio of Females per 100 Males in Newport?
There are 128.56 Females per 100 Males in Newport.
What is the Median Population Age in Newport?
Median Population Age in Newport is 40.0 Years.
What is the Average Family Size in Newport
Average Family Size in Newport is 3.0 People.
What is the Average Household Size in Newport
Average Household Size in Newport is 2.3 People.
How Large is the Labor Force in Newport?
There are 2,815 People in the Labor Forcein in Newport.
What is the Percentage of People in the Labor Force in Newport?
51.3% of People are in the Labor Force in Newport.
What is the Unemployment Rate in Newport?
Unemployment Rate in Newport is 6.1%.