Cities with the Highest Percentage of Indian (Asian) Population in Tennessee
RELATED REPORTS & OPTIONS
Indian (Asian)
Tennessee
Compare Cities
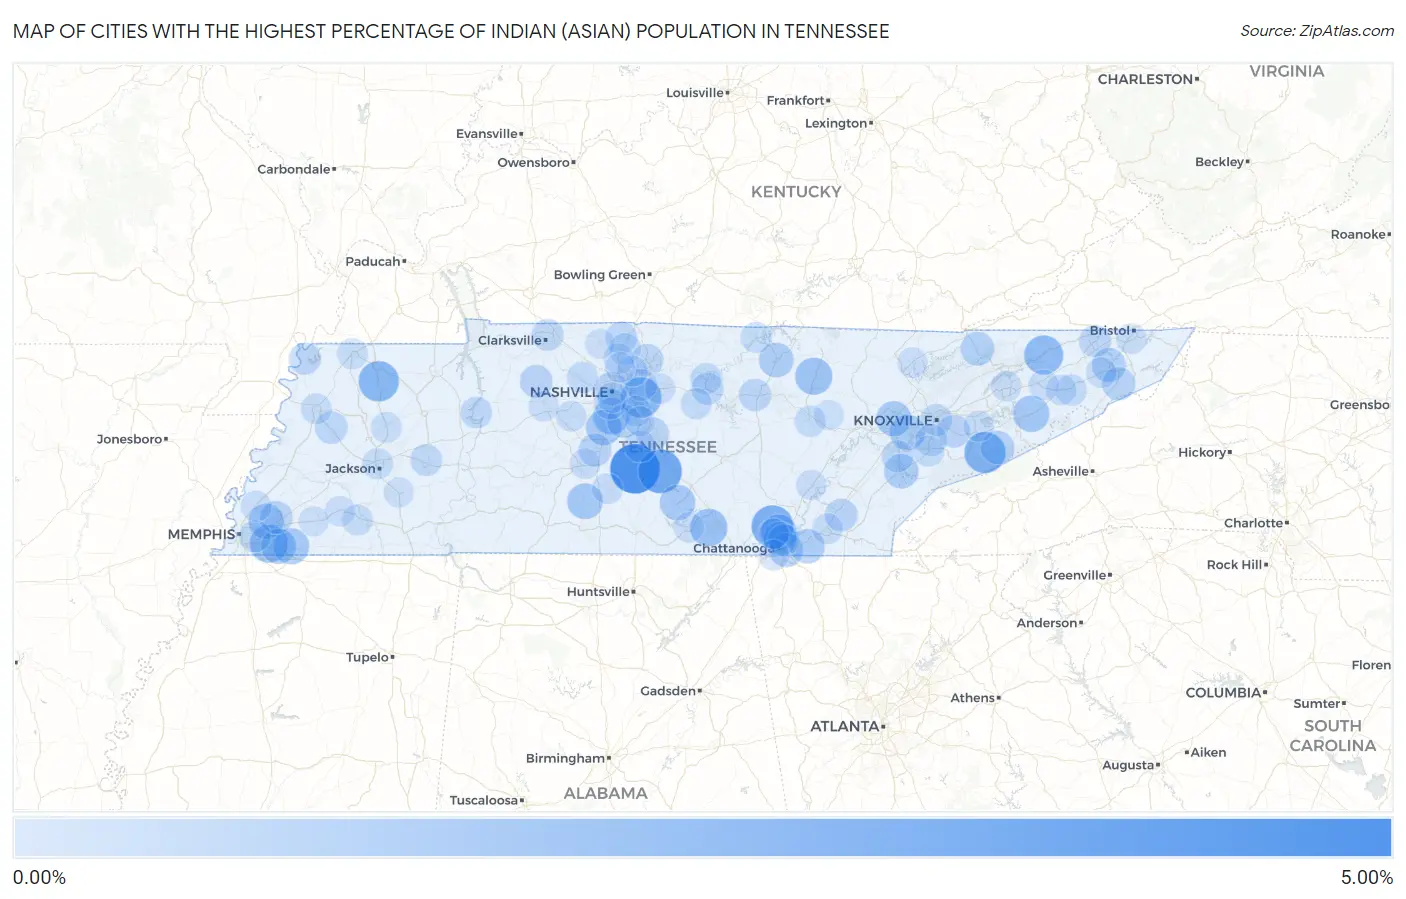
Map of Cities with the Highest Percentage of Indian (Asian) Population in Tennessee
0.00%
5.00%
Cities with the Highest Percentage of Indian (Asian) Population in Tennessee
| City | Indian (Asian) | vs State | vs National | |
| 1. | Unionville | 4.63% | 0.37%(+4.26)#1 | 1.61%(+3.02)#824 |
| 2. | Bell Buckle | 3.22% | 0.37%(+2.85)#2 | 1.61%(+1.61)#1,206 |
| 3. | Lone Oak | 2.78% | 0.37%(+2.40)#3 | 1.61%(+1.17)#1,396 |
| 4. | Gatlinburg | 2.61% | 0.37%(+2.24)#4 | 1.61%(+1.00)#1,495 |
| 5. | Rural Hill | 2.43% | 0.37%(+2.06)#5 | 1.61%(+0.822)#1,620 |
| 6. | Sharon | 2.40% | 0.37%(+2.02)#6 | 1.61%(+0.788)#1,644 |
| 7. | Rogersville | 2.12% | 0.37%(+1.74)#7 | 1.61%(+0.508)#1,861 |
| 8. | Germantown | 1.83% | 0.37%(+1.45)#8 | 1.61%(+0.216)#2,122 |
| 9. | Sewanee | 1.71% | 0.37%(+1.34)#9 | 1.61%(+0.102)#2,263 |
| 10. | Grimsley | 1.64% | 0.37%(+1.26)#10 | 1.61%(+0.026)#2,367 |
| 11. | Walden | 1.44% | 0.37%(+1.07)#11 | 1.61%(-0.166)#2,632 |
| 12. | Brentwood | 1.43% | 0.37%(+1.06)#12 | 1.61%(-0.177)#2,645 |
| 13. | Parrottsville | 1.42% | 0.37%(+1.05)#13 | 1.61%(-0.184)#2,658 |
| 14. | Piperton | 1.36% | 0.37%(+0.987)#14 | 1.61%(-0.247)#2,760 |
| 15. | Lynnville | 1.31% | 0.37%(+0.934)#15 | 1.61%(-0.300)#2,830 |
| 16. | Tullahoma | 1.25% | 0.37%(+0.876)#16 | 1.61%(-0.358)#2,945 |
| 17. | Franklin | 1.24% | 0.37%(+0.861)#17 | 1.61%(-0.372)#2,973 |
| 18. | Farragut | 1.21% | 0.37%(+0.835)#18 | 1.61%(-0.398)#3,024 |
| 19. | Oak Ridge | 1.18% | 0.37%(+0.808)#19 | 1.61%(-0.426)#3,079 |
| 20. | Bartlett | 1.18% | 0.37%(+0.801)#20 | 1.61%(-0.433)#3,092 |
| 21. | Collierville | 1.16% | 0.37%(+0.790)#21 | 1.61%(-0.444)#3,113 |
| 22. | Livingston | 1.07% | 0.37%(+0.696)#22 | 1.61%(-0.538)#3,315 |
| 23. | Vonore | 1.04% | 0.37%(+0.666)#23 | 1.61%(-0.568)#3,400 |
| 24. | Collegedale | 1.03% | 0.37%(+0.652)#24 | 1.61%(-0.582)#3,441 |
| 25. | Ridgeside | 0.98% | 0.37%(+0.604)#25 | 1.61%(-0.629)#3,570 |
| 26. | Red Bank | 0.91% | 0.37%(+0.540)#26 | 1.61%(-0.694)#3,749 |
| 27. | Tazewell | 0.86% | 0.37%(+0.486)#27 | 1.61%(-0.748)#3,929 |
| 28. | Johnson City | 0.85% | 0.37%(+0.472)#28 | 1.61%(-0.762)#3,974 |
| 29. | Nolensville | 0.79% | 0.37%(+0.414)#29 | 1.61%(-0.820)#4,161 |
| 30. | Pittman Center | 0.77% | 0.37%(+0.394)#30 | 1.61%(-0.840)#4,231 |
| 31. | Nashville | 0.72% | 0.37%(+0.345)#31 | 1.61%(-0.889)#4,393 |
| 32. | Unicoi | 0.71% | 0.37%(+0.335)#32 | 1.61%(-0.899)#4,426 |
| 33. | Spring Hill | 0.70% | 0.37%(+0.325)#33 | 1.61%(-0.909)#4,458 |
| 34. | Seymour | 0.67% | 0.37%(+0.297)#34 | 1.61%(-0.937)#4,566 |
| 35. | Vanleer | 0.66% | 0.37%(+0.286)#35 | 1.61%(-0.948)#4,607 |
| 36. | Lakeland | 0.66% | 0.37%(+0.284)#36 | 1.61%(-0.950)#4,618 |
| 37. | Murfreesboro | 0.65% | 0.37%(+0.277)#37 | 1.61%(-0.957)#4,645 |
| 38. | Charleston | 0.62% | 0.37%(+0.249)#38 | 1.61%(-0.985)#4,767 |
| 39. | Friendship | 0.60% | 0.37%(+0.220)#39 | 1.61%(-1.01)#4,889 |
| 40. | Cookeville | 0.55% | 0.37%(+0.171)#40 | 1.61%(-1.06)#5,140 |
| 41. | Gallatin | 0.49% | 0.37%(+0.117)#41 | 1.61%(-1.12)#5,406 |
| 42. | Gordonsville | 0.48% | 0.37%(+0.102)#42 | 1.61%(-1.13)#5,490 |
| 43. | Tiptonville | 0.47% | 0.37%(+0.095)#43 | 1.61%(-1.14)#5,529 |
| 44. | Kingsport | 0.47% | 0.37%(+0.091)#44 | 1.61%(-1.14)#5,545 |
| 45. | Knoxville | 0.45% | 0.37%(+0.076)#45 | 1.61%(-1.16)#5,621 |
| 46. | Clarksville | 0.45% | 0.37%(+0.074)#46 | 1.61%(-1.16)#5,628 |
| 47. | Lexington | 0.44% | 0.37%(+0.067)#47 | 1.61%(-1.17)#5,675 |
| 48. | Cross Plains | 0.44% | 0.37%(+0.064)#48 | 1.61%(-1.17)#5,693 |
| 49. | Tellico Village | 0.43% | 0.37%(+0.059)#49 | 1.61%(-1.17)#5,726 |
| 50. | Rockvale | 0.43% | 0.37%(+0.054)#50 | 1.61%(-1.18)#5,755 |
| 51. | Alcoa | 0.41% | 0.37%(+0.040)#51 | 1.61%(-1.19)#5,842 |
| 52. | Mount Juliet | 0.40% | 0.37%(+0.025)#52 | 1.61%(-1.21)#5,929 |
| 53. | Memphis | 0.40% | 0.37%(+0.023)#53 | 1.61%(-1.21)#5,939 |
| 54. | New Johnsonville | 0.38% | 0.37%(+0.005)#54 | 1.61%(-1.23)#6,068 |
| 55. | White House | 0.35% | 0.37%(-0.022)#55 | 1.61%(-1.26)#6,216 |
| 56. | Chattanooga | 0.34% | 0.37%(-0.035)#56 | 1.61%(-1.27)#6,301 |
| 57. | Carthage | 0.33% | 0.37%(-0.049)#57 | 1.61%(-1.28)#6,399 |
| 58. | Oak Hill | 0.31% | 0.37%(-0.060)#58 | 1.61%(-1.29)#6,472 |
| 59. | Ashland City | 0.31% | 0.37%(-0.068)#59 | 1.61%(-1.30)#6,524 |
| 60. | Tusculum | 0.31% | 0.37%(-0.068)#60 | 1.61%(-1.30)#6,525 |
| 61. | Crossville | 0.27% | 0.37%(-0.102)#61 | 1.61%(-1.34)#6,743 |
| 62. | Alexandria | 0.26% | 0.37%(-0.116)#62 | 1.61%(-1.35)#6,833 |
| 63. | Maryville | 0.25% | 0.37%(-0.124)#63 | 1.61%(-1.36)#6,882 |
| 64. | Celina | 0.23% | 0.37%(-0.149)#64 | 1.61%(-1.38)#7,078 |
| 65. | Jackson | 0.22% | 0.37%(-0.151)#65 | 1.61%(-1.39)#7,099 |
| 66. | Union City | 0.22% | 0.37%(-0.158)#66 | 1.61%(-1.39)#7,145 |
| 67. | Cleveland | 0.22% | 0.37%(-0.159)#67 | 1.61%(-1.39)#7,153 |
| 68. | Dyersburg | 0.21% | 0.37%(-0.165)#68 | 1.61%(-1.40)#7,187 |
| 69. | Bolivar | 0.19% | 0.37%(-0.183)#69 | 1.61%(-1.42)#7,317 |
| 70. | Milan | 0.18% | 0.37%(-0.191)#70 | 1.61%(-1.43)#7,388 |
| 71. | Millington | 0.18% | 0.37%(-0.195)#71 | 1.61%(-1.43)#7,416 |
| 72. | Karns | 0.18% | 0.37%(-0.199)#72 | 1.61%(-1.43)#7,455 |
| 73. | Jonesborough | 0.17% | 0.37%(-0.205)#73 | 1.61%(-1.44)#7,510 |
| 74. | Fairview | 0.17% | 0.37%(-0.207)#74 | 1.61%(-1.44)#7,525 |
| 75. | Hendersonville | 0.17% | 0.37%(-0.208)#75 | 1.61%(-1.44)#7,528 |
| 76. | Berry Hill | 0.16% | 0.37%(-0.214)#76 | 1.61%(-1.45)#7,565 |
| 77. | Sevierville | 0.16% | 0.37%(-0.219)#77 | 1.61%(-1.45)#7,609 |
| 78. | Lewisburg | 0.15% | 0.37%(-0.221)#78 | 1.61%(-1.46)#7,623 |
| 79. | Greeneville | 0.15% | 0.37%(-0.226)#79 | 1.61%(-1.46)#7,649 |
| 80. | Columbia | 0.15% | 0.37%(-0.227)#80 | 1.61%(-1.46)#7,656 |
| 81. | Lookout Mountain | 0.14% | 0.37%(-0.234)#81 | 1.61%(-1.47)#7,713 |
| 82. | Millersville | 0.14% | 0.37%(-0.237)#82 | 1.61%(-1.47)#7,745 |
| 83. | Whiteville | 0.13% | 0.37%(-0.248)#83 | 1.61%(-1.48)#7,828 |
| 84. | Mosheim | 0.12% | 0.37%(-0.255)#84 | 1.61%(-1.49)#7,864 |
| 85. | La Vergne | 0.11% | 0.37%(-0.266)#85 | 1.61%(-1.50)#7,932 |
| 86. | Powell | 0.11% | 0.37%(-0.268)#86 | 1.61%(-1.50)#7,952 |
| 87. | Signal Mountain | 0.10% | 0.37%(-0.273)#87 | 1.61%(-1.51)#7,988 |
| 88. | Morristown | 0.098% | 0.37%(-0.277)#88 | 1.61%(-1.51)#8,014 |
| 89. | Dayton | 0.098% | 0.37%(-0.277)#89 | 1.61%(-1.51)#8,016 |
| 90. | Goodlettsville | 0.097% | 0.37%(-0.278)#90 | 1.61%(-1.51)#8,024 |
| 91. | Winchester | 0.095% | 0.37%(-0.280)#91 | 1.61%(-1.51)#8,036 |
| 92. | Lebanon | 0.088% | 0.37%(-0.286)#92 | 1.61%(-1.52)#8,078 |
| 93. | La Follette | 0.082% | 0.37%(-0.293)#93 | 1.61%(-1.53)#8,124 |
| 94. | Dickson | 0.081% | 0.37%(-0.294)#94 | 1.61%(-1.53)#8,131 |
| 95. | Bristol | 0.081% | 0.37%(-0.294)#95 | 1.61%(-1.53)#8,134 |
| 96. | Fairfield Glade | 0.054% | 0.37%(-0.321)#96 | 1.61%(-1.55)#8,298 |
| 97. | Henderson | 0.047% | 0.37%(-0.328)#97 | 1.61%(-1.56)#8,336 |
| 98. | Smyrna | 0.043% | 0.37%(-0.332)#98 | 1.61%(-1.57)#8,364 |
| 99. | Springfield | 0.043% | 0.37%(-0.332)#99 | 1.61%(-1.57)#8,367 |
| 100. | Somerville | 0.030% | 0.37%(-0.345)#100 | 1.61%(-1.58)#8,438 |
Common Questions
What are the Top 10 Cities with the Highest Percentage of Indian (Asian) Population in Tennessee?
Top 10 Cities with the Highest Percentage of Indian (Asian) Population in Tennessee are:
#1
4.63%
#2
3.22%
#3
2.78%
#4
2.61%
#5
2.43%
#6
2.40%
#7
2.12%
#8
1.83%
#9
1.71%
#10
1.64%
What city has the Highest Percentage of Indian (Asian) Population in Tennessee?
Unionville has the Highest Percentage of Indian (Asian) Population in Tennessee with 4.63%.
What is the Percentage of Indian (Asian) Population in the State of Tennessee?
Percentage of Indian (Asian) Population in Tennessee is 0.37%.
What is the Percentage of Indian (Asian) Population in the United States?
Percentage of Indian (Asian) Population in the United States is 1.61%.