Tazewell, TN Map & Demographics
Tazewell Map
Tazewell Overview
$21,317
PER CAPITA INCOME
$49,196
AVG FAMILY INCOME
$39,554
AVG HOUSEHOLD INCOME
54.3%
WAGE / INCOME GAP [ % ]
45.7¢/ $1
WAGE / INCOME GAP [ $ ]
$13,410
FAMILY INCOME DEFICIT
0.42
INEQUALITY / GINI INDEX
2,207
TOTAL POPULATION
1,041
MALE POPULATION
1,166
FEMALE POPULATION
89.28
MALES / 100 FEMALES
112.01
FEMALES / 100 MALES
37.9
MEDIAN AGE
3.2
AVG FAMILY SIZE
2.2
AVG HOUSEHOLD SIZE
691
LABOR FORCE [ PEOPLE ]
39.2%
PERCENT IN LABOR FORCE
7.2%
UNEMPLOYMENT RATE
Tazewell Zip Codes
Tazewell Area Codes
Income in Tazewell
Income Overview in Tazewell
Per Capita Income in Tazewell is $21,317, while median incomes of families and households are $49,196 and $39,554 respectively.
| Characteristic | Number | Measure |
| Per Capita Income | 2,207 | $21,317 |
| Median Family Income | 493 | $49,196 |
| Mean Family Income | 493 | $55,464 |
| Median Household Income | 946 | $39,554 |
| Mean Household Income | 946 | $46,230 |
| Income Deficit | 493 | $13,410 |
| Wage / Income Gap (%) | 2,207 | 54.35% |
| Wage / Income Gap ($) | 2,207 | 45.65¢ per $1 |
| Gini / Inequality Index | 2,207 | 0.42 |
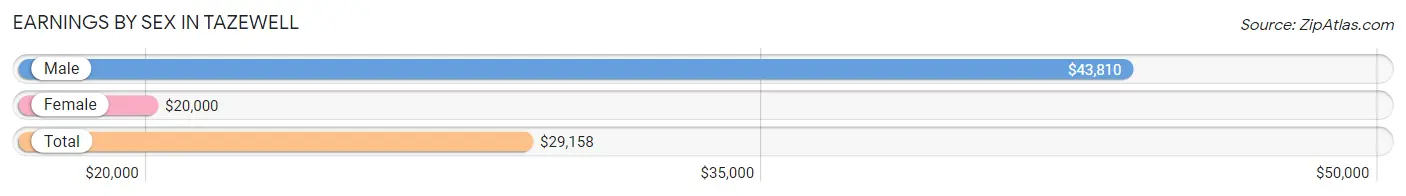
Earnings by Sex in Tazewell
Average Earnings in Tazewell are $29,158, $43,810 for men and $20,000 for women, a difference of 54.3%.
| Sex | Number | Average Earnings |
| Male | 414 (51.2%) | $43,810 |
| Female | 394 (48.8%) | $20,000 |
| Total | 808 (100.0%) | $29,158 |
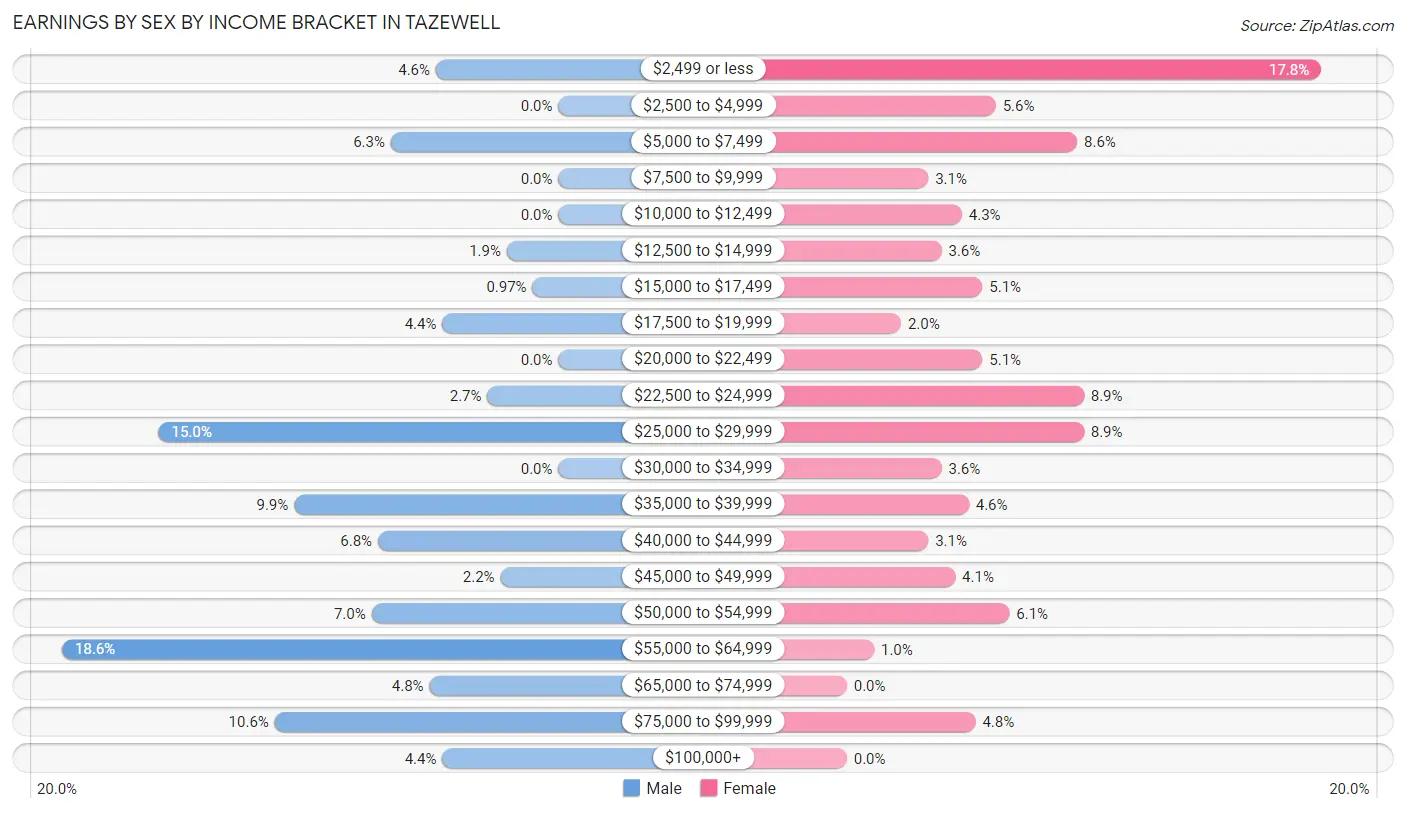
Earnings by Sex by Income Bracket in Tazewell
The most common earnings brackets in Tazewell are $55,000 to $64,999 for men (77 | 18.6%) and $2,499 or less for women (70 | 17.8%).
| Income | Male | Female |
| $2,499 or less | 19 (4.6%) | 70 (17.8%) |
| $2,500 to $4,999 | 0 (0.0%) | 22 (5.6%) |
| $5,000 to $7,499 | 26 (6.3%) | 34 (8.6%) |
| $7,500 to $9,999 | 0 (0.0%) | 12 (3.0%) |
| $10,000 to $12,499 | 0 (0.0%) | 17 (4.3%) |
| $12,500 to $14,999 | 8 (1.9%) | 14 (3.5%) |
| $15,000 to $17,499 | 4 (1.0%) | 20 (5.1%) |
| $17,500 to $19,999 | 18 (4.3%) | 8 (2.0%) |
| $20,000 to $22,499 | 0 (0.0%) | 20 (5.1%) |
| $22,500 to $24,999 | 11 (2.7%) | 35 (8.9%) |
| $25,000 to $29,999 | 62 (15.0%) | 35 (8.9%) |
| $30,000 to $34,999 | 0 (0.0%) | 14 (3.5%) |
| $35,000 to $39,999 | 41 (9.9%) | 18 (4.6%) |
| $40,000 to $44,999 | 28 (6.8%) | 12 (3.0%) |
| $45,000 to $49,999 | 9 (2.2%) | 16 (4.1%) |
| $50,000 to $54,999 | 29 (7.0%) | 24 (6.1%) |
| $55,000 to $64,999 | 77 (18.6%) | 4 (1.0%) |
| $65,000 to $74,999 | 20 (4.8%) | 0 (0.0%) |
| $75,000 to $99,999 | 44 (10.6%) | 19 (4.8%) |
| $100,000+ | 18 (4.3%) | 0 (0.0%) |
| Total | 414 (100.0%) | 394 (100.0%) |
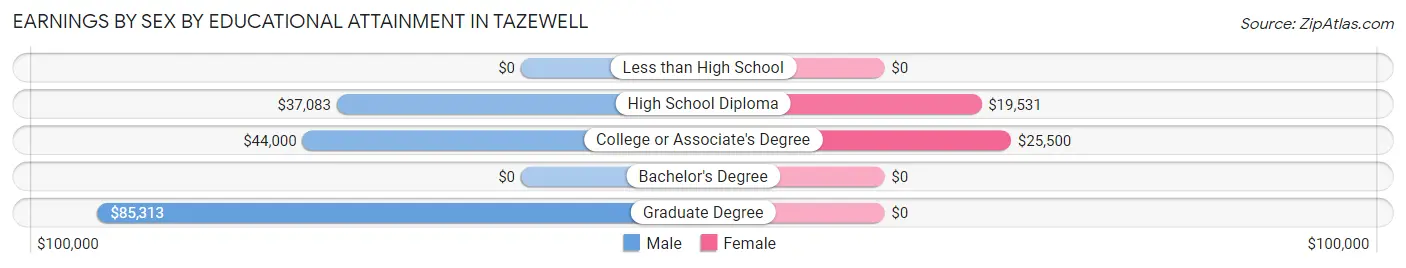
Earnings by Sex by Educational Attainment in Tazewell
Average earnings in Tazewell are $43,452 for men and $20,083 for women, a difference of 53.8%. Men with an educational attainment of graduate degree enjoy the highest average annual earnings of $85,313, while those with high school diploma education earn the least with $37,083. Women with an educational attainment of college or associate's degree earn the most with the average annual earnings of $25,500, while those with high school diploma education have the smallest earnings of $19,531.
| Educational Attainment | Male Income | Female Income |
| Less than High School | - | - |
| High School Diploma | $37,083 | $19,531 |
| College or Associate's Degree | $44,000 | $25,500 |
| Bachelor's Degree | - | - |
| Graduate Degree | $85,313 | $0 |
| Total | $43,452 | $20,083 |
Family Income in Tazewell
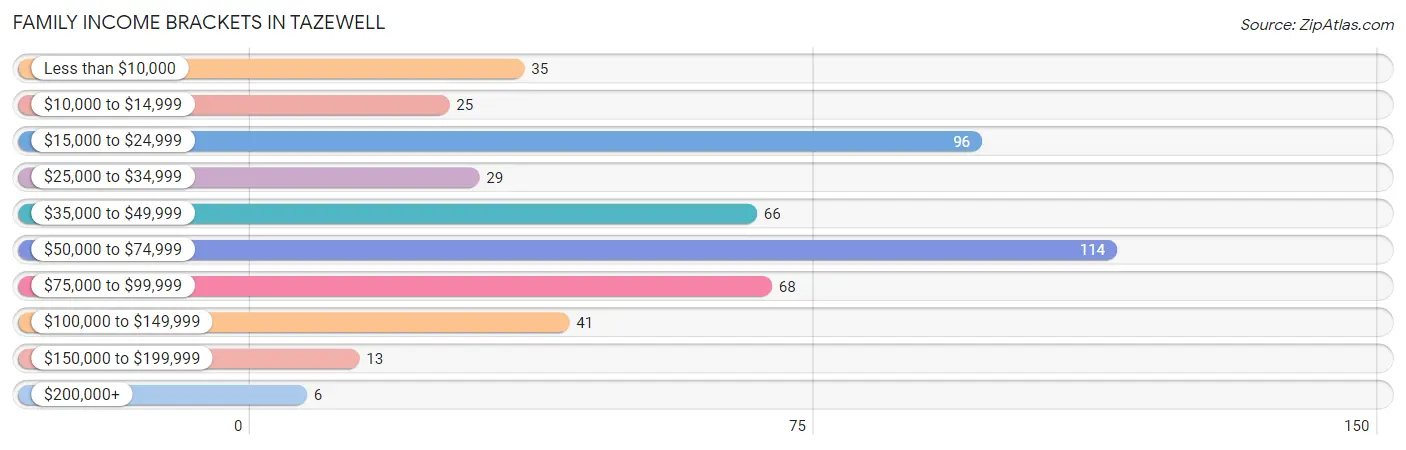
Family Income Brackets in Tazewell
According to the Tazewell family income data, there are 114 families falling into the $50,000 to $74,999 income range, which is the most common income bracket and makes up 23.1% of all families. Conversely, the $200,000+ income bracket is the least frequent group with only 6 families (1.2%) belonging to this category.
| Income Bracket | # Families | % Families |
| Less than $10,000 | 35 | 7.1% |
| $10,000 to $14,999 | 25 | 5.1% |
| $15,000 to $24,999 | 96 | 19.5% |
| $25,000 to $34,999 | 29 | 5.9% |
| $35,000 to $49,999 | 66 | 13.4% |
| $50,000 to $74,999 | 114 | 23.1% |
| $75,000 to $99,999 | 68 | 13.8% |
| $100,000 to $149,999 | 41 | 8.3% |
| $150,000 to $199,999 | 13 | 2.6% |
| $200,000+ | 6 | 1.2% |
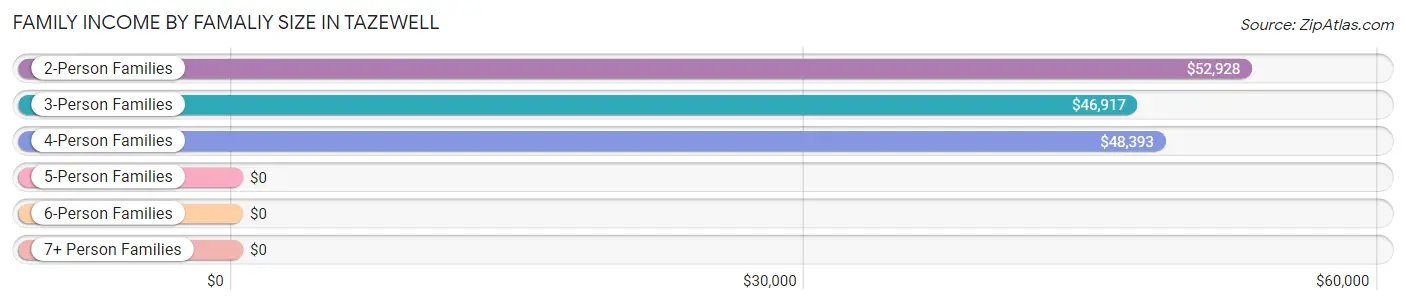
Family Income by Famaliy Size in Tazewell
2-person families (203 | 41.2%) account for the highest median family income in Tazewell with $52,928 per family, while 2-person families (203 | 41.2%) have the highest median income of $26,464 per family member.
| Income Bracket | # Families | Median Income |
| 2-Person Families | 203 (41.2%) | $52,928 |
| 3-Person Families | 91 (18.5%) | $46,917 |
| 4-Person Families | 76 (15.4%) | $48,393 |
| 5-Person Families | 74 (15.0%) | $0 |
| 6-Person Families | 40 (8.1%) | $0 |
| 7+ Person Families | 9 (1.8%) | $0 |
| Total | 493 (100.0%) | $49,196 |
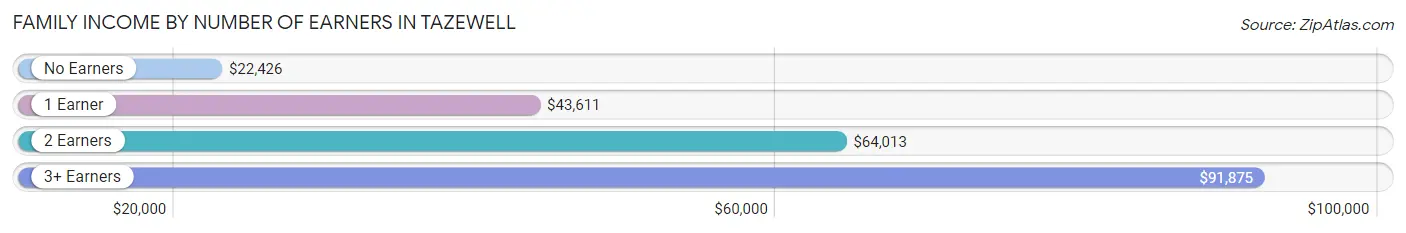
Family Income by Number of Earners in Tazewell
The median family income in Tazewell is $49,196, with families comprising 3+ earners (26) having the highest median family income of $91,875, while families with no earners (106) have the lowest median family income of $22,426, accounting for 5.3% and 21.5% of families, respectively.
| Number of Earners | # Families | Median Income |
| No Earners | 106 (21.5%) | $22,426 |
| 1 Earner | 214 (43.4%) | $43,611 |
| 2 Earners | 147 (29.8%) | $64,013 |
| 3+ Earners | 26 (5.3%) | $91,875 |
| Total | 493 (100.0%) | $49,196 |
Household Income in Tazewell
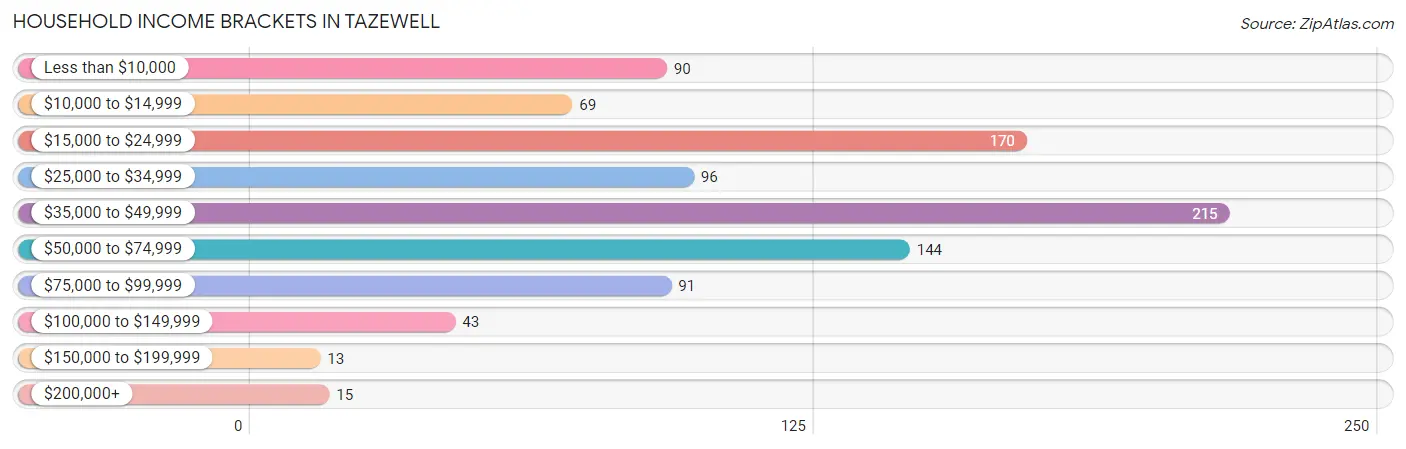
Household Income Brackets in Tazewell
With 215 households falling in the category, the $35,000 to $49,999 income range is the most frequent in Tazewell, accounting for 22.7% of all households. In contrast, only 13 households (1.4%) fall into the $150,000 to $199,999 income bracket, making it the least populous group.
| Income Bracket | # Households | % Households |
| Less than $10,000 | 90 | 9.5% |
| $10,000 to $14,999 | 69 | 7.3% |
| $15,000 to $24,999 | 170 | 18.0% |
| $25,000 to $34,999 | 96 | 10.1% |
| $35,000 to $49,999 | 215 | 22.7% |
| $50,000 to $74,999 | 144 | 15.2% |
| $75,000 to $99,999 | 91 | 9.6% |
| $100,000 to $149,999 | 43 | 4.5% |
| $150,000 to $199,999 | 13 | 1.4% |
| $200,000+ | 15 | 1.6% |
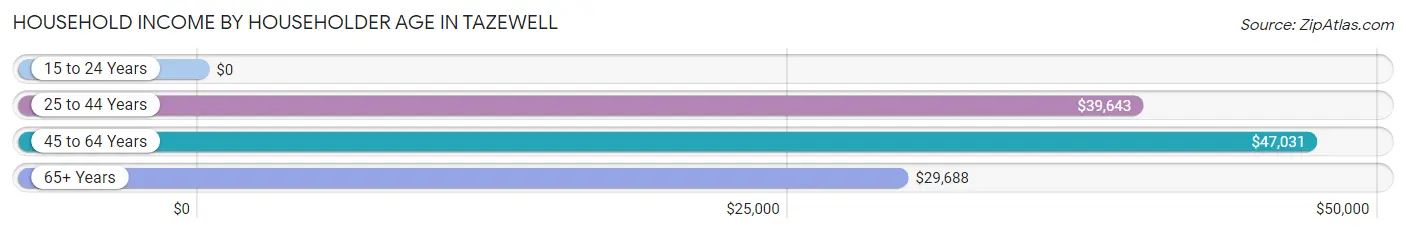
Household Income by Householder Age in Tazewell
The median household income in Tazewell is $39,554, with the highest median household income of $47,031 found in the 45 to 64 years age bracket for the primary householder. A total of 255 households (27.0%) fall into this category. Meanwhile, the 15 to 24 years age bracket for the primary householder has the lowest median household income of $0, with 69 households (7.3%) in this group.
| Income Bracket | # Households | Median Income |
| 15 to 24 Years | 69 (7.3%) | $0 |
| 25 to 44 Years | 304 (32.1%) | $39,643 |
| 45 to 64 Years | 255 (27.0%) | $47,031 |
| 65+ Years | 318 (33.6%) | $29,688 |
| Total | 946 (100.0%) | $39,554 |
Poverty in Tazewell
Income Below Poverty by Sex and Age in Tazewell
With 29.8% poverty level for males and 30.7% for females among the residents of Tazewell, 12 to 14 year old males and 5 year old females are the most vulnerable to poverty, with 65 males (94.2%) and 12 females (60.0%) in their respective age groups living below the poverty level.
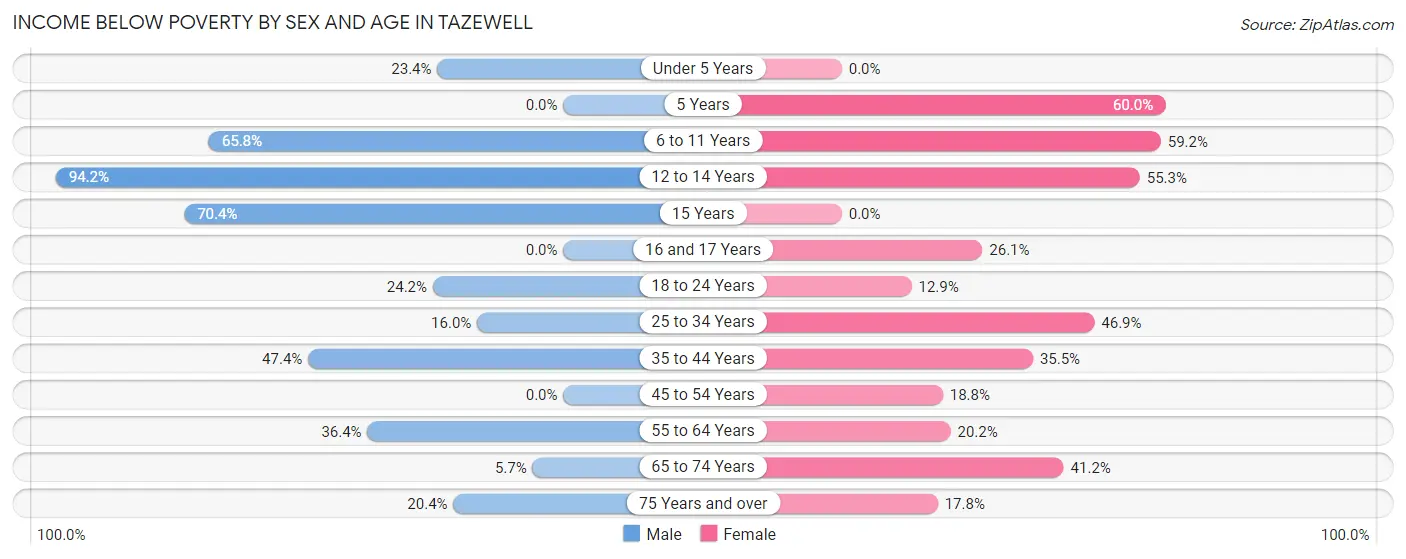
| Age Bracket | Male | Female |
| Under 5 Years | 18 (23.4%) | 0 (0.0%) |
| 5 Years | 0 (0.0%) | 12 (60.0%) |
| 6 to 11 Years | 25 (65.8%) | 45 (59.2%) |
| 12 to 14 Years | 65 (94.2%) | 26 (55.3%) |
| 15 Years | 19 (70.4%) | 0 (0.0%) |
| 16 and 17 Years | 0 (0.0%) | 6 (26.1%) |
| 18 to 24 Years | 31 (24.2%) | 11 (12.9%) |
| 25 to 34 Years | 20 (16.0%) | 75 (46.9%) |
| 35 to 44 Years | 63 (47.4%) | 44 (35.5%) |
| 45 to 54 Years | 0 (0.0%) | 24 (18.8%) |
| 55 to 64 Years | 44 (36.4%) | 22 (20.2%) |
| 65 to 74 Years | 6 (5.7%) | 49 (41.2%) |
| 75 Years and over | 10 (20.4%) | 26 (17.8%) |
| Total | 301 (29.8%) | 340 (30.7%) |
Income Above Poverty by Sex and Age in Tazewell
According to the poverty statistics in Tazewell, males aged 5 years and females aged under 5 years are the age groups that are most secure financially, with 100.0% of males and 100.0% of females in these age groups living above the poverty line.
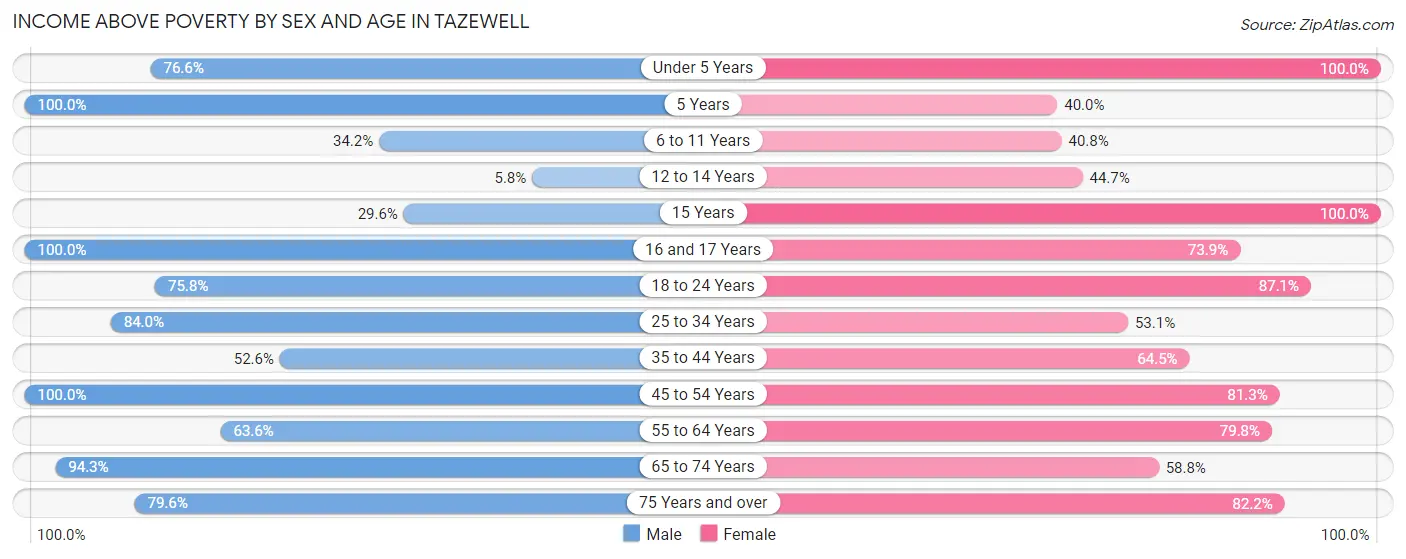
| Age Bracket | Male | Female |
| Under 5 Years | 59 (76.6%) | 48 (100.0%) |
| 5 Years | 13 (100.0%) | 8 (40.0%) |
| 6 to 11 Years | 13 (34.2%) | 31 (40.8%) |
| 12 to 14 Years | 4 (5.8%) | 21 (44.7%) |
| 15 Years | 8 (29.6%) | 23 (100.0%) |
| 16 and 17 Years | 9 (100.0%) | 17 (73.9%) |
| 18 to 24 Years | 97 (75.8%) | 74 (87.1%) |
| 25 to 34 Years | 105 (84.0%) | 85 (53.1%) |
| 35 to 44 Years | 70 (52.6%) | 80 (64.5%) |
| 45 to 54 Years | 116 (100.0%) | 104 (81.2%) |
| 55 to 64 Years | 77 (63.6%) | 87 (79.8%) |
| 65 to 74 Years | 99 (94.3%) | 70 (58.8%) |
| 75 Years and over | 39 (79.6%) | 120 (82.2%) |
| Total | 709 (70.2%) | 768 (69.3%) |
Income Below Poverty Among Married-Couple Families in Tazewell
The poverty statistics for married-couple families in Tazewell show that 17.7% or 64 of the total 361 families live below the poverty line. Families with 1 or 2 children have the highest poverty rate of 34.7%, comprising of 49 families. On the other hand, families with 5 or more children have the lowest poverty rate of 0.0%, which includes 0 families.
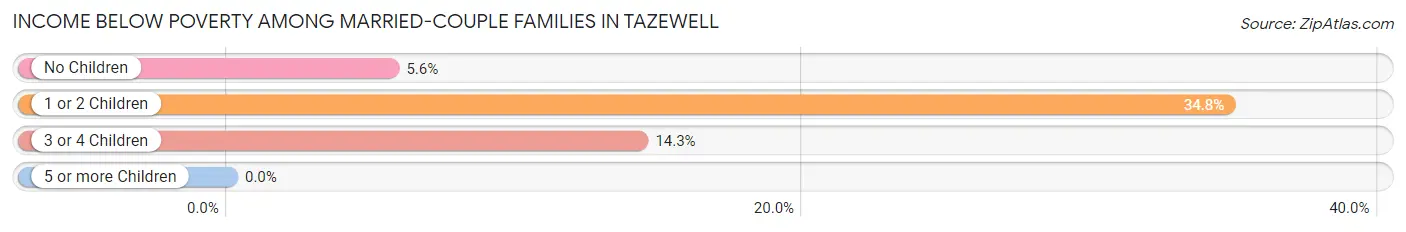
| Children | Above Poverty | Below Poverty |
| No Children | 168 (94.4%) | 10 (5.6%) |
| 1 or 2 Children | 92 (65.2%) | 49 (34.7%) |
| 3 or 4 Children | 30 (85.7%) | 5 (14.3%) |
| 5 or more Children | 7 (100.0%) | 0 (0.0%) |
| Total | 297 (82.3%) | 64 (17.7%) |
Income Below Poverty Among Single-Parent Households in Tazewell
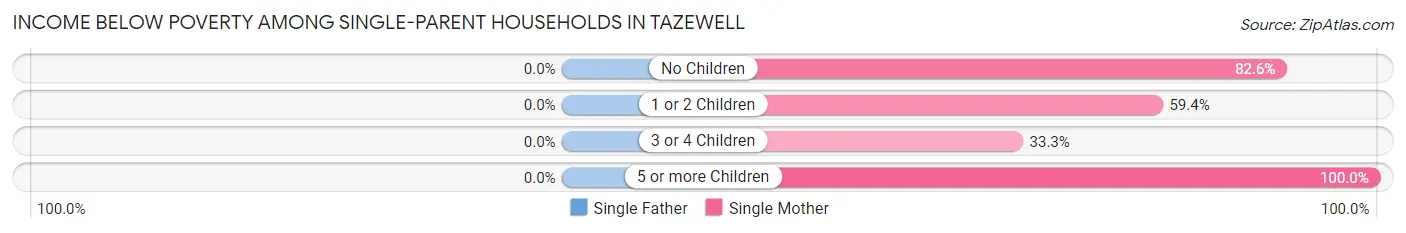
| Children | Single Father | Single Mother |
| No Children | 0 (0.0%) | 19 (82.6%) |
| 1 or 2 Children | 0 (0.0%) | 19 (59.4%) |
| 3 or 4 Children | 0 (0.0%) | 2 (33.3%) |
| 5 or more Children | 0 (0.0%) | 22 (100.0%) |
| Total | 0 (0.0%) | 62 (74.7%) |
Income Below Poverty Among Married-Couple vs Single-Parent Households in Tazewell
The poverty data for Tazewell shows that 64 of the married-couple family households (17.7%) and 62 of the single-parent households (47.0%) are living below the poverty level. Within the married-couple family households, those with 1 or 2 children have the highest poverty rate, with 49 households (34.7%) falling below the poverty line. Among the single-parent households, those with 5 or more children have the highest poverty rate, with 22 household (100.0%) living below poverty.
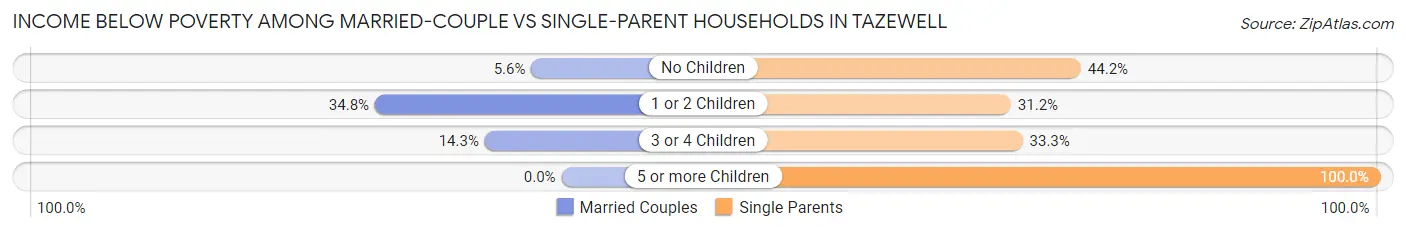
| Children | Married-Couple Families | Single-Parent Households |
| No Children | 10 (5.6%) | 19 (44.2%) |
| 1 or 2 Children | 49 (34.7%) | 19 (31.1%) |
| 3 or 4 Children | 5 (14.3%) | 2 (33.3%) |
| 5 or more Children | 0 (0.0%) | 22 (100.0%) |
| Total | 64 (17.7%) | 62 (47.0%) |
Race in Tazewell
The most populous races in Tazewell are White / Caucasian (2,103 | 95.3%), Two or more Races (44 | 2.0%), and Asian (28 | 1.3%).
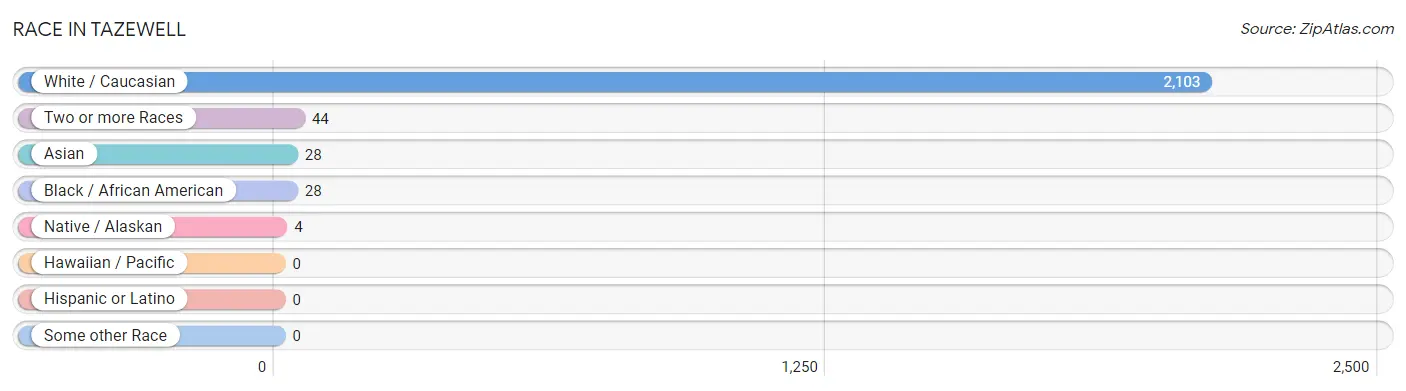
| Race | # Population | % Population |
| Asian | 28 | 1.3% |
| Black / African American | 28 | 1.3% |
| Hawaiian / Pacific | 0 | 0.0% |
| Hispanic or Latino | 0 | 0.0% |
| Native / Alaskan | 4 | 0.2% |
| White / Caucasian | 2,103 | 95.3% |
| Two or more Races | 44 | 2.0% |
| Some other Race | 0 | 0.0% |
| Total | 2,207 | 100.0% |
Ancestry in Tazewell
The most populous ancestries reported in Tazewell are American (360 | 16.3%), Irish (263 | 11.9%), German (168 | 7.6%), English (123 | 5.6%), and Scottish (78 | 3.5%), together accounting for 44.9% of all Tazewell residents.
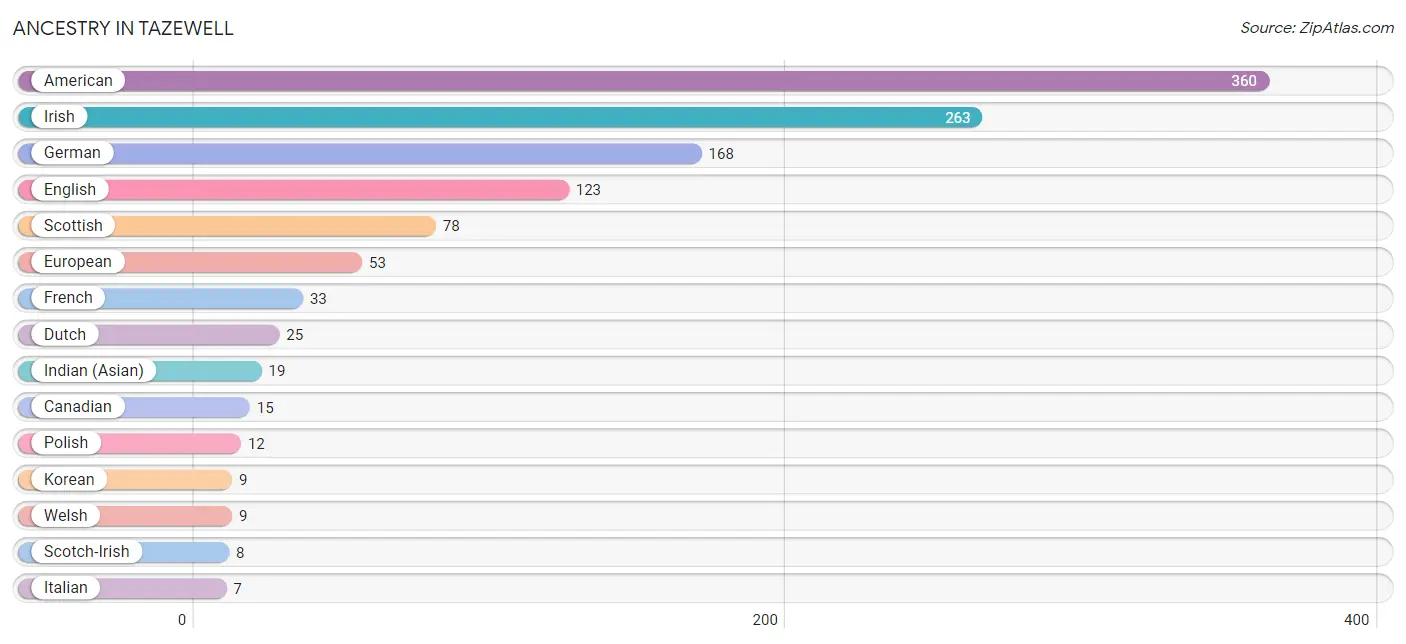
| Ancestry | # Population | % Population |
| American | 360 | 16.3% |
| Arab | 4 | 0.2% |
| Canadian | 15 | 0.7% |
| Cherokee | 6 | 0.3% |
| Dutch | 25 | 1.1% |
| English | 123 | 5.6% |
| European | 53 | 2.4% |
| French | 33 | 1.5% |
| German | 168 | 7.6% |
| Indian (Asian) | 19 | 0.9% |
| Irish | 263 | 11.9% |
| Italian | 7 | 0.3% |
| Korean | 9 | 0.4% |
| Palestinian | 4 | 0.2% |
| Polish | 12 | 0.5% |
| Scotch-Irish | 8 | 0.4% |
| Scottish | 78 | 3.5% |
| Slovak | 1 | 0.1% |
| Swedish | 5 | 0.2% |
| Welsh | 9 | 0.4% | View All 20 Rows |
Immigrants in Tazewell
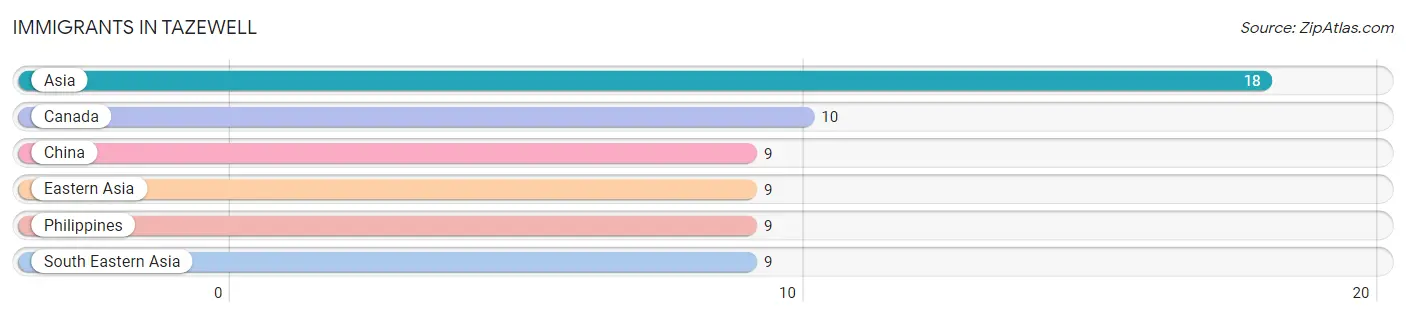
The most numerous immigrant groups reported in Tazewell came from Asia (18 | 0.8%), Canada (10 | 0.4%), China (9 | 0.4%), Eastern Asia (9 | 0.4%), and Philippines (9 | 0.4%), together accounting for 2.5% of all Tazewell residents.
| Immigration Origin | # Population | % Population |
| Asia | 18 | 0.8% |
| Canada | 10 | 0.4% |
| China | 9 | 0.4% |
| Eastern Asia | 9 | 0.4% |
| Philippines | 9 | 0.4% |
| South Eastern Asia | 9 | 0.4% | View All 6 Rows |
Sex and Age in Tazewell
Sex and Age in Tazewell
The most populous age groups in Tazewell are 20 to 24 Years (110 | 10.6%) for men and 85 Years and over (115 | 9.9%) for women.
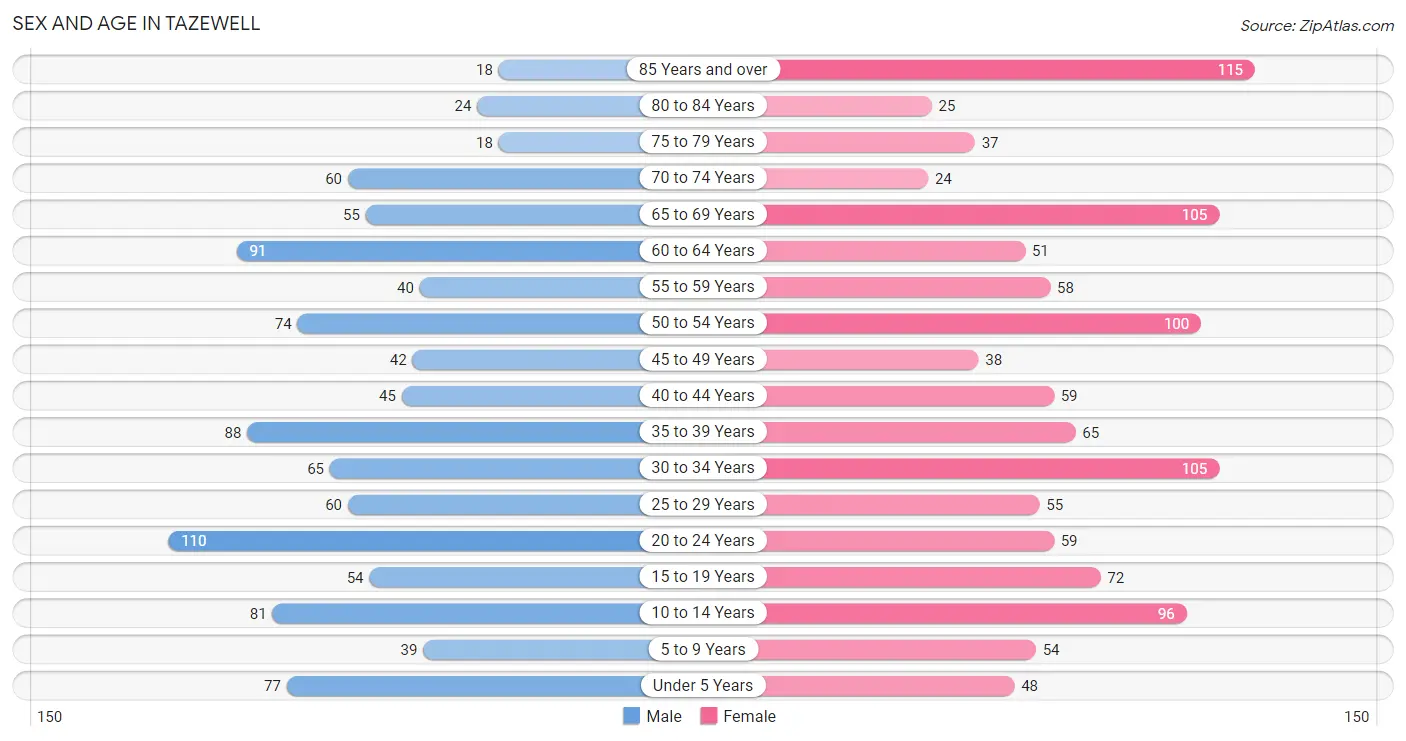
| Age Bracket | Male | Female |
| Under 5 Years | 77 (7.4%) | 48 (4.1%) |
| 5 to 9 Years | 39 (3.7%) | 54 (4.6%) |
| 10 to 14 Years | 81 (7.8%) | 96 (8.2%) |
| 15 to 19 Years | 54 (5.2%) | 72 (6.2%) |
| 20 to 24 Years | 110 (10.6%) | 59 (5.1%) |
| 25 to 29 Years | 60 (5.8%) | 55 (4.7%) |
| 30 to 34 Years | 65 (6.2%) | 105 (9.0%) |
| 35 to 39 Years | 88 (8.5%) | 65 (5.6%) |
| 40 to 44 Years | 45 (4.3%) | 59 (5.1%) |
| 45 to 49 Years | 42 (4.0%) | 38 (3.3%) |
| 50 to 54 Years | 74 (7.1%) | 100 (8.6%) |
| 55 to 59 Years | 40 (3.8%) | 58 (5.0%) |
| 60 to 64 Years | 91 (8.7%) | 51 (4.4%) |
| 65 to 69 Years | 55 (5.3%) | 105 (9.0%) |
| 70 to 74 Years | 60 (5.8%) | 24 (2.1%) |
| 75 to 79 Years | 18 (1.7%) | 37 (3.2%) |
| 80 to 84 Years | 24 (2.3%) | 25 (2.1%) |
| 85 Years and over | 18 (1.7%) | 115 (9.9%) |
| Total | 1,041 (100.0%) | 1,166 (100.0%) |
Families and Households in Tazewell
Median Family Size in Tazewell
The median family size in Tazewell is 3.19 persons per family, with married-couple families (361 | 73.2%) accounting for the largest median family size of 3.3 persons per family. On the other hand, single male/father families (49 | 9.9%) represent the smallest median family size with 2.71 persons per family.
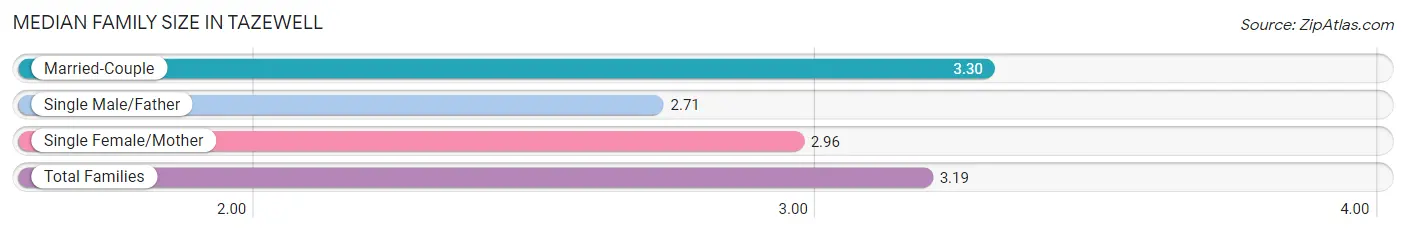
| Family Type | # Families | Family Size |
| Married-Couple | 361 (73.2%) | 3.30 |
| Single Male/Father | 49 (9.9%) | 2.71 |
| Single Female/Mother | 83 (16.8%) | 2.96 |
| Total Families | 493 (100.0%) | 3.19 |
Median Household Size in Tazewell
The median household size in Tazewell is 2.23 persons per household, with married-couple households (361 | 38.2%) accounting for the largest median household size of 3.32 persons per household. non-family households (453 | 47.9%) represent the smallest median household size with 1.09 persons per household.
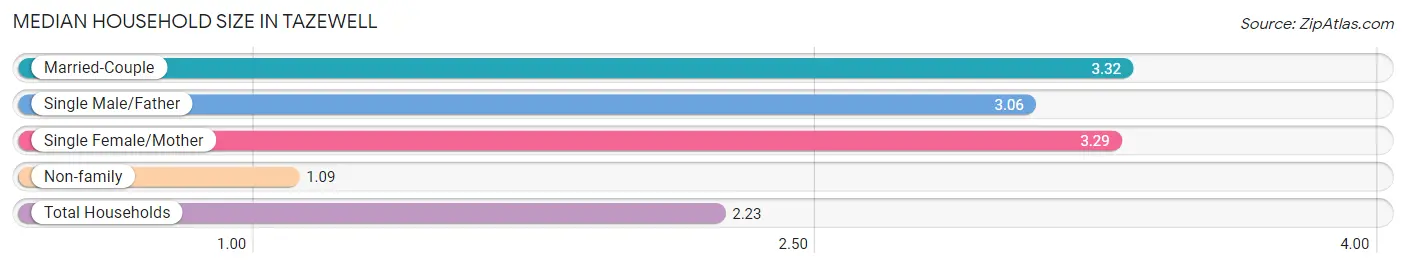
| Household Type | # Households | Household Size |
| Married-Couple | 361 (38.2%) | 3.32 |
| Single Male/Father | 49 (5.2%) | 3.06 |
| Single Female/Mother | 83 (8.8%) | 3.29 |
| Non-family | 453 (47.9%) | 1.09 |
| Total Households | 946 (100.0%) | 2.23 |
Household Size by Marriage Status in Tazewell
Out of a total of 946 households in Tazewell, 493 (52.1%) are family households, while 453 (47.9%) are nonfamily households. The most numerous type of family households are 2-person households, comprising 203, and the most common type of nonfamily households are 1-person households, comprising 430.
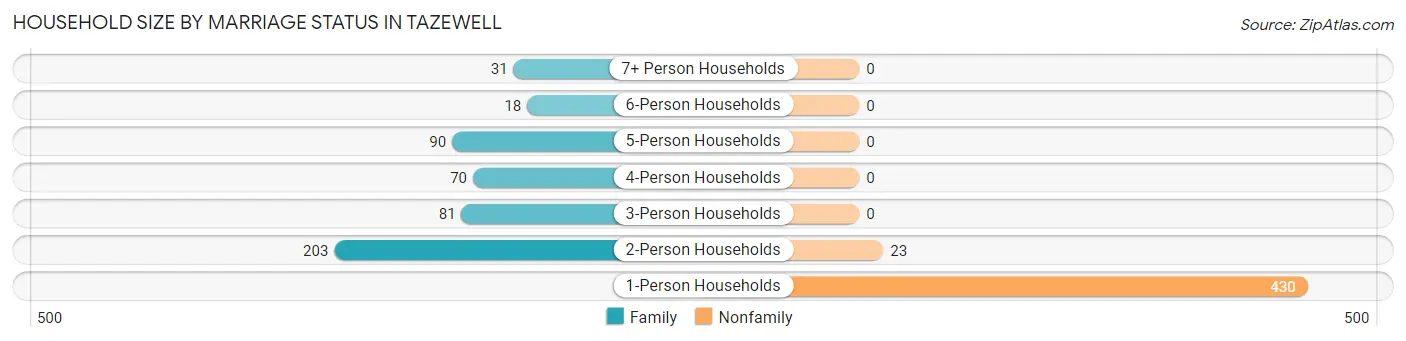
| Household Size | Family Households | Nonfamily Households |
| 1-Person Households | - | 430 (45.5%) |
| 2-Person Households | 203 (21.5%) | 23 (2.4%) |
| 3-Person Households | 81 (8.6%) | 0 (0.0%) |
| 4-Person Households | 70 (7.4%) | 0 (0.0%) |
| 5-Person Households | 90 (9.5%) | 0 (0.0%) |
| 6-Person Households | 18 (1.9%) | 0 (0.0%) |
| 7+ Person Households | 31 (3.3%) | 0 (0.0%) |
| Total | 493 (52.1%) | 453 (47.9%) |
Female Fertility in Tazewell
Fertility by Age in Tazewell
Average fertility rate in Tazewell is 84.0 births per 1,000 women. Women in the age bracket of 35 to 50 years have the highest fertility rate with 108.0 births per 1,000 women. Women in the age bracket of 20 to 34 years acount for 51.3% of all women with births.
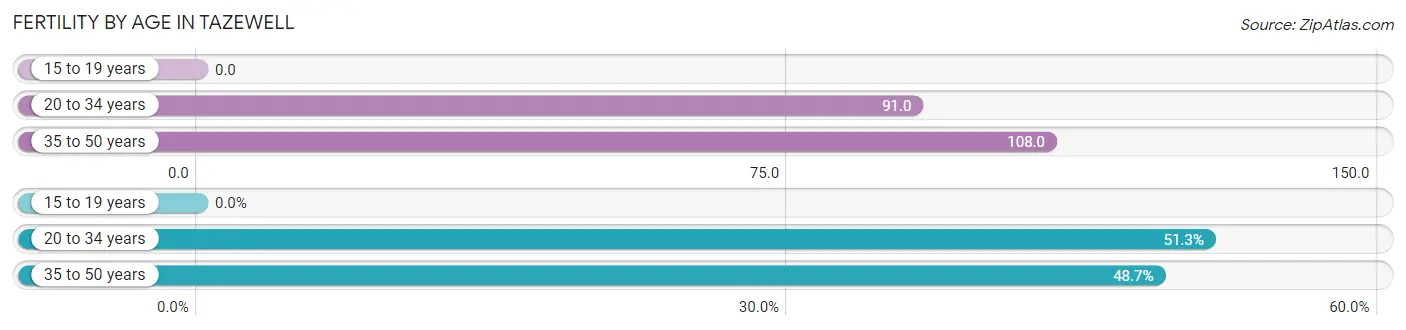
| Age Bracket | Women with Births | Births / 1,000 Women |
| 15 to 19 years | 0 (0.0%) | 0.0 |
| 20 to 34 years | 20 (51.3%) | 91.0 |
| 35 to 50 years | 19 (48.7%) | 108.0 |
| Total | 39 (100.0%) | 84.0 |
Fertility by Age by Marriage Status in Tazewell
17.9% of women with births (39) in Tazewell are married. The highest percentage of unmarried women with births falls into 35 to 50 years age bracket with 100.0% of them unmarried at the time of birth, while the lowest percentage of unmarried women with births belong to 20 to 34 years age bracket with 65.0% of them unmarried.
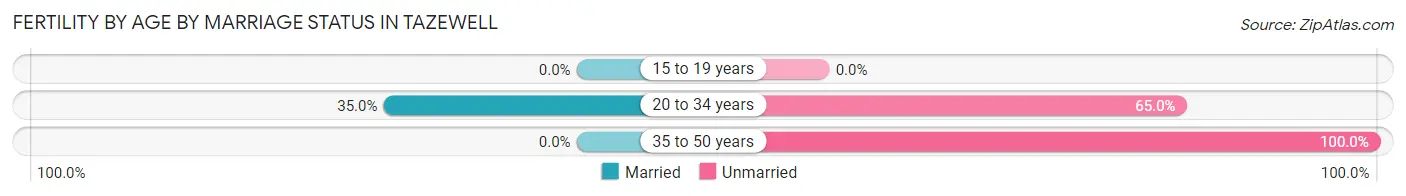
| Age Bracket | Married | Unmarried |
| 15 to 19 years | 0 (0.0%) | 0 (0.0%) |
| 20 to 34 years | 7 (35.0%) | 13 (65.0%) |
| 35 to 50 years | 0 (0.0%) | 19 (100.0%) |
| Total | 7 (17.9%) | 32 (82.1%) |
Fertility by Education in Tazewell
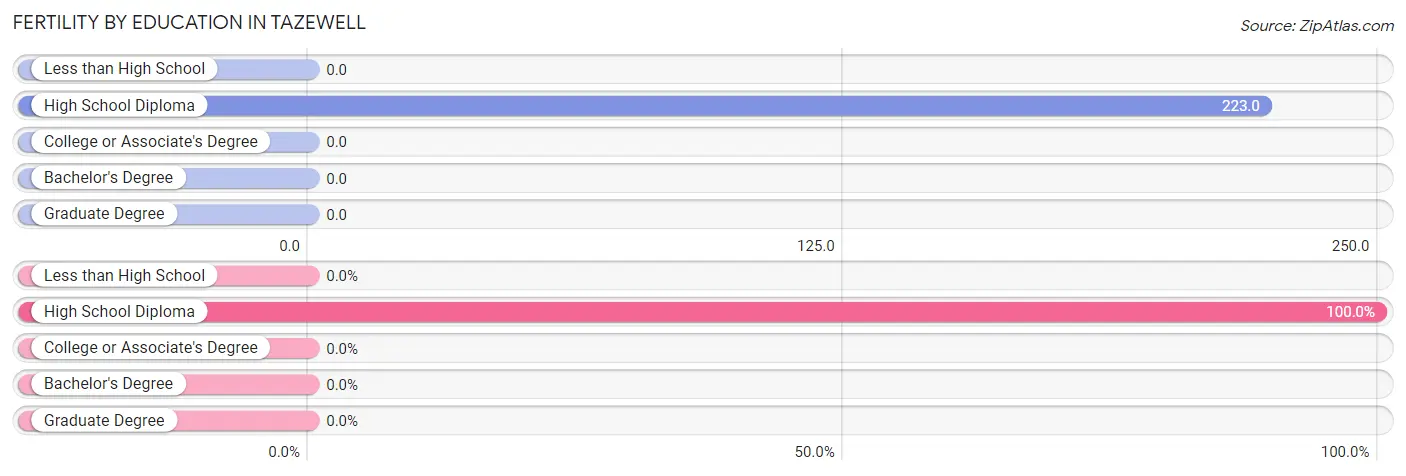
| Educational Attainment | Women with Births | Births / 1,000 Women |
| Less than High School | 0 (0.0%) | 0.0 |
| High School Diploma | 39 (100.0%) | 223.0 |
| College or Associate's Degree | 0 (0.0%) | 0.0 |
| Bachelor's Degree | 0 (0.0%) | 0.0 |
| Graduate Degree | 0 (0.0%) | 0.0 |
| Total | 39 (100.0%) | 84.0 |
Fertility by Education by Marriage Status in Tazewell
82.1% of women with births in Tazewell are unmarried. Women with the educational attainment of high school diploma are most likely to be married with 17.9% of them married at childbirth, while women with the educational attainment of high school diploma are least likely to be married with 82.1% of them unmarried at childbirth.
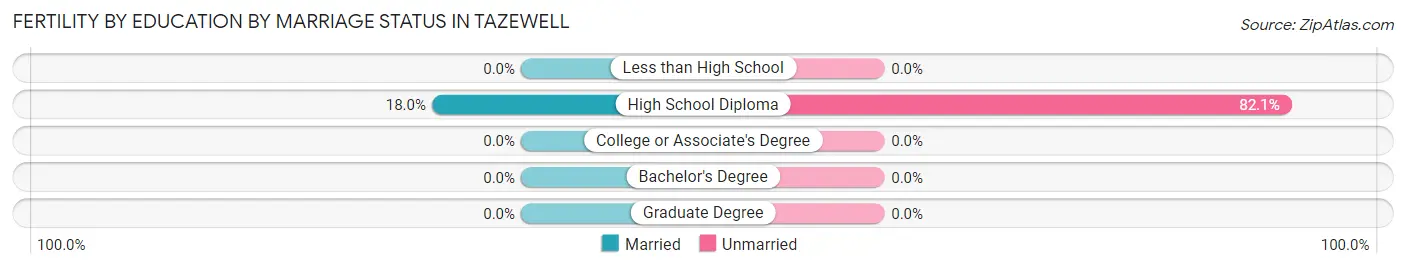
| Educational Attainment | Married | Unmarried |
| Less than High School | 0 (0.0%) | 0 (0.0%) |
| High School Diploma | 7 (17.9%) | 32 (82.1%) |
| College or Associate's Degree | 0 (0.0%) | 0 (0.0%) |
| Bachelor's Degree | 0 (0.0%) | 0 (0.0%) |
| Graduate Degree | 0 (0.0%) | 0 (0.0%) |
| Total | 7 (17.9%) | 32 (82.1%) |
Employment Characteristics in Tazewell
Employment by Class of Employer in Tazewell
Among the 629 employed individuals in Tazewell, private company employees (509 | 80.9%), local government employees (65 | 10.3%), and not-for-profit organizations (29 | 4.6%) make up the most common classes of employment.
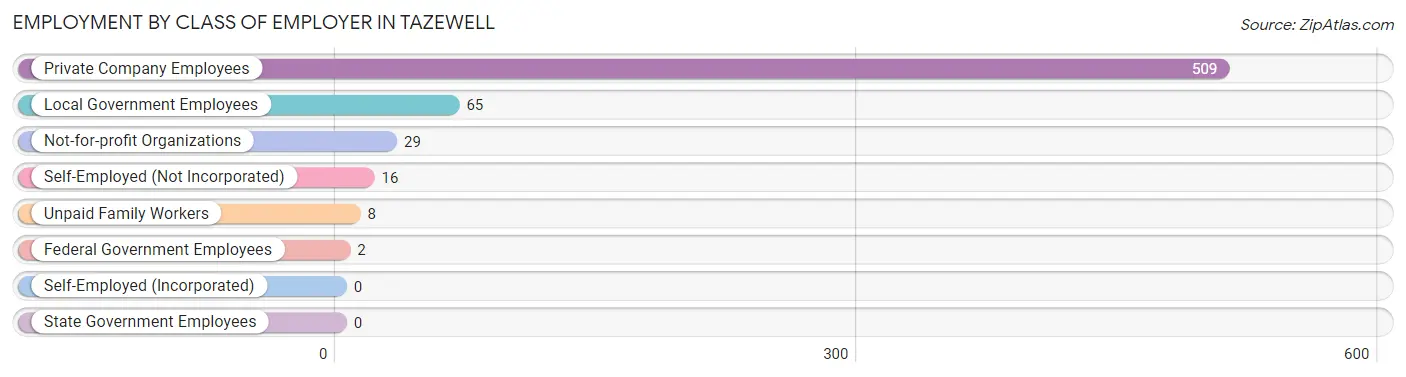
| Employer Class | # Employees | % Employees |
| Private Company Employees | 509 | 80.9% |
| Self-Employed (Incorporated) | 0 | 0.0% |
| Self-Employed (Not Incorporated) | 16 | 2.5% |
| Not-for-profit Organizations | 29 | 4.6% |
| Local Government Employees | 65 | 10.3% |
| State Government Employees | 0 | 0.0% |
| Federal Government Employees | 2 | 0.3% |
| Unpaid Family Workers | 8 | 1.3% |
| Total | 629 | 100.0% |
Employment Status by Age in Tazewell
According to the labor force statistics for Tazewell, out of the total population over 16 years of age (1,762), 39.2% or 691 individuals are in the labor force, with 7.2% or 50 of them unemployed. The age group with the highest labor force participation rate is 35 to 44 years, with 66.1% or 170 individuals in the labor force. Within the labor force, the 25 to 29 years age range has the highest percentage of unemployed individuals, with 22.2% or 16 of them being unemployed.
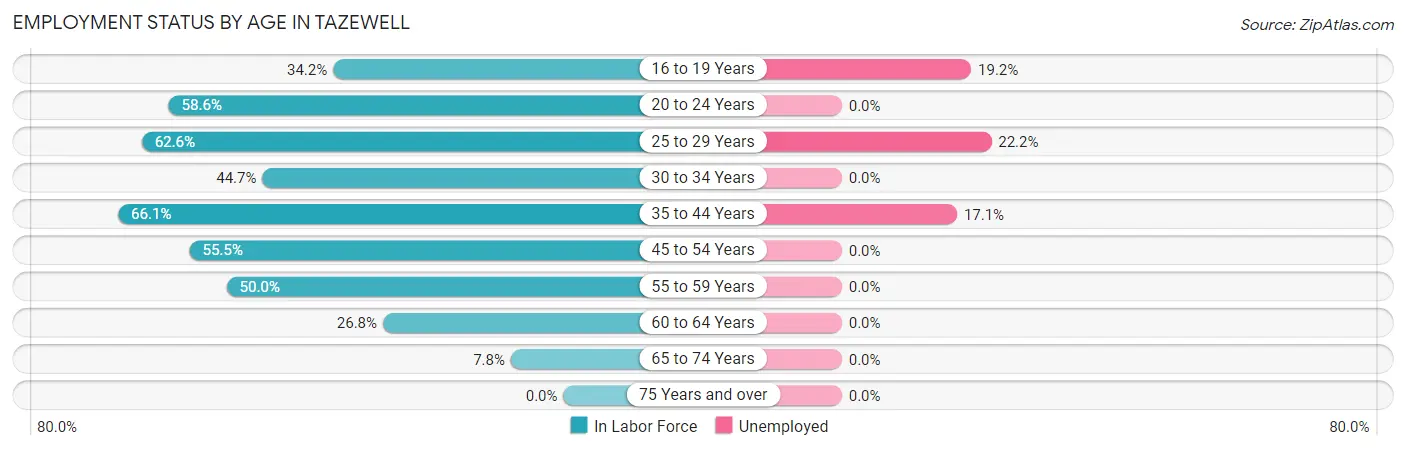
| Age Bracket | In Labor Force | Unemployed |
| 16 to 19 Years | 26 (34.2%) | 5 (19.2%) |
| 20 to 24 Years | 99 (58.6%) | 0 (0.0%) |
| 25 to 29 Years | 72 (62.6%) | 16 (22.2%) |
| 30 to 34 Years | 76 (44.7%) | 0 (0.0%) |
| 35 to 44 Years | 170 (66.1%) | 29 (17.1%) |
| 45 to 54 Years | 141 (55.5%) | 0 (0.0%) |
| 55 to 59 Years | 49 (50.0%) | 0 (0.0%) |
| 60 to 64 Years | 38 (26.8%) | 0 (0.0%) |
| 65 to 74 Years | 19 (7.8%) | 0 (0.0%) |
| 75 Years and over | 0 (0.0%) | 0 (0.0%) |
| Total | 691 (39.2%) | 50 (7.2%) |
Employment Status by Educational Attainment in Tazewell
According to labor force statistics for Tazewell, 52.7% of individuals (546) out of the total population between 25 and 64 years of age (1,036) are in the labor force, with 8.2% or 45 of them being unemployed. The group with the highest labor force participation rate are those with the educational attainment of college / associate degree, with 61.0% or 203 individuals in the labor force. Within the labor force, individuals with high school diploma education have the highest percentage of unemployment, with 12.2% or 32 of them being unemployed.
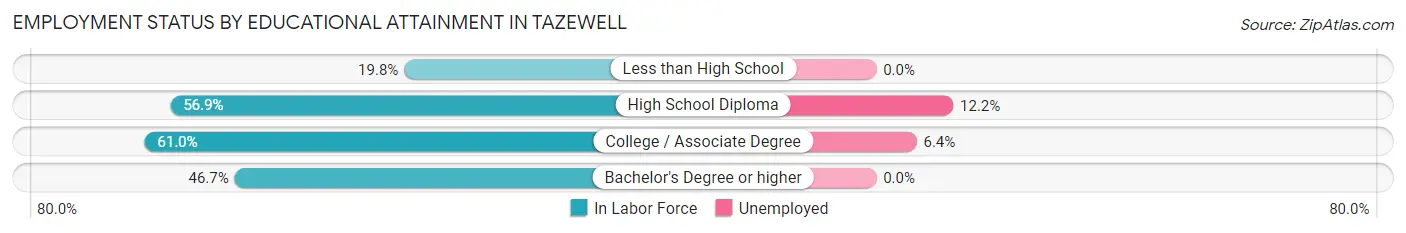
| Educational Attainment | In Labor Force | Unemployed |
| Less than High School | 24 (19.8%) | 0 (0.0%) |
| High School Diploma | 263 (56.9%) | 56 (12.2%) |
| College / Associate Degree | 203 (61.0%) | 21 (6.4%) |
| Bachelor's Degree or higher | 56 (46.7%) | 0 (0.0%) |
| Total | 546 (52.7%) | 85 (8.2%) |
Employment Occupations by Sex in Tazewell
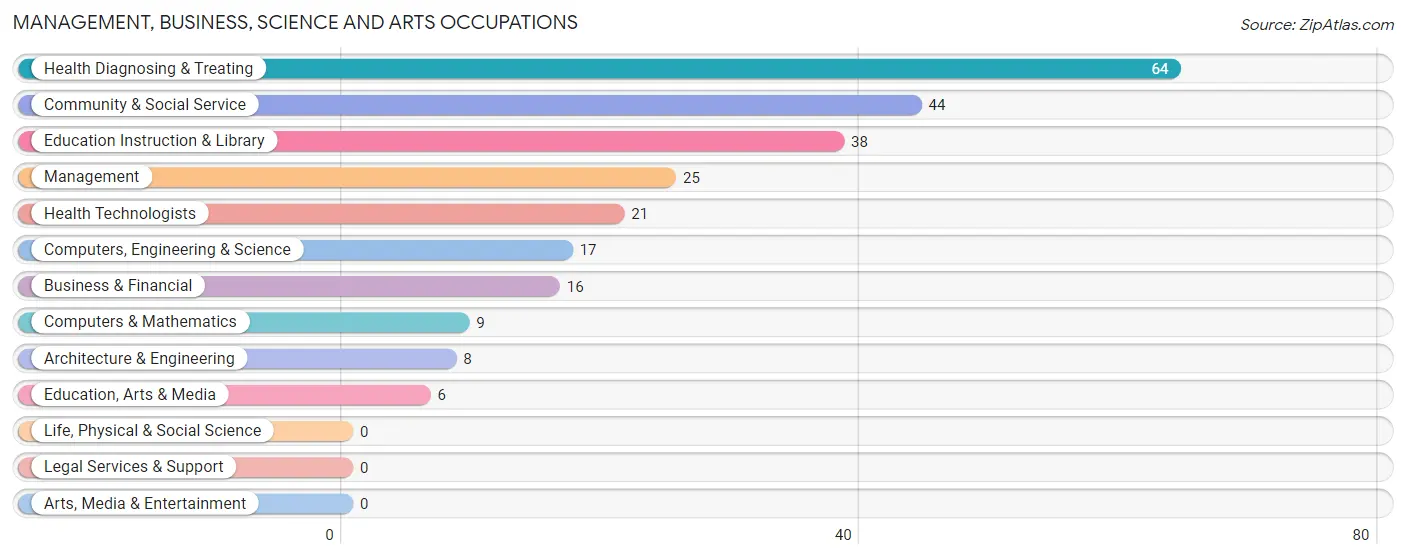
Management, Business, Science and Arts Occupations
The most common Management, Business, Science and Arts occupations in Tazewell are Health Diagnosing & Treating (64 | 10.0%), Community & Social Service (44 | 6.9%), Education Instruction & Library (38 | 5.9%), Management (25 | 3.9%), and Health Technologists (21 | 3.3%).
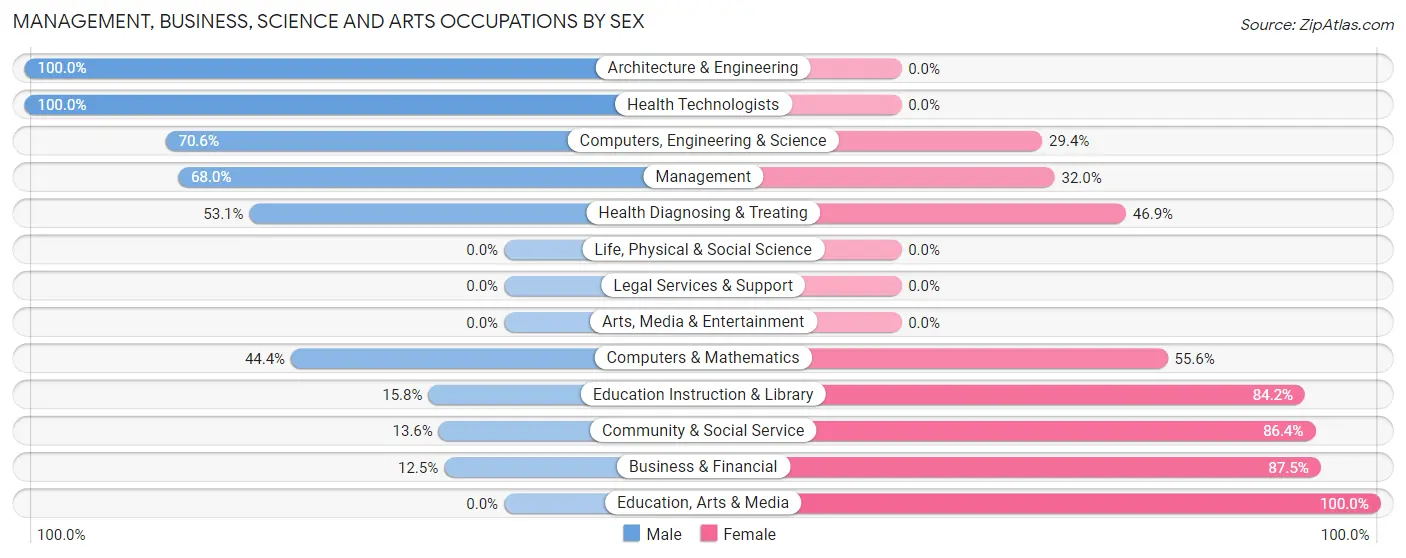
Management, Business, Science and Arts Occupations by Sex
Within the Management, Business, Science and Arts occupations in Tazewell, the most male-oriented occupations are Architecture & Engineering (100.0%), Health Technologists (100.0%), and Computers, Engineering & Science (70.6%), while the most female-oriented occupations are Education, Arts & Media (100.0%), Business & Financial (87.5%), and Community & Social Service (86.4%).
| Occupation | Male | Female |
| Management | 17 (68.0%) | 8 (32.0%) |
| Business & Financial | 2 (12.5%) | 14 (87.5%) |
| Computers, Engineering & Science | 12 (70.6%) | 5 (29.4%) |
| Computers & Mathematics | 4 (44.4%) | 5 (55.6%) |
| Architecture & Engineering | 8 (100.0%) | 0 (0.0%) |
| Life, Physical & Social Science | 0 (0.0%) | 0 (0.0%) |
| Community & Social Service | 6 (13.6%) | 38 (86.4%) |
| Education, Arts & Media | 0 (0.0%) | 6 (100.0%) |
| Legal Services & Support | 0 (0.0%) | 0 (0.0%) |
| Education Instruction & Library | 6 (15.8%) | 32 (84.2%) |
| Arts, Media & Entertainment | 0 (0.0%) | 0 (0.0%) |
| Health Diagnosing & Treating | 34 (53.1%) | 30 (46.9%) |
| Health Technologists | 21 (100.0%) | 0 (0.0%) |
| Total (Category) | 71 (42.8%) | 95 (57.2%) |
| Total (Overall) | 391 (61.1%) | 249 (38.9%) |
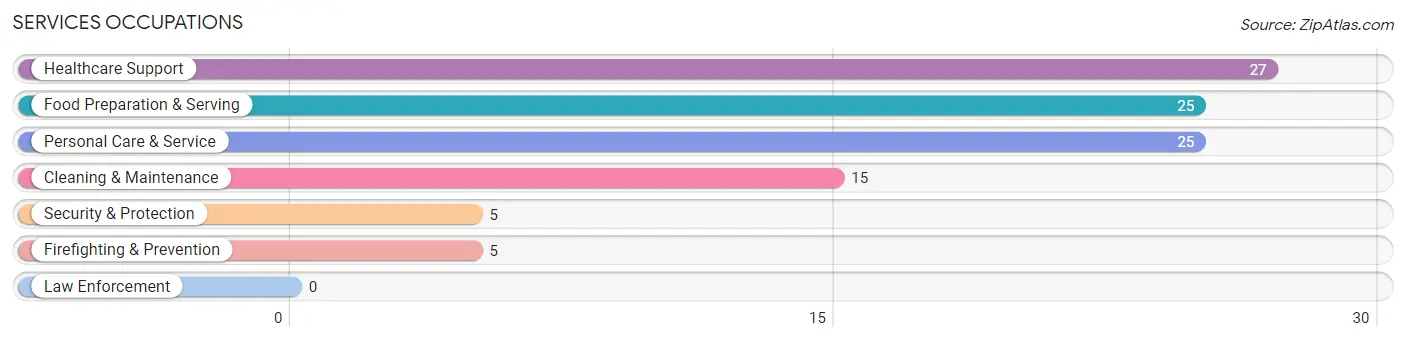
Services Occupations
The most common Services occupations in Tazewell are Healthcare Support (27 | 4.2%), Food Preparation & Serving (25 | 3.9%), Personal Care & Service (25 | 3.9%), Cleaning & Maintenance (15 | 2.3%), and Security & Protection (5 | 0.8%).
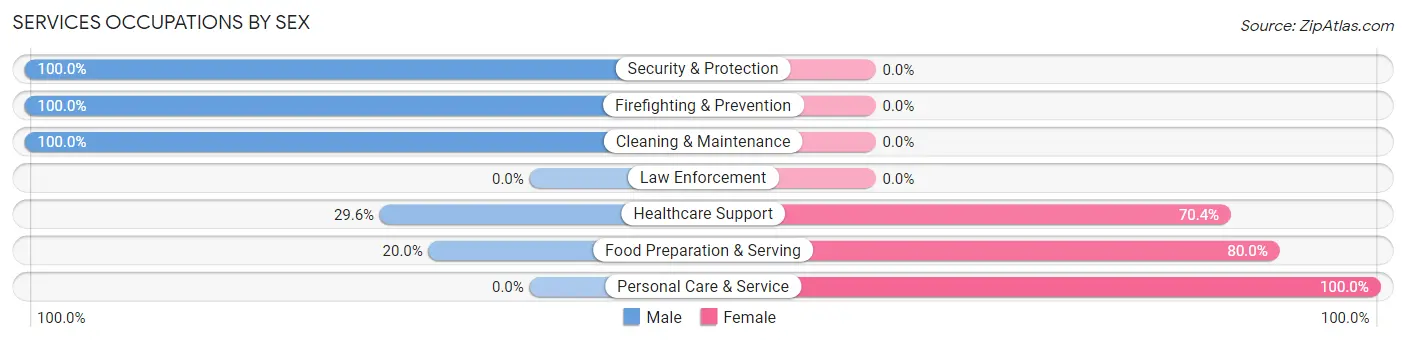
Services Occupations by Sex
Within the Services occupations in Tazewell, the most male-oriented occupations are Security & Protection (100.0%), Firefighting & Prevention (100.0%), and Cleaning & Maintenance (100.0%), while the most female-oriented occupations are Personal Care & Service (100.0%), Food Preparation & Serving (80.0%), and Healthcare Support (70.4%).
| Occupation | Male | Female |
| Healthcare Support | 8 (29.6%) | 19 (70.4%) |
| Security & Protection | 5 (100.0%) | 0 (0.0%) |
| Firefighting & Prevention | 5 (100.0%) | 0 (0.0%) |
| Law Enforcement | 0 (0.0%) | 0 (0.0%) |
| Food Preparation & Serving | 5 (20.0%) | 20 (80.0%) |
| Cleaning & Maintenance | 15 (100.0%) | 0 (0.0%) |
| Personal Care & Service | 0 (0.0%) | 25 (100.0%) |
| Total (Category) | 33 (34.0%) | 64 (66.0%) |
| Total (Overall) | 391 (61.1%) | 249 (38.9%) |
Sales and Office Occupations
The most common Sales and Office occupations in Tazewell are Sales & Related (62 | 9.7%), and Office & Administration (41 | 6.4%).

Sales and Office Occupations by Sex

| Occupation | Male | Female |
| Sales & Related | 33 (53.2%) | 29 (46.8%) |
| Office & Administration | 0 (0.0%) | 41 (100.0%) |
| Total (Category) | 33 (32.0%) | 70 (68.0%) |
| Total (Overall) | 391 (61.1%) | 249 (38.9%) |
Natural Resources, Construction and Maintenance Occupations
The most common Natural Resources, Construction and Maintenance occupations in Tazewell are , and Construction & Extraction (47 | 7.3%).

Natural Resources, Construction and Maintenance Occupations by Sex

| Occupation | Male | Female |
| Farming, Fishing & Forestry | 0 (0.0%) | 0 (0.0%) |
| Construction & Extraction | 43 (91.5%) | 4 (8.5%) |
| Installation, Maintenance & Repair | 0 (0.0%) | 0 (0.0%) |
| Total (Category) | 43 (91.5%) | 4 (8.5%) |
| Total (Overall) | 391 (61.1%) | 249 (38.9%) |
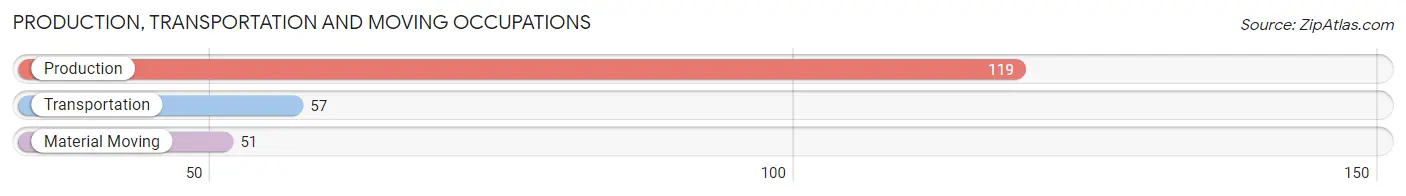
Production, Transportation and Moving Occupations
The most common Production, Transportation and Moving occupations in Tazewell are Production (119 | 18.6%), Transportation (57 | 8.9%), and Material Moving (51 | 8.0%).
Production, Transportation and Moving Occupations by Sex
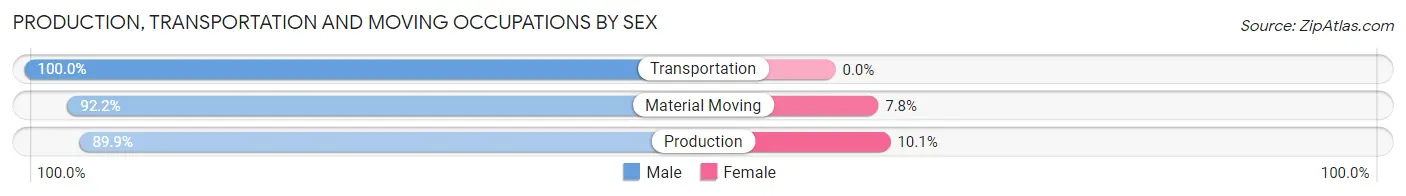
| Occupation | Male | Female |
| Production | 107 (89.9%) | 12 (10.1%) |
| Transportation | 57 (100.0%) | 0 (0.0%) |
| Material Moving | 47 (92.2%) | 4 (7.8%) |
| Total (Category) | 211 (92.9%) | 16 (7.0%) |
| Total (Overall) | 391 (61.1%) | 249 (38.9%) |
Employment Industries by Sex in Tazewell
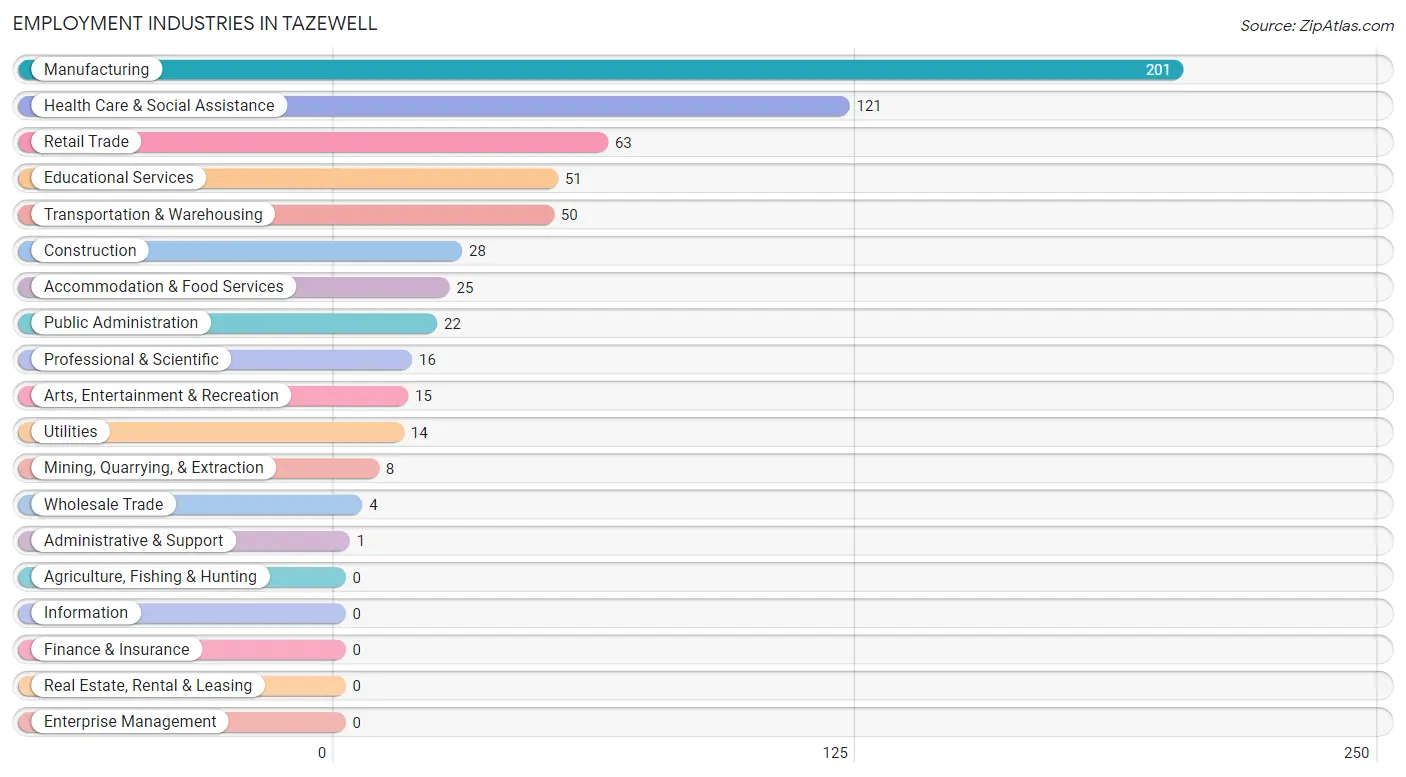
Employment Industries in Tazewell
The major employment industries in Tazewell include Manufacturing (201 | 31.4%), Health Care & Social Assistance (121 | 18.9%), Retail Trade (63 | 9.8%), Educational Services (51 | 8.0%), and Transportation & Warehousing (50 | 7.8%).
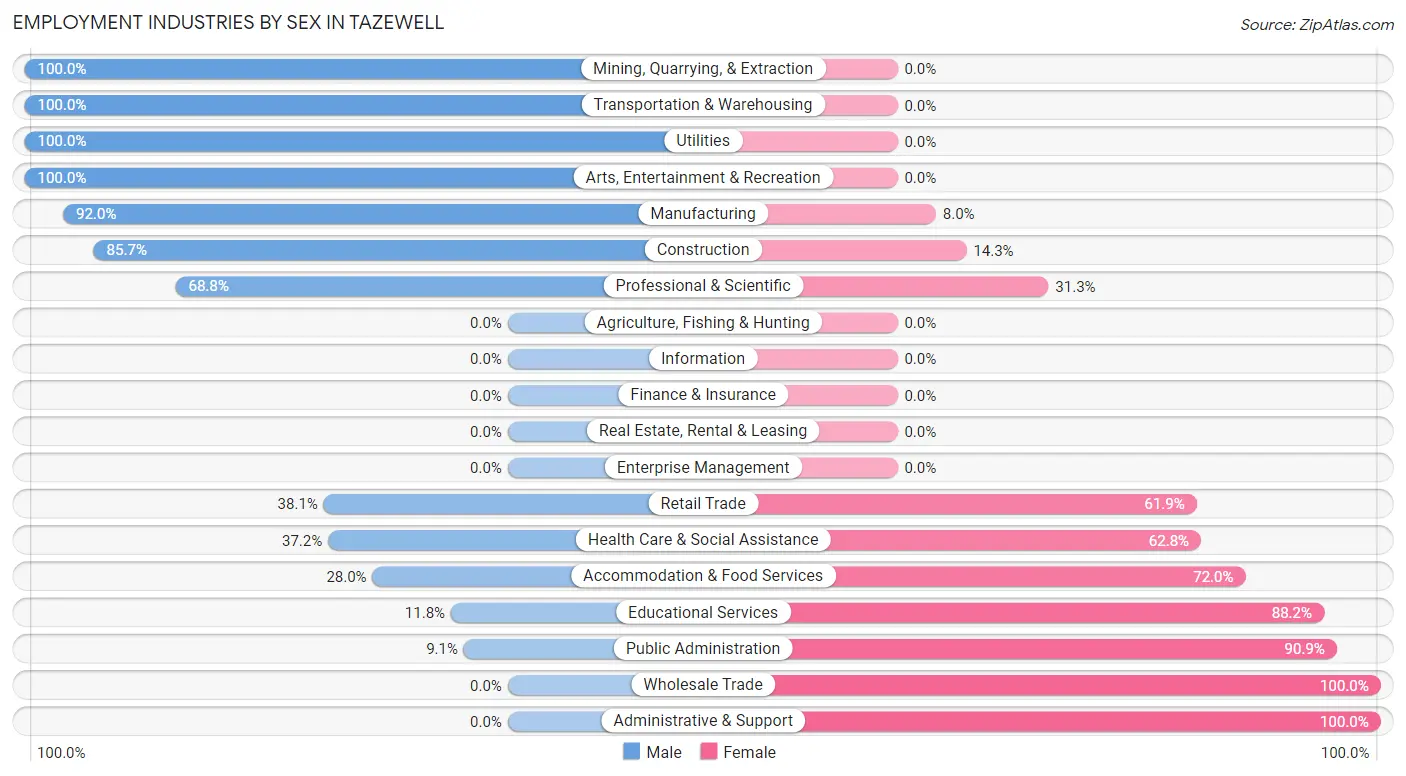
Employment Industries by Sex in Tazewell
The Tazewell industries that see more men than women are Mining, Quarrying, & Extraction (100.0%), Transportation & Warehousing (100.0%), and Utilities (100.0%), whereas the industries that tend to have a higher number of women are Wholesale Trade (100.0%), Administrative & Support (100.0%), and Public Administration (90.9%).
| Industry | Male | Female |
| Agriculture, Fishing & Hunting | 0 (0.0%) | 0 (0.0%) |
| Mining, Quarrying, & Extraction | 8 (100.0%) | 0 (0.0%) |
| Construction | 24 (85.7%) | 4 (14.3%) |
| Manufacturing | 185 (92.0%) | 16 (8.0%) |
| Wholesale Trade | 0 (0.0%) | 4 (100.0%) |
| Retail Trade | 24 (38.1%) | 39 (61.9%) |
| Transportation & Warehousing | 50 (100.0%) | 0 (0.0%) |
| Utilities | 14 (100.0%) | 0 (0.0%) |
| Information | 0 (0.0%) | 0 (0.0%) |
| Finance & Insurance | 0 (0.0%) | 0 (0.0%) |
| Real Estate, Rental & Leasing | 0 (0.0%) | 0 (0.0%) |
| Professional & Scientific | 11 (68.8%) | 5 (31.2%) |
| Enterprise Management | 0 (0.0%) | 0 (0.0%) |
| Administrative & Support | 0 (0.0%) | 1 (100.0%) |
| Educational Services | 6 (11.8%) | 45 (88.2%) |
| Health Care & Social Assistance | 45 (37.2%) | 76 (62.8%) |
| Arts, Entertainment & Recreation | 15 (100.0%) | 0 (0.0%) |
| Accommodation & Food Services | 7 (28.0%) | 18 (72.0%) |
| Public Administration | 2 (9.1%) | 20 (90.9%) |
| Total | 391 (61.1%) | 249 (38.9%) |
Education in Tazewell
School Enrollment in Tazewell
The most common levels of schooling among the 492 students in Tazewell are middle school (129 | 26.2%), high school (110 | 22.4%), and elementary school (94 | 19.1%).
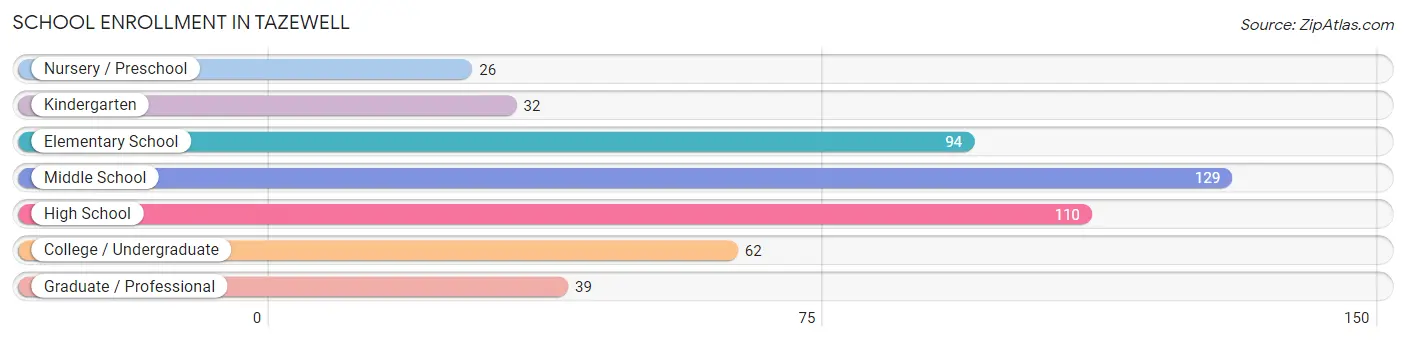
| School Level | # Students | % Students |
| Nursery / Preschool | 26 | 5.3% |
| Kindergarten | 32 | 6.5% |
| Elementary School | 94 | 19.1% |
| Middle School | 129 | 26.2% |
| High School | 110 | 22.4% |
| College / Undergraduate | 62 | 12.6% |
| Graduate / Professional | 39 | 7.9% |
| Total | 492 | 100.0% |
School Enrollment by Age by Funding Source in Tazewell
Out of a total of 492 students who are enrolled in schools in Tazewell, 45 (9.1%) attend a private institution, while the remaining 447 (90.9%) are enrolled in public schools. The age group of 20 to 24 year olds has the highest likelihood of being enrolled in private schools, with 31 (81.6% in the age bracket) enrolled. Conversely, the age group of 3 to 4 year olds has the lowest likelihood of being enrolled in a private school, with 26 (100.0% in the age bracket) attending a public institution.
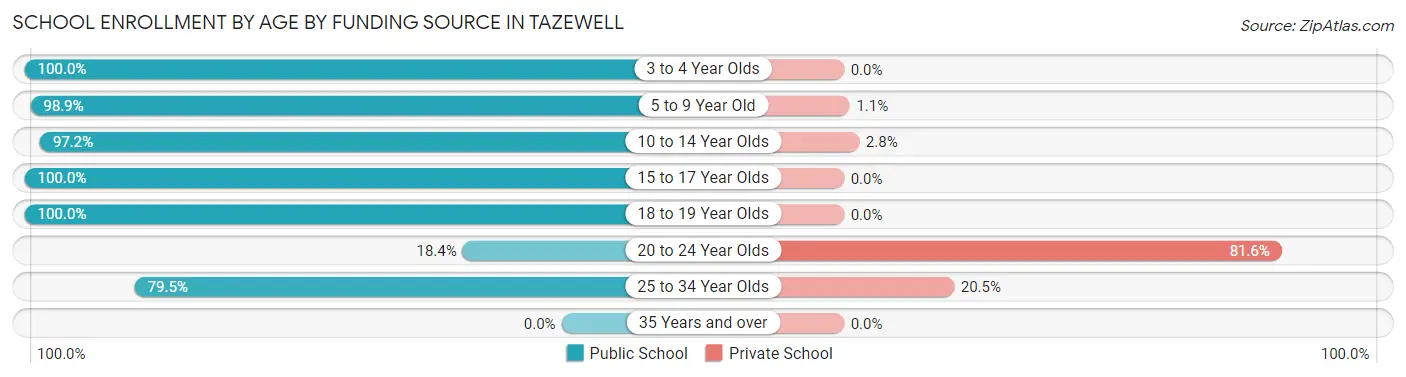
| Age Bracket | Public School | Private School |
| 3 to 4 Year Olds | 26 (100.0%) | 0 (0.0%) |
| 5 to 9 Year Old | 92 (98.9%) | 1 (1.1%) |
| 10 to 14 Year Olds | 171 (97.2%) | 5 (2.8%) |
| 15 to 17 Year Olds | 80 (100.0%) | 0 (0.0%) |
| 18 to 19 Year Olds | 40 (100.0%) | 0 (0.0%) |
| 20 to 24 Year Olds | 7 (18.4%) | 31 (81.6%) |
| 25 to 34 Year Olds | 31 (79.5%) | 8 (20.5%) |
| 35 Years and over | 0 (0.0%) | 0 (0.0%) |
| Total | 447 (90.9%) | 45 (9.1%) |
Educational Attainment by Field of Study in Tazewell
Business (96 | 36.1%), science & technology (65 | 24.4%), bio, nature & agricultural (41 | 15.4%), engineering (15 | 5.6%), and communications (15 | 5.6%) are the most common fields of study among 266 individuals in Tazewell who have obtained a bachelor's degree or higher.
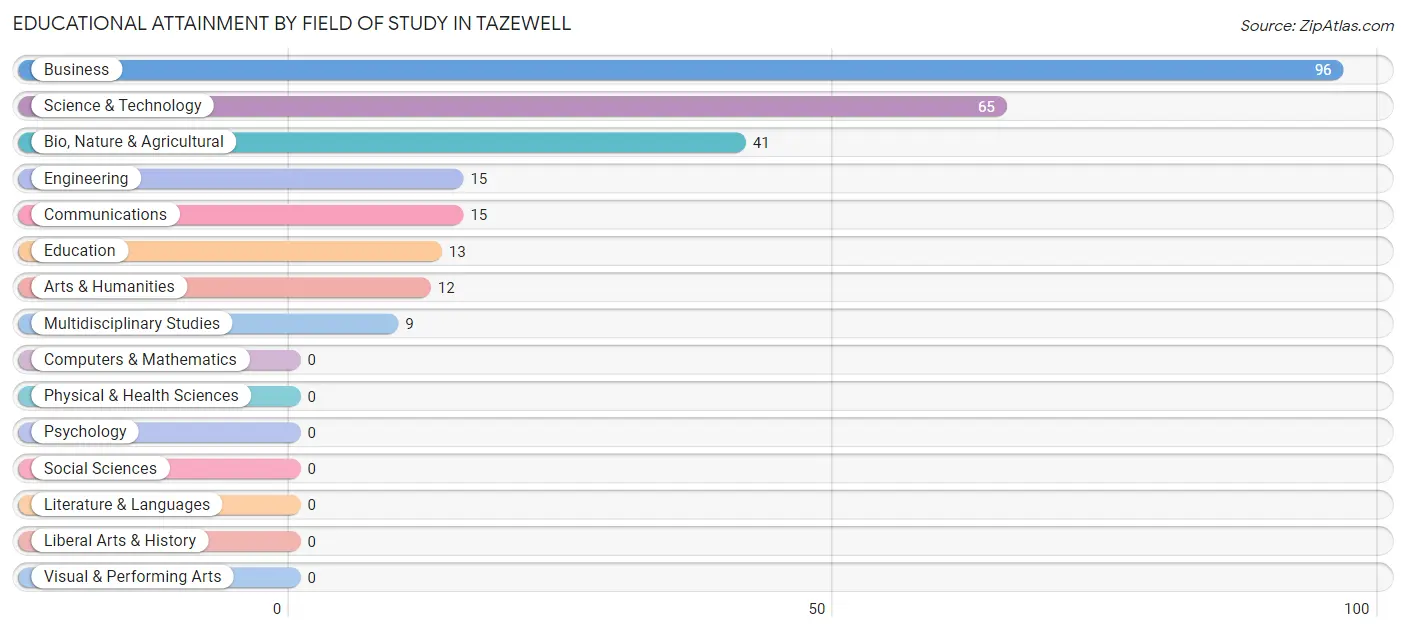
| Field of Study | # Graduates | % Graduates |
| Computers & Mathematics | 0 | 0.0% |
| Bio, Nature & Agricultural | 41 | 15.4% |
| Physical & Health Sciences | 0 | 0.0% |
| Psychology | 0 | 0.0% |
| Social Sciences | 0 | 0.0% |
| Engineering | 15 | 5.6% |
| Multidisciplinary Studies | 9 | 3.4% |
| Science & Technology | 65 | 24.4% |
| Business | 96 | 36.1% |
| Education | 13 | 4.9% |
| Literature & Languages | 0 | 0.0% |
| Liberal Arts & History | 0 | 0.0% |
| Visual & Performing Arts | 0 | 0.0% |
| Communications | 15 | 5.6% |
| Arts & Humanities | 12 | 4.5% |
| Total | 266 | 100.0% |
Transportation & Commute in Tazewell
Vehicle Availability by Sex in Tazewell
The most prevalent vehicle ownership categories in Tazewell are males with 2 vehicles (205, accounting for 53.2%) and females with 2 vehicles (73, making up 84.0%).
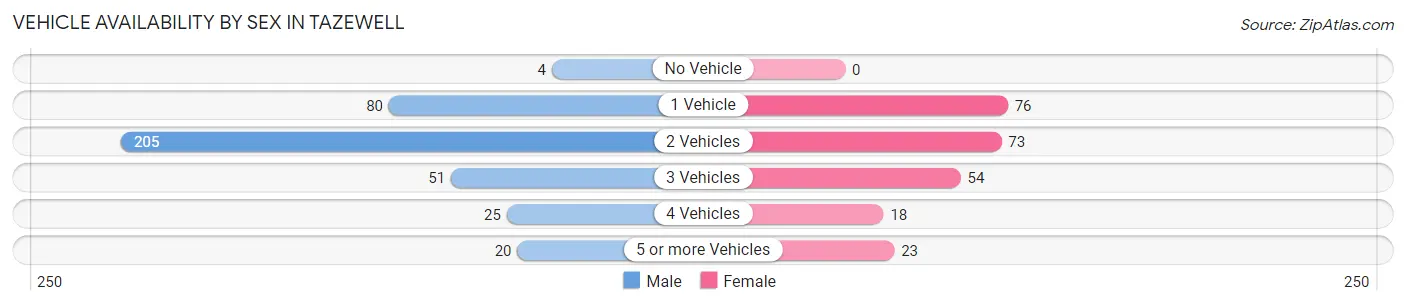
| Vehicles Available | Male | Female |
| No Vehicle | 4 (1.0%) | 0 (0.0%) |
| 1 Vehicle | 80 (20.8%) | 76 (31.1%) |
| 2 Vehicles | 205 (53.2%) | 73 (29.9%) |
| 3 Vehicles | 51 (13.3%) | 54 (22.1%) |
| 4 Vehicles | 25 (6.5%) | 18 (7.4%) |
| 5 or more Vehicles | 20 (5.2%) | 23 (9.4%) |
| Total | 385 (100.0%) | 244 (100.0%) |
Commute Time in Tazewell
The most frequently occuring commute durations in Tazewell are 5 to 9 minutes (170 commuters, 27.2%), 15 to 19 minutes (164 commuters, 26.2%), and 20 to 24 minutes (78 commuters, 12.5%).
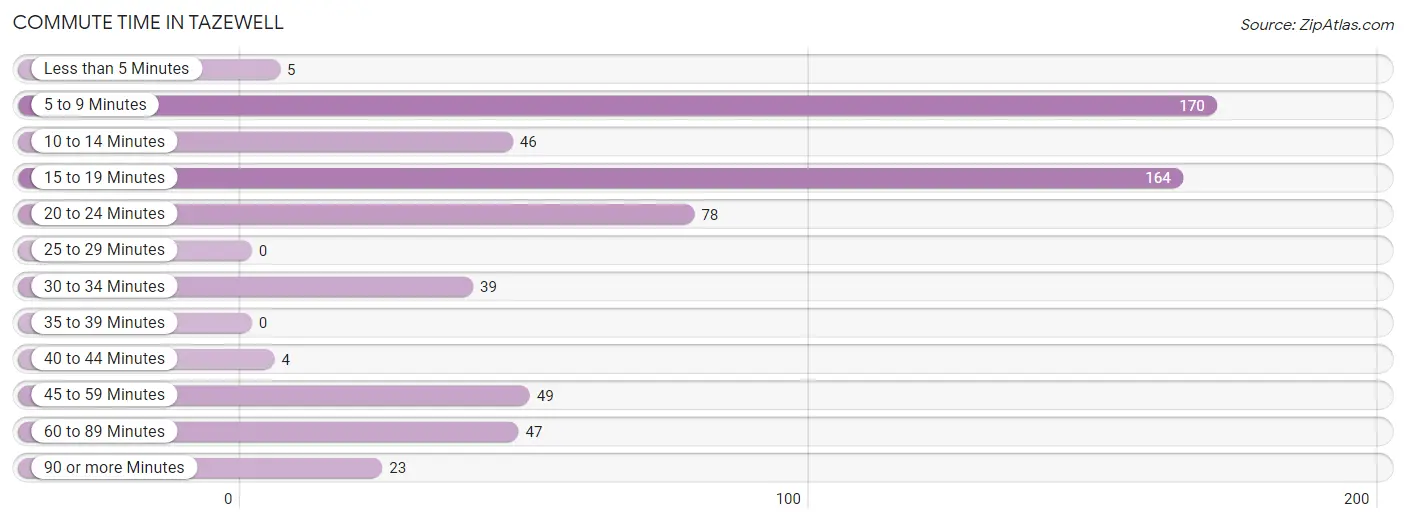
| Commute Time | # Commuters | % Commuters |
| Less than 5 Minutes | 5 | 0.8% |
| 5 to 9 Minutes | 170 | 27.2% |
| 10 to 14 Minutes | 46 | 7.4% |
| 15 to 19 Minutes | 164 | 26.2% |
| 20 to 24 Minutes | 78 | 12.5% |
| 25 to 29 Minutes | 0 | 0.0% |
| 30 to 34 Minutes | 39 | 6.2% |
| 35 to 39 Minutes | 0 | 0.0% |
| 40 to 44 Minutes | 4 | 0.6% |
| 45 to 59 Minutes | 49 | 7.8% |
| 60 to 89 Minutes | 47 | 7.5% |
| 90 or more Minutes | 23 | 3.7% |
Commute Time by Sex in Tazewell
The most common commute times in Tazewell are 15 to 19 minutes (127 commuters, 33.0%) for males and 5 to 9 minutes (89 commuters, 37.1%) for females.
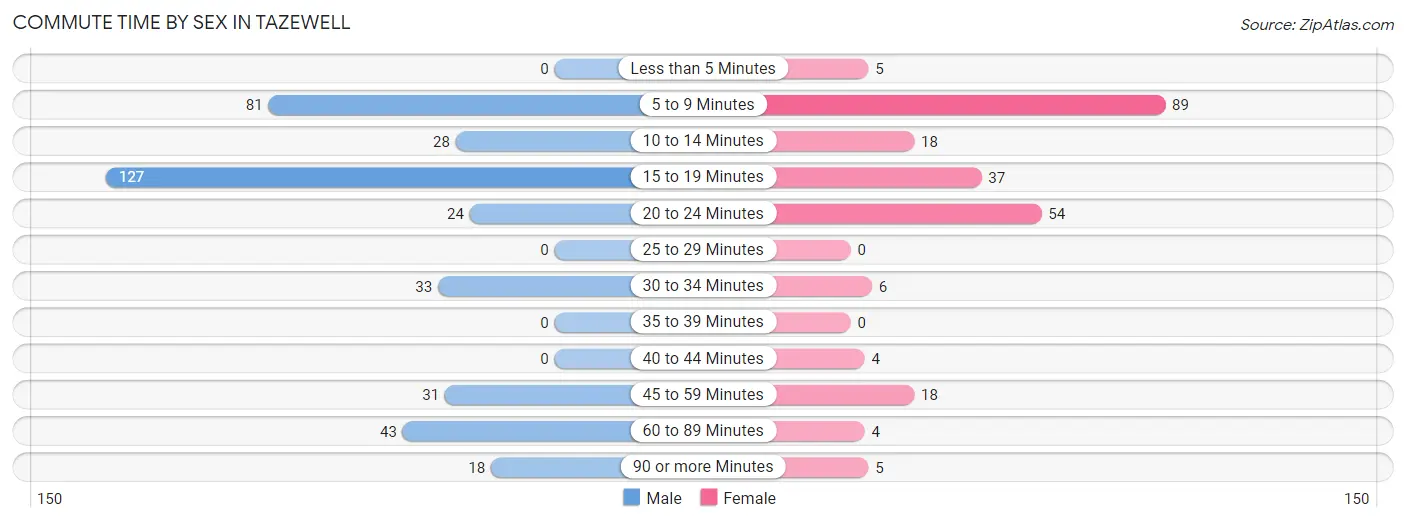
| Commute Time | Male | Female |
| Less than 5 Minutes | 0 (0.0%) | 5 (2.1%) |
| 5 to 9 Minutes | 81 (21.0%) | 89 (37.1%) |
| 10 to 14 Minutes | 28 (7.3%) | 18 (7.5%) |
| 15 to 19 Minutes | 127 (33.0%) | 37 (15.4%) |
| 20 to 24 Minutes | 24 (6.2%) | 54 (22.5%) |
| 25 to 29 Minutes | 0 (0.0%) | 0 (0.0%) |
| 30 to 34 Minutes | 33 (8.6%) | 6 (2.5%) |
| 35 to 39 Minutes | 0 (0.0%) | 0 (0.0%) |
| 40 to 44 Minutes | 0 (0.0%) | 4 (1.7%) |
| 45 to 59 Minutes | 31 (8.1%) | 18 (7.5%) |
| 60 to 89 Minutes | 43 (11.2%) | 4 (1.7%) |
| 90 or more Minutes | 18 (4.7%) | 5 (2.1%) |
Time of Departure to Work by Sex in Tazewell
The most frequent times of departure to work in Tazewell are 6:00 AM to 6:29 AM (55, 14.3%) for males and 7:30 AM to 7:59 AM (53, 22.1%) for females.
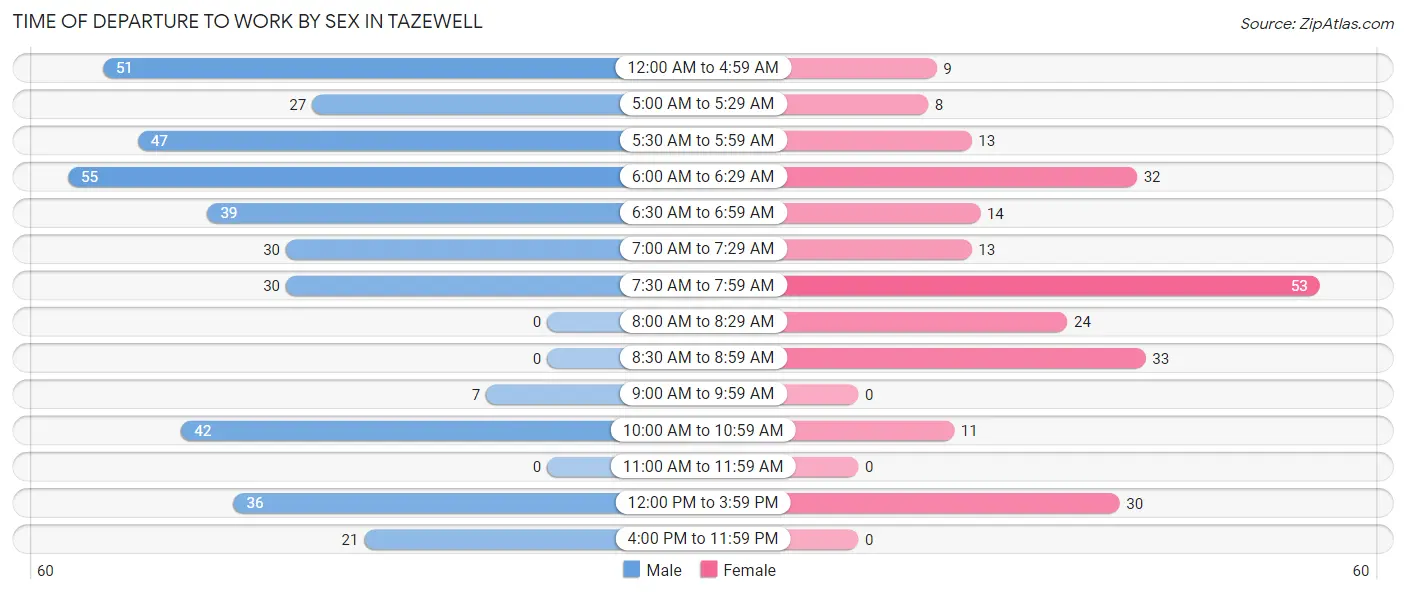
| Time of Departure | Male | Female |
| 12:00 AM to 4:59 AM | 51 (13.3%) | 9 (3.7%) |
| 5:00 AM to 5:29 AM | 27 (7.0%) | 8 (3.3%) |
| 5:30 AM to 5:59 AM | 47 (12.2%) | 13 (5.4%) |
| 6:00 AM to 6:29 AM | 55 (14.3%) | 32 (13.3%) |
| 6:30 AM to 6:59 AM | 39 (10.1%) | 14 (5.8%) |
| 7:00 AM to 7:29 AM | 30 (7.8%) | 13 (5.4%) |
| 7:30 AM to 7:59 AM | 30 (7.8%) | 53 (22.1%) |
| 8:00 AM to 8:29 AM | 0 (0.0%) | 24 (10.0%) |
| 8:30 AM to 8:59 AM | 0 (0.0%) | 33 (13.8%) |
| 9:00 AM to 9:59 AM | 7 (1.8%) | 0 (0.0%) |
| 10:00 AM to 10:59 AM | 42 (10.9%) | 11 (4.6%) |
| 11:00 AM to 11:59 AM | 0 (0.0%) | 0 (0.0%) |
| 12:00 PM to 3:59 PM | 36 (9.3%) | 30 (12.5%) |
| 4:00 PM to 11:59 PM | 21 (5.4%) | 0 (0.0%) |
| Total | 385 (100.0%) | 240 (100.0%) |
Housing Occupancy in Tazewell
Occupancy by Ownership in Tazewell
Of the total 946 dwellings in Tazewell, owner-occupied units account for 537 (56.8%), while renter-occupied units make up 409 (43.2%).
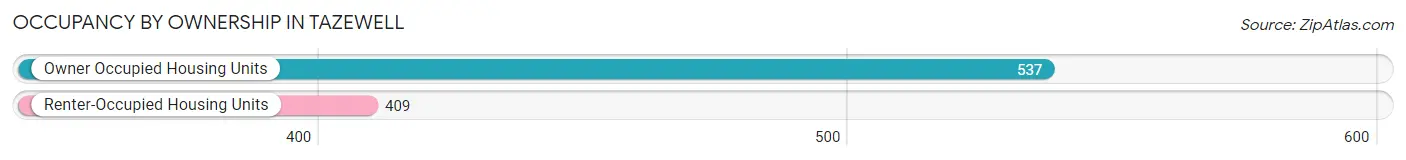
| Occupancy | # Housing Units | % Housing Units |
| Owner Occupied Housing Units | 537 | 56.8% |
| Renter-Occupied Housing Units | 409 | 43.2% |
| Total Occupied Housing Units | 946 | 100.0% |
Occupancy by Household Size in Tazewell
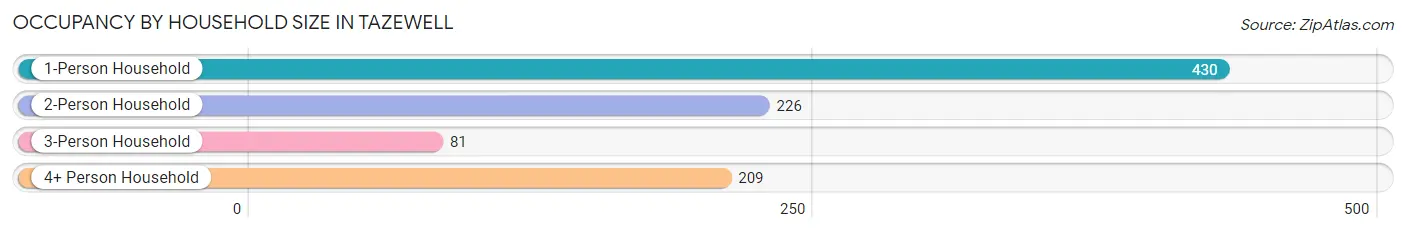
| Household Size | # Housing Units | % Housing Units |
| 1-Person Household | 430 | 45.5% |
| 2-Person Household | 226 | 23.9% |
| 3-Person Household | 81 | 8.6% |
| 4+ Person Household | 209 | 22.1% |
| Total Housing Units | 946 | 100.0% |
Occupancy by Ownership by Household Size in Tazewell
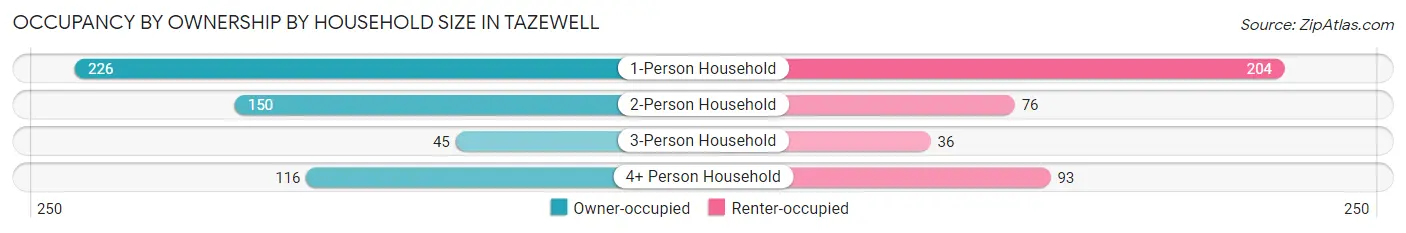
| Household Size | Owner-occupied | Renter-occupied |
| 1-Person Household | 226 (52.6%) | 204 (47.4%) |
| 2-Person Household | 150 (66.4%) | 76 (33.6%) |
| 3-Person Household | 45 (55.6%) | 36 (44.4%) |
| 4+ Person Household | 116 (55.5%) | 93 (44.5%) |
| Total Housing Units | 537 (56.8%) | 409 (43.2%) |
Occupancy by Educational Attainment in Tazewell
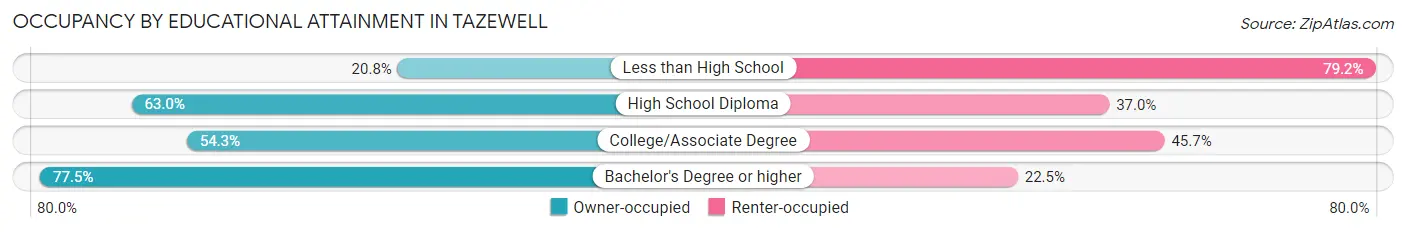
| Household Size | Owner-occupied | Renter-occupied |
| Less than High School | 30 (20.8%) | 114 (79.2%) |
| High School Diploma | 203 (63.0%) | 119 (37.0%) |
| College/Associate Degree | 159 (54.3%) | 134 (45.7%) |
| Bachelor's Degree or higher | 145 (77.5%) | 42 (22.5%) |
Occupancy by Age of Householder in Tazewell
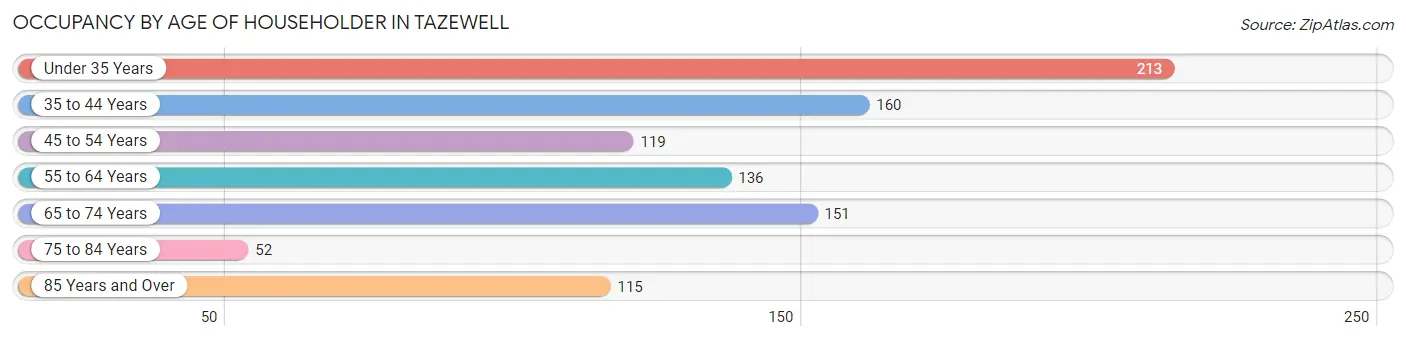
| Age Bracket | # Households | % Households |
| Under 35 Years | 213 | 22.5% |
| 35 to 44 Years | 160 | 16.9% |
| 45 to 54 Years | 119 | 12.6% |
| 55 to 64 Years | 136 | 14.4% |
| 65 to 74 Years | 151 | 16.0% |
| 75 to 84 Years | 52 | 5.5% |
| 85 Years and Over | 115 | 12.2% |
| Total | 946 | 100.0% |
Housing Finances in Tazewell
Median Income by Occupancy in Tazewell
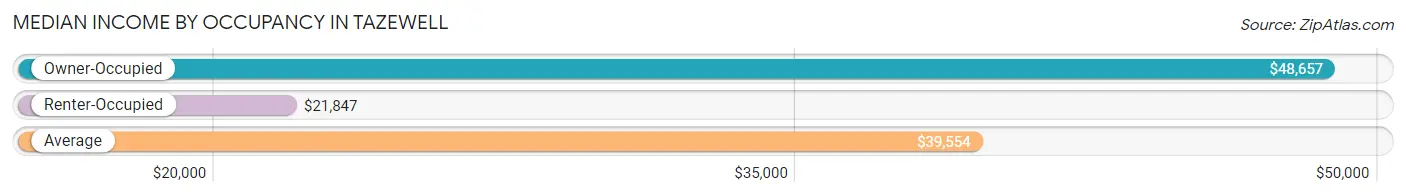
| Occupancy Type | # Households | Median Income |
| Owner-Occupied | 537 (56.8%) | $48,657 |
| Renter-Occupied | 409 (43.2%) | $21,847 |
| Average | 946 (100.0%) | $39,554 |
Occupancy by Householder Income Bracket in Tazewell
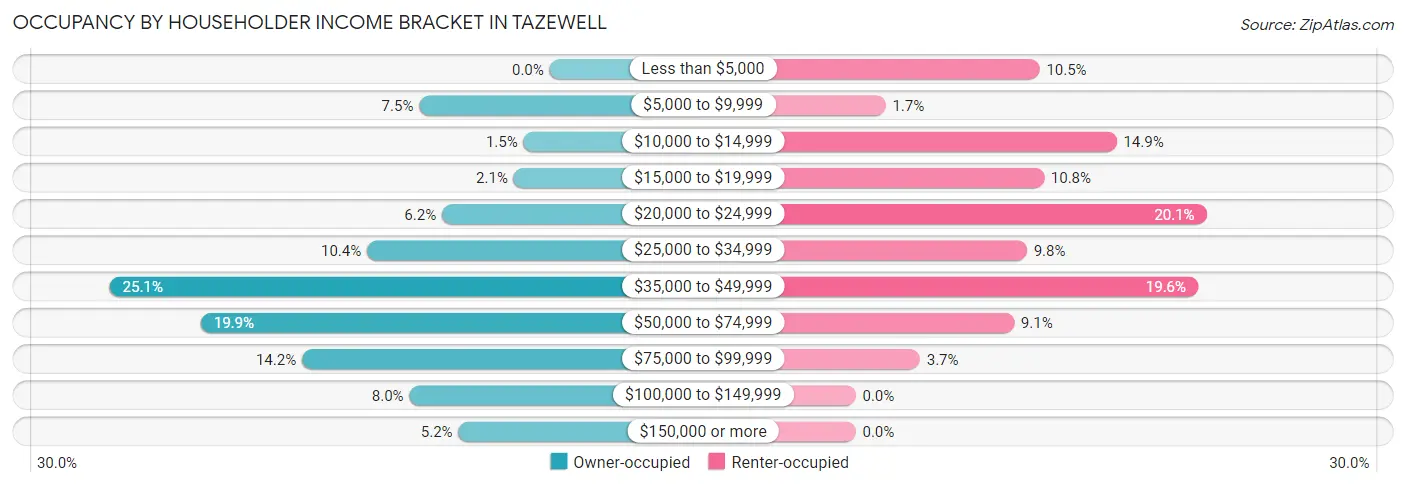
| Income Bracket | Owner-occupied | Renter-occupied |
| Less than $5,000 | 0 (0.0%) | 43 (10.5%) |
| $5,000 to $9,999 | 40 (7.4%) | 7 (1.7%) |
| $10,000 to $14,999 | 8 (1.5%) | 61 (14.9%) |
| $15,000 to $19,999 | 11 (2.1%) | 44 (10.8%) |
| $20,000 to $24,999 | 33 (6.1%) | 82 (20.1%) |
| $25,000 to $34,999 | 56 (10.4%) | 40 (9.8%) |
| $35,000 to $49,999 | 135 (25.1%) | 80 (19.6%) |
| $50,000 to $74,999 | 107 (19.9%) | 37 (9.0%) |
| $75,000 to $99,999 | 76 (14.1%) | 15 (3.7%) |
| $100,000 to $149,999 | 43 (8.0%) | 0 (0.0%) |
| $150,000 or more | 28 (5.2%) | 0 (0.0%) |
| Total | 537 (100.0%) | 409 (100.0%) |
Monthly Housing Cost Tiers in Tazewell
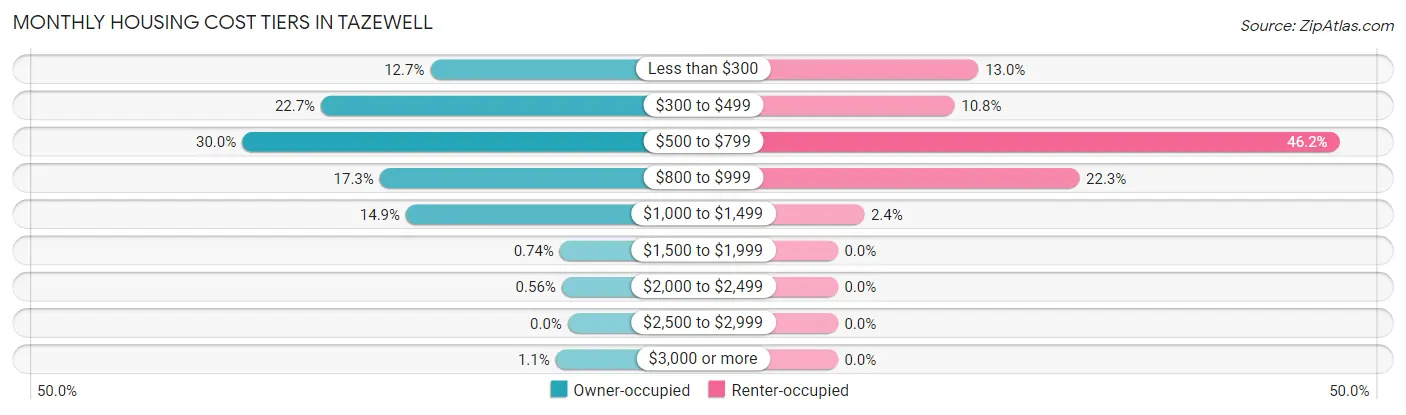
| Monthly Cost | Owner-occupied | Renter-occupied |
| Less than $300 | 68 (12.7%) | 53 (13.0%) |
| $300 to $499 | 122 (22.7%) | 44 (10.8%) |
| $500 to $799 | 161 (30.0%) | 189 (46.2%) |
| $800 to $999 | 93 (17.3%) | 91 (22.3%) |
| $1,000 to $1,499 | 80 (14.9%) | 10 (2.4%) |
| $1,500 to $1,999 | 4 (0.7%) | 0 (0.0%) |
| $2,000 to $2,499 | 3 (0.6%) | 0 (0.0%) |
| $2,500 to $2,999 | 0 (0.0%) | 0 (0.0%) |
| $3,000 or more | 6 (1.1%) | 0 (0.0%) |
| Total | 537 (100.0%) | 409 (100.0%) |
Physical Housing Characteristics in Tazewell
Housing Structures in Tazewell
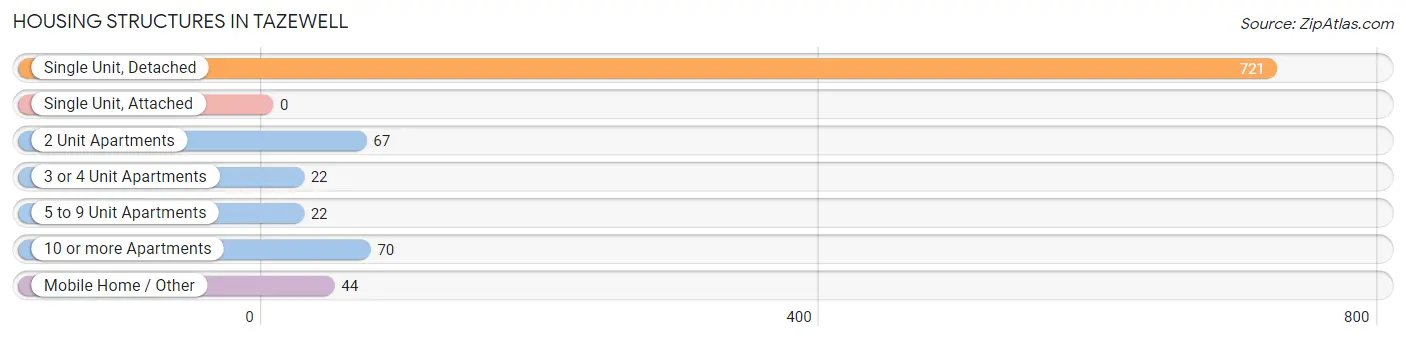
| Structure Type | # Housing Units | % Housing Units |
| Single Unit, Detached | 721 | 76.2% |
| Single Unit, Attached | 0 | 0.0% |
| 2 Unit Apartments | 67 | 7.1% |
| 3 or 4 Unit Apartments | 22 | 2.3% |
| 5 to 9 Unit Apartments | 22 | 2.3% |
| 10 or more Apartments | 70 | 7.4% |
| Mobile Home / Other | 44 | 4.6% |
| Total | 946 | 100.0% |
Housing Structures by Occupancy in Tazewell
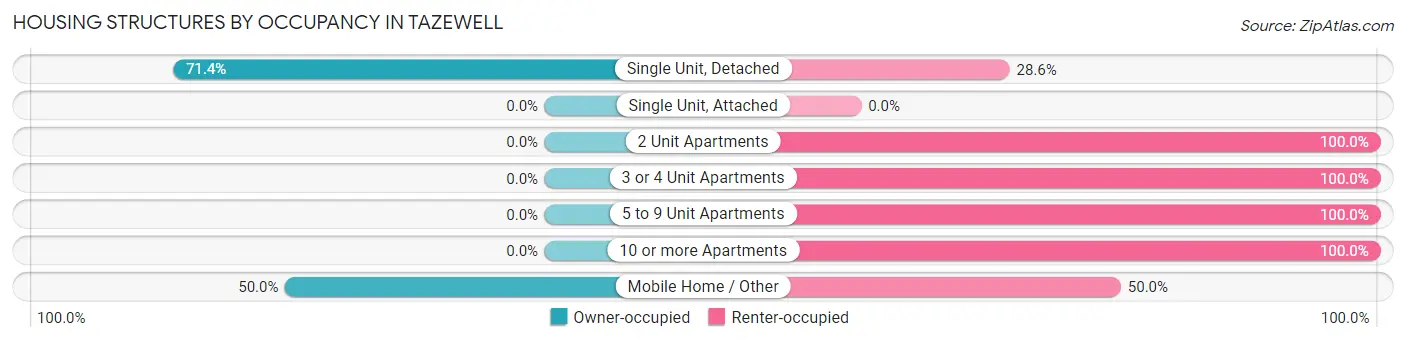
| Structure Type | Owner-occupied | Renter-occupied |
| Single Unit, Detached | 515 (71.4%) | 206 (28.6%) |
| Single Unit, Attached | 0 (0.0%) | 0 (0.0%) |
| 2 Unit Apartments | 0 (0.0%) | 67 (100.0%) |
| 3 or 4 Unit Apartments | 0 (0.0%) | 22 (100.0%) |
| 5 to 9 Unit Apartments | 0 (0.0%) | 22 (100.0%) |
| 10 or more Apartments | 0 (0.0%) | 70 (100.0%) |
| Mobile Home / Other | 22 (50.0%) | 22 (50.0%) |
| Total | 537 (56.8%) | 409 (43.2%) |
Housing Structures by Number of Rooms in Tazewell
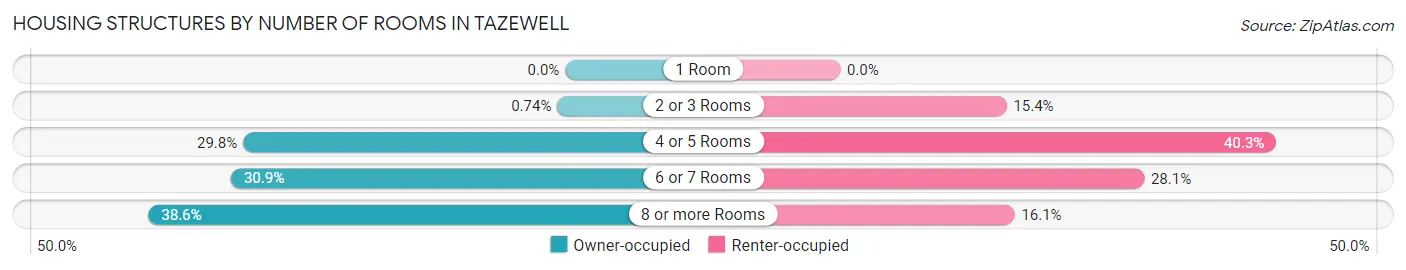
| Number of Rooms | Owner-occupied | Renter-occupied |
| 1 Room | 0 (0.0%) | 0 (0.0%) |
| 2 or 3 Rooms | 4 (0.7%) | 63 (15.4%) |
| 4 or 5 Rooms | 160 (29.8%) | 165 (40.3%) |
| 6 or 7 Rooms | 166 (30.9%) | 115 (28.1%) |
| 8 or more Rooms | 207 (38.6%) | 66 (16.1%) |
| Total | 537 (100.0%) | 409 (100.0%) |
Housing Structure by Heating Type in Tazewell
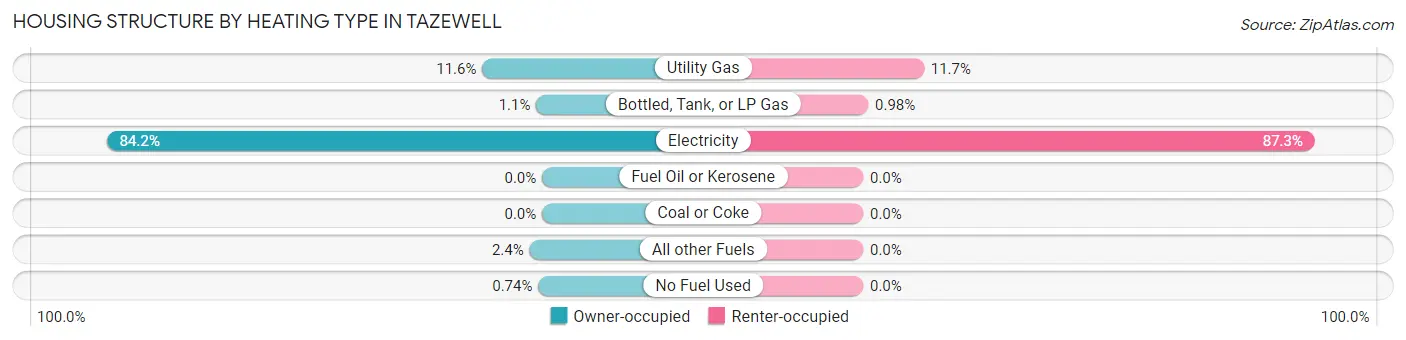
| Heating Type | Owner-occupied | Renter-occupied |
| Utility Gas | 62 (11.6%) | 48 (11.7%) |
| Bottled, Tank, or LP Gas | 6 (1.1%) | 4 (1.0%) |
| Electricity | 452 (84.2%) | 357 (87.3%) |
| Fuel Oil or Kerosene | 0 (0.0%) | 0 (0.0%) |
| Coal or Coke | 0 (0.0%) | 0 (0.0%) |
| All other Fuels | 13 (2.4%) | 0 (0.0%) |
| No Fuel Used | 4 (0.7%) | 0 (0.0%) |
| Total | 537 (100.0%) | 409 (100.0%) |
Household Vehicle Usage in Tazewell
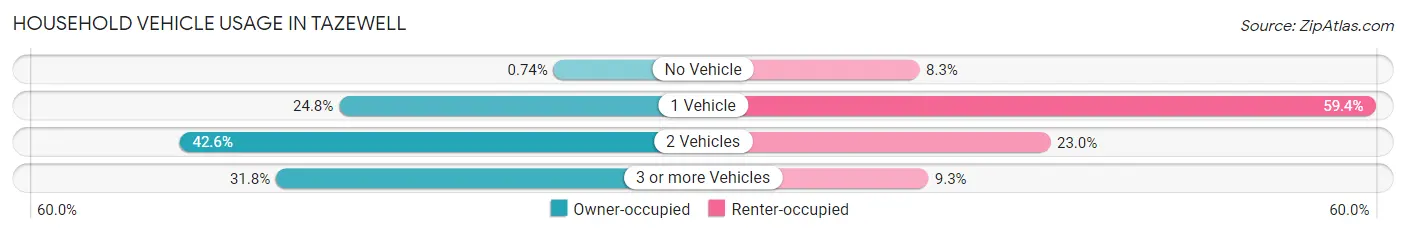
| Vehicles per Household | Owner-occupied | Renter-occupied |
| No Vehicle | 4 (0.7%) | 34 (8.3%) |
| 1 Vehicle | 133 (24.8%) | 243 (59.4%) |
| 2 Vehicles | 229 (42.6%) | 94 (23.0%) |
| 3 or more Vehicles | 171 (31.8%) | 38 (9.3%) |
| Total | 537 (100.0%) | 409 (100.0%) |
Real Estate & Mortgages in Tazewell
Real Estate and Mortgage Overview in Tazewell
| Characteristic | Without Mortgage | With Mortgage |
| Housing Units | 287 | 250 |
| Median Property Value | $179,400 | $148,300 |
| Median Household Income | $45,961 | $22 |
| Monthly Housing Costs | $421 | $0 |
| Real Estate Taxes | $646 | $8 |
Property Value by Mortgage Status in Tazewell
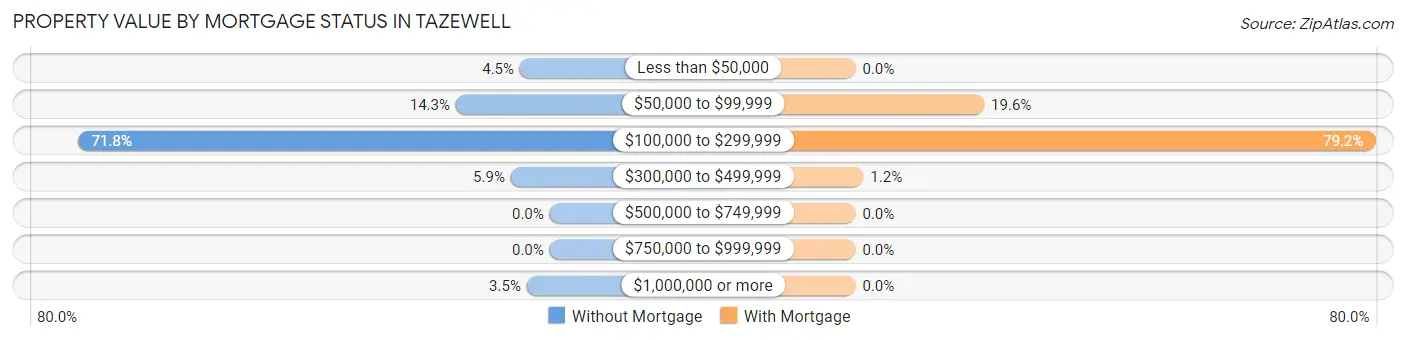
| Property Value | Without Mortgage | With Mortgage |
| Less than $50,000 | 13 (4.5%) | 0 (0.0%) |
| $50,000 to $99,999 | 41 (14.3%) | 49 (19.6%) |
| $100,000 to $299,999 | 206 (71.8%) | 198 (79.2%) |
| $300,000 to $499,999 | 17 (5.9%) | 3 (1.2%) |
| $500,000 to $749,999 | 0 (0.0%) | 0 (0.0%) |
| $750,000 to $999,999 | 0 (0.0%) | 0 (0.0%) |
| $1,000,000 or more | 10 (3.5%) | 0 (0.0%) |
| Total | 287 (100.0%) | 250 (100.0%) |
Household Income by Mortgage Status in Tazewell
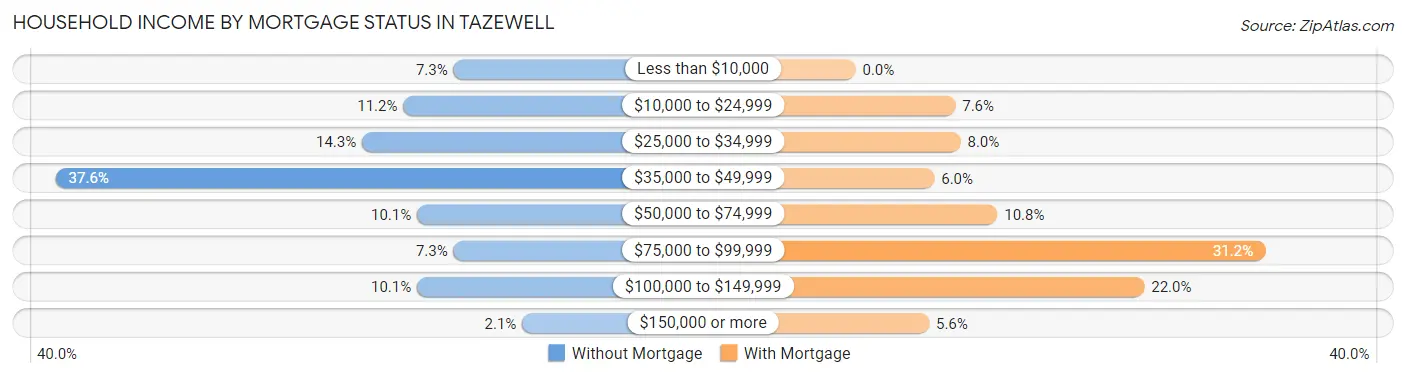
| Household Income | Without Mortgage | With Mortgage |
| Less than $10,000 | 21 (7.3%) | 0 (0.0%) |
| $10,000 to $24,999 | 32 (11.2%) | 19 (7.6%) |
| $25,000 to $34,999 | 41 (14.3%) | 20 (8.0%) |
| $35,000 to $49,999 | 108 (37.6%) | 15 (6.0%) |
| $50,000 to $74,999 | 29 (10.1%) | 27 (10.8%) |
| $75,000 to $99,999 | 21 (7.3%) | 78 (31.2%) |
| $100,000 to $149,999 | 29 (10.1%) | 55 (22.0%) |
| $150,000 or more | 6 (2.1%) | 14 (5.6%) |
| Total | 287 (100.0%) | 250 (100.0%) |
Property Value to Household Income Ratio in Tazewell
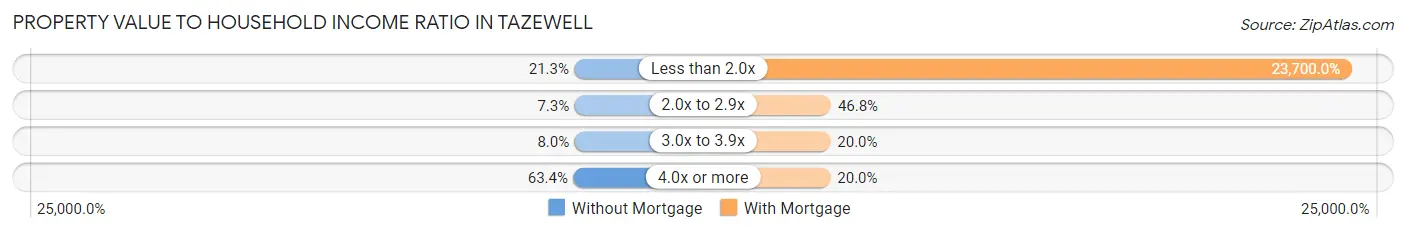
| Value-to-Income Ratio | Without Mortgage | With Mortgage |
| Less than 2.0x | 61 (21.2%) | 59,250 (23,700.0%) |
| 2.0x to 2.9x | 21 (7.3%) | 117 (46.8%) |
| 3.0x to 3.9x | 23 (8.0%) | 50 (20.0%) |
| 4.0x or more | 182 (63.4%) | 50 (20.0%) |
| Total | 287 (100.0%) | 250 (100.0%) |
Real Estate Taxes by Mortgage Status in Tazewell
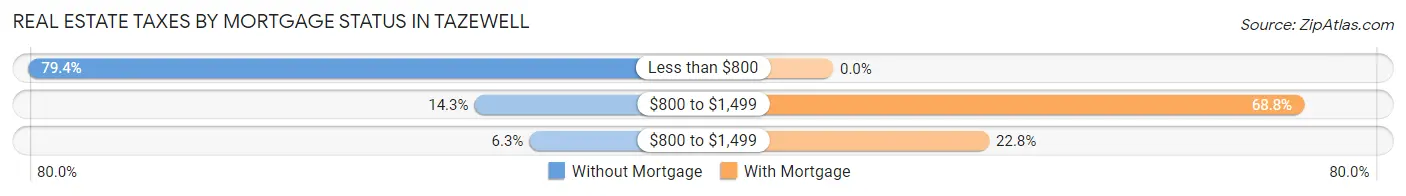
| Property Taxes | Without Mortgage | With Mortgage |
| Less than $800 | 228 (79.4%) | 0 (0.0%) |
| $800 to $1,499 | 41 (14.3%) | 172 (68.8%) |
| $800 to $1,499 | 18 (6.3%) | 57 (22.8%) |
| Total | 287 (100.0%) | 250 (100.0%) |
Health & Disability in Tazewell
Health Insurance Coverage by Age in Tazewell
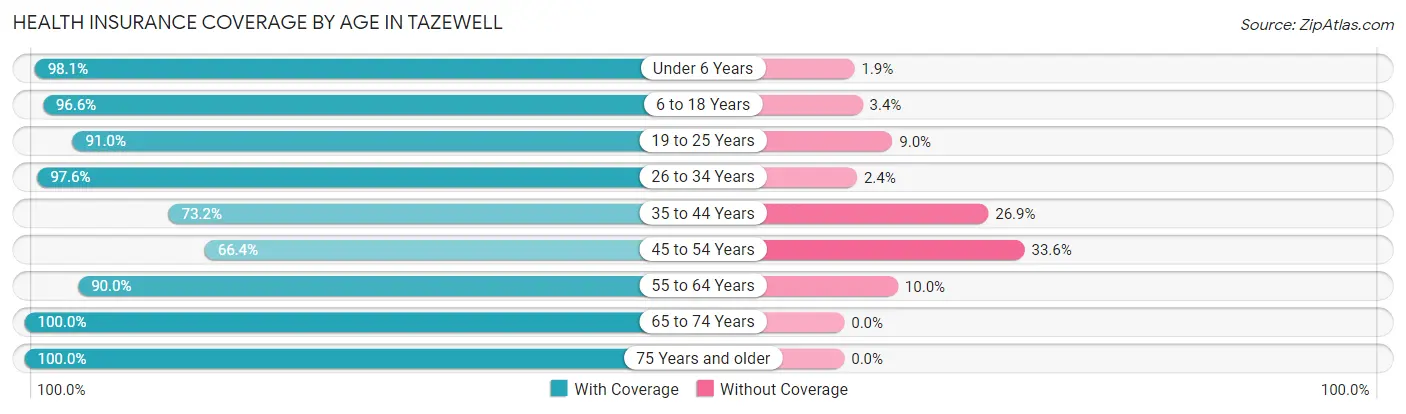
| Age Bracket | With Coverage | Without Coverage |
| Under 6 Years | 155 (98.1%) | 3 (1.9%) |
| 6 to 18 Years | 339 (96.6%) | 12 (3.4%) |
| 19 to 25 Years | 193 (91.0%) | 19 (9.0%) |
| 26 to 34 Years | 248 (97.6%) | 6 (2.4%) |
| 35 to 44 Years | 188 (73.2%) | 69 (26.9%) |
| 45 to 54 Years | 162 (66.4%) | 82 (33.6%) |
| 55 to 64 Years | 207 (90.0%) | 23 (10.0%) |
| 65 to 74 Years | 224 (100.0%) | 0 (0.0%) |
| 75 Years and older | 195 (100.0%) | 0 (0.0%) |
| Total | 1,911 (89.9%) | 214 (10.1%) |
Health Insurance Coverage by Citizenship Status in Tazewell

| Citizenship Status | With Coverage | Without Coverage |
| Native Born | 155 (98.1%) | 3 (1.9%) |
| Foreign Born, Citizen | 339 (96.6%) | 12 (3.4%) |
| Foreign Born, not a Citizen | 193 (91.0%) | 19 (9.0%) |
Health Insurance Coverage by Household Income in Tazewell

| Household Income | With Coverage | Without Coverage |
| Under $25,000 | 564 (87.2%) | 83 (12.8%) |
| $25,000 to $49,999 | 564 (95.4%) | 27 (4.6%) |
| $50,000 to $74,999 | 268 (83.5%) | 53 (16.5%) |
| $75,000 to $99,999 | 279 (91.5%) | 26 (8.5%) |
| $100,000 and over | 225 (90.0%) | 25 (10.0%) |
Public vs Private Health Insurance Coverage by Age in Tazewell
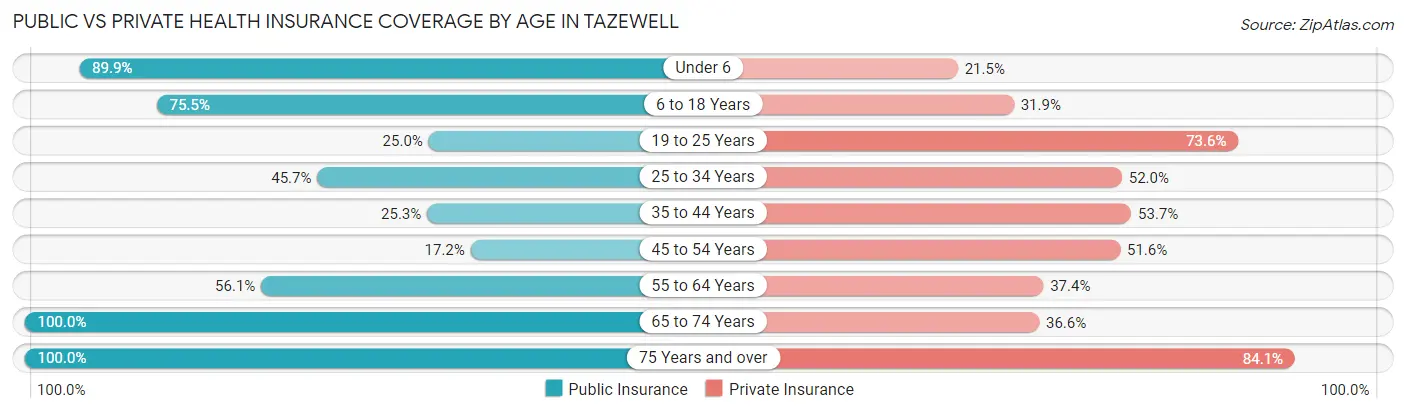
| Age Bracket | Public Insurance | Private Insurance |
| Under 6 | 142 (89.9%) | 34 (21.5%) |
| 6 to 18 Years | 265 (75.5%) | 112 (31.9%) |
| 19 to 25 Years | 53 (25.0%) | 156 (73.6%) |
| 25 to 34 Years | 116 (45.7%) | 132 (52.0%) |
| 35 to 44 Years | 65 (25.3%) | 138 (53.7%) |
| 45 to 54 Years | 42 (17.2%) | 126 (51.6%) |
| 55 to 64 Years | 129 (56.1%) | 86 (37.4%) |
| 65 to 74 Years | 224 (100.0%) | 82 (36.6%) |
| 75 Years and over | 195 (100.0%) | 164 (84.1%) |
| Total | 1,231 (57.9%) | 1,030 (48.5%) |
Disability Status by Sex by Age in Tazewell
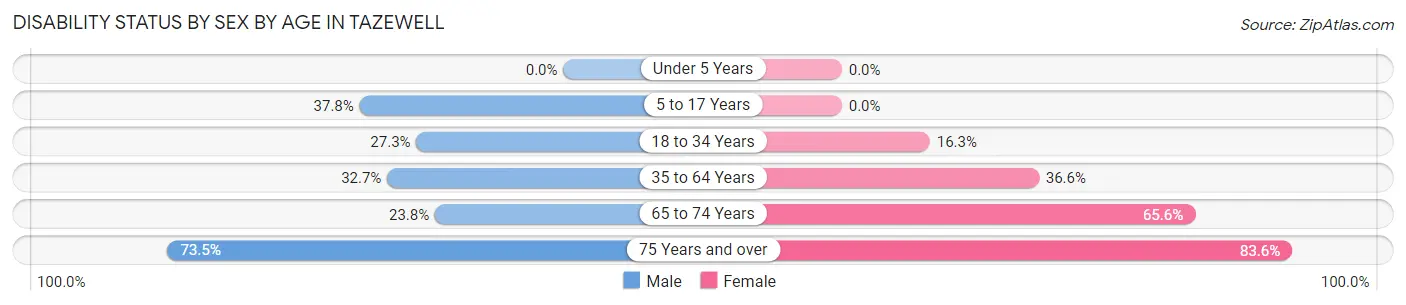
| Age Bracket | Male | Female |
| Under 5 Years | 0 (0.0%) | 0 (0.0%) |
| 5 to 17 Years | 59 (37.8%) | 0 (0.0%) |
| 18 to 34 Years | 69 (27.3%) | 40 (16.3%) |
| 35 to 64 Years | 121 (32.7%) | 132 (36.6%) |
| 65 to 74 Years | 25 (23.8%) | 78 (65.5%) |
| 75 Years and over | 36 (73.5%) | 122 (83.6%) |
Disability Class by Sex by Age in Tazewell
Disability Class: Hearing Difficulty
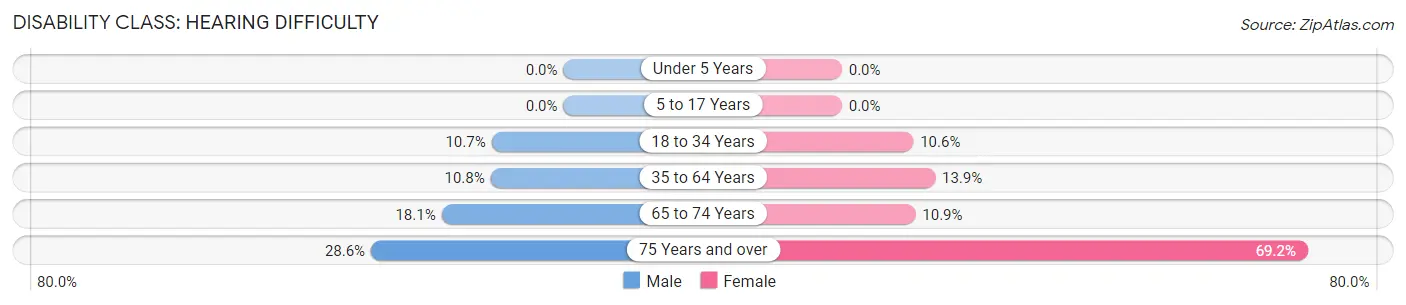
| Age Bracket | Male | Female |
| Under 5 Years | 0 (0.0%) | 0 (0.0%) |
| 5 to 17 Years | 0 (0.0%) | 0 (0.0%) |
| 18 to 34 Years | 27 (10.7%) | 26 (10.6%) |
| 35 to 64 Years | 40 (10.8%) | 50 (13.9%) |
| 65 to 74 Years | 19 (18.1%) | 13 (10.9%) |
| 75 Years and over | 14 (28.6%) | 101 (69.2%) |
Disability Class: Vision Difficulty
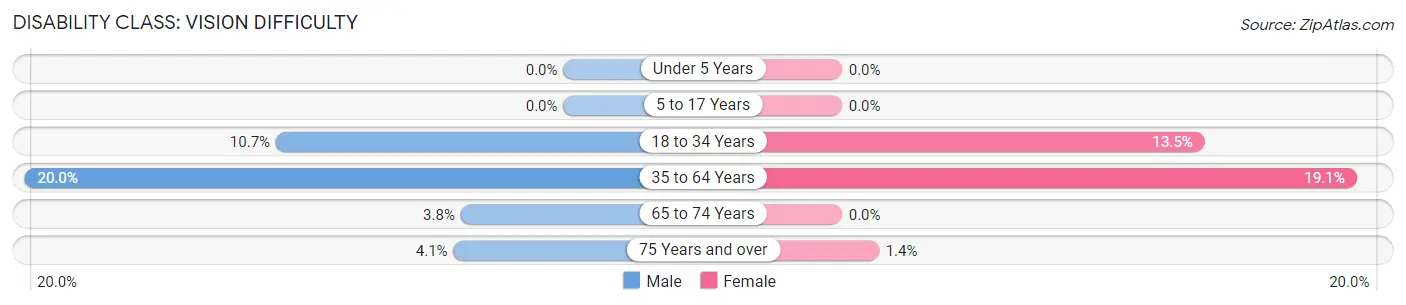
| Age Bracket | Male | Female |
| Under 5 Years | 0 (0.0%) | 0 (0.0%) |
| 5 to 17 Years | 0 (0.0%) | 0 (0.0%) |
| 18 to 34 Years | 27 (10.7%) | 33 (13.5%) |
| 35 to 64 Years | 74 (20.0%) | 69 (19.1%) |
| 65 to 74 Years | 4 (3.8%) | 0 (0.0%) |
| 75 Years and over | 2 (4.1%) | 2 (1.4%) |
Disability Class: Cognitive Difficulty
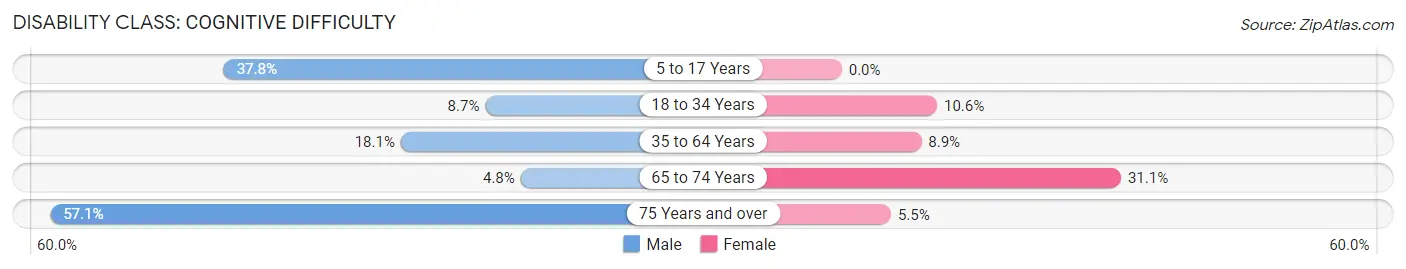
| Age Bracket | Male | Female |
| 5 to 17 Years | 59 (37.8%) | 0 (0.0%) |
| 18 to 34 Years | 22 (8.7%) | 26 (10.6%) |
| 35 to 64 Years | 67 (18.1%) | 32 (8.9%) |
| 65 to 74 Years | 5 (4.8%) | 37 (31.1%) |
| 75 Years and over | 28 (57.1%) | 8 (5.5%) |
Disability Class: Ambulatory Difficulty
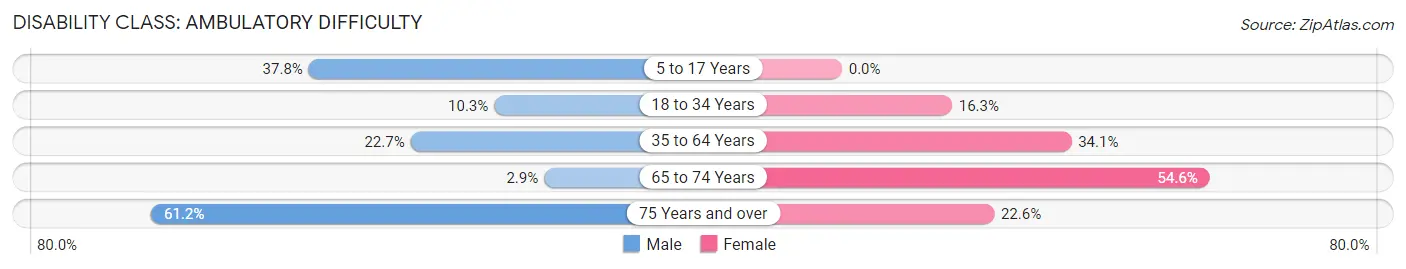
| Age Bracket | Male | Female |
| 5 to 17 Years | 59 (37.8%) | 0 (0.0%) |
| 18 to 34 Years | 26 (10.3%) | 40 (16.3%) |
| 35 to 64 Years | 84 (22.7%) | 123 (34.1%) |
| 65 to 74 Years | 3 (2.9%) | 65 (54.6%) |
| 75 Years and over | 30 (61.2%) | 33 (22.6%) |
Disability Class: Self-Care Difficulty
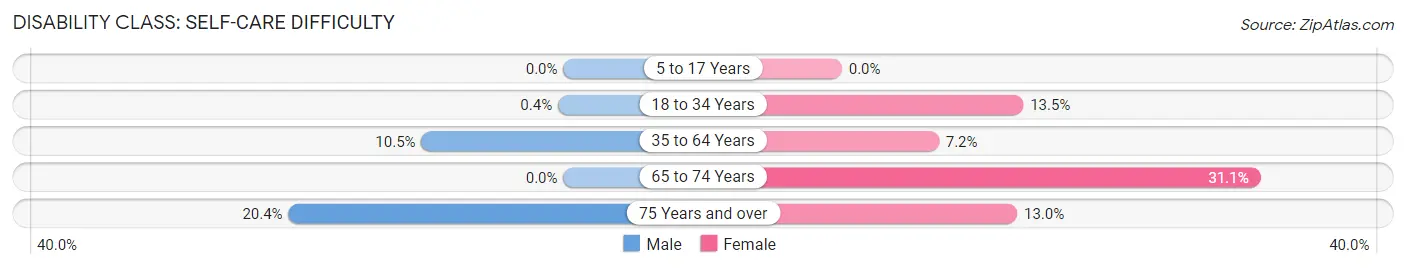
| Age Bracket | Male | Female |
| 5 to 17 Years | 0 (0.0%) | 0 (0.0%) |
| 18 to 34 Years | 1 (0.4%) | 33 (13.5%) |
| 35 to 64 Years | 39 (10.5%) | 26 (7.2%) |
| 65 to 74 Years | 0 (0.0%) | 37 (31.1%) |
| 75 Years and over | 10 (20.4%) | 19 (13.0%) |
Technology Access in Tazewell
Computing Device Access in Tazewell
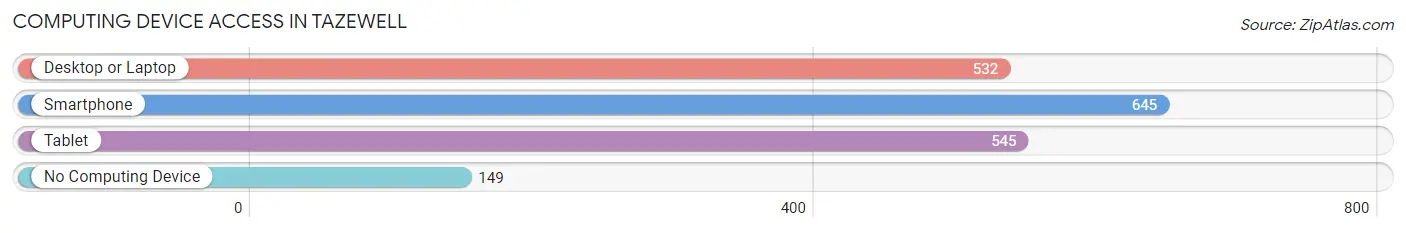
| Device Type | # Households | % Households |
| Desktop or Laptop | 532 | 56.2% |
| Smartphone | 645 | 68.2% |
| Tablet | 545 | 57.6% |
| No Computing Device | 149 | 15.8% |
| Total | 946 | 100.0% |
Internet Access in Tazewell
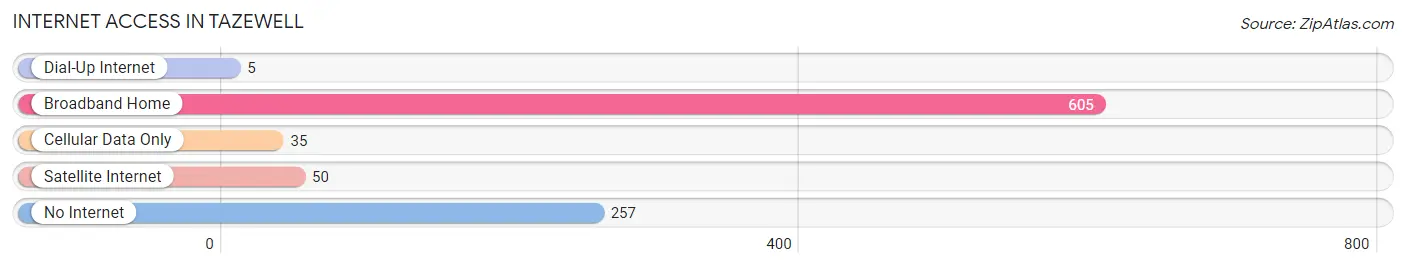
| Internet Type | # Households | % Households |
| Dial-Up Internet | 5 | 0.5% |
| Broadband Home | 605 | 63.9% |
| Cellular Data Only | 35 | 3.7% |
| Satellite Internet | 50 | 5.3% |
| No Internet | 257 | 27.2% |
| Total | 946 | 100.0% |
Tazewell Summary
Tazewell, Tennessee is a small town located in Claiborne County, in the northeastern corner of the state. It is situated on the banks of the Clinch River, and is the county seat of Claiborne County. The town was founded in 1807 and has a population of approximately 2,500 people.
History
Tazewell was founded in 1807 by William Tazewell, a Revolutionary War veteran and surveyor. He named the town after his father, Benjamin Tazewell, who was a prominent politician in Virginia. The town was originally known as Tazewell Court House, and was the county seat of Claiborne County.
In 1819, the town was incorporated and the name was changed to Tazewell. The town was a major stop on the stagecoach route between Knoxville and Cumberland Gap. During the Civil War, Tazewell was the site of a major battle between Union and Confederate forces. The town was also the site of a major Confederate victory in the Battle of Tazewell in 1863.
Geography
Tazewell is located in the northeastern corner of Tennessee, in Claiborne County. It is situated on the banks of the Clinch River, and is surrounded by the Cumberland Mountains. The town is located approximately 30 miles from Knoxville, and is accessible by US Route 25E.
The town has a total area of 2.2 square miles, all of which is land. The town has a humid subtropical climate, with hot, humid summers and mild winters. The average annual temperature is around 57 degrees Fahrenheit.
Economy
Tazewell’s economy is largely based on agriculture and tourism. The town is home to several farms, which produce a variety of crops, including corn, soybeans, and tobacco. The town is also home to several small businesses, including restaurants, shops, and a few manufacturing plants.
The town is also a popular tourist destination, due to its proximity to the Great Smoky Mountains National Park. The town is home to several historic sites, including the Tazewell County Courthouse, the Tazewell County Jail, and the Tazewell County Museum.
Demographics
As of the 2010 census, Tazewell had a population of 2,500 people. The racial makeup of the town was 95.2% White, 2.2% African American, 0.4% Native American, 0.2% Asian, 0.2% from other races, and 1.8% from two or more races. Hispanic or Latino of any race were 1.2% of the population.
The median income for a household in the town was $30,000, and the median income for a family was $35,000. The per capita income for the town was $15,000. About 17.5% of families and 20.2% of the population were below the poverty line, including 28.3% of those under age 18 and 11.2% of those age 65 or over.
Common Questions
What is Per Capita Income in Tazewell?
Per Capita income in Tazewell is $21,317.
What is the Median Family Income in Tazewell?
Median Family Income in Tazewell is $49,196.
What is the Median Household income in Tazewell?
Median Household Income in Tazewell is $39,554.
What is Income or Wage Gap in Tazewell?
Income or Wage Gap in Tazewell is 54.3%.
Women in Tazewell earn 45.7 cents for every dollar earned by a man.
What is Family Income Deficit in Tazewell?
Family Income Deficit in Tazewell is $13,410.
Families that are below poverty line in Tazewell earn $13,410 less on average than the poverty threshold level.
What is Inequality or Gini Index in Tazewell?
Inequality or Gini Index in Tazewell is 0.42.
What is the Total Population of Tazewell?
Total Population of Tazewell is 2,207.
What is the Total Male Population of Tazewell?
Total Male Population of Tazewell is 1,041.
What is the Total Female Population of Tazewell?
Total Female Population of Tazewell is 1,166.
What is the Ratio of Males per 100 Females in Tazewell?
There are 89.28 Males per 100 Females in Tazewell.
What is the Ratio of Females per 100 Males in Tazewell?
There are 112.01 Females per 100 Males in Tazewell.
What is the Median Population Age in Tazewell?
Median Population Age in Tazewell is 37.9 Years.
What is the Average Family Size in Tazewell
Average Family Size in Tazewell is 3.2 People.
What is the Average Household Size in Tazewell
Average Household Size in Tazewell is 2.2 People.
How Large is the Labor Force in Tazewell?
There are 691 People in the Labor Forcein in Tazewell.
What is the Percentage of People in the Labor Force in Tazewell?
39.2% of People are in the Labor Force in Tazewell.
What is the Unemployment Rate in Tazewell?
Unemployment Rate in Tazewell is 7.2%.