Linden, TN Map & Demographics
Linden Map
Linden Overview
$19,252
PER CAPITA INCOME
$60,057
AVG FAMILY INCOME
$46,836
AVG HOUSEHOLD INCOME
19.2%
WAGE / INCOME GAP [ % ]
80.8¢/ $1
WAGE / INCOME GAP [ $ ]
0.44
INEQUALITY / GINI INDEX
1,469
TOTAL POPULATION
622
MALE POPULATION
847
FEMALE POPULATION
73.44
MALES / 100 FEMALES
136.17
FEMALES / 100 MALES
43.9
MEDIAN AGE
4.2
AVG FAMILY SIZE
3.1
AVG HOUSEHOLD SIZE
477
LABOR FORCE [ PEOPLE ]
41.4%
PERCENT IN LABOR FORCE
8.6%
UNEMPLOYMENT RATE
Linden Zip Codes
Linden Area Codes
Income in Linden
Income Overview in Linden
Per Capita Income in Linden is $19,252, while median incomes of families and households are $60,057 and $46,836 respectively.
| Characteristic | Number | Measure |
| Per Capita Income | 1,469 | $19,252 |
| Median Family Income | 256 | $60,057 |
| Mean Family Income | 256 | $65,725 |
| Median Household Income | 439 | $46,836 |
| Mean Household Income | 439 | $52,920 |
| Income Deficit | 256 | $0 |
| Wage / Income Gap (%) | 1,469 | 19.22% |
| Wage / Income Gap ($) | 1,469 | 80.78¢ per $1 |
| Gini / Inequality Index | 1,469 | 0.44 |
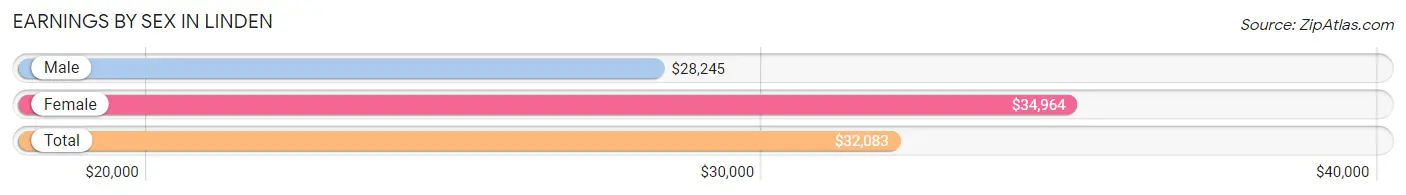
Earnings by Sex in Linden
Average Earnings in Linden are $32,083, $28,245 for men and $34,964 for women, a difference of 19.2%.
| Sex | Number | Average Earnings |
| Male | 162 (33.4%) | $28,245 |
| Female | 323 (66.6%) | $34,964 |
| Total | 485 (100.0%) | $32,083 |
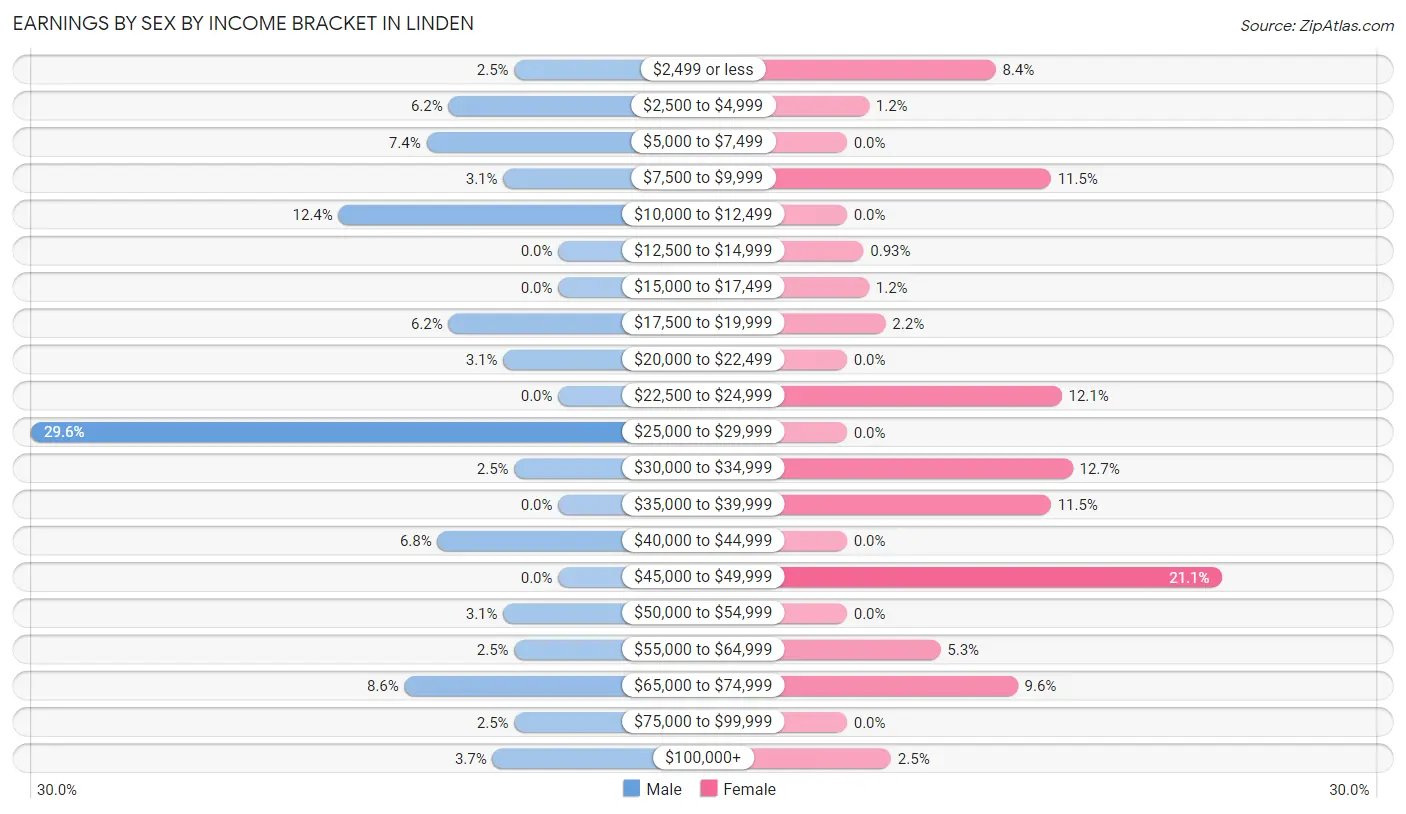
Earnings by Sex by Income Bracket in Linden
The most common earnings brackets in Linden are $25,000 to $29,999 for men (48 | 29.6%) and $45,000 to $49,999 for women (68 | 21.0%).
| Income | Male | Female |
| $2,499 or less | 4 (2.5%) | 27 (8.4%) |
| $2,500 to $4,999 | 10 (6.2%) | 4 (1.2%) |
| $5,000 to $7,499 | 12 (7.4%) | 0 (0.0%) |
| $7,500 to $9,999 | 5 (3.1%) | 37 (11.5%) |
| $10,000 to $12,499 | 20 (12.3%) | 0 (0.0%) |
| $12,500 to $14,999 | 0 (0.0%) | 3 (0.9%) |
| $15,000 to $17,499 | 0 (0.0%) | 4 (1.2%) |
| $17,500 to $19,999 | 10 (6.2%) | 7 (2.2%) |
| $20,000 to $22,499 | 5 (3.1%) | 0 (0.0%) |
| $22,500 to $24,999 | 0 (0.0%) | 39 (12.1%) |
| $25,000 to $29,999 | 48 (29.6%) | 0 (0.0%) |
| $30,000 to $34,999 | 4 (2.5%) | 41 (12.7%) |
| $35,000 to $39,999 | 0 (0.0%) | 37 (11.5%) |
| $40,000 to $44,999 | 11 (6.8%) | 0 (0.0%) |
| $45,000 to $49,999 | 0 (0.0%) | 68 (21.0%) |
| $50,000 to $54,999 | 5 (3.1%) | 0 (0.0%) |
| $55,000 to $64,999 | 4 (2.5%) | 17 (5.3%) |
| $65,000 to $74,999 | 14 (8.6%) | 31 (9.6%) |
| $75,000 to $99,999 | 4 (2.5%) | 0 (0.0%) |
| $100,000+ | 6 (3.7%) | 8 (2.5%) |
| Total | 162 (100.0%) | 323 (100.0%) |
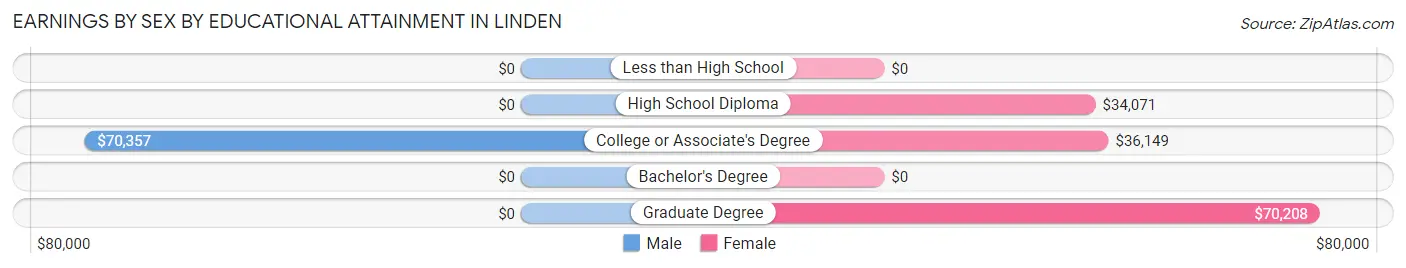
Earnings by Sex by Educational Attainment in Linden
Average earnings in Linden are $28,484 for men and $35,473 for women, a difference of 19.7%. Men with an educational attainment of college or associate's degree enjoy the highest average annual earnings of $70,357, while those with college or associate's degree education earn the least with $70,357. Women with an educational attainment of graduate degree earn the most with the average annual earnings of $70,208, while those with high school diploma education have the smallest earnings of $34,071.
| Educational Attainment | Male Income | Female Income |
| Less than High School | - | - |
| High School Diploma | - | - |
| College or Associate's Degree | $70,357 | $36,149 |
| Bachelor's Degree | - | - |
| Graduate Degree | - | - |
| Total | $28,484 | $35,473 |
Family Income in Linden
Family Income Brackets in Linden
According to the Linden family income data, there are 99 families falling into the $50,000 to $74,999 income range, which is the most common income bracket and makes up 38.7% of all families.
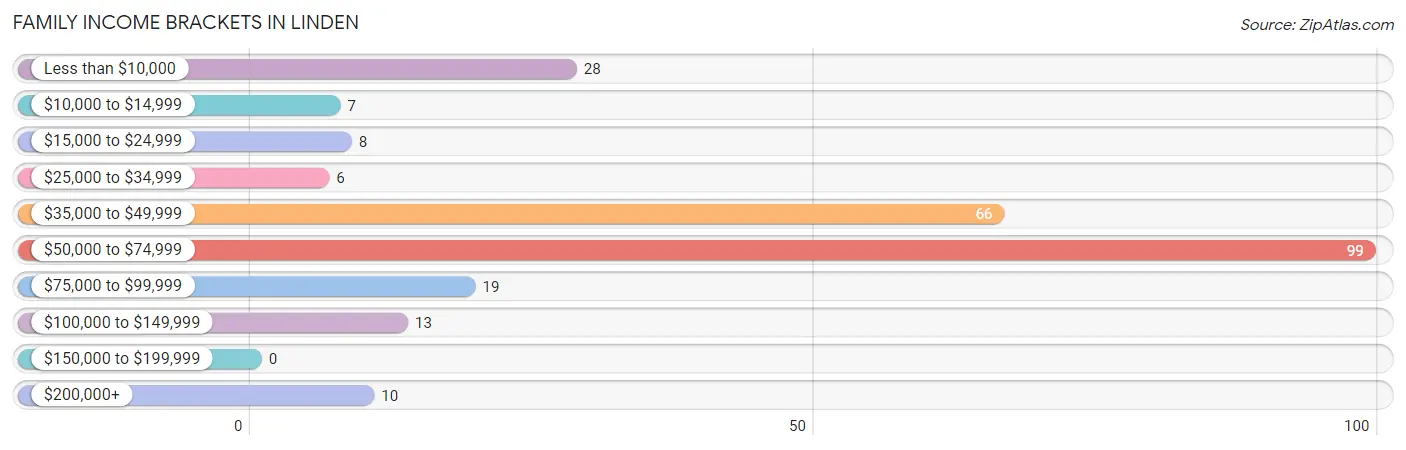
| Income Bracket | # Families | % Families |
| Less than $10,000 | 28 | 10.9% |
| $10,000 to $14,999 | 7 | 2.7% |
| $15,000 to $24,999 | 8 | 3.1% |
| $25,000 to $34,999 | 6 | 2.3% |
| $35,000 to $49,999 | 66 | 25.8% |
| $50,000 to $74,999 | 99 | 38.7% |
| $75,000 to $99,999 | 19 | 7.4% |
| $100,000 to $149,999 | 13 | 5.1% |
| $150,000 to $199,999 | 0 | 0.0% |
| $200,000+ | 10 | 3.9% |
Family Income by Famaliy Size in Linden
2-person families (104 | 40.6%) account for the highest median family income in Linden with $64,167 per family, while 2-person families (104 | 40.6%) have the highest median income of $32,084 per family member.
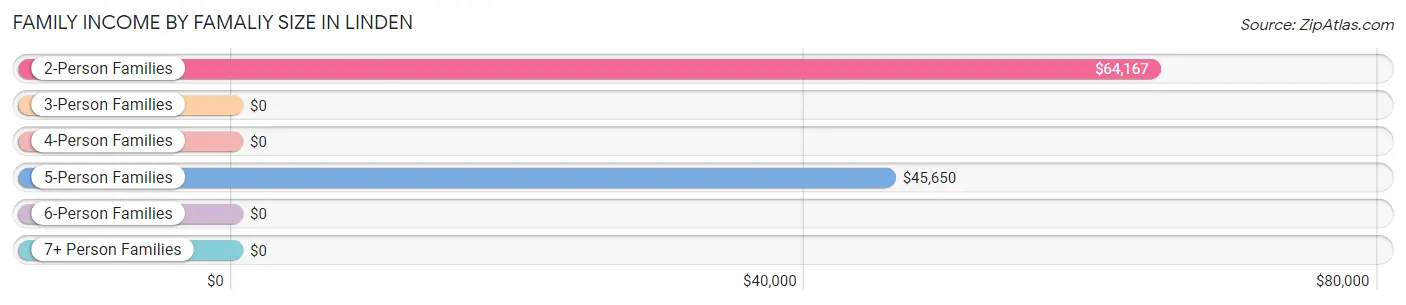
| Income Bracket | # Families | Median Income |
| 2-Person Families | 104 (40.6%) | $64,167 |
| 3-Person Families | 55 (21.5%) | $0 |
| 4-Person Families | 37 (14.4%) | $0 |
| 5-Person Families | 45 (17.6%) | $45,650 |
| 6-Person Families | 15 (5.9%) | $0 |
| 7+ Person Families | 0 (0.0%) | $0 |
| Total | 256 (100.0%) | $60,057 |
Family Income by Number of Earners in Linden
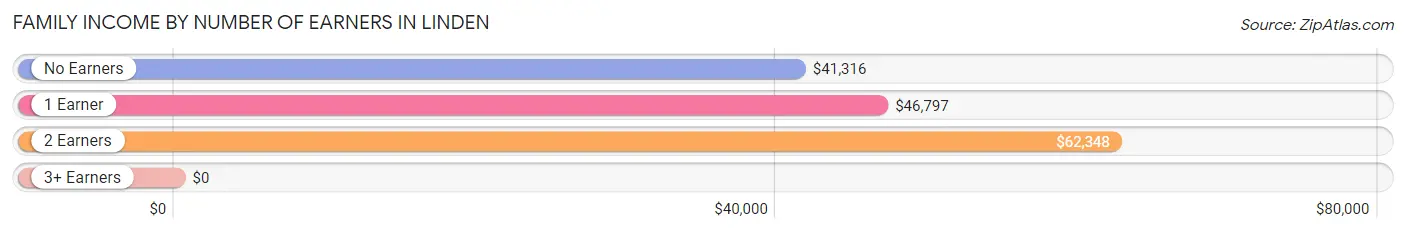
| Number of Earners | # Families | Median Income |
| No Earners | 68 (26.6%) | $41,316 |
| 1 Earner | 110 (43.0%) | $46,797 |
| 2 Earners | 77 (30.1%) | $62,348 |
| 3+ Earners | 1 (0.4%) | $0 |
| Total | 256 (100.0%) | $60,057 |
Household Income in Linden
Household Income Brackets in Linden
With 134 households falling in the category, the $50,000 to $74,999 income range is the most frequent in Linden, accounting for 30.5% of all households.
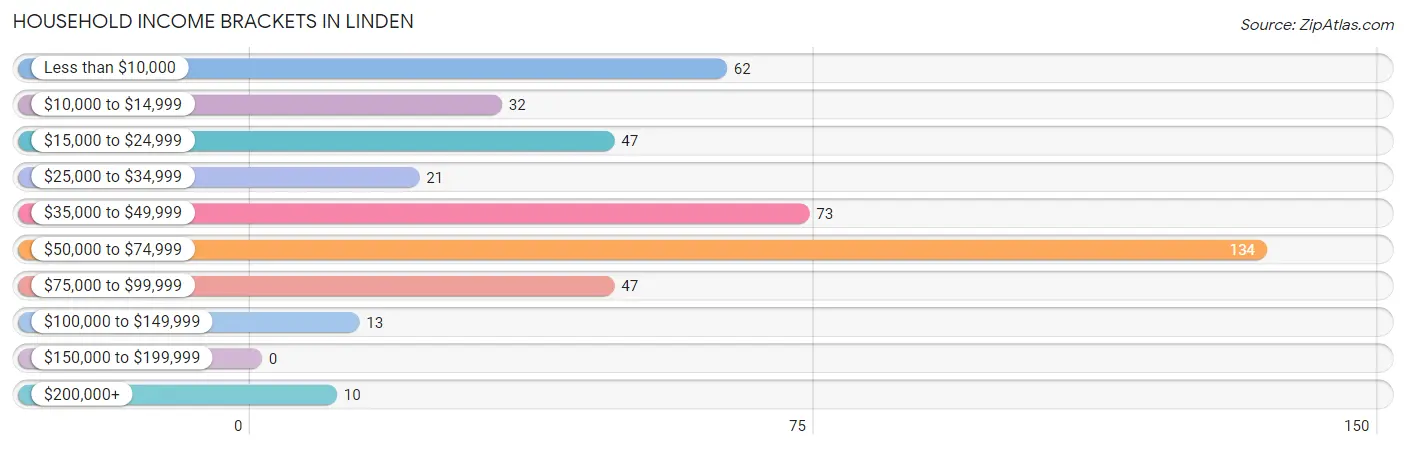
| Income Bracket | # Households | % Households |
| Less than $10,000 | 62 | 14.1% |
| $10,000 to $14,999 | 32 | 7.3% |
| $15,000 to $24,999 | 47 | 10.7% |
| $25,000 to $34,999 | 21 | 4.8% |
| $35,000 to $49,999 | 73 | 16.6% |
| $50,000 to $74,999 | 134 | 30.5% |
| $75,000 to $99,999 | 47 | 10.7% |
| $100,000 to $149,999 | 13 | 3.0% |
| $150,000 to $199,999 | 0 | 0.0% |
| $200,000+ | 10 | 2.3% |
Household Income by Householder Age in Linden
The median household income in Linden is $46,836, with the highest median household income of $61,890 found in the 45 to 64 years age bracket for the primary householder. A total of 214 households (48.7%) fall into this category. Meanwhile, the 15 to 24 years age bracket for the primary householder has the lowest median household income of $0, with 4 households (0.9%) in this group.
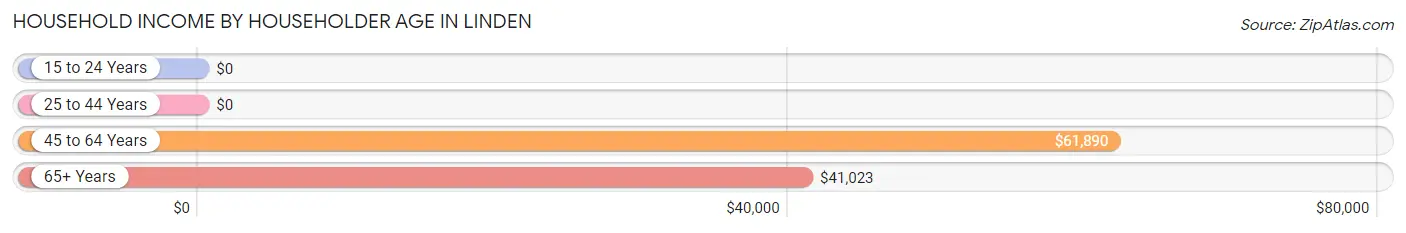
| Income Bracket | # Households | Median Income |
| 15 to 24 Years | 4 (0.9%) | $0 |
| 25 to 44 Years | 74 (16.9%) | $0 |
| 45 to 64 Years | 214 (48.7%) | $61,890 |
| 65+ Years | 147 (33.5%) | $41,023 |
| Total | 439 (100.0%) | $46,836 |
Poverty in Linden
Income Below Poverty by Sex and Age in Linden
With 13.9% poverty level for males and 13.6% for females among the residents of Linden, under 5 year old males and 55 to 64 year old females are the most vulnerable to poverty, with 23 males (69.7%) and 34 females (23.1%) in their respective age groups living below the poverty level.
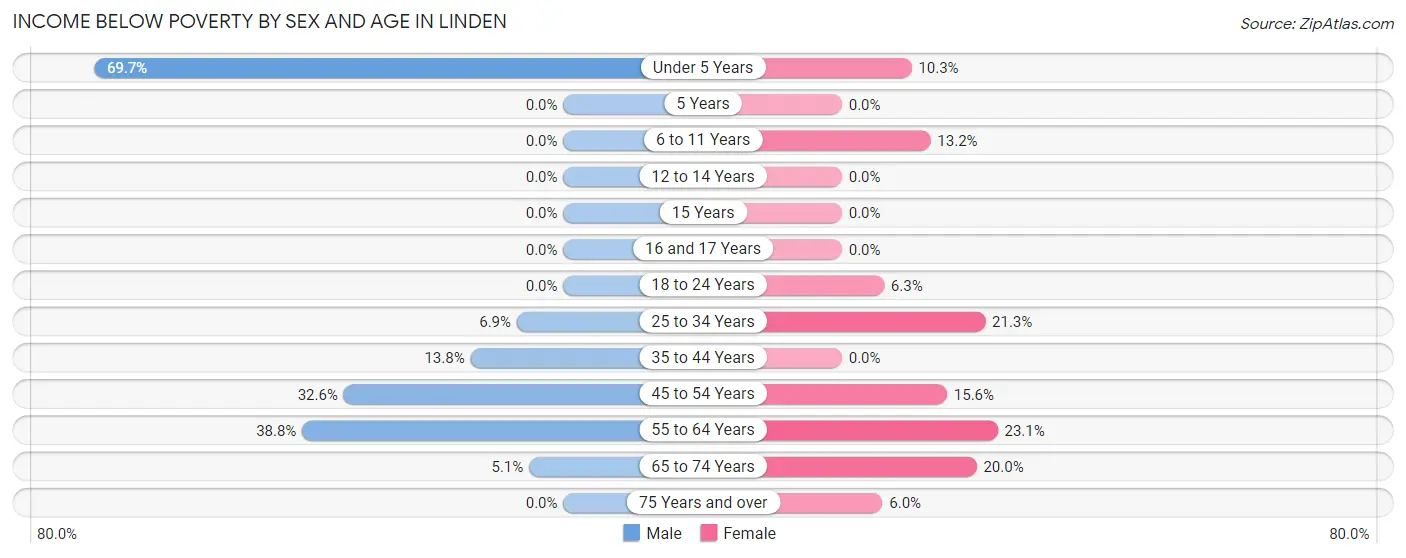
| Age Bracket | Male | Female |
| Under 5 Years | 23 (69.7%) | 6 (10.3%) |
| 5 Years | 0 (0.0%) | 0 (0.0%) |
| 6 to 11 Years | 0 (0.0%) | 5 (13.2%) |
| 12 to 14 Years | 0 (0.0%) | 0 (0.0%) |
| 15 Years | 0 (0.0%) | 0 (0.0%) |
| 16 and 17 Years | 0 (0.0%) | 0 (0.0%) |
| 18 to 24 Years | 0 (0.0%) | 1 (6.2%) |
| 25 to 34 Years | 2 (6.9%) | 30 (21.3%) |
| 35 to 44 Years | 4 (13.8%) | 0 (0.0%) |
| 45 to 54 Years | 30 (32.6%) | 17 (15.6%) |
| 55 to 64 Years | 19 (38.8%) | 34 (23.1%) |
| 65 to 74 Years | 3 (5.1%) | 6 (20.0%) |
| 75 Years and over | 0 (0.0%) | 5 (6.0%) |
| Total | 81 (13.9%) | 104 (13.6%) |
Income Above Poverty by Sex and Age in Linden
According to the poverty statistics in Linden, males aged 6 to 11 years and females aged 5 years are the age groups that are most secure financially, with 100.0% of males and 100.0% of females in these age groups living above the poverty line.
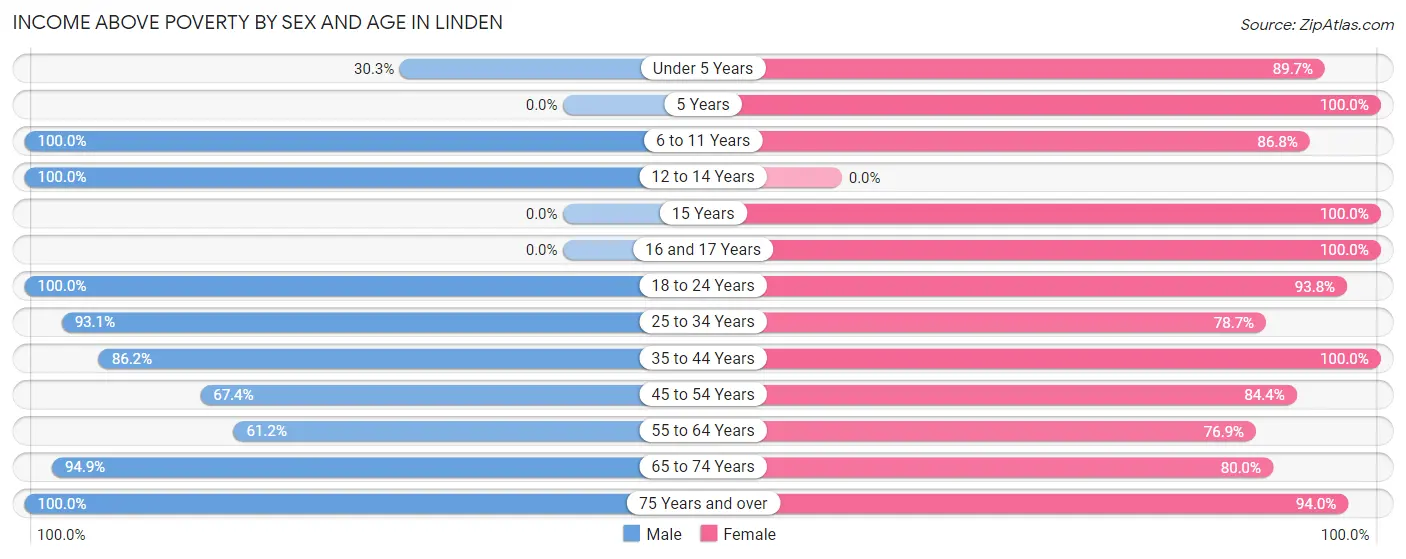
| Age Bracket | Male | Female |
| Under 5 Years | 10 (30.3%) | 52 (89.7%) |
| 5 Years | 0 (0.0%) | 9 (100.0%) |
| 6 to 11 Years | 93 (100.0%) | 33 (86.8%) |
| 12 to 14 Years | 57 (100.0%) | 0 (0.0%) |
| 15 Years | 0 (0.0%) | 20 (100.0%) |
| 16 and 17 Years | 0 (0.0%) | 18 (100.0%) |
| 18 to 24 Years | 92 (100.0%) | 15 (93.8%) |
| 25 to 34 Years | 27 (93.1%) | 111 (78.7%) |
| 35 to 44 Years | 25 (86.2%) | 95 (100.0%) |
| 45 to 54 Years | 62 (67.4%) | 92 (84.4%) |
| 55 to 64 Years | 30 (61.2%) | 113 (76.9%) |
| 65 to 74 Years | 56 (94.9%) | 24 (80.0%) |
| 75 Years and over | 51 (100.0%) | 78 (94.0%) |
| Total | 503 (86.1%) | 660 (86.4%) |
Income Below Poverty Among Married-Couple Families in Linden
The poverty statistics for married-couple families in Linden show that 9.7% or 19 of the total 195 families live below the poverty line. Families with no children have the highest poverty rate of 16.4%, comprising of 17 families. On the other hand, families with 3 or 4 children have the lowest poverty rate of 0.0%, which includes 0 families.
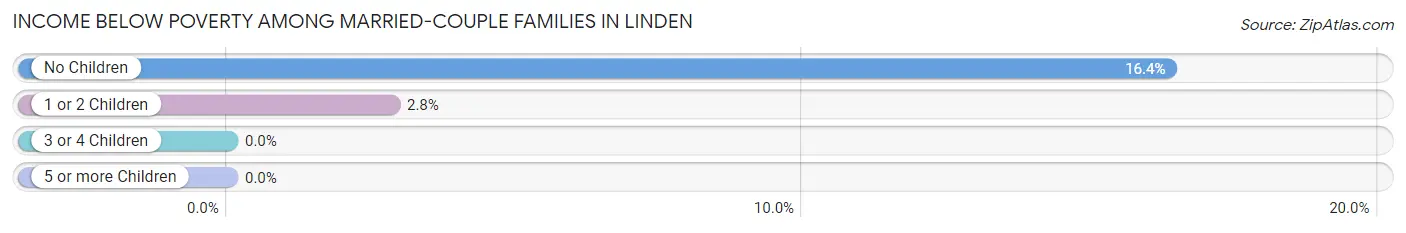
| Children | Above Poverty | Below Poverty |
| No Children | 87 (83.7%) | 17 (16.4%) |
| 1 or 2 Children | 69 (97.2%) | 2 (2.8%) |
| 3 or 4 Children | 20 (100.0%) | 0 (0.0%) |
| 5 or more Children | 0 (0.0%) | 0 (0.0%) |
| Total | 176 (90.3%) | 19 (9.7%) |
Income Below Poverty Among Single-Parent Households in Linden
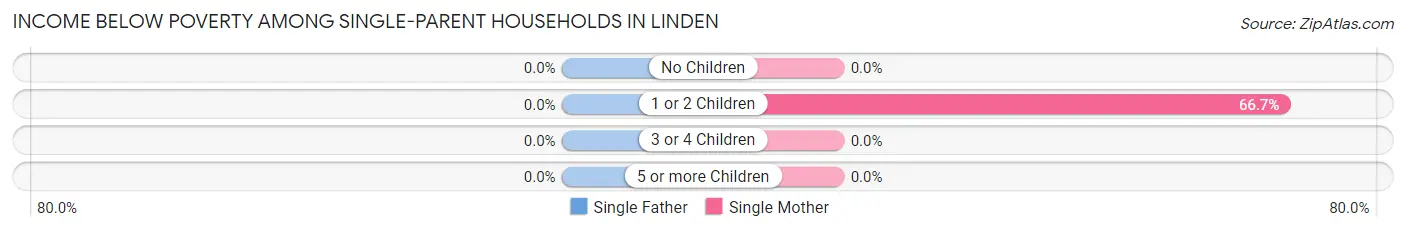
| Children | Single Father | Single Mother |
| No Children | 0 (0.0%) | 0 (0.0%) |
| 1 or 2 Children | 0 (0.0%) | 24 (66.7%) |
| 3 or 4 Children | 0 (0.0%) | 0 (0.0%) |
| 5 or more Children | 0 (0.0%) | 0 (0.0%) |
| Total | 0 (0.0%) | 24 (41.4%) |
Income Below Poverty Among Married-Couple vs Single-Parent Households in Linden
The poverty data for Linden shows that 19 of the married-couple family households (9.7%) and 24 of the single-parent households (39.3%) are living below the poverty level. Within the married-couple family households, those with no children have the highest poverty rate, with 17 households (16.4%) falling below the poverty line. Among the single-parent households, those with 1 or 2 children have the highest poverty rate, with 24 household (66.7%) living below poverty.
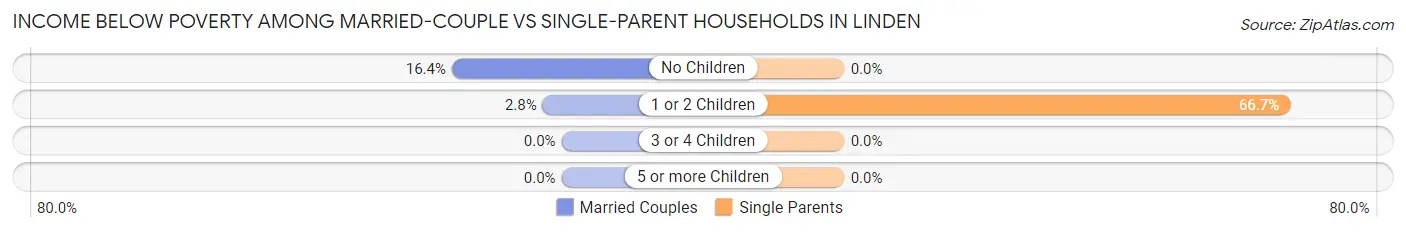
| Children | Married-Couple Families | Single-Parent Households |
| No Children | 17 (16.4%) | 0 (0.0%) |
| 1 or 2 Children | 2 (2.8%) | 24 (66.7%) |
| 3 or 4 Children | 0 (0.0%) | 0 (0.0%) |
| 5 or more Children | 0 (0.0%) | 0 (0.0%) |
| Total | 19 (9.7%) | 24 (39.3%) |
Race in Linden
The most populous races in Linden are White / Caucasian (1,136 | 77.3%), Asian (186 | 12.7%), and Two or more Races (128 | 8.7%).
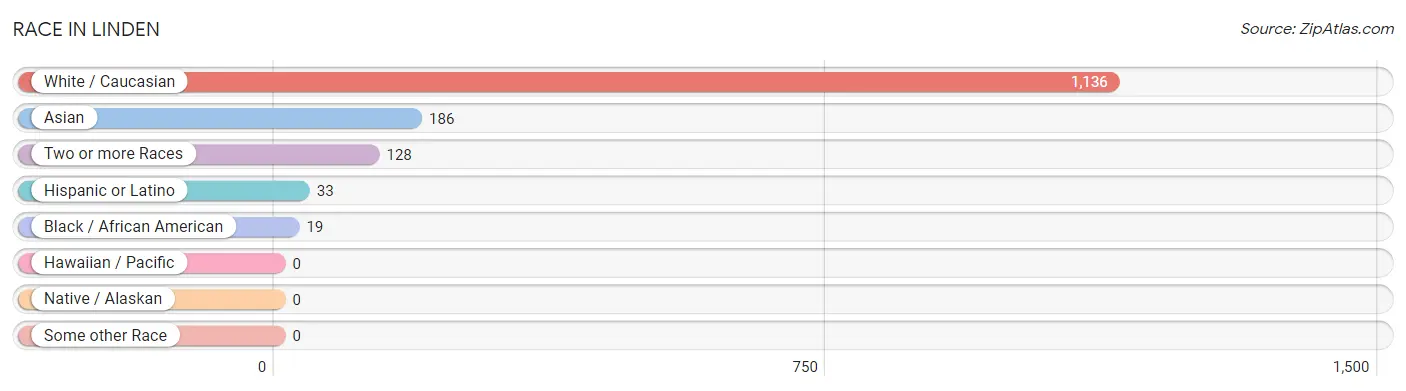
| Race | # Population | % Population |
| Asian | 186 | 12.7% |
| Black / African American | 19 | 1.3% |
| Hawaiian / Pacific | 0 | 0.0% |
| Hispanic or Latino | 33 | 2.2% |
| Native / Alaskan | 0 | 0.0% |
| White / Caucasian | 1,136 | 77.3% |
| Two or more Races | 128 | 8.7% |
| Some other Race | 0 | 0.0% |
| Total | 1,469 | 100.0% |
Ancestry in Linden
The most populous ancestries reported in Linden are American (250 | 17.0%), Thai (163 | 11.1%), English (82 | 5.6%), Mexican (33 | 2.2%), and German (31 | 2.1%), together accounting for 38.1% of all Linden residents.
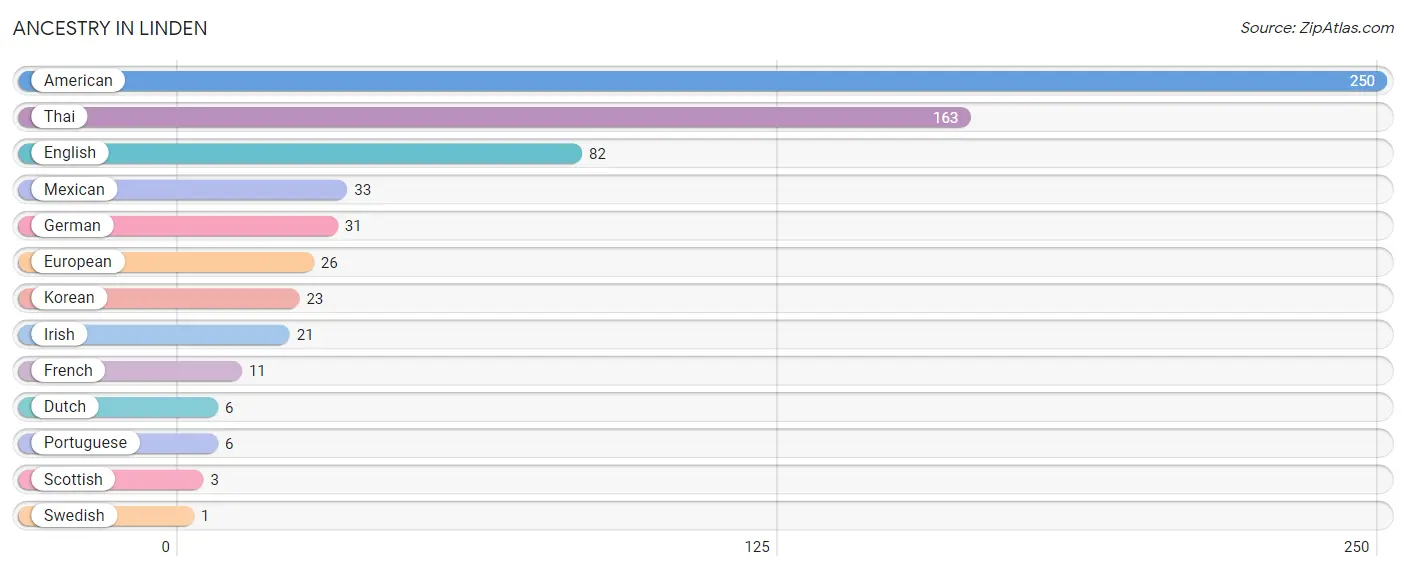
| Ancestry | # Population | % Population |
| American | 250 | 17.0% |
| Dutch | 6 | 0.4% |
| English | 82 | 5.6% |
| European | 26 | 1.8% |
| French | 11 | 0.7% |
| German | 31 | 2.1% |
| Irish | 21 | 1.4% |
| Korean | 23 | 1.6% |
| Mexican | 33 | 2.2% |
| Portuguese | 6 | 0.4% |
| Scottish | 3 | 0.2% |
| Swedish | 1 | 0.1% |
| Thai | 163 | 11.1% | View All 13 Rows |
Immigrants in Linden
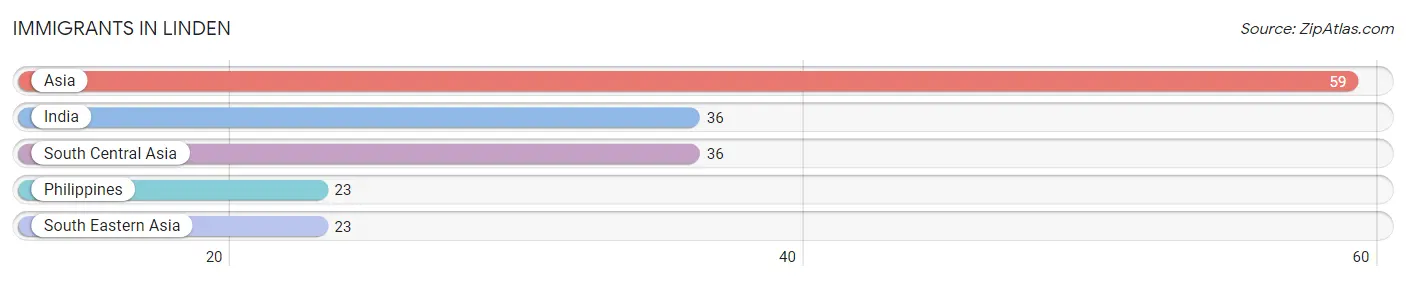
The most numerous immigrant groups reported in Linden came from Asia (59 | 4.0%), India (36 | 2.5%), South Central Asia (36 | 2.5%), Philippines (23 | 1.6%), and South Eastern Asia (23 | 1.6%), together accounting for 12.1% of all Linden residents.
| Immigration Origin | # Population | % Population |
| Asia | 59 | 4.0% |
| India | 36 | 2.5% |
| Philippines | 23 | 1.6% |
| South Central Asia | 36 | 2.5% |
| South Eastern Asia | 23 | 1.6% | View All 5 Rows |
Sex and Age in Linden
Sex and Age in Linden
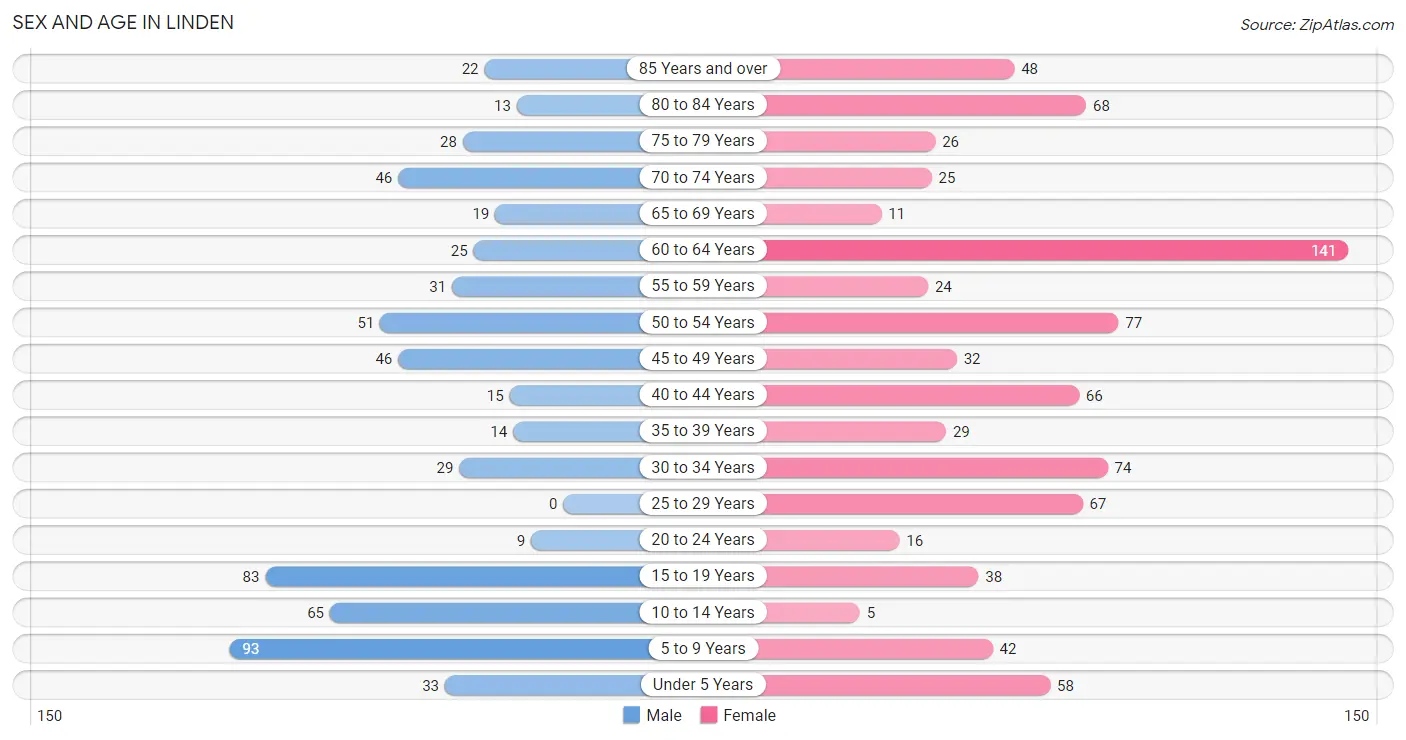
The most populous age groups in Linden are 5 to 9 Years (93 | 14.9%) for men and 60 to 64 Years (141 | 16.7%) for women.
| Age Bracket | Male | Female |
| Under 5 Years | 33 (5.3%) | 58 (6.9%) |
| 5 to 9 Years | 93 (14.9%) | 42 (5.0%) |
| 10 to 14 Years | 65 (10.4%) | 5 (0.6%) |
| 15 to 19 Years | 83 (13.3%) | 38 (4.5%) |
| 20 to 24 Years | 9 (1.5%) | 16 (1.9%) |
| 25 to 29 Years | 0 (0.0%) | 67 (7.9%) |
| 30 to 34 Years | 29 (4.7%) | 74 (8.7%) |
| 35 to 39 Years | 14 (2.2%) | 29 (3.4%) |
| 40 to 44 Years | 15 (2.4%) | 66 (7.8%) |
| 45 to 49 Years | 46 (7.4%) | 32 (3.8%) |
| 50 to 54 Years | 51 (8.2%) | 77 (9.1%) |
| 55 to 59 Years | 31 (5.0%) | 24 (2.8%) |
| 60 to 64 Years | 25 (4.0%) | 141 (16.7%) |
| 65 to 69 Years | 19 (3.0%) | 11 (1.3%) |
| 70 to 74 Years | 46 (7.4%) | 25 (2.9%) |
| 75 to 79 Years | 28 (4.5%) | 26 (3.1%) |
| 80 to 84 Years | 13 (2.1%) | 68 (8.0%) |
| 85 Years and over | 22 (3.5%) | 48 (5.7%) |
| Total | 622 (100.0%) | 847 (100.0%) |
Families and Households in Linden
Median Family Size in Linden
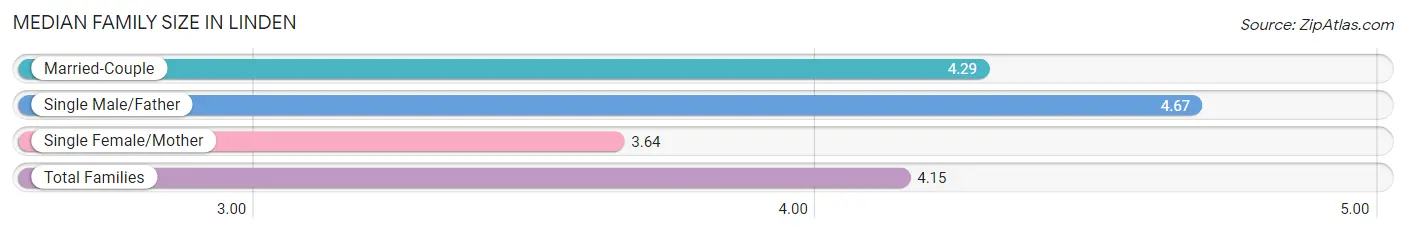
The median family size in Linden is 4.15 persons per family, with single male/father families (3 | 1.2%) accounting for the largest median family size of 4.67 persons per family. On the other hand, single female/mother families (58 | 22.7%) represent the smallest median family size with 3.64 persons per family.
| Family Type | # Families | Family Size |
| Married-Couple | 195 (76.2%) | 4.29 |
| Single Male/Father | 3 (1.2%) | 4.67 |
| Single Female/Mother | 58 (22.7%) | 3.64 |
| Total Families | 256 (100.0%) | 4.15 |
Median Household Size in Linden
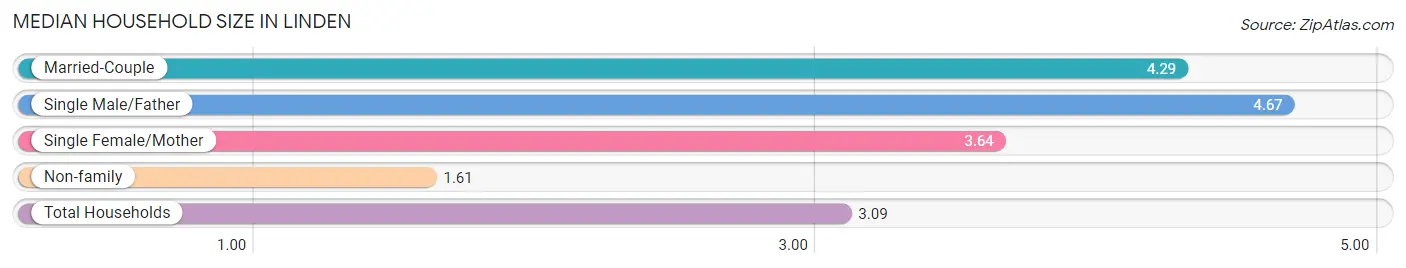
The median household size in Linden is 3.09 persons per household, with single male/father households (3 | 0.7%) accounting for the largest median household size of 4.67 persons per household. non-family households (183 | 41.7%) represent the smallest median household size with 1.61 persons per household.
| Household Type | # Households | Household Size |
| Married-Couple | 195 (44.4%) | 4.29 |
| Single Male/Father | 3 (0.7%) | 4.67 |
| Single Female/Mother | 58 (13.2%) | 3.64 |
| Non-family | 183 (41.7%) | 1.61 |
| Total Households | 439 (100.0%) | 3.09 |
Household Size by Marriage Status in Linden
Out of a total of 439 households in Linden, 256 (58.3%) are family households, while 183 (41.7%) are nonfamily households. The most numerous type of family households are 2-person households, comprising 104, and the most common type of nonfamily households are 1-person households, comprising 144.
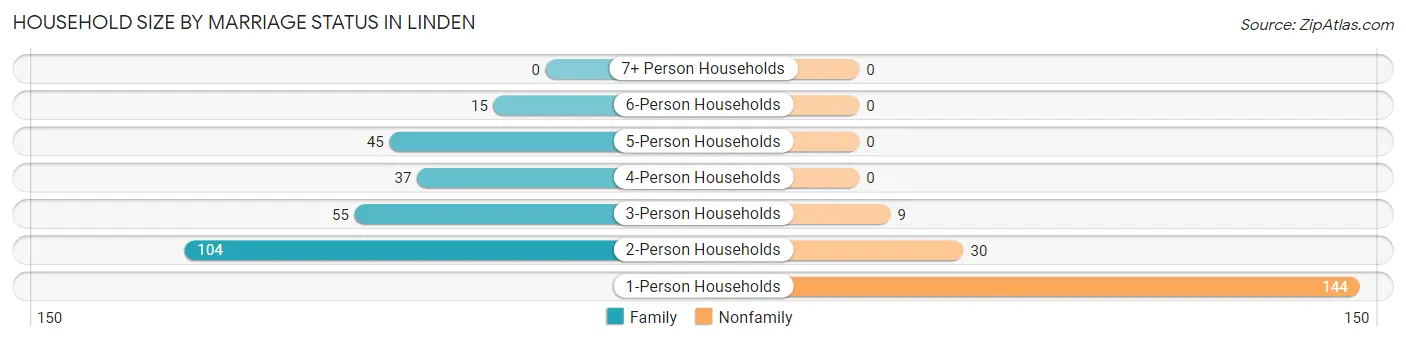
| Household Size | Family Households | Nonfamily Households |
| 1-Person Households | - | 144 (32.8%) |
| 2-Person Households | 104 (23.7%) | 30 (6.8%) |
| 3-Person Households | 55 (12.5%) | 9 (2.1%) |
| 4-Person Households | 37 (8.4%) | 0 (0.0%) |
| 5-Person Households | 45 (10.2%) | 0 (0.0%) |
| 6-Person Households | 15 (3.4%) | 0 (0.0%) |
| 7+ Person Households | 0 (0.0%) | 0 (0.0%) |
| Total | 256 (58.3%) | 183 (41.7%) |
Female Fertility in Linden
Fertility by Age in Linden
Average fertility rate in Linden is 96.0 births per 1,000 women. Women in the age bracket of 35 to 50 years have the highest fertility rate with 126.0 births per 1,000 women. Women in the age bracket of 35 to 50 years acount for 51.6% of all women with births.
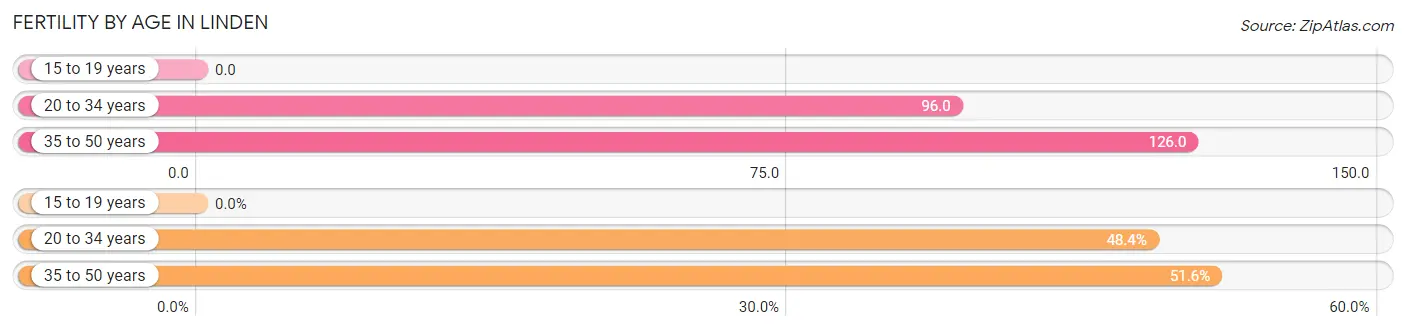
| Age Bracket | Women with Births | Births / 1,000 Women |
| 15 to 19 years | 0 (0.0%) | 0.0 |
| 20 to 34 years | 15 (48.4%) | 96.0 |
| 35 to 50 years | 16 (51.6%) | 126.0 |
| Total | 31 (100.0%) | 96.0 |
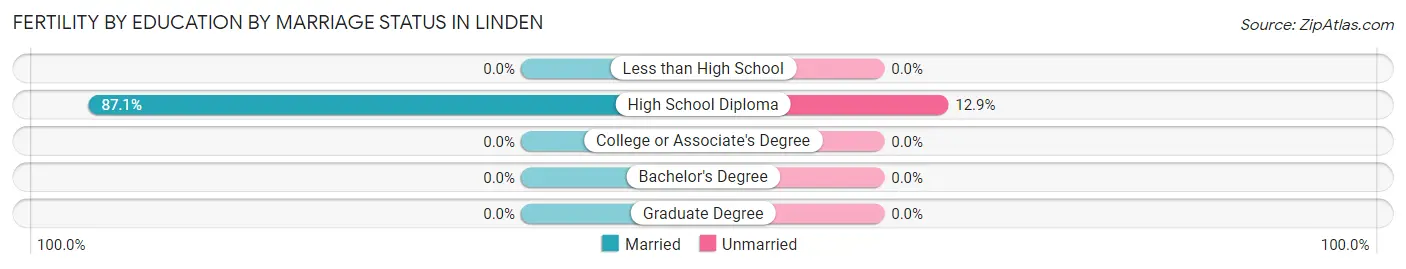
Fertility by Age by Marriage Status in Linden
87.1% of women with births (31) in Linden are married. The highest percentage of unmarried women with births falls into 20 to 34 years age bracket with 26.7% of them unmarried at the time of birth, while the lowest percentage of unmarried women with births belong to 35 to 50 years age bracket with 0.0% of them unmarried.
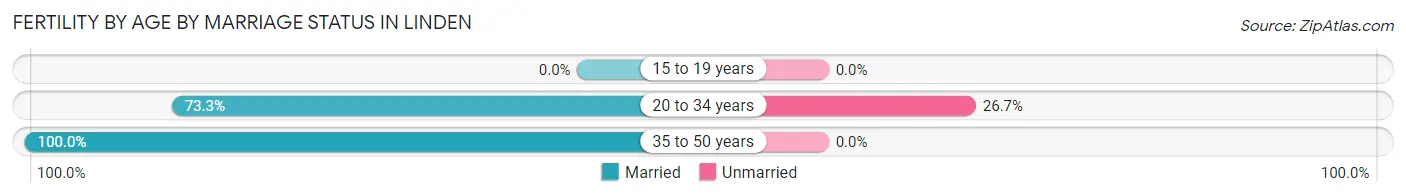
| Age Bracket | Married | Unmarried |
| 15 to 19 years | 0 (0.0%) | 0 (0.0%) |
| 20 to 34 years | 11 (73.3%) | 4 (26.7%) |
| 35 to 50 years | 16 (100.0%) | 0 (0.0%) |
| Total | 27 (87.1%) | 4 (12.9%) |
Fertility by Education in Linden
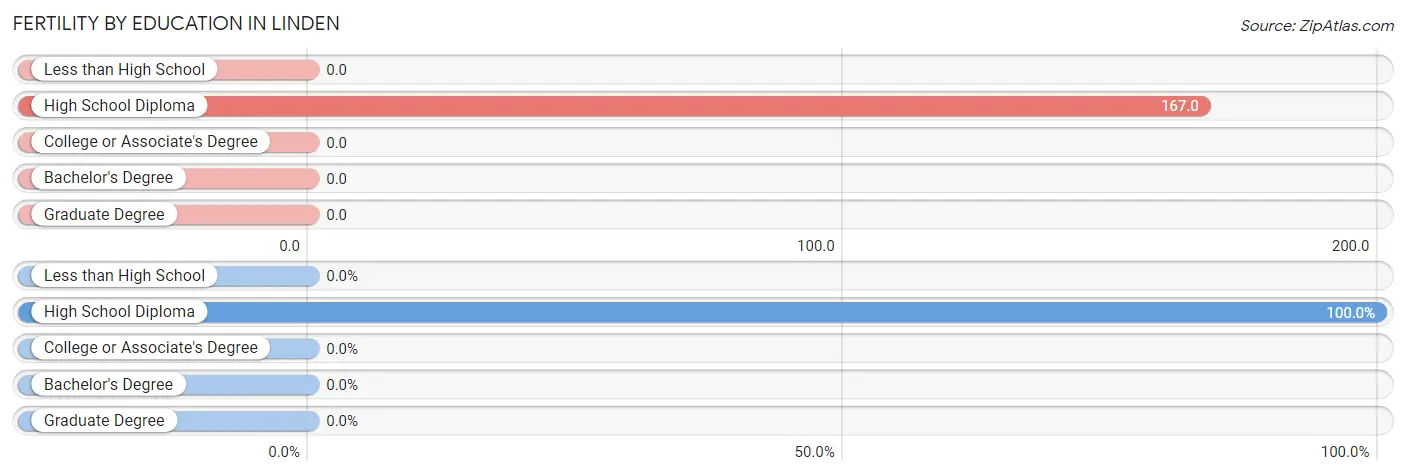
| Educational Attainment | Women with Births | Births / 1,000 Women |
| Less than High School | 0 (0.0%) | 0.0 |
| High School Diploma | 31 (100.0%) | 167.0 |
| College or Associate's Degree | 0 (0.0%) | 0.0 |
| Bachelor's Degree | 0 (0.0%) | 0.0 |
| Graduate Degree | 0 (0.0%) | 0.0 |
| Total | 31 (100.0%) | 96.0 |
Fertility by Education by Marriage Status in Linden
12.9% of women with births in Linden are unmarried. Women with the educational attainment of high school diploma are most likely to be married with 87.1% of them married at childbirth, while women with the educational attainment of high school diploma are least likely to be married with 12.9% of them unmarried at childbirth.
| Educational Attainment | Married | Unmarried |
| Less than High School | 0 (0.0%) | 0 (0.0%) |
| High School Diploma | 27 (87.1%) | 4 (12.9%) |
| College or Associate's Degree | 0 (0.0%) | 0 (0.0%) |
| Bachelor's Degree | 0 (0.0%) | 0 (0.0%) |
| Graduate Degree | 0 (0.0%) | 0 (0.0%) |
| Total | 27 (87.1%) | 4 (12.9%) |
Employment Characteristics in Linden
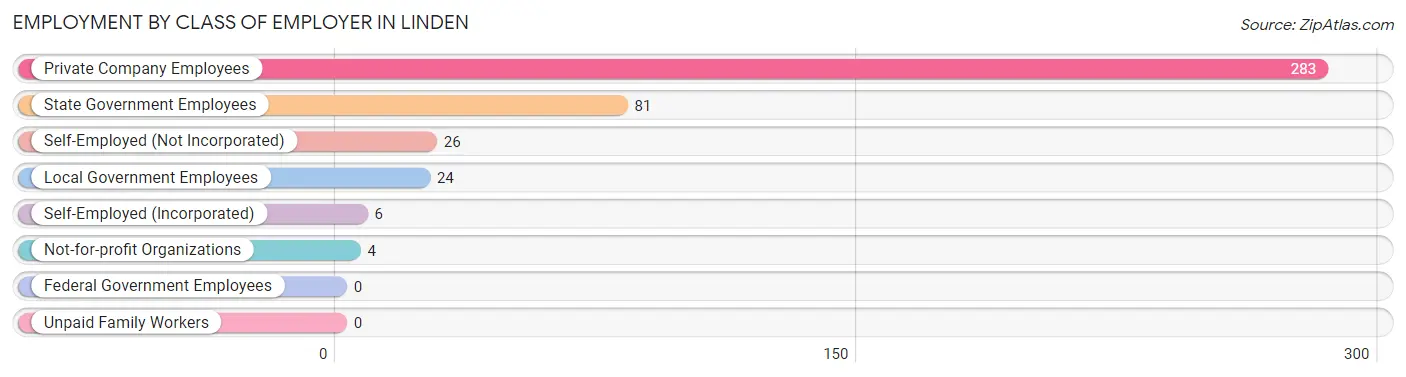
Employment by Class of Employer in Linden
Among the 424 employed individuals in Linden, private company employees (283 | 66.7%), state government employees (81 | 19.1%), and self-employed (not incorporated) (26 | 6.1%) make up the most common classes of employment.
| Employer Class | # Employees | % Employees |
| Private Company Employees | 283 | 66.7% |
| Self-Employed (Incorporated) | 6 | 1.4% |
| Self-Employed (Not Incorporated) | 26 | 6.1% |
| Not-for-profit Organizations | 4 | 0.9% |
| Local Government Employees | 24 | 5.7% |
| State Government Employees | 81 | 19.1% |
| Federal Government Employees | 0 | 0.0% |
| Unpaid Family Workers | 0 | 0.0% |
| Total | 424 | 100.0% |
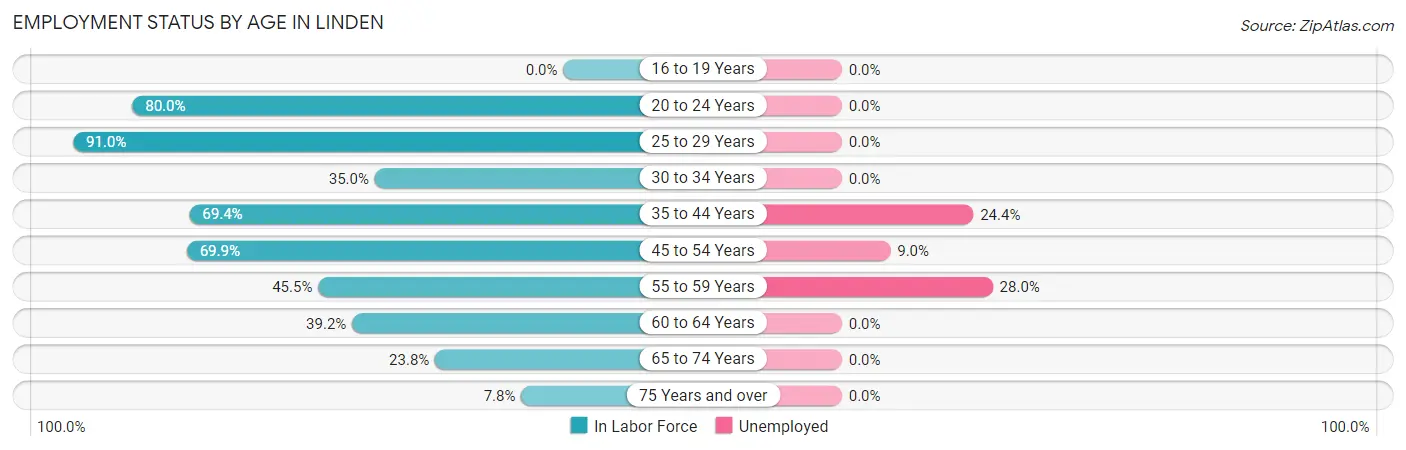
Employment Status by Age in Linden
According to the labor force statistics for Linden, out of the total population over 16 years of age (1,153), 41.4% or 477 individuals are in the labor force, with 8.6% or 41 of them unemployed. The age group with the highest labor force participation rate is 25 to 29 years, with 91.0% or 61 individuals in the labor force. Within the labor force, the 55 to 59 years age range has the highest percentage of unemployed individuals, with 28.0% or 7 of them being unemployed.
| Age Bracket | In Labor Force | Unemployed |
| 16 to 19 Years | 0 (0.0%) | 0 (0.0%) |
| 20 to 24 Years | 20 (80.0%) | 0 (0.0%) |
| 25 to 29 Years | 61 (91.0%) | 0 (0.0%) |
| 30 to 34 Years | 36 (35.0%) | 0 (0.0%) |
| 35 to 44 Years | 86 (69.4%) | 21 (24.4%) |
| 45 to 54 Years | 144 (69.9%) | 13 (9.0%) |
| 55 to 59 Years | 25 (45.5%) | 7 (28.0%) |
| 60 to 64 Years | 65 (39.2%) | 0 (0.0%) |
| 65 to 74 Years | 24 (23.8%) | 0 (0.0%) |
| 75 Years and over | 16 (7.8%) | 0 (0.0%) |
| Total | 477 (41.4%) | 41 (8.6%) |
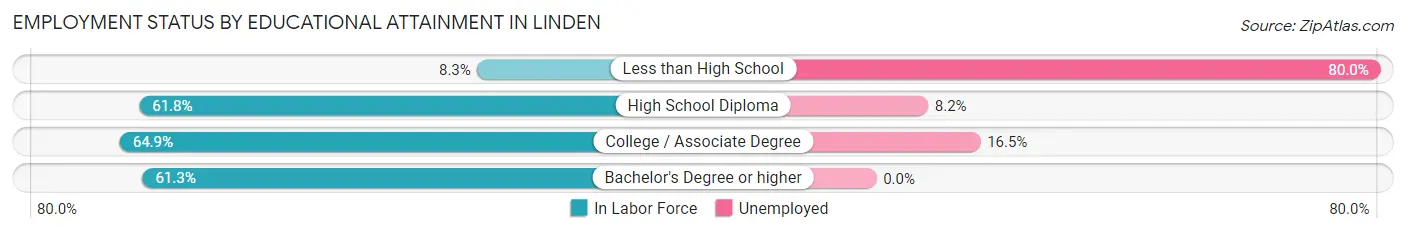
Employment Status by Educational Attainment in Linden
According to labor force statistics for Linden, 57.8% of individuals (417) out of the total population between 25 and 64 years of age (721) are in the labor force, with 9.8% or 41 of them being unemployed. The group with the highest labor force participation rate are those with the educational attainment of college / associate degree, with 64.9% or 85 individuals in the labor force. Within the labor force, individuals with less than high school education have the highest percentage of unemployment, with 80.0% or 4 of them being unemployed.
| Educational Attainment | In Labor Force | Unemployed |
| Less than High School | 5 (8.3%) | 48 (80.0%) |
| High School Diploma | 281 (61.8%) | 37 (8.2%) |
| College / Associate Degree | 85 (64.9%) | 22 (16.5%) |
| Bachelor's Degree or higher | 46 (61.3%) | 0 (0.0%) |
| Total | 417 (57.8%) | 71 (9.8%) |
Employment Occupations by Sex in Linden
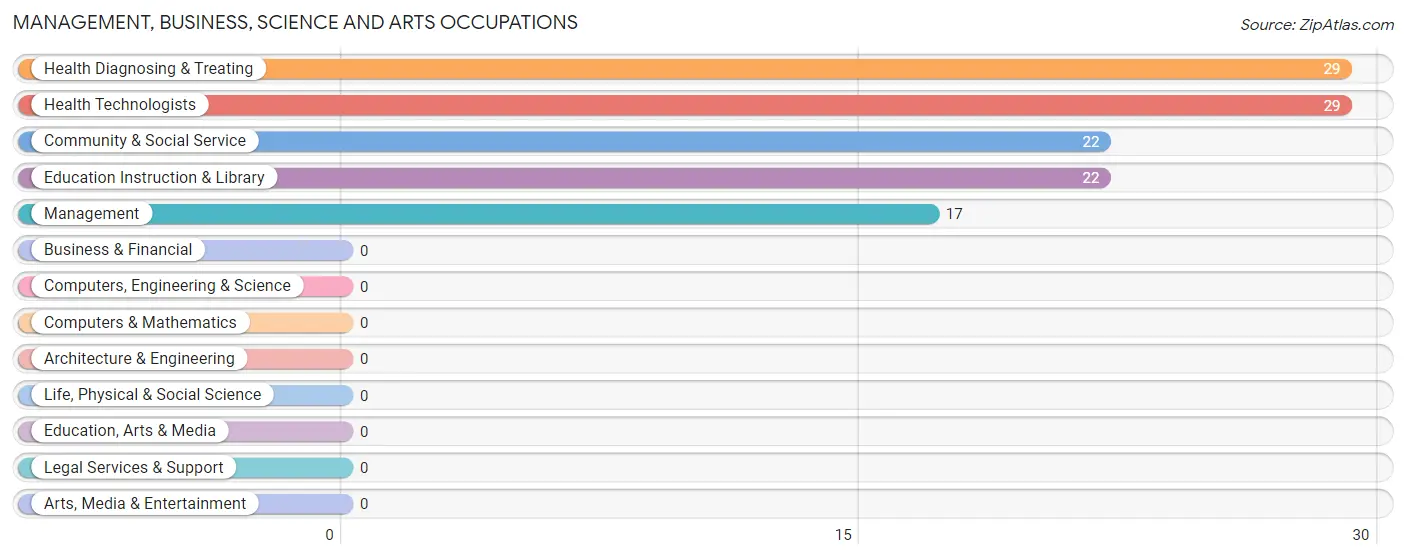
Management, Business, Science and Arts Occupations
The most common Management, Business, Science and Arts occupations in Linden are Health Diagnosing & Treating (29 | 6.7%), Health Technologists (29 | 6.7%), Community & Social Service (22 | 5.1%), Education Instruction & Library (22 | 5.1%), and Management (17 | 3.9%).
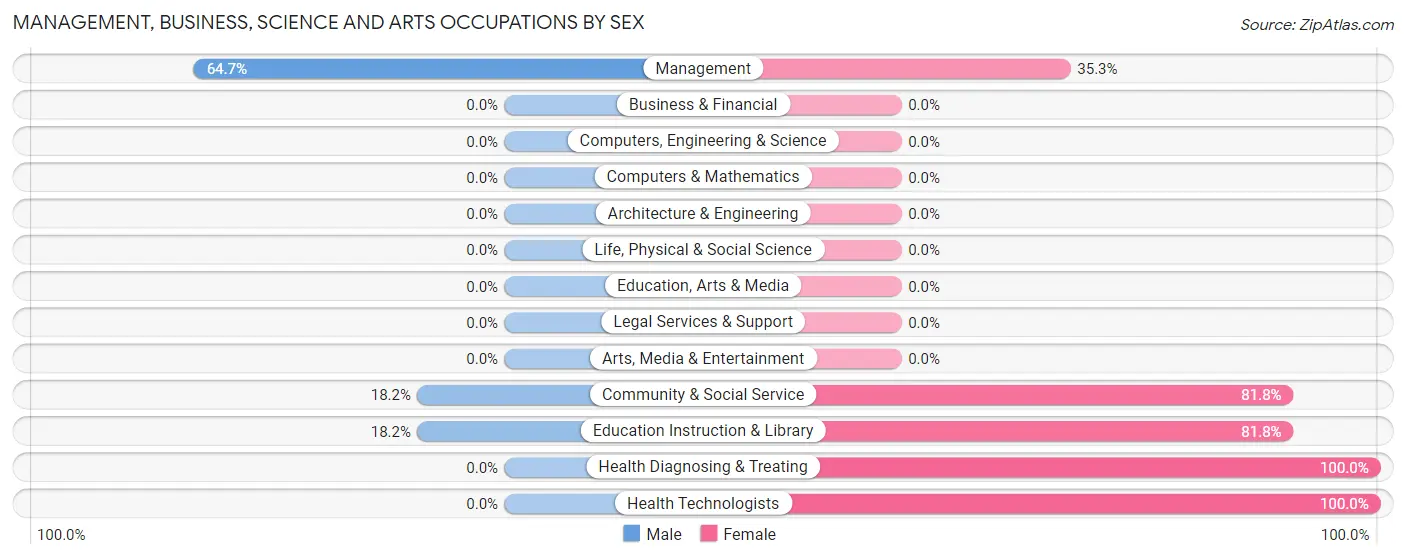
Management, Business, Science and Arts Occupations by Sex
Within the Management, Business, Science and Arts occupations in Linden, the most male-oriented occupations are Management (64.7%), Community & Social Service (18.2%), and Education Instruction & Library (18.2%), while the most female-oriented occupations are Health Diagnosing & Treating (100.0%), Health Technologists (100.0%), and Community & Social Service (81.8%).
| Occupation | Male | Female |
| Management | 11 (64.7%) | 6 (35.3%) |
| Business & Financial | 0 (0.0%) | 0 (0.0%) |
| Computers, Engineering & Science | 0 (0.0%) | 0 (0.0%) |
| Computers & Mathematics | 0 (0.0%) | 0 (0.0%) |
| Architecture & Engineering | 0 (0.0%) | 0 (0.0%) |
| Life, Physical & Social Science | 0 (0.0%) | 0 (0.0%) |
| Community & Social Service | 4 (18.2%) | 18 (81.8%) |
| Education, Arts & Media | 0 (0.0%) | 0 (0.0%) |
| Legal Services & Support | 0 (0.0%) | 0 (0.0%) |
| Education Instruction & Library | 4 (18.2%) | 18 (81.8%) |
| Arts, Media & Entertainment | 0 (0.0%) | 0 (0.0%) |
| Health Diagnosing & Treating | 0 (0.0%) | 29 (100.0%) |
| Health Technologists | 0 (0.0%) | 29 (100.0%) |
| Total (Category) | 15 (22.1%) | 53 (77.9%) |
| Total (Overall) | 158 (36.2%) | 278 (63.8%) |
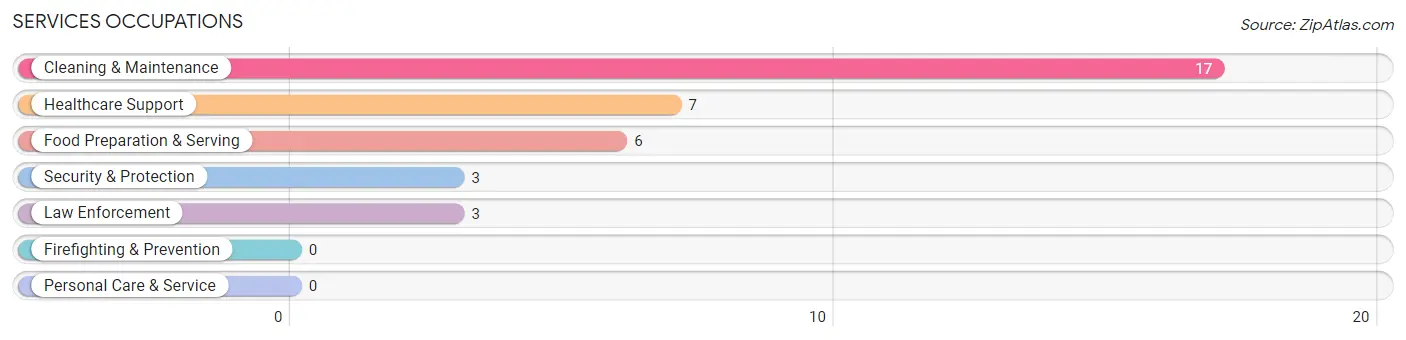
Services Occupations
The most common Services occupations in Linden are Cleaning & Maintenance (17 | 3.9%), Healthcare Support (7 | 1.6%), Food Preparation & Serving (6 | 1.4%), Security & Protection (3 | 0.7%), and Law Enforcement (3 | 0.7%).
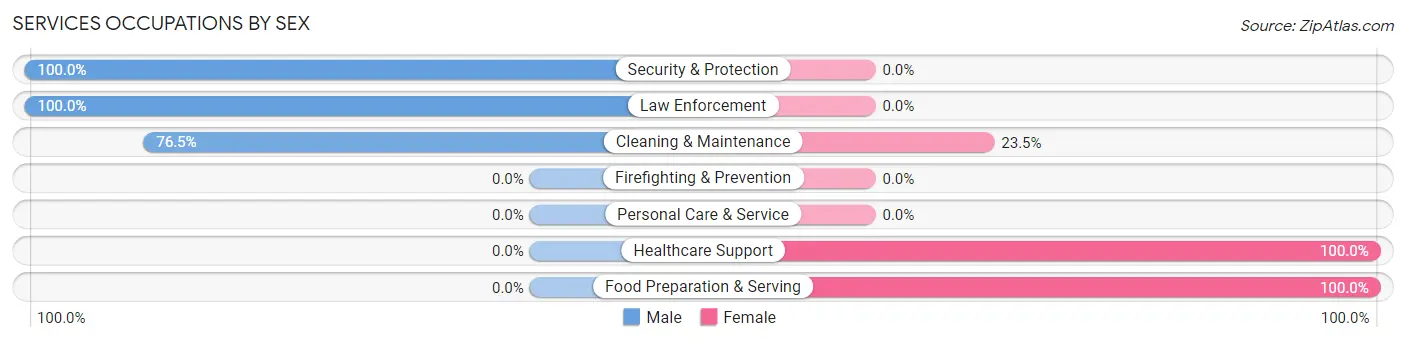
Services Occupations by Sex
Within the Services occupations in Linden, the most male-oriented occupations are Security & Protection (100.0%), Law Enforcement (100.0%), and Cleaning & Maintenance (76.5%), while the most female-oriented occupations are Healthcare Support (100.0%), Food Preparation & Serving (100.0%), and Cleaning & Maintenance (23.5%).
| Occupation | Male | Female |
| Healthcare Support | 0 (0.0%) | 7 (100.0%) |
| Security & Protection | 3 (100.0%) | 0 (0.0%) |
| Firefighting & Prevention | 0 (0.0%) | 0 (0.0%) |
| Law Enforcement | 3 (100.0%) | 0 (0.0%) |
| Food Preparation & Serving | 0 (0.0%) | 6 (100.0%) |
| Cleaning & Maintenance | 13 (76.5%) | 4 (23.5%) |
| Personal Care & Service | 0 (0.0%) | 0 (0.0%) |
| Total (Category) | 16 (48.5%) | 17 (51.5%) |
| Total (Overall) | 158 (36.2%) | 278 (63.8%) |
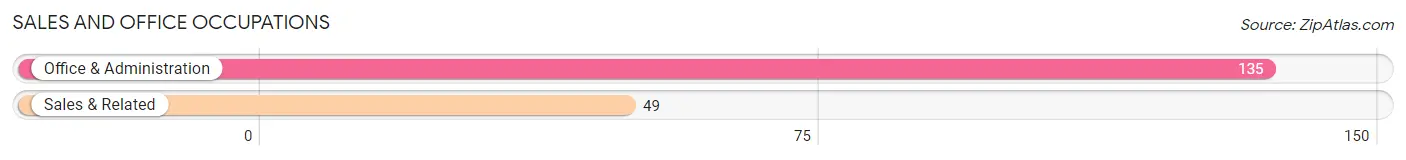
Sales and Office Occupations
The most common Sales and Office occupations in Linden are Office & Administration (135 | 31.0%), and Sales & Related (49 | 11.2%).
Sales and Office Occupations by Sex
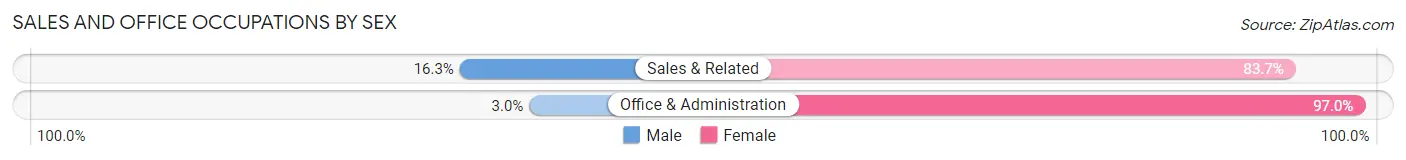
| Occupation | Male | Female |
| Sales & Related | 8 (16.3%) | 41 (83.7%) |
| Office & Administration | 4 (3.0%) | 131 (97.0%) |
| Total (Category) | 12 (6.5%) | 172 (93.5%) |
| Total (Overall) | 158 (36.2%) | 278 (63.8%) |
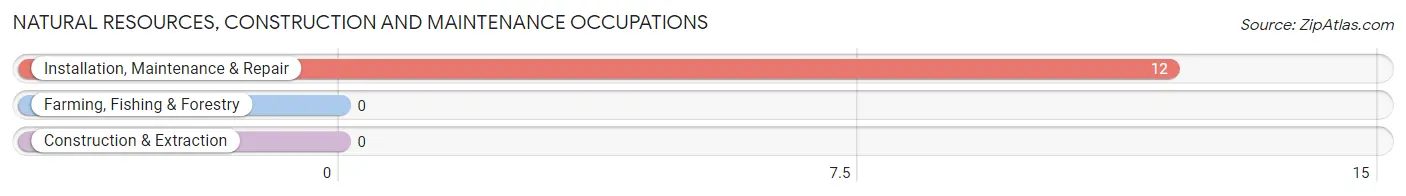
Natural Resources, Construction and Maintenance Occupations
The most common Natural Resources, Construction and Maintenance occupations in Linden are , and Installation, Maintenance & Repair (12 | 2.8%).
Natural Resources, Construction and Maintenance Occupations by Sex
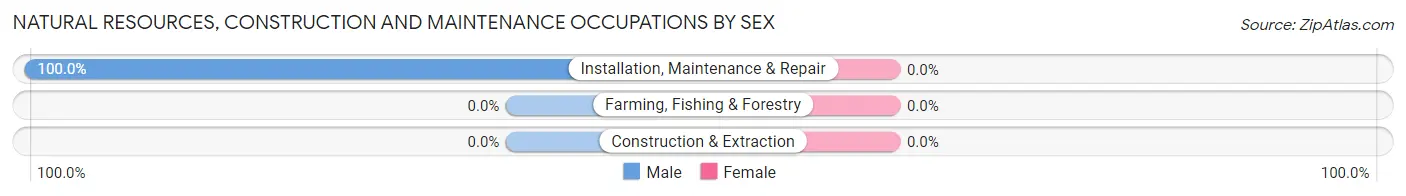
| Occupation | Male | Female |
| Farming, Fishing & Forestry | 0 (0.0%) | 0 (0.0%) |
| Construction & Extraction | 0 (0.0%) | 0 (0.0%) |
| Installation, Maintenance & Repair | 12 (100.0%) | 0 (0.0%) |
| Total (Category) | 12 (100.0%) | 0 (0.0%) |
| Total (Overall) | 158 (36.2%) | 278 (63.8%) |
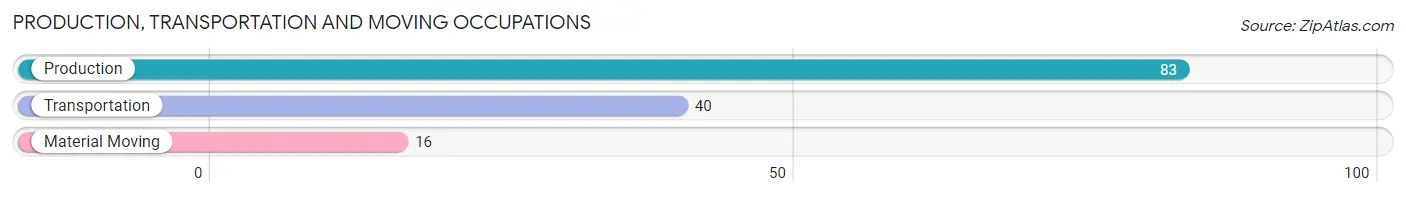
Production, Transportation and Moving Occupations
The most common Production, Transportation and Moving occupations in Linden are Production (83 | 19.0%), Transportation (40 | 9.2%), and Material Moving (16 | 3.7%).
Production, Transportation and Moving Occupations by Sex
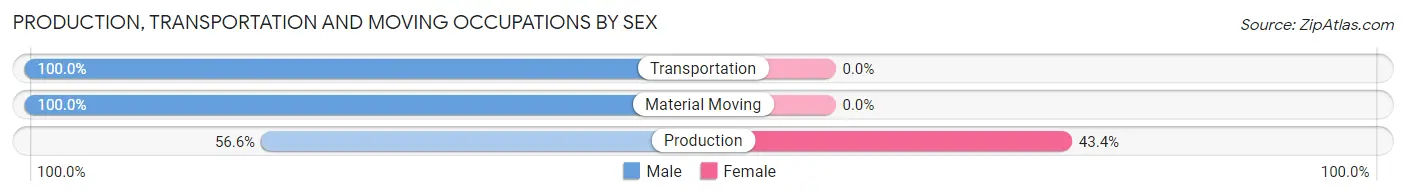
| Occupation | Male | Female |
| Production | 47 (56.6%) | 36 (43.4%) |
| Transportation | 40 (100.0%) | 0 (0.0%) |
| Material Moving | 16 (100.0%) | 0 (0.0%) |
| Total (Category) | 103 (74.1%) | 36 (25.9%) |
| Total (Overall) | 158 (36.2%) | 278 (63.8%) |
Employment Industries by Sex in Linden
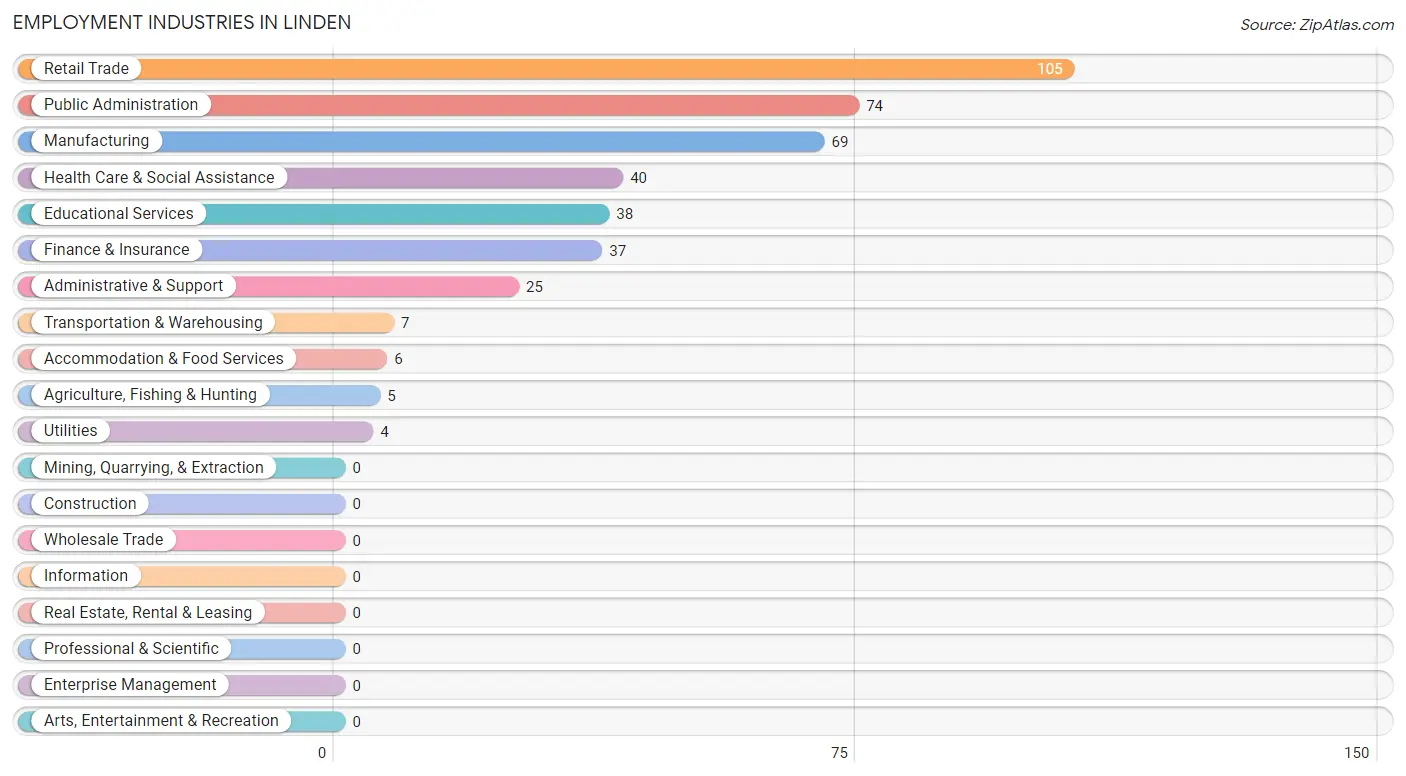
Employment Industries in Linden
The major employment industries in Linden include Retail Trade (105 | 24.1%), Public Administration (74 | 17.0%), Manufacturing (69 | 15.8%), Health Care & Social Assistance (40 | 9.2%), and Educational Services (38 | 8.7%).
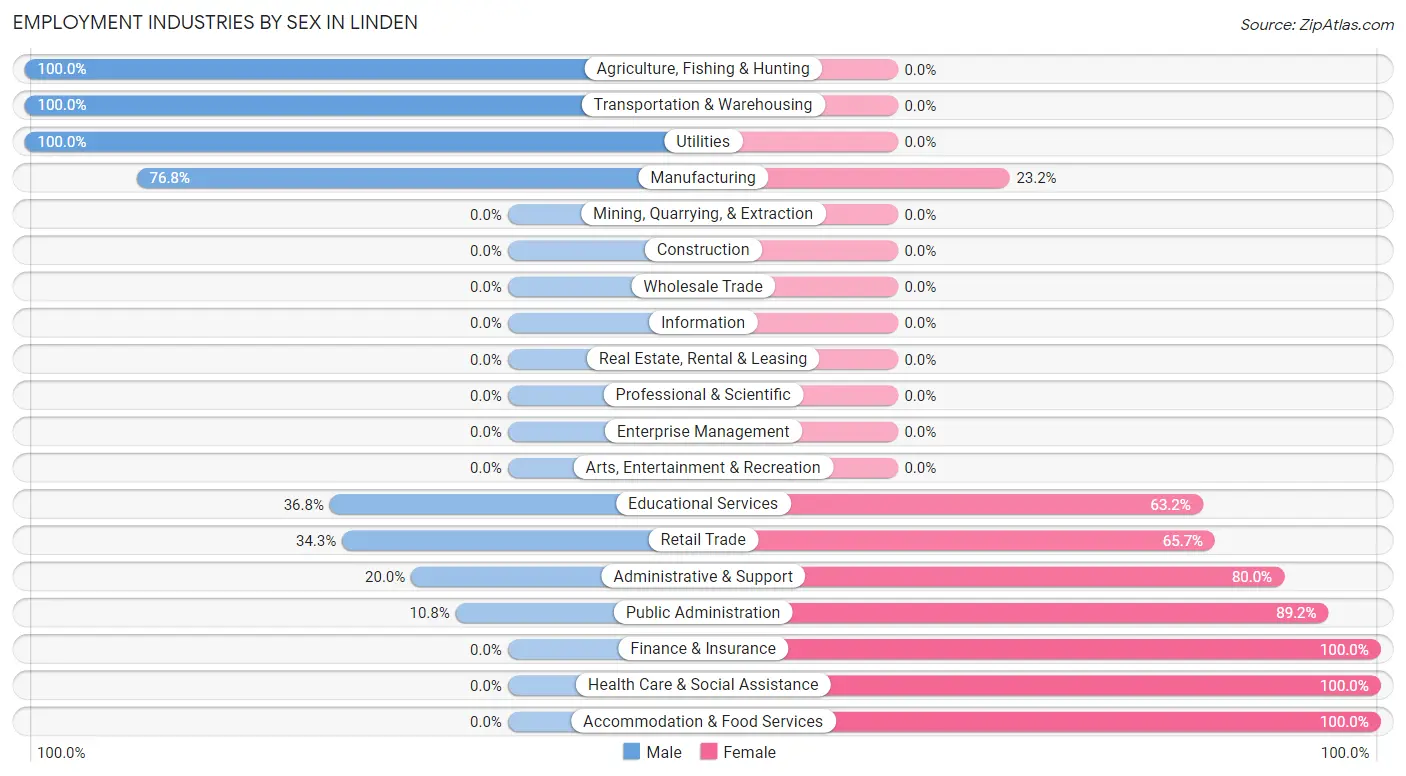
Employment Industries by Sex in Linden
The Linden industries that see more men than women are Agriculture, Fishing & Hunting (100.0%), Transportation & Warehousing (100.0%), and Utilities (100.0%), whereas the industries that tend to have a higher number of women are Finance & Insurance (100.0%), Health Care & Social Assistance (100.0%), and Accommodation & Food Services (100.0%).
| Industry | Male | Female |
| Agriculture, Fishing & Hunting | 5 (100.0%) | 0 (0.0%) |
| Mining, Quarrying, & Extraction | 0 (0.0%) | 0 (0.0%) |
| Construction | 0 (0.0%) | 0 (0.0%) |
| Manufacturing | 53 (76.8%) | 16 (23.2%) |
| Wholesale Trade | 0 (0.0%) | 0 (0.0%) |
| Retail Trade | 36 (34.3%) | 69 (65.7%) |
| Transportation & Warehousing | 7 (100.0%) | 0 (0.0%) |
| Utilities | 4 (100.0%) | 0 (0.0%) |
| Information | 0 (0.0%) | 0 (0.0%) |
| Finance & Insurance | 0 (0.0%) | 37 (100.0%) |
| Real Estate, Rental & Leasing | 0 (0.0%) | 0 (0.0%) |
| Professional & Scientific | 0 (0.0%) | 0 (0.0%) |
| Enterprise Management | 0 (0.0%) | 0 (0.0%) |
| Administrative & Support | 5 (20.0%) | 20 (80.0%) |
| Educational Services | 14 (36.8%) | 24 (63.2%) |
| Health Care & Social Assistance | 0 (0.0%) | 40 (100.0%) |
| Arts, Entertainment & Recreation | 0 (0.0%) | 0 (0.0%) |
| Accommodation & Food Services | 0 (0.0%) | 6 (100.0%) |
| Public Administration | 8 (10.8%) | 66 (89.2%) |
| Total | 158 (36.2%) | 278 (63.8%) |
Education in Linden
School Enrollment in Linden
The most common levels of schooling among the 353 students in Linden are kindergarten (86 | 24.4%), college / undergraduate (76 | 21.5%), and middle school (70 | 19.8%).
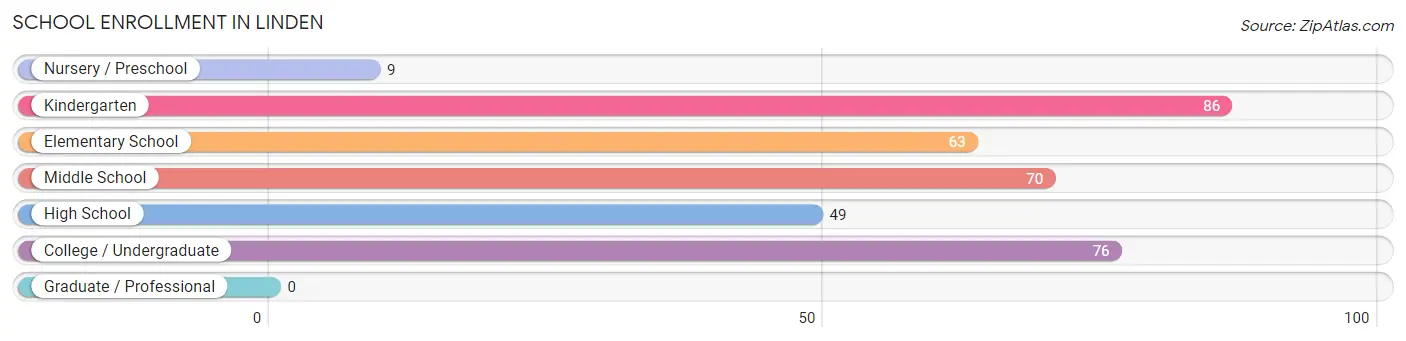
| School Level | # Students | % Students |
| Nursery / Preschool | 9 | 2.5% |
| Kindergarten | 86 | 24.4% |
| Elementary School | 63 | 17.8% |
| Middle School | 70 | 19.8% |
| High School | 49 | 13.9% |
| College / Undergraduate | 76 | 21.5% |
| Graduate / Professional | 0 | 0.0% |
| Total | 353 | 100.0% |
School Enrollment by Age by Funding Source in Linden
Out of a total of 353 students who are enrolled in schools in Linden, 66 (18.7%) attend a private institution, while the remaining 287 (81.3%) are enrolled in public schools. The age group of 3 to 4 year olds has the highest likelihood of being enrolled in private schools, with 23 (100.0% in the age bracket) enrolled. Conversely, the age group of 15 to 17 year olds has the lowest likelihood of being enrolled in a private school, with 38 (100.0% in the age bracket) attending a public institution.
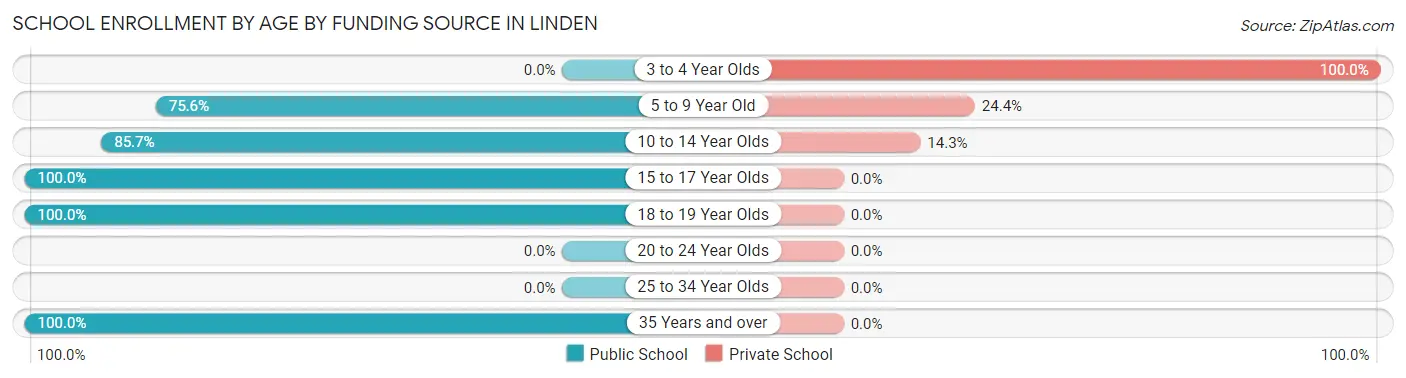
| Age Bracket | Public School | Private School |
| 3 to 4 Year Olds | 0 (0.0%) | 23 (100.0%) |
| 5 to 9 Year Old | 102 (75.6%) | 33 (24.4%) |
| 10 to 14 Year Olds | 60 (85.7%) | 10 (14.3%) |
| 15 to 17 Year Olds | 38 (100.0%) | 0 (0.0%) |
| 18 to 19 Year Olds | 83 (100.0%) | 0 (0.0%) |
| 20 to 24 Year Olds | 0 (0.0%) | 0 (0.0%) |
| 25 to 34 Year Olds | 0 (0.0%) | 0 (0.0%) |
| 35 Years and over | 4 (100.0%) | 0 (0.0%) |
| Total | 287 (81.3%) | 66 (18.7%) |
Educational Attainment by Field of Study in Linden
Science & technology (24 | 28.9%), computers & mathematics (23 | 27.7%), education (20 | 24.1%), business (6 | 7.2%), and liberal arts & history (4 | 4.8%) are the most common fields of study among 83 individuals in Linden who have obtained a bachelor's degree or higher.
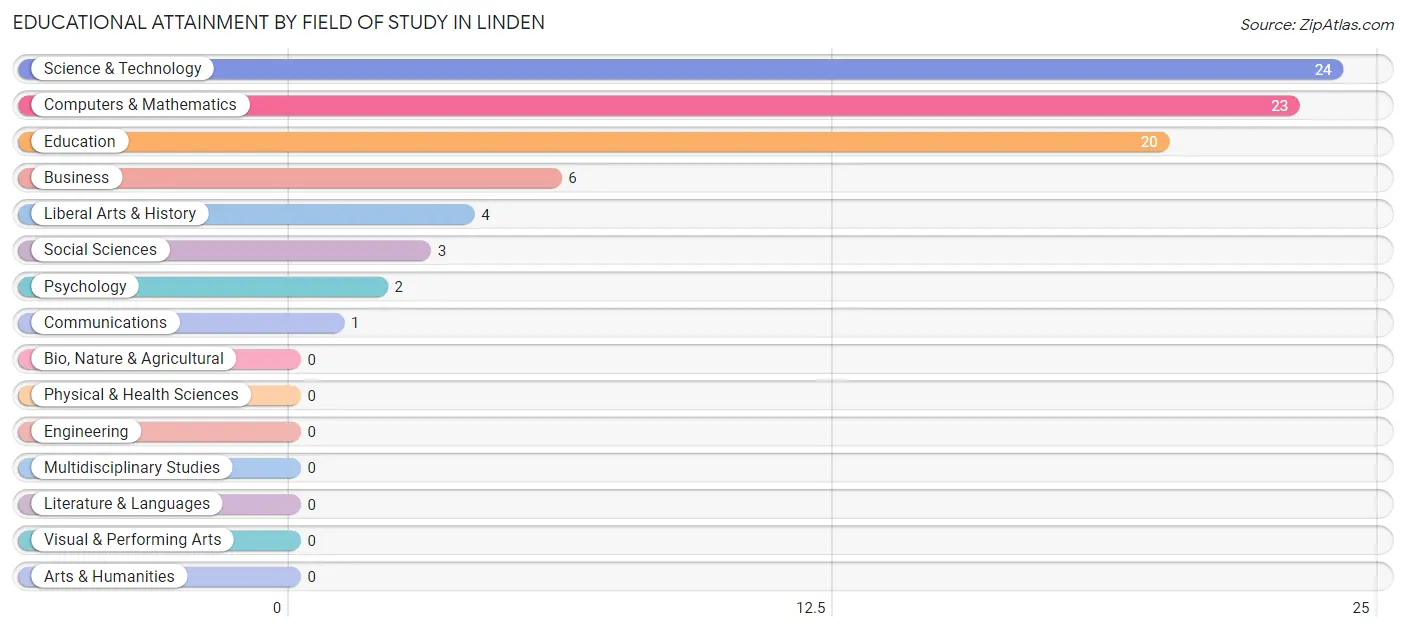
| Field of Study | # Graduates | % Graduates |
| Computers & Mathematics | 23 | 27.7% |
| Bio, Nature & Agricultural | 0 | 0.0% |
| Physical & Health Sciences | 0 | 0.0% |
| Psychology | 2 | 2.4% |
| Social Sciences | 3 | 3.6% |
| Engineering | 0 | 0.0% |
| Multidisciplinary Studies | 0 | 0.0% |
| Science & Technology | 24 | 28.9% |
| Business | 6 | 7.2% |
| Education | 20 | 24.1% |
| Literature & Languages | 0 | 0.0% |
| Liberal Arts & History | 4 | 4.8% |
| Visual & Performing Arts | 0 | 0.0% |
| Communications | 1 | 1.2% |
| Arts & Humanities | 0 | 0.0% |
| Total | 83 | 100.0% |
Transportation & Commute in Linden
Vehicle Availability by Sex in Linden
The most prevalent vehicle ownership categories in Linden are males with 3 vehicles (107, accounting for 67.7%) and females with 3 vehicles (143, making up 40.2%).
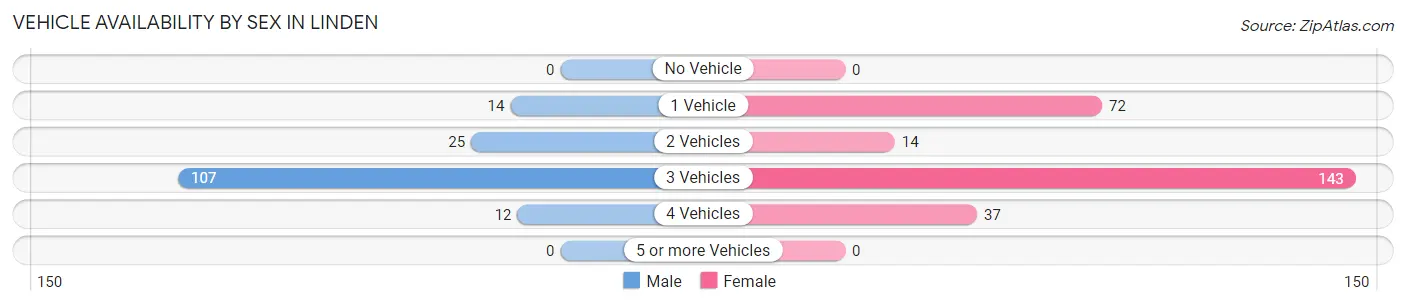
| Vehicles Available | Male | Female |
| No Vehicle | 0 (0.0%) | 0 (0.0%) |
| 1 Vehicle | 14 (8.9%) | 72 (27.1%) |
| 2 Vehicles | 25 (15.8%) | 14 (5.3%) |
| 3 Vehicles | 107 (67.7%) | 143 (53.8%) |
| 4 Vehicles | 12 (7.6%) | 37 (13.9%) |
| 5 or more Vehicles | 0 (0.0%) | 0 (0.0%) |
| Total | 158 (100.0%) | 266 (100.0%) |
Commute Time in Linden
The most frequently occuring commute durations in Linden are 5 to 9 minutes (111 commuters, 26.2%), less than 5 minutes (99 commuters, 23.4%), and 45 to 59 minutes (75 commuters, 17.7%).
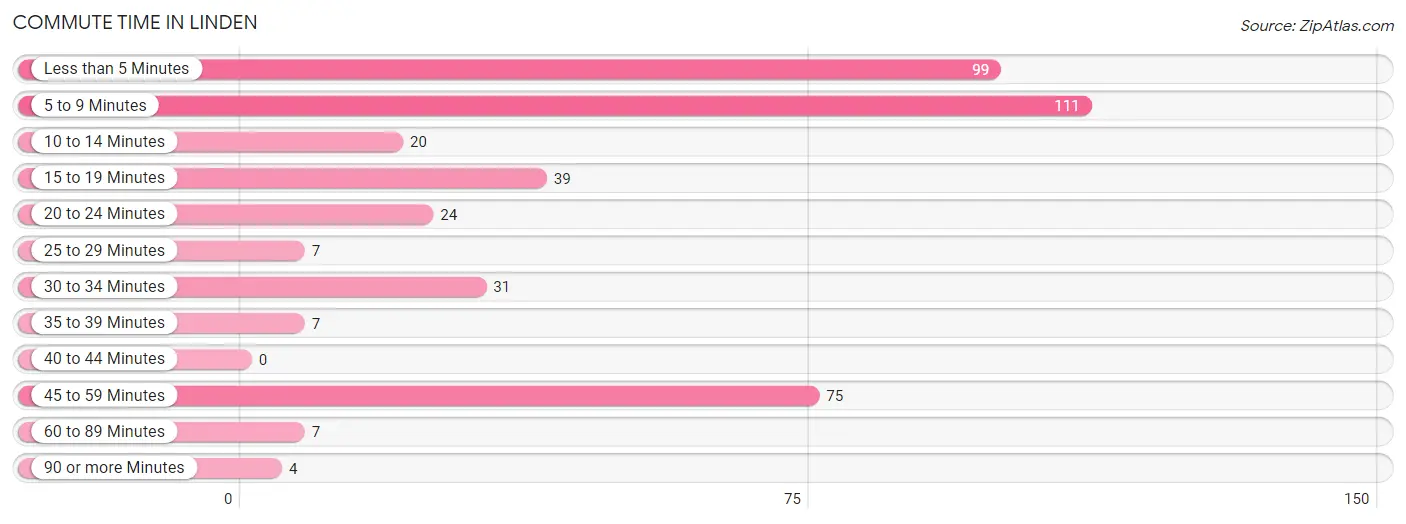
| Commute Time | # Commuters | % Commuters |
| Less than 5 Minutes | 99 | 23.4% |
| 5 to 9 Minutes | 111 | 26.2% |
| 10 to 14 Minutes | 20 | 4.7% |
| 15 to 19 Minutes | 39 | 9.2% |
| 20 to 24 Minutes | 24 | 5.7% |
| 25 to 29 Minutes | 7 | 1.7% |
| 30 to 34 Minutes | 31 | 7.3% |
| 35 to 39 Minutes | 7 | 1.7% |
| 40 to 44 Minutes | 0 | 0.0% |
| 45 to 59 Minutes | 75 | 17.7% |
| 60 to 89 Minutes | 7 | 1.7% |
| 90 or more Minutes | 4 | 0.9% |
Commute Time by Sex in Linden
The most common commute times in Linden are less than 5 minutes (53 commuters, 33.5%) for males and 5 to 9 minutes (92 commuters, 34.6%) for females.
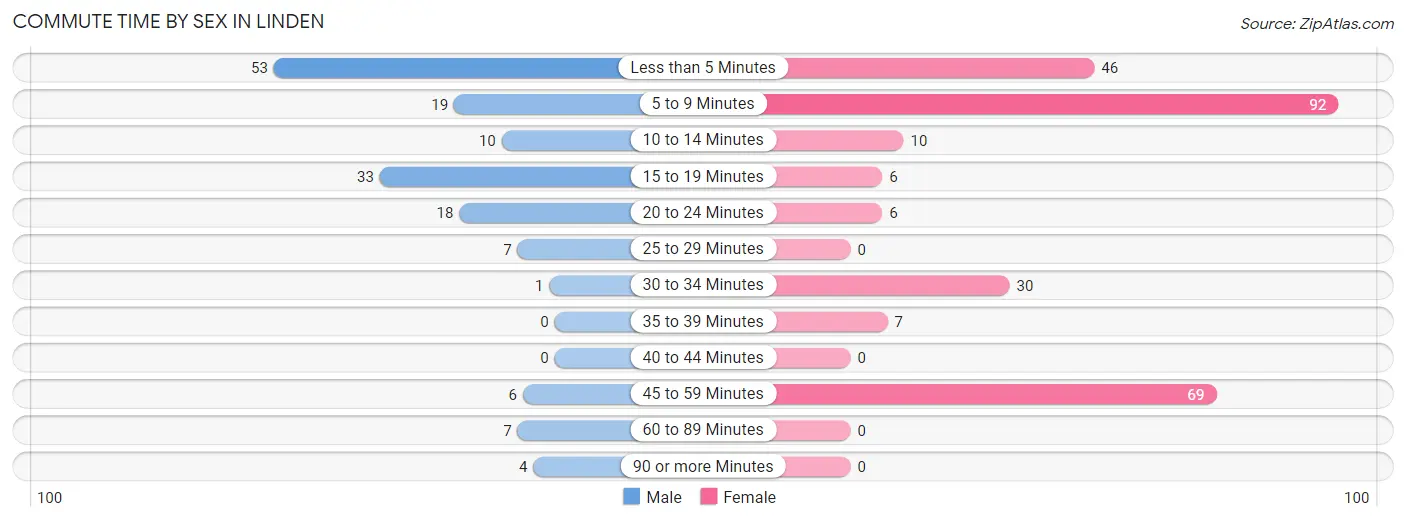
| Commute Time | Male | Female |
| Less than 5 Minutes | 53 (33.5%) | 46 (17.3%) |
| 5 to 9 Minutes | 19 (12.0%) | 92 (34.6%) |
| 10 to 14 Minutes | 10 (6.3%) | 10 (3.8%) |
| 15 to 19 Minutes | 33 (20.9%) | 6 (2.3%) |
| 20 to 24 Minutes | 18 (11.4%) | 6 (2.3%) |
| 25 to 29 Minutes | 7 (4.4%) | 0 (0.0%) |
| 30 to 34 Minutes | 1 (0.6%) | 30 (11.3%) |
| 35 to 39 Minutes | 0 (0.0%) | 7 (2.6%) |
| 40 to 44 Minutes | 0 (0.0%) | 0 (0.0%) |
| 45 to 59 Minutes | 6 (3.8%) | 69 (25.9%) |
| 60 to 89 Minutes | 7 (4.4%) | 0 (0.0%) |
| 90 or more Minutes | 4 (2.5%) | 0 (0.0%) |
Time of Departure to Work by Sex in Linden
The most frequent times of departure to work in Linden are 11:00 AM to 11:59 AM (35, 22.2%) for males and 6:30 AM to 6:59 AM (75, 28.2%) for females.
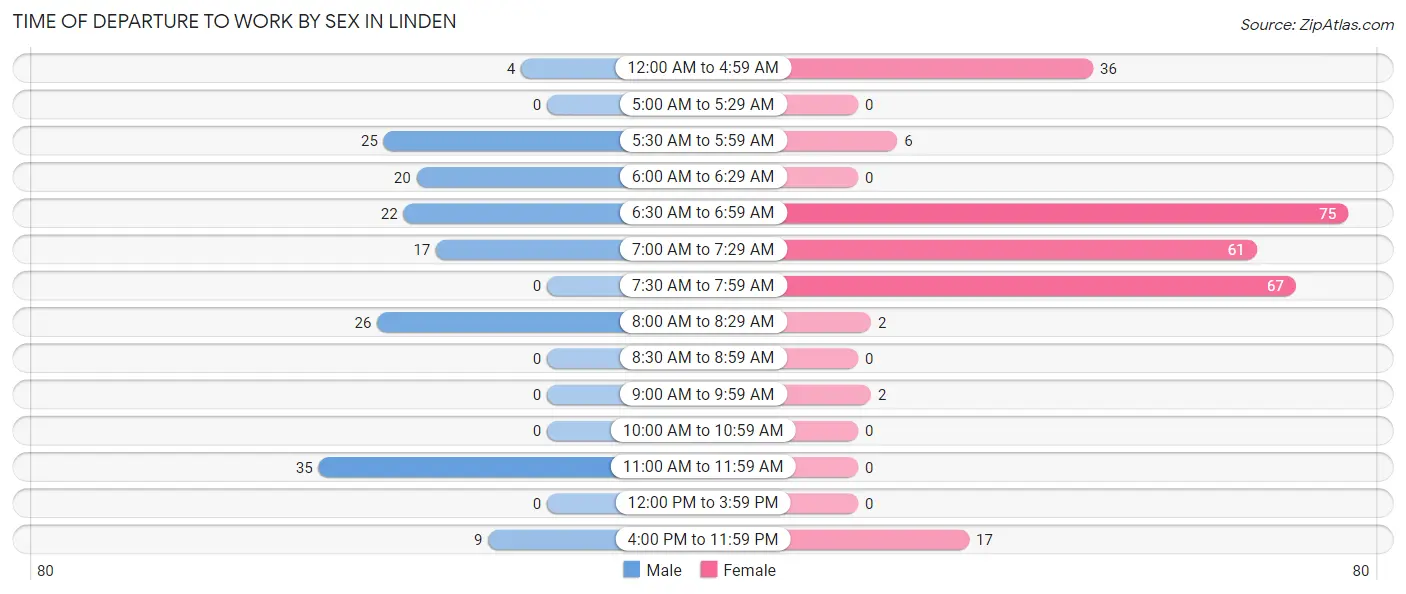
| Time of Departure | Male | Female |
| 12:00 AM to 4:59 AM | 4 (2.5%) | 36 (13.5%) |
| 5:00 AM to 5:29 AM | 0 (0.0%) | 0 (0.0%) |
| 5:30 AM to 5:59 AM | 25 (15.8%) | 6 (2.3%) |
| 6:00 AM to 6:29 AM | 20 (12.7%) | 0 (0.0%) |
| 6:30 AM to 6:59 AM | 22 (13.9%) | 75 (28.2%) |
| 7:00 AM to 7:29 AM | 17 (10.8%) | 61 (22.9%) |
| 7:30 AM to 7:59 AM | 0 (0.0%) | 67 (25.2%) |
| 8:00 AM to 8:29 AM | 26 (16.5%) | 2 (0.7%) |
| 8:30 AM to 8:59 AM | 0 (0.0%) | 0 (0.0%) |
| 9:00 AM to 9:59 AM | 0 (0.0%) | 2 (0.7%) |
| 10:00 AM to 10:59 AM | 0 (0.0%) | 0 (0.0%) |
| 11:00 AM to 11:59 AM | 35 (22.2%) | 0 (0.0%) |
| 12:00 PM to 3:59 PM | 0 (0.0%) | 0 (0.0%) |
| 4:00 PM to 11:59 PM | 9 (5.7%) | 17 (6.4%) |
| Total | 158 (100.0%) | 266 (100.0%) |
Housing Occupancy in Linden
Occupancy by Ownership in Linden
Of the total 439 dwellings in Linden, owner-occupied units account for 273 (62.2%), while renter-occupied units make up 166 (37.8%).
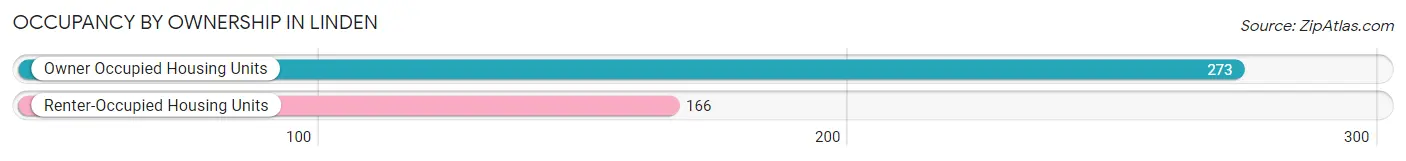
| Occupancy | # Housing Units | % Housing Units |
| Owner Occupied Housing Units | 273 | 62.2% |
| Renter-Occupied Housing Units | 166 | 37.8% |
| Total Occupied Housing Units | 439 | 100.0% |
Occupancy by Household Size in Linden
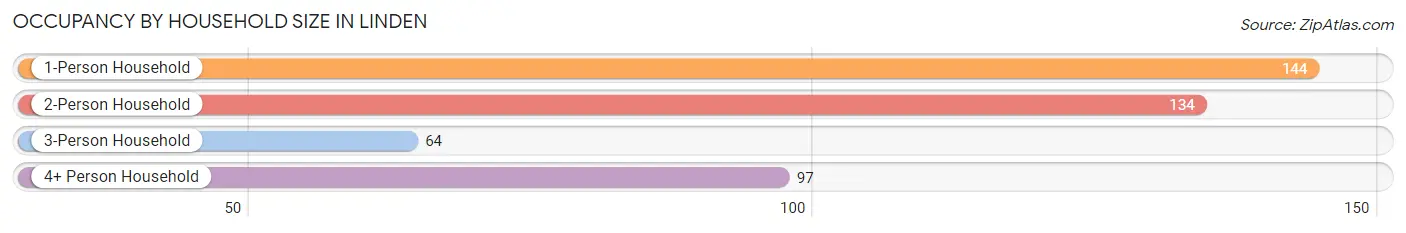
| Household Size | # Housing Units | % Housing Units |
| 1-Person Household | 144 | 32.8% |
| 2-Person Household | 134 | 30.5% |
| 3-Person Household | 64 | 14.6% |
| 4+ Person Household | 97 | 22.1% |
| Total Housing Units | 439 | 100.0% |
Occupancy by Ownership by Household Size in Linden
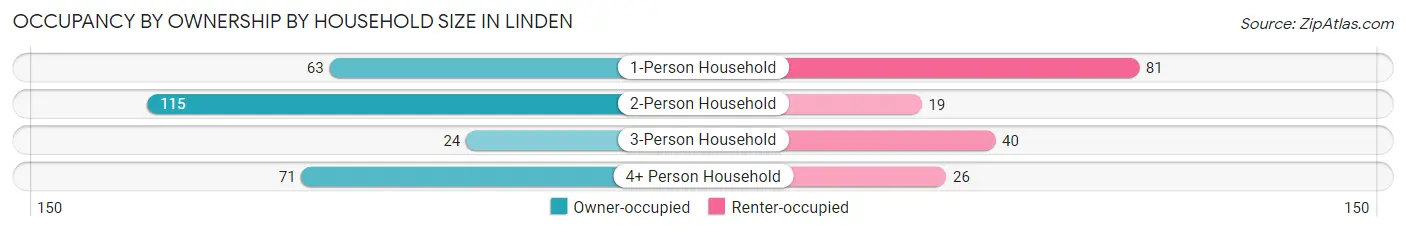
| Household Size | Owner-occupied | Renter-occupied |
| 1-Person Household | 63 (43.8%) | 81 (56.2%) |
| 2-Person Household | 115 (85.8%) | 19 (14.2%) |
| 3-Person Household | 24 (37.5%) | 40 (62.5%) |
| 4+ Person Household | 71 (73.2%) | 26 (26.8%) |
| Total Housing Units | 273 (62.2%) | 166 (37.8%) |
Occupancy by Educational Attainment in Linden
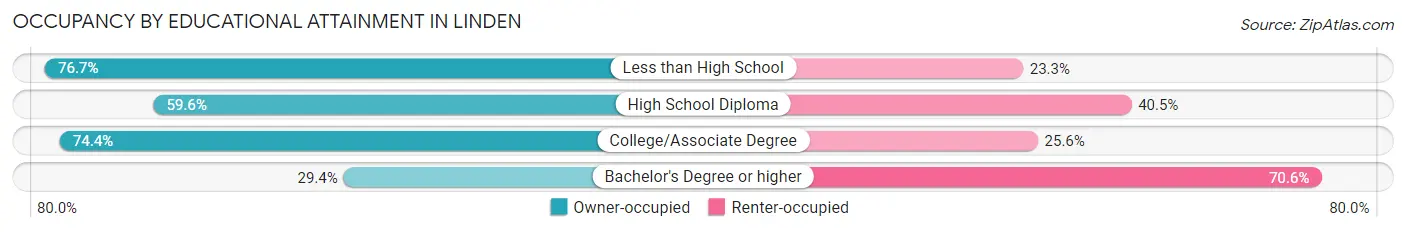
| Household Size | Owner-occupied | Renter-occupied |
| Less than High School | 66 (76.7%) | 20 (23.3%) |
| High School Diploma | 131 (59.6%) | 89 (40.5%) |
| College/Associate Degree | 61 (74.4%) | 21 (25.6%) |
| Bachelor's Degree or higher | 15 (29.4%) | 36 (70.6%) |
Occupancy by Age of Householder in Linden
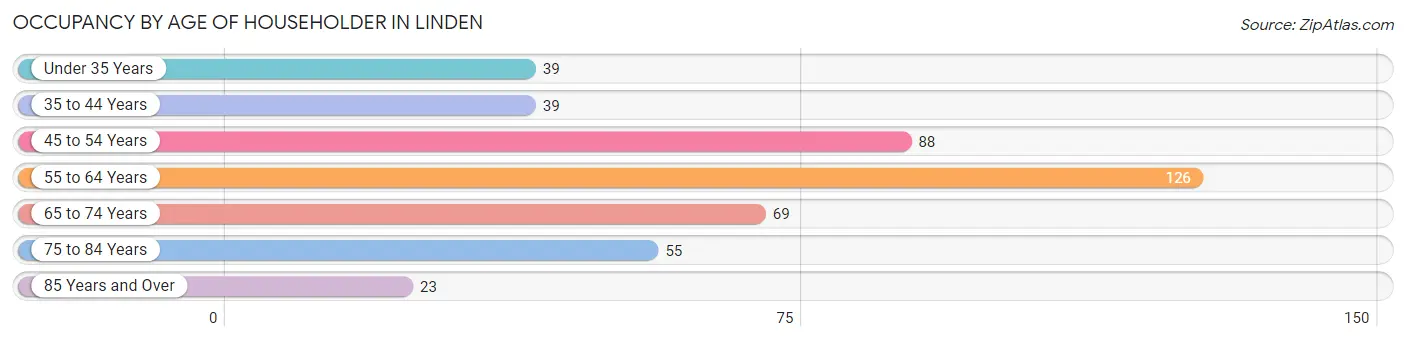
| Age Bracket | # Households | % Households |
| Under 35 Years | 39 | 8.9% |
| 35 to 44 Years | 39 | 8.9% |
| 45 to 54 Years | 88 | 20.1% |
| 55 to 64 Years | 126 | 28.7% |
| 65 to 74 Years | 69 | 15.7% |
| 75 to 84 Years | 55 | 12.5% |
| 85 Years and Over | 23 | 5.2% |
| Total | 439 | 100.0% |
Housing Finances in Linden
Median Income by Occupancy in Linden
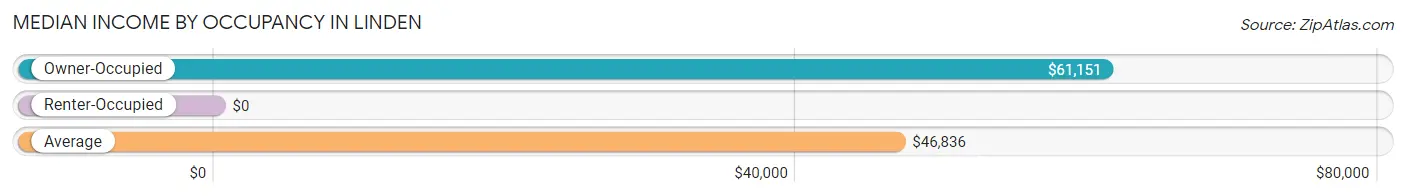
| Occupancy Type | # Households | Median Income |
| Owner-Occupied | 273 (62.2%) | $61,151 |
| Renter-Occupied | 166 (37.8%) | $0 |
| Average | 439 (100.0%) | $46,836 |
Occupancy by Householder Income Bracket in Linden
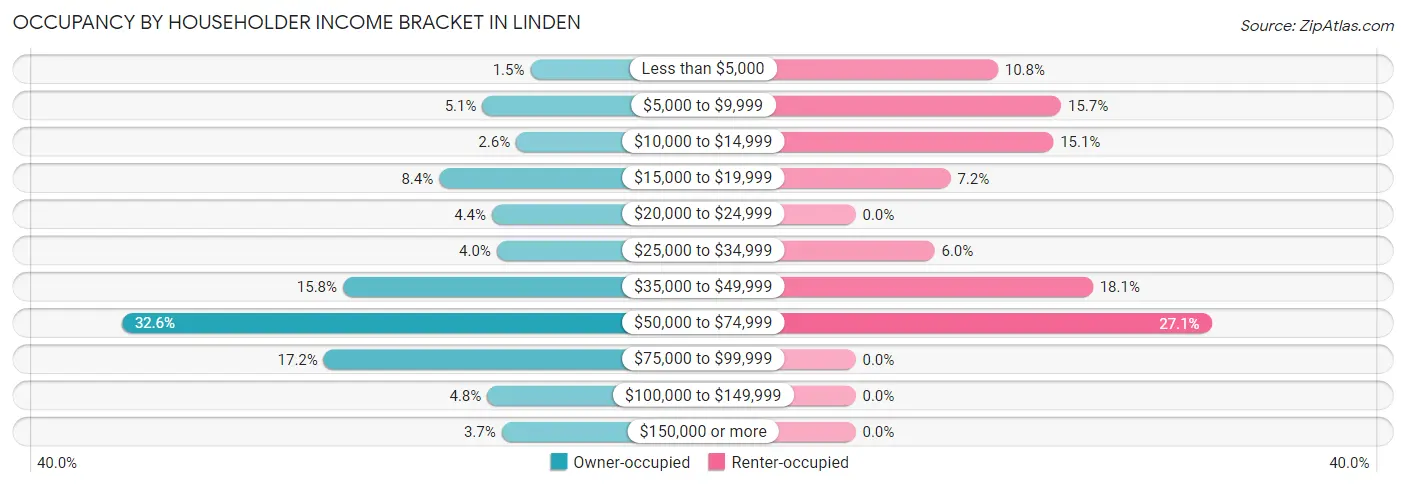
| Income Bracket | Owner-occupied | Renter-occupied |
| Less than $5,000 | 4 (1.5%) | 18 (10.8%) |
| $5,000 to $9,999 | 14 (5.1%) | 26 (15.7%) |
| $10,000 to $14,999 | 7 (2.6%) | 25 (15.1%) |
| $15,000 to $19,999 | 23 (8.4%) | 12 (7.2%) |
| $20,000 to $24,999 | 12 (4.4%) | 0 (0.0%) |
| $25,000 to $34,999 | 11 (4.0%) | 10 (6.0%) |
| $35,000 to $49,999 | 43 (15.8%) | 30 (18.1%) |
| $50,000 to $74,999 | 89 (32.6%) | 45 (27.1%) |
| $75,000 to $99,999 | 47 (17.2%) | 0 (0.0%) |
| $100,000 to $149,999 | 13 (4.8%) | 0 (0.0%) |
| $150,000 or more | 10 (3.7%) | 0 (0.0%) |
| Total | 273 (100.0%) | 166 (100.0%) |
Monthly Housing Cost Tiers in Linden
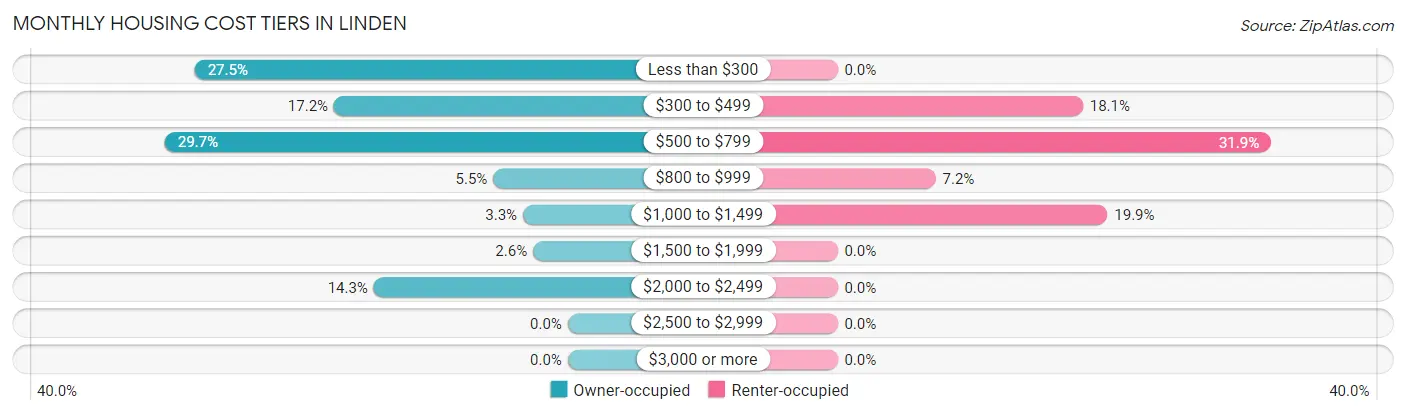
| Monthly Cost | Owner-occupied | Renter-occupied |
| Less than $300 | 75 (27.5%) | 0 (0.0%) |
| $300 to $499 | 47 (17.2%) | 30 (18.1%) |
| $500 to $799 | 81 (29.7%) | 53 (31.9%) |
| $800 to $999 | 15 (5.5%) | 12 (7.2%) |
| $1,000 to $1,499 | 9 (3.3%) | 33 (19.9%) |
| $1,500 to $1,999 | 7 (2.6%) | 0 (0.0%) |
| $2,000 to $2,499 | 39 (14.3%) | 0 (0.0%) |
| $2,500 to $2,999 | 0 (0.0%) | 0 (0.0%) |
| $3,000 or more | 0 (0.0%) | 0 (0.0%) |
| Total | 273 (100.0%) | 166 (100.0%) |
Physical Housing Characteristics in Linden
Housing Structures in Linden
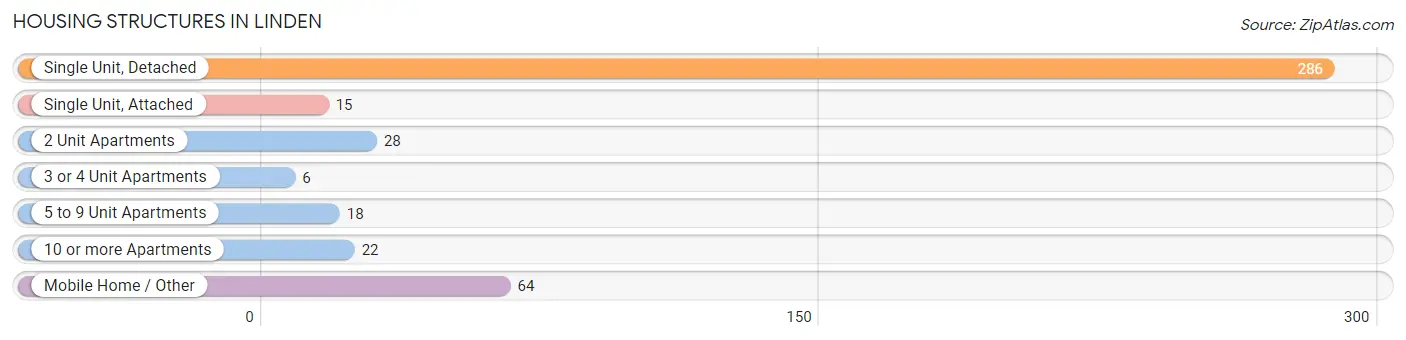
| Structure Type | # Housing Units | % Housing Units |
| Single Unit, Detached | 286 | 65.1% |
| Single Unit, Attached | 15 | 3.4% |
| 2 Unit Apartments | 28 | 6.4% |
| 3 or 4 Unit Apartments | 6 | 1.4% |
| 5 to 9 Unit Apartments | 18 | 4.1% |
| 10 or more Apartments | 22 | 5.0% |
| Mobile Home / Other | 64 | 14.6% |
| Total | 439 | 100.0% |
Housing Structures by Occupancy in Linden
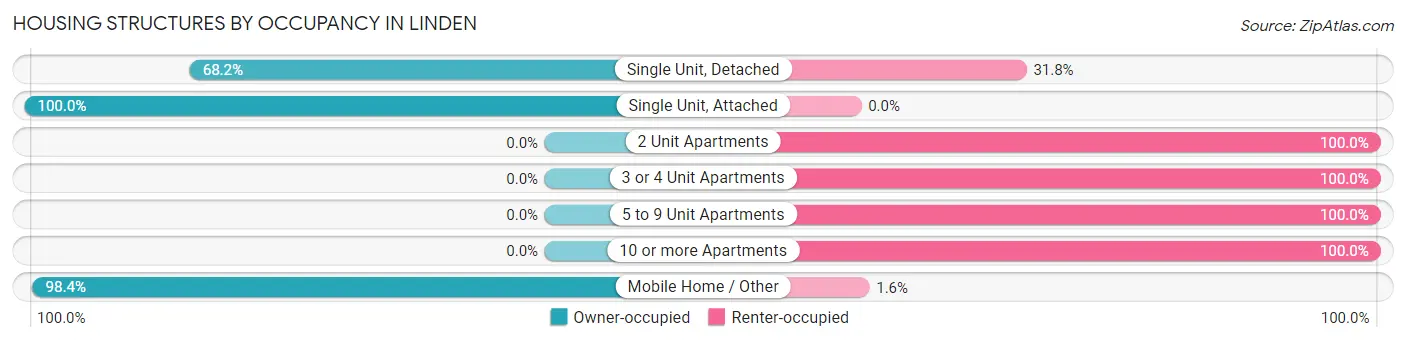
| Structure Type | Owner-occupied | Renter-occupied |
| Single Unit, Detached | 195 (68.2%) | 91 (31.8%) |
| Single Unit, Attached | 15 (100.0%) | 0 (0.0%) |
| 2 Unit Apartments | 0 (0.0%) | 28 (100.0%) |
| 3 or 4 Unit Apartments | 0 (0.0%) | 6 (100.0%) |
| 5 to 9 Unit Apartments | 0 (0.0%) | 18 (100.0%) |
| 10 or more Apartments | 0 (0.0%) | 22 (100.0%) |
| Mobile Home / Other | 63 (98.4%) | 1 (1.6%) |
| Total | 273 (62.2%) | 166 (37.8%) |
Housing Structures by Number of Rooms in Linden
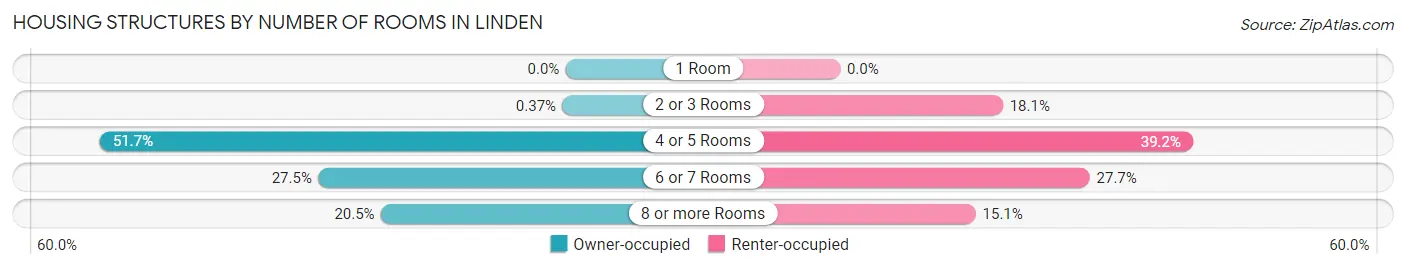
| Number of Rooms | Owner-occupied | Renter-occupied |
| 1 Room | 0 (0.0%) | 0 (0.0%) |
| 2 or 3 Rooms | 1 (0.4%) | 30 (18.1%) |
| 4 or 5 Rooms | 141 (51.6%) | 65 (39.2%) |
| 6 or 7 Rooms | 75 (27.5%) | 46 (27.7%) |
| 8 or more Rooms | 56 (20.5%) | 25 (15.1%) |
| Total | 273 (100.0%) | 166 (100.0%) |
Housing Structure by Heating Type in Linden
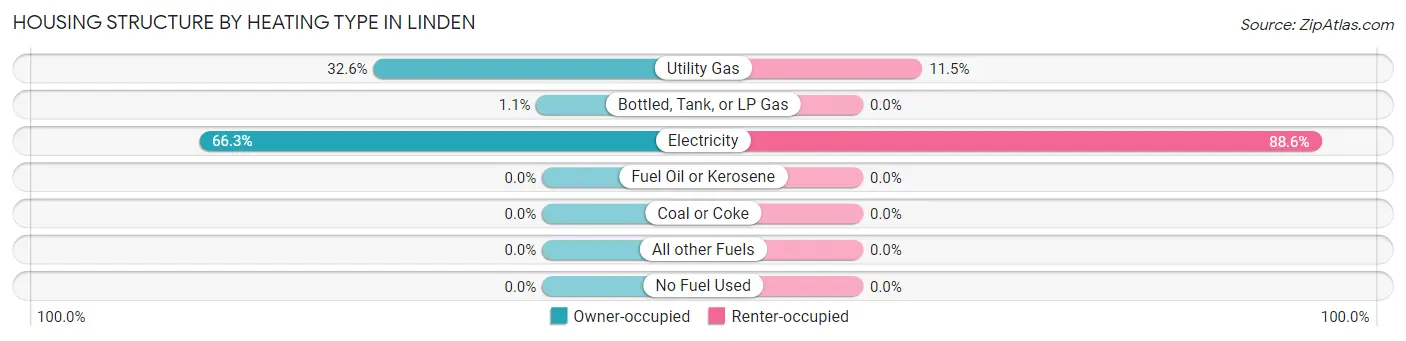
| Heating Type | Owner-occupied | Renter-occupied |
| Utility Gas | 89 (32.6%) | 19 (11.5%) |
| Bottled, Tank, or LP Gas | 3 (1.1%) | 0 (0.0%) |
| Electricity | 181 (66.3%) | 147 (88.5%) |
| Fuel Oil or Kerosene | 0 (0.0%) | 0 (0.0%) |
| Coal or Coke | 0 (0.0%) | 0 (0.0%) |
| All other Fuels | 0 (0.0%) | 0 (0.0%) |
| No Fuel Used | 0 (0.0%) | 0 (0.0%) |
| Total | 273 (100.0%) | 166 (100.0%) |
Household Vehicle Usage in Linden
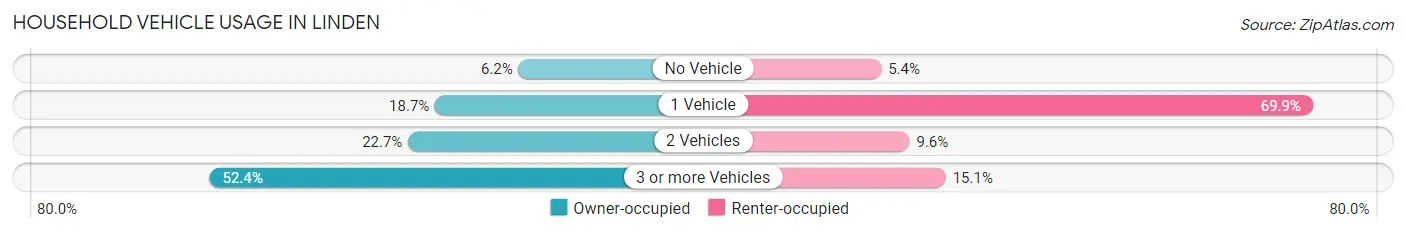
| Vehicles per Household | Owner-occupied | Renter-occupied |
| No Vehicle | 17 (6.2%) | 9 (5.4%) |
| 1 Vehicle | 51 (18.7%) | 116 (69.9%) |
| 2 Vehicles | 62 (22.7%) | 16 (9.6%) |
| 3 or more Vehicles | 143 (52.4%) | 25 (15.1%) |
| Total | 273 (100.0%) | 166 (100.0%) |
Real Estate & Mortgages in Linden
Real Estate and Mortgage Overview in Linden
| Characteristic | Without Mortgage | With Mortgage |
| Housing Units | 190 | 83 |
| Median Property Value | $67,400 | $108,900 |
| Median Household Income | $65,500 | $4 |
| Monthly Housing Costs | $363 | $0 |
| Real Estate Taxes | $397 | $4 |
Property Value by Mortgage Status in Linden
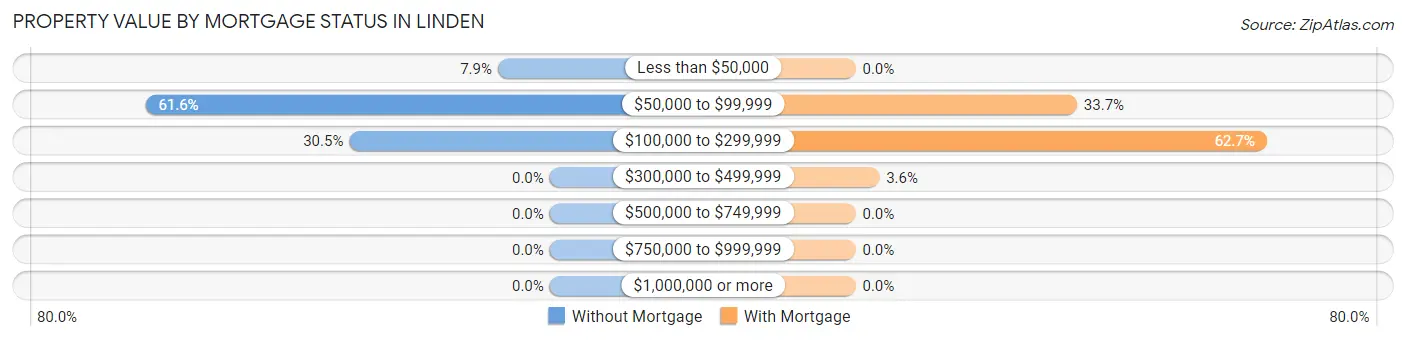
| Property Value | Without Mortgage | With Mortgage |
| Less than $50,000 | 15 (7.9%) | 0 (0.0%) |
| $50,000 to $99,999 | 117 (61.6%) | 28 (33.7%) |
| $100,000 to $299,999 | 58 (30.5%) | 52 (62.6%) |
| $300,000 to $499,999 | 0 (0.0%) | 3 (3.6%) |
| $500,000 to $749,999 | 0 (0.0%) | 0 (0.0%) |
| $750,000 to $999,999 | 0 (0.0%) | 0 (0.0%) |
| $1,000,000 or more | 0 (0.0%) | 0 (0.0%) |
| Total | 190 (100.0%) | 83 (100.0%) |
Household Income by Mortgage Status in Linden
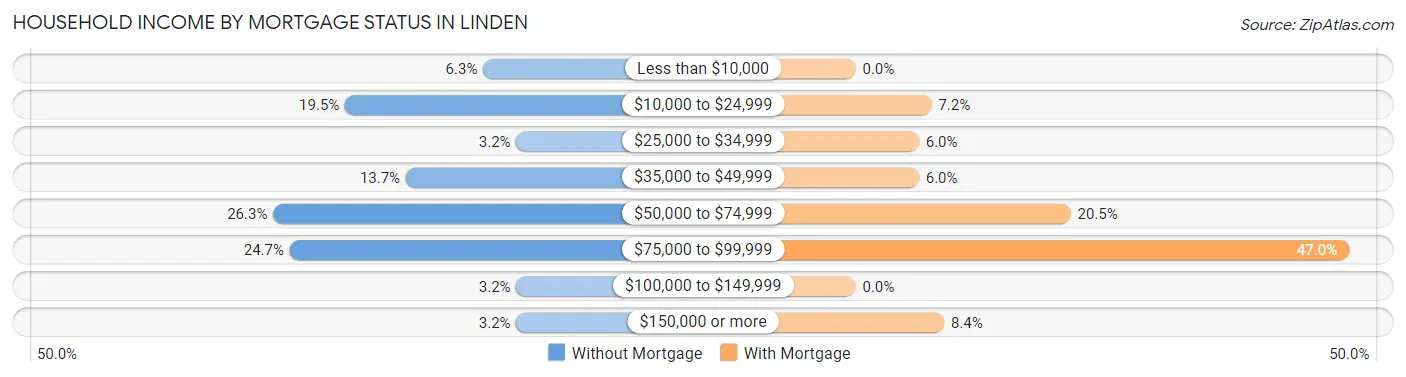
| Household Income | Without Mortgage | With Mortgage |
| Less than $10,000 | 12 (6.3%) | 0 (0.0%) |
| $10,000 to $24,999 | 37 (19.5%) | 6 (7.2%) |
| $25,000 to $34,999 | 6 (3.2%) | 5 (6.0%) |
| $35,000 to $49,999 | 26 (13.7%) | 5 (6.0%) |
| $50,000 to $74,999 | 50 (26.3%) | 17 (20.5%) |
| $75,000 to $99,999 | 47 (24.7%) | 39 (47.0%) |
| $100,000 to $149,999 | 6 (3.2%) | 0 (0.0%) |
| $150,000 or more | 6 (3.2%) | 7 (8.4%) |
| Total | 190 (100.0%) | 83 (100.0%) |
Property Value to Household Income Ratio in Linden
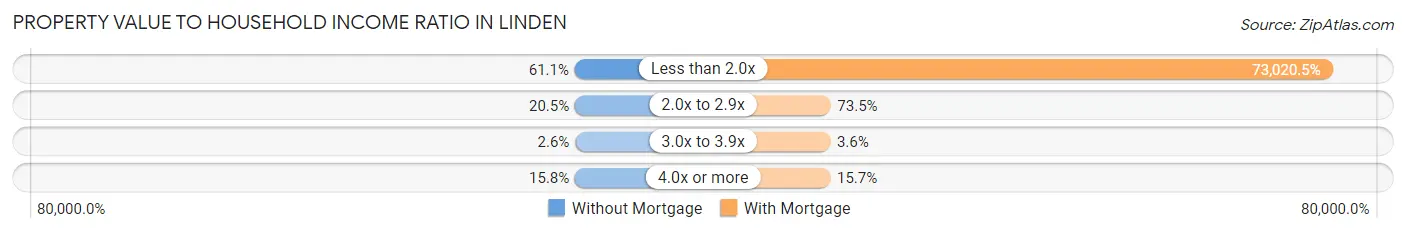
| Value-to-Income Ratio | Without Mortgage | With Mortgage |
| Less than 2.0x | 116 (61.1%) | 60,607 (73,020.5%) |
| 2.0x to 2.9x | 39 (20.5%) | 61 (73.5%) |
| 3.0x to 3.9x | 5 (2.6%) | 3 (3.6%) |
| 4.0x or more | 30 (15.8%) | 13 (15.7%) |
| Total | 190 (100.0%) | 83 (100.0%) |
Real Estate Taxes by Mortgage Status in Linden
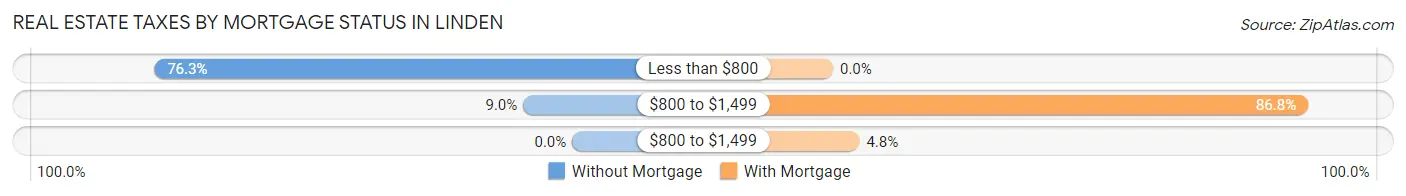
| Property Taxes | Without Mortgage | With Mortgage |
| Less than $800 | 145 (76.3%) | 0 (0.0%) |
| $800 to $1,499 | 17 (8.9%) | 72 (86.8%) |
| $800 to $1,499 | 0 (0.0%) | 4 (4.8%) |
| Total | 190 (100.0%) | 83 (100.0%) |
Health & Disability in Linden
Health Insurance Coverage by Age in Linden
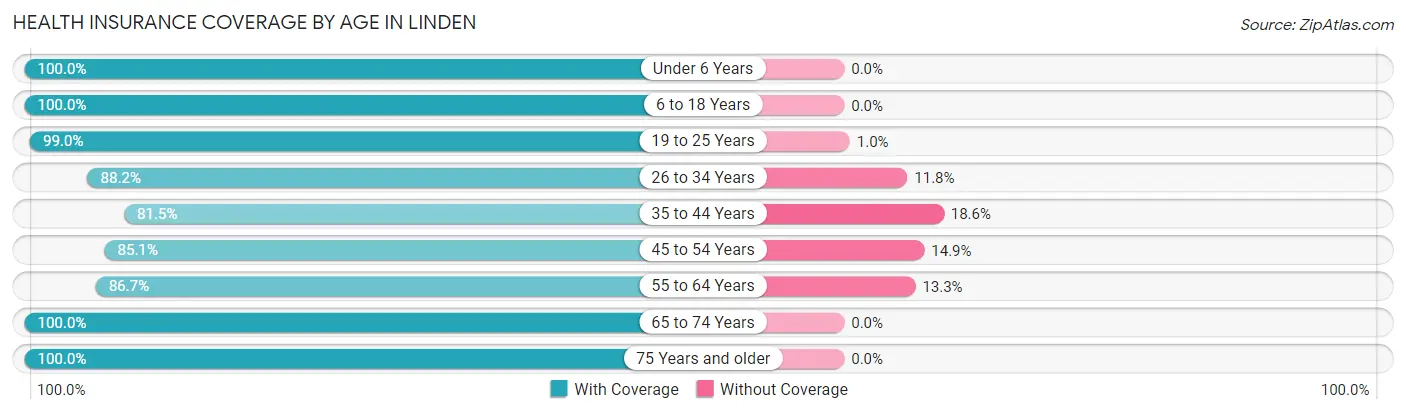
| Age Bracket | With Coverage | Without Coverage |
| Under 6 Years | 100 (100.0%) | 0 (0.0%) |
| 6 to 18 Years | 245 (100.0%) | 0 (0.0%) |
| 19 to 25 Years | 96 (99.0%) | 1 (1.0%) |
| 26 to 34 Years | 150 (88.2%) | 20 (11.8%) |
| 35 to 44 Years | 101 (81.5%) | 23 (18.5%) |
| 45 to 54 Years | 171 (85.1%) | 30 (14.9%) |
| 55 to 64 Years | 170 (86.7%) | 26 (13.3%) |
| 65 to 74 Years | 89 (100.0%) | 0 (0.0%) |
| 75 Years and older | 134 (100.0%) | 0 (0.0%) |
| Total | 1,256 (92.6%) | 100 (7.4%) |
Health Insurance Coverage by Citizenship Status in Linden
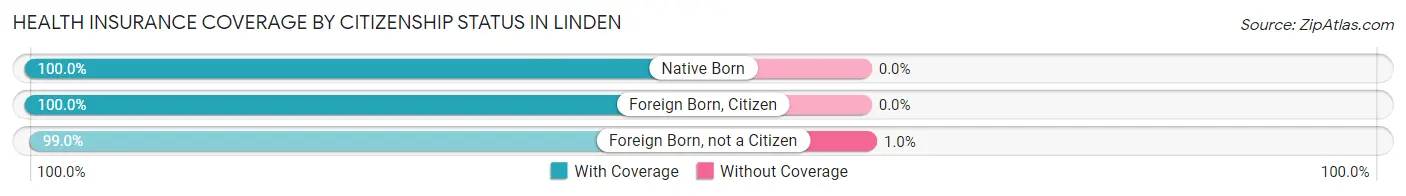
| Citizenship Status | With Coverage | Without Coverage |
| Native Born | 100 (100.0%) | 0 (0.0%) |
| Foreign Born, Citizen | 245 (100.0%) | 0 (0.0%) |
| Foreign Born, not a Citizen | 96 (99.0%) | 1 (1.0%) |
Health Insurance Coverage by Household Income in Linden
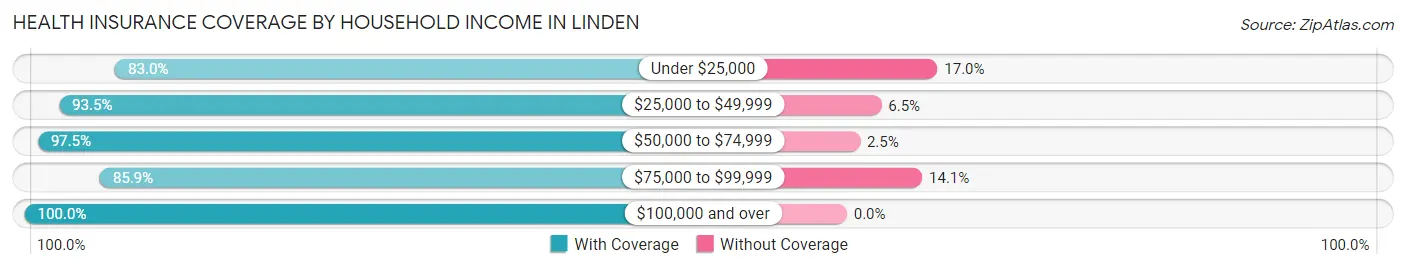
| Household Income | With Coverage | Without Coverage |
| Under $25,000 | 181 (83.0%) | 37 (17.0%) |
| $25,000 to $49,999 | 404 (93.5%) | 28 (6.5%) |
| $50,000 to $74,999 | 474 (97.5%) | 12 (2.5%) |
| $75,000 to $99,999 | 140 (85.9%) | 23 (14.1%) |
| $100,000 and over | 57 (100.0%) | 0 (0.0%) |
Public vs Private Health Insurance Coverage by Age in Linden
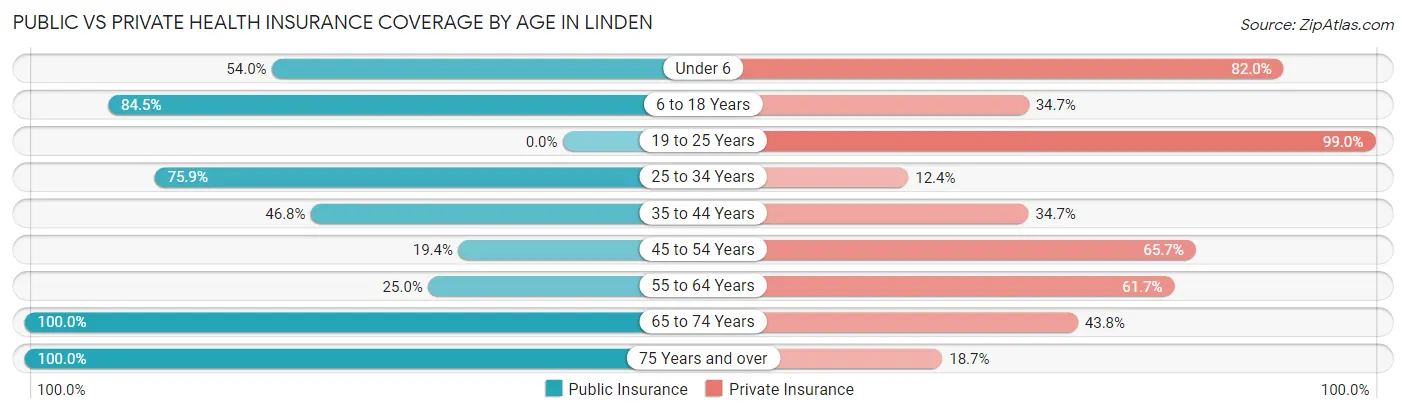
| Age Bracket | Public Insurance | Private Insurance |
| Under 6 | 54 (54.0%) | 82 (82.0%) |
| 6 to 18 Years | 207 (84.5%) | 85 (34.7%) |
| 19 to 25 Years | 0 (0.0%) | 96 (99.0%) |
| 25 to 34 Years | 129 (75.9%) | 21 (12.3%) |
| 35 to 44 Years | 58 (46.8%) | 43 (34.7%) |
| 45 to 54 Years | 39 (19.4%) | 132 (65.7%) |
| 55 to 64 Years | 49 (25.0%) | 121 (61.7%) |
| 65 to 74 Years | 89 (100.0%) | 39 (43.8%) |
| 75 Years and over | 134 (100.0%) | 25 (18.7%) |
| Total | 759 (56.0%) | 644 (47.5%) |
Disability Status by Sex by Age in Linden
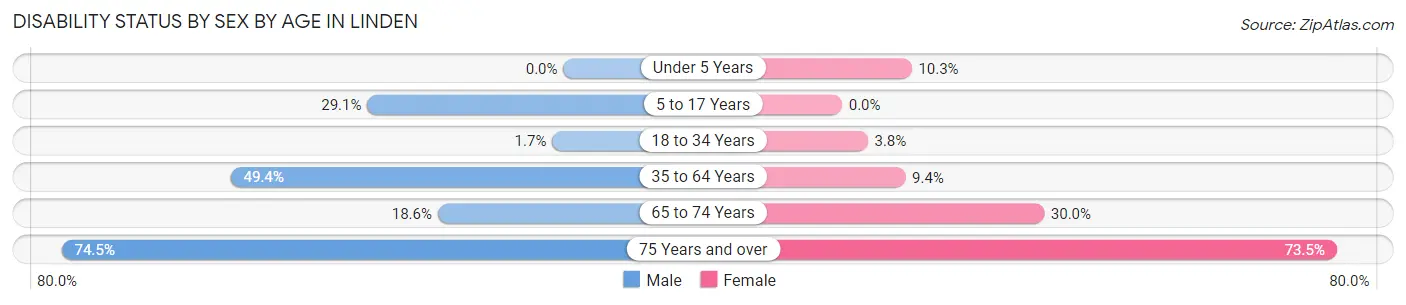
| Age Bracket | Male | Female |
| Under 5 Years | 0 (0.0%) | 6 (10.3%) |
| 5 to 17 Years | 46 (29.1%) | 0 (0.0%) |
| 18 to 34 Years | 2 (1.7%) | 6 (3.8%) |
| 35 to 64 Years | 84 (49.4%) | 33 (9.4%) |
| 65 to 74 Years | 11 (18.6%) | 9 (30.0%) |
| 75 Years and over | 38 (74.5%) | 61 (73.5%) |
Disability Class by Sex by Age in Linden
Disability Class: Hearing Difficulty
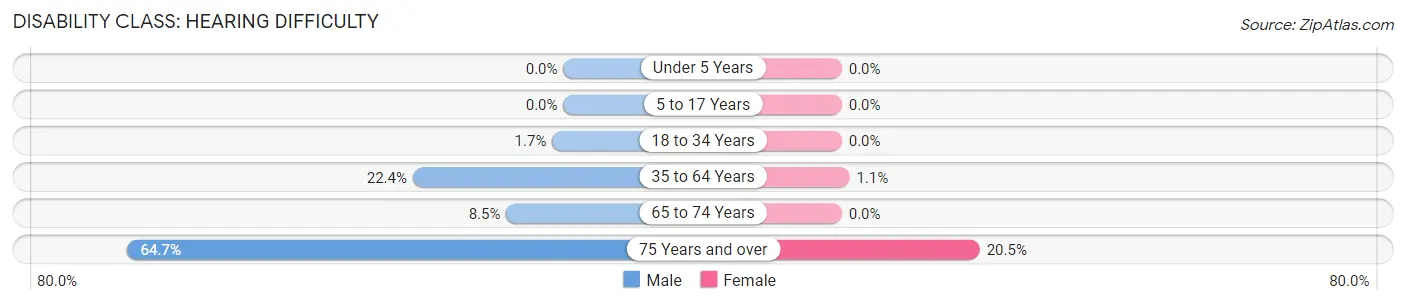
| Age Bracket | Male | Female |
| Under 5 Years | 0 (0.0%) | 0 (0.0%) |
| 5 to 17 Years | 0 (0.0%) | 0 (0.0%) |
| 18 to 34 Years | 2 (1.7%) | 0 (0.0%) |
| 35 to 64 Years | 38 (22.4%) | 4 (1.1%) |
| 65 to 74 Years | 5 (8.5%) | 0 (0.0%) |
| 75 Years and over | 33 (64.7%) | 17 (20.5%) |
Disability Class: Vision Difficulty
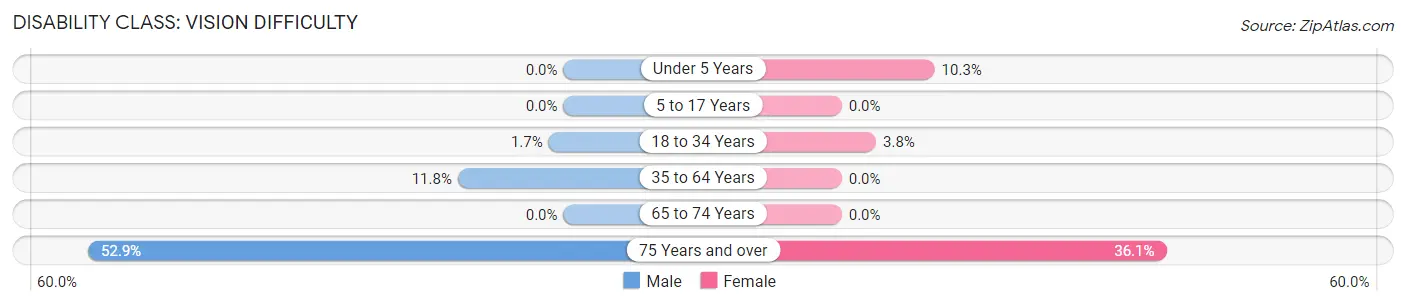
| Age Bracket | Male | Female |
| Under 5 Years | 0 (0.0%) | 6 (10.3%) |
| 5 to 17 Years | 0 (0.0%) | 0 (0.0%) |
| 18 to 34 Years | 2 (1.7%) | 6 (3.8%) |
| 35 to 64 Years | 20 (11.8%) | 0 (0.0%) |
| 65 to 74 Years | 0 (0.0%) | 0 (0.0%) |
| 75 Years and over | 27 (52.9%) | 30 (36.1%) |
Disability Class: Cognitive Difficulty
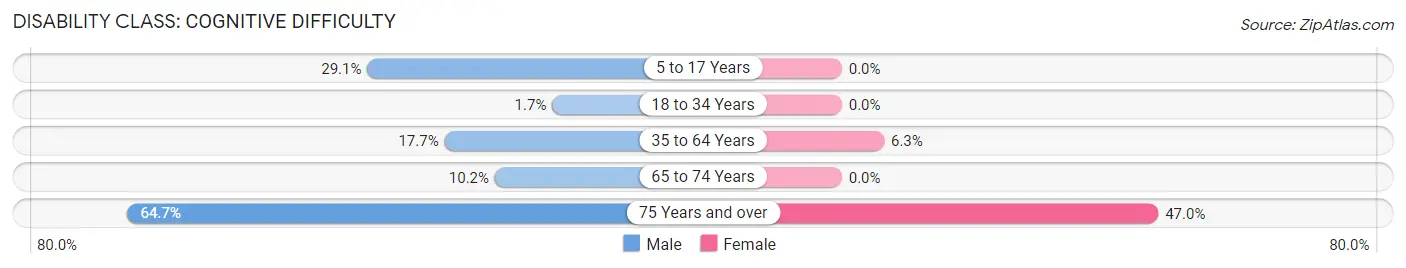
| Age Bracket | Male | Female |
| 5 to 17 Years | 46 (29.1%) | 0 (0.0%) |
| 18 to 34 Years | 2 (1.7%) | 0 (0.0%) |
| 35 to 64 Years | 30 (17.6%) | 22 (6.3%) |
| 65 to 74 Years | 6 (10.2%) | 0 (0.0%) |
| 75 Years and over | 33 (64.7%) | 39 (47.0%) |
Disability Class: Ambulatory Difficulty
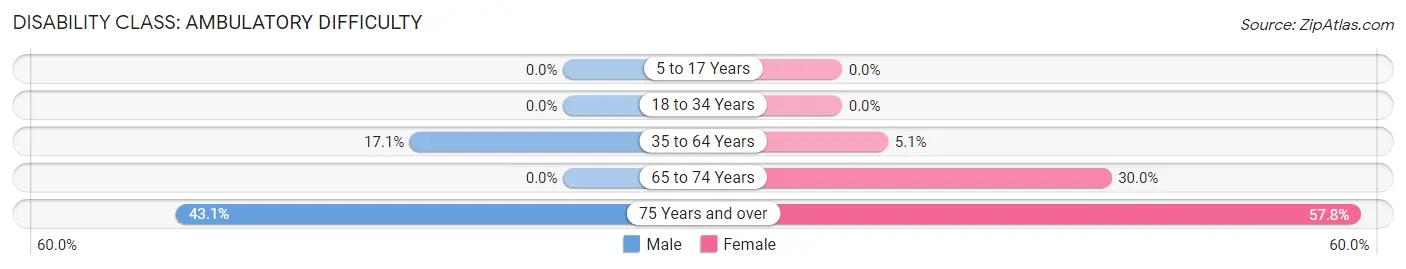
| Age Bracket | Male | Female |
| 5 to 17 Years | 0 (0.0%) | 0 (0.0%) |
| 18 to 34 Years | 0 (0.0%) | 0 (0.0%) |
| 35 to 64 Years | 29 (17.1%) | 18 (5.1%) |
| 65 to 74 Years | 0 (0.0%) | 9 (30.0%) |
| 75 Years and over | 22 (43.1%) | 48 (57.8%) |
Disability Class: Self-Care Difficulty
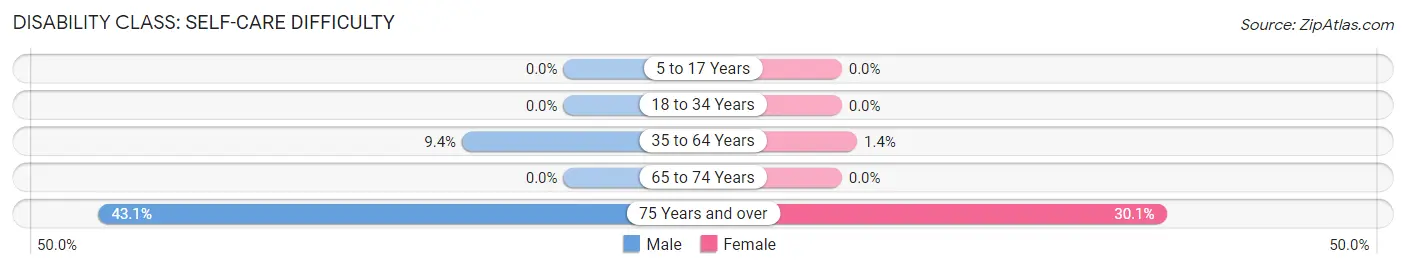
| Age Bracket | Male | Female |
| 5 to 17 Years | 0 (0.0%) | 0 (0.0%) |
| 18 to 34 Years | 0 (0.0%) | 0 (0.0%) |
| 35 to 64 Years | 16 (9.4%) | 5 (1.4%) |
| 65 to 74 Years | 0 (0.0%) | 0 (0.0%) |
| 75 Years and over | 22 (43.1%) | 25 (30.1%) |
Technology Access in Linden
Computing Device Access in Linden
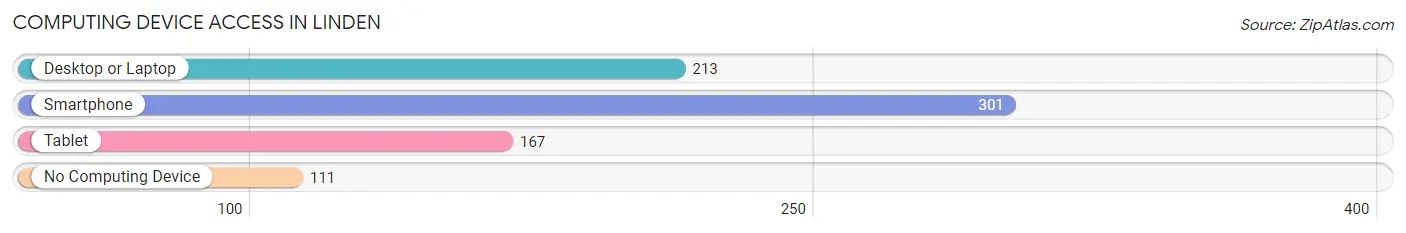
| Device Type | # Households | % Households |
| Desktop or Laptop | 213 | 48.5% |
| Smartphone | 301 | 68.6% |
| Tablet | 167 | 38.0% |
| No Computing Device | 111 | 25.3% |
| Total | 439 | 100.0% |
Internet Access in Linden
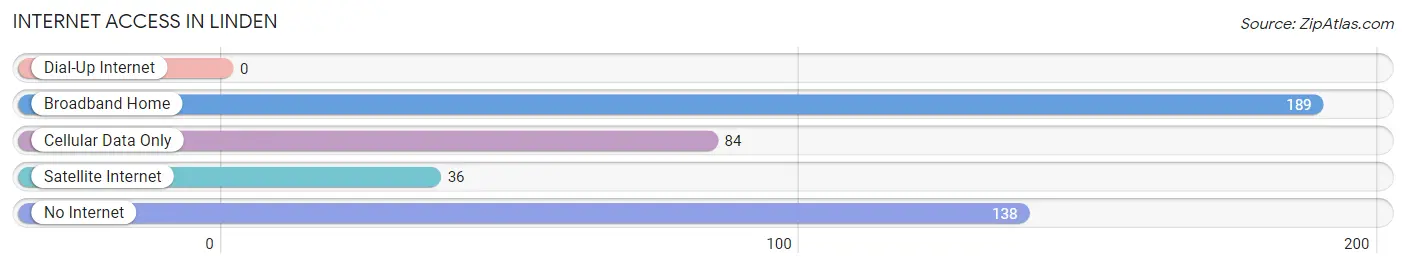
| Internet Type | # Households | % Households |
| Dial-Up Internet | 0 | 0.0% |
| Broadband Home | 189 | 43.0% |
| Cellular Data Only | 84 | 19.1% |
| Satellite Internet | 36 | 8.2% |
| No Internet | 138 | 31.4% |
| Total | 439 | 100.0% |
Linden Summary
Linden, Tennessee is a small town located in Perry County, Tennessee. It is situated in the western part of the state, approximately 70 miles from Nashville. The town was founded in 1820 and has a population of approximately 1,500 people.
History
Linden was founded in 1820 by a group of settlers from North Carolina. The town was named after a nearby creek, which was named after a Linden tree that grew near the creek. The town was originally a farming community, and the main crops were cotton and tobacco. The town was also known for its iron ore deposits, which were mined and used to make tools and weapons.
In the late 1800s, the town began to grow and develop. The railroad was built through the town, and the town became a hub for the surrounding area. The town also became a center for education, with the establishment of a school and a college.
In the early 1900s, the town began to decline. The railroad was abandoned, and the iron ore deposits were depleted. The town was also hit hard by the Great Depression, and many of the businesses in the town closed.
Geography
Linden is located in the western part of Perry County, Tennessee. The town is situated on the banks of the Buffalo River, which flows through the town. The town is surrounded by rolling hills and forests, and is located approximately 70 miles from Nashville.
Economy
The economy of Linden is largely based on agriculture. The town is home to several farms, which produce a variety of crops, including corn, soybeans, and cotton. The town also has a few small businesses, including a grocery store, a hardware store, and a few restaurants.
Demographics
As of the 2010 census, the population of Linden was 1,500. The town is predominantly white, with a small African American population. The median household income is $35,000, and the median home value is $90,000.
Conclusion
Linden, Tennessee is a small town located in Perry County, Tennessee. It was founded in 1820 and has a population of approximately 1,500 people. The town is largely based on agriculture, and the economy is supported by several small businesses. The town is predominantly white, with a small African American population. Linden is a quiet, rural town with a rich history and a bright future.
Common Questions
What is Per Capita Income in Linden?
Per Capita income in Linden is $19,252.
What is the Median Family Income in Linden?
Median Family Income in Linden is $60,057.
What is the Median Household income in Linden?
Median Household Income in Linden is $46,836.
What is Income or Wage Gap in Linden?
Income or Wage Gap in Linden is 19.2%.
Women in Linden earn 80.8 cents for every dollar earned by a man.
What is Inequality or Gini Index in Linden?
Inequality or Gini Index in Linden is 0.44.
What is the Total Population of Linden?
Total Population of Linden is 1,469.
What is the Total Male Population of Linden?
Total Male Population of Linden is 622.
What is the Total Female Population of Linden?
Total Female Population of Linden is 847.
What is the Ratio of Males per 100 Females in Linden?
There are 73.44 Males per 100 Females in Linden.
What is the Ratio of Females per 100 Males in Linden?
There are 136.17 Females per 100 Males in Linden.
What is the Median Population Age in Linden?
Median Population Age in Linden is 43.9 Years.
What is the Average Family Size in Linden
Average Family Size in Linden is 4.2 People.
What is the Average Household Size in Linden
Average Household Size in Linden is 3.1 People.
How Large is the Labor Force in Linden?
There are 477 People in the Labor Forcein in Linden.
What is the Percentage of People in the Labor Force in Linden?
41.4% of People are in the Labor Force in Linden.
What is the Unemployment Rate in Linden?
Unemployment Rate in Linden is 8.6%.