Clinton, TN Map & Demographics
Clinton Map
Clinton Overview
$32,680
PER CAPITA INCOME
$76,827
AVG FAMILY INCOME
$63,706
AVG HOUSEHOLD INCOME
8.4%
WAGE / INCOME GAP [ % ]
91.6¢/ $1
WAGE / INCOME GAP [ $ ]
$5,576
FAMILY INCOME DEFICIT
0.42
INEQUALITY / GINI INDEX
10,060
TOTAL POPULATION
4,954
MALE POPULATION
5,106
FEMALE POPULATION
97.02
MALES / 100 FEMALES
103.07
FEMALES / 100 MALES
46.1
MEDIAN AGE
2.7
AVG FAMILY SIZE
2.3
AVG HOUSEHOLD SIZE
4,765
LABOR FORCE [ PEOPLE ]
56.2%
PERCENT IN LABOR FORCE
3.1%
UNEMPLOYMENT RATE
Clinton Zip Codes
Clinton Area Codes
Income in Clinton
Income Overview in Clinton
Per Capita Income in Clinton is $32,680, while median incomes of families and households are $76,827 and $63,706 respectively.
| Characteristic | Number | Measure |
| Per Capita Income | 10,060 | $32,680 |
| Median Family Income | 2,985 | $76,827 |
| Mean Family Income | 2,985 | $91,086 |
| Median Household Income | 4,321 | $63,706 |
| Mean Household Income | 4,321 | $75,606 |
| Income Deficit | 2,985 | $5,576 |
| Wage / Income Gap (%) | 10,060 | 8.44% |
| Wage / Income Gap ($) | 10,060 | 91.56¢ per $1 |
| Gini / Inequality Index | 10,060 | 0.42 |
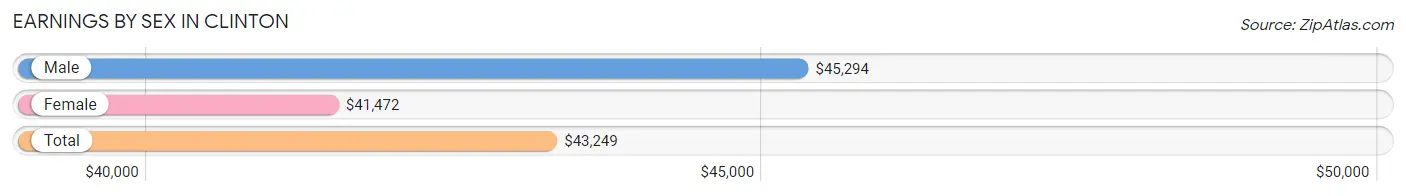
Earnings by Sex in Clinton
Average Earnings in Clinton are $43,249, $45,294 for men and $41,472 for women, a difference of 8.4%.
| Sex | Number | Average Earnings |
| Male | 2,634 (53.3%) | $45,294 |
| Female | 2,309 (46.7%) | $41,472 |
| Total | 4,943 (100.0%) | $43,249 |
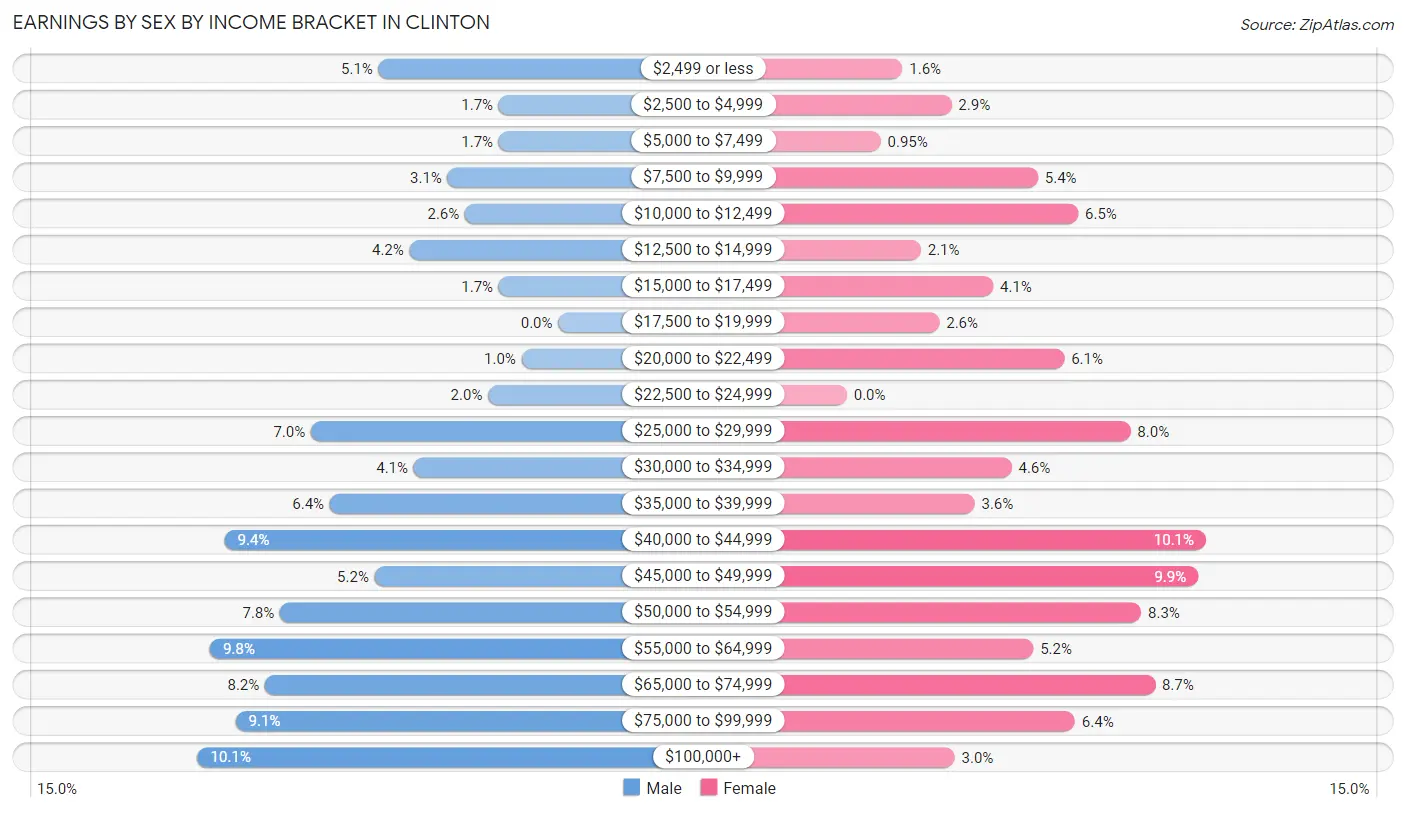
Earnings by Sex by Income Bracket in Clinton
The most common earnings brackets in Clinton are $100,000+ for men (267 | 10.1%) and $40,000 to $44,999 for women (233 | 10.1%).
| Income | Male | Female |
| $2,499 or less | 133 (5.1%) | 36 (1.6%) |
| $2,500 to $4,999 | 44 (1.7%) | 68 (2.9%) |
| $5,000 to $7,499 | 44 (1.7%) | 22 (0.9%) |
| $7,500 to $9,999 | 82 (3.1%) | 124 (5.4%) |
| $10,000 to $12,499 | 69 (2.6%) | 150 (6.5%) |
| $12,500 to $14,999 | 110 (4.2%) | 48 (2.1%) |
| $15,000 to $17,499 | 44 (1.7%) | 95 (4.1%) |
| $17,500 to $19,999 | 0 (0.0%) | 60 (2.6%) |
| $20,000 to $22,499 | 27 (1.0%) | 141 (6.1%) |
| $22,500 to $24,999 | 52 (2.0%) | 0 (0.0%) |
| $25,000 to $29,999 | 183 (7.0%) | 184 (8.0%) |
| $30,000 to $34,999 | 107 (4.1%) | 107 (4.6%) |
| $35,000 to $39,999 | 169 (6.4%) | 83 (3.6%) |
| $40,000 to $44,999 | 247 (9.4%) | 233 (10.1%) |
| $45,000 to $49,999 | 136 (5.2%) | 228 (9.9%) |
| $50,000 to $54,999 | 206 (7.8%) | 191 (8.3%) |
| $55,000 to $64,999 | 258 (9.8%) | 121 (5.2%) |
| $65,000 to $74,999 | 217 (8.2%) | 200 (8.7%) |
| $75,000 to $99,999 | 239 (9.1%) | 148 (6.4%) |
| $100,000+ | 267 (10.1%) | 70 (3.0%) |
| Total | 2,634 (100.0%) | 2,309 (100.0%) |
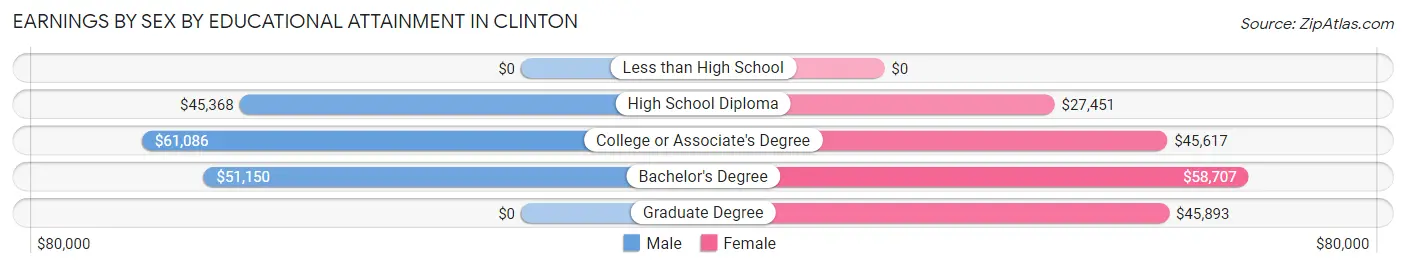
Earnings by Sex by Educational Attainment in Clinton
Average earnings in Clinton are $50,995 for men and $43,289 for women, a difference of 15.1%. Men with an educational attainment of college or associate's degree enjoy the highest average annual earnings of $61,086, while those with high school diploma education earn the least with $45,368. Women with an educational attainment of bachelor's degree earn the most with the average annual earnings of $58,707, while those with high school diploma education have the smallest earnings of $27,451.
| Educational Attainment | Male Income | Female Income |
| Less than High School | - | - |
| High School Diploma | $45,368 | $27,451 |
| College or Associate's Degree | $61,086 | $45,617 |
| Bachelor's Degree | $51,150 | $58,707 |
| Graduate Degree | - | - |
| Total | $50,995 | $43,289 |
Family Income in Clinton
Family Income Brackets in Clinton
According to the Clinton family income data, there are 734 families falling into the $100,000 to $149,999 income range, which is the most common income bracket and makes up 24.6% of all families. Conversely, the less than $10,000 income bracket is the least frequent group with only 33 families (1.1%) belonging to this category.
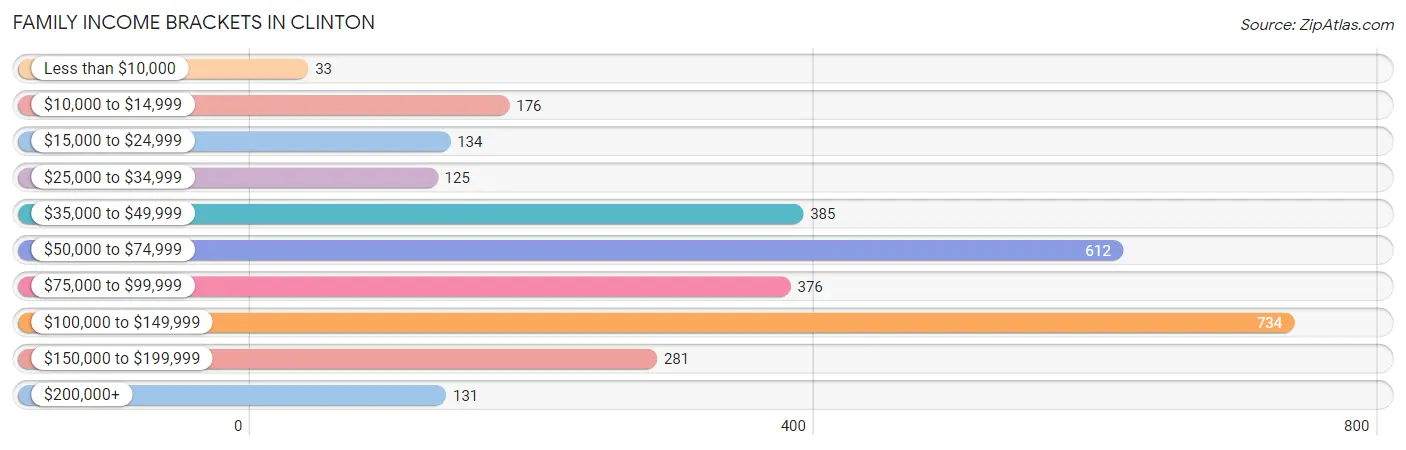
| Income Bracket | # Families | % Families |
| Less than $10,000 | 33 | 1.1% |
| $10,000 to $14,999 | 176 | 5.9% |
| $15,000 to $24,999 | 134 | 4.5% |
| $25,000 to $34,999 | 125 | 4.2% |
| $35,000 to $49,999 | 385 | 12.9% |
| $50,000 to $74,999 | 612 | 20.5% |
| $75,000 to $99,999 | 376 | 12.6% |
| $100,000 to $149,999 | 734 | 24.6% |
| $150,000 to $199,999 | 281 | 9.4% |
| $200,000+ | 131 | 4.4% |
Family Income by Famaliy Size in Clinton
4-person families (524 | 17.5%) account for the highest median family income in Clinton with $138,788 per family, while 2-person families (1,797 | 60.2%) have the highest median income of $35,196 per family member.
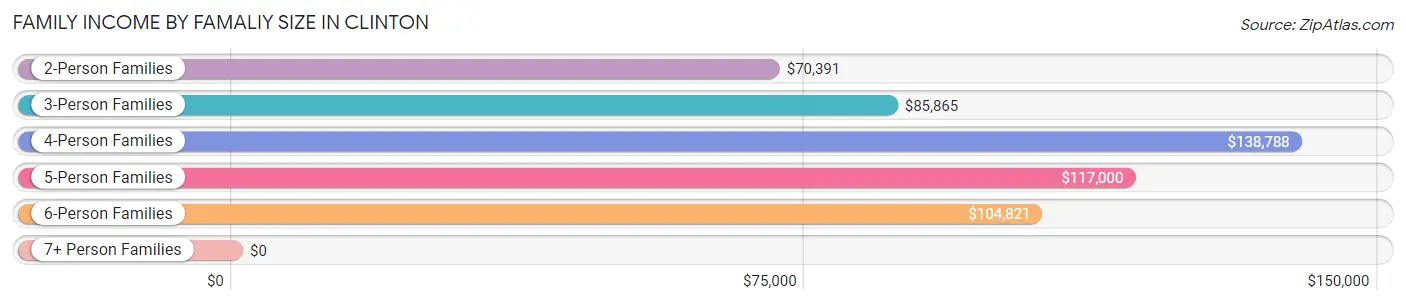
| Income Bracket | # Families | Median Income |
| 2-Person Families | 1,797 (60.2%) | $70,391 |
| 3-Person Families | 477 (16.0%) | $85,865 |
| 4-Person Families | 524 (17.5%) | $138,788 |
| 5-Person Families | 76 (2.5%) | $117,000 |
| 6-Person Families | 94 (3.2%) | $104,821 |
| 7+ Person Families | 17 (0.6%) | $0 |
| Total | 2,985 (100.0%) | $76,827 |
Family Income by Number of Earners in Clinton
The median family income in Clinton is $76,827, with families comprising 3+ earners (222) having the highest median family income of $144,276, while families with no earners (807) have the lowest median family income of $39,066, accounting for 7.4% and 27.0% of families, respectively.
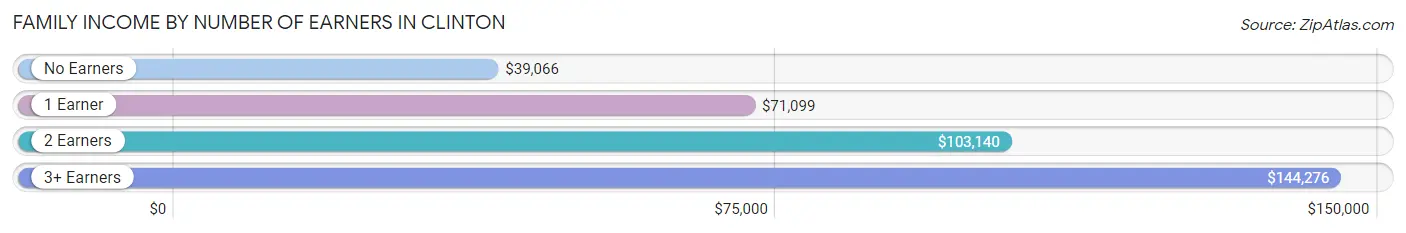
| Number of Earners | # Families | Median Income |
| No Earners | 807 (27.0%) | $39,066 |
| 1 Earner | 778 (26.1%) | $71,099 |
| 2 Earners | 1,178 (39.5%) | $103,140 |
| 3+ Earners | 222 (7.4%) | $144,276 |
| Total | 2,985 (100.0%) | $76,827 |
Household Income in Clinton
Household Income Brackets in Clinton
With 743 households falling in the category, the $100,000 to $149,999 income range is the most frequent in Clinton, accounting for 17.2% of all households. In contrast, only 138 households (3.2%) fall into the less than $10,000 income bracket, making it the least populous group.
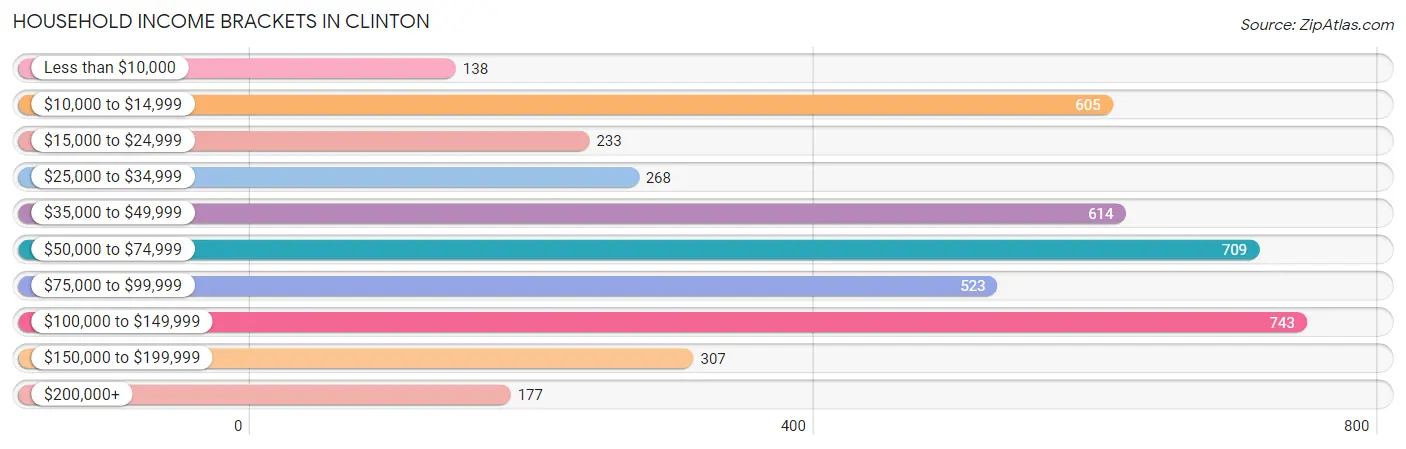
| Income Bracket | # Households | % Households |
| Less than $10,000 | 138 | 3.2% |
| $10,000 to $14,999 | 605 | 14.0% |
| $15,000 to $24,999 | 233 | 5.4% |
| $25,000 to $34,999 | 268 | 6.2% |
| $35,000 to $49,999 | 614 | 14.2% |
| $50,000 to $74,999 | 709 | 16.4% |
| $75,000 to $99,999 | 523 | 12.1% |
| $100,000 to $149,999 | 743 | 17.2% |
| $150,000 to $199,999 | 307 | 7.1% |
| $200,000+ | 177 | 4.1% |
Household Income by Householder Age in Clinton
The median household income in Clinton is $63,706, with the highest median household income of $76,250 found in the 25 to 44 years age bracket for the primary householder. A total of 1,247 households (28.9%) fall into this category. Meanwhile, the 15 to 24 years age bracket for the primary householder has the lowest median household income of $39,728, with 135 households (3.1%) in this group.
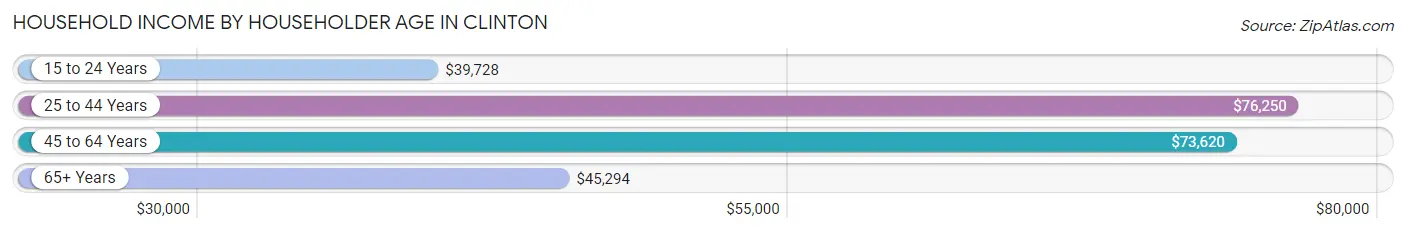
| Income Bracket | # Households | Median Income |
| 15 to 24 Years | 135 (3.1%) | $39,728 |
| 25 to 44 Years | 1,247 (28.9%) | $76,250 |
| 45 to 64 Years | 1,489 (34.5%) | $73,620 |
| 65+ Years | 1,450 (33.6%) | $45,294 |
| Total | 4,321 (100.0%) | $63,706 |
Poverty in Clinton
Income Below Poverty by Sex and Age in Clinton
With 12.4% poverty level for males and 14.4% for females among the residents of Clinton, 6 to 11 year old males and 65 to 74 year old females are the most vulnerable to poverty, with 62 males (25.7%) and 250 females (30.3%) in their respective age groups living below the poverty level.
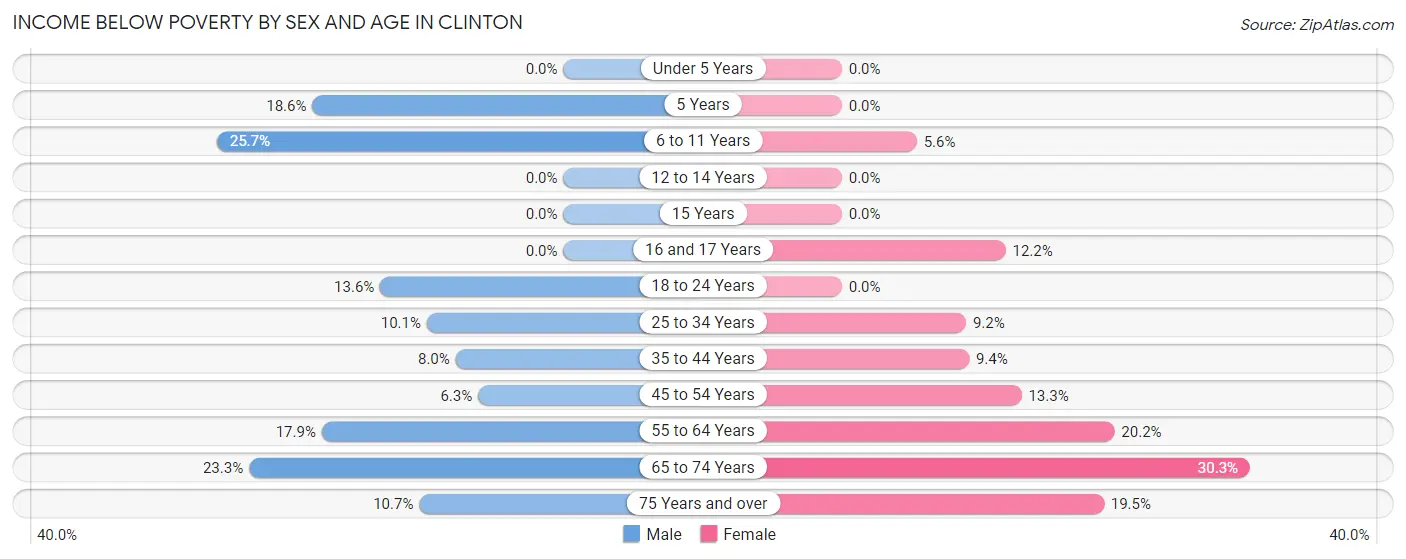
| Age Bracket | Male | Female |
| Under 5 Years | 0 (0.0%) | 0 (0.0%) |
| 5 Years | 11 (18.6%) | 0 (0.0%) |
| 6 to 11 Years | 62 (25.7%) | 17 (5.6%) |
| 12 to 14 Years | 0 (0.0%) | 0 (0.0%) |
| 15 Years | 0 (0.0%) | 0 (0.0%) |
| 16 and 17 Years | 0 (0.0%) | 9 (12.2%) |
| 18 to 24 Years | 51 (13.6%) | 0 (0.0%) |
| 25 to 34 Years | 70 (10.1%) | 67 (9.2%) |
| 35 to 44 Years | 54 (8.0%) | 42 (9.4%) |
| 45 to 54 Years | 39 (6.3%) | 83 (13.3%) |
| 55 to 64 Years | 103 (17.9%) | 166 (20.2%) |
| 65 to 74 Years | 179 (23.3%) | 250 (30.3%) |
| 75 Years and over | 41 (10.7%) | 92 (19.5%) |
| Total | 610 (12.4%) | 726 (14.4%) |
Income Above Poverty by Sex and Age in Clinton
According to the poverty statistics in Clinton, males aged under 5 years and females aged under 5 years are the age groups that are most secure financially, with 100.0% of males and 100.0% of females in these age groups living above the poverty line.
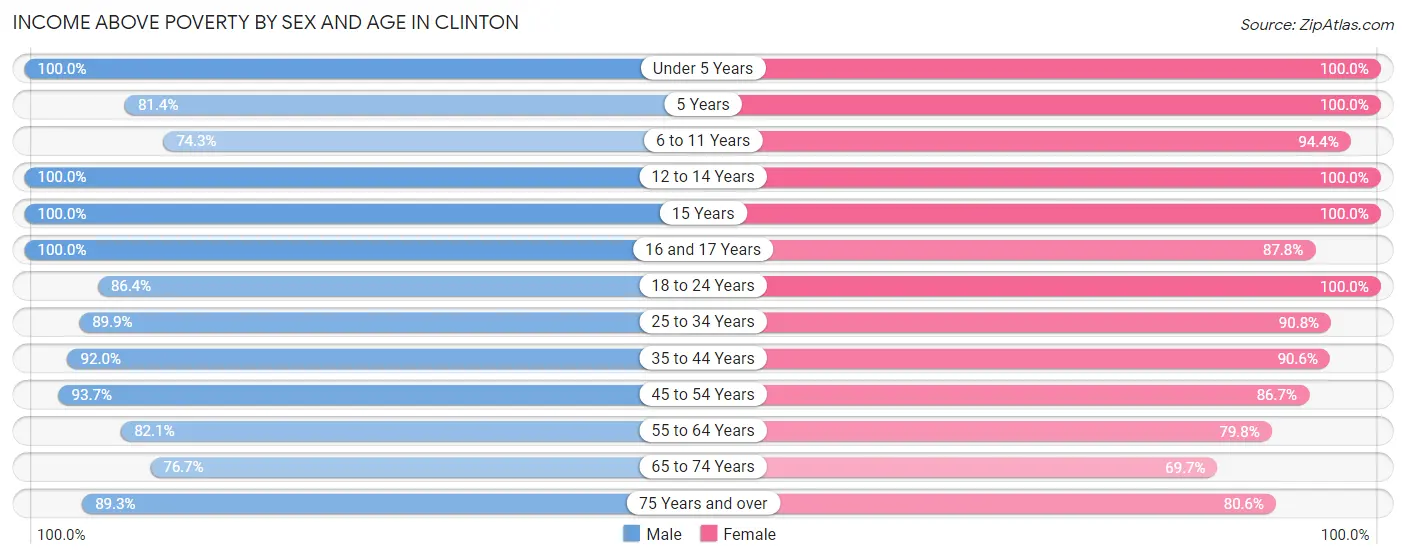
| Age Bracket | Male | Female |
| Under 5 Years | 125 (100.0%) | 340 (100.0%) |
| 5 Years | 48 (81.4%) | 33 (100.0%) |
| 6 to 11 Years | 179 (74.3%) | 289 (94.4%) |
| 12 to 14 Years | 282 (100.0%) | 89 (100.0%) |
| 15 Years | 15 (100.0%) | 76 (100.0%) |
| 16 and 17 Years | 102 (100.0%) | 65 (87.8%) |
| 18 to 24 Years | 324 (86.4%) | 194 (100.0%) |
| 25 to 34 Years | 620 (89.9%) | 660 (90.8%) |
| 35 to 44 Years | 621 (92.0%) | 403 (90.6%) |
| 45 to 54 Years | 577 (93.7%) | 539 (86.7%) |
| 55 to 64 Years | 471 (82.1%) | 654 (79.8%) |
| 65 to 74 Years | 588 (76.7%) | 575 (69.7%) |
| 75 Years and over | 342 (89.3%) | 381 (80.5%) |
| Total | 4,294 (87.6%) | 4,298 (85.6%) |
Income Below Poverty Among Married-Couple Families in Clinton
The poverty statistics for married-couple families in Clinton show that 7.6% or 178 of the total 2,351 families live below the poverty line. Families with no children have the highest poverty rate of 10.6%, comprising of 170 families. On the other hand, families with 3 or 4 children have the lowest poverty rate of 0.0%, which includes 0 families.
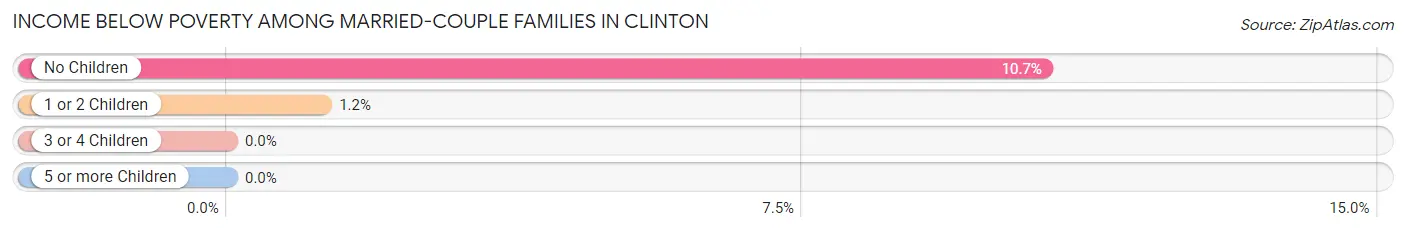
| Children | Above Poverty | Below Poverty |
| No Children | 1,426 (89.3%) | 170 (10.6%) |
| 1 or 2 Children | 643 (98.8%) | 8 (1.2%) |
| 3 or 4 Children | 87 (100.0%) | 0 (0.0%) |
| 5 or more Children | 17 (100.0%) | 0 (0.0%) |
| Total | 2,173 (92.4%) | 178 (7.6%) |
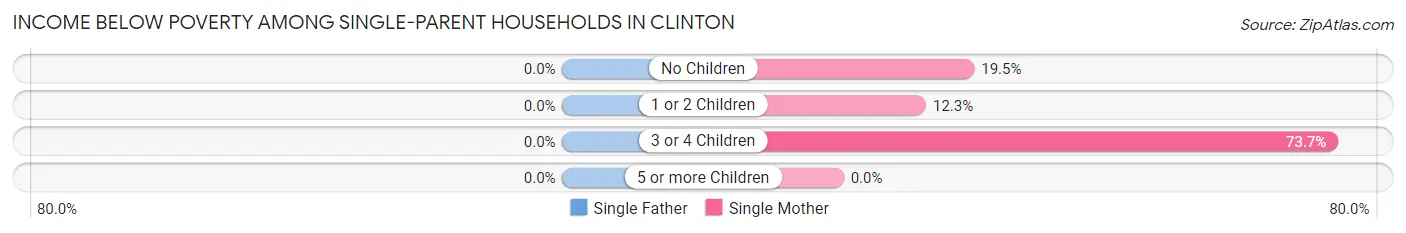
Income Below Poverty Among Single-Parent Households in Clinton
| Children | Single Father | Single Mother |
| No Children | 0 (0.0%) | 44 (19.5%) |
| 1 or 2 Children | 0 (0.0%) | 35 (12.3%) |
| 3 or 4 Children | 0 (0.0%) | 14 (73.7%) |
| 5 or more Children | 0 (0.0%) | 0 (0.0%) |
| Total | 0 (0.0%) | 93 (17.5%) |
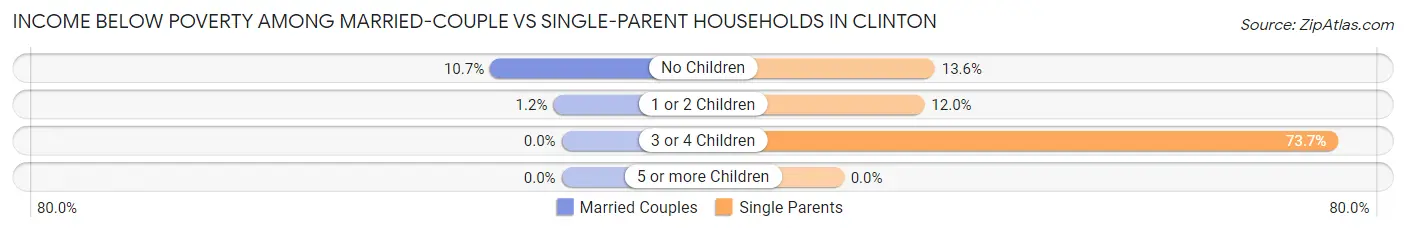
Income Below Poverty Among Married-Couple vs Single-Parent Households in Clinton
The poverty data for Clinton shows that 178 of the married-couple family households (7.6%) and 93 of the single-parent households (14.7%) are living below the poverty level. Within the married-couple family households, those with no children have the highest poverty rate, with 170 households (10.6%) falling below the poverty line. Among the single-parent households, those with 3 or 4 children have the highest poverty rate, with 14 household (73.7%) living below poverty.
| Children | Married-Couple Families | Single-Parent Households |
| No Children | 170 (10.6%) | 44 (13.6%) |
| 1 or 2 Children | 8 (1.2%) | 35 (12.0%) |
| 3 or 4 Children | 0 (0.0%) | 14 (73.7%) |
| 5 or more Children | 0 (0.0%) | 0 (0.0%) |
| Total | 178 (7.6%) | 93 (14.7%) |
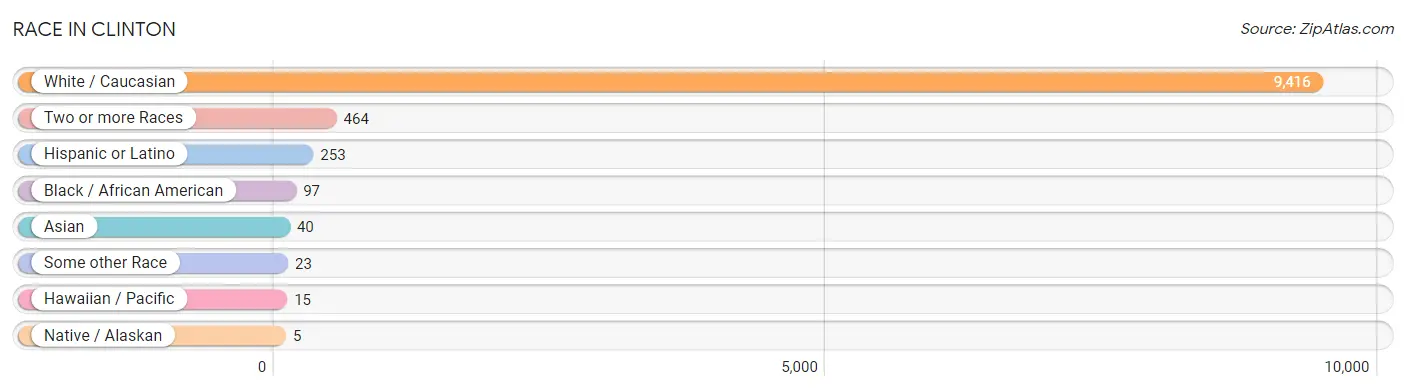
Race in Clinton
The most populous races in Clinton are White / Caucasian (9,416 | 93.6%), Two or more Races (464 | 4.6%), and Hispanic or Latino (253 | 2.5%).
| Race | # Population | % Population |
| Asian | 40 | 0.4% |
| Black / African American | 97 | 1.0% |
| Hawaiian / Pacific | 15 | 0.2% |
| Hispanic or Latino | 253 | 2.5% |
| Native / Alaskan | 5 | 0.1% |
| White / Caucasian | 9,416 | 93.6% |
| Two or more Races | 464 | 4.6% |
| Some other Race | 23 | 0.2% |
| Total | 10,060 | 100.0% |
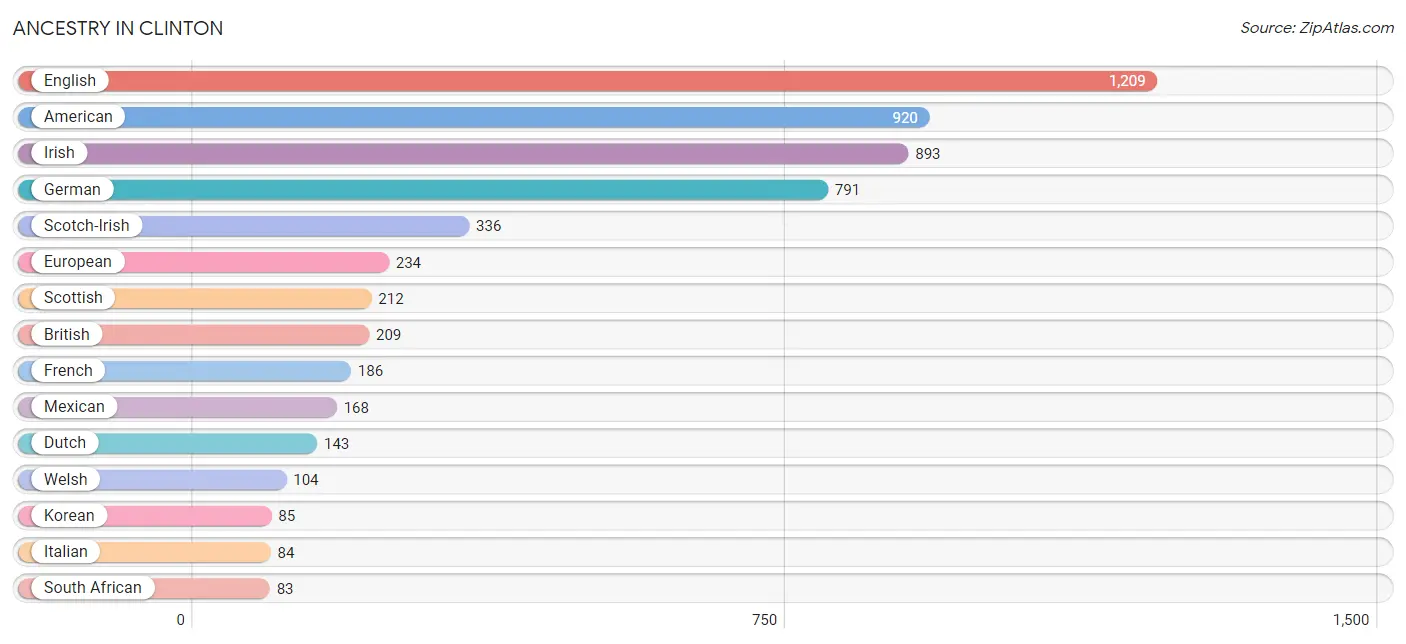
Ancestry in Clinton
The most populous ancestries reported in Clinton are English (1,209 | 12.0%), American (920 | 9.1%), Irish (893 | 8.9%), German (791 | 7.9%), and Scotch-Irish (336 | 3.3%), together accounting for 41.2% of all Clinton residents.
| Ancestry | # Population | % Population |
| American | 920 | 9.1% |
| Arab | 23 | 0.2% |
| Blackfeet | 17 | 0.2% |
| British | 209 | 2.1% |
| Burmese | 13 | 0.1% |
| Canadian | 51 | 0.5% |
| Central American | 23 | 0.2% |
| Cherokee | 71 | 0.7% |
| Choctaw | 11 | 0.1% |
| Danish | 5 | 0.1% |
| Dutch | 143 | 1.4% |
| Eastern European | 26 | 0.3% |
| English | 1,209 | 12.0% |
| European | 234 | 2.3% |
| French | 186 | 1.8% |
| French Canadian | 11 | 0.1% |
| German | 791 | 7.9% |
| German Russian | 27 | 0.3% |
| Irish | 893 | 8.9% |
| Italian | 84 | 0.8% |
| Korean | 85 | 0.8% |
| Mexican | 168 | 1.7% |
| Native Hawaiian | 15 | 0.2% |
| Northern European | 37 | 0.4% |
| Peruvian | 62 | 0.6% |
| Polish | 65 | 0.6% |
| Russian | 10 | 0.1% |
| Salvadoran | 23 | 0.2% |
| Samoan | 12 | 0.1% |
| Scandinavian | 9 | 0.1% |
| Scotch-Irish | 336 | 3.3% |
| Scottish | 212 | 2.1% |
| South African | 83 | 0.8% |
| South American | 62 | 0.6% |
| Subsaharan African | 83 | 0.8% |
| Swedish | 25 | 0.3% |
| Syrian | 23 | 0.2% |
| Ukrainian | 10 | 0.1% |
| Welsh | 104 | 1.0% | View All 39 Rows |
Immigrants in Clinton
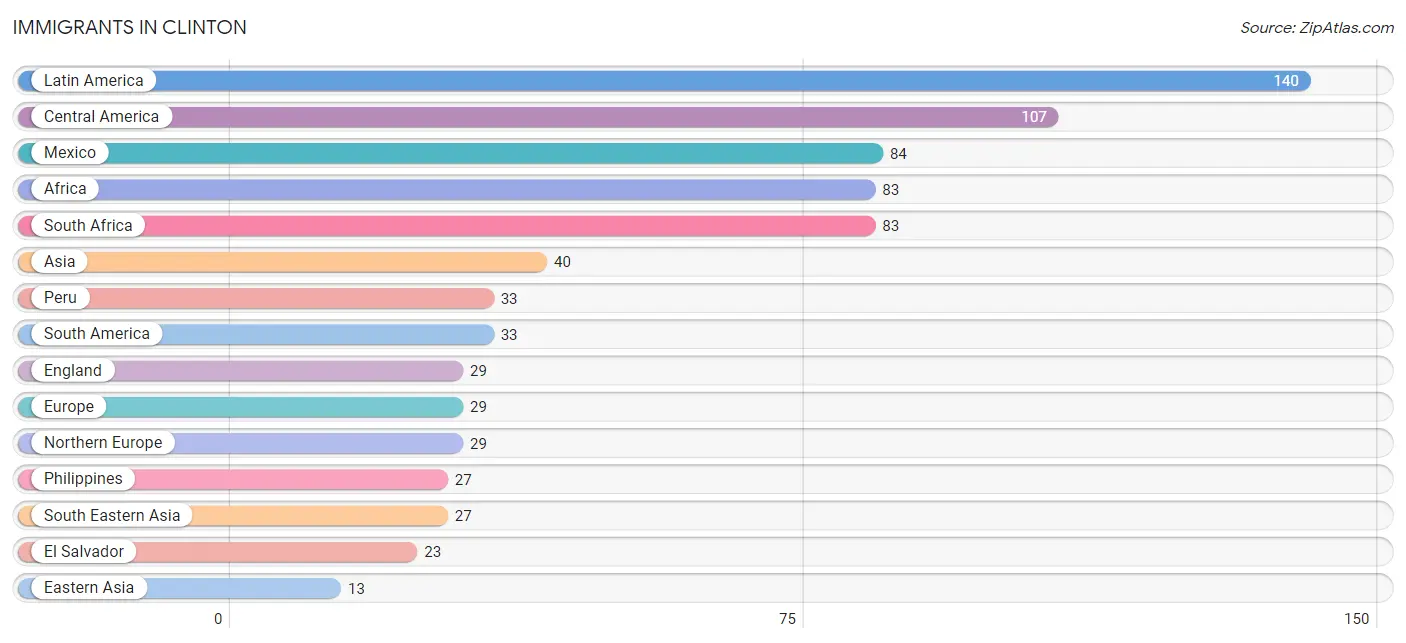
The most numerous immigrant groups reported in Clinton came from Latin America (140 | 1.4%), Central America (107 | 1.1%), Mexico (84 | 0.8%), Africa (83 | 0.8%), and South Africa (83 | 0.8%), together accounting for 4.9% of all Clinton residents.
| Immigration Origin | # Population | % Population |
| Africa | 83 | 0.8% |
| Asia | 40 | 0.4% |
| Canada | 12 | 0.1% |
| Central America | 107 | 1.1% |
| Eastern Asia | 13 | 0.1% |
| El Salvador | 23 | 0.2% |
| England | 29 | 0.3% |
| Europe | 29 | 0.3% |
| Korea | 13 | 0.1% |
| Latin America | 140 | 1.4% |
| Mexico | 84 | 0.8% |
| Northern Europe | 29 | 0.3% |
| Peru | 33 | 0.3% |
| Philippines | 27 | 0.3% |
| South Africa | 83 | 0.8% |
| South America | 33 | 0.3% |
| South Eastern Asia | 27 | 0.3% | View All 17 Rows |
Sex and Age in Clinton
Sex and Age in Clinton
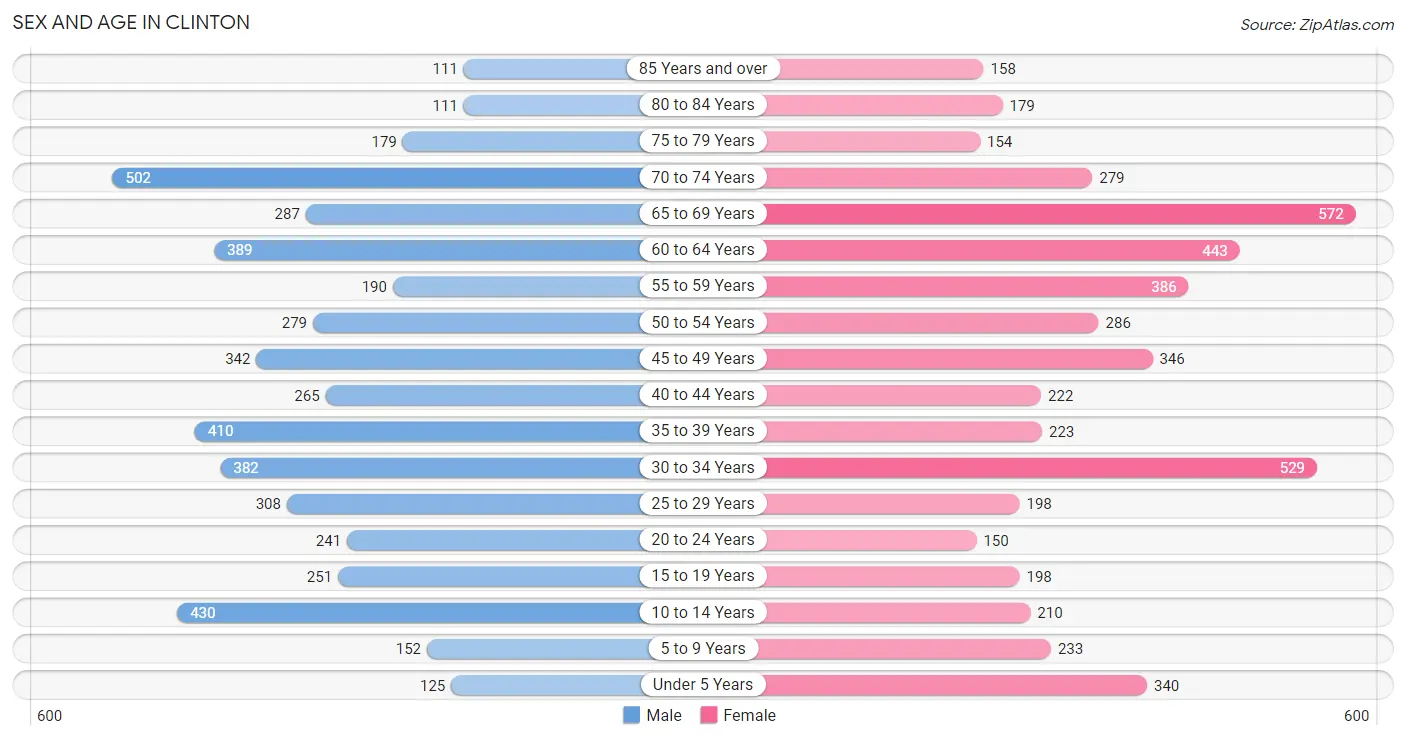
The most populous age groups in Clinton are 70 to 74 Years (502 | 10.1%) for men and 65 to 69 Years (572 | 11.2%) for women.
| Age Bracket | Male | Female |
| Under 5 Years | 125 (2.5%) | 340 (6.7%) |
| 5 to 9 Years | 152 (3.1%) | 233 (4.6%) |
| 10 to 14 Years | 430 (8.7%) | 210 (4.1%) |
| 15 to 19 Years | 251 (5.1%) | 198 (3.9%) |
| 20 to 24 Years | 241 (4.9%) | 150 (2.9%) |
| 25 to 29 Years | 308 (6.2%) | 198 (3.9%) |
| 30 to 34 Years | 382 (7.7%) | 529 (10.4%) |
| 35 to 39 Years | 410 (8.3%) | 223 (4.4%) |
| 40 to 44 Years | 265 (5.3%) | 222 (4.3%) |
| 45 to 49 Years | 342 (6.9%) | 346 (6.8%) |
| 50 to 54 Years | 279 (5.6%) | 286 (5.6%) |
| 55 to 59 Years | 190 (3.8%) | 386 (7.6%) |
| 60 to 64 Years | 389 (7.9%) | 443 (8.7%) |
| 65 to 69 Years | 287 (5.8%) | 572 (11.2%) |
| 70 to 74 Years | 502 (10.1%) | 279 (5.5%) |
| 75 to 79 Years | 179 (3.6%) | 154 (3.0%) |
| 80 to 84 Years | 111 (2.2%) | 179 (3.5%) |
| 85 Years and over | 111 (2.2%) | 158 (3.1%) |
| Total | 4,954 (100.0%) | 5,106 (100.0%) |
Families and Households in Clinton
Median Family Size in Clinton
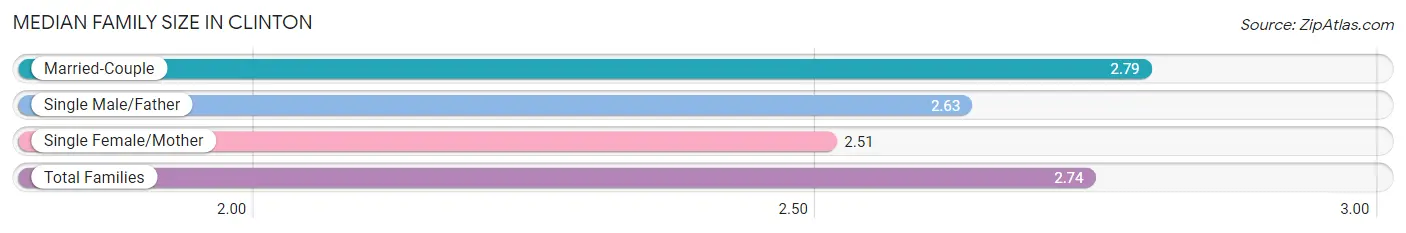
The median family size in Clinton is 2.74 persons per family, with married-couple families (2,351 | 78.8%) accounting for the largest median family size of 2.79 persons per family. On the other hand, single female/mother families (530 | 17.8%) represent the smallest median family size with 2.51 persons per family.
| Family Type | # Families | Family Size |
| Married-Couple | 2,351 (78.8%) | 2.79 |
| Single Male/Father | 104 (3.5%) | 2.63 |
| Single Female/Mother | 530 (17.8%) | 2.51 |
| Total Families | 2,985 (100.0%) | 2.74 |
Median Household Size in Clinton
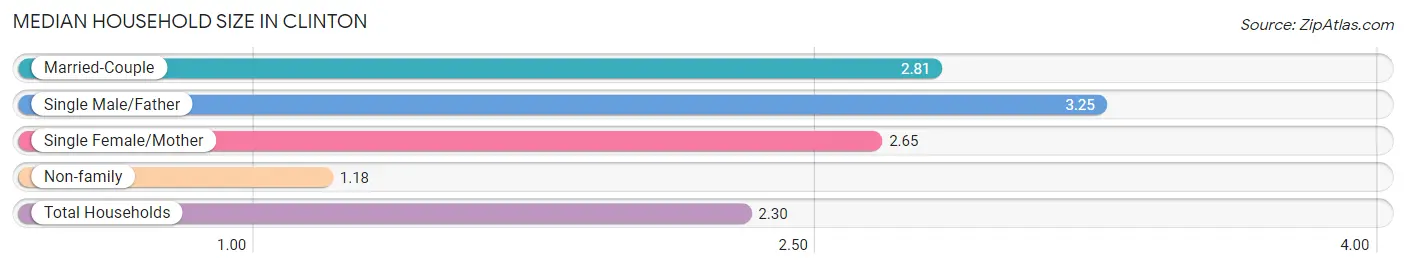
The median household size in Clinton is 2.30 persons per household, with single male/father households (104 | 2.4%) accounting for the largest median household size of 3.25 persons per household. non-family households (1,336 | 30.9%) represent the smallest median household size with 1.18 persons per household.
| Household Type | # Households | Household Size |
| Married-Couple | 2,351 (54.4%) | 2.81 |
| Single Male/Father | 104 (2.4%) | 3.25 |
| Single Female/Mother | 530 (12.3%) | 2.65 |
| Non-family | 1,336 (30.9%) | 1.18 |
| Total Households | 4,321 (100.0%) | 2.30 |
Household Size by Marriage Status in Clinton
Out of a total of 4,321 households in Clinton, 2,985 (69.1%) are family households, while 1,336 (30.9%) are nonfamily households. The most numerous type of family households are 2-person households, comprising 1,723, and the most common type of nonfamily households are 1-person households, comprising 1,166.
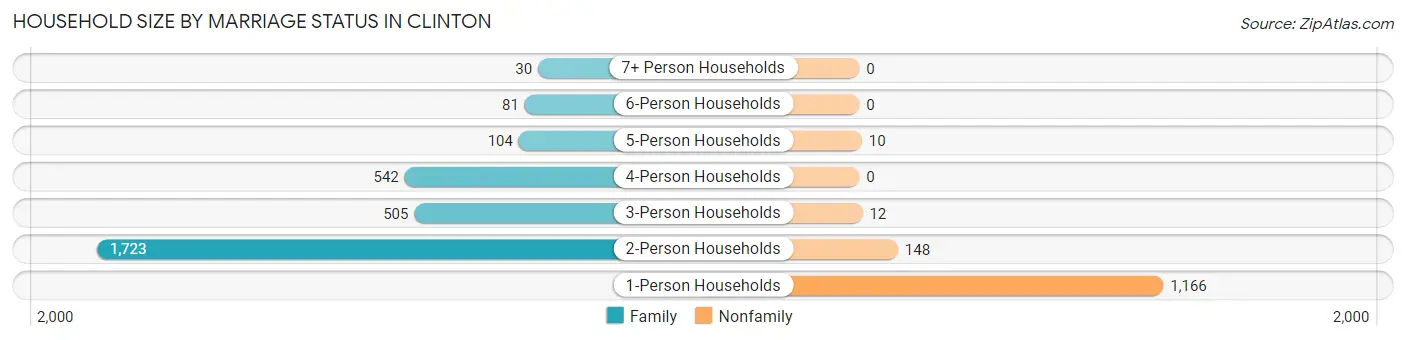
| Household Size | Family Households | Nonfamily Households |
| 1-Person Households | - | 1,166 (27.0%) |
| 2-Person Households | 1,723 (39.9%) | 148 (3.4%) |
| 3-Person Households | 505 (11.7%) | 12 (0.3%) |
| 4-Person Households | 542 (12.5%) | 0 (0.0%) |
| 5-Person Households | 104 (2.4%) | 10 (0.2%) |
| 6-Person Households | 81 (1.9%) | 0 (0.0%) |
| 7+ Person Households | 30 (0.7%) | 0 (0.0%) |
| Total | 2,985 (69.1%) | 1,336 (30.9%) |
Female Fertility in Clinton
Fertility by Age in Clinton
Average fertility rate in Clinton is 59.0 births per 1,000 women. Women in the age bracket of 20 to 34 years have the highest fertility rate with 117.0 births per 1,000 women. Women in the age bracket of 20 to 34 years acount for 92.0% of all women with births.
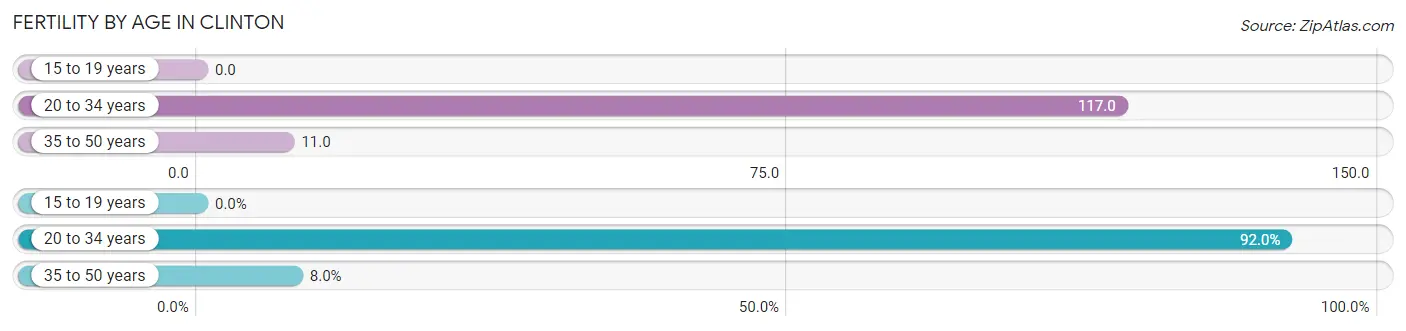
| Age Bracket | Women with Births | Births / 1,000 Women |
| 15 to 19 years | 0 (0.0%) | 0.0 |
| 20 to 34 years | 103 (92.0%) | 117.0 |
| 35 to 50 years | 9 (8.0%) | 11.0 |
| Total | 112 (100.0%) | 59.0 |
Fertility by Age by Marriage Status in Clinton
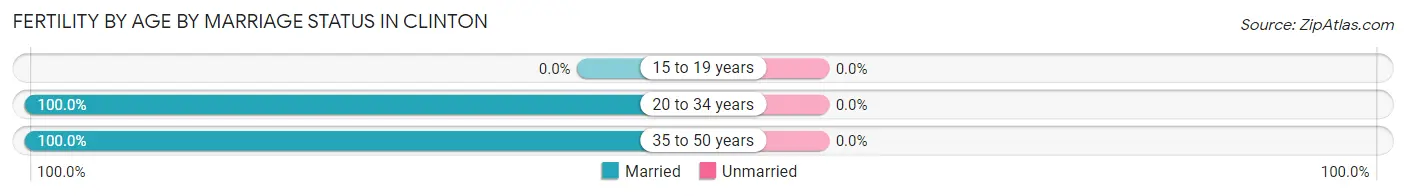
| Age Bracket | Married | Unmarried |
| 15 to 19 years | 0 (0.0%) | 0 (0.0%) |
| 20 to 34 years | 103 (100.0%) | 0 (0.0%) |
| 35 to 50 years | 9 (100.0%) | 0 (0.0%) |
| Total | 112 (100.0%) | 0 (0.0%) |
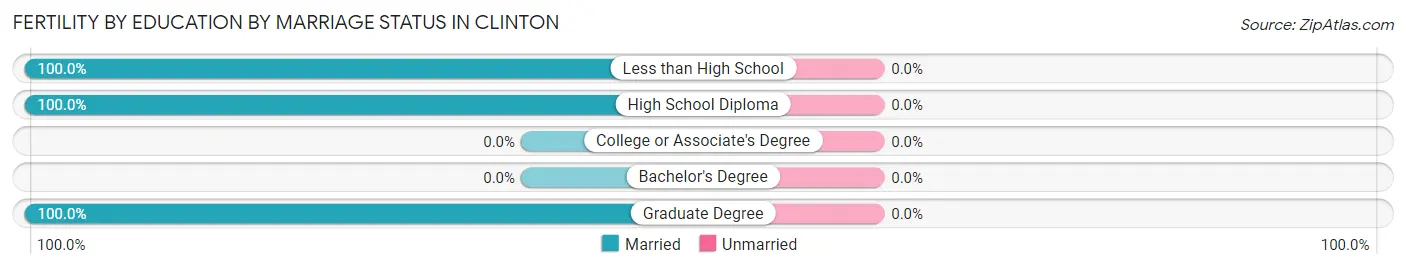
Fertility by Education in Clinton
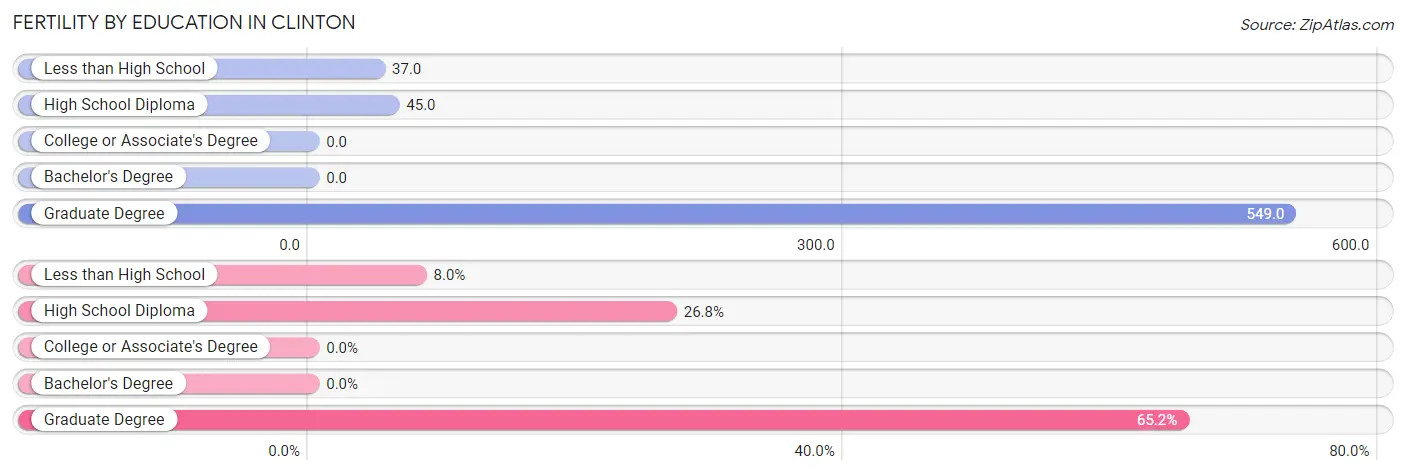
| Educational Attainment | Women with Births | Births / 1,000 Women |
| Less than High School | 9 (8.0%) | 37.0 |
| High School Diploma | 30 (26.8%) | 45.0 |
| College or Associate's Degree | 0 (0.0%) | 0.0 |
| Bachelor's Degree | 0 (0.0%) | 0.0 |
| Graduate Degree | 73 (65.2%) | 549.0 |
| Total | 112 (100.0%) | 59.0 |
Fertility by Education by Marriage Status in Clinton
| Educational Attainment | Married | Unmarried |
| Less than High School | 9 (100.0%) | 0 (0.0%) |
| High School Diploma | 30 (100.0%) | 0 (0.0%) |
| College or Associate's Degree | 0 (0.0%) | 0 (0.0%) |
| Bachelor's Degree | 0 (0.0%) | 0 (0.0%) |
| Graduate Degree | 73 (100.0%) | 0 (0.0%) |
| Total | 112 (100.0%) | 0 (0.0%) |
Employment Characteristics in Clinton
Employment by Class of Employer in Clinton
Among the 4,509 employed individuals in Clinton, private company employees (3,082 | 68.3%), not-for-profit organizations (531 | 11.8%), and self-employed (not incorporated) (277 | 6.1%) make up the most common classes of employment.
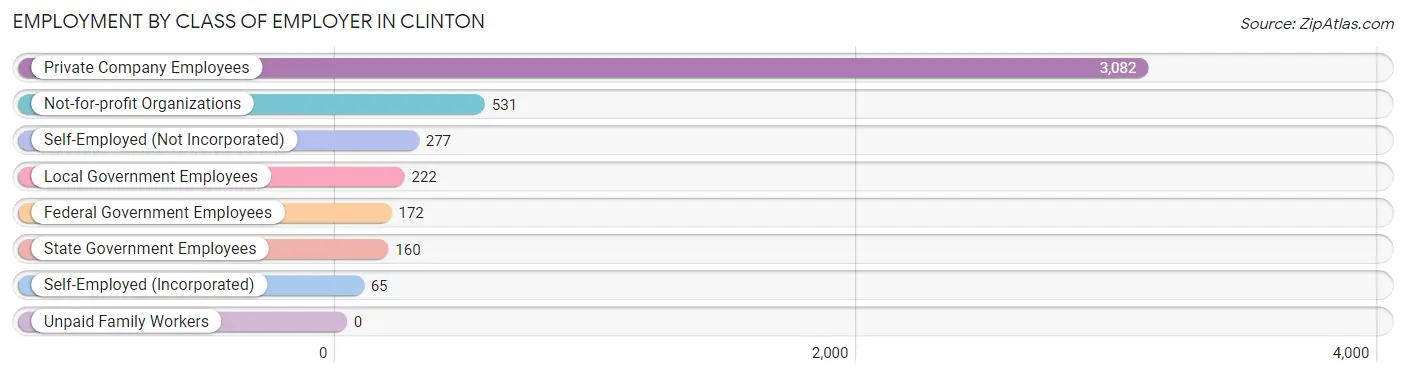
| Employer Class | # Employees | % Employees |
| Private Company Employees | 3,082 | 68.3% |
| Self-Employed (Incorporated) | 65 | 1.4% |
| Self-Employed (Not Incorporated) | 277 | 6.1% |
| Not-for-profit Organizations | 531 | 11.8% |
| Local Government Employees | 222 | 4.9% |
| State Government Employees | 160 | 3.5% |
| Federal Government Employees | 172 | 3.8% |
| Unpaid Family Workers | 0 | 0.0% |
| Total | 4,509 | 100.0% |
Employment Status by Age in Clinton
According to the labor force statistics for Clinton, out of the total population over 16 years of age (8,479), 56.2% or 4,765 individuals are in the labor force, with 3.1% or 148 of them unemployed. The age group with the highest labor force participation rate is 20 to 24 years, with 94.9% or 371 individuals in the labor force. Within the labor force, the 16 to 19 years age range has the highest percentage of unemployed individuals, with 13.0% or 16 of them being unemployed.
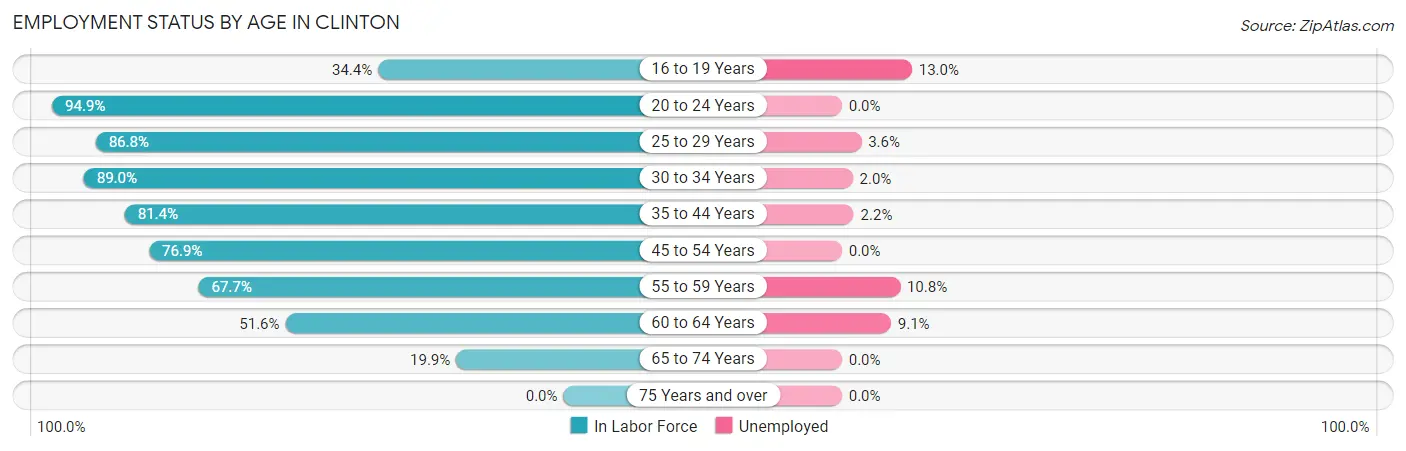
| Age Bracket | In Labor Force | Unemployed |
| 16 to 19 Years | 123 (34.4%) | 16 (13.0%) |
| 20 to 24 Years | 371 (94.9%) | 0 (0.0%) |
| 25 to 29 Years | 439 (86.8%) | 16 (3.6%) |
| 30 to 34 Years | 811 (89.0%) | 16 (2.0%) |
| 35 to 44 Years | 912 (81.4%) | 20 (2.2%) |
| 45 to 54 Years | 964 (76.9%) | 0 (0.0%) |
| 55 to 59 Years | 390 (67.7%) | 42 (10.8%) |
| 60 to 64 Years | 429 (51.6%) | 39 (9.1%) |
| 65 to 74 Years | 326 (19.9%) | 0 (0.0%) |
| 75 Years and over | 0 (0.0%) | 0 (0.0%) |
| Total | 4,765 (56.2%) | 148 (3.1%) |
Employment Status by Educational Attainment in Clinton
According to labor force statistics for Clinton, 75.9% of individuals (3,945) out of the total population between 25 and 64 years of age (5,198) are in the labor force, with 3.4% or 134 of them being unemployed. The group with the highest labor force participation rate are those with the educational attainment of bachelor's degree or higher, with 85.9% or 828 individuals in the labor force. Within the labor force, individuals with college / associate degree education have the highest percentage of unemployment, with 5.6% or 83 of them being unemployed.
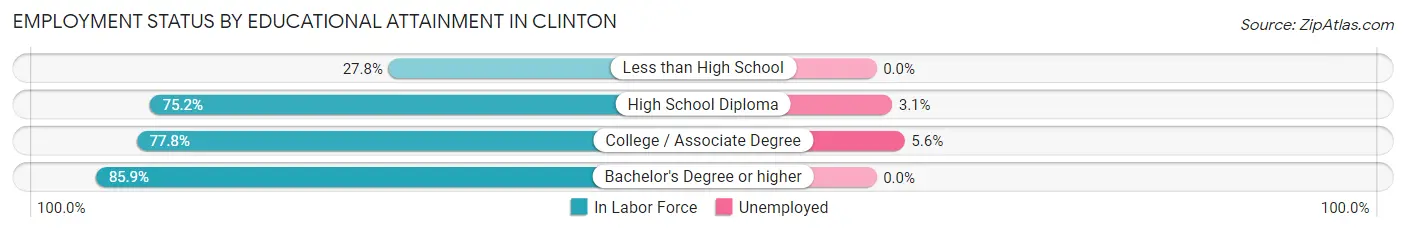
| Educational Attainment | In Labor Force | Unemployed |
| Less than High School | 69 (27.8%) | 0 (0.0%) |
| High School Diploma | 1,557 (75.2%) | 64 (3.1%) |
| College / Associate Degree | 1,491 (77.8%) | 107 (5.6%) |
| Bachelor's Degree or higher | 828 (85.9%) | 0 (0.0%) |
| Total | 3,945 (75.9%) | 177 (3.4%) |
Employment Occupations by Sex in Clinton
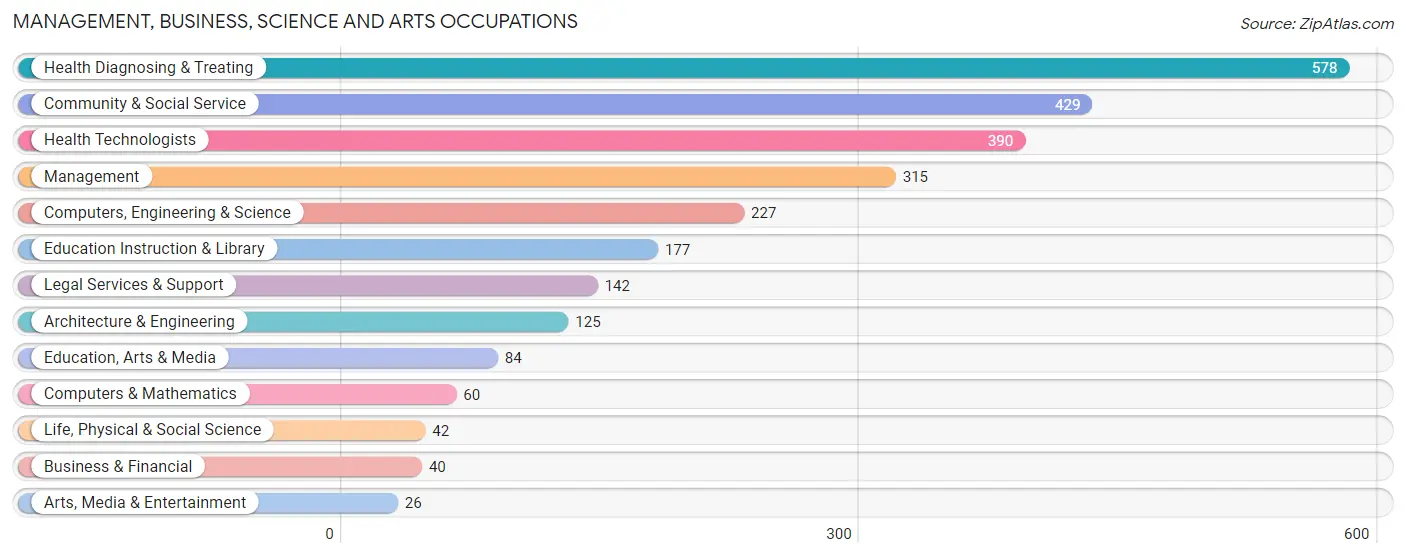
Management, Business, Science and Arts Occupations
The most common Management, Business, Science and Arts occupations in Clinton are Health Diagnosing & Treating (578 | 12.5%), Community & Social Service (429 | 9.3%), Health Technologists (390 | 8.5%), Management (315 | 6.8%), and Computers, Engineering & Science (227 | 4.9%).
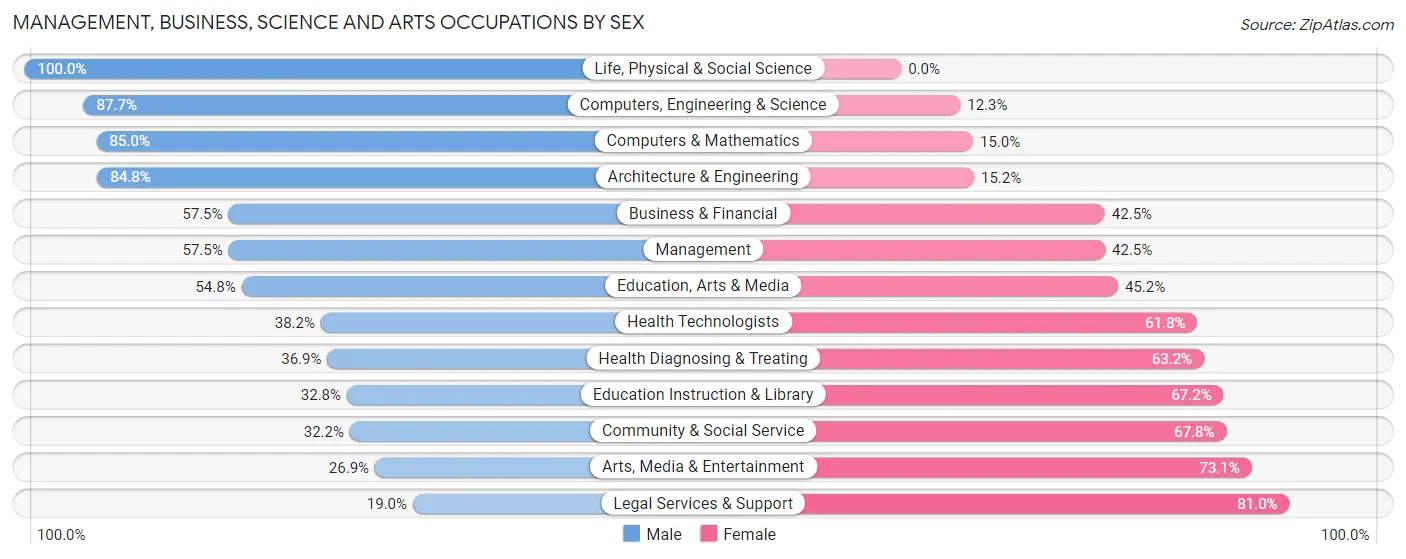
Management, Business, Science and Arts Occupations by Sex
Within the Management, Business, Science and Arts occupations in Clinton, the most male-oriented occupations are Life, Physical & Social Science (100.0%), Computers, Engineering & Science (87.7%), and Computers & Mathematics (85.0%), while the most female-oriented occupations are Legal Services & Support (81.0%), Arts, Media & Entertainment (73.1%), and Community & Social Service (67.8%).
| Occupation | Male | Female |
| Management | 181 (57.5%) | 134 (42.5%) |
| Business & Financial | 23 (57.5%) | 17 (42.5%) |
| Computers, Engineering & Science | 199 (87.7%) | 28 (12.3%) |
| Computers & Mathematics | 51 (85.0%) | 9 (15.0%) |
| Architecture & Engineering | 106 (84.8%) | 19 (15.2%) |
| Life, Physical & Social Science | 42 (100.0%) | 0 (0.0%) |
| Community & Social Service | 138 (32.2%) | 291 (67.8%) |
| Education, Arts & Media | 46 (54.8%) | 38 (45.2%) |
| Legal Services & Support | 27 (19.0%) | 115 (81.0%) |
| Education Instruction & Library | 58 (32.8%) | 119 (67.2%) |
| Arts, Media & Entertainment | 7 (26.9%) | 19 (73.1%) |
| Health Diagnosing & Treating | 213 (36.8%) | 365 (63.1%) |
| Health Technologists | 149 (38.2%) | 241 (61.8%) |
| Total (Category) | 754 (47.4%) | 835 (52.5%) |
| Total (Overall) | 2,538 (55.0%) | 2,078 (45.0%) |
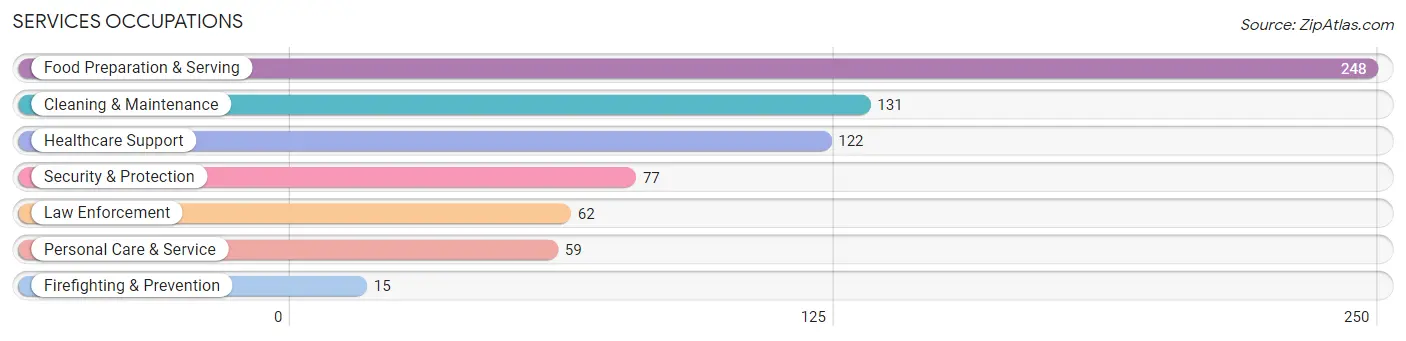
Services Occupations
The most common Services occupations in Clinton are Food Preparation & Serving (248 | 5.4%), Cleaning & Maintenance (131 | 2.8%), Healthcare Support (122 | 2.6%), Security & Protection (77 | 1.7%), and Law Enforcement (62 | 1.3%).
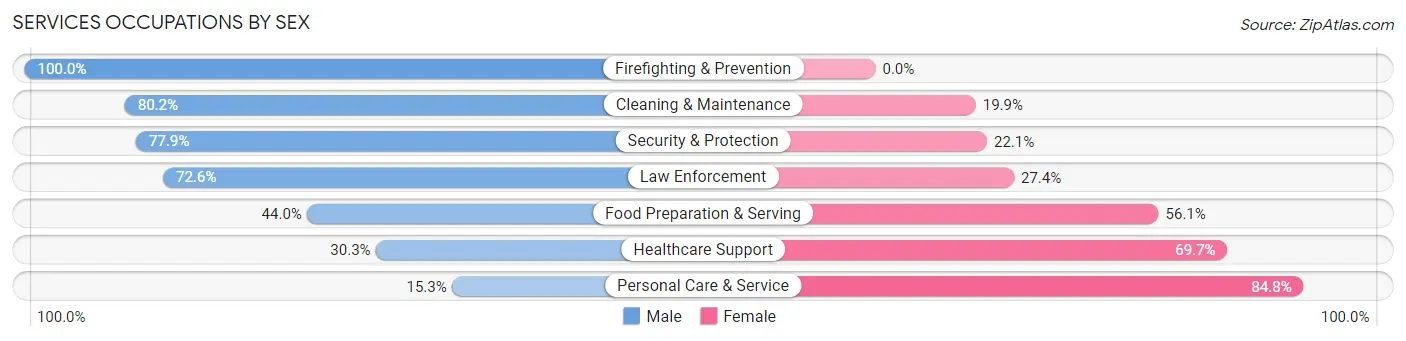
Services Occupations by Sex
Within the Services occupations in Clinton, the most male-oriented occupations are Firefighting & Prevention (100.0%), Cleaning & Maintenance (80.1%), and Security & Protection (77.9%), while the most female-oriented occupations are Personal Care & Service (84.8%), Healthcare Support (69.7%), and Food Preparation & Serving (56.0%).
| Occupation | Male | Female |
| Healthcare Support | 37 (30.3%) | 85 (69.7%) |
| Security & Protection | 60 (77.9%) | 17 (22.1%) |
| Firefighting & Prevention | 15 (100.0%) | 0 (0.0%) |
| Law Enforcement | 45 (72.6%) | 17 (27.4%) |
| Food Preparation & Serving | 109 (44.0%) | 139 (56.0%) |
| Cleaning & Maintenance | 105 (80.1%) | 26 (19.9%) |
| Personal Care & Service | 9 (15.2%) | 50 (84.8%) |
| Total (Category) | 320 (50.2%) | 317 (49.8%) |
| Total (Overall) | 2,538 (55.0%) | 2,078 (45.0%) |
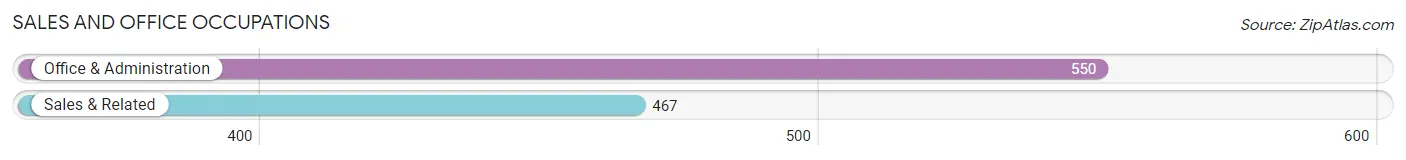
Sales and Office Occupations
The most common Sales and Office occupations in Clinton are Office & Administration (550 | 11.9%), and Sales & Related (467 | 10.1%).
Sales and Office Occupations by Sex
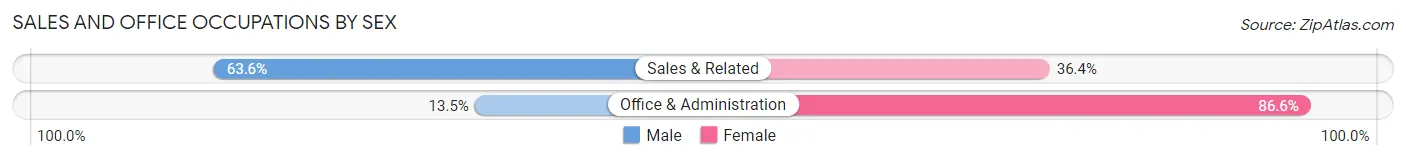
| Occupation | Male | Female |
| Sales & Related | 297 (63.6%) | 170 (36.4%) |
| Office & Administration | 74 (13.5%) | 476 (86.6%) |
| Total (Category) | 371 (36.5%) | 646 (63.5%) |
| Total (Overall) | 2,538 (55.0%) | 2,078 (45.0%) |
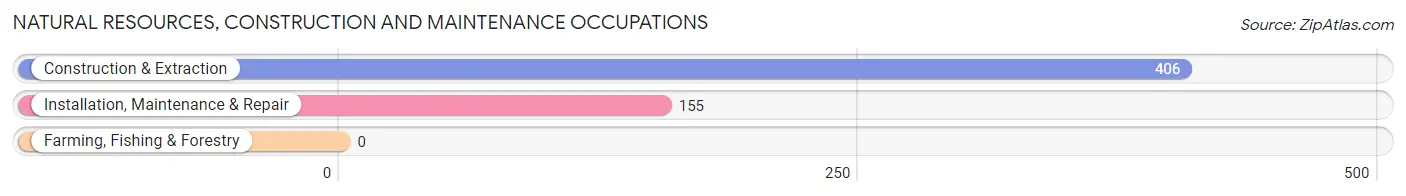
Natural Resources, Construction and Maintenance Occupations
The most common Natural Resources, Construction and Maintenance occupations in Clinton are Construction & Extraction (406 | 8.8%), and Installation, Maintenance & Repair (155 | 3.4%).
Natural Resources, Construction and Maintenance Occupations by Sex
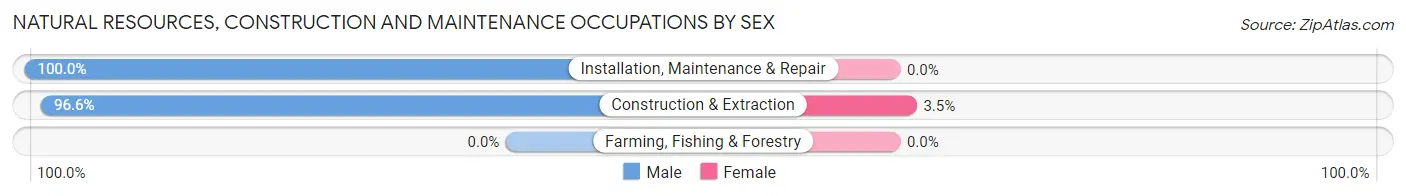
| Occupation | Male | Female |
| Farming, Fishing & Forestry | 0 (0.0%) | 0 (0.0%) |
| Construction & Extraction | 392 (96.6%) | 14 (3.5%) |
| Installation, Maintenance & Repair | 155 (100.0%) | 0 (0.0%) |
| Total (Category) | 547 (97.5%) | 14 (2.5%) |
| Total (Overall) | 2,538 (55.0%) | 2,078 (45.0%) |
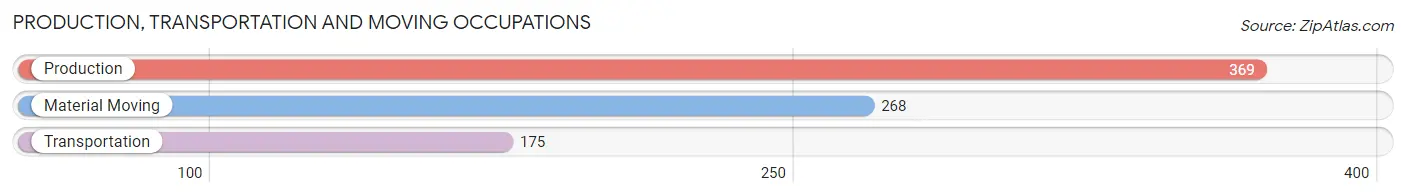
Production, Transportation and Moving Occupations
The most common Production, Transportation and Moving occupations in Clinton are Production (369 | 8.0%), Material Moving (268 | 5.8%), and Transportation (175 | 3.8%).
Production, Transportation and Moving Occupations by Sex
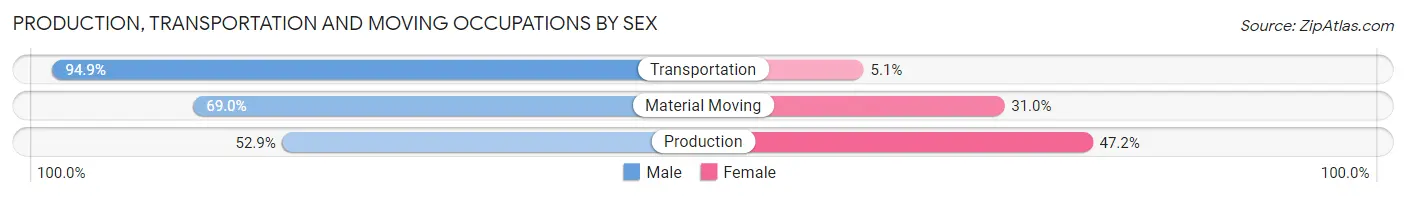
| Occupation | Male | Female |
| Production | 195 (52.8%) | 174 (47.1%) |
| Transportation | 166 (94.9%) | 9 (5.1%) |
| Material Moving | 185 (69.0%) | 83 (31.0%) |
| Total (Category) | 546 (67.2%) | 266 (32.8%) |
| Total (Overall) | 2,538 (55.0%) | 2,078 (45.0%) |
Employment Industries by Sex in Clinton
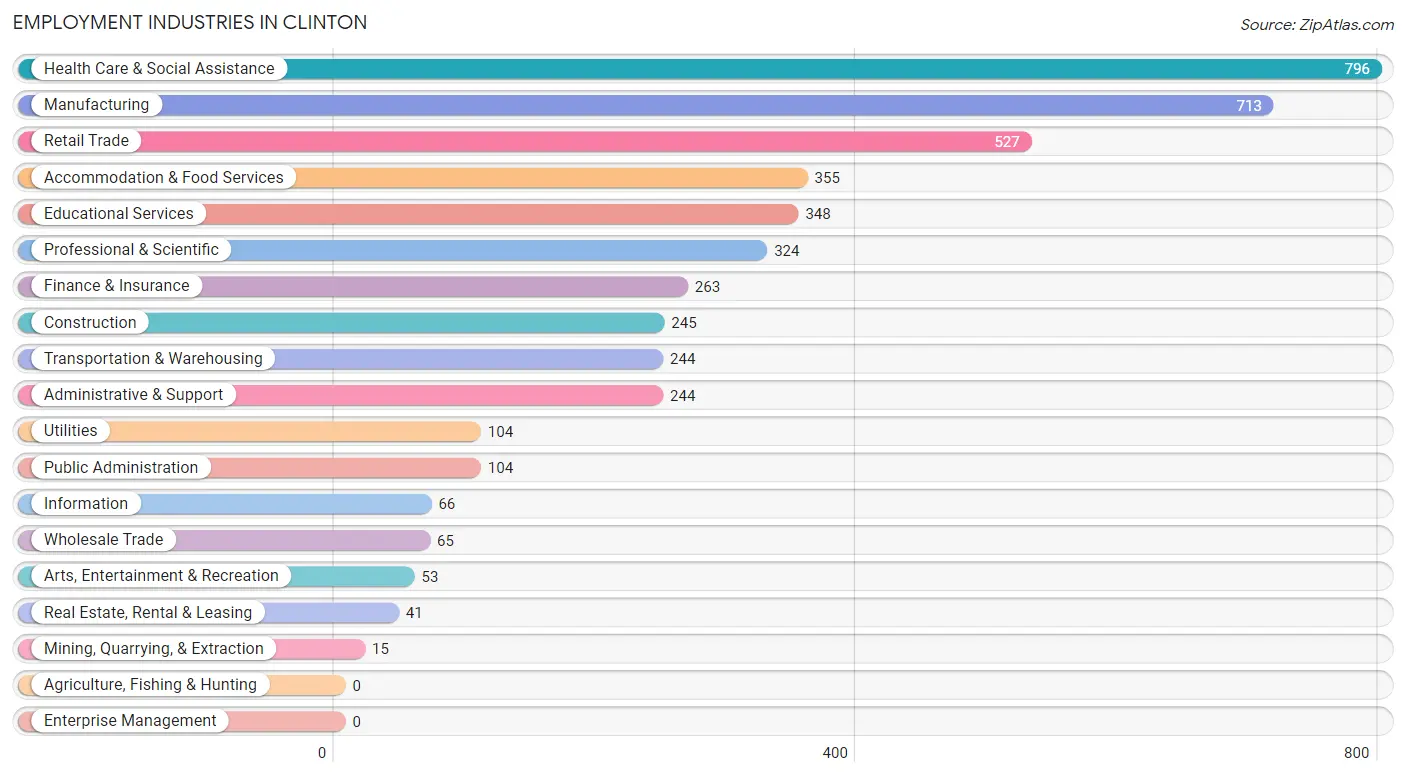
Employment Industries in Clinton
The major employment industries in Clinton include Health Care & Social Assistance (796 | 17.2%), Manufacturing (713 | 15.4%), Retail Trade (527 | 11.4%), Accommodation & Food Services (355 | 7.7%), and Educational Services (348 | 7.5%).
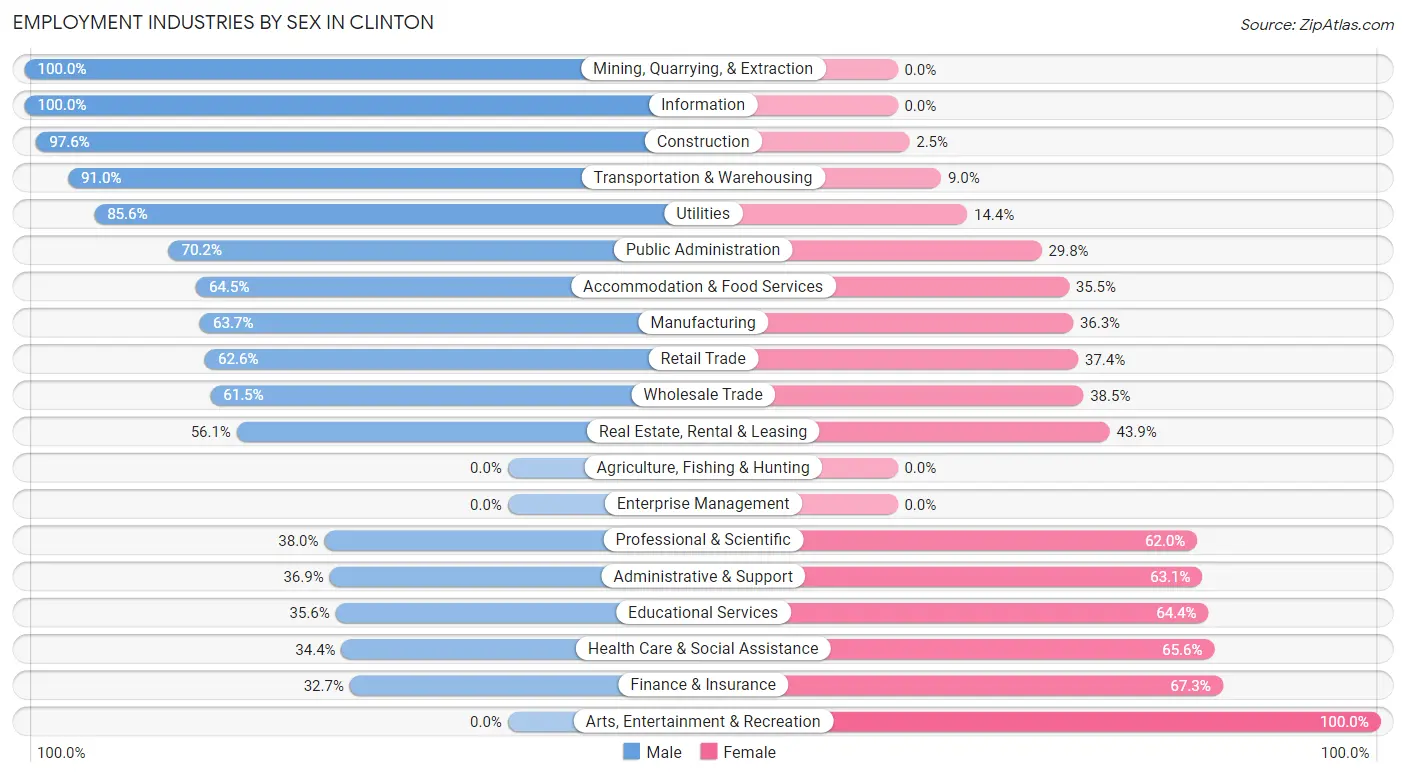
Employment Industries by Sex in Clinton
The Clinton industries that see more men than women are Mining, Quarrying, & Extraction (100.0%), Information (100.0%), and Construction (97.6%), whereas the industries that tend to have a higher number of women are Arts, Entertainment & Recreation (100.0%), Finance & Insurance (67.3%), and Health Care & Social Assistance (65.6%).
| Industry | Male | Female |
| Agriculture, Fishing & Hunting | 0 (0.0%) | 0 (0.0%) |
| Mining, Quarrying, & Extraction | 15 (100.0%) | 0 (0.0%) |
| Construction | 239 (97.6%) | 6 (2.5%) |
| Manufacturing | 454 (63.7%) | 259 (36.3%) |
| Wholesale Trade | 40 (61.5%) | 25 (38.5%) |
| Retail Trade | 330 (62.6%) | 197 (37.4%) |
| Transportation & Warehousing | 222 (91.0%) | 22 (9.0%) |
| Utilities | 89 (85.6%) | 15 (14.4%) |
| Information | 66 (100.0%) | 0 (0.0%) |
| Finance & Insurance | 86 (32.7%) | 177 (67.3%) |
| Real Estate, Rental & Leasing | 23 (56.1%) | 18 (43.9%) |
| Professional & Scientific | 123 (38.0%) | 201 (62.0%) |
| Enterprise Management | 0 (0.0%) | 0 (0.0%) |
| Administrative & Support | 90 (36.9%) | 154 (63.1%) |
| Educational Services | 124 (35.6%) | 224 (64.4%) |
| Health Care & Social Assistance | 274 (34.4%) | 522 (65.6%) |
| Arts, Entertainment & Recreation | 0 (0.0%) | 53 (100.0%) |
| Accommodation & Food Services | 229 (64.5%) | 126 (35.5%) |
| Public Administration | 73 (70.2%) | 31 (29.8%) |
| Total | 2,538 (55.0%) | 2,078 (45.0%) |
Education in Clinton
School Enrollment in Clinton
The most common levels of schooling among the 1,793 students in Clinton are high school (517 | 28.8%), middle school (414 | 23.1%), and elementary school (355 | 19.8%).
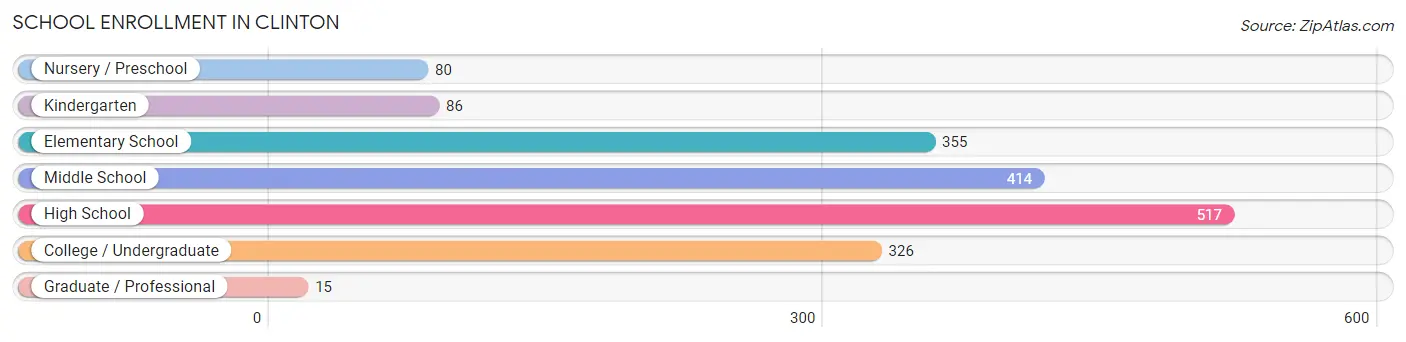
| School Level | # Students | % Students |
| Nursery / Preschool | 80 | 4.5% |
| Kindergarten | 86 | 4.8% |
| Elementary School | 355 | 19.8% |
| Middle School | 414 | 23.1% |
| High School | 517 | 28.8% |
| College / Undergraduate | 326 | 18.2% |
| Graduate / Professional | 15 | 0.8% |
| Total | 1,793 | 100.0% |
School Enrollment by Age by Funding Source in Clinton
Out of a total of 1,793 students who are enrolled in schools in Clinton, 152 (8.5%) attend a private institution, while the remaining 1,641 (91.5%) are enrolled in public schools. The age group of 35 years and over has the highest likelihood of being enrolled in private schools, with 61 (59.2% in the age bracket) enrolled. Conversely, the age group of 3 to 4 year olds has the lowest likelihood of being enrolled in a private school, with 62 (100.0% in the age bracket) attending a public institution.
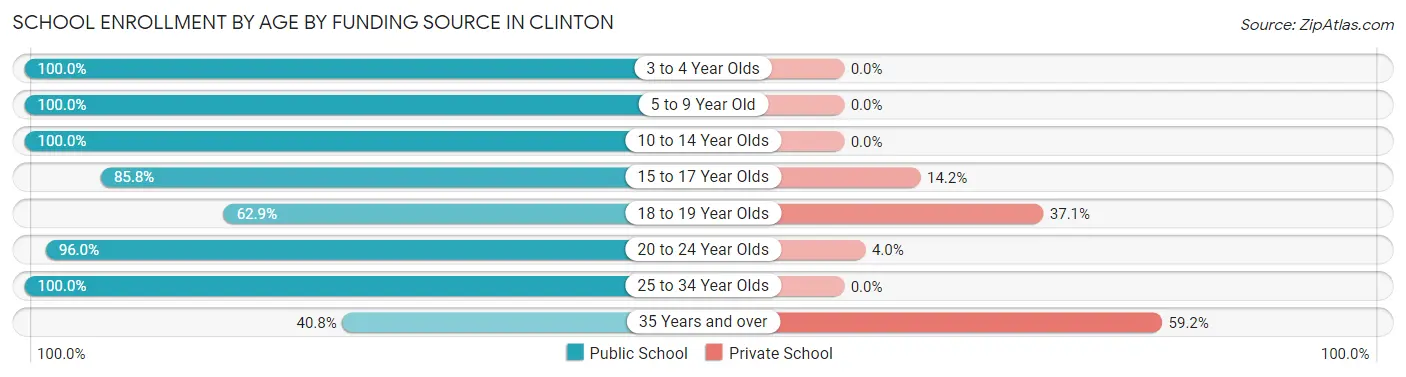
| Age Bracket | Public School | Private School |
| 3 to 4 Year Olds | 62 (100.0%) | 0 (0.0%) |
| 5 to 9 Year Old | 309 (100.0%) | 0 (0.0%) |
| 10 to 14 Year Olds | 640 (100.0%) | 0 (0.0%) |
| 15 to 17 Year Olds | 229 (85.8%) | 38 (14.2%) |
| 18 to 19 Year Olds | 78 (62.9%) | 46 (37.1%) |
| 20 to 24 Year Olds | 194 (96.0%) | 8 (4.0%) |
| 25 to 34 Year Olds | 86 (100.0%) | 0 (0.0%) |
| 35 Years and over | 42 (40.8%) | 61 (59.2%) |
| Total | 1,641 (91.5%) | 152 (8.5%) |
Educational Attainment by Field of Study in Clinton
Business (273 | 17.9%), science & technology (244 | 16.0%), education (223 | 14.6%), engineering (212 | 13.9%), and social sciences (146 | 9.6%) are the most common fields of study among 1,525 individuals in Clinton who have obtained a bachelor's degree or higher.
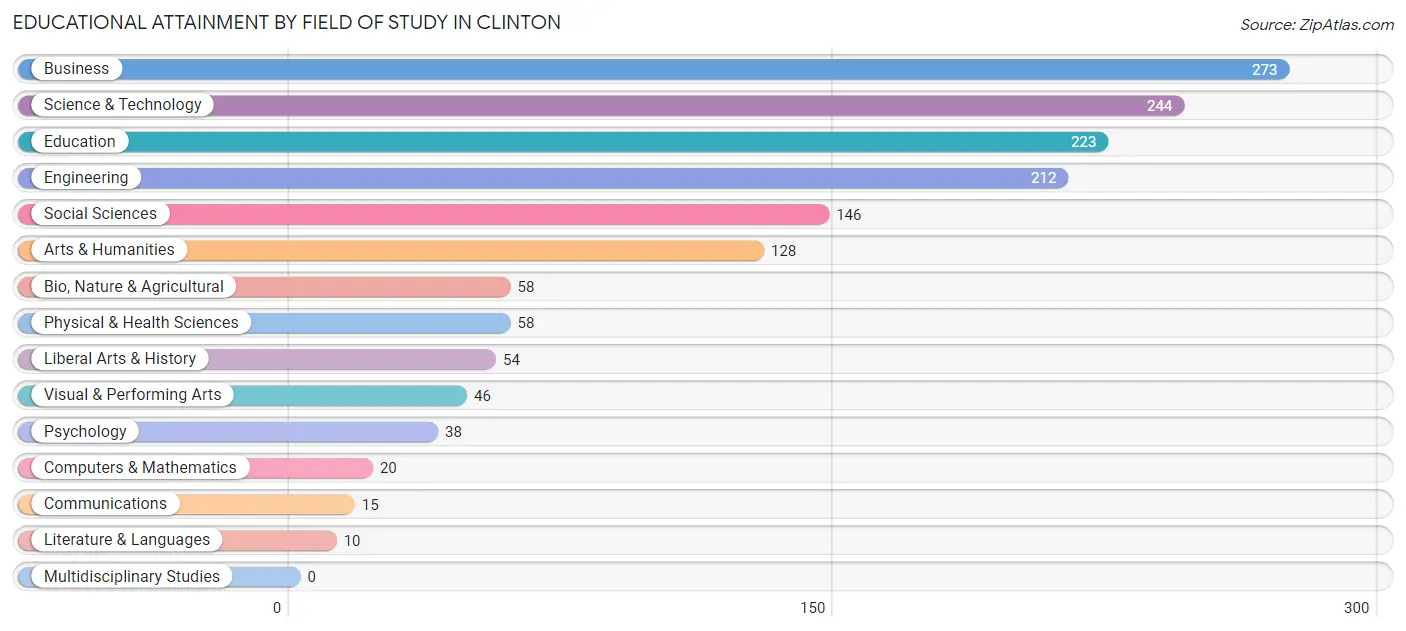
| Field of Study | # Graduates | % Graduates |
| Computers & Mathematics | 20 | 1.3% |
| Bio, Nature & Agricultural | 58 | 3.8% |
| Physical & Health Sciences | 58 | 3.8% |
| Psychology | 38 | 2.5% |
| Social Sciences | 146 | 9.6% |
| Engineering | 212 | 13.9% |
| Multidisciplinary Studies | 0 | 0.0% |
| Science & Technology | 244 | 16.0% |
| Business | 273 | 17.9% |
| Education | 223 | 14.6% |
| Literature & Languages | 10 | 0.7% |
| Liberal Arts & History | 54 | 3.5% |
| Visual & Performing Arts | 46 | 3.0% |
| Communications | 15 | 1.0% |
| Arts & Humanities | 128 | 8.4% |
| Total | 1,525 | 100.0% |
Transportation & Commute in Clinton
Vehicle Availability by Sex in Clinton
The most prevalent vehicle ownership categories in Clinton are males with 2 vehicles (976, accounting for 38.8%) and females with 2 vehicles (903, making up 48.9%).
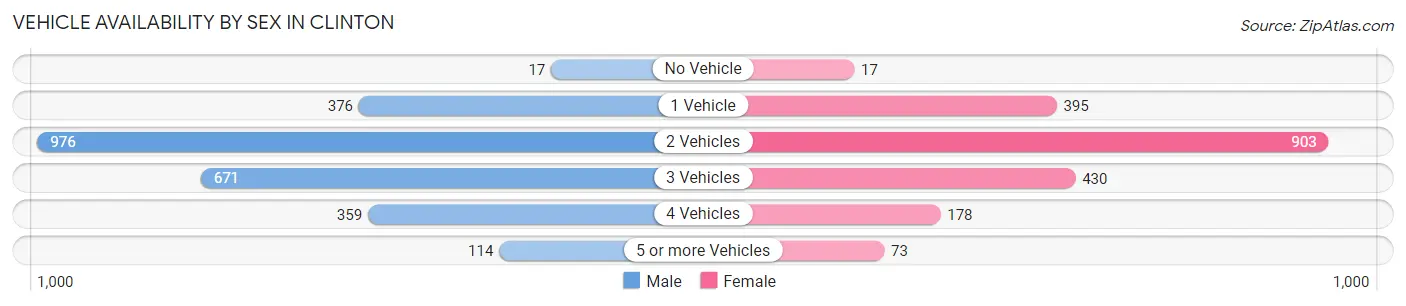
| Vehicles Available | Male | Female |
| No Vehicle | 17 (0.7%) | 17 (0.9%) |
| 1 Vehicle | 376 (15.0%) | 395 (19.8%) |
| 2 Vehicles | 976 (38.8%) | 903 (45.2%) |
| 3 Vehicles | 671 (26.7%) | 430 (21.5%) |
| 4 Vehicles | 359 (14.3%) | 178 (8.9%) |
| 5 or more Vehicles | 114 (4.5%) | 73 (3.7%) |
| Total | 2,513 (100.0%) | 1,996 (100.0%) |
Commute Time in Clinton
The most frequently occuring commute durations in Clinton are 30 to 34 minutes (1,055 commuters, 26.4%), 15 to 19 minutes (627 commuters, 15.7%), and 20 to 24 minutes (510 commuters, 12.7%).
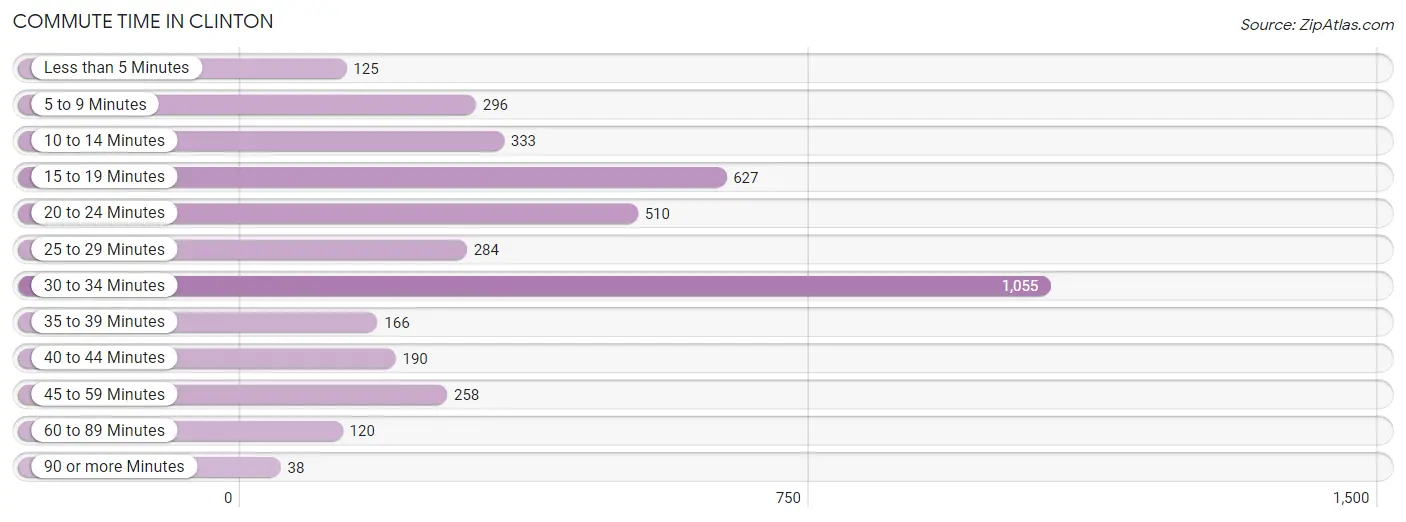
| Commute Time | # Commuters | % Commuters |
| Less than 5 Minutes | 125 | 3.1% |
| 5 to 9 Minutes | 296 | 7.4% |
| 10 to 14 Minutes | 333 | 8.3% |
| 15 to 19 Minutes | 627 | 15.7% |
| 20 to 24 Minutes | 510 | 12.7% |
| 25 to 29 Minutes | 284 | 7.1% |
| 30 to 34 Minutes | 1,055 | 26.4% |
| 35 to 39 Minutes | 166 | 4.2% |
| 40 to 44 Minutes | 190 | 4.8% |
| 45 to 59 Minutes | 258 | 6.5% |
| 60 to 89 Minutes | 120 | 3.0% |
| 90 or more Minutes | 38 | 0.9% |
Commute Time by Sex in Clinton
The most common commute times in Clinton are 30 to 34 minutes (732 commuters, 32.1%) for males and 30 to 34 minutes (323 commuters, 18.8%) for females.
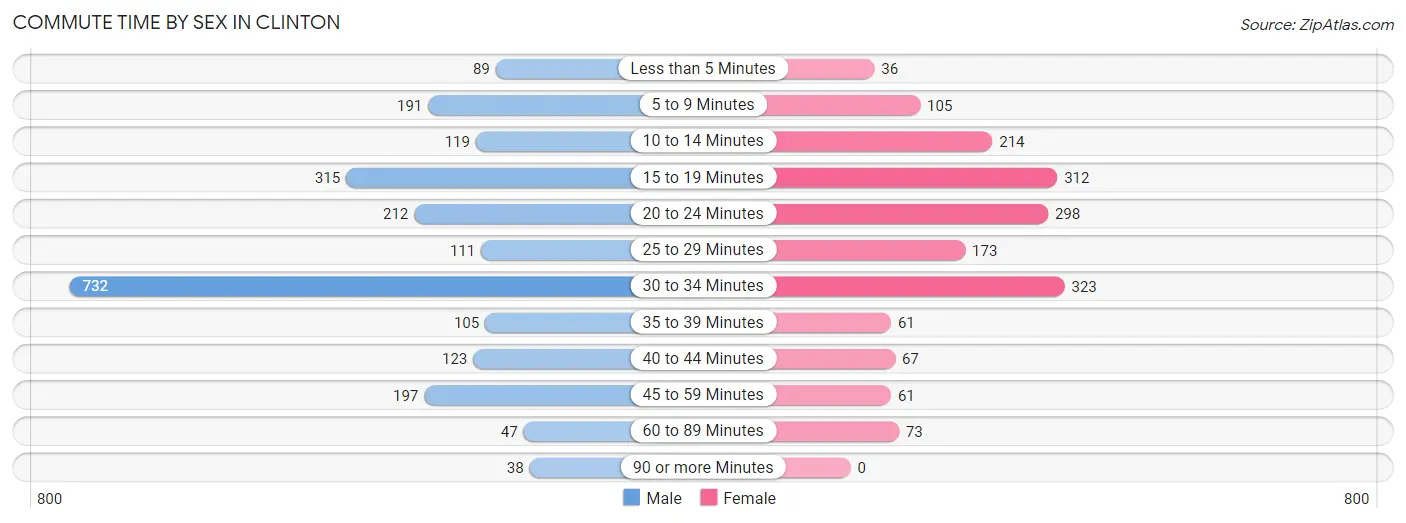
| Commute Time | Male | Female |
| Less than 5 Minutes | 89 (3.9%) | 36 (2.1%) |
| 5 to 9 Minutes | 191 (8.4%) | 105 (6.1%) |
| 10 to 14 Minutes | 119 (5.2%) | 214 (12.4%) |
| 15 to 19 Minutes | 315 (13.8%) | 312 (18.1%) |
| 20 to 24 Minutes | 212 (9.3%) | 298 (17.3%) |
| 25 to 29 Minutes | 111 (4.9%) | 173 (10.0%) |
| 30 to 34 Minutes | 732 (32.1%) | 323 (18.8%) |
| 35 to 39 Minutes | 105 (4.6%) | 61 (3.5%) |
| 40 to 44 Minutes | 123 (5.4%) | 67 (3.9%) |
| 45 to 59 Minutes | 197 (8.6%) | 61 (3.5%) |
| 60 to 89 Minutes | 47 (2.1%) | 73 (4.2%) |
| 90 or more Minutes | 38 (1.7%) | 0 (0.0%) |
Time of Departure to Work by Sex in Clinton
The most frequent times of departure to work in Clinton are 8:00 AM to 8:29 AM (354, 15.5%) for males and 8:30 AM to 8:59 AM (270, 15.7%) for females.
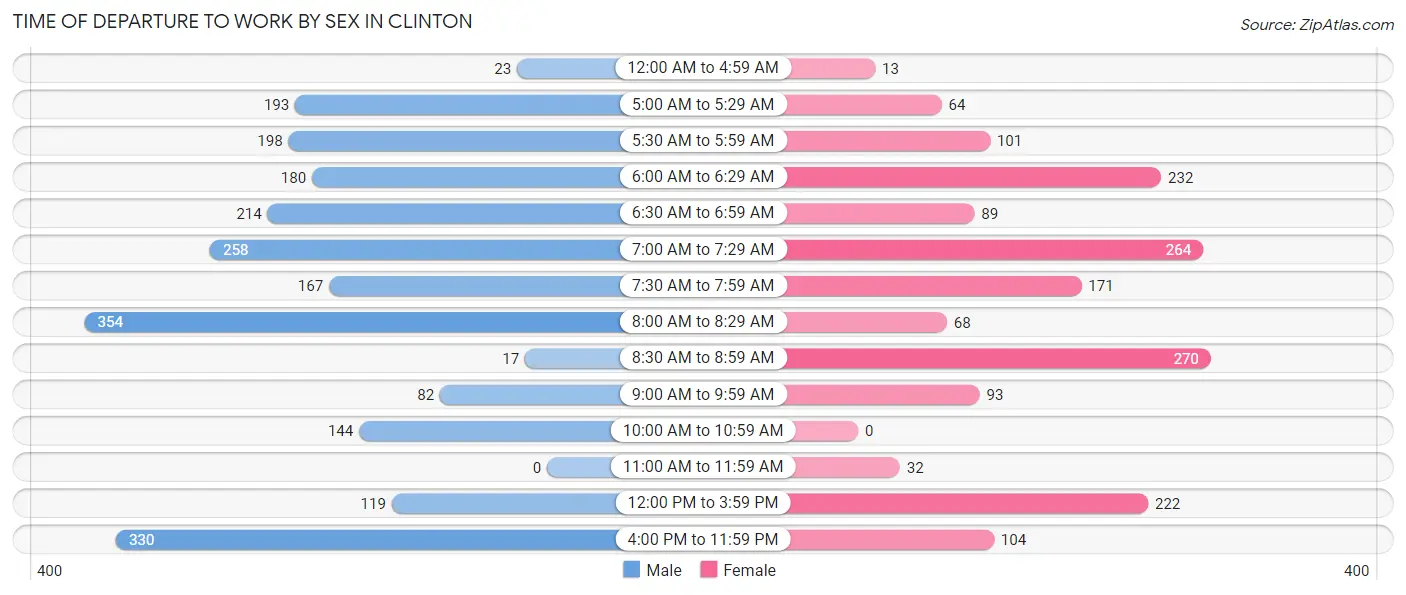
| Time of Departure | Male | Female |
| 12:00 AM to 4:59 AM | 23 (1.0%) | 13 (0.7%) |
| 5:00 AM to 5:29 AM | 193 (8.5%) | 64 (3.7%) |
| 5:30 AM to 5:59 AM | 198 (8.7%) | 101 (5.9%) |
| 6:00 AM to 6:29 AM | 180 (7.9%) | 232 (13.5%) |
| 6:30 AM to 6:59 AM | 214 (9.4%) | 89 (5.2%) |
| 7:00 AM to 7:29 AM | 258 (11.3%) | 264 (15.3%) |
| 7:30 AM to 7:59 AM | 167 (7.3%) | 171 (9.9%) |
| 8:00 AM to 8:29 AM | 354 (15.5%) | 68 (4.0%) |
| 8:30 AM to 8:59 AM | 17 (0.7%) | 270 (15.7%) |
| 9:00 AM to 9:59 AM | 82 (3.6%) | 93 (5.4%) |
| 10:00 AM to 10:59 AM | 144 (6.3%) | 0 (0.0%) |
| 11:00 AM to 11:59 AM | 0 (0.0%) | 32 (1.9%) |
| 12:00 PM to 3:59 PM | 119 (5.2%) | 222 (12.9%) |
| 4:00 PM to 11:59 PM | 330 (14.5%) | 104 (6.0%) |
| Total | 2,279 (100.0%) | 1,723 (100.0%) |
Housing Occupancy in Clinton
Occupancy by Ownership in Clinton
Of the total 4,321 dwellings in Clinton, owner-occupied units account for 2,584 (59.8%), while renter-occupied units make up 1,737 (40.2%).
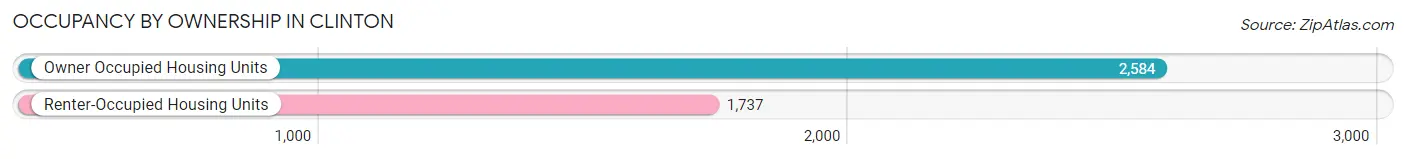
| Occupancy | # Housing Units | % Housing Units |
| Owner Occupied Housing Units | 2,584 | 59.8% |
| Renter-Occupied Housing Units | 1,737 | 40.2% |
| Total Occupied Housing Units | 4,321 | 100.0% |
Occupancy by Household Size in Clinton
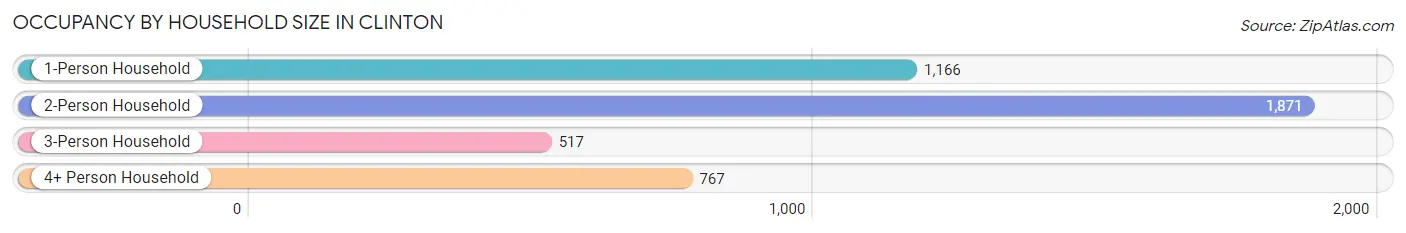
| Household Size | # Housing Units | % Housing Units |
| 1-Person Household | 1,166 | 27.0% |
| 2-Person Household | 1,871 | 43.3% |
| 3-Person Household | 517 | 12.0% |
| 4+ Person Household | 767 | 17.7% |
| Total Housing Units | 4,321 | 100.0% |
Occupancy by Ownership by Household Size in Clinton
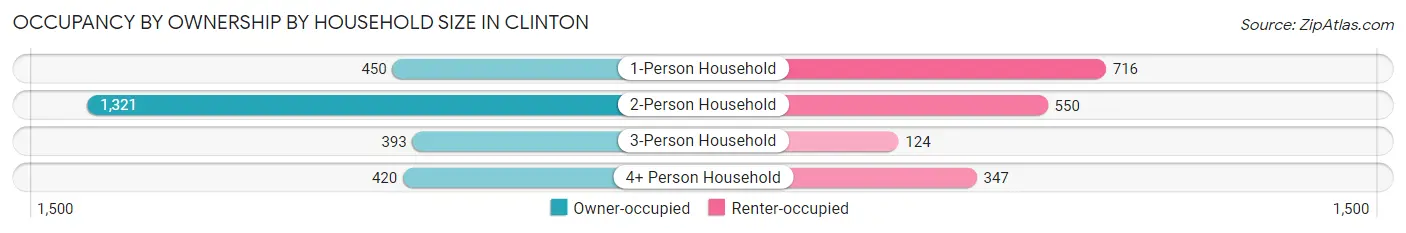
| Household Size | Owner-occupied | Renter-occupied |
| 1-Person Household | 450 (38.6%) | 716 (61.4%) |
| 2-Person Household | 1,321 (70.6%) | 550 (29.4%) |
| 3-Person Household | 393 (76.0%) | 124 (24.0%) |
| 4+ Person Household | 420 (54.8%) | 347 (45.2%) |
| Total Housing Units | 2,584 (59.8%) | 1,737 (40.2%) |
Occupancy by Educational Attainment in Clinton
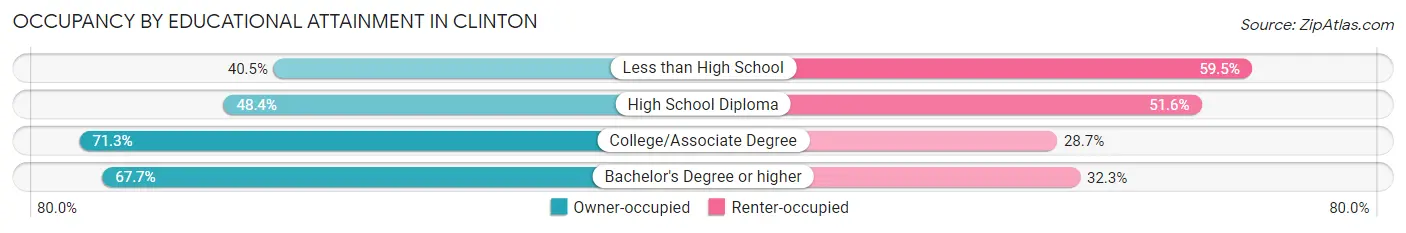
| Household Size | Owner-occupied | Renter-occupied |
| Less than High School | 102 (40.5%) | 150 (59.5%) |
| High School Diploma | 819 (48.4%) | 872 (51.6%) |
| College/Associate Degree | 1,052 (71.3%) | 423 (28.7%) |
| Bachelor's Degree or higher | 611 (67.7%) | 292 (32.3%) |
Occupancy by Age of Householder in Clinton
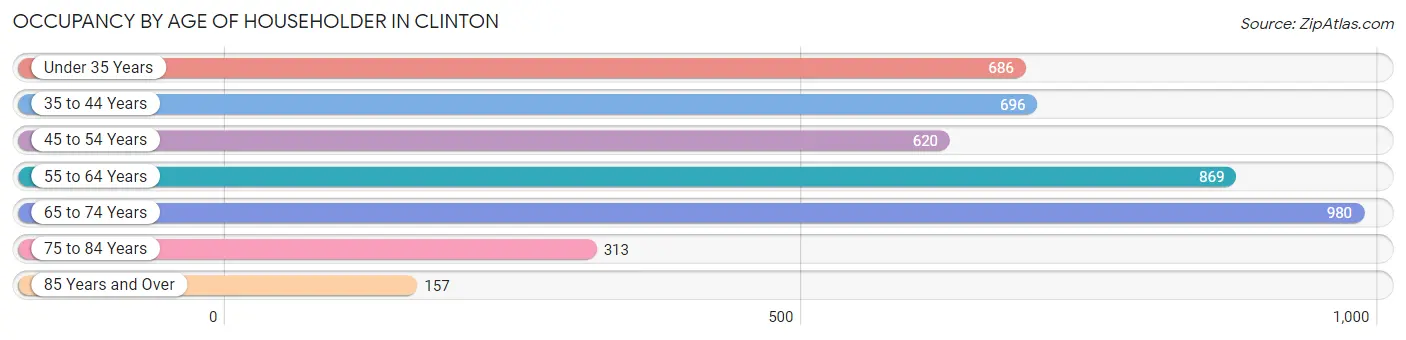
| Age Bracket | # Households | % Households |
| Under 35 Years | 686 | 15.9% |
| 35 to 44 Years | 696 | 16.1% |
| 45 to 54 Years | 620 | 14.3% |
| 55 to 64 Years | 869 | 20.1% |
| 65 to 74 Years | 980 | 22.7% |
| 75 to 84 Years | 313 | 7.2% |
| 85 Years and Over | 157 | 3.6% |
| Total | 4,321 | 100.0% |
Housing Finances in Clinton
Median Income by Occupancy in Clinton
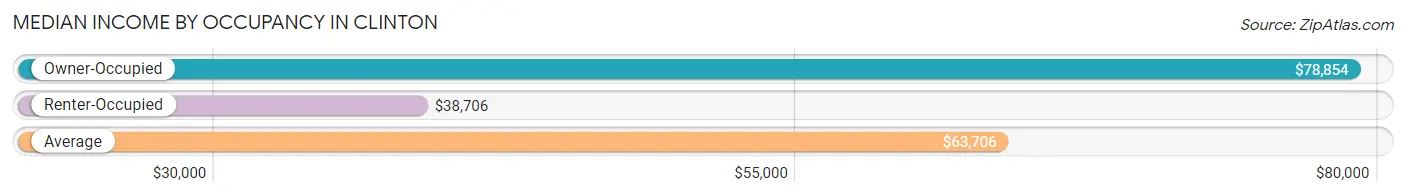
| Occupancy Type | # Households | Median Income |
| Owner-Occupied | 2,584 (59.8%) | $78,854 |
| Renter-Occupied | 1,737 (40.2%) | $38,706 |
| Average | 4,321 (100.0%) | $63,706 |
Occupancy by Householder Income Bracket in Clinton
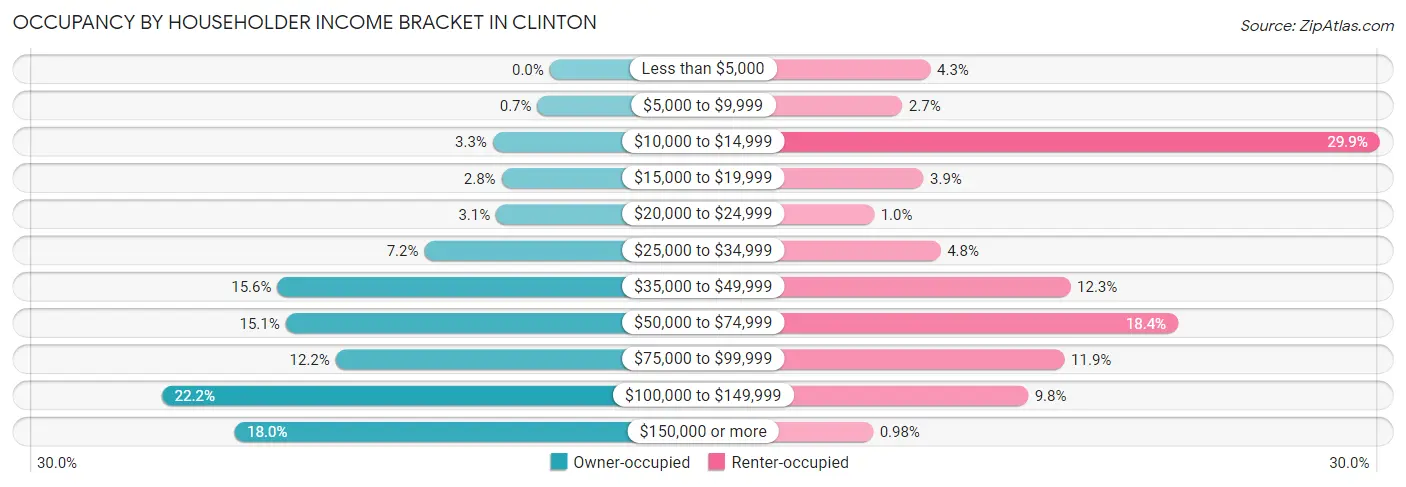
| Income Bracket | Owner-occupied | Renter-occupied |
| Less than $5,000 | 0 (0.0%) | 74 (4.3%) |
| $5,000 to $9,999 | 18 (0.7%) | 46 (2.6%) |
| $10,000 to $14,999 | 84 (3.3%) | 520 (29.9%) |
| $15,000 to $19,999 | 71 (2.8%) | 67 (3.9%) |
| $20,000 to $24,999 | 79 (3.1%) | 18 (1.0%) |
| $25,000 to $34,999 | 185 (7.2%) | 84 (4.8%) |
| $35,000 to $49,999 | 402 (15.6%) | 213 (12.3%) |
| $50,000 to $74,999 | 390 (15.1%) | 320 (18.4%) |
| $75,000 to $99,999 | 316 (12.2%) | 207 (11.9%) |
| $100,000 to $149,999 | 573 (22.2%) | 171 (9.8%) |
| $150,000 or more | 466 (18.0%) | 17 (1.0%) |
| Total | 2,584 (100.0%) | 1,737 (100.0%) |
Monthly Housing Cost Tiers in Clinton
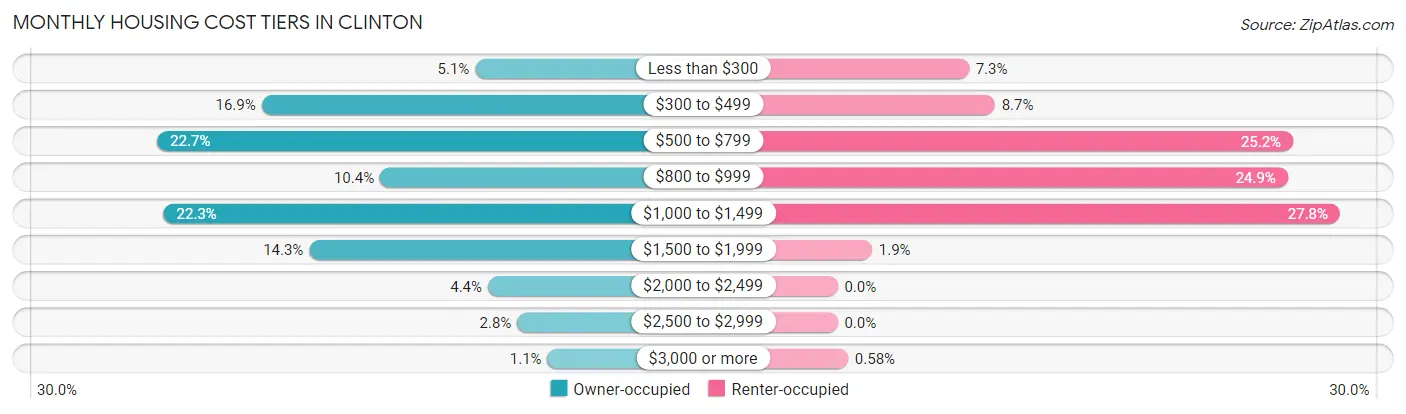
| Monthly Cost | Owner-occupied | Renter-occupied |
| Less than $300 | 132 (5.1%) | 126 (7.2%) |
| $300 to $499 | 437 (16.9%) | 151 (8.7%) |
| $500 to $799 | 586 (22.7%) | 437 (25.2%) |
| $800 to $999 | 268 (10.4%) | 432 (24.9%) |
| $1,000 to $1,499 | 577 (22.3%) | 482 (27.8%) |
| $1,500 to $1,999 | 369 (14.3%) | 33 (1.9%) |
| $2,000 to $2,499 | 114 (4.4%) | 0 (0.0%) |
| $2,500 to $2,999 | 72 (2.8%) | 0 (0.0%) |
| $3,000 or more | 29 (1.1%) | 10 (0.6%) |
| Total | 2,584 (100.0%) | 1,737 (100.0%) |
Physical Housing Characteristics in Clinton
Housing Structures in Clinton
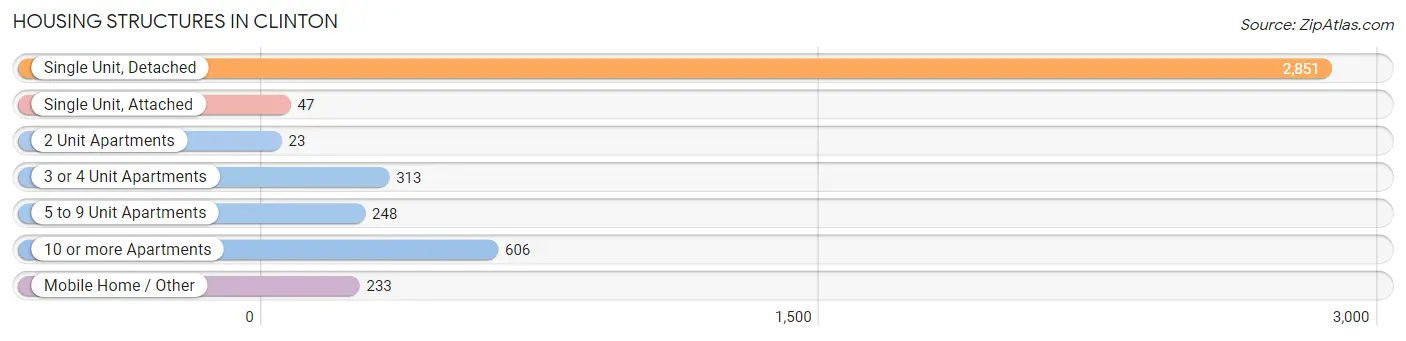
| Structure Type | # Housing Units | % Housing Units |
| Single Unit, Detached | 2,851 | 66.0% |
| Single Unit, Attached | 47 | 1.1% |
| 2 Unit Apartments | 23 | 0.5% |
| 3 or 4 Unit Apartments | 313 | 7.2% |
| 5 to 9 Unit Apartments | 248 | 5.7% |
| 10 or more Apartments | 606 | 14.0% |
| Mobile Home / Other | 233 | 5.4% |
| Total | 4,321 | 100.0% |
Housing Structures by Occupancy in Clinton
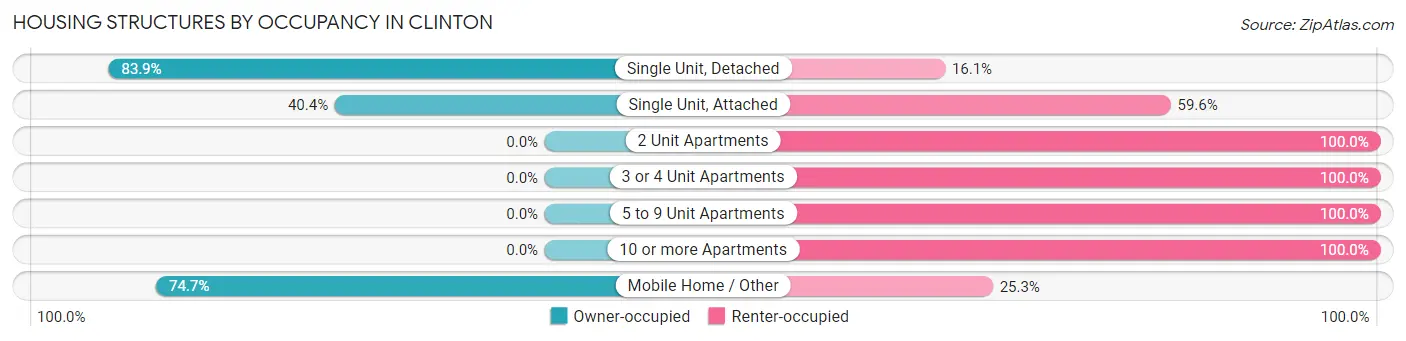
| Structure Type | Owner-occupied | Renter-occupied |
| Single Unit, Detached | 2,391 (83.9%) | 460 (16.1%) |
| Single Unit, Attached | 19 (40.4%) | 28 (59.6%) |
| 2 Unit Apartments | 0 (0.0%) | 23 (100.0%) |
| 3 or 4 Unit Apartments | 0 (0.0%) | 313 (100.0%) |
| 5 to 9 Unit Apartments | 0 (0.0%) | 248 (100.0%) |
| 10 or more Apartments | 0 (0.0%) | 606 (100.0%) |
| Mobile Home / Other | 174 (74.7%) | 59 (25.3%) |
| Total | 2,584 (59.8%) | 1,737 (40.2%) |
Housing Structures by Number of Rooms in Clinton
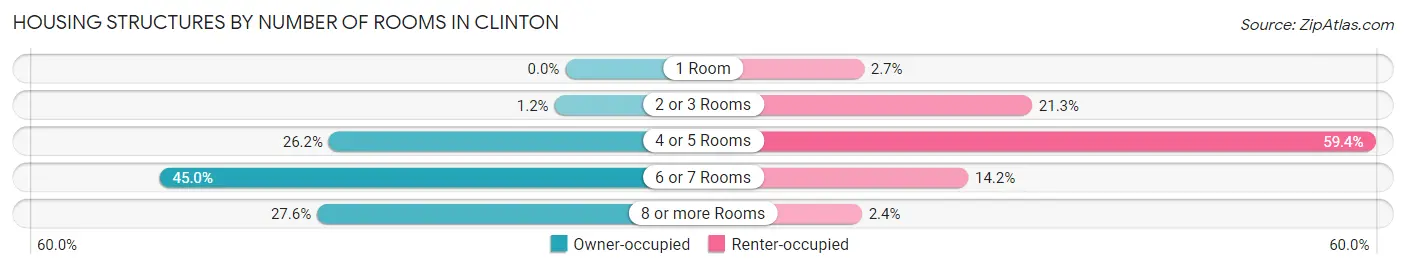
| Number of Rooms | Owner-occupied | Renter-occupied |
| 1 Room | 0 (0.0%) | 46 (2.6%) |
| 2 or 3 Rooms | 31 (1.2%) | 370 (21.3%) |
| 4 or 5 Rooms | 678 (26.2%) | 1,032 (59.4%) |
| 6 or 7 Rooms | 1,163 (45.0%) | 247 (14.2%) |
| 8 or more Rooms | 712 (27.6%) | 42 (2.4%) |
| Total | 2,584 (100.0%) | 1,737 (100.0%) |
Housing Structure by Heating Type in Clinton
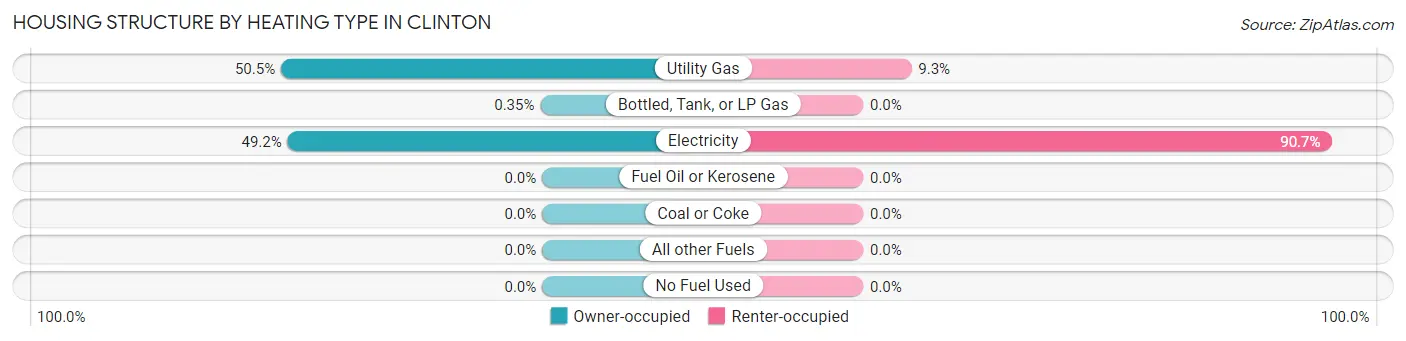
| Heating Type | Owner-occupied | Renter-occupied |
| Utility Gas | 1,304 (50.5%) | 162 (9.3%) |
| Bottled, Tank, or LP Gas | 9 (0.4%) | 0 (0.0%) |
| Electricity | 1,271 (49.2%) | 1,575 (90.7%) |
| Fuel Oil or Kerosene | 0 (0.0%) | 0 (0.0%) |
| Coal or Coke | 0 (0.0%) | 0 (0.0%) |
| All other Fuels | 0 (0.0%) | 0 (0.0%) |
| No Fuel Used | 0 (0.0%) | 0 (0.0%) |
| Total | 2,584 (100.0%) | 1,737 (100.0%) |
Household Vehicle Usage in Clinton
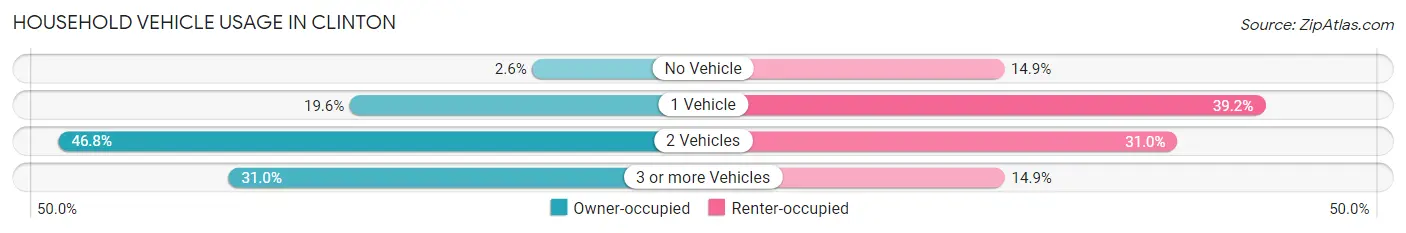
| Vehicles per Household | Owner-occupied | Renter-occupied |
| No Vehicle | 67 (2.6%) | 258 (14.8%) |
| 1 Vehicle | 507 (19.6%) | 681 (39.2%) |
| 2 Vehicles | 1,210 (46.8%) | 539 (31.0%) |
| 3 or more Vehicles | 800 (31.0%) | 259 (14.9%) |
| Total | 2,584 (100.0%) | 1,737 (100.0%) |
Real Estate & Mortgages in Clinton
Real Estate and Mortgage Overview in Clinton
| Characteristic | Without Mortgage | With Mortgage |
| Housing Units | 1,151 | 1,433 |
| Median Property Value | $185,300 | $222,400 |
| Median Household Income | $51,563 | $329 |
| Monthly Housing Costs | $503 | $29 |
| Real Estate Taxes | $1,216 | $71 |
Property Value by Mortgage Status in Clinton
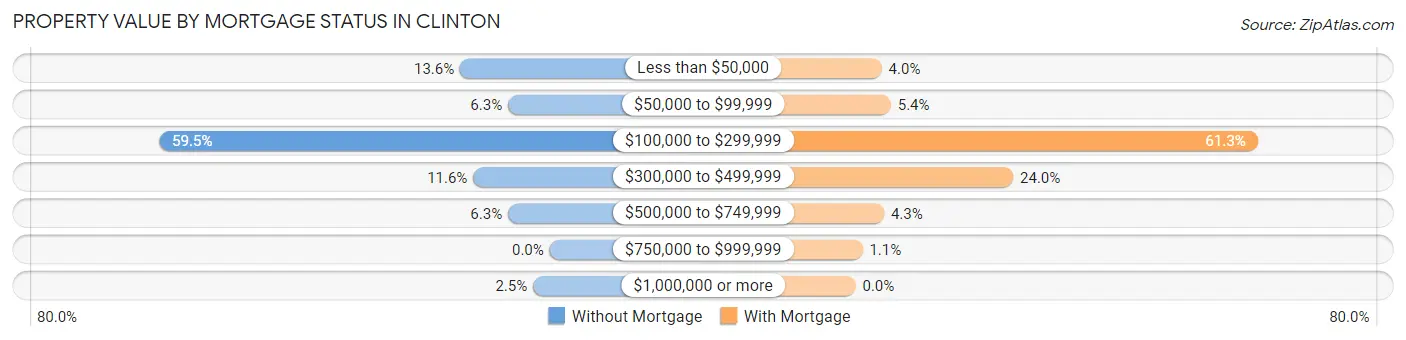
| Property Value | Without Mortgage | With Mortgage |
| Less than $50,000 | 157 (13.6%) | 57 (4.0%) |
| $50,000 to $99,999 | 73 (6.3%) | 77 (5.4%) |
| $100,000 to $299,999 | 685 (59.5%) | 878 (61.3%) |
| $300,000 to $499,999 | 134 (11.6%) | 344 (24.0%) |
| $500,000 to $749,999 | 73 (6.3%) | 62 (4.3%) |
| $750,000 to $999,999 | 0 (0.0%) | 15 (1.1%) |
| $1,000,000 or more | 29 (2.5%) | 0 (0.0%) |
| Total | 1,151 (100.0%) | 1,433 (100.0%) |
Household Income by Mortgage Status in Clinton
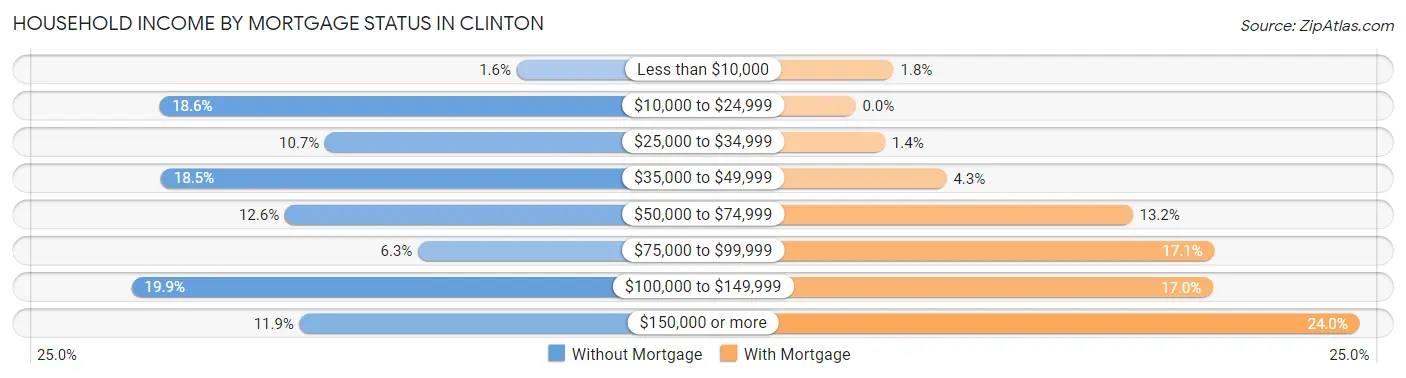
| Household Income | Without Mortgage | With Mortgage |
| Less than $10,000 | 18 (1.6%) | 26 (1.8%) |
| $10,000 to $24,999 | 214 (18.6%) | 0 (0.0%) |
| $25,000 to $34,999 | 123 (10.7%) | 20 (1.4%) |
| $35,000 to $49,999 | 213 (18.5%) | 62 (4.3%) |
| $50,000 to $74,999 | 145 (12.6%) | 189 (13.2%) |
| $75,000 to $99,999 | 72 (6.3%) | 245 (17.1%) |
| $100,000 to $149,999 | 229 (19.9%) | 244 (17.0%) |
| $150,000 or more | 137 (11.9%) | 344 (24.0%) |
| Total | 1,151 (100.0%) | 1,433 (100.0%) |
Property Value to Household Income Ratio in Clinton
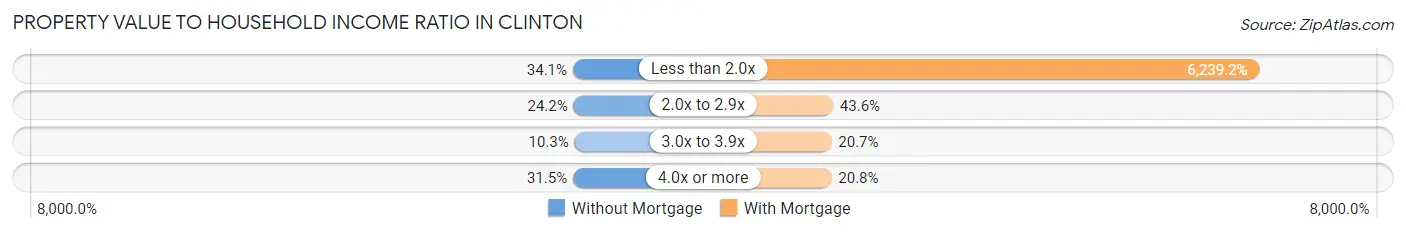
| Value-to-Income Ratio | Without Mortgage | With Mortgage |
| Less than 2.0x | 392 (34.1%) | 89,408 (6,239.2%) |
| 2.0x to 2.9x | 279 (24.2%) | 624 (43.5%) |
| 3.0x to 3.9x | 118 (10.2%) | 296 (20.7%) |
| 4.0x or more | 362 (31.5%) | 298 (20.8%) |
| Total | 1,151 (100.0%) | 1,433 (100.0%) |
Real Estate Taxes by Mortgage Status in Clinton
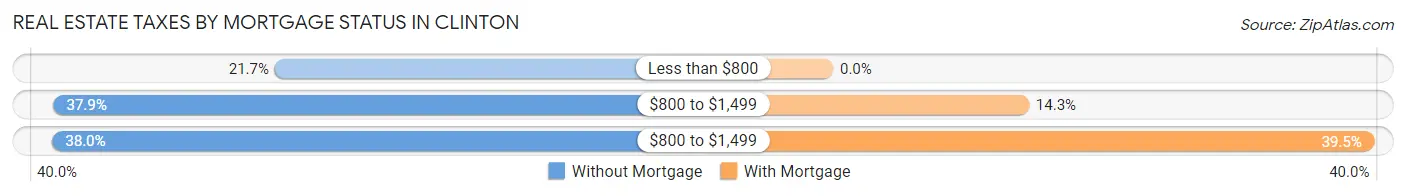
| Property Taxes | Without Mortgage | With Mortgage |
| Less than $800 | 250 (21.7%) | 0 (0.0%) |
| $800 to $1,499 | 436 (37.9%) | 205 (14.3%) |
| $800 to $1,499 | 437 (38.0%) | 566 (39.5%) |
| Total | 1,151 (100.0%) | 1,433 (100.0%) |
Health & Disability in Clinton
Health Insurance Coverage by Age in Clinton
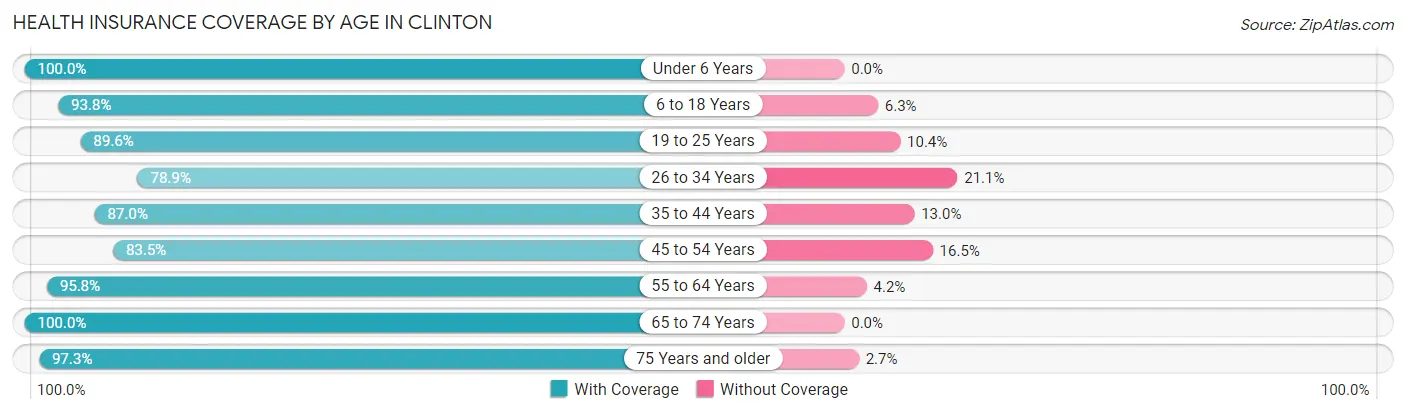
| Age Bracket | With Coverage | Without Coverage |
| Under 6 Years | 557 (100.0%) | 0 (0.0%) |
| 6 to 18 Years | 1,214 (93.8%) | 81 (6.2%) |
| 19 to 25 Years | 542 (89.6%) | 63 (10.4%) |
| 26 to 34 Years | 1,015 (78.9%) | 271 (21.1%) |
| 35 to 44 Years | 974 (87.0%) | 146 (13.0%) |
| 45 to 54 Years | 1,034 (83.5%) | 204 (16.5%) |
| 55 to 64 Years | 1,336 (95.8%) | 58 (4.2%) |
| 65 to 74 Years | 1,592 (100.0%) | 0 (0.0%) |
| 75 Years and older | 833 (97.3%) | 23 (2.7%) |
| Total | 9,097 (91.5%) | 846 (8.5%) |
Health Insurance Coverage by Citizenship Status in Clinton
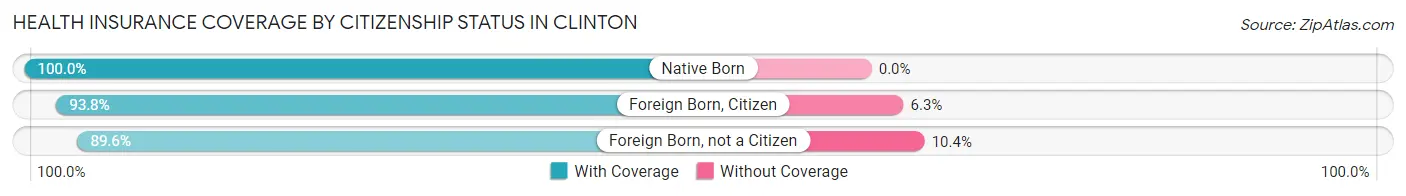
| Citizenship Status | With Coverage | Without Coverage |
| Native Born | 557 (100.0%) | 0 (0.0%) |
| Foreign Born, Citizen | 1,214 (93.8%) | 81 (6.2%) |
| Foreign Born, not a Citizen | 542 (89.6%) | 63 (10.4%) |
Health Insurance Coverage by Household Income in Clinton
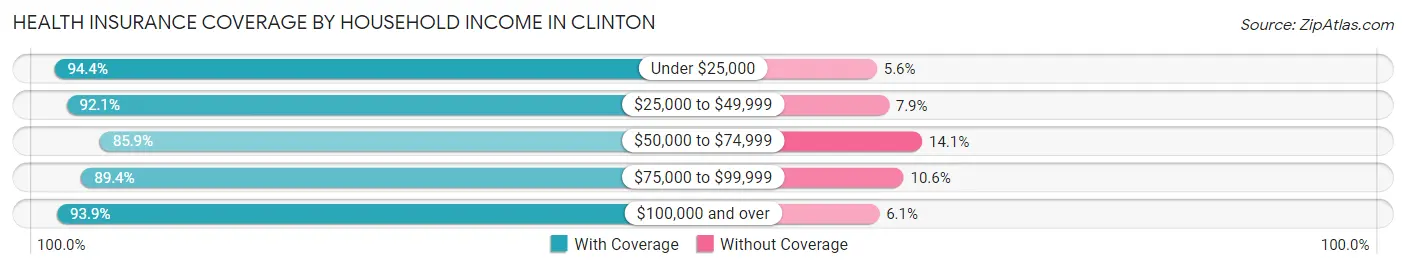
| Household Income | With Coverage | Without Coverage |
| Under $25,000 | 1,242 (94.4%) | 74 (5.6%) |
| $25,000 to $49,999 | 1,522 (92.1%) | 130 (7.9%) |
| $50,000 to $74,999 | 1,523 (85.9%) | 250 (14.1%) |
| $75,000 to $99,999 | 1,504 (89.4%) | 179 (10.6%) |
| $100,000 and over | 3,292 (93.9%) | 213 (6.1%) |
Public vs Private Health Insurance Coverage by Age in Clinton
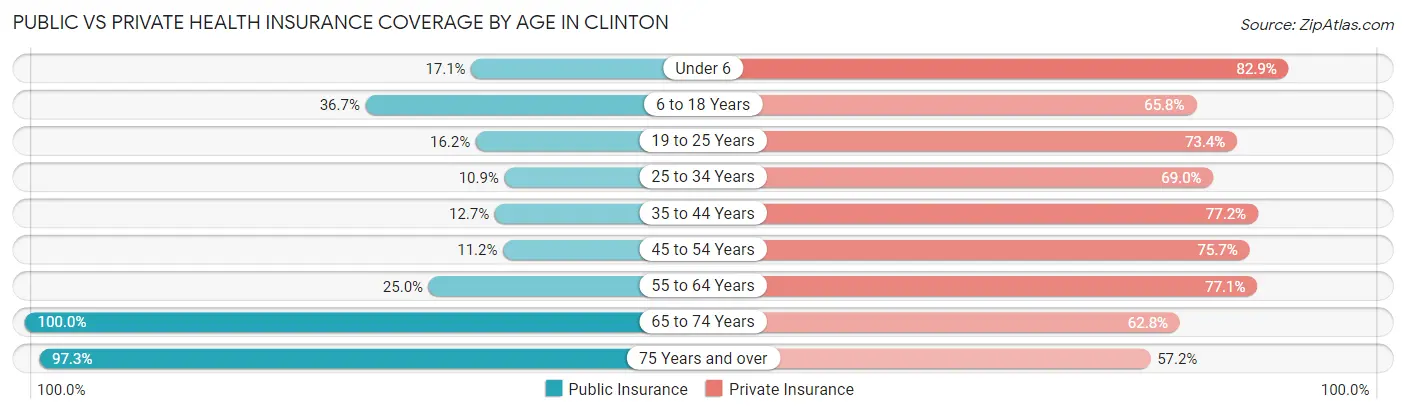
| Age Bracket | Public Insurance | Private Insurance |
| Under 6 | 95 (17.1%) | 462 (82.9%) |
| 6 to 18 Years | 475 (36.7%) | 852 (65.8%) |
| 19 to 25 Years | 98 (16.2%) | 444 (73.4%) |
| 25 to 34 Years | 140 (10.9%) | 887 (69.0%) |
| 35 to 44 Years | 142 (12.7%) | 865 (77.2%) |
| 45 to 54 Years | 138 (11.2%) | 937 (75.7%) |
| 55 to 64 Years | 348 (25.0%) | 1,075 (77.1%) |
| 65 to 74 Years | 1,592 (100.0%) | 999 (62.7%) |
| 75 Years and over | 833 (97.3%) | 490 (57.2%) |
| Total | 3,861 (38.8%) | 7,011 (70.5%) |
Disability Status by Sex by Age in Clinton
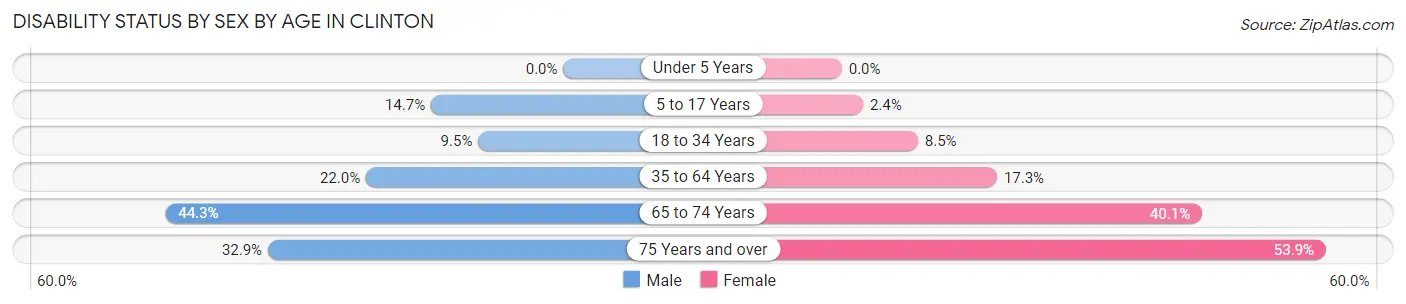
| Age Bracket | Male | Female |
| Under 5 Years | 0 (0.0%) | 0 (0.0%) |
| 5 to 17 Years | 103 (14.7%) | 14 (2.4%) |
| 18 to 34 Years | 101 (9.5%) | 78 (8.5%) |
| 35 to 64 Years | 410 (22.0%) | 326 (17.3%) |
| 65 to 74 Years | 340 (44.3%) | 331 (40.1%) |
| 75 Years and over | 126 (32.9%) | 255 (53.9%) |
Disability Class by Sex by Age in Clinton
Disability Class: Hearing Difficulty
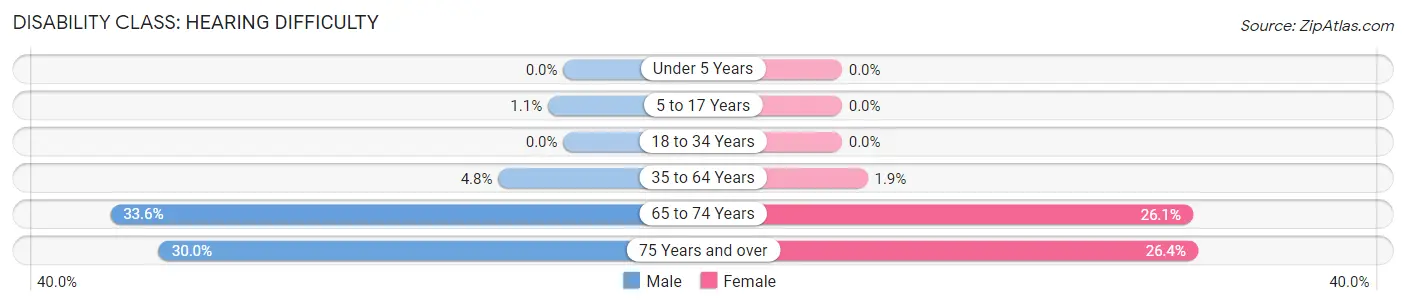
| Age Bracket | Male | Female |
| Under 5 Years | 0 (0.0%) | 0 (0.0%) |
| 5 to 17 Years | 8 (1.1%) | 0 (0.0%) |
| 18 to 34 Years | 0 (0.0%) | 0 (0.0%) |
| 35 to 64 Years | 90 (4.8%) | 36 (1.9%) |
| 65 to 74 Years | 258 (33.6%) | 215 (26.1%) |
| 75 Years and over | 115 (30.0%) | 125 (26.4%) |
Disability Class: Vision Difficulty
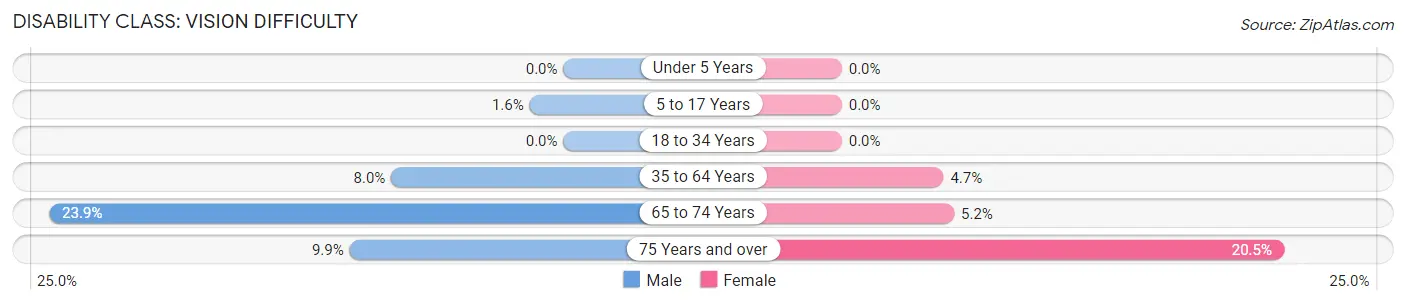
| Age Bracket | Male | Female |
| Under 5 Years | 0 (0.0%) | 0 (0.0%) |
| 5 to 17 Years | 11 (1.6%) | 0 (0.0%) |
| 18 to 34 Years | 0 (0.0%) | 0 (0.0%) |
| 35 to 64 Years | 149 (8.0%) | 89 (4.7%) |
| 65 to 74 Years | 183 (23.9%) | 43 (5.2%) |
| 75 Years and over | 38 (9.9%) | 97 (20.5%) |
Disability Class: Cognitive Difficulty
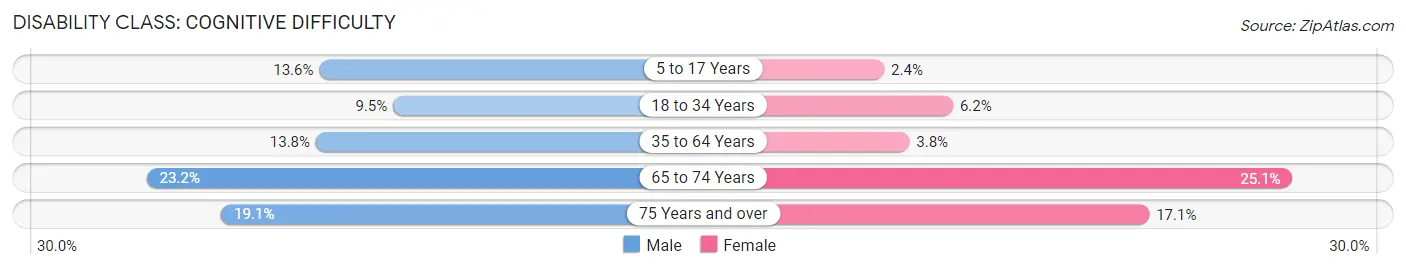
| Age Bracket | Male | Female |
| 5 to 17 Years | 95 (13.6%) | 14 (2.4%) |
| 18 to 34 Years | 101 (9.5%) | 57 (6.2%) |
| 35 to 64 Years | 257 (13.8%) | 71 (3.8%) |
| 65 to 74 Years | 178 (23.2%) | 207 (25.1%) |
| 75 Years and over | 73 (19.1%) | 81 (17.1%) |
Disability Class: Ambulatory Difficulty
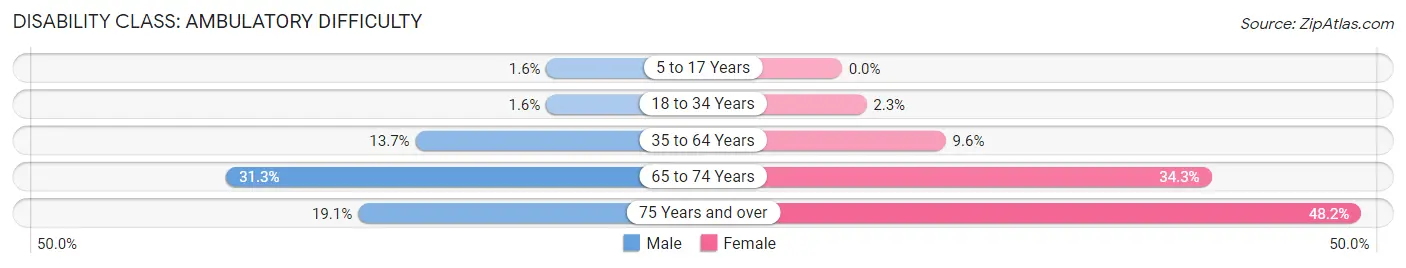
| Age Bracket | Male | Female |
| 5 to 17 Years | 11 (1.6%) | 0 (0.0%) |
| 18 to 34 Years | 17 (1.6%) | 21 (2.3%) |
| 35 to 64 Years | 256 (13.7%) | 182 (9.6%) |
| 65 to 74 Years | 240 (31.3%) | 283 (34.3%) |
| 75 Years and over | 73 (19.1%) | 228 (48.2%) |
Disability Class: Self-Care Difficulty
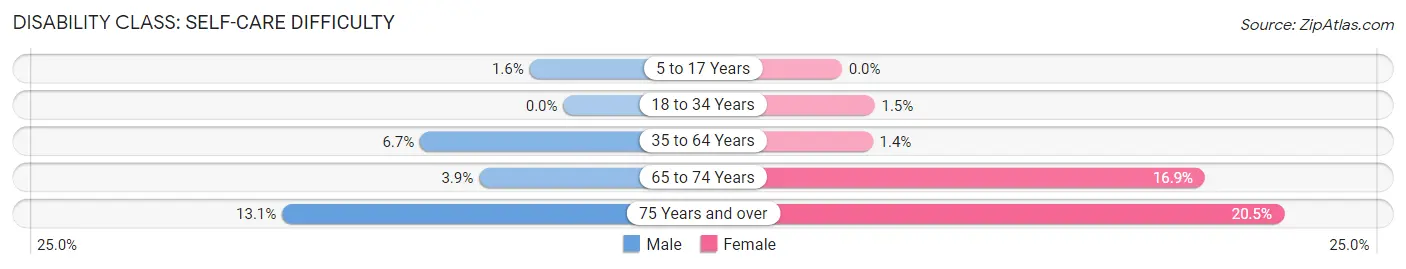
| Age Bracket | Male | Female |
| 5 to 17 Years | 11 (1.6%) | 0 (0.0%) |
| 18 to 34 Years | 0 (0.0%) | 14 (1.5%) |
| 35 to 64 Years | 124 (6.7%) | 27 (1.4%) |
| 65 to 74 Years | 30 (3.9%) | 139 (16.9%) |
| 75 Years and over | 50 (13.1%) | 97 (20.5%) |
Technology Access in Clinton
Computing Device Access in Clinton
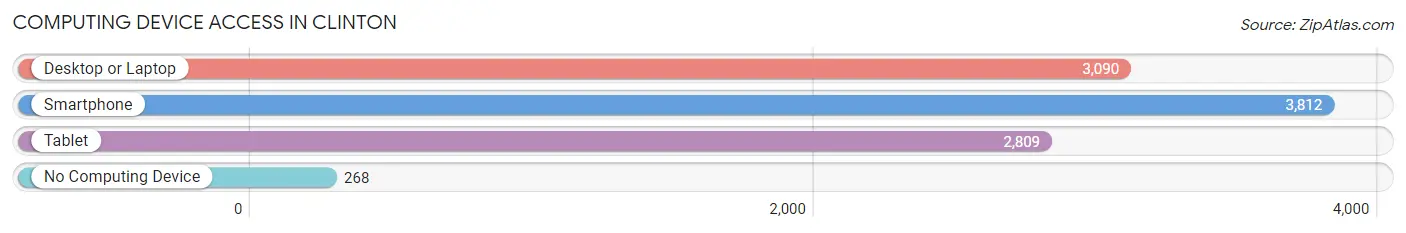
| Device Type | # Households | % Households |
| Desktop or Laptop | 3,090 | 71.5% |
| Smartphone | 3,812 | 88.2% |
| Tablet | 2,809 | 65.0% |
| No Computing Device | 268 | 6.2% |
| Total | 4,321 | 100.0% |
Internet Access in Clinton
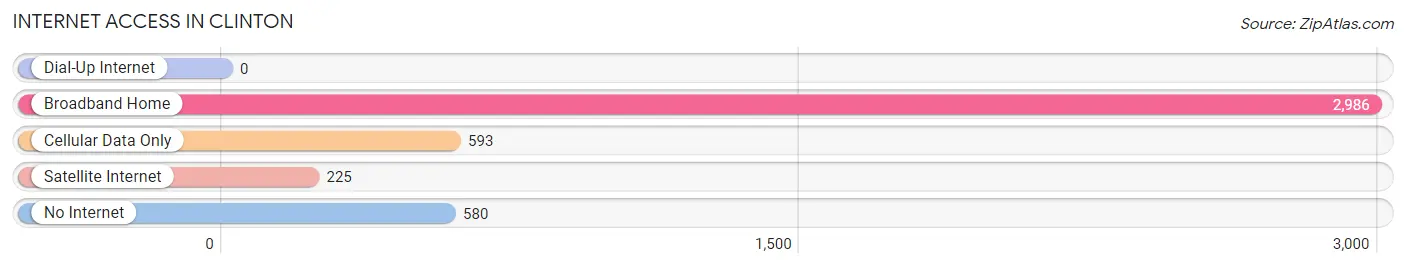
| Internet Type | # Households | % Households |
| Dial-Up Internet | 0 | 0.0% |
| Broadband Home | 2,986 | 69.1% |
| Cellular Data Only | 593 | 13.7% |
| Satellite Internet | 225 | 5.2% |
| No Internet | 580 | 13.4% |
| Total | 4,321 | 100.0% |
Clinton Summary
Clinton, Tennessee is a small city located in Anderson County, in the eastern part of the state. It is situated along the Clinch River, and is part of the Knoxville Metropolitan Statistical Area. The city has a population of around 10,000 people, and is known for its strong sense of community and its rural charm.
History
The area that is now Clinton was first settled in the late 1700s by a group of settlers from North Carolina. The town was originally known as Burrville, and was named after Aaron Burr, who had served as Vice President of the United States. The town was renamed Clinton in 1809, in honor of DeWitt Clinton, the Governor of New York at the time.
In the early 1800s, Clinton was a thriving agricultural community, with a number of mills and factories. The town was also home to a number of churches, and was a popular stop on the stagecoach route between Knoxville and Chattanooga.
In the late 1800s, the town began to experience a period of growth and prosperity. The railroad arrived in 1887, and the town was incorporated in 1889. The town continued to grow throughout the early 1900s, and by the 1950s, it had become a thriving industrial center.
Geography
Clinton is located in Anderson County, in the eastern part of the state. It is situated along the Clinch River, and is part of the Knoxville Metropolitan Statistical Area. The city has a total area of 8.3 square miles, and is located at an elevation of 890 feet.
The climate in Clinton is humid subtropical, with hot, humid summers and mild winters. The average annual temperature is around 61 degrees Fahrenheit, and the average annual precipitation is around 48 inches.
Economy
The economy of Clinton is largely based on manufacturing and agriculture. The city is home to a number of factories and industrial plants, including a paper mill, a steel mill, and a chemical plant. The city is also home to a number of agricultural businesses, including dairy farms, poultry farms, and vegetable farms.
The city is also home to a number of retail stores, restaurants, and other businesses. The city is served by a number of major highways, including Interstate 75, US Route 25, and US Route 11.
Demographics
As of the 2010 census, the population of Clinton was 9,841. The racial makeup of the city was 87.3% White, 8.2% African American, 0.4% Native American, 0.7% Asian, 0.1% Pacific Islander, 1.2% from other races, and 2.1% from two or more races. Hispanic or Latino of any race were 3.2% of the population.
The median household income in Clinton was $37,941, and the median family income was $45,941. The per capita income in the city was $19,941. About 16.2% of the population was below the poverty line.
Common Questions
What is Per Capita Income in Clinton?
Per Capita income in Clinton is $32,680.
What is the Median Family Income in Clinton?
Median Family Income in Clinton is $76,827.
What is the Median Household income in Clinton?
Median Household Income in Clinton is $63,706.
What is Income or Wage Gap in Clinton?
Income or Wage Gap in Clinton is 8.4%.
Women in Clinton earn 91.6 cents for every dollar earned by a man.
What is Family Income Deficit in Clinton?
Family Income Deficit in Clinton is $5,576.
Families that are below poverty line in Clinton earn $5,576 less on average than the poverty threshold level.
What is Inequality or Gini Index in Clinton?
Inequality or Gini Index in Clinton is 0.42.
What is the Total Population of Clinton?
Total Population of Clinton is 10,060.
What is the Total Male Population of Clinton?
Total Male Population of Clinton is 4,954.
What is the Total Female Population of Clinton?
Total Female Population of Clinton is 5,106.
What is the Ratio of Males per 100 Females in Clinton?
There are 97.02 Males per 100 Females in Clinton.
What is the Ratio of Females per 100 Males in Clinton?
There are 103.07 Females per 100 Males in Clinton.
What is the Median Population Age in Clinton?
Median Population Age in Clinton is 46.1 Years.
What is the Average Family Size in Clinton
Average Family Size in Clinton is 2.7 People.
What is the Average Household Size in Clinton
Average Household Size in Clinton is 2.3 People.
How Large is the Labor Force in Clinton?
There are 4,765 People in the Labor Forcein in Clinton.
What is the Percentage of People in the Labor Force in Clinton?
56.2% of People are in the Labor Force in Clinton.
What is the Unemployment Rate in Clinton?
Unemployment Rate in Clinton is 3.1%.