Morristown, TN Map & Demographics
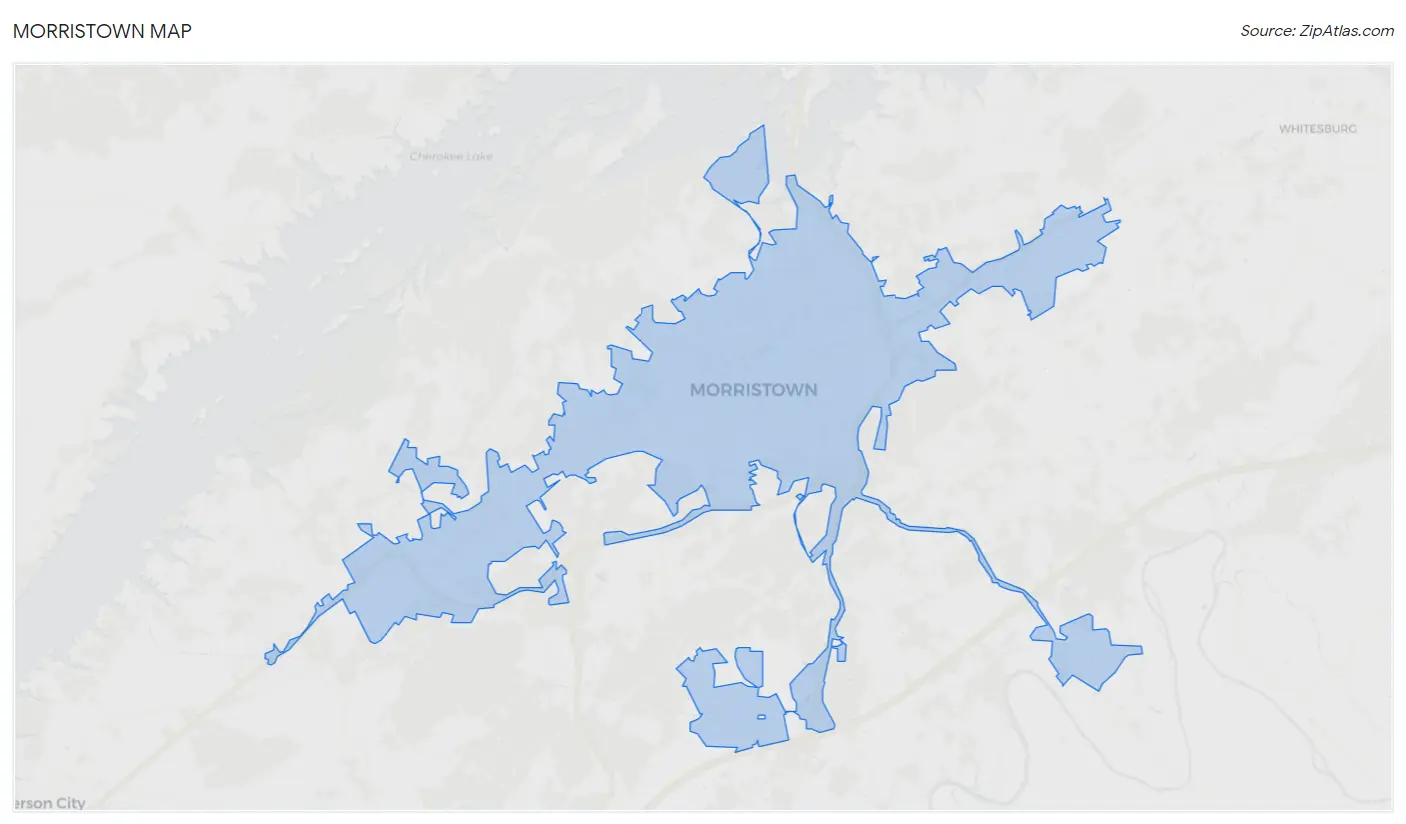
Morristown Map
Morristown Overview
$24,320
PER CAPITA INCOME
$55,485
AVG FAMILY INCOME
$39,547
AVG HOUSEHOLD INCOME
21.1%
WAGE / INCOME GAP [ % ]
78.9¢/ $1
WAGE / INCOME GAP [ $ ]
$14,880
FAMILY INCOME DEFICIT
0.51
INEQUALITY / GINI INDEX
30,574
TOTAL POPULATION
14,780
MALE POPULATION
15,794
FEMALE POPULATION
93.58
MALES / 100 FEMALES
106.86
FEMALES / 100 MALES
37.6
MEDIAN AGE
3.1
AVG FAMILY SIZE
2.4
AVG HOUSEHOLD SIZE
13,092
LABOR FORCE [ PEOPLE ]
55.0%
PERCENT IN LABOR FORCE
8.1%
UNEMPLOYMENT RATE
Income in Morristown
Income Overview in Morristown
Per Capita Income in Morristown is $24,320, while median incomes of families and households are $55,485 and $39,547 respectively.
| Characteristic | Number | Measure |
| Per Capita Income | 30,574 | $24,320 |
| Median Family Income | 7,096 | $55,485 |
| Mean Family Income | 7,096 | $73,822 |
| Median Household Income | 12,317 | $39,547 |
| Mean Household Income | 12,317 | $57,602 |
| Income Deficit | 7,096 | $14,880 |
| Wage / Income Gap (%) | 30,574 | 21.08% |
| Wage / Income Gap ($) | 30,574 | 78.92¢ per $1 |
| Gini / Inequality Index | 30,574 | 0.51 |
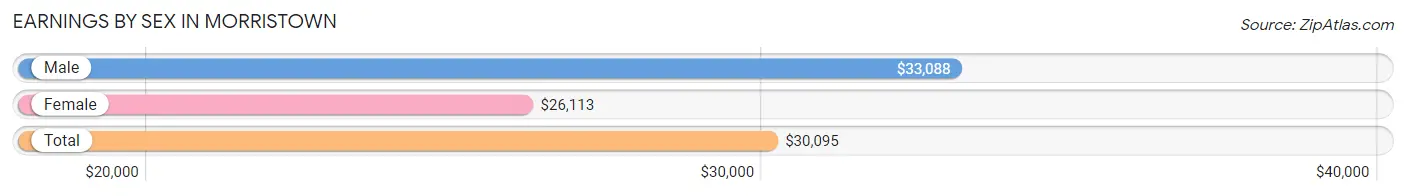
Earnings by Sex in Morristown
Average Earnings in Morristown are $30,095, $33,088 for men and $26,113 for women, a difference of 21.1%.
| Sex | Number | Average Earnings |
| Male | 6,862 (51.8%) | $33,088 |
| Female | 6,391 (48.2%) | $26,113 |
| Total | 13,253 (100.0%) | $30,095 |
Earnings by Sex by Income Bracket in Morristown
The most common earnings brackets in Morristown are $30,000 to $34,999 for men (885 | 12.9%) and $25,000 to $29,999 for women (656 | 10.3%).
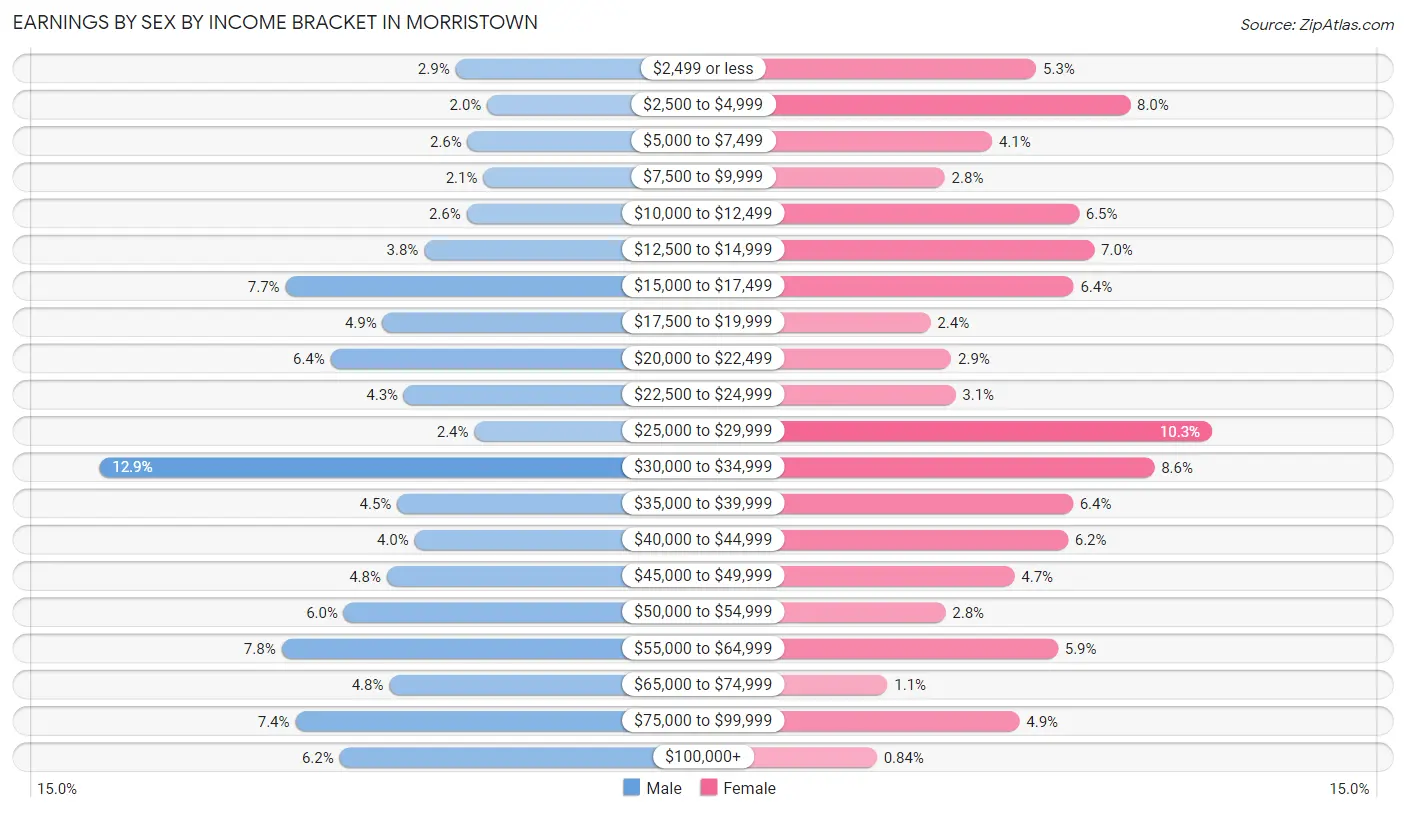
| Income | Male | Female |
| $2,499 or less | 198 (2.9%) | 340 (5.3%) |
| $2,500 to $4,999 | 137 (2.0%) | 509 (8.0%) |
| $5,000 to $7,499 | 175 (2.5%) | 261 (4.1%) |
| $7,500 to $9,999 | 145 (2.1%) | 176 (2.8%) |
| $10,000 to $12,499 | 177 (2.6%) | 417 (6.5%) |
| $12,500 to $14,999 | 259 (3.8%) | 444 (7.0%) |
| $15,000 to $17,499 | 526 (7.7%) | 407 (6.4%) |
| $17,500 to $19,999 | 339 (4.9%) | 150 (2.4%) |
| $20,000 to $22,499 | 439 (6.4%) | 187 (2.9%) |
| $22,500 to $24,999 | 298 (4.3%) | 195 (3.0%) |
| $25,000 to $29,999 | 162 (2.4%) | 656 (10.3%) |
| $30,000 to $34,999 | 885 (12.9%) | 552 (8.6%) |
| $35,000 to $39,999 | 311 (4.5%) | 406 (6.4%) |
| $40,000 to $44,999 | 277 (4.0%) | 397 (6.2%) |
| $45,000 to $49,999 | 331 (4.8%) | 301 (4.7%) |
| $50,000 to $54,999 | 414 (6.0%) | 177 (2.8%) |
| $55,000 to $64,999 | 534 (7.8%) | 379 (5.9%) |
| $65,000 to $74,999 | 326 (4.8%) | 73 (1.1%) |
| $75,000 to $99,999 | 507 (7.4%) | 310 (4.9%) |
| $100,000+ | 422 (6.1%) | 54 (0.8%) |
| Total | 6,862 (100.0%) | 6,391 (100.0%) |
Earnings by Sex by Educational Attainment in Morristown
Average earnings in Morristown are $37,905 for men and $29,993 for women, a difference of 20.9%. Men with an educational attainment of graduate degree enjoy the highest average annual earnings of $89,922, while those with less than high school education earn the least with $31,760. Women with an educational attainment of graduate degree earn the most with the average annual earnings of $54,632, while those with less than high school education have the smallest earnings of $18,083.
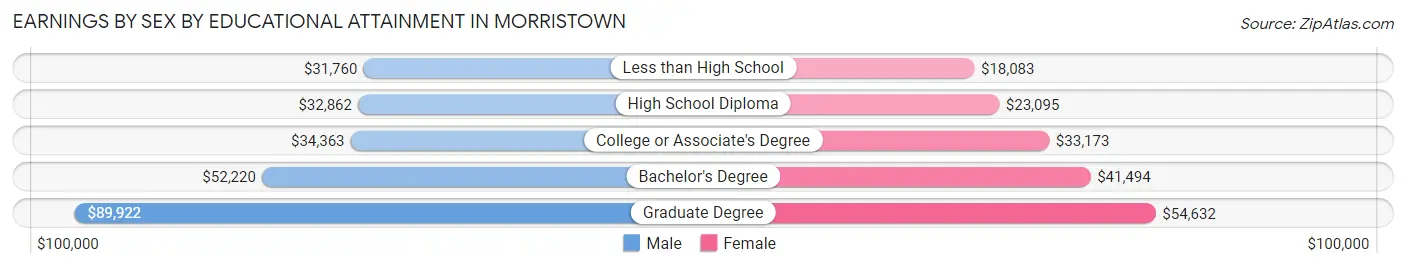
| Educational Attainment | Male Income | Female Income |
| Less than High School | $31,760 | $18,083 |
| High School Diploma | $32,862 | $23,095 |
| College or Associate's Degree | $34,363 | $33,173 |
| Bachelor's Degree | $52,220 | $41,494 |
| Graduate Degree | $89,922 | $54,632 |
| Total | $37,905 | $29,993 |
Family Income in Morristown
Family Income Brackets in Morristown
According to the Morristown family income data, there are 1,348 families falling into the $50,000 to $74,999 income range, which is the most common income bracket and makes up 19.0% of all families. Conversely, the $150,000 to $199,999 income bracket is the least frequent group with only 99 families (1.4%) belonging to this category.
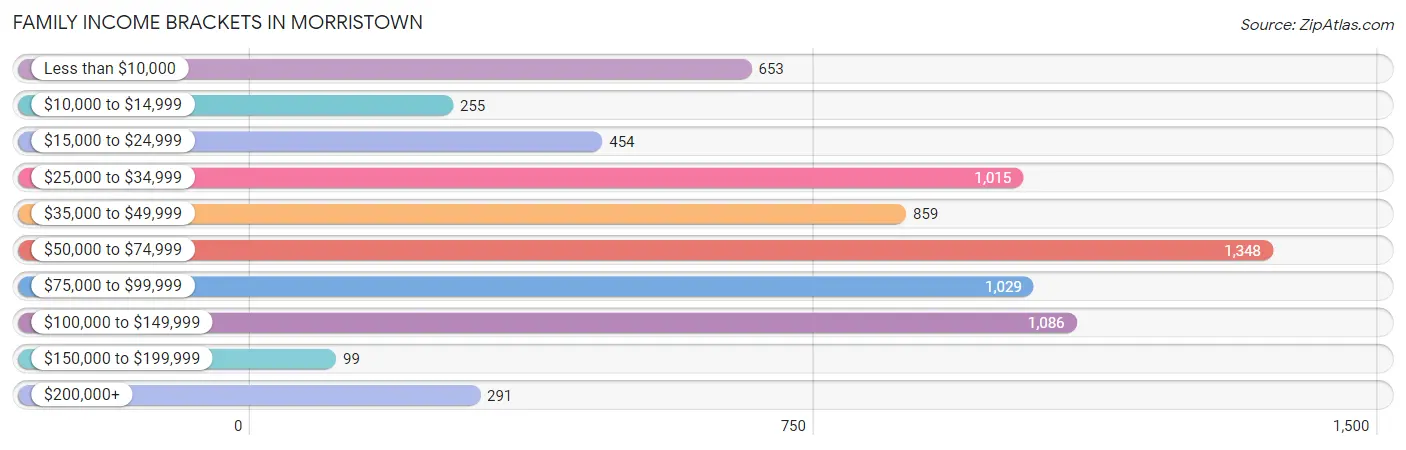
| Income Bracket | # Families | % Families |
| Less than $10,000 | 653 | 9.2% |
| $10,000 to $14,999 | 255 | 3.6% |
| $15,000 to $24,999 | 454 | 6.4% |
| $25,000 to $34,999 | 1,015 | 14.3% |
| $35,000 to $49,999 | 859 | 12.1% |
| $50,000 to $74,999 | 1,348 | 19.0% |
| $75,000 to $99,999 | 1,029 | 14.5% |
| $100,000 to $149,999 | 1,086 | 15.3% |
| $150,000 to $199,999 | 99 | 1.4% |
| $200,000+ | 291 | 4.1% |
Family Income by Famaliy Size in Morristown
7+ person families (245 | 3.5%) account for the highest median family income in Morristown with $78,516 per family, while 2-person families (3,333 | 47.0%) have the highest median income of $28,744 per family member.
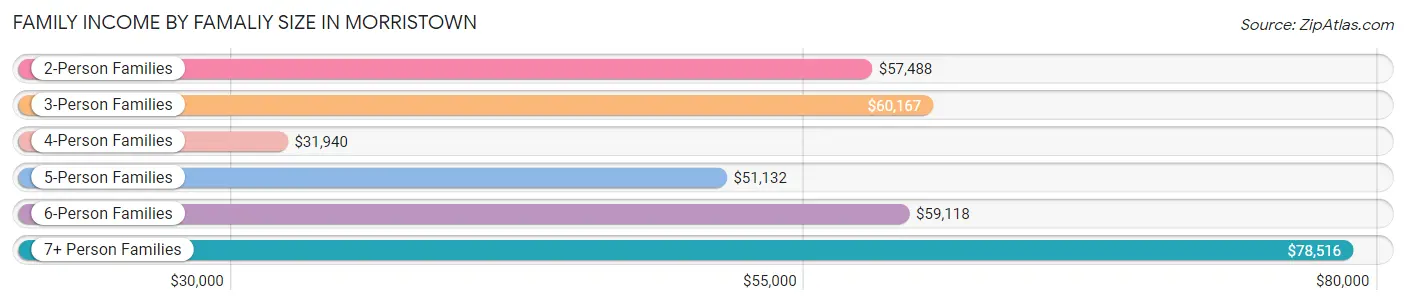
| Income Bracket | # Families | Median Income |
| 2-Person Families | 3,333 (47.0%) | $57,488 |
| 3-Person Families | 1,570 (22.1%) | $60,167 |
| 4-Person Families | 1,283 (18.1%) | $31,940 |
| 5-Person Families | 631 (8.9%) | $51,132 |
| 6-Person Families | 34 (0.5%) | $59,118 |
| 7+ Person Families | 245 (3.5%) | $78,516 |
| Total | 7,096 (100.0%) | $55,485 |
Family Income by Number of Earners in Morristown
The median family income in Morristown is $55,485, with families comprising 3+ earners (614) having the highest median family income of $93,281, while families with no earners (1,748) have the lowest median family income of $27,500, accounting for 8.6% and 24.6% of families, respectively.
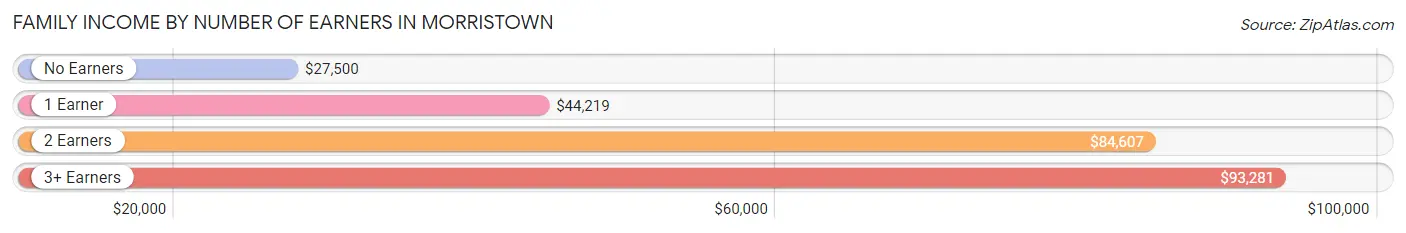
| Number of Earners | # Families | Median Income |
| No Earners | 1,748 (24.6%) | $27,500 |
| 1 Earner | 2,696 (38.0%) | $44,219 |
| 2 Earners | 2,038 (28.7%) | $84,607 |
| 3+ Earners | 614 (8.6%) | $93,281 |
| Total | 7,096 (100.0%) | $55,485 |
Household Income in Morristown
Household Income Brackets in Morristown
With 1,958 households falling in the category, the $50,000 to $74,999 income range is the most frequent in Morristown, accounting for 15.9% of all households. In contrast, only 99 households (0.8%) fall into the $150,000 to $199,999 income bracket, making it the least populous group.
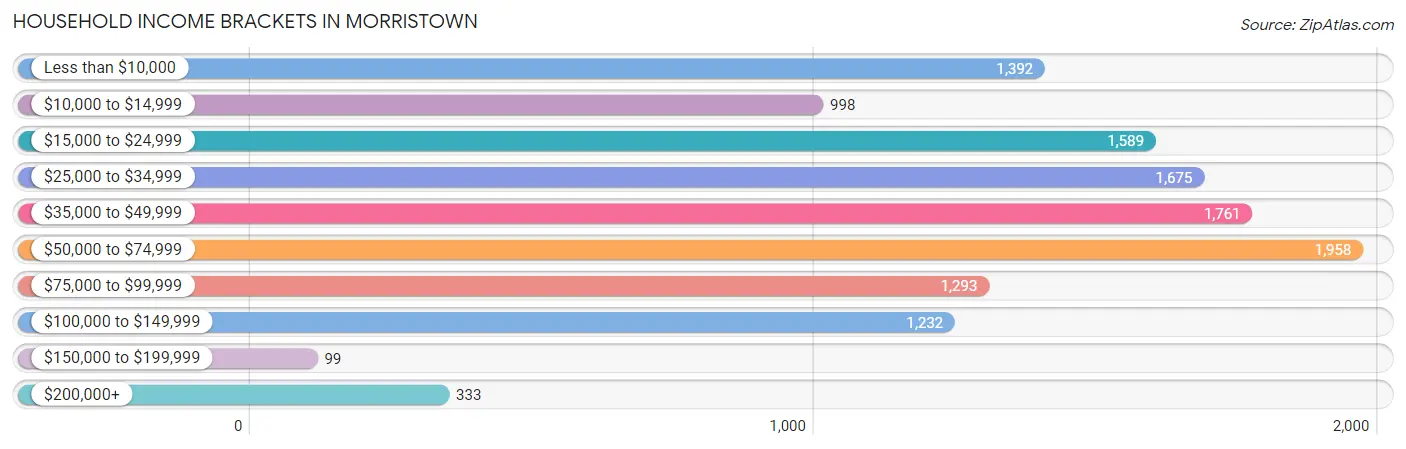
| Income Bracket | # Households | % Households |
| Less than $10,000 | 1,392 | 11.3% |
| $10,000 to $14,999 | 998 | 8.1% |
| $15,000 to $24,999 | 1,589 | 12.9% |
| $25,000 to $34,999 | 1,675 | 13.6% |
| $35,000 to $49,999 | 1,761 | 14.3% |
| $50,000 to $74,999 | 1,958 | 15.9% |
| $75,000 to $99,999 | 1,293 | 10.5% |
| $100,000 to $149,999 | 1,232 | 10.0% |
| $150,000 to $199,999 | 99 | 0.8% |
| $200,000+ | 333 | 2.7% |
Household Income by Householder Age in Morristown
The median household income in Morristown is $39,547, with the highest median household income of $46,234 found in the 25 to 44 years age bracket for the primary householder. A total of 3,880 households (31.5%) fall into this category. Meanwhile, the 15 to 24 years age bracket for the primary householder has the lowest median household income of $25,154, with 429 households (3.5%) in this group.
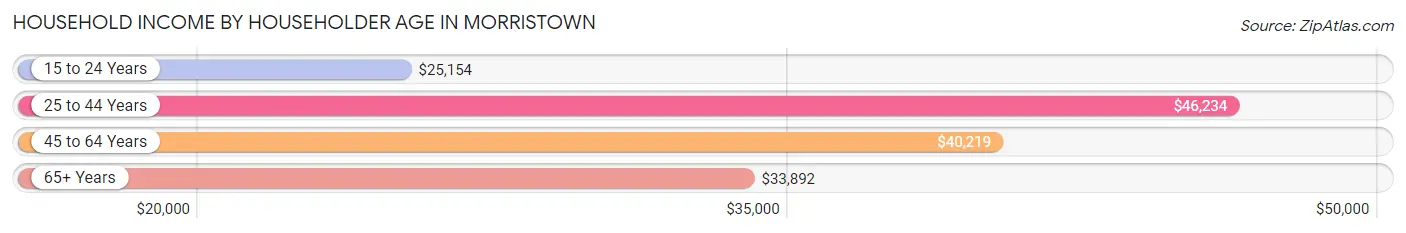
| Income Bracket | # Households | Median Income |
| 15 to 24 Years | 429 (3.5%) | $25,154 |
| 25 to 44 Years | 3,880 (31.5%) | $46,234 |
| 45 to 64 Years | 4,631 (37.6%) | $40,219 |
| 65+ Years | 3,377 (27.4%) | $33,892 |
| Total | 12,317 (100.0%) | $39,547 |
Poverty in Morristown
Income Below Poverty by Sex and Age in Morristown
With 24.0% poverty level for males and 27.3% for females among the residents of Morristown, 12 to 14 year old males and 15 year old females are the most vulnerable to poverty, with 228 males (47.4%) and 112 females (51.4%) in their respective age groups living below the poverty level.
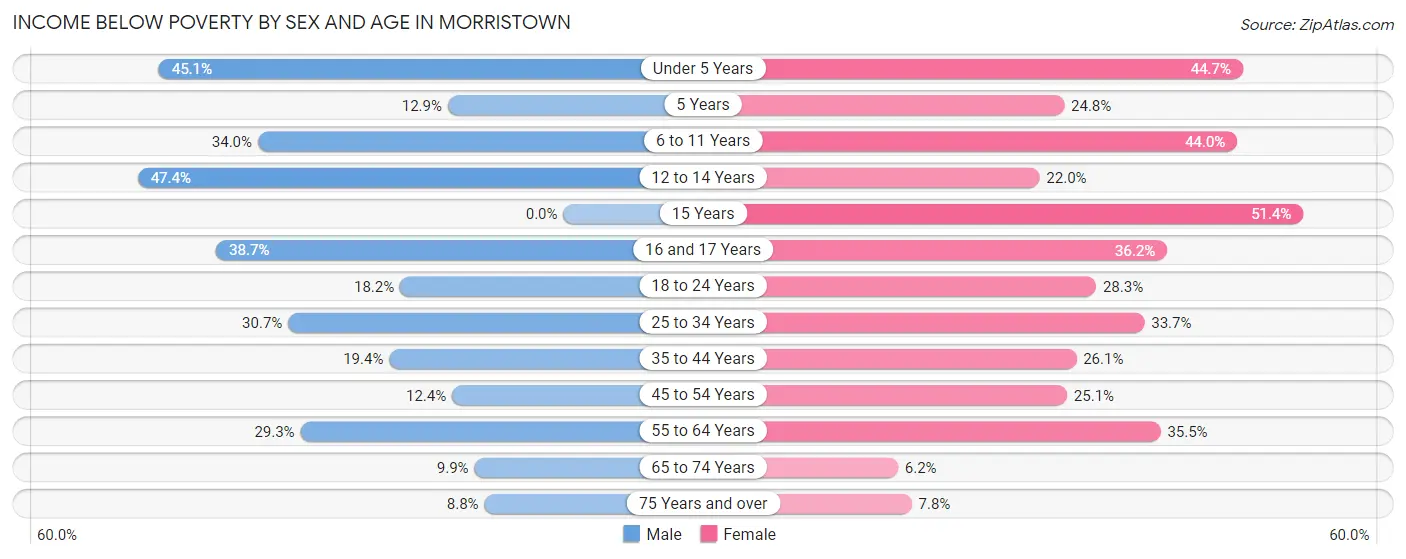
| Age Bracket | Male | Female |
| Under 5 Years | 432 (45.1%) | 405 (44.7%) |
| 5 Years | 13 (12.9%) | 79 (24.8%) |
| 6 to 11 Years | 448 (34.0%) | 479 (44.0%) |
| 12 to 14 Years | 228 (47.4%) | 175 (22.0%) |
| 15 Years | 0 (0.0%) | 112 (51.4%) |
| 16 and 17 Years | 150 (38.7%) | 121 (36.2%) |
| 18 to 24 Years | 195 (18.2%) | 443 (28.3%) |
| 25 to 34 Years | 684 (30.6%) | 571 (33.7%) |
| 35 to 44 Years | 346 (19.4%) | 535 (26.1%) |
| 45 to 54 Years | 254 (12.4%) | 458 (25.1%) |
| 55 to 64 Years | 486 (29.3%) | 631 (35.5%) |
| 65 to 74 Years | 114 (9.9%) | 99 (6.2%) |
| 75 Years and over | 64 (8.8%) | 95 (7.8%) |
| Total | 3,414 (24.0%) | 4,203 (27.3%) |
Income Above Poverty by Sex and Age in Morristown
According to the poverty statistics in Morristown, males aged 15 years and females aged 65 to 74 years are the age groups that are most secure financially, with 100.0% of males and 93.8% of females in these age groups living above the poverty line.
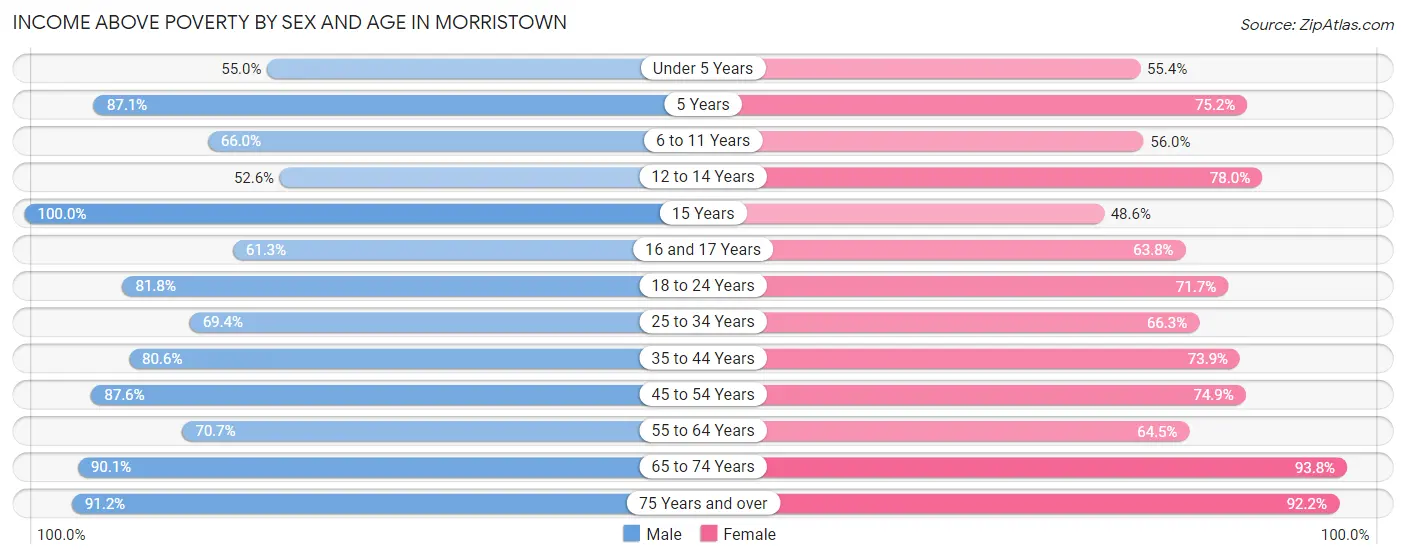
| Age Bracket | Male | Female |
| Under 5 Years | 527 (54.9%) | 502 (55.3%) |
| 5 Years | 88 (87.1%) | 240 (75.2%) |
| 6 to 11 Years | 869 (66.0%) | 609 (56.0%) |
| 12 to 14 Years | 253 (52.6%) | 620 (78.0%) |
| 15 Years | 287 (100.0%) | 106 (48.6%) |
| 16 and 17 Years | 238 (61.3%) | 213 (63.8%) |
| 18 to 24 Years | 877 (81.8%) | 1,122 (71.7%) |
| 25 to 34 Years | 1,548 (69.4%) | 1,124 (66.3%) |
| 35 to 44 Years | 1,438 (80.6%) | 1,514 (73.9%) |
| 45 to 54 Years | 1,794 (87.6%) | 1,369 (74.9%) |
| 55 to 64 Years | 1,174 (70.7%) | 1,147 (64.5%) |
| 65 to 74 Years | 1,037 (90.1%) | 1,487 (93.8%) |
| 75 Years and over | 664 (91.2%) | 1,128 (92.2%) |
| Total | 10,794 (76.0%) | 11,181 (72.7%) |
Income Below Poverty Among Married-Couple Families in Morristown
The poverty statistics for married-couple families in Morristown show that 11.4% or 490 of the total 4,307 families live below the poverty line. Families with 3 or 4 children have the highest poverty rate of 24.2%, comprising of 128 families. On the other hand, families with 5 or more children have the lowest poverty rate of 0.0%, which includes 0 families.
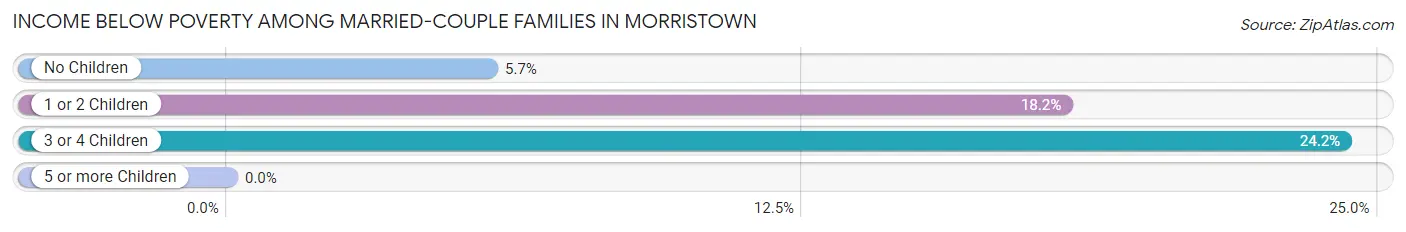
| Children | Above Poverty | Below Poverty |
| No Children | 2,400 (94.3%) | 144 (5.7%) |
| 1 or 2 Children | 982 (81.8%) | 218 (18.2%) |
| 3 or 4 Children | 400 (75.8%) | 128 (24.2%) |
| 5 or more Children | 35 (100.0%) | 0 (0.0%) |
| Total | 3,817 (88.6%) | 490 (11.4%) |
Income Below Poverty Among Single-Parent Households in Morristown
According to the poverty data in Morristown, 13.8% or 109 single-father households and 39.1% or 781 single-mother households are living below the poverty line. Among single-father households, those with 3 or 4 children have the highest poverty rate, with 50 households (100.0%) experiencing poverty. Likewise, among single-mother households, those with 3 or 4 children have the highest poverty rate, with 412 households (70.0%) falling below the poverty line.
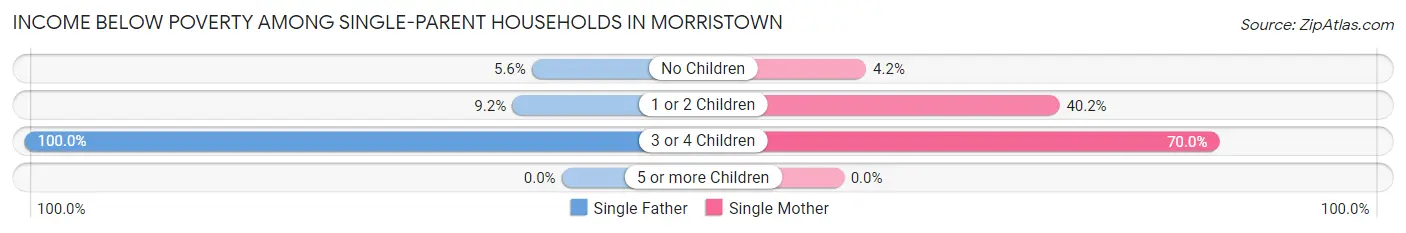
| Children | Single Father | Single Mother |
| No Children | 14 (5.6%) | 23 (4.2%) |
| 1 or 2 Children | 45 (9.2%) | 346 (40.2%) |
| 3 or 4 Children | 50 (100.0%) | 412 (70.0%) |
| 5 or more Children | 0 (0.0%) | 0 (0.0%) |
| Total | 109 (13.8%) | 781 (39.1%) |
Income Below Poverty Among Married-Couple vs Single-Parent Households in Morristown
The poverty data for Morristown shows that 490 of the married-couple family households (11.4%) and 890 of the single-parent households (31.9%) are living below the poverty level. Within the married-couple family households, those with 3 or 4 children have the highest poverty rate, with 128 households (24.2%) falling below the poverty line. Among the single-parent households, those with 3 or 4 children have the highest poverty rate, with 462 household (72.3%) living below poverty.
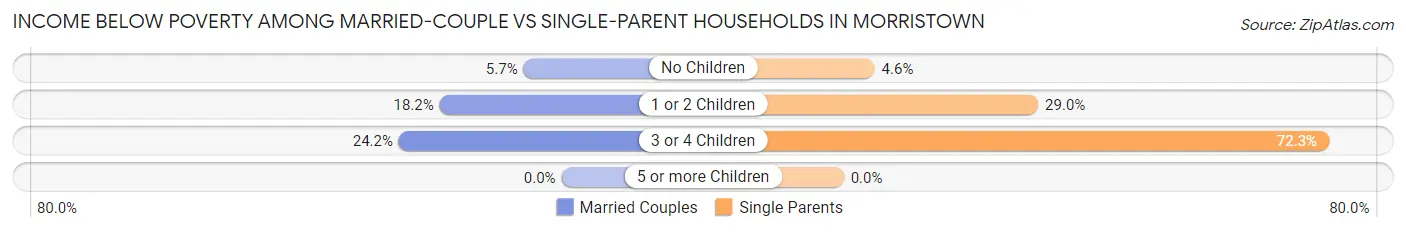
| Children | Married-Couple Families | Single-Parent Households |
| No Children | 144 (5.7%) | 37 (4.6%) |
| 1 or 2 Children | 218 (18.2%) | 391 (29.0%) |
| 3 or 4 Children | 128 (24.2%) | 462 (72.3%) |
| 5 or more Children | 0 (0.0%) | 0 (0.0%) |
| Total | 490 (11.4%) | 890 (31.9%) |
Race in Morristown
The most populous races in Morristown are White / Caucasian (23,272 | 76.1%), Hispanic or Latino (6,120 | 20.0%), and Two or more Races (3,192 | 10.4%).
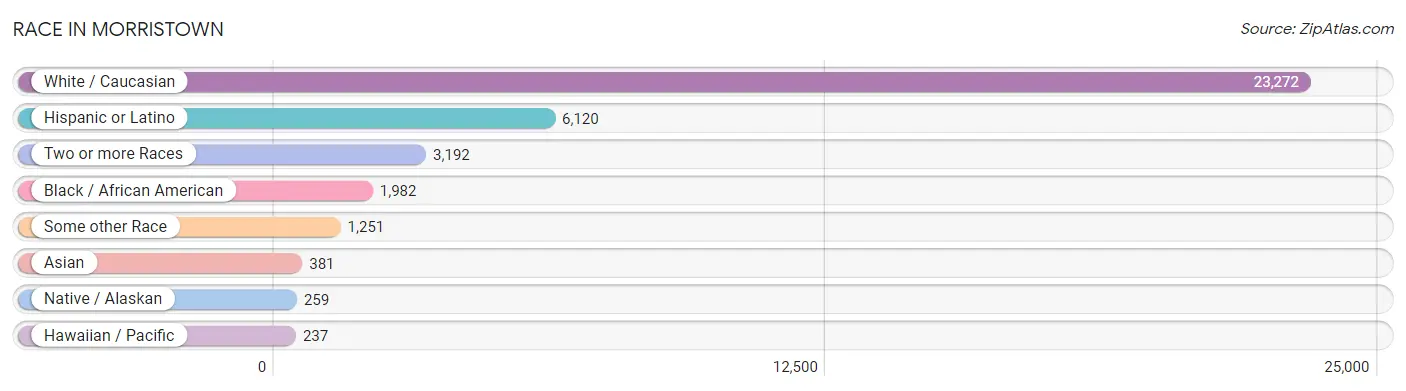
| Race | # Population | % Population |
| Asian | 381 | 1.3% |
| Black / African American | 1,982 | 6.5% |
| Hawaiian / Pacific | 237 | 0.8% |
| Hispanic or Latino | 6,120 | 20.0% |
| Native / Alaskan | 259 | 0.9% |
| White / Caucasian | 23,272 | 76.1% |
| Two or more Races | 3,192 | 10.4% |
| Some other Race | 1,251 | 4.1% |
| Total | 30,574 | 100.0% |
Ancestry in Morristown
The most populous ancestries reported in Morristown are Mexican (4,431 | 14.5%), American (2,583 | 8.5%), German (2,054 | 6.7%), Irish (2,027 | 6.6%), and English (1,945 | 6.4%), together accounting for 42.6% of all Morristown residents.
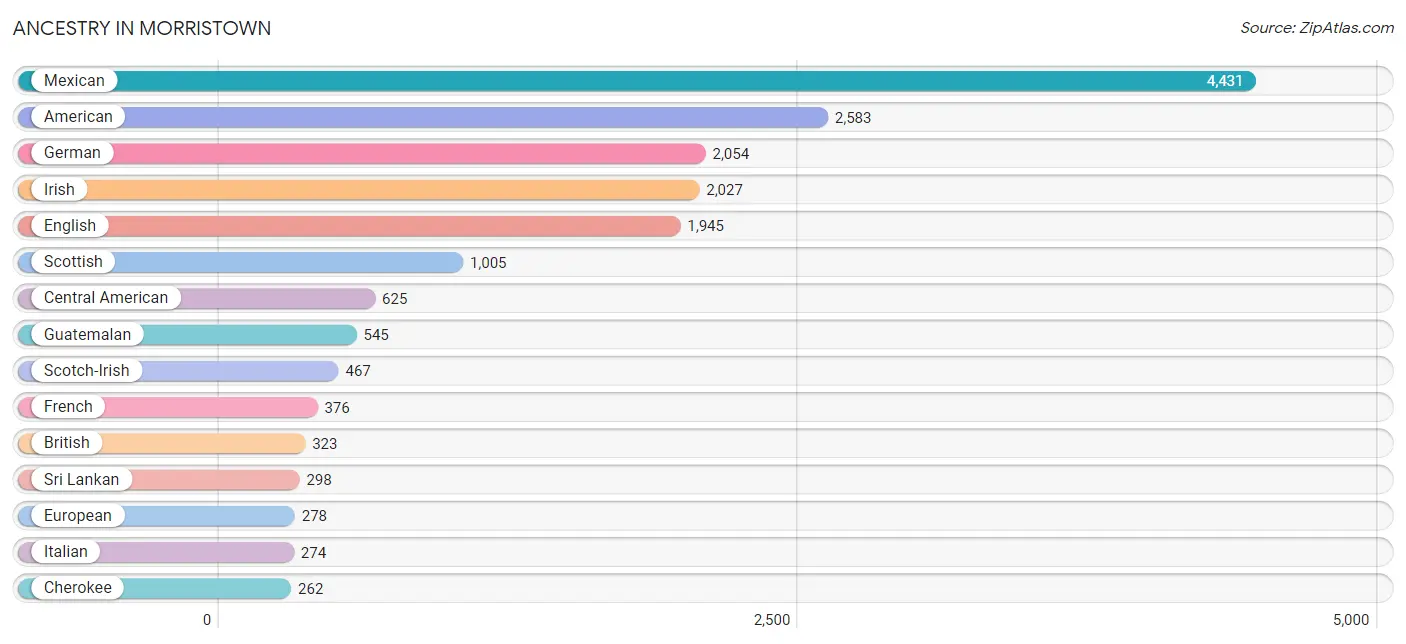
| Ancestry | # Population | % Population |
| African | 167 | 0.5% |
| American | 2,583 | 8.5% |
| Austrian | 28 | 0.1% |
| Belgian | 14 | 0.1% |
| Bhutanese | 111 | 0.4% |
| Blackfeet | 62 | 0.2% |
| British | 323 | 1.1% |
| Burmese | 15 | 0.1% |
| Canadian | 16 | 0.1% |
| Central American | 625 | 2.0% |
| Central American Indian | 177 | 0.6% |
| Cherokee | 262 | 0.9% |
| Cuban | 170 | 0.6% |
| Danish | 66 | 0.2% |
| Delaware | 7 | 0.0% |
| Dutch | 219 | 0.7% |
| Eastern European | 26 | 0.1% |
| English | 1,945 | 6.4% |
| European | 278 | 0.9% |
| Finnish | 16 | 0.1% |
| French | 376 | 1.2% |
| French Canadian | 10 | 0.0% |
| German | 2,054 | 6.7% |
| Guatemalan | 545 | 1.8% |
| Honduran | 69 | 0.2% |
| Hungarian | 10 | 0.0% |
| Indian (Asian) | 30 | 0.1% |
| Irish | 2,027 | 6.6% |
| Italian | 274 | 0.9% |
| Jamaican | 17 | 0.1% |
| Korean | 80 | 0.3% |
| Lithuanian | 42 | 0.1% |
| Marshallese | 34 | 0.1% |
| Mexican | 4,431 | 14.5% |
| Native Hawaiian | 30 | 0.1% |
| Northern European | 23 | 0.1% |
| Norwegian | 76 | 0.3% |
| Polish | 182 | 0.6% |
| Portuguese | 18 | 0.1% |
| Puerto Rican | 258 | 0.8% |
| Russian | 13 | 0.0% |
| Salvadoran | 11 | 0.0% |
| Scandinavian | 58 | 0.2% |
| Scotch-Irish | 467 | 1.5% |
| Scottish | 1,005 | 3.3% |
| South American | 24 | 0.1% |
| Spaniard | 18 | 0.1% |
| Spanish | 22 | 0.1% |
| Sri Lankan | 298 | 1.0% |
| Subsaharan African | 167 | 0.5% |
| Swedish | 81 | 0.3% |
| Swiss | 38 | 0.1% |
| Thai | 51 | 0.2% |
| Venezuelan | 24 | 0.1% |
| Welsh | 114 | 0.4% | View All 55 Rows |
Immigrants in Morristown
The most numerous immigrant groups reported in Morristown came from Latin America (2,484 | 8.1%), Central America (2,410 | 7.9%), Mexico (1,750 | 5.7%), Asia (402 | 1.3%), and Guatemala (401 | 1.3%), together accounting for 24.3% of all Morristown residents.
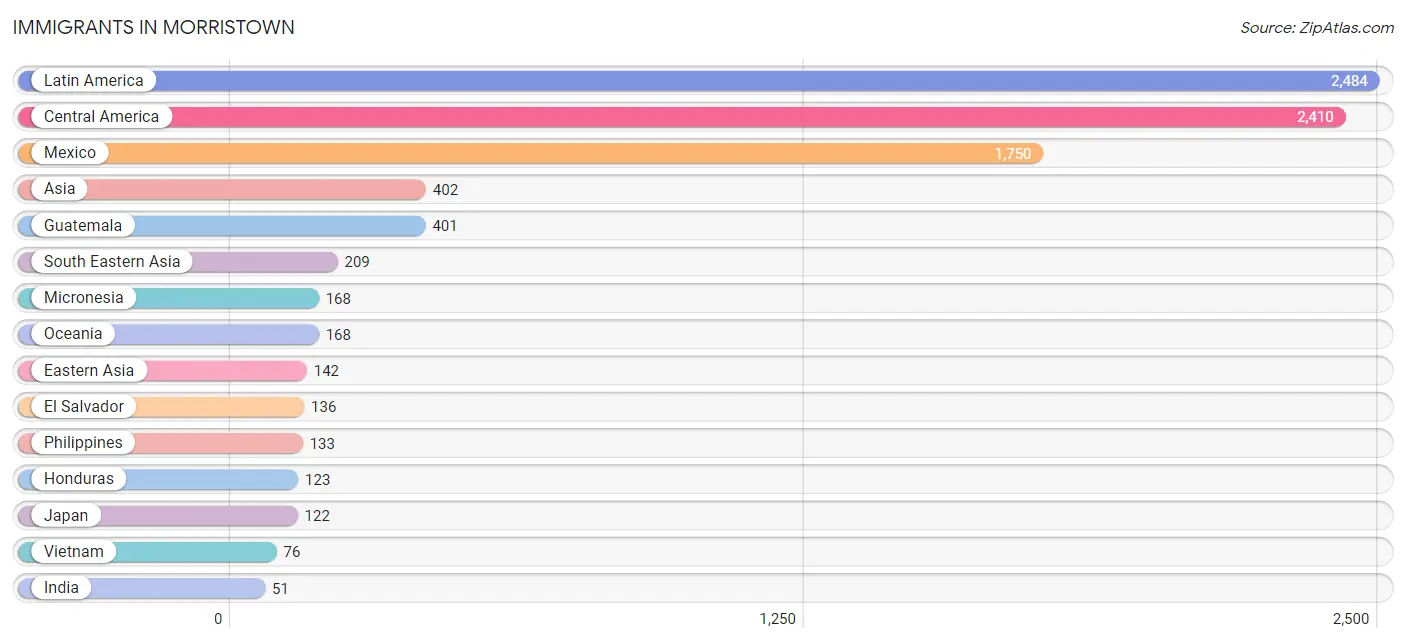
| Immigration Origin | # Population | % Population |
| Asia | 402 | 1.3% |
| Caribbean | 50 | 0.2% |
| Central America | 2,410 | 7.9% |
| China | 20 | 0.1% |
| Cuba | 33 | 0.1% |
| Eastern Asia | 142 | 0.5% |
| El Salvador | 136 | 0.4% |
| England | 1 | 0.0% |
| Europe | 2 | 0.0% |
| Guatemala | 401 | 1.3% |
| Honduras | 123 | 0.4% |
| India | 51 | 0.2% |
| Jamaica | 17 | 0.1% |
| Japan | 122 | 0.4% |
| Latin America | 2,484 | 8.1% |
| Mexico | 1,750 | 5.7% |
| Micronesia | 168 | 0.5% |
| Northern Europe | 2 | 0.0% |
| Oceania | 168 | 0.5% |
| Philippines | 133 | 0.4% |
| South America | 24 | 0.1% |
| South Central Asia | 51 | 0.2% |
| South Eastern Asia | 209 | 0.7% |
| Venezuela | 24 | 0.1% |
| Vietnam | 76 | 0.3% | View All 25 Rows |
Sex and Age in Morristown
Sex and Age in Morristown
The most populous age groups in Morristown are 25 to 29 Years (1,294 | 8.8%) for men and 20 to 24 Years (1,191 | 7.5%) for women.
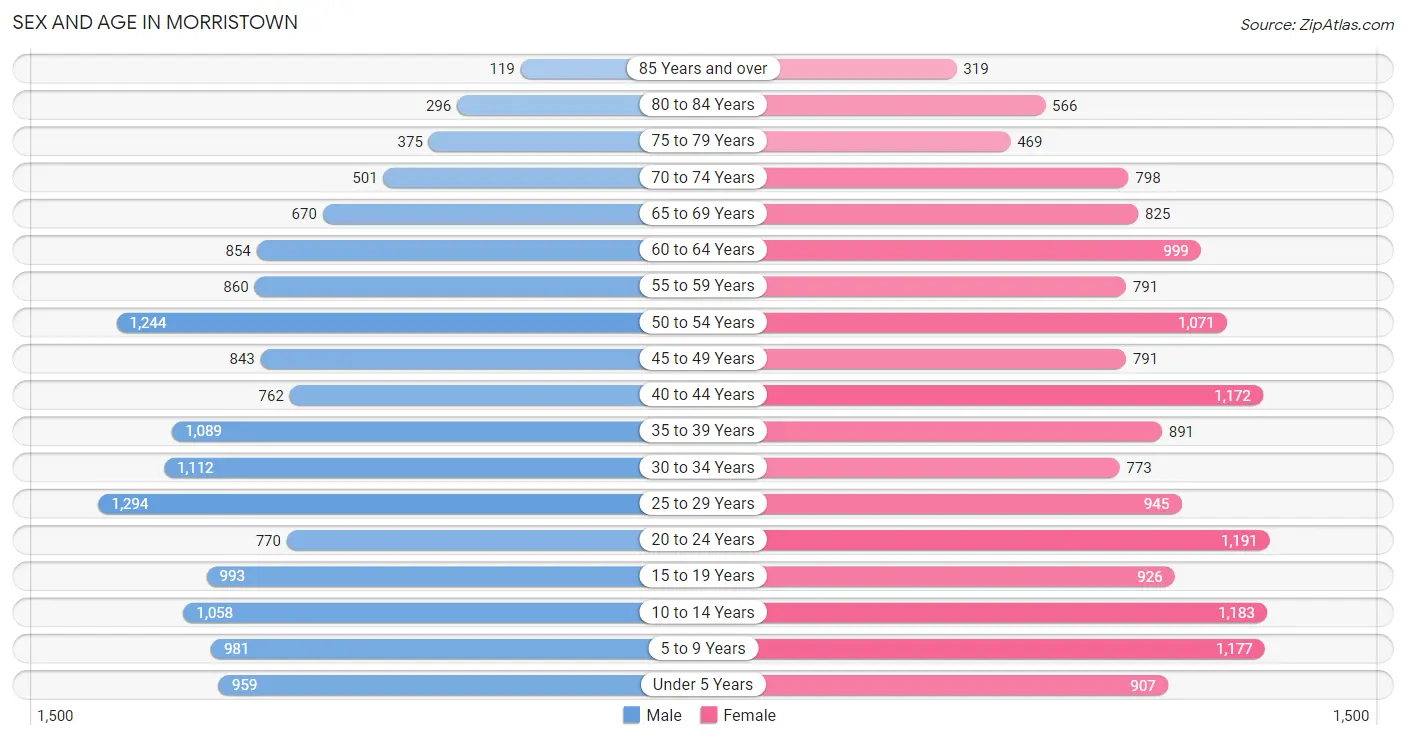
| Age Bracket | Male | Female |
| Under 5 Years | 959 (6.5%) | 907 (5.7%) |
| 5 to 9 Years | 981 (6.6%) | 1,177 (7.4%) |
| 10 to 14 Years | 1,058 (7.2%) | 1,183 (7.5%) |
| 15 to 19 Years | 993 (6.7%) | 926 (5.9%) |
| 20 to 24 Years | 770 (5.2%) | 1,191 (7.5%) |
| 25 to 29 Years | 1,294 (8.8%) | 945 (6.0%) |
| 30 to 34 Years | 1,112 (7.5%) | 773 (4.9%) |
| 35 to 39 Years | 1,089 (7.4%) | 891 (5.6%) |
| 40 to 44 Years | 762 (5.2%) | 1,172 (7.4%) |
| 45 to 49 Years | 843 (5.7%) | 791 (5.0%) |
| 50 to 54 Years | 1,244 (8.4%) | 1,071 (6.8%) |
| 55 to 59 Years | 860 (5.8%) | 791 (5.0%) |
| 60 to 64 Years | 854 (5.8%) | 999 (6.3%) |
| 65 to 69 Years | 670 (4.5%) | 825 (5.2%) |
| 70 to 74 Years | 501 (3.4%) | 798 (5.1%) |
| 75 to 79 Years | 375 (2.5%) | 469 (3.0%) |
| 80 to 84 Years | 296 (2.0%) | 566 (3.6%) |
| 85 Years and over | 119 (0.8%) | 319 (2.0%) |
| Total | 14,780 (100.0%) | 15,794 (100.0%) |
Families and Households in Morristown
Median Family Size in Morristown
The median family size in Morristown is 3.15 persons per family, with single female/mother families (1,999 | 28.2%) accounting for the largest median family size of 3.39 persons per family. On the other hand, single male/father families (790 | 11.1%) represent the smallest median family size with 2.67 persons per family.
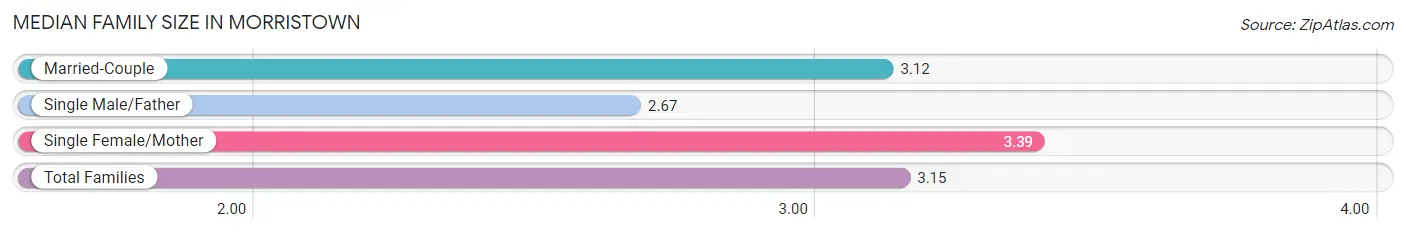
| Family Type | # Families | Family Size |
| Married-Couple | 4,307 (60.7%) | 3.12 |
| Single Male/Father | 790 (11.1%) | 2.67 |
| Single Female/Mother | 1,999 (28.2%) | 3.39 |
| Total Families | 7,096 (100.0%) | 3.15 |
Median Household Size in Morristown
The median household size in Morristown is 2.42 persons per household, with single female/mother households (1,999 | 16.2%) accounting for the largest median household size of 3.48 persons per household. non-family households (5,221 | 42.4%) represent the smallest median household size with 1.34 persons per household.
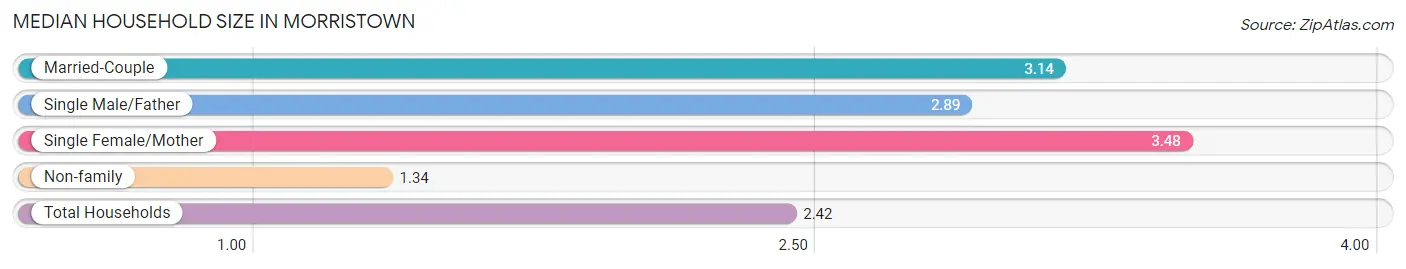
| Household Type | # Households | Household Size |
| Married-Couple | 4,307 (35.0%) | 3.14 |
| Single Male/Father | 790 (6.4%) | 2.89 |
| Single Female/Mother | 1,999 (16.2%) | 3.48 |
| Non-family | 5,221 (42.4%) | 1.34 |
| Total Households | 12,317 (100.0%) | 2.42 |
Household Size by Marriage Status in Morristown
Out of a total of 12,317 households in Morristown, 7,096 (57.6%) are family households, while 5,221 (42.4%) are nonfamily households. The most numerous type of family households are 2-person households, comprising 3,133, and the most common type of nonfamily households are 1-person households, comprising 4,230.
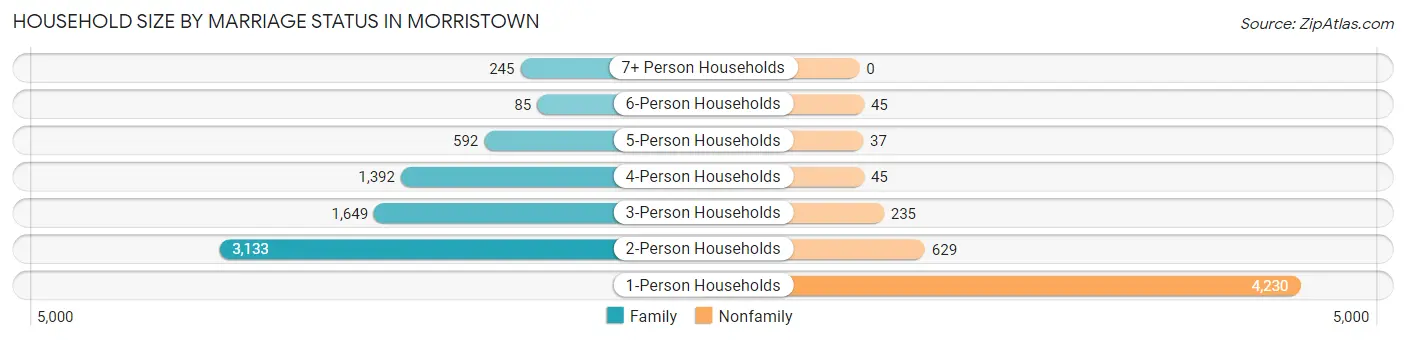
| Household Size | Family Households | Nonfamily Households |
| 1-Person Households | - | 4,230 (34.3%) |
| 2-Person Households | 3,133 (25.4%) | 629 (5.1%) |
| 3-Person Households | 1,649 (13.4%) | 235 (1.9%) |
| 4-Person Households | 1,392 (11.3%) | 45 (0.4%) |
| 5-Person Households | 592 (4.8%) | 37 (0.3%) |
| 6-Person Households | 85 (0.7%) | 45 (0.4%) |
| 7+ Person Households | 245 (2.0%) | 0 (0.0%) |
| Total | 7,096 (57.6%) | 5,221 (42.4%) |
Female Fertility in Morristown
Fertility by Age in Morristown
Average fertility rate in Morristown is 39.0 births per 1,000 women. Women in the age bracket of 20 to 34 years have the highest fertility rate with 87.0 births per 1,000 women. Women in the age bracket of 20 to 34 years acount for 93.0% of all women with births.
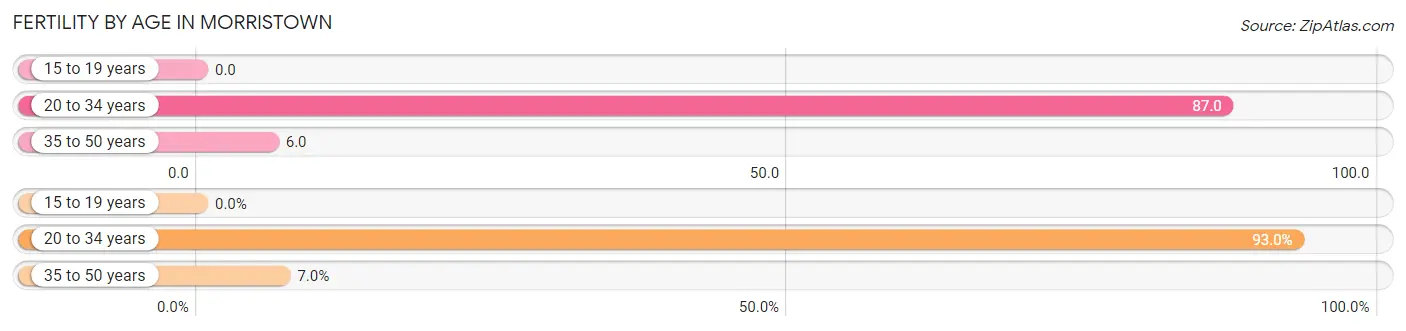
| Age Bracket | Women with Births | Births / 1,000 Women |
| 15 to 19 years | 0 (0.0%) | 0.0 |
| 20 to 34 years | 253 (93.0%) | 87.0 |
| 35 to 50 years | 19 (7.0%) | 6.0 |
| Total | 272 (100.0%) | 39.0 |
Fertility by Age by Marriage Status in Morristown
70.6% of women with births (272) in Morristown are married. The highest percentage of unmarried women with births falls into 20 to 34 years age bracket with 31.6% of them unmarried at the time of birth, while the lowest percentage of unmarried women with births belong to 35 to 50 years age bracket with 0.0% of them unmarried.
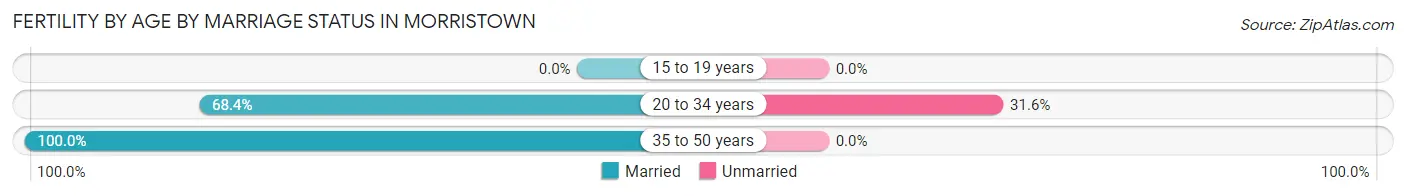
| Age Bracket | Married | Unmarried |
| 15 to 19 years | 0 (0.0%) | 0 (0.0%) |
| 20 to 34 years | 173 (68.4%) | 80 (31.6%) |
| 35 to 50 years | 19 (100.0%) | 0 (0.0%) |
| Total | 192 (70.6%) | 80 (29.4%) |
Fertility by Education in Morristown
Average fertility rate in Morristown is 39.0 births per 1,000 women. Women with the education attainment of high school diploma have the highest fertility rate of 45.0 births per 1,000 women, while women with the education attainment of less than high school have the lowest fertility at 27.0 births per 1,000 women. Women with the education attainment of college or associate's degree represent 38.6% of all women with births.
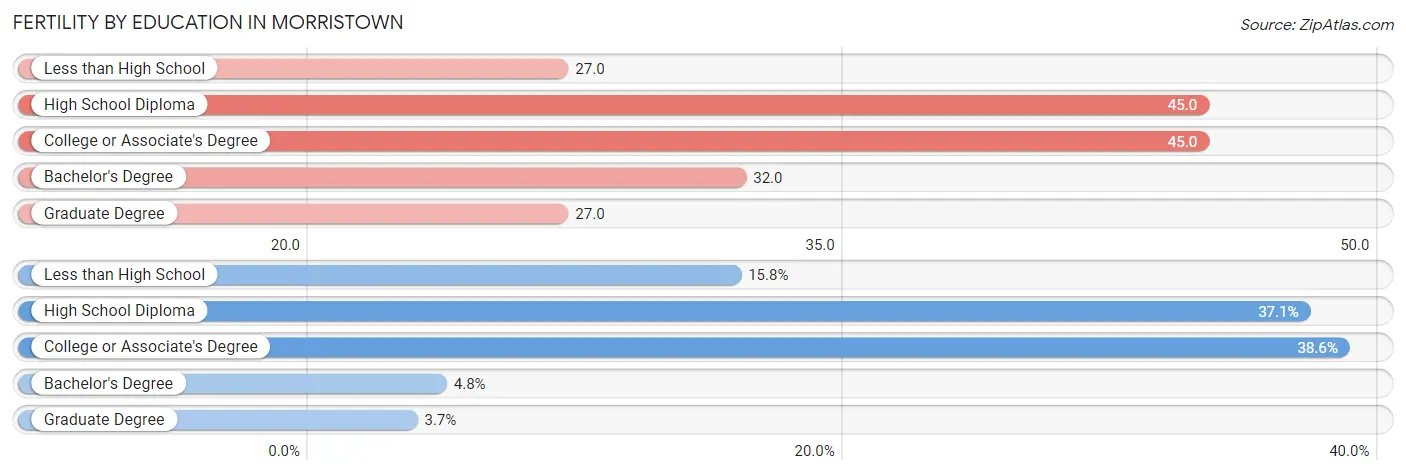
| Educational Attainment | Women with Births | Births / 1,000 Women |
| Less than High School | 43 (15.8%) | 27.0 |
| High School Diploma | 101 (37.1%) | 45.0 |
| College or Associate's Degree | 105 (38.6%) | 45.0 |
| Bachelor's Degree | 13 (4.8%) | 32.0 |
| Graduate Degree | 10 (3.7%) | 27.0 |
| Total | 272 (100.0%) | 39.0 |
Fertility by Education by Marriage Status in Morristown
29.4% of women with births in Morristown are unmarried. Women with the educational attainment of less than high school are most likely to be married with 100.0% of them married at childbirth, while women with the educational attainment of high school diploma are least likely to be married with 79.2% of them unmarried at childbirth.
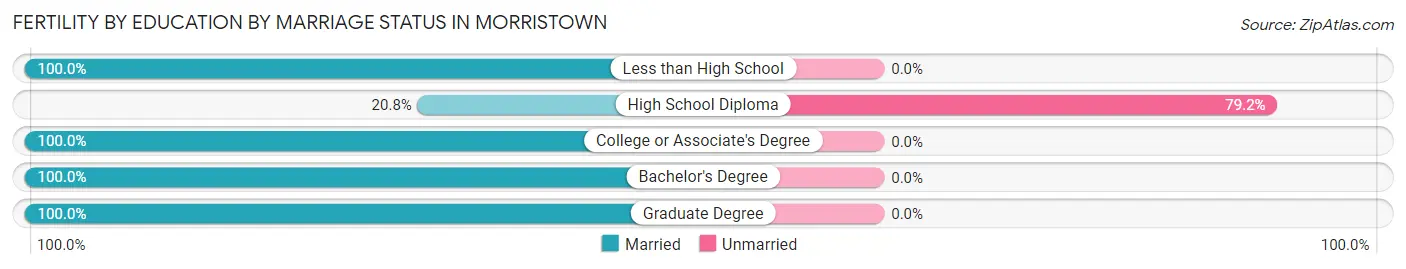
| Educational Attainment | Married | Unmarried |
| Less than High School | 43 (100.0%) | 0 (0.0%) |
| High School Diploma | 21 (20.8%) | 80 (79.2%) |
| College or Associate's Degree | 105 (100.0%) | 0 (0.0%) |
| Bachelor's Degree | 13 (100.0%) | 0 (0.0%) |
| Graduate Degree | 10 (100.0%) | 0 (0.0%) |
| Total | 192 (70.6%) | 80 (29.4%) |
Employment Characteristics in Morristown
Employment by Class of Employer in Morristown
Among the 11,938 employed individuals in Morristown, private company employees (9,266 | 77.6%), self-employed (not incorporated) (815 | 6.8%), and local government employees (602 | 5.0%) make up the most common classes of employment.
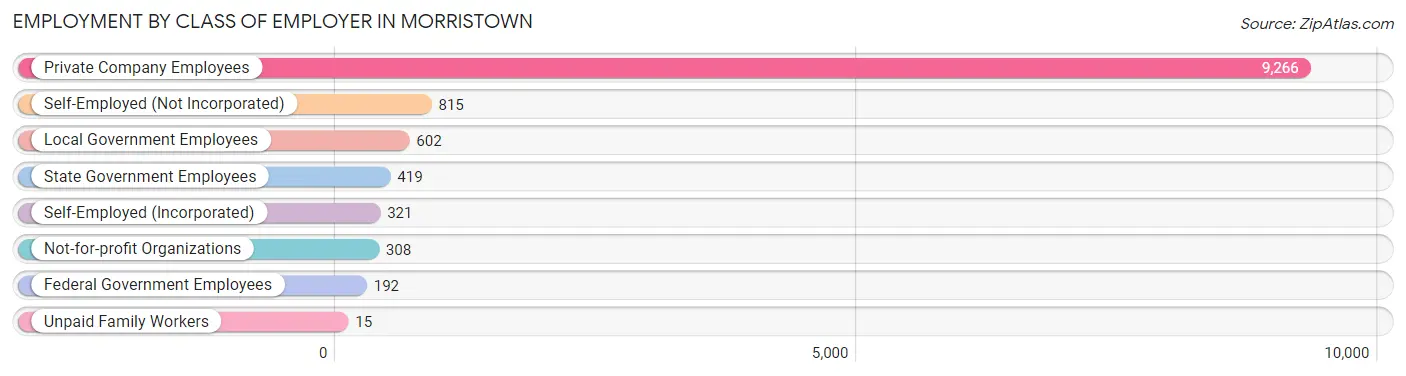
| Employer Class | # Employees | % Employees |
| Private Company Employees | 9,266 | 77.6% |
| Self-Employed (Incorporated) | 321 | 2.7% |
| Self-Employed (Not Incorporated) | 815 | 6.8% |
| Not-for-profit Organizations | 308 | 2.6% |
| Local Government Employees | 602 | 5.0% |
| State Government Employees | 419 | 3.5% |
| Federal Government Employees | 192 | 1.6% |
| Unpaid Family Workers | 15 | 0.1% |
| Total | 11,938 | 100.0% |
Employment Status by Age in Morristown
According to the labor force statistics for Morristown, out of the total population over 16 years of age (23,804), 55.0% or 13,092 individuals are in the labor force, with 8.1% or 1,060 of them unemployed. The age group with the highest labor force participation rate is 25 to 29 years, with 80.5% or 1,802 individuals in the labor force. Within the labor force, the 55 to 59 years age range has the highest percentage of unemployed individuals, with 15.6% or 124 of them being unemployed.
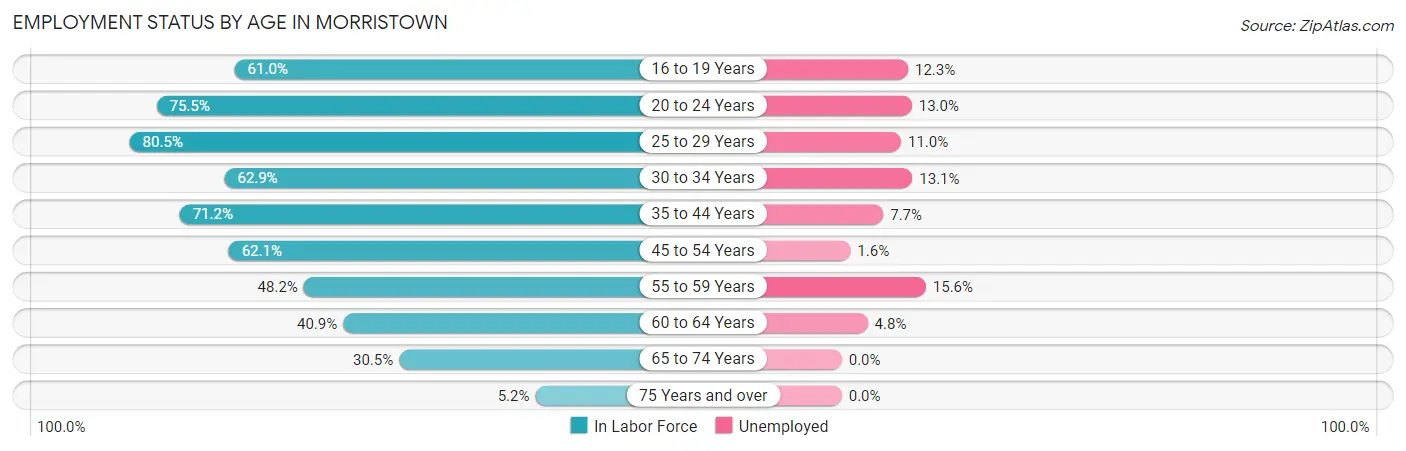
| Age Bracket | In Labor Force | Unemployed |
| 16 to 19 Years | 863 (61.0%) | 106 (12.3%) |
| 20 to 24 Years | 1,481 (75.5%) | 193 (13.0%) |
| 25 to 29 Years | 1,802 (80.5%) | 198 (11.0%) |
| 30 to 34 Years | 1,186 (62.9%) | 155 (13.1%) |
| 35 to 44 Years | 2,787 (71.2%) | 215 (7.7%) |
| 45 to 54 Years | 2,452 (62.1%) | 39 (1.6%) |
| 55 to 59 Years | 796 (48.2%) | 124 (15.6%) |
| 60 to 64 Years | 758 (40.9%) | 36 (4.8%) |
| 65 to 74 Years | 852 (30.5%) | 0 (0.0%) |
| 75 Years and over | 111 (5.2%) | 0 (0.0%) |
| Total | 13,092 (55.0%) | 1,060 (8.1%) |
Employment Status by Educational Attainment in Morristown
According to labor force statistics for Morristown, 63.1% of individuals (9,775) out of the total population between 25 and 64 years of age (15,491) are in the labor force, with 7.9% or 772 of them being unemployed. The group with the highest labor force participation rate are those with the educational attainment of bachelor's degree or higher, with 72.5% or 1,781 individuals in the labor force. Within the labor force, individuals with high school diploma education have the highest percentage of unemployment, with 14.6% or 551 of them being unemployed.
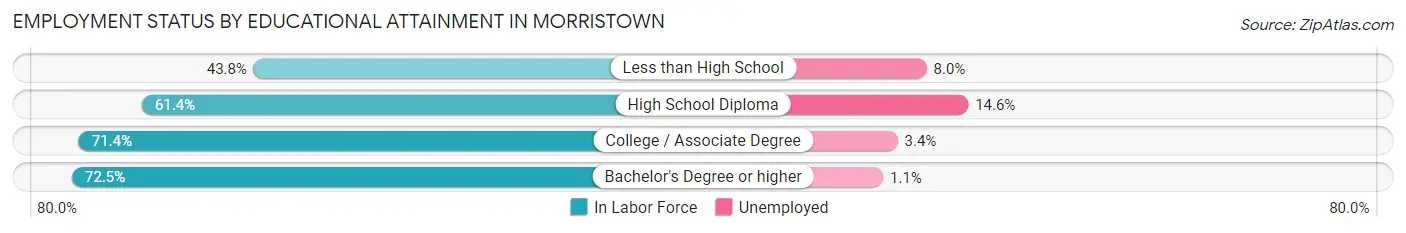
| Educational Attainment | In Labor Force | Unemployed |
| Less than High School | 1,104 (43.8%) | 202 (8.0%) |
| High School Diploma | 3,772 (61.4%) | 897 (14.6%) |
| College / Associate Degree | 3,120 (71.4%) | 149 (3.4%) |
| Bachelor's Degree or higher | 1,781 (72.5%) | 27 (1.1%) |
| Total | 9,775 (63.1%) | 1,224 (7.9%) |
Employment Occupations by Sex in Morristown
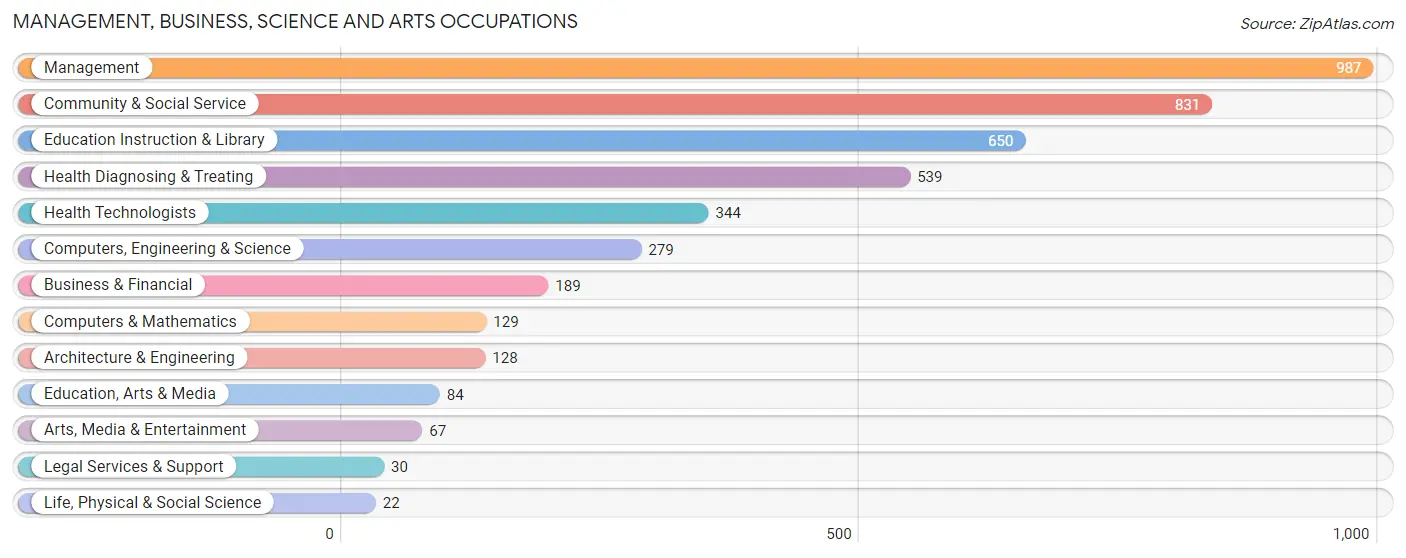
Management, Business, Science and Arts Occupations
The most common Management, Business, Science and Arts occupations in Morristown are Management (987 | 8.2%), Community & Social Service (831 | 6.9%), Education Instruction & Library (650 | 5.4%), Health Diagnosing & Treating (539 | 4.5%), and Health Technologists (344 | 2.9%).
Management, Business, Science and Arts Occupations by Sex
Within the Management, Business, Science and Arts occupations in Morristown, the most male-oriented occupations are Architecture & Engineering (100.0%), Arts, Media & Entertainment (100.0%), and Computers & Mathematics (92.2%), while the most female-oriented occupations are Life, Physical & Social Science (100.0%), Education Instruction & Library (72.3%), and Education, Arts & Media (69.1%).
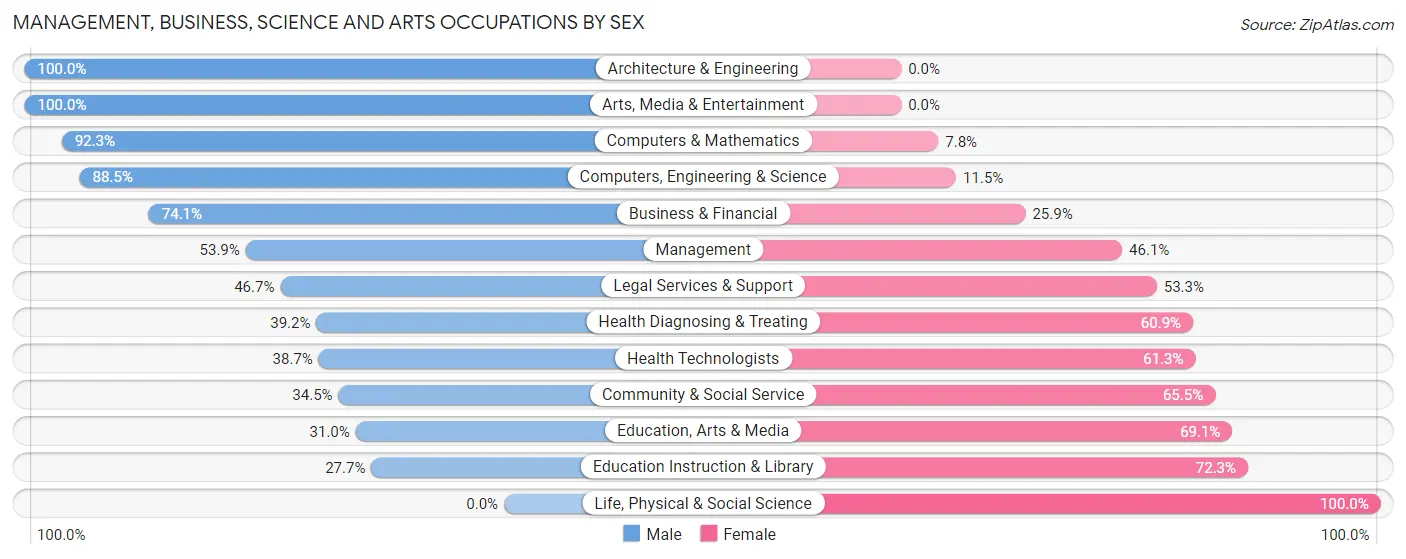
| Occupation | Male | Female |
| Management | 532 (53.9%) | 455 (46.1%) |
| Business & Financial | 140 (74.1%) | 49 (25.9%) |
| Computers, Engineering & Science | 247 (88.5%) | 32 (11.5%) |
| Computers & Mathematics | 119 (92.2%) | 10 (7.7%) |
| Architecture & Engineering | 128 (100.0%) | 0 (0.0%) |
| Life, Physical & Social Science | 0 (0.0%) | 22 (100.0%) |
| Community & Social Service | 287 (34.5%) | 544 (65.5%) |
| Education, Arts & Media | 26 (30.9%) | 58 (69.1%) |
| Legal Services & Support | 14 (46.7%) | 16 (53.3%) |
| Education Instruction & Library | 180 (27.7%) | 470 (72.3%) |
| Arts, Media & Entertainment | 67 (100.0%) | 0 (0.0%) |
| Health Diagnosing & Treating | 211 (39.2%) | 328 (60.9%) |
| Health Technologists | 133 (38.7%) | 211 (61.3%) |
| Total (Category) | 1,417 (50.2%) | 1,408 (49.8%) |
| Total (Overall) | 6,189 (51.6%) | 5,799 (48.4%) |
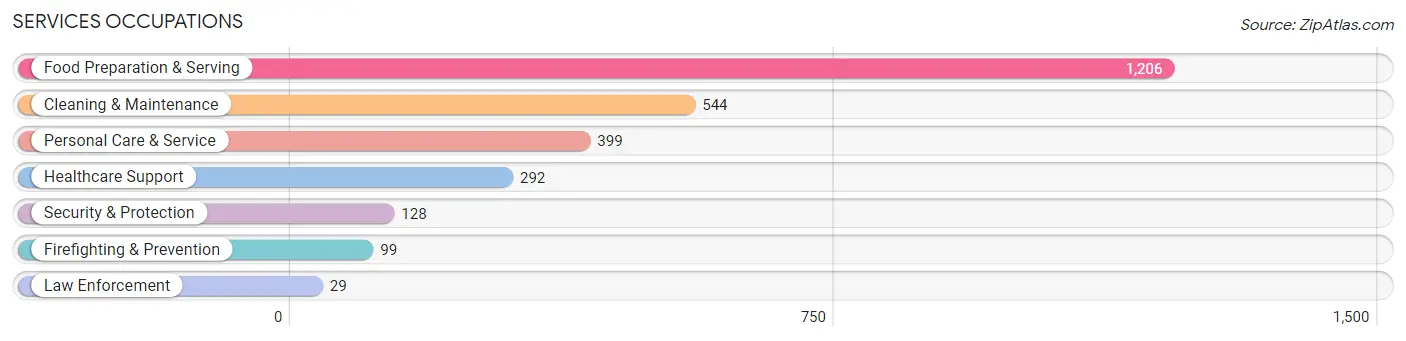
Services Occupations
The most common Services occupations in Morristown are Food Preparation & Serving (1,206 | 10.1%), Cleaning & Maintenance (544 | 4.5%), Personal Care & Service (399 | 3.3%), Healthcare Support (292 | 2.4%), and Security & Protection (128 | 1.1%).
Services Occupations by Sex
Within the Services occupations in Morristown, the most male-oriented occupations are Law Enforcement (100.0%), Security & Protection (80.5%), and Cleaning & Maintenance (79.8%), while the most female-oriented occupations are Personal Care & Service (88.2%), Healthcare Support (83.9%), and Food Preparation & Serving (49.5%).
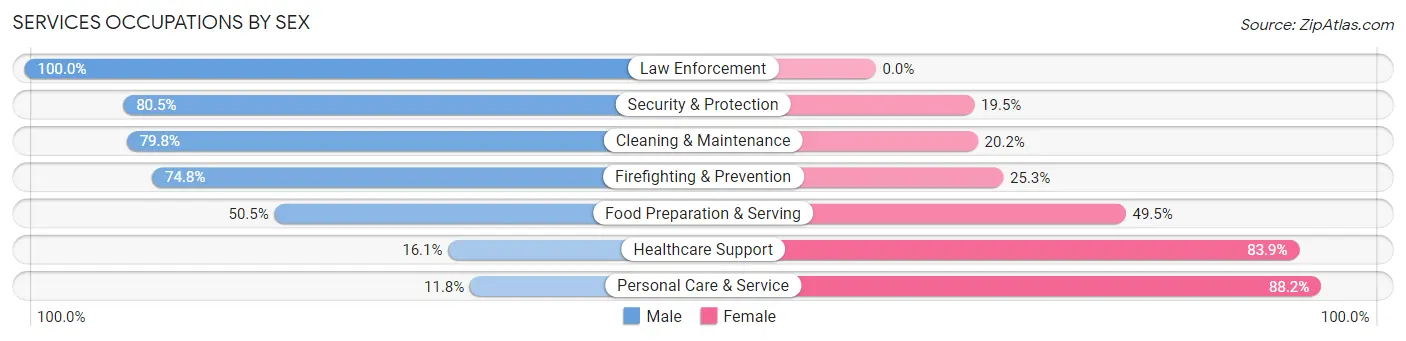
| Occupation | Male | Female |
| Healthcare Support | 47 (16.1%) | 245 (83.9%) |
| Security & Protection | 103 (80.5%) | 25 (19.5%) |
| Firefighting & Prevention | 74 (74.8%) | 25 (25.3%) |
| Law Enforcement | 29 (100.0%) | 0 (0.0%) |
| Food Preparation & Serving | 609 (50.5%) | 597 (49.5%) |
| Cleaning & Maintenance | 434 (79.8%) | 110 (20.2%) |
| Personal Care & Service | 47 (11.8%) | 352 (88.2%) |
| Total (Category) | 1,240 (48.3%) | 1,329 (51.7%) |
| Total (Overall) | 6,189 (51.6%) | 5,799 (48.4%) |
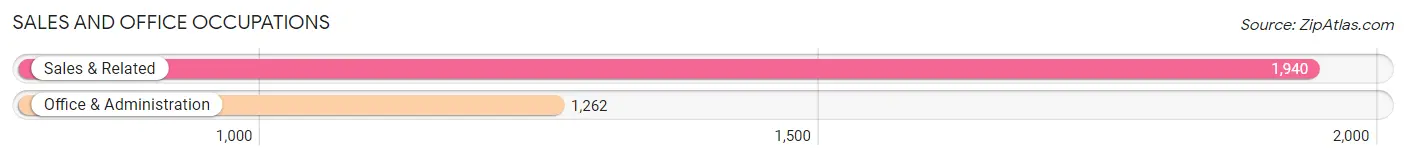
Sales and Office Occupations
The most common Sales and Office occupations in Morristown are Sales & Related (1,940 | 16.2%), and Office & Administration (1,262 | 10.5%).
Sales and Office Occupations by Sex
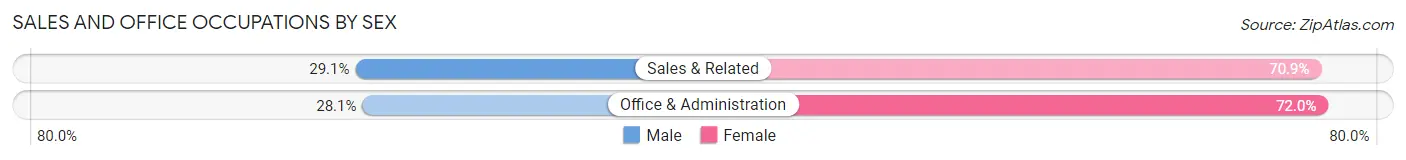
| Occupation | Male | Female |
| Sales & Related | 565 (29.1%) | 1,375 (70.9%) |
| Office & Administration | 354 (28.1%) | 908 (72.0%) |
| Total (Category) | 919 (28.7%) | 2,283 (71.3%) |
| Total (Overall) | 6,189 (51.6%) | 5,799 (48.4%) |
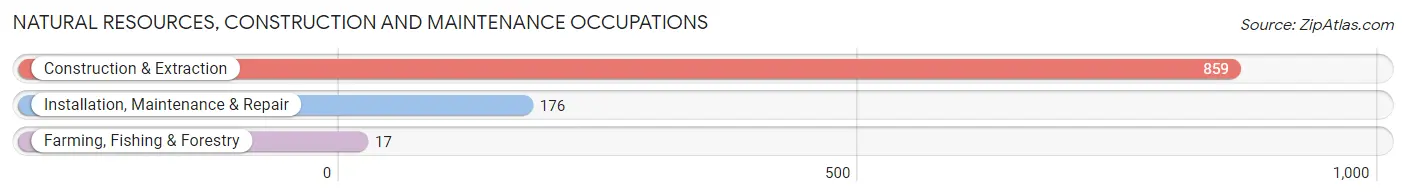
Natural Resources, Construction and Maintenance Occupations
The most common Natural Resources, Construction and Maintenance occupations in Morristown are Construction & Extraction (859 | 7.2%), Installation, Maintenance & Repair (176 | 1.5%), and Farming, Fishing & Forestry (17 | 0.1%).
Natural Resources, Construction and Maintenance Occupations by Sex
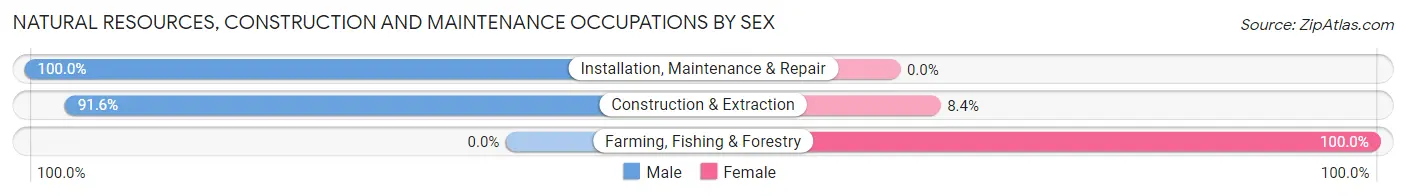
| Occupation | Male | Female |
| Farming, Fishing & Forestry | 0 (0.0%) | 17 (100.0%) |
| Construction & Extraction | 787 (91.6%) | 72 (8.4%) |
| Installation, Maintenance & Repair | 176 (100.0%) | 0 (0.0%) |
| Total (Category) | 963 (91.5%) | 89 (8.5%) |
| Total (Overall) | 6,189 (51.6%) | 5,799 (48.4%) |
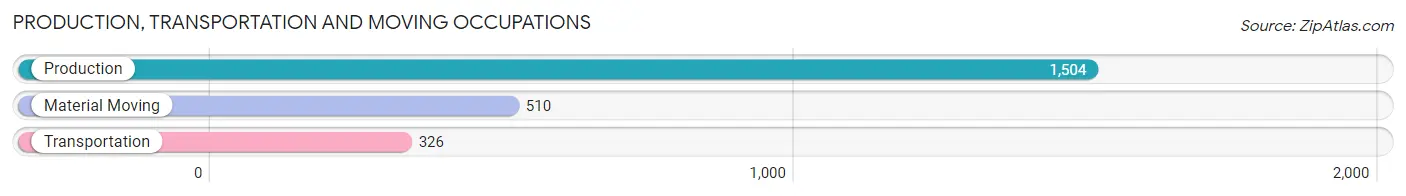
Production, Transportation and Moving Occupations
The most common Production, Transportation and Moving occupations in Morristown are Production (1,504 | 12.6%), Material Moving (510 | 4.3%), and Transportation (326 | 2.7%).
Production, Transportation and Moving Occupations by Sex
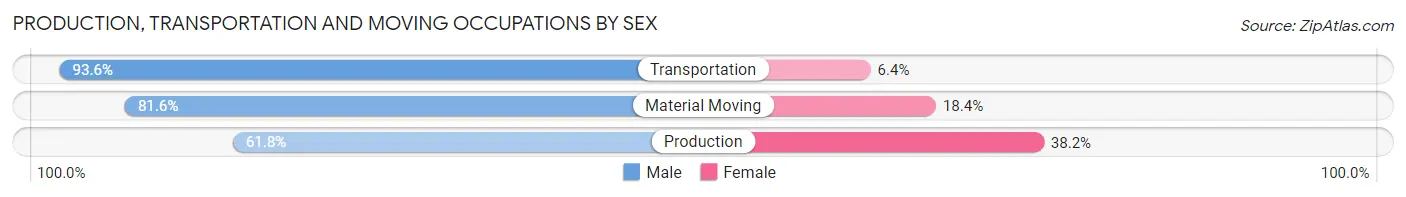
| Occupation | Male | Female |
| Production | 929 (61.8%) | 575 (38.2%) |
| Transportation | 305 (93.6%) | 21 (6.4%) |
| Material Moving | 416 (81.6%) | 94 (18.4%) |
| Total (Category) | 1,650 (70.5%) | 690 (29.5%) |
| Total (Overall) | 6,189 (51.6%) | 5,799 (48.4%) |
Employment Industries by Sex in Morristown
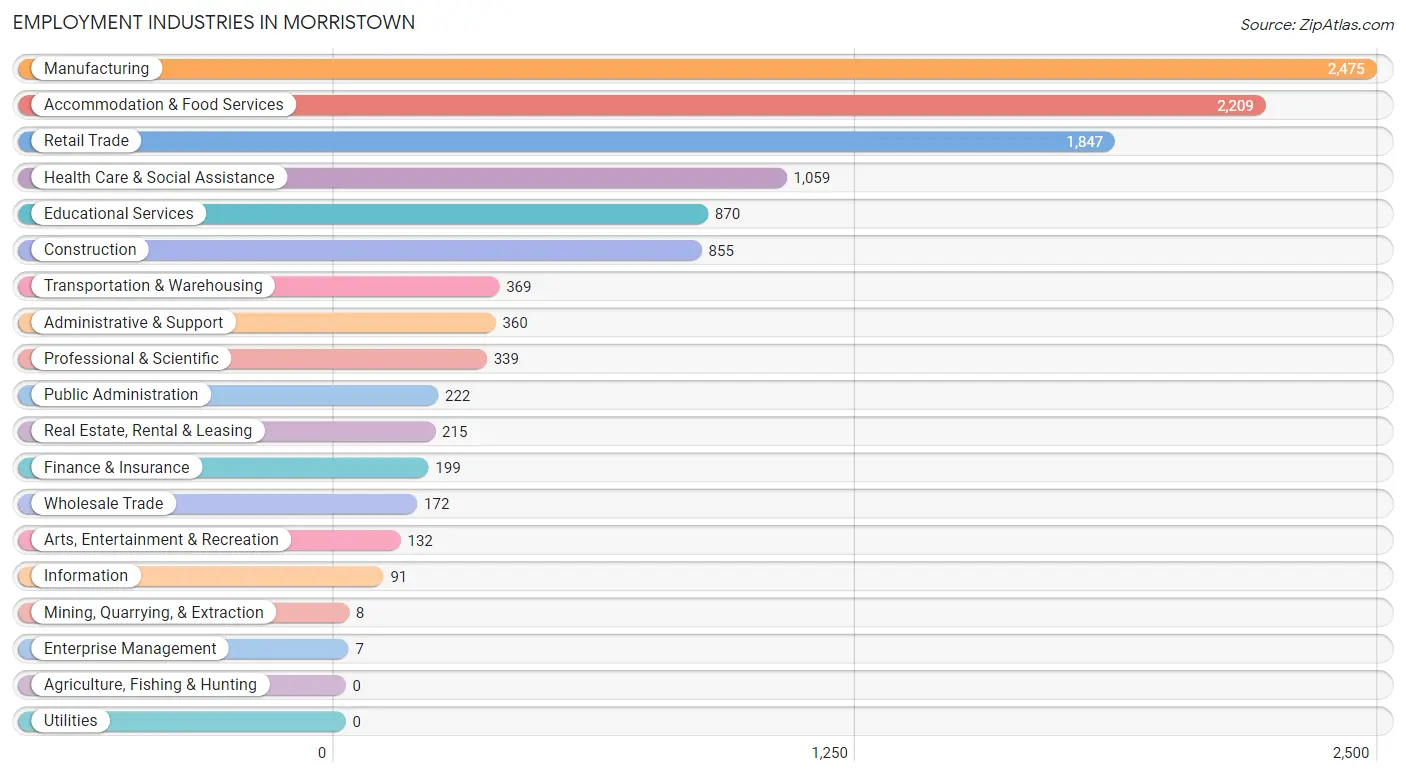
Employment Industries in Morristown
The major employment industries in Morristown include Manufacturing (2,475 | 20.6%), Accommodation & Food Services (2,209 | 18.4%), Retail Trade (1,847 | 15.4%), Health Care & Social Assistance (1,059 | 8.8%), and Educational Services (870 | 7.3%).
Employment Industries by Sex in Morristown
The Morristown industries that see more men than women are Mining, Quarrying, & Extraction (100.0%), Construction (94.9%), and Arts, Entertainment & Recreation (84.1%), whereas the industries that tend to have a higher number of women are Enterprise Management (100.0%), Health Care & Social Assistance (74.8%), and Professional & Scientific (67.0%).
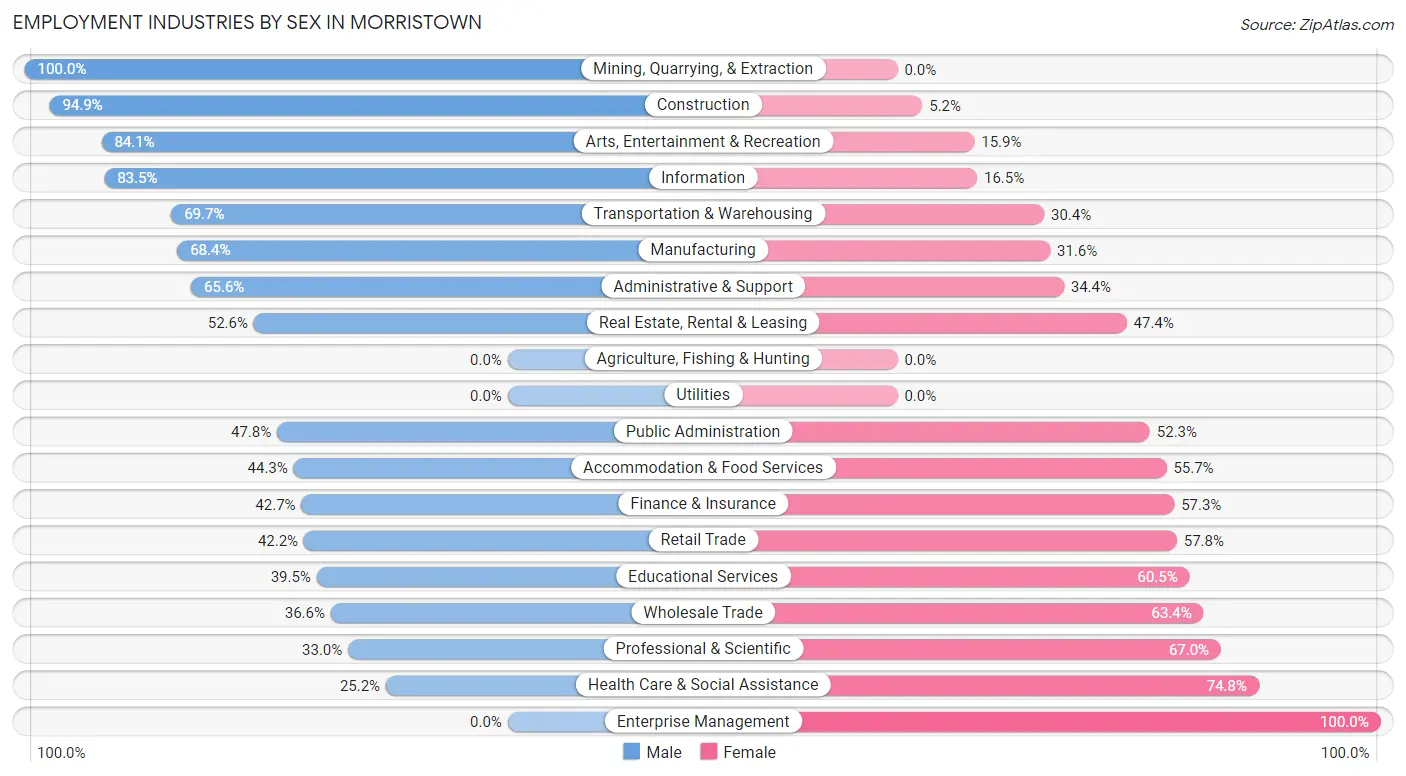
| Industry | Male | Female |
| Agriculture, Fishing & Hunting | 0 (0.0%) | 0 (0.0%) |
| Mining, Quarrying, & Extraction | 8 (100.0%) | 0 (0.0%) |
| Construction | 811 (94.9%) | 44 (5.1%) |
| Manufacturing | 1,693 (68.4%) | 782 (31.6%) |
| Wholesale Trade | 63 (36.6%) | 109 (63.4%) |
| Retail Trade | 779 (42.2%) | 1,068 (57.8%) |
| Transportation & Warehousing | 257 (69.7%) | 112 (30.3%) |
| Utilities | 0 (0.0%) | 0 (0.0%) |
| Information | 76 (83.5%) | 15 (16.5%) |
| Finance & Insurance | 85 (42.7%) | 114 (57.3%) |
| Real Estate, Rental & Leasing | 113 (52.6%) | 102 (47.4%) |
| Professional & Scientific | 112 (33.0%) | 227 (67.0%) |
| Enterprise Management | 0 (0.0%) | 7 (100.0%) |
| Administrative & Support | 236 (65.6%) | 124 (34.4%) |
| Educational Services | 344 (39.5%) | 526 (60.5%) |
| Health Care & Social Assistance | 267 (25.2%) | 792 (74.8%) |
| Arts, Entertainment & Recreation | 111 (84.1%) | 21 (15.9%) |
| Accommodation & Food Services | 979 (44.3%) | 1,230 (55.7%) |
| Public Administration | 106 (47.7%) | 116 (52.2%) |
| Total | 6,189 (51.6%) | 5,799 (48.4%) |
Education in Morristown
School Enrollment in Morristown
The most common levels of schooling among the 7,321 students in Morristown are middle school (1,728 | 23.6%), high school (1,642 | 22.4%), and elementary school (1,549 | 21.2%).
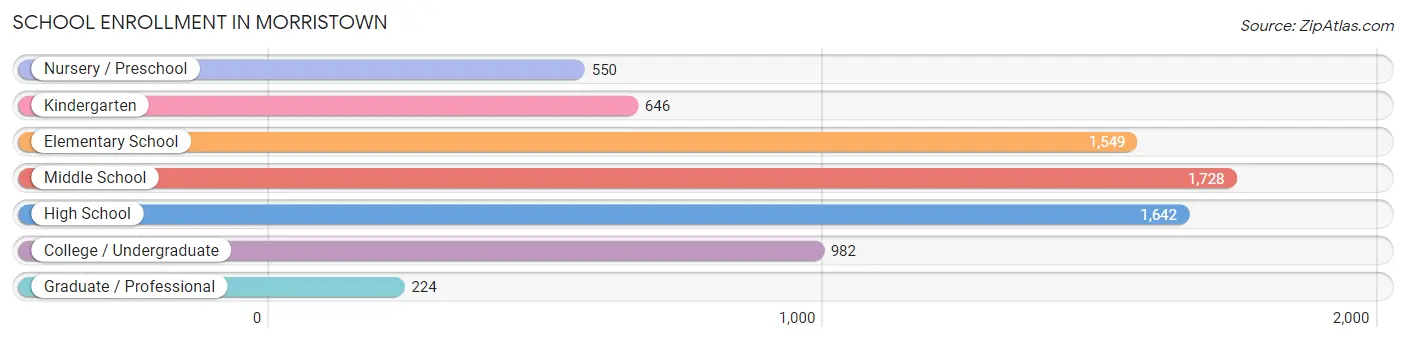
| School Level | # Students | % Students |
| Nursery / Preschool | 550 | 7.5% |
| Kindergarten | 646 | 8.8% |
| Elementary School | 1,549 | 21.2% |
| Middle School | 1,728 | 23.6% |
| High School | 1,642 | 22.4% |
| College / Undergraduate | 982 | 13.4% |
| Graduate / Professional | 224 | 3.1% |
| Total | 7,321 | 100.0% |
School Enrollment by Age by Funding Source in Morristown
Out of a total of 7,321 students who are enrolled in schools in Morristown, 476 (6.5%) attend a private institution, while the remaining 6,845 (93.5%) are enrolled in public schools. The age group of 35 years and over has the highest likelihood of being enrolled in private schools, with 41 (30.6% in the age bracket) enrolled. Conversely, the age group of 18 to 19 year olds has the lowest likelihood of being enrolled in a private school, with 534 (100.0% in the age bracket) attending a public institution.
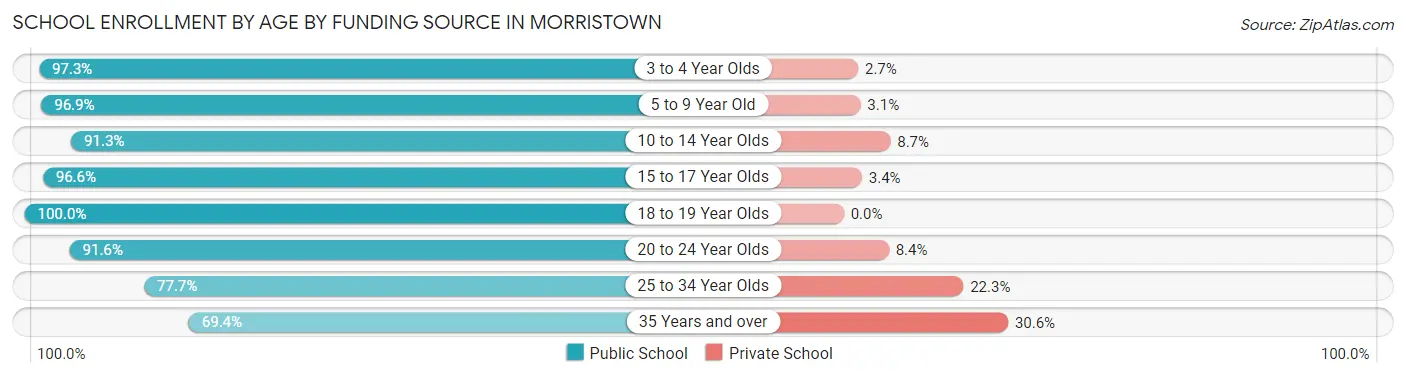
| Age Bracket | Public School | Private School |
| 3 to 4 Year Olds | 399 (97.3%) | 11 (2.7%) |
| 5 to 9 Year Old | 2,046 (96.9%) | 66 (3.1%) |
| 10 to 14 Year Olds | 2,000 (91.3%) | 190 (8.7%) |
| 15 to 17 Year Olds | 1,168 (96.6%) | 41 (3.4%) |
| 18 to 19 Year Olds | 534 (100.0%) | 0 (0.0%) |
| 20 to 24 Year Olds | 251 (91.6%) | 23 (8.4%) |
| 25 to 34 Year Olds | 356 (77.7%) | 102 (22.3%) |
| 35 Years and over | 93 (69.4%) | 41 (30.6%) |
| Total | 6,845 (93.5%) | 476 (6.5%) |
Educational Attainment by Field of Study in Morristown
Business (716 | 21.6%), education (647 | 19.5%), bio, nature & agricultural (420 | 12.7%), science & technology (380 | 11.5%), and arts & humanities (207 | 6.2%) are the most common fields of study among 3,312 individuals in Morristown who have obtained a bachelor's degree or higher.
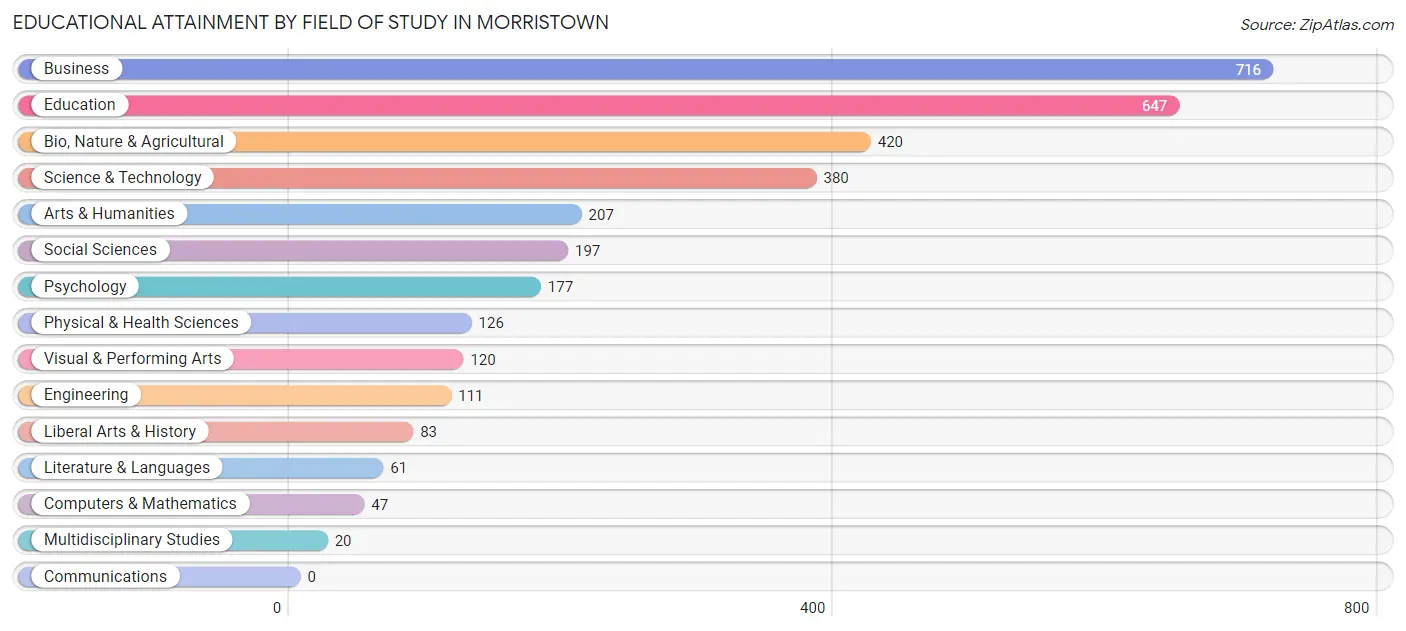
| Field of Study | # Graduates | % Graduates |
| Computers & Mathematics | 47 | 1.4% |
| Bio, Nature & Agricultural | 420 | 12.7% |
| Physical & Health Sciences | 126 | 3.8% |
| Psychology | 177 | 5.3% |
| Social Sciences | 197 | 5.9% |
| Engineering | 111 | 3.4% |
| Multidisciplinary Studies | 20 | 0.6% |
| Science & Technology | 380 | 11.5% |
| Business | 716 | 21.6% |
| Education | 647 | 19.5% |
| Literature & Languages | 61 | 1.8% |
| Liberal Arts & History | 83 | 2.5% |
| Visual & Performing Arts | 120 | 3.6% |
| Communications | 0 | 0.0% |
| Arts & Humanities | 207 | 6.2% |
| Total | 3,312 | 100.0% |
Transportation & Commute in Morristown
Vehicle Availability by Sex in Morristown
The most prevalent vehicle ownership categories in Morristown are males with 2 vehicles (2,674, accounting for 43.1%) and females with 2 vehicles (2,270, making up 46.8%).
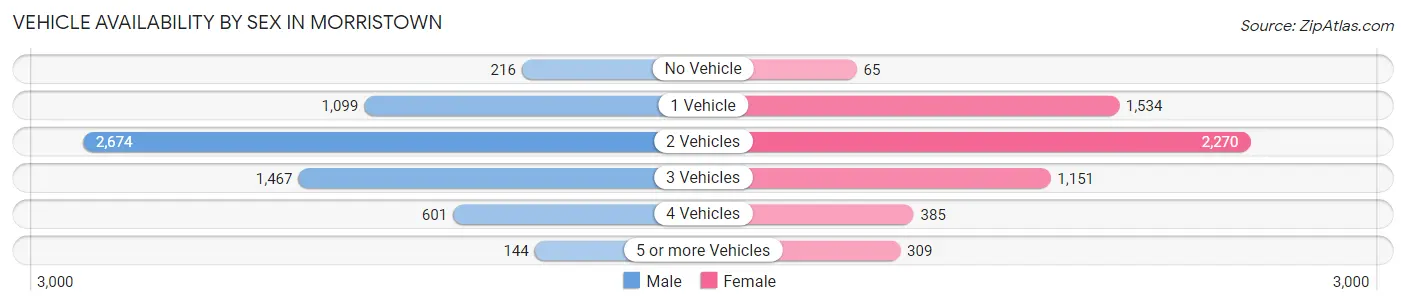
| Vehicles Available | Male | Female |
| No Vehicle | 216 (3.5%) | 65 (1.1%) |
| 1 Vehicle | 1,099 (17.7%) | 1,534 (26.9%) |
| 2 Vehicles | 2,674 (43.1%) | 2,270 (39.7%) |
| 3 Vehicles | 1,467 (23.7%) | 1,151 (20.1%) |
| 4 Vehicles | 601 (9.7%) | 385 (6.7%) |
| 5 or more Vehicles | 144 (2.3%) | 309 (5.4%) |
| Total | 6,201 (100.0%) | 5,714 (100.0%) |
Commute Time in Morristown
The most frequently occuring commute durations in Morristown are 10 to 14 minutes (2,705 commuters, 23.3%), 5 to 9 minutes (2,516 commuters, 21.7%), and 15 to 19 minutes (2,227 commuters, 19.2%).
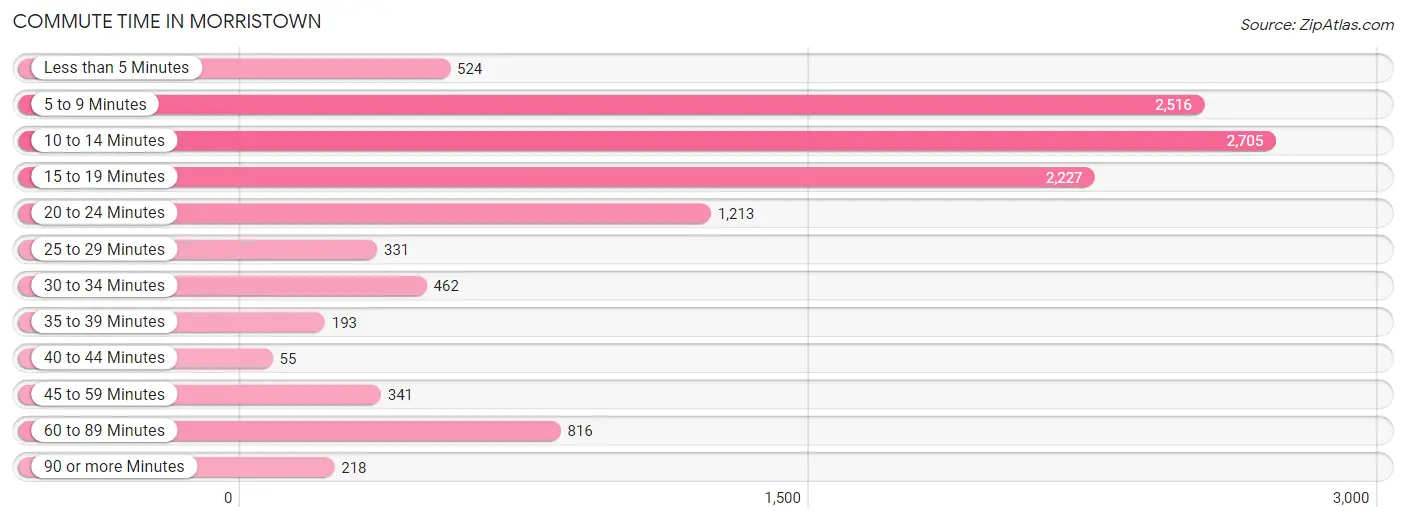
| Commute Time | # Commuters | % Commuters |
| Less than 5 Minutes | 524 | 4.5% |
| 5 to 9 Minutes | 2,516 | 21.7% |
| 10 to 14 Minutes | 2,705 | 23.3% |
| 15 to 19 Minutes | 2,227 | 19.2% |
| 20 to 24 Minutes | 1,213 | 10.5% |
| 25 to 29 Minutes | 331 | 2.9% |
| 30 to 34 Minutes | 462 | 4.0% |
| 35 to 39 Minutes | 193 | 1.7% |
| 40 to 44 Minutes | 55 | 0.5% |
| 45 to 59 Minutes | 341 | 2.9% |
| 60 to 89 Minutes | 816 | 7.0% |
| 90 or more Minutes | 218 | 1.9% |
Commute Time by Sex in Morristown
The most common commute times in Morristown are 5 to 9 minutes (1,417 commuters, 23.5%) for males and 15 to 19 minutes (1,326 commuters, 23.8%) for females.
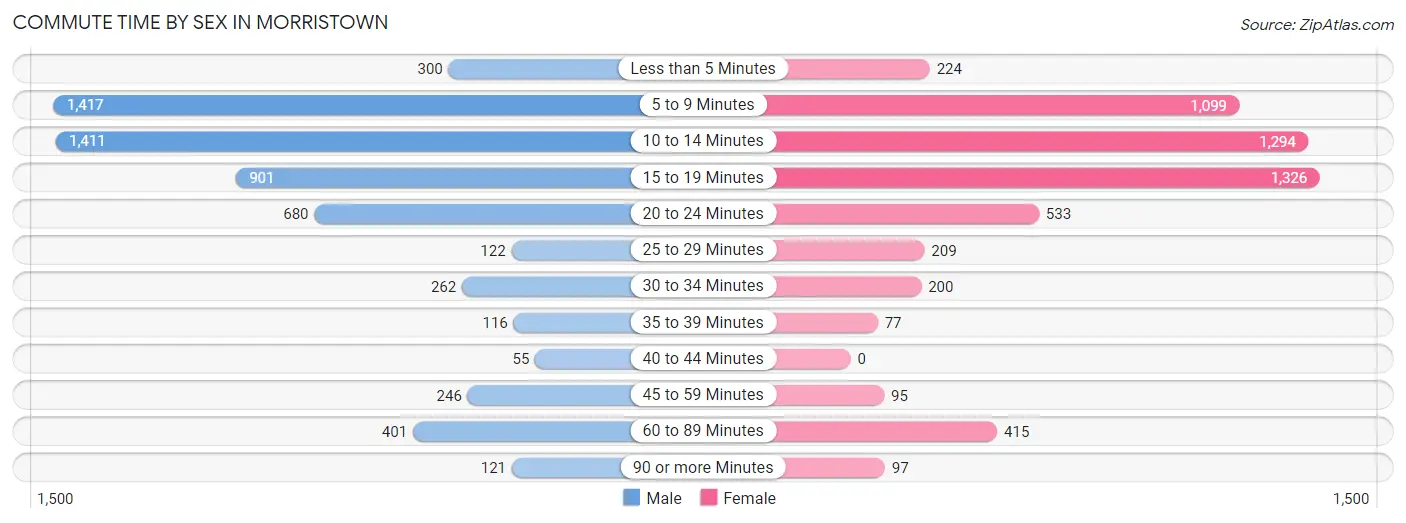
| Commute Time | Male | Female |
| Less than 5 Minutes | 300 (5.0%) | 224 (4.0%) |
| 5 to 9 Minutes | 1,417 (23.5%) | 1,099 (19.7%) |
| 10 to 14 Minutes | 1,411 (23.4%) | 1,294 (23.2%) |
| 15 to 19 Minutes | 901 (14.9%) | 1,326 (23.8%) |
| 20 to 24 Minutes | 680 (11.3%) | 533 (9.6%) |
| 25 to 29 Minutes | 122 (2.0%) | 209 (3.7%) |
| 30 to 34 Minutes | 262 (4.3%) | 200 (3.6%) |
| 35 to 39 Minutes | 116 (1.9%) | 77 (1.4%) |
| 40 to 44 Minutes | 55 (0.9%) | 0 (0.0%) |
| 45 to 59 Minutes | 246 (4.1%) | 95 (1.7%) |
| 60 to 89 Minutes | 401 (6.7%) | 415 (7.4%) |
| 90 or more Minutes | 121 (2.0%) | 97 (1.7%) |
Time of Departure to Work by Sex in Morristown
The most frequent times of departure to work in Morristown are 7:00 AM to 7:29 AM (731, 12.1%) for males and 12:00 PM to 3:59 PM (746, 13.4%) for females.
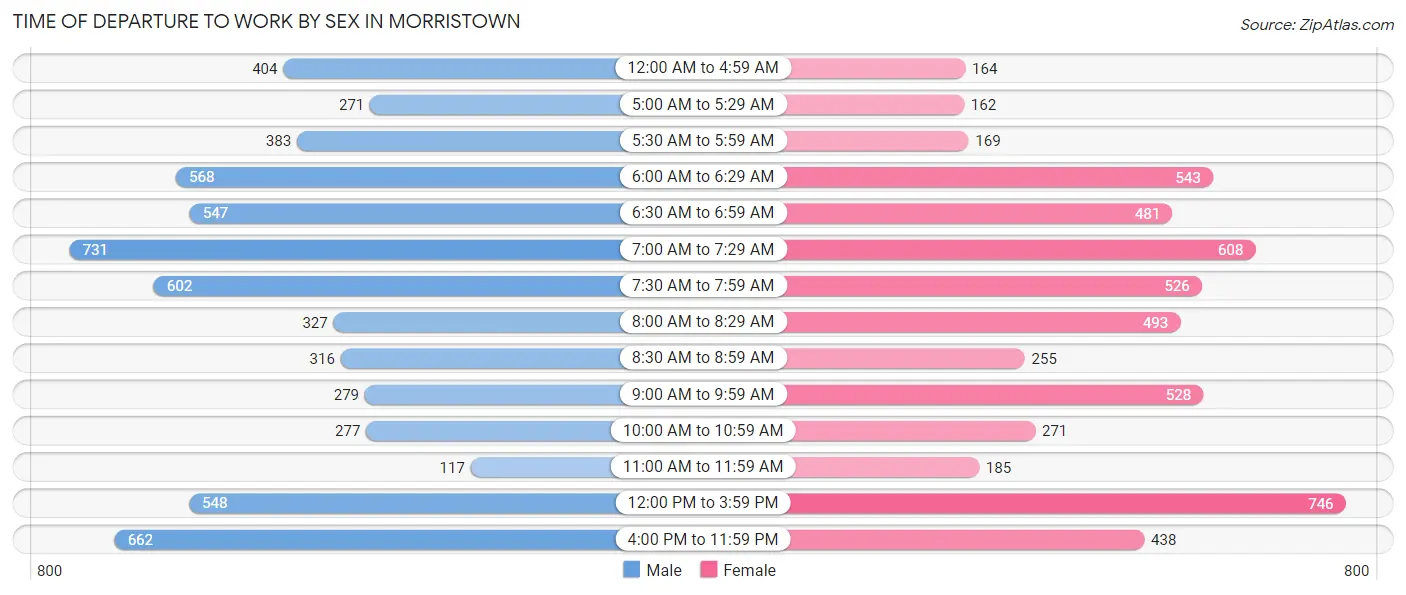
| Time of Departure | Male | Female |
| 12:00 AM to 4:59 AM | 404 (6.7%) | 164 (2.9%) |
| 5:00 AM to 5:29 AM | 271 (4.5%) | 162 (2.9%) |
| 5:30 AM to 5:59 AM | 383 (6.4%) | 169 (3.0%) |
| 6:00 AM to 6:29 AM | 568 (9.4%) | 543 (9.8%) |
| 6:30 AM to 6:59 AM | 547 (9.1%) | 481 (8.6%) |
| 7:00 AM to 7:29 AM | 731 (12.1%) | 608 (10.9%) |
| 7:30 AM to 7:59 AM | 602 (10.0%) | 526 (9.5%) |
| 8:00 AM to 8:29 AM | 327 (5.4%) | 493 (8.8%) |
| 8:30 AM to 8:59 AM | 316 (5.2%) | 255 (4.6%) |
| 9:00 AM to 9:59 AM | 279 (4.6%) | 528 (9.5%) |
| 10:00 AM to 10:59 AM | 277 (4.6%) | 271 (4.9%) |
| 11:00 AM to 11:59 AM | 117 (1.9%) | 185 (3.3%) |
| 12:00 PM to 3:59 PM | 548 (9.1%) | 746 (13.4%) |
| 4:00 PM to 11:59 PM | 662 (11.0%) | 438 (7.9%) |
| Total | 6,032 (100.0%) | 5,569 (100.0%) |
Housing Occupancy in Morristown
Occupancy by Ownership in Morristown
Of the total 12,317 dwellings in Morristown, owner-occupied units account for 6,161 (50.0%), while renter-occupied units make up 6,156 (50.0%).
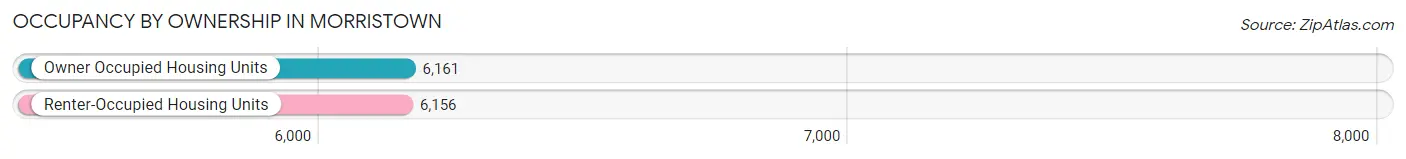
| Occupancy | # Housing Units | % Housing Units |
| Owner Occupied Housing Units | 6,161 | 50.0% |
| Renter-Occupied Housing Units | 6,156 | 50.0% |
| Total Occupied Housing Units | 12,317 | 100.0% |
Occupancy by Household Size in Morristown
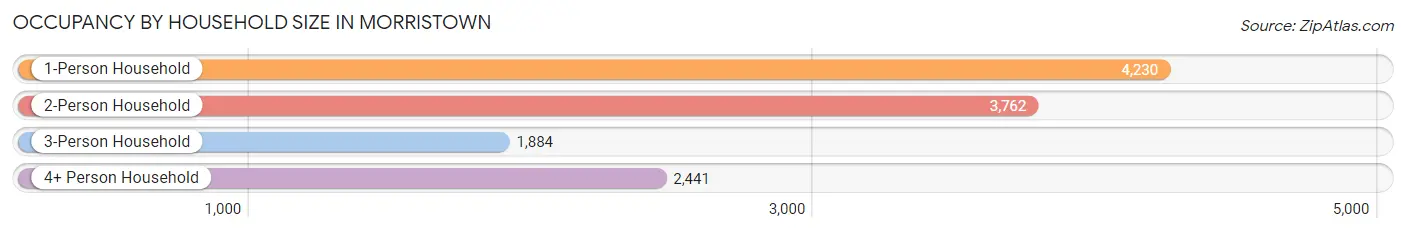
| Household Size | # Housing Units | % Housing Units |
| 1-Person Household | 4,230 | 34.3% |
| 2-Person Household | 3,762 | 30.5% |
| 3-Person Household | 1,884 | 15.3% |
| 4+ Person Household | 2,441 | 19.8% |
| Total Housing Units | 12,317 | 100.0% |
Occupancy by Ownership by Household Size in Morristown
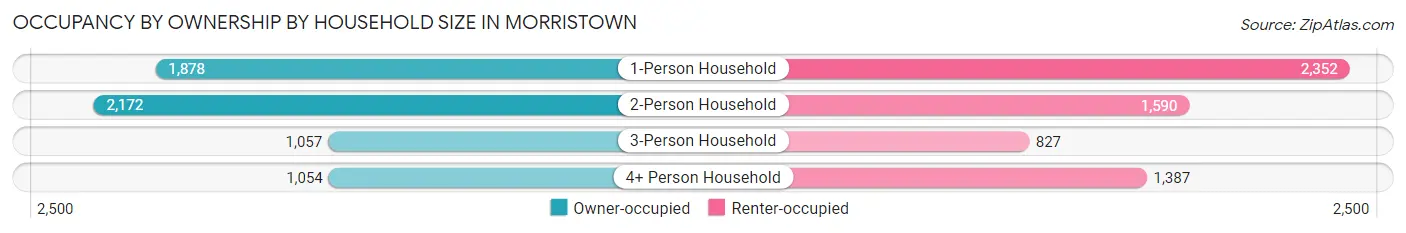
| Household Size | Owner-occupied | Renter-occupied |
| 1-Person Household | 1,878 (44.4%) | 2,352 (55.6%) |
| 2-Person Household | 2,172 (57.7%) | 1,590 (42.3%) |
| 3-Person Household | 1,057 (56.1%) | 827 (43.9%) |
| 4+ Person Household | 1,054 (43.2%) | 1,387 (56.8%) |
| Total Housing Units | 6,161 (50.0%) | 6,156 (50.0%) |
Occupancy by Educational Attainment in Morristown
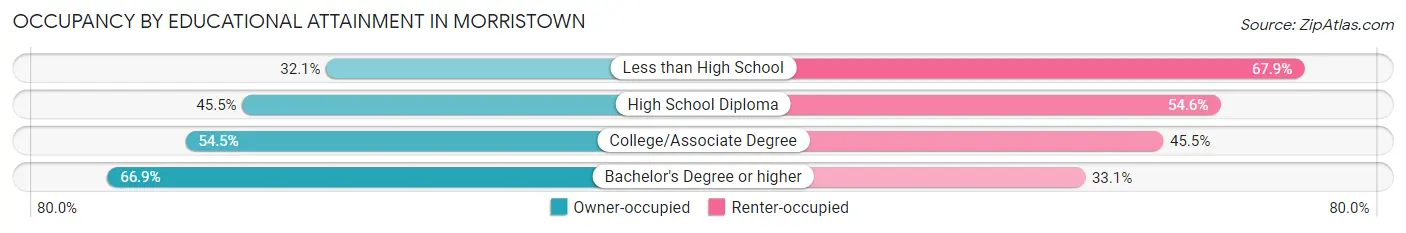
| Household Size | Owner-occupied | Renter-occupied |
| Less than High School | 600 (32.1%) | 1,267 (67.9%) |
| High School Diploma | 2,006 (45.5%) | 2,408 (54.5%) |
| College/Associate Degree | 2,121 (54.5%) | 1,771 (45.5%) |
| Bachelor's Degree or higher | 1,434 (66.9%) | 710 (33.1%) |
Occupancy by Age of Householder in Morristown
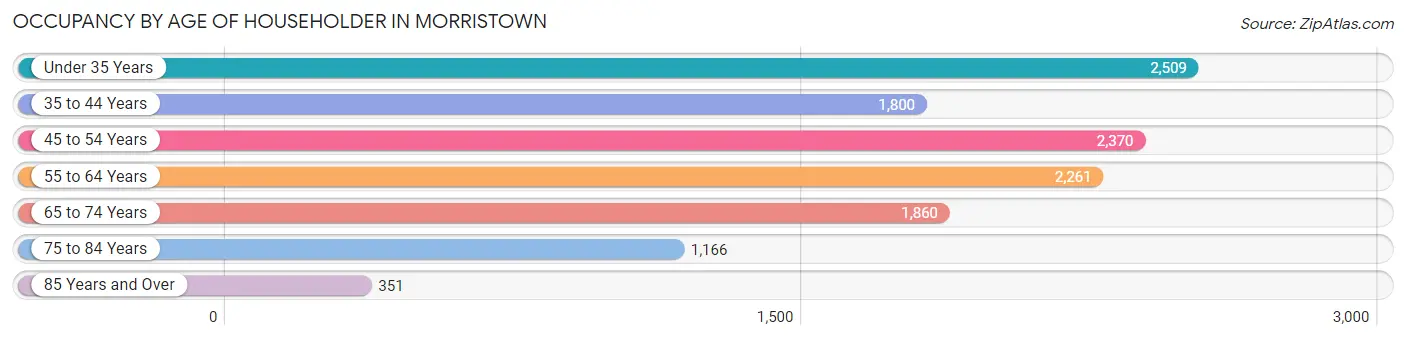
| Age Bracket | # Households | % Households |
| Under 35 Years | 2,509 | 20.4% |
| 35 to 44 Years | 1,800 | 14.6% |
| 45 to 54 Years | 2,370 | 19.2% |
| 55 to 64 Years | 2,261 | 18.4% |
| 65 to 74 Years | 1,860 | 15.1% |
| 75 to 84 Years | 1,166 | 9.5% |
| 85 Years and Over | 351 | 2.9% |
| Total | 12,317 | 100.0% |
Housing Finances in Morristown
Median Income by Occupancy in Morristown
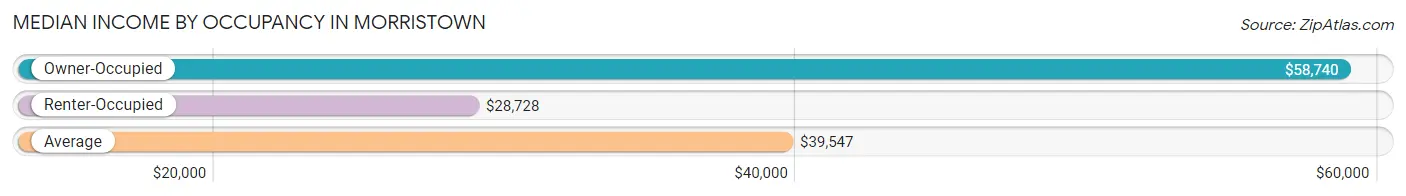
| Occupancy Type | # Households | Median Income |
| Owner-Occupied | 6,161 (50.0%) | $58,740 |
| Renter-Occupied | 6,156 (50.0%) | $28,728 |
| Average | 12,317 (100.0%) | $39,547 |
Occupancy by Householder Income Bracket in Morristown
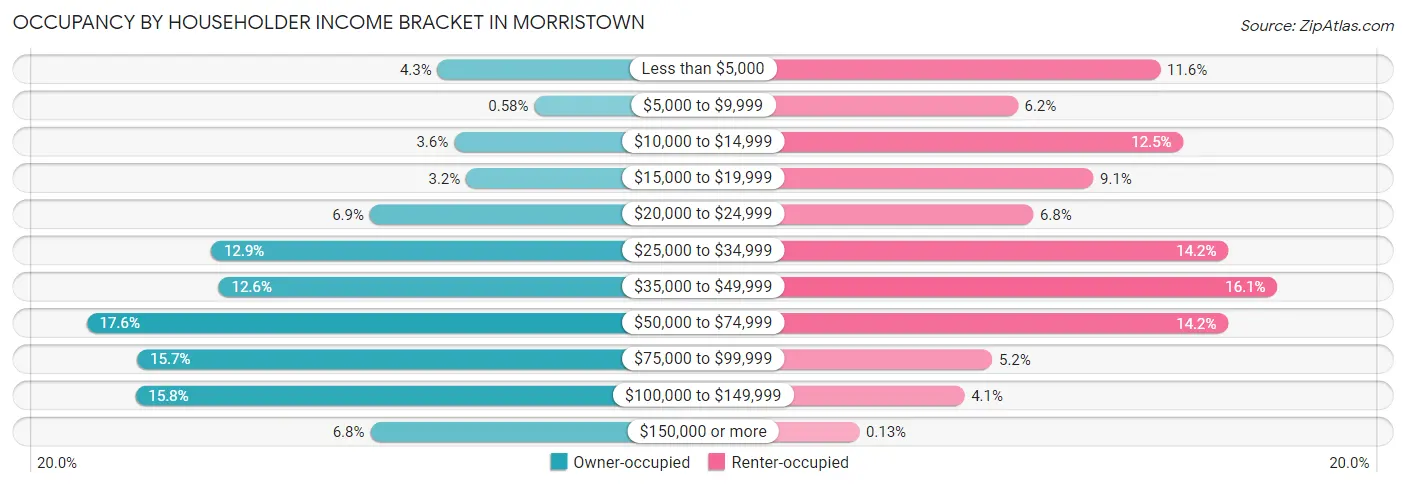
| Income Bracket | Owner-occupied | Renter-occupied |
| Less than $5,000 | 263 (4.3%) | 714 (11.6%) |
| $5,000 to $9,999 | 36 (0.6%) | 380 (6.2%) |
| $10,000 to $14,999 | 224 (3.6%) | 769 (12.5%) |
| $15,000 to $19,999 | 196 (3.2%) | 557 (9.0%) |
| $20,000 to $24,999 | 422 (6.9%) | 416 (6.8%) |
| $25,000 to $34,999 | 795 (12.9%) | 874 (14.2%) |
| $35,000 to $49,999 | 777 (12.6%) | 989 (16.1%) |
| $50,000 to $74,999 | 1,087 (17.6%) | 874 (14.2%) |
| $75,000 to $99,999 | 968 (15.7%) | 320 (5.2%) |
| $100,000 to $149,999 | 972 (15.8%) | 255 (4.1%) |
| $150,000 or more | 421 (6.8%) | 8 (0.1%) |
| Total | 6,161 (100.0%) | 6,156 (100.0%) |
Monthly Housing Cost Tiers in Morristown
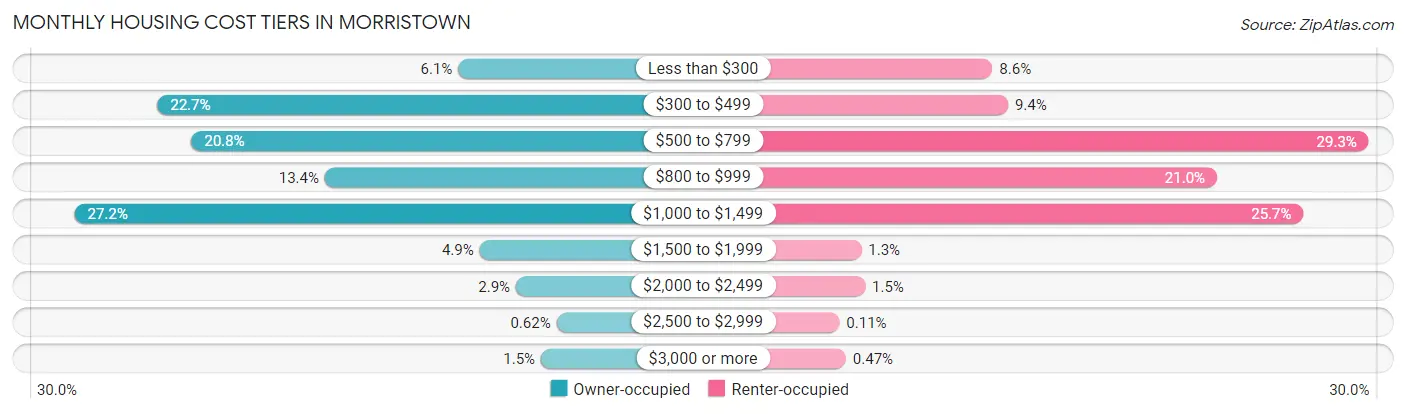
| Monthly Cost | Owner-occupied | Renter-occupied |
| Less than $300 | 373 (6.0%) | 527 (8.6%) |
| $300 to $499 | 1,397 (22.7%) | 580 (9.4%) |
| $500 to $799 | 1,281 (20.8%) | 1,806 (29.3%) |
| $800 to $999 | 827 (13.4%) | 1,290 (21.0%) |
| $1,000 to $1,499 | 1,678 (27.2%) | 1,584 (25.7%) |
| $1,500 to $1,999 | 300 (4.9%) | 81 (1.3%) |
| $2,000 to $2,499 | 176 (2.9%) | 94 (1.5%) |
| $2,500 to $2,999 | 38 (0.6%) | 7 (0.1%) |
| $3,000 or more | 91 (1.5%) | 29 (0.5%) |
| Total | 6,161 (100.0%) | 6,156 (100.0%) |
Physical Housing Characteristics in Morristown
Housing Structures in Morristown
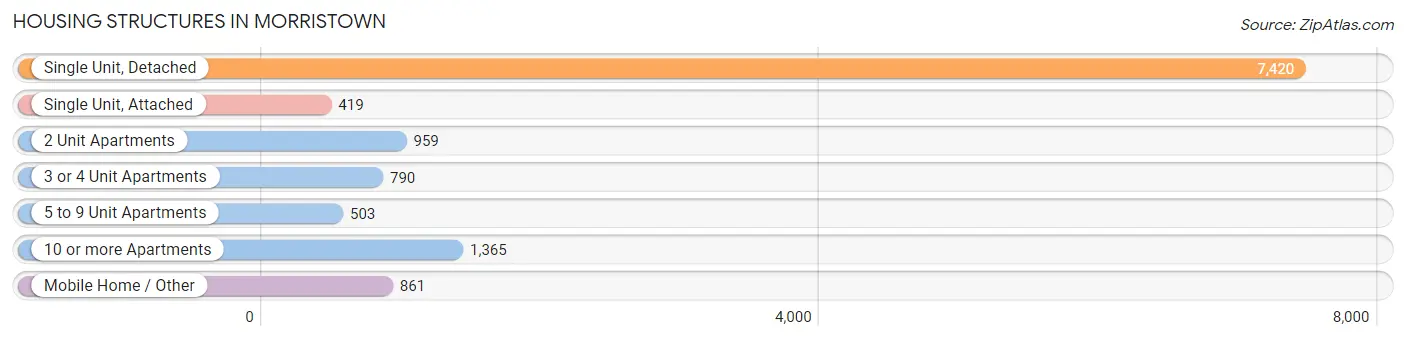
| Structure Type | # Housing Units | % Housing Units |
| Single Unit, Detached | 7,420 | 60.2% |
| Single Unit, Attached | 419 | 3.4% |
| 2 Unit Apartments | 959 | 7.8% |
| 3 or 4 Unit Apartments | 790 | 6.4% |
| 5 to 9 Unit Apartments | 503 | 4.1% |
| 10 or more Apartments | 1,365 | 11.1% |
| Mobile Home / Other | 861 | 7.0% |
| Total | 12,317 | 100.0% |
Housing Structures by Occupancy in Morristown
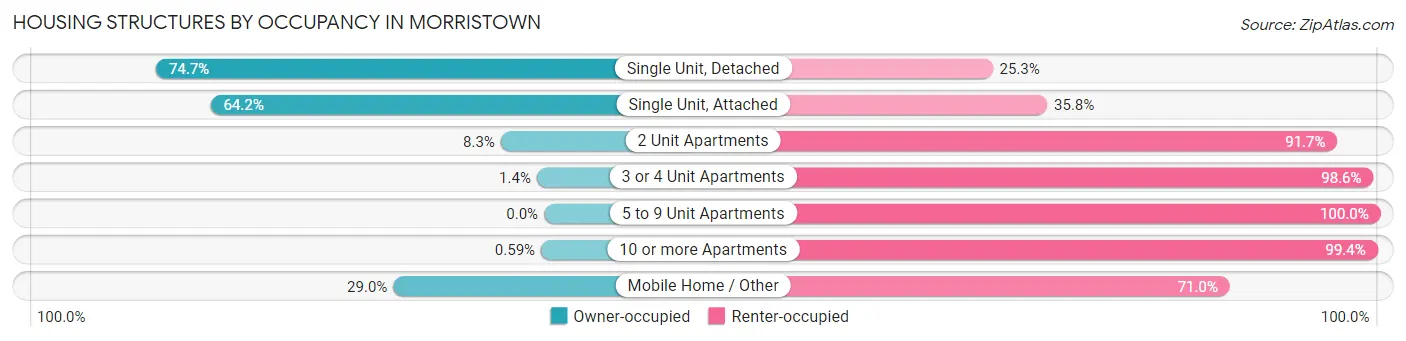
| Structure Type | Owner-occupied | Renter-occupied |
| Single Unit, Detached | 5,543 (74.7%) | 1,877 (25.3%) |
| Single Unit, Attached | 269 (64.2%) | 150 (35.8%) |
| 2 Unit Apartments | 80 (8.3%) | 879 (91.7%) |
| 3 or 4 Unit Apartments | 11 (1.4%) | 779 (98.6%) |
| 5 to 9 Unit Apartments | 0 (0.0%) | 503 (100.0%) |
| 10 or more Apartments | 8 (0.6%) | 1,357 (99.4%) |
| Mobile Home / Other | 250 (29.0%) | 611 (71.0%) |
| Total | 6,161 (50.0%) | 6,156 (50.0%) |
Housing Structures by Number of Rooms in Morristown
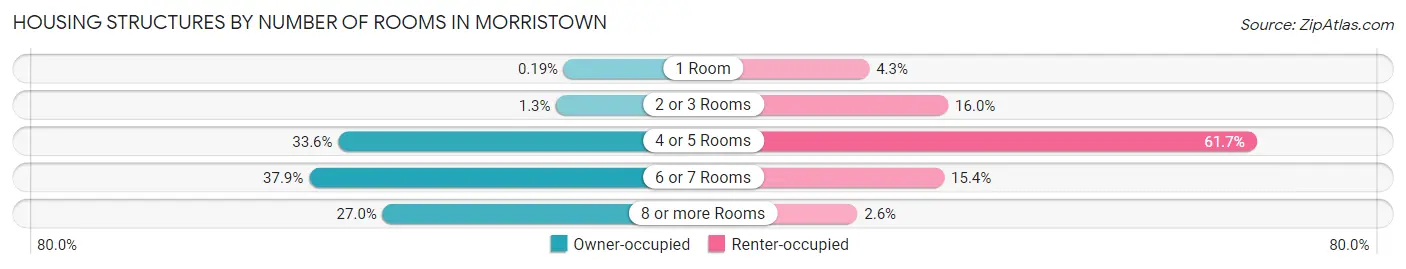
| Number of Rooms | Owner-occupied | Renter-occupied |
| 1 Room | 12 (0.2%) | 267 (4.3%) |
| 2 or 3 Rooms | 81 (1.3%) | 986 (16.0%) |
| 4 or 5 Rooms | 2,068 (33.6%) | 3,795 (61.7%) |
| 6 or 7 Rooms | 2,335 (37.9%) | 949 (15.4%) |
| 8 or more Rooms | 1,665 (27.0%) | 159 (2.6%) |
| Total | 6,161 (100.0%) | 6,156 (100.0%) |
Housing Structure by Heating Type in Morristown
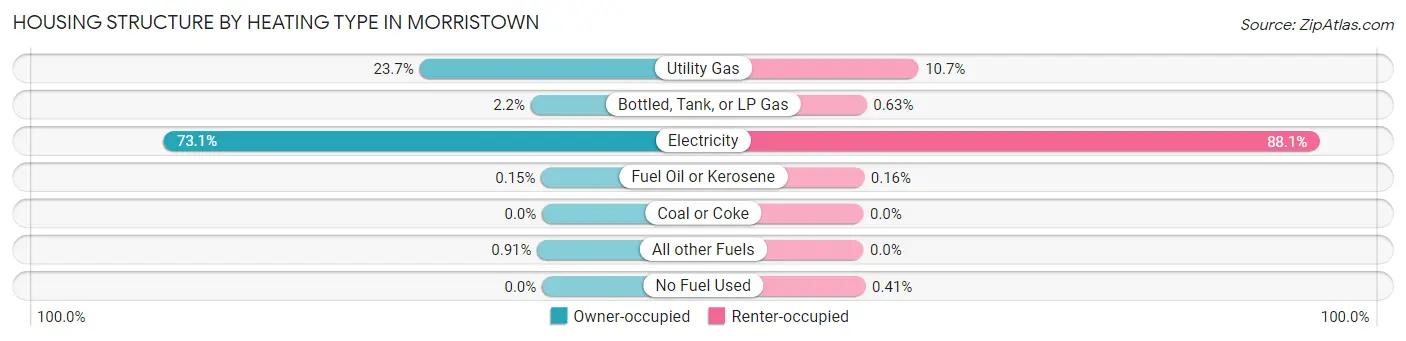
| Heating Type | Owner-occupied | Renter-occupied |
| Utility Gas | 1,459 (23.7%) | 656 (10.7%) |
| Bottled, Tank, or LP Gas | 134 (2.2%) | 39 (0.6%) |
| Electricity | 4,503 (73.1%) | 5,426 (88.1%) |
| Fuel Oil or Kerosene | 9 (0.2%) | 10 (0.2%) |
| Coal or Coke | 0 (0.0%) | 0 (0.0%) |
| All other Fuels | 56 (0.9%) | 0 (0.0%) |
| No Fuel Used | 0 (0.0%) | 25 (0.4%) |
| Total | 6,161 (100.0%) | 6,156 (100.0%) |
Household Vehicle Usage in Morristown
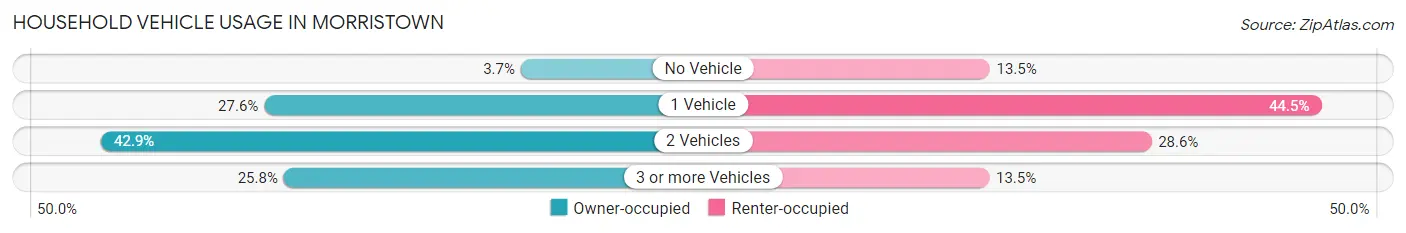
| Vehicles per Household | Owner-occupied | Renter-occupied |
| No Vehicle | 227 (3.7%) | 831 (13.5%) |
| 1 Vehicle | 1,703 (27.6%) | 2,737 (44.5%) |
| 2 Vehicles | 2,641 (42.9%) | 1,760 (28.6%) |
| 3 or more Vehicles | 1,590 (25.8%) | 828 (13.5%) |
| Total | 6,161 (100.0%) | 6,156 (100.0%) |
Real Estate & Mortgages in Morristown
Real Estate and Mortgage Overview in Morristown
| Characteristic | Without Mortgage | With Mortgage |
| Housing Units | 2,548 | 3,613 |
| Median Property Value | $124,100 | $144,600 |
| Median Household Income | $45,857 | $255 |
| Monthly Housing Costs | $413 | $91 |
| Real Estate Taxes | $853 | $64 |
Property Value by Mortgage Status in Morristown
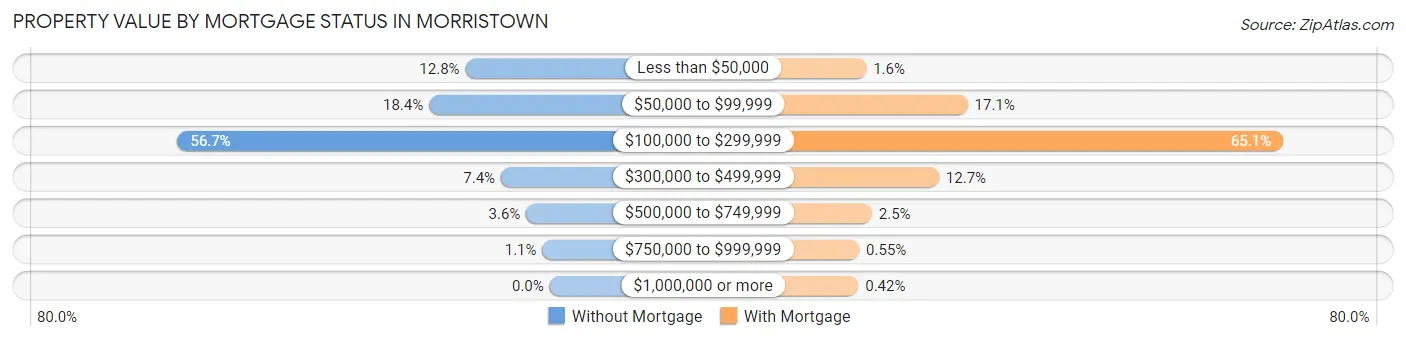
| Property Value | Without Mortgage | With Mortgage |
| Less than $50,000 | 327 (12.8%) | 59 (1.6%) |
| $50,000 to $99,999 | 468 (18.4%) | 617 (17.1%) |
| $100,000 to $299,999 | 1,445 (56.7%) | 2,353 (65.1%) |
| $300,000 to $499,999 | 189 (7.4%) | 459 (12.7%) |
| $500,000 to $749,999 | 91 (3.6%) | 90 (2.5%) |
| $750,000 to $999,999 | 28 (1.1%) | 20 (0.5%) |
| $1,000,000 or more | 0 (0.0%) | 15 (0.4%) |
| Total | 2,548 (100.0%) | 3,613 (100.0%) |
Household Income by Mortgage Status in Morristown
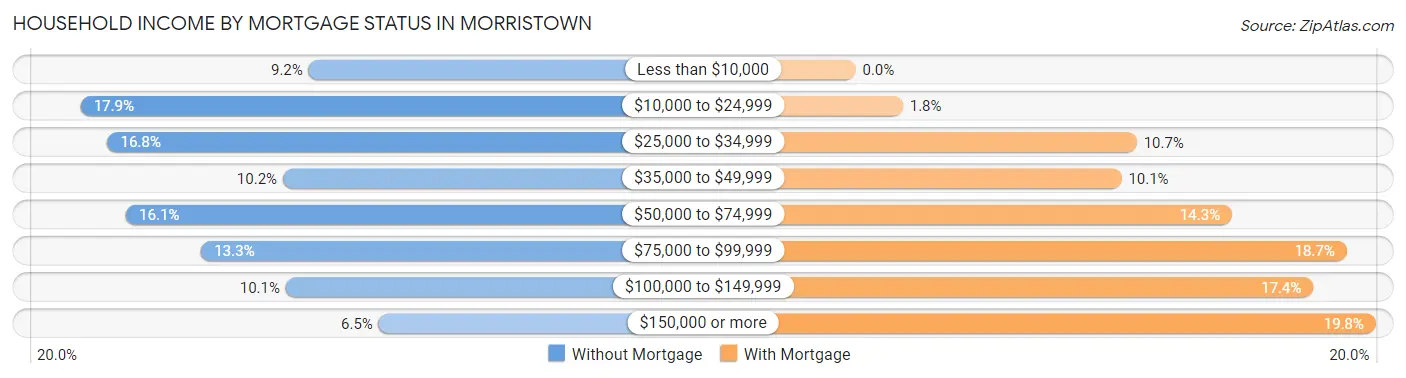
| Household Income | Without Mortgage | With Mortgage |
| Less than $10,000 | 234 (9.2%) | 0 (0.0%) |
| $10,000 to $24,999 | 455 (17.9%) | 65 (1.8%) |
| $25,000 to $34,999 | 429 (16.8%) | 387 (10.7%) |
| $35,000 to $49,999 | 259 (10.2%) | 366 (10.1%) |
| $50,000 to $74,999 | 411 (16.1%) | 518 (14.3%) |
| $75,000 to $99,999 | 338 (13.3%) | 676 (18.7%) |
| $100,000 to $149,999 | 256 (10.1%) | 630 (17.4%) |
| $150,000 or more | 166 (6.5%) | 716 (19.8%) |
| Total | 2,548 (100.0%) | 3,613 (100.0%) |
Property Value to Household Income Ratio in Morristown
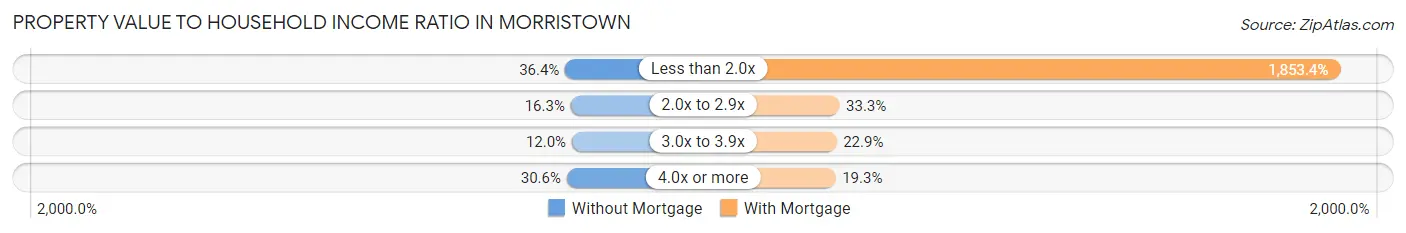
| Value-to-Income Ratio | Without Mortgage | With Mortgage |
| Less than 2.0x | 928 (36.4%) | 66,964 (1,853.4%) |
| 2.0x to 2.9x | 415 (16.3%) | 1,203 (33.3%) |
| 3.0x to 3.9x | 305 (12.0%) | 827 (22.9%) |
| 4.0x or more | 779 (30.6%) | 697 (19.3%) |
| Total | 2,548 (100.0%) | 3,613 (100.0%) |
Real Estate Taxes by Mortgage Status in Morristown
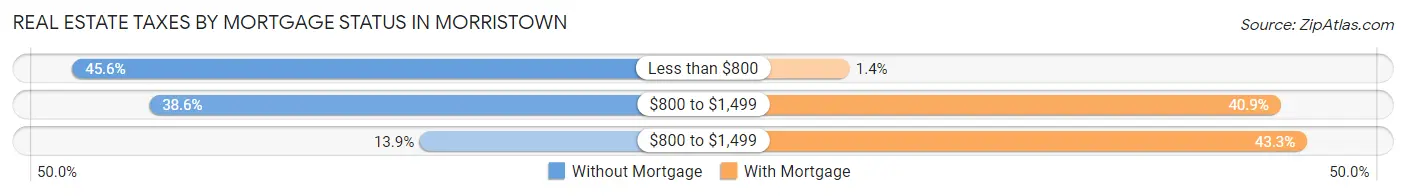
| Property Taxes | Without Mortgage | With Mortgage |
| Less than $800 | 1,163 (45.6%) | 52 (1.4%) |
| $800 to $1,499 | 984 (38.6%) | 1,477 (40.9%) |
| $800 to $1,499 | 354 (13.9%) | 1,564 (43.3%) |
| Total | 2,548 (100.0%) | 3,613 (100.0%) |
Health & Disability in Morristown
Health Insurance Coverage by Age in Morristown
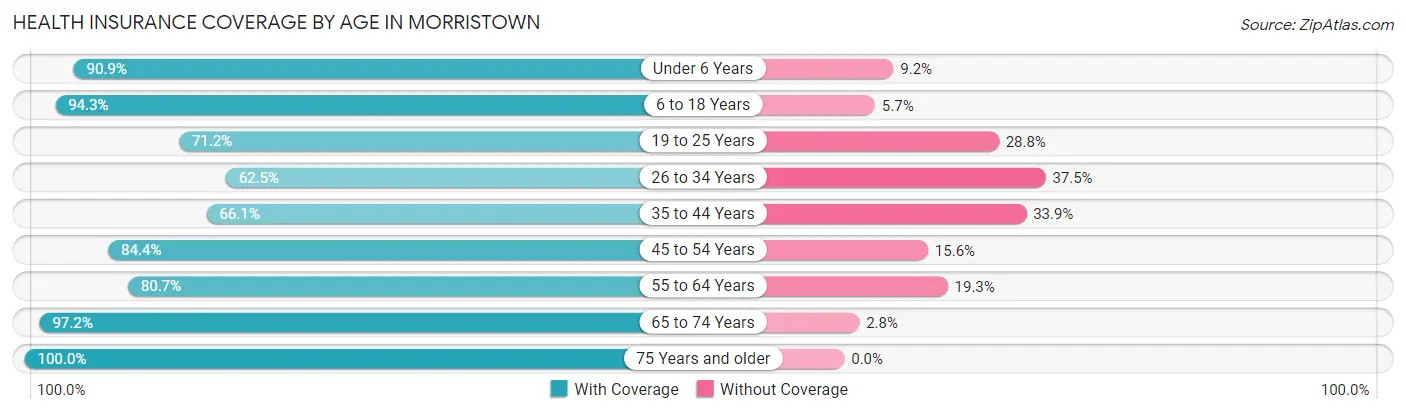
| Age Bracket | With Coverage | Without Coverage |
| Under 6 Years | 2,126 (90.8%) | 214 (9.1%) |
| 6 to 18 Years | 5,117 (94.3%) | 310 (5.7%) |
| 19 to 25 Years | 1,830 (71.2%) | 740 (28.8%) |
| 26 to 34 Years | 2,324 (62.5%) | 1,395 (37.5%) |
| 35 to 44 Years | 2,511 (66.1%) | 1,289 (33.9%) |
| 45 to 54 Years | 3,271 (84.4%) | 604 (15.6%) |
| 55 to 64 Years | 2,776 (80.7%) | 662 (19.3%) |
| 65 to 74 Years | 2,661 (97.2%) | 76 (2.8%) |
| 75 Years and older | 1,951 (100.0%) | 0 (0.0%) |
| Total | 24,567 (82.3%) | 5,290 (17.7%) |
Health Insurance Coverage by Citizenship Status in Morristown
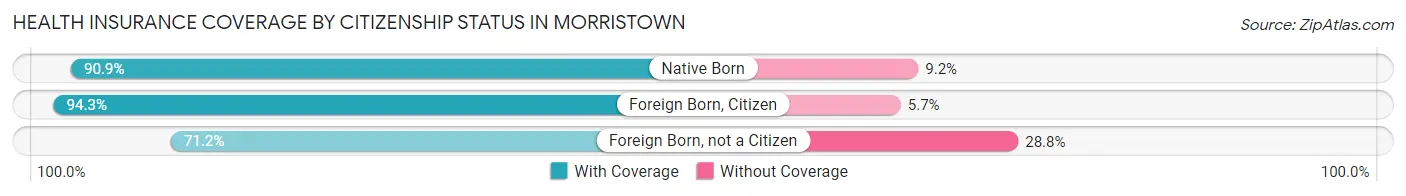
| Citizenship Status | With Coverage | Without Coverage |
| Native Born | 2,126 (90.8%) | 214 (9.1%) |
| Foreign Born, Citizen | 5,117 (94.3%) | 310 (5.7%) |
| Foreign Born, not a Citizen | 1,830 (71.2%) | 740 (28.8%) |
Health Insurance Coverage by Household Income in Morristown
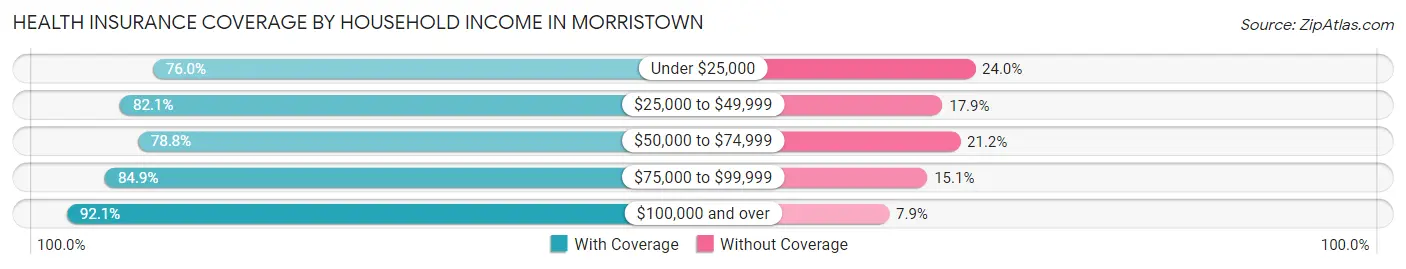
| Household Income | With Coverage | Without Coverage |
| Under $25,000 | 5,258 (76.0%) | 1,664 (24.0%) |
| $25,000 to $49,999 | 6,772 (82.1%) | 1,475 (17.9%) |
| $50,000 to $74,999 | 4,047 (78.8%) | 1,091 (21.2%) |
| $75,000 to $99,999 | 3,572 (84.9%) | 634 (15.1%) |
| $100,000 and over | 4,808 (92.1%) | 414 (7.9%) |
Public vs Private Health Insurance Coverage by Age in Morristown
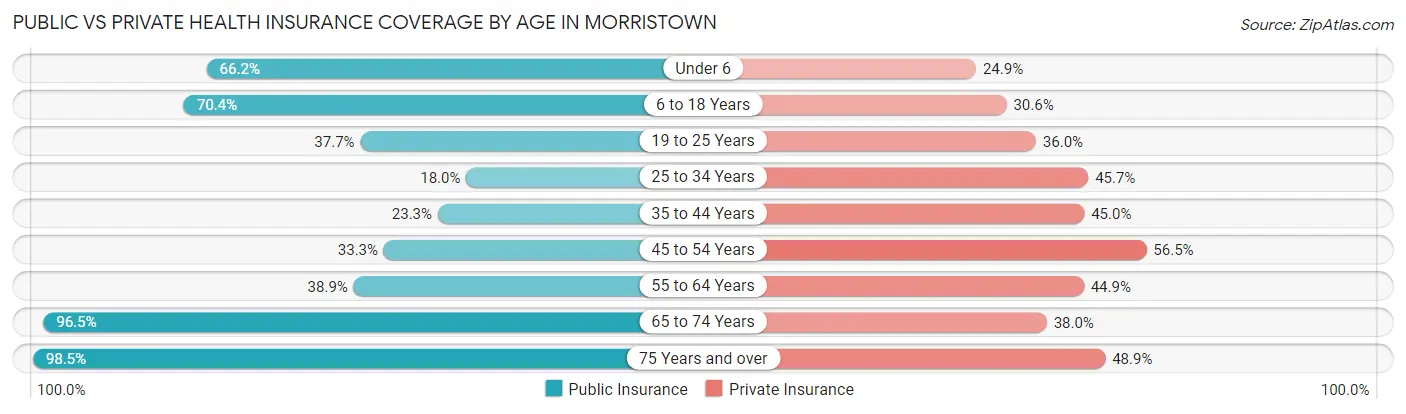
| Age Bracket | Public Insurance | Private Insurance |
| Under 6 | 1,549 (66.2%) | 583 (24.9%) |
| 6 to 18 Years | 3,823 (70.4%) | 1,659 (30.6%) |
| 19 to 25 Years | 968 (37.7%) | 926 (36.0%) |
| 25 to 34 Years | 670 (18.0%) | 1,701 (45.7%) |
| 35 to 44 Years | 885 (23.3%) | 1,710 (45.0%) |
| 45 to 54 Years | 1,291 (33.3%) | 2,191 (56.5%) |
| 55 to 64 Years | 1,338 (38.9%) | 1,544 (44.9%) |
| 65 to 74 Years | 2,642 (96.5%) | 1,041 (38.0%) |
| 75 Years and over | 1,921 (98.5%) | 954 (48.9%) |
| Total | 15,087 (50.5%) | 12,309 (41.2%) |
Disability Status by Sex by Age in Morristown

| Age Bracket | Male | Female |
| Under 5 Years | 0 (0.0%) | 6 (0.7%) |
| 5 to 17 Years | 204 (7.5%) | 226 (7.8%) |
| 18 to 34 Years | 426 (12.9%) | 359 (11.0%) |
| 35 to 64 Years | 1,261 (23.1%) | 1,766 (31.2%) |
| 65 to 74 Years | 409 (35.5%) | 526 (33.2%) |
| 75 Years and over | 486 (66.8%) | 764 (62.5%) |
Disability Class by Sex by Age in Morristown
Disability Class: Hearing Difficulty
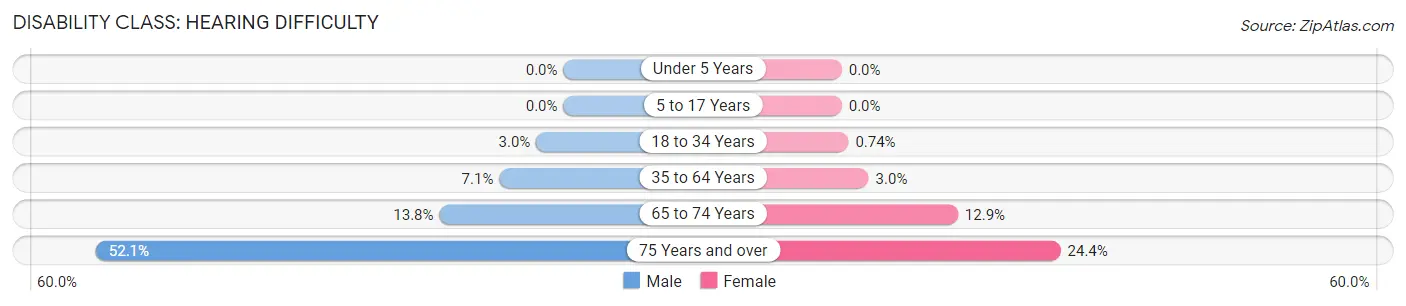
| Age Bracket | Male | Female |
| Under 5 Years | 0 (0.0%) | 0 (0.0%) |
| 5 to 17 Years | 0 (0.0%) | 0 (0.0%) |
| 18 to 34 Years | 100 (3.0%) | 24 (0.7%) |
| 35 to 64 Years | 390 (7.1%) | 169 (3.0%) |
| 65 to 74 Years | 159 (13.8%) | 205 (12.9%) |
| 75 Years and over | 379 (52.1%) | 298 (24.4%) |
Disability Class: Vision Difficulty
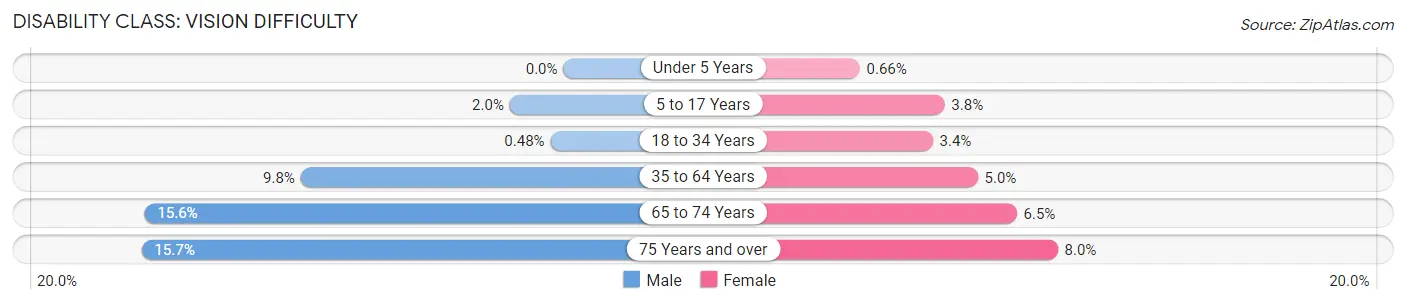
| Age Bracket | Male | Female |
| Under 5 Years | 0 (0.0%) | 6 (0.7%) |
| 5 to 17 Years | 54 (2.0%) | 111 (3.8%) |
| 18 to 34 Years | 16 (0.5%) | 110 (3.4%) |
| 35 to 64 Years | 532 (9.8%) | 285 (5.0%) |
| 65 to 74 Years | 179 (15.5%) | 103 (6.5%) |
| 75 Years and over | 114 (15.7%) | 98 (8.0%) |
Disability Class: Cognitive Difficulty
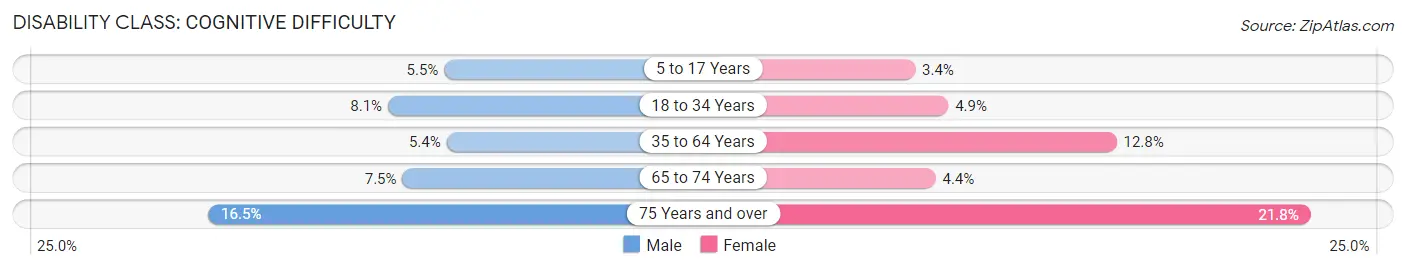
| Age Bracket | Male | Female |
| 5 to 17 Years | 150 (5.5%) | 99 (3.4%) |
| 18 to 34 Years | 269 (8.1%) | 161 (4.9%) |
| 35 to 64 Years | 296 (5.4%) | 721 (12.8%) |
| 65 to 74 Years | 86 (7.5%) | 69 (4.3%) |
| 75 Years and over | 120 (16.5%) | 266 (21.7%) |
Disability Class: Ambulatory Difficulty
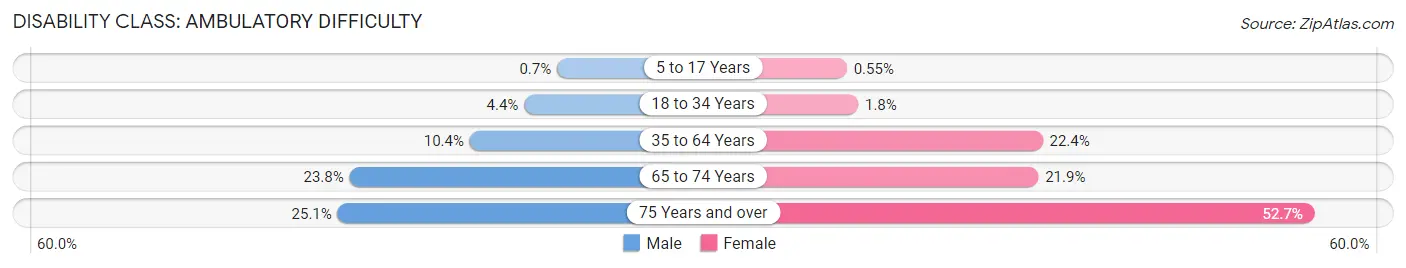
| Age Bracket | Male | Female |
| 5 to 17 Years | 19 (0.7%) | 16 (0.5%) |
| 18 to 34 Years | 144 (4.4%) | 59 (1.8%) |
| 35 to 64 Years | 569 (10.4%) | 1,264 (22.4%) |
| 65 to 74 Years | 274 (23.8%) | 347 (21.9%) |
| 75 Years and over | 183 (25.1%) | 644 (52.7%) |
Disability Class: Self-Care Difficulty
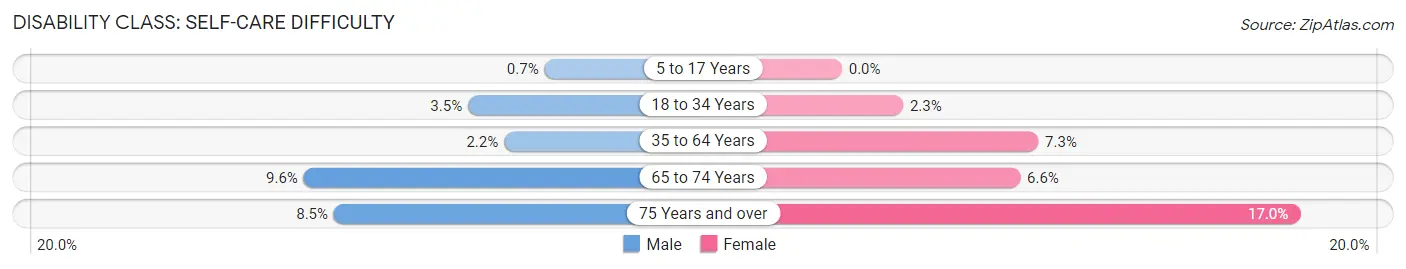
| Age Bracket | Male | Female |
| 5 to 17 Years | 19 (0.7%) | 0 (0.0%) |
| 18 to 34 Years | 117 (3.5%) | 74 (2.3%) |
| 35 to 64 Years | 120 (2.2%) | 412 (7.3%) |
| 65 to 74 Years | 111 (9.6%) | 105 (6.6%) |
| 75 Years and over | 62 (8.5%) | 208 (17.0%) |
Technology Access in Morristown
Computing Device Access in Morristown
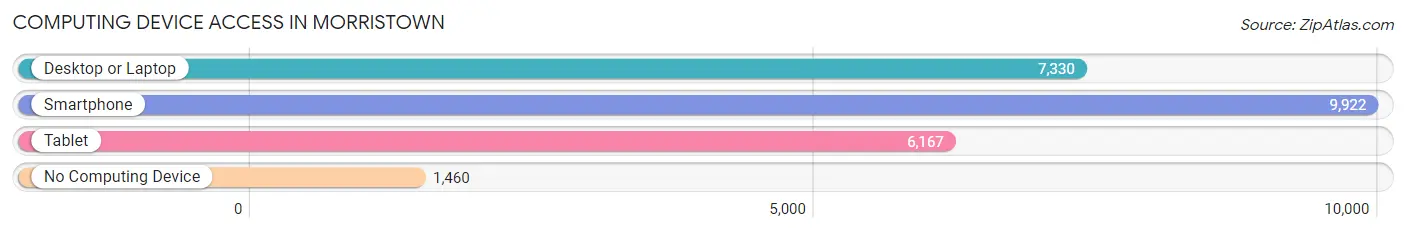
| Device Type | # Households | % Households |
| Desktop or Laptop | 7,330 | 59.5% |
| Smartphone | 9,922 | 80.6% |
| Tablet | 6,167 | 50.1% |
| No Computing Device | 1,460 | 11.8% |
| Total | 12,317 | 100.0% |
Internet Access in Morristown
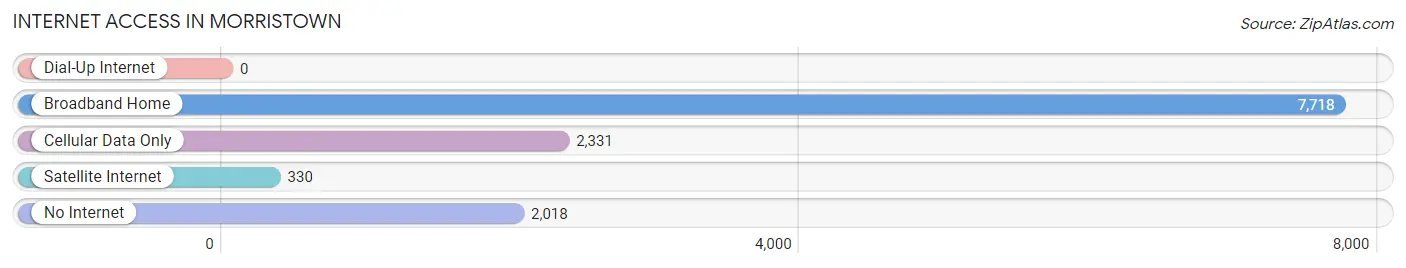
| Internet Type | # Households | % Households |
| Dial-Up Internet | 0 | 0.0% |
| Broadband Home | 7,718 | 62.7% |
| Cellular Data Only | 2,331 | 18.9% |
| Satellite Internet | 330 | 2.7% |
| No Internet | 2,018 | 16.4% |
| Total | 12,317 | 100.0% |
Morristown Summary
Morristown, Tennessee is a city located in the eastern part of the state, in Hamblen County. It is the county seat and the largest city in the county. The city is situated in the foothills of the Great Smoky Mountains, and is located along the banks of the Nolichucky River. The city has a population of approximately 30,000 people, and is part of the Knoxville Metropolitan Statistical Area.
History
Morristown was founded in 1786 by Gideon Morris, a Revolutionary War veteran. The city was named after him, and was originally known as Morris’s Town. The city was incorporated in 1855, and has since grown to become the largest city in Hamblen County.
Morristown was an important center of industry during the 19th century. The city was home to several cotton mills, and was also the site of the first railroad in the county. The railroad connected Morristown to Knoxville, and was instrumental in the growth of the city.
Geography
Morristown is located in the eastern part of Tennessee, in Hamblen County. The city is situated in the foothills of the Great Smoky Mountains, and is located along the banks of the Nolichucky River. The city has a total area of 24.3 square miles, of which 24.2 square miles is land and 0.1 square miles is water.
The city has a humid subtropical climate, with hot, humid summers and mild winters. The average annual temperature is around 60 degrees Fahrenheit, and the average annual precipitation is around 45 inches.
Economy
Morristown’s economy is largely based on manufacturing and retail. The city is home to several large manufacturing companies, including Eastman Chemical Company, Denso Manufacturing Tennessee, and Bush Brothers & Company. The city is also home to several retail stores, including Walmart, Lowe’s, and Target.
The city is also home to several educational institutions, including Walters State Community College, Lincoln Memorial University, and the University of Tennessee at Knoxville.
Demographics
As of the 2010 census, the population of Morristown was 29,137. The racial makeup of the city was 79.2% White, 15.7% African American, 0.4% Native American, 1.2% Asian, 0.1% Pacific Islander, 1.7% from other races, and 1.7% from two or more races. Hispanic or Latino of any race were 4.2% of the population.
The median income for a household in the city was $32,917, and the median income for a family was $41,945. The per capita income for the city was $19,845. About 17.2% of families and 20.7% of the population were below the poverty line, including 28.2% of those under age 18 and 14.2% of those age 65 or over.
Common Questions
What is Per Capita Income in Morristown?
Per Capita income in Morristown is $24,320.
What is the Median Family Income in Morristown?
Median Family Income in Morristown is $55,485.
What is the Median Household income in Morristown?
Median Household Income in Morristown is $39,547.
What is Income or Wage Gap in Morristown?
Income or Wage Gap in Morristown is 21.1%.
Women in Morristown earn 78.9 cents for every dollar earned by a man.
What is Family Income Deficit in Morristown?
Family Income Deficit in Morristown is $14,880.
Families that are below poverty line in Morristown earn $14,880 less on average than the poverty threshold level.
What is Inequality or Gini Index in Morristown?
Inequality or Gini Index in Morristown is 0.51.
What is the Total Population of Morristown?
Total Population of Morristown is 30,574.
What is the Total Male Population of Morristown?
Total Male Population of Morristown is 14,780.
What is the Total Female Population of Morristown?
Total Female Population of Morristown is 15,794.
What is the Ratio of Males per 100 Females in Morristown?
There are 93.58 Males per 100 Females in Morristown.
What is the Ratio of Females per 100 Males in Morristown?
There are 106.86 Females per 100 Males in Morristown.
What is the Median Population Age in Morristown?
Median Population Age in Morristown is 37.6 Years.
What is the Average Family Size in Morristown
Average Family Size in Morristown is 3.1 People.
What is the Average Household Size in Morristown
Average Household Size in Morristown is 2.4 People.
How Large is the Labor Force in Morristown?
There are 13,092 People in the Labor Forcein in Morristown.
What is the Percentage of People in the Labor Force in Morristown?
55.0% of People are in the Labor Force in Morristown.
What is the Unemployment Rate in Morristown?
Unemployment Rate in Morristown is 8.1%.