Portland, TN Map & Demographics
Portland Map
Portland Overview
$29,330
PER CAPITA INCOME
$77,924
AVG FAMILY INCOME
$68,315
AVG HOUSEHOLD INCOME
26.1%
WAGE / INCOME GAP [ % ]
73.9¢/ $1
WAGE / INCOME GAP [ $ ]
0.37
INEQUALITY / GINI INDEX
13,177
TOTAL POPULATION
6,702
MALE POPULATION
6,475
FEMALE POPULATION
103.51
MALES / 100 FEMALES
96.61
FEMALES / 100 MALES
34.0
MEDIAN AGE
3.1
AVG FAMILY SIZE
2.6
AVG HOUSEHOLD SIZE
7,369
LABOR FORCE [ PEOPLE ]
71.9%
PERCENT IN LABOR FORCE
3.8%
UNEMPLOYMENT RATE
Portland Zip Codes
Portland Area Codes
Income in Portland
Income Overview in Portland
Per Capita Income in Portland is $29,330, while median incomes of families and households are $77,924 and $68,315 respectively.
| Characteristic | Number | Measure |
| Per Capita Income | 13,177 | $29,330 |
| Median Family Income | 3,553 | $77,924 |
| Mean Family Income | 3,553 | $86,014 |
| Median Household Income | 5,059 | $68,315 |
| Mean Household Income | 5,059 | $75,894 |
| Income Deficit | 3,553 | $0 |
| Wage / Income Gap (%) | 13,177 | 26.15% |
| Wage / Income Gap ($) | 13,177 | 73.85¢ per $1 |
| Gini / Inequality Index | 13,177 | 0.37 |
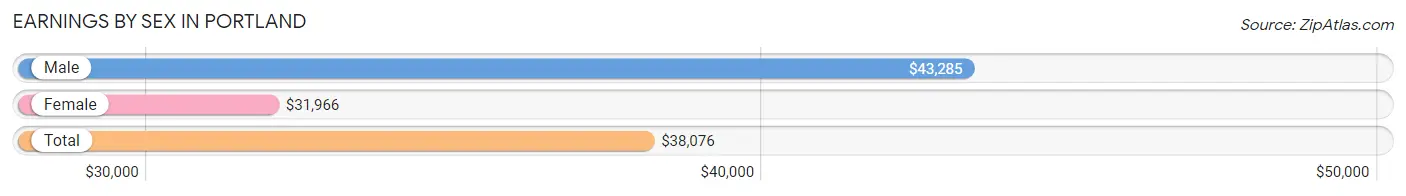
Earnings by Sex in Portland
Average Earnings in Portland are $38,076, $43,285 for men and $31,966 for women, a difference of 26.2%.
| Sex | Number | Average Earnings |
| Male | 3,947 (52.1%) | $43,285 |
| Female | 3,627 (47.9%) | $31,966 |
| Total | 7,574 (100.0%) | $38,076 |
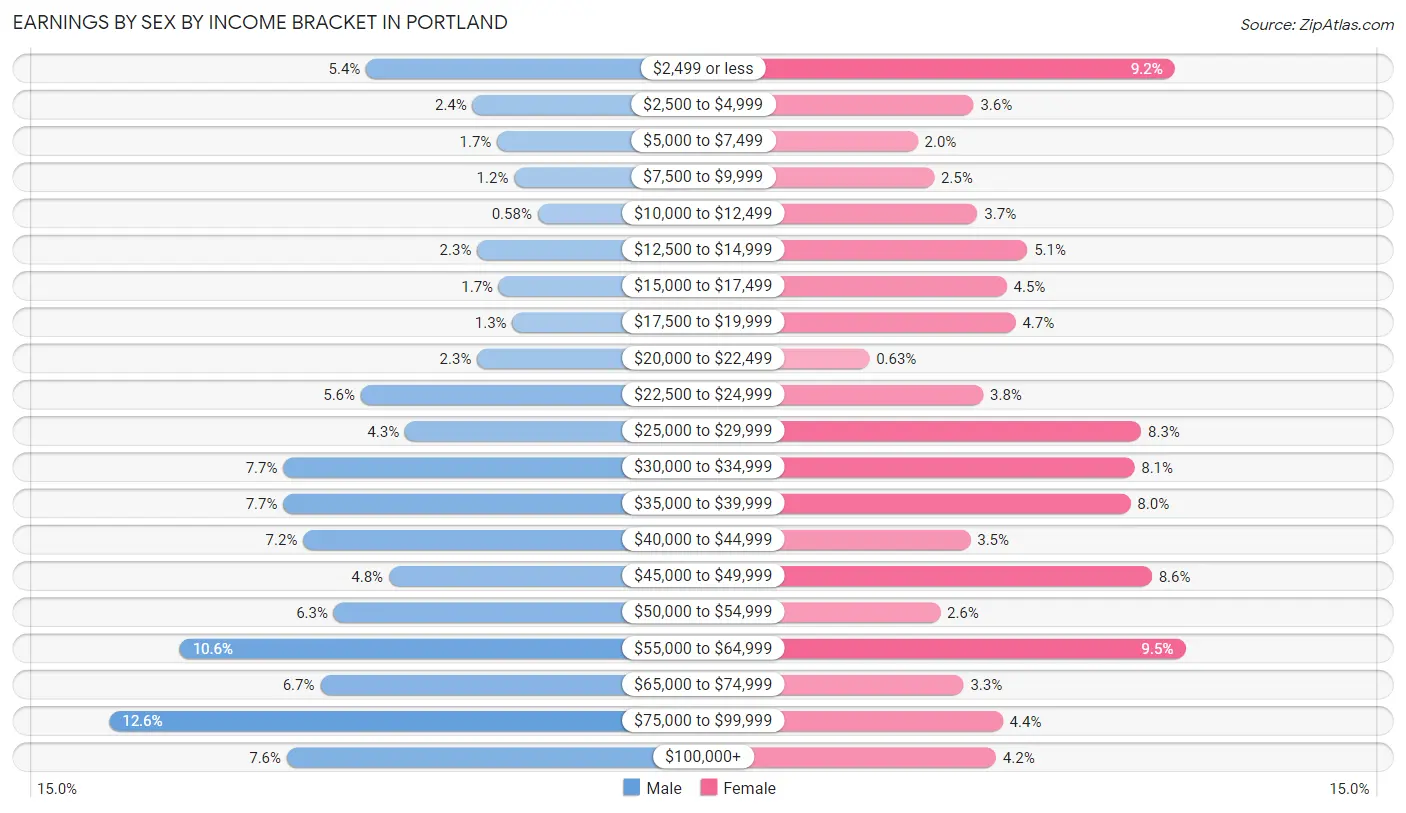
Earnings by Sex by Income Bracket in Portland
The most common earnings brackets in Portland are $75,000 to $99,999 for men (498 | 12.6%) and $55,000 to $64,999 for women (345 | 9.5%).
| Income | Male | Female |
| $2,499 or less | 213 (5.4%) | 334 (9.2%) |
| $2,500 to $4,999 | 95 (2.4%) | 129 (3.6%) |
| $5,000 to $7,499 | 68 (1.7%) | 72 (2.0%) |
| $7,500 to $9,999 | 49 (1.2%) | 89 (2.5%) |
| $10,000 to $12,499 | 23 (0.6%) | 133 (3.7%) |
| $12,500 to $14,999 | 90 (2.3%) | 184 (5.1%) |
| $15,000 to $17,499 | 66 (1.7%) | 163 (4.5%) |
| $17,500 to $19,999 | 51 (1.3%) | 172 (4.7%) |
| $20,000 to $22,499 | 90 (2.3%) | 23 (0.6%) |
| $22,500 to $24,999 | 219 (5.6%) | 139 (3.8%) |
| $25,000 to $29,999 | 170 (4.3%) | 300 (8.3%) |
| $30,000 to $34,999 | 305 (7.7%) | 293 (8.1%) |
| $35,000 to $39,999 | 305 (7.7%) | 289 (8.0%) |
| $40,000 to $44,999 | 283 (7.2%) | 126 (3.5%) |
| $45,000 to $49,999 | 188 (4.8%) | 311 (8.6%) |
| $50,000 to $54,999 | 249 (6.3%) | 95 (2.6%) |
| $55,000 to $64,999 | 420 (10.6%) | 345 (9.5%) |
| $65,000 to $74,999 | 264 (6.7%) | 119 (3.3%) |
| $75,000 to $99,999 | 498 (12.6%) | 159 (4.4%) |
| $100,000+ | 301 (7.6%) | 152 (4.2%) |
| Total | 3,947 (100.0%) | 3,627 (100.0%) |
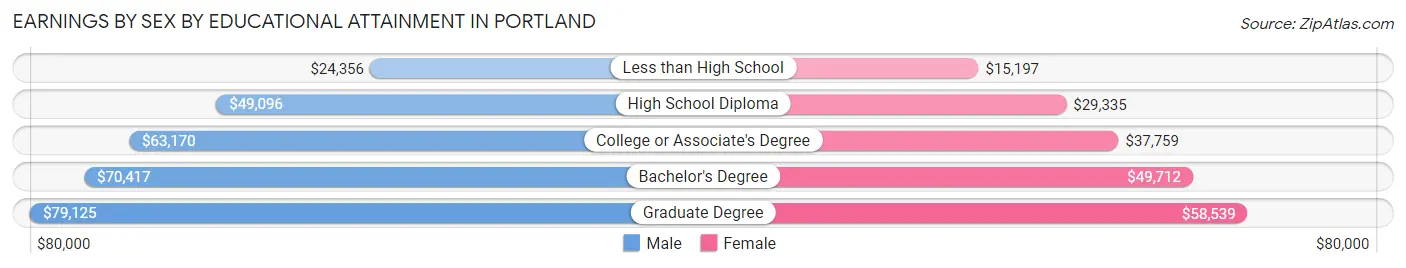
Earnings by Sex by Educational Attainment in Portland
Average earnings in Portland are $52,846 for men and $36,870 for women, a difference of 30.2%. Men with an educational attainment of graduate degree enjoy the highest average annual earnings of $79,125, while those with less than high school education earn the least with $24,356. Women with an educational attainment of graduate degree earn the most with the average annual earnings of $58,539, while those with less than high school education have the smallest earnings of $15,197.
| Educational Attainment | Male Income | Female Income |
| Less than High School | $24,356 | $15,197 |
| High School Diploma | $49,096 | $29,335 |
| College or Associate's Degree | $63,170 | $37,759 |
| Bachelor's Degree | $70,417 | $49,712 |
| Graduate Degree | $79,125 | $58,539 |
| Total | $52,846 | $36,870 |
Family Income in Portland
Family Income Brackets in Portland
According to the Portland family income data, there are 902 families falling into the $100,000 to $149,999 income range, which is the most common income bracket and makes up 25.4% of all families. Conversely, the $10,000 to $14,999 income bracket is the least frequent group with only 18 families (0.5%) belonging to this category.
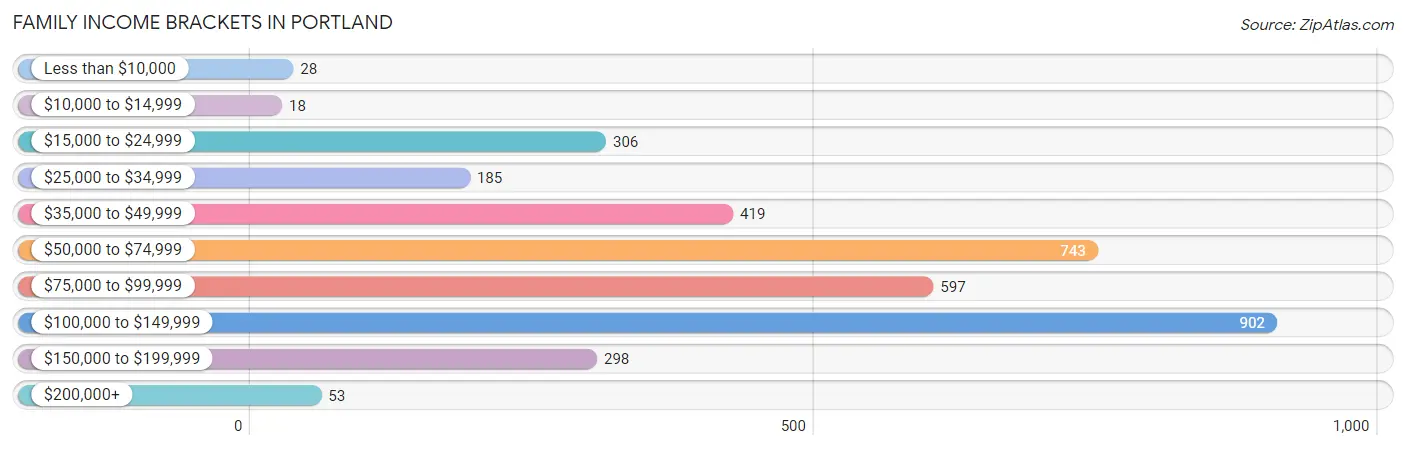
| Income Bracket | # Families | % Families |
| Less than $10,000 | 28 | 0.8% |
| $10,000 to $14,999 | 18 | 0.5% |
| $15,000 to $24,999 | 306 | 8.6% |
| $25,000 to $34,999 | 185 | 5.2% |
| $35,000 to $49,999 | 419 | 11.8% |
| $50,000 to $74,999 | 743 | 20.9% |
| $75,000 to $99,999 | 597 | 16.8% |
| $100,000 to $149,999 | 902 | 25.4% |
| $150,000 to $199,999 | 298 | 8.4% |
| $200,000+ | 53 | 1.5% |
Family Income by Famaliy Size in Portland
4-person families (881 | 24.8%) account for the highest median family income in Portland with $85,417 per family, while 2-person families (1,529 | 43.0%) have the highest median income of $39,414 per family member.
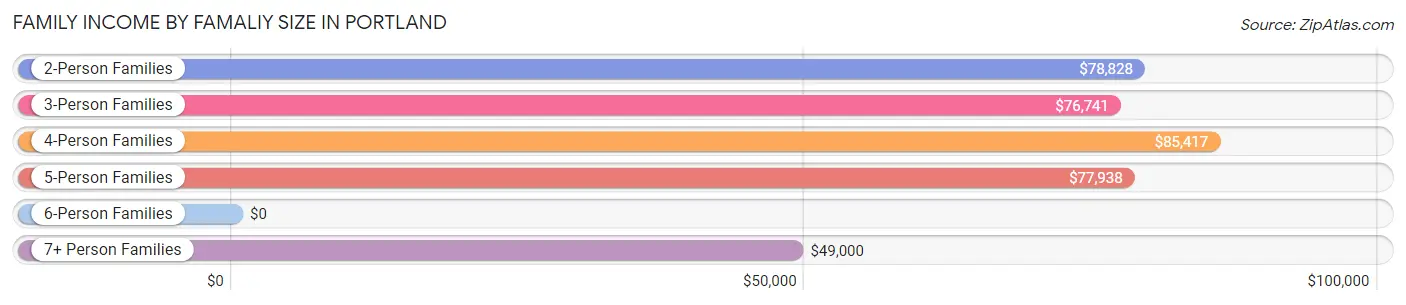
| Income Bracket | # Families | Median Income |
| 2-Person Families | 1,529 (43.0%) | $78,828 |
| 3-Person Families | 819 (23.1%) | $76,741 |
| 4-Person Families | 881 (24.8%) | $85,417 |
| 5-Person Families | 162 (4.6%) | $77,938 |
| 6-Person Families | 128 (3.6%) | $0 |
| 7+ Person Families | 34 (1.0%) | $49,000 |
| Total | 3,553 (100.0%) | $77,924 |
Family Income by Number of Earners in Portland
The median family income in Portland is $77,924, with families comprising 2 earners (1,597) having the highest median family income of $98,263, while families with 1 earner (1,340) have the lowest median family income of $60,371, accounting for 45.0% and 37.7% of families, respectively.
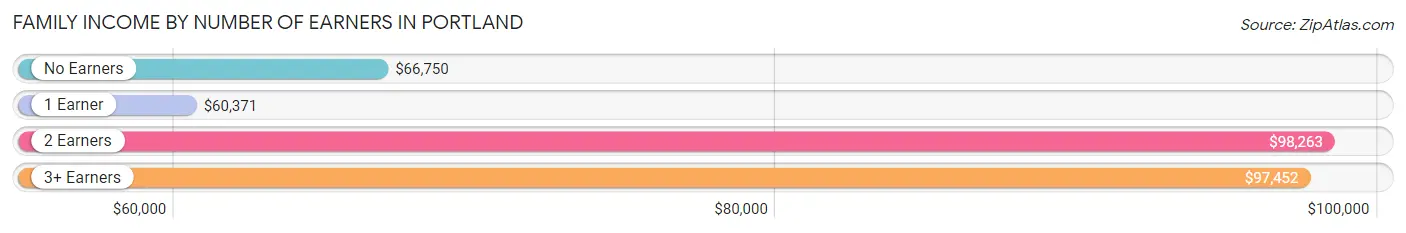
| Number of Earners | # Families | Median Income |
| No Earners | 205 (5.8%) | $66,750 |
| 1 Earner | 1,340 (37.7%) | $60,371 |
| 2 Earners | 1,597 (45.0%) | $98,263 |
| 3+ Earners | 411 (11.6%) | $97,452 |
| Total | 3,553 (100.0%) | $77,924 |
Household Income in Portland
Household Income Brackets in Portland
With 1,007 households falling in the category, the $100,000 to $149,999 income range is the most frequent in Portland, accounting for 19.9% of all households. In contrast, only 51 households (1.0%) fall into the $200,000+ income bracket, making it the least populous group.
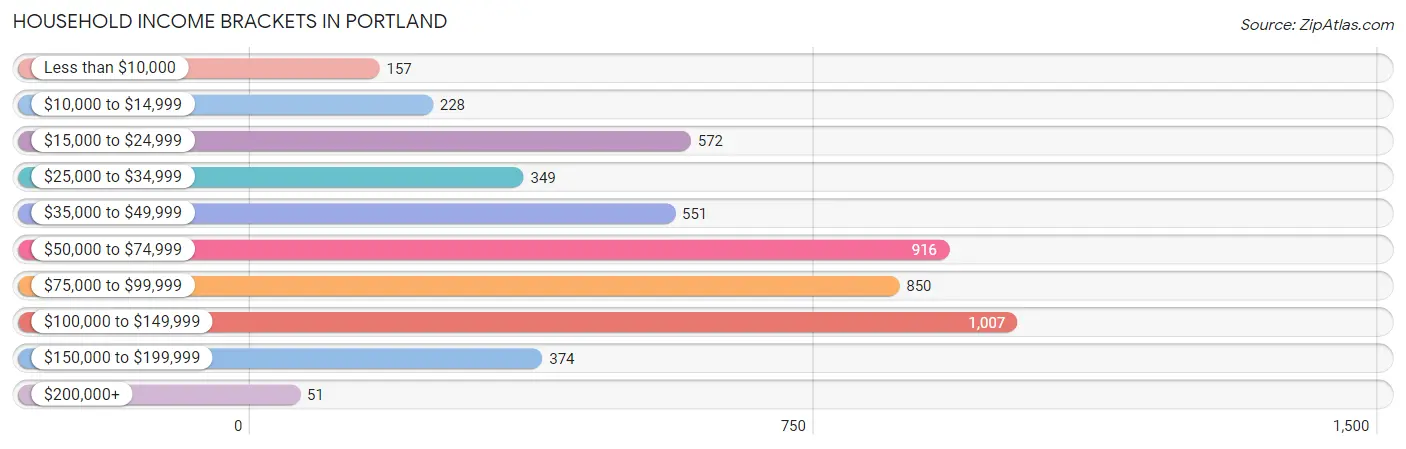
| Income Bracket | # Households | % Households |
| Less than $10,000 | 157 | 3.1% |
| $10,000 to $14,999 | 228 | 4.5% |
| $15,000 to $24,999 | 572 | 11.3% |
| $25,000 to $34,999 | 349 | 6.9% |
| $35,000 to $49,999 | 551 | 10.9% |
| $50,000 to $74,999 | 916 | 18.1% |
| $75,000 to $99,999 | 850 | 16.8% |
| $100,000 to $149,999 | 1,007 | 19.9% |
| $150,000 to $199,999 | 374 | 7.4% |
| $200,000+ | 51 | 1.0% |
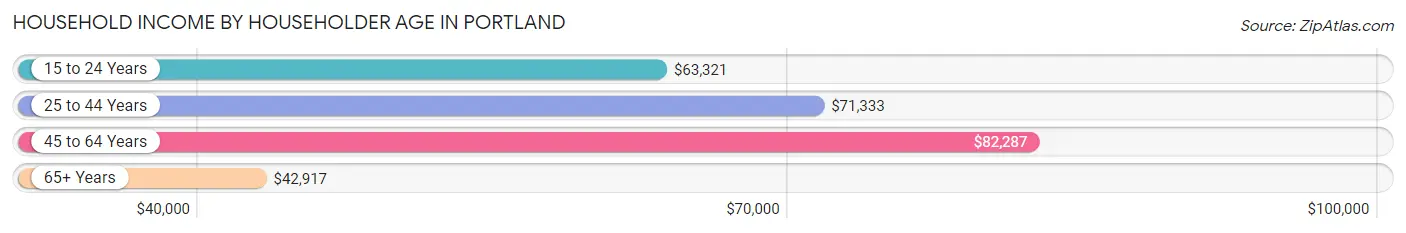
Household Income by Householder Age in Portland
The median household income in Portland is $68,315, with the highest median household income of $82,287 found in the 45 to 64 years age bracket for the primary householder. A total of 1,954 households (38.6%) fall into this category. Meanwhile, the 65+ years age bracket for the primary householder has the lowest median household income of $42,917, with 974 households (19.3%) in this group.
| Income Bracket | # Households | Median Income |
| 15 to 24 Years | 292 (5.8%) | $63,321 |
| 25 to 44 Years | 1,839 (36.3%) | $71,333 |
| 45 to 64 Years | 1,954 (38.6%) | $82,287 |
| 65+ Years | 974 (19.3%) | $42,917 |
| Total | 5,059 (100.0%) | $68,315 |
Poverty in Portland
Income Below Poverty by Sex and Age in Portland
With 9.7% poverty level for males and 15.2% for females among the residents of Portland, 16 and 17 year old males and 5 year old females are the most vulnerable to poverty, with 61 males (24.6%) and 32 females (68.1%) in their respective age groups living below the poverty level.
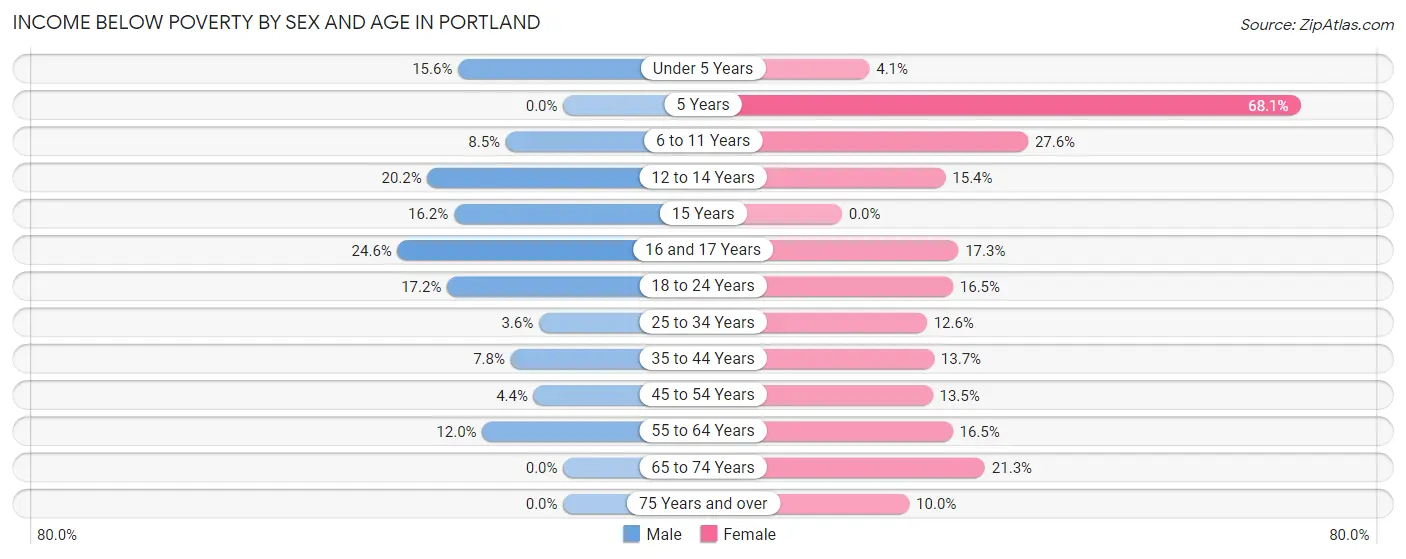
| Age Bracket | Male | Female |
| Under 5 Years | 79 (15.6%) | 21 (4.1%) |
| 5 Years | 0 (0.0%) | 32 (68.1%) |
| 6 to 11 Years | 36 (8.5%) | 115 (27.6%) |
| 12 to 14 Years | 73 (20.2%) | 20 (15.4%) |
| 15 Years | 43 (16.2%) | 0 (0.0%) |
| 16 and 17 Years | 61 (24.6%) | 46 (17.3%) |
| 18 to 24 Years | 121 (17.2%) | 110 (16.5%) |
| 25 to 34 Years | 37 (3.6%) | 112 (12.6%) |
| 35 to 44 Years | 74 (7.8%) | 129 (13.7%) |
| 45 to 54 Years | 36 (4.4%) | 125 (13.5%) |
| 55 to 64 Years | 85 (12.0%) | 115 (16.5%) |
| 65 to 74 Years | 0 (0.0%) | 129 (21.2%) |
| 75 Years and over | 0 (0.0%) | 24 (10.0%) |
| Total | 645 (9.7%) | 978 (15.2%) |
Income Above Poverty by Sex and Age in Portland
According to the poverty statistics in Portland, males aged 5 years and females aged 15 years are the age groups that are most secure financially, with 100.0% of males and 100.0% of females in these age groups living above the poverty line.
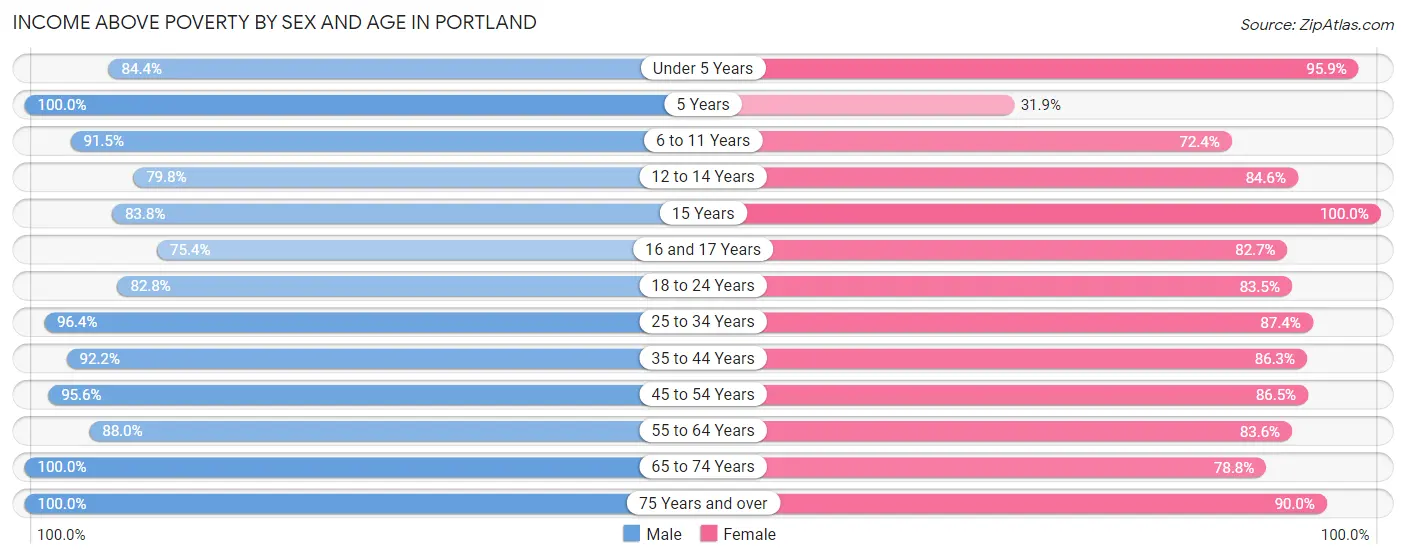
| Age Bracket | Male | Female |
| Under 5 Years | 427 (84.4%) | 494 (95.9%) |
| 5 Years | 112 (100.0%) | 15 (31.9%) |
| 6 to 11 Years | 386 (91.5%) | 301 (72.4%) |
| 12 to 14 Years | 289 (79.8%) | 110 (84.6%) |
| 15 Years | 222 (83.8%) | 70 (100.0%) |
| 16 and 17 Years | 187 (75.4%) | 220 (82.7%) |
| 18 to 24 Years | 581 (82.8%) | 557 (83.5%) |
| 25 to 34 Years | 988 (96.4%) | 776 (87.4%) |
| 35 to 44 Years | 875 (92.2%) | 814 (86.3%) |
| 45 to 54 Years | 784 (95.6%) | 802 (86.5%) |
| 55 to 64 Years | 622 (88.0%) | 584 (83.6%) |
| 65 to 74 Years | 467 (100.0%) | 478 (78.7%) |
| 75 Years and over | 72 (100.0%) | 216 (90.0%) |
| Total | 6,012 (90.3%) | 5,437 (84.8%) |
Income Below Poverty Among Married-Couple Families in Portland
The poverty statistics for married-couple families in Portland show that 3.0% or 74 of the total 2,464 families live below the poverty line. Families with 3 or 4 children have the highest poverty rate of 33.5%, comprising of 66 families. On the other hand, families with no children have the lowest poverty rate of 0.0%, which includes 0 families.
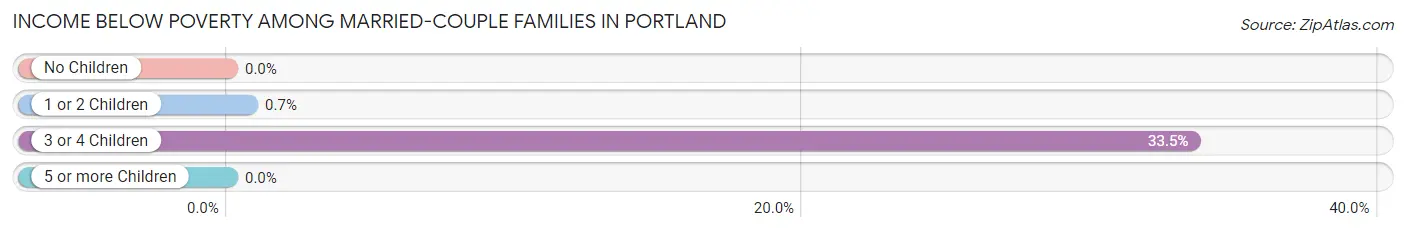
| Children | Above Poverty | Below Poverty |
| No Children | 1,100 (100.0%) | 0 (0.0%) |
| 1 or 2 Children | 1,139 (99.3%) | 8 (0.7%) |
| 3 or 4 Children | 131 (66.5%) | 66 (33.5%) |
| 5 or more Children | 20 (100.0%) | 0 (0.0%) |
| Total | 2,390 (97.0%) | 74 (3.0%) |
Income Below Poverty Among Single-Parent Households in Portland
According to the poverty data in Portland, 3.8% or 14 single-father households and 20.8% or 150 single-mother households are living below the poverty line. Among single-father households, those with 1 or 2 children have the highest poverty rate, with 14 households (4.9%) experiencing poverty. Likewise, among single-mother households, those with 5 or more children have the highest poverty rate, with 5 households (100.0%) falling below the poverty line.
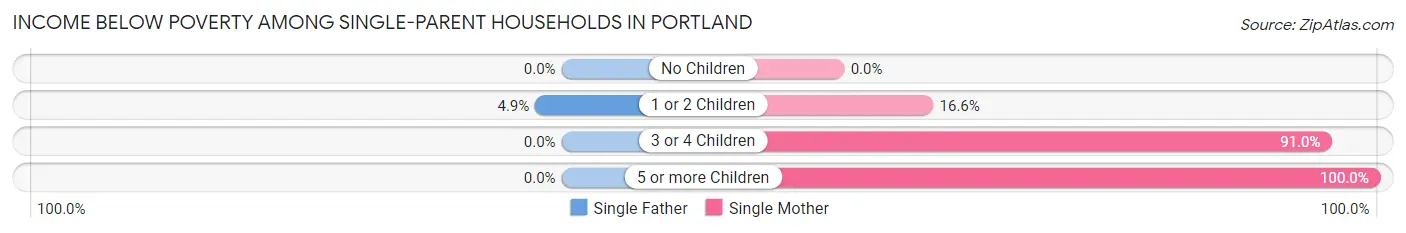
| Children | Single Father | Single Mother |
| No Children | 0 (0.0%) | 0 (0.0%) |
| 1 or 2 Children | 14 (4.9%) | 54 (16.6%) |
| 3 or 4 Children | 0 (0.0%) | 91 (91.0%) |
| 5 or more Children | 0 (0.0%) | 5 (100.0%) |
| Total | 14 (3.8%) | 150 (20.8%) |
Income Below Poverty Among Married-Couple vs Single-Parent Households in Portland
The poverty data for Portland shows that 74 of the married-couple family households (3.0%) and 164 of the single-parent households (15.1%) are living below the poverty level. Within the married-couple family households, those with 3 or 4 children have the highest poverty rate, with 66 households (33.5%) falling below the poverty line. Among the single-parent households, those with 5 or more children have the highest poverty rate, with 5 household (100.0%) living below poverty.
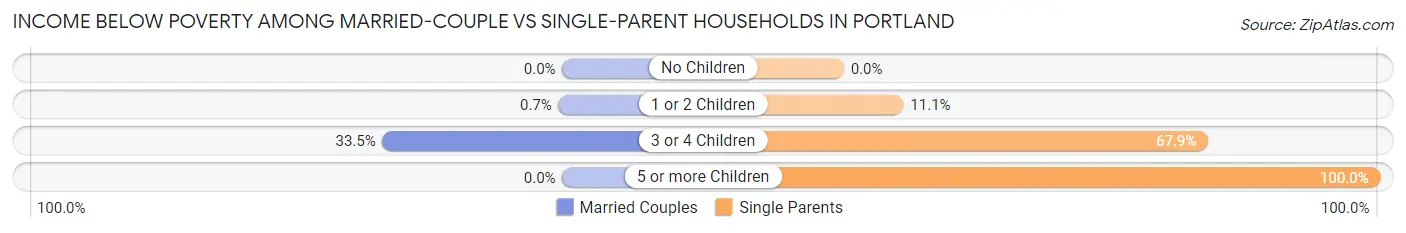
| Children | Married-Couple Families | Single-Parent Households |
| No Children | 0 (0.0%) | 0 (0.0%) |
| 1 or 2 Children | 8 (0.7%) | 68 (11.1%) |
| 3 or 4 Children | 66 (33.5%) | 91 (67.9%) |
| 5 or more Children | 0 (0.0%) | 5 (100.0%) |
| Total | 74 (3.0%) | 164 (15.1%) |
Race in Portland
The most populous races in Portland are White / Caucasian (11,664 | 88.5%), Hispanic or Latino (916 | 7.0%), and Black / African American (600 | 4.5%).
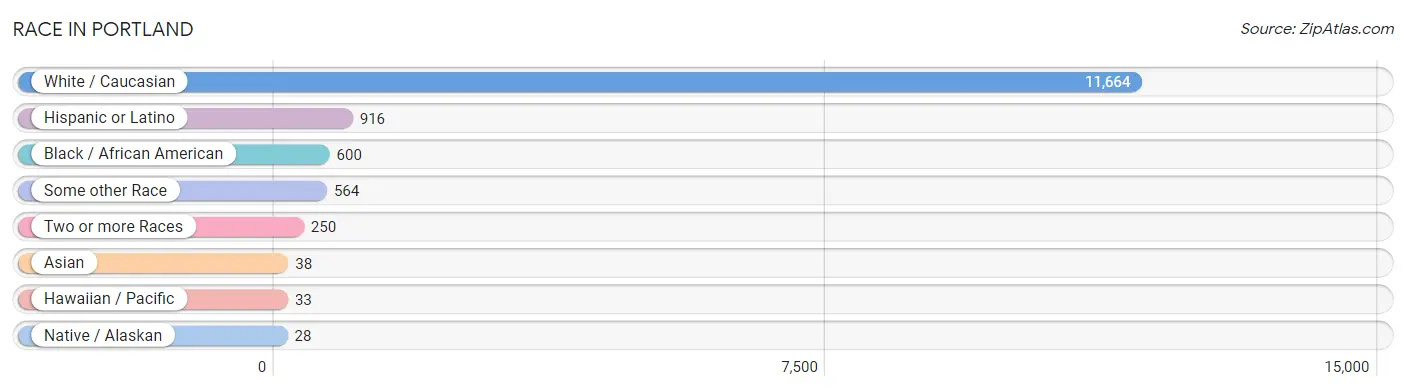
| Race | # Population | % Population |
| Asian | 38 | 0.3% |
| Black / African American | 600 | 4.5% |
| Hawaiian / Pacific | 33 | 0.3% |
| Hispanic or Latino | 916 | 7.0% |
| Native / Alaskan | 28 | 0.2% |
| White / Caucasian | 11,664 | 88.5% |
| Two or more Races | 250 | 1.9% |
| Some other Race | 564 | 4.3% |
| Total | 13,177 | 100.0% |
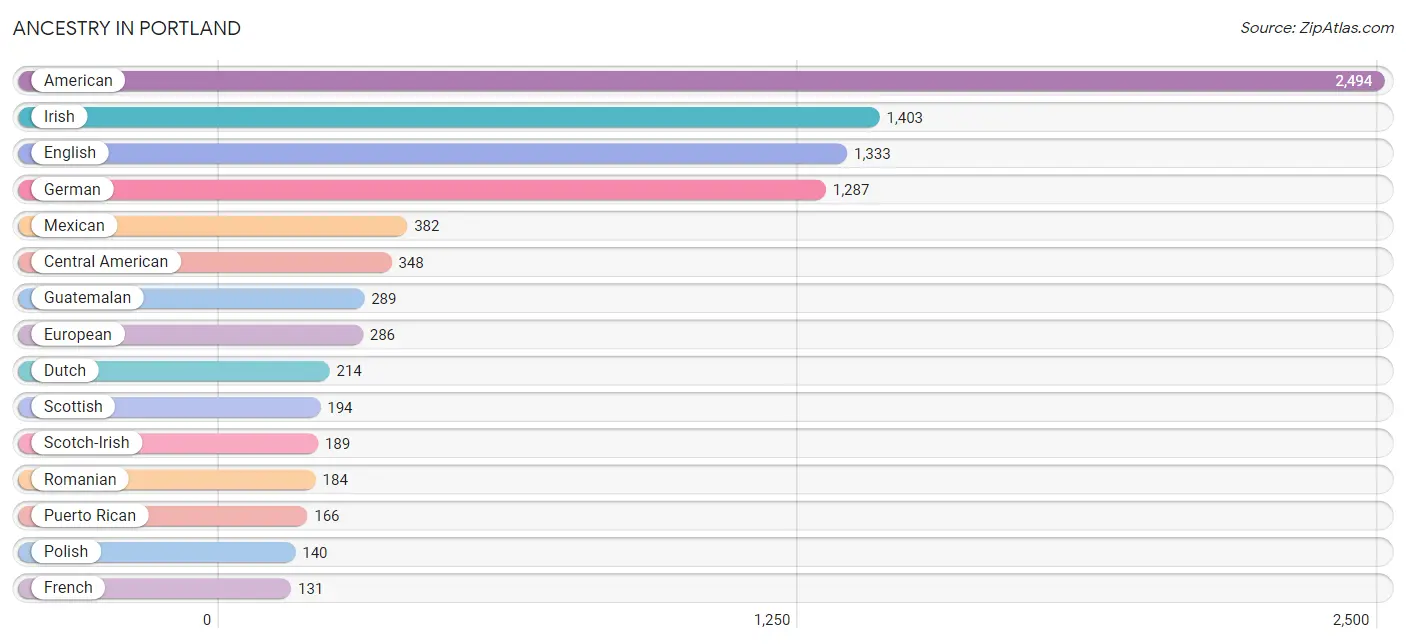
Ancestry in Portland
The most populous ancestries reported in Portland are American (2,494 | 18.9%), Irish (1,403 | 10.6%), English (1,333 | 10.1%), German (1,287 | 9.8%), and Mexican (382 | 2.9%), together accounting for 52.4% of all Portland residents.
| Ancestry | # Population | % Population |
| African | 7 | 0.1% |
| American | 2,494 | 18.9% |
| Austrian | 17 | 0.1% |
| Bhutanese | 16 | 0.1% |
| Blackfeet | 14 | 0.1% |
| British | 60 | 0.5% |
| Burmese | 12 | 0.1% |
| Central American | 348 | 2.6% |
| Cherokee | 55 | 0.4% |
| Czech | 101 | 0.8% |
| Danish | 8 | 0.1% |
| Dutch | 214 | 1.6% |
| Eastern European | 4 | 0.0% |
| English | 1,333 | 10.1% |
| European | 286 | 2.2% |
| French | 131 | 1.0% |
| French Canadian | 30 | 0.2% |
| German | 1,287 | 9.8% |
| Greek | 7 | 0.1% |
| Guatemalan | 289 | 2.2% |
| Honduran | 59 | 0.4% |
| Hungarian | 5 | 0.0% |
| Iranian | 4 | 0.0% |
| Irish | 1,403 | 10.6% |
| Italian | 122 | 0.9% |
| Korean | 18 | 0.1% |
| Luxembourger | 3 | 0.0% |
| Mexican | 382 | 2.9% |
| Native Hawaiian | 33 | 0.3% |
| Northern European | 46 | 0.4% |
| Norwegian | 81 | 0.6% |
| Peruvian | 11 | 0.1% |
| Polish | 140 | 1.1% |
| Puerto Rican | 166 | 1.3% |
| Romanian | 184 | 1.4% |
| Scandinavian | 8 | 0.1% |
| Scotch-Irish | 189 | 1.4% |
| Scottish | 194 | 1.5% |
| Slovak | 5 | 0.0% |
| South American | 11 | 0.1% |
| Spanish | 9 | 0.1% |
| Subsaharan African | 7 | 0.1% |
| Swedish | 93 | 0.7% |
| Ukrainian | 5 | 0.0% |
| Welsh | 34 | 0.3% | View All 45 Rows |
Immigrants in Portland
The most numerous immigrant groups reported in Portland came from Central America (385 | 2.9%), Latin America (385 | 2.9%), Guatemala (224 | 1.7%), Mexico (102 | 0.8%), and Honduras (59 | 0.4%), together accounting for 8.8% of all Portland residents.
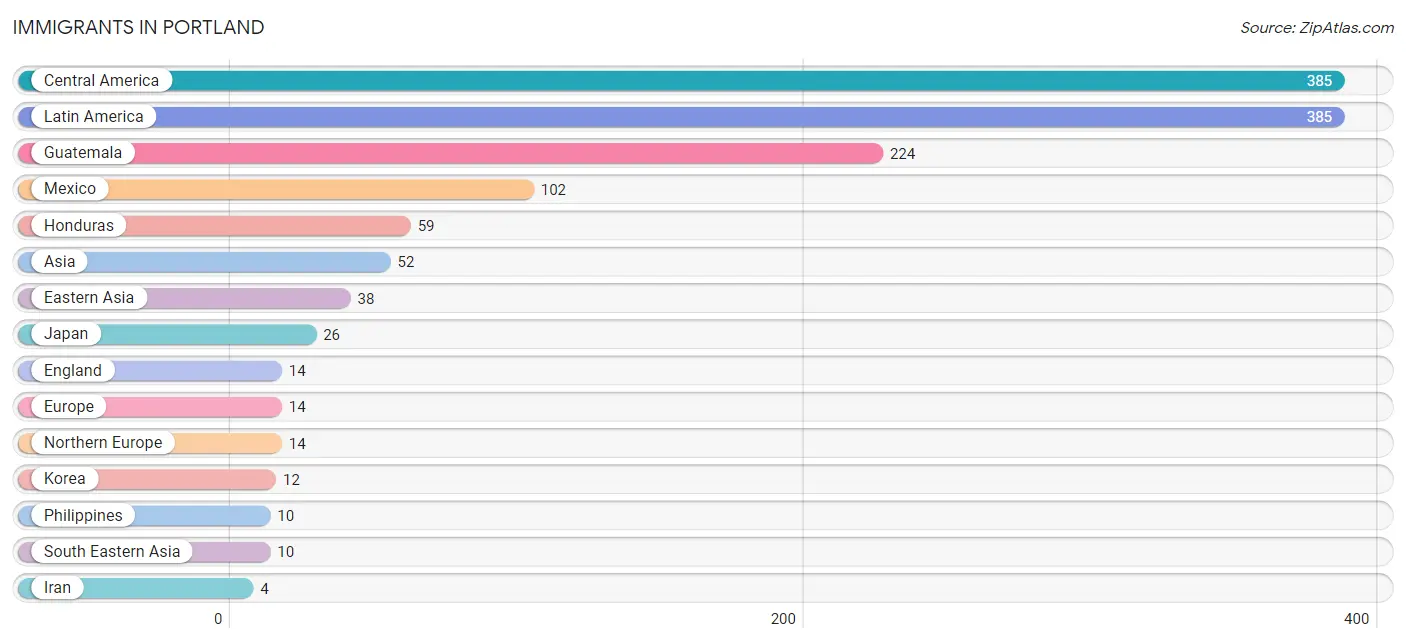
| Immigration Origin | # Population | % Population |
| Asia | 52 | 0.4% |
| Central America | 385 | 2.9% |
| Eastern Asia | 38 | 0.3% |
| England | 14 | 0.1% |
| Europe | 14 | 0.1% |
| Guatemala | 224 | 1.7% |
| Honduras | 59 | 0.4% |
| Iran | 4 | 0.0% |
| Japan | 26 | 0.2% |
| Korea | 12 | 0.1% |
| Latin America | 385 | 2.9% |
| Mexico | 102 | 0.8% |
| Northern Europe | 14 | 0.1% |
| Philippines | 10 | 0.1% |
| South Central Asia | 4 | 0.0% |
| South Eastern Asia | 10 | 0.1% | View All 16 Rows |
Sex and Age in Portland
Sex and Age in Portland
The most populous age groups in Portland are 15 to 19 Years (711 | 10.6%) for men and 20 to 24 Years (588 | 9.1%) for women.
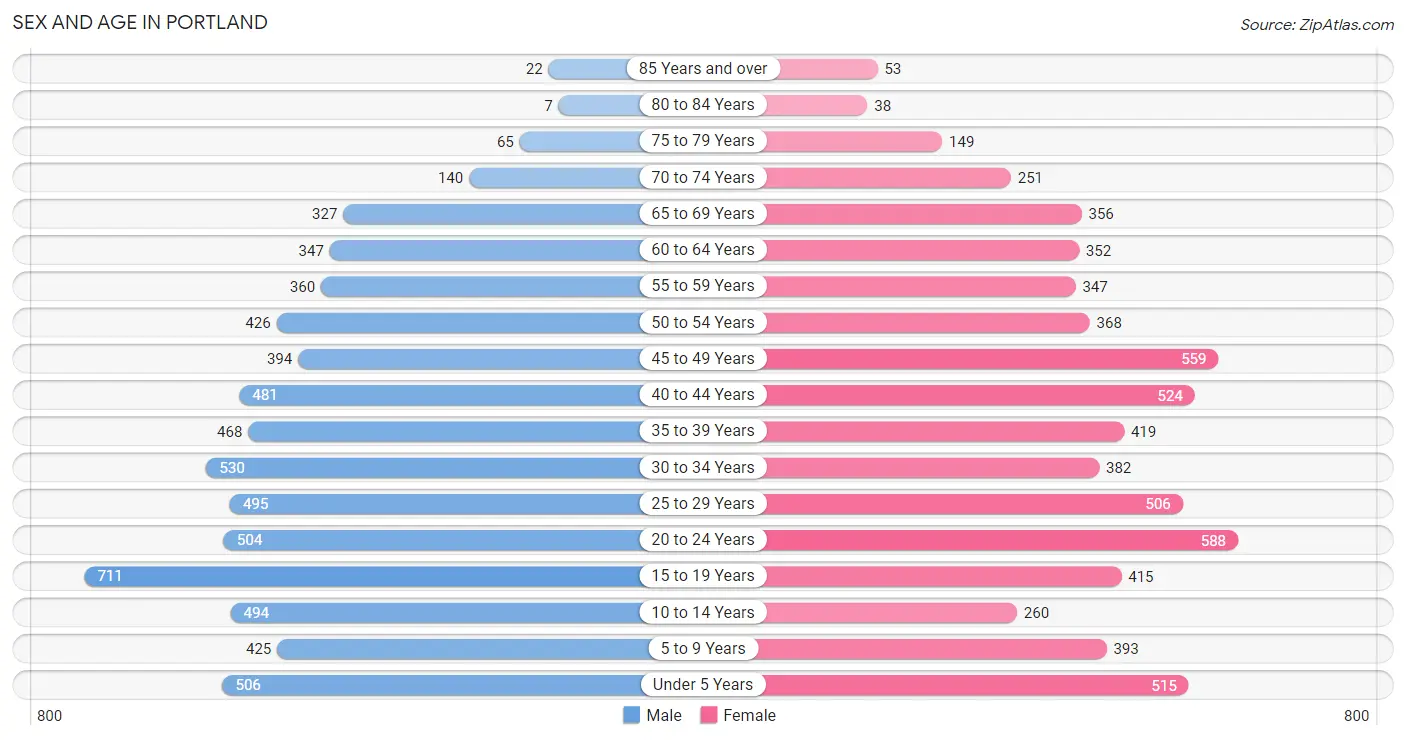
| Age Bracket | Male | Female |
| Under 5 Years | 506 (7.5%) | 515 (8.0%) |
| 5 to 9 Years | 425 (6.3%) | 393 (6.1%) |
| 10 to 14 Years | 494 (7.4%) | 260 (4.0%) |
| 15 to 19 Years | 711 (10.6%) | 415 (6.4%) |
| 20 to 24 Years | 504 (7.5%) | 588 (9.1%) |
| 25 to 29 Years | 495 (7.4%) | 506 (7.8%) |
| 30 to 34 Years | 530 (7.9%) | 382 (5.9%) |
| 35 to 39 Years | 468 (7.0%) | 419 (6.5%) |
| 40 to 44 Years | 481 (7.2%) | 524 (8.1%) |
| 45 to 49 Years | 394 (5.9%) | 559 (8.6%) |
| 50 to 54 Years | 426 (6.4%) | 368 (5.7%) |
| 55 to 59 Years | 360 (5.4%) | 347 (5.4%) |
| 60 to 64 Years | 347 (5.2%) | 352 (5.4%) |
| 65 to 69 Years | 327 (4.9%) | 356 (5.5%) |
| 70 to 74 Years | 140 (2.1%) | 251 (3.9%) |
| 75 to 79 Years | 65 (1.0%) | 149 (2.3%) |
| 80 to 84 Years | 7 (0.1%) | 38 (0.6%) |
| 85 Years and over | 22 (0.3%) | 53 (0.8%) |
| Total | 6,702 (100.0%) | 6,475 (100.0%) |
Families and Households in Portland
Median Family Size in Portland
The median family size in Portland is 3.06 persons per family, with married-couple families (2,464 | 69.4%) accounting for the largest median family size of 3.14 persons per family. On the other hand, single male/father families (369 | 10.4%) represent the smallest median family size with 2.44 persons per family.
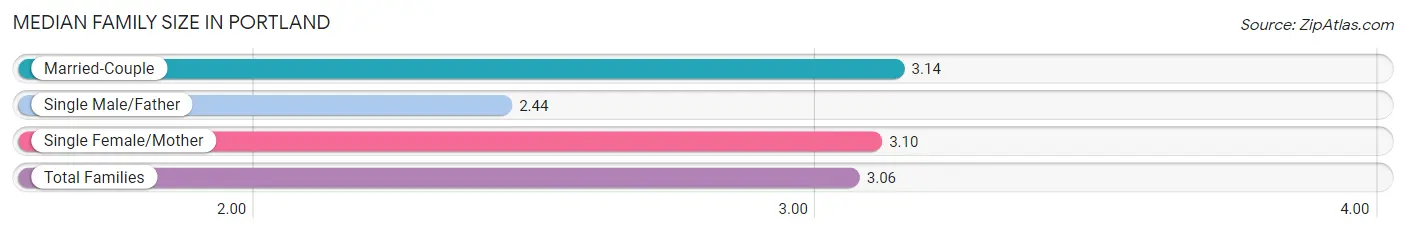
| Family Type | # Families | Family Size |
| Married-Couple | 2,464 (69.4%) | 3.14 |
| Single Male/Father | 369 (10.4%) | 2.44 |
| Single Female/Mother | 720 (20.3%) | 3.10 |
| Total Families | 3,553 (100.0%) | 3.06 |
Median Household Size in Portland
The median household size in Portland is 2.60 persons per household, with single female/mother households (720 | 14.2%) accounting for the largest median household size of 3.4 persons per household. non-family households (1,506 | 29.8%) represent the smallest median household size with 1.20 persons per household.
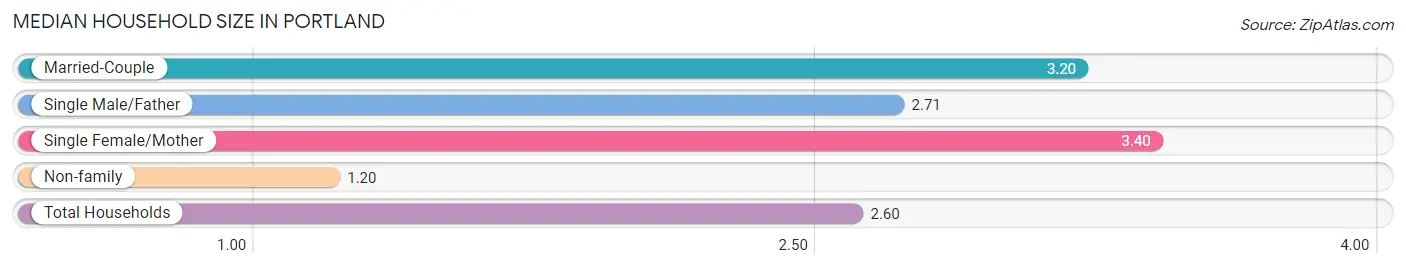
| Household Type | # Households | Household Size |
| Married-Couple | 2,464 (48.7%) | 3.20 |
| Single Male/Father | 369 (7.3%) | 2.71 |
| Single Female/Mother | 720 (14.2%) | 3.40 |
| Non-family | 1,506 (29.8%) | 1.20 |
| Total Households | 5,059 (100.0%) | 2.60 |
Household Size by Marriage Status in Portland
Out of a total of 5,059 households in Portland, 3,553 (70.2%) are family households, while 1,506 (29.8%) are nonfamily households. The most numerous type of family households are 2-person households, comprising 1,306, and the most common type of nonfamily households are 1-person households, comprising 1,199.

| Household Size | Family Households | Nonfamily Households |
| 1-Person Households | - | 1,199 (23.7%) |
| 2-Person Households | 1,306 (25.8%) | 288 (5.7%) |
| 3-Person Households | 920 (18.2%) | 10 (0.2%) |
| 4-Person Households | 913 (18.0%) | 9 (0.2%) |
| 5-Person Households | 228 (4.5%) | 0 (0.0%) |
| 6-Person Households | 152 (3.0%) | 0 (0.0%) |
| 7+ Person Households | 34 (0.7%) | 0 (0.0%) |
| Total | 3,553 (70.2%) | 1,506 (29.8%) |
Female Fertility in Portland
Fertility by Age in Portland
Average fertility rate in Portland is 41.0 births per 1,000 women. Women in the age bracket of 20 to 34 years have the highest fertility rate with 92.0 births per 1,000 women. Women in the age bracket of 20 to 34 years acount for 95.1% of all women with births.
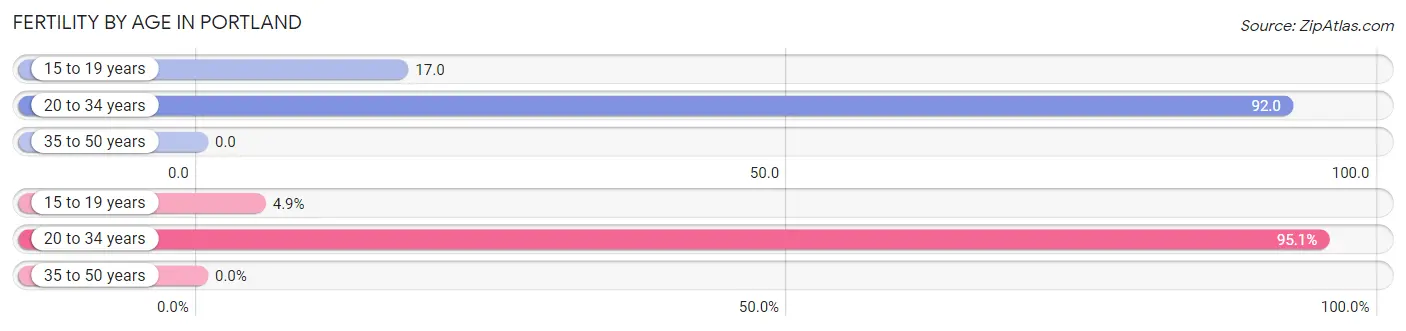
| Age Bracket | Women with Births | Births / 1,000 Women |
| 15 to 19 years | 7 (4.9%) | 17.0 |
| 20 to 34 years | 136 (95.1%) | 92.0 |
| 35 to 50 years | 0 (0.0%) | 0.0 |
| Total | 143 (100.0%) | 41.0 |
Fertility by Age by Marriage Status in Portland
69.9% of women with births (143) in Portland are married. The highest percentage of unmarried women with births falls into 15 to 19 years age bracket with 100.0% of them unmarried at the time of birth, while the lowest percentage of unmarried women with births belong to 20 to 34 years age bracket with 26.5% of them unmarried.
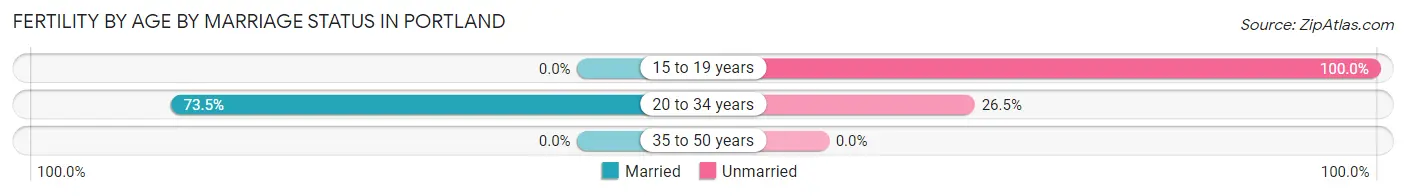
| Age Bracket | Married | Unmarried |
| 15 to 19 years | 0 (0.0%) | 7 (100.0%) |
| 20 to 34 years | 100 (73.5%) | 36 (26.5%) |
| 35 to 50 years | 0 (0.0%) | 0 (0.0%) |
| Total | 100 (69.9%) | 43 (30.1%) |
Fertility by Education in Portland
Average fertility rate in Portland is 41.0 births per 1,000 women. Women with the education attainment of bachelor's degree have the highest fertility rate of 71.0 births per 1,000 women, while women with the education attainment of less than high school have the lowest fertility at 14.0 births per 1,000 women. Women with the education attainment of college or associate's degree represent 38.5% of all women with births.
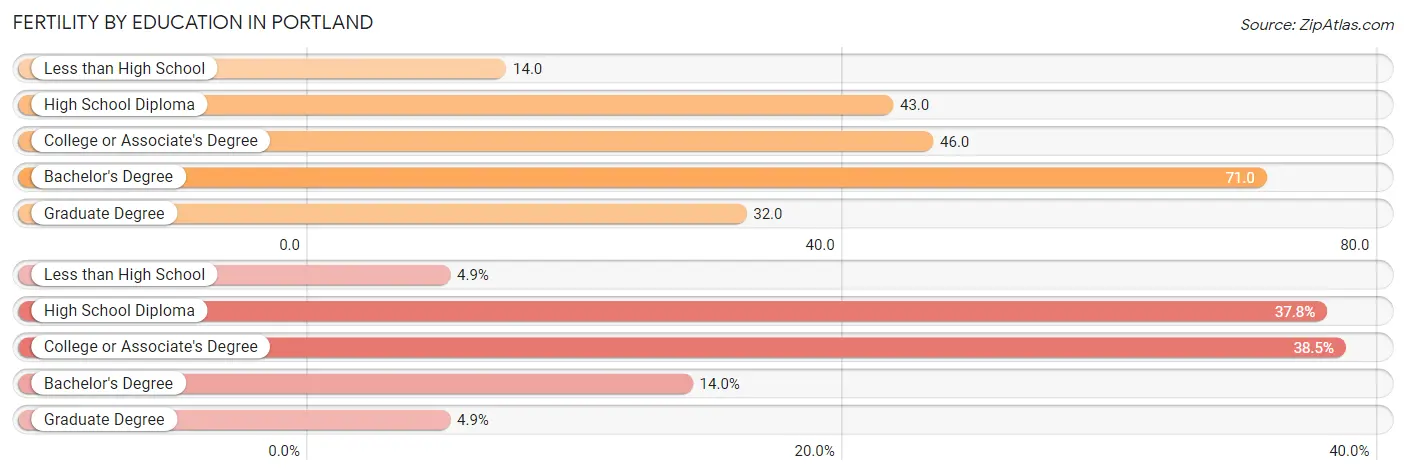
| Educational Attainment | Women with Births | Births / 1,000 Women |
| Less than High School | 7 (4.9%) | 14.0 |
| High School Diploma | 54 (37.8%) | 43.0 |
| College or Associate's Degree | 55 (38.5%) | 46.0 |
| Bachelor's Degree | 20 (14.0%) | 71.0 |
| Graduate Degree | 7 (4.9%) | 32.0 |
| Total | 143 (100.0%) | 41.0 |
Fertility by Education by Marriage Status in Portland
30.1% of women with births in Portland are unmarried. Women with the educational attainment of college or associate's degree are most likely to be married with 100.0% of them married at childbirth, while women with the educational attainment of less than high school are least likely to be married with 100.0% of them unmarried at childbirth.
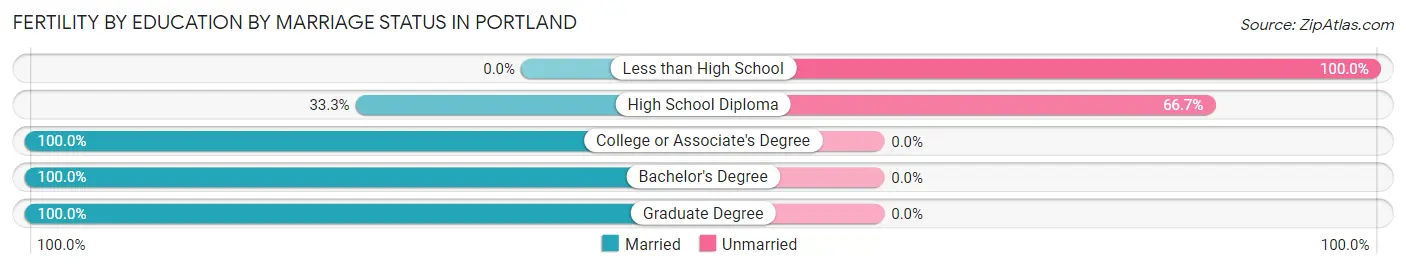
| Educational Attainment | Married | Unmarried |
| Less than High School | 0 (0.0%) | 7 (100.0%) |
| High School Diploma | 18 (33.3%) | 36 (66.7%) |
| College or Associate's Degree | 55 (100.0%) | 0 (0.0%) |
| Bachelor's Degree | 20 (100.0%) | 0 (0.0%) |
| Graduate Degree | 7 (100.0%) | 0 (0.0%) |
| Total | 100 (69.9%) | 43 (30.1%) |
Employment Characteristics in Portland
Employment by Class of Employer in Portland
Among the 6,991 employed individuals in Portland, private company employees (5,325 | 76.2%), local government employees (496 | 7.1%), and self-employed (not incorporated) (368 | 5.3%) make up the most common classes of employment.
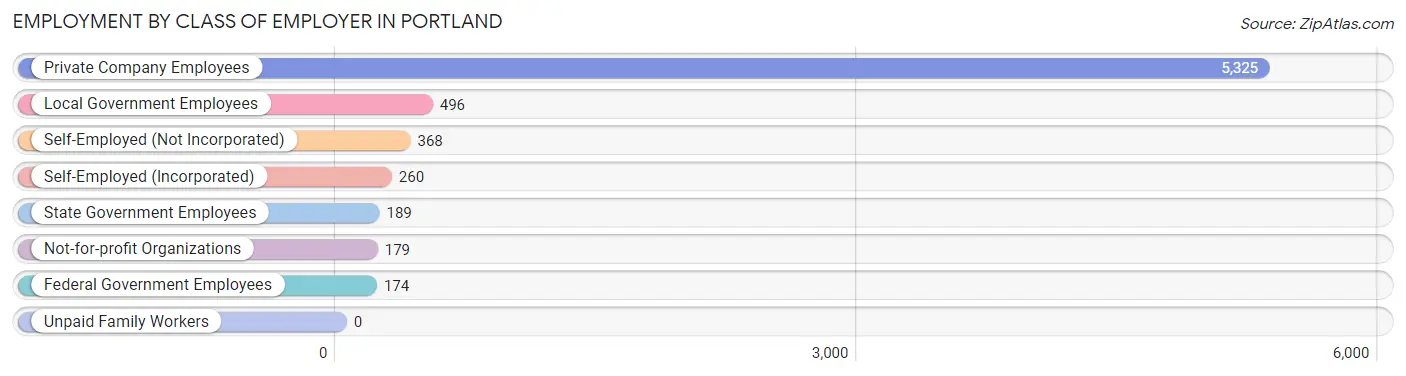
| Employer Class | # Employees | % Employees |
| Private Company Employees | 5,325 | 76.2% |
| Self-Employed (Incorporated) | 260 | 3.7% |
| Self-Employed (Not Incorporated) | 368 | 5.3% |
| Not-for-profit Organizations | 179 | 2.6% |
| Local Government Employees | 496 | 7.1% |
| State Government Employees | 189 | 2.7% |
| Federal Government Employees | 174 | 2.5% |
| Unpaid Family Workers | 0 | 0.0% |
| Total | 6,991 | 100.0% |
Employment Status by Age in Portland
According to the labor force statistics for Portland, out of the total population over 16 years of age (10,249), 71.9% or 7,369 individuals are in the labor force, with 3.8% or 280 of them unemployed. The age group with the highest labor force participation rate is 30 to 34 years, with 89.1% or 813 individuals in the labor force. Within the labor force, the 16 to 19 years age range has the highest percentage of unemployed individuals, with 12.1% or 48 of them being unemployed.
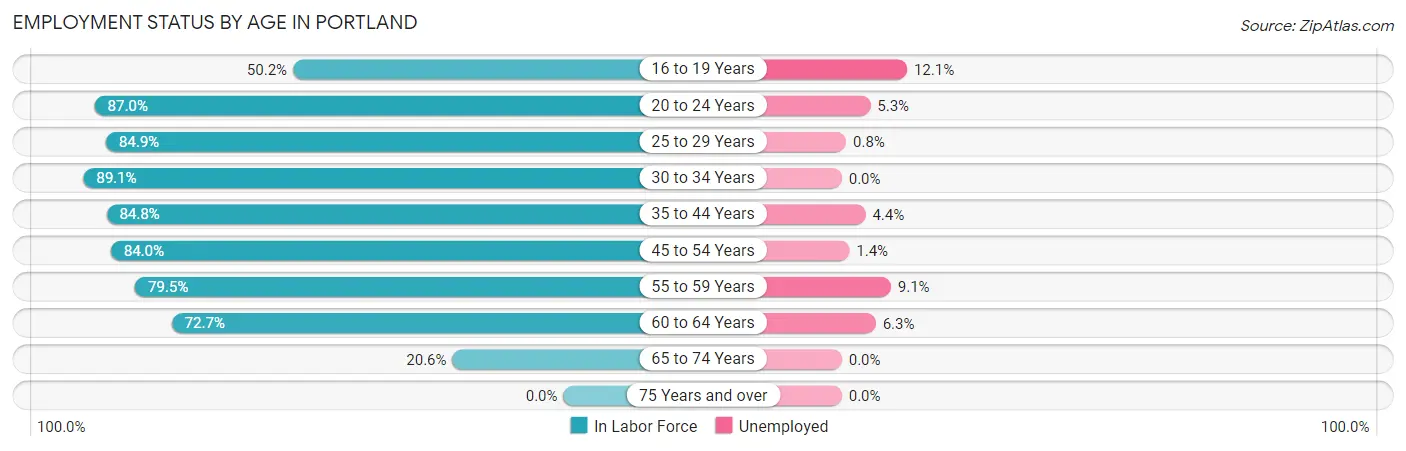
| Age Bracket | In Labor Force | Unemployed |
| 16 to 19 Years | 397 (50.2%) | 48 (12.1%) |
| 20 to 24 Years | 950 (87.0%) | 50 (5.3%) |
| 25 to 29 Years | 850 (84.9%) | 7 (0.8%) |
| 30 to 34 Years | 813 (89.1%) | 0 (0.0%) |
| 35 to 44 Years | 1,604 (84.8%) | 71 (4.4%) |
| 45 to 54 Years | 1,467 (84.0%) | 21 (1.4%) |
| 55 to 59 Years | 562 (79.5%) | 51 (9.1%) |
| 60 to 64 Years | 508 (72.7%) | 32 (6.3%) |
| 65 to 74 Years | 221 (20.6%) | 0 (0.0%) |
| 75 Years and over | 0 (0.0%) | 0 (0.0%) |
| Total | 7,369 (71.9%) | 280 (3.8%) |
Employment Status by Educational Attainment in Portland
According to labor force statistics for Portland, 83.4% of individuals (5,803) out of the total population between 25 and 64 years of age (6,958) are in the labor force, with 3.1% or 180 of them being unemployed. The group with the highest labor force participation rate are those with the educational attainment of bachelor's degree or higher, with 91.7% or 916 individuals in the labor force. Within the labor force, individuals with less than high school education have the highest percentage of unemployment, with 12.0% or 78 of them being unemployed.
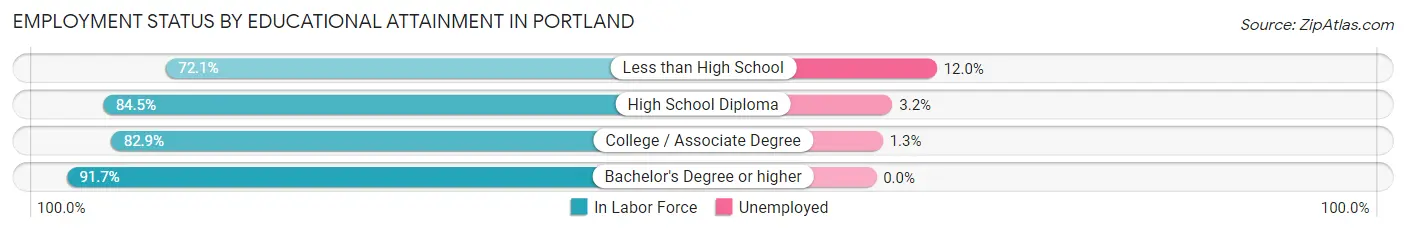
| Educational Attainment | In Labor Force | Unemployed |
| Less than High School | 650 (72.1%) | 108 (12.0%) |
| High School Diploma | 2,495 (84.5%) | 94 (3.2%) |
| College / Associate Degree | 1,745 (82.9%) | 27 (1.3%) |
| Bachelor's Degree or higher | 916 (91.7%) | 0 (0.0%) |
| Total | 5,803 (83.4%) | 216 (3.1%) |
Employment Occupations by Sex in Portland
Management, Business, Science and Arts Occupations
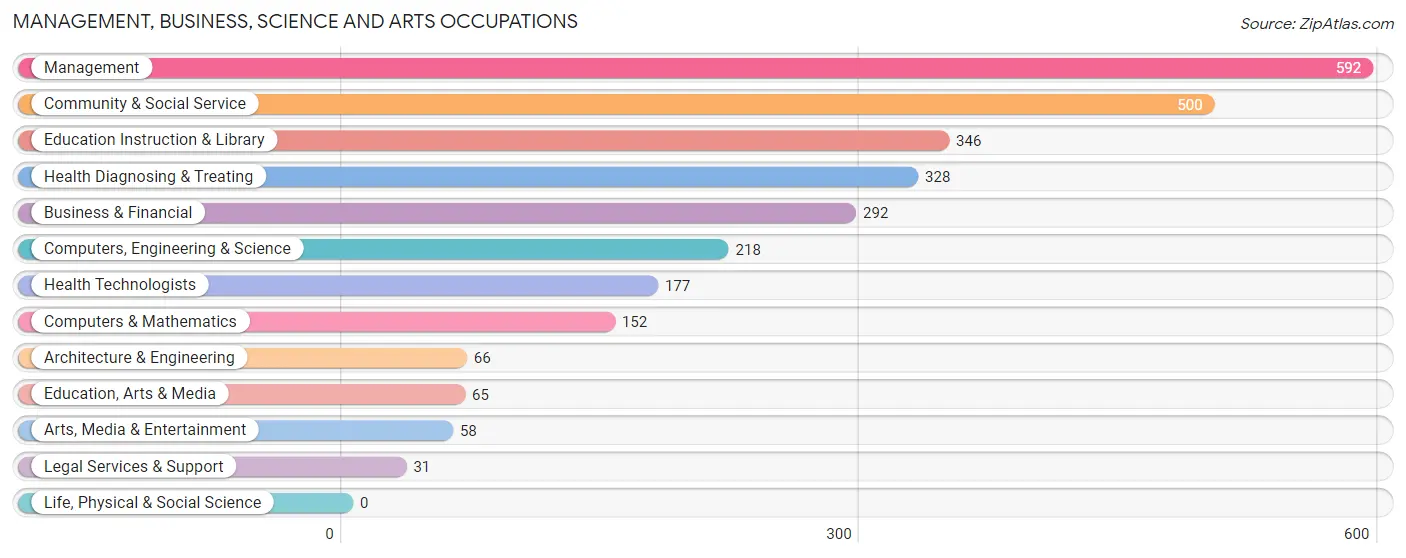
The most common Management, Business, Science and Arts occupations in Portland are Management (592 | 8.4%), Community & Social Service (500 | 7.0%), Education Instruction & Library (346 | 4.9%), Health Diagnosing & Treating (328 | 4.6%), and Business & Financial (292 | 4.1%).
Management, Business, Science and Arts Occupations by Sex
Within the Management, Business, Science and Arts occupations in Portland, the most male-oriented occupations are Architecture & Engineering (100.0%), Arts, Media & Entertainment (100.0%), and Management (64.0%), while the most female-oriented occupations are Legal Services & Support (100.0%), Health Technologists (100.0%), and Education Instruction & Library (86.7%).
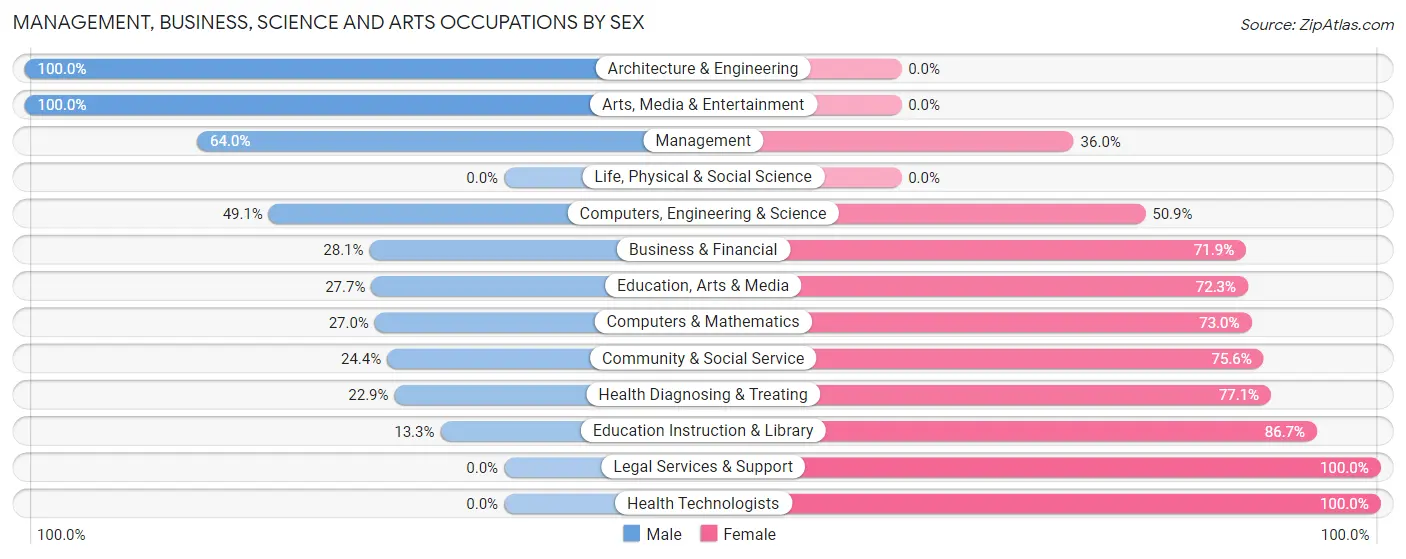
| Occupation | Male | Female |
| Management | 379 (64.0%) | 213 (36.0%) |
| Business & Financial | 82 (28.1%) | 210 (71.9%) |
| Computers, Engineering & Science | 107 (49.1%) | 111 (50.9%) |
| Computers & Mathematics | 41 (27.0%) | 111 (73.0%) |
| Architecture & Engineering | 66 (100.0%) | 0 (0.0%) |
| Life, Physical & Social Science | 0 (0.0%) | 0 (0.0%) |
| Community & Social Service | 122 (24.4%) | 378 (75.6%) |
| Education, Arts & Media | 18 (27.7%) | 47 (72.3%) |
| Legal Services & Support | 0 (0.0%) | 31 (100.0%) |
| Education Instruction & Library | 46 (13.3%) | 300 (86.7%) |
| Arts, Media & Entertainment | 58 (100.0%) | 0 (0.0%) |
| Health Diagnosing & Treating | 75 (22.9%) | 253 (77.1%) |
| Health Technologists | 0 (0.0%) | 177 (100.0%) |
| Total (Category) | 765 (39.6%) | 1,165 (60.4%) |
| Total (Overall) | 3,710 (52.3%) | 3,384 (47.7%) |
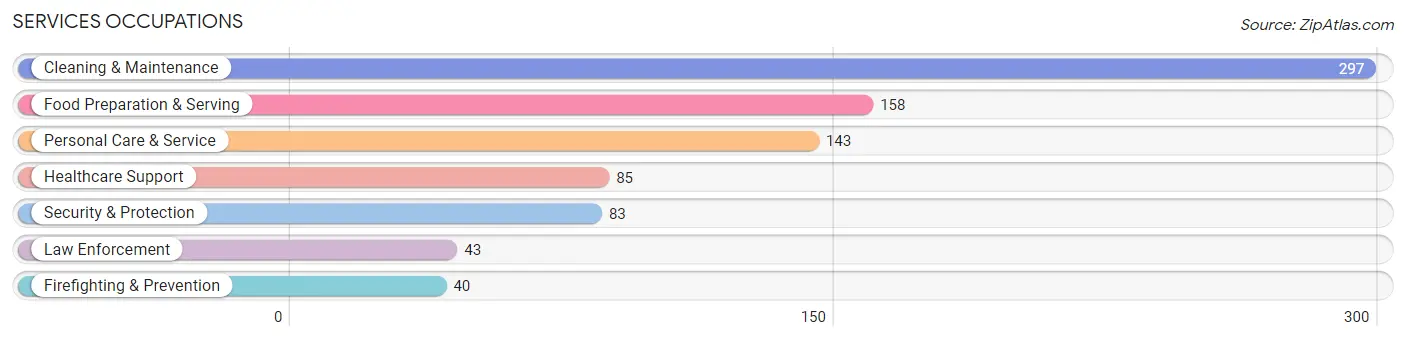
Services Occupations
The most common Services occupations in Portland are Cleaning & Maintenance (297 | 4.2%), Food Preparation & Serving (158 | 2.2%), Personal Care & Service (143 | 2.0%), Healthcare Support (85 | 1.2%), and Security & Protection (83 | 1.2%).
Services Occupations by Sex
Within the Services occupations in Portland, the most male-oriented occupations are Law Enforcement (100.0%), Security & Protection (79.5%), and Cleaning & Maintenance (64.6%), while the most female-oriented occupations are Personal Care & Service (100.0%), Healthcare Support (85.9%), and Food Preparation & Serving (43.7%).
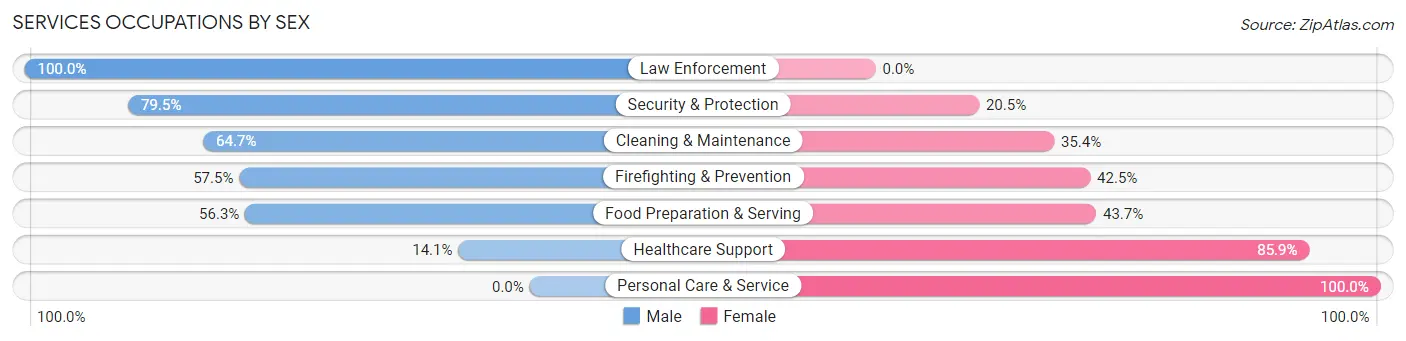
| Occupation | Male | Female |
| Healthcare Support | 12 (14.1%) | 73 (85.9%) |
| Security & Protection | 66 (79.5%) | 17 (20.5%) |
| Firefighting & Prevention | 23 (57.5%) | 17 (42.5%) |
| Law Enforcement | 43 (100.0%) | 0 (0.0%) |
| Food Preparation & Serving | 89 (56.3%) | 69 (43.7%) |
| Cleaning & Maintenance | 192 (64.6%) | 105 (35.3%) |
| Personal Care & Service | 0 (0.0%) | 143 (100.0%) |
| Total (Category) | 359 (46.9%) | 407 (53.1%) |
| Total (Overall) | 3,710 (52.3%) | 3,384 (47.7%) |
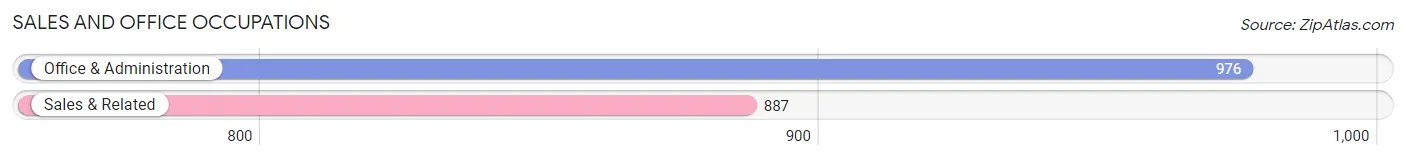
Sales and Office Occupations
The most common Sales and Office occupations in Portland are Office & Administration (976 | 13.8%), and Sales & Related (887 | 12.5%).
Sales and Office Occupations by Sex
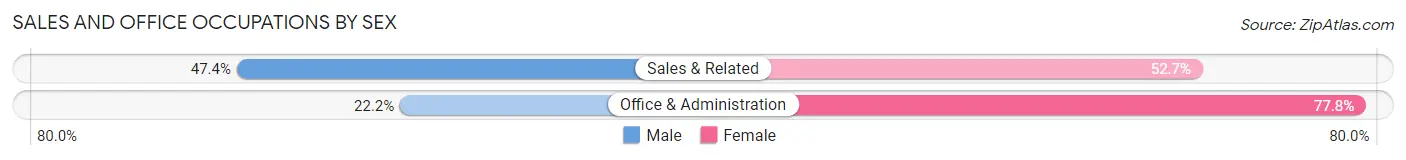
| Occupation | Male | Female |
| Sales & Related | 420 (47.3%) | 467 (52.6%) |
| Office & Administration | 217 (22.2%) | 759 (77.8%) |
| Total (Category) | 637 (34.2%) | 1,226 (65.8%) |
| Total (Overall) | 3,710 (52.3%) | 3,384 (47.7%) |
Natural Resources, Construction and Maintenance Occupations
The most common Natural Resources, Construction and Maintenance occupations in Portland are Construction & Extraction (579 | 8.2%), and Installation, Maintenance & Repair (261 | 3.7%).
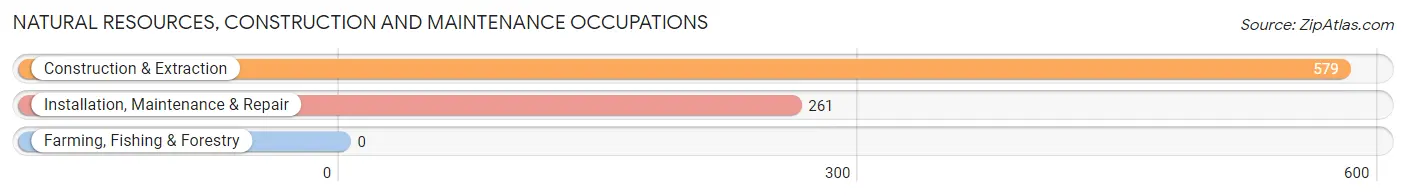
Natural Resources, Construction and Maintenance Occupations by Sex
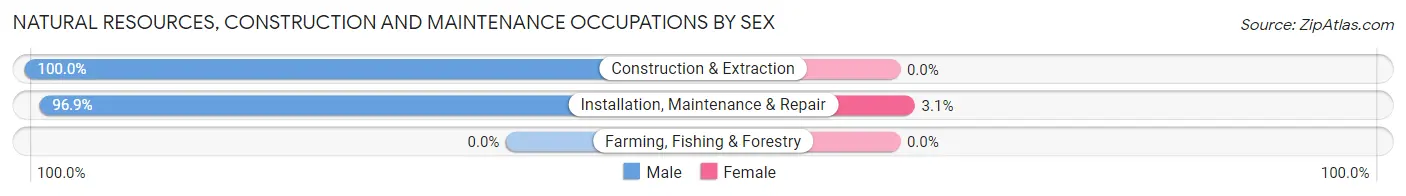
| Occupation | Male | Female |
| Farming, Fishing & Forestry | 0 (0.0%) | 0 (0.0%) |
| Construction & Extraction | 579 (100.0%) | 0 (0.0%) |
| Installation, Maintenance & Repair | 253 (96.9%) | 8 (3.1%) |
| Total (Category) | 832 (99.1%) | 8 (0.9%) |
| Total (Overall) | 3,710 (52.3%) | 3,384 (47.7%) |
Production, Transportation and Moving Occupations
The most common Production, Transportation and Moving occupations in Portland are Production (923 | 13.0%), Material Moving (477 | 6.7%), and Transportation (295 | 4.2%).
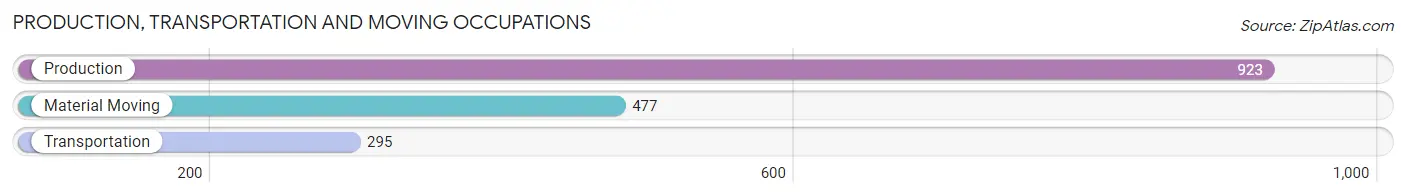
Production, Transportation and Moving Occupations by Sex
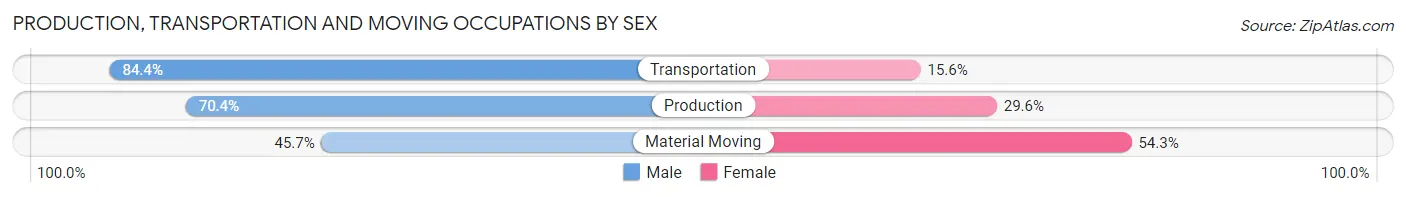
| Occupation | Male | Female |
| Production | 650 (70.4%) | 273 (29.6%) |
| Transportation | 249 (84.4%) | 46 (15.6%) |
| Material Moving | 218 (45.7%) | 259 (54.3%) |
| Total (Category) | 1,117 (65.9%) | 578 (34.1%) |
| Total (Overall) | 3,710 (52.3%) | 3,384 (47.7%) |
Employment Industries by Sex in Portland
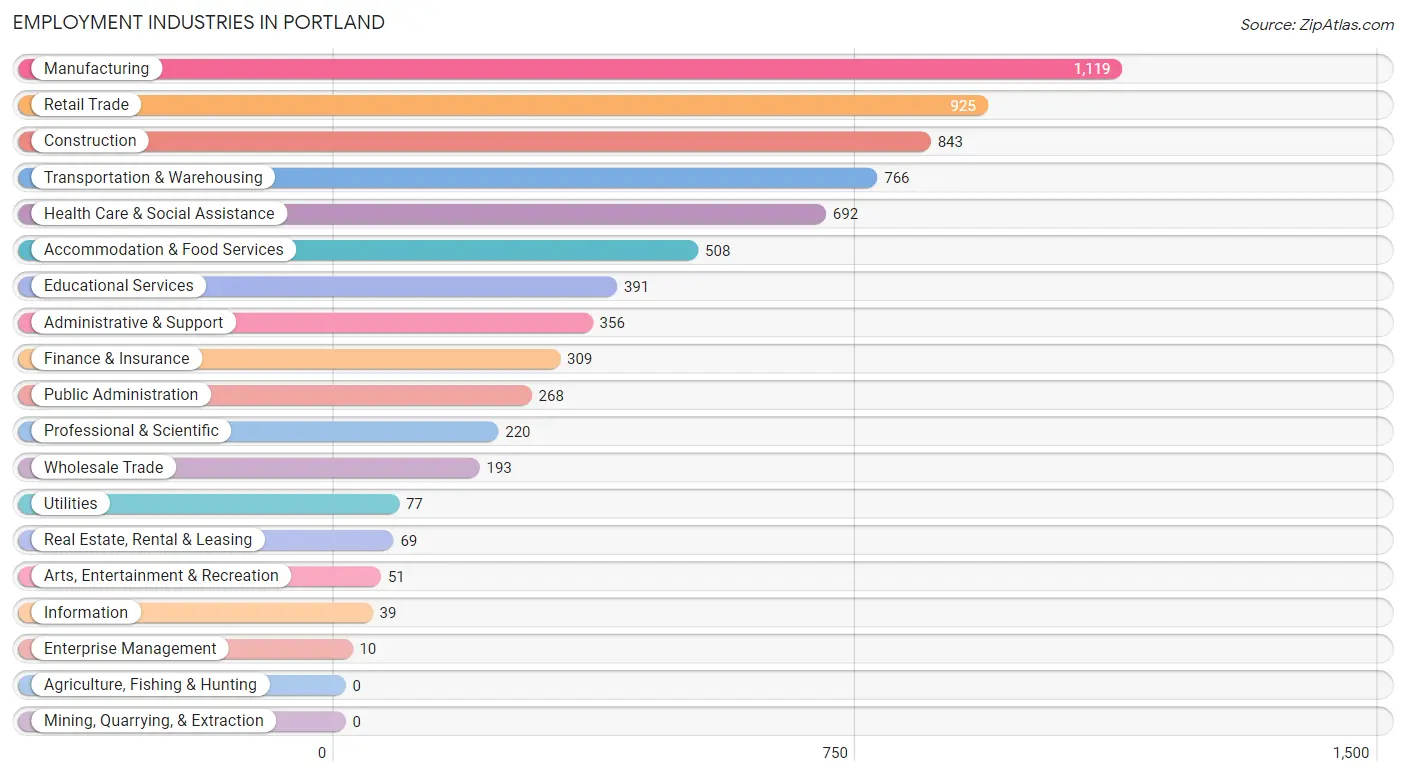
Employment Industries in Portland
The major employment industries in Portland include Manufacturing (1,119 | 15.8%), Retail Trade (925 | 13.0%), Construction (843 | 11.9%), Transportation & Warehousing (766 | 10.8%), and Health Care & Social Assistance (692 | 9.8%).
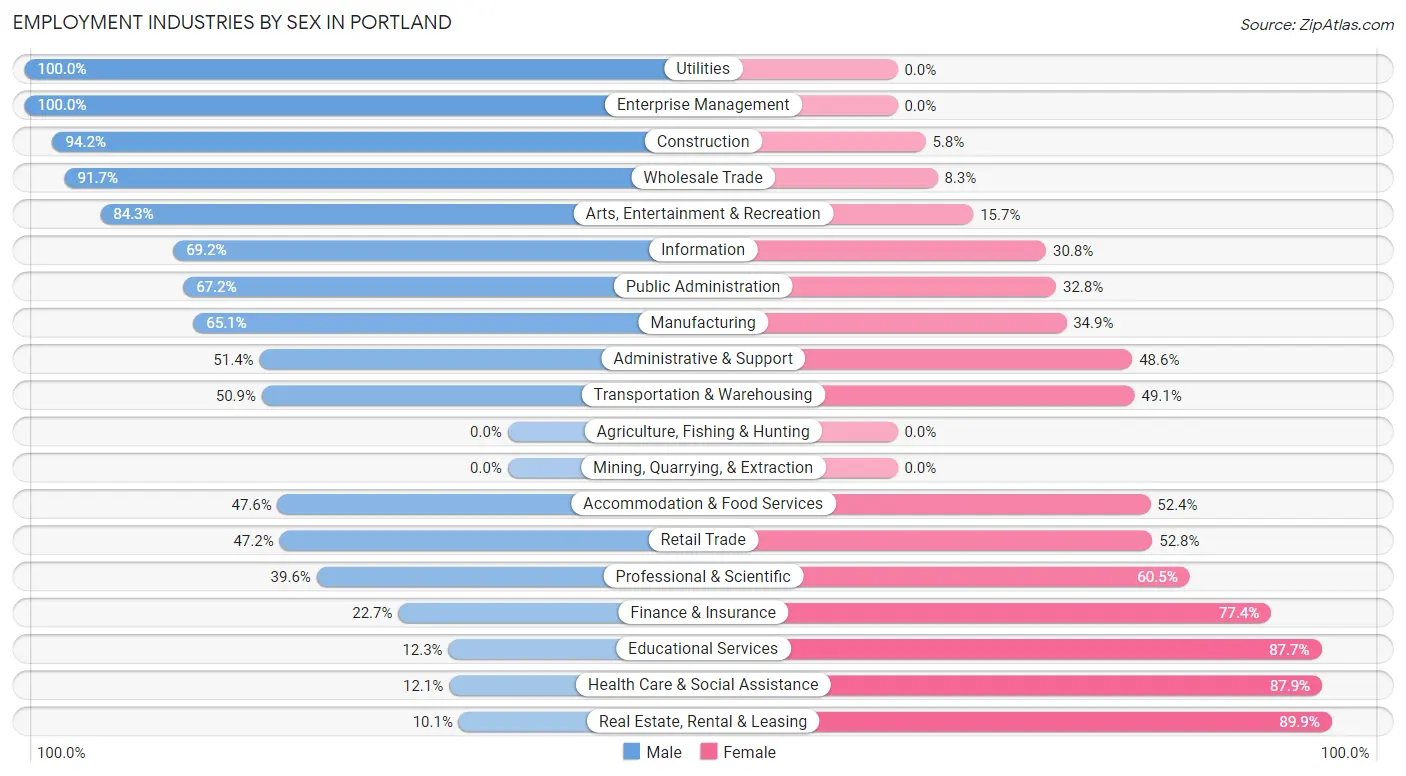
Employment Industries by Sex in Portland
The Portland industries that see more men than women are Utilities (100.0%), Enterprise Management (100.0%), and Construction (94.2%), whereas the industries that tend to have a higher number of women are Real Estate, Rental & Leasing (89.9%), Health Care & Social Assistance (87.9%), and Educational Services (87.7%).
| Industry | Male | Female |
| Agriculture, Fishing & Hunting | 0 (0.0%) | 0 (0.0%) |
| Mining, Quarrying, & Extraction | 0 (0.0%) | 0 (0.0%) |
| Construction | 794 (94.2%) | 49 (5.8%) |
| Manufacturing | 728 (65.1%) | 391 (34.9%) |
| Wholesale Trade | 177 (91.7%) | 16 (8.3%) |
| Retail Trade | 437 (47.2%) | 488 (52.8%) |
| Transportation & Warehousing | 390 (50.9%) | 376 (49.1%) |
| Utilities | 77 (100.0%) | 0 (0.0%) |
| Information | 27 (69.2%) | 12 (30.8%) |
| Finance & Insurance | 70 (22.7%) | 239 (77.3%) |
| Real Estate, Rental & Leasing | 7 (10.1%) | 62 (89.9%) |
| Professional & Scientific | 87 (39.6%) | 133 (60.5%) |
| Enterprise Management | 10 (100.0%) | 0 (0.0%) |
| Administrative & Support | 183 (51.4%) | 173 (48.6%) |
| Educational Services | 48 (12.3%) | 343 (87.7%) |
| Health Care & Social Assistance | 84 (12.1%) | 608 (87.9%) |
| Arts, Entertainment & Recreation | 43 (84.3%) | 8 (15.7%) |
| Accommodation & Food Services | 242 (47.6%) | 266 (52.4%) |
| Public Administration | 180 (67.2%) | 88 (32.8%) |
| Total | 3,710 (52.3%) | 3,384 (47.7%) |
Education in Portland
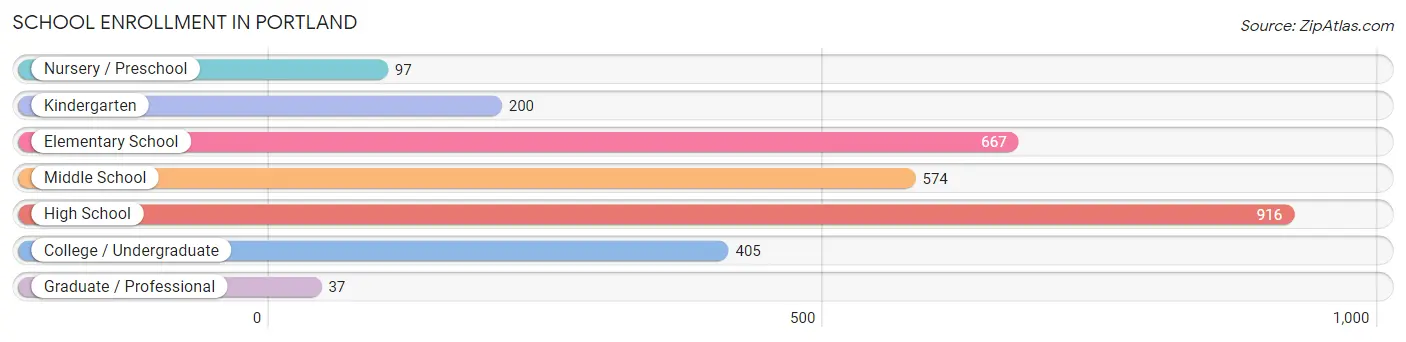
School Enrollment in Portland
The most common levels of schooling among the 2,896 students in Portland are high school (916 | 31.6%), elementary school (667 | 23.0%), and middle school (574 | 19.8%).
| School Level | # Students | % Students |
| Nursery / Preschool | 97 | 3.4% |
| Kindergarten | 200 | 6.9% |
| Elementary School | 667 | 23.0% |
| Middle School | 574 | 19.8% |
| High School | 916 | 31.6% |
| College / Undergraduate | 405 | 14.0% |
| Graduate / Professional | 37 | 1.3% |
| Total | 2,896 | 100.0% |
School Enrollment by Age by Funding Source in Portland
Out of a total of 2,896 students who are enrolled in schools in Portland, 229 (7.9%) attend a private institution, while the remaining 2,667 (92.1%) are enrolled in public schools. The age group of 35 years and over has the highest likelihood of being enrolled in private schools, with 83 (56.9% in the age bracket) enrolled. Conversely, the age group of 18 to 19 year olds has the lowest likelihood of being enrolled in a private school, with 109 (100.0% in the age bracket) attending a public institution.
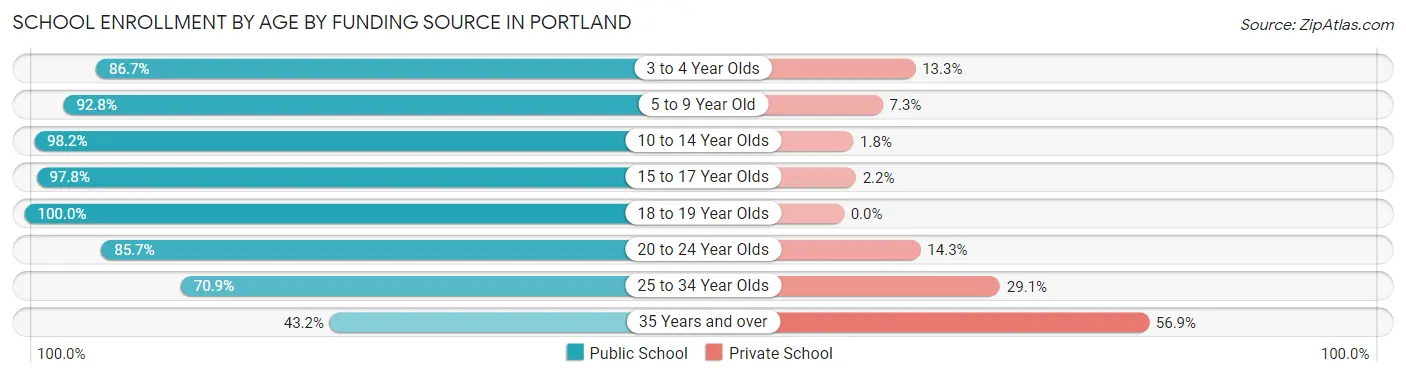
| Age Bracket | Public School | Private School |
| 3 to 4 Year Olds | 39 (86.7%) | 6 (13.3%) |
| 5 to 9 Year Old | 742 (92.7%) | 58 (7.2%) |
| 10 to 14 Year Olds | 723 (98.2%) | 13 (1.8%) |
| 15 to 17 Year Olds | 830 (97.8%) | 19 (2.2%) |
| 18 to 19 Year Olds | 109 (100.0%) | 0 (0.0%) |
| 20 to 24 Year Olds | 66 (85.7%) | 11 (14.3%) |
| 25 to 34 Year Olds | 95 (70.9%) | 39 (29.1%) |
| 35 Years and over | 63 (43.1%) | 83 (56.9%) |
| Total | 2,667 (92.1%) | 229 (7.9%) |
Educational Attainment by Field of Study in Portland
Business (263 | 18.5%), science & technology (239 | 16.8%), education (192 | 13.5%), social sciences (129 | 9.1%), and engineering (107 | 7.5%) are the most common fields of study among 1,422 individuals in Portland who have obtained a bachelor's degree or higher.
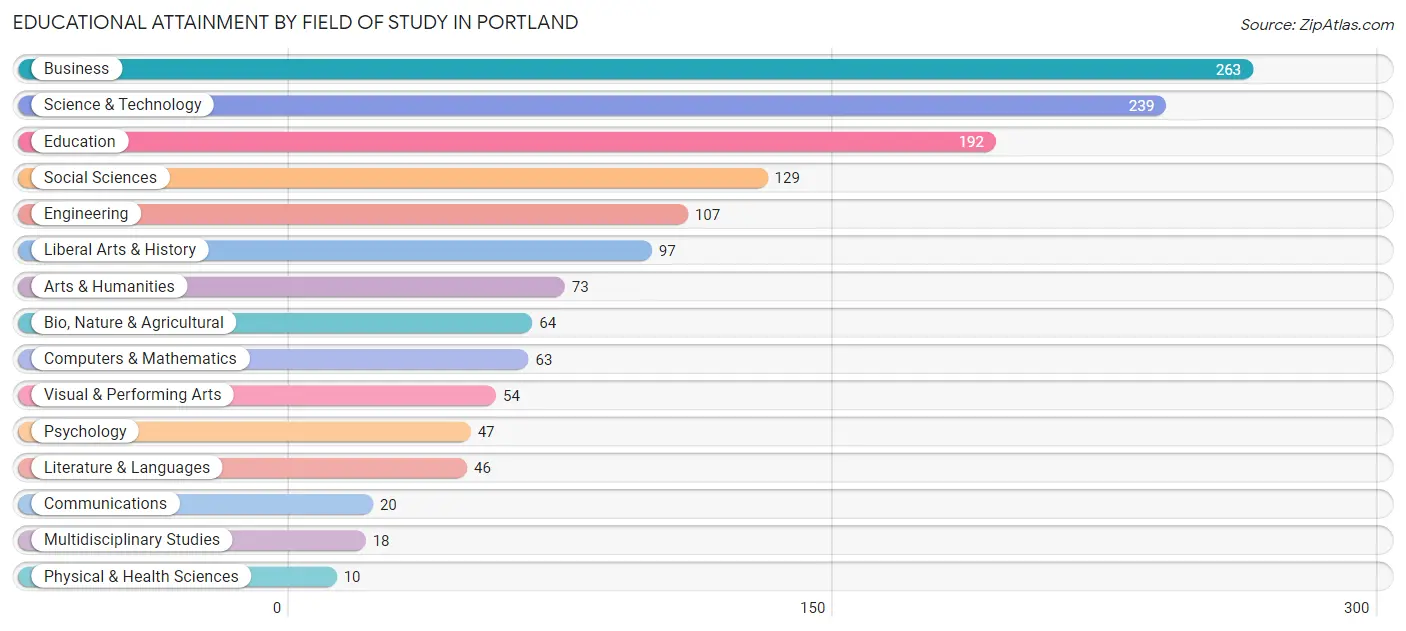
| Field of Study | # Graduates | % Graduates |
| Computers & Mathematics | 63 | 4.4% |
| Bio, Nature & Agricultural | 64 | 4.5% |
| Physical & Health Sciences | 10 | 0.7% |
| Psychology | 47 | 3.3% |
| Social Sciences | 129 | 9.1% |
| Engineering | 107 | 7.5% |
| Multidisciplinary Studies | 18 | 1.3% |
| Science & Technology | 239 | 16.8% |
| Business | 263 | 18.5% |
| Education | 192 | 13.5% |
| Literature & Languages | 46 | 3.2% |
| Liberal Arts & History | 97 | 6.8% |
| Visual & Performing Arts | 54 | 3.8% |
| Communications | 20 | 1.4% |
| Arts & Humanities | 73 | 5.1% |
| Total | 1,422 | 100.0% |
Transportation & Commute in Portland
Vehicle Availability by Sex in Portland
The most prevalent vehicle ownership categories in Portland are males with 2 vehicles (1,543, accounting for 42.4%) and females with 2 vehicles (1,411, making up 46.3%).
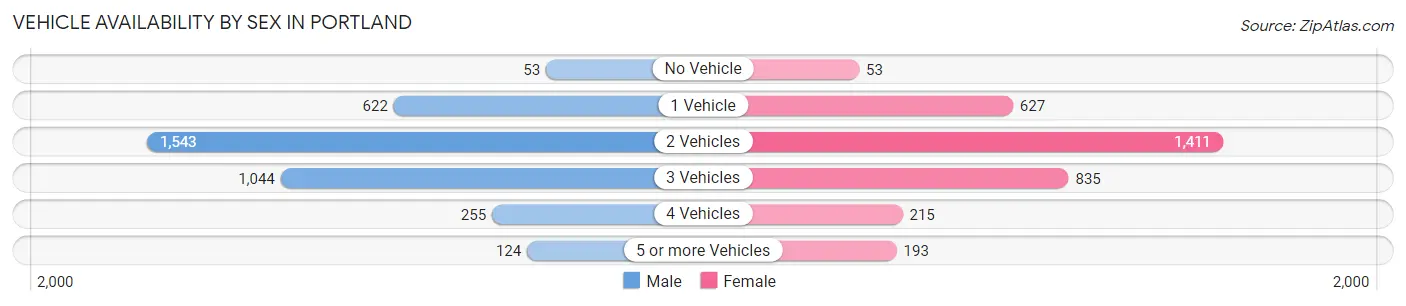
| Vehicles Available | Male | Female |
| No Vehicle | 53 (1.5%) | 53 (1.6%) |
| 1 Vehicle | 622 (17.1%) | 627 (18.8%) |
| 2 Vehicles | 1,543 (42.4%) | 1,411 (42.3%) |
| 3 Vehicles | 1,044 (28.7%) | 835 (25.0%) |
| 4 Vehicles | 255 (7.0%) | 215 (6.5%) |
| 5 or more Vehicles | 124 (3.4%) | 193 (5.8%) |
| Total | 3,641 (100.0%) | 3,334 (100.0%) |
Commute Time in Portland
The most frequently occuring commute durations in Portland are 10 to 14 minutes (1,060 commuters, 16.3%), 5 to 9 minutes (1,026 commuters, 15.8%), and 45 to 59 minutes (840 commuters, 12.9%).
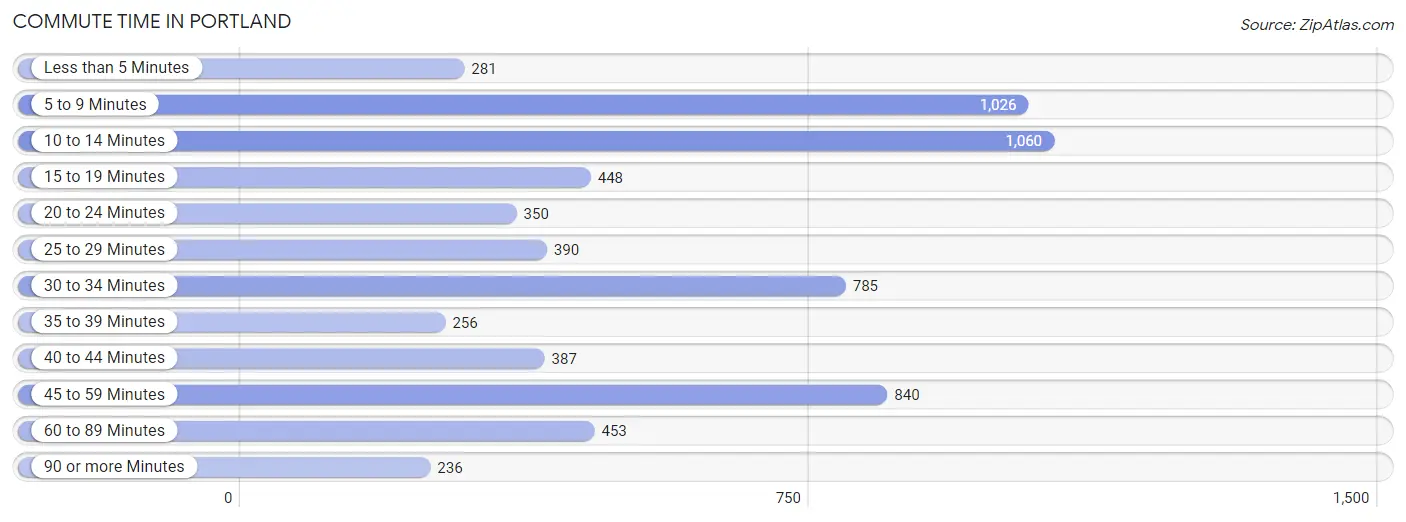
| Commute Time | # Commuters | % Commuters |
| Less than 5 Minutes | 281 | 4.3% |
| 5 to 9 Minutes | 1,026 | 15.8% |
| 10 to 14 Minutes | 1,060 | 16.3% |
| 15 to 19 Minutes | 448 | 6.9% |
| 20 to 24 Minutes | 350 | 5.4% |
| 25 to 29 Minutes | 390 | 6.0% |
| 30 to 34 Minutes | 785 | 12.0% |
| 35 to 39 Minutes | 256 | 3.9% |
| 40 to 44 Minutes | 387 | 5.9% |
| 45 to 59 Minutes | 840 | 12.9% |
| 60 to 89 Minutes | 453 | 7.0% |
| 90 or more Minutes | 236 | 3.6% |
Commute Time by Sex in Portland
The most common commute times in Portland are 5 to 9 minutes (566 commuters, 16.5%) for males and 10 to 14 minutes (644 commuters, 20.9%) for females.
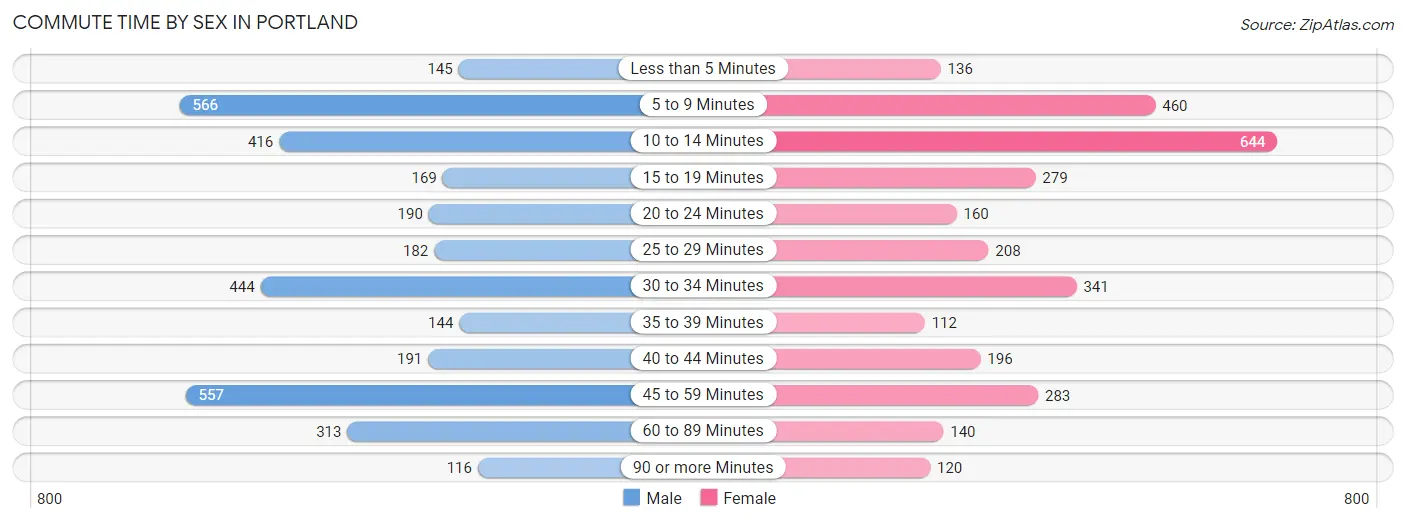
| Commute Time | Male | Female |
| Less than 5 Minutes | 145 (4.2%) | 136 (4.4%) |
| 5 to 9 Minutes | 566 (16.5%) | 460 (14.9%) |
| 10 to 14 Minutes | 416 (12.1%) | 644 (20.9%) |
| 15 to 19 Minutes | 169 (4.9%) | 279 (9.1%) |
| 20 to 24 Minutes | 190 (5.5%) | 160 (5.2%) |
| 25 to 29 Minutes | 182 (5.3%) | 208 (6.8%) |
| 30 to 34 Minutes | 444 (12.9%) | 341 (11.1%) |
| 35 to 39 Minutes | 144 (4.2%) | 112 (3.6%) |
| 40 to 44 Minutes | 191 (5.6%) | 196 (6.4%) |
| 45 to 59 Minutes | 557 (16.2%) | 283 (9.2%) |
| 60 to 89 Minutes | 313 (9.1%) | 140 (4.5%) |
| 90 or more Minutes | 116 (3.4%) | 120 (3.9%) |
Time of Departure to Work by Sex in Portland
The most frequent times of departure to work in Portland are 6:30 AM to 6:59 AM (585, 17.0%) for males and 7:00 AM to 7:29 AM (580, 18.8%) for females.
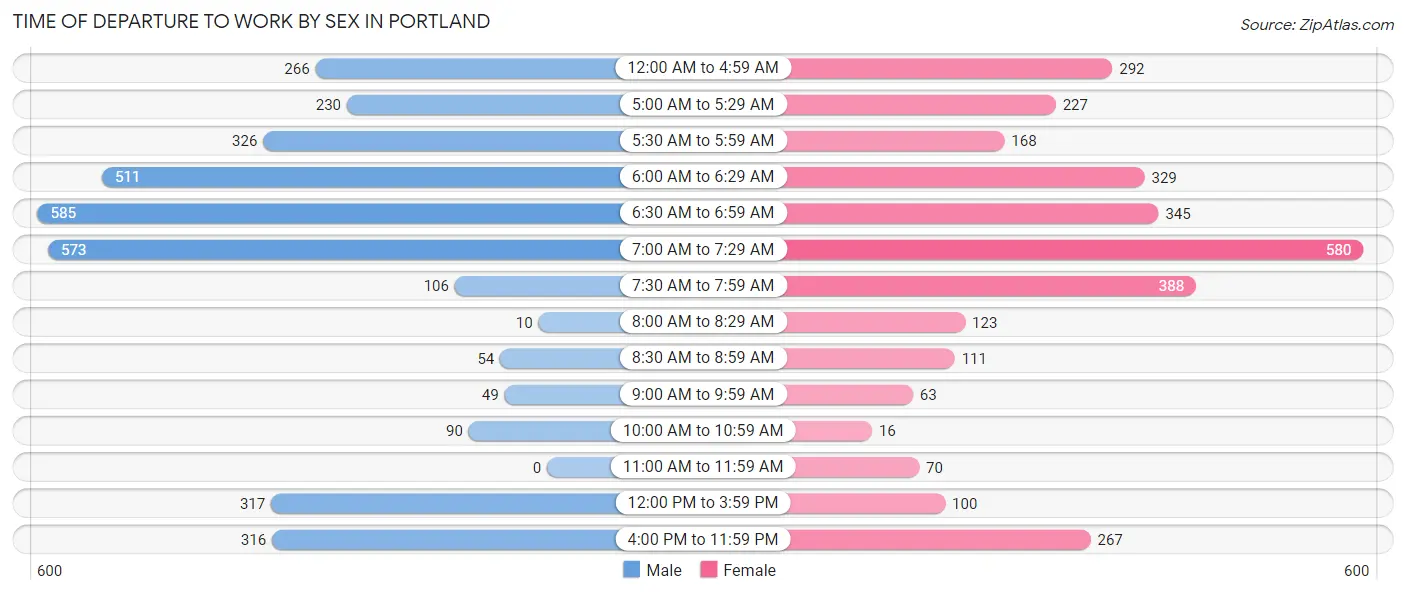
| Time of Departure | Male | Female |
| 12:00 AM to 4:59 AM | 266 (7.7%) | 292 (9.5%) |
| 5:00 AM to 5:29 AM | 230 (6.7%) | 227 (7.4%) |
| 5:30 AM to 5:59 AM | 326 (9.5%) | 168 (5.5%) |
| 6:00 AM to 6:29 AM | 511 (14.9%) | 329 (10.7%) |
| 6:30 AM to 6:59 AM | 585 (17.0%) | 345 (11.2%) |
| 7:00 AM to 7:29 AM | 573 (16.7%) | 580 (18.8%) |
| 7:30 AM to 7:59 AM | 106 (3.1%) | 388 (12.6%) |
| 8:00 AM to 8:29 AM | 10 (0.3%) | 123 (4.0%) |
| 8:30 AM to 8:59 AM | 54 (1.6%) | 111 (3.6%) |
| 9:00 AM to 9:59 AM | 49 (1.4%) | 63 (2.1%) |
| 10:00 AM to 10:59 AM | 90 (2.6%) | 16 (0.5%) |
| 11:00 AM to 11:59 AM | 0 (0.0%) | 70 (2.3%) |
| 12:00 PM to 3:59 PM | 317 (9.2%) | 100 (3.3%) |
| 4:00 PM to 11:59 PM | 316 (9.2%) | 267 (8.7%) |
| Total | 3,433 (100.0%) | 3,079 (100.0%) |
Housing Occupancy in Portland
Occupancy by Ownership in Portland
Of the total 5,059 dwellings in Portland, owner-occupied units account for 3,129 (61.9%), while renter-occupied units make up 1,930 (38.2%).
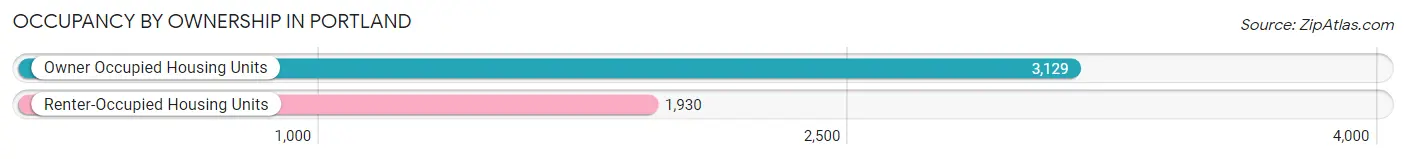
| Occupancy | # Housing Units | % Housing Units |
| Owner Occupied Housing Units | 3,129 | 61.9% |
| Renter-Occupied Housing Units | 1,930 | 38.2% |
| Total Occupied Housing Units | 5,059 | 100.0% |
Occupancy by Household Size in Portland
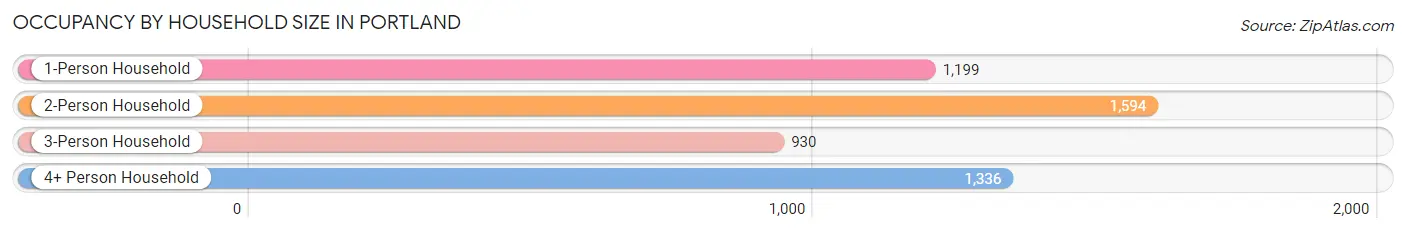
| Household Size | # Housing Units | % Housing Units |
| 1-Person Household | 1,199 | 23.7% |
| 2-Person Household | 1,594 | 31.5% |
| 3-Person Household | 930 | 18.4% |
| 4+ Person Household | 1,336 | 26.4% |
| Total Housing Units | 5,059 | 100.0% |
Occupancy by Ownership by Household Size in Portland
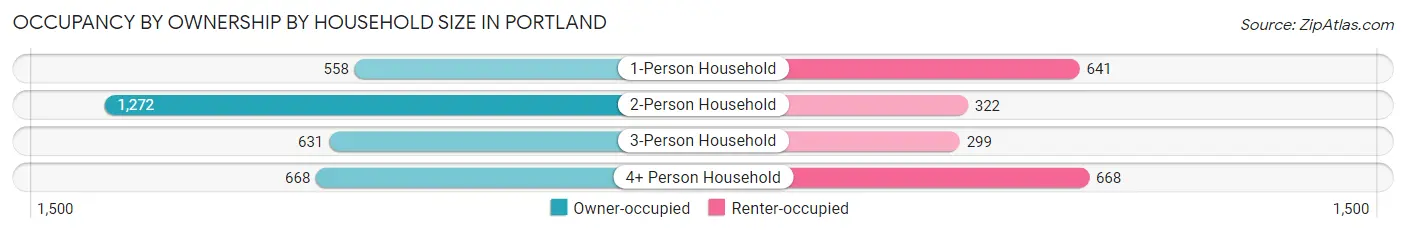
| Household Size | Owner-occupied | Renter-occupied |
| 1-Person Household | 558 (46.5%) | 641 (53.5%) |
| 2-Person Household | 1,272 (79.8%) | 322 (20.2%) |
| 3-Person Household | 631 (67.8%) | 299 (32.2%) |
| 4+ Person Household | 668 (50.0%) | 668 (50.0%) |
| Total Housing Units | 3,129 (61.9%) | 1,930 (38.2%) |
Occupancy by Educational Attainment in Portland
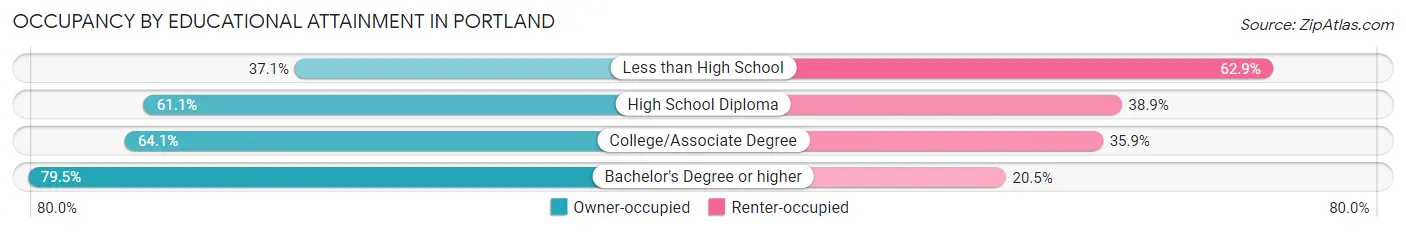
| Household Size | Owner-occupied | Renter-occupied |
| Less than High School | 248 (37.1%) | 420 (62.9%) |
| High School Diploma | 1,142 (61.1%) | 728 (38.9%) |
| College/Associate Degree | 1,100 (64.1%) | 617 (35.9%) |
| Bachelor's Degree or higher | 639 (79.5%) | 165 (20.5%) |
Occupancy by Age of Householder in Portland
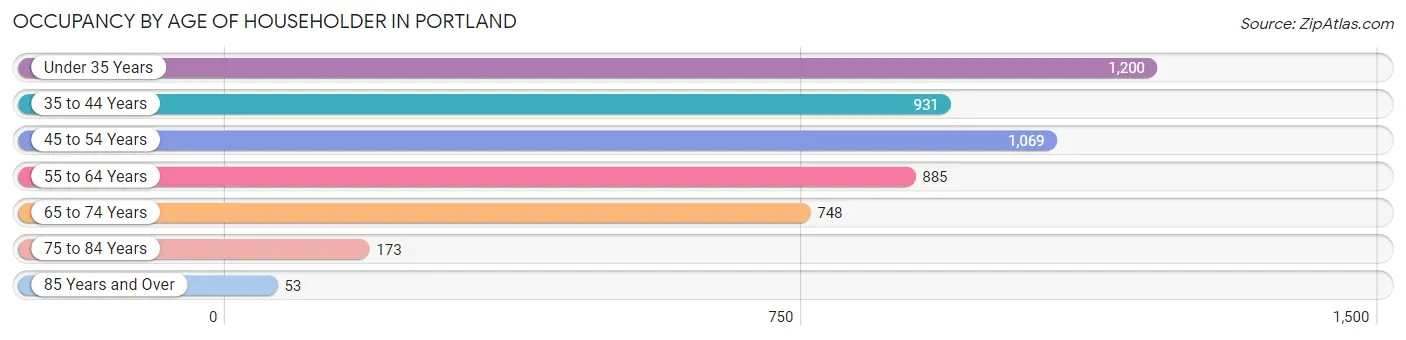
| Age Bracket | # Households | % Households |
| Under 35 Years | 1,200 | 23.7% |
| 35 to 44 Years | 931 | 18.4% |
| 45 to 54 Years | 1,069 | 21.1% |
| 55 to 64 Years | 885 | 17.5% |
| 65 to 74 Years | 748 | 14.8% |
| 75 to 84 Years | 173 | 3.4% |
| 85 Years and Over | 53 | 1.1% |
| Total | 5,059 | 100.0% |
Housing Finances in Portland
Median Income by Occupancy in Portland
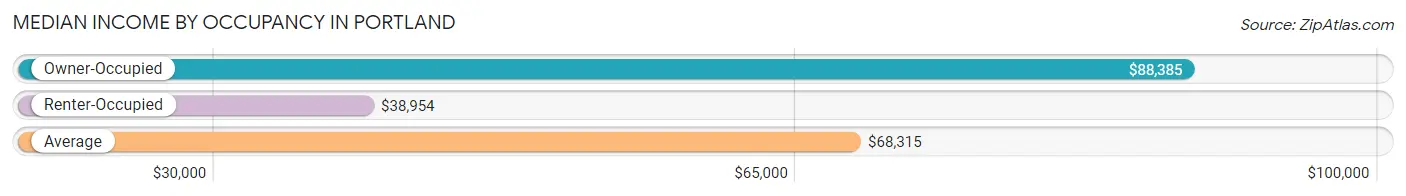
| Occupancy Type | # Households | Median Income |
| Owner-Occupied | 3,129 (61.9%) | $88,385 |
| Renter-Occupied | 1,930 (38.2%) | $38,954 |
| Average | 5,059 (100.0%) | $68,315 |
Occupancy by Householder Income Bracket in Portland
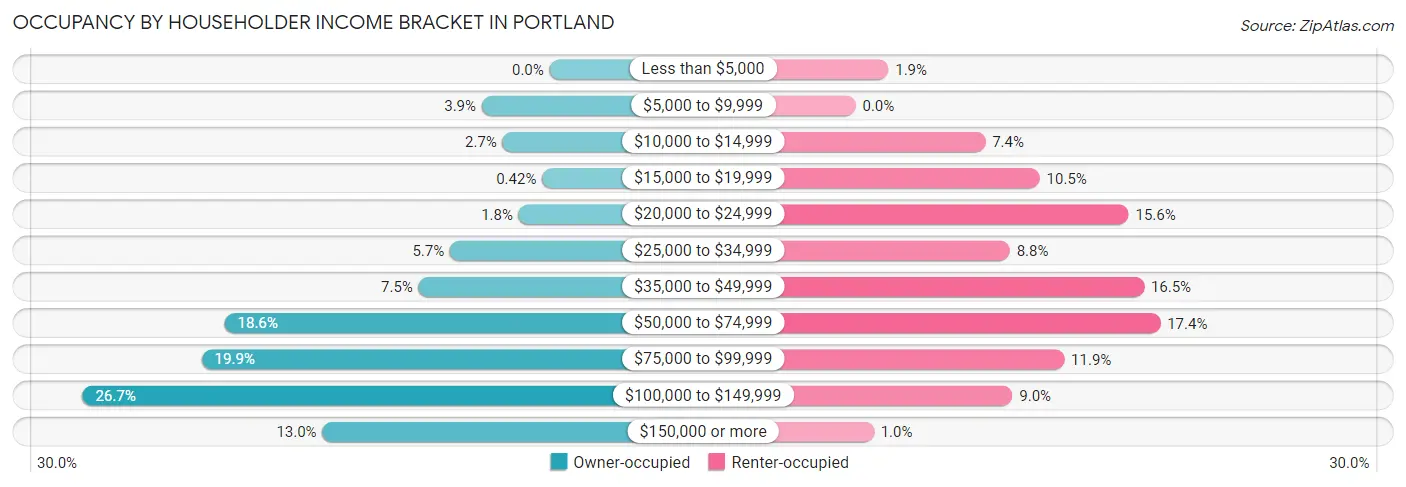
| Income Bracket | Owner-occupied | Renter-occupied |
| Less than $5,000 | 0 (0.0%) | 36 (1.9%) |
| $5,000 to $9,999 | 121 (3.9%) | 0 (0.0%) |
| $10,000 to $14,999 | 84 (2.7%) | 143 (7.4%) |
| $15,000 to $19,999 | 13 (0.4%) | 203 (10.5%) |
| $20,000 to $24,999 | 55 (1.8%) | 301 (15.6%) |
| $25,000 to $34,999 | 178 (5.7%) | 170 (8.8%) |
| $35,000 to $49,999 | 234 (7.5%) | 318 (16.5%) |
| $50,000 to $74,999 | 581 (18.6%) | 336 (17.4%) |
| $75,000 to $99,999 | 622 (19.9%) | 230 (11.9%) |
| $100,000 to $149,999 | 835 (26.7%) | 173 (9.0%) |
| $150,000 or more | 406 (13.0%) | 20 (1.0%) |
| Total | 3,129 (100.0%) | 1,930 (100.0%) |
Monthly Housing Cost Tiers in Portland
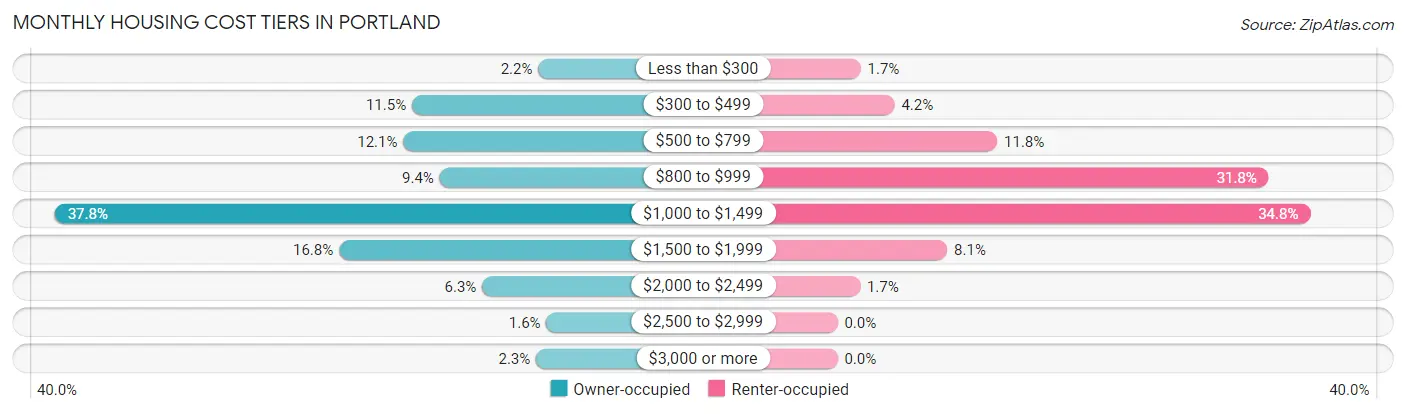
| Monthly Cost | Owner-occupied | Renter-occupied |
| Less than $300 | 68 (2.2%) | 33 (1.7%) |
| $300 to $499 | 359 (11.5%) | 81 (4.2%) |
| $500 to $799 | 379 (12.1%) | 227 (11.8%) |
| $800 to $999 | 295 (9.4%) | 613 (31.8%) |
| $1,000 to $1,499 | 1,182 (37.8%) | 672 (34.8%) |
| $1,500 to $1,999 | 527 (16.8%) | 156 (8.1%) |
| $2,000 to $2,499 | 197 (6.3%) | 32 (1.7%) |
| $2,500 to $2,999 | 49 (1.6%) | 0 (0.0%) |
| $3,000 or more | 73 (2.3%) | 0 (0.0%) |
| Total | 3,129 (100.0%) | 1,930 (100.0%) |
Physical Housing Characteristics in Portland
Housing Structures in Portland
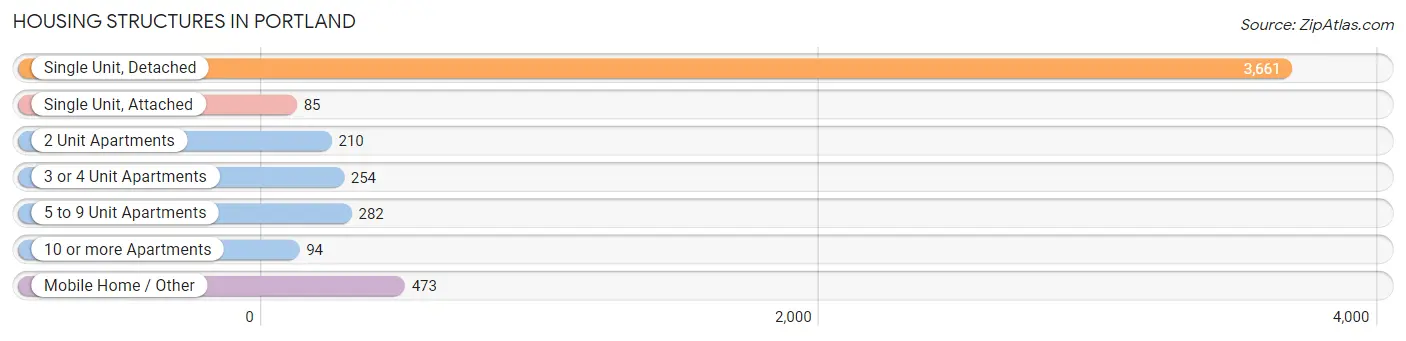
| Structure Type | # Housing Units | % Housing Units |
| Single Unit, Detached | 3,661 | 72.4% |
| Single Unit, Attached | 85 | 1.7% |
| 2 Unit Apartments | 210 | 4.2% |
| 3 or 4 Unit Apartments | 254 | 5.0% |
| 5 to 9 Unit Apartments | 282 | 5.6% |
| 10 or more Apartments | 94 | 1.9% |
| Mobile Home / Other | 473 | 9.3% |
| Total | 5,059 | 100.0% |
Housing Structures by Occupancy in Portland
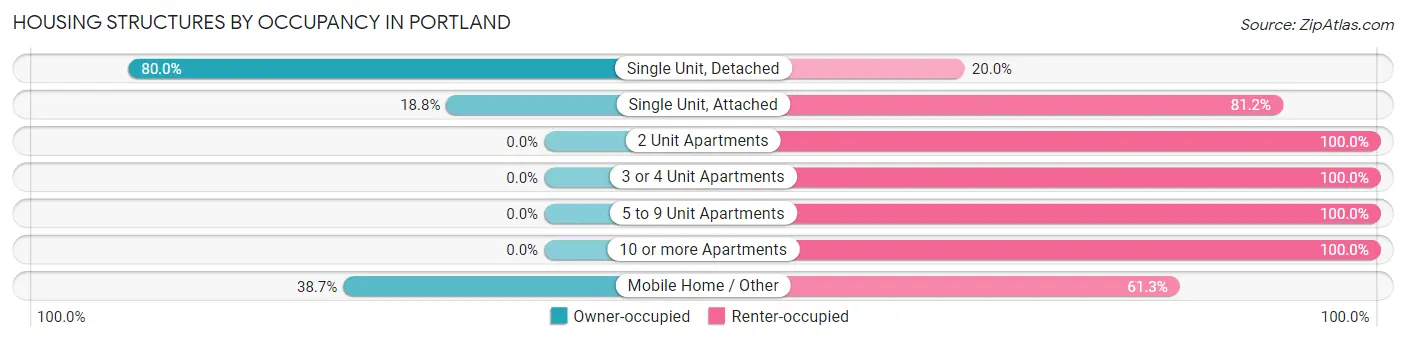
| Structure Type | Owner-occupied | Renter-occupied |
| Single Unit, Detached | 2,930 (80.0%) | 731 (20.0%) |
| Single Unit, Attached | 16 (18.8%) | 69 (81.2%) |
| 2 Unit Apartments | 0 (0.0%) | 210 (100.0%) |
| 3 or 4 Unit Apartments | 0 (0.0%) | 254 (100.0%) |
| 5 to 9 Unit Apartments | 0 (0.0%) | 282 (100.0%) |
| 10 or more Apartments | 0 (0.0%) | 94 (100.0%) |
| Mobile Home / Other | 183 (38.7%) | 290 (61.3%) |
| Total | 3,129 (61.9%) | 1,930 (38.2%) |
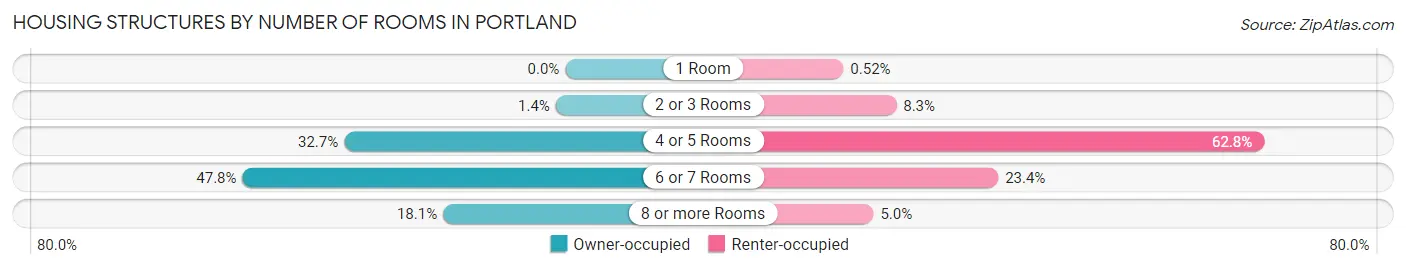
Housing Structures by Number of Rooms in Portland
| Number of Rooms | Owner-occupied | Renter-occupied |
| 1 Room | 0 (0.0%) | 10 (0.5%) |
| 2 or 3 Rooms | 44 (1.4%) | 161 (8.3%) |
| 4 or 5 Rooms | 1,024 (32.7%) | 1,211 (62.7%) |
| 6 or 7 Rooms | 1,495 (47.8%) | 452 (23.4%) |
| 8 or more Rooms | 566 (18.1%) | 96 (5.0%) |
| Total | 3,129 (100.0%) | 1,930 (100.0%) |
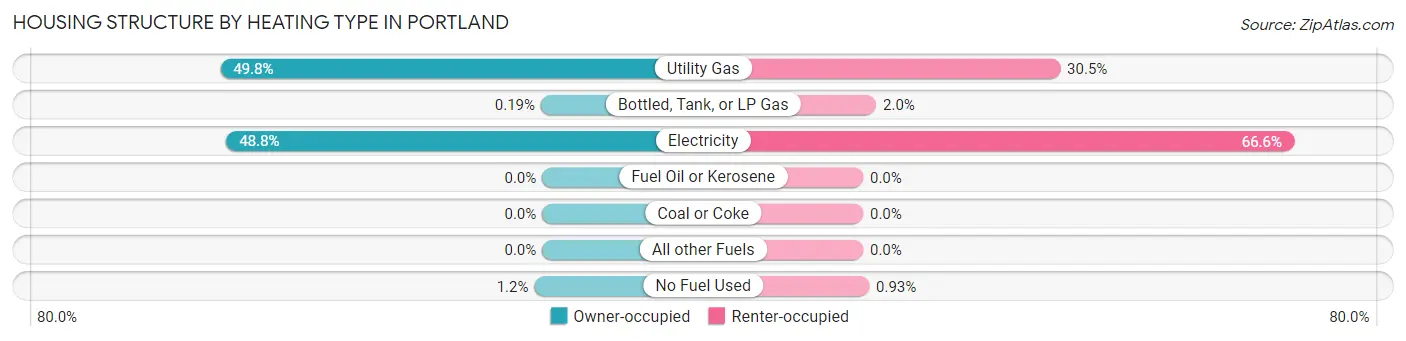
Housing Structure by Heating Type in Portland
| Heating Type | Owner-occupied | Renter-occupied |
| Utility Gas | 1,557 (49.8%) | 588 (30.5%) |
| Bottled, Tank, or LP Gas | 6 (0.2%) | 39 (2.0%) |
| Electricity | 1,528 (48.8%) | 1,285 (66.6%) |
| Fuel Oil or Kerosene | 0 (0.0%) | 0 (0.0%) |
| Coal or Coke | 0 (0.0%) | 0 (0.0%) |
| All other Fuels | 0 (0.0%) | 0 (0.0%) |
| No Fuel Used | 38 (1.2%) | 18 (0.9%) |
| Total | 3,129 (100.0%) | 1,930 (100.0%) |
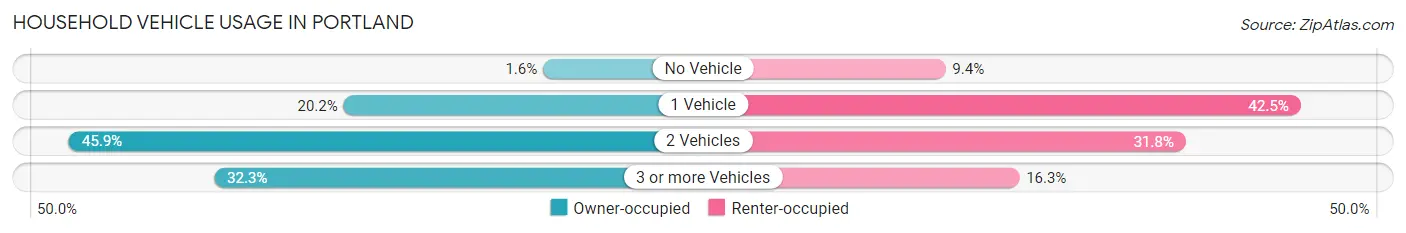
Household Vehicle Usage in Portland
| Vehicles per Household | Owner-occupied | Renter-occupied |
| No Vehicle | 50 (1.6%) | 181 (9.4%) |
| 1 Vehicle | 633 (20.2%) | 821 (42.5%) |
| 2 Vehicles | 1,435 (45.9%) | 614 (31.8%) |
| 3 or more Vehicles | 1,011 (32.3%) | 314 (16.3%) |
| Total | 3,129 (100.0%) | 1,930 (100.0%) |
Real Estate & Mortgages in Portland
Real Estate and Mortgage Overview in Portland
| Characteristic | Without Mortgage | With Mortgage |
| Housing Units | 661 | 2,468 |
| Median Property Value | $212,600 | $233,100 |
| Median Household Income | $71,250 | $378 |
| Monthly Housing Costs | $454 | $73 |
| Real Estate Taxes | $1,122 | $109 |
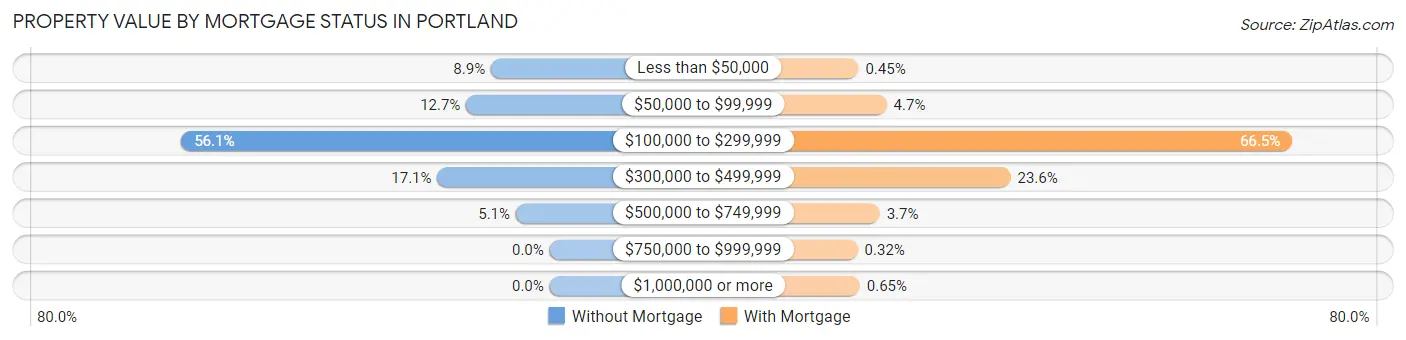
Property Value by Mortgage Status in Portland
| Property Value | Without Mortgage | With Mortgage |
| Less than $50,000 | 59 (8.9%) | 11 (0.4%) |
| $50,000 to $99,999 | 84 (12.7%) | 117 (4.7%) |
| $100,000 to $299,999 | 371 (56.1%) | 1,642 (66.5%) |
| $300,000 to $499,999 | 113 (17.1%) | 583 (23.6%) |
| $500,000 to $749,999 | 34 (5.1%) | 91 (3.7%) |
| $750,000 to $999,999 | 0 (0.0%) | 8 (0.3%) |
| $1,000,000 or more | 0 (0.0%) | 16 (0.6%) |
| Total | 661 (100.0%) | 2,468 (100.0%) |
Household Income by Mortgage Status in Portland
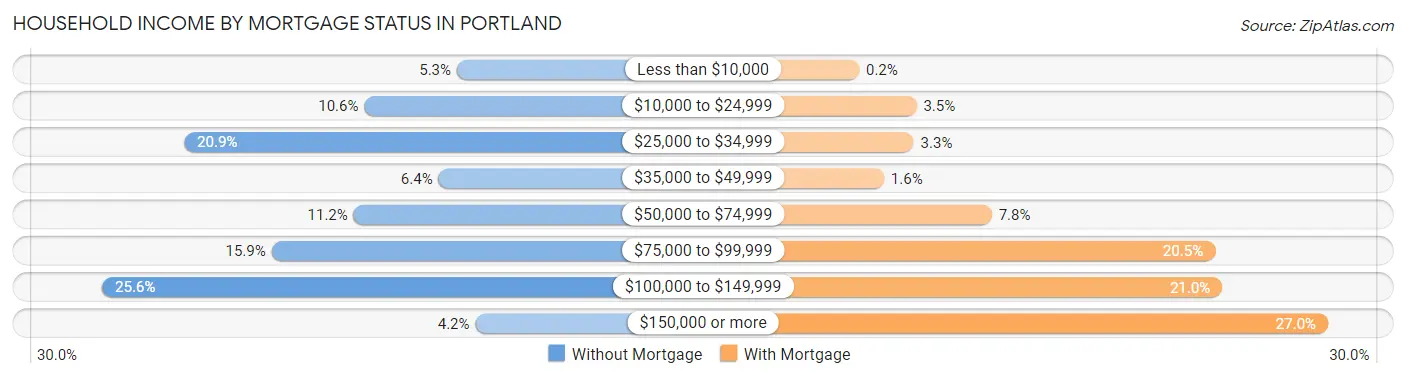
| Household Income | Without Mortgage | With Mortgage |
| Less than $10,000 | 35 (5.3%) | 5 (0.2%) |
| $10,000 to $24,999 | 70 (10.6%) | 86 (3.5%) |
| $25,000 to $34,999 | 138 (20.9%) | 82 (3.3%) |
| $35,000 to $49,999 | 42 (6.4%) | 40 (1.6%) |
| $50,000 to $74,999 | 74 (11.2%) | 192 (7.8%) |
| $75,000 to $99,999 | 105 (15.9%) | 507 (20.5%) |
| $100,000 to $149,999 | 169 (25.6%) | 517 (20.9%) |
| $150,000 or more | 28 (4.2%) | 666 (27.0%) |
| Total | 661 (100.0%) | 2,468 (100.0%) |
Property Value to Household Income Ratio in Portland
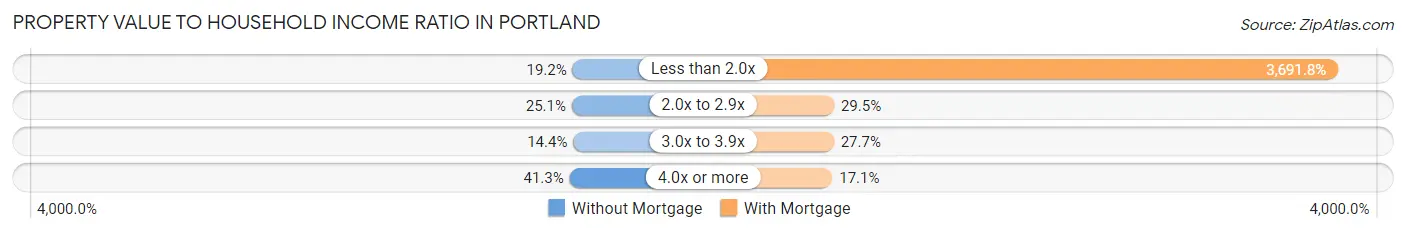
| Value-to-Income Ratio | Without Mortgage | With Mortgage |
| Less than 2.0x | 127 (19.2%) | 91,113 (3,691.8%) |
| 2.0x to 2.9x | 166 (25.1%) | 728 (29.5%) |
| 3.0x to 3.9x | 95 (14.4%) | 684 (27.7%) |
| 4.0x or more | 273 (41.3%) | 421 (17.1%) |
| Total | 661 (100.0%) | 2,468 (100.0%) |
Real Estate Taxes by Mortgage Status in Portland
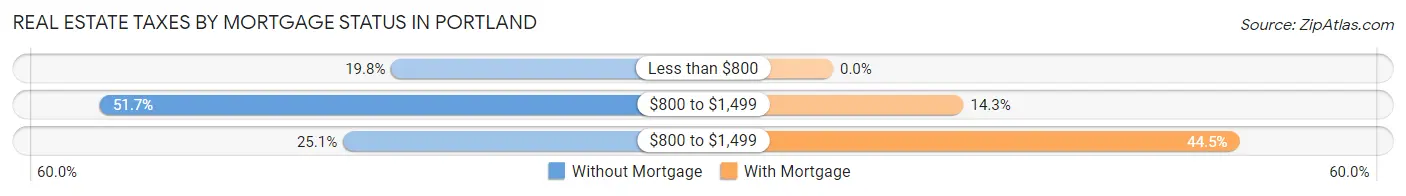
| Property Taxes | Without Mortgage | With Mortgage |
| Less than $800 | 131 (19.8%) | 0 (0.0%) |
| $800 to $1,499 | 342 (51.7%) | 353 (14.3%) |
| $800 to $1,499 | 166 (25.1%) | 1,099 (44.5%) |
| Total | 661 (100.0%) | 2,468 (100.0%) |
Health & Disability in Portland
Health Insurance Coverage by Age in Portland
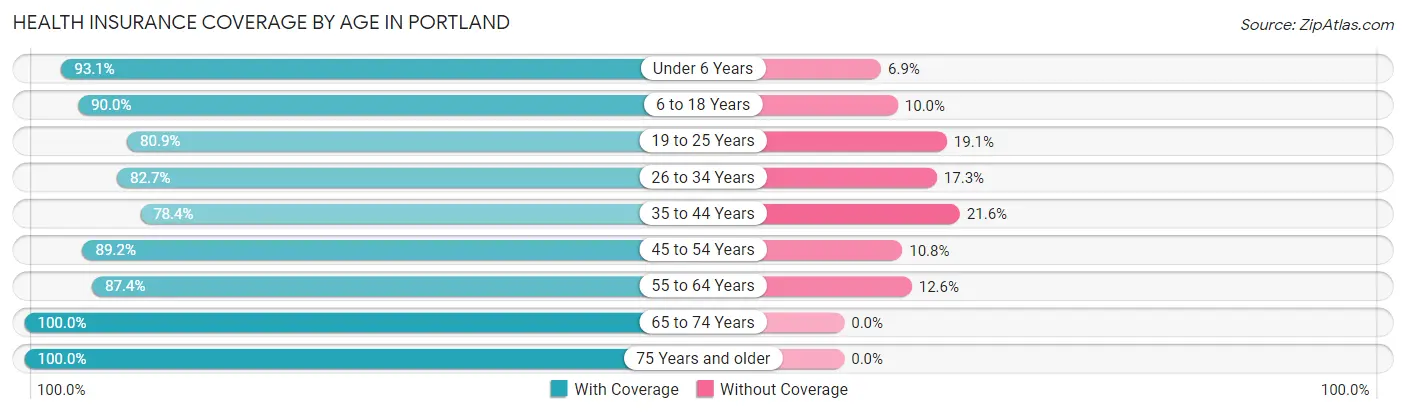
| Age Bracket | With Coverage | Without Coverage |
| Under 6 Years | 1,099 (93.1%) | 81 (6.9%) |
| 6 to 18 Years | 2,162 (90.0%) | 240 (10.0%) |
| 19 to 25 Years | 1,099 (80.9%) | 260 (19.1%) |
| 26 to 34 Years | 1,475 (82.7%) | 308 (17.3%) |
| 35 to 44 Years | 1,484 (78.4%) | 408 (21.6%) |
| 45 to 54 Years | 1,558 (89.2%) | 189 (10.8%) |
| 55 to 64 Years | 1,229 (87.4%) | 177 (12.6%) |
| 65 to 74 Years | 1,074 (100.0%) | 0 (0.0%) |
| 75 Years and older | 312 (100.0%) | 0 (0.0%) |
| Total | 11,492 (87.4%) | 1,663 (12.6%) |
Health Insurance Coverage by Citizenship Status in Portland
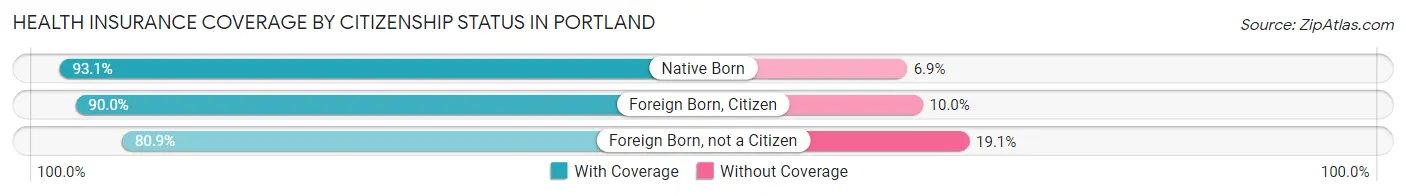
| Citizenship Status | With Coverage | Without Coverage |
| Native Born | 1,099 (93.1%) | 81 (6.9%) |
| Foreign Born, Citizen | 2,162 (90.0%) | 240 (10.0%) |
| Foreign Born, not a Citizen | 1,099 (80.9%) | 260 (19.1%) |
Health Insurance Coverage by Household Income in Portland
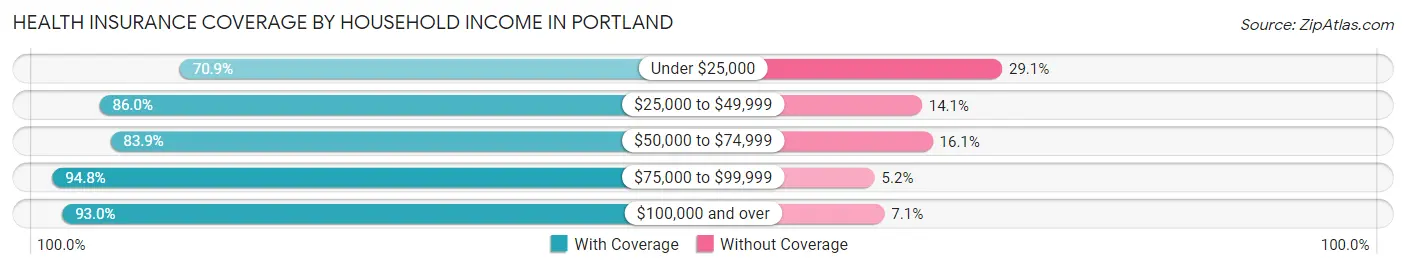
| Household Income | With Coverage | Without Coverage |
| Under $25,000 | 1,299 (70.9%) | 533 (29.1%) |
| $25,000 to $49,999 | 1,854 (86.0%) | 303 (14.1%) |
| $50,000 to $74,999 | 2,041 (83.9%) | 391 (16.1%) |
| $75,000 to $99,999 | 2,326 (94.8%) | 128 (5.2%) |
| $100,000 and over | 3,958 (92.9%) | 300 (7.0%) |
Public vs Private Health Insurance Coverage by Age in Portland
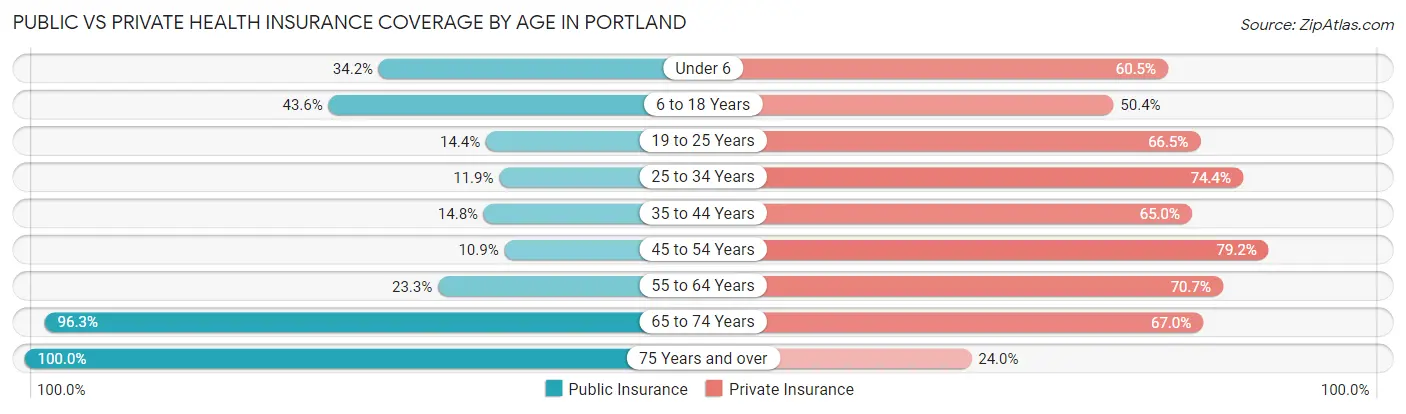
| Age Bracket | Public Insurance | Private Insurance |
| Under 6 | 404 (34.2%) | 714 (60.5%) |
| 6 to 18 Years | 1,047 (43.6%) | 1,211 (50.4%) |
| 19 to 25 Years | 195 (14.3%) | 904 (66.5%) |
| 25 to 34 Years | 212 (11.9%) | 1,327 (74.4%) |
| 35 to 44 Years | 279 (14.7%) | 1,229 (65.0%) |
| 45 to 54 Years | 191 (10.9%) | 1,384 (79.2%) |
| 55 to 64 Years | 327 (23.3%) | 994 (70.7%) |
| 65 to 74 Years | 1,034 (96.3%) | 720 (67.0%) |
| 75 Years and over | 312 (100.0%) | 75 (24.0%) |
| Total | 4,001 (30.4%) | 8,558 (65.1%) |
Disability Status by Sex by Age in Portland
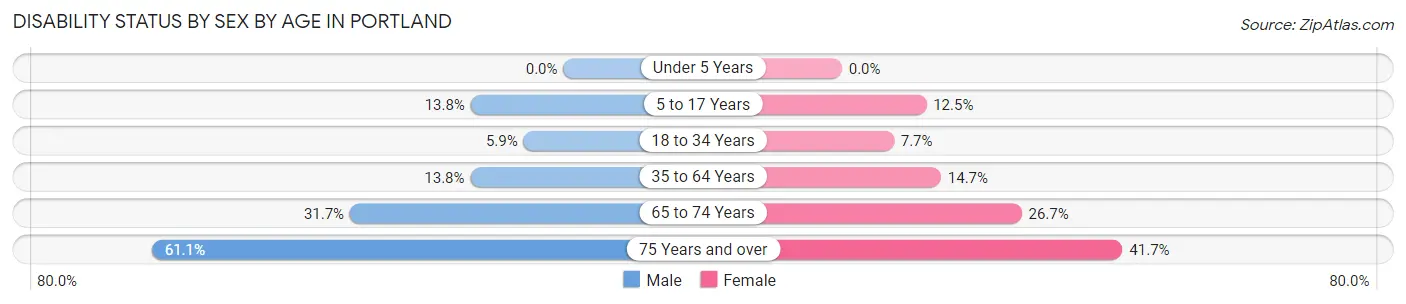
| Age Bracket | Male | Female |
| Under 5 Years | 0 (0.0%) | 0 (0.0%) |
| 5 to 17 Years | 197 (13.8%) | 124 (12.5%) |
| 18 to 34 Years | 102 (5.9%) | 120 (7.7%) |
| 35 to 64 Years | 342 (13.8%) | 378 (14.7%) |
| 65 to 74 Years | 148 (31.7%) | 162 (26.7%) |
| 75 Years and over | 44 (61.1%) | 100 (41.7%) |
Disability Class by Sex by Age in Portland
Disability Class: Hearing Difficulty
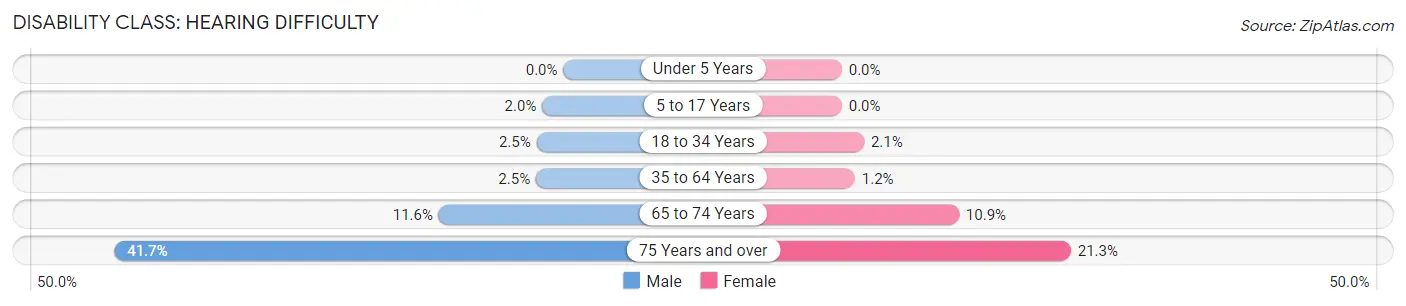
| Age Bracket | Male | Female |
| Under 5 Years | 0 (0.0%) | 0 (0.0%) |
| 5 to 17 Years | 28 (2.0%) | 0 (0.0%) |
| 18 to 34 Years | 43 (2.5%) | 32 (2.1%) |
| 35 to 64 Years | 63 (2.5%) | 31 (1.2%) |
| 65 to 74 Years | 54 (11.6%) | 66 (10.9%) |
| 75 Years and over | 30 (41.7%) | 51 (21.2%) |
Disability Class: Vision Difficulty
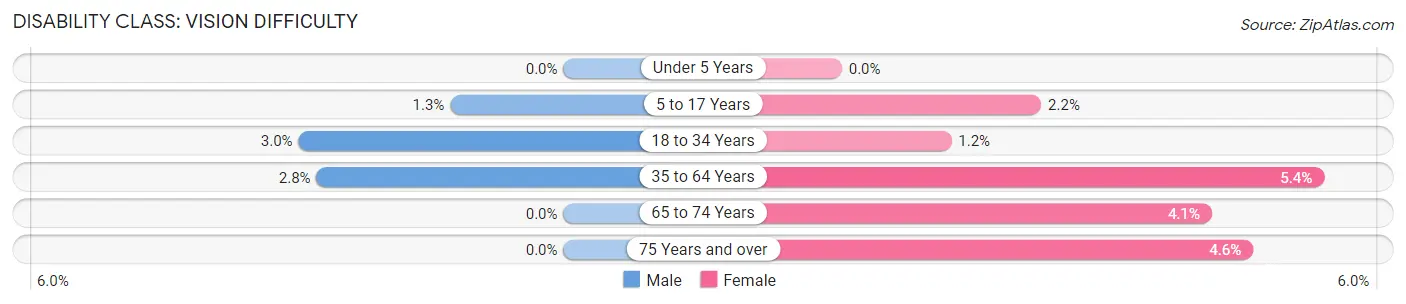
| Age Bracket | Male | Female |
| Under 5 Years | 0 (0.0%) | 0 (0.0%) |
| 5 to 17 Years | 18 (1.3%) | 22 (2.2%) |
| 18 to 34 Years | 51 (2.9%) | 19 (1.2%) |
| 35 to 64 Years | 68 (2.8%) | 138 (5.4%) |
| 65 to 74 Years | 0 (0.0%) | 25 (4.1%) |
| 75 Years and over | 0 (0.0%) | 11 (4.6%) |
Disability Class: Cognitive Difficulty
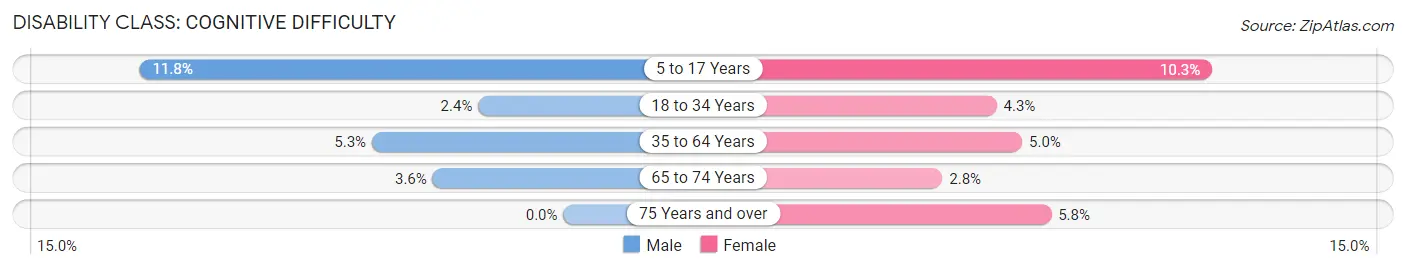
| Age Bracket | Male | Female |
| 5 to 17 Years | 169 (11.8%) | 102 (10.3%) |
| 18 to 34 Years | 41 (2.4%) | 67 (4.3%) |
| 35 to 64 Years | 132 (5.3%) | 129 (5.0%) |
| 65 to 74 Years | 17 (3.6%) | 17 (2.8%) |
| 75 Years and over | 0 (0.0%) | 14 (5.8%) |
Disability Class: Ambulatory Difficulty
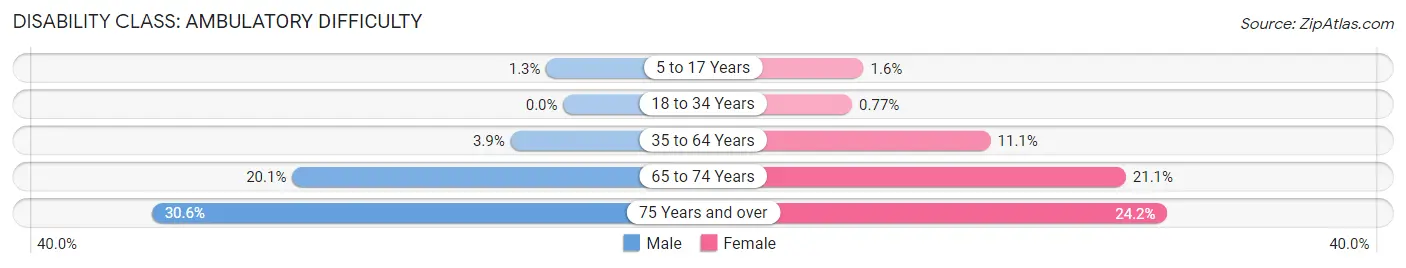
| Age Bracket | Male | Female |
| 5 to 17 Years | 18 (1.3%) | 16 (1.6%) |
| 18 to 34 Years | 0 (0.0%) | 12 (0.8%) |
| 35 to 64 Years | 97 (3.9%) | 284 (11.1%) |
| 65 to 74 Years | 94 (20.1%) | 128 (21.1%) |
| 75 Years and over | 22 (30.6%) | 58 (24.2%) |
Disability Class: Self-Care Difficulty
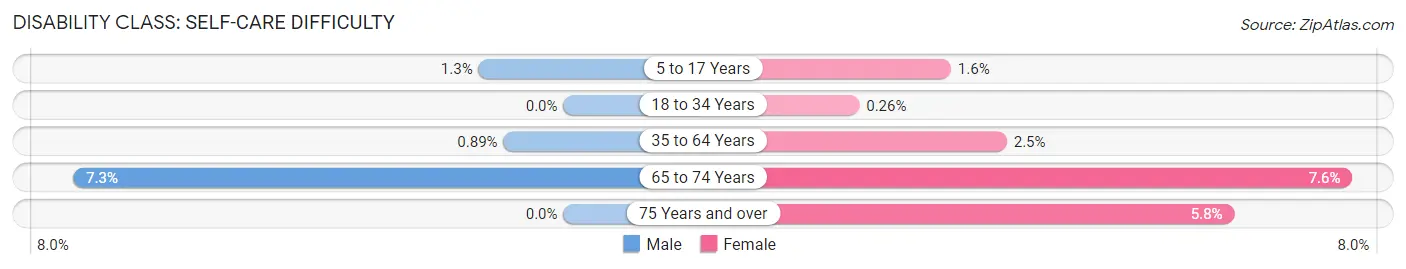
| Age Bracket | Male | Female |
| 5 to 17 Years | 18 (1.3%) | 16 (1.6%) |
| 18 to 34 Years | 0 (0.0%) | 4 (0.3%) |
| 35 to 64 Years | 22 (0.9%) | 63 (2.5%) |
| 65 to 74 Years | 34 (7.3%) | 46 (7.6%) |
| 75 Years and over | 0 (0.0%) | 14 (5.8%) |
Technology Access in Portland
Computing Device Access in Portland
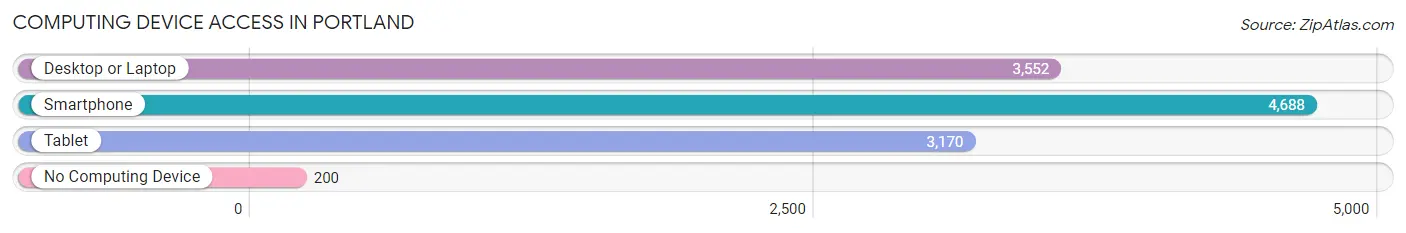
| Device Type | # Households | % Households |
| Desktop or Laptop | 3,552 | 70.2% |
| Smartphone | 4,688 | 92.7% |
| Tablet | 3,170 | 62.7% |
| No Computing Device | 200 | 4.0% |
| Total | 5,059 | 100.0% |
Internet Access in Portland
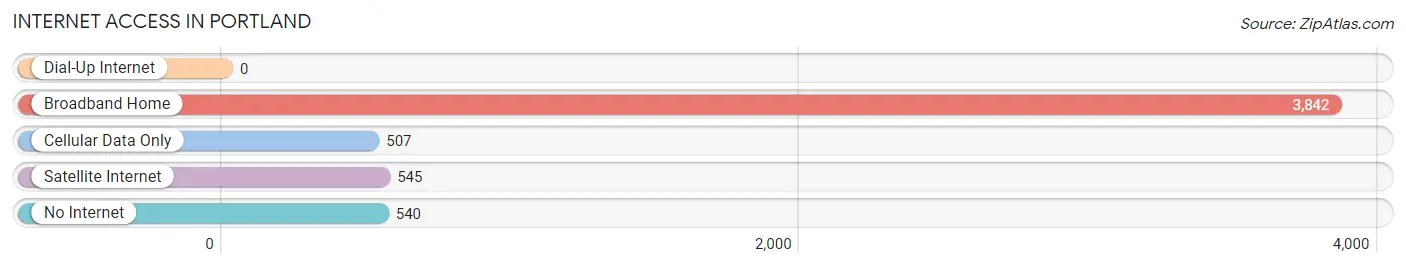
| Internet Type | # Households | % Households |
| Dial-Up Internet | 0 | 0.0% |
| Broadband Home | 3,842 | 75.9% |
| Cellular Data Only | 507 | 10.0% |
| Satellite Internet | 545 | 10.8% |
| No Internet | 540 | 10.7% |
| Total | 5,059 | 100.0% |
Portland Summary
Portland, Tennessee is a small city located in Sumner County, Tennessee. It is situated on the banks of the Cumberland River, approximately 25 miles northeast of Nashville. The city has a population of approximately 11,000 people and is part of the Nashville Metropolitan Statistical Area.
History
Portland was founded in 1820 by William Hall, a Revolutionary War veteran. Hall purchased the land from the local Native Americans and named the town after his hometown of Portland, Maine. The town was incorporated in 1841 and quickly became a thriving river port. The town was a major stop on the Nashville and Northwestern Railroad, which connected Nashville to the Midwest.
The town was also a major center for the production of tobacco, cotton, and other agricultural products. During the Civil War, the town was occupied by Union forces and served as a major supply depot. After the war, the town experienced a period of growth and prosperity.
Geography
Portland is located in Sumner County, Tennessee, on the banks of the Cumberland River. The city is situated at the intersection of Interstate 65 and U.S. Route 31. The city has a total area of 8.3 square miles, of which 8.2 square miles is land and 0.1 square miles is water. The city is located in a hilly region of Middle Tennessee and is surrounded by rolling hills and forests.
Economy
Portland’s economy is largely based on agriculture and manufacturing. The city is home to several large manufacturing plants, including a Tyson Foods plant and a Bridgestone tire plant. The city is also home to several small businesses, including restaurants, retail stores, and service providers.
Demographics
As of the 2010 census, Portland had a population of 11,067 people. The racial makeup of the city was 87.3% White, 8.2% African American, 0.4% Native American, 0.7% Asian, 0.1% Pacific Islander, 1.2% from other races, and 2.1% from two or more races. Hispanic or Latino of any race were 3.2% of the population.
The median income for a household in the city was $37,945, and the median income for a family was $45,945. The per capita income for the city was $19,945. About 11.2% of families and 14.2% of the population were below the poverty line, including 19.2% of those under age 18 and 11.2% of those age 65 or over.
Portland is a small city with a rich history and a diverse population. The city is home to several large manufacturing plants and a variety of small businesses. The city is also home to a number of parks and recreational areas, making it a great place to live and work.
Common Questions
What is Per Capita Income in Portland?
Per Capita income in Portland is $29,330.
What is the Median Family Income in Portland?
Median Family Income in Portland is $77,924.
What is the Median Household income in Portland?
Median Household Income in Portland is $68,315.
What is Income or Wage Gap in Portland?
Income or Wage Gap in Portland is 26.1%.
Women in Portland earn 73.9 cents for every dollar earned by a man.
What is Inequality or Gini Index in Portland?
Inequality or Gini Index in Portland is 0.37.
What is the Total Population of Portland?
Total Population of Portland is 13,177.
What is the Total Male Population of Portland?
Total Male Population of Portland is 6,702.
What is the Total Female Population of Portland?
Total Female Population of Portland is 6,475.
What is the Ratio of Males per 100 Females in Portland?
There are 103.51 Males per 100 Females in Portland.
What is the Ratio of Females per 100 Males in Portland?
There are 96.61 Females per 100 Males in Portland.
What is the Median Population Age in Portland?
Median Population Age in Portland is 34.0 Years.
What is the Average Family Size in Portland
Average Family Size in Portland is 3.1 People.
What is the Average Household Size in Portland
Average Household Size in Portland is 2.6 People.
How Large is the Labor Force in Portland?
There are 7,369 People in the Labor Forcein in Portland.
What is the Percentage of People in the Labor Force in Portland?
71.9% of People are in the Labor Force in Portland.
What is the Unemployment Rate in Portland?
Unemployment Rate in Portland is 3.8%.