Crossville, TN Map & Demographics
Crossville Map
Crossville Overview
$26,240
PER CAPITA INCOME
$62,279
AVG FAMILY INCOME
$44,375
AVG HOUSEHOLD INCOME
36.9%
WAGE / INCOME GAP [ % ]
63.1¢/ $1
WAGE / INCOME GAP [ $ ]
$8,897
FAMILY INCOME DEFICIT
0.46
INEQUALITY / GINI INDEX
12,099
TOTAL POPULATION
5,650
MALE POPULATION
6,449
FEMALE POPULATION
87.61
MALES / 100 FEMALES
114.14
FEMALES / 100 MALES
40.3
MEDIAN AGE
3.0
AVG FAMILY SIZE
2.2
AVG HOUSEHOLD SIZE
5,311
LABOR FORCE [ PEOPLE ]
52.4%
PERCENT IN LABOR FORCE
10.6%
UNEMPLOYMENT RATE
Crossville Area Codes
Income in Crossville
Income Overview in Crossville
Per Capita Income in Crossville is $26,240, while median incomes of families and households are $62,279 and $44,375 respectively.
| Characteristic | Number | Measure |
| Per Capita Income | 12,099 | $26,240 |
| Median Family Income | 2,681 | $62,279 |
| Mean Family Income | 2,681 | $77,271 |
| Median Household Income | 5,323 | $44,375 |
| Mean Household Income | 5,323 | $57,787 |
| Income Deficit | 2,681 | $8,897 |
| Wage / Income Gap (%) | 12,099 | 36.89% |
| Wage / Income Gap ($) | 12,099 | 63.11¢ per $1 |
| Gini / Inequality Index | 12,099 | 0.46 |
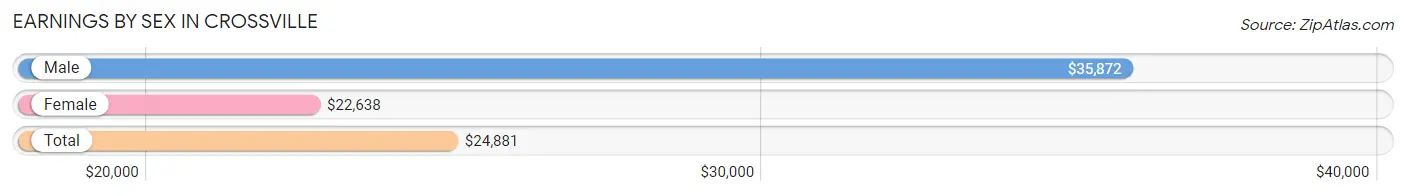
Earnings by Sex in Crossville
Average Earnings in Crossville are $24,881, $35,872 for men and $22,638 for women, a difference of 36.9%.
| Sex | Number | Average Earnings |
| Male | 3,040 (54.0%) | $35,872 |
| Female | 2,592 (46.0%) | $22,638 |
| Total | 5,632 (100.0%) | $24,881 |
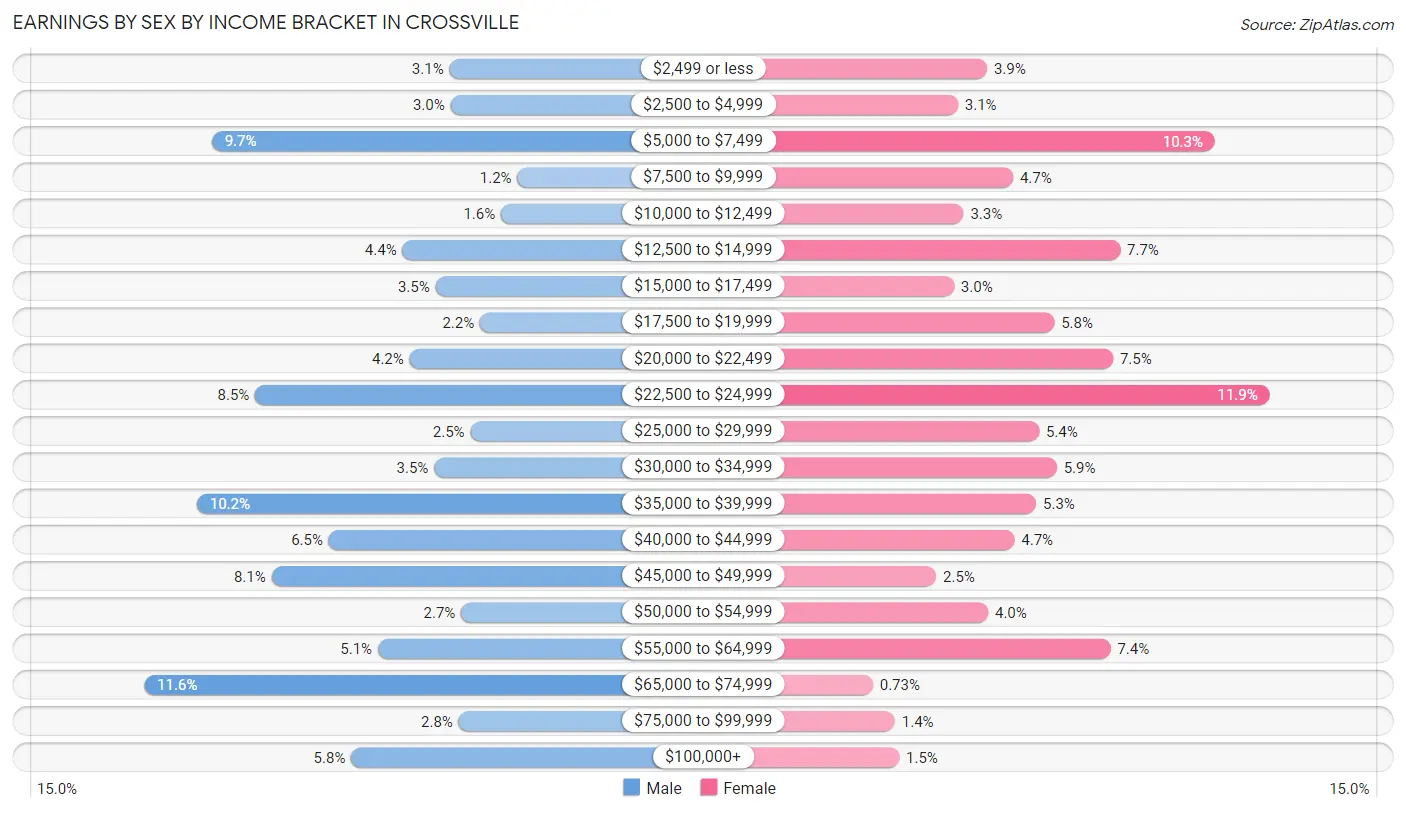
Earnings by Sex by Income Bracket in Crossville
The most common earnings brackets in Crossville are $65,000 to $74,999 for men (354 | 11.6%) and $22,500 to $24,999 for women (308 | 11.9%).
| Income | Male | Female |
| $2,499 or less | 93 (3.1%) | 102 (3.9%) |
| $2,500 to $4,999 | 92 (3.0%) | 81 (3.1%) |
| $5,000 to $7,499 | 296 (9.7%) | 268 (10.3%) |
| $7,500 to $9,999 | 35 (1.1%) | 121 (4.7%) |
| $10,000 to $12,499 | 49 (1.6%) | 85 (3.3%) |
| $12,500 to $14,999 | 133 (4.4%) | 199 (7.7%) |
| $15,000 to $17,499 | 105 (3.5%) | 78 (3.0%) |
| $17,500 to $19,999 | 67 (2.2%) | 151 (5.8%) |
| $20,000 to $22,499 | 127 (4.2%) | 194 (7.5%) |
| $22,500 to $24,999 | 259 (8.5%) | 308 (11.9%) |
| $25,000 to $29,999 | 75 (2.5%) | 140 (5.4%) |
| $30,000 to $34,999 | 106 (3.5%) | 153 (5.9%) |
| $35,000 to $39,999 | 309 (10.2%) | 138 (5.3%) |
| $40,000 to $44,999 | 196 (6.5%) | 122 (4.7%) |
| $45,000 to $49,999 | 245 (8.1%) | 65 (2.5%) |
| $50,000 to $54,999 | 83 (2.7%) | 103 (4.0%) |
| $55,000 to $64,999 | 154 (5.1%) | 192 (7.4%) |
| $65,000 to $74,999 | 354 (11.6%) | 19 (0.7%) |
| $75,000 to $99,999 | 85 (2.8%) | 35 (1.3%) |
| $100,000+ | 177 (5.8%) | 38 (1.5%) |
| Total | 3,040 (100.0%) | 2,592 (100.0%) |
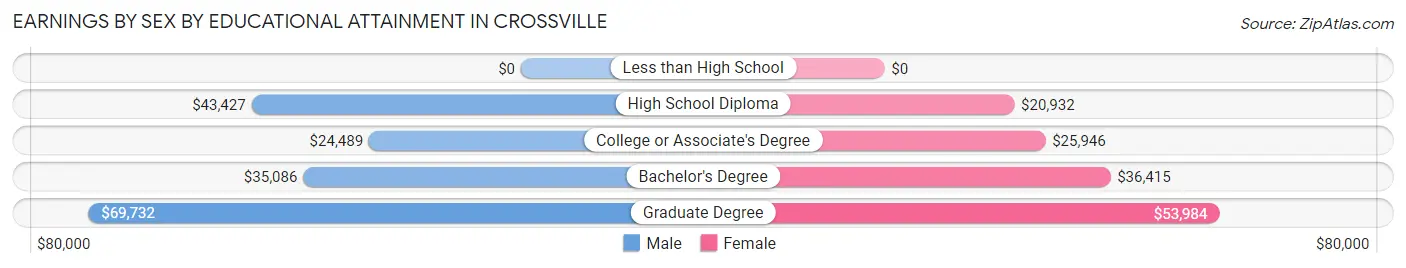
Earnings by Sex by Educational Attainment in Crossville
Average earnings in Crossville are $36,889 for men and $23,353 for women, a difference of 36.7%. Men with an educational attainment of graduate degree enjoy the highest average annual earnings of $69,732, while those with college or associate's degree education earn the least with $24,489. Women with an educational attainment of graduate degree earn the most with the average annual earnings of $53,984, while those with high school diploma education have the smallest earnings of $20,932.
| Educational Attainment | Male Income | Female Income |
| Less than High School | - | - |
| High School Diploma | $43,427 | $20,932 |
| College or Associate's Degree | $24,489 | $25,946 |
| Bachelor's Degree | $35,086 | $36,415 |
| Graduate Degree | $69,732 | $53,984 |
| Total | $36,889 | $23,353 |
Family Income in Crossville
Family Income Brackets in Crossville
According to the Crossville family income data, there are 568 families falling into the $50,000 to $74,999 income range, which is the most common income bracket and makes up 21.2% of all families. Conversely, the less than $10,000 income bracket is the least frequent group with only 75 families (2.8%) belonging to this category.
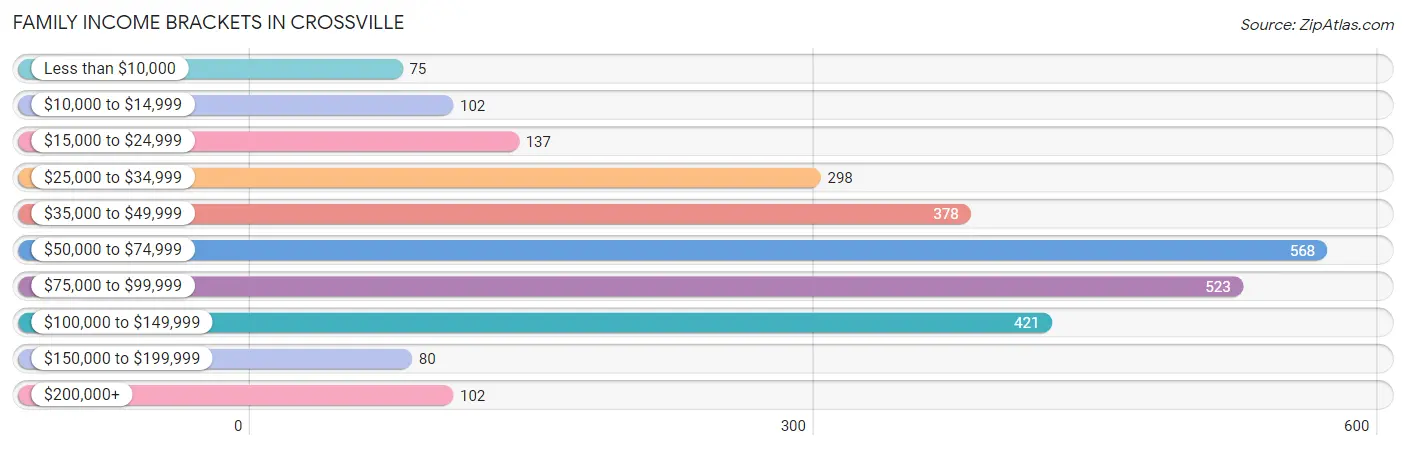
| Income Bracket | # Families | % Families |
| Less than $10,000 | 75 | 2.8% |
| $10,000 to $14,999 | 102 | 3.8% |
| $15,000 to $24,999 | 137 | 5.1% |
| $25,000 to $34,999 | 298 | 11.1% |
| $35,000 to $49,999 | 378 | 14.1% |
| $50,000 to $74,999 | 568 | 21.2% |
| $75,000 to $99,999 | 523 | 19.5% |
| $100,000 to $149,999 | 421 | 15.7% |
| $150,000 to $199,999 | 80 | 3.0% |
| $200,000+ | 102 | 3.8% |
Family Income by Famaliy Size in Crossville
6-person families (63 | 2.4%) account for the highest median family income in Crossville with $81,385 per family, while 2-person families (1,279 | 47.7%) have the highest median income of $30,008 per family member.
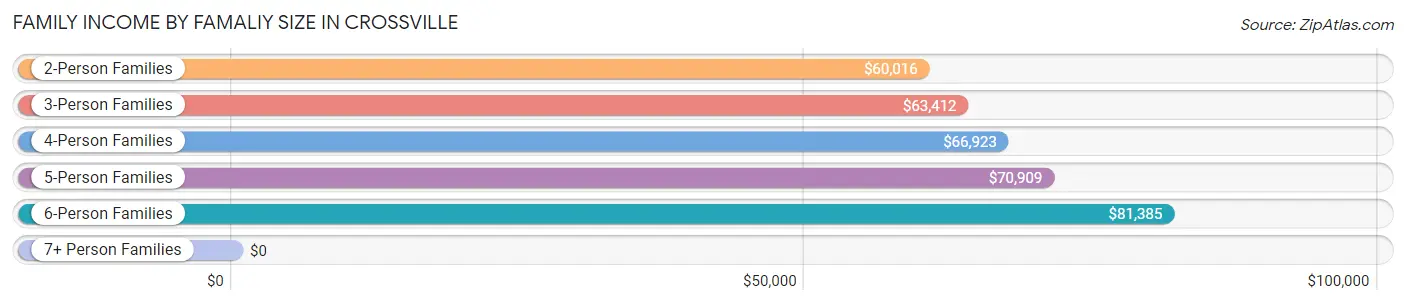
| Income Bracket | # Families | Median Income |
| 2-Person Families | 1,279 (47.7%) | $60,016 |
| 3-Person Families | 579 (21.6%) | $63,412 |
| 4-Person Families | 432 (16.1%) | $66,923 |
| 5-Person Families | 328 (12.2%) | $70,909 |
| 6-Person Families | 63 (2.4%) | $81,385 |
| 7+ Person Families | 0 (0.0%) | $0 |
| Total | 2,681 (100.0%) | $62,279 |
Family Income by Number of Earners in Crossville
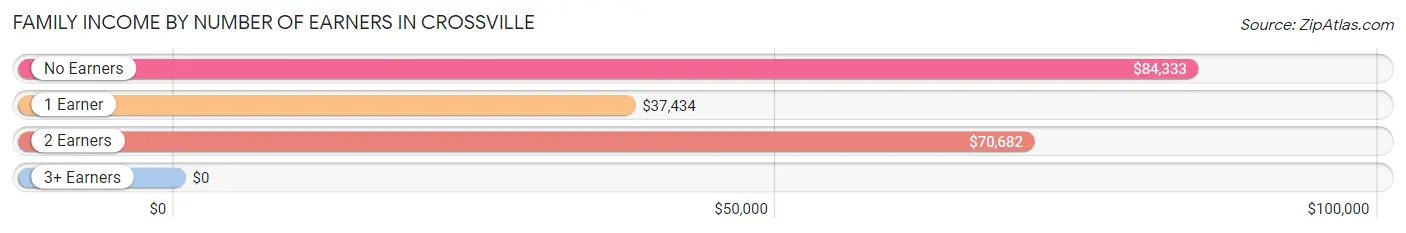
| Number of Earners | # Families | Median Income |
| No Earners | 612 (22.8%) | $84,333 |
| 1 Earner | 759 (28.3%) | $37,434 |
| 2 Earners | 1,198 (44.7%) | $70,682 |
| 3+ Earners | 112 (4.2%) | $0 |
| Total | 2,681 (100.0%) | $62,279 |
Household Income in Crossville
Household Income Brackets in Crossville
With 947 households falling in the category, the $50,000 to $74,999 income range is the most frequent in Crossville, accounting for 17.8% of all households. In contrast, only 106 households (2.0%) fall into the $150,000 to $199,999 income bracket, making it the least populous group.
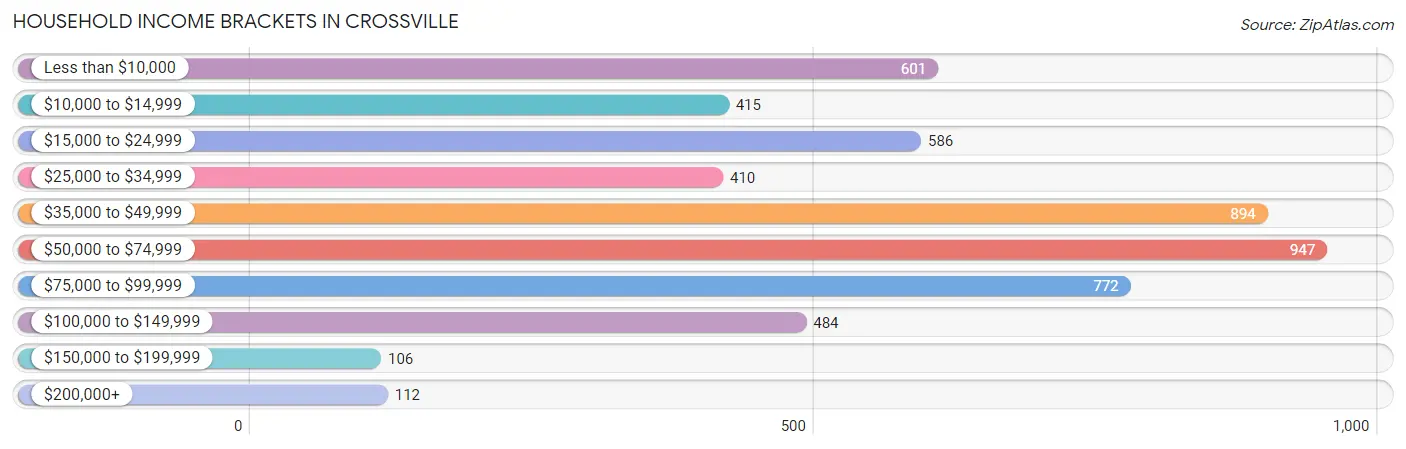
| Income Bracket | # Households | % Households |
| Less than $10,000 | 601 | 11.3% |
| $10,000 to $14,999 | 415 | 7.8% |
| $15,000 to $24,999 | 586 | 11.0% |
| $25,000 to $34,999 | 410 | 7.7% |
| $35,000 to $49,999 | 894 | 16.8% |
| $50,000 to $74,999 | 947 | 17.8% |
| $75,000 to $99,999 | 772 | 14.5% |
| $100,000 to $149,999 | 484 | 9.1% |
| $150,000 to $199,999 | 106 | 2.0% |
| $200,000+ | 112 | 2.1% |
Household Income by Householder Age in Crossville
The median household income in Crossville is $44,375, with the highest median household income of $61,250 found in the 15 to 24 years age bracket for the primary householder. A total of 286 households (5.4%) fall into this category. Meanwhile, the 45 to 64 years age bracket for the primary householder has the lowest median household income of $41,150, with 1,610 households (30.2%) in this group.
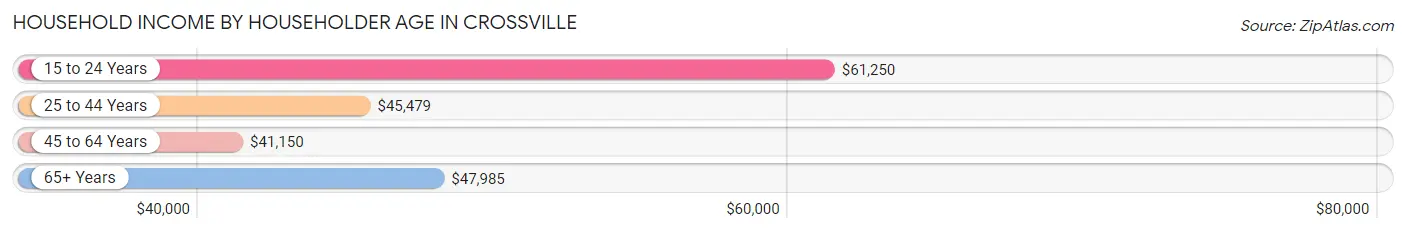
| Income Bracket | # Households | Median Income |
| 15 to 24 Years | 286 (5.4%) | $61,250 |
| 25 to 44 Years | 1,844 (34.6%) | $45,479 |
| 45 to 64 Years | 1,610 (30.2%) | $41,150 |
| 65+ Years | 1,583 (29.7%) | $47,985 |
| Total | 5,323 (100.0%) | $44,375 |
Poverty in Crossville
Income Below Poverty by Sex and Age in Crossville
With 21.4% poverty level for males and 19.7% for females among the residents of Crossville, 12 to 14 year old males and 5 year old females are the most vulnerable to poverty, with 68 males (43.9%) and 11 females (55.0%) in their respective age groups living below the poverty level.
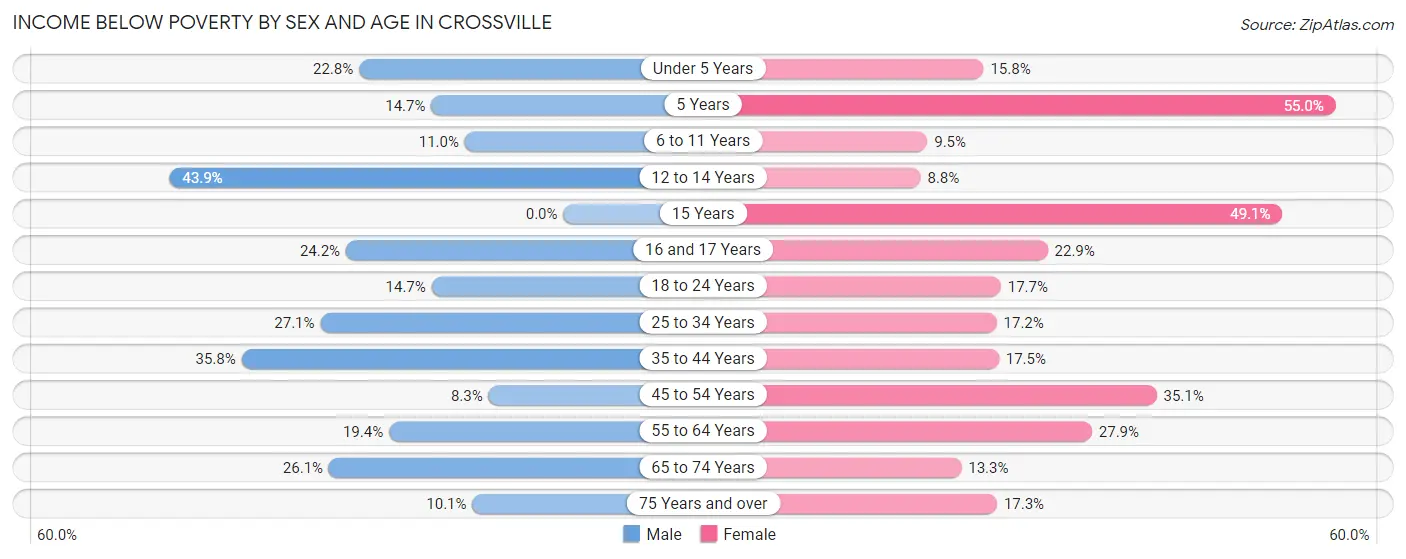
| Age Bracket | Male | Female |
| Under 5 Years | 38 (22.8%) | 68 (15.8%) |
| 5 Years | 10 (14.7%) | 11 (55.0%) |
| 6 to 11 Years | 38 (11.0%) | 48 (9.5%) |
| 12 to 14 Years | 68 (43.9%) | 15 (8.8%) |
| 15 Years | 0 (0.0%) | 26 (49.1%) |
| 16 and 17 Years | 23 (24.2%) | 33 (22.9%) |
| 18 to 24 Years | 92 (14.7%) | 93 (17.7%) |
| 25 to 34 Years | 292 (27.1%) | 166 (17.2%) |
| 35 to 44 Years | 248 (35.8%) | 90 (17.5%) |
| 45 to 54 Years | 46 (8.3%) | 232 (35.0%) |
| 55 to 64 Years | 127 (19.4%) | 232 (27.9%) |
| 65 to 74 Years | 124 (26.1%) | 109 (13.3%) |
| 75 Years and over | 48 (10.1%) | 104 (17.3%) |
| Total | 1,154 (21.4%) | 1,227 (19.7%) |
Income Above Poverty by Sex and Age in Crossville
According to the poverty statistics in Crossville, males aged 15 years and females aged 12 to 14 years are the age groups that are most secure financially, with 100.0% of males and 91.2% of females in these age groups living above the poverty line.
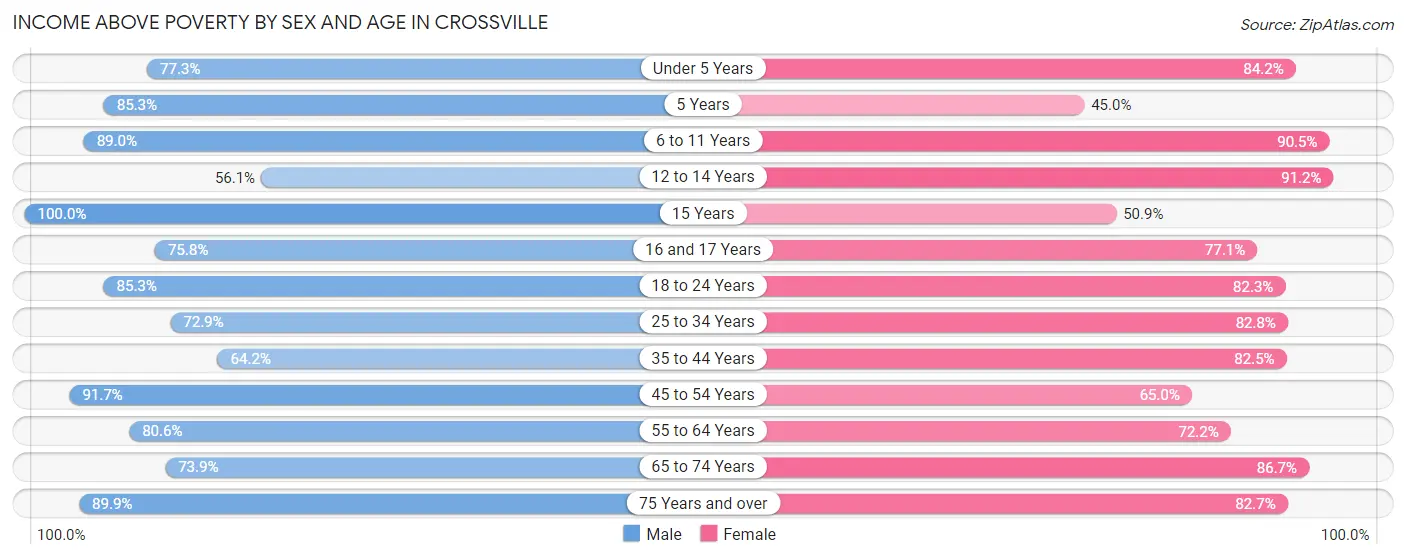
| Age Bracket | Male | Female |
| Under 5 Years | 129 (77.2%) | 363 (84.2%) |
| 5 Years | 58 (85.3%) | 9 (45.0%) |
| 6 to 11 Years | 308 (89.0%) | 456 (90.5%) |
| 12 to 14 Years | 87 (56.1%) | 156 (91.2%) |
| 15 Years | 14 (100.0%) | 27 (50.9%) |
| 16 and 17 Years | 72 (75.8%) | 111 (77.1%) |
| 18 to 24 Years | 535 (85.3%) | 432 (82.3%) |
| 25 to 34 Years | 787 (72.9%) | 797 (82.8%) |
| 35 to 44 Years | 444 (64.2%) | 425 (82.5%) |
| 45 to 54 Years | 506 (91.7%) | 430 (64.9%) |
| 55 to 64 Years | 527 (80.6%) | 601 (72.2%) |
| 65 to 74 Years | 351 (73.9%) | 710 (86.7%) |
| 75 Years and over | 426 (89.9%) | 498 (82.7%) |
| Total | 4,244 (78.6%) | 5,015 (80.3%) |
Income Below Poverty Among Married-Couple Families in Crossville
The poverty statistics for married-couple families in Crossville show that 9.2% or 193 of the total 2,098 families live below the poverty line. Families with 3 or 4 children have the highest poverty rate of 13.1%, comprising of 25 families. On the other hand, families with no children have the lowest poverty rate of 7.7%, which includes 87 families.
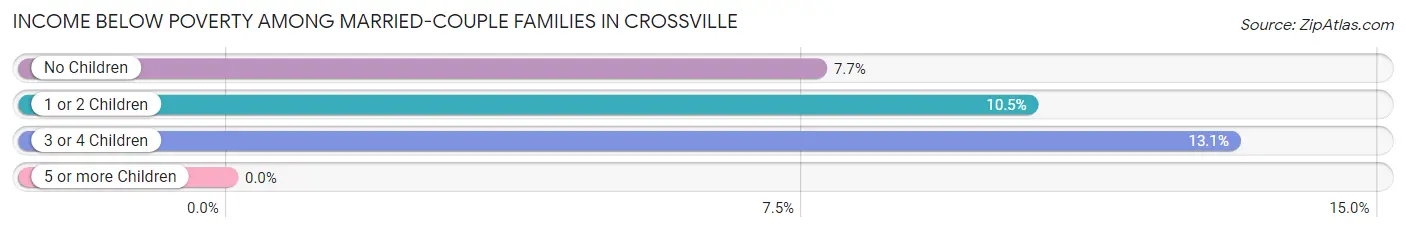
| Children | Above Poverty | Below Poverty |
| No Children | 1,045 (92.3%) | 87 (7.7%) |
| 1 or 2 Children | 694 (89.5%) | 81 (10.4%) |
| 3 or 4 Children | 166 (86.9%) | 25 (13.1%) |
| 5 or more Children | 0 (0.0%) | 0 (0.0%) |
| Total | 1,905 (90.8%) | 193 (9.2%) |
Income Below Poverty Among Single-Parent Households in Crossville
According to the poverty data in Crossville, 83.0% or 93 single-father households and 14.2% or 67 single-mother households are living below the poverty line. Among single-father households, those with 3 or 4 children have the highest poverty rate, with 13 households (100.0%) experiencing poverty. Likewise, among single-mother households, those with 3 or 4 children have the highest poverty rate, with 12 households (100.0%) falling below the poverty line.
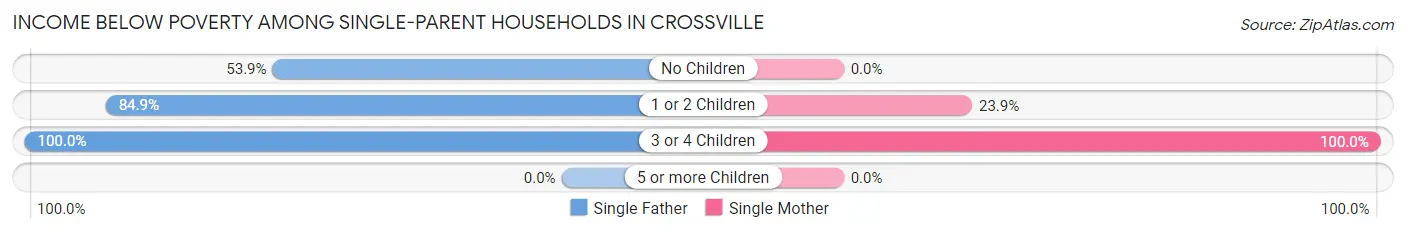
| Children | Single Father | Single Mother |
| No Children | 7 (53.8%) | 0 (0.0%) |
| 1 or 2 Children | 73 (84.9%) | 55 (23.9%) |
| 3 or 4 Children | 13 (100.0%) | 12 (100.0%) |
| 5 or more Children | 0 (0.0%) | 0 (0.0%) |
| Total | 93 (83.0%) | 67 (14.2%) |
Income Below Poverty Among Married-Couple vs Single-Parent Households in Crossville
The poverty data for Crossville shows that 193 of the married-couple family households (9.2%) and 160 of the single-parent households (27.4%) are living below the poverty level. Within the married-couple family households, those with 3 or 4 children have the highest poverty rate, with 25 households (13.1%) falling below the poverty line. Among the single-parent households, those with 3 or 4 children have the highest poverty rate, with 25 household (100.0%) living below poverty.
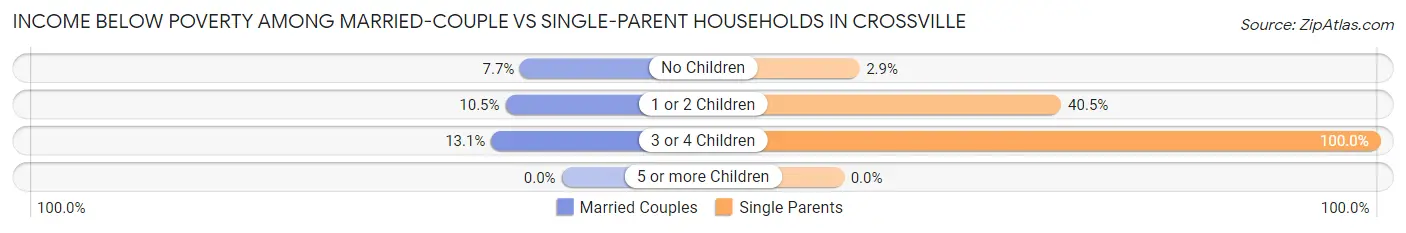
| Children | Married-Couple Families | Single-Parent Households |
| No Children | 87 (7.7%) | 7 (2.9%) |
| 1 or 2 Children | 81 (10.4%) | 128 (40.5%) |
| 3 or 4 Children | 25 (13.1%) | 25 (100.0%) |
| 5 or more Children | 0 (0.0%) | 0 (0.0%) |
| Total | 193 (9.2%) | 160 (27.4%) |
Race in Crossville
The most populous races in Crossville are White / Caucasian (10,860 | 89.8%), Hispanic or Latino (1,091 | 9.0%), and Hawaiian / Pacific (516 | 4.3%).
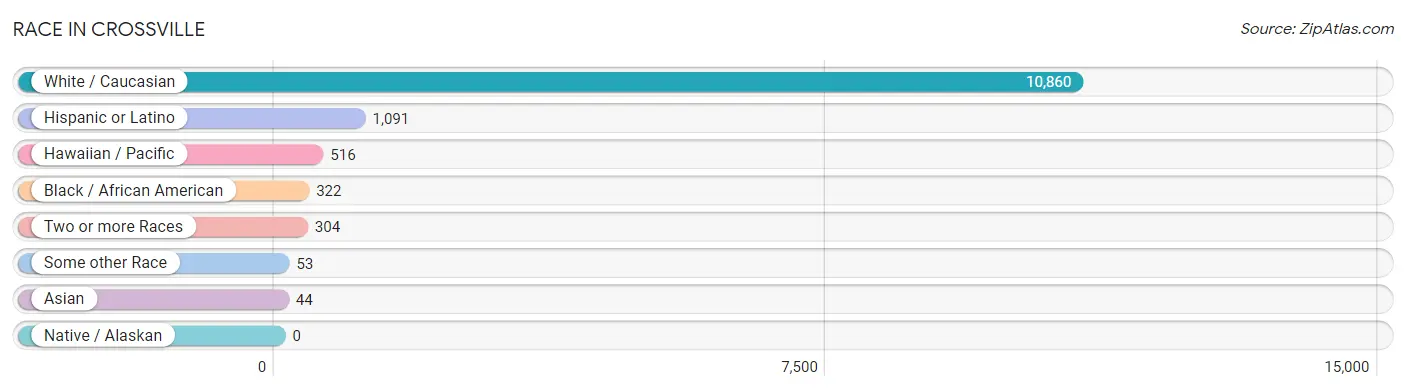
| Race | # Population | % Population |
| Asian | 44 | 0.4% |
| Black / African American | 322 | 2.7% |
| Hawaiian / Pacific | 516 | 4.3% |
| Hispanic or Latino | 1,091 | 9.0% |
| Native / Alaskan | 0 | 0.0% |
| White / Caucasian | 10,860 | 89.8% |
| Two or more Races | 304 | 2.5% |
| Some other Race | 53 | 0.4% |
| Total | 12,099 | 100.0% |
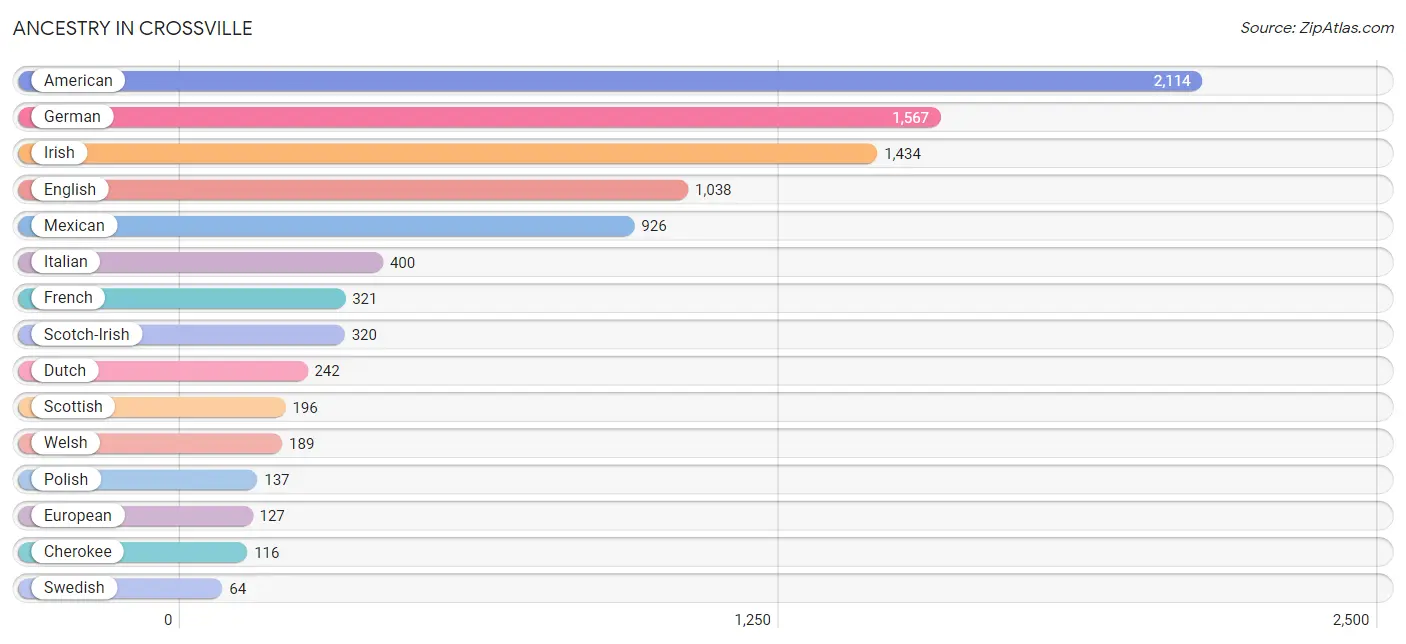
Ancestry in Crossville
The most populous ancestries reported in Crossville are American (2,114 | 17.5%), German (1,567 | 13.0%), Irish (1,434 | 11.8%), English (1,038 | 8.6%), and Mexican (926 | 7.6%), together accounting for 58.5% of all Crossville residents.
| Ancestry | # Population | % Population |
| African | 9 | 0.1% |
| American | 2,114 | 17.5% |
| British | 10 | 0.1% |
| Central American | 21 | 0.2% |
| Cherokee | 116 | 1.0% |
| Cuban | 63 | 0.5% |
| Czech | 11 | 0.1% |
| Danish | 47 | 0.4% |
| Dutch | 242 | 2.0% |
| English | 1,038 | 8.6% |
| European | 127 | 1.1% |
| French | 321 | 2.6% |
| French Canadian | 16 | 0.1% |
| German | 1,567 | 13.0% |
| Greek | 26 | 0.2% |
| Guatemalan | 21 | 0.2% |
| Indian (Asian) | 33 | 0.3% |
| Irish | 1,434 | 11.8% |
| Italian | 400 | 3.3% |
| Korean | 11 | 0.1% |
| Mexican | 926 | 7.6% |
| Native Hawaiian | 15 | 0.1% |
| Nigerian | 24 | 0.2% |
| Northern European | 6 | 0.1% |
| Norwegian | 6 | 0.1% |
| Polish | 137 | 1.1% |
| Portuguese | 15 | 0.1% |
| Romanian | 31 | 0.3% |
| Russian | 42 | 0.4% |
| Scandinavian | 33 | 0.3% |
| Scotch-Irish | 320 | 2.6% |
| Scottish | 196 | 1.6% |
| Slovak | 14 | 0.1% |
| South American | 46 | 0.4% |
| Subsaharan African | 33 | 0.3% |
| Swedish | 64 | 0.5% |
| Swiss | 25 | 0.2% |
| Venezuelan | 46 | 0.4% |
| Welsh | 189 | 1.6% | View All 39 Rows |
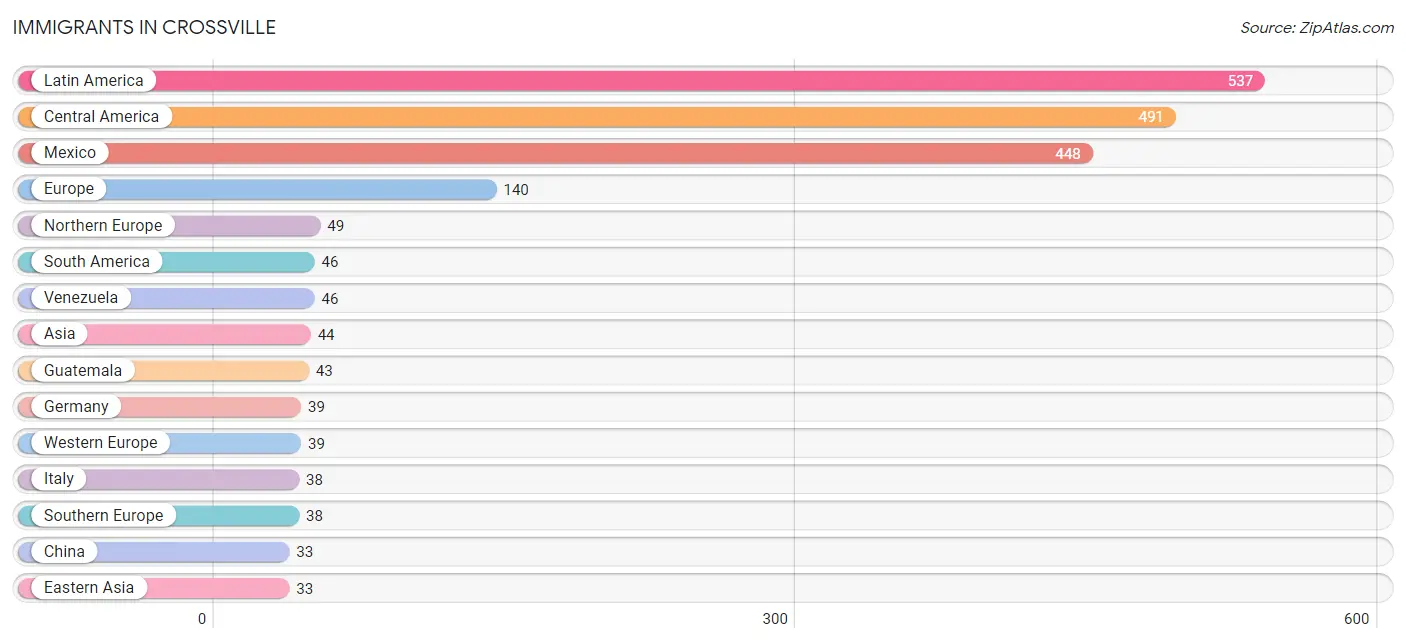
Immigrants in Crossville
The most numerous immigrant groups reported in Crossville came from Latin America (537 | 4.4%), Central America (491 | 4.1%), Mexico (448 | 3.7%), Europe (140 | 1.2%), and Northern Europe (49 | 0.4%), together accounting for 13.8% of all Crossville residents.
| Immigration Origin | # Population | % Population |
| Asia | 44 | 0.4% |
| Canada | 25 | 0.2% |
| Central America | 491 | 4.1% |
| China | 33 | 0.3% |
| Denmark | 30 | 0.3% |
| Eastern Asia | 33 | 0.3% |
| Eastern Europe | 14 | 0.1% |
| Europe | 140 | 1.2% |
| Germany | 39 | 0.3% |
| Guatemala | 43 | 0.4% |
| Ireland | 19 | 0.2% |
| Italy | 38 | 0.3% |
| Latin America | 537 | 4.4% |
| Mexico | 448 | 3.7% |
| Northern Europe | 49 | 0.4% |
| Philippines | 11 | 0.1% |
| Poland | 4 | 0.0% |
| Romania | 10 | 0.1% |
| South America | 46 | 0.4% |
| South Eastern Asia | 11 | 0.1% |
| Southern Europe | 38 | 0.3% |
| Venezuela | 46 | 0.4% |
| Western Europe | 39 | 0.3% | View All 23 Rows |
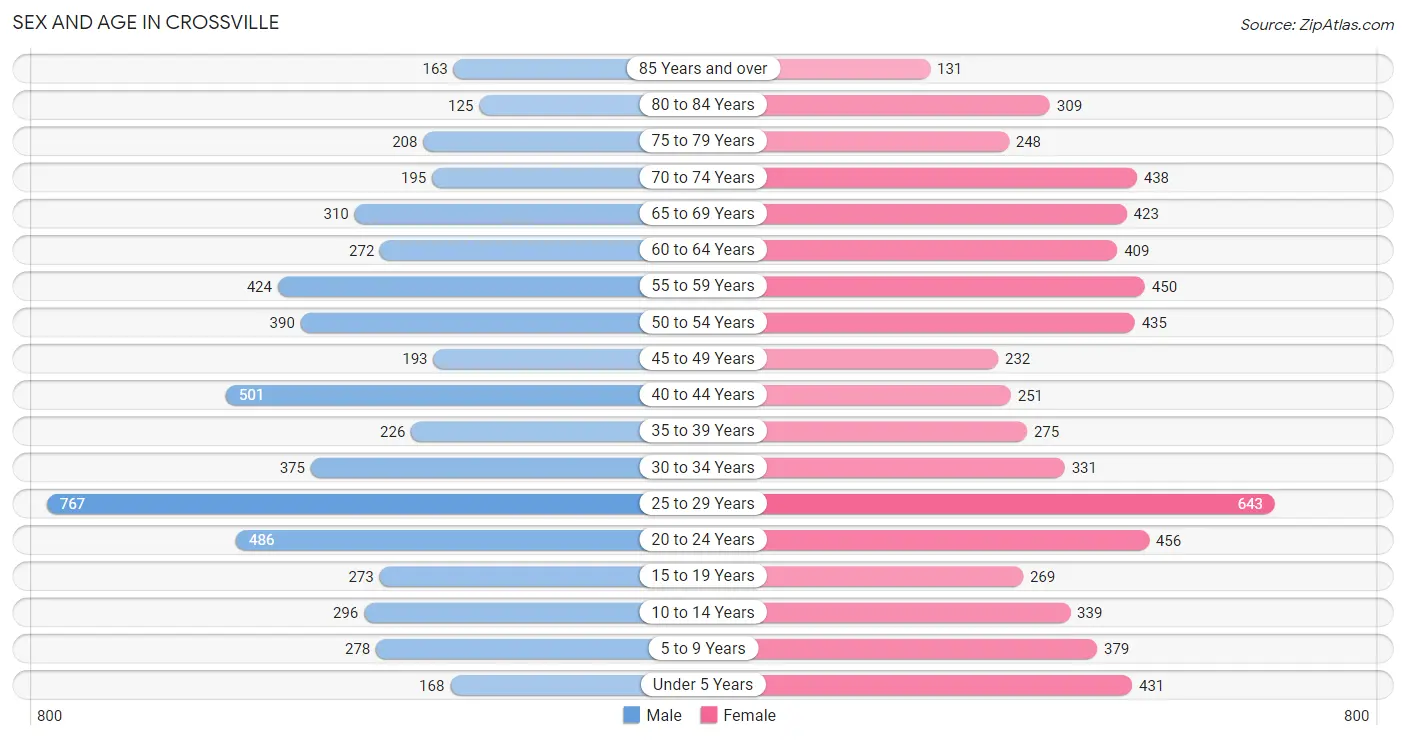
Sex and Age in Crossville
Sex and Age in Crossville
The most populous age groups in Crossville are 25 to 29 Years (767 | 13.6%) for men and 25 to 29 Years (643 | 10.0%) for women.
| Age Bracket | Male | Female |
| Under 5 Years | 168 (3.0%) | 431 (6.7%) |
| 5 to 9 Years | 278 (4.9%) | 379 (5.9%) |
| 10 to 14 Years | 296 (5.2%) | 339 (5.3%) |
| 15 to 19 Years | 273 (4.8%) | 269 (4.2%) |
| 20 to 24 Years | 486 (8.6%) | 456 (7.1%) |
| 25 to 29 Years | 767 (13.6%) | 643 (10.0%) |
| 30 to 34 Years | 375 (6.6%) | 331 (5.1%) |
| 35 to 39 Years | 226 (4.0%) | 275 (4.3%) |
| 40 to 44 Years | 501 (8.9%) | 251 (3.9%) |
| 45 to 49 Years | 193 (3.4%) | 232 (3.6%) |
| 50 to 54 Years | 390 (6.9%) | 435 (6.8%) |
| 55 to 59 Years | 424 (7.5%) | 450 (7.0%) |
| 60 to 64 Years | 272 (4.8%) | 409 (6.3%) |
| 65 to 69 Years | 310 (5.5%) | 423 (6.6%) |
| 70 to 74 Years | 195 (3.5%) | 438 (6.8%) |
| 75 to 79 Years | 208 (3.7%) | 248 (3.8%) |
| 80 to 84 Years | 125 (2.2%) | 309 (4.8%) |
| 85 Years and over | 163 (2.9%) | 131 (2.0%) |
| Total | 5,650 (100.0%) | 6,449 (100.0%) |
Families and Households in Crossville
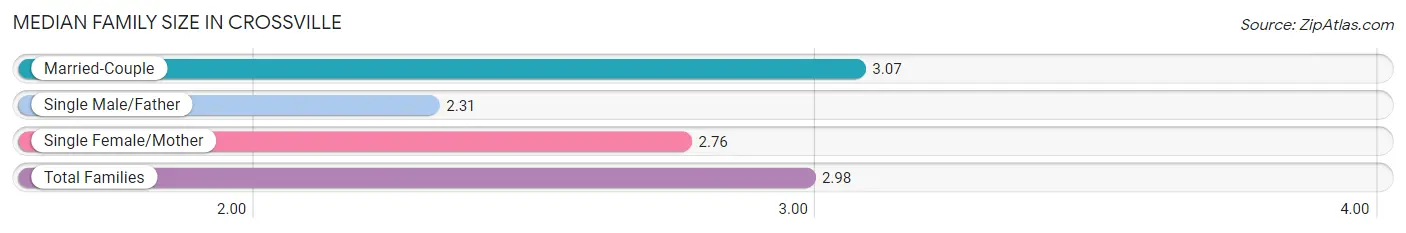
Median Family Size in Crossville
The median family size in Crossville is 2.98 persons per family, with married-couple families (2,098 | 78.2%) accounting for the largest median family size of 3.07 persons per family. On the other hand, single male/father families (112 | 4.2%) represent the smallest median family size with 2.31 persons per family.
| Family Type | # Families | Family Size |
| Married-Couple | 2,098 (78.2%) | 3.07 |
| Single Male/Father | 112 (4.2%) | 2.31 |
| Single Female/Mother | 471 (17.6%) | 2.76 |
| Total Families | 2,681 (100.0%) | 2.98 |
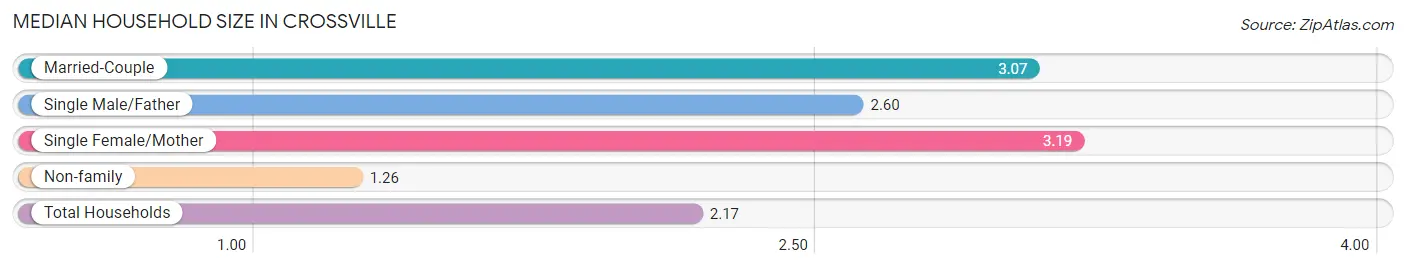
Median Household Size in Crossville
The median household size in Crossville is 2.17 persons per household, with single female/mother households (471 | 8.8%) accounting for the largest median household size of 3.19 persons per household. non-family households (2,642 | 49.6%) represent the smallest median household size with 1.26 persons per household.
| Household Type | # Households | Household Size |
| Married-Couple | 2,098 (39.4%) | 3.07 |
| Single Male/Father | 112 (2.1%) | 2.60 |
| Single Female/Mother | 471 (8.8%) | 3.19 |
| Non-family | 2,642 (49.6%) | 1.26 |
| Total Households | 5,323 (100.0%) | 2.17 |
Household Size by Marriage Status in Crossville
Out of a total of 5,323 households in Crossville, 2,681 (50.4%) are family households, while 2,642 (49.6%) are nonfamily households. The most numerous type of family households are 2-person households, comprising 1,170, and the most common type of nonfamily households are 1-person households, comprising 2,157.
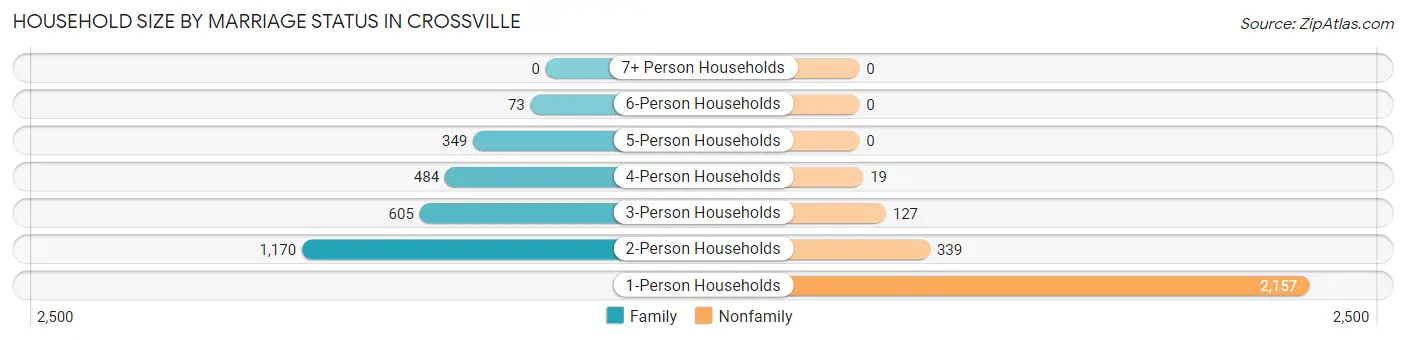
| Household Size | Family Households | Nonfamily Households |
| 1-Person Households | - | 2,157 (40.5%) |
| 2-Person Households | 1,170 (22.0%) | 339 (6.4%) |
| 3-Person Households | 605 (11.4%) | 127 (2.4%) |
| 4-Person Households | 484 (9.1%) | 19 (0.4%) |
| 5-Person Households | 349 (6.6%) | 0 (0.0%) |
| 6-Person Households | 73 (1.4%) | 0 (0.0%) |
| 7+ Person Households | 0 (0.0%) | 0 (0.0%) |
| Total | 2,681 (50.4%) | 2,642 (49.6%) |
Female Fertility in Crossville
Fertility by Age in Crossville
Average fertility rate in Crossville is 85.0 births per 1,000 women. Women in the age bracket of 20 to 34 years have the highest fertility rate with 150.0 births per 1,000 women. Women in the age bracket of 20 to 34 years acount for 100.0% of all women with births.
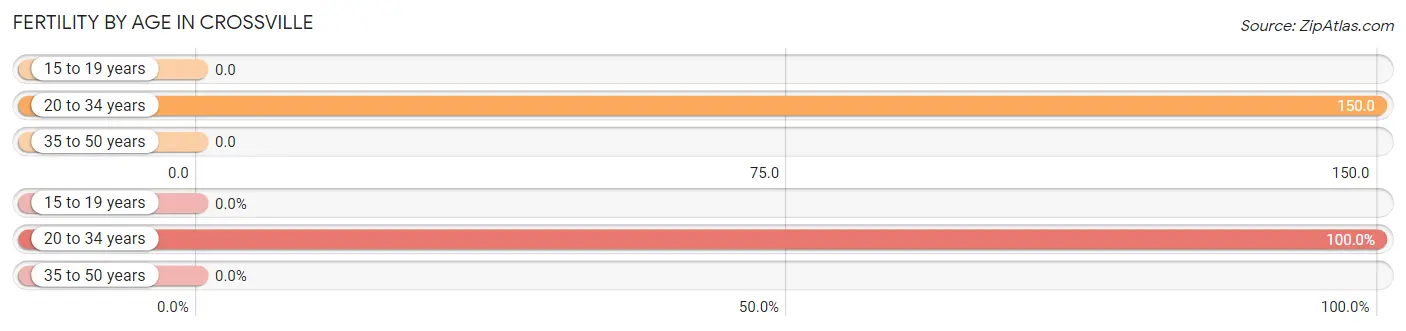
| Age Bracket | Women with Births | Births / 1,000 Women |
| 15 to 19 years | 0 (0.0%) | 0.0 |
| 20 to 34 years | 214 (100.0%) | 150.0 |
| 35 to 50 years | 0 (0.0%) | 0.0 |
| Total | 214 (100.0%) | 85.0 |
Fertility by Age by Marriage Status in Crossville
97.7% of women with births (214) in Crossville are married. The highest percentage of unmarried women with births falls into 20 to 34 years age bracket with 2.3% of them unmarried at the time of birth, while the lowest percentage of unmarried women with births belong to 20 to 34 years age bracket with 2.3% of them unmarried.
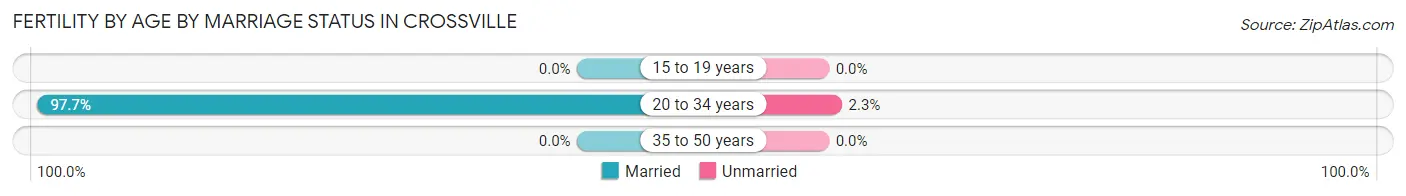
| Age Bracket | Married | Unmarried |
| 15 to 19 years | 0 (0.0%) | 0 (0.0%) |
| 20 to 34 years | 209 (97.7%) | 5 (2.3%) |
| 35 to 50 years | 0 (0.0%) | 0 (0.0%) |
| Total | 209 (97.7%) | 5 (2.3%) |
Fertility by Education in Crossville
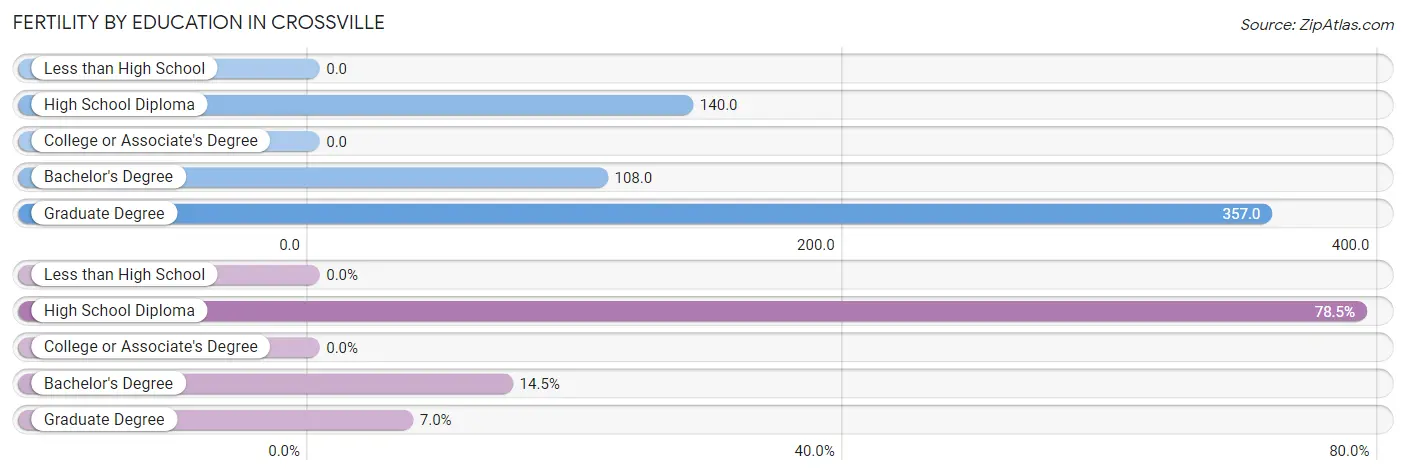
| Educational Attainment | Women with Births | Births / 1,000 Women |
| Less than High School | 0 (0.0%) | 0.0 |
| High School Diploma | 168 (78.5%) | 140.0 |
| College or Associate's Degree | 0 (0.0%) | 0.0 |
| Bachelor's Degree | 31 (14.5%) | 108.0 |
| Graduate Degree | 15 (7.0%) | 357.0 |
| Total | 214 (100.0%) | 85.0 |
Fertility by Education by Marriage Status in Crossville
2.3% of women with births in Crossville are unmarried. Women with the educational attainment of bachelor's degree are most likely to be married with 100.0% of them married at childbirth, while women with the educational attainment of high school diploma are least likely to be married with 3.0% of them unmarried at childbirth.
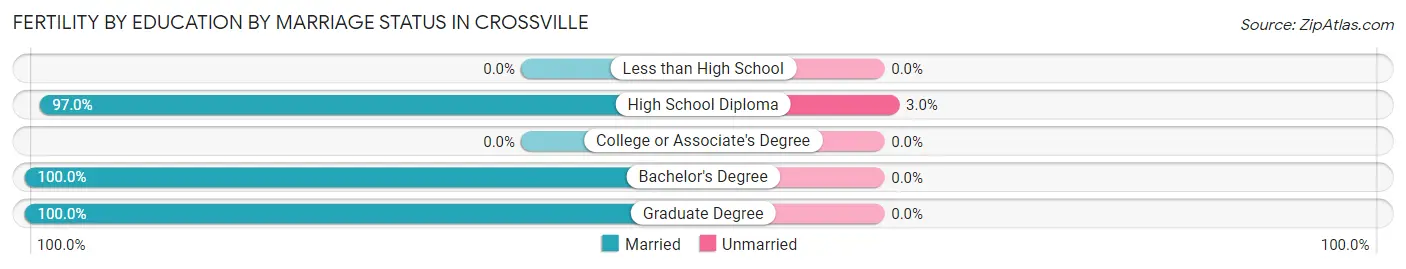
| Educational Attainment | Married | Unmarried |
| Less than High School | 0 (0.0%) | 0 (0.0%) |
| High School Diploma | 163 (97.0%) | 5 (3.0%) |
| College or Associate's Degree | 0 (0.0%) | 0 (0.0%) |
| Bachelor's Degree | 31 (100.0%) | 0 (0.0%) |
| Graduate Degree | 15 (100.0%) | 0 (0.0%) |
| Total | 209 (97.7%) | 5 (2.3%) |
Employment Characteristics in Crossville
Employment by Class of Employer in Crossville
Among the 4,602 employed individuals in Crossville, private company employees (3,346 | 72.7%), not-for-profit organizations (445 | 9.7%), and self-employed (not incorporated) (378 | 8.2%) make up the most common classes of employment.
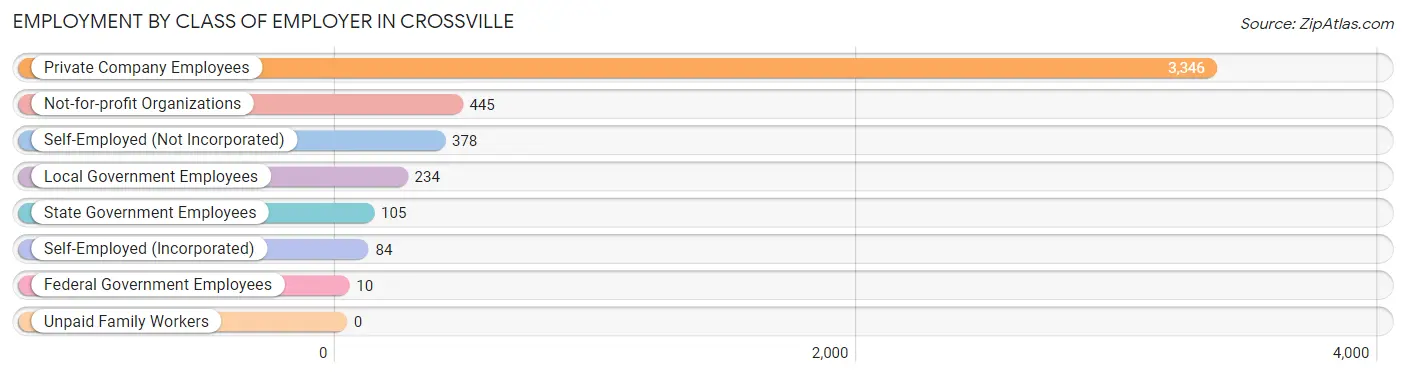
| Employer Class | # Employees | % Employees |
| Private Company Employees | 3,346 | 72.7% |
| Self-Employed (Incorporated) | 84 | 1.8% |
| Self-Employed (Not Incorporated) | 378 | 8.2% |
| Not-for-profit Organizations | 445 | 9.7% |
| Local Government Employees | 234 | 5.1% |
| State Government Employees | 105 | 2.3% |
| Federal Government Employees | 10 | 0.2% |
| Unpaid Family Workers | 0 | 0.0% |
| Total | 4,602 | 100.0% |
Employment Status by Age in Crossville
According to the labor force statistics for Crossville, out of the total population over 16 years of age (10,135), 52.4% or 5,311 individuals are in the labor force, with 10.6% or 563 of them unemployed. The age group with the highest labor force participation rate is 30 to 34 years, with 86.3% or 609 individuals in the labor force. Within the labor force, the 16 to 19 years age range has the highest percentage of unemployed individuals, with 20.7% or 47 of them being unemployed.
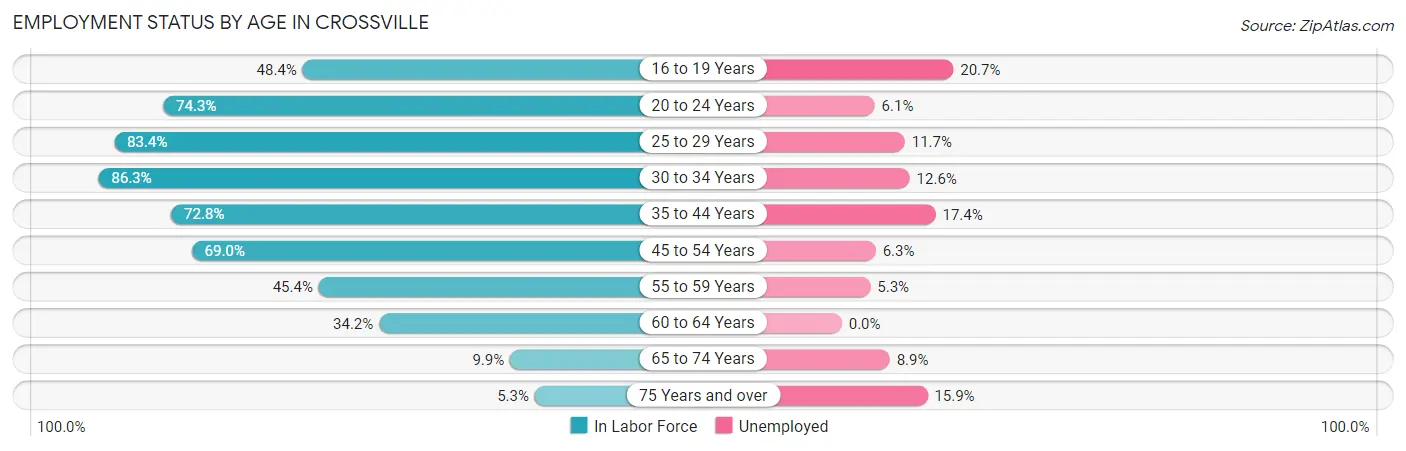
| Age Bracket | In Labor Force | Unemployed |
| 16 to 19 Years | 227 (48.4%) | 47 (20.7%) |
| 20 to 24 Years | 700 (74.3%) | 43 (6.1%) |
| 25 to 29 Years | 1,176 (83.4%) | 138 (11.7%) |
| 30 to 34 Years | 609 (86.3%) | 77 (12.6%) |
| 35 to 44 Years | 912 (72.8%) | 159 (17.4%) |
| 45 to 54 Years | 862 (69.0%) | 54 (6.3%) |
| 55 to 59 Years | 397 (45.4%) | 21 (5.3%) |
| 60 to 64 Years | 233 (34.2%) | 0 (0.0%) |
| 65 to 74 Years | 135 (9.9%) | 12 (8.9%) |
| 75 Years and over | 63 (5.3%) | 10 (15.9%) |
| Total | 5,311 (52.4%) | 563 (10.6%) |
Employment Status by Educational Attainment in Crossville
According to labor force statistics for Crossville, 67.8% of individuals (4,186) out of the total population between 25 and 64 years of age (6,174) are in the labor force, with 10.7% or 448 of them being unemployed. The group with the highest labor force participation rate are those with the educational attainment of college / associate degree, with 74.6% or 1,083 individuals in the labor force. Within the labor force, individuals with high school diploma education have the highest percentage of unemployment, with 15.4% or 293 of them being unemployed.
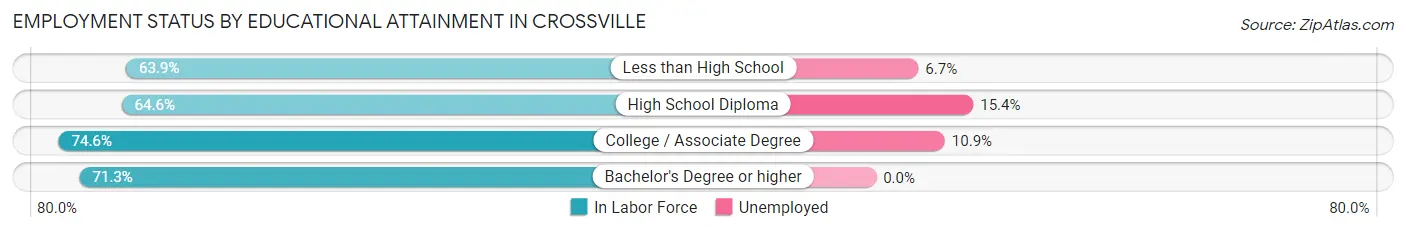
| Educational Attainment | In Labor Force | Unemployed |
| Less than High School | 555 (63.9%) | 58 (6.7%) |
| High School Diploma | 1,902 (64.6%) | 453 (15.4%) |
| College / Associate Degree | 1,083 (74.6%) | 158 (10.9%) |
| Bachelor's Degree or higher | 648 (71.3%) | 0 (0.0%) |
| Total | 4,186 (67.8%) | 661 (10.7%) |
Employment Occupations by Sex in Crossville
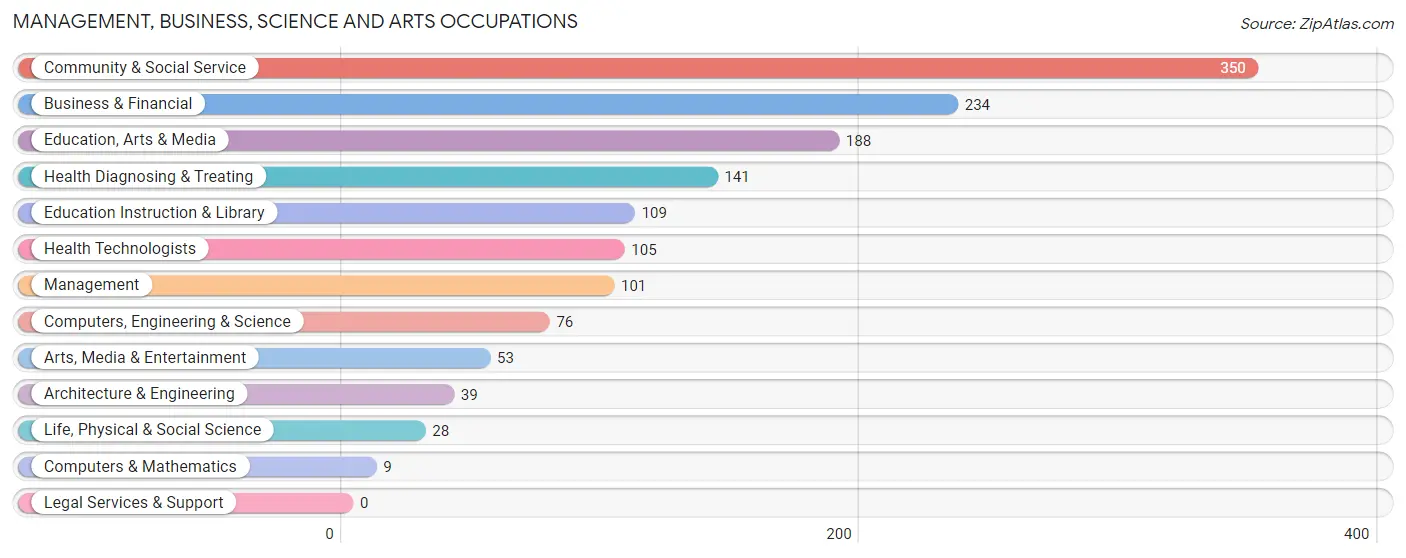
Management, Business, Science and Arts Occupations
The most common Management, Business, Science and Arts occupations in Crossville are Community & Social Service (350 | 7.4%), Business & Financial (234 | 4.9%), Education, Arts & Media (188 | 4.0%), Health Diagnosing & Treating (141 | 3.0%), and Education Instruction & Library (109 | 2.3%).
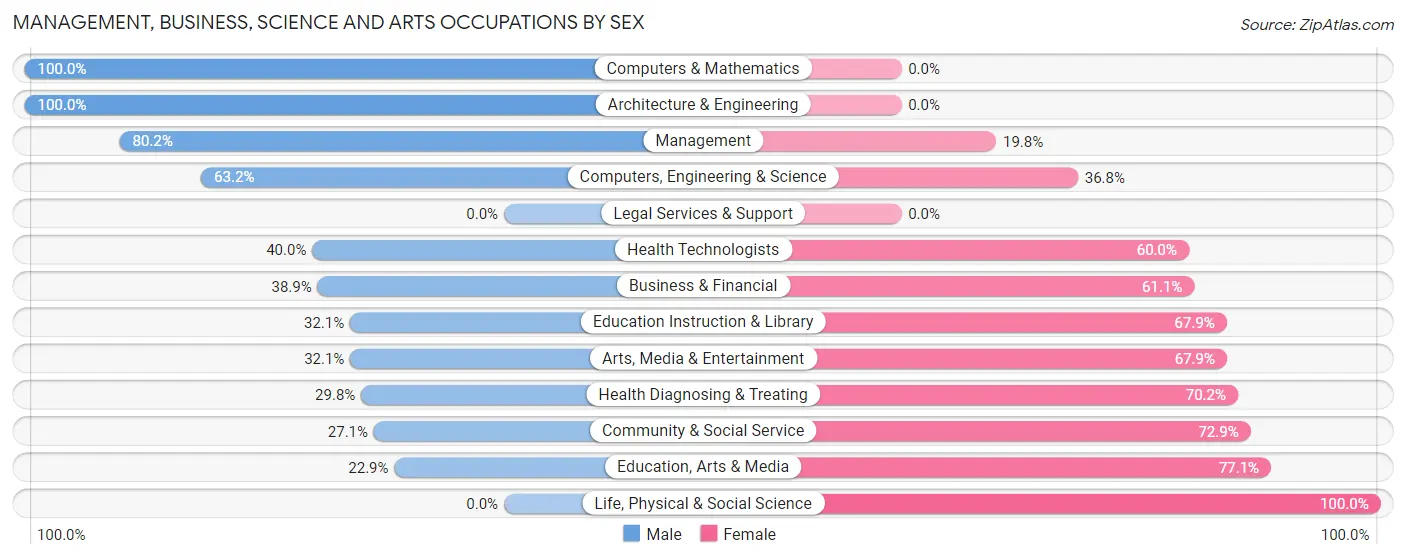
Management, Business, Science and Arts Occupations by Sex
Within the Management, Business, Science and Arts occupations in Crossville, the most male-oriented occupations are Computers & Mathematics (100.0%), Architecture & Engineering (100.0%), and Management (80.2%), while the most female-oriented occupations are Life, Physical & Social Science (100.0%), Education, Arts & Media (77.1%), and Community & Social Service (72.9%).
| Occupation | Male | Female |
| Management | 81 (80.2%) | 20 (19.8%) |
| Business & Financial | 91 (38.9%) | 143 (61.1%) |
| Computers, Engineering & Science | 48 (63.2%) | 28 (36.8%) |
| Computers & Mathematics | 9 (100.0%) | 0 (0.0%) |
| Architecture & Engineering | 39 (100.0%) | 0 (0.0%) |
| Life, Physical & Social Science | 0 (0.0%) | 28 (100.0%) |
| Community & Social Service | 95 (27.1%) | 255 (72.9%) |
| Education, Arts & Media | 43 (22.9%) | 145 (77.1%) |
| Legal Services & Support | 0 (0.0%) | 0 (0.0%) |
| Education Instruction & Library | 35 (32.1%) | 74 (67.9%) |
| Arts, Media & Entertainment | 17 (32.1%) | 36 (67.9%) |
| Health Diagnosing & Treating | 42 (29.8%) | 99 (70.2%) |
| Health Technologists | 42 (40.0%) | 63 (60.0%) |
| Total (Category) | 357 (39.6%) | 545 (60.4%) |
| Total (Overall) | 2,532 (53.3%) | 2,221 (46.7%) |
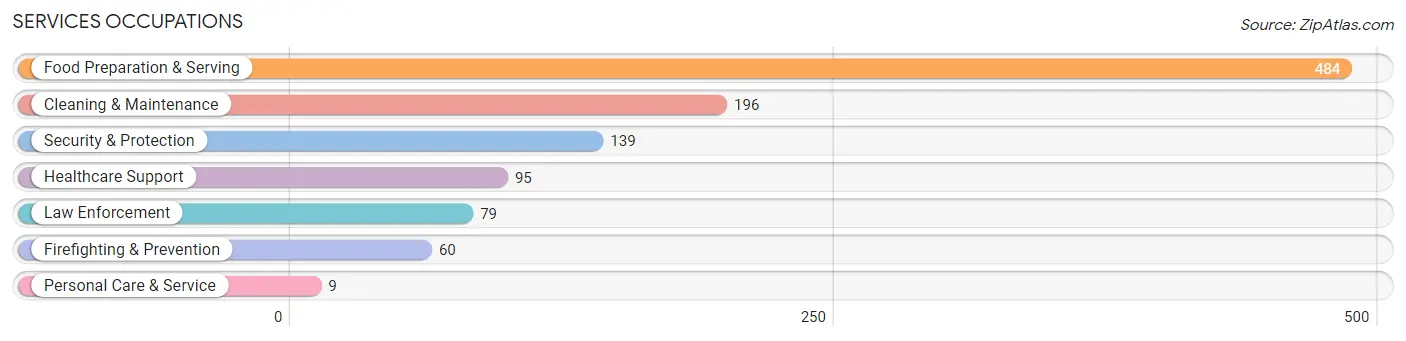
Services Occupations
The most common Services occupations in Crossville are Food Preparation & Serving (484 | 10.2%), Cleaning & Maintenance (196 | 4.1%), Security & Protection (139 | 2.9%), Healthcare Support (95 | 2.0%), and Law Enforcement (79 | 1.7%).
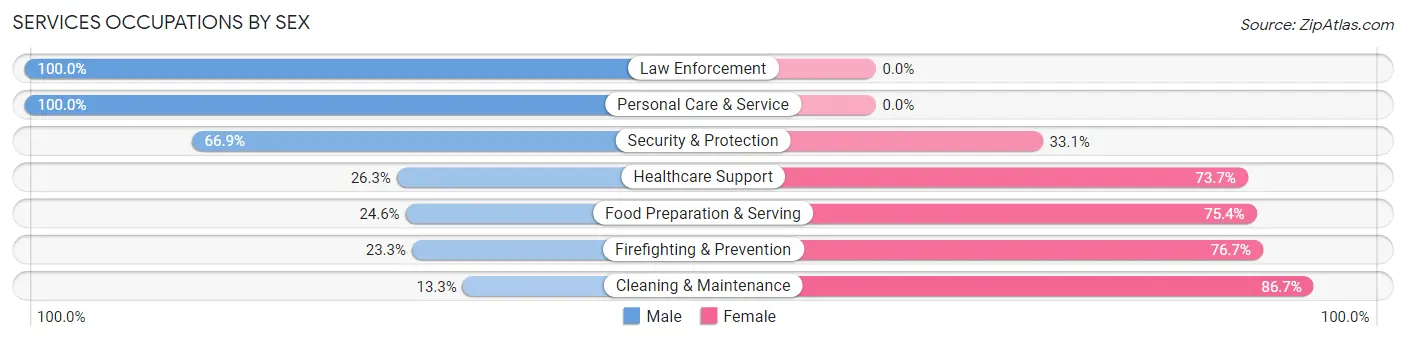
Services Occupations by Sex
Within the Services occupations in Crossville, the most male-oriented occupations are Law Enforcement (100.0%), Personal Care & Service (100.0%), and Security & Protection (66.9%), while the most female-oriented occupations are Cleaning & Maintenance (86.7%), Firefighting & Prevention (76.7%), and Food Preparation & Serving (75.4%).
| Occupation | Male | Female |
| Healthcare Support | 25 (26.3%) | 70 (73.7%) |
| Security & Protection | 93 (66.9%) | 46 (33.1%) |
| Firefighting & Prevention | 14 (23.3%) | 46 (76.7%) |
| Law Enforcement | 79 (100.0%) | 0 (0.0%) |
| Food Preparation & Serving | 119 (24.6%) | 365 (75.4%) |
| Cleaning & Maintenance | 26 (13.3%) | 170 (86.7%) |
| Personal Care & Service | 9 (100.0%) | 0 (0.0%) |
| Total (Category) | 272 (29.5%) | 651 (70.5%) |
| Total (Overall) | 2,532 (53.3%) | 2,221 (46.7%) |
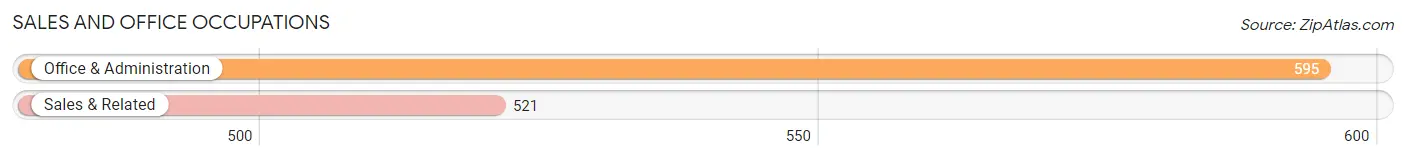
Sales and Office Occupations
The most common Sales and Office occupations in Crossville are Office & Administration (595 | 12.5%), and Sales & Related (521 | 11.0%).
Sales and Office Occupations by Sex
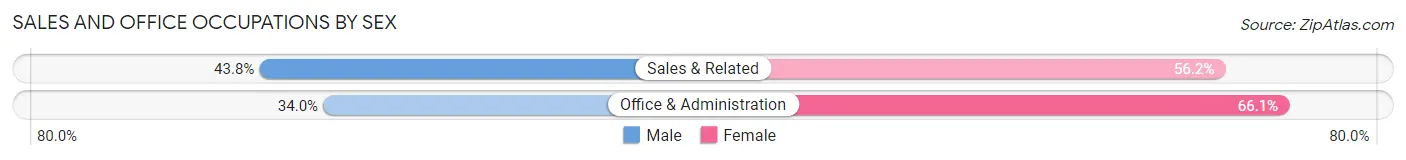
| Occupation | Male | Female |
| Sales & Related | 228 (43.8%) | 293 (56.2%) |
| Office & Administration | 202 (34.0%) | 393 (66.0%) |
| Total (Category) | 430 (38.5%) | 686 (61.5%) |
| Total (Overall) | 2,532 (53.3%) | 2,221 (46.7%) |
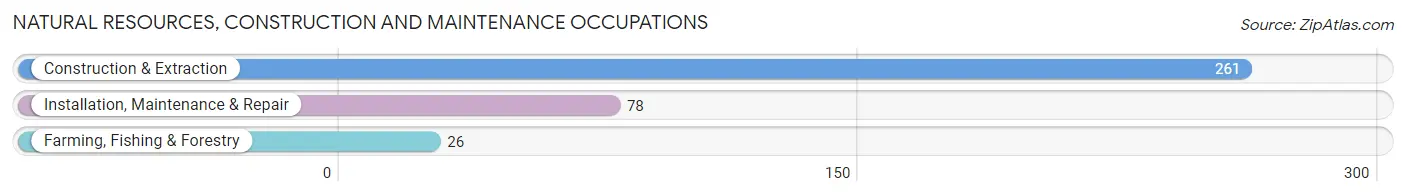
Natural Resources, Construction and Maintenance Occupations
The most common Natural Resources, Construction and Maintenance occupations in Crossville are Construction & Extraction (261 | 5.5%), Installation, Maintenance & Repair (78 | 1.6%), and Farming, Fishing & Forestry (26 | 0.5%).
Natural Resources, Construction and Maintenance Occupations by Sex
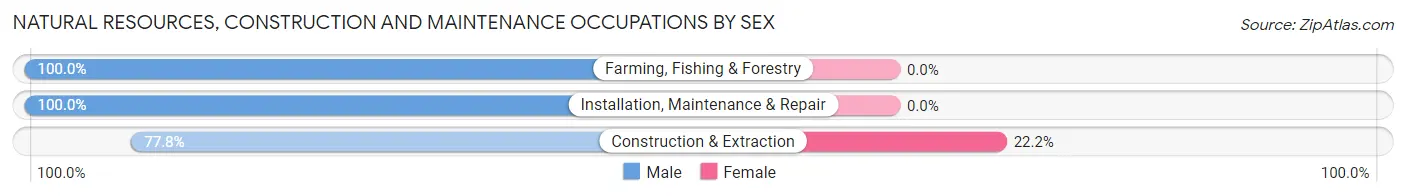
| Occupation | Male | Female |
| Farming, Fishing & Forestry | 26 (100.0%) | 0 (0.0%) |
| Construction & Extraction | 203 (77.8%) | 58 (22.2%) |
| Installation, Maintenance & Repair | 78 (100.0%) | 0 (0.0%) |
| Total (Category) | 307 (84.1%) | 58 (15.9%) |
| Total (Overall) | 2,532 (53.3%) | 2,221 (46.7%) |
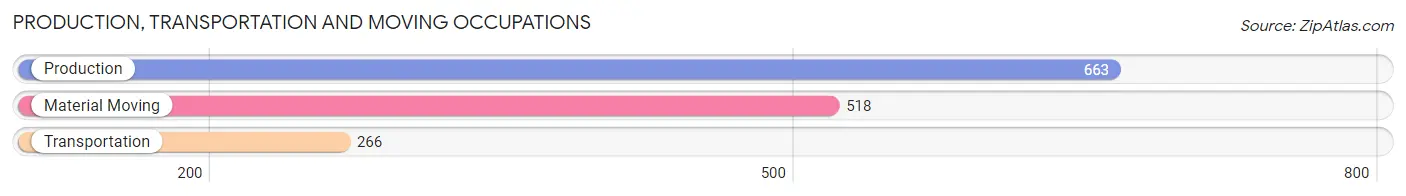
Production, Transportation and Moving Occupations
The most common Production, Transportation and Moving occupations in Crossville are Production (663 | 14.0%), Material Moving (518 | 10.9%), and Transportation (266 | 5.6%).
Production, Transportation and Moving Occupations by Sex
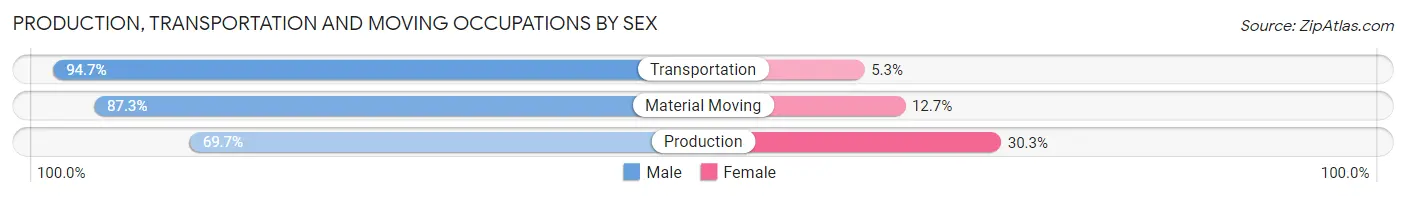
| Occupation | Male | Female |
| Production | 462 (69.7%) | 201 (30.3%) |
| Transportation | 252 (94.7%) | 14 (5.3%) |
| Material Moving | 452 (87.3%) | 66 (12.7%) |
| Total (Category) | 1,166 (80.6%) | 281 (19.4%) |
| Total (Overall) | 2,532 (53.3%) | 2,221 (46.7%) |
Employment Industries by Sex in Crossville
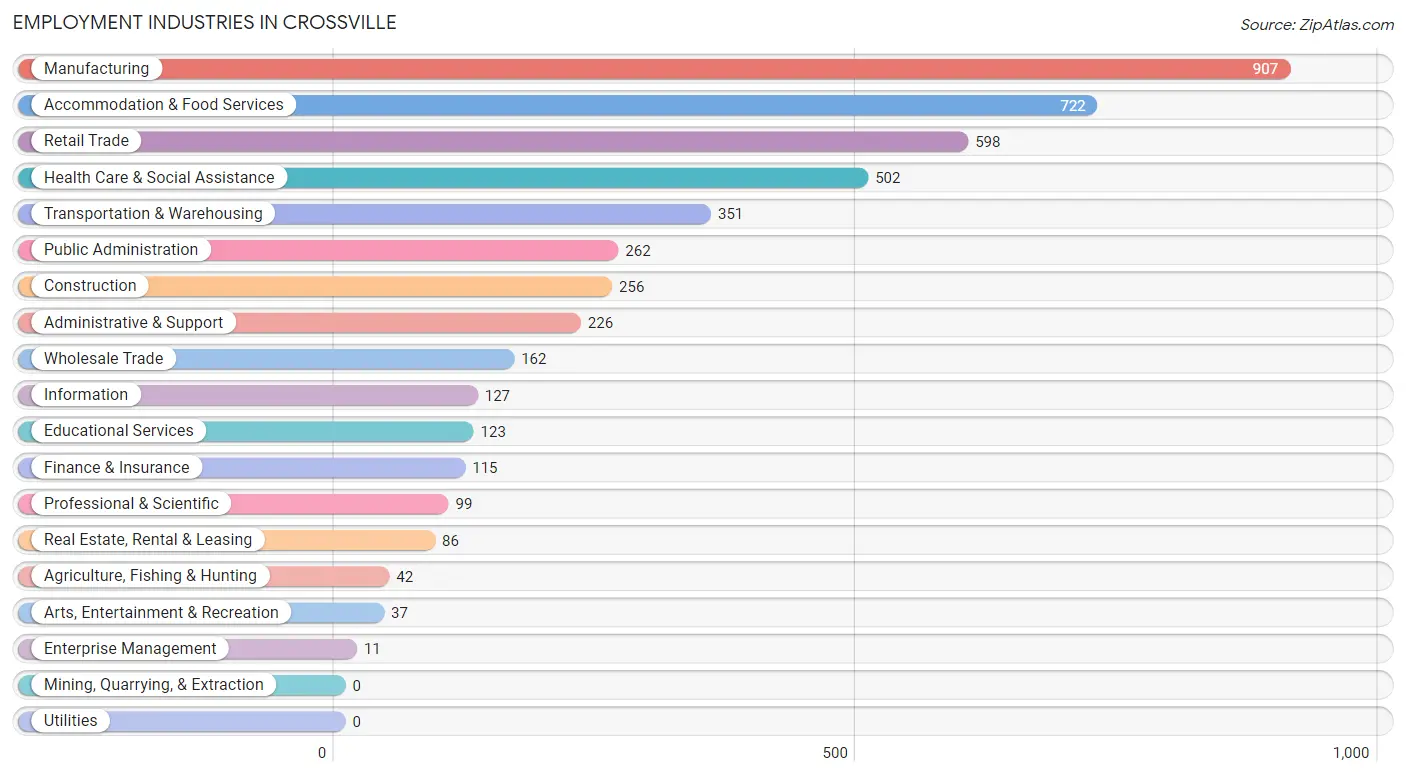
Employment Industries in Crossville
The major employment industries in Crossville include Manufacturing (907 | 19.1%), Accommodation & Food Services (722 | 15.2%), Retail Trade (598 | 12.6%), Health Care & Social Assistance (502 | 10.6%), and Transportation & Warehousing (351 | 7.4%).
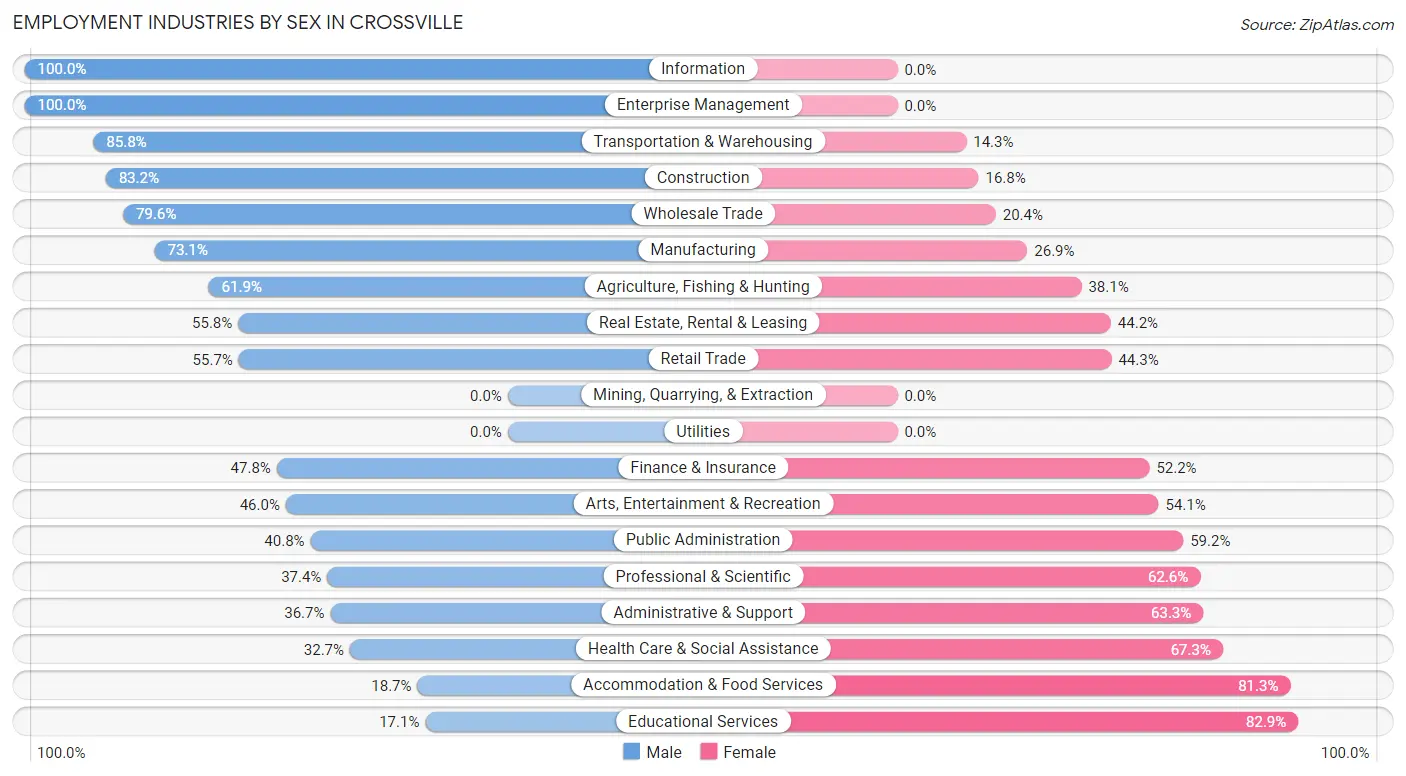
Employment Industries by Sex in Crossville
The Crossville industries that see more men than women are Information (100.0%), Enterprise Management (100.0%), and Transportation & Warehousing (85.8%), whereas the industries that tend to have a higher number of women are Educational Services (82.9%), Accommodation & Food Services (81.3%), and Health Care & Social Assistance (67.3%).
| Industry | Male | Female |
| Agriculture, Fishing & Hunting | 26 (61.9%) | 16 (38.1%) |
| Mining, Quarrying, & Extraction | 0 (0.0%) | 0 (0.0%) |
| Construction | 213 (83.2%) | 43 (16.8%) |
| Manufacturing | 663 (73.1%) | 244 (26.9%) |
| Wholesale Trade | 129 (79.6%) | 33 (20.4%) |
| Retail Trade | 333 (55.7%) | 265 (44.3%) |
| Transportation & Warehousing | 301 (85.8%) | 50 (14.2%) |
| Utilities | 0 (0.0%) | 0 (0.0%) |
| Information | 127 (100.0%) | 0 (0.0%) |
| Finance & Insurance | 55 (47.8%) | 60 (52.2%) |
| Real Estate, Rental & Leasing | 48 (55.8%) | 38 (44.2%) |
| Professional & Scientific | 37 (37.4%) | 62 (62.6%) |
| Enterprise Management | 11 (100.0%) | 0 (0.0%) |
| Administrative & Support | 83 (36.7%) | 143 (63.3%) |
| Educational Services | 21 (17.1%) | 102 (82.9%) |
| Health Care & Social Assistance | 164 (32.7%) | 338 (67.3%) |
| Arts, Entertainment & Recreation | 17 (46.0%) | 20 (54.0%) |
| Accommodation & Food Services | 135 (18.7%) | 587 (81.3%) |
| Public Administration | 107 (40.8%) | 155 (59.2%) |
| Total | 2,532 (53.3%) | 2,221 (46.7%) |
Education in Crossville
School Enrollment in Crossville
The most common levels of schooling among the 1,967 students in Crossville are middle school (482 | 24.5%), elementary school (474 | 24.1%), and high school (428 | 21.8%).
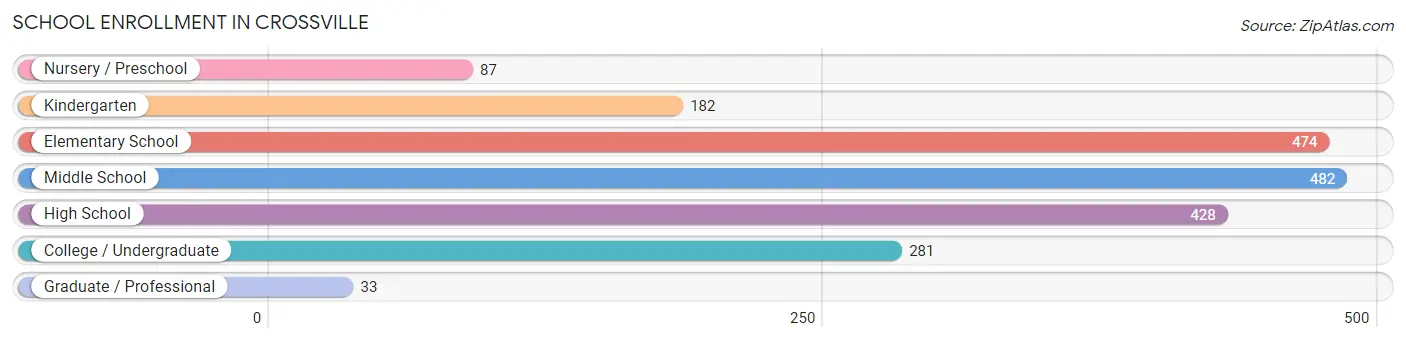
| School Level | # Students | % Students |
| Nursery / Preschool | 87 | 4.4% |
| Kindergarten | 182 | 9.2% |
| Elementary School | 474 | 24.1% |
| Middle School | 482 | 24.5% |
| High School | 428 | 21.8% |
| College / Undergraduate | 281 | 14.3% |
| Graduate / Professional | 33 | 1.7% |
| Total | 1,967 | 100.0% |
School Enrollment by Age by Funding Source in Crossville
Out of a total of 1,967 students who are enrolled in schools in Crossville, 153 (7.8%) attend a private institution, while the remaining 1,814 (92.2%) are enrolled in public schools. The age group of 3 to 4 year olds has the highest likelihood of being enrolled in private schools, with 33 (42.9% in the age bracket) enrolled. Conversely, the age group of 18 to 19 year olds has the lowest likelihood of being enrolled in a private school, with 36 (100.0% in the age bracket) attending a public institution.
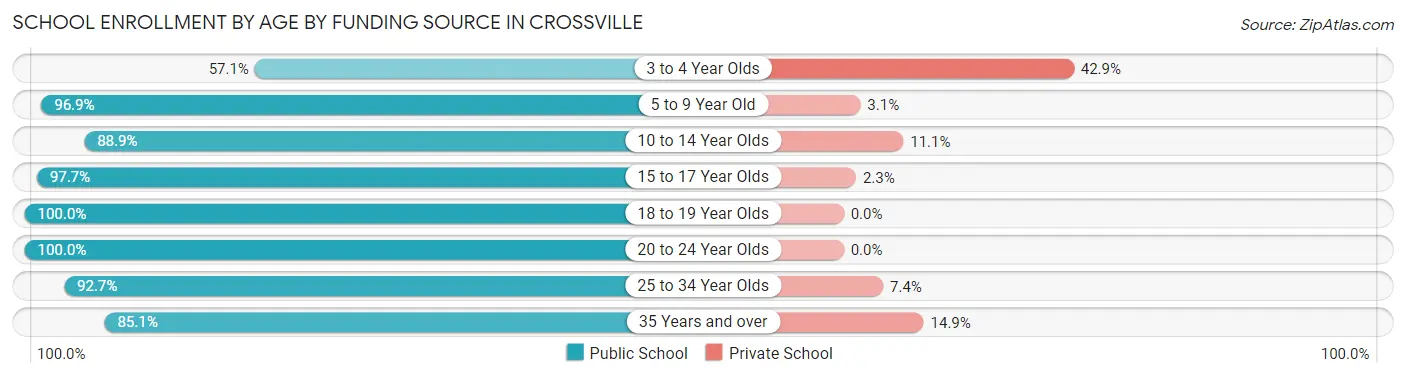
| Age Bracket | Public School | Private School |
| 3 to 4 Year Olds | 44 (57.1%) | 33 (42.9%) |
| 5 to 9 Year Old | 590 (96.9%) | 19 (3.1%) |
| 10 to 14 Year Olds | 560 (88.9%) | 70 (11.1%) |
| 15 to 17 Year Olds | 299 (97.7%) | 7 (2.3%) |
| 18 to 19 Year Olds | 36 (100.0%) | 0 (0.0%) |
| 20 to 24 Year Olds | 79 (100.0%) | 0 (0.0%) |
| 25 to 34 Year Olds | 126 (92.6%) | 10 (7.3%) |
| 35 Years and over | 80 (85.1%) | 14 (14.9%) |
| Total | 1,814 (92.2%) | 153 (7.8%) |
Educational Attainment by Field of Study in Crossville
Education (326 | 18.1%), business (261 | 14.5%), arts & humanities (213 | 11.8%), social sciences (180 | 10.0%), and science & technology (178 | 9.9%) are the most common fields of study among 1,803 individuals in Crossville who have obtained a bachelor's degree or higher.
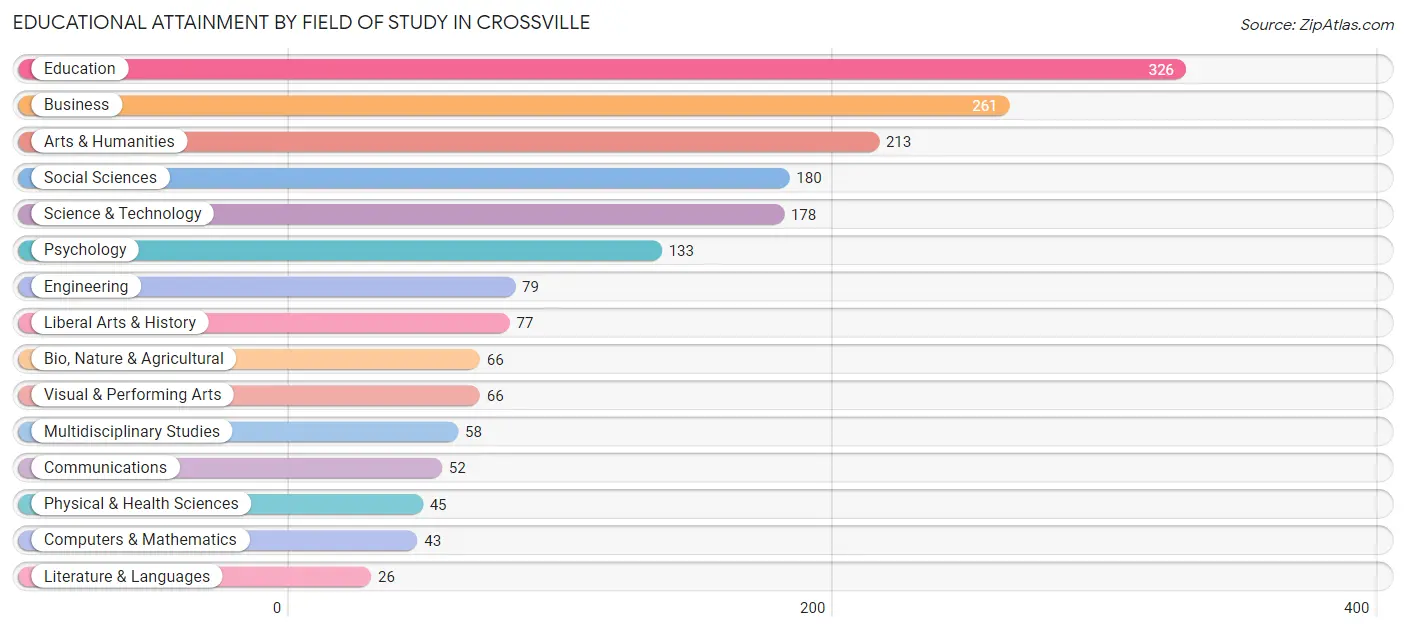
| Field of Study | # Graduates | % Graduates |
| Computers & Mathematics | 43 | 2.4% |
| Bio, Nature & Agricultural | 66 | 3.7% |
| Physical & Health Sciences | 45 | 2.5% |
| Psychology | 133 | 7.4% |
| Social Sciences | 180 | 10.0% |
| Engineering | 79 | 4.4% |
| Multidisciplinary Studies | 58 | 3.2% |
| Science & Technology | 178 | 9.9% |
| Business | 261 | 14.5% |
| Education | 326 | 18.1% |
| Literature & Languages | 26 | 1.4% |
| Liberal Arts & History | 77 | 4.3% |
| Visual & Performing Arts | 66 | 3.7% |
| Communications | 52 | 2.9% |
| Arts & Humanities | 213 | 11.8% |
| Total | 1,803 | 100.0% |
Transportation & Commute in Crossville
Vehicle Availability by Sex in Crossville
The most prevalent vehicle ownership categories in Crossville are males with 2 vehicles (1,002, accounting for 41.1%) and females with 2 vehicles (815, making up 46.4%).
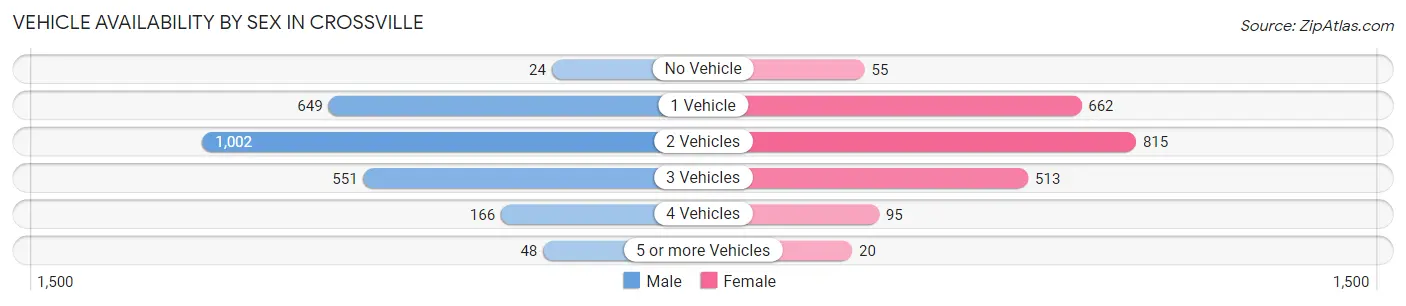
| Vehicles Available | Male | Female |
| No Vehicle | 24 (1.0%) | 55 (2.5%) |
| 1 Vehicle | 649 (26.6%) | 662 (30.6%) |
| 2 Vehicles | 1,002 (41.1%) | 815 (37.7%) |
| 3 Vehicles | 551 (22.6%) | 513 (23.7%) |
| 4 Vehicles | 166 (6.8%) | 95 (4.4%) |
| 5 or more Vehicles | 48 (2.0%) | 20 (0.9%) |
| Total | 2,440 (100.0%) | 2,160 (100.0%) |
Commute Time in Crossville
The most frequently occuring commute durations in Crossville are 5 to 9 minutes (1,361 commuters, 30.8%), 15 to 19 minutes (940 commuters, 21.3%), and 10 to 14 minutes (937 commuters, 21.2%).
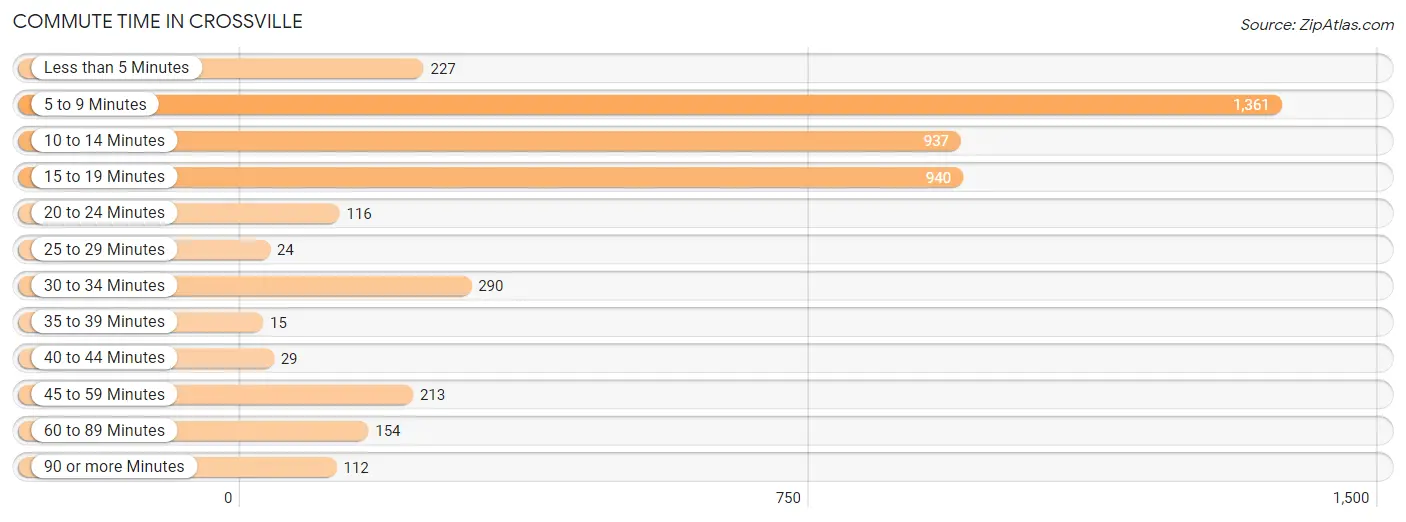
| Commute Time | # Commuters | % Commuters |
| Less than 5 Minutes | 227 | 5.1% |
| 5 to 9 Minutes | 1,361 | 30.8% |
| 10 to 14 Minutes | 937 | 21.2% |
| 15 to 19 Minutes | 940 | 21.3% |
| 20 to 24 Minutes | 116 | 2.6% |
| 25 to 29 Minutes | 24 | 0.5% |
| 30 to 34 Minutes | 290 | 6.6% |
| 35 to 39 Minutes | 15 | 0.3% |
| 40 to 44 Minutes | 29 | 0.7% |
| 45 to 59 Minutes | 213 | 4.8% |
| 60 to 89 Minutes | 154 | 3.5% |
| 90 or more Minutes | 112 | 2.5% |
Commute Time by Sex in Crossville
The most common commute times in Crossville are 5 to 9 minutes (687 commuters, 29.7%) for males and 5 to 9 minutes (674 commuters, 32.0%) for females.
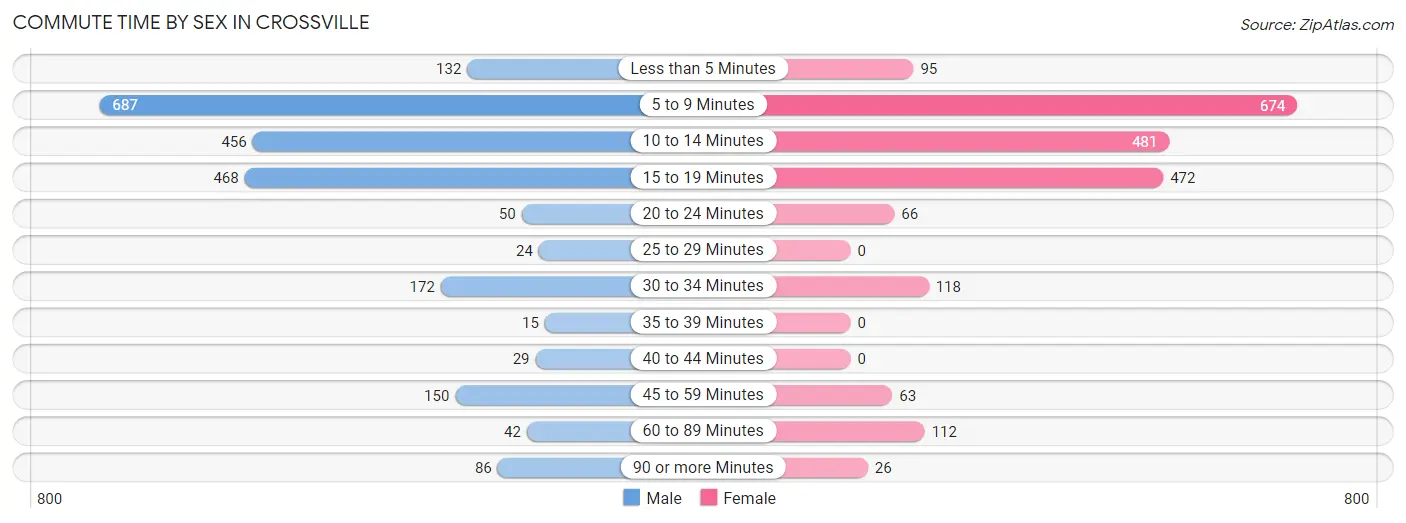
| Commute Time | Male | Female |
| Less than 5 Minutes | 132 (5.7%) | 95 (4.5%) |
| 5 to 9 Minutes | 687 (29.7%) | 674 (32.0%) |
| 10 to 14 Minutes | 456 (19.7%) | 481 (22.8%) |
| 15 to 19 Minutes | 468 (20.3%) | 472 (22.4%) |
| 20 to 24 Minutes | 50 (2.2%) | 66 (3.1%) |
| 25 to 29 Minutes | 24 (1.0%) | 0 (0.0%) |
| 30 to 34 Minutes | 172 (7.4%) | 118 (5.6%) |
| 35 to 39 Minutes | 15 (0.6%) | 0 (0.0%) |
| 40 to 44 Minutes | 29 (1.3%) | 0 (0.0%) |
| 45 to 59 Minutes | 150 (6.5%) | 63 (3.0%) |
| 60 to 89 Minutes | 42 (1.8%) | 112 (5.3%) |
| 90 or more Minutes | 86 (3.7%) | 26 (1.2%) |
Time of Departure to Work by Sex in Crossville
The most frequent times of departure to work in Crossville are 7:00 AM to 7:29 AM (357, 15.4%) for males and 7:00 AM to 7:29 AM (281, 13.3%) for females.
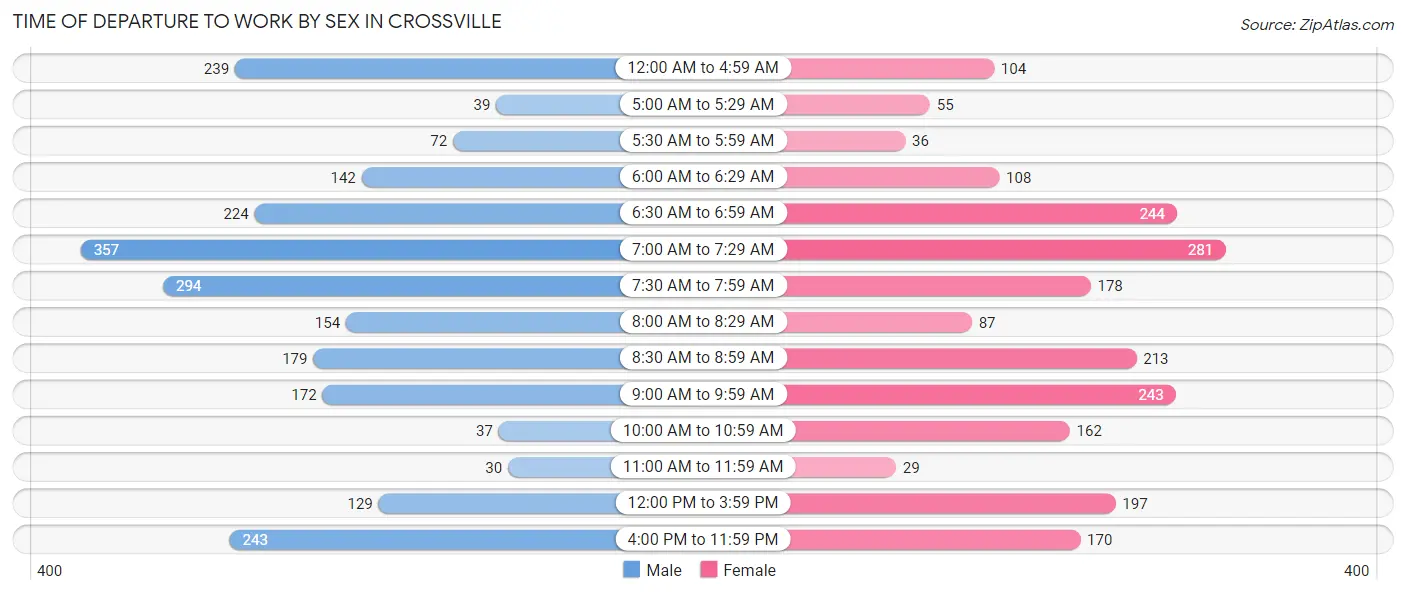
| Time of Departure | Male | Female |
| 12:00 AM to 4:59 AM | 239 (10.3%) | 104 (4.9%) |
| 5:00 AM to 5:29 AM | 39 (1.7%) | 55 (2.6%) |
| 5:30 AM to 5:59 AM | 72 (3.1%) | 36 (1.7%) |
| 6:00 AM to 6:29 AM | 142 (6.1%) | 108 (5.1%) |
| 6:30 AM to 6:59 AM | 224 (9.7%) | 244 (11.6%) |
| 7:00 AM to 7:29 AM | 357 (15.4%) | 281 (13.3%) |
| 7:30 AM to 7:59 AM | 294 (12.7%) | 178 (8.5%) |
| 8:00 AM to 8:29 AM | 154 (6.7%) | 87 (4.1%) |
| 8:30 AM to 8:59 AM | 179 (7.7%) | 213 (10.1%) |
| 9:00 AM to 9:59 AM | 172 (7.4%) | 243 (11.5%) |
| 10:00 AM to 10:59 AM | 37 (1.6%) | 162 (7.7%) |
| 11:00 AM to 11:59 AM | 30 (1.3%) | 29 (1.4%) |
| 12:00 PM to 3:59 PM | 129 (5.6%) | 197 (9.3%) |
| 4:00 PM to 11:59 PM | 243 (10.5%) | 170 (8.1%) |
| Total | 2,311 (100.0%) | 2,107 (100.0%) |
Housing Occupancy in Crossville
Occupancy by Ownership in Crossville
Of the total 5,323 dwellings in Crossville, owner-occupied units account for 2,689 (50.5%), while renter-occupied units make up 2,634 (49.5%).
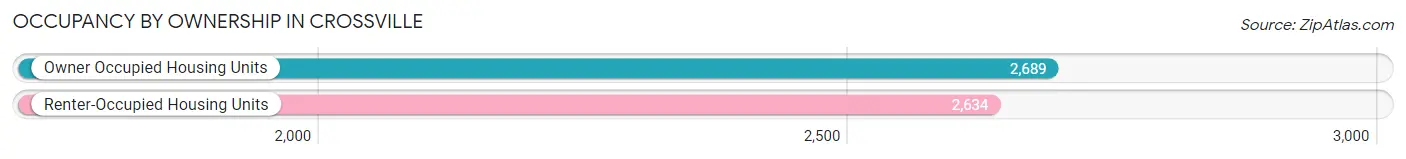
| Occupancy | # Housing Units | % Housing Units |
| Owner Occupied Housing Units | 2,689 | 50.5% |
| Renter-Occupied Housing Units | 2,634 | 49.5% |
| Total Occupied Housing Units | 5,323 | 100.0% |
Occupancy by Household Size in Crossville
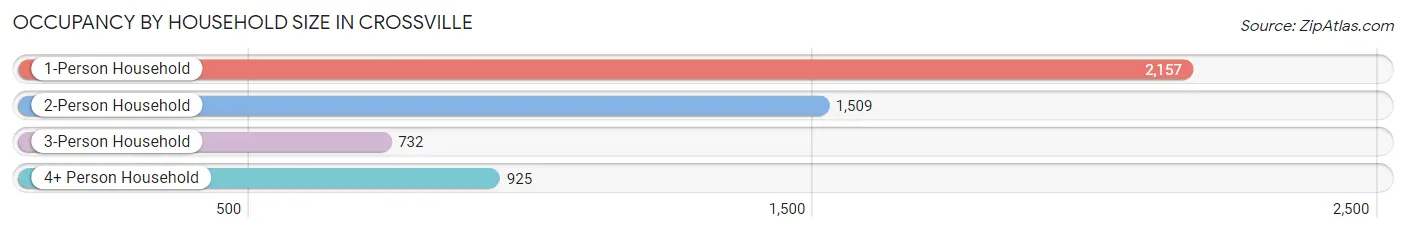
| Household Size | # Housing Units | % Housing Units |
| 1-Person Household | 2,157 | 40.5% |
| 2-Person Household | 1,509 | 28.3% |
| 3-Person Household | 732 | 13.8% |
| 4+ Person Household | 925 | 17.4% |
| Total Housing Units | 5,323 | 100.0% |
Occupancy by Ownership by Household Size in Crossville
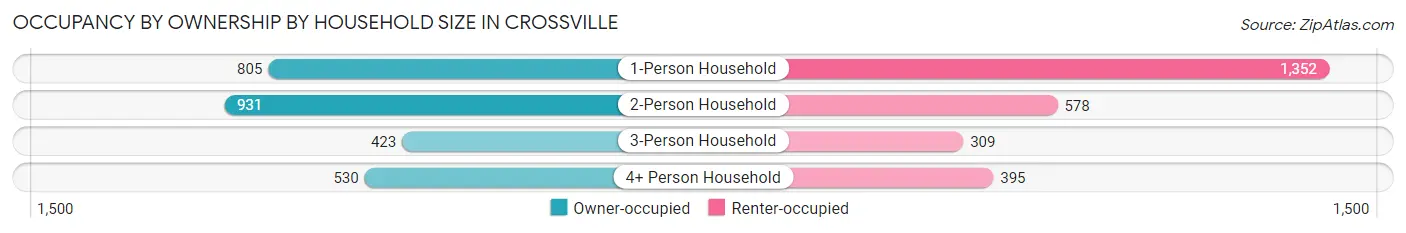
| Household Size | Owner-occupied | Renter-occupied |
| 1-Person Household | 805 (37.3%) | 1,352 (62.7%) |
| 2-Person Household | 931 (61.7%) | 578 (38.3%) |
| 3-Person Household | 423 (57.8%) | 309 (42.2%) |
| 4+ Person Household | 530 (57.3%) | 395 (42.7%) |
| Total Housing Units | 2,689 (50.5%) | 2,634 (49.5%) |
Occupancy by Educational Attainment in Crossville
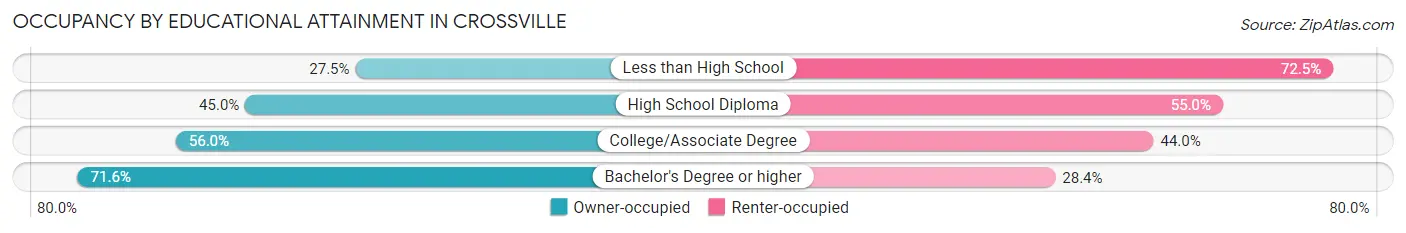
| Household Size | Owner-occupied | Renter-occupied |
| Less than High School | 230 (27.5%) | 605 (72.5%) |
| High School Diploma | 890 (45.0%) | 1,087 (55.0%) |
| College/Associate Degree | 821 (56.0%) | 645 (44.0%) |
| Bachelor's Degree or higher | 748 (71.6%) | 297 (28.4%) |
Occupancy by Age of Householder in Crossville
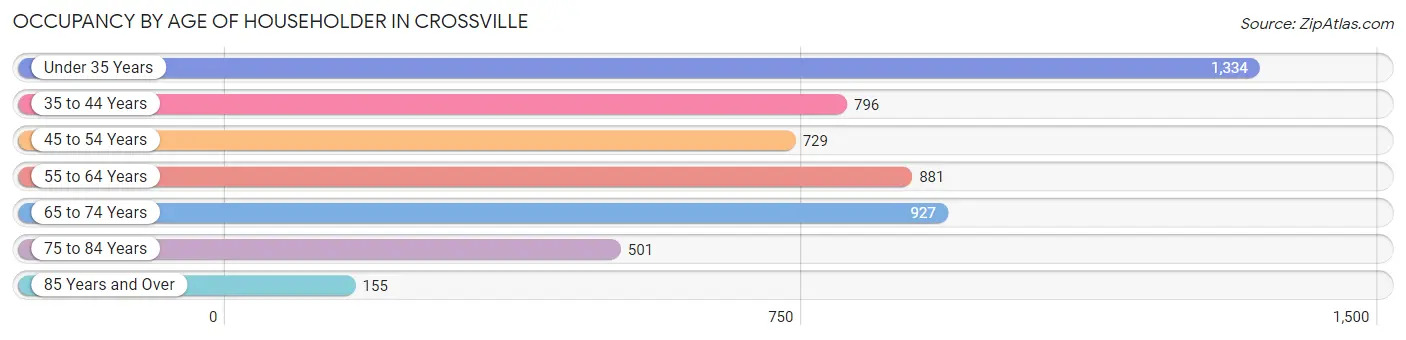
| Age Bracket | # Households | % Households |
| Under 35 Years | 1,334 | 25.1% |
| 35 to 44 Years | 796 | 14.9% |
| 45 to 54 Years | 729 | 13.7% |
| 55 to 64 Years | 881 | 16.6% |
| 65 to 74 Years | 927 | 17.4% |
| 75 to 84 Years | 501 | 9.4% |
| 85 Years and Over | 155 | 2.9% |
| Total | 5,323 | 100.0% |
Housing Finances in Crossville
Median Income by Occupancy in Crossville
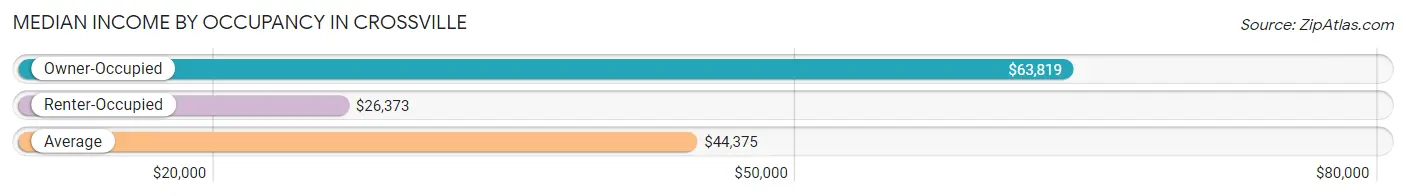
| Occupancy Type | # Households | Median Income |
| Owner-Occupied | 2,689 (50.5%) | $63,819 |
| Renter-Occupied | 2,634 (49.5%) | $26,373 |
| Average | 5,323 (100.0%) | $44,375 |
Occupancy by Householder Income Bracket in Crossville
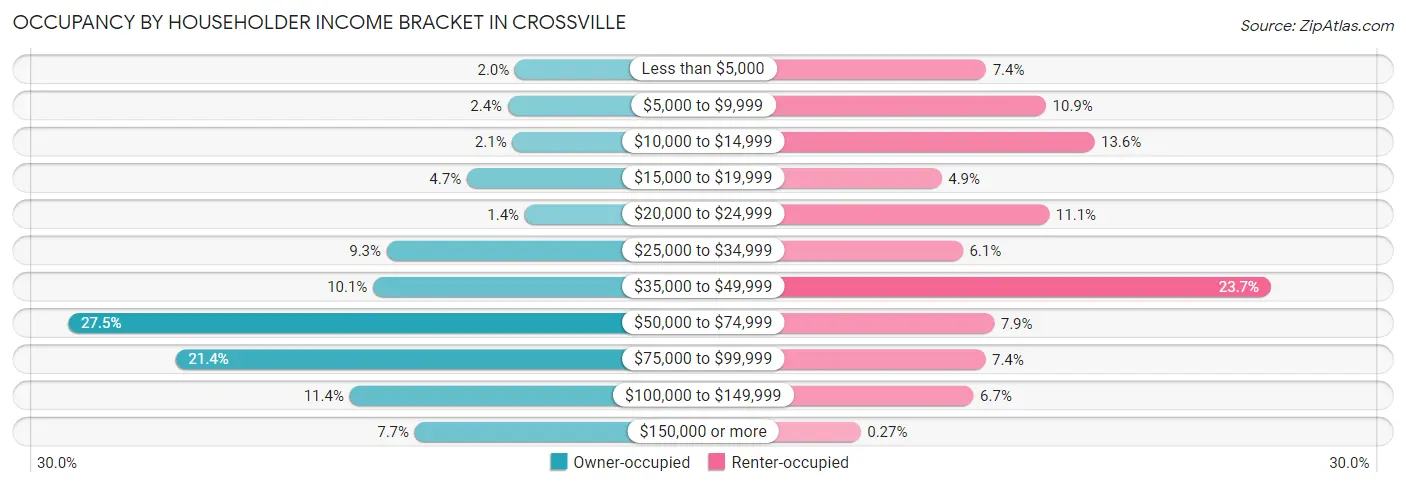
| Income Bracket | Owner-occupied | Renter-occupied |
| Less than $5,000 | 53 (2.0%) | 196 (7.4%) |
| $5,000 to $9,999 | 64 (2.4%) | 286 (10.9%) |
| $10,000 to $14,999 | 57 (2.1%) | 359 (13.6%) |
| $15,000 to $19,999 | 127 (4.7%) | 129 (4.9%) |
| $20,000 to $24,999 | 38 (1.4%) | 291 (11.1%) |
| $25,000 to $34,999 | 250 (9.3%) | 161 (6.1%) |
| $35,000 to $49,999 | 271 (10.1%) | 625 (23.7%) |
| $50,000 to $74,999 | 740 (27.5%) | 208 (7.9%) |
| $75,000 to $99,999 | 575 (21.4%) | 195 (7.4%) |
| $100,000 to $149,999 | 307 (11.4%) | 177 (6.7%) |
| $150,000 or more | 207 (7.7%) | 7 (0.3%) |
| Total | 2,689 (100.0%) | 2,634 (100.0%) |
Monthly Housing Cost Tiers in Crossville
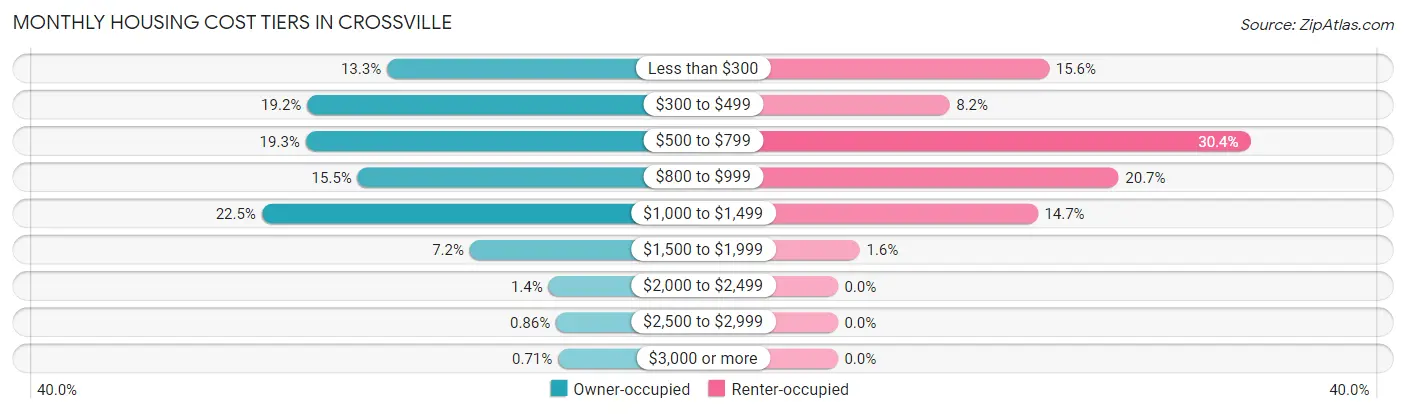
| Monthly Cost | Owner-occupied | Renter-occupied |
| Less than $300 | 358 (13.3%) | 410 (15.6%) |
| $300 to $499 | 516 (19.2%) | 217 (8.2%) |
| $500 to $799 | 519 (19.3%) | 801 (30.4%) |
| $800 to $999 | 416 (15.5%) | 545 (20.7%) |
| $1,000 to $1,499 | 606 (22.5%) | 388 (14.7%) |
| $1,500 to $1,999 | 194 (7.2%) | 43 (1.6%) |
| $2,000 to $2,499 | 38 (1.4%) | 0 (0.0%) |
| $2,500 to $2,999 | 23 (0.9%) | 0 (0.0%) |
| $3,000 or more | 19 (0.7%) | 0 (0.0%) |
| Total | 2,689 (100.0%) | 2,634 (100.0%) |
Physical Housing Characteristics in Crossville
Housing Structures in Crossville
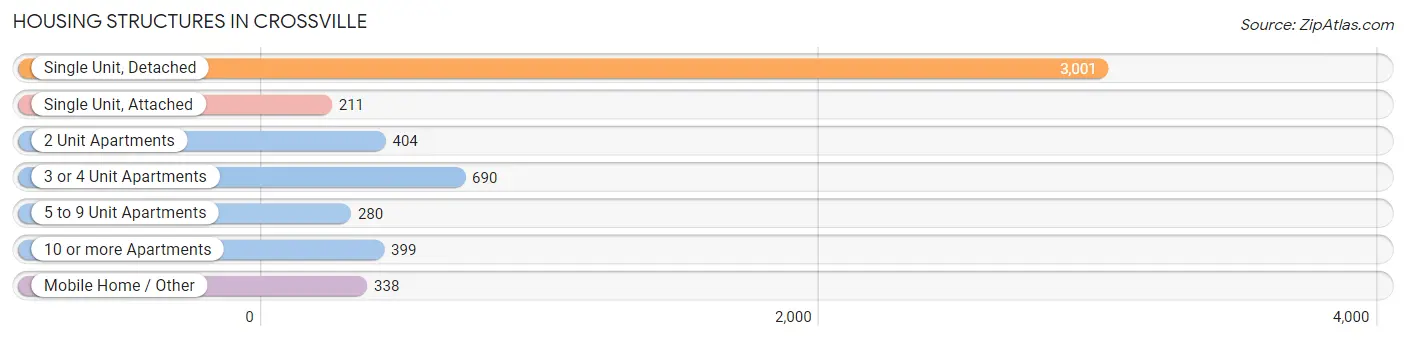
| Structure Type | # Housing Units | % Housing Units |
| Single Unit, Detached | 3,001 | 56.4% |
| Single Unit, Attached | 211 | 4.0% |
| 2 Unit Apartments | 404 | 7.6% |
| 3 or 4 Unit Apartments | 690 | 13.0% |
| 5 to 9 Unit Apartments | 280 | 5.3% |
| 10 or more Apartments | 399 | 7.5% |
| Mobile Home / Other | 338 | 6.4% |
| Total | 5,323 | 100.0% |
Housing Structures by Occupancy in Crossville
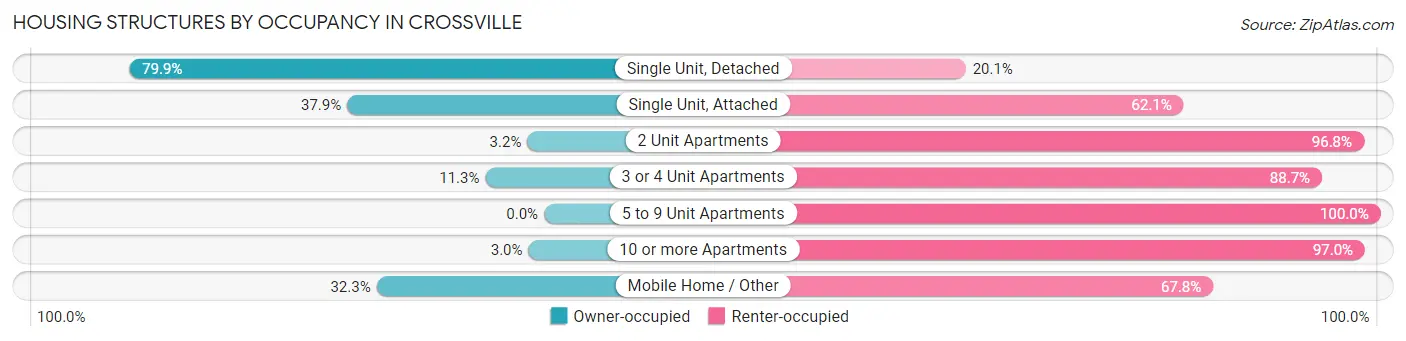
| Structure Type | Owner-occupied | Renter-occupied |
| Single Unit, Detached | 2,397 (79.9%) | 604 (20.1%) |
| Single Unit, Attached | 80 (37.9%) | 131 (62.1%) |
| 2 Unit Apartments | 13 (3.2%) | 391 (96.8%) |
| 3 or 4 Unit Apartments | 78 (11.3%) | 612 (88.7%) |
| 5 to 9 Unit Apartments | 0 (0.0%) | 280 (100.0%) |
| 10 or more Apartments | 12 (3.0%) | 387 (97.0%) |
| Mobile Home / Other | 109 (32.3%) | 229 (67.7%) |
| Total | 2,689 (50.5%) | 2,634 (49.5%) |
Housing Structures by Number of Rooms in Crossville
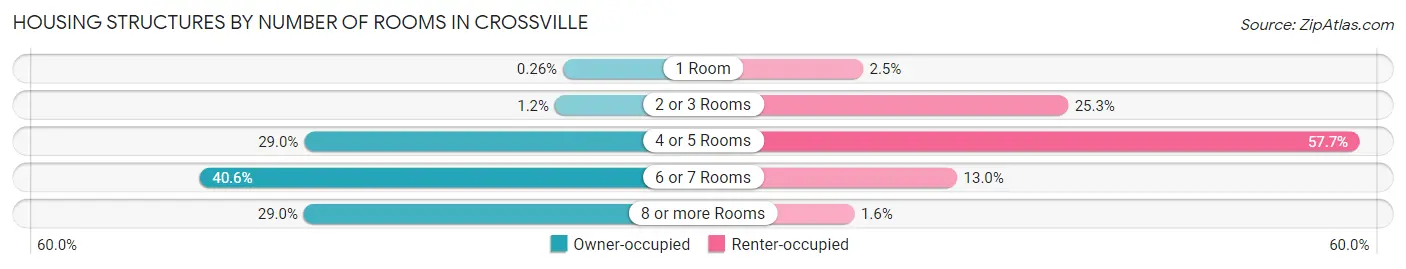
| Number of Rooms | Owner-occupied | Renter-occupied |
| 1 Room | 7 (0.3%) | 66 (2.5%) |
| 2 or 3 Rooms | 31 (1.1%) | 666 (25.3%) |
| 4 or 5 Rooms | 779 (29.0%) | 1,520 (57.7%) |
| 6 or 7 Rooms | 1,092 (40.6%) | 341 (13.0%) |
| 8 or more Rooms | 780 (29.0%) | 41 (1.6%) |
| Total | 2,689 (100.0%) | 2,634 (100.0%) |
Housing Structure by Heating Type in Crossville
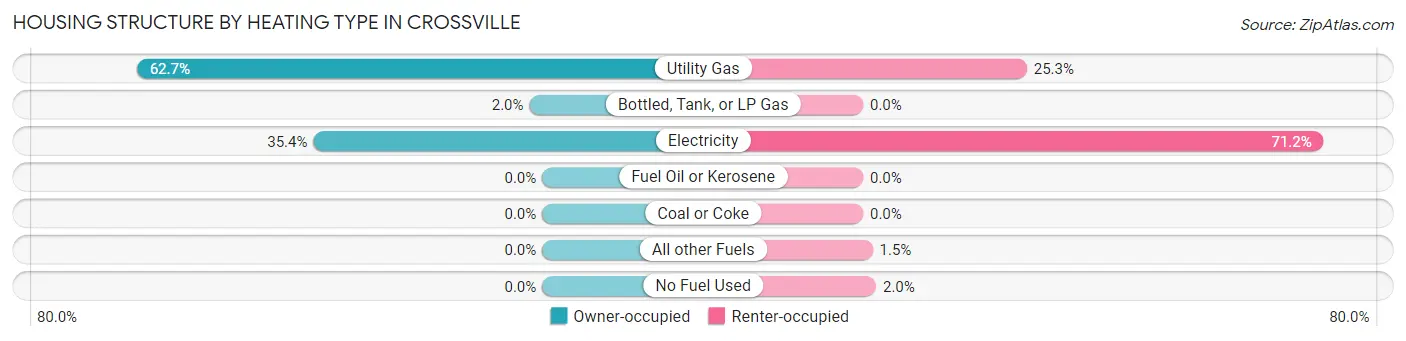
| Heating Type | Owner-occupied | Renter-occupied |
| Utility Gas | 1,685 (62.7%) | 667 (25.3%) |
| Bottled, Tank, or LP Gas | 53 (2.0%) | 0 (0.0%) |
| Electricity | 951 (35.4%) | 1,875 (71.2%) |
| Fuel Oil or Kerosene | 0 (0.0%) | 0 (0.0%) |
| Coal or Coke | 0 (0.0%) | 0 (0.0%) |
| All other Fuels | 0 (0.0%) | 39 (1.5%) |
| No Fuel Used | 0 (0.0%) | 53 (2.0%) |
| Total | 2,689 (100.0%) | 2,634 (100.0%) |
Household Vehicle Usage in Crossville
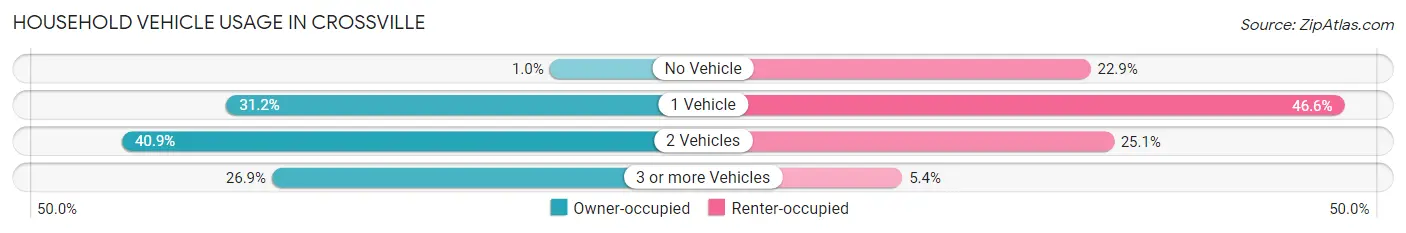
| Vehicles per Household | Owner-occupied | Renter-occupied |
| No Vehicle | 27 (1.0%) | 604 (22.9%) |
| 1 Vehicle | 838 (31.2%) | 1,228 (46.6%) |
| 2 Vehicles | 1,100 (40.9%) | 661 (25.1%) |
| 3 or more Vehicles | 724 (26.9%) | 141 (5.3%) |
| Total | 2,689 (100.0%) | 2,634 (100.0%) |
Real Estate & Mortgages in Crossville
Real Estate and Mortgage Overview in Crossville
| Characteristic | Without Mortgage | With Mortgage |
| Housing Units | 1,450 | 1,239 |
| Median Property Value | $245,400 | $202,000 |
| Median Household Income | $60,800 | $98 |
| Monthly Housing Costs | $437 | $4 |
| Real Estate Taxes | $1,154 | $26 |
Property Value by Mortgage Status in Crossville
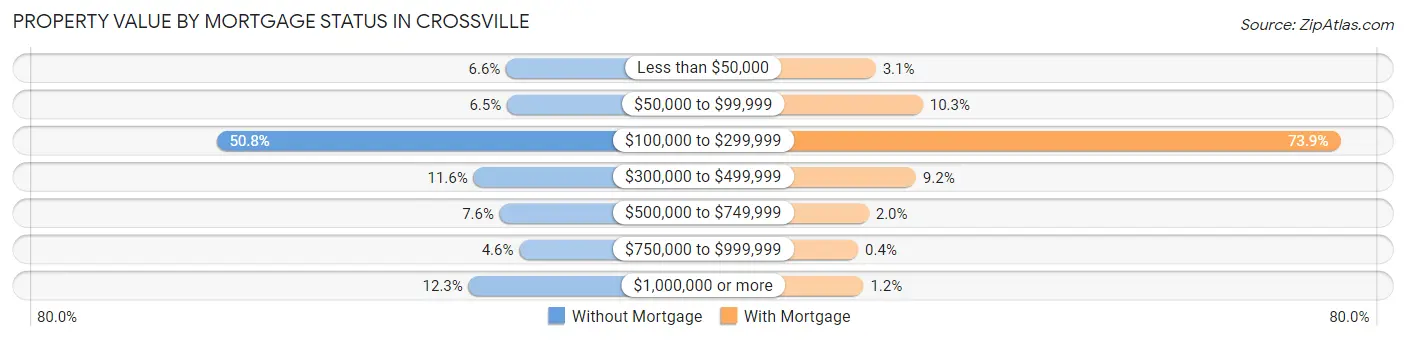
| Property Value | Without Mortgage | With Mortgage |
| Less than $50,000 | 96 (6.6%) | 38 (3.1%) |
| $50,000 to $99,999 | 94 (6.5%) | 127 (10.2%) |
| $100,000 to $299,999 | 736 (50.8%) | 915 (73.9%) |
| $300,000 to $499,999 | 168 (11.6%) | 114 (9.2%) |
| $500,000 to $749,999 | 110 (7.6%) | 25 (2.0%) |
| $750,000 to $999,999 | 67 (4.6%) | 5 (0.4%) |
| $1,000,000 or more | 179 (12.3%) | 15 (1.2%) |
| Total | 1,450 (100.0%) | 1,239 (100.0%) |
Household Income by Mortgage Status in Crossville
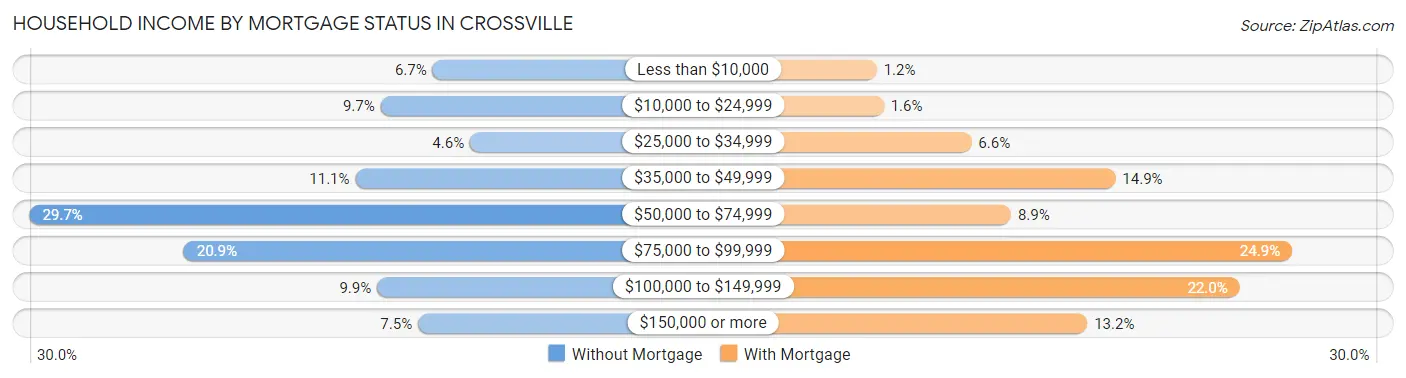
| Household Income | Without Mortgage | With Mortgage |
| Less than $10,000 | 97 (6.7%) | 15 (1.2%) |
| $10,000 to $24,999 | 140 (9.7%) | 20 (1.6%) |
| $25,000 to $34,999 | 66 (4.5%) | 82 (6.6%) |
| $35,000 to $49,999 | 161 (11.1%) | 184 (14.8%) |
| $50,000 to $74,999 | 431 (29.7%) | 110 (8.9%) |
| $75,000 to $99,999 | 303 (20.9%) | 309 (24.9%) |
| $100,000 to $149,999 | 143 (9.9%) | 272 (22.0%) |
| $150,000 or more | 109 (7.5%) | 164 (13.2%) |
| Total | 1,450 (100.0%) | 1,239 (100.0%) |
Property Value to Household Income Ratio in Crossville
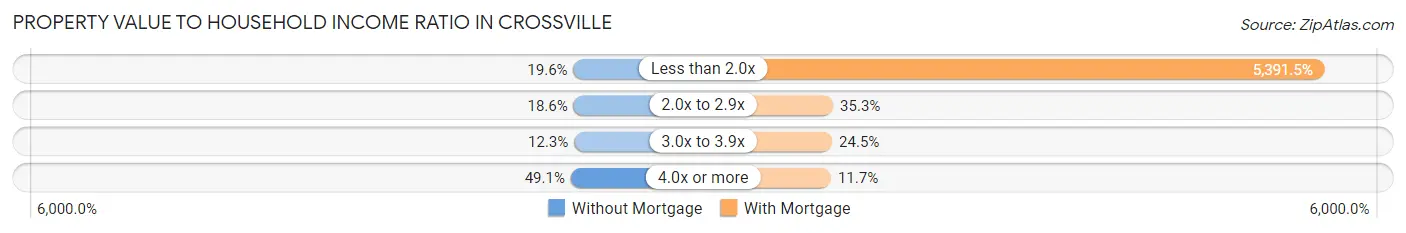
| Value-to-Income Ratio | Without Mortgage | With Mortgage |
| Less than 2.0x | 284 (19.6%) | 66,801 (5,391.5%) |
| 2.0x to 2.9x | 269 (18.5%) | 437 (35.3%) |
| 3.0x to 3.9x | 178 (12.3%) | 304 (24.5%) |
| 4.0x or more | 712 (49.1%) | 145 (11.7%) |
| Total | 1,450 (100.0%) | 1,239 (100.0%) |
Real Estate Taxes by Mortgage Status in Crossville
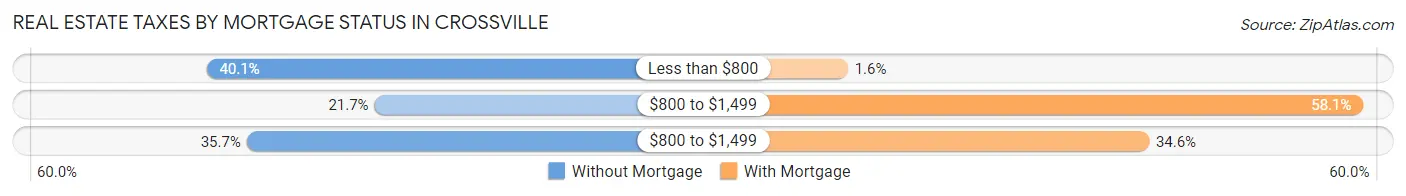
| Property Taxes | Without Mortgage | With Mortgage |
| Less than $800 | 581 (40.1%) | 20 (1.6%) |
| $800 to $1,499 | 314 (21.7%) | 720 (58.1%) |
| $800 to $1,499 | 517 (35.7%) | 429 (34.6%) |
| Total | 1,450 (100.0%) | 1,239 (100.0%) |
Health & Disability in Crossville
Health Insurance Coverage by Age in Crossville
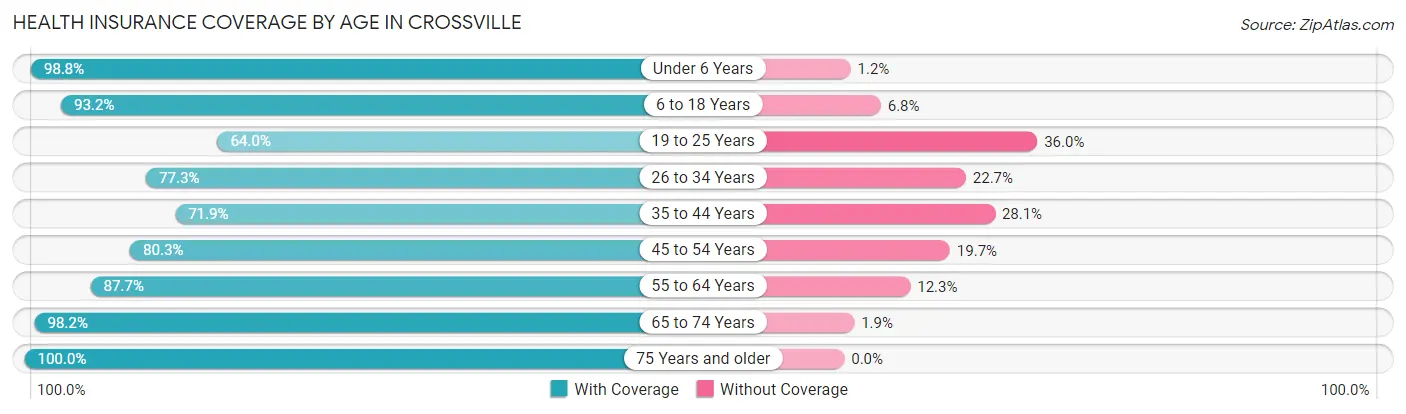
| Age Bracket | With Coverage | Without Coverage |
| Under 6 Years | 678 (98.8%) | 8 (1.2%) |
| 6 to 18 Years | 1,493 (93.2%) | 109 (6.8%) |
| 19 to 25 Years | 822 (64.0%) | 462 (36.0%) |
| 26 to 34 Years | 1,402 (77.3%) | 411 (22.7%) |
| 35 to 44 Years | 868 (71.9%) | 339 (28.1%) |
| 45 to 54 Years | 975 (80.3%) | 239 (19.7%) |
| 55 to 64 Years | 1,304 (87.7%) | 183 (12.3%) |
| 65 to 74 Years | 1,270 (98.2%) | 24 (1.8%) |
| 75 Years and older | 1,076 (100.0%) | 0 (0.0%) |
| Total | 9,888 (84.8%) | 1,775 (15.2%) |
Health Insurance Coverage by Citizenship Status in Crossville
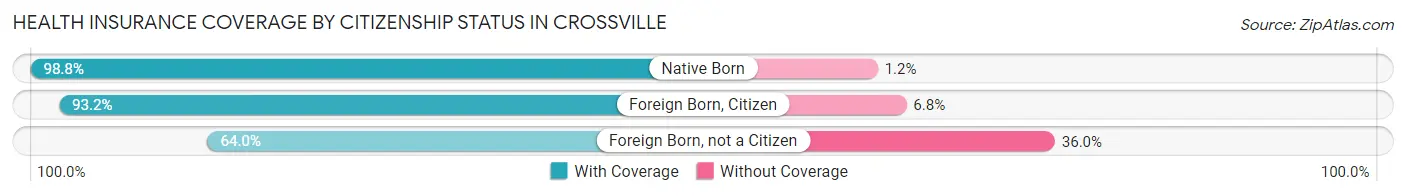
| Citizenship Status | With Coverage | Without Coverage |
| Native Born | 678 (98.8%) | 8 (1.2%) |
| Foreign Born, Citizen | 1,493 (93.2%) | 109 (6.8%) |
| Foreign Born, not a Citizen | 822 (64.0%) | 462 (36.0%) |
Health Insurance Coverage by Household Income in Crossville
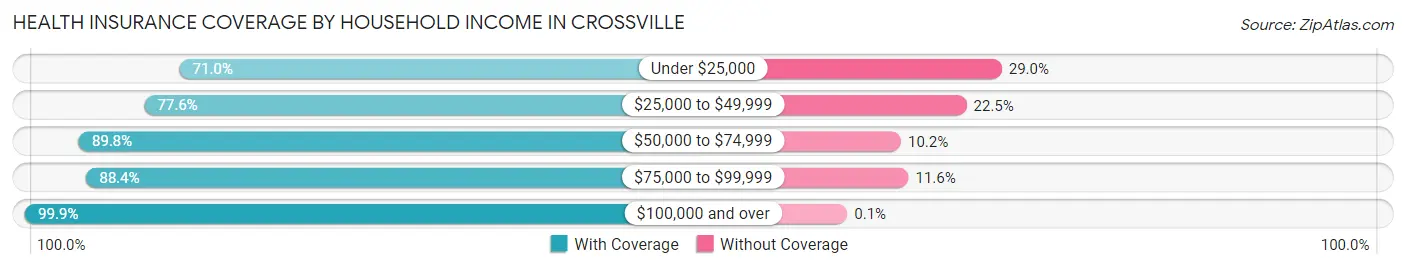
| Household Income | With Coverage | Without Coverage |
| Under $25,000 | 1,566 (71.0%) | 641 (29.0%) |
| $25,000 to $49,999 | 2,259 (77.5%) | 654 (22.5%) |
| $50,000 to $74,999 | 2,163 (89.8%) | 245 (10.2%) |
| $75,000 to $99,999 | 1,780 (88.4%) | 233 (11.6%) |
| $100,000 and over | 2,022 (99.9%) | 2 (0.1%) |
Public vs Private Health Insurance Coverage by Age in Crossville
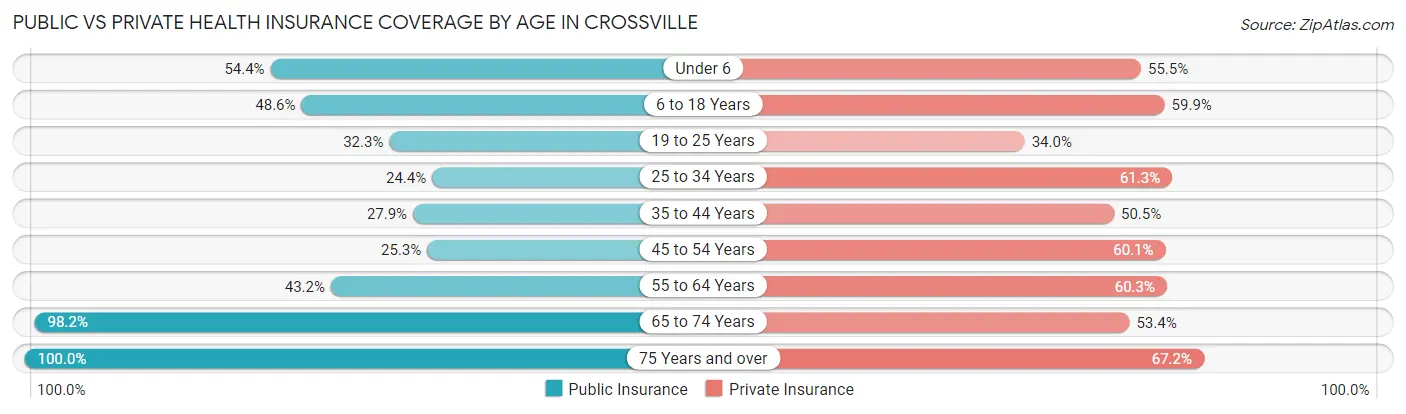
| Age Bracket | Public Insurance | Private Insurance |
| Under 6 | 373 (54.4%) | 381 (55.5%) |
| 6 to 18 Years | 779 (48.6%) | 960 (59.9%) |
| 19 to 25 Years | 415 (32.3%) | 436 (34.0%) |
| 25 to 34 Years | 442 (24.4%) | 1,111 (61.3%) |
| 35 to 44 Years | 337 (27.9%) | 610 (50.5%) |
| 45 to 54 Years | 307 (25.3%) | 729 (60.1%) |
| 55 to 64 Years | 642 (43.2%) | 897 (60.3%) |
| 65 to 74 Years | 1,270 (98.2%) | 691 (53.4%) |
| 75 Years and over | 1,076 (100.0%) | 723 (67.2%) |
| Total | 5,641 (48.4%) | 6,538 (56.1%) |
Disability Status by Sex by Age in Crossville
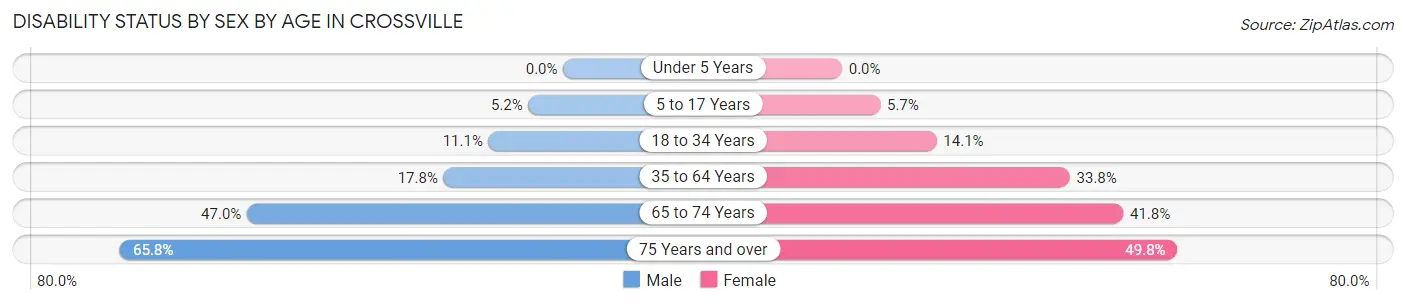
| Age Bracket | Male | Female |
| Under 5 Years | 0 (0.0%) | 0 (0.0%) |
| 5 to 17 Years | 35 (5.2%) | 52 (5.7%) |
| 18 to 34 Years | 189 (11.1%) | 209 (14.1%) |
| 35 to 64 Years | 337 (17.8%) | 680 (33.8%) |
| 65 to 74 Years | 223 (46.9%) | 342 (41.8%) |
| 75 Years and over | 312 (65.8%) | 300 (49.8%) |
Disability Class by Sex by Age in Crossville
Disability Class: Hearing Difficulty
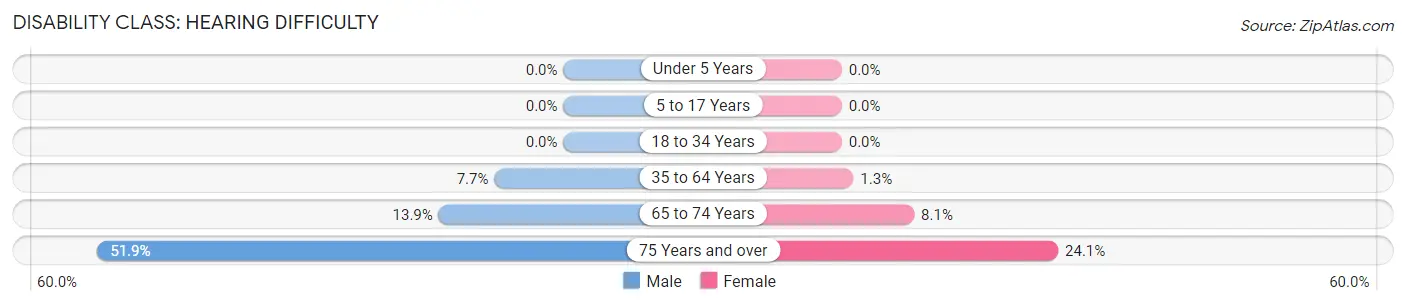
| Age Bracket | Male | Female |
| Under 5 Years | 0 (0.0%) | 0 (0.0%) |
| 5 to 17 Years | 0 (0.0%) | 0 (0.0%) |
| 18 to 34 Years | 0 (0.0%) | 0 (0.0%) |
| 35 to 64 Years | 146 (7.7%) | 26 (1.3%) |
| 65 to 74 Years | 66 (13.9%) | 66 (8.1%) |
| 75 Years and over | 246 (51.9%) | 145 (24.1%) |
Disability Class: Vision Difficulty
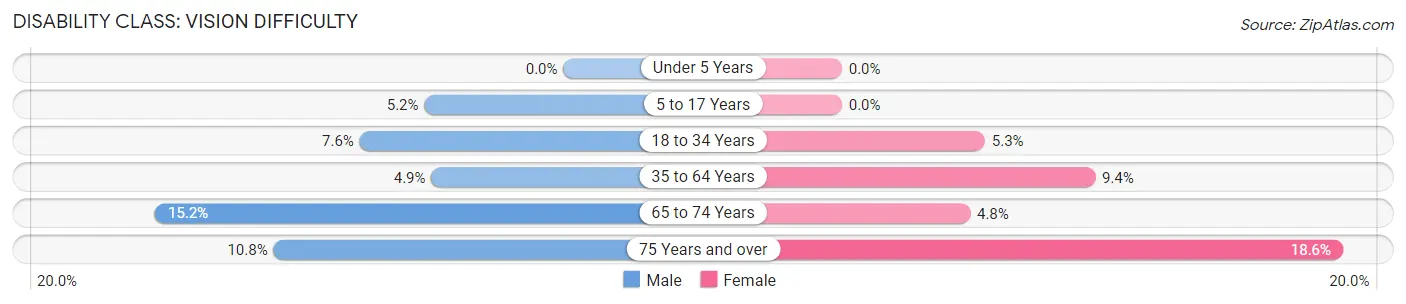
| Age Bracket | Male | Female |
| Under 5 Years | 0 (0.0%) | 0 (0.0%) |
| 5 to 17 Years | 35 (5.2%) | 0 (0.0%) |
| 18 to 34 Years | 129 (7.6%) | 79 (5.3%) |
| 35 to 64 Years | 93 (4.9%) | 189 (9.4%) |
| 65 to 74 Years | 72 (15.2%) | 39 (4.8%) |
| 75 Years and over | 51 (10.8%) | 112 (18.6%) |
Disability Class: Cognitive Difficulty
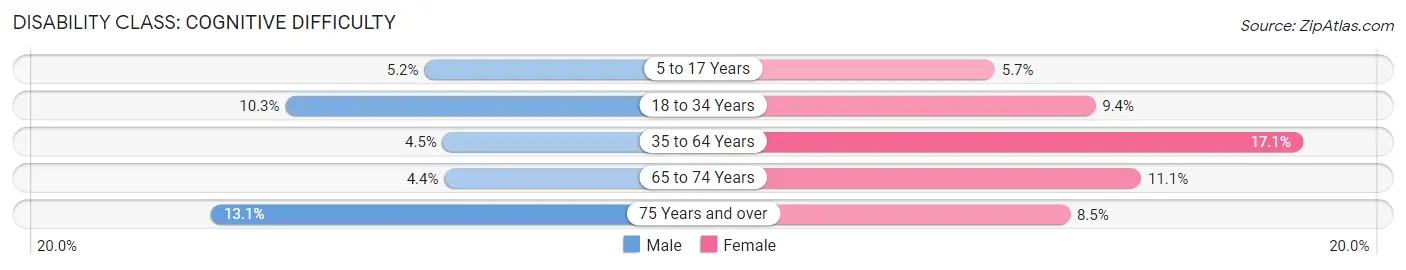
| Age Bracket | Male | Female |
| 5 to 17 Years | 35 (5.2%) | 52 (5.7%) |
| 18 to 34 Years | 176 (10.3%) | 140 (9.4%) |
| 35 to 64 Years | 85 (4.5%) | 344 (17.1%) |
| 65 to 74 Years | 21 (4.4%) | 91 (11.1%) |
| 75 Years and over | 62 (13.1%) | 51 (8.5%) |
Disability Class: Ambulatory Difficulty
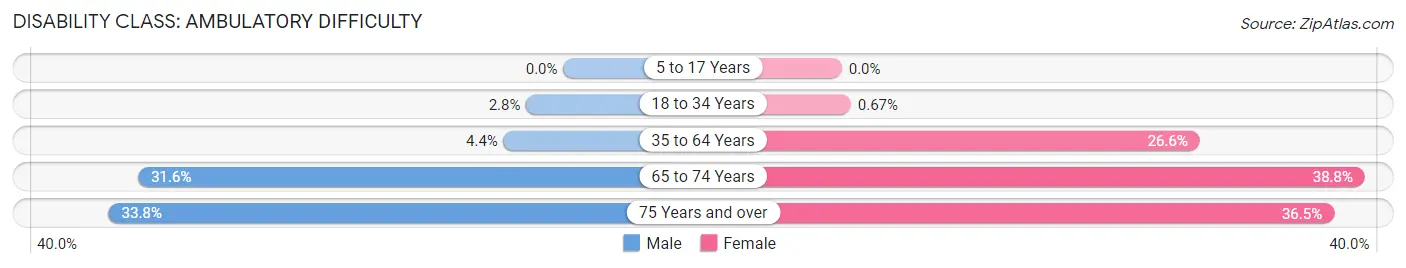
| Age Bracket | Male | Female |
| 5 to 17 Years | 0 (0.0%) | 0 (0.0%) |
| 18 to 34 Years | 47 (2.8%) | 10 (0.7%) |
| 35 to 64 Years | 84 (4.4%) | 534 (26.6%) |
| 65 to 74 Years | 150 (31.6%) | 318 (38.8%) |
| 75 Years and over | 160 (33.8%) | 220 (36.5%) |
Disability Class: Self-Care Difficulty
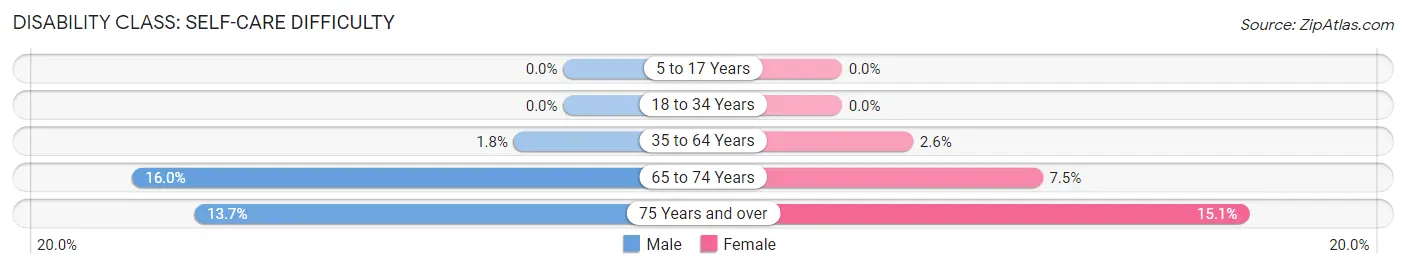
| Age Bracket | Male | Female |
| 5 to 17 Years | 0 (0.0%) | 0 (0.0%) |
| 18 to 34 Years | 0 (0.0%) | 0 (0.0%) |
| 35 to 64 Years | 35 (1.8%) | 53 (2.6%) |
| 65 to 74 Years | 76 (16.0%) | 61 (7.4%) |
| 75 Years and over | 65 (13.7%) | 91 (15.1%) |
Technology Access in Crossville
Computing Device Access in Crossville
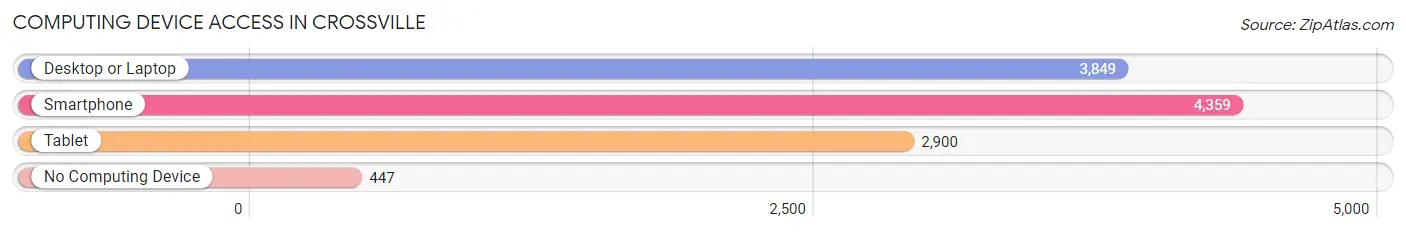
| Device Type | # Households | % Households |
| Desktop or Laptop | 3,849 | 72.3% |
| Smartphone | 4,359 | 81.9% |
| Tablet | 2,900 | 54.5% |
| No Computing Device | 447 | 8.4% |
| Total | 5,323 | 100.0% |
Internet Access in Crossville
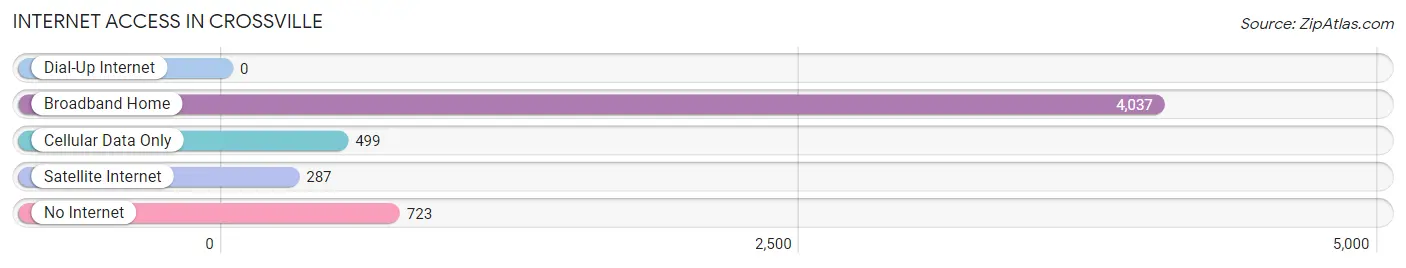
| Internet Type | # Households | % Households |
| Dial-Up Internet | 0 | 0.0% |
| Broadband Home | 4,037 | 75.8% |
| Cellular Data Only | 499 | 9.4% |
| Satellite Internet | 287 | 5.4% |
| No Internet | 723 | 13.6% |
| Total | 5,323 | 100.0% |
Crossville Summary
Crossville, Tennessee is a city located in Cumberland County, Tennessee. It is the county seat of Cumberland County and is located in the heart of the Cumberland Plateau. The city is situated at the intersection of U.S. Route 70 and State Route 101, approximately 85 miles east of Nashville. The population of Crossville was 10,795 as of the 2010 census.
History
Crossville was founded in 1856 by William P. Cross, a former Confederate soldier. The city was originally known as "Crossville Depot" due to its location on the East Tennessee and Georgia Railroad. The city was officially incorporated in 1875 and was named after its founder.
Crossville has a long and rich history. During the Civil War, the city was the site of a major battle between Union and Confederate forces. The Battle of Crossville was fought on December 7, 1862 and resulted in a Confederate victory.
In the late 19th century, Crossville was a major center for the timber industry. The city was home to several sawmills and lumber companies, which provided employment for many of the city's residents.
Geography
Crossville is located in the Cumberland Plateau region of Tennessee. The city is situated at the intersection of U.S. Route 70 and State Route 101, approximately 85 miles east of Nashville. The city is surrounded by the Cumberland Mountains to the north and the Great Smoky Mountains to the south.
The city has a total area of 10.3 square miles, all of which is land. The terrain is mostly hilly and the elevation is 1,068 feet above sea level. The climate is humid subtropical, with hot summers and mild winters.
Economy
Crossville's economy is largely based on manufacturing and tourism. The city is home to several manufacturing companies, including Crossville Ceramics, which produces ceramic tile and other products. The city is also home to several tourist attractions, including the Cumberland County Playhouse, the Cumberland County Museum, and the Crossville Raceway.
Crossville is also home to several retail stores, restaurants, and other businesses. The city is served by the Crossville-Cumberland County Airport, which offers daily flights to Nashville and other destinations.
Demographics
As of the 2010 census, the population of Crossville was 10,795. The racial makeup of the city was 92.3% White, 4.2% African American, 0.3% Native American, 0.7% Asian, 0.1% Pacific Islander, 1.2% from other races, and 1.2% from two or more races. Hispanic or Latino of any race were 2.7% of the population.
The median income for a household in Crossville was $32,917, and the median income for a family was $41,945. The per capita income for the city was $19,945. About 14.2% of families and 17.7% of the population were below the poverty line, including 25.2% of those under age 18 and 11.2% of those age 65 or over.
Crossville is a small city with a rich history and a diverse economy. The city is home to several manufacturing companies, tourist attractions, and other businesses. The city has a diverse population and a strong sense of community. Crossville is a great place to live, work, and visit.
Common Questions
What is Per Capita Income in Crossville?
Per Capita income in Crossville is $26,240.
What is the Median Family Income in Crossville?
Median Family Income in Crossville is $62,279.
What is the Median Household income in Crossville?
Median Household Income in Crossville is $44,375.
What is Income or Wage Gap in Crossville?
Income or Wage Gap in Crossville is 36.9%.
Women in Crossville earn 63.1 cents for every dollar earned by a man.
What is Family Income Deficit in Crossville?
Family Income Deficit in Crossville is $8,897.
Families that are below poverty line in Crossville earn $8,897 less on average than the poverty threshold level.
What is Inequality or Gini Index in Crossville?
Inequality or Gini Index in Crossville is 0.46.
What is the Total Population of Crossville?
Total Population of Crossville is 12,099.
What is the Total Male Population of Crossville?
Total Male Population of Crossville is 5,650.
What is the Total Female Population of Crossville?
Total Female Population of Crossville is 6,449.
What is the Ratio of Males per 100 Females in Crossville?
There are 87.61 Males per 100 Females in Crossville.
What is the Ratio of Females per 100 Males in Crossville?
There are 114.14 Females per 100 Males in Crossville.
What is the Median Population Age in Crossville?
Median Population Age in Crossville is 40.3 Years.
What is the Average Family Size in Crossville
Average Family Size in Crossville is 3.0 People.
What is the Average Household Size in Crossville
Average Household Size in Crossville is 2.2 People.
How Large is the Labor Force in Crossville?
There are 5,311 People in the Labor Forcein in Crossville.
What is the Percentage of People in the Labor Force in Crossville?
52.4% of People are in the Labor Force in Crossville.
What is the Unemployment Rate in Crossville?
Unemployment Rate in Crossville is 10.6%.