Lenoir City, TN Map & Demographics
Lenoir City Map
Lenoir City Overview
$25,273
PER CAPITA INCOME
$61,171
AVG FAMILY INCOME
$53,100
AVG HOUSEHOLD INCOME
40.0%
WAGE / INCOME GAP [ % ]
60.0¢/ $1
WAGE / INCOME GAP [ $ ]
0.42
INEQUALITY / GINI INDEX
10,291
TOTAL POPULATION
4,804
MALE POPULATION
5,487
FEMALE POPULATION
87.55
MALES / 100 FEMALES
114.22
FEMALES / 100 MALES
35.9
MEDIAN AGE
3.4
AVG FAMILY SIZE
2.7
AVG HOUSEHOLD SIZE
4,745
LABOR FORCE [ PEOPLE ]
60.5%
PERCENT IN LABOR FORCE
4.0%
UNEMPLOYMENT RATE
Lenoir City Area Codes
Income in Lenoir City
Income Overview in Lenoir City
Per Capita Income in Lenoir City is $25,273, while median incomes of families and households are $61,171 and $53,100 respectively.
| Characteristic | Number | Measure |
| Per Capita Income | 10,291 | $25,273 |
| Median Family Income | 2,437 | $61,171 |
| Mean Family Income | 2,437 | $70,915 |
| Median Household Income | 3,826 | $53,100 |
| Mean Household Income | 3,826 | $62,973 |
| Income Deficit | 2,437 | $0 |
| Wage / Income Gap (%) | 10,291 | 40.03% |
| Wage / Income Gap ($) | 10,291 | 59.97¢ per $1 |
| Gini / Inequality Index | 10,291 | 0.42 |
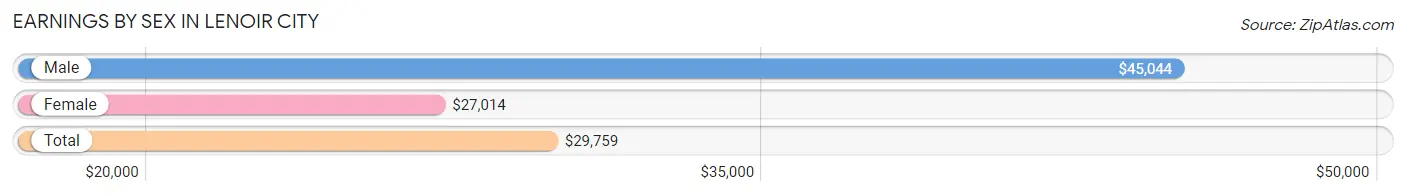
Earnings by Sex in Lenoir City
Average Earnings in Lenoir City are $29,759, $45,044 for men and $27,014 for women, a difference of 40.0%.
| Sex | Number | Average Earnings |
| Male | 2,556 (52.5%) | $45,044 |
| Female | 2,308 (47.4%) | $27,014 |
| Total | 4,864 (100.0%) | $29,759 |
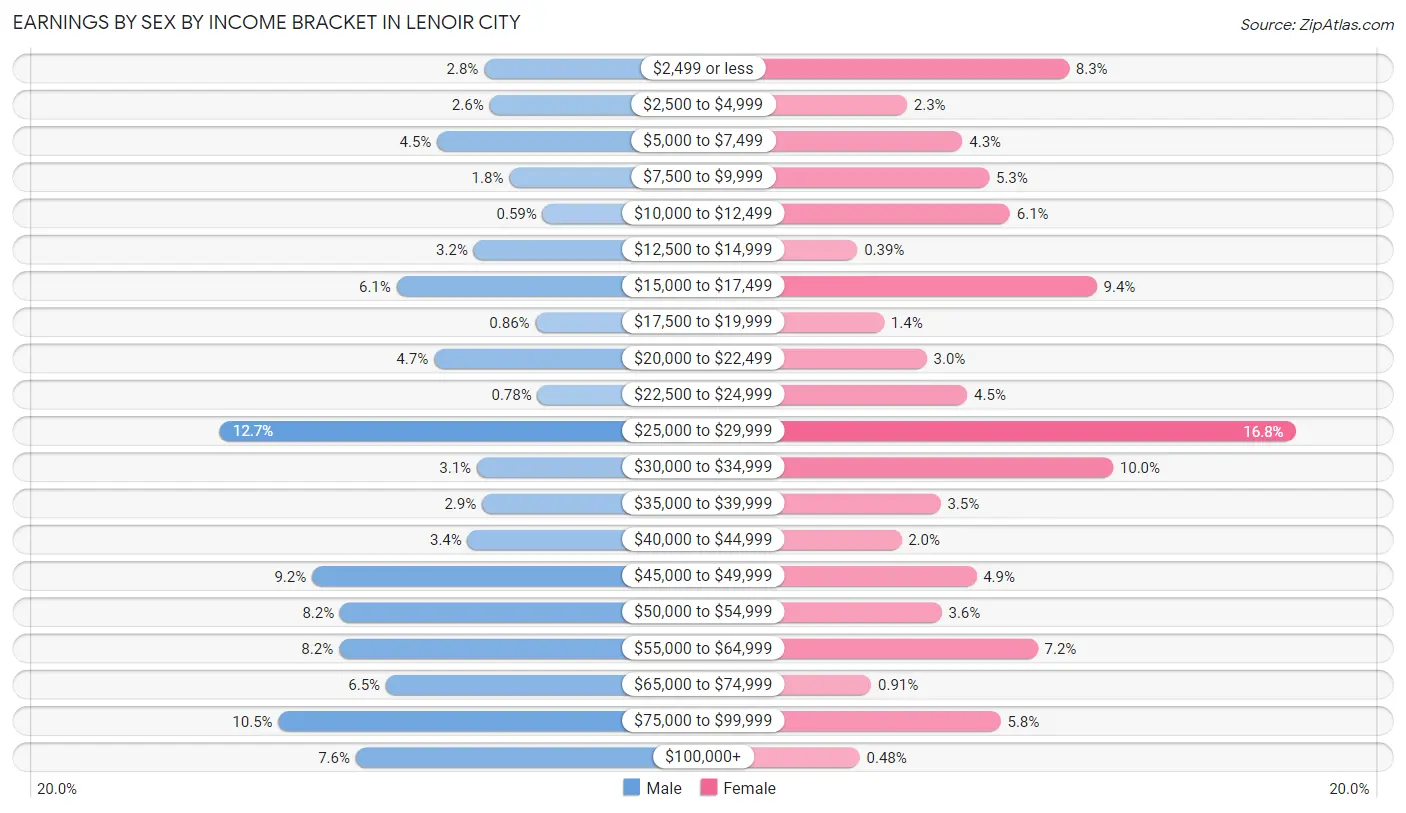
Earnings by Sex by Income Bracket in Lenoir City
The most common earnings brackets in Lenoir City are $25,000 to $29,999 for men (324 | 12.7%) and $25,000 to $29,999 for women (388 | 16.8%).
| Income | Male | Female |
| $2,499 or less | 71 (2.8%) | 192 (8.3%) |
| $2,500 to $4,999 | 66 (2.6%) | 52 (2.2%) |
| $5,000 to $7,499 | 116 (4.5%) | 100 (4.3%) |
| $7,500 to $9,999 | 47 (1.8%) | 123 (5.3%) |
| $10,000 to $12,499 | 15 (0.6%) | 141 (6.1%) |
| $12,500 to $14,999 | 81 (3.2%) | 9 (0.4%) |
| $15,000 to $17,499 | 155 (6.1%) | 216 (9.4%) |
| $17,500 to $19,999 | 22 (0.9%) | 32 (1.4%) |
| $20,000 to $22,499 | 119 (4.7%) | 69 (3.0%) |
| $22,500 to $24,999 | 20 (0.8%) | 104 (4.5%) |
| $25,000 to $29,999 | 324 (12.7%) | 388 (16.8%) |
| $30,000 to $34,999 | 78 (3.0%) | 230 (10.0%) |
| $35,000 to $39,999 | 73 (2.9%) | 81 (3.5%) |
| $40,000 to $44,999 | 87 (3.4%) | 47 (2.0%) |
| $45,000 to $49,999 | 236 (9.2%) | 112 (4.9%) |
| $50,000 to $54,999 | 209 (8.2%) | 82 (3.5%) |
| $55,000 to $64,999 | 210 (8.2%) | 165 (7.1%) |
| $65,000 to $74,999 | 165 (6.5%) | 21 (0.9%) |
| $75,000 to $99,999 | 268 (10.5%) | 133 (5.8%) |
| $100,000+ | 194 (7.6%) | 11 (0.5%) |
| Total | 2,556 (100.0%) | 2,308 (100.0%) |
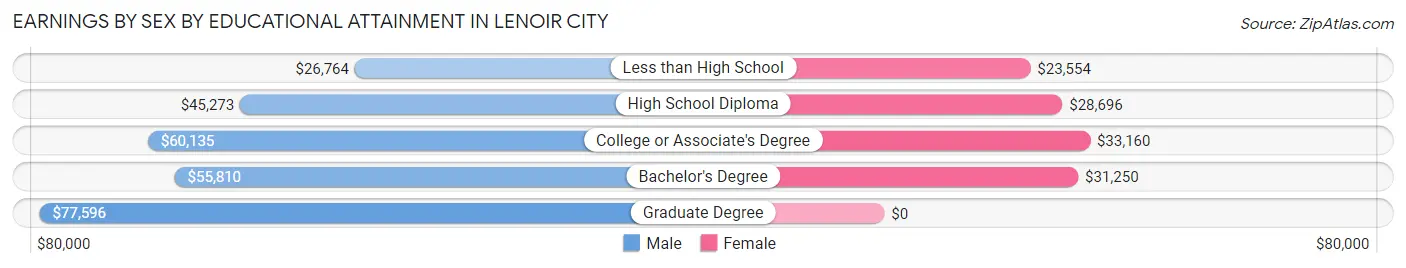
Earnings by Sex by Educational Attainment in Lenoir City
Average earnings in Lenoir City are $47,128 for men and $29,343 for women, a difference of 37.7%. Men with an educational attainment of graduate degree enjoy the highest average annual earnings of $77,596, while those with less than high school education earn the least with $26,764. Women with an educational attainment of college or associate's degree earn the most with the average annual earnings of $33,160, while those with less than high school education have the smallest earnings of $23,554.
| Educational Attainment | Male Income | Female Income |
| Less than High School | $26,764 | $23,554 |
| High School Diploma | $45,273 | $28,696 |
| College or Associate's Degree | $60,135 | $33,160 |
| Bachelor's Degree | $55,810 | $31,250 |
| Graduate Degree | $77,596 | $0 |
| Total | $47,128 | $29,343 |
Family Income in Lenoir City
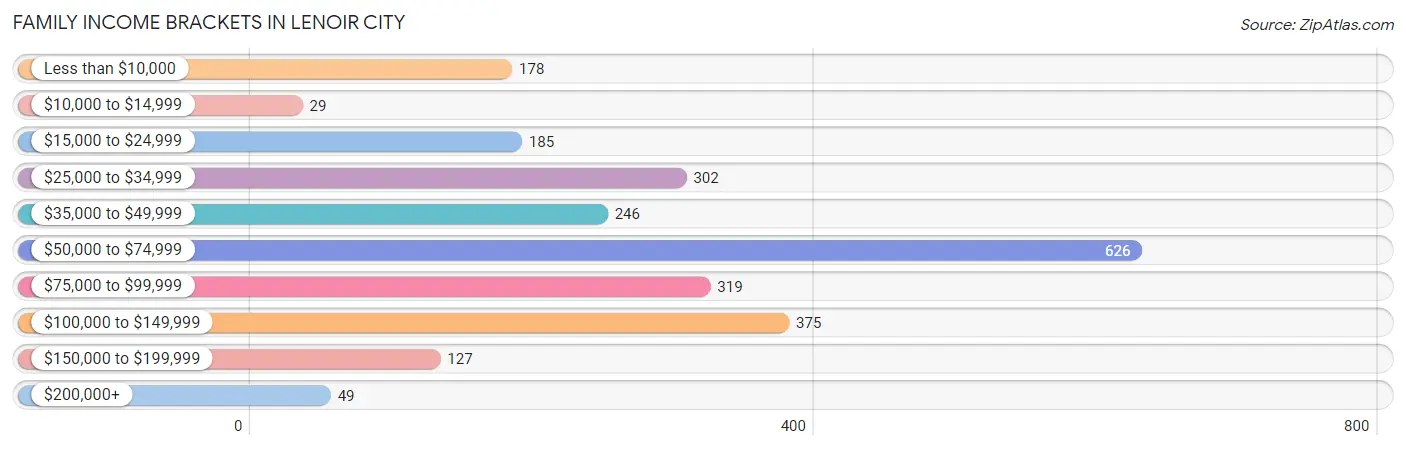
Family Income Brackets in Lenoir City
According to the Lenoir City family income data, there are 626 families falling into the $50,000 to $74,999 income range, which is the most common income bracket and makes up 25.7% of all families. Conversely, the $10,000 to $14,999 income bracket is the least frequent group with only 29 families (1.2%) belonging to this category.
| Income Bracket | # Families | % Families |
| Less than $10,000 | 178 | 7.3% |
| $10,000 to $14,999 | 29 | 1.2% |
| $15,000 to $24,999 | 185 | 7.6% |
| $25,000 to $34,999 | 302 | 12.4% |
| $35,000 to $49,999 | 246 | 10.1% |
| $50,000 to $74,999 | 626 | 25.7% |
| $75,000 to $99,999 | 319 | 13.1% |
| $100,000 to $149,999 | 375 | 15.4% |
| $150,000 to $199,999 | 127 | 5.2% |
| $200,000+ | 49 | 2.0% |
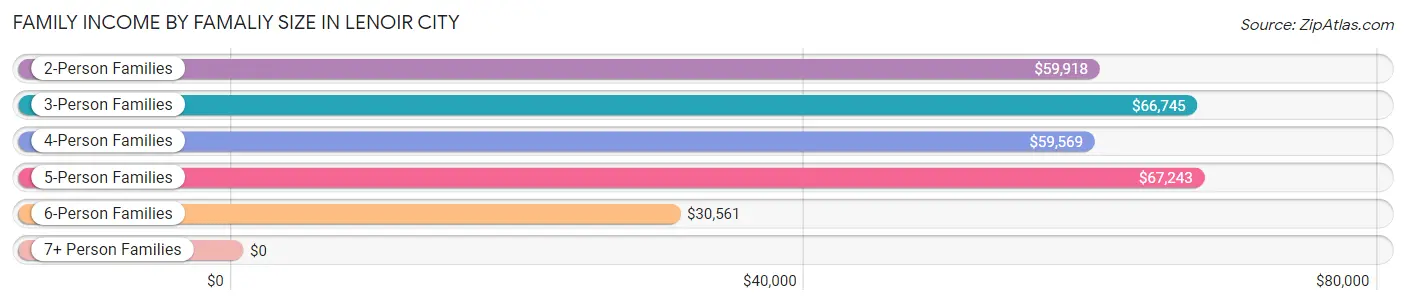
Family Income by Famaliy Size in Lenoir City
5-person families (201 | 8.3%) account for the highest median family income in Lenoir City with $67,243 per family, while 2-person families (1,223 | 50.2%) have the highest median income of $29,959 per family member.
| Income Bracket | # Families | Median Income |
| 2-Person Families | 1,223 (50.2%) | $59,918 |
| 3-Person Families | 578 (23.7%) | $66,745 |
| 4-Person Families | 258 (10.6%) | $59,569 |
| 5-Person Families | 201 (8.3%) | $67,243 |
| 6-Person Families | 118 (4.8%) | $30,561 |
| 7+ Person Families | 59 (2.4%) | $0 |
| Total | 2,437 (100.0%) | $61,171 |
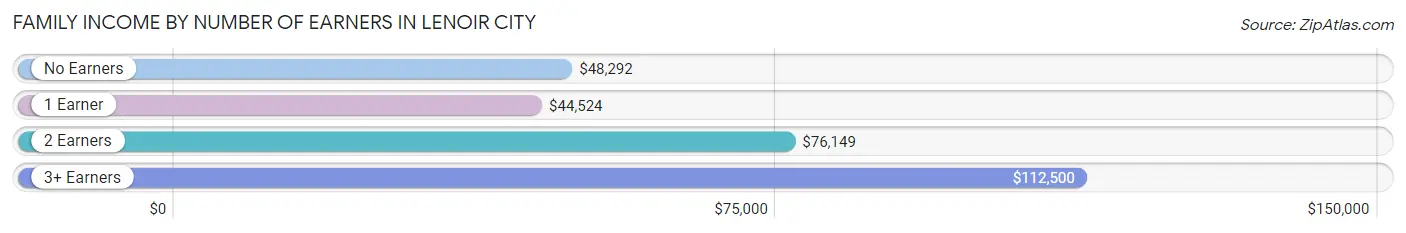
Family Income by Number of Earners in Lenoir City
The median family income in Lenoir City is $61,171, with families comprising 3+ earners (174) having the highest median family income of $112,500, while families with 1 earner (882) have the lowest median family income of $44,524, accounting for 7.1% and 36.2% of families, respectively.
| Number of Earners | # Families | Median Income |
| No Earners | 421 (17.3%) | $48,292 |
| 1 Earner | 882 (36.2%) | $44,524 |
| 2 Earners | 960 (39.4%) | $76,149 |
| 3+ Earners | 174 (7.1%) | $112,500 |
| Total | 2,437 (100.0%) | $61,171 |
Household Income in Lenoir City
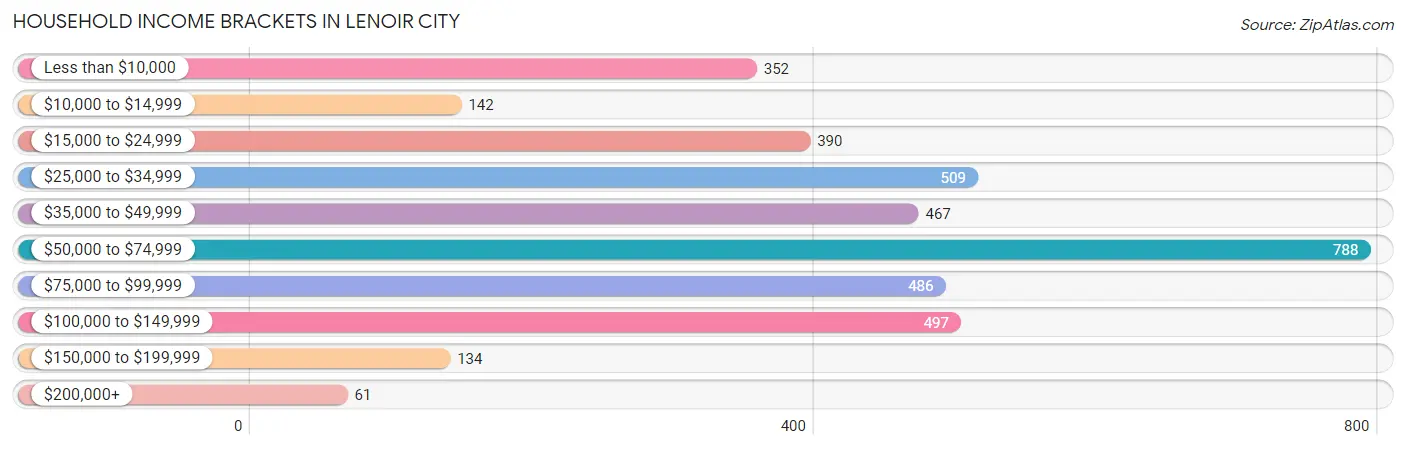
Household Income Brackets in Lenoir City
With 788 households falling in the category, the $50,000 to $74,999 income range is the most frequent in Lenoir City, accounting for 20.6% of all households. In contrast, only 61 households (1.6%) fall into the $200,000+ income bracket, making it the least populous group.
| Income Bracket | # Households | % Households |
| Less than $10,000 | 352 | 9.2% |
| $10,000 to $14,999 | 142 | 3.7% |
| $15,000 to $24,999 | 390 | 10.2% |
| $25,000 to $34,999 | 509 | 13.3% |
| $35,000 to $49,999 | 467 | 12.2% |
| $50,000 to $74,999 | 788 | 20.6% |
| $75,000 to $99,999 | 486 | 12.7% |
| $100,000 to $149,999 | 497 | 13.0% |
| $150,000 to $199,999 | 134 | 3.5% |
| $200,000+ | 61 | 1.6% |
Household Income by Householder Age in Lenoir City
The median household income in Lenoir City is $53,100, with the highest median household income of $61,600 found in the 25 to 44 years age bracket for the primary householder. A total of 1,261 households (33.0%) fall into this category. Meanwhile, the 15 to 24 years age bracket for the primary householder has the lowest median household income of $0, with 95 households (2.5%) in this group.
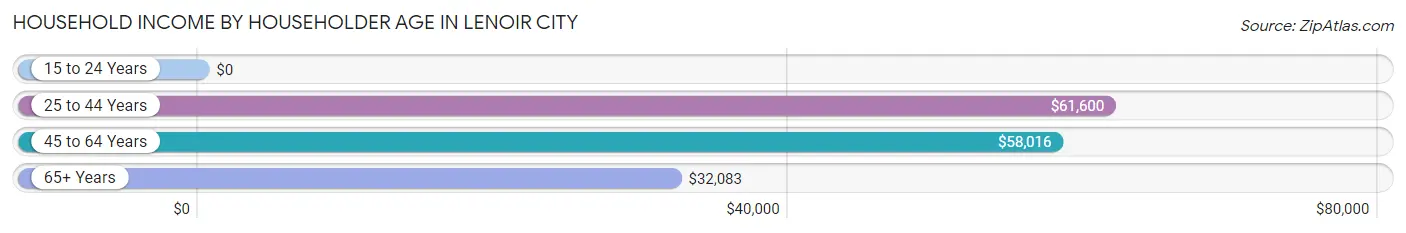
| Income Bracket | # Households | Median Income |
| 15 to 24 Years | 95 (2.5%) | $0 |
| 25 to 44 Years | 1,261 (33.0%) | $61,600 |
| 45 to 64 Years | 1,167 (30.5%) | $58,016 |
| 65+ Years | 1,303 (34.1%) | $32,083 |
| Total | 3,826 (100.0%) | $53,100 |
Poverty in Lenoir City
Income Below Poverty by Sex and Age in Lenoir City
With 14.8% poverty level for males and 20.6% for females among the residents of Lenoir City, 55 to 64 year old males and 15 year old females are the most vulnerable to poverty, with 160 males (39.6%) and 58 females (36.5%) in their respective age groups living below the poverty level.
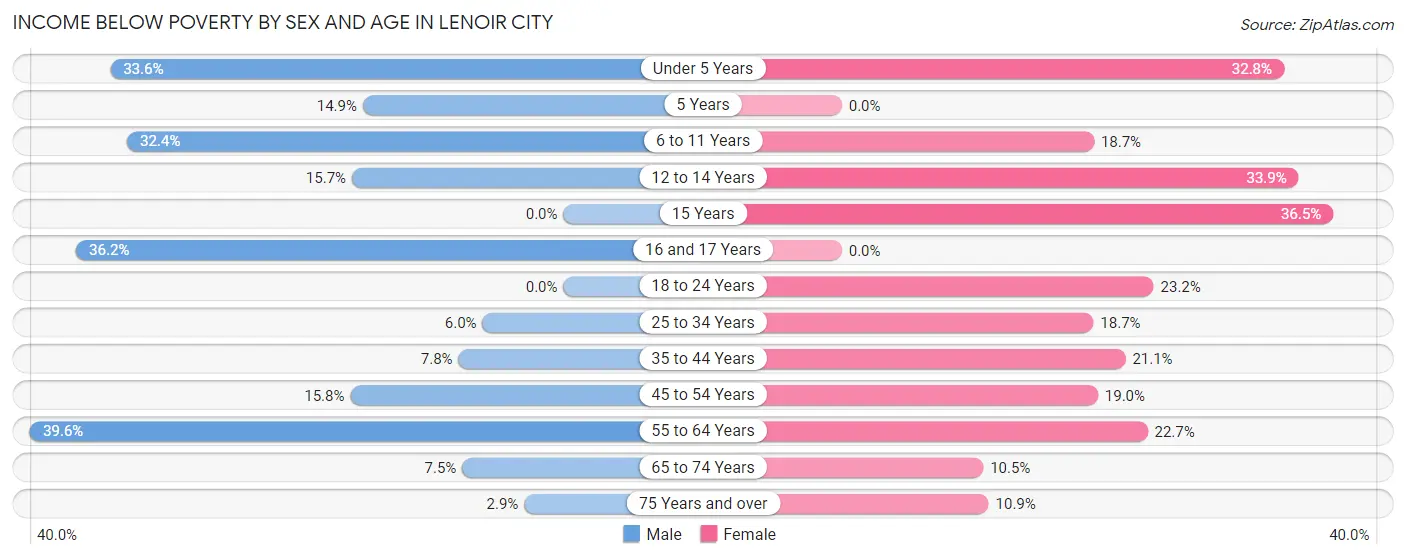
| Age Bracket | Male | Female |
| Under 5 Years | 144 (33.6%) | 169 (32.8%) |
| 5 Years | 14 (14.9%) | 0 (0.0%) |
| 6 to 11 Years | 114 (32.4%) | 79 (18.7%) |
| 12 to 14 Years | 27 (15.7%) | 78 (33.9%) |
| 15 Years | 0 (0.0%) | 58 (36.5%) |
| 16 and 17 Years | 34 (36.2%) | 0 (0.0%) |
| 18 to 24 Years | 0 (0.0%) | 138 (23.2%) |
| 25 to 34 Years | 51 (6.0%) | 88 (18.7%) |
| 35 to 44 Years | 48 (7.8%) | 135 (21.1%) |
| 45 to 54 Years | 81 (15.8%) | 115 (19.0%) |
| 55 to 64 Years | 160 (39.6%) | 148 (22.7%) |
| 65 to 74 Years | 31 (7.5%) | 71 (10.5%) |
| 75 Years and over | 9 (2.9%) | 45 (10.9%) |
| Total | 713 (14.8%) | 1,124 (20.6%) |
Income Above Poverty by Sex and Age in Lenoir City
According to the poverty statistics in Lenoir City, males aged 15 years and females aged 5 years are the age groups that are most secure financially, with 100.0% of males and 100.0% of females in these age groups living above the poverty line.
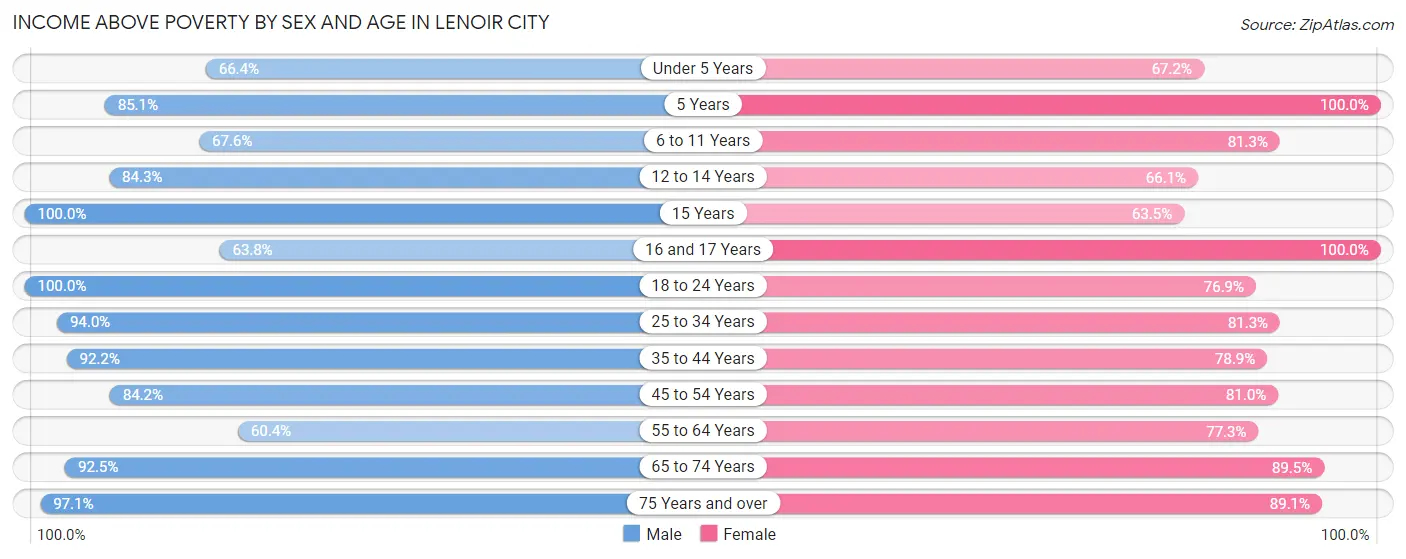
| Age Bracket | Male | Female |
| Under 5 Years | 284 (66.4%) | 346 (67.2%) |
| 5 Years | 80 (85.1%) | 4 (100.0%) |
| 6 to 11 Years | 238 (67.6%) | 343 (81.3%) |
| 12 to 14 Years | 145 (84.3%) | 152 (66.1%) |
| 15 Years | 48 (100.0%) | 101 (63.5%) |
| 16 and 17 Years | 60 (63.8%) | 79 (100.0%) |
| 18 to 24 Years | 513 (100.0%) | 458 (76.8%) |
| 25 to 34 Years | 798 (94.0%) | 383 (81.3%) |
| 35 to 44 Years | 568 (92.2%) | 506 (78.9%) |
| 45 to 54 Years | 431 (84.2%) | 490 (81.0%) |
| 55 to 64 Years | 244 (60.4%) | 504 (77.3%) |
| 65 to 74 Years | 382 (92.5%) | 605 (89.5%) |
| 75 Years and over | 300 (97.1%) | 368 (89.1%) |
| Total | 4,091 (85.2%) | 4,339 (79.4%) |
Income Below Poverty Among Married-Couple Families in Lenoir City
The poverty statistics for married-couple families in Lenoir City show that 14.3% or 228 of the total 1,596 families live below the poverty line. Families with 5 or more children have the highest poverty rate of 100.0%, comprising of 26 families. On the other hand, families with 1 or 2 children have the lowest poverty rate of 0.0%, which includes 0 families.
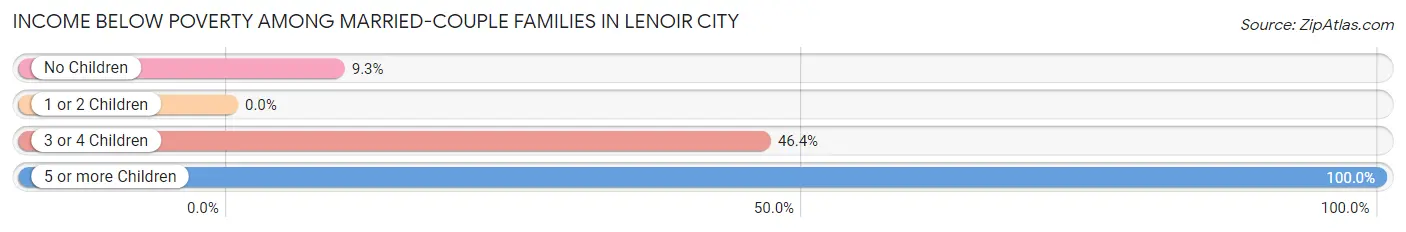
| Children | Above Poverty | Below Poverty |
| No Children | 781 (90.7%) | 80 (9.3%) |
| 1 or 2 Children | 446 (100.0%) | 0 (0.0%) |
| 3 or 4 Children | 141 (53.6%) | 122 (46.4%) |
| 5 or more Children | 0 (0.0%) | 26 (100.0%) |
| Total | 1,368 (85.7%) | 228 (14.3%) |
Income Below Poverty Among Single-Parent Households in Lenoir City
According to the poverty data in Lenoir City, 5.6% or 15 single-father households and 22.1% or 127 single-mother households are living below the poverty line. Among single-father households, those with 1 or 2 children have the highest poverty rate, with 15 households (11.5%) experiencing poverty. Likewise, among single-mother households, those with 1 or 2 children have the highest poverty rate, with 127 households (56.2%) falling below the poverty line.
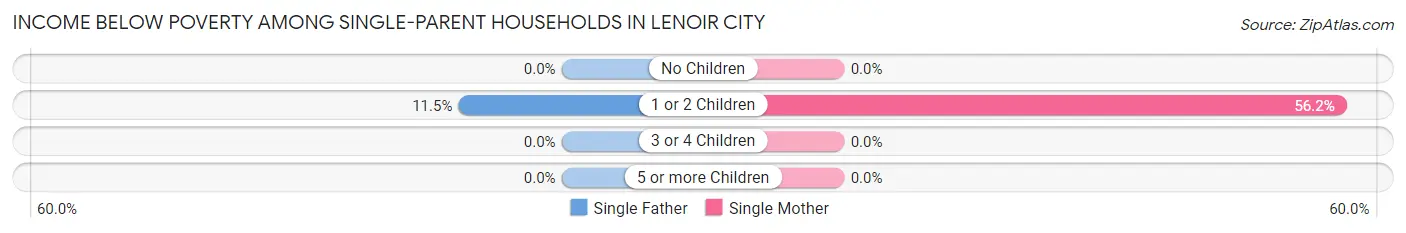
| Children | Single Father | Single Mother |
| No Children | 0 (0.0%) | 0 (0.0%) |
| 1 or 2 Children | 15 (11.5%) | 127 (56.2%) |
| 3 or 4 Children | 0 (0.0%) | 0 (0.0%) |
| 5 or more Children | 0 (0.0%) | 0 (0.0%) |
| Total | 15 (5.6%) | 127 (22.1%) |
Income Below Poverty Among Married-Couple vs Single-Parent Households in Lenoir City
The poverty data for Lenoir City shows that 228 of the married-couple family households (14.3%) and 142 of the single-parent households (16.9%) are living below the poverty level. Within the married-couple family households, those with 5 or more children have the highest poverty rate, with 26 households (100.0%) falling below the poverty line. Among the single-parent households, those with 1 or 2 children have the highest poverty rate, with 142 household (39.9%) living below poverty.
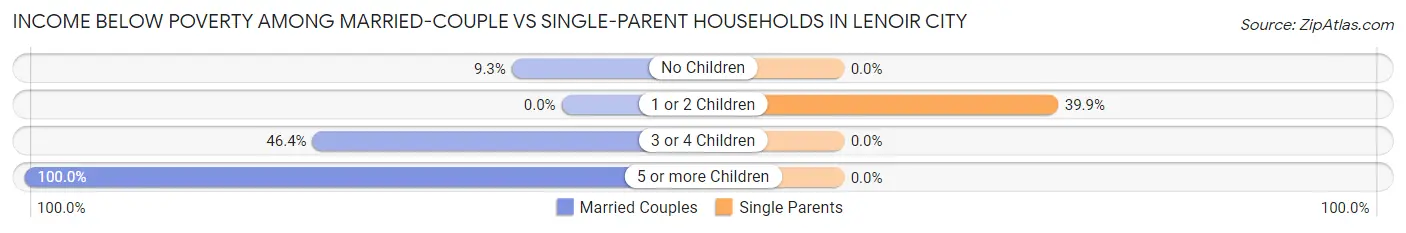
| Children | Married-Couple Families | Single-Parent Households |
| No Children | 80 (9.3%) | 0 (0.0%) |
| 1 or 2 Children | 0 (0.0%) | 142 (39.9%) |
| 3 or 4 Children | 122 (46.4%) | 0 (0.0%) |
| 5 or more Children | 26 (100.0%) | 0 (0.0%) |
| Total | 228 (14.3%) | 142 (16.9%) |
Race in Lenoir City
The most populous races in Lenoir City are White / Caucasian (8,927 | 86.8%), Hispanic or Latino (2,086 | 20.3%), and Two or more Races (935 | 9.1%).
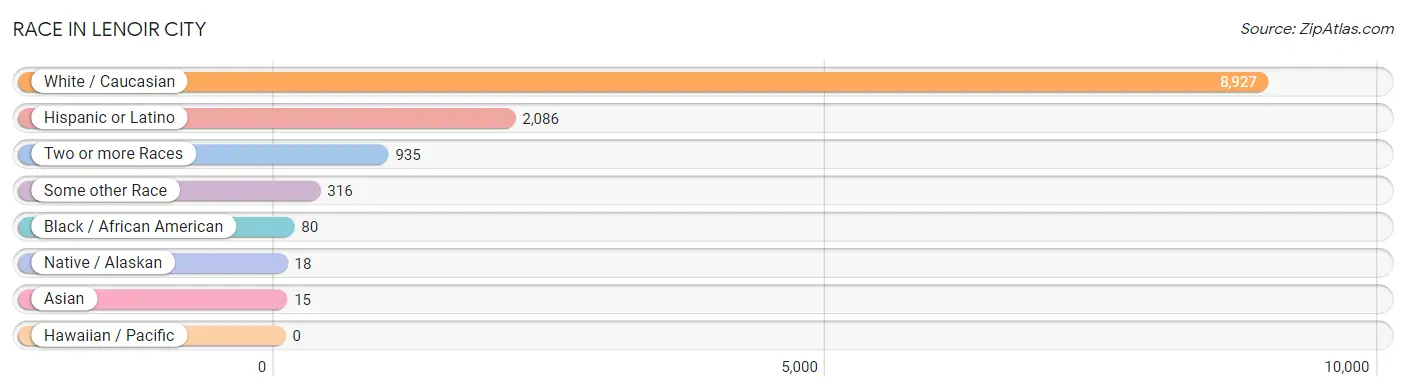
| Race | # Population | % Population |
| Asian | 15 | 0.2% |
| Black / African American | 80 | 0.8% |
| Hawaiian / Pacific | 0 | 0.0% |
| Hispanic or Latino | 2,086 | 20.3% |
| Native / Alaskan | 18 | 0.2% |
| White / Caucasian | 8,927 | 86.8% |
| Two or more Races | 935 | 9.1% |
| Some other Race | 316 | 3.1% |
| Total | 10,291 | 100.0% |
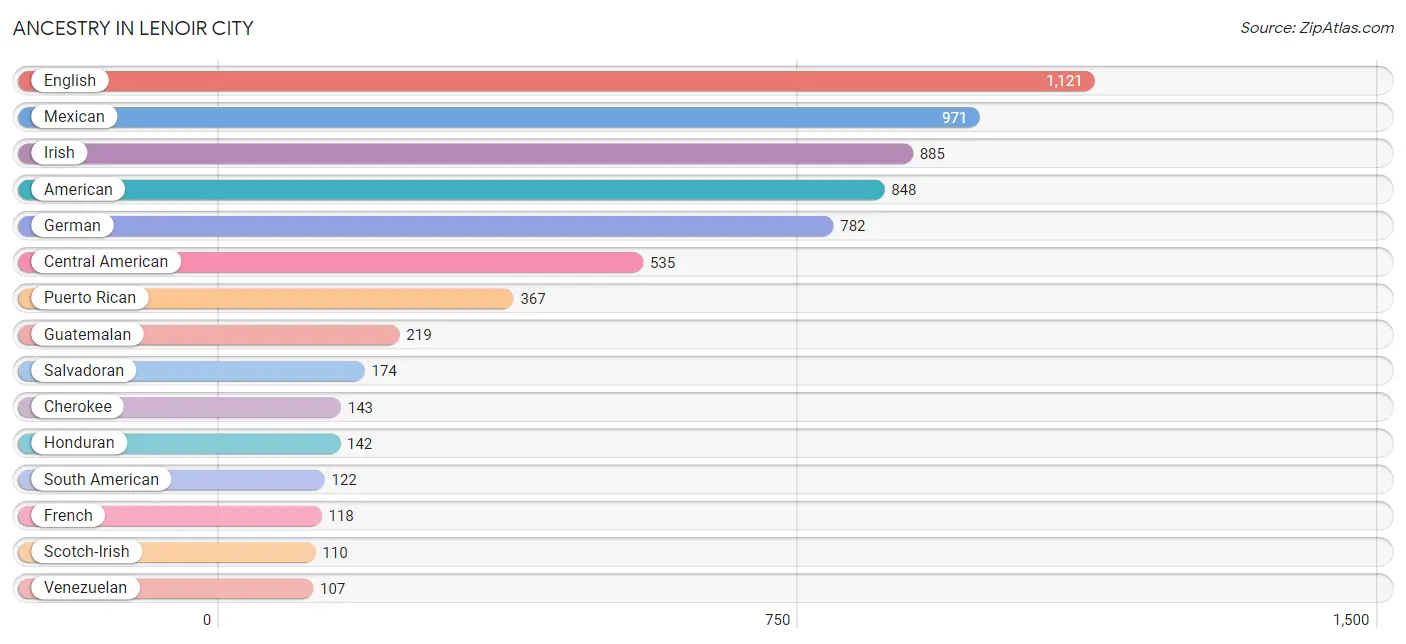
Ancestry in Lenoir City
The most populous ancestries reported in Lenoir City are English (1,121 | 10.9%), Mexican (971 | 9.4%), Irish (885 | 8.6%), American (848 | 8.2%), and German (782 | 7.6%), together accounting for 44.8% of all Lenoir City residents.
| Ancestry | # Population | % Population |
| American | 848 | 8.2% |
| Arab | 7 | 0.1% |
| British | 17 | 0.2% |
| Central American | 535 | 5.2% |
| Cherokee | 143 | 1.4% |
| Colombian | 15 | 0.2% |
| Croatian | 50 | 0.5% |
| Czech | 41 | 0.4% |
| Dutch | 15 | 0.2% |
| Eastern European | 51 | 0.5% |
| English | 1,121 | 10.9% |
| European | 16 | 0.2% |
| French | 118 | 1.1% |
| French Canadian | 10 | 0.1% |
| German | 782 | 7.6% |
| Greek | 20 | 0.2% |
| Guatemalan | 219 | 2.1% |
| Honduran | 142 | 1.4% |
| Hungarian | 12 | 0.1% |
| Irish | 885 | 8.6% |
| Italian | 80 | 0.8% |
| Korean | 15 | 0.2% |
| Mexican | 971 | 9.4% |
| Northern European | 11 | 0.1% |
| Norwegian | 27 | 0.3% |
| Polish | 69 | 0.7% |
| Pueblo | 13 | 0.1% |
| Puerto Rican | 367 | 3.6% |
| Romanian | 59 | 0.6% |
| Salvadoran | 174 | 1.7% |
| Scotch-Irish | 110 | 1.1% |
| Scottish | 87 | 0.9% |
| Slavic | 14 | 0.1% |
| South American | 122 | 1.2% |
| Spanish | 91 | 0.9% |
| Swedish | 10 | 0.1% |
| Swiss | 25 | 0.2% |
| Thai | 15 | 0.2% |
| Venezuelan | 107 | 1.0% |
| Welsh | 9 | 0.1% | View All 40 Rows |
Immigrants in Lenoir City
The most numerous immigrant groups reported in Lenoir City came from Latin America (766 | 7.4%), Central America (659 | 6.4%), Mexico (302 | 2.9%), Guatemala (182 | 1.8%), and El Salvador (129 | 1.3%), together accounting for 19.8% of all Lenoir City residents.
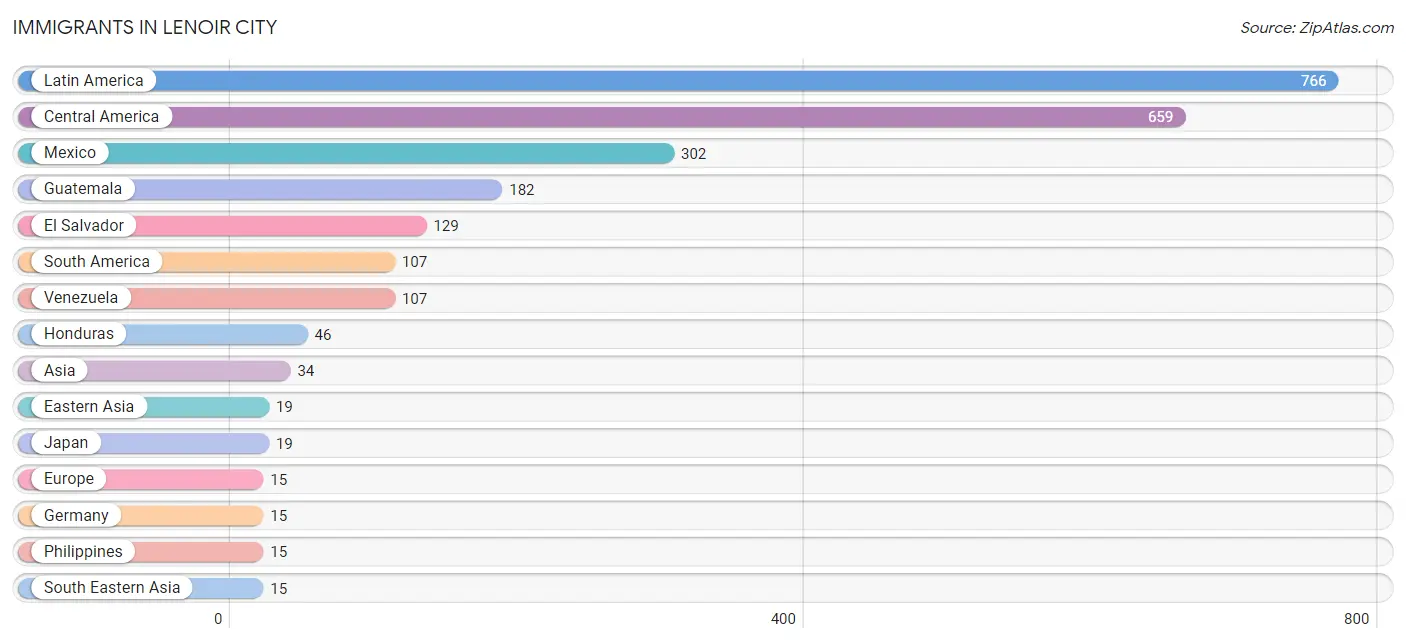
| Immigration Origin | # Population | % Population |
| Asia | 34 | 0.3% |
| Central America | 659 | 6.4% |
| Eastern Asia | 19 | 0.2% |
| El Salvador | 129 | 1.3% |
| Europe | 15 | 0.2% |
| Germany | 15 | 0.2% |
| Guatemala | 182 | 1.8% |
| Honduras | 46 | 0.4% |
| Japan | 19 | 0.2% |
| Latin America | 766 | 7.4% |
| Mexico | 302 | 2.9% |
| Philippines | 15 | 0.2% |
| South America | 107 | 1.0% |
| South Eastern Asia | 15 | 0.2% |
| Venezuela | 107 | 1.0% |
| Western Europe | 15 | 0.2% | View All 16 Rows |
Sex and Age in Lenoir City
Sex and Age in Lenoir City
The most populous age groups in Lenoir City are 25 to 29 Years (554 | 11.5%) for men and Under 5 Years (515 | 9.4%) for women.
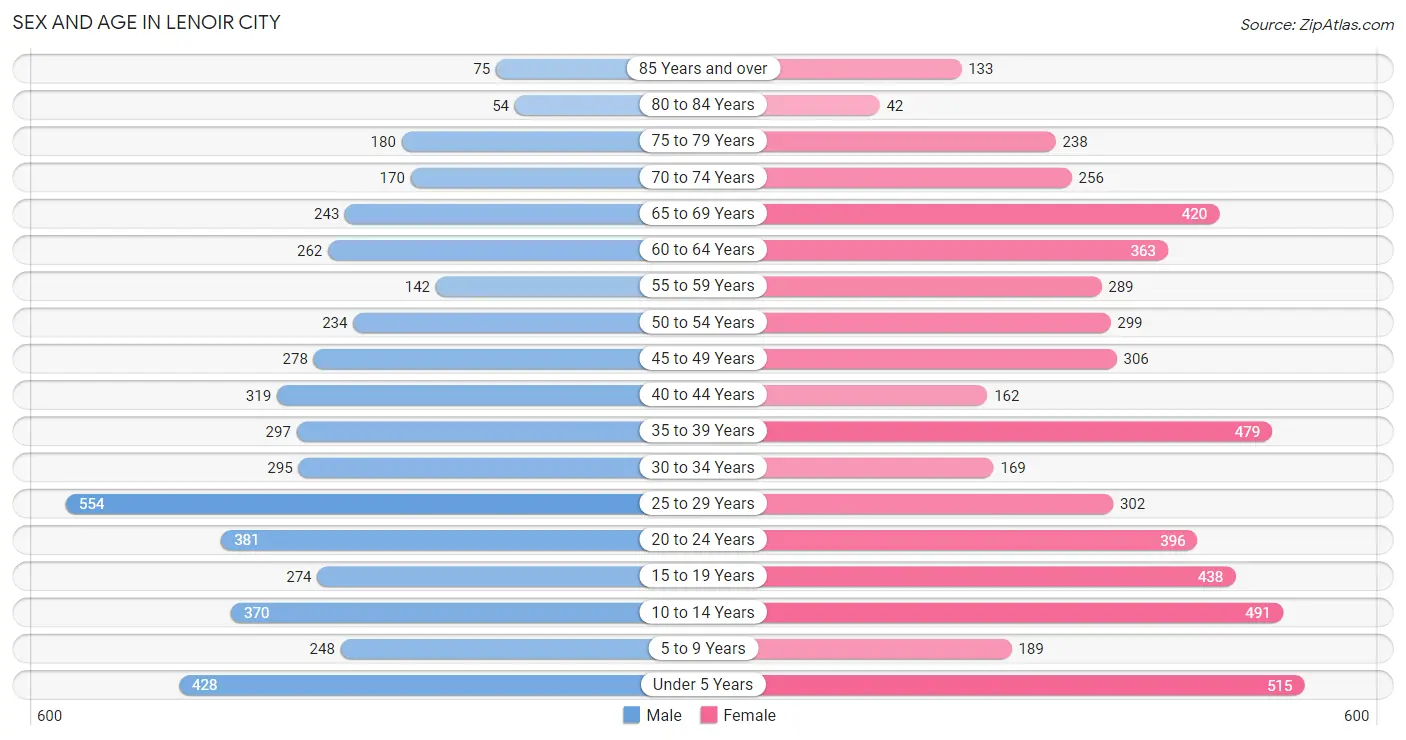
| Age Bracket | Male | Female |
| Under 5 Years | 428 (8.9%) | 515 (9.4%) |
| 5 to 9 Years | 248 (5.2%) | 189 (3.4%) |
| 10 to 14 Years | 370 (7.7%) | 491 (8.9%) |
| 15 to 19 Years | 274 (5.7%) | 438 (8.0%) |
| 20 to 24 Years | 381 (7.9%) | 396 (7.2%) |
| 25 to 29 Years | 554 (11.5%) | 302 (5.5%) |
| 30 to 34 Years | 295 (6.1%) | 169 (3.1%) |
| 35 to 39 Years | 297 (6.2%) | 479 (8.7%) |
| 40 to 44 Years | 319 (6.6%) | 162 (2.9%) |
| 45 to 49 Years | 278 (5.8%) | 306 (5.6%) |
| 50 to 54 Years | 234 (4.9%) | 299 (5.4%) |
| 55 to 59 Years | 142 (3.0%) | 289 (5.3%) |
| 60 to 64 Years | 262 (5.4%) | 363 (6.6%) |
| 65 to 69 Years | 243 (5.1%) | 420 (7.6%) |
| 70 to 74 Years | 170 (3.5%) | 256 (4.7%) |
| 75 to 79 Years | 180 (3.7%) | 238 (4.3%) |
| 80 to 84 Years | 54 (1.1%) | 42 (0.8%) |
| 85 Years and over | 75 (1.6%) | 133 (2.4%) |
| Total | 4,804 (100.0%) | 5,487 (100.0%) |
Families and Households in Lenoir City
Median Family Size in Lenoir City
The median family size in Lenoir City is 3.40 persons per family, with married-couple families (1,596 | 65.5%) accounting for the largest median family size of 3.61 persons per family. On the other hand, single male/father families (267 | 11.0%) represent the smallest median family size with 2.51 persons per family.
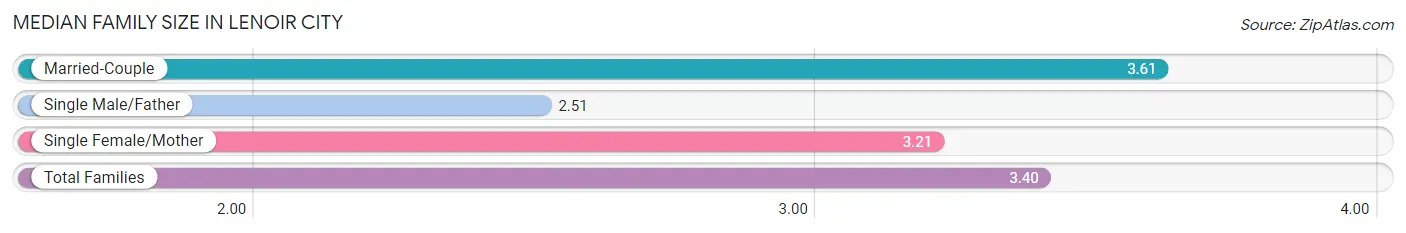
| Family Type | # Families | Family Size |
| Married-Couple | 1,596 (65.5%) | 3.61 |
| Single Male/Father | 267 (11.0%) | 2.51 |
| Single Female/Mother | 574 (23.5%) | 3.21 |
| Total Families | 2,437 (100.0%) | 3.40 |
Median Household Size in Lenoir City
The median household size in Lenoir City is 2.69 persons per household, with married-couple households (1,596 | 41.7%) accounting for the largest median household size of 3.74 persons per household. non-family households (1,389 | 36.3%) represent the smallest median household size with 1.16 persons per household.
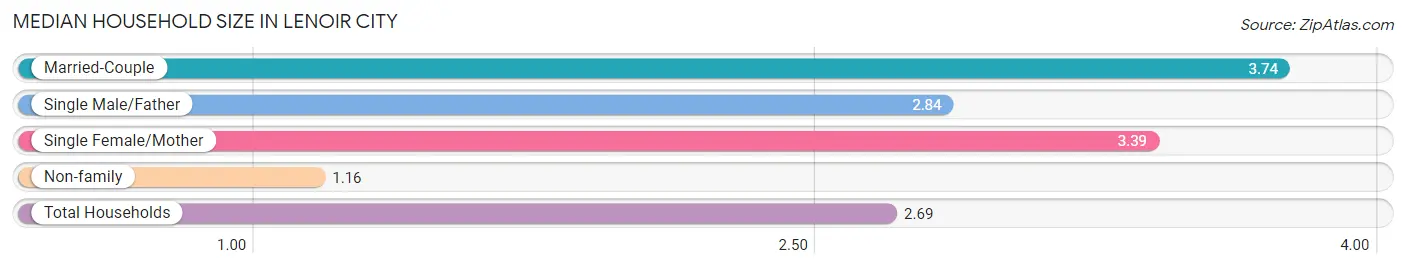
| Household Type | # Households | Household Size |
| Married-Couple | 1,596 (41.7%) | 3.74 |
| Single Male/Father | 267 (7.0%) | 2.84 |
| Single Female/Mother | 574 (15.0%) | 3.39 |
| Non-family | 1,389 (36.3%) | 1.16 |
| Total Households | 3,826 (100.0%) | 2.69 |
Household Size by Marriage Status in Lenoir City
Out of a total of 3,826 households in Lenoir City, 2,437 (63.7%) are family households, while 1,389 (36.3%) are nonfamily households. The most numerous type of family households are 2-person households, comprising 1,063, and the most common type of nonfamily households are 1-person households, comprising 1,252.
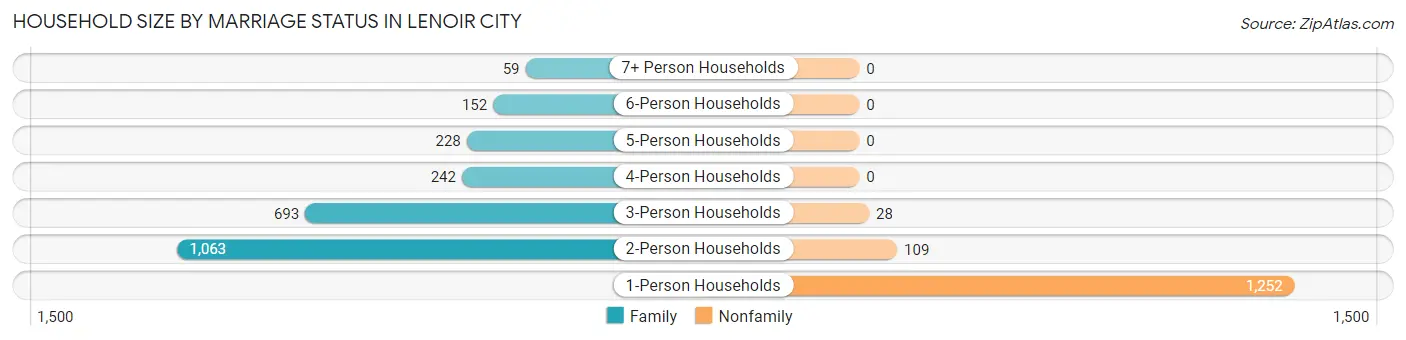
| Household Size | Family Households | Nonfamily Households |
| 1-Person Households | - | 1,252 (32.7%) |
| 2-Person Households | 1,063 (27.8%) | 109 (2.9%) |
| 3-Person Households | 693 (18.1%) | 28 (0.7%) |
| 4-Person Households | 242 (6.3%) | 0 (0.0%) |
| 5-Person Households | 228 (6.0%) | 0 (0.0%) |
| 6-Person Households | 152 (4.0%) | 0 (0.0%) |
| 7+ Person Households | 59 (1.5%) | 0 (0.0%) |
| Total | 2,437 (63.7%) | 1,389 (36.3%) |
Female Fertility in Lenoir City
Fertility by Age in Lenoir City
Average fertility rate in Lenoir City is 23.0 births per 1,000 women. Women in the age bracket of 20 to 34 years have the highest fertility rate with 52.0 births per 1,000 women. Women in the age bracket of 20 to 34 years acount for 84.9% of all women with births.
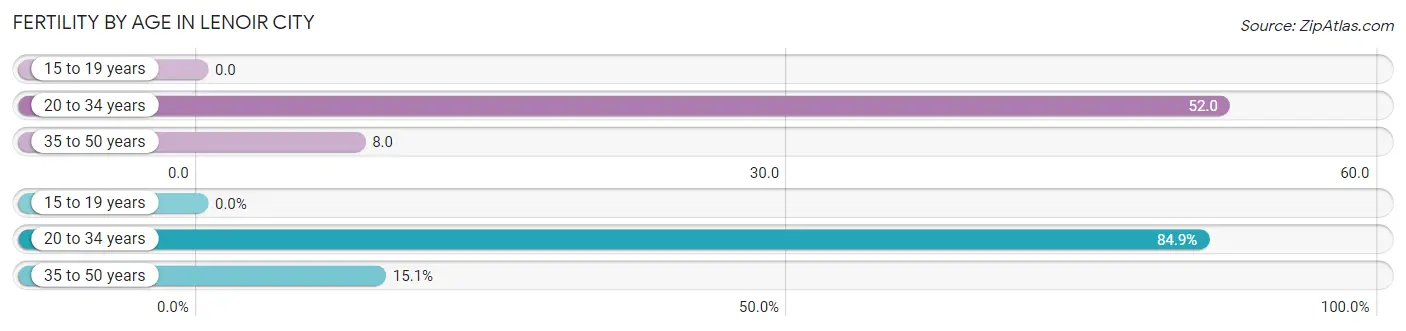
| Age Bracket | Women with Births | Births / 1,000 Women |
| 15 to 19 years | 0 (0.0%) | 0.0 |
| 20 to 34 years | 45 (84.9%) | 52.0 |
| 35 to 50 years | 8 (15.1%) | 8.0 |
| Total | 53 (100.0%) | 23.0 |
Fertility by Age by Marriage Status in Lenoir City
84.9% of women with births (53) in Lenoir City are married. The highest percentage of unmarried women with births falls into 35 to 50 years age bracket with 100.0% of them unmarried at the time of birth, while the lowest percentage of unmarried women with births belong to 20 to 34 years age bracket with 0.0% of them unmarried.
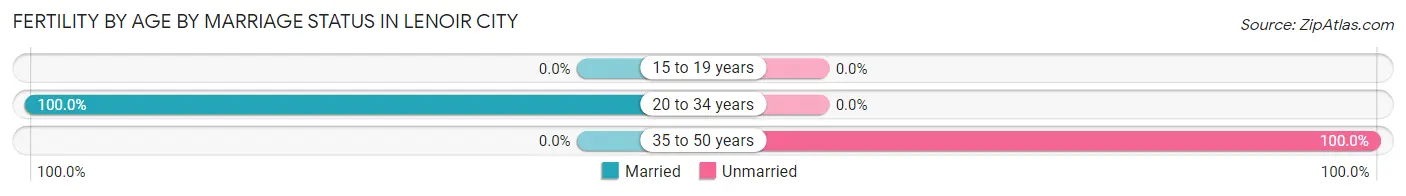
| Age Bracket | Married | Unmarried |
| 15 to 19 years | 0 (0.0%) | 0 (0.0%) |
| 20 to 34 years | 45 (100.0%) | 0 (0.0%) |
| 35 to 50 years | 0 (0.0%) | 8 (100.0%) |
| Total | 45 (84.9%) | 8 (15.1%) |
Fertility by Education in Lenoir City
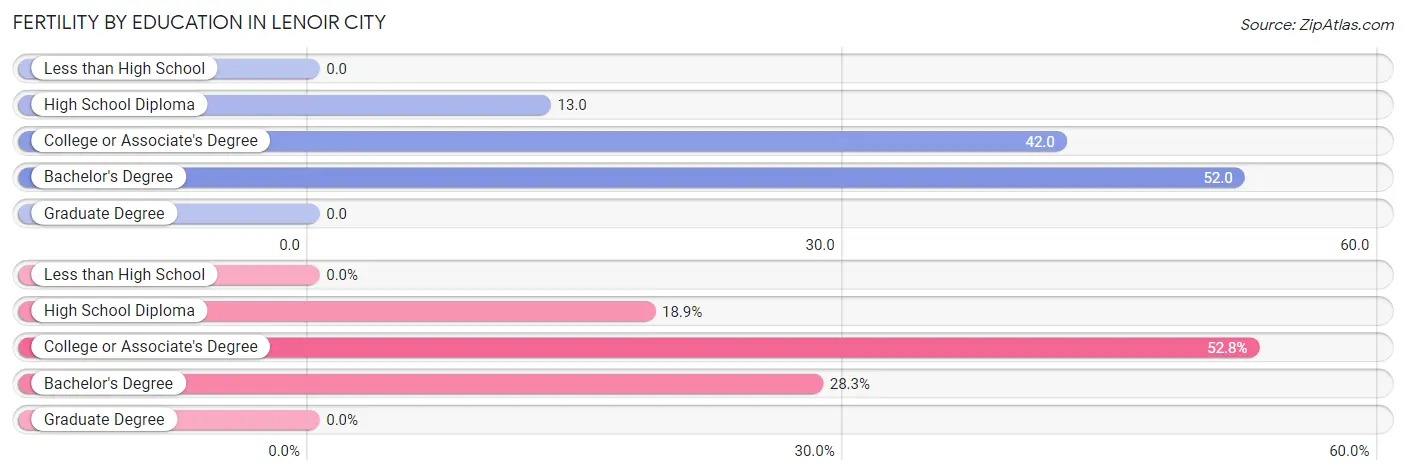
| Educational Attainment | Women with Births | Births / 1,000 Women |
| Less than High School | 0 (0.0%) | 0.0 |
| High School Diploma | 10 (18.9%) | 13.0 |
| College or Associate's Degree | 28 (52.8%) | 42.0 |
| Bachelor's Degree | 15 (28.3%) | 52.0 |
| Graduate Degree | 0 (0.0%) | 0.0 |
| Total | 53 (100.0%) | 23.0 |
Fertility by Education by Marriage Status in Lenoir City
15.1% of women with births in Lenoir City are unmarried. Women with the educational attainment of high school diploma are most likely to be married with 100.0% of them married at childbirth, while women with the educational attainment of college or associate's degree are least likely to be married with 28.6% of them unmarried at childbirth.
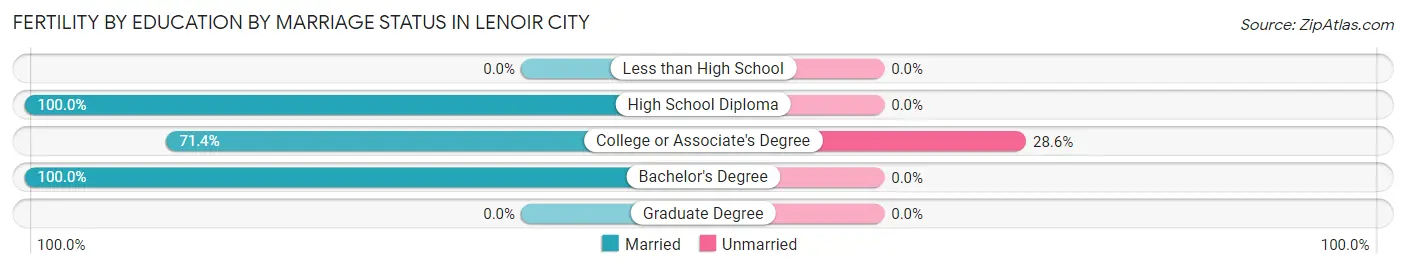
| Educational Attainment | Married | Unmarried |
| Less than High School | 0 (0.0%) | 0 (0.0%) |
| High School Diploma | 10 (100.0%) | 0 (0.0%) |
| College or Associate's Degree | 20 (71.4%) | 8 (28.6%) |
| Bachelor's Degree | 15 (100.0%) | 0 (0.0%) |
| Graduate Degree | 0 (0.0%) | 0 (0.0%) |
| Total | 45 (84.9%) | 8 (15.1%) |
Employment Characteristics in Lenoir City
Employment by Class of Employer in Lenoir City
Among the 4,475 employed individuals in Lenoir City, private company employees (3,636 | 81.2%), not-for-profit organizations (356 | 8.0%), and federal government employees (188 | 4.2%) make up the most common classes of employment.
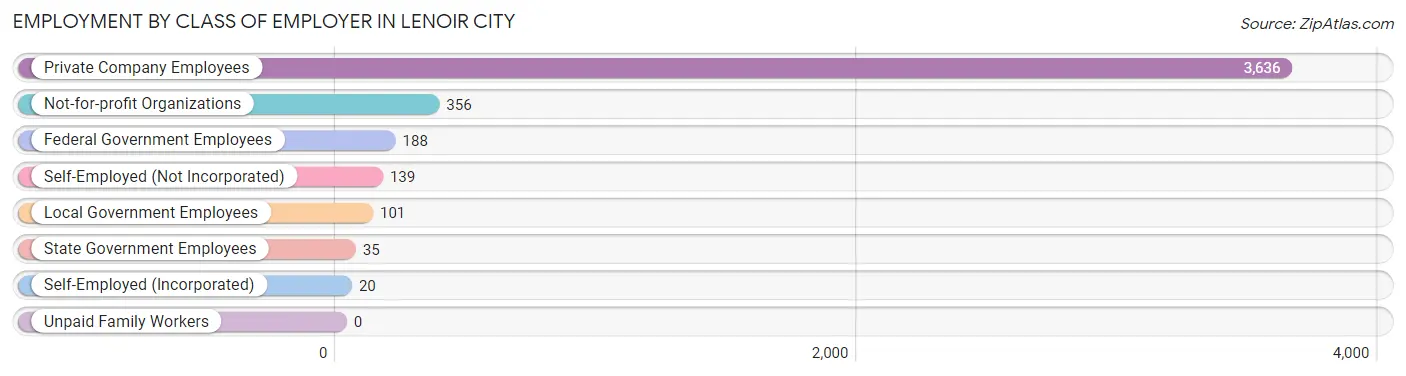
| Employer Class | # Employees | % Employees |
| Private Company Employees | 3,636 | 81.2% |
| Self-Employed (Incorporated) | 20 | 0.4% |
| Self-Employed (Not Incorporated) | 139 | 3.1% |
| Not-for-profit Organizations | 356 | 8.0% |
| Local Government Employees | 101 | 2.3% |
| State Government Employees | 35 | 0.8% |
| Federal Government Employees | 188 | 4.2% |
| Unpaid Family Workers | 0 | 0.0% |
| Total | 4,475 | 100.0% |
Employment Status by Age in Lenoir City
According to the labor force statistics for Lenoir City, out of the total population over 16 years of age (7,843), 60.5% or 4,745 individuals are in the labor force, with 4.0% or 190 of them unemployed. The age group with the highest labor force participation rate is 30 to 34 years, with 94.0% or 436 individuals in the labor force. Within the labor force, the 30 to 34 years age range has the highest percentage of unemployed individuals, with 14.0% or 61 of them being unemployed.
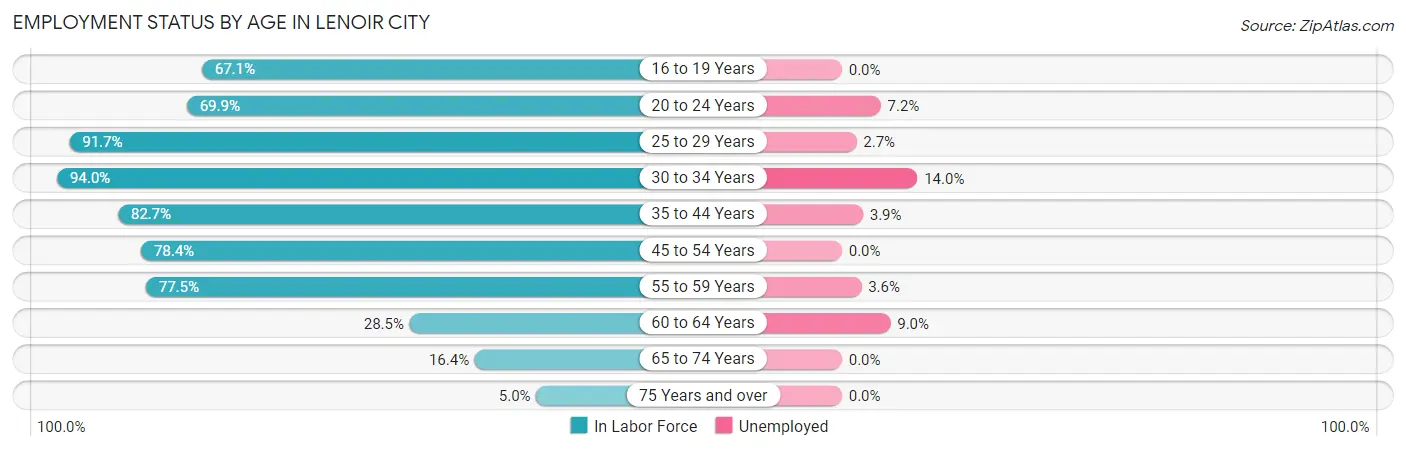
| Age Bracket | In Labor Force | Unemployed |
| 16 to 19 Years | 339 (67.1%) | 0 (0.0%) |
| 20 to 24 Years | 543 (69.9%) | 39 (7.2%) |
| 25 to 29 Years | 785 (91.7%) | 21 (2.7%) |
| 30 to 34 Years | 436 (94.0%) | 61 (14.0%) |
| 35 to 44 Years | 1,040 (82.7%) | 41 (3.9%) |
| 45 to 54 Years | 876 (78.4%) | 0 (0.0%) |
| 55 to 59 Years | 334 (77.5%) | 12 (3.6%) |
| 60 to 64 Years | 178 (28.5%) | 16 (9.0%) |
| 65 to 74 Years | 179 (16.4%) | 0 (0.0%) |
| 75 Years and over | 36 (5.0%) | 0 (0.0%) |
| Total | 4,745 (60.5%) | 190 (4.0%) |
Employment Status by Educational Attainment in Lenoir City
According to labor force statistics for Lenoir City, 76.8% of individuals (3,648) out of the total population between 25 and 64 years of age (4,750) are in the labor force, with 4.1% or 150 of them being unemployed. The group with the highest labor force participation rate are those with the educational attainment of bachelor's degree or higher, with 88.7% or 906 individuals in the labor force. Within the labor force, individuals with college / associate degree education have the highest percentage of unemployment, with 8.1% or 87 of them being unemployed.
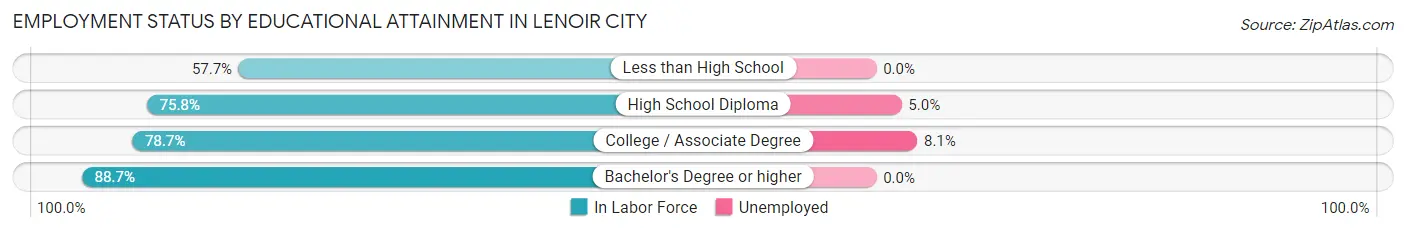
| Educational Attainment | In Labor Force | Unemployed |
| Less than High School | 392 (57.7%) | 0 (0.0%) |
| High School Diploma | 1,282 (75.8%) | 85 (5.0%) |
| College / Associate Degree | 1,070 (78.7%) | 110 (8.1%) |
| Bachelor's Degree or higher | 906 (88.7%) | 0 (0.0%) |
| Total | 3,648 (76.8%) | 195 (4.1%) |
Employment Occupations by Sex in Lenoir City
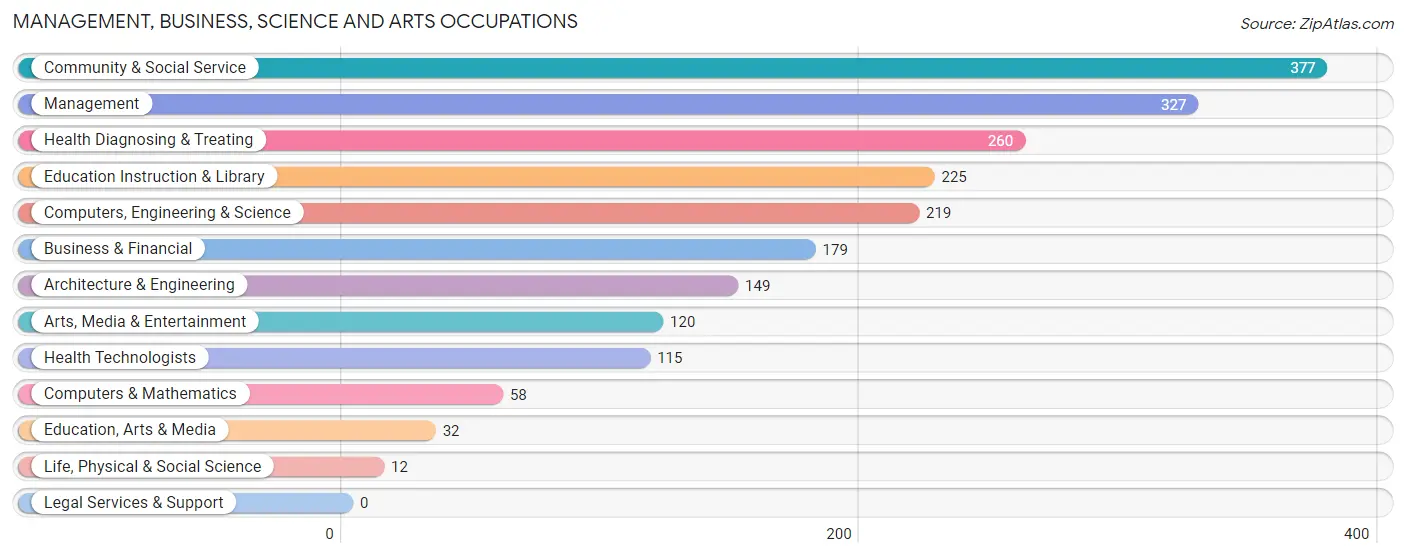
Management, Business, Science and Arts Occupations
The most common Management, Business, Science and Arts occupations in Lenoir City are Community & Social Service (377 | 8.4%), Management (327 | 7.2%), Health Diagnosing & Treating (260 | 5.8%), Education Instruction & Library (225 | 5.0%), and Computers, Engineering & Science (219 | 4.9%).
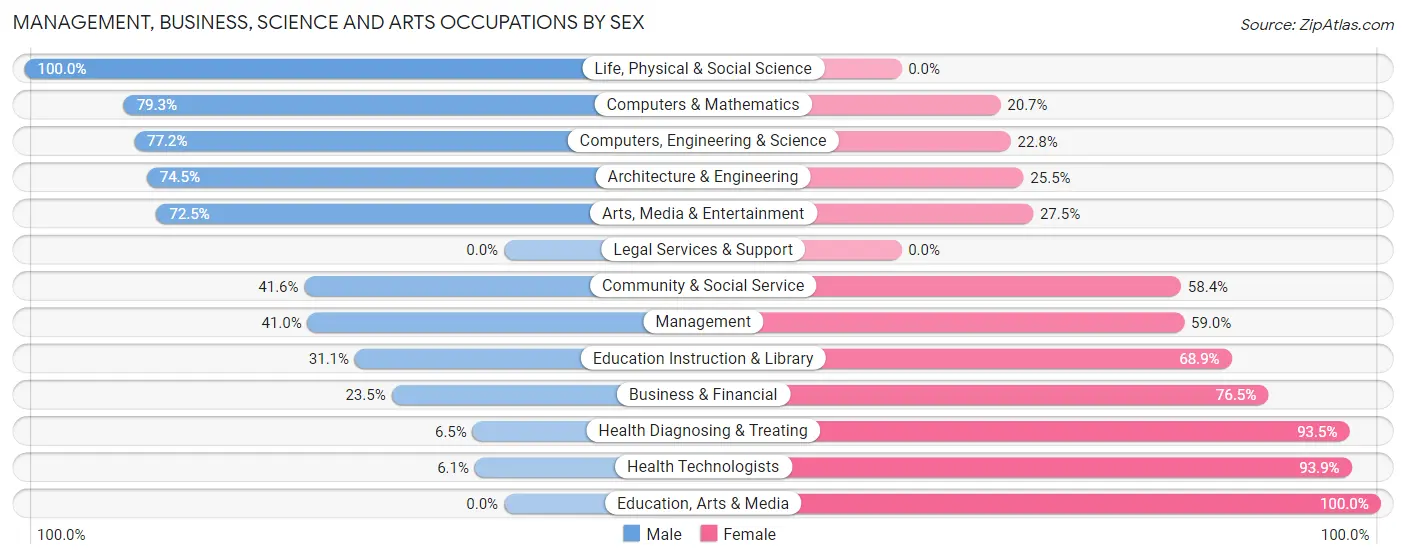
Management, Business, Science and Arts Occupations by Sex
Within the Management, Business, Science and Arts occupations in Lenoir City, the most male-oriented occupations are Life, Physical & Social Science (100.0%), Computers & Mathematics (79.3%), and Computers, Engineering & Science (77.2%), while the most female-oriented occupations are Education, Arts & Media (100.0%), Health Technologists (93.9%), and Health Diagnosing & Treating (93.5%).
| Occupation | Male | Female |
| Management | 134 (41.0%) | 193 (59.0%) |
| Business & Financial | 42 (23.5%) | 137 (76.5%) |
| Computers, Engineering & Science | 169 (77.2%) | 50 (22.8%) |
| Computers & Mathematics | 46 (79.3%) | 12 (20.7%) |
| Architecture & Engineering | 111 (74.5%) | 38 (25.5%) |
| Life, Physical & Social Science | 12 (100.0%) | 0 (0.0%) |
| Community & Social Service | 157 (41.6%) | 220 (58.4%) |
| Education, Arts & Media | 0 (0.0%) | 32 (100.0%) |
| Legal Services & Support | 0 (0.0%) | 0 (0.0%) |
| Education Instruction & Library | 70 (31.1%) | 155 (68.9%) |
| Arts, Media & Entertainment | 87 (72.5%) | 33 (27.5%) |
| Health Diagnosing & Treating | 17 (6.5%) | 243 (93.5%) |
| Health Technologists | 7 (6.1%) | 108 (93.9%) |
| Total (Category) | 519 (38.1%) | 843 (61.9%) |
| Total (Overall) | 2,416 (53.5%) | 2,099 (46.5%) |
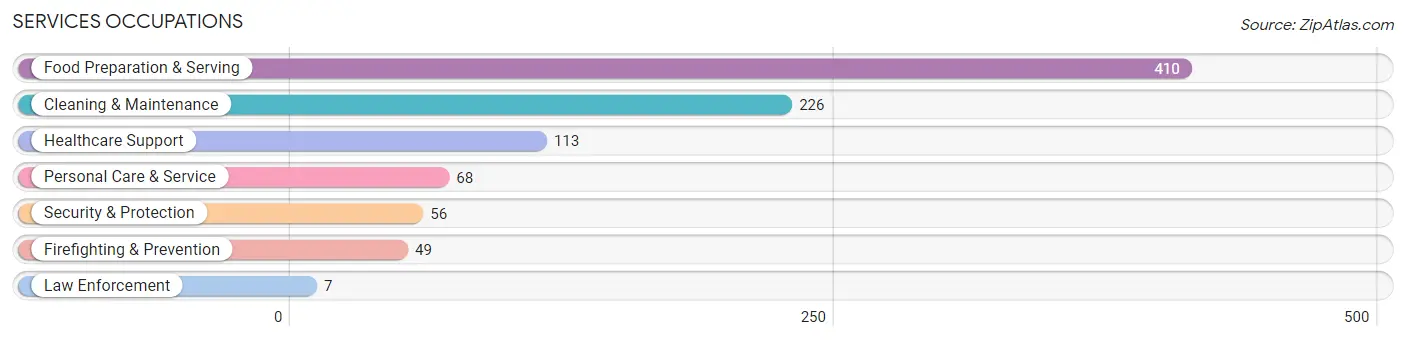
Services Occupations
The most common Services occupations in Lenoir City are Food Preparation & Serving (410 | 9.1%), Cleaning & Maintenance (226 | 5.0%), Healthcare Support (113 | 2.5%), Personal Care & Service (68 | 1.5%), and Security & Protection (56 | 1.2%).
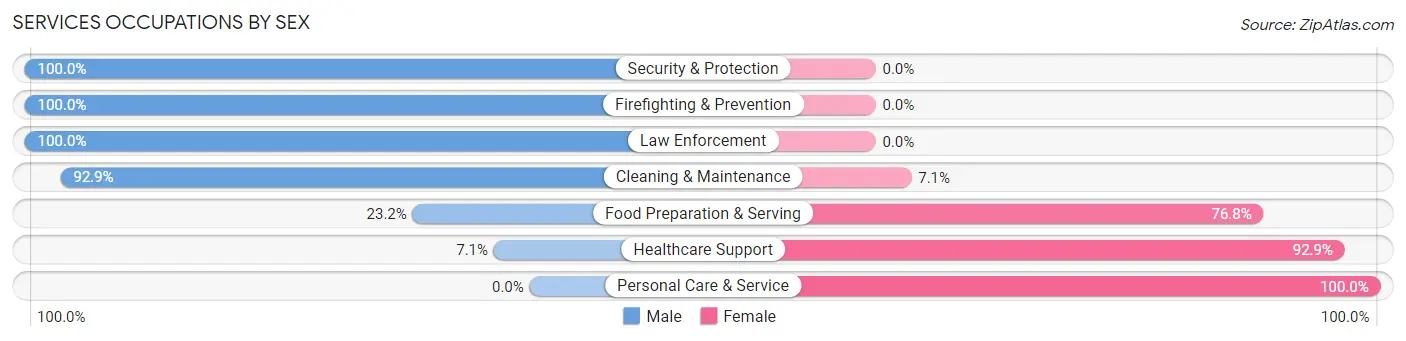
Services Occupations by Sex
Within the Services occupations in Lenoir City, the most male-oriented occupations are Security & Protection (100.0%), Firefighting & Prevention (100.0%), and Law Enforcement (100.0%), while the most female-oriented occupations are Personal Care & Service (100.0%), Healthcare Support (92.9%), and Food Preparation & Serving (76.8%).
| Occupation | Male | Female |
| Healthcare Support | 8 (7.1%) | 105 (92.9%) |
| Security & Protection | 56 (100.0%) | 0 (0.0%) |
| Firefighting & Prevention | 49 (100.0%) | 0 (0.0%) |
| Law Enforcement | 7 (100.0%) | 0 (0.0%) |
| Food Preparation & Serving | 95 (23.2%) | 315 (76.8%) |
| Cleaning & Maintenance | 210 (92.9%) | 16 (7.1%) |
| Personal Care & Service | 0 (0.0%) | 68 (100.0%) |
| Total (Category) | 369 (42.3%) | 504 (57.7%) |
| Total (Overall) | 2,416 (53.5%) | 2,099 (46.5%) |
Sales and Office Occupations
The most common Sales and Office occupations in Lenoir City are Sales & Related (414 | 9.2%), and Office & Administration (296 | 6.6%).
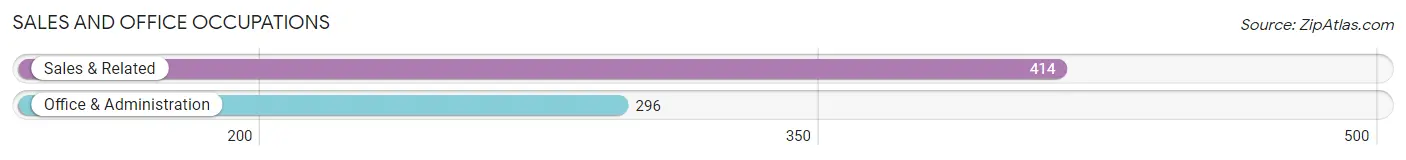
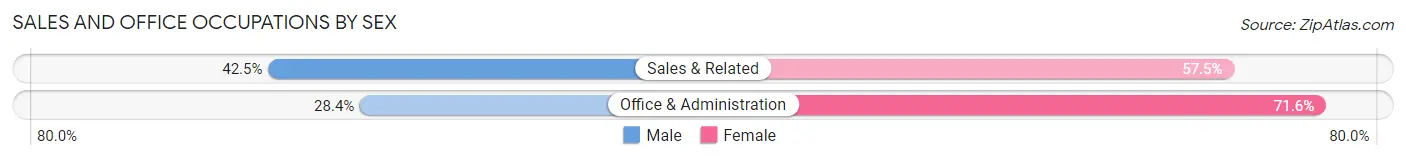
Sales and Office Occupations by Sex
| Occupation | Male | Female |
| Sales & Related | 176 (42.5%) | 238 (57.5%) |
| Office & Administration | 84 (28.4%) | 212 (71.6%) |
| Total (Category) | 260 (36.6%) | 450 (63.4%) |
| Total (Overall) | 2,416 (53.5%) | 2,099 (46.5%) |
Natural Resources, Construction and Maintenance Occupations
The most common Natural Resources, Construction and Maintenance occupations in Lenoir City are Construction & Extraction (252 | 5.6%), Installation, Maintenance & Repair (240 | 5.3%), and Farming, Fishing & Forestry (28 | 0.6%).

Natural Resources, Construction and Maintenance Occupations by Sex
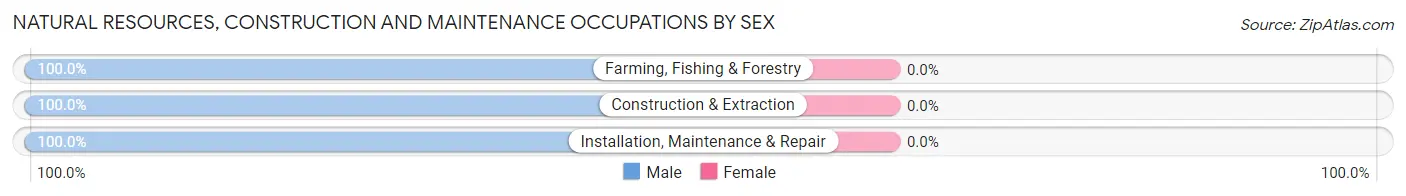
| Occupation | Male | Female |
| Farming, Fishing & Forestry | 28 (100.0%) | 0 (0.0%) |
| Construction & Extraction | 252 (100.0%) | 0 (0.0%) |
| Installation, Maintenance & Repair | 240 (100.0%) | 0 (0.0%) |
| Total (Category) | 520 (100.0%) | 0 (0.0%) |
| Total (Overall) | 2,416 (53.5%) | 2,099 (46.5%) |
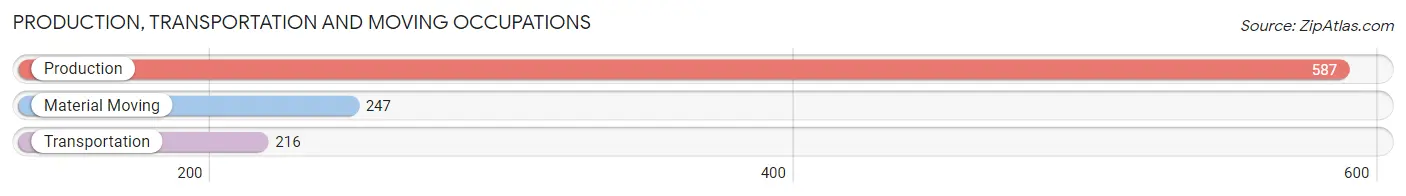
Production, Transportation and Moving Occupations
The most common Production, Transportation and Moving occupations in Lenoir City are Production (587 | 13.0%), Material Moving (247 | 5.5%), and Transportation (216 | 4.8%).
Production, Transportation and Moving Occupations by Sex
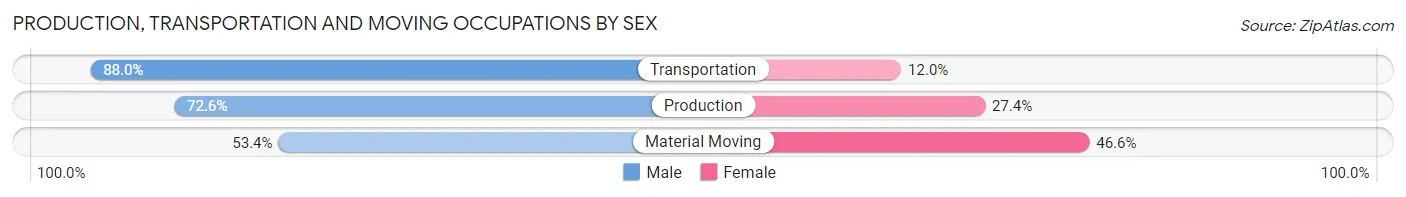
| Occupation | Male | Female |
| Production | 426 (72.6%) | 161 (27.4%) |
| Transportation | 190 (88.0%) | 26 (12.0%) |
| Material Moving | 132 (53.4%) | 115 (46.6%) |
| Total (Category) | 748 (71.2%) | 302 (28.8%) |
| Total (Overall) | 2,416 (53.5%) | 2,099 (46.5%) |
Employment Industries by Sex in Lenoir City
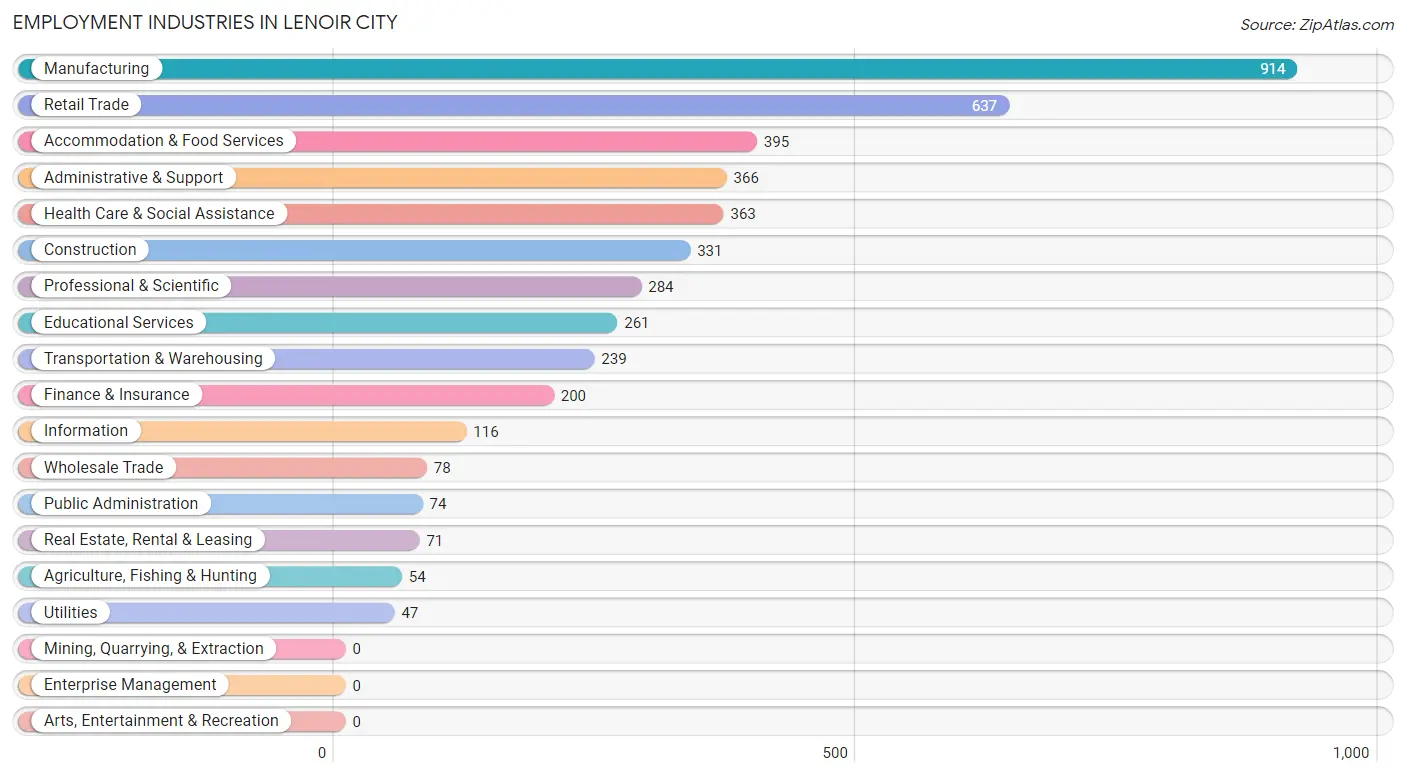
Employment Industries in Lenoir City
The major employment industries in Lenoir City include Manufacturing (914 | 20.2%), Retail Trade (637 | 14.1%), Accommodation & Food Services (395 | 8.7%), Administrative & Support (366 | 8.1%), and Health Care & Social Assistance (363 | 8.0%).
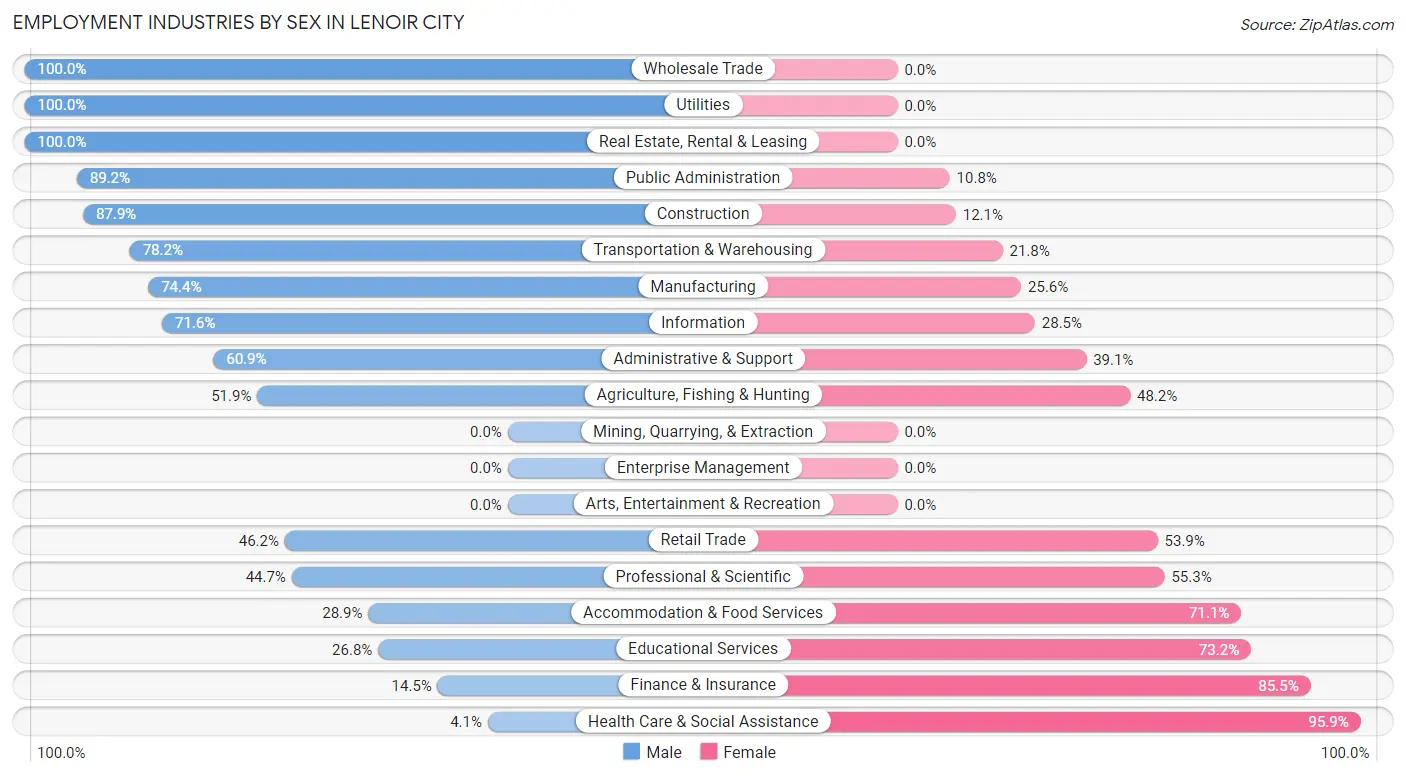
Employment Industries by Sex in Lenoir City
The Lenoir City industries that see more men than women are Wholesale Trade (100.0%), Utilities (100.0%), and Real Estate, Rental & Leasing (100.0%), whereas the industries that tend to have a higher number of women are Health Care & Social Assistance (95.9%), Finance & Insurance (85.5%), and Educational Services (73.2%).
| Industry | Male | Female |
| Agriculture, Fishing & Hunting | 28 (51.8%) | 26 (48.1%) |
| Mining, Quarrying, & Extraction | 0 (0.0%) | 0 (0.0%) |
| Construction | 291 (87.9%) | 40 (12.1%) |
| Manufacturing | 680 (74.4%) | 234 (25.6%) |
| Wholesale Trade | 78 (100.0%) | 0 (0.0%) |
| Retail Trade | 294 (46.2%) | 343 (53.8%) |
| Transportation & Warehousing | 187 (78.2%) | 52 (21.8%) |
| Utilities | 47 (100.0%) | 0 (0.0%) |
| Information | 83 (71.6%) | 33 (28.4%) |
| Finance & Insurance | 29 (14.5%) | 171 (85.5%) |
| Real Estate, Rental & Leasing | 71 (100.0%) | 0 (0.0%) |
| Professional & Scientific | 127 (44.7%) | 157 (55.3%) |
| Enterprise Management | 0 (0.0%) | 0 (0.0%) |
| Administrative & Support | 223 (60.9%) | 143 (39.1%) |
| Educational Services | 70 (26.8%) | 191 (73.2%) |
| Health Care & Social Assistance | 15 (4.1%) | 348 (95.9%) |
| Arts, Entertainment & Recreation | 0 (0.0%) | 0 (0.0%) |
| Accommodation & Food Services | 114 (28.9%) | 281 (71.1%) |
| Public Administration | 66 (89.2%) | 8 (10.8%) |
| Total | 2,416 (53.5%) | 2,099 (46.5%) |
Education in Lenoir City
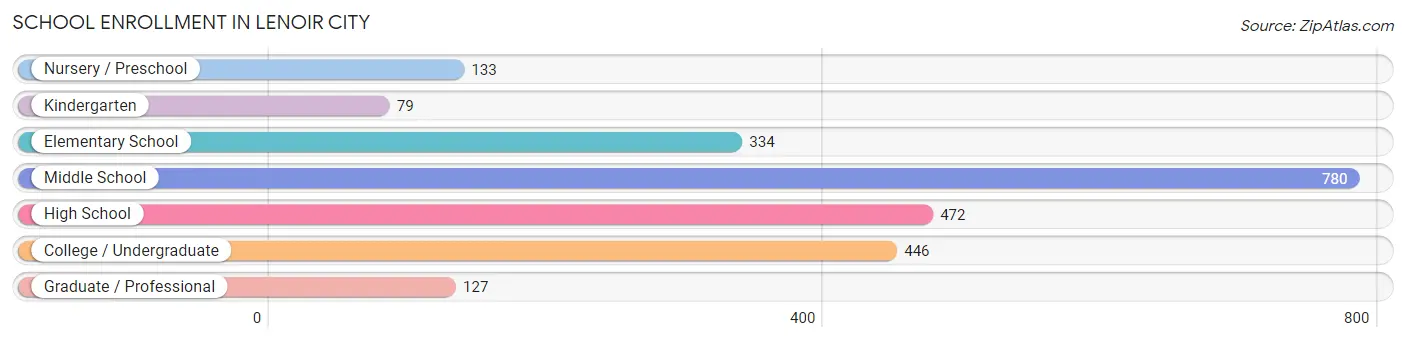
School Enrollment in Lenoir City
The most common levels of schooling among the 2,371 students in Lenoir City are middle school (780 | 32.9%), high school (472 | 19.9%), and college / undergraduate (446 | 18.8%).
| School Level | # Students | % Students |
| Nursery / Preschool | 133 | 5.6% |
| Kindergarten | 79 | 3.3% |
| Elementary School | 334 | 14.1% |
| Middle School | 780 | 32.9% |
| High School | 472 | 19.9% |
| College / Undergraduate | 446 | 18.8% |
| Graduate / Professional | 127 | 5.4% |
| Total | 2,371 | 100.0% |
School Enrollment by Age by Funding Source in Lenoir City
Out of a total of 2,371 students who are enrolled in schools in Lenoir City, 247 (10.4%) attend a private institution, while the remaining 2,124 (89.6%) are enrolled in public schools. The age group of 35 years and over has the highest likelihood of being enrolled in private schools, with 19 (52.8% in the age bracket) enrolled. Conversely, the age group of 3 to 4 year olds has the lowest likelihood of being enrolled in a private school, with 79 (100.0% in the age bracket) attending a public institution.
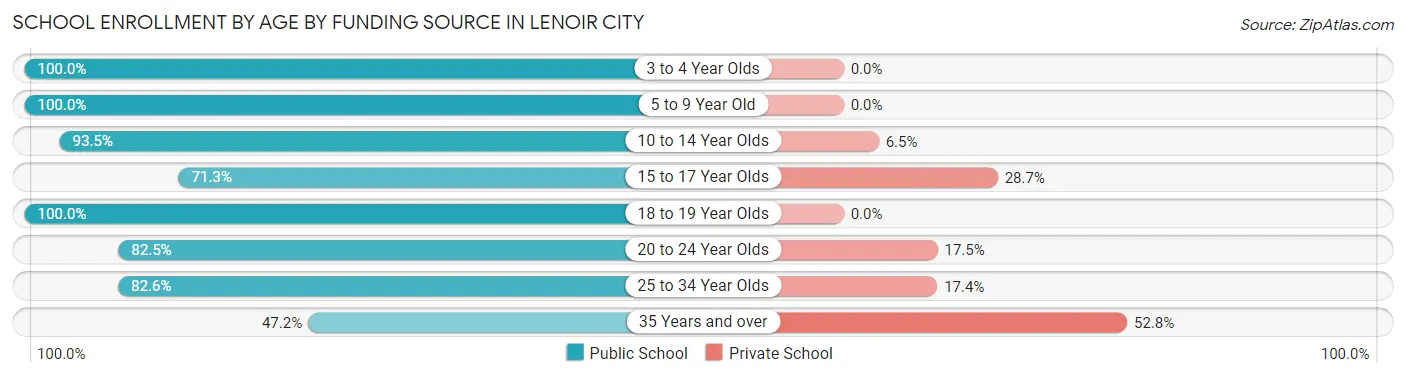
| Age Bracket | Public School | Private School |
| 3 to 4 Year Olds | 79 (100.0%) | 0 (0.0%) |
| 5 to 9 Year Old | 437 (100.0%) | 0 (0.0%) |
| 10 to 14 Year Olds | 789 (93.5%) | 55 (6.5%) |
| 15 to 17 Year Olds | 261 (71.3%) | 105 (28.7%) |
| 18 to 19 Year Olds | 225 (100.0%) | 0 (0.0%) |
| 20 to 24 Year Olds | 170 (82.5%) | 36 (17.5%) |
| 25 to 34 Year Olds | 147 (82.6%) | 31 (17.4%) |
| 35 Years and over | 17 (47.2%) | 19 (52.8%) |
| Total | 2,124 (89.6%) | 247 (10.4%) |
Educational Attainment by Field of Study in Lenoir City
Business (367 | 24.4%), education (261 | 17.4%), engineering (210 | 14.0%), science & technology (146 | 9.7%), and communications (115 | 7.6%) are the most common fields of study among 1,503 individuals in Lenoir City who have obtained a bachelor's degree or higher.
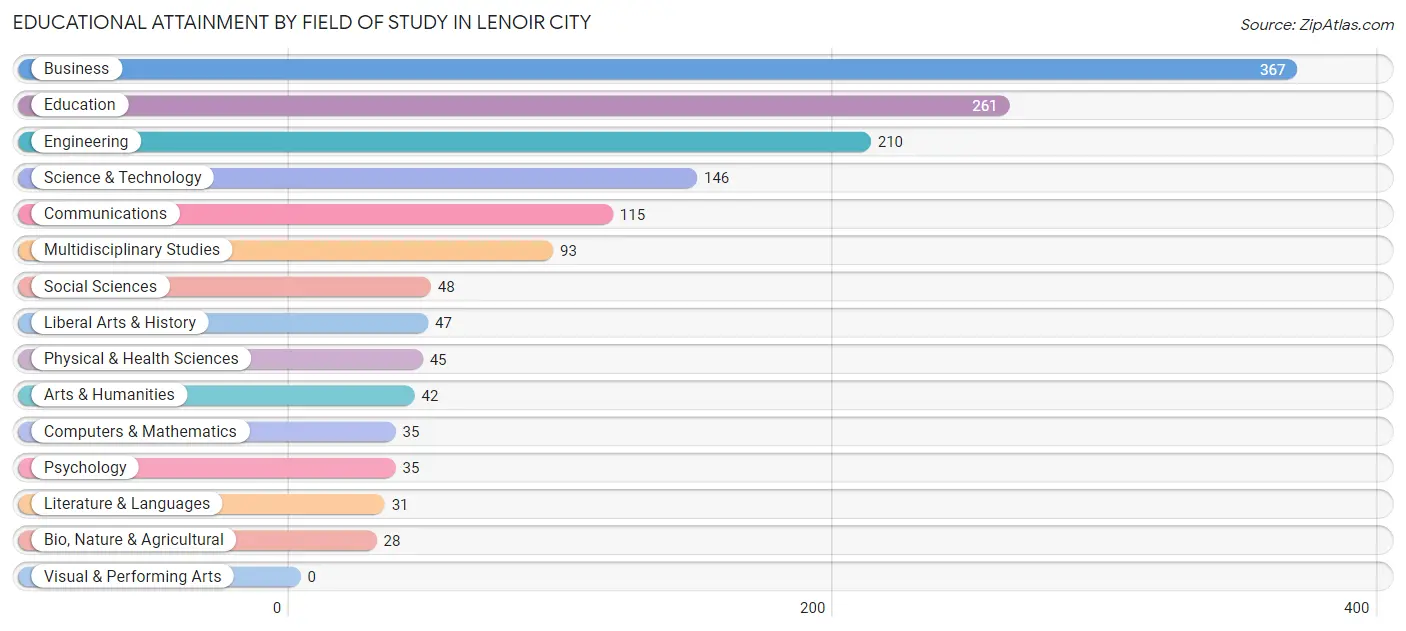
| Field of Study | # Graduates | % Graduates |
| Computers & Mathematics | 35 | 2.3% |
| Bio, Nature & Agricultural | 28 | 1.9% |
| Physical & Health Sciences | 45 | 3.0% |
| Psychology | 35 | 2.3% |
| Social Sciences | 48 | 3.2% |
| Engineering | 210 | 14.0% |
| Multidisciplinary Studies | 93 | 6.2% |
| Science & Technology | 146 | 9.7% |
| Business | 367 | 24.4% |
| Education | 261 | 17.4% |
| Literature & Languages | 31 | 2.1% |
| Liberal Arts & History | 47 | 3.1% |
| Visual & Performing Arts | 0 | 0.0% |
| Communications | 115 | 7.6% |
| Arts & Humanities | 42 | 2.8% |
| Total | 1,503 | 100.0% |
Transportation & Commute in Lenoir City
Vehicle Availability by Sex in Lenoir City
The most prevalent vehicle ownership categories in Lenoir City are males with 2 vehicles (918, accounting for 38.2%) and females with 2 vehicles (774, making up 44.3%).
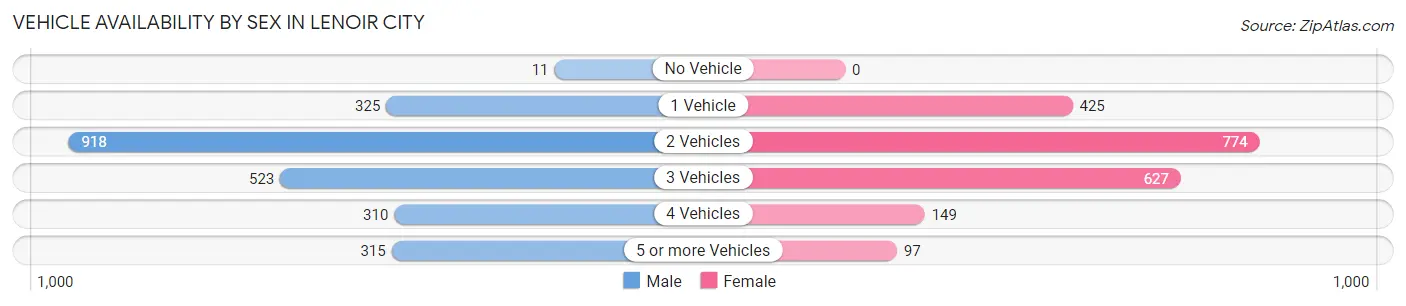
| Vehicles Available | Male | Female |
| No Vehicle | 11 (0.5%) | 0 (0.0%) |
| 1 Vehicle | 325 (13.5%) | 425 (20.5%) |
| 2 Vehicles | 918 (38.2%) | 774 (37.4%) |
| 3 Vehicles | 523 (21.8%) | 627 (30.3%) |
| 4 Vehicles | 310 (12.9%) | 149 (7.2%) |
| 5 or more Vehicles | 315 (13.1%) | 97 (4.7%) |
| Total | 2,402 (100.0%) | 2,072 (100.0%) |
Commute Time in Lenoir City
The most frequently occuring commute durations in Lenoir City are 30 to 34 minutes (992 commuters, 23.6%), 10 to 14 minutes (810 commuters, 19.3%), and 5 to 9 minutes (604 commuters, 14.4%).
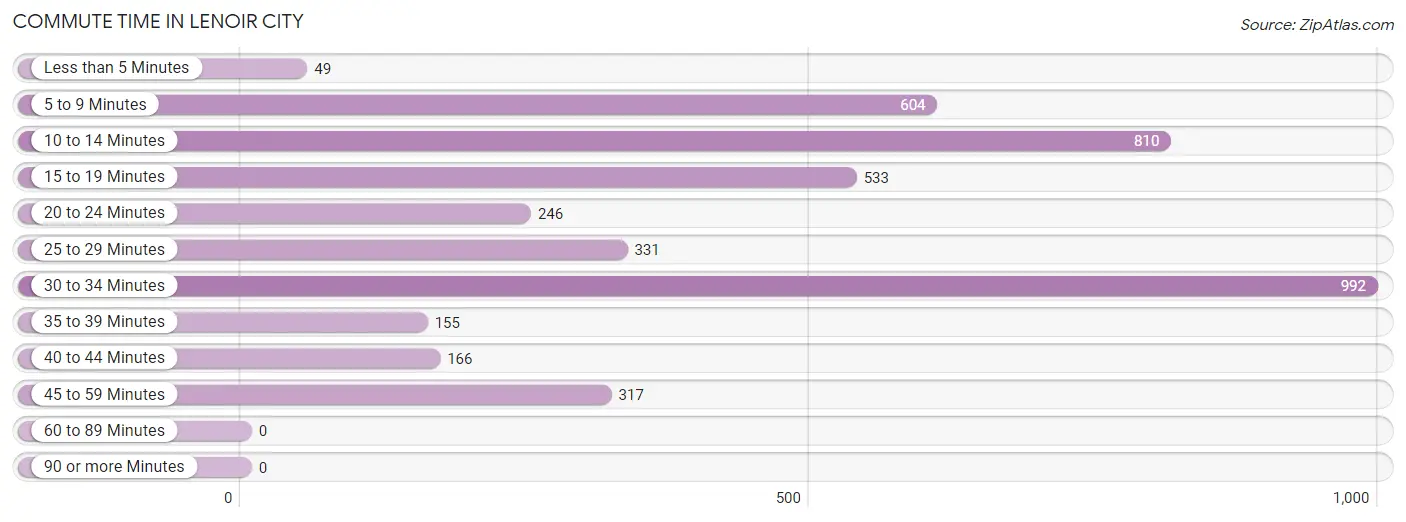
| Commute Time | # Commuters | % Commuters |
| Less than 5 Minutes | 49 | 1.2% |
| 5 to 9 Minutes | 604 | 14.4% |
| 10 to 14 Minutes | 810 | 19.3% |
| 15 to 19 Minutes | 533 | 12.7% |
| 20 to 24 Minutes | 246 | 5.9% |
| 25 to 29 Minutes | 331 | 7.9% |
| 30 to 34 Minutes | 992 | 23.6% |
| 35 to 39 Minutes | 155 | 3.7% |
| 40 to 44 Minutes | 166 | 4.0% |
| 45 to 59 Minutes | 317 | 7.5% |
| 60 to 89 Minutes | 0 | 0.0% |
| 90 or more Minutes | 0 | 0.0% |
Commute Time by Sex in Lenoir City
The most common commute times in Lenoir City are 30 to 34 minutes (631 commuters, 26.9%) for males and 30 to 34 minutes (361 commuters, 19.4%) for females.
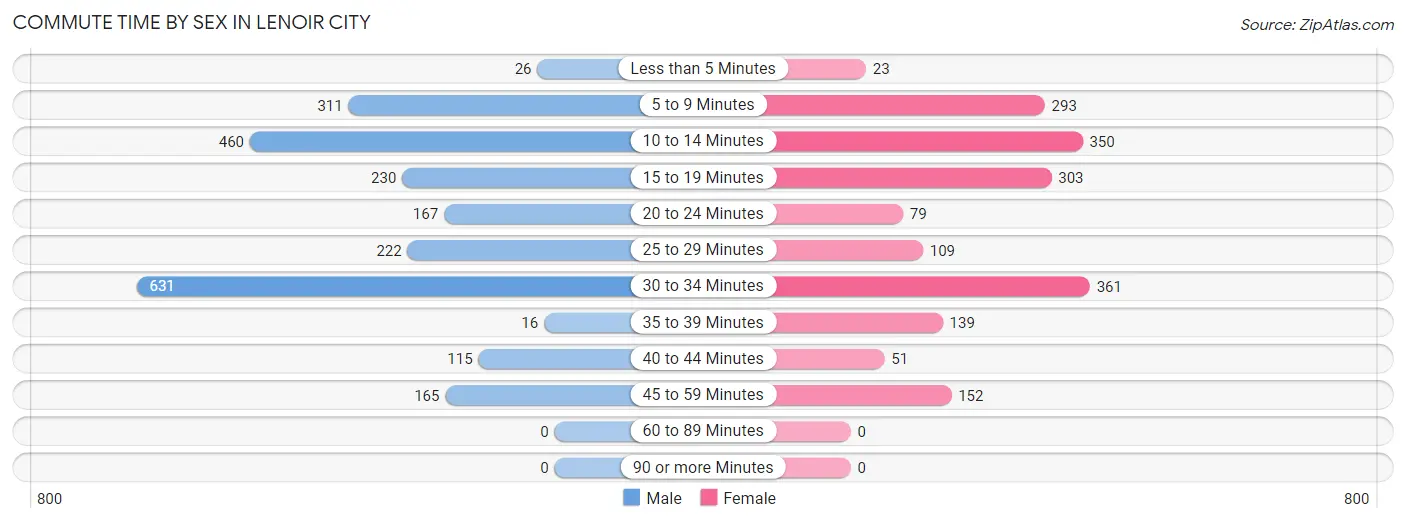
| Commute Time | Male | Female |
| Less than 5 Minutes | 26 (1.1%) | 23 (1.2%) |
| 5 to 9 Minutes | 311 (13.3%) | 293 (15.8%) |
| 10 to 14 Minutes | 460 (19.6%) | 350 (18.8%) |
| 15 to 19 Minutes | 230 (9.8%) | 303 (16.3%) |
| 20 to 24 Minutes | 167 (7.1%) | 79 (4.3%) |
| 25 to 29 Minutes | 222 (9.5%) | 109 (5.9%) |
| 30 to 34 Minutes | 631 (26.9%) | 361 (19.4%) |
| 35 to 39 Minutes | 16 (0.7%) | 139 (7.5%) |
| 40 to 44 Minutes | 115 (4.9%) | 51 (2.7%) |
| 45 to 59 Minutes | 165 (7.0%) | 152 (8.2%) |
| 60 to 89 Minutes | 0 (0.0%) | 0 (0.0%) |
| 90 or more Minutes | 0 (0.0%) | 0 (0.0%) |
Time of Departure to Work by Sex in Lenoir City
The most frequent times of departure to work in Lenoir City are 7:00 AM to 7:29 AM (600, 25.6%) for males and 8:00 AM to 8:29 AM (412, 22.2%) for females.
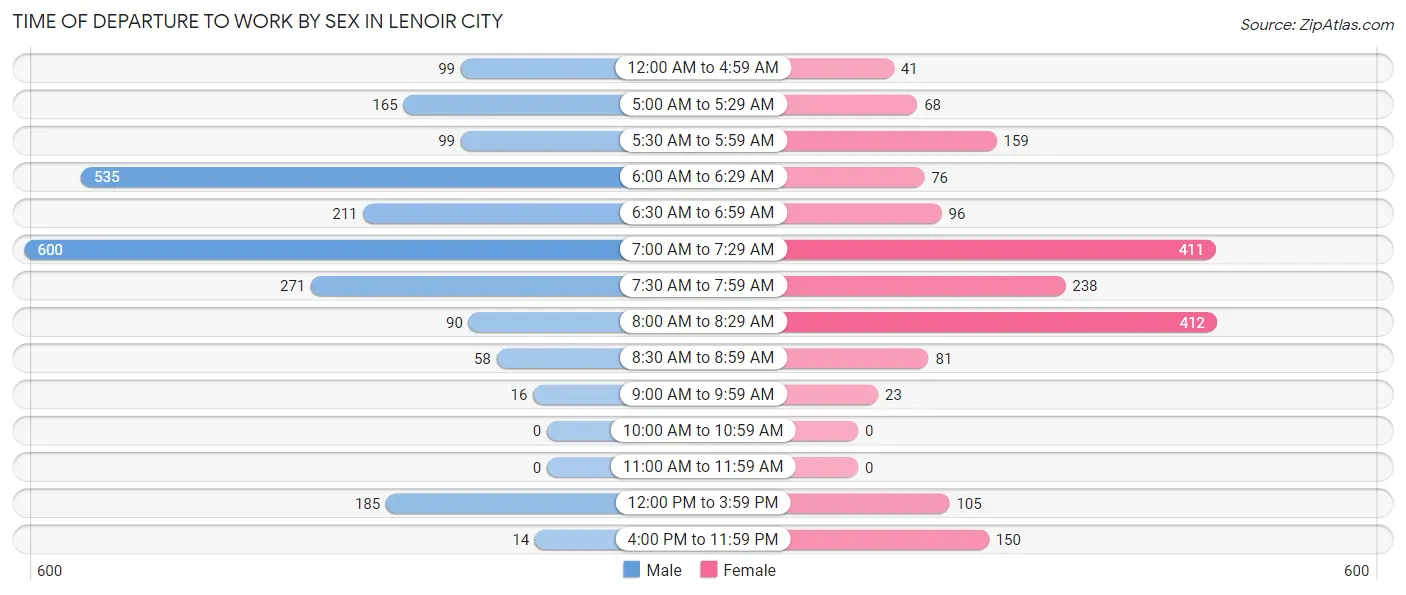
| Time of Departure | Male | Female |
| 12:00 AM to 4:59 AM | 99 (4.2%) | 41 (2.2%) |
| 5:00 AM to 5:29 AM | 165 (7.0%) | 68 (3.7%) |
| 5:30 AM to 5:59 AM | 99 (4.2%) | 159 (8.6%) |
| 6:00 AM to 6:29 AM | 535 (22.8%) | 76 (4.1%) |
| 6:30 AM to 6:59 AM | 211 (9.0%) | 96 (5.2%) |
| 7:00 AM to 7:29 AM | 600 (25.6%) | 411 (22.1%) |
| 7:30 AM to 7:59 AM | 271 (11.6%) | 238 (12.8%) |
| 8:00 AM to 8:29 AM | 90 (3.8%) | 412 (22.2%) |
| 8:30 AM to 8:59 AM | 58 (2.5%) | 81 (4.3%) |
| 9:00 AM to 9:59 AM | 16 (0.7%) | 23 (1.2%) |
| 10:00 AM to 10:59 AM | 0 (0.0%) | 0 (0.0%) |
| 11:00 AM to 11:59 AM | 0 (0.0%) | 0 (0.0%) |
| 12:00 PM to 3:59 PM | 185 (7.9%) | 105 (5.7%) |
| 4:00 PM to 11:59 PM | 14 (0.6%) | 150 (8.1%) |
| Total | 2,343 (100.0%) | 1,860 (100.0%) |
Housing Occupancy in Lenoir City
Occupancy by Ownership in Lenoir City
Of the total 3,826 dwellings in Lenoir City, owner-occupied units account for 2,344 (61.3%), while renter-occupied units make up 1,482 (38.7%).
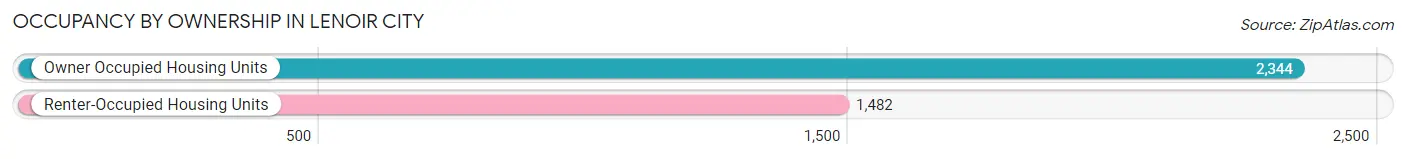
| Occupancy | # Housing Units | % Housing Units |
| Owner Occupied Housing Units | 2,344 | 61.3% |
| Renter-Occupied Housing Units | 1,482 | 38.7% |
| Total Occupied Housing Units | 3,826 | 100.0% |
Occupancy by Household Size in Lenoir City
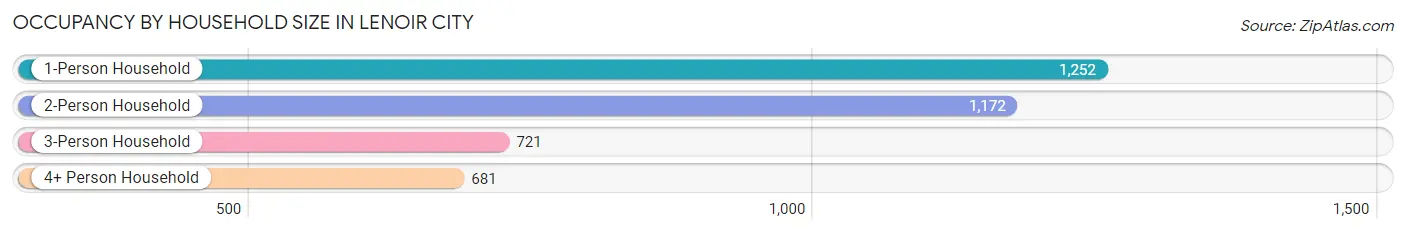
| Household Size | # Housing Units | % Housing Units |
| 1-Person Household | 1,252 | 32.7% |
| 2-Person Household | 1,172 | 30.6% |
| 3-Person Household | 721 | 18.8% |
| 4+ Person Household | 681 | 17.8% |
| Total Housing Units | 3,826 | 100.0% |
Occupancy by Ownership by Household Size in Lenoir City
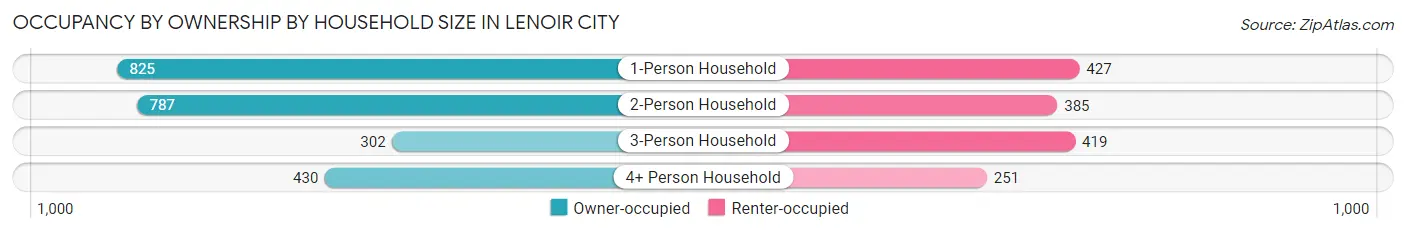
| Household Size | Owner-occupied | Renter-occupied |
| 1-Person Household | 825 (65.9%) | 427 (34.1%) |
| 2-Person Household | 787 (67.1%) | 385 (32.9%) |
| 3-Person Household | 302 (41.9%) | 419 (58.1%) |
| 4+ Person Household | 430 (63.1%) | 251 (36.9%) |
| Total Housing Units | 2,344 (61.3%) | 1,482 (38.7%) |
Occupancy by Educational Attainment in Lenoir City
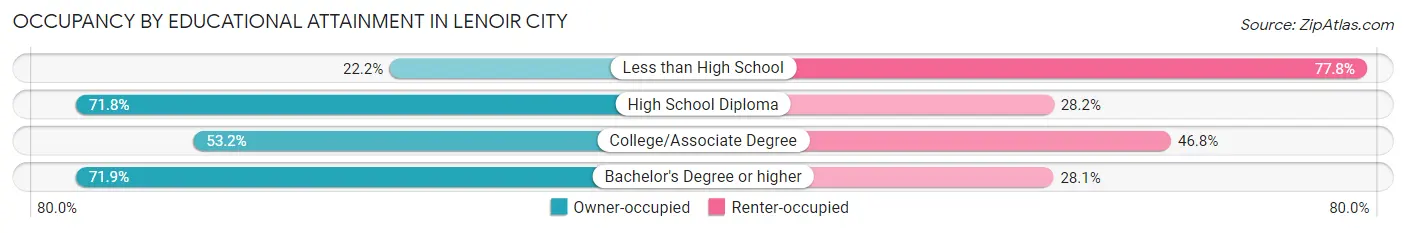
| Household Size | Owner-occupied | Renter-occupied |
| Less than High School | 83 (22.2%) | 291 (77.8%) |
| High School Diploma | 1,023 (71.8%) | 401 (28.2%) |
| College/Associate Degree | 627 (53.2%) | 551 (46.8%) |
| Bachelor's Degree or higher | 611 (71.9%) | 239 (28.1%) |
Occupancy by Age of Householder in Lenoir City
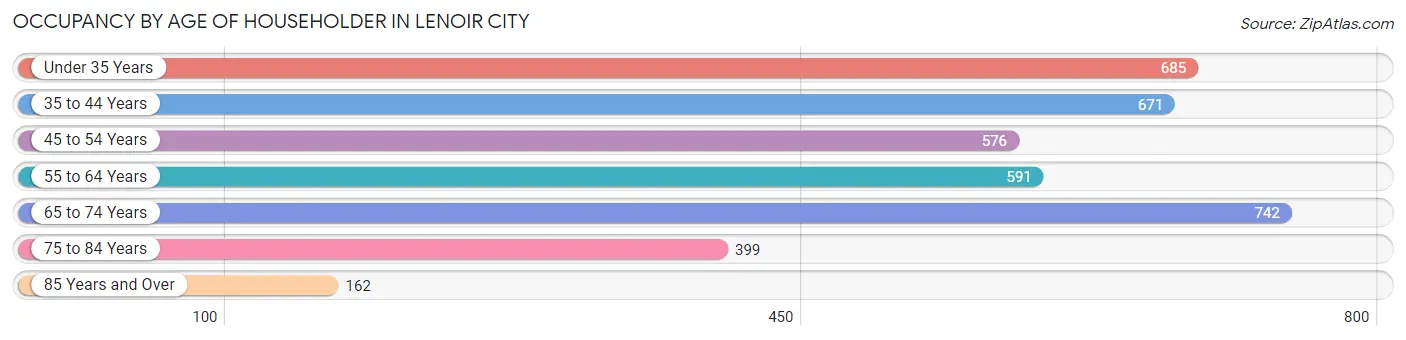
| Age Bracket | # Households | % Households |
| Under 35 Years | 685 | 17.9% |
| 35 to 44 Years | 671 | 17.5% |
| 45 to 54 Years | 576 | 15.0% |
| 55 to 64 Years | 591 | 15.4% |
| 65 to 74 Years | 742 | 19.4% |
| 75 to 84 Years | 399 | 10.4% |
| 85 Years and Over | 162 | 4.2% |
| Total | 3,826 | 100.0% |
Housing Finances in Lenoir City
Median Income by Occupancy in Lenoir City
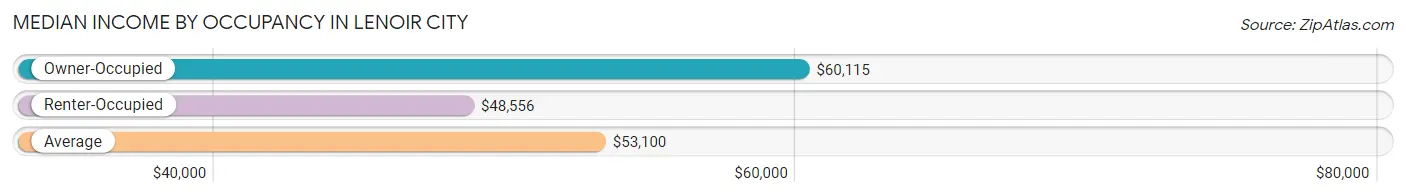
| Occupancy Type | # Households | Median Income |
| Owner-Occupied | 2,344 (61.3%) | $60,115 |
| Renter-Occupied | 1,482 (38.7%) | $48,556 |
| Average | 3,826 (100.0%) | $53,100 |
Occupancy by Householder Income Bracket in Lenoir City
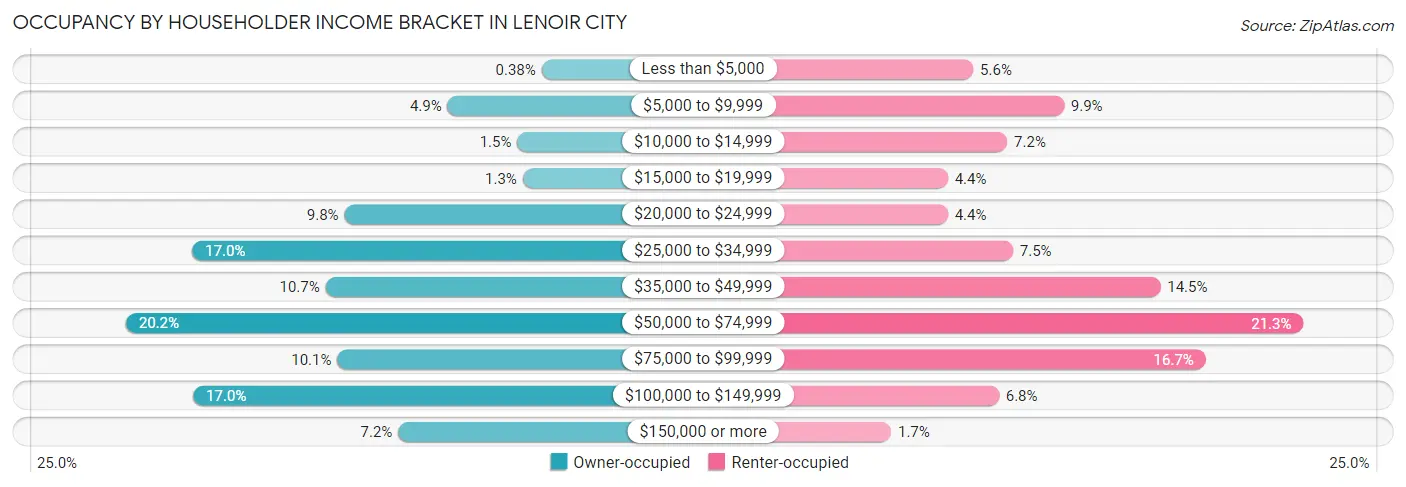
| Income Bracket | Owner-occupied | Renter-occupied |
| Less than $5,000 | 9 (0.4%) | 83 (5.6%) |
| $5,000 to $9,999 | 114 (4.9%) | 147 (9.9%) |
| $10,000 to $14,999 | 36 (1.5%) | 107 (7.2%) |
| $15,000 to $19,999 | 30 (1.3%) | 65 (4.4%) |
| $20,000 to $24,999 | 229 (9.8%) | 65 (4.4%) |
| $25,000 to $34,999 | 399 (17.0%) | 111 (7.5%) |
| $35,000 to $49,999 | 250 (10.7%) | 215 (14.5%) |
| $50,000 to $74,999 | 473 (20.2%) | 316 (21.3%) |
| $75,000 to $99,999 | 237 (10.1%) | 247 (16.7%) |
| $100,000 to $149,999 | 398 (17.0%) | 101 (6.8%) |
| $150,000 or more | 169 (7.2%) | 25 (1.7%) |
| Total | 2,344 (100.0%) | 1,482 (100.0%) |
Monthly Housing Cost Tiers in Lenoir City
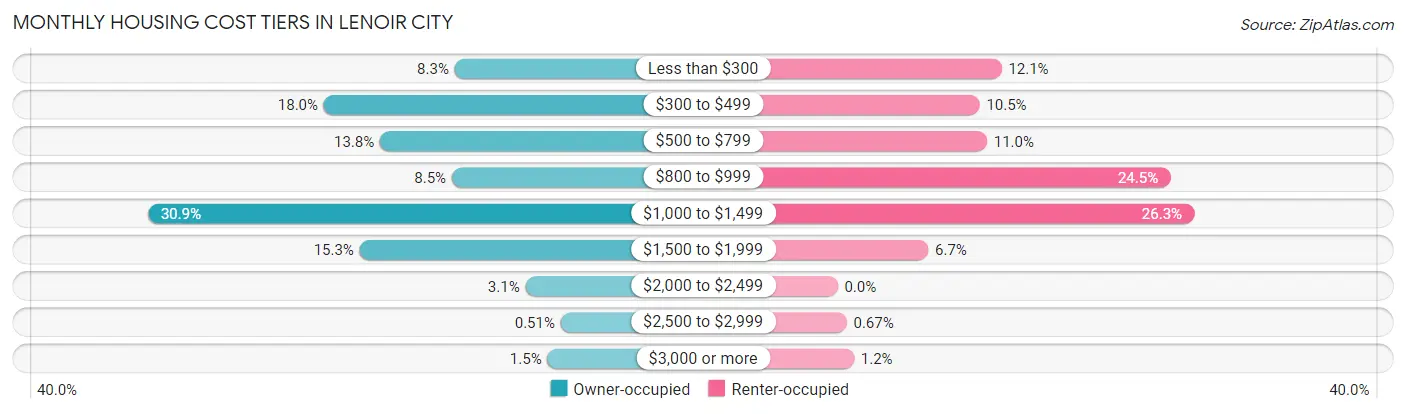
| Monthly Cost | Owner-occupied | Renter-occupied |
| Less than $300 | 195 (8.3%) | 179 (12.1%) |
| $300 to $499 | 421 (18.0%) | 155 (10.5%) |
| $500 to $799 | 324 (13.8%) | 163 (11.0%) |
| $800 to $999 | 200 (8.5%) | 363 (24.5%) |
| $1,000 to $1,499 | 725 (30.9%) | 389 (26.3%) |
| $1,500 to $1,999 | 359 (15.3%) | 99 (6.7%) |
| $2,000 to $2,499 | 73 (3.1%) | 0 (0.0%) |
| $2,500 to $2,999 | 12 (0.5%) | 10 (0.7%) |
| $3,000 or more | 35 (1.5%) | 18 (1.2%) |
| Total | 2,344 (100.0%) | 1,482 (100.0%) |
Physical Housing Characteristics in Lenoir City
Housing Structures in Lenoir City
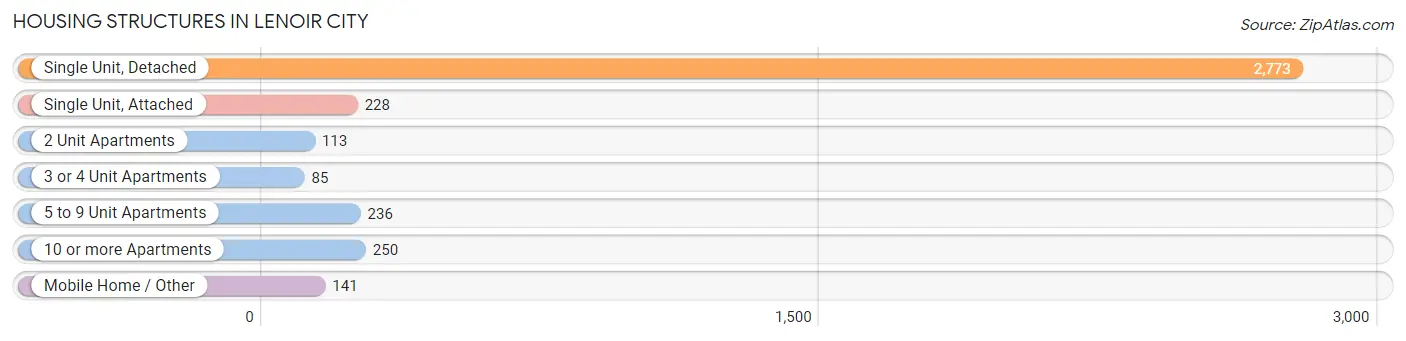
| Structure Type | # Housing Units | % Housing Units |
| Single Unit, Detached | 2,773 | 72.5% |
| Single Unit, Attached | 228 | 6.0% |
| 2 Unit Apartments | 113 | 2.9% |
| 3 or 4 Unit Apartments | 85 | 2.2% |
| 5 to 9 Unit Apartments | 236 | 6.2% |
| 10 or more Apartments | 250 | 6.5% |
| Mobile Home / Other | 141 | 3.7% |
| Total | 3,826 | 100.0% |
Housing Structures by Occupancy in Lenoir City
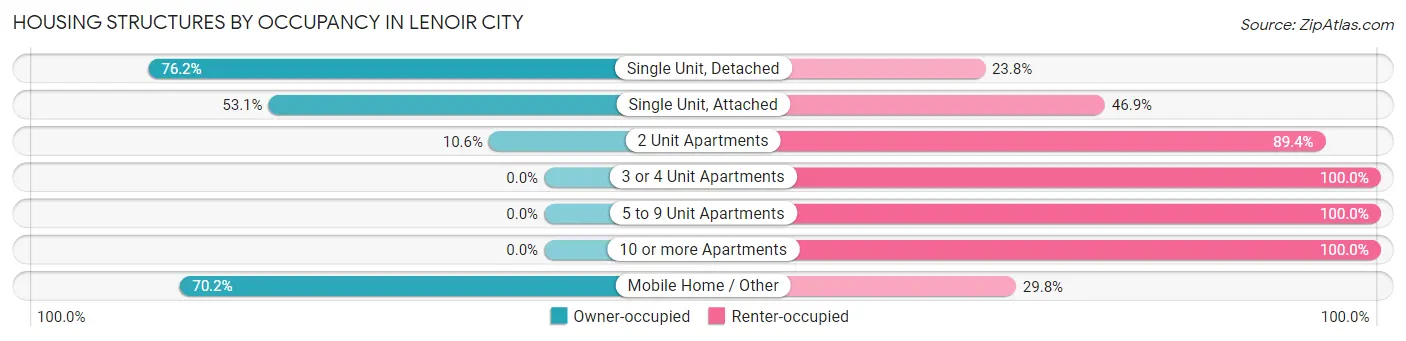
| Structure Type | Owner-occupied | Renter-occupied |
| Single Unit, Detached | 2,112 (76.2%) | 661 (23.8%) |
| Single Unit, Attached | 121 (53.1%) | 107 (46.9%) |
| 2 Unit Apartments | 12 (10.6%) | 101 (89.4%) |
| 3 or 4 Unit Apartments | 0 (0.0%) | 85 (100.0%) |
| 5 to 9 Unit Apartments | 0 (0.0%) | 236 (100.0%) |
| 10 or more Apartments | 0 (0.0%) | 250 (100.0%) |
| Mobile Home / Other | 99 (70.2%) | 42 (29.8%) |
| Total | 2,344 (61.3%) | 1,482 (38.7%) |
Housing Structures by Number of Rooms in Lenoir City
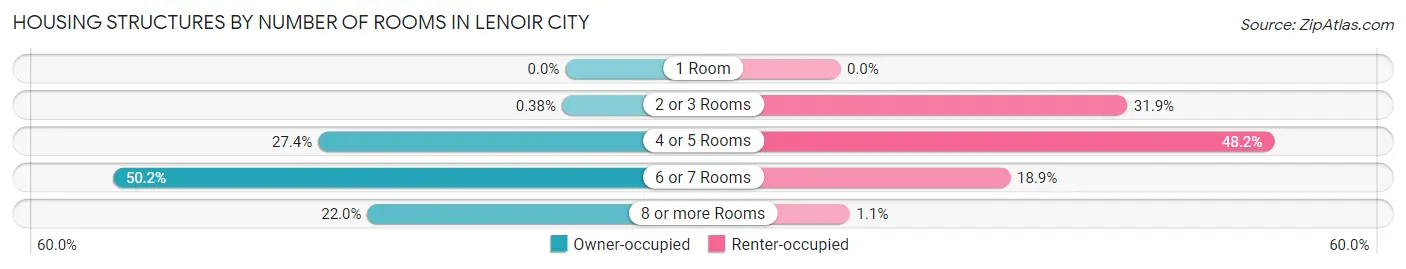
| Number of Rooms | Owner-occupied | Renter-occupied |
| 1 Room | 0 (0.0%) | 0 (0.0%) |
| 2 or 3 Rooms | 9 (0.4%) | 472 (31.9%) |
| 4 or 5 Rooms | 643 (27.4%) | 714 (48.2%) |
| 6 or 7 Rooms | 1,177 (50.2%) | 280 (18.9%) |
| 8 or more Rooms | 515 (22.0%) | 16 (1.1%) |
| Total | 2,344 (100.0%) | 1,482 (100.0%) |
Housing Structure by Heating Type in Lenoir City
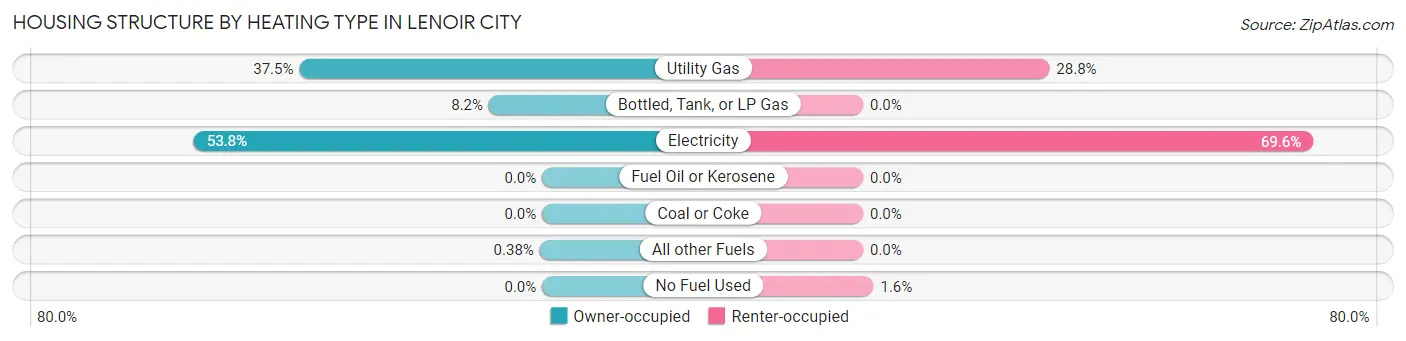
| Heating Type | Owner-occupied | Renter-occupied |
| Utility Gas | 880 (37.5%) | 427 (28.8%) |
| Bottled, Tank, or LP Gas | 193 (8.2%) | 0 (0.0%) |
| Electricity | 1,262 (53.8%) | 1,031 (69.6%) |
| Fuel Oil or Kerosene | 0 (0.0%) | 0 (0.0%) |
| Coal or Coke | 0 (0.0%) | 0 (0.0%) |
| All other Fuels | 9 (0.4%) | 0 (0.0%) |
| No Fuel Used | 0 (0.0%) | 24 (1.6%) |
| Total | 2,344 (100.0%) | 1,482 (100.0%) |
Household Vehicle Usage in Lenoir City
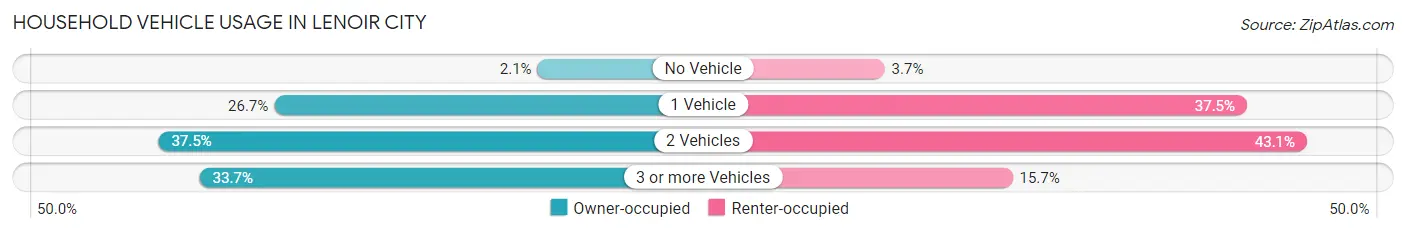
| Vehicles per Household | Owner-occupied | Renter-occupied |
| No Vehicle | 50 (2.1%) | 55 (3.7%) |
| 1 Vehicle | 626 (26.7%) | 556 (37.5%) |
| 2 Vehicles | 879 (37.5%) | 639 (43.1%) |
| 3 or more Vehicles | 789 (33.7%) | 232 (15.7%) |
| Total | 2,344 (100.0%) | 1,482 (100.0%) |
Real Estate & Mortgages in Lenoir City
Real Estate and Mortgage Overview in Lenoir City
| Characteristic | Without Mortgage | With Mortgage |
| Housing Units | 807 | 1,537 |
| Median Property Value | $140,200 | $218,100 |
| Median Household Income | $29,680 | $146 |
| Monthly Housing Costs | $349 | $35 |
| Real Estate Taxes | $669 | $119 |
Property Value by Mortgage Status in Lenoir City
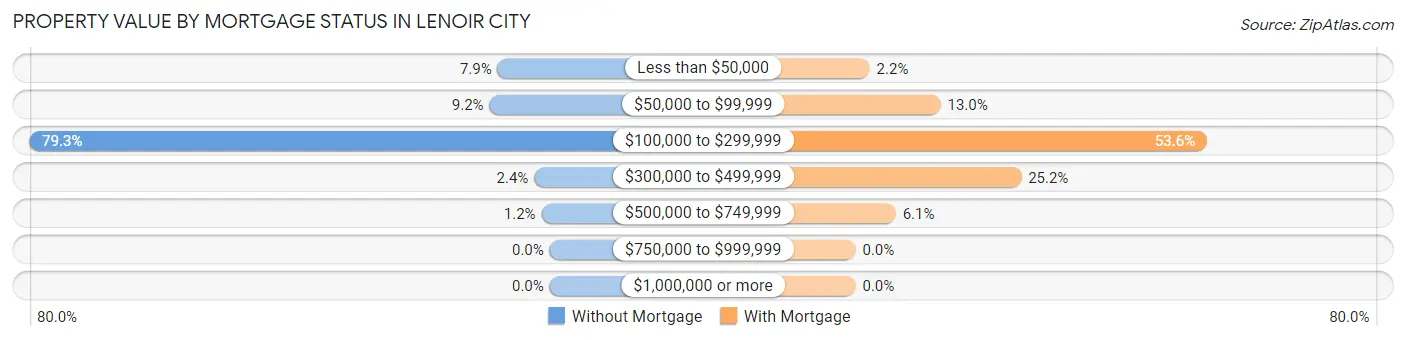
| Property Value | Without Mortgage | With Mortgage |
| Less than $50,000 | 64 (7.9%) | 33 (2.1%) |
| $50,000 to $99,999 | 74 (9.2%) | 199 (13.0%) |
| $100,000 to $299,999 | 640 (79.3%) | 823 (53.5%) |
| $300,000 to $499,999 | 19 (2.4%) | 388 (25.2%) |
| $500,000 to $749,999 | 10 (1.2%) | 94 (6.1%) |
| $750,000 to $999,999 | 0 (0.0%) | 0 (0.0%) |
| $1,000,000 or more | 0 (0.0%) | 0 (0.0%) |
| Total | 807 (100.0%) | 1,537 (100.0%) |
Household Income by Mortgage Status in Lenoir City
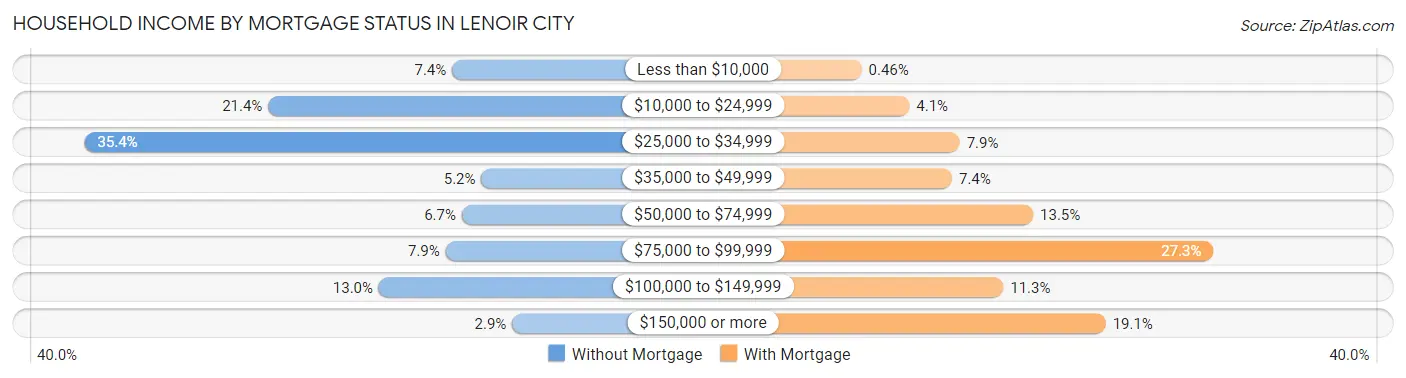
| Household Income | Without Mortgage | With Mortgage |
| Less than $10,000 | 60 (7.4%) | 7 (0.5%) |
| $10,000 to $24,999 | 173 (21.4%) | 63 (4.1%) |
| $25,000 to $34,999 | 286 (35.4%) | 122 (7.9%) |
| $35,000 to $49,999 | 42 (5.2%) | 113 (7.3%) |
| $50,000 to $74,999 | 54 (6.7%) | 208 (13.5%) |
| $75,000 to $99,999 | 64 (7.9%) | 419 (27.3%) |
| $100,000 to $149,999 | 105 (13.0%) | 173 (11.3%) |
| $150,000 or more | 23 (2.9%) | 293 (19.1%) |
| Total | 807 (100.0%) | 1,537 (100.0%) |
Property Value to Household Income Ratio in Lenoir City
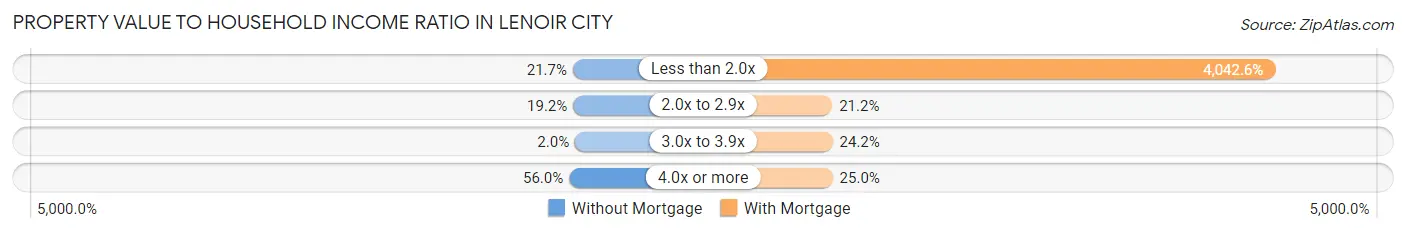
| Value-to-Income Ratio | Without Mortgage | With Mortgage |
| Less than 2.0x | 175 (21.7%) | 62,135 (4,042.6%) |
| 2.0x to 2.9x | 155 (19.2%) | 325 (21.1%) |
| 3.0x to 3.9x | 16 (2.0%) | 372 (24.2%) |
| 4.0x or more | 452 (56.0%) | 384 (25.0%) |
| Total | 807 (100.0%) | 1,537 (100.0%) |
Real Estate Taxes by Mortgage Status in Lenoir City
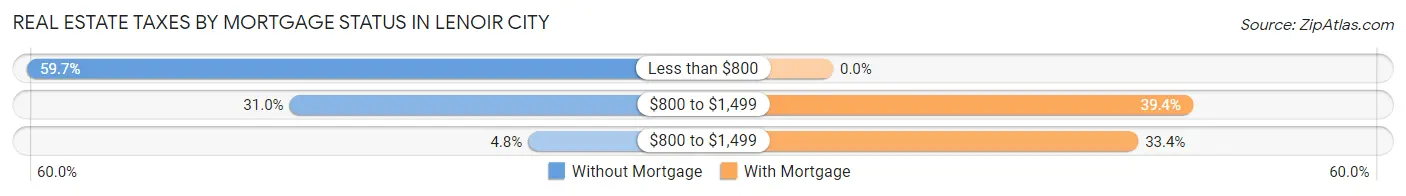
| Property Taxes | Without Mortgage | With Mortgage |
| Less than $800 | 482 (59.7%) | 0 (0.0%) |
| $800 to $1,499 | 250 (31.0%) | 606 (39.4%) |
| $800 to $1,499 | 39 (4.8%) | 514 (33.4%) |
| Total | 807 (100.0%) | 1,537 (100.0%) |
Health & Disability in Lenoir City
Health Insurance Coverage by Age in Lenoir City
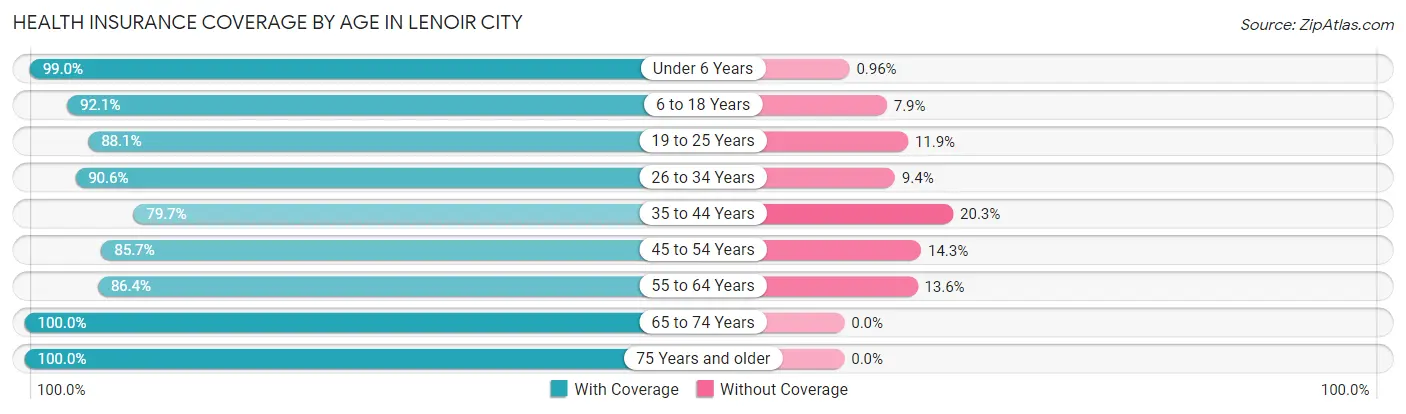
| Age Bracket | With Coverage | Without Coverage |
| Under 6 Years | 1,031 (99.0%) | 10 (1.0%) |
| 6 to 18 Years | 1,662 (92.1%) | 143 (7.9%) |
| 19 to 25 Years | 906 (88.1%) | 122 (11.9%) |
| 26 to 34 Years | 1,065 (90.6%) | 111 (9.4%) |
| 35 to 44 Years | 1,002 (79.7%) | 255 (20.3%) |
| 45 to 54 Years | 957 (85.7%) | 160 (14.3%) |
| 55 to 64 Years | 874 (86.4%) | 138 (13.6%) |
| 65 to 74 Years | 1,089 (100.0%) | 0 (0.0%) |
| 75 Years and older | 722 (100.0%) | 0 (0.0%) |
| Total | 9,308 (90.8%) | 939 (9.2%) |
Health Insurance Coverage by Citizenship Status in Lenoir City
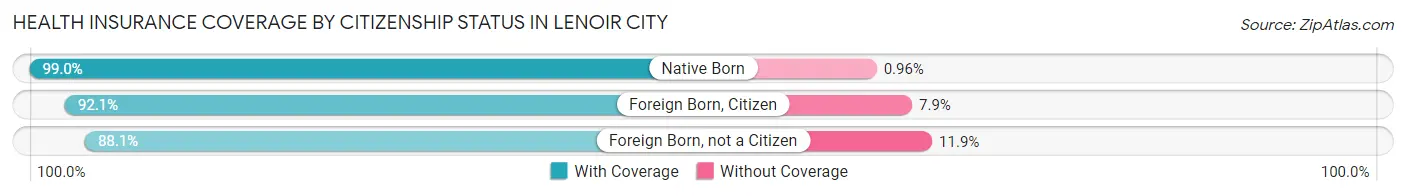
| Citizenship Status | With Coverage | Without Coverage |
| Native Born | 1,031 (99.0%) | 10 (1.0%) |
| Foreign Born, Citizen | 1,662 (92.1%) | 143 (7.9%) |
| Foreign Born, not a Citizen | 906 (88.1%) | 122 (11.9%) |
Health Insurance Coverage by Household Income in Lenoir City
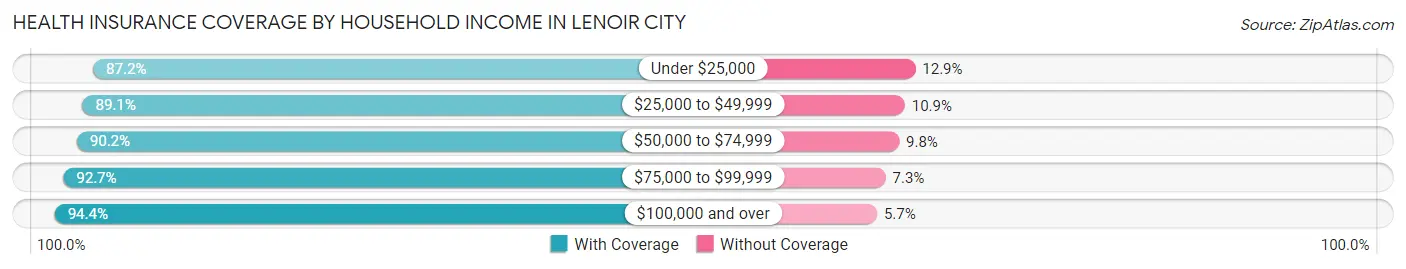
| Household Income | With Coverage | Without Coverage |
| Under $25,000 | 1,302 (87.2%) | 192 (12.9%) |
| $25,000 to $49,999 | 2,141 (89.1%) | 261 (10.9%) |
| $50,000 to $74,999 | 2,199 (90.2%) | 239 (9.8%) |
| $75,000 to $99,999 | 1,518 (92.7%) | 119 (7.3%) |
| $100,000 and over | 2,139 (94.4%) | 128 (5.7%) |
Public vs Private Health Insurance Coverage by Age in Lenoir City
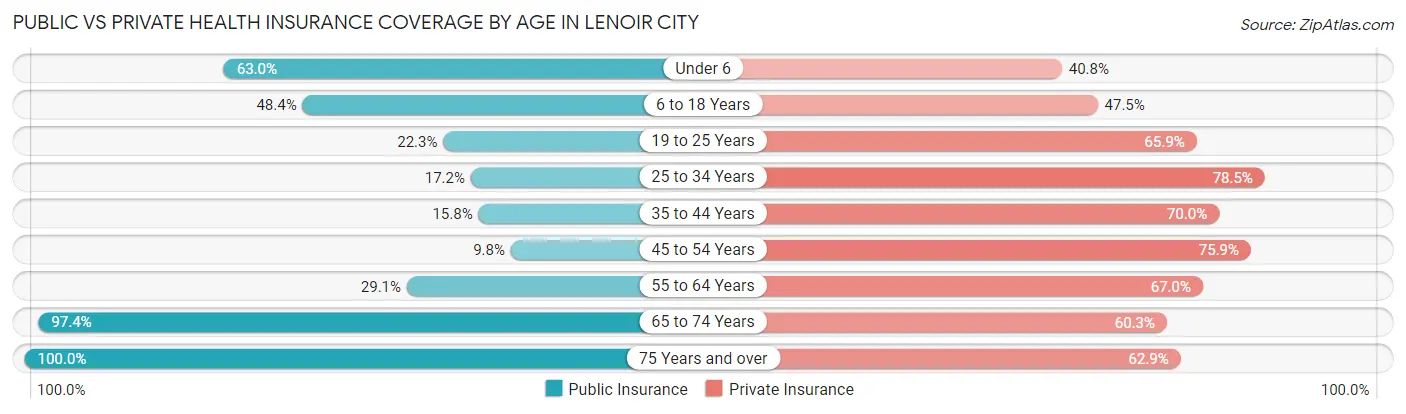
| Age Bracket | Public Insurance | Private Insurance |
| Under 6 | 656 (63.0%) | 425 (40.8%) |
| 6 to 18 Years | 874 (48.4%) | 857 (47.5%) |
| 19 to 25 Years | 229 (22.3%) | 677 (65.9%) |
| 25 to 34 Years | 202 (17.2%) | 923 (78.5%) |
| 35 to 44 Years | 198 (15.8%) | 880 (70.0%) |
| 45 to 54 Years | 109 (9.8%) | 848 (75.9%) |
| 55 to 64 Years | 294 (29.0%) | 678 (67.0%) |
| 65 to 74 Years | 1,061 (97.4%) | 657 (60.3%) |
| 75 Years and over | 722 (100.0%) | 454 (62.9%) |
| Total | 4,345 (42.4%) | 6,399 (62.5%) |
Disability Status by Sex by Age in Lenoir City
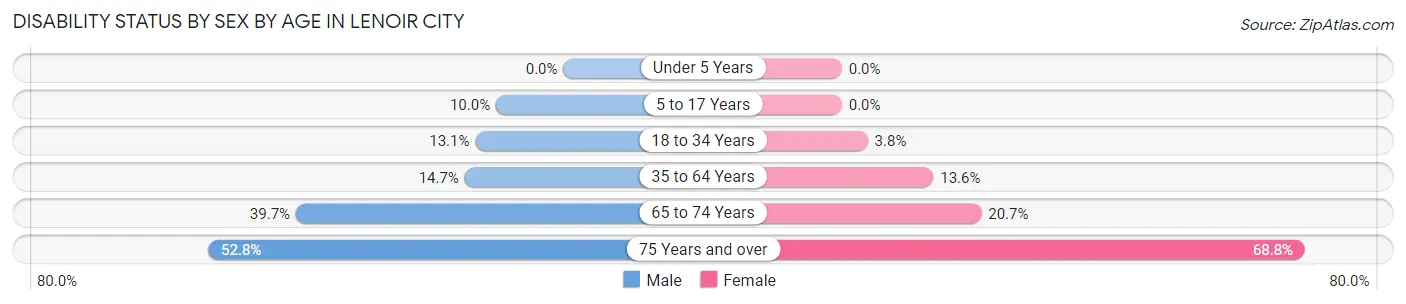
| Age Bracket | Male | Female |
| Under 5 Years | 0 (0.0%) | 0 (0.0%) |
| 5 to 17 Years | 76 (10.0%) | 0 (0.0%) |
| 18 to 34 Years | 178 (13.1%) | 41 (3.8%) |
| 35 to 64 Years | 218 (14.6%) | 258 (13.6%) |
| 65 to 74 Years | 164 (39.7%) | 140 (20.7%) |
| 75 Years and over | 163 (52.7%) | 284 (68.8%) |
Disability Class by Sex by Age in Lenoir City
Disability Class: Hearing Difficulty
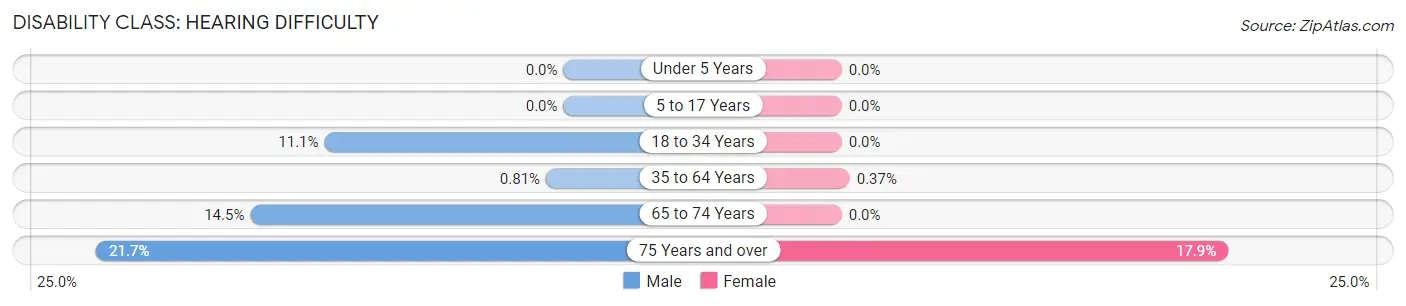
| Age Bracket | Male | Female |
| Under 5 Years | 0 (0.0%) | 0 (0.0%) |
| 5 to 17 Years | 0 (0.0%) | 0 (0.0%) |
| 18 to 34 Years | 151 (11.1%) | 0 (0.0%) |
| 35 to 64 Years | 12 (0.8%) | 7 (0.4%) |
| 65 to 74 Years | 60 (14.5%) | 0 (0.0%) |
| 75 Years and over | 67 (21.7%) | 74 (17.9%) |
Disability Class: Vision Difficulty
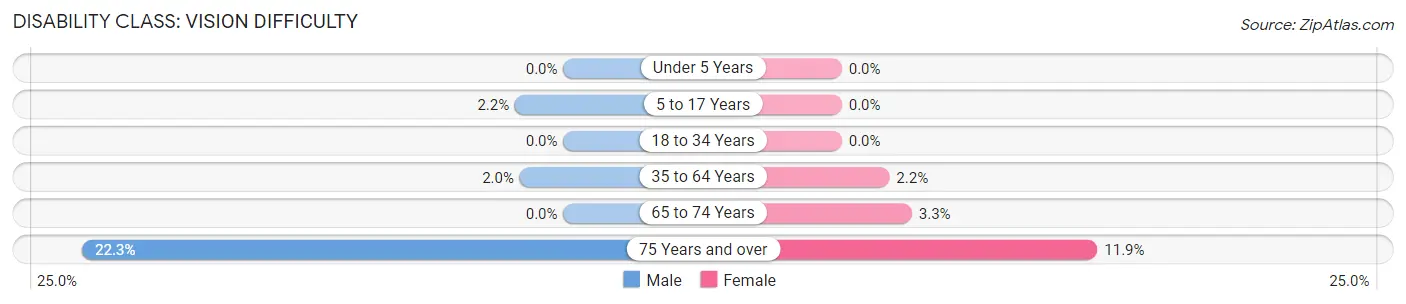
| Age Bracket | Male | Female |
| Under 5 Years | 0 (0.0%) | 0 (0.0%) |
| 5 to 17 Years | 17 (2.2%) | 0 (0.0%) |
| 18 to 34 Years | 0 (0.0%) | 0 (0.0%) |
| 35 to 64 Years | 30 (2.0%) | 42 (2.2%) |
| 65 to 74 Years | 0 (0.0%) | 22 (3.3%) |
| 75 Years and over | 69 (22.3%) | 49 (11.9%) |
Disability Class: Cognitive Difficulty
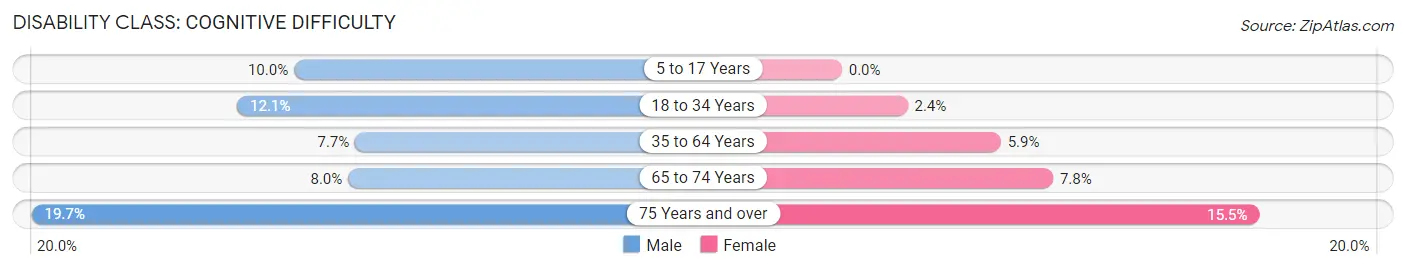
| Age Bracket | Male | Female |
| 5 to 17 Years | 76 (10.0%) | 0 (0.0%) |
| 18 to 34 Years | 165 (12.1%) | 26 (2.4%) |
| 35 to 64 Years | 115 (7.7%) | 112 (5.9%) |
| 65 to 74 Years | 33 (8.0%) | 53 (7.8%) |
| 75 Years and over | 61 (19.7%) | 64 (15.5%) |
Disability Class: Ambulatory Difficulty
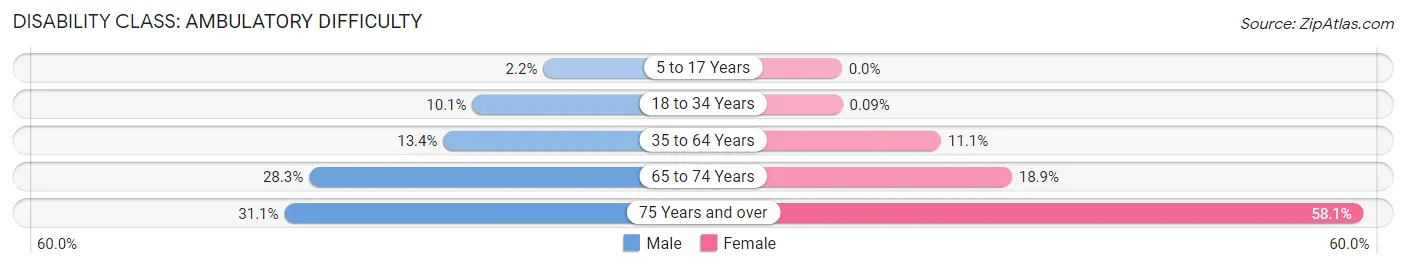
| Age Bracket | Male | Female |
| 5 to 17 Years | 17 (2.2%) | 0 (0.0%) |
| 18 to 34 Years | 138 (10.1%) | 1 (0.1%) |
| 35 to 64 Years | 199 (13.4%) | 210 (11.1%) |
| 65 to 74 Years | 117 (28.3%) | 128 (18.9%) |
| 75 Years and over | 96 (31.1%) | 240 (58.1%) |
Disability Class: Self-Care Difficulty
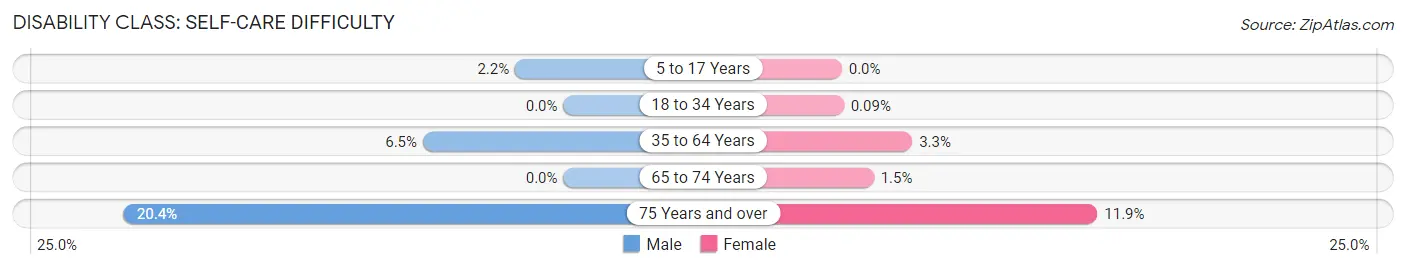
| Age Bracket | Male | Female |
| 5 to 17 Years | 17 (2.2%) | 0 (0.0%) |
| 18 to 34 Years | 0 (0.0%) | 1 (0.1%) |
| 35 to 64 Years | 97 (6.5%) | 62 (3.3%) |
| 65 to 74 Years | 0 (0.0%) | 10 (1.5%) |
| 75 Years and over | 63 (20.4%) | 49 (11.9%) |
Technology Access in Lenoir City
Computing Device Access in Lenoir City
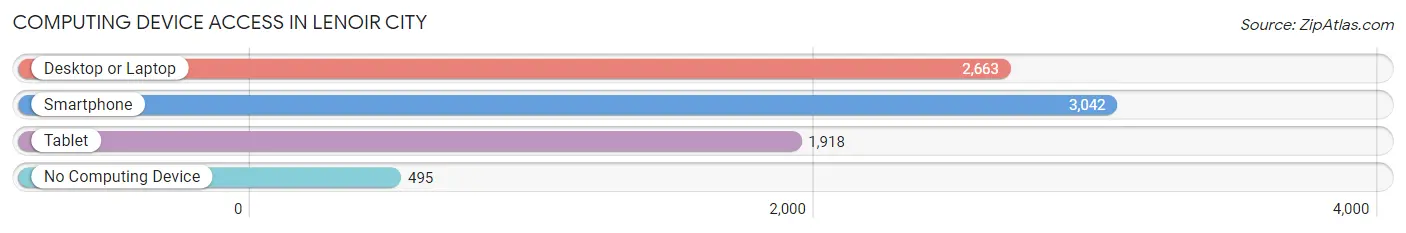
| Device Type | # Households | % Households |
| Desktop or Laptop | 2,663 | 69.6% |
| Smartphone | 3,042 | 79.5% |
| Tablet | 1,918 | 50.1% |
| No Computing Device | 495 | 12.9% |
| Total | 3,826 | 100.0% |
Internet Access in Lenoir City
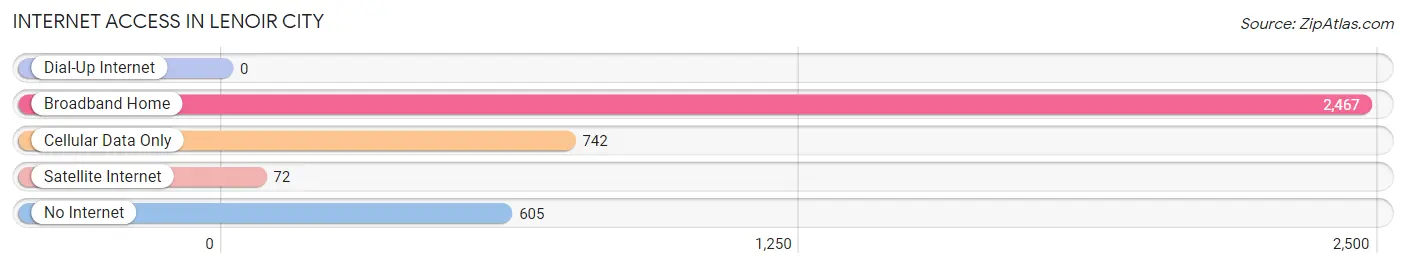
| Internet Type | # Households | % Households |
| Dial-Up Internet | 0 | 0.0% |
| Broadband Home | 2,467 | 64.5% |
| Cellular Data Only | 742 | 19.4% |
| Satellite Internet | 72 | 1.9% |
| No Internet | 605 | 15.8% |
| Total | 3,826 | 100.0% |
Lenoir City Summary
History
The city of Lenoir City, Tennessee is located in Loudon County, and is part of the Knoxville Metropolitan Statistical Area. The city was founded in 1810 by William Ballard Lenoir, a Revolutionary War veteran, and was originally known as Lenoir’s Station. The city was named after Lenoir’s father, General William Lenoir, who was a prominent figure in the American Revolution. The city was incorporated in 1891 and has since grown to become a thriving community.
Lenoir City has a rich history that dates back to the early 1800s. During the Civil War, the city was a major supply center for the Confederate Army. The city was also the site of a major battle in 1863, when Union forces attempted to capture the city. The Union forces were unsuccessful, and the city remained in Confederate hands until the end of the war.
In the late 1800s, Lenoir City became a major industrial center, with several factories and mills located in the city. The city was also home to several large farms, which provided food for the local population. The city was also home to several large businesses, including a cotton mill, a paper mill, and a furniture factory.
In the early 1900s, Lenoir City experienced a period of growth and prosperity. The city was home to several large businesses, including a cotton mill, a paper mill, and a furniture factory. The city also had several banks, a movie theater, and a number of churches.
In the mid-1900s, Lenoir City experienced a period of decline. The factories and mills closed, and the city’s population began to decline. The city was also hit hard by the Great Depression, and many of the businesses in the city closed.
In the late 1900s, Lenoir City began to experience a period of revitalization. The city was home to several new businesses, including a shopping center, a movie theater, and a number of restaurants. The city also experienced a period of population growth, as new residents moved to the city.
Geography
Lenoir City is located in the eastern part of Tennessee, in Loudon County. The city is situated on the banks of the Tennessee River, and is surrounded by rolling hills and forests. The city is located approximately 25 miles south of Knoxville, and is part of the Knoxville Metropolitan Statistical Area.
The city has a total area of 8.3 square miles, of which 8.2 square miles is land and 0.1 square miles is water. The city is located at an elevation of 845 feet above sea level.
Economy
Lenoir City’s economy is largely based on manufacturing and retail. The city is home to several large factories and mills, including a paper mill, a furniture factory, and a cotton mill. The city is also home to several large retail stores, including a shopping center, a movie theater, and a number of restaurants.
The city is also home to several large businesses, including a bank, a hospital, and a number of churches. The city is also home to several educational institutions, including a community college and a technical school.
Demographics
As of the 2010 census, the population of Lenoir City was 6,418. The city has a population density of 771.3 people per square mile. The median age of the city’s population is 38.7 years, and the median household income is $41,945.
The city is predominantly white, with 87.3% of the population identifying as white. The city also has a large Hispanic population, with 8.3% of the population identifying as Hispanic or Latino. The city also has a small African American population, with 2.2% of the population identifying as African American.
Conclusion
Lenoir City, Tennessee is a thriving city with a rich history and a vibrant economy. The city is home to several large businesses, including a paper mill, a furniture factory, and a cotton mill. The city is also home to several large retail stores, including a shopping center, a movie theater, and a number of restaurants. The city is predominantly white, with 87.3% of the population identifying as white. The city also has a large Hispanic population, with 8.3% of the population identifying as Hispanic or Latino. The city also has a small African American population, with 2.2% of the population identifying as African American.
Common Questions
What is Per Capita Income in Lenoir City?
Per Capita income in Lenoir City is $25,273.
What is the Median Family Income in Lenoir City?
Median Family Income in Lenoir City is $61,171.
What is the Median Household income in Lenoir City?
Median Household Income in Lenoir City is $53,100.
What is Income or Wage Gap in Lenoir City?
Income or Wage Gap in Lenoir City is 40.0%.
Women in Lenoir City earn 60.0 cents for every dollar earned by a man.
What is Inequality or Gini Index in Lenoir City?
Inequality or Gini Index in Lenoir City is 0.42.
What is the Total Population of Lenoir City?
Total Population of Lenoir City is 10,291.
What is the Total Male Population of Lenoir City?
Total Male Population of Lenoir City is 4,804.
What is the Total Female Population of Lenoir City?
Total Female Population of Lenoir City is 5,487.
What is the Ratio of Males per 100 Females in Lenoir City?
There are 87.55 Males per 100 Females in Lenoir City.
What is the Ratio of Females per 100 Males in Lenoir City?
There are 114.22 Females per 100 Males in Lenoir City.
What is the Median Population Age in Lenoir City?
Median Population Age in Lenoir City is 35.9 Years.
What is the Average Family Size in Lenoir City
Average Family Size in Lenoir City is 3.4 People.
What is the Average Household Size in Lenoir City
Average Household Size in Lenoir City is 2.7 People.
How Large is the Labor Force in Lenoir City?
There are 4,745 People in the Labor Forcein in Lenoir City.
What is the Percentage of People in the Labor Force in Lenoir City?
60.5% of People are in the Labor Force in Lenoir City.
What is the Unemployment Rate in Lenoir City?
Unemployment Rate in Lenoir City is 4.0%.