Cities with the Most Immigrants from Caribbean in Tennessee
RELATED REPORTS & OPTIONS
Caribbean
Tennessee
Compare Cities
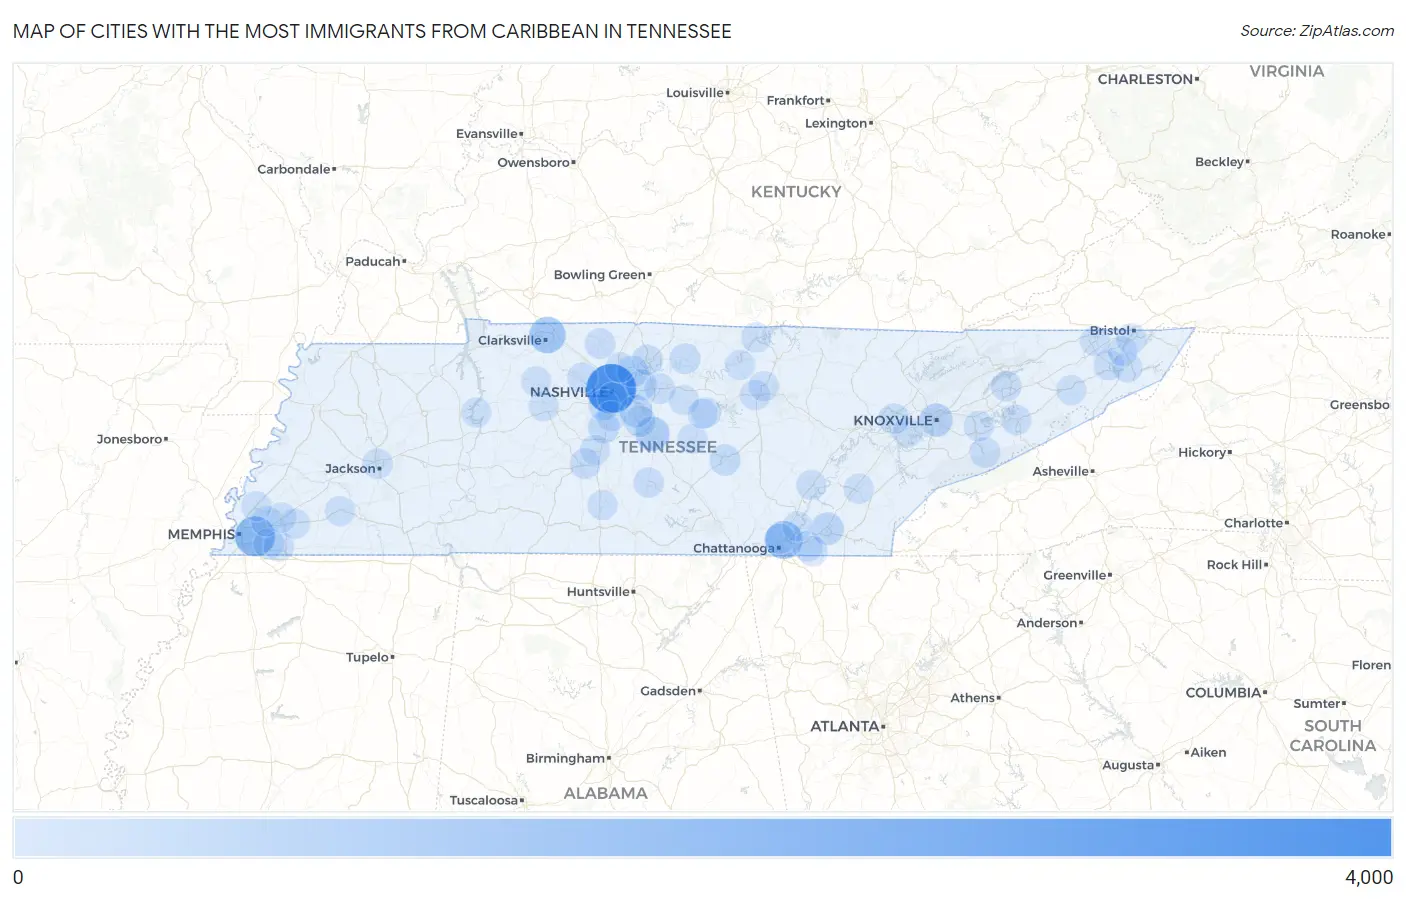
Map of Cities with the Most Immigrants from Caribbean in Tennessee
0
4,000
Cities with the Most Immigrants from Caribbean in Tennessee
| City | Caribbean | vs State | vs National | |
| 1. | Nashville | 3,125 | 13,259(23.57%)#1 | 4,544,093(0.07%)#174 |
| 2. | Memphis | 1,562 | 13,259(11.78%)#2 | 4,544,093(0.03%)#305 |
| 3. | Chattanooga | 1,169 | 13,259(8.82%)#3 | 4,544,093(0.03%)#378 |
| 4. | Clarksville | 952 | 13,259(7.18%)#4 | 4,544,093(0.02%)#433 |
| 5. | Murfreesboro | 616 | 13,259(4.65%)#5 | 4,544,093(0.01%)#596 |
| 6. | Knoxville | 469 | 13,259(3.54%)#6 | 4,544,093(0.01%)#698 |
| 7. | Cleveland | 361 | 13,259(2.72%)#7 | 4,544,093(0.01%)#862 |
| 8. | La Vergne | 323 | 13,259(2.44%)#8 | 4,544,093(0.01%)#946 |
| 9. | Hendersonville | 206 | 13,259(1.55%)#9 | 4,544,093(0.00%)#1,306 |
| 10. | Smyrna | 192 | 13,259(1.45%)#10 | 4,544,093(0.00%)#1,378 |
| 11. | Franklin | 191 | 13,259(1.44%)#11 | 4,544,093(0.00%)#1,382 |
| 12. | Mcminnville | 167 | 13,259(1.26%)#12 | 4,544,093(0.00%)#1,517 |
| 13. | Mount Juliet | 136 | 13,259(1.03%)#13 | 4,544,093(0.00%)#1,715 |
| 14. | Gallatin | 114 | 13,259(0.86%)#14 | 4,544,093(0.00%)#1,919 |
| 15. | Germantown | 113 | 13,259(0.85%)#15 | 4,544,093(0.00%)#1,925 |
| 16. | Forest Hills | 113 | 13,259(0.85%)#16 | 4,544,093(0.00%)#1,931 |
| 17. | Hartsville Trousdale County | 103 | 13,259(0.78%)#17 | 4,544,093(0.00%)#2,045 |
| 18. | Oak Ridge | 98 | 13,259(0.74%)#18 | 4,544,093(0.00%)#2,104 |
| 19. | Columbia | 85 | 13,259(0.64%)#19 | 4,544,093(0.00%)#2,295 |
| 20. | Ashland City | 74 | 13,259(0.56%)#20 | 4,544,093(0.00%)#2,493 |
| 21. | Springfield | 70 | 13,259(0.53%)#21 | 4,544,093(0.00%)#2,548 |
| 22. | Johnson City | 66 | 13,259(0.50%)#22 | 4,544,093(0.00%)#2,617 |
| 23. | Lebanon | 62 | 13,259(0.47%)#23 | 4,544,093(0.00%)#2,691 |
| 24. | Collierville | 58 | 13,259(0.44%)#24 | 4,544,093(0.00%)#2,789 |
| 25. | Gatlinburg | 58 | 13,259(0.44%)#25 | 4,544,093(0.00%)#2,803 |
| 26. | Morristown | 50 | 13,259(0.38%)#26 | 4,544,093(0.00%)#2,989 |
| 27. | Bartlett | 40 | 13,259(0.30%)#27 | 4,544,093(0.00%)#3,296 |
| 28. | Newport | 39 | 13,259(0.29%)#28 | 4,544,093(0.00%)#3,338 |
| 29. | Jackson | 35 | 13,259(0.26%)#29 | 4,544,093(0.00%)#3,471 |
| 30. | Bristol | 31 | 13,259(0.23%)#30 | 4,544,093(0.00%)#3,644 |
| 31. | Cookeville | 28 | 13,259(0.21%)#31 | 4,544,093(0.00%)#3,770 |
| 32. | Shelbyville | 28 | 13,259(0.21%)#32 | 4,544,093(0.00%)#3,775 |
| 33. | Sevierville | 26 | 13,259(0.20%)#33 | 4,544,093(0.00%)#3,868 |
| 34. | Oakland | 26 | 13,259(0.20%)#34 | 4,544,093(0.00%)#3,883 |
| 35. | Brentwood | 25 | 13,259(0.19%)#35 | 4,544,093(0.00%)#3,925 |
| 36. | Farragut | 24 | 13,259(0.18%)#36 | 4,544,093(0.00%)#3,991 |
| 37. | Elizabethton | 21 | 13,259(0.16%)#37 | 4,544,093(0.00%)#4,159 |
| 38. | Arlington | 18 | 13,259(0.14%)#38 | 4,544,093(0.00%)#4,372 |
| 39. | Collegedale | 18 | 13,259(0.14%)#39 | 4,544,093(0.00%)#4,379 |
| 40. | Berry Hill | 18 | 13,259(0.14%)#40 | 4,544,093(0.00%)#4,412 |
| 41. | Celina | 14 | 13,259(0.11%)#41 | 4,544,093(0.00%)#4,722 |
| 42. | Algood | 13 | 13,259(0.10%)#42 | 4,544,093(0.00%)#4,782 |
| 43. | Kingsport | 11 | 13,259(0.08%)#43 | 4,544,093(0.00%)#4,929 |
| 44. | Goodlettsville | 11 | 13,259(0.08%)#44 | 4,544,093(0.00%)#4,944 |
| 45. | Dickson | 10 | 13,259(0.08%)#45 | 4,544,093(0.00%)#5,060 |
| 46. | Apison | 10 | 13,259(0.08%)#46 | 4,544,093(0.00%)#5,099 |
| 47. | Lakesite | 10 | 13,259(0.08%)#47 | 4,544,093(0.00%)#5,131 |
| 48. | Tusculum | 9 | 13,259(0.07%)#48 | 4,544,093(0.00%)#5,248 |
| 49. | Spring Hill | 8 | 13,259(0.06%)#49 | 4,544,093(0.00%)#5,306 |
| 50. | Whiteville | 8 | 13,259(0.06%)#50 | 4,544,093(0.00%)#5,349 |
| 51. | Athens | 7 | 13,259(0.05%)#51 | 4,544,093(0.00%)#5,442 |
| 52. | Vanleer | 6 | 13,259(0.05%)#52 | 4,544,093(0.00%)#5,700 |
| 53. | Dowelltown | 6 | 13,259(0.05%)#53 | 4,544,093(0.00%)#5,709 |
| 54. | Cornersville | 5 | 13,259(0.04%)#54 | 4,544,093(0.00%)#5,790 |
| 55. | Dayton | 4 | 13,259(0.03%)#55 | 4,544,093(0.00%)#5,886 |
| 56. | Woodbury | 4 | 13,259(0.03%)#56 | 4,544,093(0.00%)#5,905 |
| 57. | Bluff City | 4 | 13,259(0.03%)#57 | 4,544,093(0.00%)#5,915 |
| 58. | Gainesboro | 4 | 13,259(0.03%)#58 | 4,544,093(0.00%)#5,956 |
| 59. | New Johnsonville | 3 | 13,259(0.02%)#59 | 4,544,093(0.00%)#6,058 |
| 60. | Watertown | 3 | 13,259(0.02%)#60 | 4,544,093(0.00%)#6,063 |
| 61. | Red Bank | 2 | 13,259(0.02%)#61 | 4,544,093(0.00%)#6,155 |
| 62. | Millington | 2 | 13,259(0.02%)#62 | 4,544,093(0.00%)#6,160 |
| 63. | Liberty | 2 | 13,259(0.02%)#63 | 4,544,093(0.00%)#6,284 |
Common Questions
What are the Top 10 Cities with the Most Immigrants from Caribbean in Tennessee?
Top 10 Cities with the Most Immigrants from Caribbean in Tennessee are:
#1
3,125
#2
1,562
#3
1,169
#4
952
#5
616
#6
469
#7
361
#8
323
#9
206
#10
192
What city has the Most Immigrants from Caribbean in Tennessee?
Nashville has the Most Immigrants from Caribbean in Tennessee with 3,125.
What is the Total Immigrants from Caribbean in the State of Tennessee?
Total Immigrants from Caribbean in Tennessee is 13,259.
What is the Total Immigrants from Caribbean in the United States?
Total Immigrants from Caribbean in the United States is 4,544,093.