Seymour, TN Map & Demographics
Seymour Map
Seymour Overview
$37,472
PER CAPITA INCOME
$89,571
AVG FAMILY INCOME
$78,898
AVG HOUSEHOLD INCOME
35.6%
WAGE / INCOME GAP [ % ]
64.4¢/ $1
WAGE / INCOME GAP [ $ ]
0.45
INEQUALITY / GINI INDEX
16,081
TOTAL POPULATION
7,521
MALE POPULATION
8,560
FEMALE POPULATION
87.86
MALES / 100 FEMALES
113.81
FEMALES / 100 MALES
42.4
MEDIAN AGE
3.1
AVG FAMILY SIZE
2.7
AVG HOUSEHOLD SIZE
8,136
LABOR FORCE [ PEOPLE ]
62.7%
PERCENT IN LABOR FORCE
6.0%
UNEMPLOYMENT RATE
Seymour Zip Codes
Income in Seymour
Income Overview in Seymour
Per Capita Income in Seymour is $37,472, while median incomes of families and households are $89,571 and $78,898 respectively.
| Characteristic | Number | Measure |
| Per Capita Income | 16,081 | $37,472 |
| Median Family Income | 4,357 | $89,571 |
| Mean Family Income | 4,357 | $117,047 |
| Median Household Income | 5,896 | $78,898 |
| Mean Household Income | 5,896 | $102,629 |
| Income Deficit | 4,357 | $0 |
| Wage / Income Gap (%) | 16,081 | 35.63% |
| Wage / Income Gap ($) | 16,081 | 64.37¢ per $1 |
| Gini / Inequality Index | 16,081 | 0.45 |
Earnings by Sex in Seymour
Average Earnings in Seymour are $40,786, $54,468 for men and $35,063 for women, a difference of 35.6%.
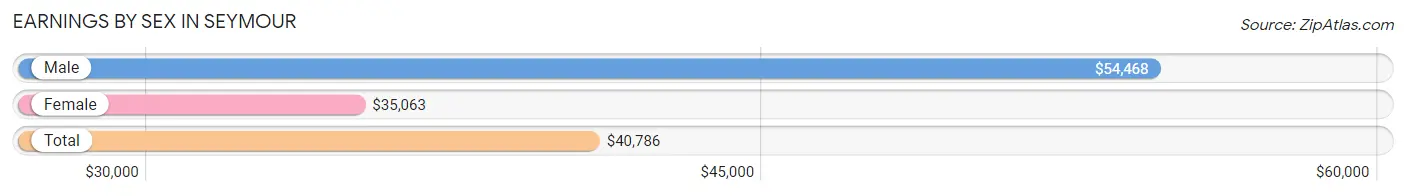
| Sex | Number | Average Earnings |
| Male | 4,304 (51.9%) | $54,468 |
| Female | 3,991 (48.1%) | $35,063 |
| Total | 8,295 (100.0%) | $40,786 |
Earnings by Sex by Income Bracket in Seymour
The most common earnings brackets in Seymour are $100,000+ for men (861 | 20.0%) and $35,000 to $39,999 for women (365 | 9.1%).
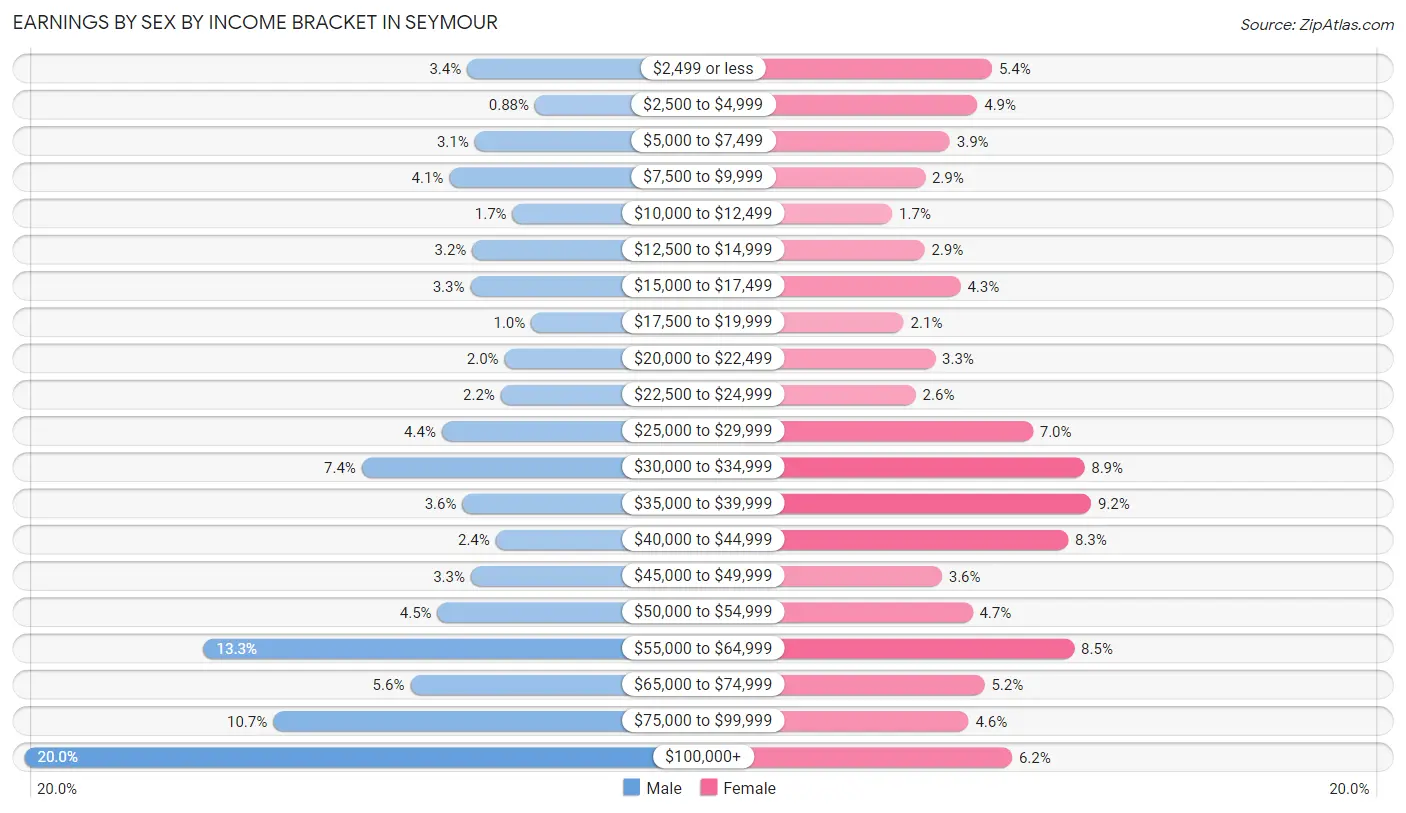
| Income | Male | Female |
| $2,499 or less | 147 (3.4%) | 217 (5.4%) |
| $2,500 to $4,999 | 38 (0.9%) | 195 (4.9%) |
| $5,000 to $7,499 | 135 (3.1%) | 154 (3.9%) |
| $7,500 to $9,999 | 176 (4.1%) | 117 (2.9%) |
| $10,000 to $12,499 | 74 (1.7%) | 68 (1.7%) |
| $12,500 to $14,999 | 139 (3.2%) | 116 (2.9%) |
| $15,000 to $17,499 | 142 (3.3%) | 170 (4.3%) |
| $17,500 to $19,999 | 44 (1.0%) | 85 (2.1%) |
| $20,000 to $22,499 | 87 (2.0%) | 132 (3.3%) |
| $22,500 to $24,999 | 93 (2.2%) | 103 (2.6%) |
| $25,000 to $29,999 | 188 (4.4%) | 278 (7.0%) |
| $30,000 to $34,999 | 317 (7.4%) | 355 (8.9%) |
| $35,000 to $39,999 | 155 (3.6%) | 365 (9.1%) |
| $40,000 to $44,999 | 101 (2.4%) | 331 (8.3%) |
| $45,000 to $49,999 | 141 (3.3%) | 142 (3.6%) |
| $50,000 to $54,999 | 195 (4.5%) | 188 (4.7%) |
| $55,000 to $64,999 | 572 (13.3%) | 340 (8.5%) |
| $65,000 to $74,999 | 239 (5.6%) | 206 (5.2%) |
| $75,000 to $99,999 | 460 (10.7%) | 182 (4.6%) |
| $100,000+ | 861 (20.0%) | 247 (6.2%) |
| Total | 4,304 (100.0%) | 3,991 (100.0%) |
Earnings by Sex by Educational Attainment in Seymour
Average earnings in Seymour are $58,927 for men and $36,623 for women, a difference of 37.9%. Men with an educational attainment of graduate degree enjoy the highest average annual earnings of $121,098, while those with high school diploma education earn the least with $52,846. Women with an educational attainment of graduate degree earn the most with the average annual earnings of $66,827, while those with high school diploma education have the smallest earnings of $27,185.
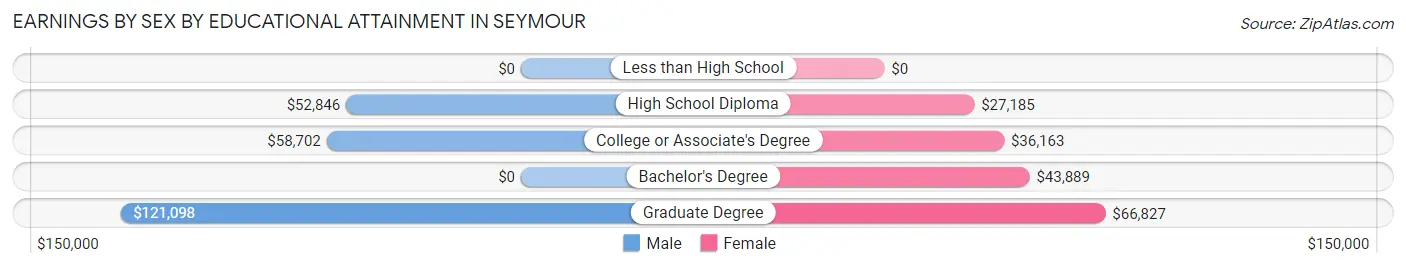
| Educational Attainment | Male Income | Female Income |
| Less than High School | - | - |
| High School Diploma | $52,846 | $27,185 |
| College or Associate's Degree | $58,702 | $36,163 |
| Bachelor's Degree | - | - |
| Graduate Degree | $121,098 | $66,827 |
| Total | $58,927 | $36,623 |
Family Income in Seymour
Family Income Brackets in Seymour
According to the Seymour family income data, there are 1,124 families falling into the $100,000 to $149,999 income range, which is the most common income bracket and makes up 25.8% of all families. Conversely, the $10,000 to $14,999 income bracket is the least frequent group with only 78 families (1.8%) belonging to this category.
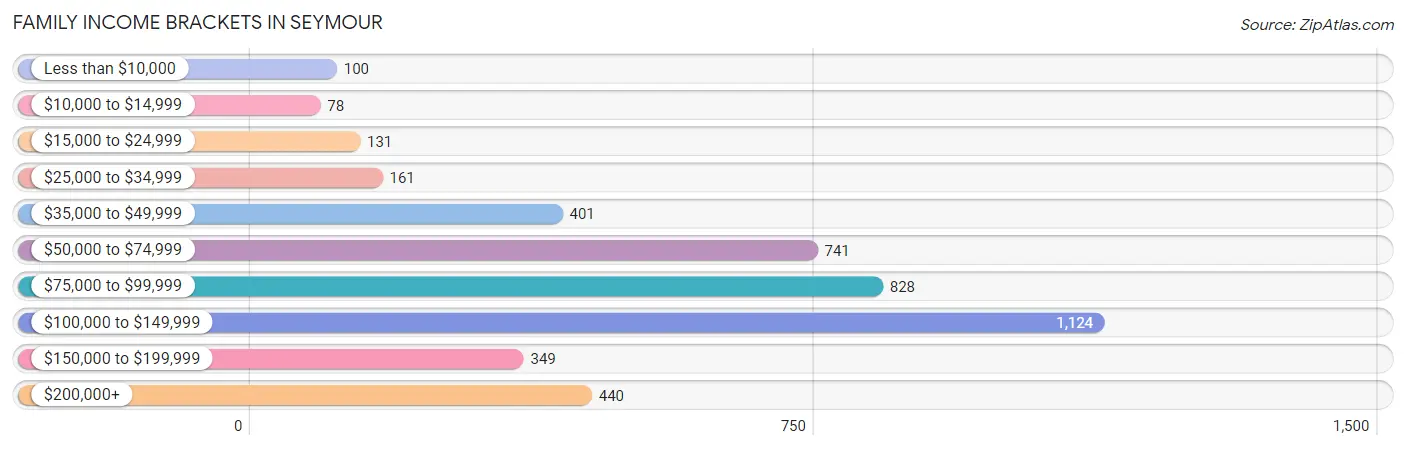
| Income Bracket | # Families | % Families |
| Less than $10,000 | 100 | 2.3% |
| $10,000 to $14,999 | 78 | 1.8% |
| $15,000 to $24,999 | 131 | 3.0% |
| $25,000 to $34,999 | 161 | 3.7% |
| $35,000 to $49,999 | 401 | 9.2% |
| $50,000 to $74,999 | 741 | 17.0% |
| $75,000 to $99,999 | 828 | 19.0% |
| $100,000 to $149,999 | 1,124 | 25.8% |
| $150,000 to $199,999 | 349 | 8.0% |
| $200,000+ | 440 | 10.1% |
Family Income by Famaliy Size in Seymour
6-person families (120 | 2.8%) account for the highest median family income in Seymour with $150,962 per family, while 2-person families (1,991 | 45.7%) have the highest median income of $38,416 per family member.
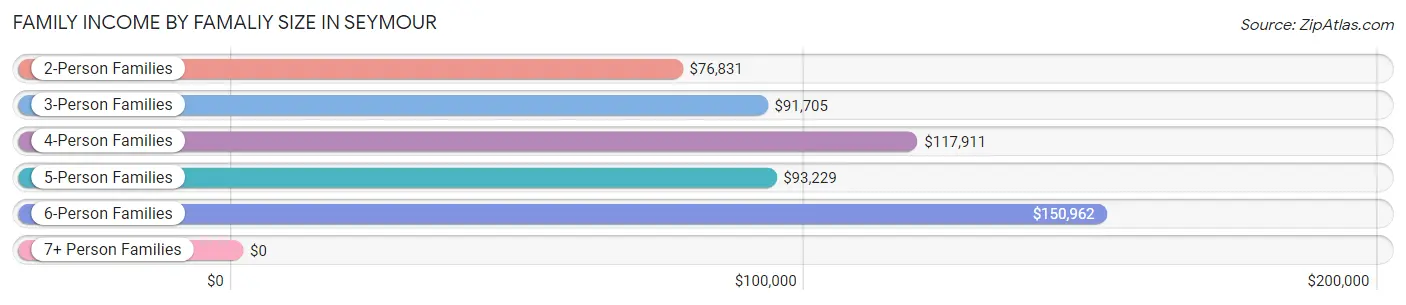
| Income Bracket | # Families | Median Income |
| 2-Person Families | 1,991 (45.7%) | $76,831 |
| 3-Person Families | 926 (21.2%) | $91,705 |
| 4-Person Families | 922 (21.2%) | $117,911 |
| 5-Person Families | 291 (6.7%) | $93,229 |
| 6-Person Families | 120 (2.8%) | $150,962 |
| 7+ Person Families | 107 (2.5%) | $0 |
| Total | 4,357 (100.0%) | $89,571 |
Family Income by Number of Earners in Seymour
The median family income in Seymour is $89,571, with families comprising 3+ earners (630) having the highest median family income of $123,750, while families with no earners (585) have the lowest median family income of $43,125, accounting for 14.5% and 13.4% of families, respectively.
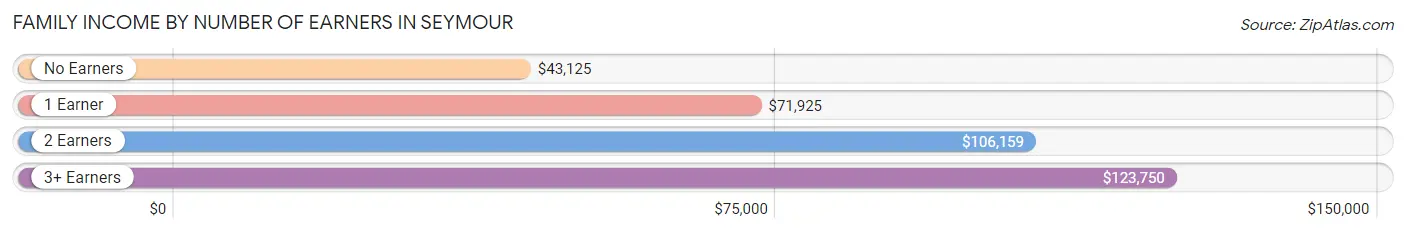
| Number of Earners | # Families | Median Income |
| No Earners | 585 (13.4%) | $43,125 |
| 1 Earner | 1,381 (31.7%) | $71,925 |
| 2 Earners | 1,761 (40.4%) | $106,159 |
| 3+ Earners | 630 (14.5%) | $123,750 |
| Total | 4,357 (100.0%) | $89,571 |
Household Income in Seymour
Household Income Brackets in Seymour
With 1,332 households falling in the category, the $100,000 to $149,999 income range is the most frequent in Seymour, accounting for 22.6% of all households. In contrast, only 147 households (2.5%) fall into the $10,000 to $14,999 income bracket, making it the least populous group.
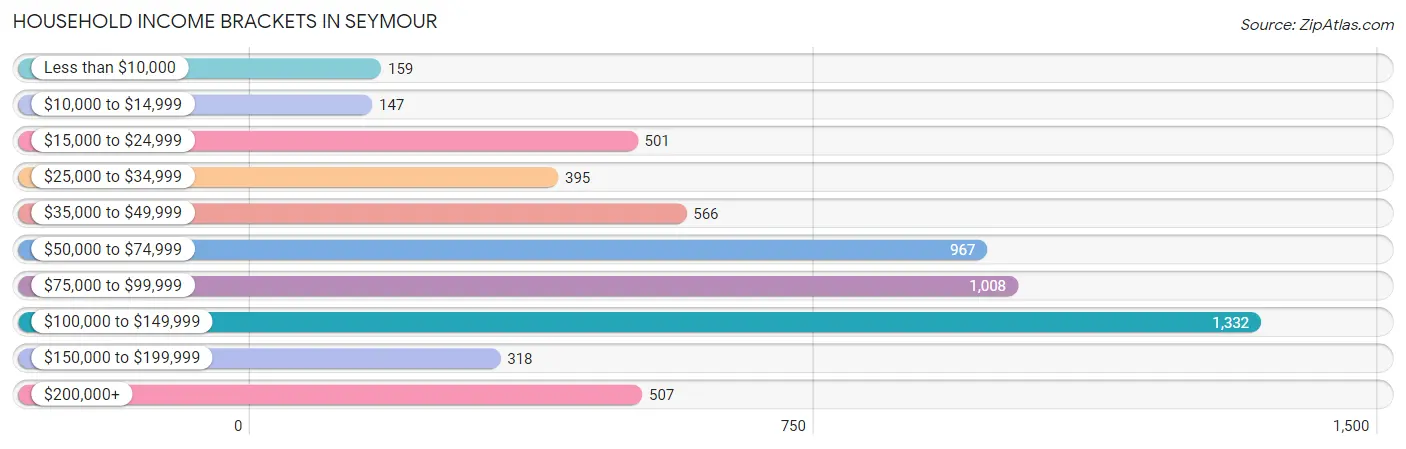
| Income Bracket | # Households | % Households |
| Less than $10,000 | 159 | 2.7% |
| $10,000 to $14,999 | 147 | 2.5% |
| $15,000 to $24,999 | 501 | 8.5% |
| $25,000 to $34,999 | 395 | 6.7% |
| $35,000 to $49,999 | 566 | 9.6% |
| $50,000 to $74,999 | 967 | 16.4% |
| $75,000 to $99,999 | 1,008 | 17.1% |
| $100,000 to $149,999 | 1,332 | 22.6% |
| $150,000 to $199,999 | 318 | 5.4% |
| $200,000+ | 507 | 8.6% |
Household Income by Householder Age in Seymour
The median household income in Seymour is $78,898, with the highest median household income of $101,019 found in the 45 to 64 years age bracket for the primary householder. A total of 2,479 households (42.0%) fall into this category. Meanwhile, the 65+ years age bracket for the primary householder has the lowest median household income of $37,804, with 1,729 households (29.3%) in this group.
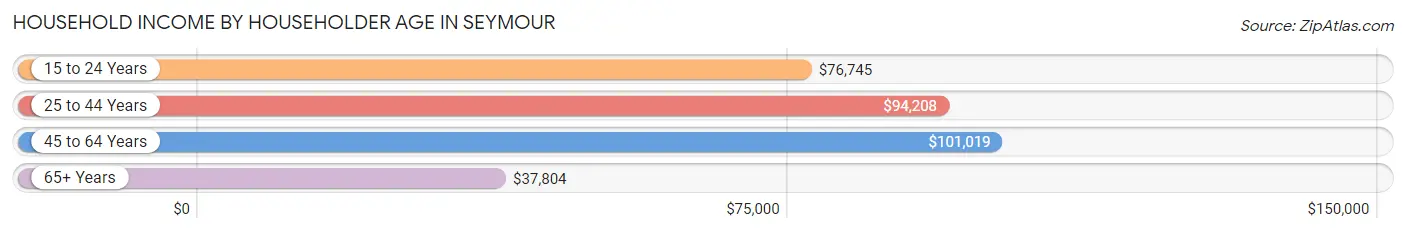
| Income Bracket | # Households | Median Income |
| 15 to 24 Years | 139 (2.4%) | $76,745 |
| 25 to 44 Years | 1,549 (26.3%) | $94,208 |
| 45 to 64 Years | 2,479 (42.0%) | $101,019 |
| 65+ Years | 1,729 (29.3%) | $37,804 |
| Total | 5,896 (100.0%) | $78,898 |
Poverty in Seymour
Income Below Poverty by Sex and Age in Seymour
With 5.5% poverty level for males and 8.8% for females among the residents of Seymour, 12 to 14 year old males and under 5 year old females are the most vulnerable to poverty, with 69 males (17.3%) and 56 females (23.3%) in their respective age groups living below the poverty level.
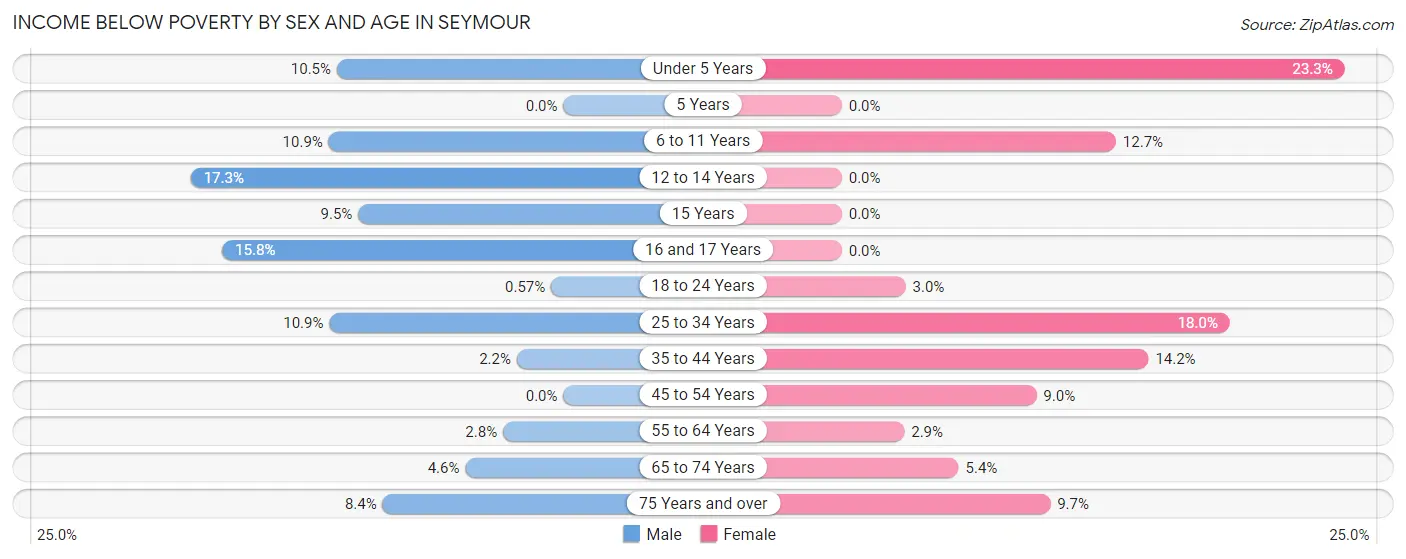
| Age Bracket | Male | Female |
| Under 5 Years | 62 (10.5%) | 56 (23.3%) |
| 5 Years | 0 (0.0%) | 0 (0.0%) |
| 6 to 11 Years | 38 (10.9%) | 71 (12.7%) |
| 12 to 14 Years | 69 (17.3%) | 0 (0.0%) |
| 15 Years | 14 (9.5%) | 0 (0.0%) |
| 16 and 17 Years | 22 (15.8%) | 0 (0.0%) |
| 18 to 24 Years | 5 (0.6%) | 15 (3.0%) |
| 25 to 34 Years | 91 (10.9%) | 142 (18.0%) |
| 35 to 44 Years | 19 (2.2%) | 146 (14.2%) |
| 45 to 54 Years | 0 (0.0%) | 143 (9.0%) |
| 55 to 64 Years | 30 (2.8%) | 30 (2.9%) |
| 65 to 74 Years | 26 (4.5%) | 46 (5.4%) |
| 75 Years and over | 35 (8.4%) | 85 (9.7%) |
| Total | 411 (5.5%) | 734 (8.8%) |
Income Above Poverty by Sex and Age in Seymour
According to the poverty statistics in Seymour, males aged 5 years and females aged 5 years are the age groups that are most secure financially, with 100.0% of males and 100.0% of females in these age groups living above the poverty line.
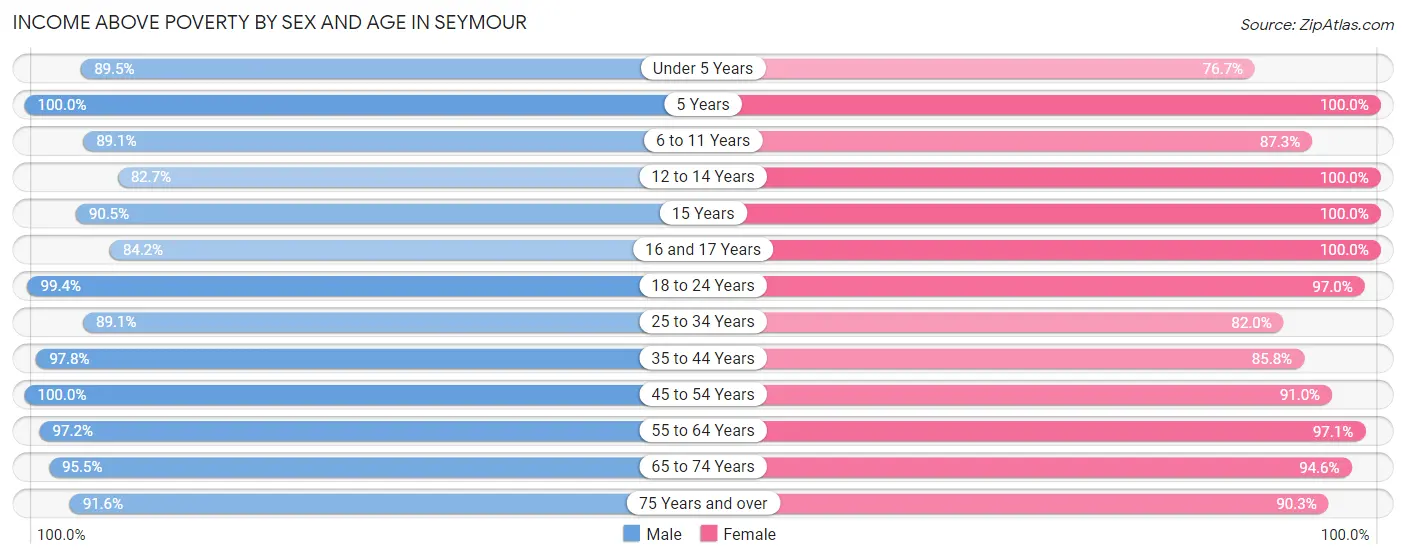
| Age Bracket | Male | Female |
| Under 5 Years | 528 (89.5%) | 184 (76.7%) |
| 5 Years | 8 (100.0%) | 73 (100.0%) |
| 6 to 11 Years | 311 (89.1%) | 487 (87.3%) |
| 12 to 14 Years | 330 (82.7%) | 338 (100.0%) |
| 15 Years | 133 (90.5%) | 167 (100.0%) |
| 16 and 17 Years | 117 (84.2%) | 298 (100.0%) |
| 18 to 24 Years | 867 (99.4%) | 492 (97.0%) |
| 25 to 34 Years | 747 (89.1%) | 647 (82.0%) |
| 35 to 44 Years | 860 (97.8%) | 880 (85.8%) |
| 45 to 54 Years | 1,224 (100.0%) | 1,440 (91.0%) |
| 55 to 64 Years | 1,040 (97.2%) | 1,005 (97.1%) |
| 65 to 74 Years | 546 (95.5%) | 802 (94.6%) |
| 75 Years and over | 382 (91.6%) | 794 (90.3%) |
| Total | 7,093 (94.5%) | 7,607 (91.2%) |
Income Below Poverty Among Married-Couple Families in Seymour
The poverty statistics for married-couple families in Seymour show that 2.1% or 76 of the total 3,702 families live below the poverty line. Families with 3 or 4 children have the highest poverty rate of 15.6%, comprising of 25 families. On the other hand, families with 1 or 2 children have the lowest poverty rate of 0.0%, which includes 0 families.
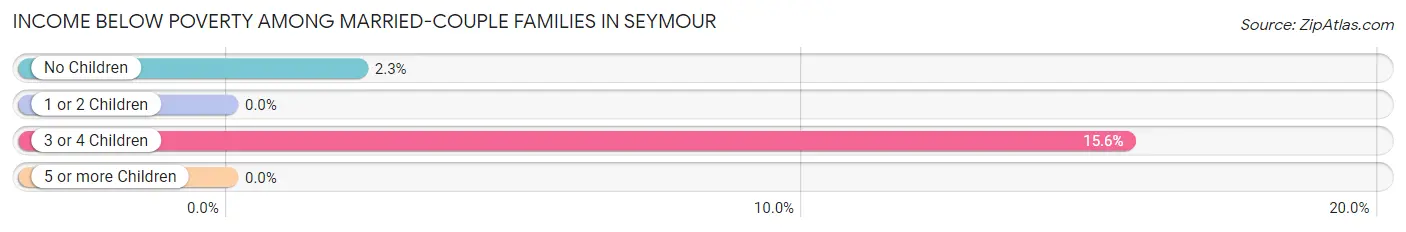
| Children | Above Poverty | Below Poverty |
| No Children | 2,209 (97.7%) | 51 (2.3%) |
| 1 or 2 Children | 1,175 (100.0%) | 0 (0.0%) |
| 3 or 4 Children | 135 (84.4%) | 25 (15.6%) |
| 5 or more Children | 107 (100.0%) | 0 (0.0%) |
| Total | 3,626 (98.0%) | 76 (2.1%) |
Income Below Poverty Among Single-Parent Households in Seymour
According to the poverty data in Seymour, 9.5% or 21 single-father households and 28.6% or 124 single-mother households are living below the poverty line. Among single-father households, those with 1 or 2 children have the highest poverty rate, with 21 households (11.2%) experiencing poverty. Likewise, among single-mother households, those with 5 or more children have the highest poverty rate, with 3 households (100.0%) falling below the poverty line.
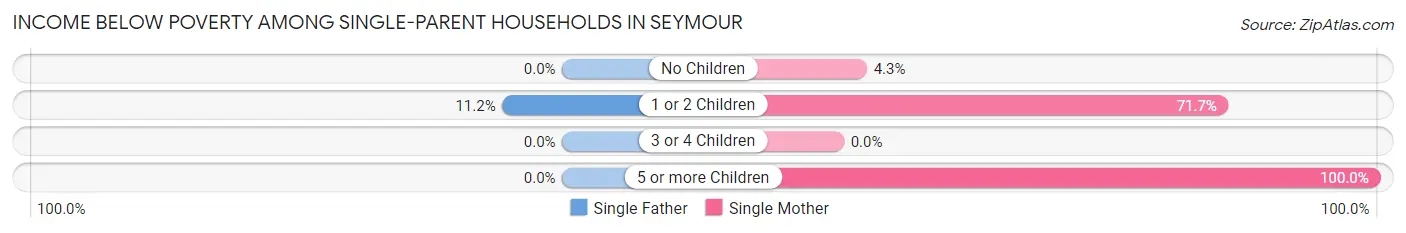
| Children | Single Father | Single Mother |
| No Children | 0 (0.0%) | 12 (4.3%) |
| 1 or 2 Children | 21 (11.2%) | 109 (71.7%) |
| 3 or 4 Children | 0 (0.0%) | 0 (0.0%) |
| 5 or more Children | 0 (0.0%) | 3 (100.0%) |
| Total | 21 (9.5%) | 124 (28.6%) |
Income Below Poverty Among Married-Couple vs Single-Parent Households in Seymour
The poverty data for Seymour shows that 76 of the married-couple family households (2.1%) and 145 of the single-parent households (22.1%) are living below the poverty level. Within the married-couple family households, those with 3 or 4 children have the highest poverty rate, with 25 households (15.6%) falling below the poverty line. Among the single-parent households, those with 5 or more children have the highest poverty rate, with 3 household (100.0%) living below poverty.
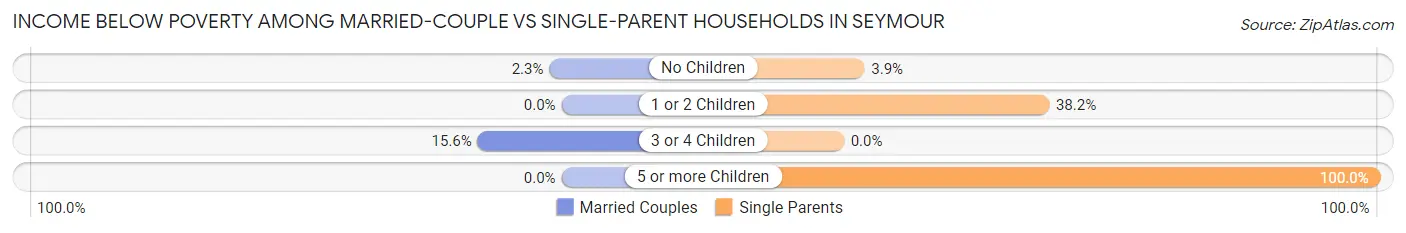
| Children | Married-Couple Families | Single-Parent Households |
| No Children | 51 (2.3%) | 12 (3.8%) |
| 1 or 2 Children | 0 (0.0%) | 130 (38.2%) |
| 3 or 4 Children | 25 (15.6%) | 0 (0.0%) |
| 5 or more Children | 0 (0.0%) | 3 (100.0%) |
| Total | 76 (2.1%) | 145 (22.1%) |
Race in Seymour
The most populous races in Seymour are White / Caucasian (15,328 | 95.3%), Two or more Races (500 | 3.1%), and Hispanic or Latino (238 | 1.5%).
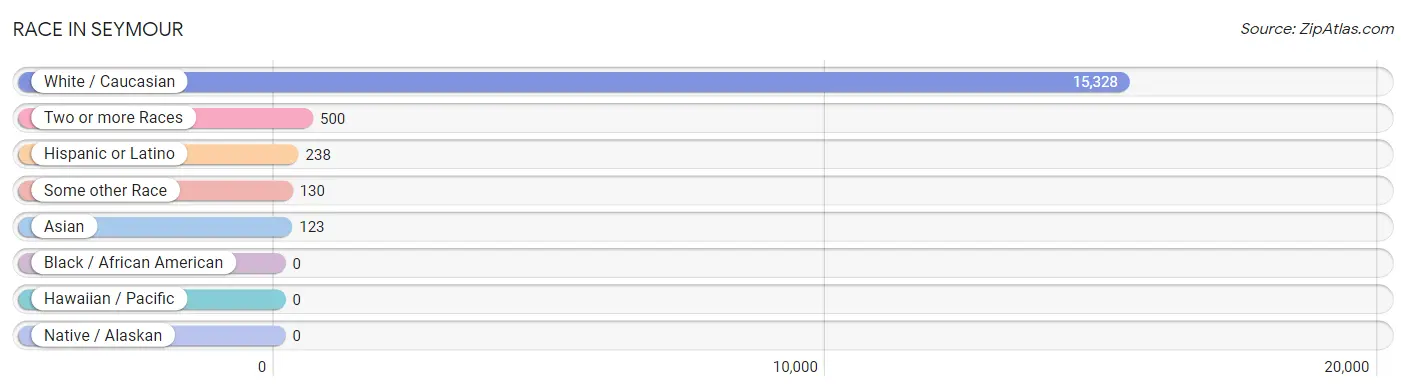
| Race | # Population | % Population |
| Asian | 123 | 0.8% |
| Black / African American | 0 | 0.0% |
| Hawaiian / Pacific | 0 | 0.0% |
| Hispanic or Latino | 238 | 1.5% |
| Native / Alaskan | 0 | 0.0% |
| White / Caucasian | 15,328 | 95.3% |
| Two or more Races | 500 | 3.1% |
| Some other Race | 130 | 0.8% |
| Total | 16,081 | 100.0% |
Ancestry in Seymour
The most populous ancestries reported in Seymour are American (2,558 | 15.9%), Irish (2,284 | 14.2%), English (2,264 | 14.1%), German (1,831 | 11.4%), and Scottish (671 | 4.2%), together accounting for 59.7% of all Seymour residents.
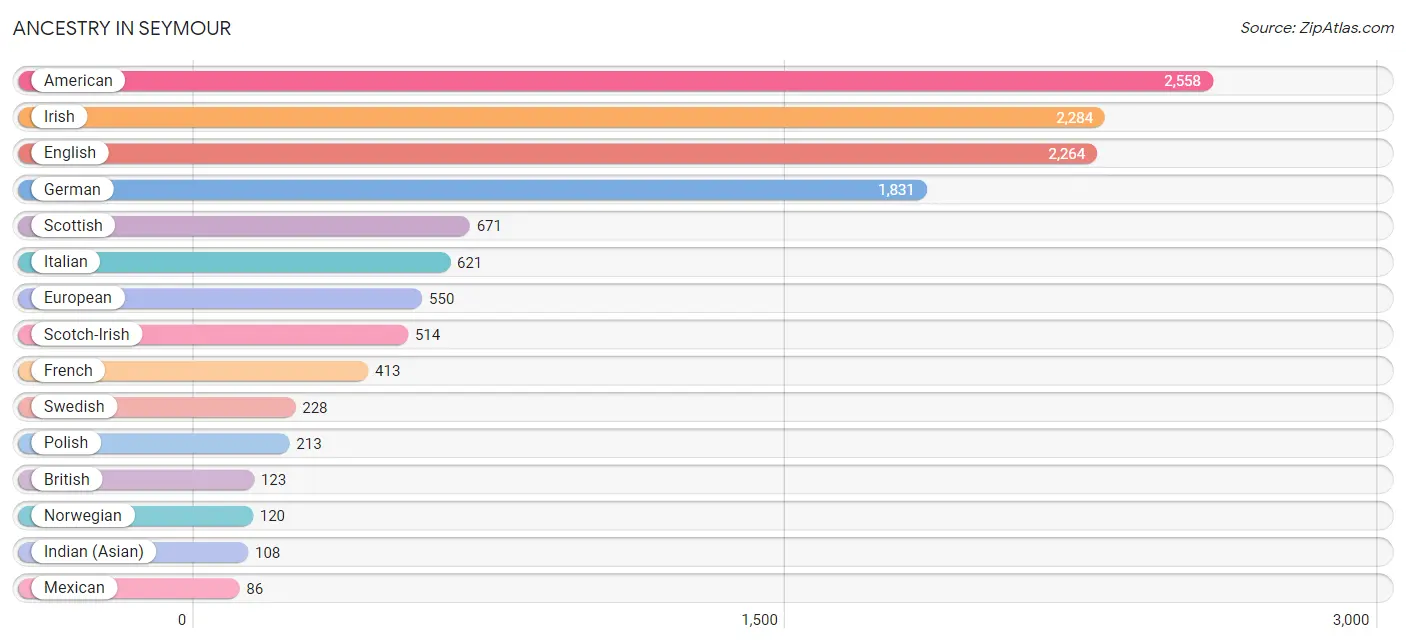
| Ancestry | # Population | % Population |
| American | 2,558 | 15.9% |
| Austrian | 16 | 0.1% |
| British | 123 | 0.8% |
| Cherokee | 71 | 0.4% |
| Colombian | 15 | 0.1% |
| Creek | 12 | 0.1% |
| Cuban | 4 | 0.0% |
| Czech | 51 | 0.3% |
| Dutch | 82 | 0.5% |
| Eastern European | 60 | 0.4% |
| English | 2,264 | 14.1% |
| European | 550 | 3.4% |
| French | 413 | 2.6% |
| German | 1,831 | 11.4% |
| Greek | 5 | 0.0% |
| Hungarian | 79 | 0.5% |
| Indian (Asian) | 108 | 0.7% |
| Irish | 2,284 | 14.2% |
| Iroquois | 7 | 0.0% |
| Italian | 621 | 3.9% |
| Korean | 15 | 0.1% |
| Lithuanian | 13 | 0.1% |
| Mexican | 86 | 0.5% |
| Norwegian | 120 | 0.7% |
| Polish | 213 | 1.3% |
| Puerto Rican | 71 | 0.4% |
| Scandinavian | 22 | 0.1% |
| Scotch-Irish | 514 | 3.2% |
| Scottish | 671 | 4.2% |
| Slavic | 18 | 0.1% |
| South American | 77 | 0.5% |
| Swedish | 228 | 1.4% |
| Thai | 13 | 0.1% |
| Ukrainian | 34 | 0.2% |
| Ute | 44 | 0.3% |
| Venezuelan | 62 | 0.4% |
| Welsh | 14 | 0.1% | View All 37 Rows |
Immigrants in Seymour
The most numerous immigrant groups reported in Seymour came from Asia (406 | 2.5%), India (283 | 1.8%), South Central Asia (283 | 1.8%), Latin America (109 | 0.7%), and China (108 | 0.7%), together accounting for 7.4% of all Seymour residents.
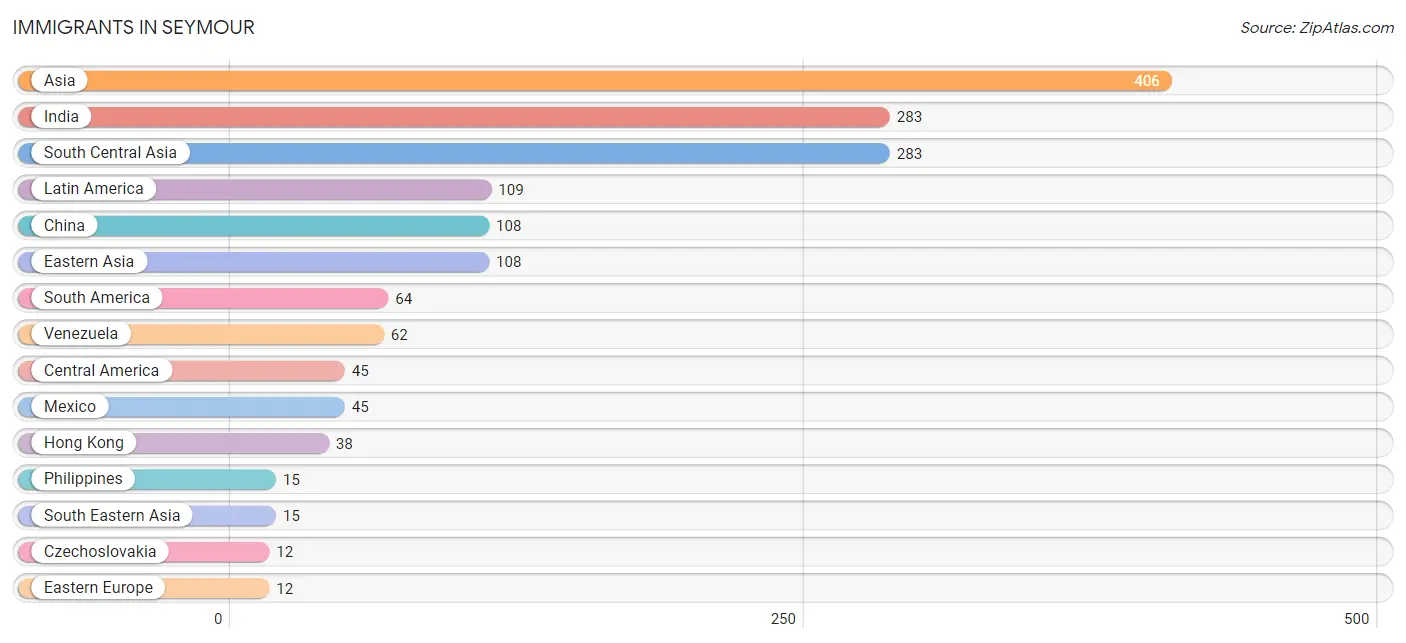
| Immigration Origin | # Population | % Population |
| Asia | 406 | 2.5% |
| Brazil | 2 | 0.0% |
| Central America | 45 | 0.3% |
| China | 108 | 0.7% |
| Czechoslovakia | 12 | 0.1% |
| Eastern Asia | 108 | 0.7% |
| Eastern Europe | 12 | 0.1% |
| Europe | 12 | 0.1% |
| Hong Kong | 38 | 0.2% |
| India | 283 | 1.8% |
| Latin America | 109 | 0.7% |
| Mexico | 45 | 0.3% |
| Philippines | 15 | 0.1% |
| South America | 64 | 0.4% |
| South Central Asia | 283 | 1.8% |
| South Eastern Asia | 15 | 0.1% |
| Venezuela | 62 | 0.4% | View All 17 Rows |
Sex and Age in Seymour
Sex and Age in Seymour
The most populous age groups in Seymour are 50 to 54 Years (699 | 9.3%) for men and 45 to 49 Years (865 | 10.1%) for women.
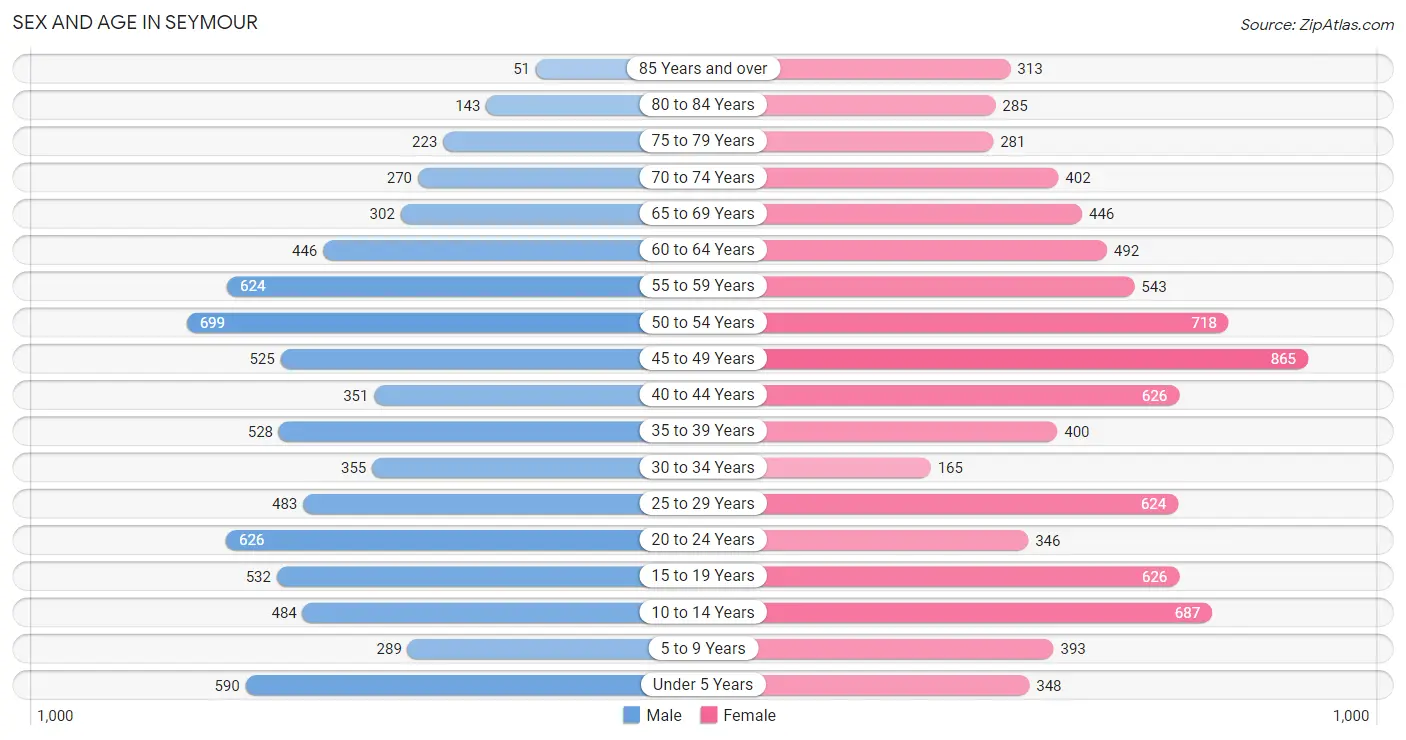
| Age Bracket | Male | Female |
| Under 5 Years | 590 (7.8%) | 348 (4.1%) |
| 5 to 9 Years | 289 (3.8%) | 393 (4.6%) |
| 10 to 14 Years | 484 (6.4%) | 687 (8.0%) |
| 15 to 19 Years | 532 (7.1%) | 626 (7.3%) |
| 20 to 24 Years | 626 (8.3%) | 346 (4.0%) |
| 25 to 29 Years | 483 (6.4%) | 624 (7.3%) |
| 30 to 34 Years | 355 (4.7%) | 165 (1.9%) |
| 35 to 39 Years | 528 (7.0%) | 400 (4.7%) |
| 40 to 44 Years | 351 (4.7%) | 626 (7.3%) |
| 45 to 49 Years | 525 (7.0%) | 865 (10.1%) |
| 50 to 54 Years | 699 (9.3%) | 718 (8.4%) |
| 55 to 59 Years | 624 (8.3%) | 543 (6.3%) |
| 60 to 64 Years | 446 (5.9%) | 492 (5.8%) |
| 65 to 69 Years | 302 (4.0%) | 446 (5.2%) |
| 70 to 74 Years | 270 (3.6%) | 402 (4.7%) |
| 75 to 79 Years | 223 (3.0%) | 281 (3.3%) |
| 80 to 84 Years | 143 (1.9%) | 285 (3.3%) |
| 85 Years and over | 51 (0.7%) | 313 (3.7%) |
| Total | 7,521 (100.0%) | 8,560 (100.0%) |
Families and Households in Seymour
Median Family Size in Seymour
The median family size in Seymour is 3.14 persons per family, with married-couple families (3,702 | 85.0%) accounting for the largest median family size of 3.21 persons per family. On the other hand, single female/mother families (434 | 10.0%) represent the smallest median family size with 2.71 persons per family.
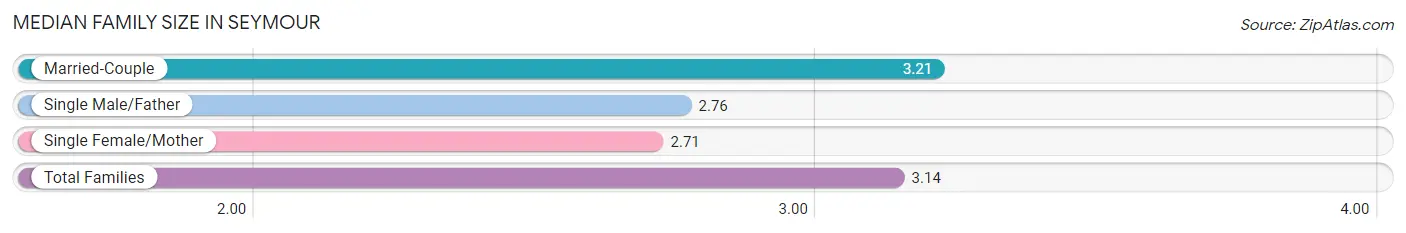
| Family Type | # Families | Family Size |
| Married-Couple | 3,702 (85.0%) | 3.21 |
| Single Male/Father | 221 (5.1%) | 2.76 |
| Single Female/Mother | 434 (10.0%) | 2.71 |
| Total Families | 4,357 (100.0%) | 3.14 |
Median Household Size in Seymour
The median household size in Seymour is 2.73 persons per household, with single male/father households (221 | 3.7%) accounting for the largest median household size of 3.35 persons per household. non-family households (1,539 | 26.1%) represent the smallest median household size with 1.23 persons per household.
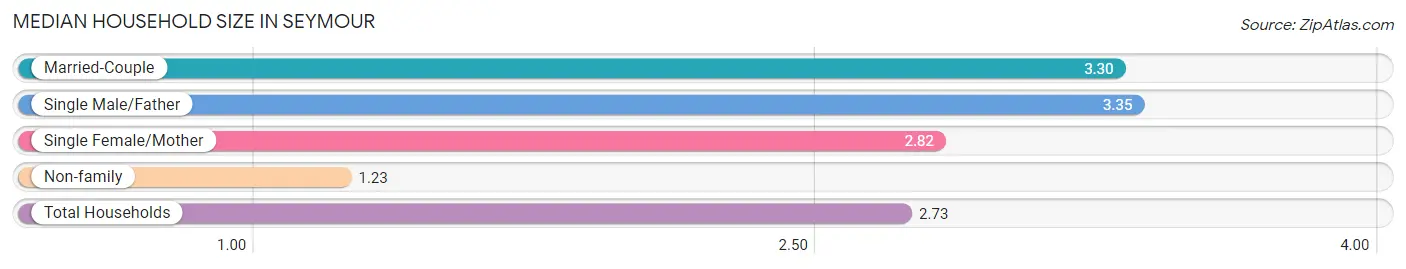
| Household Type | # Households | Household Size |
| Married-Couple | 3,702 (62.8%) | 3.30 |
| Single Male/Father | 221 (3.7%) | 3.35 |
| Single Female/Mother | 434 (7.4%) | 2.82 |
| Non-family | 1,539 (26.1%) | 1.23 |
| Total Households | 5,896 (100.0%) | 2.73 |
Household Size by Marriage Status in Seymour
Out of a total of 5,896 households in Seymour, 4,357 (73.9%) are family households, while 1,539 (26.1%) are nonfamily households. The most numerous type of family households are 2-person households, comprising 1,919, and the most common type of nonfamily households are 1-person households, comprising 1,233.
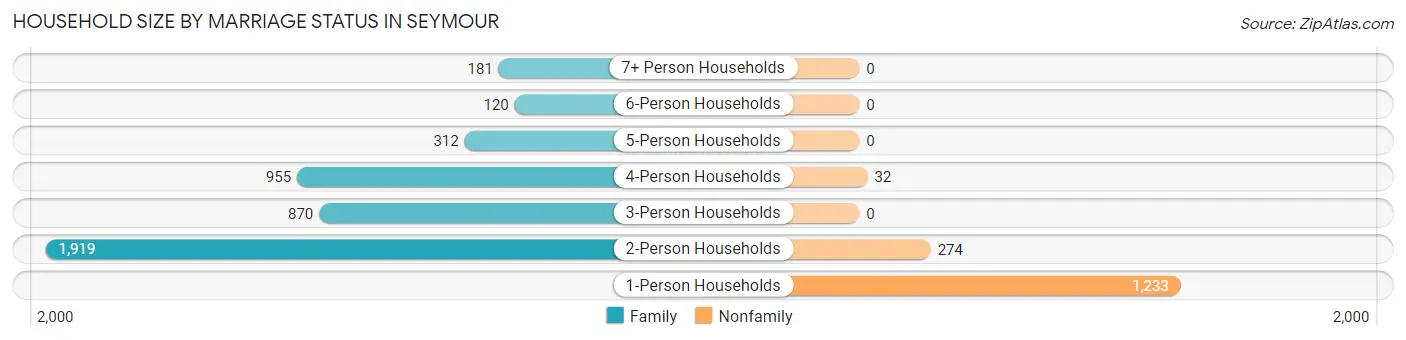
| Household Size | Family Households | Nonfamily Households |
| 1-Person Households | - | 1,233 (20.9%) |
| 2-Person Households | 1,919 (32.6%) | 274 (4.6%) |
| 3-Person Households | 870 (14.8%) | 0 (0.0%) |
| 4-Person Households | 955 (16.2%) | 32 (0.5%) |
| 5-Person Households | 312 (5.3%) | 0 (0.0%) |
| 6-Person Households | 120 (2.0%) | 0 (0.0%) |
| 7+ Person Households | 181 (3.1%) | 0 (0.0%) |
| Total | 4,357 (73.9%) | 1,539 (26.1%) |
Female Fertility in Seymour
Fertility by Age in Seymour
Average fertility rate in Seymour is 23.0 births per 1,000 women. Women in the age bracket of 20 to 34 years have the highest fertility rate with 58.0 births per 1,000 women. Women in the age bracket of 20 to 34 years acount for 76.7% of all women with births.
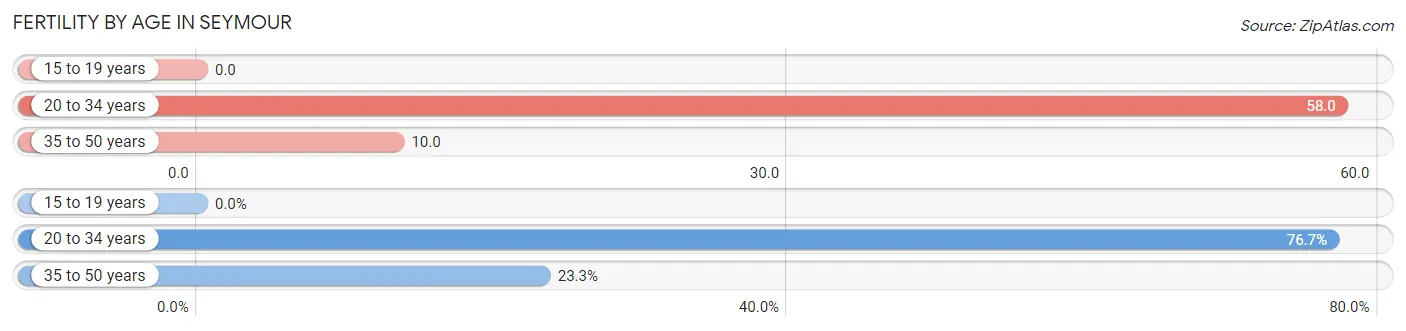
| Age Bracket | Women with Births | Births / 1,000 Women |
| 15 to 19 years | 0 (0.0%) | 0.0 |
| 20 to 34 years | 66 (76.7%) | 58.0 |
| 35 to 50 years | 20 (23.3%) | 10.0 |
| Total | 86 (100.0%) | 23.0 |
Fertility by Age by Marriage Status in Seymour
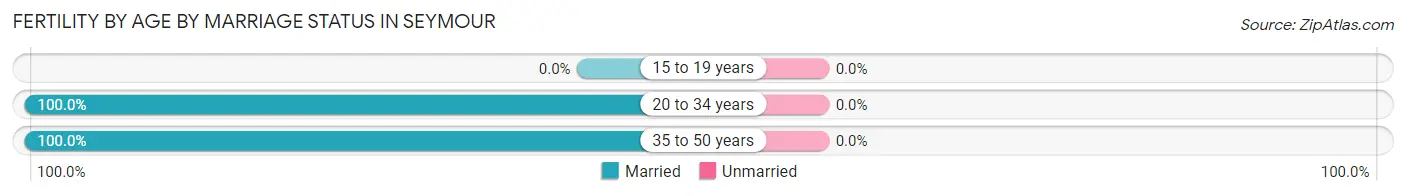
| Age Bracket | Married | Unmarried |
| 15 to 19 years | 0 (0.0%) | 0 (0.0%) |
| 20 to 34 years | 66 (100.0%) | 0 (0.0%) |
| 35 to 50 years | 20 (100.0%) | 0 (0.0%) |
| Total | 86 (100.0%) | 0 (0.0%) |
Fertility by Education in Seymour
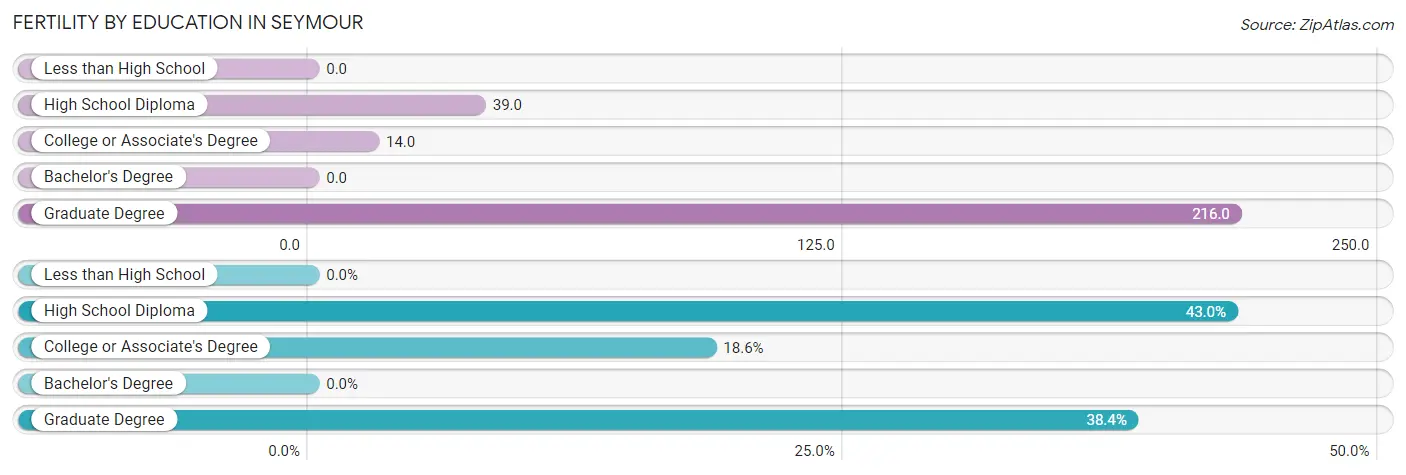
| Educational Attainment | Women with Births | Births / 1,000 Women |
| Less than High School | 0 (0.0%) | 0.0 |
| High School Diploma | 37 (43.0%) | 39.0 |
| College or Associate's Degree | 16 (18.6%) | 14.0 |
| Bachelor's Degree | 0 (0.0%) | 0.0 |
| Graduate Degree | 33 (38.4%) | 216.0 |
| Total | 86 (100.0%) | 23.0 |
Fertility by Education by Marriage Status in Seymour
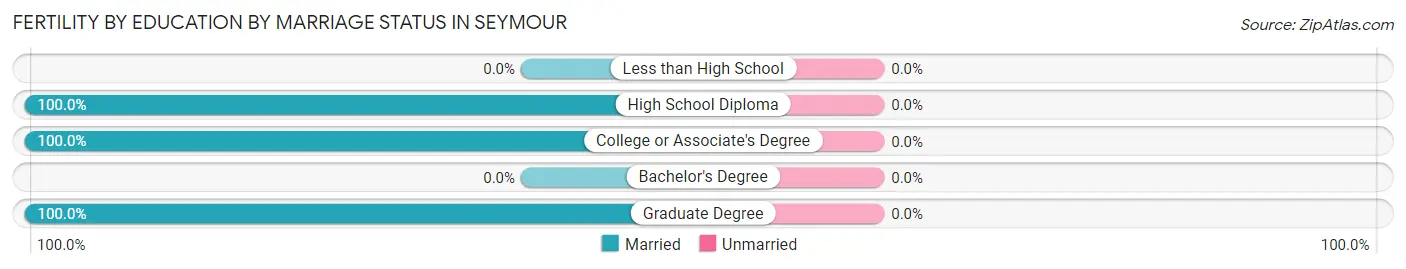
| Educational Attainment | Married | Unmarried |
| Less than High School | 0 (0.0%) | 0 (0.0%) |
| High School Diploma | 37 (100.0%) | 0 (0.0%) |
| College or Associate's Degree | 16 (100.0%) | 0 (0.0%) |
| Bachelor's Degree | 0 (0.0%) | 0 (0.0%) |
| Graduate Degree | 33 (100.0%) | 0 (0.0%) |
| Total | 86 (100.0%) | 0 (0.0%) |
Employment Characteristics in Seymour
Employment by Class of Employer in Seymour
Among the 7,503 employed individuals in Seymour, private company employees (5,060 | 67.4%), local government employees (568 | 7.6%), and self-employed (not incorporated) (449 | 6.0%) make up the most common classes of employment.
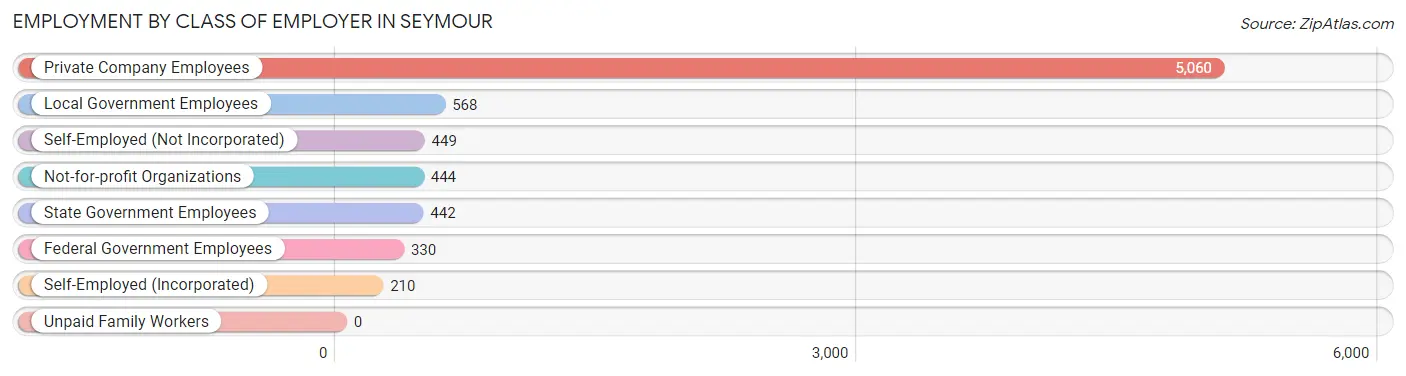
| Employer Class | # Employees | % Employees |
| Private Company Employees | 5,060 | 67.4% |
| Self-Employed (Incorporated) | 210 | 2.8% |
| Self-Employed (Not Incorporated) | 449 | 6.0% |
| Not-for-profit Organizations | 444 | 5.9% |
| Local Government Employees | 568 | 7.6% |
| State Government Employees | 442 | 5.9% |
| Federal Government Employees | 330 | 4.4% |
| Unpaid Family Workers | 0 | 0.0% |
| Total | 7,503 | 100.0% |
Employment Status by Age in Seymour
According to the labor force statistics for Seymour, out of the total population over 16 years of age (12,976), 62.7% or 8,136 individuals are in the labor force, with 6.0% or 488 of them unemployed. The age group with the highest labor force participation rate is 25 to 29 years, with 88.9% or 984 individuals in the labor force. Within the labor force, the 16 to 19 years age range has the highest percentage of unemployed individuals, with 19.5% or 63 of them being unemployed.
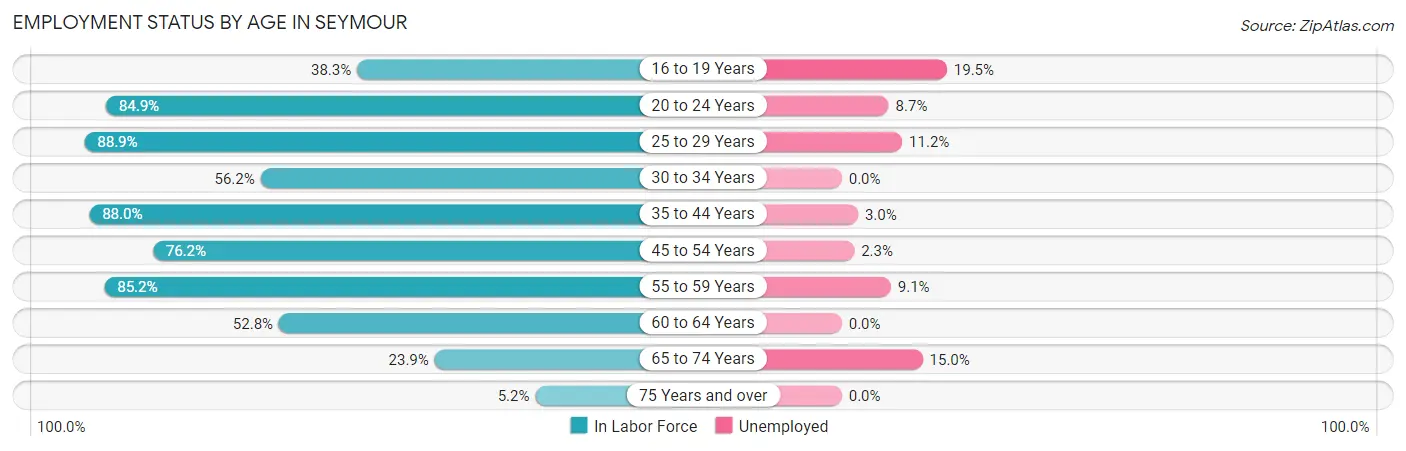
| Age Bracket | In Labor Force | Unemployed |
| 16 to 19 Years | 323 (38.3%) | 63 (19.5%) |
| 20 to 24 Years | 825 (84.9%) | 72 (8.7%) |
| 25 to 29 Years | 984 (88.9%) | 110 (11.2%) |
| 30 to 34 Years | 292 (56.2%) | 0 (0.0%) |
| 35 to 44 Years | 1,676 (88.0%) | 50 (3.0%) |
| 45 to 54 Years | 2,139 (76.2%) | 49 (2.3%) |
| 55 to 59 Years | 994 (85.2%) | 90 (9.1%) |
| 60 to 64 Years | 495 (52.8%) | 0 (0.0%) |
| 65 to 74 Years | 339 (23.9%) | 51 (15.0%) |
| 75 Years and over | 67 (5.2%) | 0 (0.0%) |
| Total | 8,136 (62.7%) | 488 (6.0%) |
Employment Status by Educational Attainment in Seymour
According to labor force statistics for Seymour, 77.9% of individuals (6,578) out of the total population between 25 and 64 years of age (8,444) are in the labor force, with 4.6% or 303 of them being unemployed. The group with the highest labor force participation rate are those with the educational attainment of bachelor's degree or higher, with 93.5% or 1,872 individuals in the labor force. Within the labor force, individuals with college / associate degree education have the highest percentage of unemployment, with 5.8% or 136 of them being unemployed.
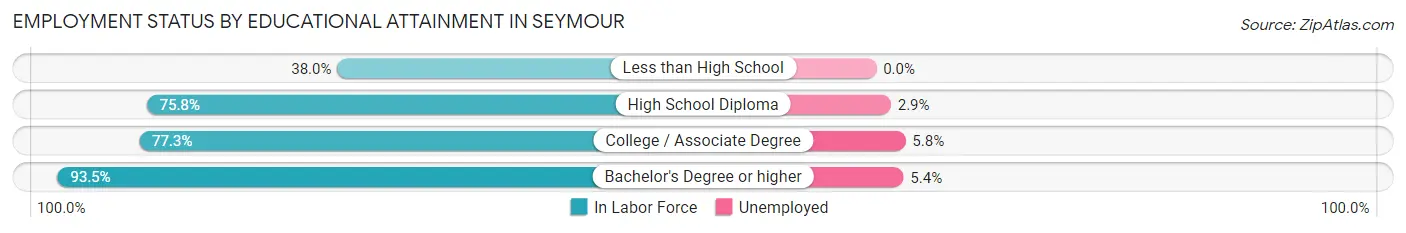
| Educational Attainment | In Labor Force | Unemployed |
| Less than High School | 222 (38.0%) | 0 (0.0%) |
| High School Diploma | 2,144 (75.8%) | 82 (2.9%) |
| College / Associate Degree | 2,341 (77.3%) | 176 (5.8%) |
| Bachelor's Degree or higher | 1,872 (93.5%) | 108 (5.4%) |
| Total | 6,578 (77.9%) | 388 (4.6%) |
Employment Occupations by Sex in Seymour
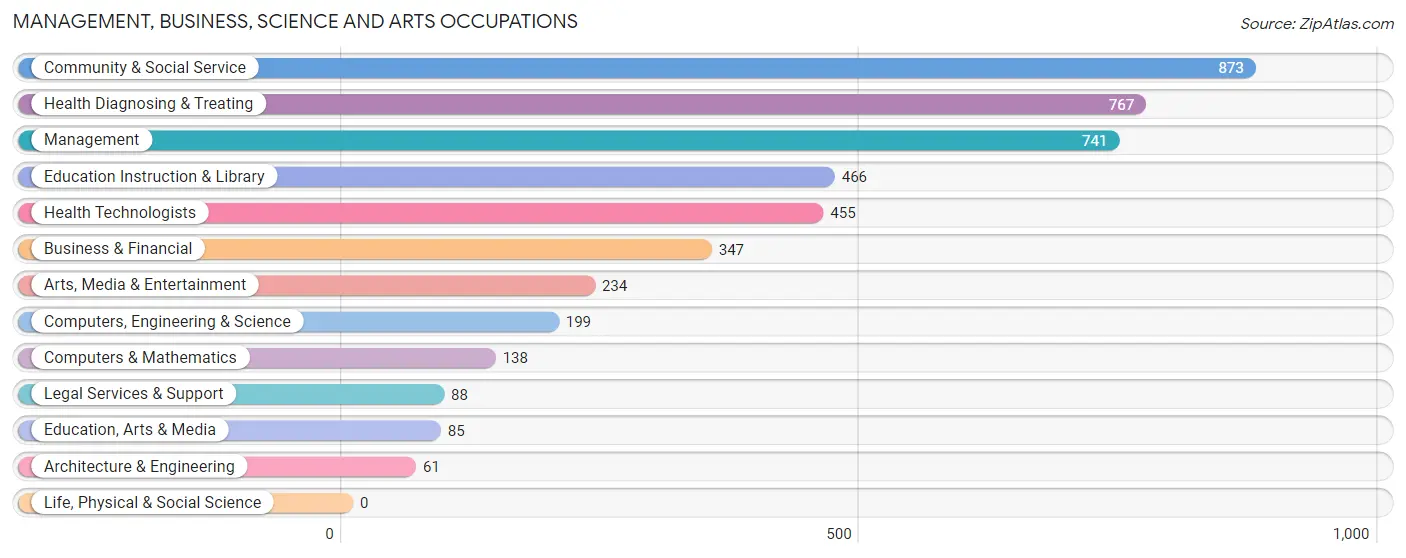
Management, Business, Science and Arts Occupations
The most common Management, Business, Science and Arts occupations in Seymour are Community & Social Service (873 | 11.4%), Health Diagnosing & Treating (767 | 10.0%), Management (741 | 9.7%), Education Instruction & Library (466 | 6.1%), and Health Technologists (455 | 6.0%).
Management, Business, Science and Arts Occupations by Sex
Within the Management, Business, Science and Arts occupations in Seymour, the most male-oriented occupations are Architecture & Engineering (100.0%), Education, Arts & Media (100.0%), and Management (88.9%), while the most female-oriented occupations are Health Diagnosing & Treating (80.6%), Health Technologists (76.3%), and Legal Services & Support (64.8%).
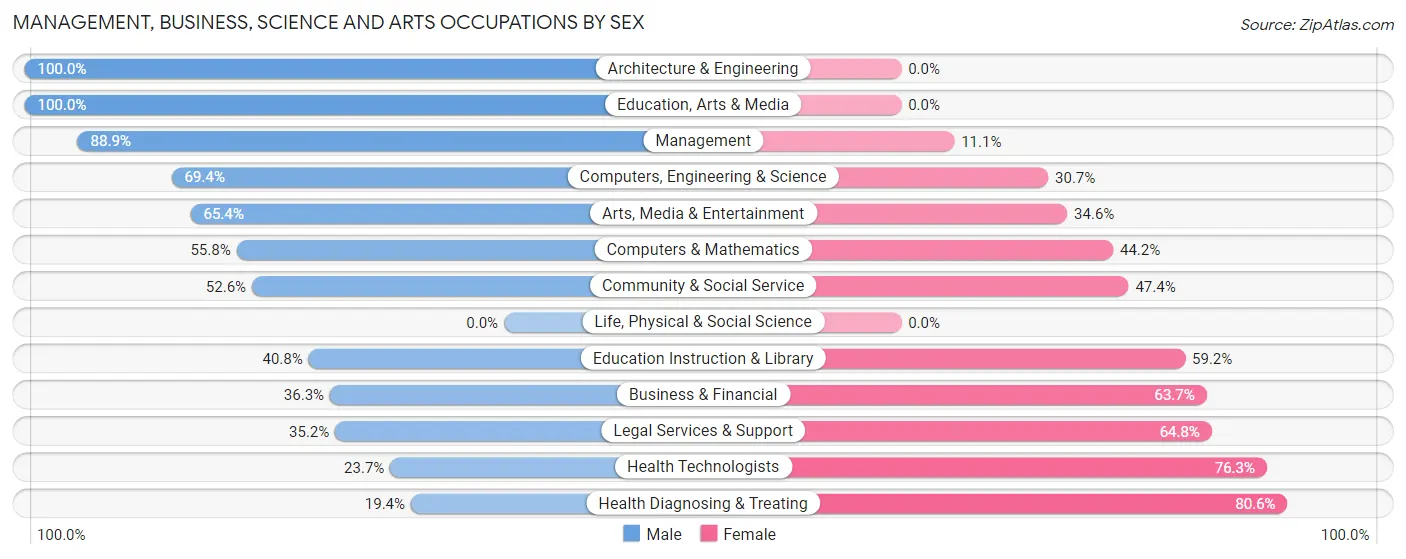
| Occupation | Male | Female |
| Management | 659 (88.9%) | 82 (11.1%) |
| Business & Financial | 126 (36.3%) | 221 (63.7%) |
| Computers, Engineering & Science | 138 (69.4%) | 61 (30.6%) |
| Computers & Mathematics | 77 (55.8%) | 61 (44.2%) |
| Architecture & Engineering | 61 (100.0%) | 0 (0.0%) |
| Life, Physical & Social Science | 0 (0.0%) | 0 (0.0%) |
| Community & Social Service | 459 (52.6%) | 414 (47.4%) |
| Education, Arts & Media | 85 (100.0%) | 0 (0.0%) |
| Legal Services & Support | 31 (35.2%) | 57 (64.8%) |
| Education Instruction & Library | 190 (40.8%) | 276 (59.2%) |
| Arts, Media & Entertainment | 153 (65.4%) | 81 (34.6%) |
| Health Diagnosing & Treating | 149 (19.4%) | 618 (80.6%) |
| Health Technologists | 108 (23.7%) | 347 (76.3%) |
| Total (Category) | 1,531 (52.3%) | 1,396 (47.7%) |
| Total (Overall) | 3,948 (51.7%) | 3,690 (48.3%) |
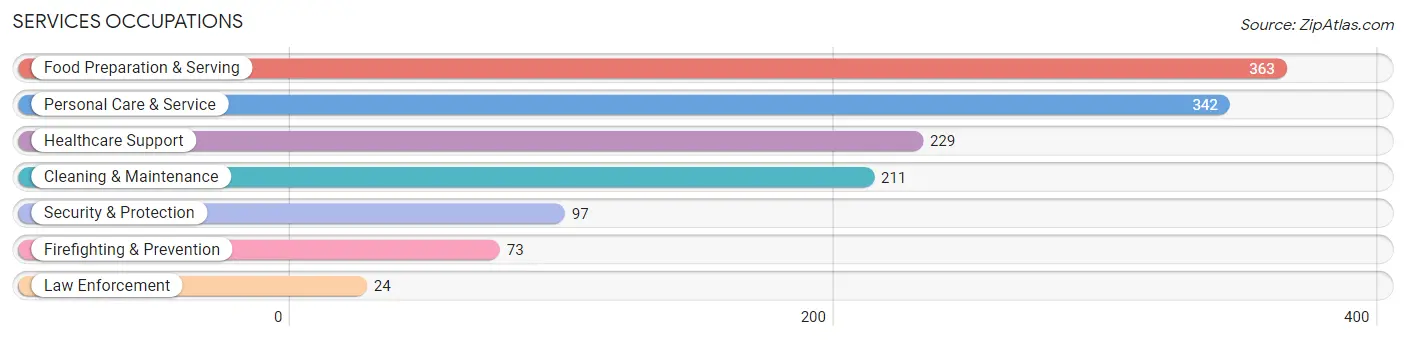
Services Occupations
The most common Services occupations in Seymour are Food Preparation & Serving (363 | 4.8%), Personal Care & Service (342 | 4.5%), Healthcare Support (229 | 3.0%), Cleaning & Maintenance (211 | 2.8%), and Security & Protection (97 | 1.3%).
Services Occupations by Sex
Within the Services occupations in Seymour, the most male-oriented occupations are Law Enforcement (100.0%), Cleaning & Maintenance (75.8%), and Security & Protection (73.2%), while the most female-oriented occupations are Healthcare Support (87.3%), Food Preparation & Serving (75.2%), and Personal Care & Service (64.6%).
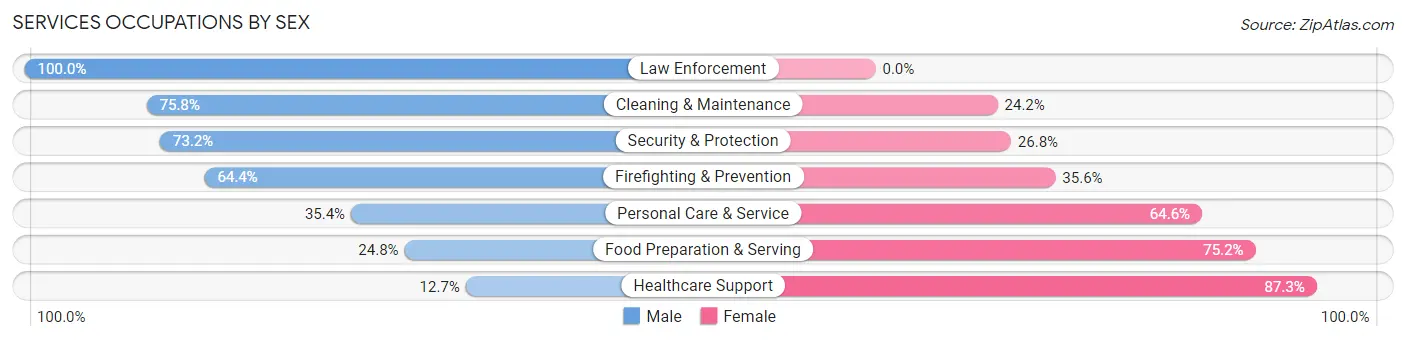
| Occupation | Male | Female |
| Healthcare Support | 29 (12.7%) | 200 (87.3%) |
| Security & Protection | 71 (73.2%) | 26 (26.8%) |
| Firefighting & Prevention | 47 (64.4%) | 26 (35.6%) |
| Law Enforcement | 24 (100.0%) | 0 (0.0%) |
| Food Preparation & Serving | 90 (24.8%) | 273 (75.2%) |
| Cleaning & Maintenance | 160 (75.8%) | 51 (24.2%) |
| Personal Care & Service | 121 (35.4%) | 221 (64.6%) |
| Total (Category) | 471 (37.9%) | 771 (62.1%) |
| Total (Overall) | 3,948 (51.7%) | 3,690 (48.3%) |
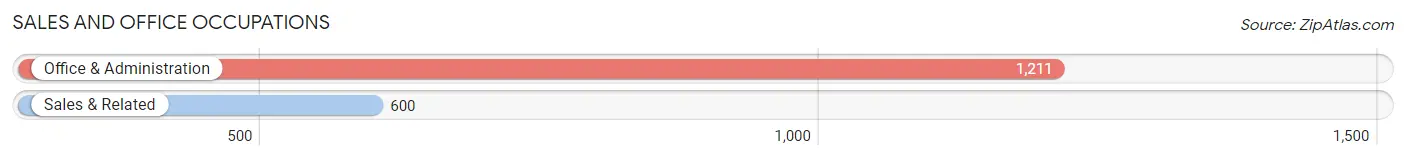
Sales and Office Occupations
The most common Sales and Office occupations in Seymour are Office & Administration (1,211 | 15.9%), and Sales & Related (600 | 7.9%).
Sales and Office Occupations by Sex
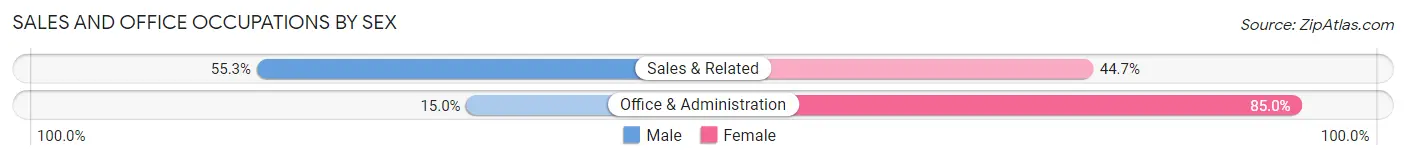
| Occupation | Male | Female |
| Sales & Related | 332 (55.3%) | 268 (44.7%) |
| Office & Administration | 182 (15.0%) | 1,029 (85.0%) |
| Total (Category) | 514 (28.4%) | 1,297 (71.6%) |
| Total (Overall) | 3,948 (51.7%) | 3,690 (48.3%) |
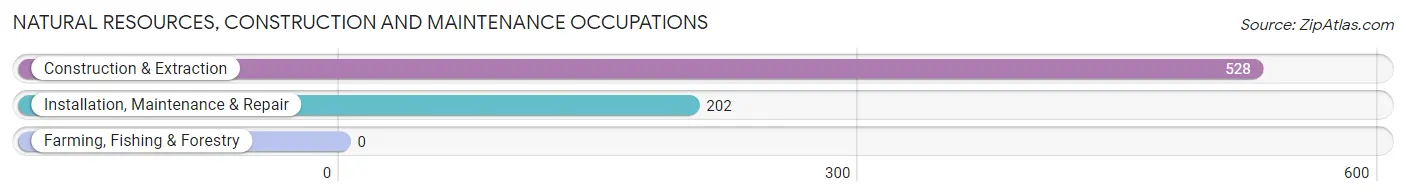
Natural Resources, Construction and Maintenance Occupations
The most common Natural Resources, Construction and Maintenance occupations in Seymour are Construction & Extraction (528 | 6.9%), and Installation, Maintenance & Repair (202 | 2.6%).
Natural Resources, Construction and Maintenance Occupations by Sex
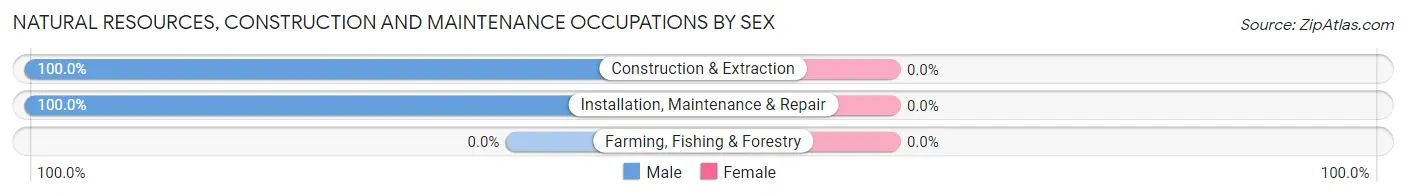
| Occupation | Male | Female |
| Farming, Fishing & Forestry | 0 (0.0%) | 0 (0.0%) |
| Construction & Extraction | 528 (100.0%) | 0 (0.0%) |
| Installation, Maintenance & Repair | 202 (100.0%) | 0 (0.0%) |
| Total (Category) | 730 (100.0%) | 0 (0.0%) |
| Total (Overall) | 3,948 (51.7%) | 3,690 (48.3%) |
Production, Transportation and Moving Occupations
The most common Production, Transportation and Moving occupations in Seymour are Production (510 | 6.7%), Transportation (242 | 3.2%), and Material Moving (176 | 2.3%).
Production, Transportation and Moving Occupations by Sex
| Occupation | Male | Female |
| Production | 358 (70.2%) | 152 (29.8%) |
| Transportation | 177 (73.1%) | 65 (26.9%) |
| Material Moving | 167 (94.9%) | 9 (5.1%) |
| Total (Category) | 702 (75.6%) | 226 (24.3%) |
| Total (Overall) | 3,948 (51.7%) | 3,690 (48.3%) |
Employment Industries by Sex in Seymour
Employment Industries in Seymour
The major employment industries in Seymour include Health Care & Social Assistance (1,210 | 15.8%), Retail Trade (853 | 11.2%), Manufacturing (843 | 11.0%), Accommodation & Food Services (541 | 7.1%), and Finance & Insurance (539 | 7.1%).
Employment Industries by Sex in Seymour
The Seymour industries that see more men than women are Agriculture, Fishing & Hunting (100.0%), Construction (100.0%), and Utilities (100.0%), whereas the industries that tend to have a higher number of women are Enterprise Management (100.0%), Finance & Insurance (92.9%), and Health Care & Social Assistance (84.3%).
| Industry | Male | Female |
| Agriculture, Fishing & Hunting | 32 (100.0%) | 0 (0.0%) |
| Mining, Quarrying, & Extraction | 0 (0.0%) | 0 (0.0%) |
| Construction | 420 (100.0%) | 0 (0.0%) |
| Manufacturing | 665 (78.9%) | 178 (21.1%) |
| Wholesale Trade | 53 (71.6%) | 21 (28.4%) |
| Retail Trade | 525 (61.6%) | 328 (38.5%) |
| Transportation & Warehousing | 197 (57.8%) | 144 (42.2%) |
| Utilities | 8 (100.0%) | 0 (0.0%) |
| Information | 124 (84.4%) | 23 (15.7%) |
| Finance & Insurance | 38 (7.0%) | 501 (92.9%) |
| Real Estate, Rental & Leasing | 145 (100.0%) | 0 (0.0%) |
| Professional & Scientific | 352 (65.7%) | 184 (34.3%) |
| Enterprise Management | 0 (0.0%) | 21 (100.0%) |
| Administrative & Support | 172 (72.9%) | 64 (27.1%) |
| Educational Services | 195 (37.1%) | 330 (62.9%) |
| Health Care & Social Assistance | 190 (15.7%) | 1,020 (84.3%) |
| Arts, Entertainment & Recreation | 289 (57.2%) | 216 (42.8%) |
| Accommodation & Food Services | 197 (36.4%) | 344 (63.6%) |
| Public Administration | 137 (63.4%) | 79 (36.6%) |
| Total | 3,948 (51.7%) | 3,690 (48.3%) |
Education in Seymour
School Enrollment in Seymour
The most common levels of schooling among the 3,366 students in Seymour are high school (1,028 | 30.5%), middle school (767 | 22.8%), and elementary school (706 | 21.0%).
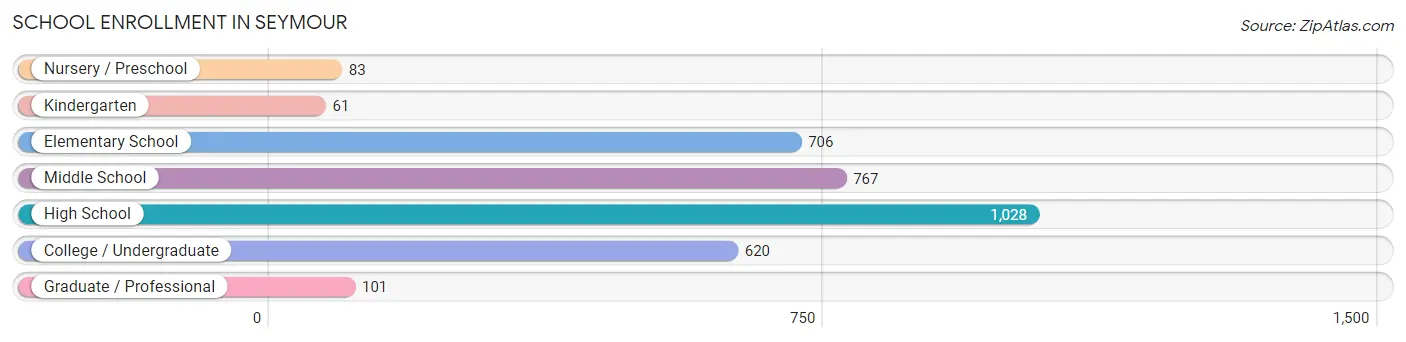
| School Level | # Students | % Students |
| Nursery / Preschool | 83 | 2.5% |
| Kindergarten | 61 | 1.8% |
| Elementary School | 706 | 21.0% |
| Middle School | 767 | 22.8% |
| High School | 1,028 | 30.5% |
| College / Undergraduate | 620 | 18.4% |
| Graduate / Professional | 101 | 3.0% |
| Total | 3,366 | 100.0% |
School Enrollment by Age by Funding Source in Seymour
Out of a total of 3,366 students who are enrolled in schools in Seymour, 1,017 (30.2%) attend a private institution, while the remaining 2,349 (69.8%) are enrolled in public schools. The age group of 18 to 19 year olds has the highest likelihood of being enrolled in private schools, with 150 (55.8% in the age bracket) enrolled. Conversely, the age group of 20 to 24 year olds has the lowest likelihood of being enrolled in a private school, with 390 (100.0% in the age bracket) attending a public institution.
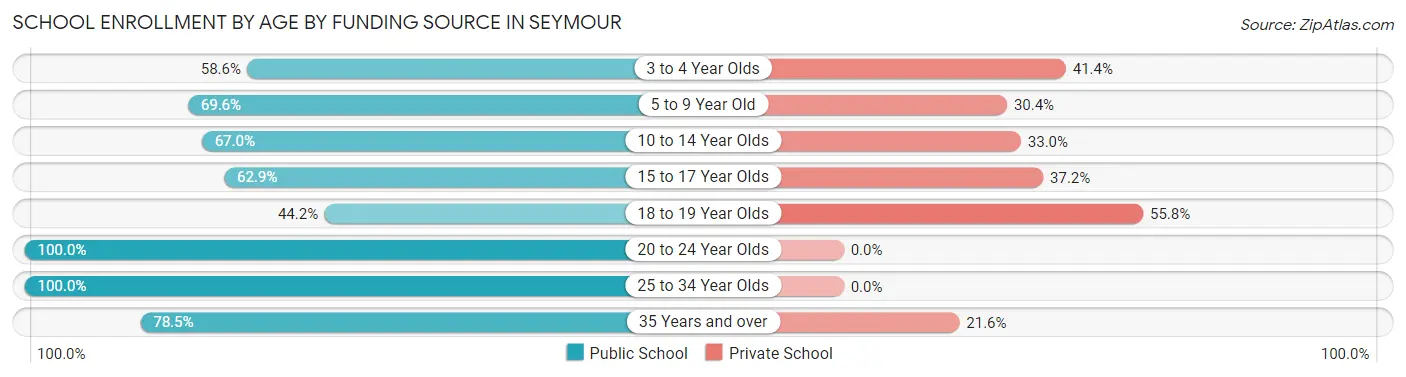
| Age Bracket | Public School | Private School |
| 3 to 4 Year Olds | 34 (58.6%) | 24 (41.4%) |
| 5 to 9 Year Old | 428 (69.6%) | 187 (30.4%) |
| 10 to 14 Year Olds | 666 (67.0%) | 328 (33.0%) |
| 15 to 17 Year Olds | 472 (62.8%) | 279 (37.1%) |
| 18 to 19 Year Olds | 119 (44.2%) | 150 (55.8%) |
| 20 to 24 Year Olds | 390 (100.0%) | 0 (0.0%) |
| 25 to 34 Year Olds | 57 (100.0%) | 0 (0.0%) |
| 35 Years and over | 182 (78.4%) | 50 (21.5%) |
| Total | 2,349 (69.8%) | 1,017 (30.2%) |
Educational Attainment by Field of Study in Seymour
Science & technology (500 | 19.9%), business (409 | 16.3%), education (363 | 14.4%), arts & humanities (281 | 11.2%), and bio, nature & agricultural (201 | 8.0%) are the most common fields of study among 2,512 individuals in Seymour who have obtained a bachelor's degree or higher.
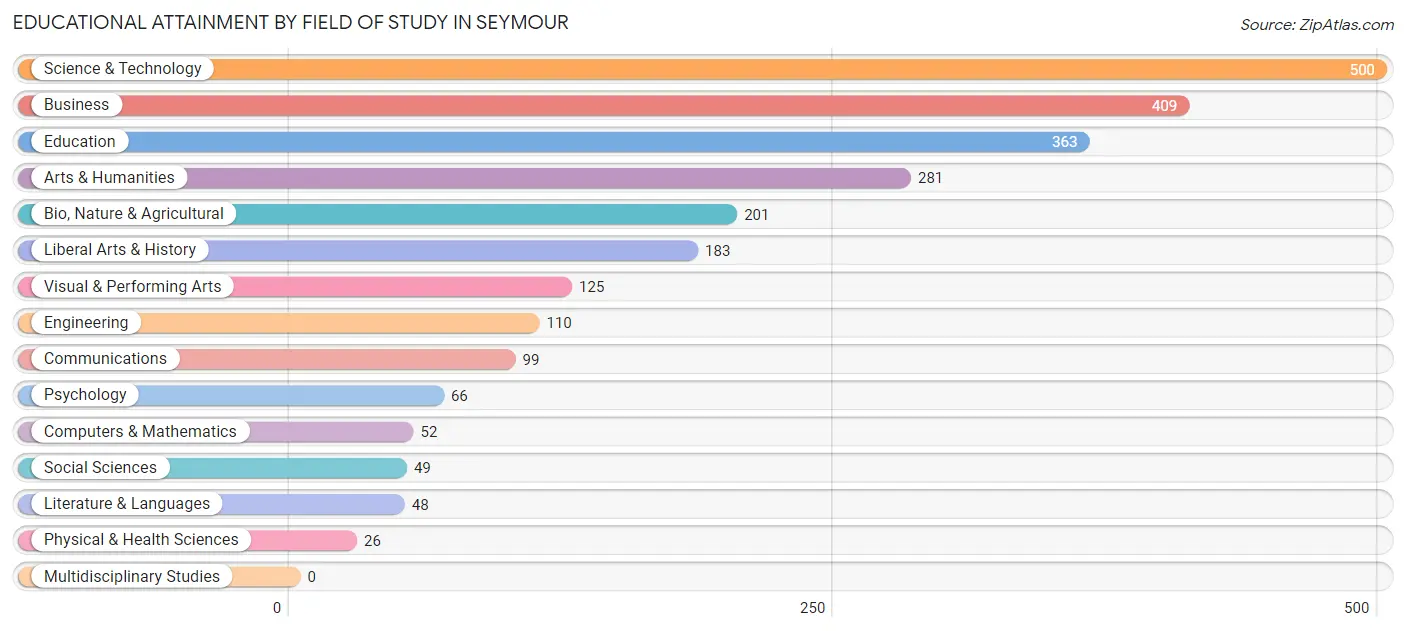
| Field of Study | # Graduates | % Graduates |
| Computers & Mathematics | 52 | 2.1% |
| Bio, Nature & Agricultural | 201 | 8.0% |
| Physical & Health Sciences | 26 | 1.0% |
| Psychology | 66 | 2.6% |
| Social Sciences | 49 | 1.9% |
| Engineering | 110 | 4.4% |
| Multidisciplinary Studies | 0 | 0.0% |
| Science & Technology | 500 | 19.9% |
| Business | 409 | 16.3% |
| Education | 363 | 14.4% |
| Literature & Languages | 48 | 1.9% |
| Liberal Arts & History | 183 | 7.3% |
| Visual & Performing Arts | 125 | 5.0% |
| Communications | 99 | 3.9% |
| Arts & Humanities | 281 | 11.2% |
| Total | 2,512 | 100.0% |
Transportation & Commute in Seymour
Vehicle Availability by Sex in Seymour
The most prevalent vehicle ownership categories in Seymour are males with 2 vehicles (1,629, accounting for 41.3%) and females with 2 vehicles (1,307, making up 45.8%).
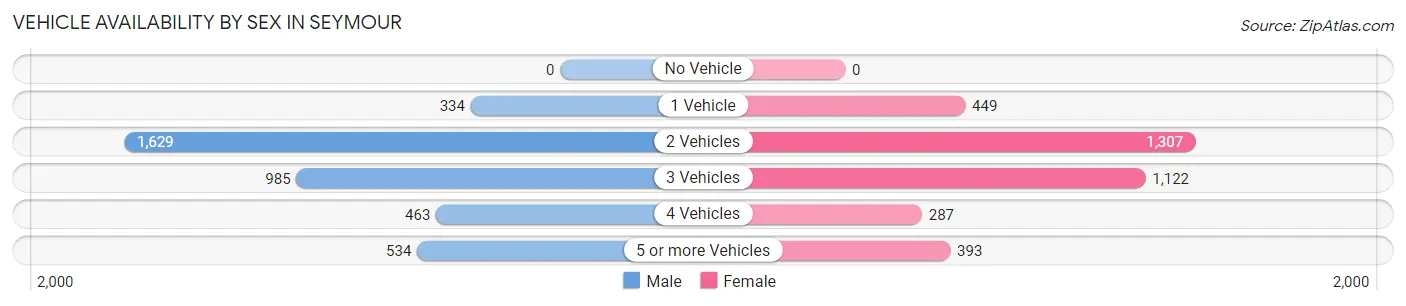
| Vehicles Available | Male | Female |
| No Vehicle | 0 (0.0%) | 0 (0.0%) |
| 1 Vehicle | 334 (8.5%) | 449 (12.6%) |
| 2 Vehicles | 1,629 (41.3%) | 1,307 (36.7%) |
| 3 Vehicles | 985 (25.0%) | 1,122 (31.5%) |
| 4 Vehicles | 463 (11.7%) | 287 (8.1%) |
| 5 or more Vehicles | 534 (13.5%) | 393 (11.1%) |
| Total | 3,945 (100.0%) | 3,558 (100.0%) |
Commute Time in Seymour
The most frequently occuring commute durations in Seymour are 30 to 34 minutes (1,645 commuters, 25.0%), 25 to 29 minutes (993 commuters, 15.1%), and 20 to 24 minutes (917 commuters, 13.9%).
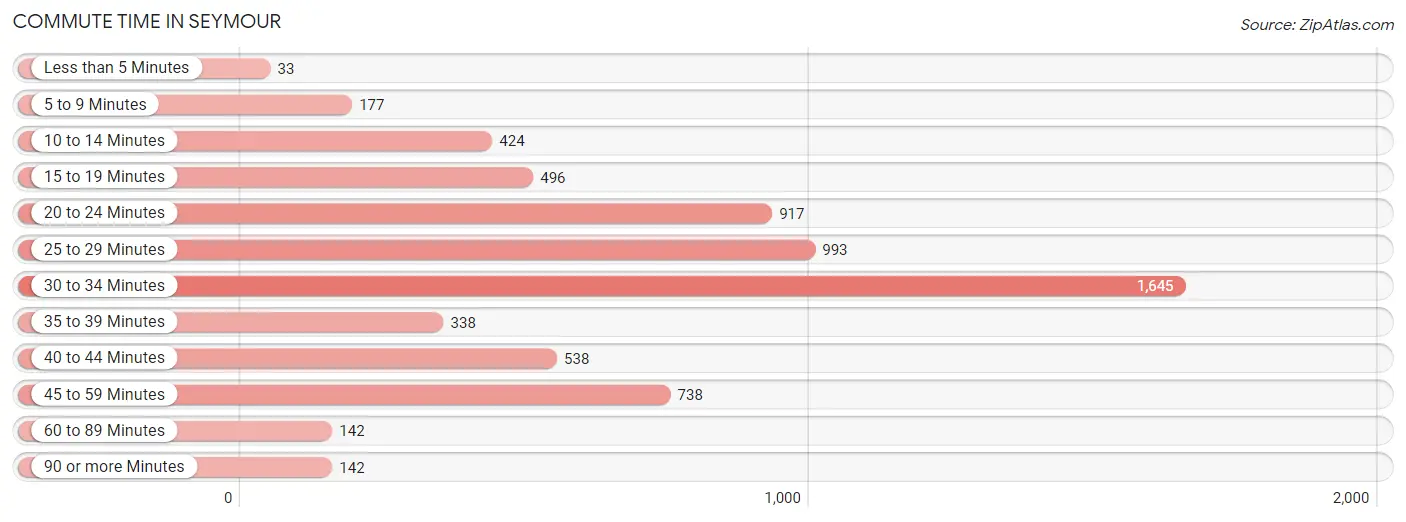
| Commute Time | # Commuters | % Commuters |
| Less than 5 Minutes | 33 | 0.5% |
| 5 to 9 Minutes | 177 | 2.7% |
| 10 to 14 Minutes | 424 | 6.4% |
| 15 to 19 Minutes | 496 | 7.5% |
| 20 to 24 Minutes | 917 | 13.9% |
| 25 to 29 Minutes | 993 | 15.1% |
| 30 to 34 Minutes | 1,645 | 25.0% |
| 35 to 39 Minutes | 338 | 5.1% |
| 40 to 44 Minutes | 538 | 8.2% |
| 45 to 59 Minutes | 738 | 11.2% |
| 60 to 89 Minutes | 142 | 2.2% |
| 90 or more Minutes | 142 | 2.2% |
Commute Time by Sex in Seymour
The most common commute times in Seymour are 30 to 34 minutes (785 commuters, 22.9%) for males and 30 to 34 minutes (860 commuters, 27.3%) for females.
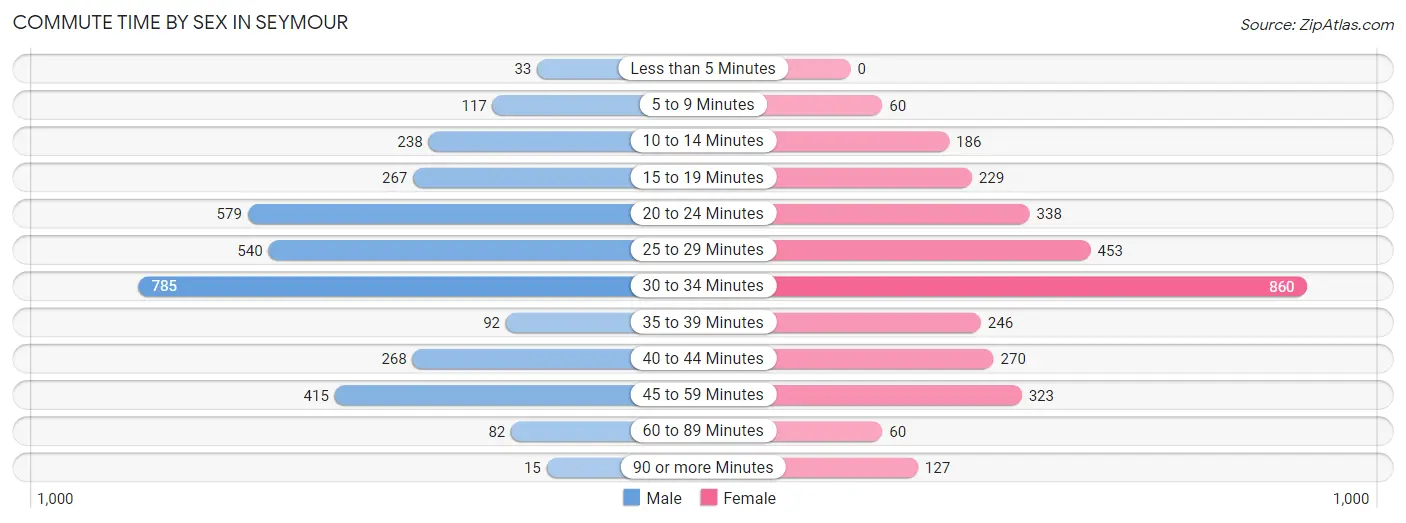
| Commute Time | Male | Female |
| Less than 5 Minutes | 33 (1.0%) | 0 (0.0%) |
| 5 to 9 Minutes | 117 (3.4%) | 60 (1.9%) |
| 10 to 14 Minutes | 238 (6.9%) | 186 (5.9%) |
| 15 to 19 Minutes | 267 (7.8%) | 229 (7.3%) |
| 20 to 24 Minutes | 579 (16.9%) | 338 (10.7%) |
| 25 to 29 Minutes | 540 (15.7%) | 453 (14.4%) |
| 30 to 34 Minutes | 785 (22.9%) | 860 (27.3%) |
| 35 to 39 Minutes | 92 (2.7%) | 246 (7.8%) |
| 40 to 44 Minutes | 268 (7.8%) | 270 (8.6%) |
| 45 to 59 Minutes | 415 (12.1%) | 323 (10.2%) |
| 60 to 89 Minutes | 82 (2.4%) | 60 (1.9%) |
| 90 or more Minutes | 15 (0.4%) | 127 (4.0%) |
Time of Departure to Work by Sex in Seymour
The most frequent times of departure to work in Seymour are 7:00 AM to 7:29 AM (549, 16.0%) for males and 7:00 AM to 7:29 AM (870, 27.6%) for females.
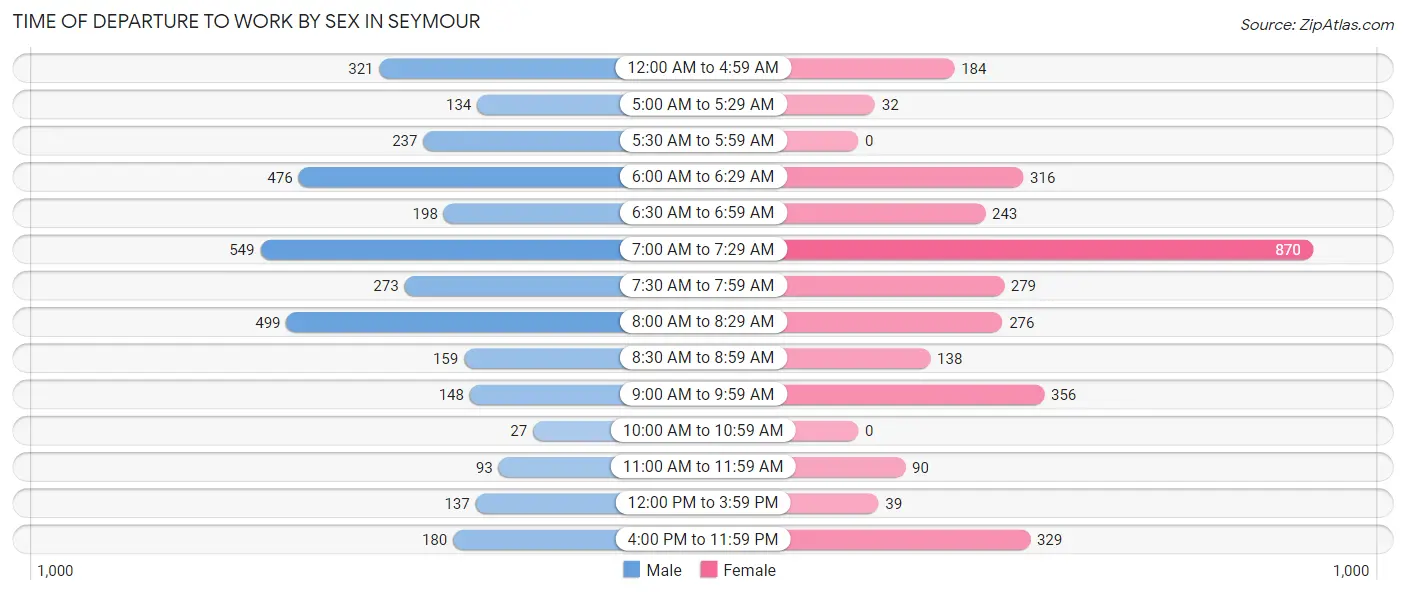
| Time of Departure | Male | Female |
| 12:00 AM to 4:59 AM | 321 (9.4%) | 184 (5.8%) |
| 5:00 AM to 5:29 AM | 134 (3.9%) | 32 (1.0%) |
| 5:30 AM to 5:59 AM | 237 (6.9%) | 0 (0.0%) |
| 6:00 AM to 6:29 AM | 476 (13.9%) | 316 (10.0%) |
| 6:30 AM to 6:59 AM | 198 (5.8%) | 243 (7.7%) |
| 7:00 AM to 7:29 AM | 549 (16.0%) | 870 (27.6%) |
| 7:30 AM to 7:59 AM | 273 (8.0%) | 279 (8.8%) |
| 8:00 AM to 8:29 AM | 499 (14.5%) | 276 (8.8%) |
| 8:30 AM to 8:59 AM | 159 (4.6%) | 138 (4.4%) |
| 9:00 AM to 9:59 AM | 148 (4.3%) | 356 (11.3%) |
| 10:00 AM to 10:59 AM | 27 (0.8%) | 0 (0.0%) |
| 11:00 AM to 11:59 AM | 93 (2.7%) | 90 (2.9%) |
| 12:00 PM to 3:59 PM | 137 (4.0%) | 39 (1.2%) |
| 4:00 PM to 11:59 PM | 180 (5.2%) | 329 (10.4%) |
| Total | 3,431 (100.0%) | 3,152 (100.0%) |
Housing Occupancy in Seymour
Occupancy by Ownership in Seymour
Of the total 5,896 dwellings in Seymour, owner-occupied units account for 4,646 (78.8%), while renter-occupied units make up 1,250 (21.2%).
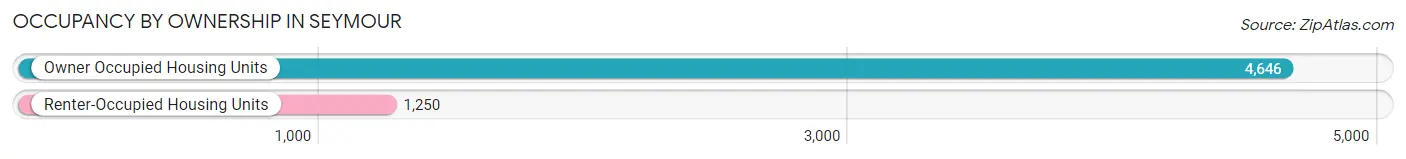
| Occupancy | # Housing Units | % Housing Units |
| Owner Occupied Housing Units | 4,646 | 78.8% |
| Renter-Occupied Housing Units | 1,250 | 21.2% |
| Total Occupied Housing Units | 5,896 | 100.0% |
Occupancy by Household Size in Seymour
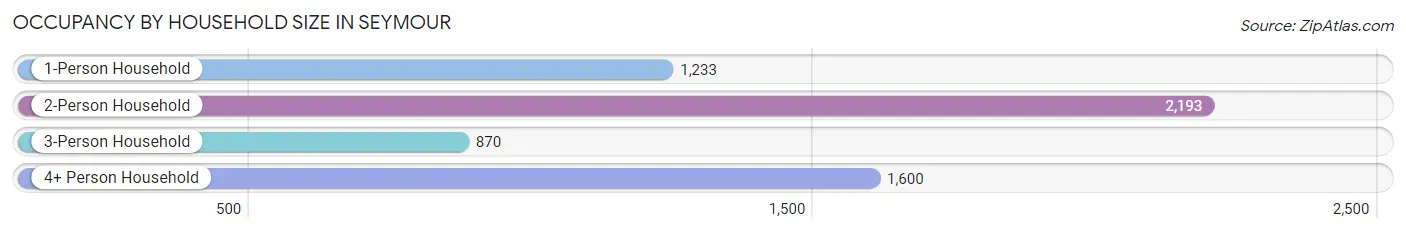
| Household Size | # Housing Units | % Housing Units |
| 1-Person Household | 1,233 | 20.9% |
| 2-Person Household | 2,193 | 37.2% |
| 3-Person Household | 870 | 14.8% |
| 4+ Person Household | 1,600 | 27.1% |
| Total Housing Units | 5,896 | 100.0% |
Occupancy by Ownership by Household Size in Seymour
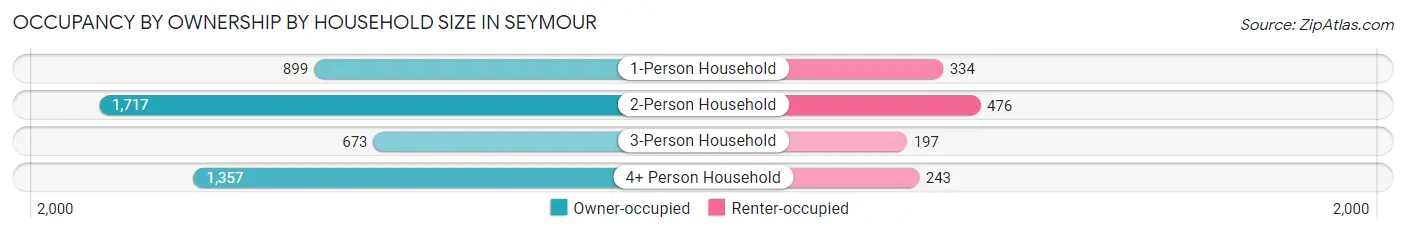
| Household Size | Owner-occupied | Renter-occupied |
| 1-Person Household | 899 (72.9%) | 334 (27.1%) |
| 2-Person Household | 1,717 (78.3%) | 476 (21.7%) |
| 3-Person Household | 673 (77.4%) | 197 (22.6%) |
| 4+ Person Household | 1,357 (84.8%) | 243 (15.2%) |
| Total Housing Units | 4,646 (78.8%) | 1,250 (21.2%) |
Occupancy by Educational Attainment in Seymour
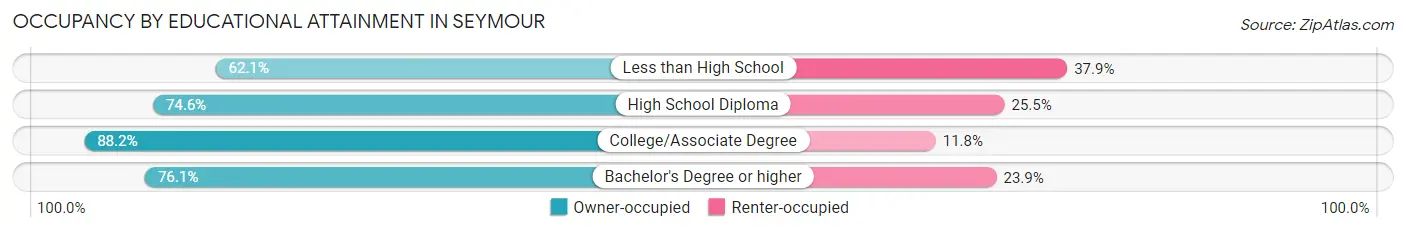
| Household Size | Owner-occupied | Renter-occupied |
| Less than High School | 246 (62.1%) | 150 (37.9%) |
| High School Diploma | 1,523 (74.6%) | 520 (25.5%) |
| College/Associate Degree | 1,796 (88.2%) | 241 (11.8%) |
| Bachelor's Degree or higher | 1,081 (76.1%) | 339 (23.9%) |
Occupancy by Age of Householder in Seymour
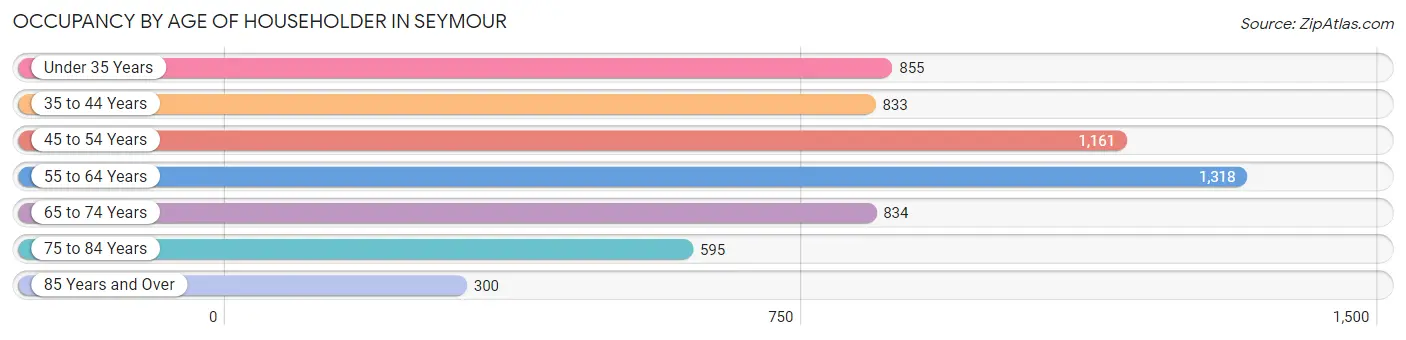
| Age Bracket | # Households | % Households |
| Under 35 Years | 855 | 14.5% |
| 35 to 44 Years | 833 | 14.1% |
| 45 to 54 Years | 1,161 | 19.7% |
| 55 to 64 Years | 1,318 | 22.4% |
| 65 to 74 Years | 834 | 14.1% |
| 75 to 84 Years | 595 | 10.1% |
| 85 Years and Over | 300 | 5.1% |
| Total | 5,896 | 100.0% |
Housing Finances in Seymour
Median Income by Occupancy in Seymour
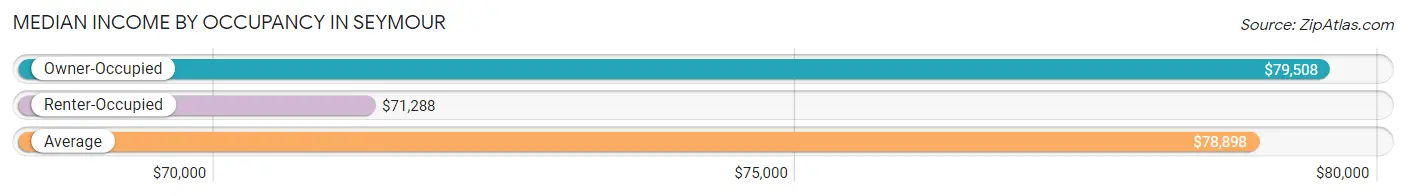
| Occupancy Type | # Households | Median Income |
| Owner-Occupied | 4,646 (78.8%) | $79,508 |
| Renter-Occupied | 1,250 (21.2%) | $71,288 |
| Average | 5,896 (100.0%) | $78,898 |
Occupancy by Householder Income Bracket in Seymour
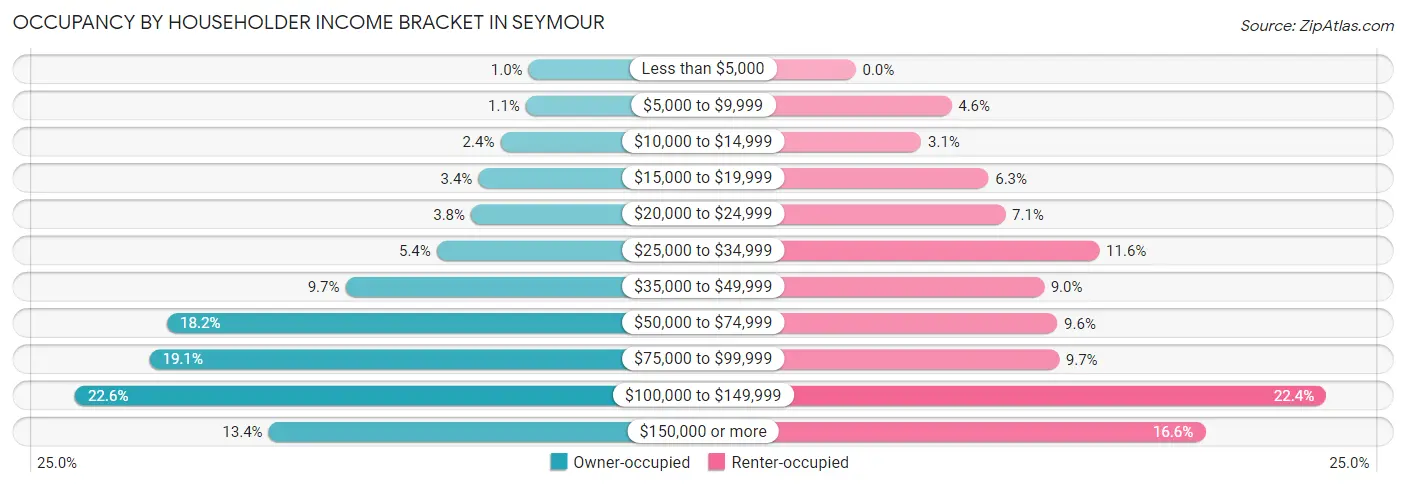
| Income Bracket | Owner-occupied | Renter-occupied |
| Less than $5,000 | 47 (1.0%) | 0 (0.0%) |
| $5,000 to $9,999 | 53 (1.1%) | 57 (4.6%) |
| $10,000 to $14,999 | 109 (2.4%) | 39 (3.1%) |
| $15,000 to $19,999 | 158 (3.4%) | 79 (6.3%) |
| $20,000 to $24,999 | 174 (3.7%) | 89 (7.1%) |
| $25,000 to $34,999 | 250 (5.4%) | 145 (11.6%) |
| $35,000 to $49,999 | 452 (9.7%) | 112 (9.0%) |
| $50,000 to $74,999 | 846 (18.2%) | 120 (9.6%) |
| $75,000 to $99,999 | 885 (19.1%) | 121 (9.7%) |
| $100,000 to $149,999 | 1,050 (22.6%) | 280 (22.4%) |
| $150,000 or more | 622 (13.4%) | 208 (16.6%) |
| Total | 4,646 (100.0%) | 1,250 (100.0%) |
Monthly Housing Cost Tiers in Seymour
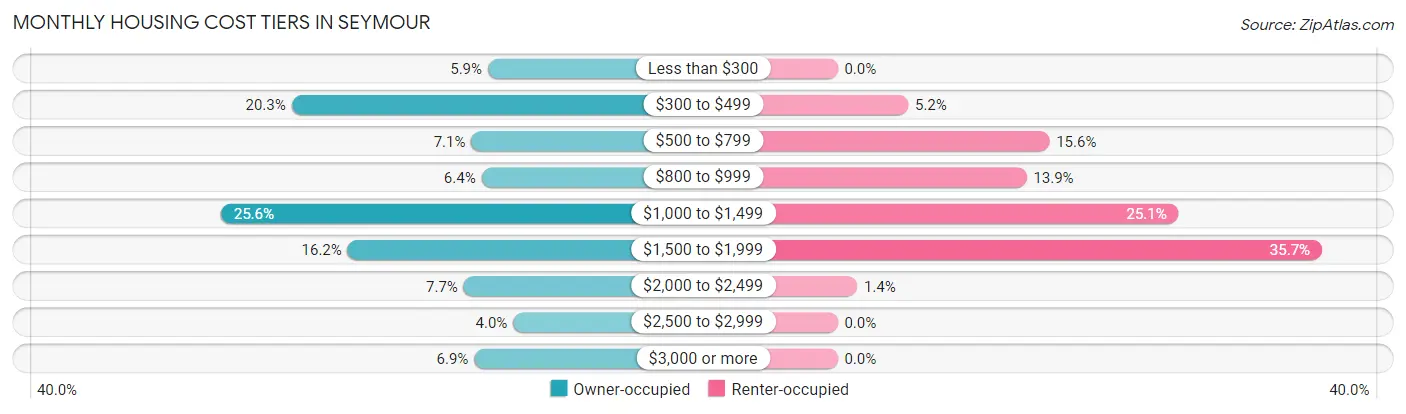
| Monthly Cost | Owner-occupied | Renter-occupied |
| Less than $300 | 273 (5.9%) | 0 (0.0%) |
| $300 to $499 | 945 (20.3%) | 65 (5.2%) |
| $500 to $799 | 330 (7.1%) | 195 (15.6%) |
| $800 to $999 | 295 (6.4%) | 174 (13.9%) |
| $1,000 to $1,499 | 1,187 (25.6%) | 314 (25.1%) |
| $1,500 to $1,999 | 753 (16.2%) | 446 (35.7%) |
| $2,000 to $2,499 | 356 (7.7%) | 18 (1.4%) |
| $2,500 to $2,999 | 187 (4.0%) | 0 (0.0%) |
| $3,000 or more | 320 (6.9%) | 0 (0.0%) |
| Total | 4,646 (100.0%) | 1,250 (100.0%) |
Physical Housing Characteristics in Seymour
Housing Structures in Seymour
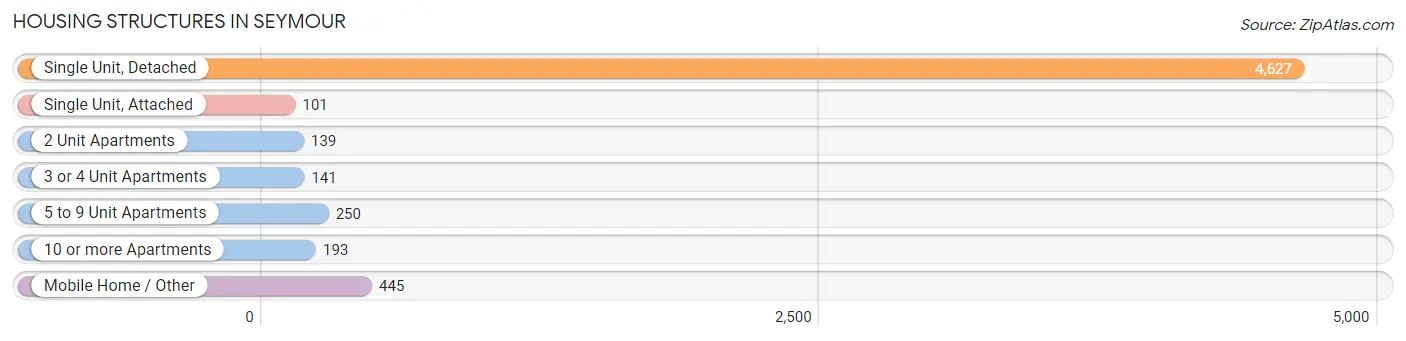
| Structure Type | # Housing Units | % Housing Units |
| Single Unit, Detached | 4,627 | 78.5% |
| Single Unit, Attached | 101 | 1.7% |
| 2 Unit Apartments | 139 | 2.4% |
| 3 or 4 Unit Apartments | 141 | 2.4% |
| 5 to 9 Unit Apartments | 250 | 4.2% |
| 10 or more Apartments | 193 | 3.3% |
| Mobile Home / Other | 445 | 7.5% |
| Total | 5,896 | 100.0% |
Housing Structures by Occupancy in Seymour
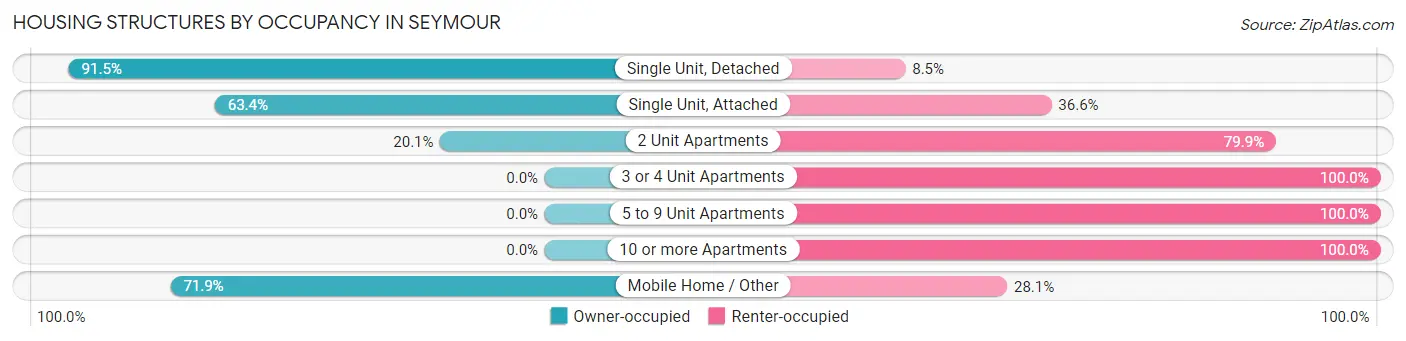
| Structure Type | Owner-occupied | Renter-occupied |
| Single Unit, Detached | 4,234 (91.5%) | 393 (8.5%) |
| Single Unit, Attached | 64 (63.4%) | 37 (36.6%) |
| 2 Unit Apartments | 28 (20.1%) | 111 (79.9%) |
| 3 or 4 Unit Apartments | 0 (0.0%) | 141 (100.0%) |
| 5 to 9 Unit Apartments | 0 (0.0%) | 250 (100.0%) |
| 10 or more Apartments | 0 (0.0%) | 193 (100.0%) |
| Mobile Home / Other | 320 (71.9%) | 125 (28.1%) |
| Total | 4,646 (78.8%) | 1,250 (21.2%) |
Housing Structures by Number of Rooms in Seymour
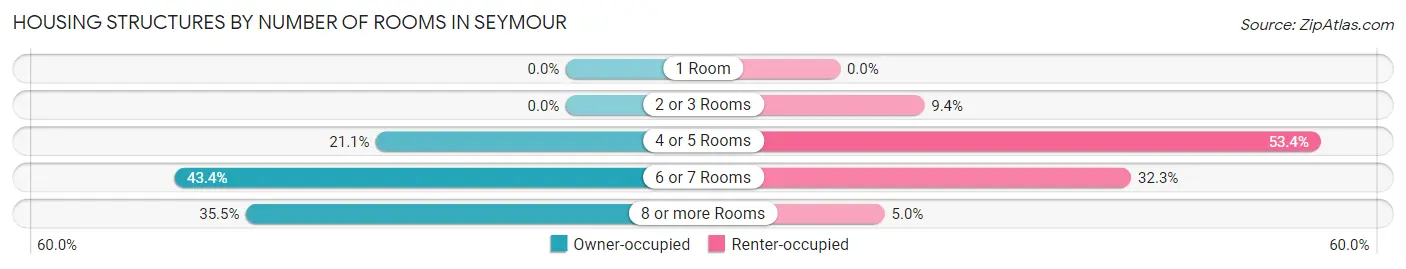
| Number of Rooms | Owner-occupied | Renter-occupied |
| 1 Room | 0 (0.0%) | 0 (0.0%) |
| 2 or 3 Rooms | 0 (0.0%) | 117 (9.4%) |
| 4 or 5 Rooms | 979 (21.1%) | 667 (53.4%) |
| 6 or 7 Rooms | 2,017 (43.4%) | 404 (32.3%) |
| 8 or more Rooms | 1,650 (35.5%) | 62 (5.0%) |
| Total | 4,646 (100.0%) | 1,250 (100.0%) |
Housing Structure by Heating Type in Seymour
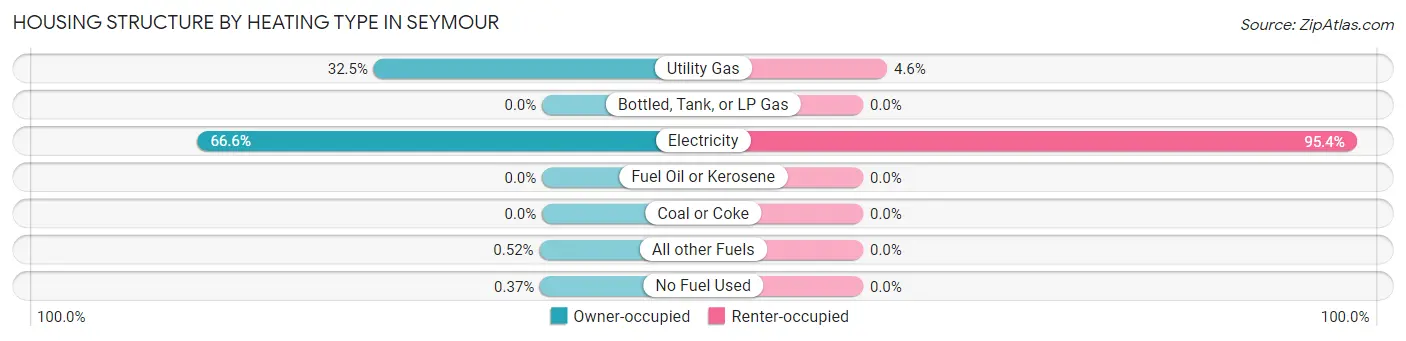
| Heating Type | Owner-occupied | Renter-occupied |
| Utility Gas | 1,511 (32.5%) | 58 (4.6%) |
| Bottled, Tank, or LP Gas | 0 (0.0%) | 0 (0.0%) |
| Electricity | 3,094 (66.6%) | 1,192 (95.4%) |
| Fuel Oil or Kerosene | 0 (0.0%) | 0 (0.0%) |
| Coal or Coke | 0 (0.0%) | 0 (0.0%) |
| All other Fuels | 24 (0.5%) | 0 (0.0%) |
| No Fuel Used | 17 (0.4%) | 0 (0.0%) |
| Total | 4,646 (100.0%) | 1,250 (100.0%) |
Household Vehicle Usage in Seymour
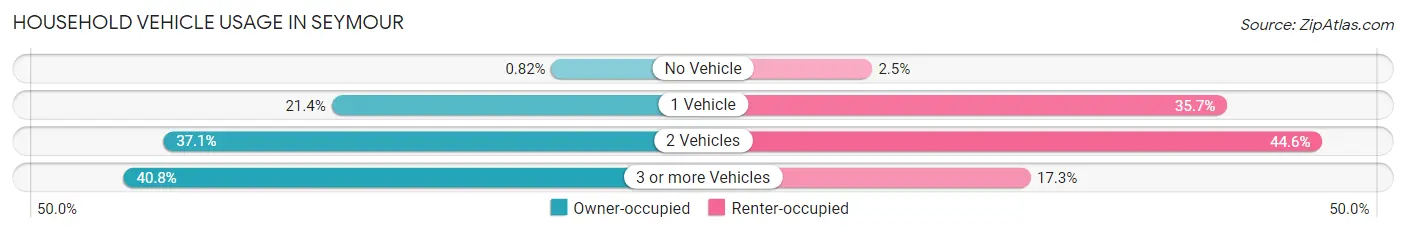
| Vehicles per Household | Owner-occupied | Renter-occupied |
| No Vehicle | 38 (0.8%) | 31 (2.5%) |
| 1 Vehicle | 992 (21.3%) | 446 (35.7%) |
| 2 Vehicles | 1,722 (37.1%) | 557 (44.6%) |
| 3 or more Vehicles | 1,894 (40.8%) | 216 (17.3%) |
| Total | 4,646 (100.0%) | 1,250 (100.0%) |
Real Estate & Mortgages in Seymour
Real Estate and Mortgage Overview in Seymour
| Characteristic | Without Mortgage | With Mortgage |
| Housing Units | 1,435 | 3,211 |
| Median Property Value | $217,500 | $265,300 |
| Median Household Income | $47,679 | $563 |
| Monthly Housing Costs | $372 | $305 |
| Real Estate Taxes | $870 | $26 |
Property Value by Mortgage Status in Seymour
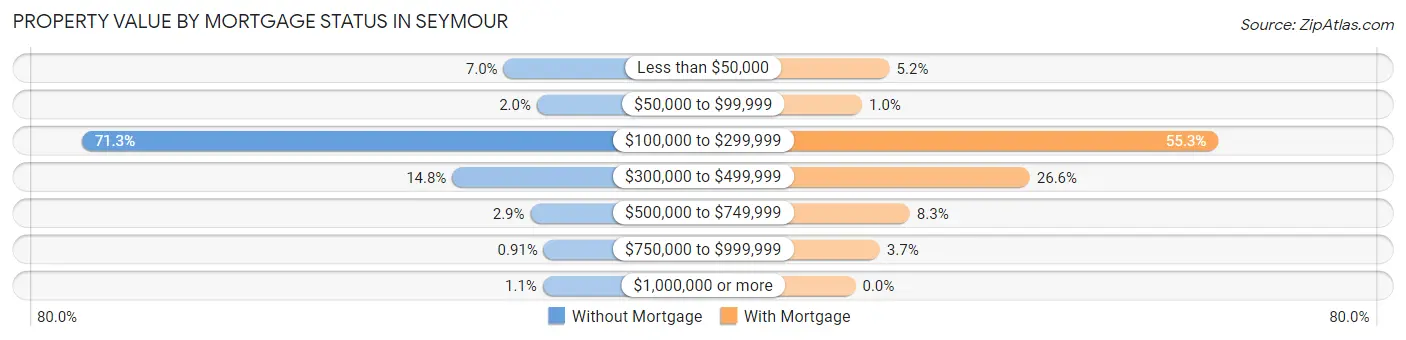
| Property Value | Without Mortgage | With Mortgage |
| Less than $50,000 | 101 (7.0%) | 167 (5.2%) |
| $50,000 to $99,999 | 28 (1.9%) | 32 (1.0%) |
| $100,000 to $299,999 | 1,023 (71.3%) | 1,774 (55.2%) |
| $300,000 to $499,999 | 213 (14.8%) | 853 (26.6%) |
| $500,000 to $749,999 | 42 (2.9%) | 266 (8.3%) |
| $750,000 to $999,999 | 13 (0.9%) | 119 (3.7%) |
| $1,000,000 or more | 15 (1.1%) | 0 (0.0%) |
| Total | 1,435 (100.0%) | 3,211 (100.0%) |
Household Income by Mortgage Status in Seymour
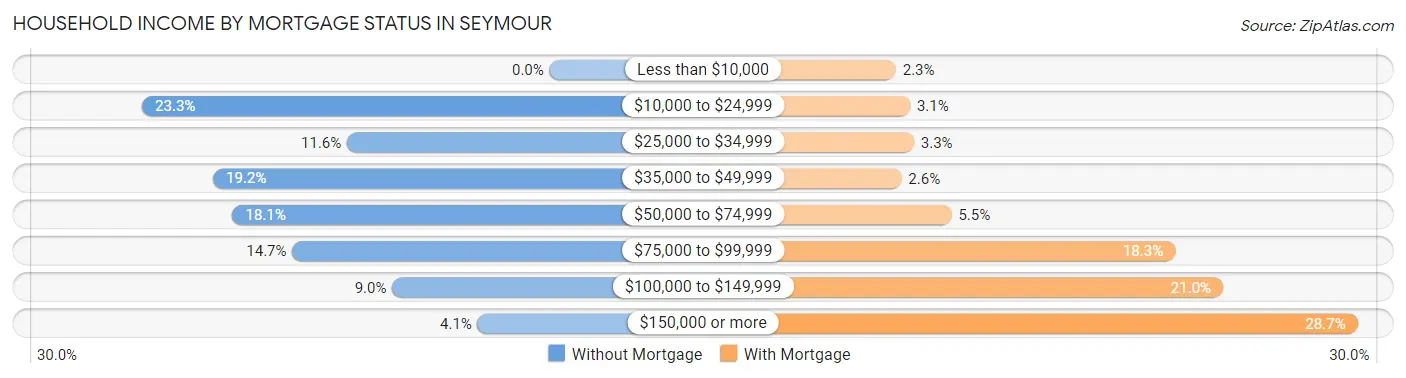
| Household Income | Without Mortgage | With Mortgage |
| Less than $10,000 | 0 (0.0%) | 74 (2.3%) |
| $10,000 to $24,999 | 334 (23.3%) | 100 (3.1%) |
| $25,000 to $34,999 | 166 (11.6%) | 107 (3.3%) |
| $35,000 to $49,999 | 276 (19.2%) | 84 (2.6%) |
| $50,000 to $74,999 | 260 (18.1%) | 176 (5.5%) |
| $75,000 to $99,999 | 211 (14.7%) | 586 (18.2%) |
| $100,000 to $149,999 | 129 (9.0%) | 674 (21.0%) |
| $150,000 or more | 59 (4.1%) | 921 (28.7%) |
| Total | 1,435 (100.0%) | 3,211 (100.0%) |
Property Value to Household Income Ratio in Seymour
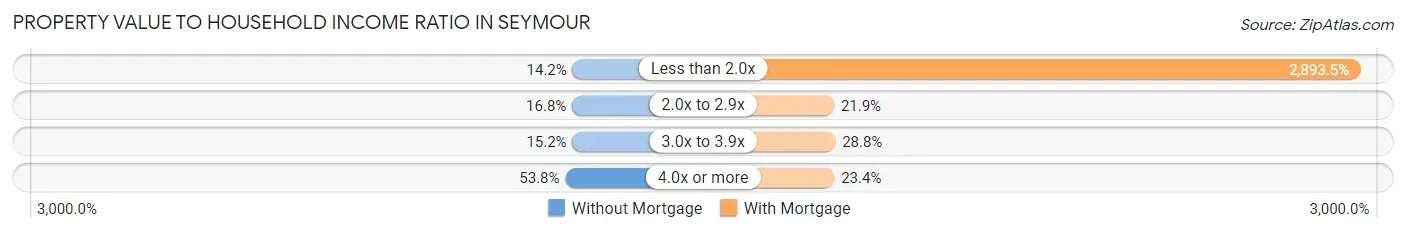
| Value-to-Income Ratio | Without Mortgage | With Mortgage |
| Less than 2.0x | 204 (14.2%) | 92,909 (2,893.5%) |
| 2.0x to 2.9x | 241 (16.8%) | 703 (21.9%) |
| 3.0x to 3.9x | 218 (15.2%) | 925 (28.8%) |
| 4.0x or more | 772 (53.8%) | 752 (23.4%) |
| Total | 1,435 (100.0%) | 3,211 (100.0%) |
Real Estate Taxes by Mortgage Status in Seymour
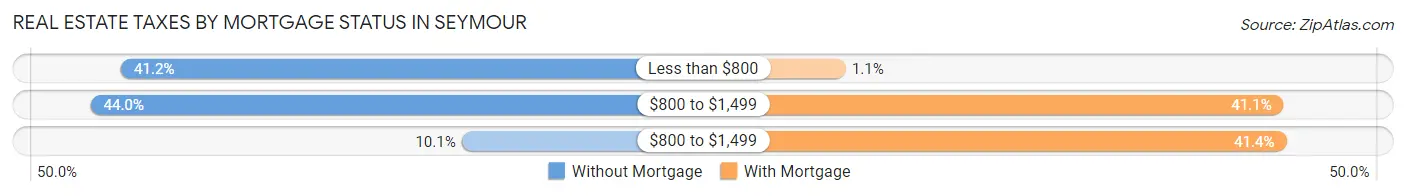
| Property Taxes | Without Mortgage | With Mortgage |
| Less than $800 | 591 (41.2%) | 35 (1.1%) |
| $800 to $1,499 | 631 (44.0%) | 1,321 (41.1%) |
| $800 to $1,499 | 145 (10.1%) | 1,329 (41.4%) |
| Total | 1,435 (100.0%) | 3,211 (100.0%) |
Health & Disability in Seymour
Health Insurance Coverage by Age in Seymour
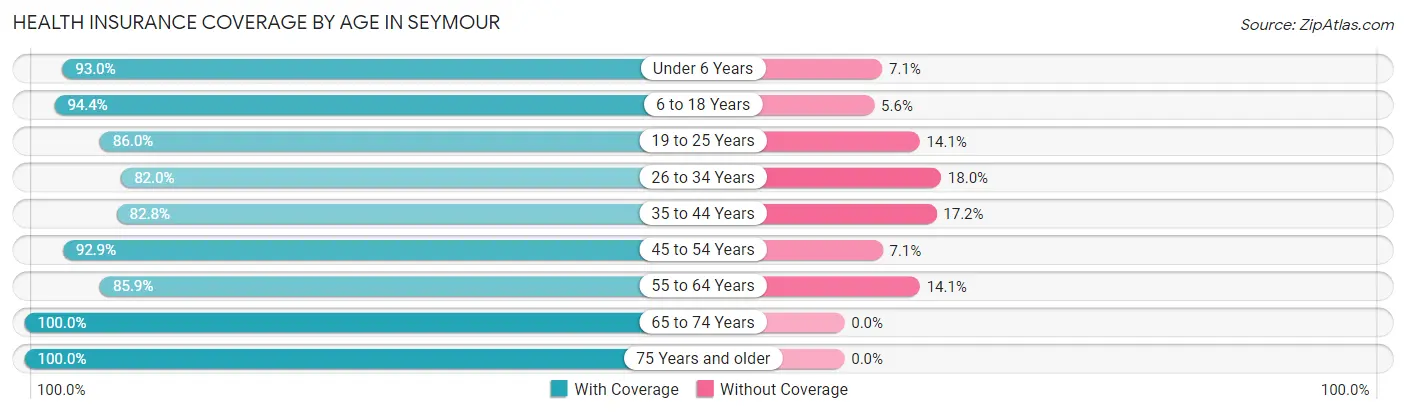
| Age Bracket | With Coverage | Without Coverage |
| Under 6 Years | 963 (92.9%) | 73 (7.0%) |
| 6 to 18 Years | 2,596 (94.4%) | 153 (5.6%) |
| 19 to 25 Years | 1,077 (86.0%) | 176 (14.1%) |
| 26 to 34 Years | 1,228 (82.0%) | 270 (18.0%) |
| 35 to 44 Years | 1,578 (82.8%) | 327 (17.2%) |
| 45 to 54 Years | 2,607 (92.9%) | 200 (7.1%) |
| 55 to 64 Years | 1,809 (85.9%) | 296 (14.1%) |
| 65 to 74 Years | 1,420 (100.0%) | 0 (0.0%) |
| 75 Years and older | 1,296 (100.0%) | 0 (0.0%) |
| Total | 14,574 (90.7%) | 1,495 (9.3%) |
Health Insurance Coverage by Citizenship Status in Seymour
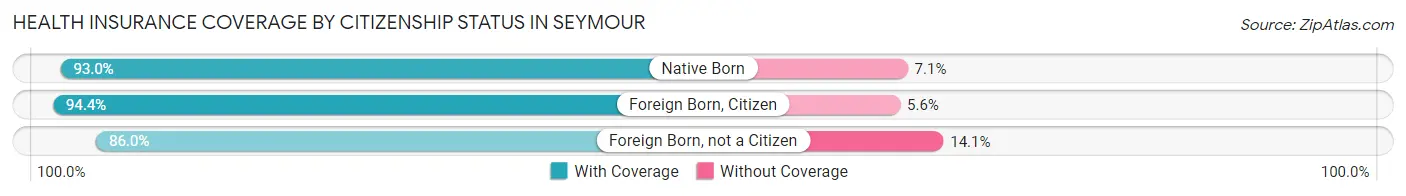
| Citizenship Status | With Coverage | Without Coverage |
| Native Born | 963 (92.9%) | 73 (7.0%) |
| Foreign Born, Citizen | 2,596 (94.4%) | 153 (5.6%) |
| Foreign Born, not a Citizen | 1,077 (86.0%) | 176 (14.1%) |
Health Insurance Coverage by Household Income in Seymour
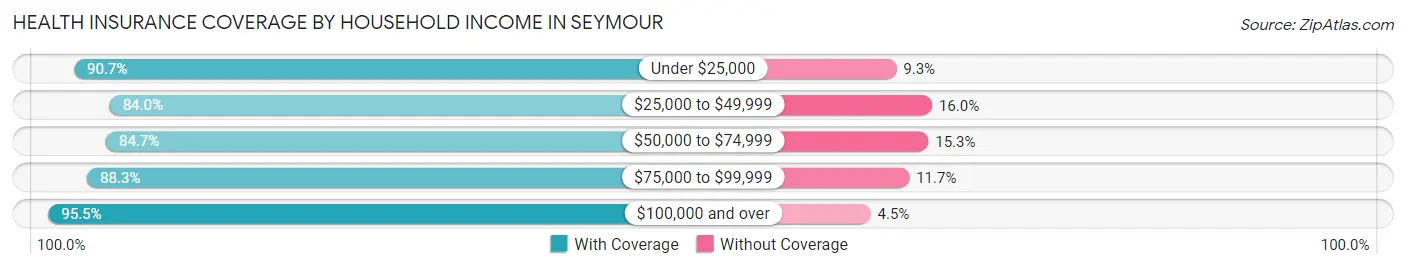
| Household Income | With Coverage | Without Coverage |
| Under $25,000 | 1,368 (90.7%) | 140 (9.3%) |
| $25,000 to $49,999 | 1,632 (84.0%) | 310 (16.0%) |
| $50,000 to $74,999 | 2,103 (84.7%) | 379 (15.3%) |
| $75,000 to $99,999 | 2,612 (88.3%) | 346 (11.7%) |
| $100,000 and over | 6,859 (95.5%) | 320 (4.5%) |
Public vs Private Health Insurance Coverage by Age in Seymour
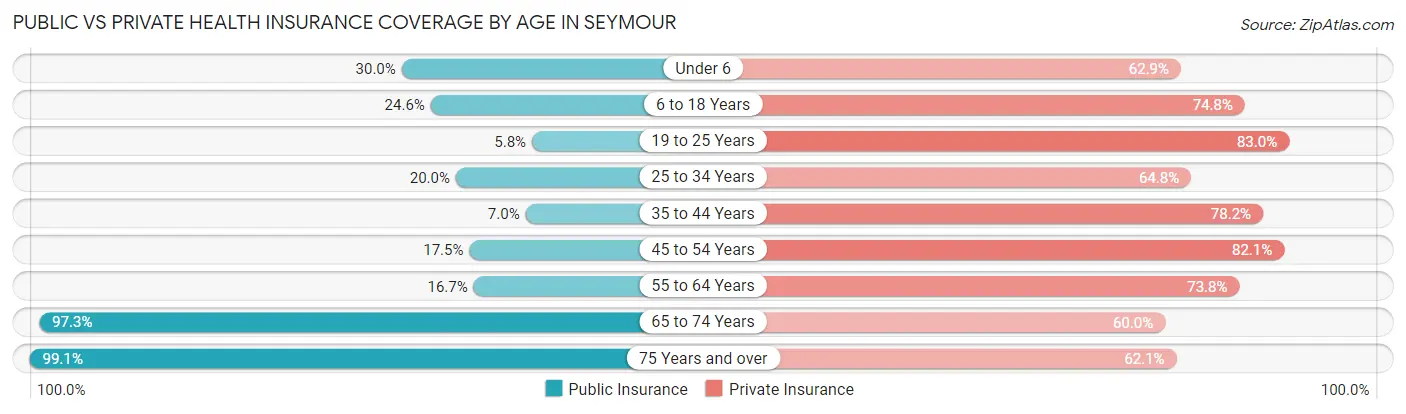
| Age Bracket | Public Insurance | Private Insurance |
| Under 6 | 311 (30.0%) | 652 (62.9%) |
| 6 to 18 Years | 677 (24.6%) | 2,056 (74.8%) |
| 19 to 25 Years | 73 (5.8%) | 1,040 (83.0%) |
| 25 to 34 Years | 299 (20.0%) | 971 (64.8%) |
| 35 to 44 Years | 134 (7.0%) | 1,489 (78.2%) |
| 45 to 54 Years | 490 (17.5%) | 2,304 (82.1%) |
| 55 to 64 Years | 351 (16.7%) | 1,553 (73.8%) |
| 65 to 74 Years | 1,382 (97.3%) | 852 (60.0%) |
| 75 Years and over | 1,284 (99.1%) | 805 (62.1%) |
| Total | 5,001 (31.1%) | 11,722 (73.0%) |
Disability Status by Sex by Age in Seymour
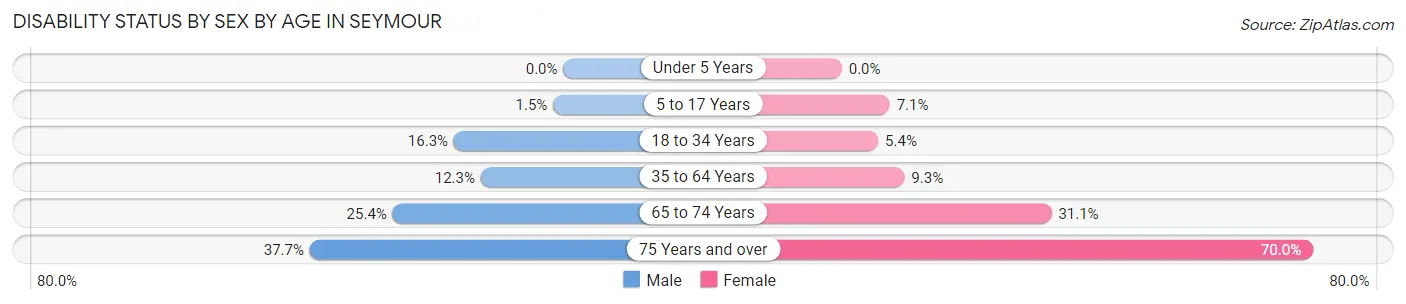
| Age Bracket | Male | Female |
| Under 5 Years | 0 (0.0%) | 0 (0.0%) |
| 5 to 17 Years | 16 (1.5%) | 110 (7.1%) |
| 18 to 34 Years | 276 (16.3%) | 70 (5.4%) |
| 35 to 64 Years | 389 (12.3%) | 339 (9.3%) |
| 65 to 74 Years | 145 (25.4%) | 264 (31.1%) |
| 75 Years and over | 157 (37.7%) | 615 (70.0%) |
Disability Class by Sex by Age in Seymour
Disability Class: Hearing Difficulty
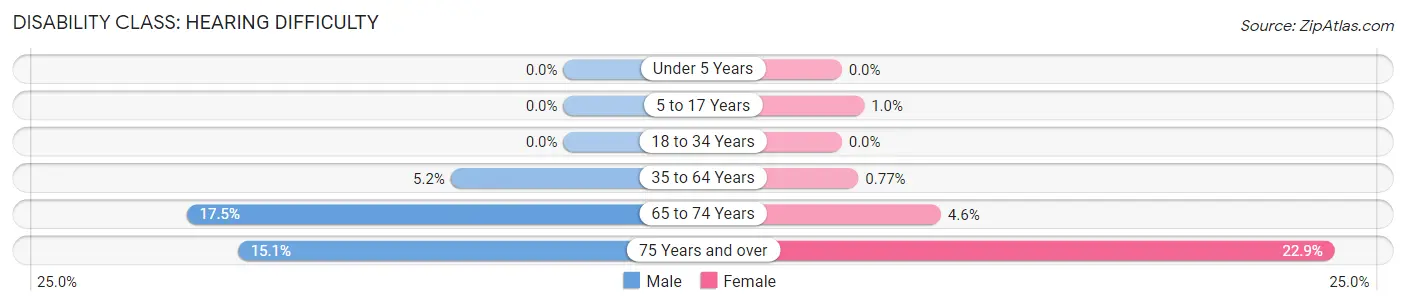
| Age Bracket | Male | Female |
| Under 5 Years | 0 (0.0%) | 0 (0.0%) |
| 5 to 17 Years | 0 (0.0%) | 16 (1.0%) |
| 18 to 34 Years | 0 (0.0%) | 0 (0.0%) |
| 35 to 64 Years | 166 (5.2%) | 28 (0.8%) |
| 65 to 74 Years | 100 (17.5%) | 39 (4.6%) |
| 75 Years and over | 63 (15.1%) | 201 (22.9%) |
Disability Class: Vision Difficulty
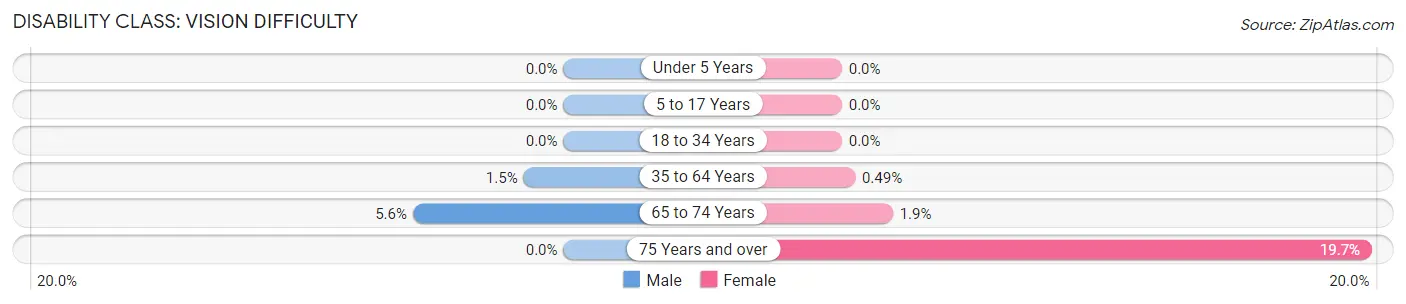
| Age Bracket | Male | Female |
| Under 5 Years | 0 (0.0%) | 0 (0.0%) |
| 5 to 17 Years | 0 (0.0%) | 0 (0.0%) |
| 18 to 34 Years | 0 (0.0%) | 0 (0.0%) |
| 35 to 64 Years | 47 (1.5%) | 18 (0.5%) |
| 65 to 74 Years | 32 (5.6%) | 16 (1.9%) |
| 75 Years and over | 0 (0.0%) | 173 (19.7%) |
Disability Class: Cognitive Difficulty
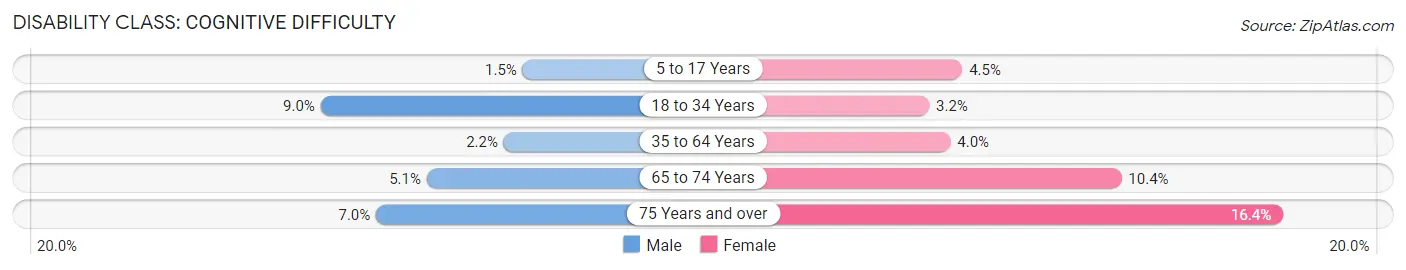
| Age Bracket | Male | Female |
| 5 to 17 Years | 16 (1.5%) | 69 (4.5%) |
| 18 to 34 Years | 153 (9.0%) | 42 (3.2%) |
| 35 to 64 Years | 70 (2.2%) | 147 (4.0%) |
| 65 to 74 Years | 29 (5.1%) | 88 (10.4%) |
| 75 Years and over | 29 (7.0%) | 144 (16.4%) |
Disability Class: Ambulatory Difficulty
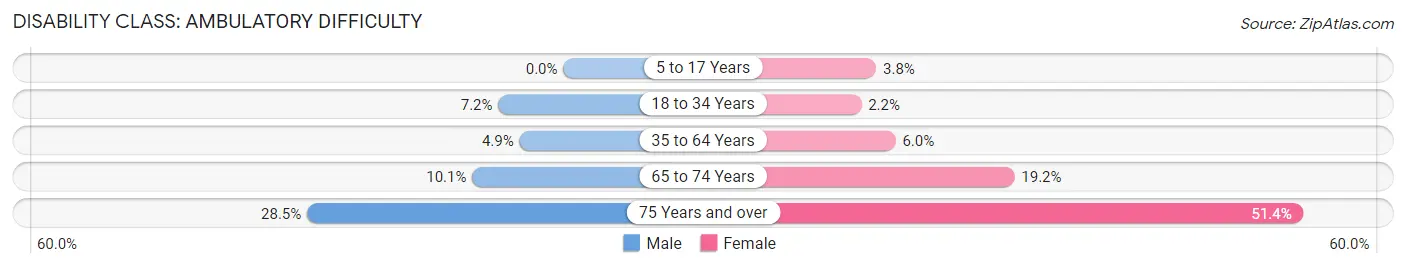
| Age Bracket | Male | Female |
| 5 to 17 Years | 0 (0.0%) | 59 (3.8%) |
| 18 to 34 Years | 123 (7.2%) | 28 (2.2%) |
| 35 to 64 Years | 155 (4.9%) | 218 (6.0%) |
| 65 to 74 Years | 58 (10.1%) | 163 (19.2%) |
| 75 Years and over | 119 (28.5%) | 452 (51.4%) |
Disability Class: Self-Care Difficulty
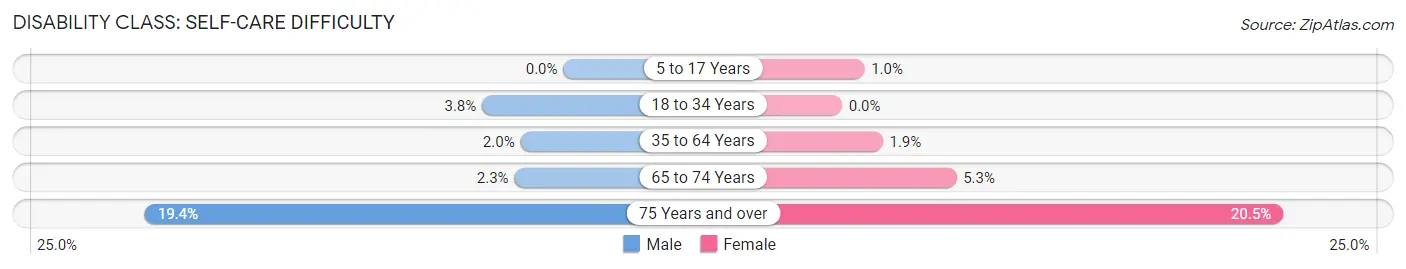
| Age Bracket | Male | Female |
| 5 to 17 Years | 0 (0.0%) | 16 (1.0%) |
| 18 to 34 Years | 64 (3.8%) | 0 (0.0%) |
| 35 to 64 Years | 63 (2.0%) | 69 (1.9%) |
| 65 to 74 Years | 13 (2.3%) | 45 (5.3%) |
| 75 Years and over | 81 (19.4%) | 180 (20.5%) |
Technology Access in Seymour
Computing Device Access in Seymour
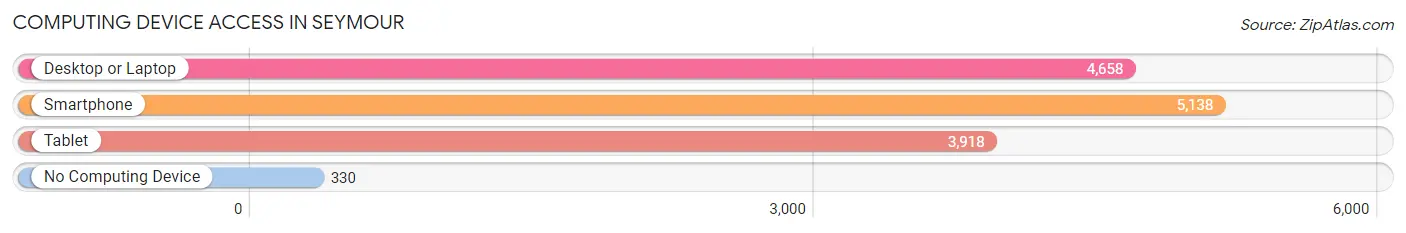
| Device Type | # Households | % Households |
| Desktop or Laptop | 4,658 | 79.0% |
| Smartphone | 5,138 | 87.1% |
| Tablet | 3,918 | 66.4% |
| No Computing Device | 330 | 5.6% |
| Total | 5,896 | 100.0% |
Internet Access in Seymour
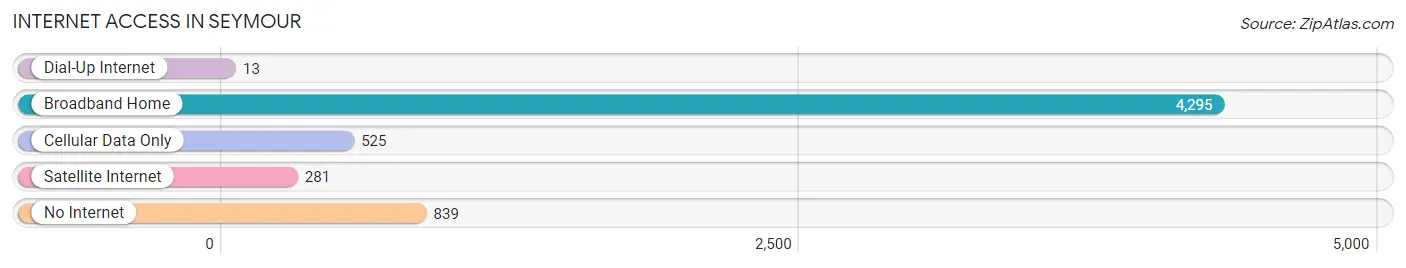
| Internet Type | # Households | % Households |
| Dial-Up Internet | 13 | 0.2% |
| Broadband Home | 4,295 | 72.9% |
| Cellular Data Only | 525 | 8.9% |
| Satellite Internet | 281 | 4.8% |
| No Internet | 839 | 14.2% |
| Total | 5,896 | 100.0% |
Seymour Summary
Seymour, Tennessee is a small city located in the foothills of the Great Smoky Mountains in eastern Tennessee. It is part of Sevier County and is situated about 25 miles southeast of Knoxville. The city has a population of approximately 6,000 people and is known for its rural charm and friendly atmosphere.
History
Seymour was first settled in the early 1800s by settlers from North Carolina. The city was originally known as “Seymourville” and was named after the first settler, William Seymour. The city was officially incorporated in 1875 and has since grown to become a thriving community.
Geography
Seymour is located in the foothills of the Great Smoky Mountains in eastern Tennessee. The city is situated about 25 miles southeast of Knoxville and is surrounded by the towns of Kodak, Pigeon Forge, and Gatlinburg. The city is located at an elevation of 1,000 feet and has a total area of 4.2 square miles.
Economy
Seymour’s economy is largely based on tourism and manufacturing. The city is home to several tourist attractions, including the Great Smoky Mountains National Park, Dollywood, and the Great Smoky Mountains Railroad. The city is also home to several manufacturing companies, including Denso Manufacturing Tennessee, Inc., which produces automotive parts.
Demographics
As of the 2010 census, the population of Seymour was 6,039. The racial makeup of the city was 95.2% White, 1.2% African American, 0.3% Native American, 0.7% Asian, 0.1% Pacific Islander, 1.2% from other races, and 1.3% from two or more races. Hispanic or Latino of any race were 2.7% of the population.
The median income for a household in the city was $37,917, and the median income for a family was $45,938. The per capita income for the city was $19,945. About 11.2% of families and 14.2% of the population were below the poverty line, including 19.2% of those under age 18 and 11.2% of those age 65 or over.
Seymour is a small city with a rich history and a vibrant economy. It is a great place to live, work, and visit, and its friendly atmosphere and rural charm make it a great place to call home.
Common Questions
What is Per Capita Income in Seymour?
Per Capita income in Seymour is $37,472.
What is the Median Family Income in Seymour?
Median Family Income in Seymour is $89,571.
What is the Median Household income in Seymour?
Median Household Income in Seymour is $78,898.
What is Income or Wage Gap in Seymour?
Income or Wage Gap in Seymour is 35.6%.
Women in Seymour earn 64.4 cents for every dollar earned by a man.
What is Inequality or Gini Index in Seymour?
Inequality or Gini Index in Seymour is 0.45.
What is the Total Population of Seymour?
Total Population of Seymour is 16,081.
What is the Total Male Population of Seymour?
Total Male Population of Seymour is 7,521.
What is the Total Female Population of Seymour?
Total Female Population of Seymour is 8,560.
What is the Ratio of Males per 100 Females in Seymour?
There are 87.86 Males per 100 Females in Seymour.
What is the Ratio of Females per 100 Males in Seymour?
There are 113.81 Females per 100 Males in Seymour.
What is the Median Population Age in Seymour?
Median Population Age in Seymour is 42.4 Years.
What is the Average Family Size in Seymour
Average Family Size in Seymour is 3.1 People.
What is the Average Household Size in Seymour
Average Household Size in Seymour is 2.7 People.
How Large is the Labor Force in Seymour?
There are 8,136 People in the Labor Forcein in Seymour.
What is the Percentage of People in the Labor Force in Seymour?
62.7% of People are in the Labor Force in Seymour.
What is the Unemployment Rate in Seymour?
Unemployment Rate in Seymour is 6.0%.