Savannah, TN Map & Demographics
Savannah Map
Savannah Overview
$20,228
PER CAPITA INCOME
$40,423
AVG FAMILY INCOME
$40,200
AVG HOUSEHOLD INCOME
42.1%
WAGE / INCOME GAP [ % ]
57.9¢/ $1
WAGE / INCOME GAP [ $ ]
0.45
INEQUALITY / GINI INDEX
7,206
TOTAL POPULATION
3,248
MALE POPULATION
3,958
FEMALE POPULATION
82.06
MALES / 100 FEMALES
121.86
FEMALES / 100 MALES
36.3
MEDIAN AGE
3.1
AVG FAMILY SIZE
2.5
AVG HOUSEHOLD SIZE
2,579
LABOR FORCE [ PEOPLE ]
47.2%
PERCENT IN LABOR FORCE
1.6%
UNEMPLOYMENT RATE
Savannah Zip Codes
Savannah Area Codes
Income in Savannah
Income Overview in Savannah
Per Capita Income in Savannah is $20,228, while median incomes of families and households are $40,423 and $40,200 respectively.
| Characteristic | Number | Measure |
| Per Capita Income | 7,206 | $20,228 |
| Median Family Income | 1,737 | $40,423 |
| Mean Family Income | 1,737 | $52,630 |
| Median Household Income | 2,697 | $40,200 |
| Mean Household Income | 2,697 | $50,951 |
| Income Deficit | 1,737 | $0 |
| Wage / Income Gap (%) | 7,206 | 42.09% |
| Wage / Income Gap ($) | 7,206 | 57.91¢ per $1 |
| Gini / Inequality Index | 7,206 | 0.45 |
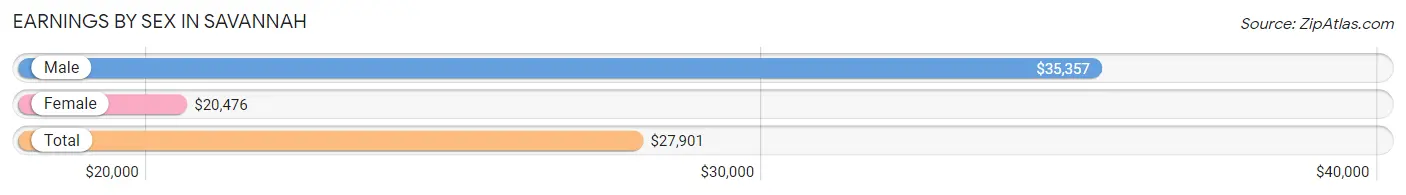
Earnings by Sex in Savannah
Average Earnings in Savannah are $27,901, $35,357 for men and $20,476 for women, a difference of 42.1%.
| Sex | Number | Average Earnings |
| Male | 1,374 (50.0%) | $35,357 |
| Female | 1,374 (50.0%) | $20,476 |
| Total | 2,748 (100.0%) | $27,901 |
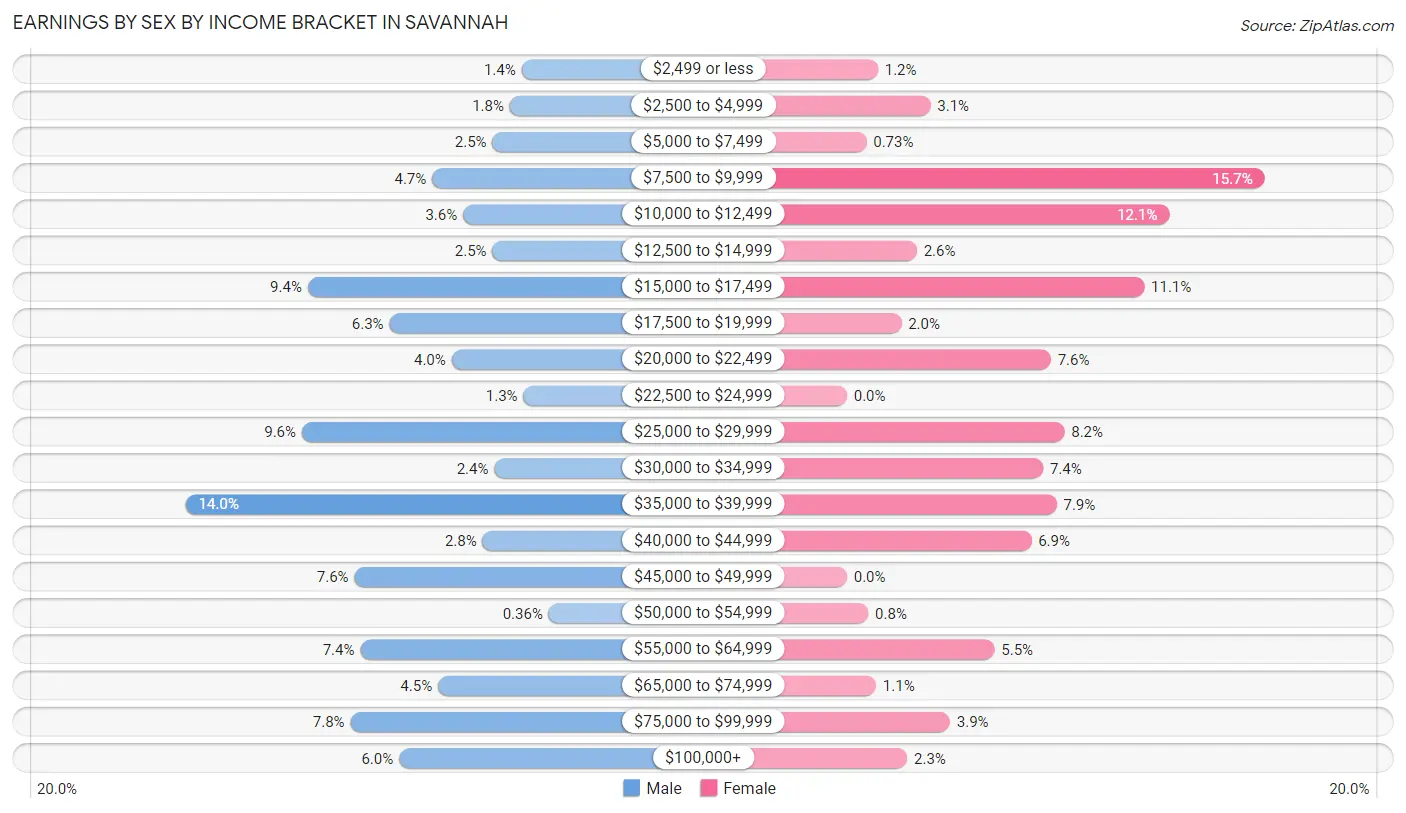
Earnings by Sex by Income Bracket in Savannah
The most common earnings brackets in Savannah are $35,000 to $39,999 for men (192 | 14.0%) and $7,500 to $9,999 for women (215 | 15.7%).
| Income | Male | Female |
| $2,499 or less | 19 (1.4%) | 16 (1.2%) |
| $2,500 to $4,999 | 25 (1.8%) | 43 (3.1%) |
| $5,000 to $7,499 | 34 (2.5%) | 10 (0.7%) |
| $7,500 to $9,999 | 65 (4.7%) | 215 (15.7%) |
| $10,000 to $12,499 | 49 (3.6%) | 166 (12.1%) |
| $12,500 to $14,999 | 34 (2.5%) | 36 (2.6%) |
| $15,000 to $17,499 | 129 (9.4%) | 153 (11.1%) |
| $17,500 to $19,999 | 87 (6.3%) | 28 (2.0%) |
| $20,000 to $22,499 | 55 (4.0%) | 105 (7.6%) |
| $22,500 to $24,999 | 18 (1.3%) | 0 (0.0%) |
| $25,000 to $29,999 | 132 (9.6%) | 112 (8.2%) |
| $30,000 to $34,999 | 33 (2.4%) | 101 (7.3%) |
| $35,000 to $39,999 | 192 (14.0%) | 108 (7.9%) |
| $40,000 to $44,999 | 39 (2.8%) | 95 (6.9%) |
| $45,000 to $49,999 | 105 (7.6%) | 0 (0.0%) |
| $50,000 to $54,999 | 5 (0.4%) | 11 (0.8%) |
| $55,000 to $64,999 | 102 (7.4%) | 76 (5.5%) |
| $65,000 to $74,999 | 62 (4.5%) | 15 (1.1%) |
| $75,000 to $99,999 | 107 (7.8%) | 53 (3.9%) |
| $100,000+ | 82 (6.0%) | 31 (2.3%) |
| Total | 1,374 (100.0%) | 1,374 (100.0%) |
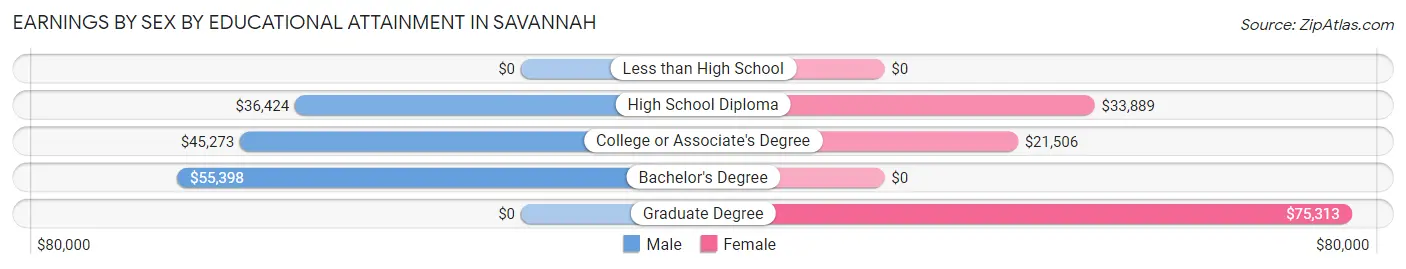
Earnings by Sex by Educational Attainment in Savannah
Average earnings in Savannah are $38,322 for men and $27,736 for women, a difference of 27.6%. Men with an educational attainment of bachelor's degree enjoy the highest average annual earnings of $55,398, while those with high school diploma education earn the least with $36,424. Women with an educational attainment of graduate degree earn the most with the average annual earnings of $75,313, while those with college or associate's degree education have the smallest earnings of $21,506.
| Educational Attainment | Male Income | Female Income |
| Less than High School | - | - |
| High School Diploma | $36,424 | $33,889 |
| College or Associate's Degree | $45,273 | $21,506 |
| Bachelor's Degree | $55,398 | $0 |
| Graduate Degree | - | - |
| Total | $38,322 | $27,736 |
Family Income in Savannah
Family Income Brackets in Savannah
According to the Savannah family income data, there are 525 families falling into the $35,000 to $49,999 income range, which is the most common income bracket and makes up 30.2% of all families. Conversely, the $200,000+ income bracket is the least frequent group with only 30 families (1.7%) belonging to this category.
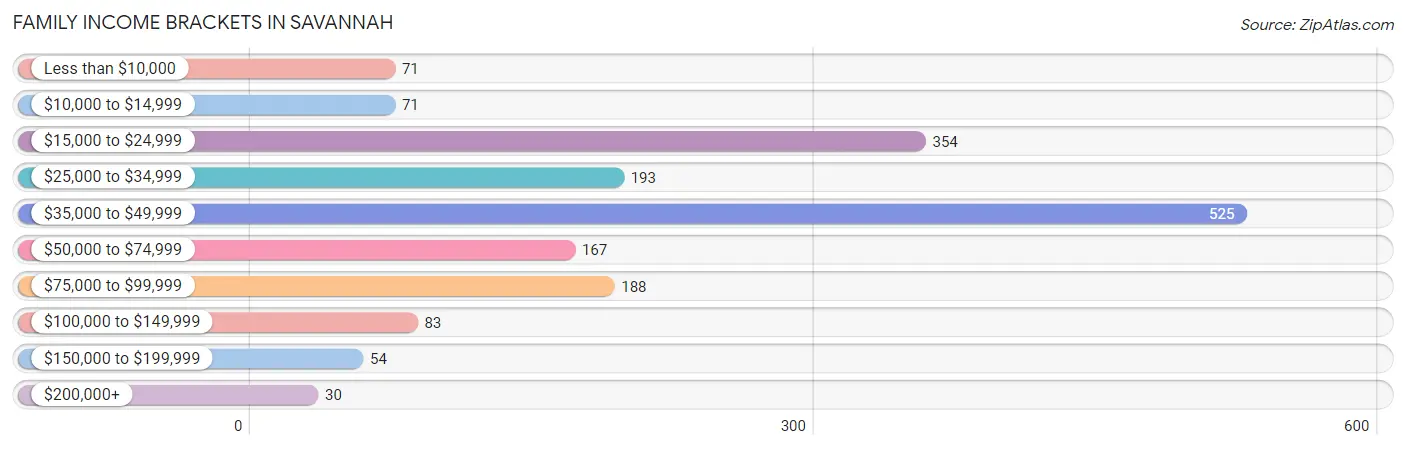
| Income Bracket | # Families | % Families |
| Less than $10,000 | 71 | 4.1% |
| $10,000 to $14,999 | 71 | 4.1% |
| $15,000 to $24,999 | 354 | 20.4% |
| $25,000 to $34,999 | 193 | 11.1% |
| $35,000 to $49,999 | 525 | 30.2% |
| $50,000 to $74,999 | 167 | 9.6% |
| $75,000 to $99,999 | 188 | 10.8% |
| $100,000 to $149,999 | 83 | 4.8% |
| $150,000 to $199,999 | 54 | 3.1% |
| $200,000+ | 30 | 1.7% |
Family Income by Famaliy Size in Savannah
4-person families (209 | 12.0%) account for the highest median family income in Savannah with $48,869 per family, while 2-person families (895 | 51.5%) have the highest median income of $19,952 per family member.
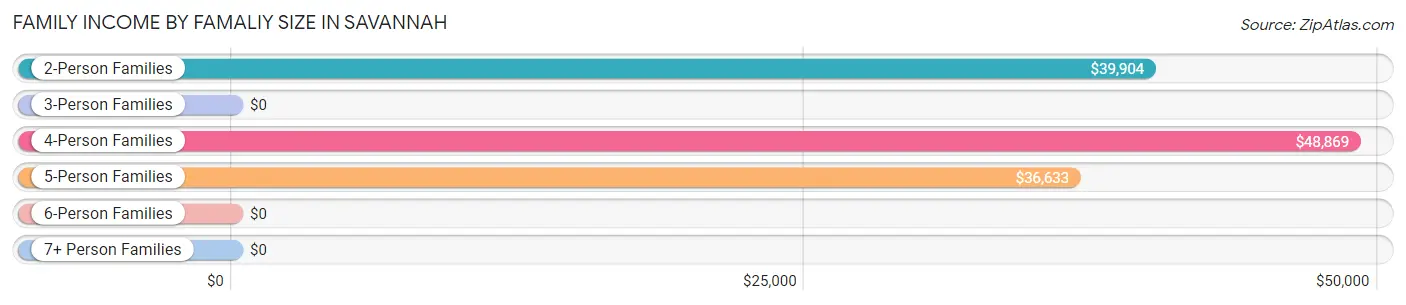
| Income Bracket | # Families | Median Income |
| 2-Person Families | 895 (51.5%) | $39,904 |
| 3-Person Families | 419 (24.1%) | $0 |
| 4-Person Families | 209 (12.0%) | $48,869 |
| 5-Person Families | 108 (6.2%) | $36,633 |
| 6-Person Families | 99 (5.7%) | $0 |
| 7+ Person Families | 7 (0.4%) | $0 |
| Total | 1,737 (100.0%) | $40,423 |
Family Income by Number of Earners in Savannah
The median family income in Savannah is $40,423, with families comprising 3+ earners (50) having the highest median family income of $98,900, while families with no earners (431) have the lowest median family income of $28,897, accounting for 2.9% and 24.8% of families, respectively.
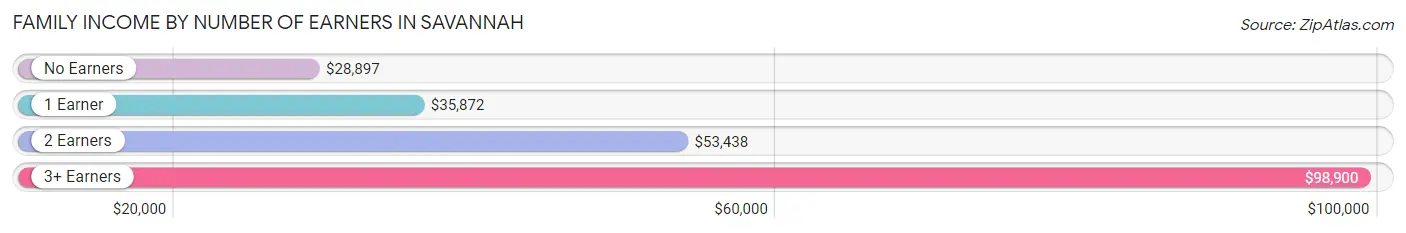
| Number of Earners | # Families | Median Income |
| No Earners | 431 (24.8%) | $28,897 |
| 1 Earner | 837 (48.2%) | $35,872 |
| 2 Earners | 419 (24.1%) | $53,438 |
| 3+ Earners | 50 (2.9%) | $98,900 |
| Total | 1,737 (100.0%) | $40,423 |
Household Income in Savannah
Household Income Brackets in Savannah
With 580 households falling in the category, the $35,000 to $49,999 income range is the most frequent in Savannah, accounting for 21.5% of all households. In contrast, only 46 households (1.7%) fall into the $200,000+ income bracket, making it the least populous group.
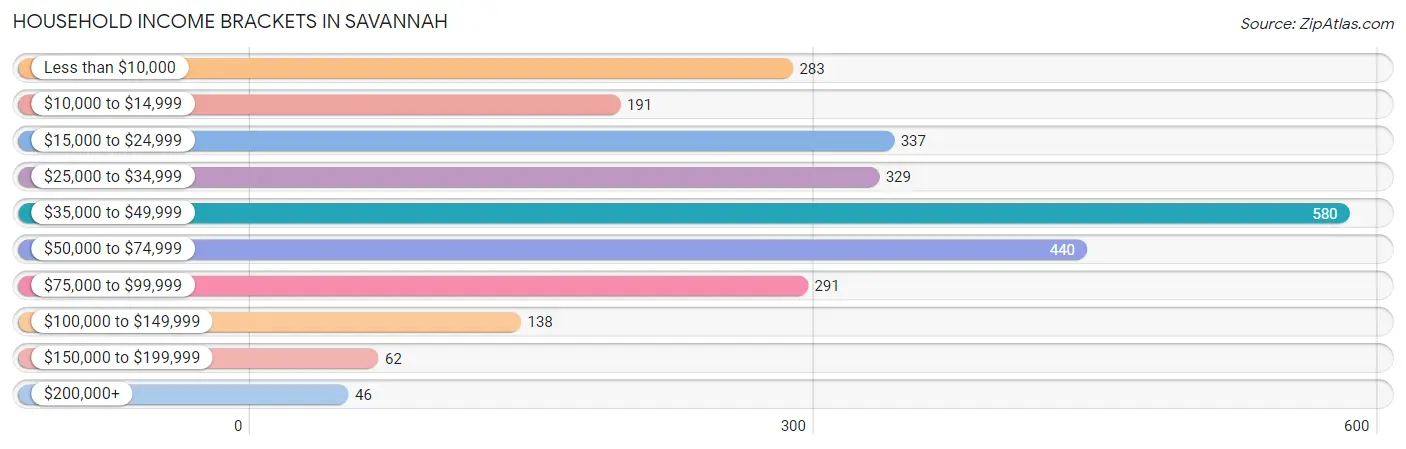
| Income Bracket | # Households | % Households |
| Less than $10,000 | 283 | 10.5% |
| $10,000 to $14,999 | 191 | 7.1% |
| $15,000 to $24,999 | 337 | 12.5% |
| $25,000 to $34,999 | 329 | 12.2% |
| $35,000 to $49,999 | 580 | 21.5% |
| $50,000 to $74,999 | 440 | 16.3% |
| $75,000 to $99,999 | 291 | 10.8% |
| $100,000 to $149,999 | 138 | 5.1% |
| $150,000 to $199,999 | 62 | 2.3% |
| $200,000+ | 46 | 1.7% |
Household Income by Householder Age in Savannah
The median household income in Savannah is $40,200, with the highest median household income of $48,143 found in the 25 to 44 years age bracket for the primary householder. A total of 1,072 households (39.8%) fall into this category. Meanwhile, the 15 to 24 years age bracket for the primary householder has the lowest median household income of $0, with 211 households (7.8%) in this group.
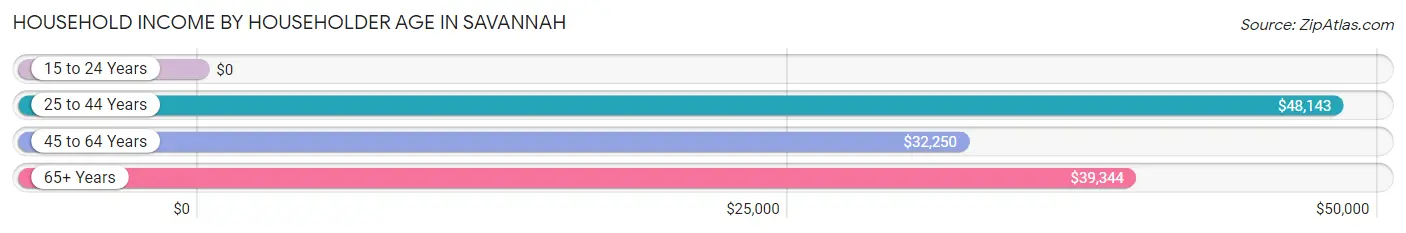
| Income Bracket | # Households | Median Income |
| 15 to 24 Years | 211 (7.8%) | $0 |
| 25 to 44 Years | 1,072 (39.8%) | $48,143 |
| 45 to 64 Years | 657 (24.4%) | $32,250 |
| 65+ Years | 757 (28.1%) | $39,344 |
| Total | 2,697 (100.0%) | $40,200 |
Poverty in Savannah
Income Below Poverty by Sex and Age in Savannah
With 18.1% poverty level for males and 31.2% for females among the residents of Savannah, under 5 year old males and 5 year old females are the most vulnerable to poverty, with 204 males (61.6%) and 129 females (100.0%) in their respective age groups living below the poverty level.
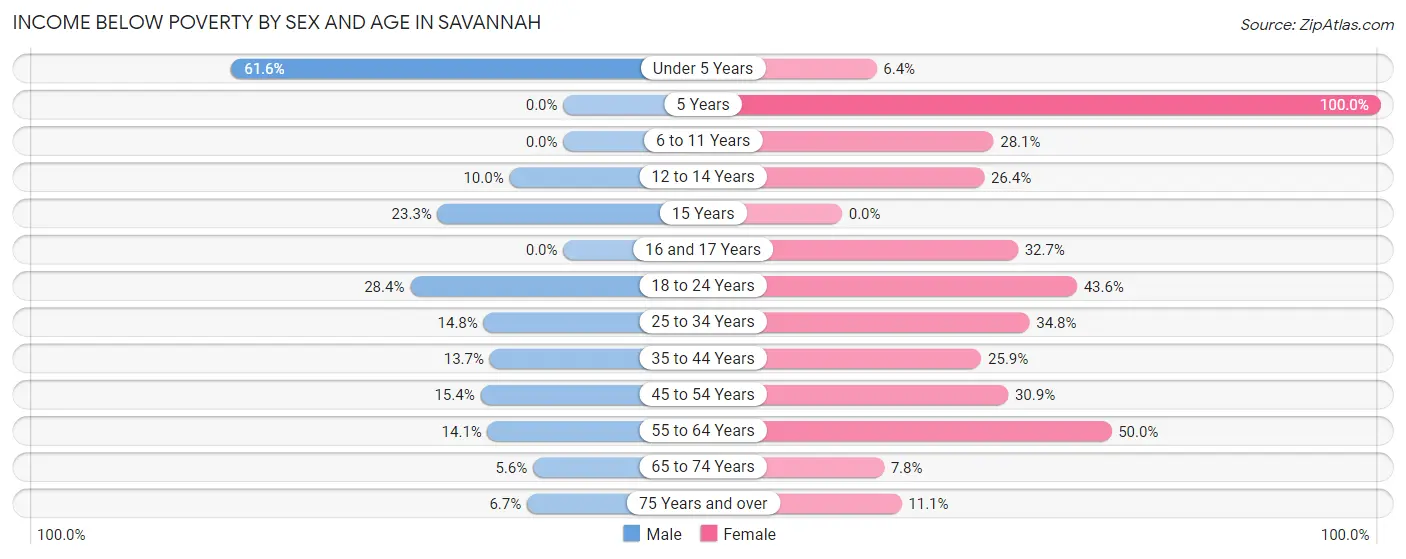
| Age Bracket | Male | Female |
| Under 5 Years | 204 (61.6%) | 12 (6.4%) |
| 5 Years | 0 (0.0%) | 129 (100.0%) |
| 6 to 11 Years | 0 (0.0%) | 108 (28.1%) |
| 12 to 14 Years | 17 (10.0%) | 38 (26.4%) |
| 15 Years | 28 (23.3%) | 0 (0.0%) |
| 16 and 17 Years | 0 (0.0%) | 16 (32.7%) |
| 18 to 24 Years | 83 (28.4%) | 211 (43.6%) |
| 25 to 34 Years | 70 (14.8%) | 156 (34.8%) |
| 35 to 44 Years | 53 (13.7%) | 113 (25.9%) |
| 45 to 54 Years | 34 (15.4%) | 87 (30.8%) |
| 55 to 64 Years | 43 (14.1%) | 218 (50.0%) |
| 65 to 74 Years | 20 (5.6%) | 26 (7.8%) |
| 75 Years and over | 13 (6.7%) | 39 (11.1%) |
| Total | 565 (18.1%) | 1,153 (31.2%) |
Income Above Poverty by Sex and Age in Savannah
According to the poverty statistics in Savannah, males aged 5 years and females aged 15 years are the age groups that are most secure financially, with 100.0% of males and 100.0% of females in these age groups living above the poverty line.
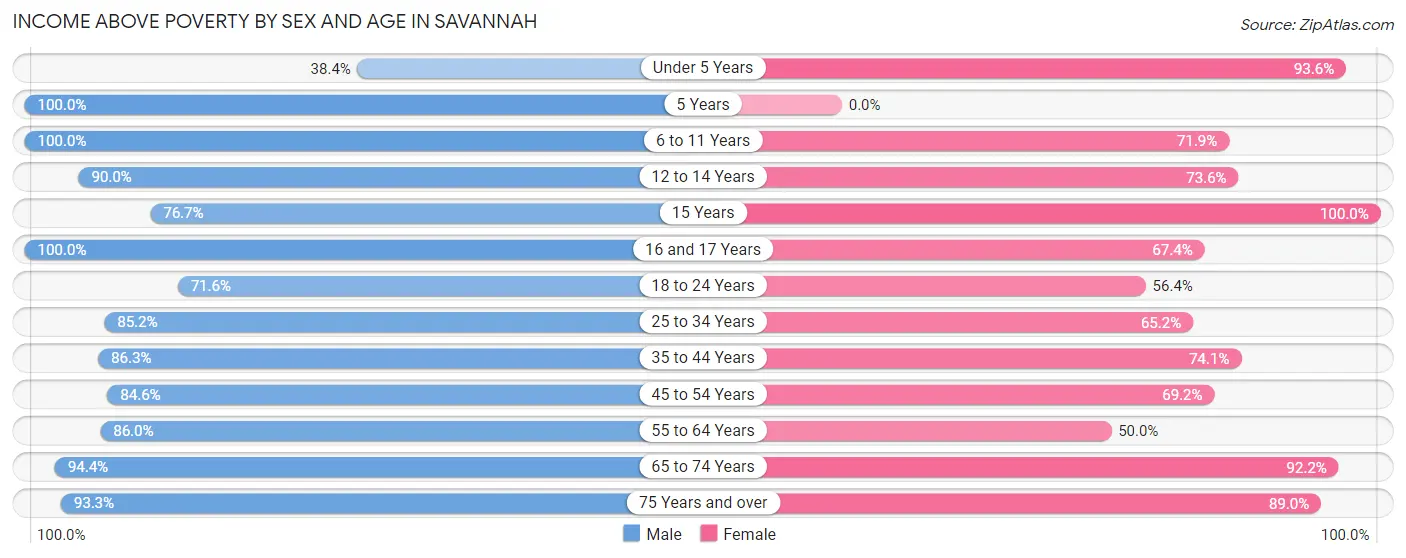
| Age Bracket | Male | Female |
| Under 5 Years | 127 (38.4%) | 175 (93.6%) |
| 5 Years | 27 (100.0%) | 0 (0.0%) |
| 6 to 11 Years | 195 (100.0%) | 276 (71.9%) |
| 12 to 14 Years | 153 (90.0%) | 106 (73.6%) |
| 15 Years | 92 (76.7%) | 28 (100.0%) |
| 16 and 17 Years | 52 (100.0%) | 33 (67.3%) |
| 18 to 24 Years | 209 (71.6%) | 273 (56.4%) |
| 25 to 34 Years | 403 (85.2%) | 292 (65.2%) |
| 35 to 44 Years | 335 (86.3%) | 324 (74.1%) |
| 45 to 54 Years | 187 (84.6%) | 195 (69.2%) |
| 55 to 64 Years | 263 (86.0%) | 218 (50.0%) |
| 65 to 74 Years | 335 (94.4%) | 308 (92.2%) |
| 75 Years and over | 180 (93.3%) | 314 (88.9%) |
| Total | 2,558 (81.9%) | 2,542 (68.8%) |
Income Below Poverty Among Married-Couple Families in Savannah
The poverty statistics for married-couple families in Savannah show that 3.6% or 37 of the total 1,019 families live below the poverty line. Families with 1 or 2 children have the highest poverty rate of 9.7%, comprising of 24 families. On the other hand, families with 3 or 4 children have the lowest poverty rate of 0.0%, which includes 0 families.
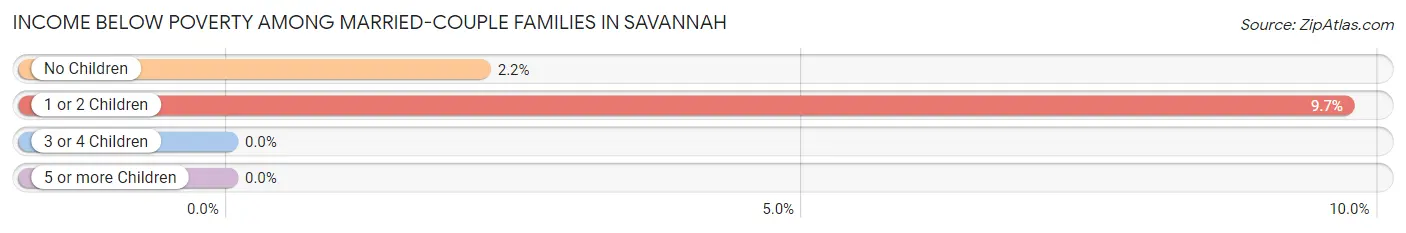
| Children | Above Poverty | Below Poverty |
| No Children | 577 (97.8%) | 13 (2.2%) |
| 1 or 2 Children | 223 (90.3%) | 24 (9.7%) |
| 3 or 4 Children | 182 (100.0%) | 0 (0.0%) |
| 5 or more Children | 0 (0.0%) | 0 (0.0%) |
| Total | 982 (96.4%) | 37 (3.6%) |
Income Below Poverty Among Single-Parent Households in Savannah
According to the poverty data in Savannah, 33.0% or 36 single-father households and 54.8% or 334 single-mother households are living below the poverty line. Among single-father households, those with 1 or 2 children have the highest poverty rate, with 19 households (35.8%) experiencing poverty. Likewise, among single-mother households, those with 1 or 2 children have the highest poverty rate, with 279 households (71.5%) falling below the poverty line.
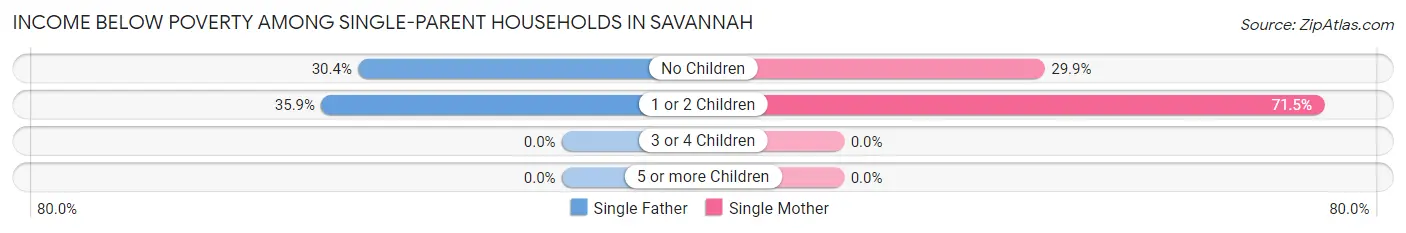
| Children | Single Father | Single Mother |
| No Children | 17 (30.4%) | 55 (29.9%) |
| 1 or 2 Children | 19 (35.8%) | 279 (71.5%) |
| 3 or 4 Children | 0 (0.0%) | 0 (0.0%) |
| 5 or more Children | 0 (0.0%) | 0 (0.0%) |
| Total | 36 (33.0%) | 334 (54.8%) |
Income Below Poverty Among Married-Couple vs Single-Parent Households in Savannah
The poverty data for Savannah shows that 37 of the married-couple family households (3.6%) and 370 of the single-parent households (51.5%) are living below the poverty level. Within the married-couple family households, those with 1 or 2 children have the highest poverty rate, with 24 households (9.7%) falling below the poverty line. Among the single-parent households, those with 1 or 2 children have the highest poverty rate, with 298 household (67.3%) living below poverty.
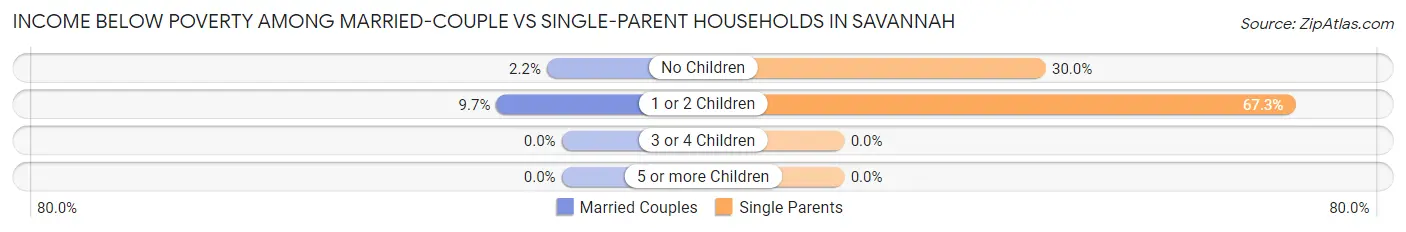
| Children | Married-Couple Families | Single-Parent Households |
| No Children | 13 (2.2%) | 72 (30.0%) |
| 1 or 2 Children | 24 (9.7%) | 298 (67.3%) |
| 3 or 4 Children | 0 (0.0%) | 0 (0.0%) |
| 5 or more Children | 0 (0.0%) | 0 (0.0%) |
| Total | 37 (3.6%) | 370 (51.5%) |
Race in Savannah
The most populous races in Savannah are White / Caucasian (6,303 | 87.5%), Hispanic or Latino (546 | 7.6%), and Two or more Races (469 | 6.5%).
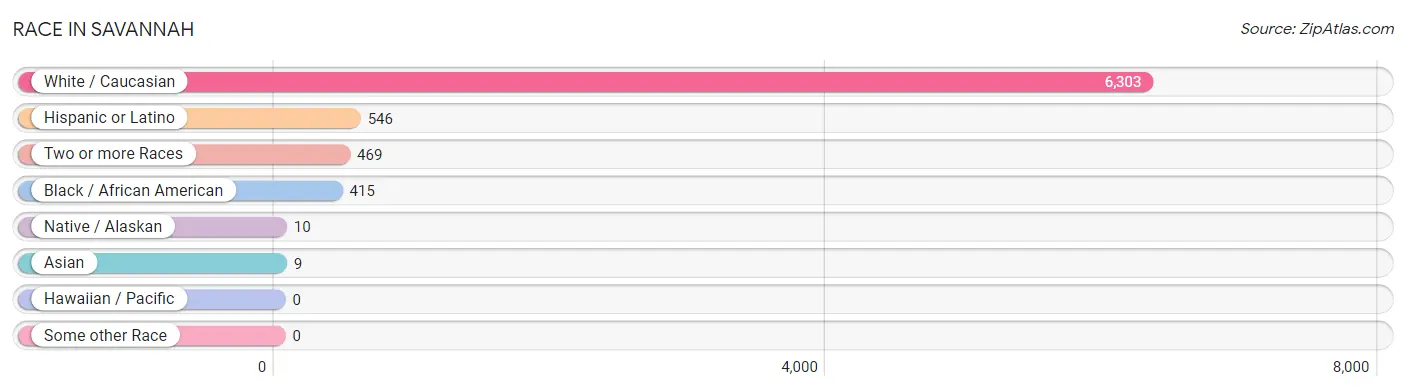
| Race | # Population | % Population |
| Asian | 9 | 0.1% |
| Black / African American | 415 | 5.8% |
| Hawaiian / Pacific | 0 | 0.0% |
| Hispanic or Latino | 546 | 7.6% |
| Native / Alaskan | 10 | 0.1% |
| White / Caucasian | 6,303 | 87.5% |
| Two or more Races | 469 | 6.5% |
| Some other Race | 0 | 0.0% |
| Total | 7,206 | 100.0% |
Ancestry in Savannah
The most populous ancestries reported in Savannah are Irish (1,086 | 15.1%), American (805 | 11.2%), English (667 | 9.3%), German (567 | 7.9%), and European (414 | 5.8%), together accounting for 49.1% of all Savannah residents.
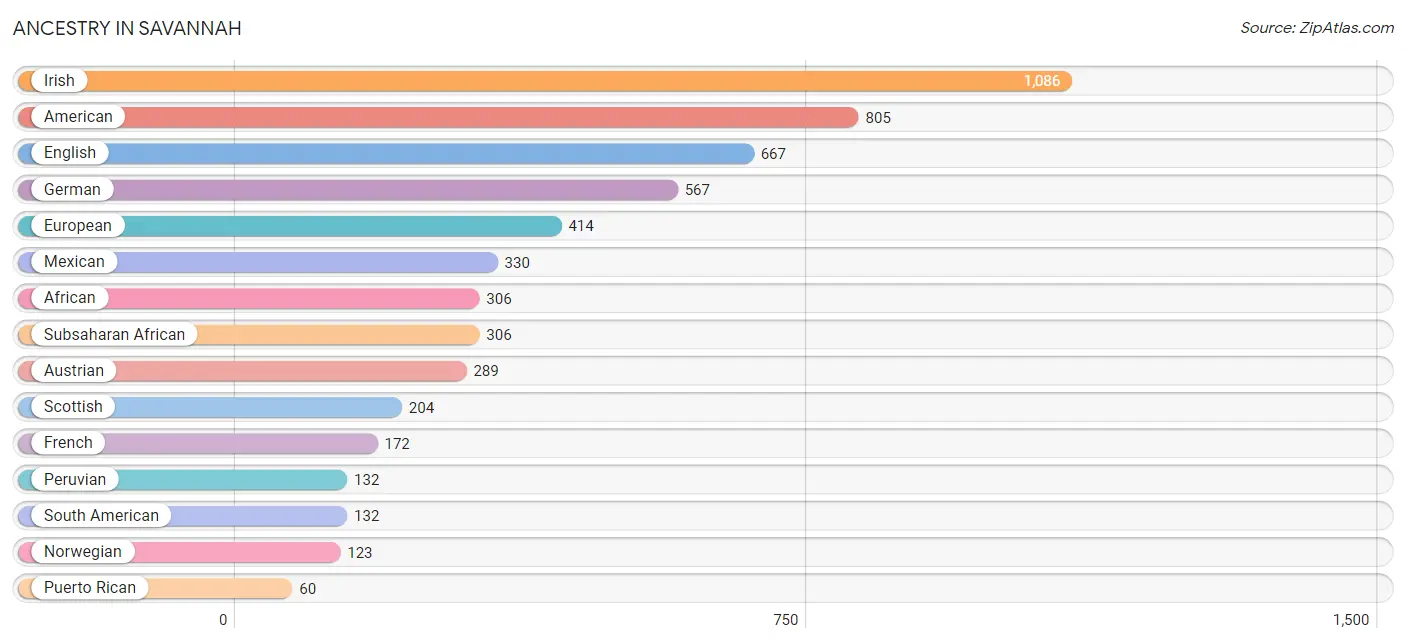
| Ancestry | # Population | % Population |
| African | 306 | 4.3% |
| American | 805 | 11.2% |
| Apache | 2 | 0.0% |
| Austrian | 289 | 4.0% |
| British | 25 | 0.4% |
| Cherokee | 39 | 0.5% |
| Creek | 8 | 0.1% |
| English | 667 | 9.3% |
| European | 414 | 5.8% |
| French | 172 | 2.4% |
| German | 567 | 7.9% |
| Greek | 58 | 0.8% |
| Irish | 1,086 | 15.1% |
| Italian | 54 | 0.7% |
| Jamaican | 10 | 0.1% |
| Korean | 9 | 0.1% |
| Lithuanian | 17 | 0.2% |
| Mexican | 330 | 4.6% |
| Norwegian | 123 | 1.7% |
| Peruvian | 132 | 1.8% |
| Puerto Rican | 60 | 0.8% |
| Scotch-Irish | 41 | 0.6% |
| Scottish | 204 | 2.8% |
| South American | 132 | 1.8% |
| Spaniard | 24 | 0.3% |
| Subsaharan African | 306 | 4.3% | View All 26 Rows |
Immigrants in Savannah
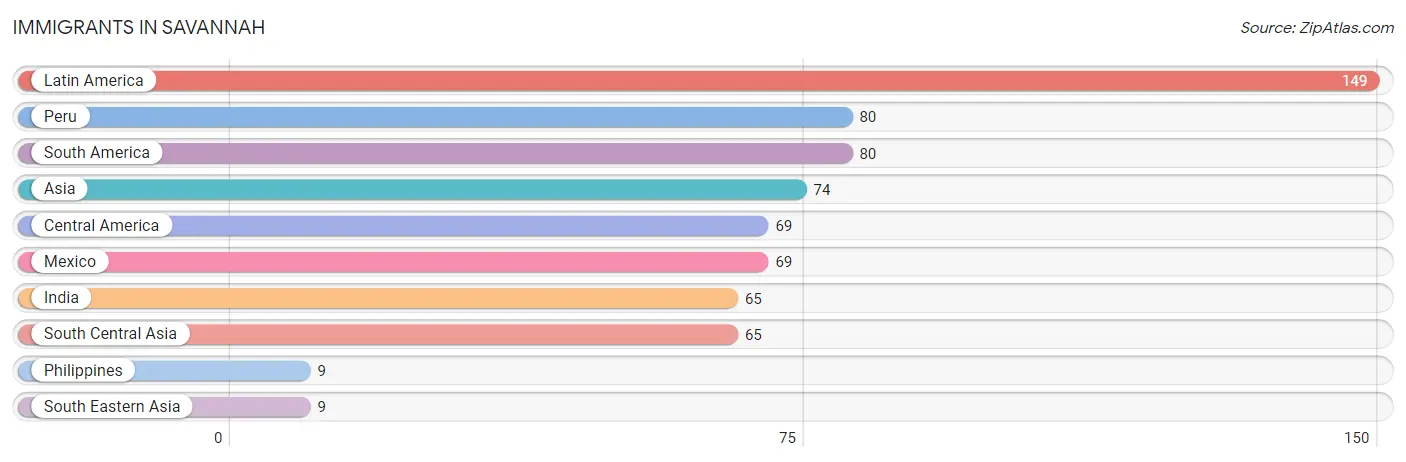
The most numerous immigrant groups reported in Savannah came from Latin America (149 | 2.1%), Peru (80 | 1.1%), South America (80 | 1.1%), Asia (74 | 1.0%), and Central America (69 | 1.0%), together accounting for 6.3% of all Savannah residents.
| Immigration Origin | # Population | % Population |
| Asia | 74 | 1.0% |
| Central America | 69 | 1.0% |
| India | 65 | 0.9% |
| Latin America | 149 | 2.1% |
| Mexico | 69 | 1.0% |
| Peru | 80 | 1.1% |
| Philippines | 9 | 0.1% |
| South America | 80 | 1.1% |
| South Central Asia | 65 | 0.9% |
| South Eastern Asia | 9 | 0.1% | View All 10 Rows |
Sex and Age in Savannah
Sex and Age in Savannah
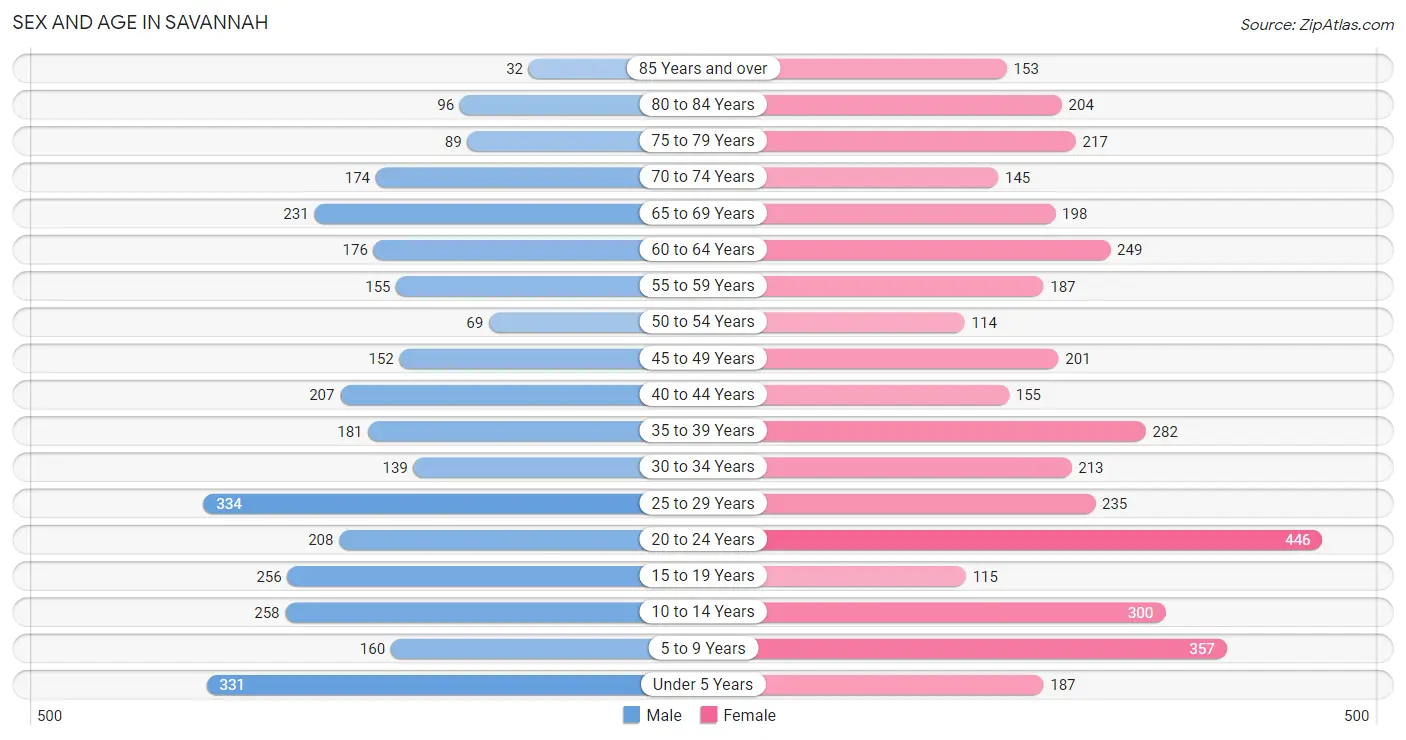
The most populous age groups in Savannah are 25 to 29 Years (334 | 10.3%) for men and 20 to 24 Years (446 | 11.3%) for women.
| Age Bracket | Male | Female |
| Under 5 Years | 331 (10.2%) | 187 (4.7%) |
| 5 to 9 Years | 160 (4.9%) | 357 (9.0%) |
| 10 to 14 Years | 258 (7.9%) | 300 (7.6%) |
| 15 to 19 Years | 256 (7.9%) | 115 (2.9%) |
| 20 to 24 Years | 208 (6.4%) | 446 (11.3%) |
| 25 to 29 Years | 334 (10.3%) | 235 (5.9%) |
| 30 to 34 Years | 139 (4.3%) | 213 (5.4%) |
| 35 to 39 Years | 181 (5.6%) | 282 (7.1%) |
| 40 to 44 Years | 207 (6.4%) | 155 (3.9%) |
| 45 to 49 Years | 152 (4.7%) | 201 (5.1%) |
| 50 to 54 Years | 69 (2.1%) | 114 (2.9%) |
| 55 to 59 Years | 155 (4.8%) | 187 (4.7%) |
| 60 to 64 Years | 176 (5.4%) | 249 (6.3%) |
| 65 to 69 Years | 231 (7.1%) | 198 (5.0%) |
| 70 to 74 Years | 174 (5.4%) | 145 (3.7%) |
| 75 to 79 Years | 89 (2.7%) | 217 (5.5%) |
| 80 to 84 Years | 96 (3.0%) | 204 (5.1%) |
| 85 Years and over | 32 (1.0%) | 153 (3.9%) |
| Total | 3,248 (100.0%) | 3,958 (100.0%) |
Families and Households in Savannah
Median Family Size in Savannah
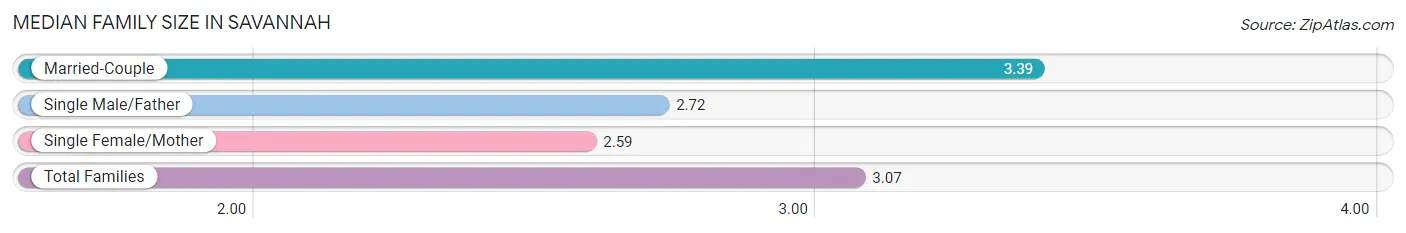
The median family size in Savannah is 3.07 persons per family, with married-couple families (1,019 | 58.7%) accounting for the largest median family size of 3.39 persons per family. On the other hand, single female/mother families (609 | 35.1%) represent the smallest median family size with 2.59 persons per family.
| Family Type | # Families | Family Size |
| Married-Couple | 1,019 (58.7%) | 3.39 |
| Single Male/Father | 109 (6.3%) | 2.72 |
| Single Female/Mother | 609 (35.1%) | 2.59 |
| Total Families | 1,737 (100.0%) | 3.07 |
Median Household Size in Savannah
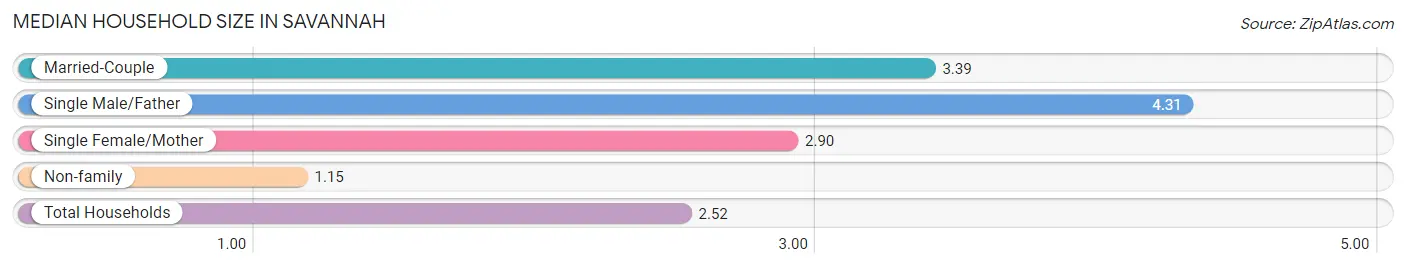
The median household size in Savannah is 2.52 persons per household, with single male/father households (109 | 4.0%) accounting for the largest median household size of 4.31 persons per household. non-family households (960 | 35.6%) represent the smallest median household size with 1.15 persons per household.
| Household Type | # Households | Household Size |
| Married-Couple | 1,019 (37.8%) | 3.39 |
| Single Male/Father | 109 (4.0%) | 4.31 |
| Single Female/Mother | 609 (22.6%) | 2.90 |
| Non-family | 960 (35.6%) | 1.15 |
| Total Households | 2,697 (100.0%) | 2.52 |
Household Size by Marriage Status in Savannah
Out of a total of 2,697 households in Savannah, 1,737 (64.4%) are family households, while 960 (35.6%) are nonfamily households. The most numerous type of family households are 2-person households, comprising 686, and the most common type of nonfamily households are 1-person households, comprising 859.
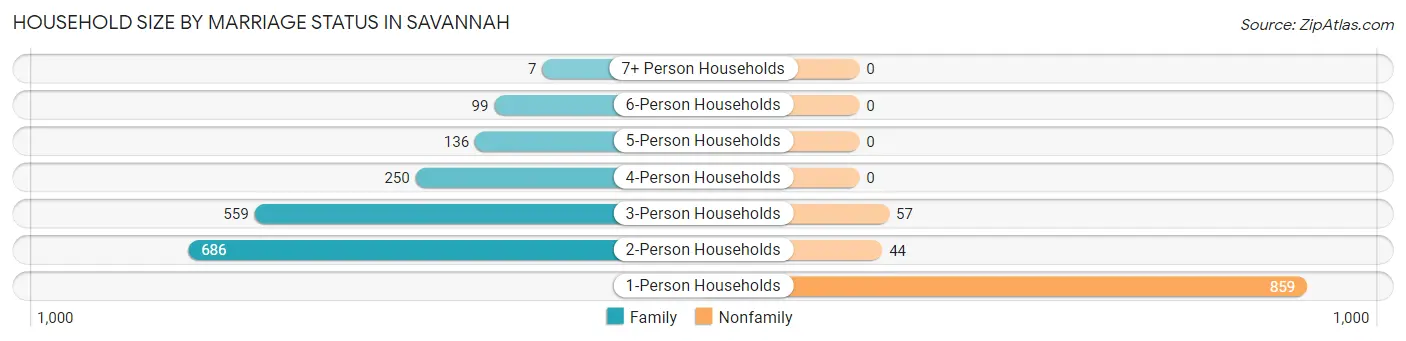
| Household Size | Family Households | Nonfamily Households |
| 1-Person Households | - | 859 (31.9%) |
| 2-Person Households | 686 (25.4%) | 44 (1.6%) |
| 3-Person Households | 559 (20.7%) | 57 (2.1%) |
| 4-Person Households | 250 (9.3%) | 0 (0.0%) |
| 5-Person Households | 136 (5.0%) | 0 (0.0%) |
| 6-Person Households | 99 (3.7%) | 0 (0.0%) |
| 7+ Person Households | 7 (0.3%) | 0 (0.0%) |
| Total | 1,737 (64.4%) | 960 (35.6%) |
Female Fertility in Savannah
Fertility by Age in Savannah
Average fertility rate in Savannah is 121.0 births per 1,000 women. Women in the age bracket of 20 to 34 years have the highest fertility rate with 225.0 births per 1,000 women. Women in the age bracket of 20 to 34 years acount for 100.0% of all women with births.
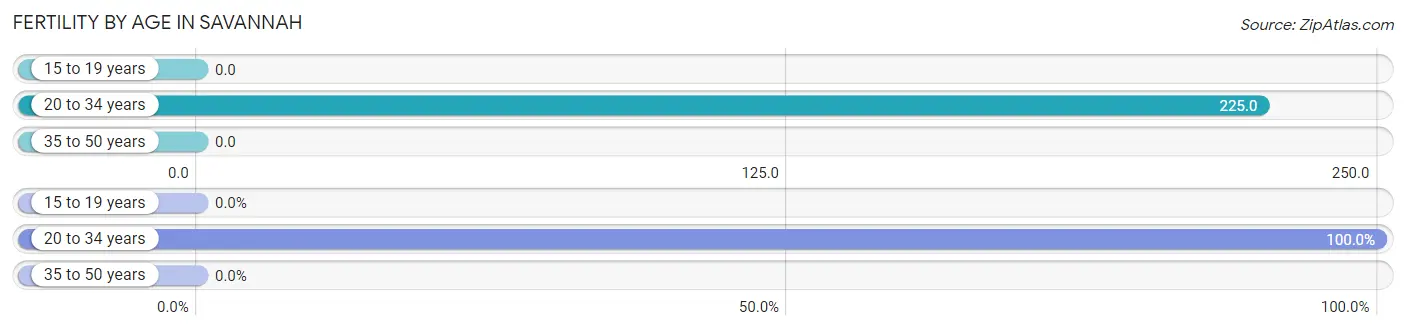
| Age Bracket | Women with Births | Births / 1,000 Women |
| 15 to 19 years | 0 (0.0%) | 0.0 |
| 20 to 34 years | 201 (100.0%) | 225.0 |
| 35 to 50 years | 0 (0.0%) | 0.0 |
| Total | 201 (100.0%) | 121.0 |
Fertility by Age by Marriage Status in Savannah
19.4% of women with births (201) in Savannah are married. The highest percentage of unmarried women with births falls into 20 to 34 years age bracket with 80.6% of them unmarried at the time of birth, while the lowest percentage of unmarried women with births belong to 20 to 34 years age bracket with 80.6% of them unmarried.
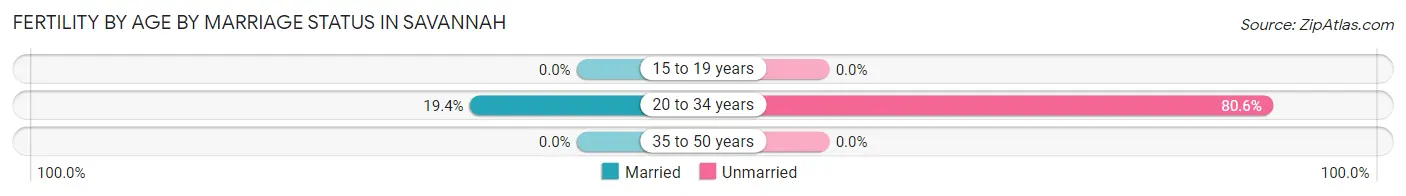
| Age Bracket | Married | Unmarried |
| 15 to 19 years | 0 (0.0%) | 0 (0.0%) |
| 20 to 34 years | 39 (19.4%) | 162 (80.6%) |
| 35 to 50 years | 0 (0.0%) | 0 (0.0%) |
| Total | 39 (19.4%) | 162 (80.6%) |
Fertility by Education in Savannah
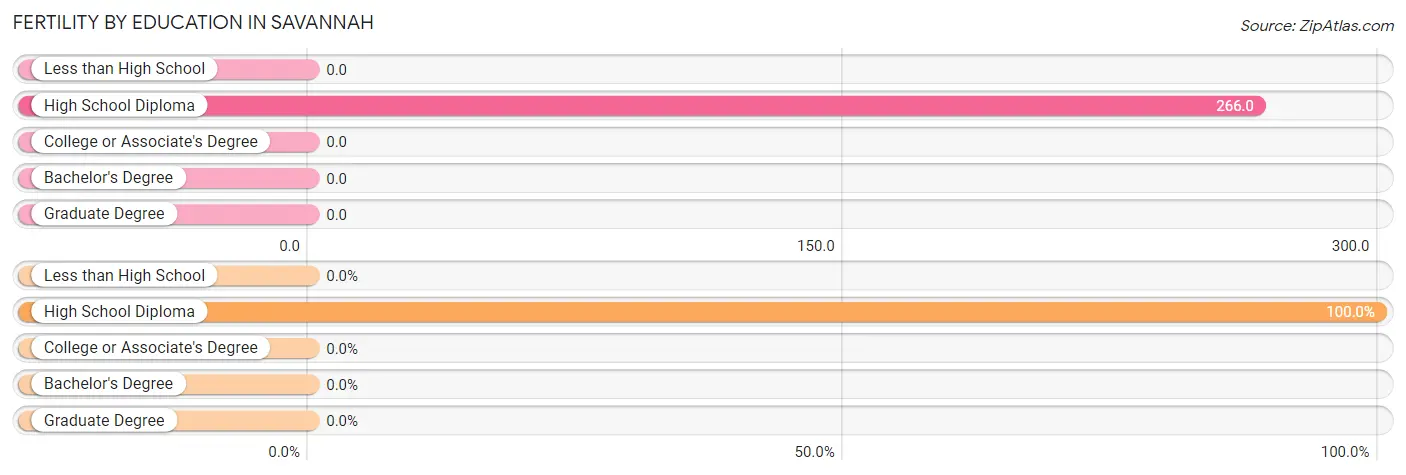
| Educational Attainment | Women with Births | Births / 1,000 Women |
| Less than High School | 0 (0.0%) | 0.0 |
| High School Diploma | 201 (100.0%) | 266.0 |
| College or Associate's Degree | 0 (0.0%) | 0.0 |
| Bachelor's Degree | 0 (0.0%) | 0.0 |
| Graduate Degree | 0 (0.0%) | 0.0 |
| Total | 201 (100.0%) | 121.0 |
Fertility by Education by Marriage Status in Savannah
80.6% of women with births in Savannah are unmarried. Women with the educational attainment of high school diploma are most likely to be married with 19.4% of them married at childbirth, while women with the educational attainment of high school diploma are least likely to be married with 80.6% of them unmarried at childbirth.
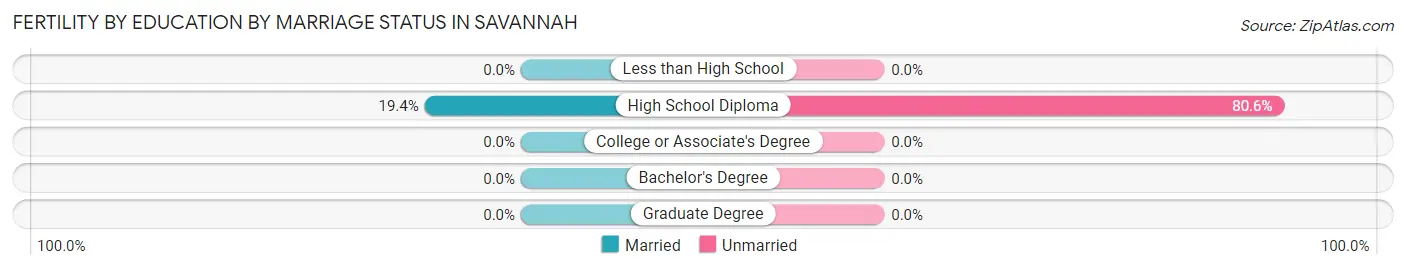
| Educational Attainment | Married | Unmarried |
| Less than High School | 0 (0.0%) | 0 (0.0%) |
| High School Diploma | 39 (19.4%) | 162 (80.6%) |
| College or Associate's Degree | 0 (0.0%) | 0 (0.0%) |
| Bachelor's Degree | 0 (0.0%) | 0 (0.0%) |
| Graduate Degree | 0 (0.0%) | 0 (0.0%) |
| Total | 39 (19.4%) | 162 (80.6%) |
Employment Characteristics in Savannah
Employment by Class of Employer in Savannah
Among the 2,470 employed individuals in Savannah, private company employees (1,702 | 68.9%), not-for-profit organizations (238 | 9.6%), and self-employed (incorporated) (190 | 7.7%) make up the most common classes of employment.
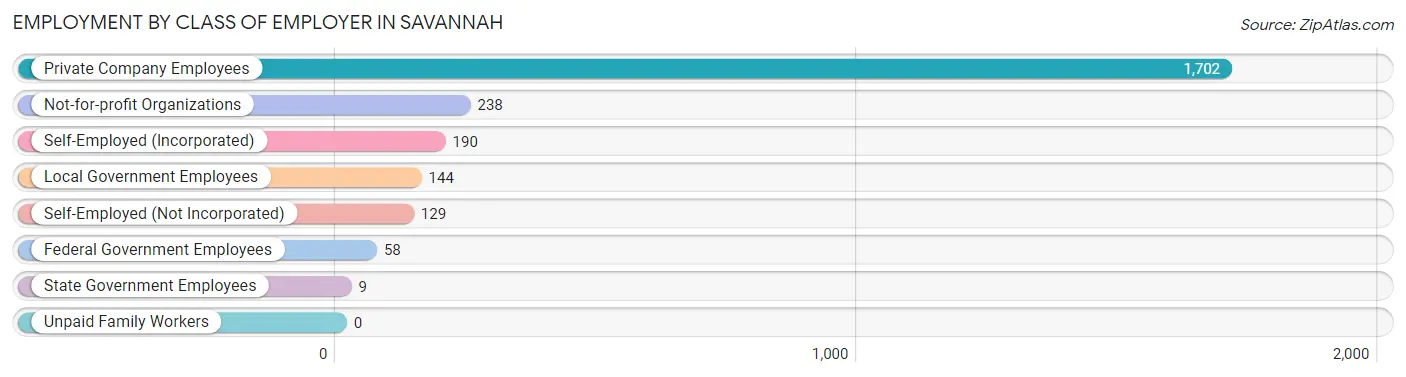
| Employer Class | # Employees | % Employees |
| Private Company Employees | 1,702 | 68.9% |
| Self-Employed (Incorporated) | 190 | 7.7% |
| Self-Employed (Not Incorporated) | 129 | 5.2% |
| Not-for-profit Organizations | 238 | 9.6% |
| Local Government Employees | 144 | 5.8% |
| State Government Employees | 9 | 0.4% |
| Federal Government Employees | 58 | 2.4% |
| Unpaid Family Workers | 0 | 0.0% |
| Total | 2,470 | 100.0% |
Employment Status by Age in Savannah
According to the labor force statistics for Savannah, out of the total population over 16 years of age (5,465), 47.2% or 2,579 individuals are in the labor force, with 1.6% or 41 of them unemployed. The age group with the highest labor force participation rate is 25 to 29 years, with 77.9% or 443 individuals in the labor force. Within the labor force, the 30 to 34 years age range has the highest percentage of unemployed individuals, with 5.1% or 11 of them being unemployed.
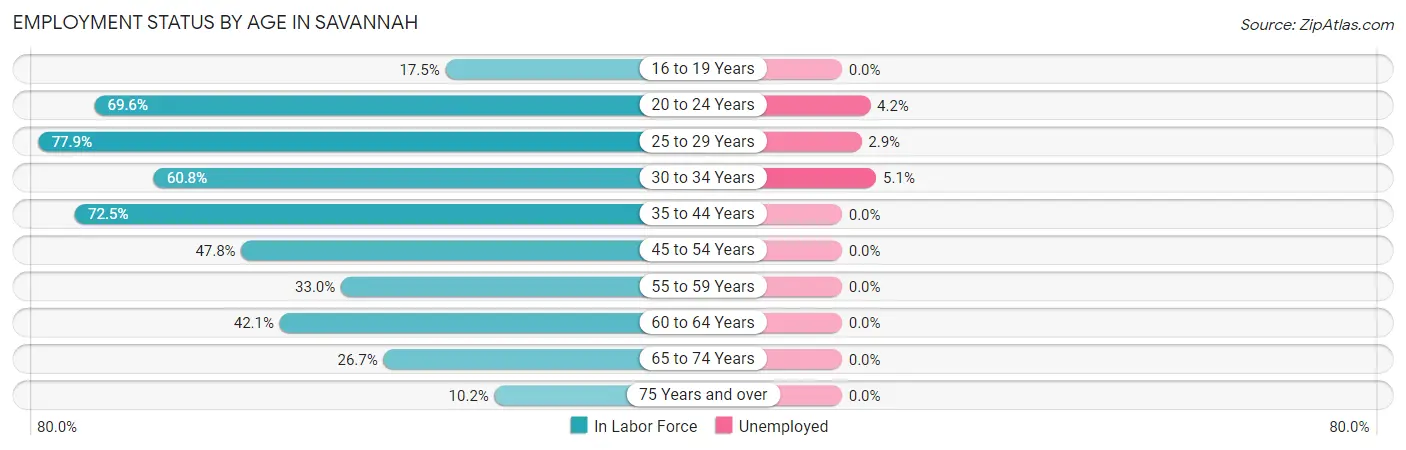
| Age Bracket | In Labor Force | Unemployed |
| 16 to 19 Years | 39 (17.5%) | 0 (0.0%) |
| 20 to 24 Years | 455 (69.6%) | 19 (4.2%) |
| 25 to 29 Years | 443 (77.9%) | 13 (2.9%) |
| 30 to 34 Years | 214 (60.8%) | 11 (5.1%) |
| 35 to 44 Years | 598 (72.5%) | 0 (0.0%) |
| 45 to 54 Years | 256 (47.8%) | 0 (0.0%) |
| 55 to 59 Years | 113 (33.0%) | 0 (0.0%) |
| 60 to 64 Years | 179 (42.1%) | 0 (0.0%) |
| 65 to 74 Years | 200 (26.7%) | 0 (0.0%) |
| 75 Years and over | 81 (10.2%) | 0 (0.0%) |
| Total | 2,579 (47.2%) | 41 (1.6%) |
Employment Status by Educational Attainment in Savannah
According to labor force statistics for Savannah, 59.1% of individuals (1,802) out of the total population between 25 and 64 years of age (3,049) are in the labor force, with 1.3% or 23 of them being unemployed. The group with the highest labor force participation rate are those with the educational attainment of bachelor's degree or higher, with 85.8% or 338 individuals in the labor force. Within the labor force, individuals with college / associate degree education have the highest percentage of unemployment, with 3.2% or 24 of them being unemployed.
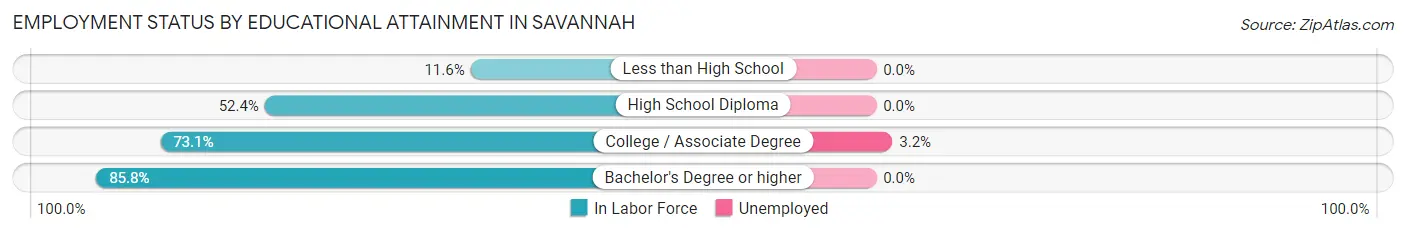
| Educational Attainment | In Labor Force | Unemployed |
| Less than High School | 40 (11.6%) | 0 (0.0%) |
| High School Diploma | 664 (52.4%) | 0 (0.0%) |
| College / Associate Degree | 761 (73.1%) | 33 (3.2%) |
| Bachelor's Degree or higher | 338 (85.8%) | 0 (0.0%) |
| Total | 1,802 (59.1%) | 40 (1.3%) |
Employment Occupations by Sex in Savannah
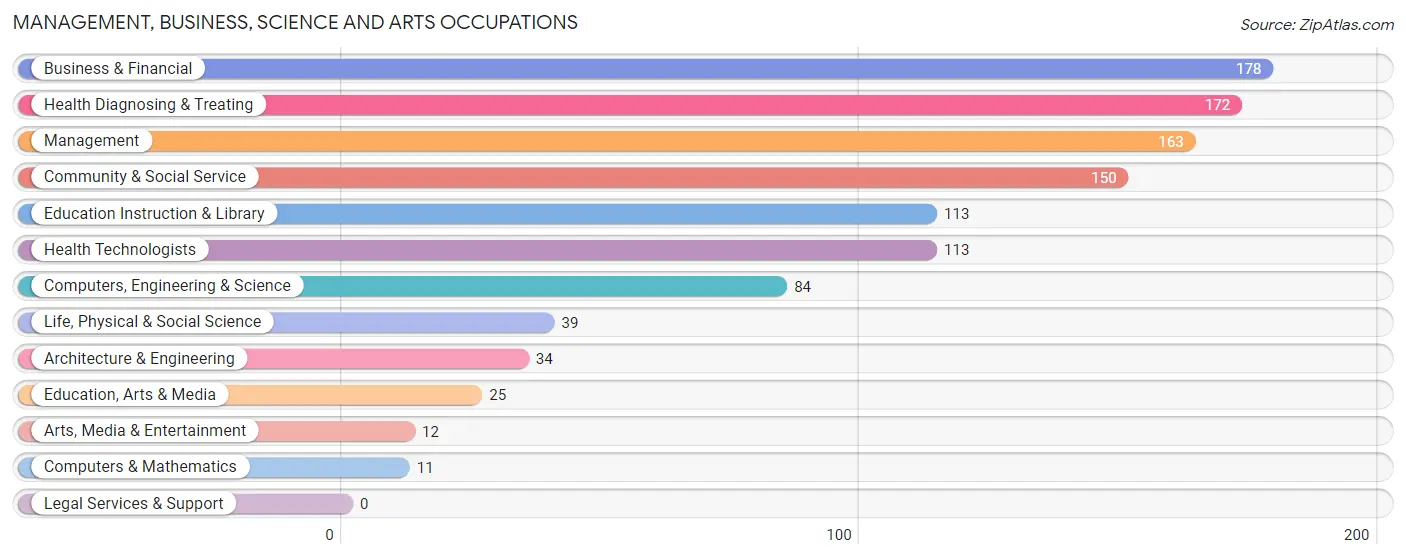
Management, Business, Science and Arts Occupations
The most common Management, Business, Science and Arts occupations in Savannah are Business & Financial (178 | 7.1%), Health Diagnosing & Treating (172 | 6.9%), Management (163 | 6.5%), Community & Social Service (150 | 6.0%), and Education Instruction & Library (113 | 4.5%).
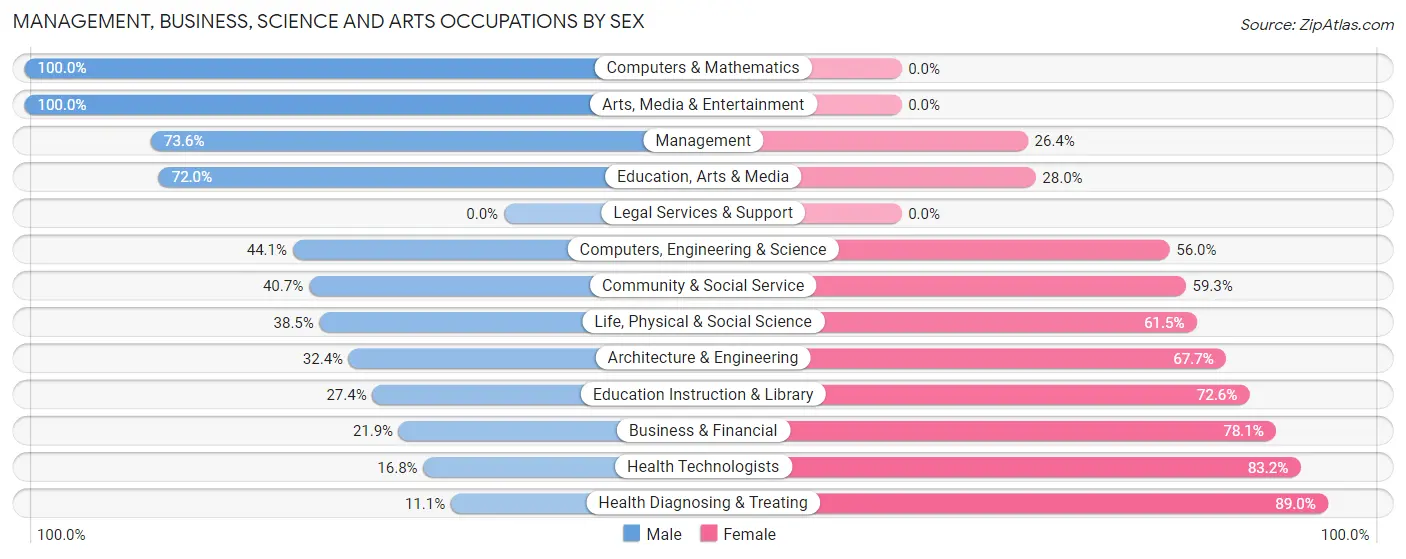
Management, Business, Science and Arts Occupations by Sex
Within the Management, Business, Science and Arts occupations in Savannah, the most male-oriented occupations are Computers & Mathematics (100.0%), Arts, Media & Entertainment (100.0%), and Management (73.6%), while the most female-oriented occupations are Health Diagnosing & Treating (88.9%), Health Technologists (83.2%), and Business & Financial (78.1%).
| Occupation | Male | Female |
| Management | 120 (73.6%) | 43 (26.4%) |
| Business & Financial | 39 (21.9%) | 139 (78.1%) |
| Computers, Engineering & Science | 37 (44.1%) | 47 (55.9%) |
| Computers & Mathematics | 11 (100.0%) | 0 (0.0%) |
| Architecture & Engineering | 11 (32.4%) | 23 (67.6%) |
| Life, Physical & Social Science | 15 (38.5%) | 24 (61.5%) |
| Community & Social Service | 61 (40.7%) | 89 (59.3%) |
| Education, Arts & Media | 18 (72.0%) | 7 (28.0%) |
| Legal Services & Support | 0 (0.0%) | 0 (0.0%) |
| Education Instruction & Library | 31 (27.4%) | 82 (72.6%) |
| Arts, Media & Entertainment | 12 (100.0%) | 0 (0.0%) |
| Health Diagnosing & Treating | 19 (11.1%) | 153 (88.9%) |
| Health Technologists | 19 (16.8%) | 94 (83.2%) |
| Total (Category) | 276 (36.9%) | 471 (63.0%) |
| Total (Overall) | 1,225 (48.8%) | 1,284 (51.2%) |
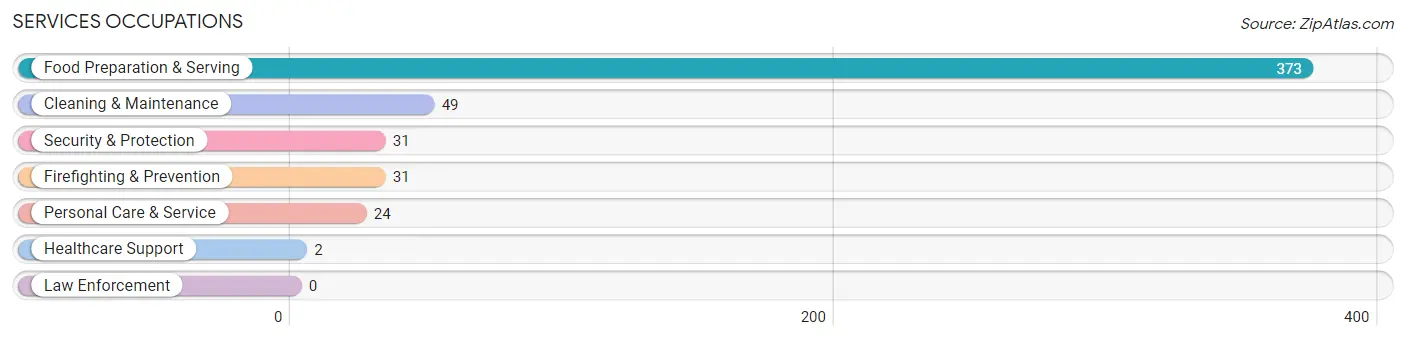
Services Occupations
The most common Services occupations in Savannah are Food Preparation & Serving (373 | 14.9%), Cleaning & Maintenance (49 | 1.9%), Security & Protection (31 | 1.2%), Firefighting & Prevention (31 | 1.2%), and Personal Care & Service (24 | 1.0%).
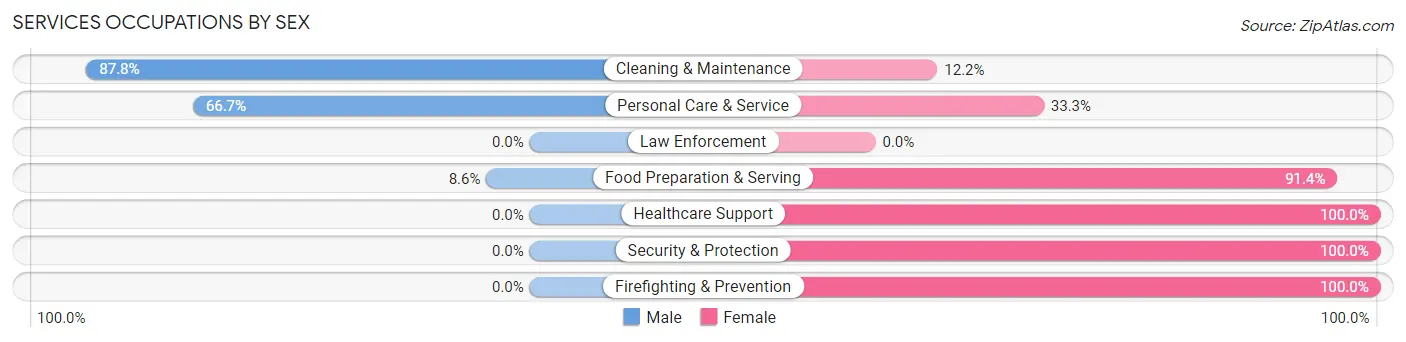
Services Occupations by Sex
Within the Services occupations in Savannah, the most male-oriented occupations are Cleaning & Maintenance (87.8%), Personal Care & Service (66.7%), and Food Preparation & Serving (8.6%), while the most female-oriented occupations are Healthcare Support (100.0%), Security & Protection (100.0%), and Firefighting & Prevention (100.0%).
| Occupation | Male | Female |
| Healthcare Support | 0 (0.0%) | 2 (100.0%) |
| Security & Protection | 0 (0.0%) | 31 (100.0%) |
| Firefighting & Prevention | 0 (0.0%) | 31 (100.0%) |
| Law Enforcement | 0 (0.0%) | 0 (0.0%) |
| Food Preparation & Serving | 32 (8.6%) | 341 (91.4%) |
| Cleaning & Maintenance | 43 (87.8%) | 6 (12.2%) |
| Personal Care & Service | 16 (66.7%) | 8 (33.3%) |
| Total (Category) | 91 (19.0%) | 388 (81.0%) |
| Total (Overall) | 1,225 (48.8%) | 1,284 (51.2%) |
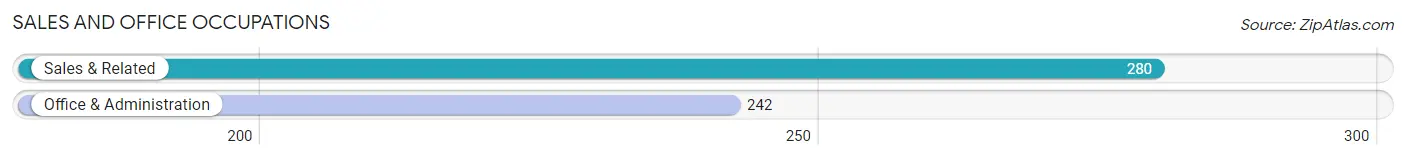
Sales and Office Occupations
The most common Sales and Office occupations in Savannah are Sales & Related (280 | 11.2%), and Office & Administration (242 | 9.7%).
Sales and Office Occupations by Sex
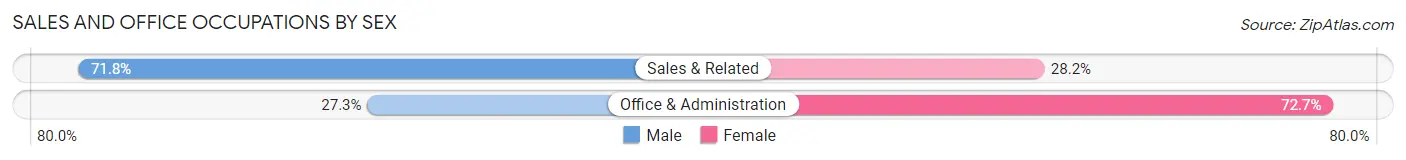
| Occupation | Male | Female |
| Sales & Related | 201 (71.8%) | 79 (28.2%) |
| Office & Administration | 66 (27.3%) | 176 (72.7%) |
| Total (Category) | 267 (51.1%) | 255 (48.8%) |
| Total (Overall) | 1,225 (48.8%) | 1,284 (51.2%) |
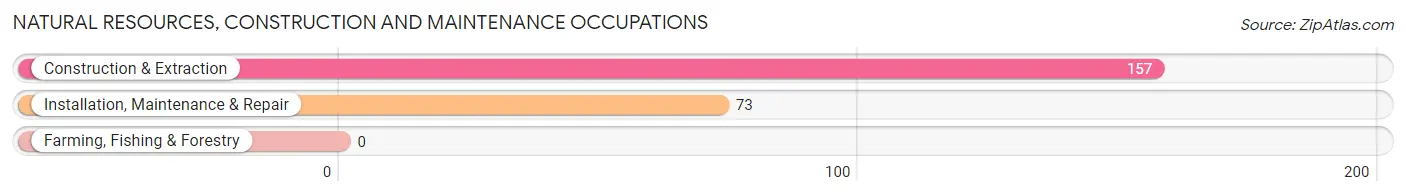
Natural Resources, Construction and Maintenance Occupations
The most common Natural Resources, Construction and Maintenance occupations in Savannah are Construction & Extraction (157 | 6.3%), and Installation, Maintenance & Repair (73 | 2.9%).
Natural Resources, Construction and Maintenance Occupations by Sex
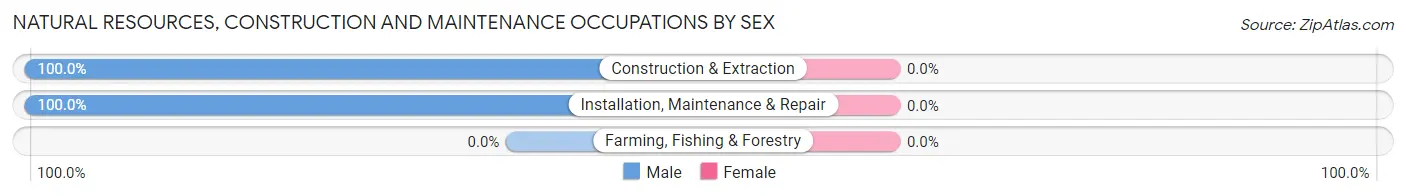
| Occupation | Male | Female |
| Farming, Fishing & Forestry | 0 (0.0%) | 0 (0.0%) |
| Construction & Extraction | 157 (100.0%) | 0 (0.0%) |
| Installation, Maintenance & Repair | 73 (100.0%) | 0 (0.0%) |
| Total (Category) | 230 (100.0%) | 0 (0.0%) |
| Total (Overall) | 1,225 (48.8%) | 1,284 (51.2%) |
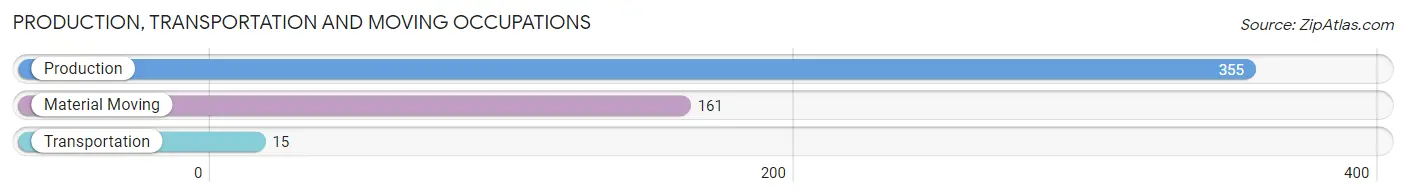
Production, Transportation and Moving Occupations
The most common Production, Transportation and Moving occupations in Savannah are Production (355 | 14.1%), Material Moving (161 | 6.4%), and Transportation (15 | 0.6%).
Production, Transportation and Moving Occupations by Sex
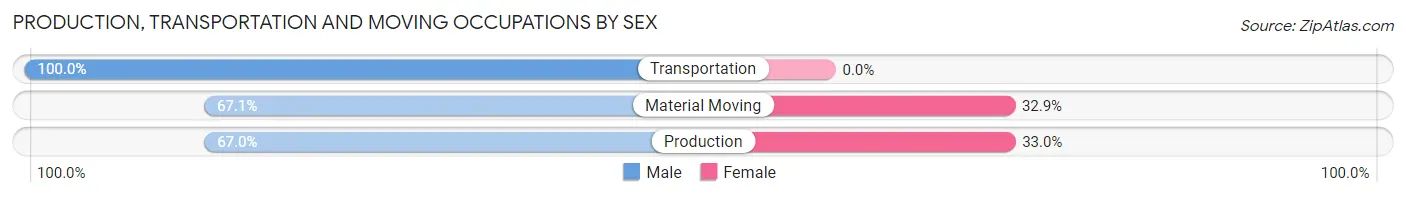
| Occupation | Male | Female |
| Production | 238 (67.0%) | 117 (33.0%) |
| Transportation | 15 (100.0%) | 0 (0.0%) |
| Material Moving | 108 (67.1%) | 53 (32.9%) |
| Total (Category) | 361 (68.0%) | 170 (32.0%) |
| Total (Overall) | 1,225 (48.8%) | 1,284 (51.2%) |
Employment Industries by Sex in Savannah
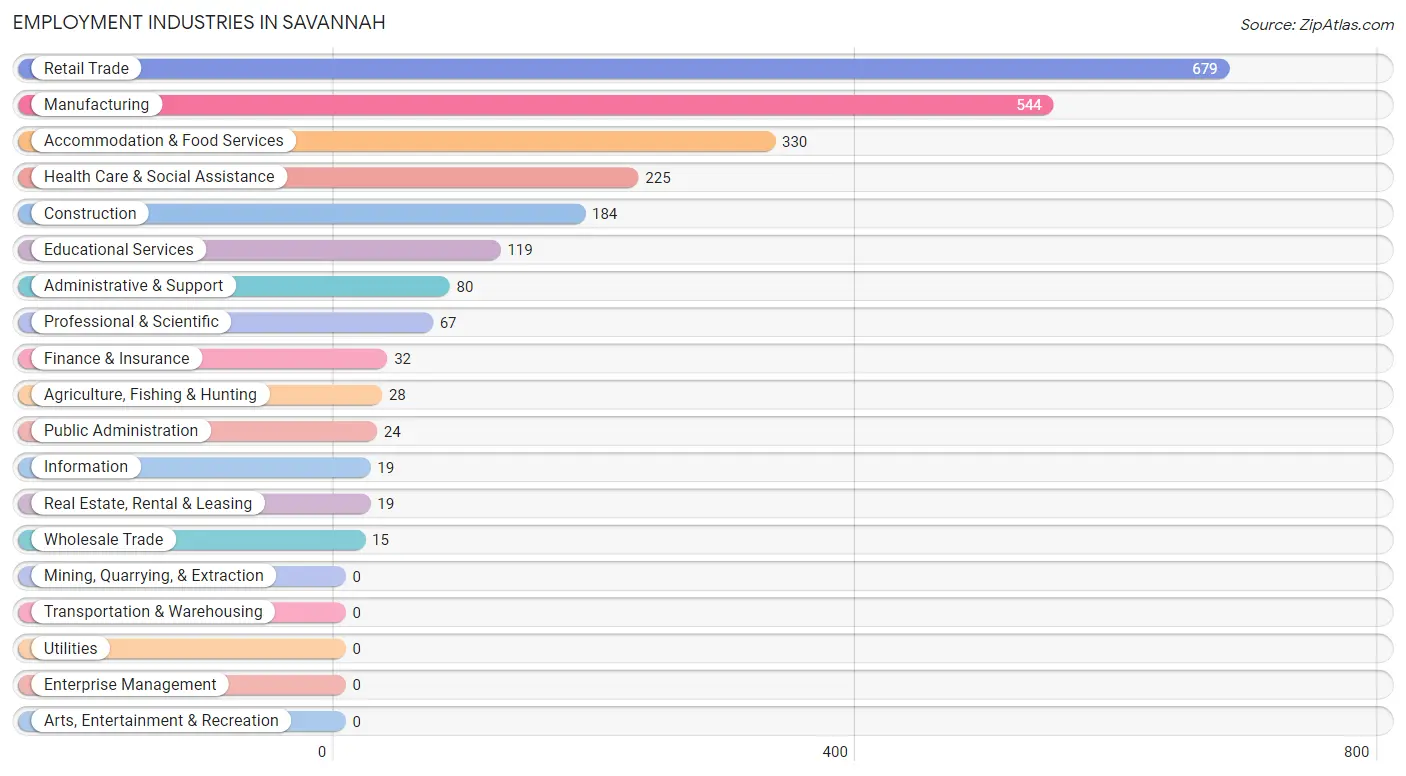
Employment Industries in Savannah
The major employment industries in Savannah include Retail Trade (679 | 27.1%), Manufacturing (544 | 21.7%), Accommodation & Food Services (330 | 13.2%), Health Care & Social Assistance (225 | 9.0%), and Construction (184 | 7.3%).
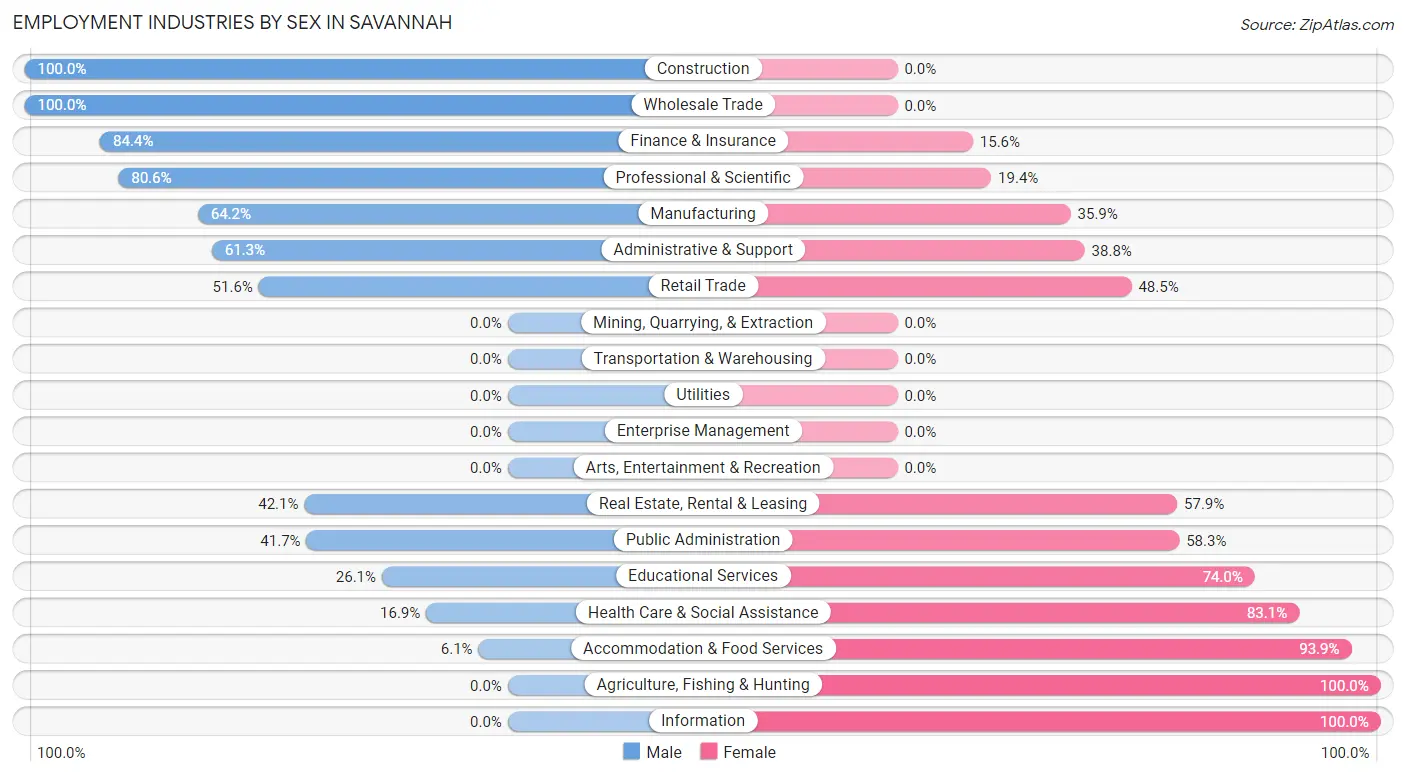
Employment Industries by Sex in Savannah
The Savannah industries that see more men than women are Construction (100.0%), Wholesale Trade (100.0%), and Finance & Insurance (84.4%), whereas the industries that tend to have a higher number of women are Agriculture, Fishing & Hunting (100.0%), Information (100.0%), and Accommodation & Food Services (93.9%).
| Industry | Male | Female |
| Agriculture, Fishing & Hunting | 0 (0.0%) | 28 (100.0%) |
| Mining, Quarrying, & Extraction | 0 (0.0%) | 0 (0.0%) |
| Construction | 184 (100.0%) | 0 (0.0%) |
| Manufacturing | 349 (64.1%) | 195 (35.8%) |
| Wholesale Trade | 15 (100.0%) | 0 (0.0%) |
| Retail Trade | 350 (51.5%) | 329 (48.4%) |
| Transportation & Warehousing | 0 (0.0%) | 0 (0.0%) |
| Utilities | 0 (0.0%) | 0 (0.0%) |
| Information | 0 (0.0%) | 19 (100.0%) |
| Finance & Insurance | 27 (84.4%) | 5 (15.6%) |
| Real Estate, Rental & Leasing | 8 (42.1%) | 11 (57.9%) |
| Professional & Scientific | 54 (80.6%) | 13 (19.4%) |
| Enterprise Management | 0 (0.0%) | 0 (0.0%) |
| Administrative & Support | 49 (61.3%) | 31 (38.8%) |
| Educational Services | 31 (26.1%) | 88 (74.0%) |
| Health Care & Social Assistance | 38 (16.9%) | 187 (83.1%) |
| Arts, Entertainment & Recreation | 0 (0.0%) | 0 (0.0%) |
| Accommodation & Food Services | 20 (6.1%) | 310 (93.9%) |
| Public Administration | 10 (41.7%) | 14 (58.3%) |
| Total | 1,225 (48.8%) | 1,284 (51.2%) |
Education in Savannah
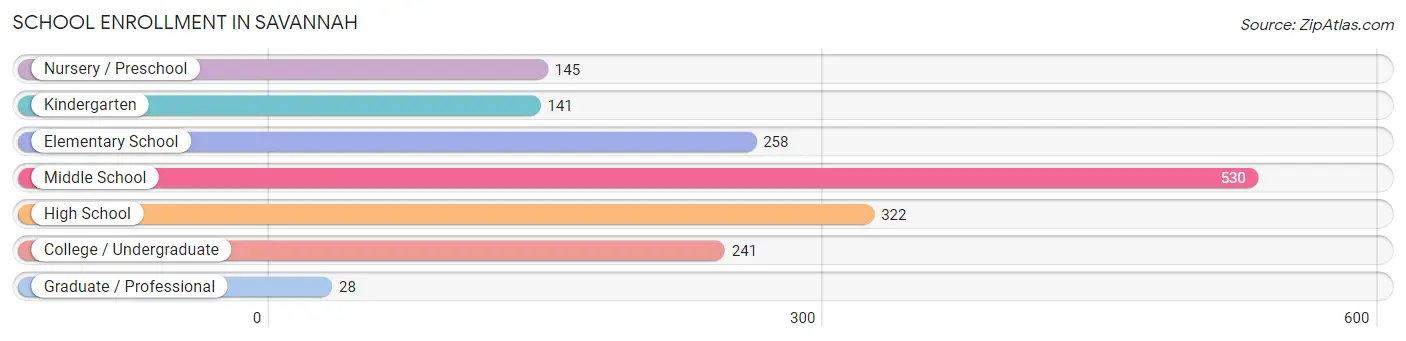
School Enrollment in Savannah
The most common levels of schooling among the 1,665 students in Savannah are middle school (530 | 31.8%), high school (322 | 19.3%), and elementary school (258 | 15.5%).
| School Level | # Students | % Students |
| Nursery / Preschool | 145 | 8.7% |
| Kindergarten | 141 | 8.5% |
| Elementary School | 258 | 15.5% |
| Middle School | 530 | 31.8% |
| High School | 322 | 19.3% |
| College / Undergraduate | 241 | 14.5% |
| Graduate / Professional | 28 | 1.7% |
| Total | 1,665 | 100.0% |
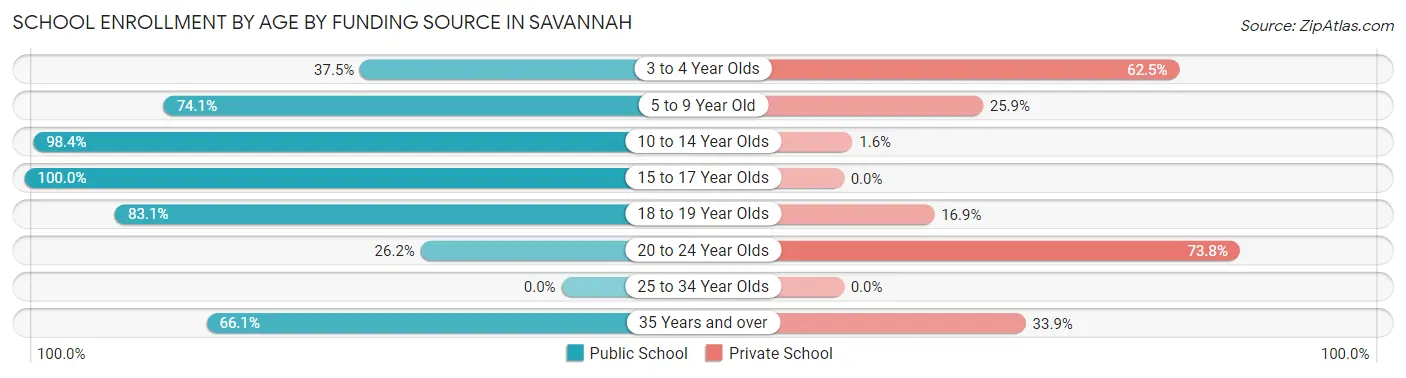
School Enrollment by Age by Funding Source in Savannah
Out of a total of 1,665 students who are enrolled in schools in Savannah, 321 (19.3%) attend a private institution, while the remaining 1,344 (80.7%) are enrolled in public schools. The age group of 20 to 24 year olds has the highest likelihood of being enrolled in private schools, with 135 (73.8% in the age bracket) enrolled. Conversely, the age group of 15 to 17 year olds has the lowest likelihood of being enrolled in a private school, with 249 (100.0% in the age bracket) attending a public institution.
| Age Bracket | Public School | Private School |
| 3 to 4 Year Olds | 6 (37.5%) | 10 (62.5%) |
| 5 to 9 Year Old | 383 (74.1%) | 134 (25.9%) |
| 10 to 14 Year Olds | 549 (98.4%) | 9 (1.6%) |
| 15 to 17 Year Olds | 249 (100.0%) | 0 (0.0%) |
| 18 to 19 Year Olds | 69 (83.1%) | 14 (16.9%) |
| 20 to 24 Year Olds | 48 (26.2%) | 135 (73.8%) |
| 25 to 34 Year Olds | 0 (0.0%) | 0 (0.0%) |
| 35 Years and over | 39 (66.1%) | 20 (33.9%) |
| Total | 1,344 (80.7%) | 321 (19.3%) |
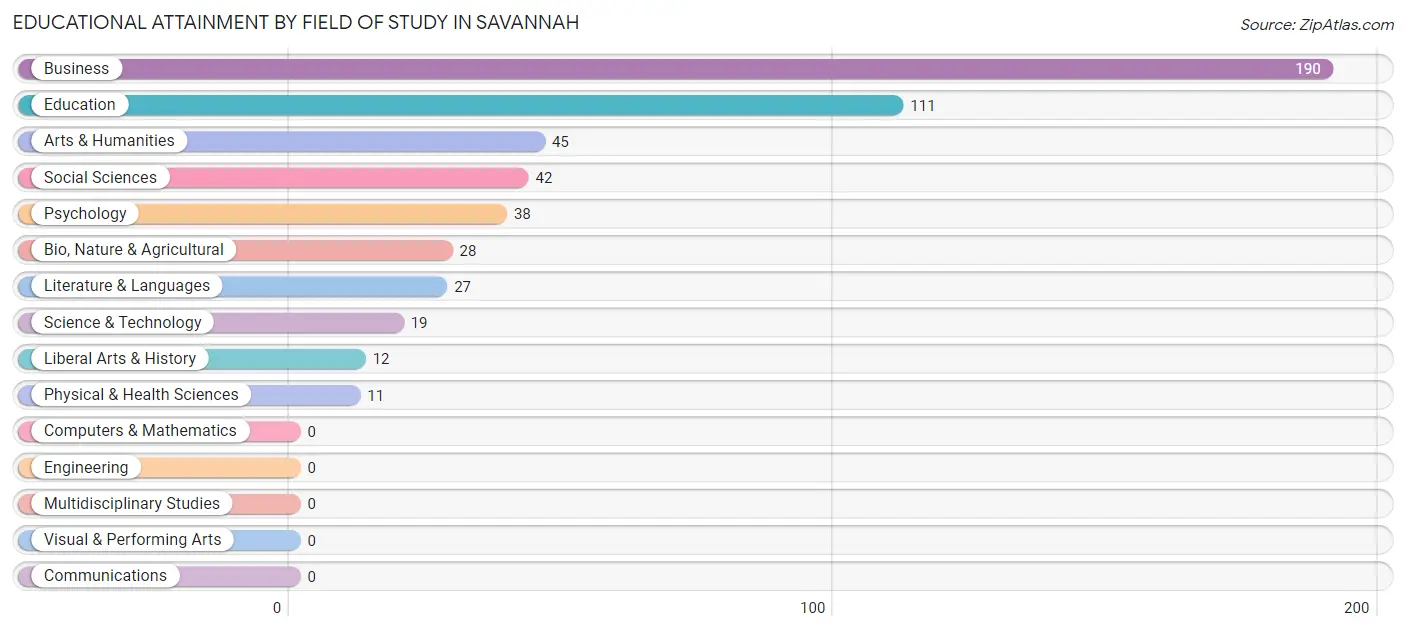
Educational Attainment by Field of Study in Savannah
Business (190 | 36.3%), education (111 | 21.2%), arts & humanities (45 | 8.6%), social sciences (42 | 8.0%), and psychology (38 | 7.3%) are the most common fields of study among 523 individuals in Savannah who have obtained a bachelor's degree or higher.
| Field of Study | # Graduates | % Graduates |
| Computers & Mathematics | 0 | 0.0% |
| Bio, Nature & Agricultural | 28 | 5.3% |
| Physical & Health Sciences | 11 | 2.1% |
| Psychology | 38 | 7.3% |
| Social Sciences | 42 | 8.0% |
| Engineering | 0 | 0.0% |
| Multidisciplinary Studies | 0 | 0.0% |
| Science & Technology | 19 | 3.6% |
| Business | 190 | 36.3% |
| Education | 111 | 21.2% |
| Literature & Languages | 27 | 5.2% |
| Liberal Arts & History | 12 | 2.3% |
| Visual & Performing Arts | 0 | 0.0% |
| Communications | 0 | 0.0% |
| Arts & Humanities | 45 | 8.6% |
| Total | 523 | 100.0% |
Transportation & Commute in Savannah
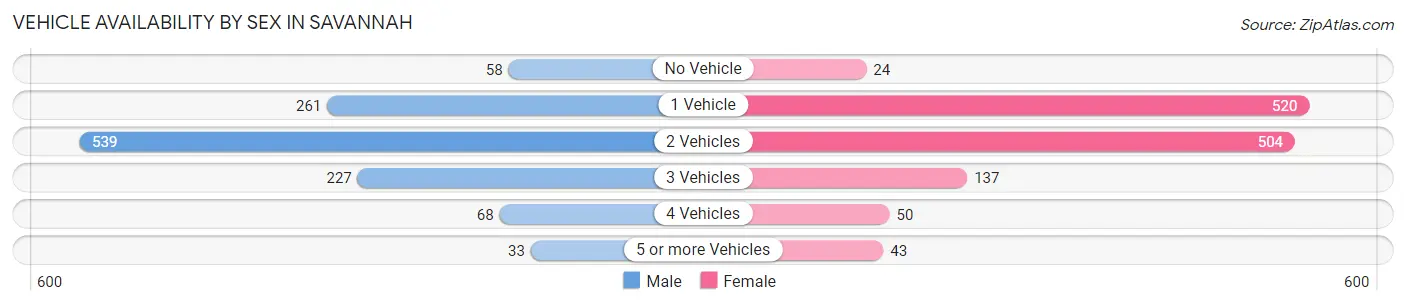
Vehicle Availability by Sex in Savannah
The most prevalent vehicle ownership categories in Savannah are males with 2 vehicles (539, accounting for 45.5%) and females with 2 vehicles (504, making up 42.2%).
| Vehicles Available | Male | Female |
| No Vehicle | 58 (4.9%) | 24 (1.9%) |
| 1 Vehicle | 261 (22.0%) | 520 (40.7%) |
| 2 Vehicles | 539 (45.5%) | 504 (39.4%) |
| 3 Vehicles | 227 (19.1%) | 137 (10.7%) |
| 4 Vehicles | 68 (5.7%) | 50 (3.9%) |
| 5 or more Vehicles | 33 (2.8%) | 43 (3.4%) |
| Total | 1,186 (100.0%) | 1,278 (100.0%) |
Commute Time in Savannah
The most frequently occuring commute durations in Savannah are 5 to 9 minutes (524 commuters, 22.3%), 15 to 19 minutes (472 commuters, 20.1%), and 10 to 14 minutes (420 commuters, 17.9%).
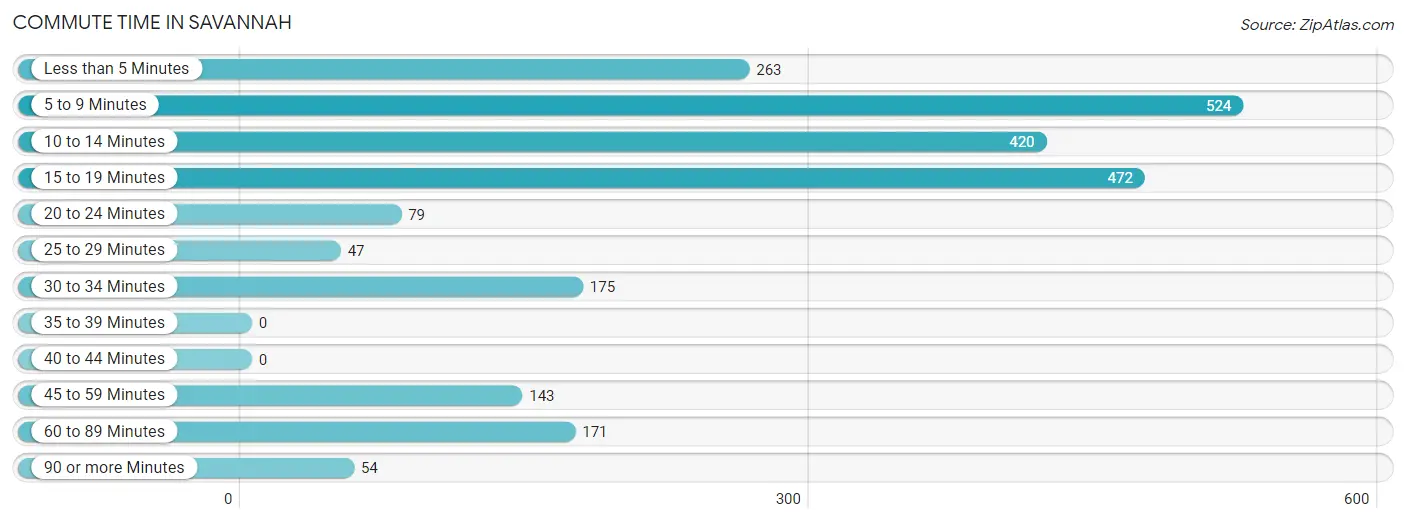
| Commute Time | # Commuters | % Commuters |
| Less than 5 Minutes | 263 | 11.2% |
| 5 to 9 Minutes | 524 | 22.3% |
| 10 to 14 Minutes | 420 | 17.9% |
| 15 to 19 Minutes | 472 | 20.1% |
| 20 to 24 Minutes | 79 | 3.4% |
| 25 to 29 Minutes | 47 | 2.0% |
| 30 to 34 Minutes | 175 | 7.4% |
| 35 to 39 Minutes | 0 | 0.0% |
| 40 to 44 Minutes | 0 | 0.0% |
| 45 to 59 Minutes | 143 | 6.1% |
| 60 to 89 Minutes | 171 | 7.3% |
| 90 or more Minutes | 54 | 2.3% |
Commute Time by Sex in Savannah
The most common commute times in Savannah are 5 to 9 minutes (296 commuters, 27.3%) for males and 15 to 19 minutes (279 commuters, 22.1%) for females.
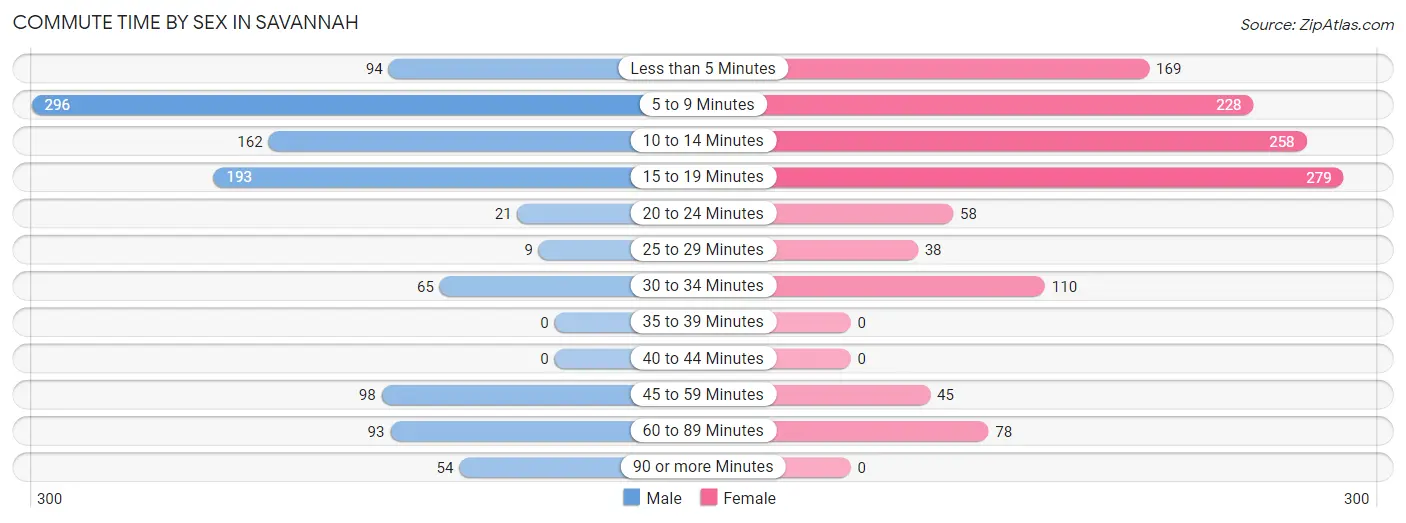
| Commute Time | Male | Female |
| Less than 5 Minutes | 94 (8.7%) | 169 (13.4%) |
| 5 to 9 Minutes | 296 (27.3%) | 228 (18.0%) |
| 10 to 14 Minutes | 162 (14.9%) | 258 (20.4%) |
| 15 to 19 Minutes | 193 (17.8%) | 279 (22.1%) |
| 20 to 24 Minutes | 21 (1.9%) | 58 (4.6%) |
| 25 to 29 Minutes | 9 (0.8%) | 38 (3.0%) |
| 30 to 34 Minutes | 65 (6.0%) | 110 (8.7%) |
| 35 to 39 Minutes | 0 (0.0%) | 0 (0.0%) |
| 40 to 44 Minutes | 0 (0.0%) | 0 (0.0%) |
| 45 to 59 Minutes | 98 (9.0%) | 45 (3.6%) |
| 60 to 89 Minutes | 93 (8.6%) | 78 (6.2%) |
| 90 or more Minutes | 54 (5.0%) | 0 (0.0%) |
Time of Departure to Work by Sex in Savannah
The most frequent times of departure to work in Savannah are 6:00 AM to 6:29 AM (196, 18.1%) for males and 7:30 AM to 7:59 AM (302, 23.9%) for females.
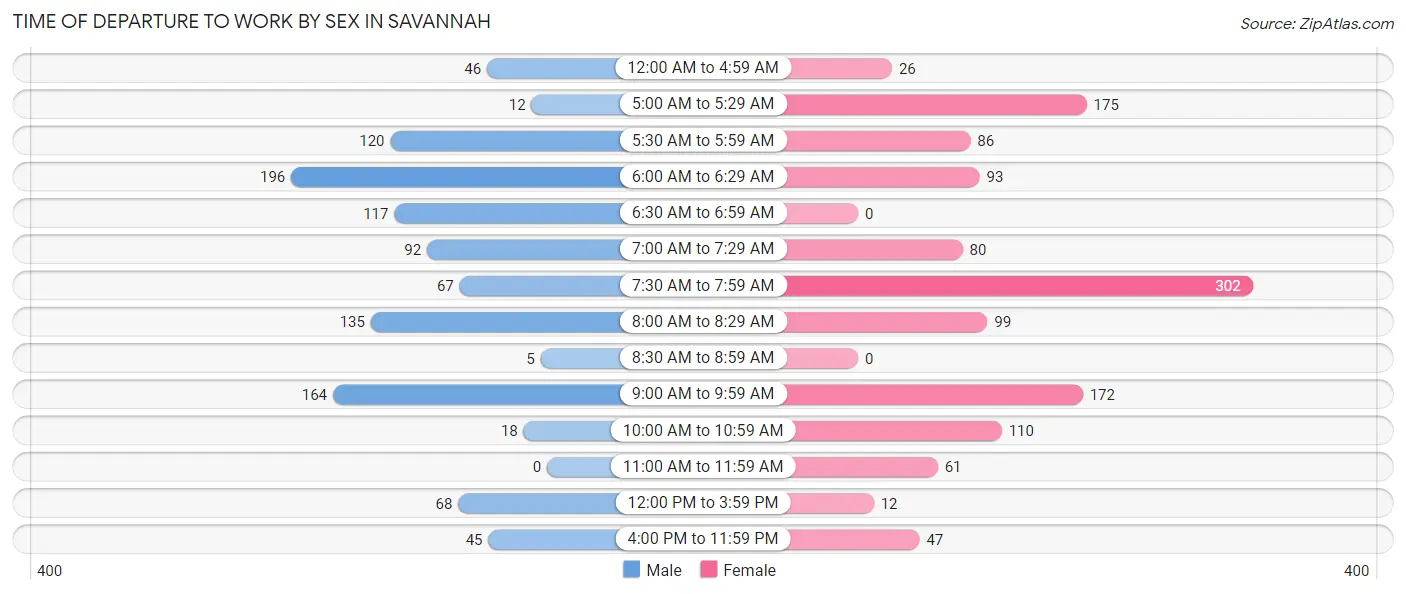
| Time of Departure | Male | Female |
| 12:00 AM to 4:59 AM | 46 (4.2%) | 26 (2.1%) |
| 5:00 AM to 5:29 AM | 12 (1.1%) | 175 (13.9%) |
| 5:30 AM to 5:59 AM | 120 (11.1%) | 86 (6.8%) |
| 6:00 AM to 6:29 AM | 196 (18.1%) | 93 (7.4%) |
| 6:30 AM to 6:59 AM | 117 (10.8%) | 0 (0.0%) |
| 7:00 AM to 7:29 AM | 92 (8.5%) | 80 (6.3%) |
| 7:30 AM to 7:59 AM | 67 (6.2%) | 302 (23.9%) |
| 8:00 AM to 8:29 AM | 135 (12.4%) | 99 (7.8%) |
| 8:30 AM to 8:59 AM | 5 (0.5%) | 0 (0.0%) |
| 9:00 AM to 9:59 AM | 164 (15.1%) | 172 (13.6%) |
| 10:00 AM to 10:59 AM | 18 (1.7%) | 110 (8.7%) |
| 11:00 AM to 11:59 AM | 0 (0.0%) | 61 (4.8%) |
| 12:00 PM to 3:59 PM | 68 (6.3%) | 12 (0.9%) |
| 4:00 PM to 11:59 PM | 45 (4.2%) | 47 (3.7%) |
| Total | 1,085 (100.0%) | 1,263 (100.0%) |
Housing Occupancy in Savannah
Occupancy by Ownership in Savannah
Of the total 2,697 dwellings in Savannah, owner-occupied units account for 1,295 (48.0%), while renter-occupied units make up 1,402 (52.0%).
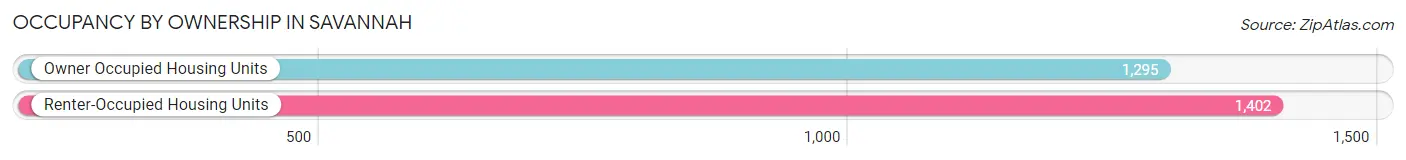
| Occupancy | # Housing Units | % Housing Units |
| Owner Occupied Housing Units | 1,295 | 48.0% |
| Renter-Occupied Housing Units | 1,402 | 52.0% |
| Total Occupied Housing Units | 2,697 | 100.0% |
Occupancy by Household Size in Savannah
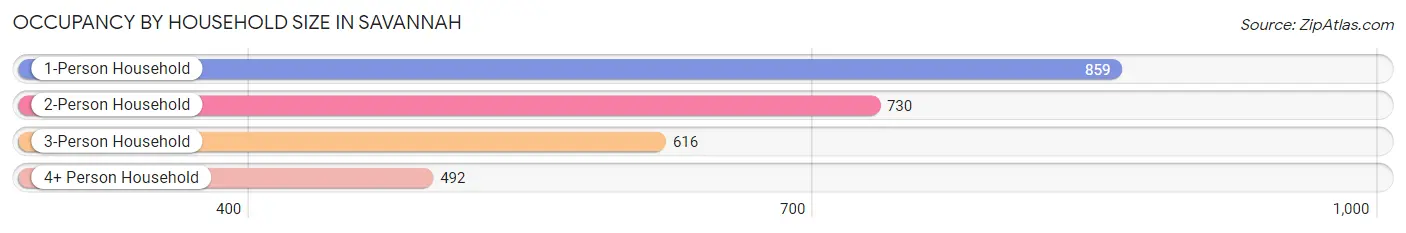
| Household Size | # Housing Units | % Housing Units |
| 1-Person Household | 859 | 31.9% |
| 2-Person Household | 730 | 27.1% |
| 3-Person Household | 616 | 22.8% |
| 4+ Person Household | 492 | 18.2% |
| Total Housing Units | 2,697 | 100.0% |
Occupancy by Ownership by Household Size in Savannah
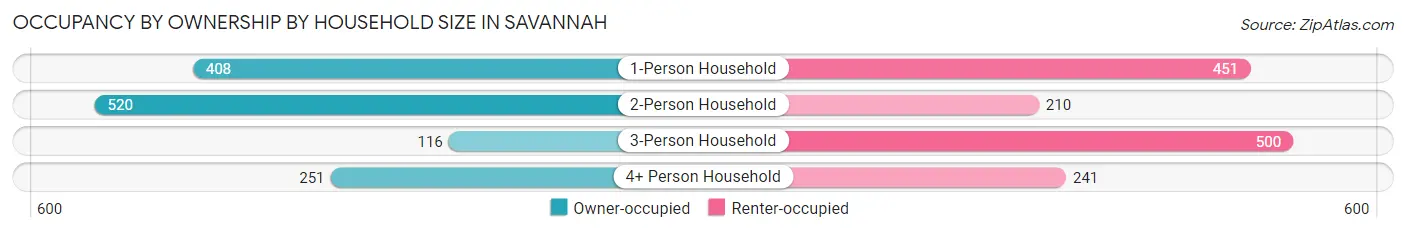
| Household Size | Owner-occupied | Renter-occupied |
| 1-Person Household | 408 (47.5%) | 451 (52.5%) |
| 2-Person Household | 520 (71.2%) | 210 (28.8%) |
| 3-Person Household | 116 (18.8%) | 500 (81.2%) |
| 4+ Person Household | 251 (51.0%) | 241 (49.0%) |
| Total Housing Units | 1,295 (48.0%) | 1,402 (52.0%) |
Occupancy by Educational Attainment in Savannah
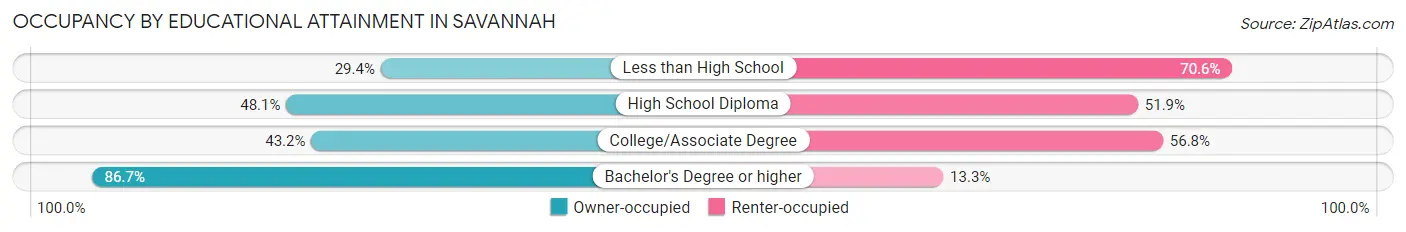
| Household Size | Owner-occupied | Renter-occupied |
| Less than High School | 77 (29.4%) | 185 (70.6%) |
| High School Diploma | 602 (48.1%) | 649 (51.9%) |
| College/Associate Degree | 407 (43.2%) | 536 (56.8%) |
| Bachelor's Degree or higher | 209 (86.7%) | 32 (13.3%) |
Occupancy by Age of Householder in Savannah
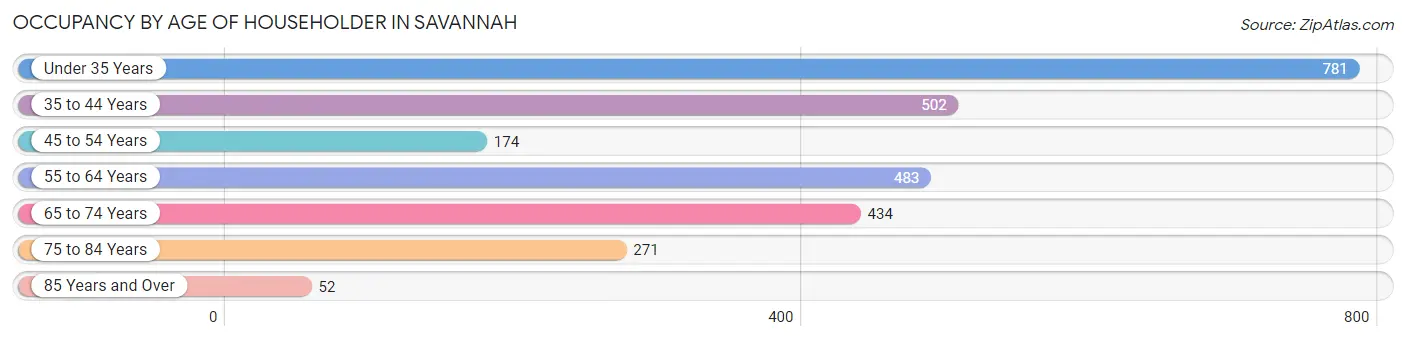
| Age Bracket | # Households | % Households |
| Under 35 Years | 781 | 29.0% |
| 35 to 44 Years | 502 | 18.6% |
| 45 to 54 Years | 174 | 6.5% |
| 55 to 64 Years | 483 | 17.9% |
| 65 to 74 Years | 434 | 16.1% |
| 75 to 84 Years | 271 | 10.1% |
| 85 Years and Over | 52 | 1.9% |
| Total | 2,697 | 100.0% |
Housing Finances in Savannah
Median Income by Occupancy in Savannah
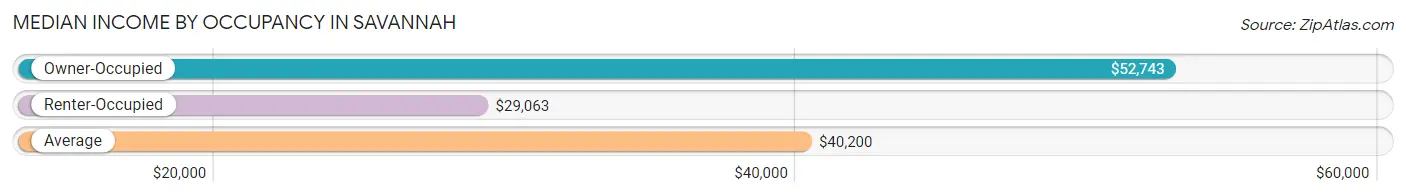
| Occupancy Type | # Households | Median Income |
| Owner-Occupied | 1,295 (48.0%) | $52,743 |
| Renter-Occupied | 1,402 (52.0%) | $29,063 |
| Average | 2,697 (100.0%) | $40,200 |
Occupancy by Householder Income Bracket in Savannah
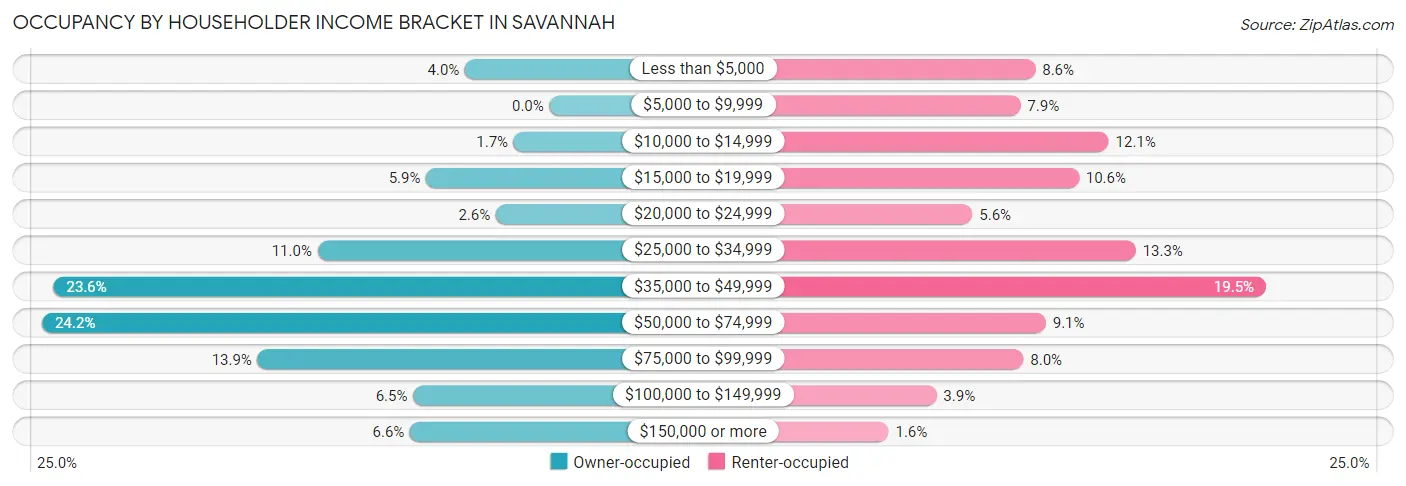
| Income Bracket | Owner-occupied | Renter-occupied |
| Less than $5,000 | 52 (4.0%) | 120 (8.6%) |
| $5,000 to $9,999 | 0 (0.0%) | 110 (7.9%) |
| $10,000 to $14,999 | 22 (1.7%) | 169 (12.0%) |
| $15,000 to $19,999 | 76 (5.9%) | 149 (10.6%) |
| $20,000 to $24,999 | 33 (2.5%) | 78 (5.6%) |
| $25,000 to $34,999 | 143 (11.0%) | 187 (13.3%) |
| $35,000 to $49,999 | 306 (23.6%) | 274 (19.5%) |
| $50,000 to $74,999 | 313 (24.2%) | 127 (9.1%) |
| $75,000 to $99,999 | 180 (13.9%) | 112 (8.0%) |
| $100,000 to $149,999 | 84 (6.5%) | 54 (3.8%) |
| $150,000 or more | 86 (6.6%) | 22 (1.6%) |
| Total | 1,295 (100.0%) | 1,402 (100.0%) |
Monthly Housing Cost Tiers in Savannah
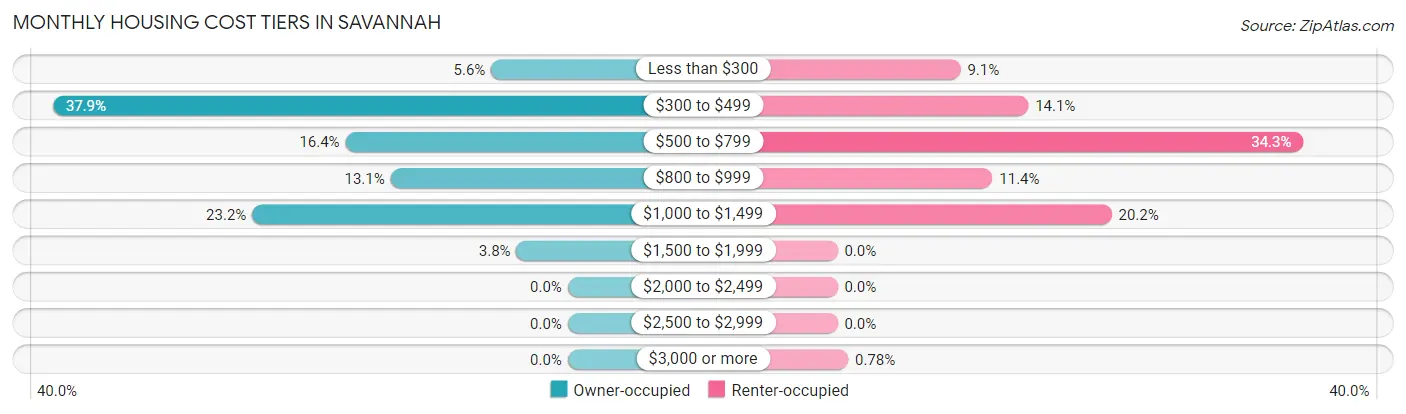
| Monthly Cost | Owner-occupied | Renter-occupied |
| Less than $300 | 73 (5.6%) | 127 (9.1%) |
| $300 to $499 | 491 (37.9%) | 197 (14.1%) |
| $500 to $799 | 212 (16.4%) | 481 (34.3%) |
| $800 to $999 | 169 (13.1%) | 160 (11.4%) |
| $1,000 to $1,499 | 301 (23.2%) | 283 (20.2%) |
| $1,500 to $1,999 | 49 (3.8%) | 0 (0.0%) |
| $2,000 to $2,499 | 0 (0.0%) | 0 (0.0%) |
| $2,500 to $2,999 | 0 (0.0%) | 0 (0.0%) |
| $3,000 or more | 0 (0.0%) | 11 (0.8%) |
| Total | 1,295 (100.0%) | 1,402 (100.0%) |
Physical Housing Characteristics in Savannah
Housing Structures in Savannah
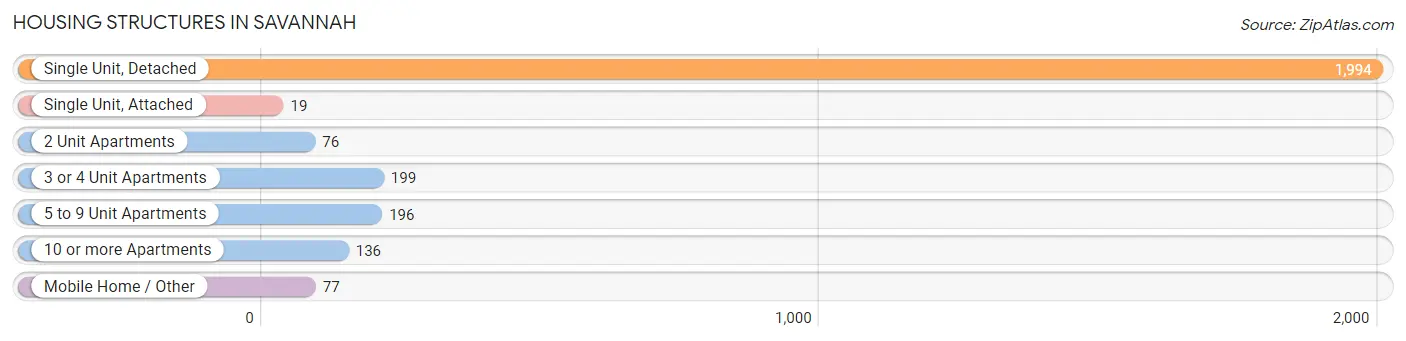
| Structure Type | # Housing Units | % Housing Units |
| Single Unit, Detached | 1,994 | 73.9% |
| Single Unit, Attached | 19 | 0.7% |
| 2 Unit Apartments | 76 | 2.8% |
| 3 or 4 Unit Apartments | 199 | 7.4% |
| 5 to 9 Unit Apartments | 196 | 7.3% |
| 10 or more Apartments | 136 | 5.0% |
| Mobile Home / Other | 77 | 2.9% |
| Total | 2,697 | 100.0% |
Housing Structures by Occupancy in Savannah
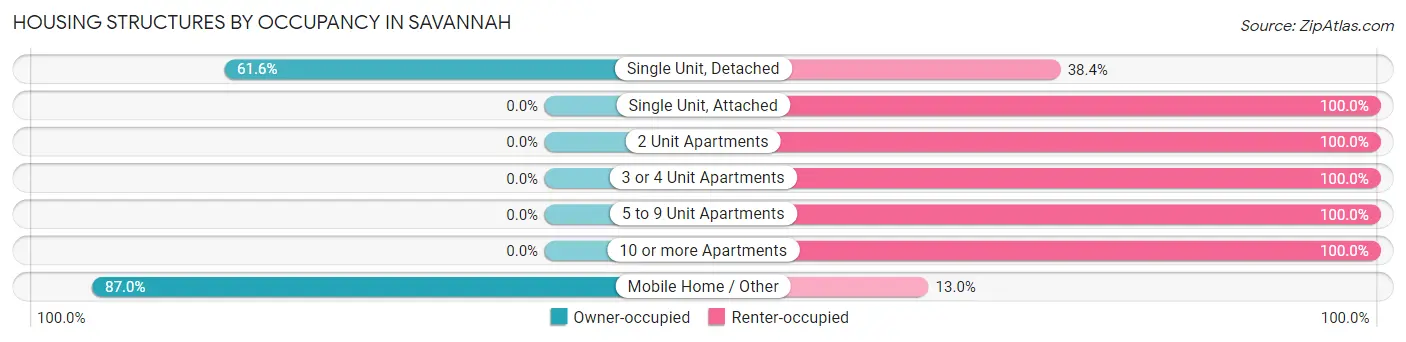
| Structure Type | Owner-occupied | Renter-occupied |
| Single Unit, Detached | 1,228 (61.6%) | 766 (38.4%) |
| Single Unit, Attached | 0 (0.0%) | 19 (100.0%) |
| 2 Unit Apartments | 0 (0.0%) | 76 (100.0%) |
| 3 or 4 Unit Apartments | 0 (0.0%) | 199 (100.0%) |
| 5 to 9 Unit Apartments | 0 (0.0%) | 196 (100.0%) |
| 10 or more Apartments | 0 (0.0%) | 136 (100.0%) |
| Mobile Home / Other | 67 (87.0%) | 10 (13.0%) |
| Total | 1,295 (48.0%) | 1,402 (52.0%) |
Housing Structures by Number of Rooms in Savannah
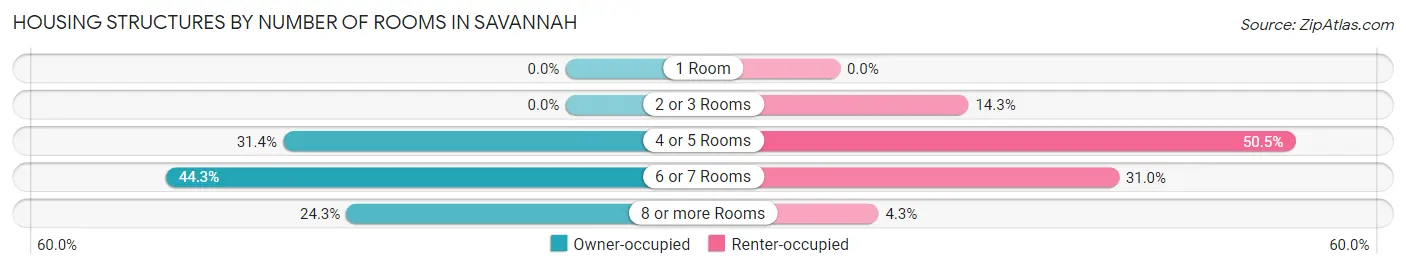
| Number of Rooms | Owner-occupied | Renter-occupied |
| 1 Room | 0 (0.0%) | 0 (0.0%) |
| 2 or 3 Rooms | 0 (0.0%) | 200 (14.3%) |
| 4 or 5 Rooms | 406 (31.4%) | 708 (50.5%) |
| 6 or 7 Rooms | 574 (44.3%) | 434 (31.0%) |
| 8 or more Rooms | 315 (24.3%) | 60 (4.3%) |
| Total | 1,295 (100.0%) | 1,402 (100.0%) |
Housing Structure by Heating Type in Savannah
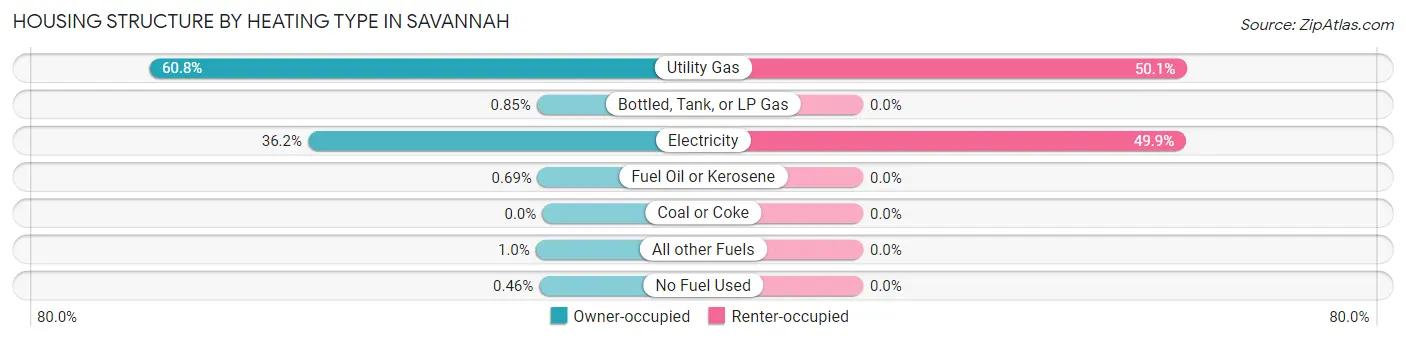
| Heating Type | Owner-occupied | Renter-occupied |
| Utility Gas | 787 (60.8%) | 702 (50.1%) |
| Bottled, Tank, or LP Gas | 11 (0.9%) | 0 (0.0%) |
| Electricity | 469 (36.2%) | 700 (49.9%) |
| Fuel Oil or Kerosene | 9 (0.7%) | 0 (0.0%) |
| Coal or Coke | 0 (0.0%) | 0 (0.0%) |
| All other Fuels | 13 (1.0%) | 0 (0.0%) |
| No Fuel Used | 6 (0.5%) | 0 (0.0%) |
| Total | 1,295 (100.0%) | 1,402 (100.0%) |
Household Vehicle Usage in Savannah
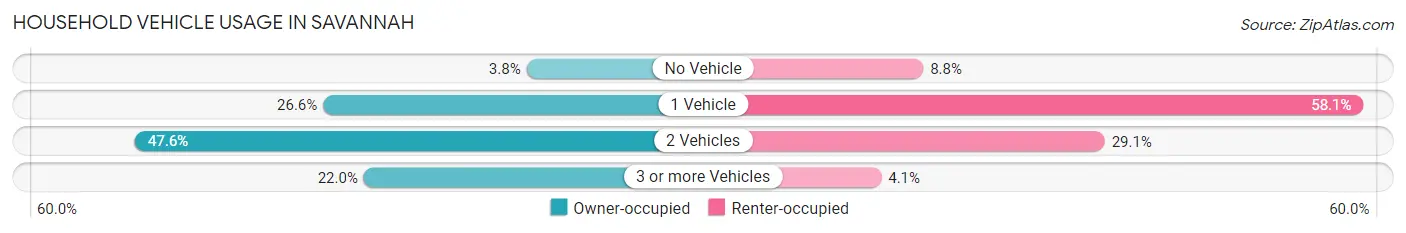
| Vehicles per Household | Owner-occupied | Renter-occupied |
| No Vehicle | 49 (3.8%) | 123 (8.8%) |
| 1 Vehicle | 344 (26.6%) | 814 (58.1%) |
| 2 Vehicles | 617 (47.6%) | 408 (29.1%) |
| 3 or more Vehicles | 285 (22.0%) | 57 (4.1%) |
| Total | 1,295 (100.0%) | 1,402 (100.0%) |
Real Estate & Mortgages in Savannah
Real Estate and Mortgage Overview in Savannah
| Characteristic | Without Mortgage | With Mortgage |
| Housing Units | 699 | 596 |
| Median Property Value | $168,100 | $144,500 |
| Median Household Income | $44,145 | $20 |
| Monthly Housing Costs | $434 | $0 |
| Real Estate Taxes | $903 | $31 |
Property Value by Mortgage Status in Savannah
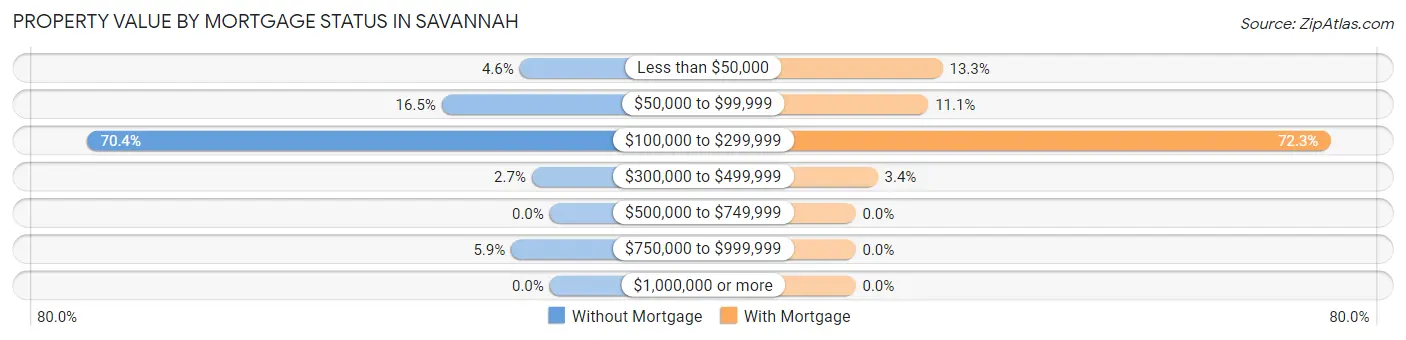
| Property Value | Without Mortgage | With Mortgage |
| Less than $50,000 | 32 (4.6%) | 79 (13.3%) |
| $50,000 to $99,999 | 115 (16.5%) | 66 (11.1%) |
| $100,000 to $299,999 | 492 (70.4%) | 431 (72.3%) |
| $300,000 to $499,999 | 19 (2.7%) | 20 (3.4%) |
| $500,000 to $749,999 | 0 (0.0%) | 0 (0.0%) |
| $750,000 to $999,999 | 41 (5.9%) | 0 (0.0%) |
| $1,000,000 or more | 0 (0.0%) | 0 (0.0%) |
| Total | 699 (100.0%) | 596 (100.0%) |
Household Income by Mortgage Status in Savannah
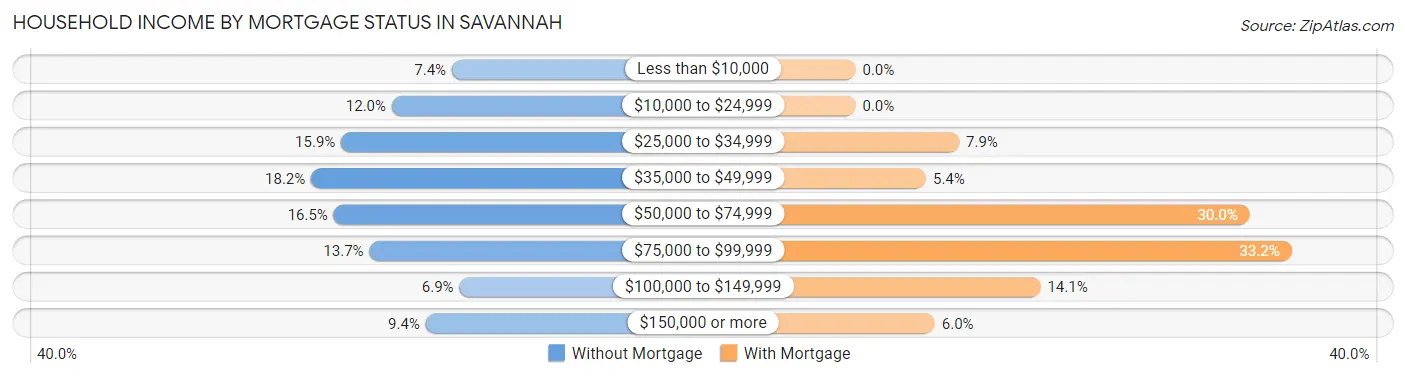
| Household Income | Without Mortgage | With Mortgage |
| Less than $10,000 | 52 (7.4%) | 0 (0.0%) |
| $10,000 to $24,999 | 84 (12.0%) | 0 (0.0%) |
| $25,000 to $34,999 | 111 (15.9%) | 47 (7.9%) |
| $35,000 to $49,999 | 127 (18.2%) | 32 (5.4%) |
| $50,000 to $74,999 | 115 (16.5%) | 179 (30.0%) |
| $75,000 to $99,999 | 96 (13.7%) | 198 (33.2%) |
| $100,000 to $149,999 | 48 (6.9%) | 84 (14.1%) |
| $150,000 or more | 66 (9.4%) | 36 (6.0%) |
| Total | 699 (100.0%) | 596 (100.0%) |
Property Value to Household Income Ratio in Savannah
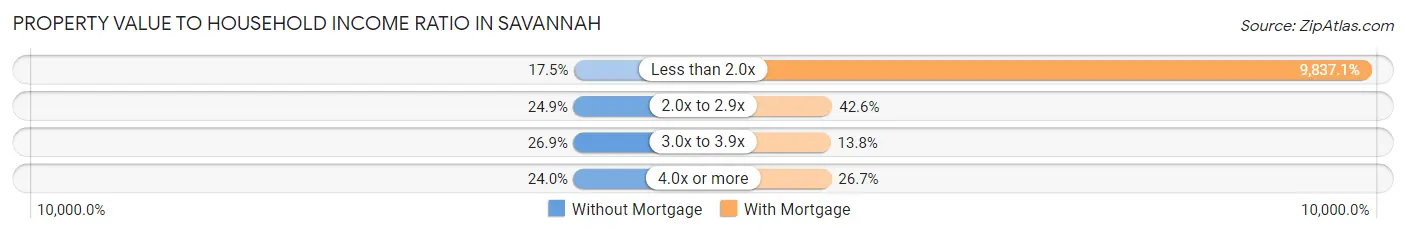
| Value-to-Income Ratio | Without Mortgage | With Mortgage |
| Less than 2.0x | 122 (17.4%) | 58,629 (9,837.1%) |
| 2.0x to 2.9x | 174 (24.9%) | 254 (42.6%) |
| 3.0x to 3.9x | 188 (26.9%) | 82 (13.8%) |
| 4.0x or more | 168 (24.0%) | 159 (26.7%) |
| Total | 699 (100.0%) | 596 (100.0%) |
Real Estate Taxes by Mortgage Status in Savannah
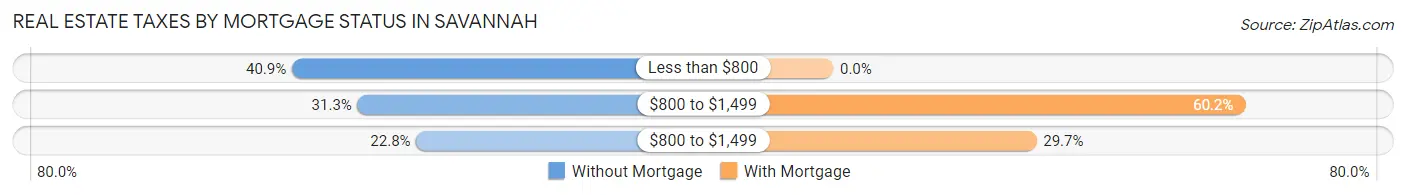
| Property Taxes | Without Mortgage | With Mortgage |
| Less than $800 | 286 (40.9%) | 0 (0.0%) |
| $800 to $1,499 | 219 (31.3%) | 359 (60.2%) |
| $800 to $1,499 | 159 (22.8%) | 177 (29.7%) |
| Total | 699 (100.0%) | 596 (100.0%) |
Health & Disability in Savannah
Health Insurance Coverage by Age in Savannah
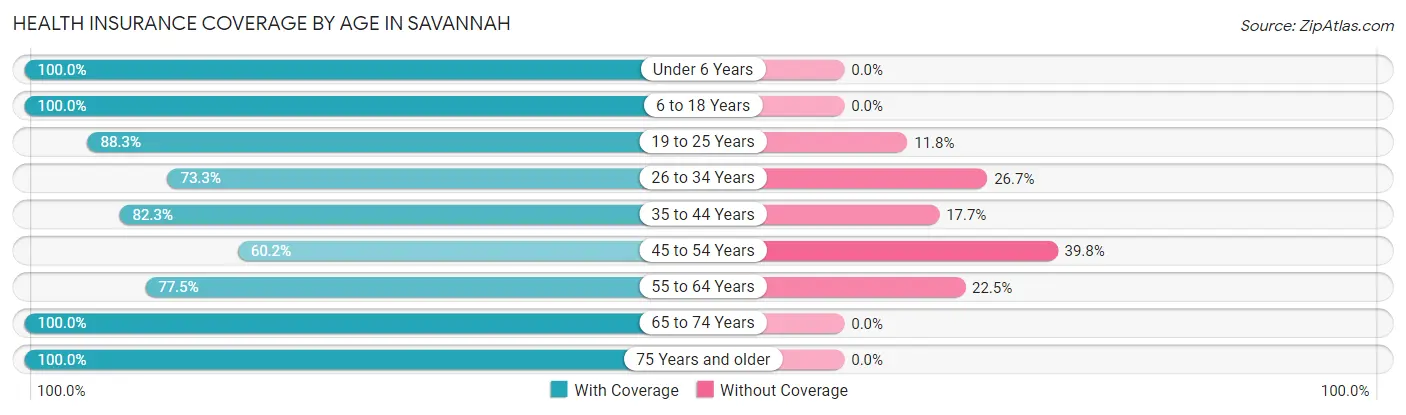
| Age Bracket | With Coverage | Without Coverage |
| Under 6 Years | 674 (100.0%) | 0 (0.0%) |
| 6 to 18 Years | 1,251 (100.0%) | 0 (0.0%) |
| 19 to 25 Years | 616 (88.2%) | 82 (11.7%) |
| 26 to 34 Years | 652 (73.3%) | 237 (26.7%) |
| 35 to 44 Years | 679 (82.3%) | 146 (17.7%) |
| 45 to 54 Years | 303 (60.2%) | 200 (39.8%) |
| 55 to 64 Years | 575 (77.5%) | 167 (22.5%) |
| 65 to 74 Years | 689 (100.0%) | 0 (0.0%) |
| 75 Years and older | 546 (100.0%) | 0 (0.0%) |
| Total | 5,985 (87.8%) | 832 (12.2%) |
Health Insurance Coverage by Citizenship Status in Savannah
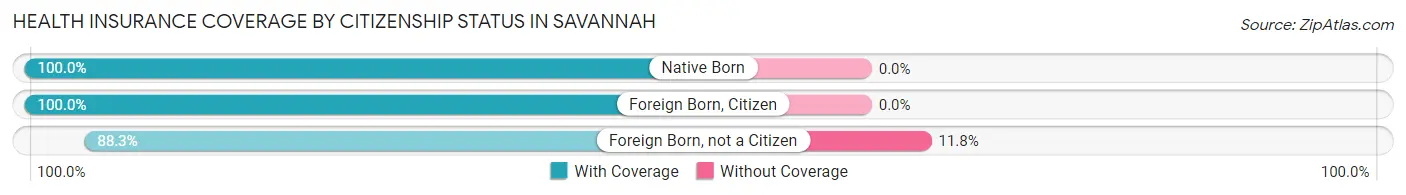
| Citizenship Status | With Coverage | Without Coverage |
| Native Born | 674 (100.0%) | 0 (0.0%) |
| Foreign Born, Citizen | 1,251 (100.0%) | 0 (0.0%) |
| Foreign Born, not a Citizen | 616 (88.2%) | 82 (11.7%) |
Health Insurance Coverage by Household Income in Savannah
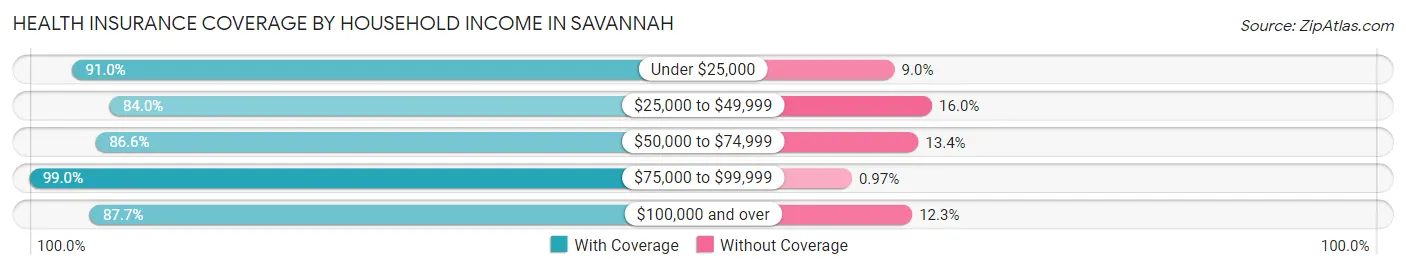
| Household Income | With Coverage | Without Coverage |
| Under $25,000 | 1,340 (91.0%) | 132 (9.0%) |
| $25,000 to $49,999 | 2,181 (84.0%) | 415 (16.0%) |
| $50,000 to $74,999 | 1,026 (86.6%) | 159 (13.4%) |
| $75,000 to $99,999 | 821 (99.0%) | 8 (1.0%) |
| $100,000 and over | 601 (87.7%) | 84 (12.3%) |
Public vs Private Health Insurance Coverage by Age in Savannah
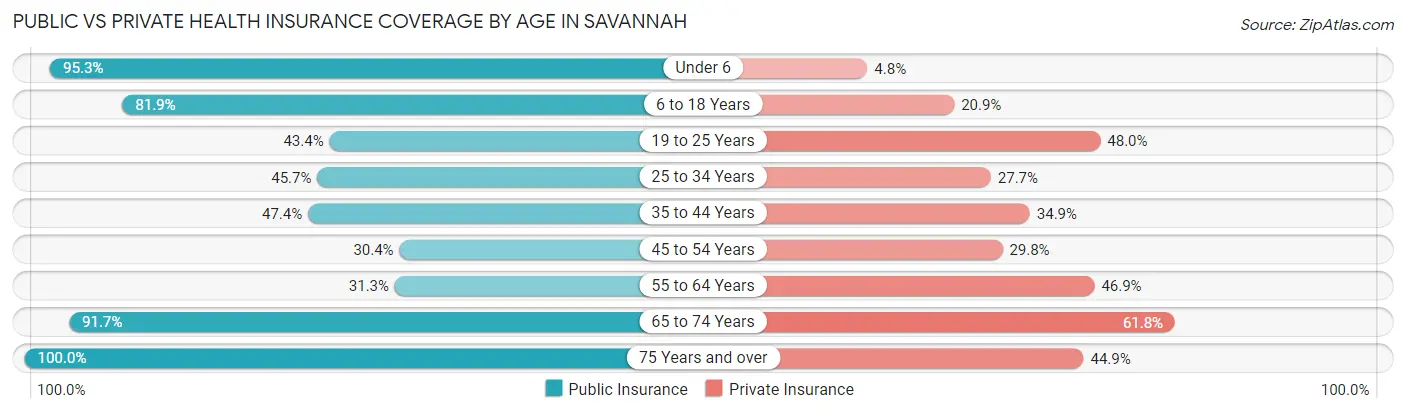
| Age Bracket | Public Insurance | Private Insurance |
| Under 6 | 642 (95.3%) | 32 (4.8%) |
| 6 to 18 Years | 1,024 (81.9%) | 261 (20.9%) |
| 19 to 25 Years | 303 (43.4%) | 335 (48.0%) |
| 25 to 34 Years | 406 (45.7%) | 246 (27.7%) |
| 35 to 44 Years | 391 (47.4%) | 288 (34.9%) |
| 45 to 54 Years | 153 (30.4%) | 150 (29.8%) |
| 55 to 64 Years | 232 (31.3%) | 348 (46.9%) |
| 65 to 74 Years | 632 (91.7%) | 426 (61.8%) |
| 75 Years and over | 546 (100.0%) | 245 (44.9%) |
| Total | 4,329 (63.5%) | 2,331 (34.2%) |
Disability Status by Sex by Age in Savannah
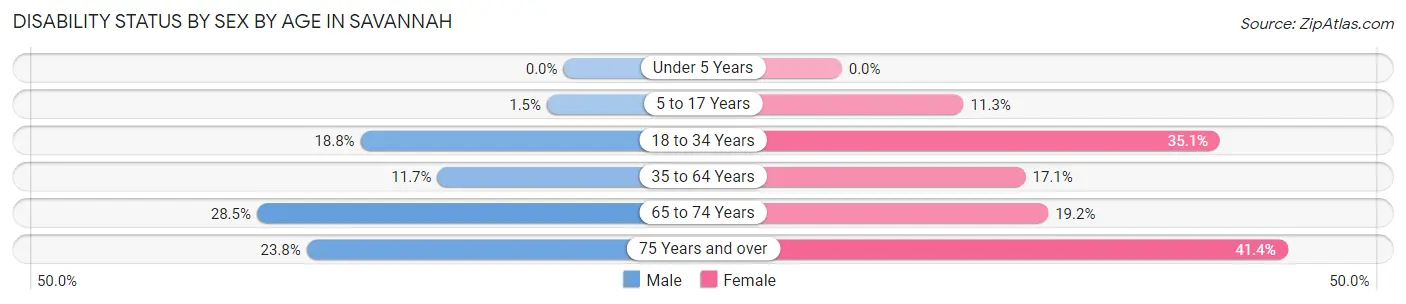
| Age Bracket | Male | Female |
| Under 5 Years | 0 (0.0%) | 0 (0.0%) |
| 5 to 17 Years | 9 (1.5%) | 83 (11.3%) |
| 18 to 34 Years | 139 (18.8%) | 327 (35.1%) |
| 35 to 64 Years | 107 (11.7%) | 197 (17.1%) |
| 65 to 74 Years | 101 (28.4%) | 64 (19.2%) |
| 75 Years and over | 46 (23.8%) | 146 (41.4%) |
Disability Class by Sex by Age in Savannah
Disability Class: Hearing Difficulty
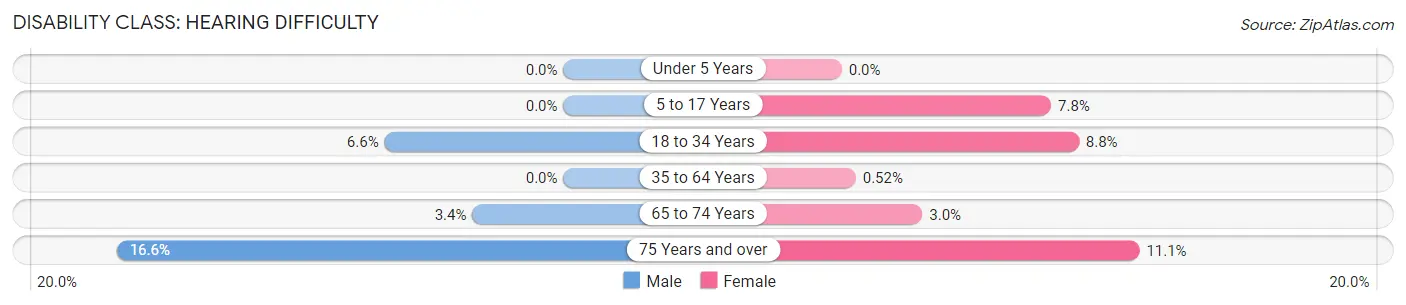
| Age Bracket | Male | Female |
| Under 5 Years | 0 (0.0%) | 0 (0.0%) |
| 5 to 17 Years | 0 (0.0%) | 57 (7.8%) |
| 18 to 34 Years | 49 (6.6%) | 82 (8.8%) |
| 35 to 64 Years | 0 (0.0%) | 6 (0.5%) |
| 65 to 74 Years | 12 (3.4%) | 10 (3.0%) |
| 75 Years and over | 32 (16.6%) | 39 (11.1%) |
Disability Class: Vision Difficulty
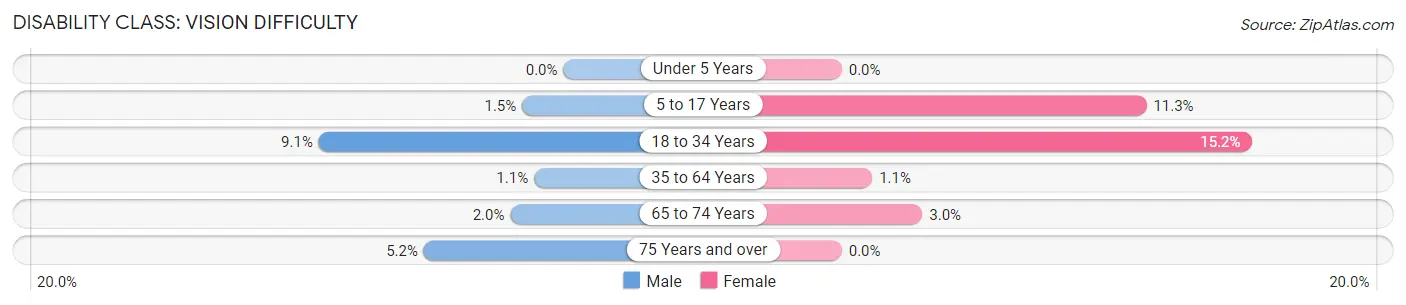
| Age Bracket | Male | Female |
| Under 5 Years | 0 (0.0%) | 0 (0.0%) |
| 5 to 17 Years | 9 (1.5%) | 83 (11.3%) |
| 18 to 34 Years | 67 (9.1%) | 142 (15.2%) |
| 35 to 64 Years | 10 (1.1%) | 13 (1.1%) |
| 65 to 74 Years | 7 (2.0%) | 10 (3.0%) |
| 75 Years and over | 10 (5.2%) | 0 (0.0%) |
Disability Class: Cognitive Difficulty
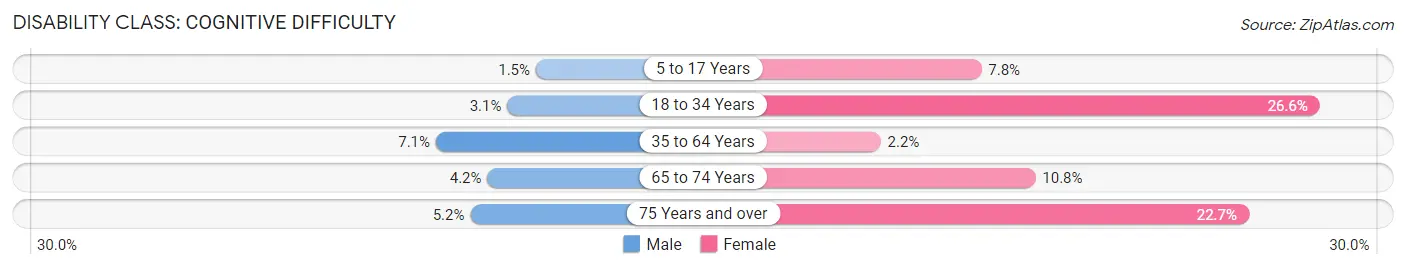
| Age Bracket | Male | Female |
| 5 to 17 Years | 9 (1.5%) | 57 (7.8%) |
| 18 to 34 Years | 23 (3.1%) | 248 (26.6%) |
| 35 to 64 Years | 65 (7.1%) | 25 (2.2%) |
| 65 to 74 Years | 15 (4.2%) | 36 (10.8%) |
| 75 Years and over | 10 (5.2%) | 80 (22.7%) |
Disability Class: Ambulatory Difficulty
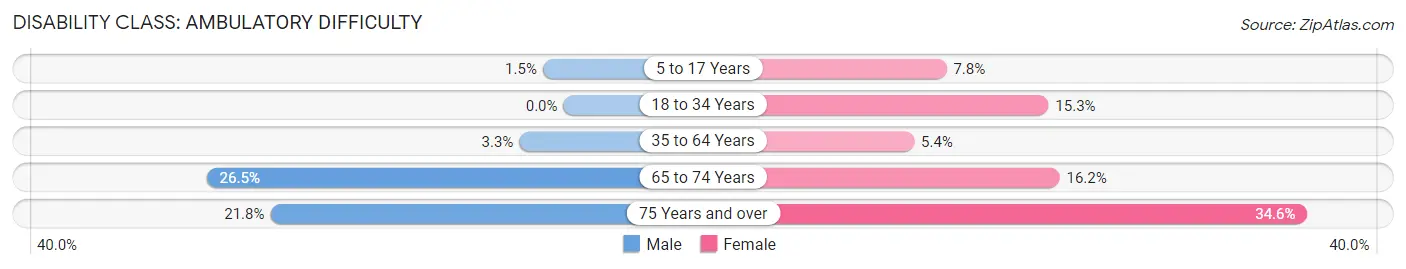
| Age Bracket | Male | Female |
| 5 to 17 Years | 9 (1.5%) | 57 (7.8%) |
| 18 to 34 Years | 0 (0.0%) | 143 (15.3%) |
| 35 to 64 Years | 30 (3.3%) | 62 (5.4%) |
| 65 to 74 Years | 94 (26.5%) | 54 (16.2%) |
| 75 Years and over | 42 (21.8%) | 122 (34.6%) |
Disability Class: Self-Care Difficulty
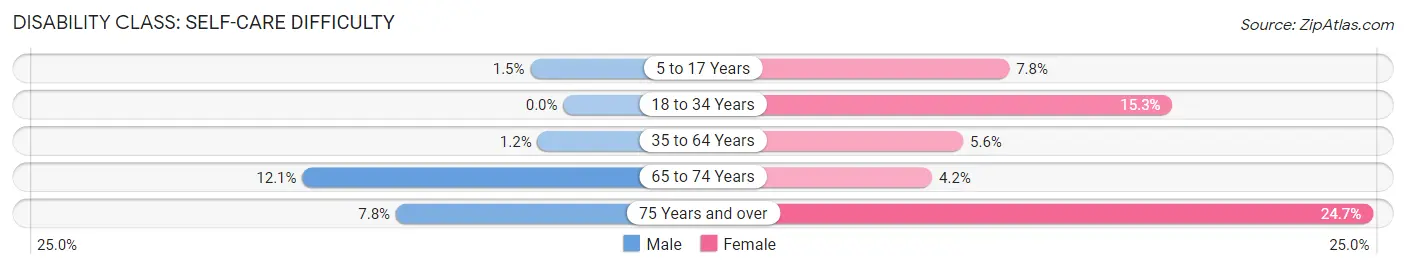
| Age Bracket | Male | Female |
| 5 to 17 Years | 9 (1.5%) | 57 (7.8%) |
| 18 to 34 Years | 0 (0.0%) | 143 (15.3%) |
| 35 to 64 Years | 11 (1.2%) | 65 (5.6%) |
| 65 to 74 Years | 43 (12.1%) | 14 (4.2%) |
| 75 Years and over | 15 (7.8%) | 87 (24.6%) |
Technology Access in Savannah
Computing Device Access in Savannah
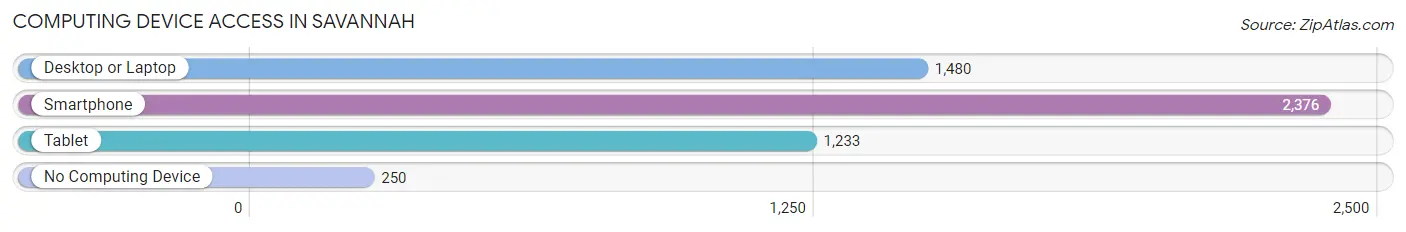
| Device Type | # Households | % Households |
| Desktop or Laptop | 1,480 | 54.9% |
| Smartphone | 2,376 | 88.1% |
| Tablet | 1,233 | 45.7% |
| No Computing Device | 250 | 9.3% |
| Total | 2,697 | 100.0% |
Internet Access in Savannah
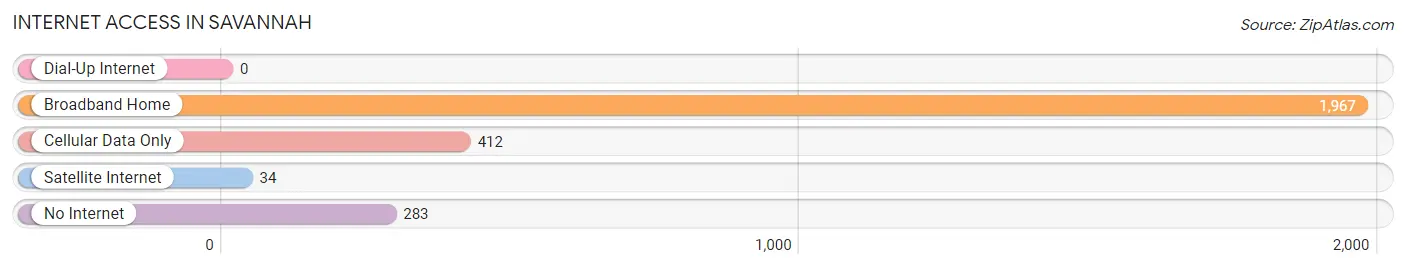
| Internet Type | # Households | % Households |
| Dial-Up Internet | 0 | 0.0% |
| Broadband Home | 1,967 | 72.9% |
| Cellular Data Only | 412 | 15.3% |
| Satellite Internet | 34 | 1.3% |
| No Internet | 283 | 10.5% |
| Total | 2,697 | 100.0% |
Savannah Summary
Savannah, Tennessee is a small city located in Hardin County, in the southwestern corner of the state. It is situated along the banks of the Tennessee River, and is the county seat of Hardin County. The city has a population of 7,000 people, and is part of the Jackson, Tennessee metropolitan area.
History
The area that is now Savannah was first settled in the early 1800s by settlers from North Carolina. The town was originally known as “Rudd’s Ferry”, named after the ferry that operated across the Tennessee River. In 1825, the town was renamed “Savannah”, after the nearby Savannah River.
In the mid-1800s, Savannah was a thriving river port, and was a major stop on the Memphis and Charleston Railroad. The railroad connected Savannah to Memphis, Tennessee, and Charleston, South Carolina. The town was also a major stop on the Underground Railroad, and was a safe haven for escaped slaves.
In the late 1800s, Savannah was a major center for the timber industry. The town was home to several sawmills, and the timber industry was a major source of employment for the town’s residents.
Geography
Savannah is located in Hardin County, in the southwestern corner of the state. It is situated along the banks of the Tennessee River, and is the county seat of Hardin County. The city has a total area of 4.2 square miles, all of which is land.
The city is located in the Central Basin of Tennessee, and is part of the Jackson Purchase region. The city is located in the western part of the state, and is approximately 90 miles from Memphis, Tennessee.
Economy
The economy of Savannah is largely based on agriculture and manufacturing. The city is home to several large manufacturing plants, including a Tyson Foods plant and a General Motors plant. The city is also home to several agricultural businesses, including a large dairy farm and several poultry farms.
The city is also home to several retail businesses, including several restaurants, grocery stores, and clothing stores. The city is also home to several banks, and is a major center for banking and finance in the region.
Demographics
As of the 2010 census, the population of Savannah was 7,000 people. The racial makeup of the city was 87.3% White, 8.7% African American, 0.3% Native American, 0.7% Asian, and 2.9% from other races. Hispanic or Latino of any race were 2.2% of the population.
The median income for a household in the city was $31,250, and the median income for a family was $37,500. The per capita income for the city was $17,845. About 17.2% of families and 20.2% of the population were below the poverty line, including 28.3% of those under age 18 and 16.2% of those age 65 or over.
Savannah is a small city with a rich history and a diverse economy. The city is home to several large manufacturing plants, and is a major center for agriculture and banking in the region. The city has a population of 7,000 people, and is part of the Jackson, Tennessee metropolitan area.
Common Questions
What is Per Capita Income in Savannah?
Per Capita income in Savannah is $20,228.
What is the Median Family Income in Savannah?
Median Family Income in Savannah is $40,423.
What is the Median Household income in Savannah?
Median Household Income in Savannah is $40,200.
What is Income or Wage Gap in Savannah?
Income or Wage Gap in Savannah is 42.1%.
Women in Savannah earn 57.9 cents for every dollar earned by a man.
What is Inequality or Gini Index in Savannah?
Inequality or Gini Index in Savannah is 0.45.
What is the Total Population of Savannah?
Total Population of Savannah is 7,206.
What is the Total Male Population of Savannah?
Total Male Population of Savannah is 3,248.
What is the Total Female Population of Savannah?
Total Female Population of Savannah is 3,958.
What is the Ratio of Males per 100 Females in Savannah?
There are 82.06 Males per 100 Females in Savannah.
What is the Ratio of Females per 100 Males in Savannah?
There are 121.86 Females per 100 Males in Savannah.
What is the Median Population Age in Savannah?
Median Population Age in Savannah is 36.3 Years.
What is the Average Family Size in Savannah
Average Family Size in Savannah is 3.1 People.
What is the Average Household Size in Savannah
Average Household Size in Savannah is 2.5 People.
How Large is the Labor Force in Savannah?
There are 2,579 People in the Labor Forcein in Savannah.
What is the Percentage of People in the Labor Force in Savannah?
47.2% of People are in the Labor Force in Savannah.
What is the Unemployment Rate in Savannah?
Unemployment Rate in Savannah is 1.6%.